S165A200036 - School District of Lee County
446
U.S. Department of Education Washington, D.C. 20202-5335 APPLICATION FOR GRANTS UNDER THE Fiscal Year 2020 Application for New Grants CFDA # 84.165A PR/Award # S165A200036 Gramts.gov Tracking#: GRANT13152207 OMB No. 1894-0006 , Expiration Date: 01/31/2021 Closing Date: Jun 30, 2020 PR/Award # S165A200036
-
Upload
khangminh22 -
Category
Documents
-
view
0 -
download
0
Transcript of S165A200036 - School District of Lee County

U.S. Department of EducationWashington, D.C. 20202-5335
APPLICATION FOR GRANTSUNDER THE
Fiscal Year 2020 Application for New Grants
CFDA # 84.165A
PR/Award # S165A200036
Gramts.gov Tracking#: GRANT13152207
OMB No. 1894-0006 , Expiration Date: 01/31/2021
Closing Date: Jun 30, 2020
PR/Award # S165A200036

**Table of Contents**
Form Page
1. Application for Federal Assistance SF-424 e3
2. Standard Budget Sheet (ED 524) e6
3. ED GEPA427 Form e8
Attachment - 1 (1240-GEPA 427 Statement) e9
4. Grants.gov Lobbying Form e10
5. Dept of Education Supplemental Information for SF-424 e11
Attachment - 1 (1234-Lee County Human Subject Narrative) e12
6. ED Abstract Narrative Form e15
Attachment - 1 (1238-Abstract) e16
7. Project Narrative Form e17
Attachment - 1 (1235-Narrative) e18
8. Other Narrative Form e140
Attachment - 1 (1236-Other_Attachments_Appendixes) e141
Attachment - 2 (1237-sf424b-signed) e431
9. Budget Narrative Form e433
Attachment - 1 (1239-Itemized_Budget_Narrative) e434
This application was generated using the PDF functionality. The PDF functionality automatically numbers the pages in this application. Some pages/sections of this application may contain 2
sets of page numbers, one set created by the applicant and the other set created by e-Application's PDF functionality. Page numbers created by the e-Application PDF functionality will be
preceded by the letter e (for example, e1, e2, e3, etc.).
Page e2

OMB Number: 4040-0004Expiration Date: 12/31/2022
* 1. Type of Submission: * 2. Type of Application:
* 3. Date Received: 4. Applicant Identifier:
5a. Federal Entity Identifier: 5b. Federal Award Identifier:
6. Date Received by State: 7. State Application Identifier:
* a. Legal Name:
* b. Employer/Taxpayer Identification Number (EIN/TIN): * c. Organizational DUNS:
* Street1:
Street2:
* City:
County/Parish:
* State:
Province:
* Country:
* Zip / Postal Code:
Department Name: Division Name:
Prefix: * First Name:
Middle Name:
* Last Name:
Suffix:
Title:
Organizational Affiliation:
* Telephone Number: Fax Number:
* Email:
* If Revision, select appropriate letter(s):
* Other (Specify):
State Use Only:
8. APPLICANT INFORMATION:
d. Address:
e. Organizational Unit:
f. Name and contact information of person to be contacted on matters involving this application:
Application for Federal Assistance SF-424
Preapplication
Application
Changed/Corrected Application
New
Continuation
Revision
06/25/2020
School District of Lee County
2855 Colonial Blvd
Fort Myers
FL: Florida
USA: UNITED STATES
33966-1012
Academic Services
Dr. Terri
Kinsey
Asst. Director Grants & Program Development
Funding Opportunity Number:ED-GRANTS-031020-001 Received Date:Jun 25, 2020 01:06:52 PM EDTTracking Number:GRANT13152207
PR/Award # S165A200036
Page e3

* 9. Type of Applicant 1: Select Applicant Type:
Type of Applicant 2: Select Applicant Type:
Type of Applicant 3: Select Applicant Type:
* Other (specify):
* 10. Name of Federal Agency:
11. Catalog of Federal Domestic Assistance Number:
CFDA Title:
* 12. Funding Opportunity Number:
* Title:
13. Competition Identification Number:
Title:
14. Areas Affected by Project (Cities, Counties, States, etc.):
* 15. Descriptive Title of Applicant's Project:
Attach supporting documents as specified in agency instructions.
Application for Federal Assistance SF-424
G: Independent School District
Department of Education
84.165
Magnet Schools Assistance
ED-GRANTS-031020-001
Office of Elementary and Secondary Education (OESE): Magnet Schools Assistance Program (MSAP) CFDA Number 84.165A
84-165A2020-1
Office of Elementary and Secondary Education (OESE): Magnet Schools Assistance Program (MSAP) CFDA Number 84.165A
The Increasing Diversity and Achievement through Rigorous and Engaging (I-DARE) Programs Phase II Project
View AttachmentsDelete AttachmentsAdd Attachments
View AttachmentDelete AttachmentAdd Attachment
Funding Opportunity Number:ED-GRANTS-031020-001 Received Date:Jun 25, 2020 01:06:52 PM EDTTracking Number:GRANT13152207
PR/Award # S165A200036
Page e4

.
Prefix: * First Name:
Middle Name:
* Last Name:
Suffix:
* Title:
* Telephone Number:
* Email:
Fax Number:
* Signature of Authorized Representative: * Date Signed:
18. Estimated Funding ($):
21. *By signing this application, I certify (1) to the statements contained in the list of certifications** and (2) that the statements herein are true, complete and accurate to the best of my knowledge. I also provide the required assurances** and agree to comply with any resulting terms if I accept an award. I am aware that any false, fictitious, or fraudulent statements or claims may subject me to criminal, civil, or administrative penalties. (U.S. Code, Title 218, Section 1001)
** The list of certifications and assurances, or an internet site where you may obtain this list, is contained in the announcement or agency specific instructions.
Authorized Representative:
Application for Federal Assistance SF-424
* a. Applicant
Attach an additional list of Program/Project Congressional Districts if needed.
* b. Program/Project
* a. Start Date: * b. End Date:
16. Congressional Districts Of:
17. Proposed Project:
19 19
Add Attachment Delete Attachment View Attachment
10/01/2020 09/30/2025
a. This application was made available to the State under the Executive Order 12372 Process for review on
b. Program is subject to E.O. 12372 but has not been selected by the State for review.
c. Program is not covered by E.O. 12372.
Yes No
Add Attachment Delete Attachment View Attachment
** I AGREE
Dr. Gregory
K
Adkins
Superintendent of Schools
Terri M Kinsey
* 20. Is the Applicant Delinquent On Any Federal Debt? (If "Yes," provide explanation in attachment.)
* 19. Is Application Subject to Review By State Under Executive Order 12372 Process?
06/25/2020
If "Yes", provide explanation and attach
Funding Opportunity Number:ED-GRANTS-031020-001 Received Date:Jun 25, 2020 01:06:52 PM EDTTracking Number:GRANT13152207
PR/Award # S165A200036
Page e5
Project Year 1(a)
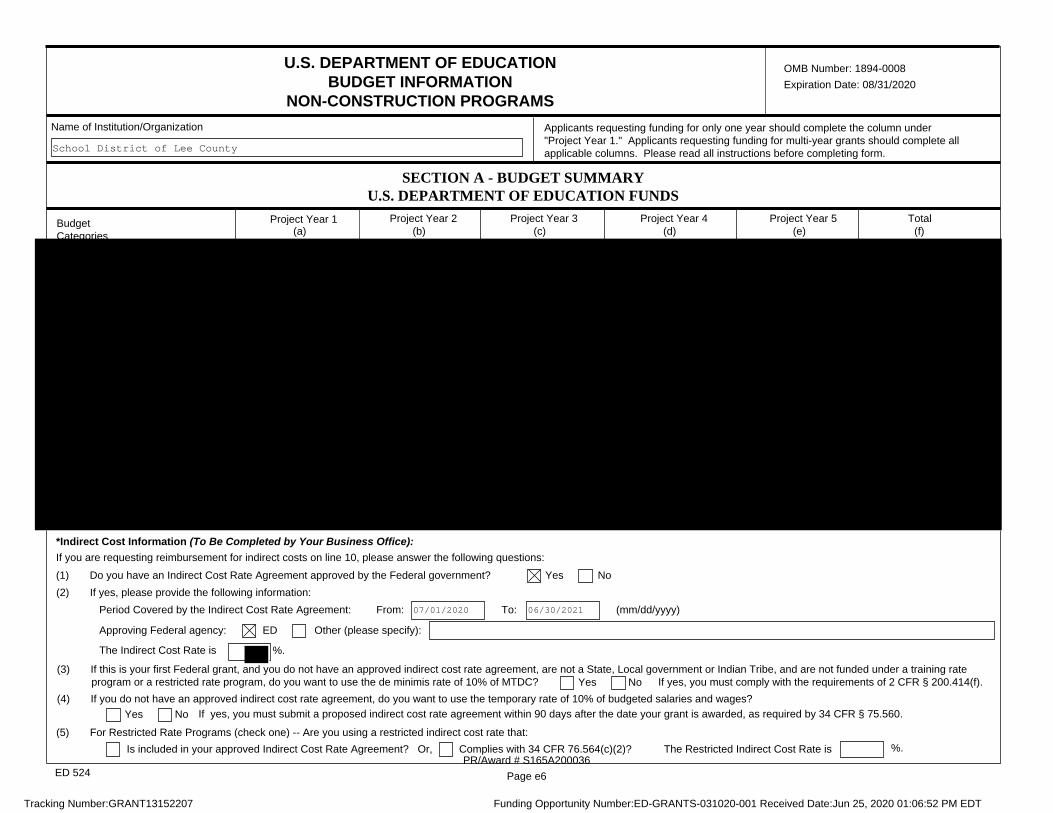
OMB Number: 1894-0008Expiration Date: 08/31/2020
Name of Institution/Organization Applicants requesting funding for only one year should complete the column under "Project Year 1." Applicants requesting funding for multi-year grants should complete all applicable columns. Please read all instructions before completing form.
U.S. DEPARTMENT OF EDUCATION BUDGET INFORMATION
NON-CONSTRUCTION PROGRAMS
SECTION A - BUDGET SUMMARY U.S. DEPARTMENT OF EDUCATION FUNDS
Budget Categories
Project Year 2(b)
Project Year 3(c)
Project Year 4(d)
Project Year 5(e)
Total(f)
*Indirect Cost Information (To Be Completed by Your Business Office): If you are requesting reimbursement for indirect costs on line 10, please answer the following questions:
ED 524
School District of Lee County
(1) Do you have an Indirect Cost Rate Agreement approved by the Federal government? Yes No(2) If yes, please provide the following information:
Period Covered by the Indirect Cost Rate Agreement: From: 07/01/2020 To: 06/30/2021 (mm/dd/yyyy)
Approving Federal agency: ED Other (please specify):
The Indirect Cost Rate is %.
(3) If this is your first Federal grant, and you do not have an approved indirect cost rate agreement, are not a State, Local government or Indian Tribe, and are not funded under a training rate program or a restricted rate program, do you want to use the de minimis rate of 10% of MTDC? Yes No If yes, you must comply with the requirements of 2 CFR § 200.414(f).
(4) If you do not have an approved indirect cost rate agreement, do you want to use the temporary rate of 10% of budgeted salaries and wages?Yes No If yes, you must submit a proposed indirect cost rate agreement within 90 days after the date your grant is awarded, as required by 34 CFR § 75.560.
(5) For Restricted Rate Programs (check one) -- Are you using a restricted indirect cost rate that: Is included in your approved Indirect Cost Rate Agreement? Or, Complies with 34 CFR 76.564(c)(2)? The Restricted Indirect Cost Rate is %.
Funding Opportunity Number:ED-GRANTS-031020-001 Received Date:Jun 25, 2020 01:06:52 PM EDTTracking Number:GRANT13152207
PR/Award # S165A200036
Page e6

Project Year 1(a)
Name of Institution/Organization Applicants requesting funding for only one year should complete the column under "Project Year 1." Applicants requesting funding for multi-year grants should complete all applicable columns. Please read all instructions before completing form.
SECTION B - BUDGET SUMMARY NON-FEDERAL FUNDS
SECTION C - BUDGET NARRATIVE (see instructions)
Budget Categories Project Year 2(b)
Project Year 3(c)
Project Year 4(d)
Project Year 5(e)
Total(f)
ED 524
School District of Lee County
Funding Opportunity Number:ED-GRANTS-031020-001 Received Date:Jun 25, 2020 01:06:52 PM EDTTracking Number:GRANT13152207
PR/Award # S165A200036
Page e7

OMB Number: 1894-0005 Expiration Date: 04/30/2020NOTICE TO ALL APPLICANTS
The purpose of this enclosure is to inform you about a new provision in the Department of Education's General Education Provisions Act (GEPA) that applies to applicants for new grant awards under Department programs. This provision is Section 427 of GEPA, enacted as part of the Improving America's Schools Act of 1994 (Public Law (P.L.) 103-382).
To Whom Does This Provision Apply?
Section 427 of GEPA affects applicants for new grant awards under this program. ALL APPLICANTS FOR NEW AWARDS MUST INCLUDE INFORMATION IN THEIR APPLICATIONS TO ADDRESS THIS NEW PROVISION IN ORDER TO RECEIVE FUNDING UNDER THIS PROGRAM.
(If this program is a State-formula grant program, a State needs to provide this description only for projects or activities that it carries out with funds reserved for State-level uses. In addition, local school districts or other eligible applicants that apply to the State for funding need to provide this description in their applications to the State for funding. The State would be responsible for ensuring that the school district or other local entity has submitted a sufficient section 427 statement as described below.)
What Does This Provision Require?
Section 427 requires each applicant for funds (other than an individual person) to include in its application a description of the steps the applicant proposes to take to ensure equitable access to, and participation in, its Federally-assisted program for students, teachers, and other program beneficiaries with special needs. This provision allows applicants discretion in developing the required description. The statute highlights six types of barriers that can impede equitable access or participation: gender, race, national origin, color, disability, or age. Based on local circumstances, you should determine whether these or other barriers may prevent your students, teachers, etc. from such access or participation in, the Federally-funded project or activity. The description in your application of steps to be taken to overcome these barriers need not be lengthy; you may provide a clear and succinct description of how you plan to address those barriers that are applicable to your circumstances. In addition, the information may be provided in a single narrative, or, if appropriate, may
be discussed in connection with related topics in the application.
Section 427 is not intended to duplicate the requirements of civil rights statutes, but rather to ensure that, in designing their projects, applicants for Federal funds address equity concerns that may affect the ability of certain potential beneficiaries to fully participate in the project and to achieve to high standards. Consistent with program requirements and its approved application, an applicant may use the Federal funds awarded to it to eliminate barriers it identifies.
What are Examples of How an Applicant Might Satisfy the Requirement of This Provision?
The following examples may help illustrate how an applicant may comply with Section 427.
(1) An applicant that proposes to carry out an adult literacy project serving, among others, adults with limited English proficiency, might describe in its application how it intends to distribute a brochure about the proposed project to such potential participants in their native language.
(2) An applicant that proposes to develop instructional materials for classroom use might describe how it will make the materials available on audio tape or in braille for students who are blind.
(3) An applicant that proposes to carry out a model science program for secondary students and is concerned that girls may be less likely than boys to enroll in the course, might indicate how it intends to conduct "outreach" efforts to girls, to encourage their enrollment.
We recognize that many applicants may already be implementing effective steps to ensure equity of access and participation in their grant programs, and we appreciate your cooperation in responding to the requirements of this provision.
Estimated Burden Statement for GEPA Requirements
According to the Paperwork Reduction Act of 1995, no persons are required to respond to a collection of information unless such collection displays a valid OMB control number. Public reporting burden for this collection of information is estimated to average 1.5 hours per response, including time for reviewing instructions, searching existing data sources, gathering and maintaining the data needed, and completing and reviewing the collection of information. The obligation to respond to this collection is required to obtain or retain benefit (Public Law 103-382). Send comments regarding the burden estimate or any other aspect of this collection of information, including suggestions for reducing this burden, to the U.S. Department of Education, 400 Maryland Ave., SW, Washington, DC 20210-4537 or email [email protected] and reference the OMB Control Number 1894-0005.
Optional - You may attach 1 file to this page.
1240-GEPA 427 Statement.pdf View AttachmentDelete AttachmentAdd Attachment
(4) An applicant that proposes a project to increase school safety might describe the special efforts it will take to address concern of lesbian, gay, bisexual, and transgender students, and efforts to reach out to and involve the families of LGBT students.
Funding Opportunity Number:ED-GRANTS-031020-001 Received Date:Jun 25, 2020 01:06:52 PM EDTTracking Number:GRANT13152207
PR/Award # S165A200036
Page e8

Response to GEPA Requirements
This document is the response of the School Board of Lee County to requirements of
section 427 of GEPA, enacted as part of the Improving America's Schools Act of 1994
(Public Law (P.L.) 103-382).
The School Board of Lee County, by this application and by School Board Policy 1.91,
hereby assures that no person shall be excluded from participation in, be denied the
benefits of or be subjected to discrimination in any educational program or activity based
on race, color, religion, sex, sexual orientation, national or ethnic origin, marital status,
disability if otherwise qualified, or any other unlawful factor; and that no person shall be
excluded from participation in, be denied the benefits of or be subjected to discrimination
in any employment conditions or practices based on race, color, religion, sex, age, sexual
orientation, national or ethnic origin, marital status, disability if otherwise qualified, or
any other unlawful factor.
The School Board of Lee County further assures that is shall comply with the Americans
with Disabilities Act of 1990 (ADA).
The School Board of Lee County further assures that persons alleging unlawful
discrimination shall have access to a grievance procedure provided in School Board
approved Administrative Regulations.
Consideration of Equitable Participation
The District has considered § 427 of the General Education Provisions Act, particularly
in regards to the equitable participation of students who could potentially find barriers to
access based on one or more of the six factors cited in that section, namely gender, race,
national origin, color, disability, and age.
The District will make special effort to avoid preventing access based on gender, race,
national origin, color, and age through the provisions of the student assignment process
which deliberately and effectively excludes these factors. The District will also make key
emergency documents available in English, Spanish, Haitian Creole, and (when
available) in Portuguese, in consideration of the larger subpopulations of local residents
for whom these are their home languages.
PR/Award # S165A200036
Page e9

Certification for Contracts, Grants, Loans, and Cooperative Agreements
(2) If any funds other than Federal appropriated funds have been paid or will be paid to any person for influencing or attempting to influence an officer or employee of any agency, a Member of Congress, an officer or employee of Congress, or an employee of a Member of Congress in connection with this Federal contract, grant, loan, or cooperative agreement, the undersigned shall complete and submit Standard Form-LLL, ''Disclosure of Lobbying Activities,'' in accordance with its instructions.
(3) The undersigned shall require that the language of this certification be included in the award documents for all subawards at all tiers (including subcontracts, subgrants, and contracts under grants, loans, and cooperative agreements) and that all subrecipients shall certify and disclose accordingly. This certification is a material representation of fact upon which reliance was placed when this transaction was made or entered into. Submission of this certification is a prerequisite for making or entering into this transaction imposed by section 1352, title 31, U.S. Code. Any person who fails to file the required certification shall be subject to a civil penalty of not less than $10,000 and not more than $100,000 for each such failure.
If any funds have been paid or will be paid to any person for influencing or attempting to influence an officer or employee of any agency, a Member of Congress, an officer or employee of Congress, or an employee of a Member of Congress in connection with this commitment providing for the United States to insure or guarantee a loan, the undersigned shall complete and submit Standard Form-LLL, ''Disclosure of Lobbying Activities,'' in accordance with its instructions. Submission of this statement is a prerequisite for making or entering into this transaction imposed by section 1352, title 31, U.S. Code. Any person who fails to file the required statement shall be subject to a civil penalty of not less than $10,000 and not more than $100,000 for each such failure.
* APPLICANT'S ORGANIZATION
* SIGNATURE: * DATE:
* PRINTED NAME AND TITLE OF AUTHORIZED REPRESENTATIVE
Suffix:
Middle Name:
* Title:
* First Name:
* Last Name:
Prefix:
CERTIFICATION REGARDING LOBBYING
(1) No Federal appropriated funds have been paid or will be paid, by or on behalf of the undersigned, to any person for influencing or attempting to influence an officer or employee of an agency, a Member of Congress, an officer or employee of Congress, or an employee of a Member of Congress in connection with the awarding of any Federal contract, the making of any Federal grant, the making of any Federal loan, the entering into of any cooperative agreement, and the extension, continuation, renewal, amendment, or modification of any Federal contract, grant, loan, or cooperative agreement.
The undersigned certifies, to the best of his or her knowledge and belief, that:
Statement for Loan Guarantees and Loan Insurance
The undersigned states, to the best of his or her knowledge and belief, that:
School District of Lee County
Dr. Gregory K
Superintendent of Schools
Adkins
Terri M Kinsey 06/25/2020
Funding Opportunity Number:ED-GRANTS-031020-001 Received Date:Jun 25, 2020 01:06:52 PM EDTTracking Number:GRANT13152207
PR/Award # S165A200036
Page e10

U.S. DEPARTMENT OF EDUCATION SUPPLEMENTAL INFORMATION
FOR THE SF-424
Zip Code:
State:
Address:
Prefix: First Name: Middle Name: Last Name:
Phone Number (give area code)
Street1:
City:
Suffix:
Email Address:
1. Project Director:
Fax Number (give area code)
2. Novice Applicant:
Are you a novice applicant as defined in the regulations in 34 CFR 75.225 (and included in the definitions page in the attached instructions)?
3. Human Subjects Research:
a. Are any research activities involving human subjects planned at any time during the proposed Project Period?
b. Are ALL the research activities proposed designated to be exempt from the regulations?
Provide Exemption(s) #:
Provide Assurance #, if available:
Street2:
Country:
County:
c. If applicable, please attach your "Exempt Research" or "Nonexempt Research" narrative to this form as indicated in the definitions page in the attached instructions.
Dr. Terri Kinsey
2855 Colonial Blvd
Fort Myers
FL: Florida
33966-1012
USA: UNITED STATES
Yes No Not applicable to this program
Yes No
Yes
No
1 2 3 4 5 6
NO. No assurance # available at moment. We will comply with 34 CFR 97 and proceed to obtain human subjects assurance by designated ED official. When application is recommended/selected for funding, we will obtain the assurance within 30 days of request.
1234-Lee County Human Subject Narrative.pdf Add Attachment Delete Attachment View Attachment
OMB Number: 1894-0007Expiration Date: 09/30/2020
Funding Opportunity Number:ED-GRANTS-031020-001 Received Date:Jun 25, 2020 01:06:52 PM EDTTracking Number:GRANT13152207
PR/Award # S165A200036
Page e11

1
School District of Lee County U.S. DEPARTMENT OF EDUCATION SUPPLEMENTAL INFORMATION FOR THE SF-424 3. Human Subject Research:
a. Are any research activities involving human subjects planned at any time during the
proposed Project Period? YES
b. Are ALL the research activities proposed designated to be exempt from the regulations?
NO. None. No assurance # available at the moment. We will comply with 34 CFR 97 and
proceed to obtain the human subjects assurance upon request by the designated ED
official. When our application is recommended/selected for funding, we will obtain the
assurance within 30 days after the specific formal request.
c. If applicable, please attach your "Exempt Research" or "Nonexempt Research" narrative
to this form as indicated in the definitions page in the attached instructions.
PR/Award # S165A200036
Page e12

2
Nonexempt Research Narrative
(1) Human Subjects Involvement and Characteristics
There are two groups of human subjects in the study, students and teachers. All students and
teachers, about 1,900 9-12 students and 120 teachers, at the magnet high school will be eligible
to participate in our studies.
(2) Sources of Materials
Evaluation data specifically collected for evaluation purposes include teacher surveys, student
academic data and non-academic outcomes. The non-academic outcomes include indicators of
students staying in school, progressing in school, and graduating in four years. The evaluators
will also request documentation from magnet school teachers to help determine the quality and
extent of MSAP implementation including class level descriptions of and dosage for units and
courses that present the magnet theme to students, teacher professional development and teacher
instructional practices. During site visits, the evaluator will conduct school and classroom
walkthroughs, observe lessons, and interview teachers to collect data related to professional
development and instructional practices.
All data will be treated as confidential. Paper copies containing personal information will be
scanned for extraction and destroyed after having electronic versions of the information. The
electronic data files containing such information will be maintained on secure computer
networks with adequate password protection to allow only authorized users of the data to have
access. Students and teachers will be assigned a unique identification number so that researchers
working with the data will not know the true identities of the participants. The electronic data
files containing such information will be maintained on secure computer networks with adequate
password protection to allow only authorized users of the data to have access.
(3) Recruitment and Informed Consent
AES and district staff will work together to identify the teachers at the magnet high school and
their contact information will be requested. All potential teachers will receive e-mails
introducing the evaluation study and inviting them to participate. Teachers will be recruited
during site visits. Once teacher consent has been obtained, study information will be sent home
with students to inform parents and give them the chance to opt out.
PR/Award # S165A200036
Page e13

3
Information and consent forms for parents and teachers will specify expected study activities,
information about potential risks and benefits, and contact information for reporting problems
and/or withdrawing from the study. All research instruments and procedures will be submitted to
UCLA’s Institutional Review Board (IRB) prior to contact with human subjects.
(4) Potential Risks
There are no foreseeable risks associated with study participation.
(5) Protection Against Risk
Participants and student parents will be advised of study requirements, risks, and benefits and
will have time to consider these before granting consent to participate or opt out. All data will be
stored securely and any indirect identifiers stripped at completion of analyses.
(6) Importance of the Knowledge to be Gained
This evaluation strives to bolster the current body of research with instrumentation and analytic
methodology aligned directly with the priorities and selection criteria of the Magnet Schools
Assistance Program (MSAP), and it is intended to contribute to the evidence-based database on
magnet schools the Department of Education is building.
(7) Collaborating Site(s)
None.
PR/Award # S165A200036
Page e14

AbstractThe abstract narrative must not exceed one page and should use language that will be understood by a range of audiences. For all projects, include the project title (if applicable), goals, expected outcomes and contributions for research, policy, practice, etc. Include population to be served, as appropriate. For research applications, also include the following:
Theoretical and conceptual background of the study (i.e., prior research that this investigation builds upon and that provides a compelling rationale for this study)
Study design including a brief description of the sample including sample size, methods, principals dependent, independent, and control variables, and the approach to data analysis.
···
* Attachment:
[Note: For a non-electronic submission, include the name and address of your organization and the name, phone number and e-mail address of the contact person for this project.]
Research issues, hypotheses and questions being addressed
1238-Abstract.pdf View AttachmentDelete AttachmentAdd Attachment
You may now Close the Form
You have attached 1 file to this page, no more files may be added. To add a different file, you must first delete the existing file.
Funding Opportunity Number:ED-GRANTS-031020-001 Received Date:Jun 25, 2020 01:06:52 PM EDTTracking Number:GRANT13152207
PR/Award # S165A200036
Page e15

School District of Lee County
Abstract
The Increasing Diversity and Achievement through Rigorous and Engaging (I-DARE) Programs Phase II Project will support one elementary school and one high school in Lee County to create appealing and challenging magnet programs and attract diverse students. Phase II builds on the successes of the current I-DARE magnet grant that supports three middle schools. The project goal is to create high performing diverse students within each magnet school and allow these programs to thrive after the project period ends. The I-DARE, Phase II project addresses the five competitive preference priorities. The first priority, need for instance, is addressed through budget shortfall data at the federal, local, and state levels as well as the steady population growth that Lee experiences each year with an additional 1,500 – 2,000 students enrolled. Priority 2, new or revised magnet schools, is addressed by placing magnets in schools not previously benefiting from the Magnet Schools Assistance Program. Priority 3, student selection, is addressed by selecting students through a lottery process. Priority 4, increased integration and socioeconomic diversity, is measured through the student enrollment plan and through performance measures in the project. Finally, Priority 5, spurring investment in Qualified Opportunity Zones is addressed by serving an elementary school and students at elementary and high school levels that reside in multiple qualified opportunity zones.
The Project Objectives include: 1) Minority group and socioeconomic isolation will be
reduced at the proposed magnet schools; 2) All students will receive high quality instruction that includes their school's systemic reforms and magnet themes in units and courses aligned with Florida Standards; 3) All students, at each magnet school, will receive magnet theme instruction; 4a) Student academic achievement will increase each year in English/Language Arts, mathematics, and science for all students; 4b) The percentage of students from major ethnic and racial subgroups attaining level 3 or 4 on the state assessments will increase; 5) Staff will receive professional development related to improvement of curriculum, instruction and magnet theme development and implementation; 6) All students will have equitable access to high quality magnet education; and 7) There will be an increase in parent participation at each magnet school.
James Stephens Elementary will adopt a STEM magnet program to provide a hands-on,
engaging science, technology, engineering and mathematics curriculum to its 480 students. James Stephens will integrate STEM into all disciplines: social studies, science, English/Language Arts, mathematics and special areas such as media, art, music and physical education to create a whole school magnet approach. The school will partner with key science and engineering organizations/businesses to strengthen its infrastructure supporting STEM.
South Fort Myers High School will implement a Cambridge and Career Academy magnet
program to prepare its 1,900 students for future college and career opportunities. Students may choose the Cambridge/AICE program that provides college preparation and college level coursework. Or students may choose among four career academies: Automotive & Construction, Health & Safety, Technology, and the new academy, Hospitality & Tourism where they earn industry certifications. Local business partners provide students with internships in order to receive real world, on-the-job training. Students in both programs are supported by trained and caring educators to ensure they graduate and move on to postsecondary education or professional career. UCLA CRESST’s will conduct a rigorous evaluation of South’s Career Academies.
PR/Award # S165A200036
Page e16

Project Narrative File(s)
* Mandatory Project Narrative File Filename:
To add more Project Narrative File attachments, please use the attachment buttons below.
1235-Narrative.pdf
View Mandatory Project Narrative FileDelete Mandatory Project Narrative FileAdd Mandatory Project Narrative File
Add Optional Project Narrative File Delete Optional Project Narrative File View Optional Project Narrative File
Funding Opportunity Number:ED-GRANTS-031020-001 Received Date:Jun 25, 2020 01:06:52 PM EDTTracking Number:GRANT13152207
PR/Award # S165A200036
Page e17

School District of Lee County 1
Table of Contents Competitive Preference Priority 1—Need for Assistance .............................................................. 2
(a) Costs of fully implementing the magnet schools project as proposed; ..................................... 3
(b) Resources available to carry out project if MSAP funds were not provided; ........................... 4
(c) Extent to which costs of project exceed the applicant's resources; and .................................... 6
(d) Difficulty of effectively carrying out project, including impact of design. .............................. 8
Competitive Preference Priority 2–-New or Revised Magnet Schools Projects........................... 10
Competitive Preference Priority 4—Increasing Racial Integration and Socioeconomic Diversity....................................................................................................................................................... 13
Competitive Preference Priority 5—Spurring Investment in Qualified Opportunity Zones ........ 16
(a) Desegregation .......................................................................................................................... 17
(1) Effectiveness of magnet plan to recruit diverse students; ....................................................... 17
(2) Foster interaction among students of different backgrounds; ................................................. 23
(3) Ensure equal access and treatment for participants traditionally underrepresented; and ........ 25
(4) Effectiveness of other desegregation strategies. ..................................................................... 28
(b) Quality of Project Design ........................................................................................................ 30
(1) Improve student academic achievement, including evidence, or a rationale; ......................... 30
(2) Professional training is of quality, intensity, and duration to lead to improvements; and ...... 40
(3) Collaboration of appropriate partners for maximizing effectiveness of project services. ...... 61
(4) Quality of conceptual framework. ........................................................................................... 64
(c) Quality of Management Plan ................................................................................................... 65
(1) Adequacy of management plan to achieve objectives on time and within budget; and .......... 65
(2) Ensure diversity of perspectives are brought to bear in operation of project, including parents, teachers, business community, professional fields, recipients or beneficiaries. ........................... 69
(3) Resources beyond grant, multi-year model and plan, partners, broad support ....................... 71
(d) Quality of Personnel ................................................................................................................ 72
(1) Qualifications of personnel-(a) The project director is qualified to manage the project; ....... 72
(b) Other key personnel are qualified to manage the project; and ................................................ 73
(c) Qualified teachers in magnet schools to implement special magnet curriculum. ................... 78
(2) Experience and training in fields related to objectives of project, including knowledge and experience in curriculum development and desegregation strategies. .......................................... 80
(e) Quality of Project Evaluation .................................................................................................. 81
(1) Extent to which methods of evaluation will produce promising evidence. ............................ 84
(2) Evaluation measures relate to outcomes and produce quantitative and qualitative data; ....... 98
(3) Costs are reasonable in relation to the objectives, design, and significance of project. ....... 112
References ................................................................................................................................... 118
PR/Award # S165A200036
Page e18

School District of Lee County 2
Selection Criteria
Competitive Preference Priority 1—Need for Assistance
Introduction: The School District of Lee County (Lee) proudly educates over 95,000
students in Pre-K to 12 and is the 33rd largest school district in the United States. The Pre-K to
12 student population is made up of 14% African-American, 2% Asian, 41% Hispanic, <1%
Indian, 6% Multi-racial, 37% White; 70% of its students qualify for the federal school lunch
program. Southwest Florida has experienced steady population growth the past 18 years, which
has increased enrollment by 1,300 - 1,500 per year. This growth has increased the need to hire
more new teachers and build more schools.
Lee’s academic performance is just above average in comparison to other school districts
in Florida. Lee’s graduation rate is 84% and ~ 55% of students in grades 3 - 10 read at or above
grade level. District averages represent a range of performance among Lee’s schools. The two
proposed magnet schools are at the lower range where only about 35 – 40% of their students read
at or above grade level. Lee’s response is a focused alignment of resources (Comprehensive
Funding Plan) and programs (Academic Plan) that provide the greatest support to the neediest
schools. This approach is an effort to create equity and excellence for all students by providing
targeted strategies to recruit and retain high quality educators in every school.
Lee County is located on Southwest Florida’s gulf coast between Sarasota and Naples.
Lee County is home to over 750,000 residents, which increased by almost 100,000 in three years.
The county’s largest industries are in trade and tourism and the largest employers are Lee Health
Systems and The School District of Lee County. There are six local municipalities within the
county, but these are not typical cities with large city centers. They reflect a sprawl of businesses
and housing with the majority of residents living in the unincorporated areas of the county.
PR/Award # S165A200036
Page e19

School District of Lee County 3
Lee’s beaches stretch for 50 miles in a resort and retirement community atmosphere, a natural
treasure which can distract observers from the economic and demographic stresses for many
citizens living in the county.
(a) Costs of fully implementing the magnet schools project as proposed;
Lee proposes to expand The Increasing Diversity and Achievement through Rigorous and
Engaging (I-DARE) Programs Project (Phase II) by establishing magnets in two of its high need,
racially isolated schools, one elementary and one high school. The cost of implementing the
magnet schools project far exceeds the district’s resources. Lee is experiencing severe economic
conditions that prevent it from providing the infusion of much needed funds in order for the two
proposed schools to fully implement thriving magnet programs that will each attract a diverse
student population.
Lee is requesting approximately per year for five years from the Magnet
Schools Assistance Program (MSAP). Funding is needed to support a magnet director, magnet
grant specialist, two magnet lead teachers – one per school, and 1 – 2 theme-based teachers per
school to support and deliver content within magnet schools. MSAP resources will support the
project’s seven objectives: 1) Reducing minority group and socioeconomic isolation; 2)
Delivering high quality instruction using magnet themes and aligned with Florida Standards; 3)
All students will be directly involved in magnet themed learning; 4) Student achievement will
increase, especially in ethnic and racial subgroups; 5) Teachers will be well-trained to improve
curriculum and deliver content; 6) Students will have equitable access; and 7) Their families will
increase participation in school. In relation to the project objectives, the budget supports
personnel, professional development, equipment, supplies, and contractual services to develop,
implement, monitor, and improve magnet themed instruction. The resources will attract diverse
PR/Award # S165A200036
Page e20

School District of Lee County 4
students who will receive high quality instruction in a theme-based atmosphere increasing
student achievement and support from families. MSAP funds will support an evaluation of the
project and a rigorous quasi-experimental study of the implementation of the highly researched
career academies that will be used in the proposed magnet high school. The study is of great
significance because it will help determine if students have a greater likelihood of earning a high
school diploma. These costs are reasonable and essential in order for Lee to efficiently and
effectively provide high quality educational programs to meet desegregation goals.
(b) Resources available to carry out project if MSAP funds were not provided;
Lee allocates funding using student enrollment and Direct Certification. Schools are
ranked based on demographics and performance. Greater funding is distributed to the neediest
schools. Principals are given discretion regarding allocation of their school budget. Lee provides
additional resources to the neediest schools based on results from progress monitoring data.
These additional resources, while limited, are provided in an effort to assist in developing the
current instructional staff.
Every school in the country is experiencing funding loss and learning loss, in addition to
lives lost, as a result of COVID-19. It has taken a major toll on all lives around the world as we
navigate through uncharted waters. There are certainly areas much harder hit by COVID-19 and
we understand they will have greater need for support. While the pandemic is not unique to Lee,
it is compounded by the ever-increasing enrollment and the lack of funding by the State of
Florida for K-12 student education. Average funding per-pupil in 2019 was $12,756 compared to
$9,764 per-pupil funding for Florida’s students. Florida is ranked 45th in K-12 education funding.
Lee is capable of providing in-kind resources to support the two proposed magnet
schools. Lee would provide all transportation to and from school for all students who select the
PR/Award # S165A200036
Page e21

School District of Lee County 5
two schools, like it does for the three magnet schools in our currently funded magnet grant. The
only exceptions would be extra funding from MSAP to support field trips and extra activity
buses for students who attend after school activities.
The two proposed magnet schools are part of a group of high-need schools that are
regularly monitored and receive teacher leaders (Learning and Leadership Teachers and Peer
Collaborative Teachers) who provide coaching and support to other teachers and teach direct
instruction 20% - 50% of the time. The teacher leader position has evolved and was funded
originally from another federal grant, Teacher Incentive Fund. Funding for the grant has ended
so Lee established a sustainability plan to continue funding teacher leaders in the high need
schools. Teacher leaders (in-kind) will coach and support new and developing teachers along
with mentor teachers at proposed magnet schools. Teacher leaders are well versed in research-
based, differentiated instructional strategies to help students. Curriculum would remain the same
in each school unless a particular subject had texts that were up for adoption. There would be no
additional funds to enhance the curriculum at either school, and the district has not budget funds
to enhance career academies at South Fort Myers High. The plans to expand the career
academies funded by MSAP are cost prohibitive. Even though the career academy expansion has
been highly researched and the previous study has been found to be effective for students staying
in school, the upfront costs are too much for Lee to include in its budget, however, the
continuation or maintenance costs are much more manageable.
Due to the high poverty in each of the proposed magnet schools, the schools each receive
federal Title I funding at a rate of per student. Funding is specifically allocated to improve
academic achievement primarily in reading and mathematics. There are limits on how funds can
be used to support these schools and Title I will not cover start-up costs to support the proposed
PR/Award # S165A200036
Page e22

School District of Lee County 6
magnet schools. Title I funds can be leveraged to support magnet programs once the programs
have begun in order to improve academic achievement.
(c) Extent to which costs of project exceed the applicant's resources; and
The costs to implement the proposed magnet schools are significant and exceed Lee’s
resources. The District does not have the resources needed to initiate the proposed project
without MSAP support, and lacks the essential start-up funds to develop the highly specialized
curriculum, support instructional and theme-specific professional development for teachers, or
purchase the sophisticated equipment and theme-based interactive learning centers necessary to
make these magnet schools a reality. In fact, Lee presently faces costly challenges just to meet
the needs of its current school operations.
Lee’s tremendous growth is demanding the building of more schools to accommodate
students, additionally, existing older schools need repair. In past years, Florida’ funding for fixed
capital outlay (building construction, maintenance, repair and renovation) has been down. School
districts across Florida have lost more than $4.6 billion in capital funding — which includes
renovations and technology — over the last eight years, according to the Florida School Finance
Council. In 2017 there was an 11 percent ($230 million) increase for kindergarten through state
universities. Funding for building maintenance, repair and renovation increased by 60 percent to
almost $248 million, but the allocation of funds did not correspond to student enrollments. For
example, public school students represent 65 percent of the total enrollment, but only 30 percent
of the allocation. Conversely, charter school students represent 6 percent of the total enrollment,
but received 30 percent of the allocation for maintenance, repair and renovation. This continues
to be a trend.
PR/Award # S165A200036
Page e23

School District of Lee County 7
Since the inception of charter schools in Florida, more and more funding has been
redirected from district schools to charters. This requires Lee to consider more local sources.
Property tax is the primary local source for school funding in Florida (where there is no state
income tax). Additionally, Lee’s school board is authorized to levy a sales surtax of up to
for capital outlay purposes if approval is obtained by referendum. Lee County citizens passed a
referendum for a half-cent sales tax in November of 2018 that is to be used for new construction,
building maintenance and safety. It cannot be used for any other areas such as equipment,
supplies, curriculum, teacher salaries or anything else. This was a huge win for the school district
in terms of building new schools and caring for older ones, but it will not support magnet-related
activities. Since mid-March sales tax revenue has declined as a result of COVID-19 which halted
tourism.
Between 2008 and 2012 Lee experienced in general fund budget reductions
and per student (Florida Education Finance Program) allocations.
Stimulus dollars helped soften the blow, but departments and schools all suffered reductions. The
table below does not include charter school students and the bars represent different funding
sources that were decreased or eliminated. These funding sources include: misc. fuel tax refund,
interest, classrooms for kids, Impact fees, Florida’s Public Education and Capital Outlay (PECO)
maintenance, taxes, PECO new construction, Capital Outlay and Debt Service. The line trending
upward in the Capital Reductions Table represents student enrollment. For the 2019-2020 school
year enrollment has grown to over 85,000 or to over 95,000 when charter students are added.
PR/Award # S165A200036
Page e24

School District of Lee County 8
Table: Capital Reductions in Lee’s School Funding
(d) Difficulty of effectively carrying out project, including impact of design.
MSAP funds will provide the necessary funding to fully implement magnet programs in
two racially and socioeconomically isolated and high need schools in Lee. Each proposed school
either resides in an Opportunity Zone (James Stephens Elementary) or serves students who live
in an Opportunity Zone (South Fort Myers High School). Opportunity Zones (OZs) are defined
as economically-distressed communities. Each state nominates blocks of low-income areas by
census tract, which are then certified. Lee County has 15 certified Census Tracts designated as
Opportunity Zones.
Additionally, Lee County economic development provides demographic data for specific
addresses to provide population information for the proposed schools. The following table
provides information about the location of each proposed magnet school in Lee. It is important to
note that students from a wider area, not necessarily in a radius are eligible to apply to the
proposed magnets. The geographic markers for how far students can reside and still be eligible to
apply is provided on a map within the student assignment plan and included in the Appendix.
64,000
66,000
68,000
70,000
72,000
74,000
76,000
78,000
80,000
82,000
0
50,000,000
100,000,000
150,000,000
200,000,000
250,000,000
300,000,000
350,000,000
Rev
enu
e
En
roll
men
t
PR/Award # S165A200036
Page e25

School District of Lee County 9
Table: Demographics of 5-Mile Radius for Proposed Magnet Schools Proposed
Magnet
Schools
Year Population
5mile
radius
Ages
0-19
Hispanic
(Total)
Black
(Total)
White
(Total)
Poverty
(Total)
Age 25+
no
diploma
James
Stephens El
2018 107,208 23,934 21% 18% 51% 35.5% 20%
James
Stephens El
2021 118,827 26,139 21% 18.5% 49.5% 30.5%* 20%
South Fort
Myers
2018 134,436 24,304 15% 7.5% 70% 23% 9%
South Fort
Myers
2021 147,080 26,865 16% 8% 68.5% 20%* 9%
*2021 Projections were prior to the COVID-19 Pandemic which has caused a large spike in unemployment.
Each of the proposed schools does experience some negative perceptions, in part, because
of the demographic and economic conditions surrounding the schools. The schools are
designated Title I schools and include large numbers of students traditionally underrepresented in
high performing programs and schools. Many of the households with children do not have
English as their first language, heads of households do not have high school diplomas, many are
undocumented, and are living, in some cases, in extreme poverty.
Staff at each proposed magnet school considered the student population, family, and
community when developing the type of program. They support a magnet program that would
help current students improve achievement through greater engagement and better resources and
would attract diverse students from across the county to want to be part of the school’s magnet
PR/Award # S165A200036
Page e26

School District of Lee County 10
program. Staff reviewed research to better understand what makes a successful magnet. Without
MSAP funds staff would have difficulty effectively implementing the plan because the magnet
would be best implemented school-wide, with effective outreach for prospective students
(University of Minnesota Law School, Institute on Metropolitan Opportunity, 2013). Each
proposed magnet, if MSAP funded, will implement a specialized curriculum and refine
instructional methods supported by training. In order to fully implement the curriculum, MSAP
funds are needed to support texts, technology, materials, staff training, and to allow for
experiential learning to occur. MSAP funds will provide the foundational funding while the
school (fundraising) and school district will support programming after the project period ends.
Competitive Preference Priority 2–-New or Revised Magnet Schools Projects
Lee proposes to carry out a new evidence-based program within its proposed magnet high
school in order to increase student achievement and reduce minority group isolation. The
elementary school will adopt a STEM magnet that has been successful in other school districts,
like Houston’s Ryan Middle School that went from the worst to one of the best performing
middle schools in Houston (Nelson, 2018). The elementary magnet theme was selected to
provide the critical foundation for STEM disciplines that will facilitate later learning. This will
allow young children to utilize their curious nature and explore the world around them (Sarama
et al., 2018). Additionally, the elementary is located near a successful STEM high school that has
earned math, science and technology national awards in recent years, including international
awards in Microsoft competitions. This high school, Dunbar High, will partner with the
elementary to provide high school mentors to elementary students as they engage in STEM
competitions.
PR/Award # S165A200036
Page e27

School District of Lee County 11
The proposed magnet high school will offer Cambridge and Career Academies as
separate school-within-school structures, but in total will include the entire student body. A
Career Academy approach will encompass four academies: Health & Safety, Technology,
Automotive & Construction, and Hospitality. In an effort to increase student achievement at
South Fort Myers High, Lee looked to a randomized control trial conducted by Kemple and
Snipes (2000) to create greater support and structure within the Career Academies (included in
Appendix).
Kemple, J.J., & Snipes, J.C. (2000). Career Academies: Impacts on Students’ Engagement and Performance in High School. Retrieved from https://ies.ed.gov/ncee/wwc/Study/78544
Meets the What Works Clearinghouse Evidence Standards without reservations.
This study found that Career Academies increased positive relational support of students from teachers and peers and increased career awareness as well as workplace skills acquisition. The study also found decreased dropout rates and greater potential of on time graduation among student subgroups. The proposed project will create career academies with interpersonal supports, focused curricula providing enriched learning opportunities, career awareness, and work-based learning opportunities.
Kemple and Snipes (2000) addressed three questions in their report. They wanted to know to
what extent the Career Academy approach altered the high school environment in ways that
better support students academically and developmentally. They wanted to know to what extent
the Career Academy approach change educational, employment, and youth development
outcomes for students at greater or lesser risk of school failure. And they wanted to know how
the manner and context in which Career Academy programs are implemented influence their
effects on student outcomes. Some of the key findings included: increased both the level of
interpersonal support students experienced during high school and their participation in career
PR/Award # S165A200036
Page e28

School District of Lee County 12
awareness and work-based learning activities; Career Academies substantially improved high
school outcomes among students at high risk of dropping out; Among students least likely to
drop out of high school, the Career Academies increased the likelihood of graduating on time;
and in sites where the Academies produced particularly dramatic enhancements in the
interpersonal support that students received from teachers and peers, the Career Academies
reduced dropout rates and improved school engagement for both high-risk and medium-risk
subgroups.
Career Academies will be implemented at South Fort Myers High School (South). There
are four overarching academies that will make up the career academies at South. These
academies include: Health & Safety, Technology, Automotive & Construction, and the newest
Hospitality & Tourism. These academies will adopt career academy standards based on the
National Standards of Practice for Career Academies. This will help to align the instruction,
learning, and support needed to create success for students. The approach for career academies
will be a smaller learning community, career theme curriculum, and an advisory board of
business and community members. Students as freshmen will explore career academy options.
Students enter a career academy, officially in sophomore year and continue through senior year
where they will experience internships and industry certifications.
To address the interpersonal and work skill supports needed by students in the career
academies the school will utilize the BARR (Building Assets, Reducing Risks) program. BARR
is a strengths-based model that provides schools with a comprehensive approach to meeting the
academic, social, and emotional needs of all students. Through the implementation of the BARR
program and the Personal and Career Development approach, South harnesses the power of
relationships and data to become more equitable, ensure that no student is invisible, and remove
PR/Award # S165A200036
Page e29

School District of Lee County 13
both academic and non-academic barriers to learning. The BARR model leads to better academic
performance and fewer course failures (Corsello & Sharma, 2015). Additionally, a BARR
Personal and Career Development course will provide opportunities for career exploration and
support for career academy students. By addressing soft skill gaps between learning a career and
implementing it, students will find a more successful transition from high school to their chosen
career.
Lee, using MSAP funds, will contract with an evaluation firm and a partnering institution
of higher education to conduct a rigorous, quasi-experimental study of Career Academies.
Students enrolled in the Career Academies will be in the treatment group and students enrolled in
the Cambridge/AICE program at the same high school will represent the control group. More
details about how Career Academies will be implemented is provided in the Project Design
section and details are included in the Evaluation section.
Competitive Preference Priority 4—Increasing Racial Integration and Socioeconomic
Diversity
Many Lee County residents value diversity, and Lee strongly believes in its educational
benefits. Lee defines diversity broadly to include a number of factors: gender, socioeconomic
status, race, ethnicity, academic achievement, language ability, and exceptional education needs.
It is well established that schools with such multifaceted diversity contribute to a number of
educational values. Experience in a diverse classroom better prepares students for the work force
and trains students to better exercise their civic responsibilities. Education in a diverse school
environment enhances students’ values by bringing them together in ways that can reduce racial
fears and stereotypes, teaches students how to interact comfortably and respectfully with people
PR/Award # S165A200036
Page e30

School District of Lee County 14
who are different from them, and prepares students to be better neighbors, colleagues, and
citizens in our multicultural, democratic society.
Diversity in the student body also helps to improve teaching and learning for all students
by encouraging a multiplicity of viewpoints. Moreover, placing disadvantaged students in
diverse classrooms in which teachers have high expectations for all students, can positively
affect their educational achievement and long-term prospects, without negatively affecting the
performance of other students. In addition, diverse enrollments can improve preparation for
employment and post-secondary education by teaching students the value of different
perspectives, how to function in multicultural business and educational settings, and how to
communicate effectively in our increasingly heterogeneous domestic workforce and expanding
global marketplace.
In contrast, high concentrations of poverty, high percentages of low achieving students,
and racial isolation can all cause or contribute to serious educational harms. It is widely known
that many of the conditions associated with poverty present significant challenges for educators.
Research has shown that when high concentrations of poor students are assigned to any given
school, the academic achievement of all students in that school may be adversely affected.
Similarly, students who are not achieving on grade level, present significant challenges
for educators, and high concentrations of such students can have a negative impact on all
students in the school. Finally, as Lee has learned through its own history of desegregation,
students at racially isolated schools not only miss-out on the educational benefits of learning in a
diverse environment, but also may suffer additional educational harms from such isolation.
In monitoring its progress in achieving diverse enrollments, Lee within its Student
Assignment Plan (included in Appendix) considers Socioeconomic status, academic
PR/Award # S165A200036
Page e31

School District of Lee County 15
performance, race and ethnicity, English Language Learners, and Exceptional Student Education
and specific targets to assure diverse enrollments are maintained at all schools. Specifically, as it
relates to Socio-economic Status – Lee’s goal is for each school to have a diverse enrollment
with respect to socioeconomic status. The District’s target for each school is to maintain student
enrollment that is within 20 percentage points, plus or minus, of the zone-wide average of
students eligible for Free and Reduced Meals for each level (elementary, middle and high). As
shown in the following example, an individual elementary school would be within an acceptable
range if the student population receiving free and/or reduced meals or free and/or reduced lunch
(FARMS or FRL) represents between 38 percent and 78 percent of the total enrollment. Since
2016, Lee County is a Community Eligibility Provision (CEP) School District so new targets for
Direct Certification may change, but the following table provides an example of targets. In
addition, Lee may collect other information regarding family socio-economic situations as
students participate in the application process.
Table: Socio-economic diversity targets
Race and Ethnicity – Lee’s goal regarding race and ethnicity is for its schools to have
enrollments that include all racial and ethnic groups enrolled in the school district and sets a
target that no racial or ethnic group representing at least 5 percent of a zone’s enrollment will
School level Free/Reduced
Zone Average
Acceptable
Variations
Lower
Limit
Upper
Limit
Elementary 58% 20% 38% 78%
Middle 51% 20% 31% 71%
High 37% 20% 17% 67%
Totals 50% 20% 30% 70%
PR/Award # S165A200036
Page e32

School District of Lee County 16
vary from one school to another by more than 20 percent of the zone average for each level
(elementary, middle and high). The proportion of elementary Hispanic children at any
elementary school should fall between 25 percent and 37 percent of the total population;
whereas, the proportion of White students would be targeted to range from 32 percent to 49
percent. Specific targets would not be set for Asian and Indian students in this example because
they do not represent more than 5 percent of the zone population at any level.
Lee’s Director of Diversity and Inclusion and his staff, which include a coordinator and
two teacher leaders support district staff and students in a multitude of ways. They support or
lead training in cultural awareness and diversity and they advise senior staff regarding issues of
equity and support for all students and staff. The Diversity staff also regularly share
communication on best practices for creating a supportive, equitable, and diverse community of
learners. This department is critical in helping review the diversity of our schools and discussing
means for creating schools that are more reflective of the overall diversity of Lee County. The
Diversity and Inclusion Department was integral in selecting the two proposed magnet schools.
Competitive Preference Priority 5—Spurring Investment in Qualified Opportunity Zones
Lee has 15 certified census tracts designated as Opportunity Zones. Lee is divided into
three school enrollment zones. There are 17 schools located within the Qualified Opportunity
Zones (QOZ), and there are students who reside in QOZ who may not attend a school within a
QOZ. Lee’s open enrollment process allows students to choose among schools inside and outside
their neighborhoods. The table below provides the census track number of the QOZ for James
Stephens Elementary and the census track number of the QOZ for the neighborhoods where
students reside that can choose to attend South Fort Myers High School.
PR/Award # S165A200036
Page e33

School District of Lee County 17
Table: Qualified Opportunity Zones and Proposed Magnet Schools
QOZ Census
Tract Number
School located or
serving students
Within that QOZ
Services to be Provided
12071000503 James Stephens
Elementary
Public education options for students in
grades K-5 and 9-12
Magnet-themed teaching and learning
Equal opportunity employment within
the district
12071000600,
12071001910,
12071050103
South Fort Myers High
School
(a) Desegregation
(1) Effectiveness of magnet plan to recruit diverse students;
Lee’s strategic plan (known as Envision 2030) three areas of highest impact: Family &
Community Engagement, Workforce Success, and Continuous Improvement. The plan focuses
on five overarching objectives: increase academic achievement, increase kindergarten readiness,
increase college and career readiness, increase workforce success, and increase operational
efficiency and effectiveness. The first three objectives of Envision 2030 directly impact the two
proposed magnet schools through support of early learning, improved overall student learning
and creating tangible pathways for students as they graduate. Lee’s approach is to address the
learning spectrum that is PreK through graduation.
While there is certainly academic merit to addressing the learning spectrum, there is also
real merit in making sure that students of different backgrounds are successful in all of these
programs. At the secondary level, to further address the achievement gap, this magnet plan will
PR/Award # S165A200036
Page e34

School District of Lee County 18
deliver AVID (Advancement Via Individual Determination) to help teachers shift from
delivering content to facilitating learning, resulting in an inquiry-based, student-centric
classroom. AVID fosters a safe and open culture, high expectations for teachers and students,
and collaboration in all classrooms. Highly-effective teachers at the high school will reach out to
middle school teachers and middle school students of different social, economic, ethnic, and
racial backgrounds. Teachers will help identify underrepresented students and educate them on
the magnet choice options at South Fort Myers High School.
To be effective, this magnet plan must address a number of factors that lead parents to be
less likely to choose the three identified schools. Both schools are Title I schools, with high
populations of students from low socioeconomic households. Both schools, over the past 5 years,
have averaged a state accountability grade of “C.” Both schools have a much higher rate of
students from racial and ethnic minority groups (72 to 82%) compared to the District-wide
average of 56%.
James Stephens Elementary is located in a Qualified Opportunity Zone (QOZ) (an
economically-distressed community) and most of the students enrolled at the school reside in a
QOZ. While South Fort Myers High is not located in a QOZ some of its students reside in QOZs.
Many of the children in these two schools live in households facing serious challenges in
providing appropriate health care, nutrition, and security, and this is true now more than ever
during this pandemic and extreme job loss.
The school district has helped schools with these demographic challenges before. In a
number of prior magnet school projects, the programs were so enticing, so dramatically different,
and so well-supported that they have continued to thrive long after the initial magnet funding
ended. In several cases, these former magnet schools are showcase schools, and it is difficult for
PR/Award # S165A200036
Page e35

School District of Lee County 19
anyone to believe they were once the first choice of no parents at all. In other cases, overcoming
profound negative connotations for a particular school is a difficult challenge, but achievable.
Our current magnet grant, awarded in 2017, is experiencing a renaissance of sorts with
greater focus at the school and greater interest in the community. The approach with these three
magnets is to work on sustainability from the beginning and it appears to be taking root. After a
long history of magnet programs, Lee has determined that the most sustainable, effective, and
enduring magnet projects have been those that significantly altered the diversity in magnet
schools earlier rather than later. Some conspicuous portion of the magnet “change” needs to be
dramatic and immediately visible, rather than only improvements that build gradually.
Marketing for the schools
Therefore, in addition to creating highly-appealing academic programs at the schools,
Lee will strengthen the attraction of these schools by marketing the schools to appeal to parents
and students from diverse socioeconomic backgrounds and to parents and students from outside
the neighborhoods in which these schools are located. In particular, parents of students in nearby
private schools and charter schools will be marketed in time for the District’s student assignment
“season” that includes open house events and community outreach appearances.
By capturing the attention of these parents early in the school selection timelines, and by
marketing the schools precisely to overcome the negative connotations, Lee will increase
socioeconomic diversity in these schools, with associated improvements in reducing racial and
ethnic isolation and with associated academic benefits to all students in the schools.
The marketing campaign will be varied as much as possible to reach parents currently
selecting other suburban schools. Marketing materials will emphasize positive aspects of these
school programs, including highlighting the high quality of teachers, the innovations in academic
PR/Award # S165A200036
Page e36

School District of Lee County 20
offering, and the excitement of the magnet school experience. Traditional media including
television, radio, newspaper, magazine, brochures, and direct mail media will be used along with
digital and social media. The magnet-funded family-community engagement specialist will
manage Twitter and Facebook accounts to promote magnet school events, the success stories of
star students, faculty activities and honors, and theme-specific information about the schools. A
dedicated set of magnet school project Web pages will be developed by the family-community
engagement specialist and published on the front of the District Web site during the enrollment
season to keep parents aware of the excitement at these new magnet schools.
The project director will work closely with the District’s Executive Director of Student
Enrollment to ensure the new magnet programs at the two schools are featured and promoted in
the district enrollment office. For example, the District’s Web site will be updated with content
that is presented in a more accessible format for people with disabilities in order to provide
information about the new magnet programs. Moreover, the project director and the family-
community engagement specialist will assist the schools in setting up display and information
tables at community events, such as Taste of the Town or the Edison Festival of Light events, in
order to inform the general public about these new magnet programs. The project director,
family-community engagement specialist, and the marketing team at each school will also
implement specific methods to recruit students from different social, economic, ethnic, and racial
backgrounds, which is detailed in the table below.
Table: Magnet Schools’ Recruitment and Marketing Plan
Marketing Methods Target Audience Timeline
School Web site redesign Prospective families and
partners
Immediately, updated
quarterly
PR/Award # S165A200036
Page e37

School District of Lee County 21
School open houses Prospective families January of each year
School marquee – displays
school/community events and
accolades
Prospective families,
community
Within first year of
project
School tours Prospective families, citizens,
volunteers
January – March of each
year
Brochures Prospective families in School
Choice office and each
school’s main office
December of each year
School performance events Current families, local
residents, community partners
At least quarterly and
varied academic and
talent events
Press Releases on significant
school events and
accomplishments
All local print, online, social
media, and television media
outlets
At least every two weeks
Recruiting for the schools
To track the effectiveness of this marketing in real time, the magnet director and the
family-community engagement specialist will monitor socioeconomic diversity of applications
made during and after the student assignment process, thus allowing for both immediate and
long-range changes to marketing tactics if indicated. The full-time family-community
engagement specialist will serve the two schools during the enrollment season, and continue to
serve the schools throughout the calendar year. The family-community engagement specialist
PR/Award # S165A200036
Page e38

School District of Lee County 22
will study and recommend changes to school branding, and will collaborate with the District’s
communications director to relentlessly promote the new brand of these schools to parents and to
the larger community as well. Spreading the good news about these schools will encourage
community, civic, and business partnerships, which will in turn further strengthen the academic
success of these schools.
The family-community engagement specialist will use an attractive and professional
mobile booth and informative and engaging brochures and marketing materials to take the
message about these magnet schools to community events where school reputations can be
enhanced — local festivals, fairs, social events, student competitions, town hall meetings,
seminars, cultural events, teacher recruitment fairs, summer camps, and open houses and parent
events at other schools targeted as having potential magnet students. The family-community
engagement specialist will spread the word about the schools throughout the years to make sure
that parents considering a change in school will know that these high-quality magnet schools are
prime choices.
Working closely with each school’s principal and magnet team, the family-community
engagement specialist will implement a site-specific plan for attracting, serving, and retaining a
highly-diverse and high-achieving student population. As needed, the family-community
engagement specialist will analyze school and student data to make suggestions to the principal
and the magnet director about possible improvements in school practices or offerings that could
enhance parent satisfaction and student success. During the final year of the magnet project, the
magnet director and the family-community engagement specialist will work with each magnet
principal and magnet team to plan a seamless transition so that these marketing and recruitment
activities will be sustained by school staff after the grant project ends.
PR/Award # S165A200036
Page e39

School District of Lee County 23
(2) Foster interaction among students of different backgrounds;
Lee’s longstanding, controlled choice plan (adopted in 1997 after achieving unitary status
in the settlement of a decades-long desegregation lawsuit) has helped schools gain considerable
expertise in selecting, implementing, and marketing effective themes and special programs to
improve their appeal to students and families. This experience demonstrates that families will
indeed select a new school if what is being offered represents an authentic implementation of
what is promised.
Every child, every day
The project director will work with each school’s principal and faculty — including
working within each school’s existing professional learning community processes — to make
sure that authentic implementation occurs, that the magnet theme enriches every part of the
school program, and especially that benefits of the magnet program reach every student
regardless of race, ethnicity, or socioeconomic background. Each school’s staffing plan, master
schedule, school improvement plans, Title I plans, discipline processes, communications
methods, and extracurricular programs will be reviewed to make sure that no subgroup of
students is inadvertently left out of the magnet experience. Performance measures for this project
will include mathematics, reading, and science achievement for all subgroups. Teachers will be
provided with professional development programs that support culturally responsive teaching for
diverse populations, effective differentiated instruction, and inclusion. The principals will
encourage and support project-based learning, team learning, multicultural, and multidisciplinary
learning throughout the school program to help foster true interaction and engagement among
students.
Supporting true interaction in a diverse school
PR/Award # S165A200036
Page e40

School District of Lee County 24
As each school’s magnet program grows and flourishes, all of these interventions will
continue to be supported. Newly-hired teachers are quickly brought up to speed on the special
programs. All teachers will receive training and coaching to help them understand how the
magnet theme is changing teaching and learning in the school, and how to make sure their own
lessons fully engage all students.
The project director and principals of each magnet school will monitor student
participation within classrooms and in each school’s extracurricular programs to ensure
participation of all students of all backgrounds. When participation appears to be
incommensurate, the project director and the principals will work with teachers and parents to
identify and remove barriers to participation that may exist. Various factors such as counseling,
teacher training, scheduling, communications, lesson planning, and transportation may affect
equitable participation and true participation, and all of these factors will be considering in the
ongoing monitoring. When indicated, students, parents, and teachers may be surveyed to
measure the effects of these factors, and help guide changes that would advance interaction.
A challenging but essential component of this approach will involve the principals
leading each school’s faculty in avoiding ability grouping whenever possible in favor of
heterogeneous grouping. These efforts will ensure that students from all racial, ethnic, and
socioeconomic backgrounds are working and learning together throughout the school day in the
same classes, with the same teachers, with the same privileges and responsibilities.
The selected magnet themes will be supported by the proven instructional methods of
project-based learning, differentiated instruction, and cooperative learning, all of which innately
support and promote high-yield student interaction. A rich variety of projects, exhibitions,
presentations, camps, and practical experiences will promote high levels of student engagement
PR/Award # S165A200036
Page e41

School District of Lee County 25
and a high degree of interaction among students. Students at the elementary will explore their
surroundings, conduct experiments, build creative projects, and read books together. They will
share vivid enrichment experiences together, including going to summer camp, touring the
Kennedy Space Center in Florida, and experiencing robotics competitions. They will explore
new technology and new software together, and they will learn to discover together. The high
school students will be supported by the AVID and BARR programs that give students the extra
supports and skills needed to be successful in school and beyond. They will discover the power
of working in teams, and they will find new strengths within themselves to bring to these team
efforts. Throughout all of this, they will be coached by teachers who have received specialized
training in methods to promote student engagement and interaction.
They will find individual success by working together, and they will find personal
development by making new friends. These rich experiences and interactions will strengthen
their bond to their teachers and their school, and give them the skills and confidence they need to
move on in continuum of learning.
(3) Ensure equal access and treatment for participants traditionally underrepresented; and
Lee’s proactive stance toward equity will help the magnet programs flourish, and help
these schools reach underserved participants. The Director of Diversity and Inclusion and his
staff is focused on eliminating racial and socioeconomic inequities, eliminating systemic racism,
eliminating achievement gaps and improving diversity of District and school staff. He reports
directly to the superintendent to provide guidance in creating a safe and inclusive learning
environment for all (Letter of support by the Director of Diversity and Inclusion is attached). The
PR/Award # S165A200036
Page e42

School District of Lee County 26
Director of Diversity and Inclusion works closely with Professional Development to bring
trainings on such topics as culturally relevant pedagogy.
The Director of Professional Standards and Equity works with each school to ensure
equal access and treatment for all students, staff and families, and helping to remove barriers to
student success. The School Board has adopted policy that ensures equity in school programs
and employment practices, and provides that no person shall be excluded from participation in,
be denied the benefits of or be subjected to discrimination in any educational program or activity
based on race, color, religion, sex, sexual orientation, national or ethnic origin, marital status,
disability if otherwise qualified, or any other unlawful factor. Lee has designated two equity
contacts to enforce this policy, one for employees and another specifically for students.
Each magnet school will implement their magnet program in ways to ensure equal access,
particularly for those who have been traditionally underrepresented in courses or activities. The
grant-funded curricular improvements, the marketing program, and the recruitment program will
attract a new student population of racially and ethnically diverse students to these schools. They
will be inclusive of students with disabilities, students with 504 plans, and students with limited
English proficiency. Lee’s student enrollment program will provide parents with extensive
information and assistance in selecting the best choice of schools to meet the individual needs of
their children. The family-community engagement specialist will expand this parent outreach by
offering community-based consulting and information sessions to make sure that parents are
aware of these choices available to all students.
Effective instructional practices will be used to foster interaction among students of
varying backgrounds. To the greatest extent possible, ability grouping will be minimized in favor
of inclusive, multidisciplinary, and cooperative classroom structures. The project director and
PR/Award # S165A200036
Page e43

School District of Lee County 27
principals will monitor schedules and plans to ensure that inadvertent sorting and selecting does
not take place, and that students of all genders, races, ethnicities, languages, and abilities receive
the full benefit of these magnet programs, and of the entire school program beyond that include
extracurricular programs. Students will be encouraged to participate on the bases of their own
interest rather than on demographic or ability factors. This is of special concern in the case of the
STEM and STEM-related Career Academies offerings at these schools. Special attention will be
given to ensure effective recruitment and equitable success of girls and minority students, who
have been traditionally underrepresented in such programs. Women and members of racial and
ethnic minorities who have been successful in STEM careers will serve as role models in
presentations, tours, trips, and classroom instruction.
Students with disabilities will be equitably served in such a way as to ensure
participation, meaningful interaction with other students, and academic success. Lee will provide
assistive and adaptive technologies whenever needed for students who have vision or hearing
impairments. All instruction will take place in ADA-compliant facilities and all student
transportation will be outfitted to accommodate individual student needs, including students with
special behavioral or medical needs. The schools will use a high-quality MTSS model to identify
any factors that might limit success early on, and monitor the success of any interventions or
accommodations needed.
English language learners will be well-served in these magnet programs, with teachers
who have been specially training in ESOL strategies. Curriculum materials and activities will be
linguistically and culturally diverse, and will encourage acquisition of academic English skills
while celebrating multilingualism. The family-community engagement specialist will provide
PR/Award # S165A200036
Page e44

School District of Lee County 28
information to parents in English, Spanish, and Haitian Creole to ensure that students of diverse
linguistic backgrounds have full access to the magnet programs.
(4) Effectiveness of other desegregation strategies.
In 1997, acting under a court-ordered desegregation plan, the Lee County School Board
adopted a controlled open-enrollment method of student assignment. The District achieved
Unitary Status in 1999. The system of one-neighborhood-for-one-school was been replaced with
an open-enrollment system. What had become an annual and upsetting ritual of redrawing school
boundaries, moving children involuntarily from one school to another to accommodate growth
was replaced with a system in which parents rank a variety of school options.
For 23 years now, the School Board has continued to regularly assess and regularly
modify its student enrollment plan to ensure that parents have the widest possible school options
for their children while still providing stability once those decisions were made. The District’s
student enrollment plan differs from the traditional boundary method of student assignment in
that once students are enrolled in a school, they may remain in that school to the highest grade
available unless: (1) they choose to leave; (2) they move out of the zone, or (3) they require
placement in an alternative program. This method promotes academic improvement and
accountability through constructive competition.
The Student Enrollment Plan divides Lee into three large geographic Zones—each
containing several elementary schools, middle schools, and high schools. A student’s home
residence determines which set of schools, among the three zones, are available for parental
choice. Parents select schools through the student assignment process when (a) entering
PR/Award # S165A200036
Page e45

School District of Lee County 29
kindergarten, (b) rising to middle school, (c) rising to high school, (d) when new to the District at
any grade, or (e) when moving from one zone to another.
The current plan provides for a large number of choices for every family, as shown in the
following table. The choices do not account for charter schools and private schools.
Table: School Choices by Geographic Zone in FY20
East Zone South Zone West Zone
Elementary school choices 17 15 14
Middle school choices 6 6 7
High school choices 4 6 5
Over the years, this system has been refined to the point that 95% of families are assigned to one
of their top three school choices, and 82% are assigned to their top-ranked school. This system is
continuously monitored by a Marketing and Program Placement Committee, which works to
maximize the choices available to every parent, and to ensure that all schools are desirable
choices.
This work is then balanced by that of Lee’s Equity and Diversity Advisory Committee.
This School-Board-appointed committee monitors the District’s maintenance of a unitary school
system and adherence to School Board Policies concerning equity and diversity. The committee
recommends revisions to the student assignment plan to prevent racial, ethnic, and
socioeconomic isolation and promote diversity. Moreover, this committee works closely with the
Director of Diversity and Inclusion and District’s Department of Recruitment to improve efforts
in hiring and retaining a diverse teacher workforce. The committee’s most recent work has
PR/Award # S165A200036
Page e46

School District of Lee County 30
focused on a diversity climate survey, diversity for recruitment of teachers, expanding language
options for information messages, and better equipping students with mental and/or physical
disabilities for college or career.
(b) Quality of Project Design
(1) Improve student academic achievement, including evidence, or a rationale;
Magnet school programs have the potential to improve student academic achievement in
two ways: by delivering an enhanced, specialized academic program and by student integration
within the schools and classrooms (University of Minnesota Law School, Institute on
Metropolitan Opportunity, 2013). Additionally, the research found stronger peer support for
academic achievement. The I-DARE II project will focus on one elementary and one high school
and use a two-pronged approach to address both program and student enrollment. The first will
target all elements needed to fully implement a specialized academic program and theme. The
second will address student integration so the proposed magnets will reflect the overall district
student population and create the rich and diverse student enrollment within classrooms needed
for improved student achievement.
The proposed magnet schools are designed to improve academic achievement for all
students enrolled in the schools. Measurable goals and performance measures are established in
the objectives to quantify the effectiveness of the project, not only to meet academic objectives,
but also to provide a continuum of benchmarks through the project years that will provide project
staff and schools the data to stay the course or make midcourse adjustments. In the proposed
magnet schools, all teachers will set high expectations for themselves and for all students, and
students will be energized by exciting and engaging instructional strategies and learning content.
PR/Award # S165A200036
Page e47

School District of Lee County 31
The challenging, interdisciplinary curricula will be engaging and stimulating for all. Students
will be challenged academically and will receive the supports needed to be successful.
The project logic models (one district level, one per school in Appendix) are the framework that
identifies the key inputs, outputs and outcomes. Project logic model activities include:
desegregation/student recruitment, improved curriculum and instruction and student academic
supports, magnet theme integration, professional development, and parent involvement. The
logic models are explained in greater detail in Quality of Project Design, section (4).
James Stephens Elementary – STEM Magnet School
James Stephens will enhance its academic program through STEM integration, in order
to attract students of diverse populations. James Stephens staff is committed to integrating
science, technology, engineering and mathematics into every classroom on campus for its 480
students. The STEM was chosen because if delivered exploration, structured play, and building
as the opportunity to promote highly engaging and effective hands-on and inquiry-oriented
learning to support development of new skills that emphasize higher orders of thinking,
creativity, design, and innovation thereby increasing student academic achievement (Nugent,
Barker, Grandgenett, & Adamchuk, 2010). James Stephens will partner with key science and
engineering organizations/businesses to strengthen its infrastructure supporting STEM (Hess,
Kelly & Meeks, 2011). James Stephens’ plan for sustainability will be to develop student
mindsets through the use of elementary engineering curriculum and increased use of technology,
garner sponsors, and promote individualized learning to increase student achievement.
In addition to STEM, James Stephens will continue to support its students through social
and emotional supports as well as through necessary reading interventions. James Stephens will
use the research-based program Reading Recovery. It is a short-term tutoring intervention that
PR/Award # S165A200036
Page e48

School District of Lee County 32
provides one-on-one tutoring to first-grade students who are struggling in reading and writing.
Reading Recovery helps to develop literacy skills, reducing the number of students who are
struggling to read, and is intended to prevent long-term reading difficulties. This reading
program is a supplement to classroom teaching with tutoring sessions, generally conducted as
pull-out sessions during the school day. Tutoring will be delivered by trained Reading Recovery
teachers in daily 30-minute sessions over the course of approximately 18 weeks. Reading
Recovery is found to have positive effects on reading fluency and alphabetic domain and is cited
in What Works Clearinghouse (Schwartz, 2005).
James Stephens understands the evidence that students who experience inquiry-based
learning through STEM instruction show gains not only in academic achievement measured in
standardized testing of science and mathematics, but they also showed positive attitudes towards
STEM related career fields (Acar, Tertemiz & Taşdemir 2018). James Stephens has reached out
to Dunbar High School, a Lee County high school that provides a technology academy that
offers over 33 IT certifications which include but are not limited to Microsoft, Adobe, and
Storyboard Max. This model school is home to three Microsoft Office World Champions and is
considered a Microsoft Mentor School. In addition, they also offer an Engineering Academy that
provides engineering curriculum to encourage students to pursue engineering and related science
disciplines. Dunbar High School has relationships with over 100 colleges and universities and of
those 36 offer credit for completion of their academy coursework. This school will be a valuable
resource to James Stephens as it implements its magnet theme.
James Stephens will utilize a Magnet Lead Teacher and a STEM teacher to support
instruction and learning. They will help lead plans to integrate STEM into all disciplines: social
studies, science, English/Language Arts, mathematics and special areas such as media, art, music
PR/Award # S165A200036
Page e49

School District of Lee County 33
and physical education. These plans will further be refined each school year to best meet student
learning needs and aim to provide a tiered approach to build capacity for students in each
discipline. An example of James Stephens’ approach to engineering integration is provided
below.
At every level, elementary teachers will instruct using the Engineering Design Process
within their classroom instruction. This is a five-step process that guides students through the
engineering challenges by asking, imagining, planning, creating and improving. Once this
design process is taught, teachers will use the Engineering is Elementary curriculum to introduce
engineering challenges for students to work through using the design process. These units mirror
state standards that each grade level would be teaching within their science block. These lessons
infuse literacy through the use of a storybook in which a character in the story solves a real-
world problem through engineering and progresses further to hands-on lessons that allow
students to problem solve, think critically and work through their design process step by step.
Partnerships with local science agencies will allow students to gain experience with utilizing
their new-found problem-solving skills in a real-world context. For instance, students can use
their science and engineering skills built in the Ecosystems units by visiting the Mudflats off
Bunche Beach to explore an ecosystem and food web using the tools and skills acquired through
the Engineering is Elementary units.
South Fort Myers High School – Cambridge and Career Magnet Academy
South Fort Myers High School (South) will enhance its career academies by creating a
more school within a school approach and will add Cambridge/AICE to their curriculum for
students who choose college as a next step after high school. Career academies have created
viable pathways for graduates and increased their wages compared to non-academy students
PR/Award # S165A200036
Page e50

School District of Lee County 34
(Kemple & Willner, 2008). Career academies have also helped young people become more
financially independent (Kemple & Willner, 2008). The four-year Cambridge curriculum and
exams leading to an Advanced International Certificate of Education (AICE) Diploma have been
found to increase student performance and prepare students for continued studies in college
(Shaw & Bailey, 2011).
South is combining Cambridge and its career academies to create a Cambridge and
Career Magnet Academy. Cambridge will be a new addition to the curriculum at South and will
be a thoughtful and planned execution. The Cambridge AICE program is of great value to
students. The Florida legislature and the Florida Department of Education support Cambridge
through financial awards and college tuition. Students meeting the AICE Diploma requirements
become Florida Academic Scholars and receive an award to cover 100% of college tuition and
applicable fees and $300 for both fall and spring semesters for additional educational expenses.
Florida Medallion Scholars receive an award to cover 75% of tuition and applicable fees.
Students attending a public institution will have tuition and applicable fees covered.
During the 2020-2021 academic year all currently enrolled students will be invited to opt
in to a Cambridge program. Also, during this year the Magnet Lead Teacher, Cambridge
Teacher, school administrators, counselors, and other teacher leaders will begin a communication
campaign to all middle school teachers and students in the feeder schools. Information about
Cambridge, its benefits, and the desire of South to attract a diverse student body with diverse
perspectives and talents will be the focus. Teachers will be encouraged to identify students
traditionally underrepresented in programs like Cambridge. South staff will reach out to these
students and their families and share the benefits of the program.
PR/Award # S165A200036
Page e51

School District of Lee County 35
The Cambridge program in Year 2 and following will include an application with
academic requirements for entering the program. The Cambridge recruitment team will work
diligently to ensure there is a large diverse applicant pool and that academic requirements do not
limit opportunity for those who want to opt in. This is where the AVID (Advancement Via
Individual Determination) program will help support a diverse applicant pool. Each feeder
middle school offers AVID to underrepresented students or students on the verge of becoming
college ready. AVID instruction delivers tools such as organizing, study and personal skills to be
better prepared for college and career.
AVID instruction and support are integral to South’s curriculum and will continue to
guide students with the help of a college tutor who acts as a role model for the high school
student. Students learn through AVID to support one another and to work through any challenges
by utilizing inquiry, writing, and collaboration. This activity is beneficial for success in all
coursework and personal growth. Students will actively explore the different potential pathways
for their future. A student is able to determine whether they want to pursue an academic or
academy pathway during high school. Students who choose to enroll in a career academy will
participate in AVID instruction that emphasizes career readiness and soft skills. AVID offers
students the opportunity to research potential careers, progression, and the actions needed to
achieve those careers. AVID curriculum, in addition to a discrete class, is integrated into student
core courses and provided through the Weeks at a Glance (WAG), AVID Weekly, tutorials, and
the College and Career materials.
South has offered career academies since it was built in 2005, but it has gone through
many changes over the past 15 years resulting in a shift in the student population. South is
working to get their academies all at a high performing level and have made improvements with
PR/Award # S165A200036
Page e52

School District of Lee County 36
their academy offerings, instructor knowledge, and business partnerships. South’s principal is a
big champion for his school and has created new, positive relations among community and
business partners. For instance, he is expanding the Automotive and Construction Academy to
include masonry after discussions with the head of Lee County Builders Association.
There are four overarching academies that make up the career academies at South. These
academies include: Health & Safety, Technology, Automotive & Construction, and the newest
Hospitality & Tourism. Even though we are in the midst of a pandemic, Florida’s major industry
is tourism and so the school will adapt as the needs of tourism in Florida evolve. All of the
programs at South will have to adapt to the changing needs and safety of its students, staff, and
families. These academies will adopt career academy standards based on the National Standards
of Practice for Career Academies. This will help to align the instruction, learning, and support
needed to create success for students. The approach for career academies will be a smaller
learning community, career theme curriculum, and an advisory board of business and community
members. Students as freshmen will explore career academy options. Students enter a career
academy, officially in sophomore year and continue through senior year where they will
experience internships and industry certifications.
The Health and Safety Career Academy includes Allied Health Assisting, Electro Cardio
Graph Aid, Nursing Assistant, Introduction to Firefighting, Emergency Medical Responder,
Veterinary Assisting, and Agricultural Health Science. The proposed project will add Sports
Medicine or exercise science to support student interests and industry needs. An athletic trainer
will be paid with grant funds to instruct in exercise science and create hands-on learning
opportunities through high school athletic training and with a partnership with the Minnesota
Twins and their Spring Training complex which is located across from the high school.
PR/Award # S165A200036
Page e53

School District of Lee County 37
Additionally, if funded, this academy would like to further expand with the following: Certified
Electronic Health Record Specialist, Pharmacy, Health Unit Coordinator, and Vision Care. These
career opportunities will help support Florida’s retired and aging population.
The Technology Career Academy encompasses Applied Cybersecurity, 2-D Animation
Technology, 3 D Animation Technology, and Administrative Office Specialist. The Applied
Cybersecurity is a hands-on program that gives students real world security scenarios. Students
will learn to protect computers from hackers, secure wireless networks, protect computers from
malware and identify security threats. Students will also learn how to secure residential,
business computers, and fill the demand at public and private companies to address internet
security concerns in today’s world. Program content includes but is not limited to foundational
knowledge and skills in computer and network security, security vulnerabilities, attack
mechanisms and techniques, intrusion detection and prevention, cryptographic systems, system
hardening, risk identifications, incidence response, penetration testing, key management, access
control, and recovery. Specialized program areas focus on database security, planning and
analysis, software, and web security.
The Technology Career Academy encompasses 2-D & 3-D Animation Technology which
is a hands-on program where students will work on real world animation projects that will
prepare students for employment in advertising, cinema and other forms of entertainment.
Students create animation and visual effects and this can translate to everything from films and
video games to television, mobile devices and other forms of media using illustrations and
software programs. Students also create graphics and develop storyboards, drawings, and
illustrations.
PR/Award # S165A200036
Page e54

School District of Lee County 38
The Administrative Office Specialist program encompasses the skills necessary to handle
a business and office environment. The program prepares students with skills to perform as a
professional administrative office specialist which would include handling requests from
supervisors, understanding spread sheets and data bases, working with basic filing systems,
managing phones and greeting clients properly. Some courses that would be offered to enhance
their skills for this position in the workplace would be MS Word processing and business
English, Business Communication, Administrative Office Management, Records Management,
and Customer Relations. An internship will be required with a local business partner as part of
the certification.
The Automotive and Construction Academy is made up of Automotive, Electrical,
Plumbing, Painting, Welding, and plans to add Masonry for 2020. The Automotive and
Construction Academies will further build on growing their programs through use of the grant.
The Academies will provide students with more hands-on training. This training will be
provided by instructors, added materials to develop the skills needed in the students’ chosen
academy and updated tools and equipment. The skills of the trade and the knowledge provided
to students during their time in the Automotive and Construction Academies will provide them
with the real-world experience. The real-world experience will allow the students to be hired on
or begin their apprenticeship with our community partners. Partnering businesses and agencies
are provided in section (3) of Project Design.
Finally, the newest academy will be the Hospitality and Tourism Academy and will
include customer service, business and dining etiquette, business management, front desk, and
hospitality career exploration. The Hospitality and Tourism academy is designed to give students
real world experience while learning about careers in the hospitality industry. Students will learn
PR/Award # S165A200036
Page e55

School District of Lee County 39
the skills while building relationships with mentors in the hospitality industry leading to career
placement upon graduation. Teamwork and project-based curriculum will strengthen students’
interpersonal skills while developing their ability to work with others.
A final, but significant component of the magnet project at South will be BARR
(Building Assets, Reducing Risks). BARR is a strengths-based model that provides schools with
a comprehensive approach to meeting the academic, social, and emotional needs of all students.
Through the implementation of the BARR program and the Personal and Career Development
approach, South harnesses the power of relationships and data to become more equitable, ensure
that no student is invisible, and remove both academic and non-academic barriers to learning.
The BARR model leads to better academic performance and fewer course failures (Corsello &
Sharma, 2015).
The BARR Personal and Career Development course will provide opportunities for
career exploration and support for career academy students. By addressing soft skill gaps
between learning a career and implementing it, students will find a more successful transition
from high school to their chosen career. Freshman year career path students will be exposed to
the multiple academy and career options open to them. Through guest speakers, mentors, field
trips, simulation software, and a collaboration with the academies, the student will be provided
exposure to the variety of career path academies available to them. This deep dive will assist
students in determining which academy path is the right fit.
The BARR instructor as well as the entire instructional staff at South will continue to
support career path students throughout their high school years. Through partnerships with local
businesses, colleges, and universities, students will have mentoring and internship opportunities
in their Junior and Senior years. The Personal and Career Development course for sophomore –
PR/Award # S165A200036
Page e56

School District of Lee County 40
senior year will include: Career Development, Job Seeking Skills, Professionalism, Financial
Literacy, Business Communication, Written Communication, and Portfolio and resume creation.
(2) Professional training is of quality, intensity, and duration to lead to improvements; and
Each school developed their training plans to ensure quality, intensity, and duration in
order to work toward project goals and performance measures. In addition to each school’s
training plans, the school staffs will participate in book studies on diversity and race. Such books
will include: Courageous Conversations about Race (Singleton & Linton, 2006) and The Dream-
Keepers (Ladson-Billings, 2009). These book studies will help continue the important discussion
about racial disparities, inclusiveness, and creating anti-racist schools. The training plans below
reflect the thoughtful and detailed steps to ensure all classroom teachers are trained and that
training is reinforced from year to year. Training includes magnet theme professional
development as well as systemic reform training.
James Stephens Implementation and Training Plan
STEM Integration
Engineering is Elementary (EIE), or a similar establishment, will train teachers to use the
five-step engineering design process in the classroom and build knowledge of engineering. This
training will help teachers feel comfortable and confident in teaching these engineering concepts
through the use of hands-on experiences with Engineering is Elementary curriculum and
materials. First this training helps teachers gain foundational knowledge technology,
engineering and the engineering design process. Next, teachers will become comfortable with
how EIE units are structured and their pedagogical approach and finally they will experience a
PR/Award # S165A200036
Page e57

School District of Lee County 41
full EIE unit both as a learner and as an instructor. Once this initial training has been completed,
teachers will be equipped to start integrating the curriculum units into their classrooms.
James Stephens STEM integration professional development will mirror the following:
● Professional development training for the entire staff during preschool training days to
provide information and hands on experiences using the Engineering is Elementary
curriculum.
● In-class modeling by EIE professionals using the engineering design steps which support the
engineering challenges.
● Co-planning between an EIE facilitator and teams of classroom teachers to help them
understand the processes and knowledge that go into an EIE unit.
● Side-by-side instructional coaching to help teachers reflect on lesson implementation and the
impact of the learning experience on student success.
● Intermittent professional development training led by a team of teachers to share their
learning with colleagues and lead them into using the strategies in their own classrooms.
In order to ensure fidelity of STEM integration, the professional development provided to
teachers will be utilized within their science block and teachers will be expected to complete at
least one engineering challenge each quarter. Teams of teachers will meet to discuss the impact
these units have on student attitudes towards science, math, engineering and technology and their
achievement in all subject areas.
James Stephens has historically been a struggling school academically since its inception.
Part of the challenge with the student population is the mobility rate which sits at 56%. Teachers
do not get to see continuous improvement because their students typically move away out of
PR/Award # S165A200036
Page e58

School District of Lee County 42
county or state or transfer to other schools within the county. One way we plan to create
systemic change is by integrating the Reading Recovery program into our first-grade curriculum.
Reading Recovery is an early intervention program that is built to close gaps in reading and
writing for students in grade 1. “During this relatively short-term intervention, these children
make faster than average progress so that they can catch up with their peers and continue to work
on their own within an average group setting in the regular classroom.” (Askew, Fountas,
Lyons, Pinnell, Schmitt, 1998). Reading Recovery will allow the students at JSIA to close
foundational gaps so that they do not become at-risk readers.
Professional Development Timeline
Semester 1:
● Assess teachers’ knowledge and implementation of the engineering design process,
Engineering is Elementary curriculum and knowledge and impact of Reading Recovery
● Collect baseline demographic and student achievement data to measure the effectiveness
of program implementations.
● Create a professional development plan of action to include trainings, conferences,
workshops, coaching and follow-up for programs such as Engineering is Elementary,
Engineering Design Process and Reading Recovery.
● Select and form Engineering is Elementary, Engineering Design Process, and Reading
Recovery committees and site teams to implement, assess, evaluate, reflect, follow-up
and coach teachers once professional development begins.
● Explore training for Robotics, 3-D printing, Google Certifications and Simple Machines
for primary levels
PR/Award # S165A200036
Page e59

School District of Lee County 43
● Discuss a tiered approach for students to continue education in which their previous skills
would be applicable to the next level of learning. (Example: K-2 Simple Machines,
Grade 3: Introduction to Robotics, Grade 4: Intermediate Robotics, Grade 5: Advanced
Robotics)
● Host diversity and race book studies.
● Kagan strategies
Semester 2:
● Professional development for Reading Recovery for first grade teachers, primary reading
coach, and MTSS specialist.
● Additional Engineering is Elementary trainings for teachers to improve their EIE
practice.
Semester 3:
● Training, coaching, modeling and workshops with visits from professional development
facilitators for arts integration for continued support and monitoring will be ongoing
during this time.
● EIE and Reading Recovery training will continue with ongoing professional development
and support along with more in-depth training for new teachers.
● Site teams along with administration and Magnet Lead Teacher will begin to identify
teachers who have shown exemplary skills at utilizing techniques and instructional
strategies successfully from each of the professional development initiatives within their
classroom consistently. These teachers will be selected to become trainers and model
classrooms for each of the professional development programs, to establish ongoing
training within the school, as we build our sustainability model with specialized coaches.
PR/Award # S165A200036
Page e60

School District of Lee County 44
● Host diversity and race book studies.
● Kagan strategies
Semester 4:
● Targeted evaluations will be completed by Magnet Lead Teacher, administration and site
teams using rubrics created with and for each professional development program as all
initiatives will be up and running in full at this point. Once this is done, targeted plans
including professional development, coaching and follow-up will be put in place to
address areas needed for improvement.
● Training for the exemplary teachers selected to be trainers for each program will begin
during this time.
● Follow-up, monitoring, coaching, reflection and sharing of high impact techniques and
instructional strategies will continue via Google classroom set up for each professional
development training along with model classrooms, continued support and mini-
workshops.
Semesters 5-10:
● Engineering is Elementary and Reading Recovery trainings will continue with ongoing
professional development and support along with more in-depth training for new
teachers.
● Ongoing targeted evaluations will continue and be completed by magnet teacher leader,
administration, site teams and program coaches using rubrics created with and for each
professional development programs. Once this is done, targeted plans will continually be
made including professional development, coaching and follow-up put in place in order
to address areas needed for improvement. This will remain in place on a continuous basis
PR/Award # S165A200036
Page e61

School District of Lee County 45
to ensure initiatives are being followed through in every classroom throughout the school
on a consistent basis.
● Follow-up, monitoring, coaching, reflection and sharing of high impact techniques and
instructional strategies will continue via Google classroom set up for each professional
development training along with model classrooms, continued support and mini-
workshops. These will now be monitored by the exemplary teachers selected and trained
for each professional development initiative who will now act as program coaches.
● Host diversity and race book studies.
● Kagan strategies.
South Fort Myers High School’s Training Plan
Cambridge
Cambridge certified courses require that all teachers are trained in the rigors of the
Cambridge model within one year of a course being offered to students. During the first year of
grant implementation the Cambridge coordinator will identify teachers for core courses within
the Cambridge Program (General Paper, English, Social Studies and Science) that are required
for students to earn the Cambridge Diploma. Additionally, teachers will be targeted that will
complement aspects of South’s academy programs (computer science courses, business courses,
design courses etc.). The goal in year one is to send approximately 18 teachers (2 per core
subject area or complimentary supporting subject area) to the 2-day trainings (held throughout
the state of Florida in the spring semester and the summer) organized by the Cambridge
program. Since the identified teachers will already be experts in their areas of instruction, the
purpose of the training is to gain a crucial understanding of the Cambridge course and exam
PR/Award # S165A200036
Page e62

School District of Lee County 46
requirements as well as pedagogical strategies to maximize student success. Sending 2 teachers
per subject area will ensure that there are opportunities for horizontal alignment within subjects
as well as opportunities for long term vertical alignment throughout the entire Cambridge
program. This approach will also protect the Cambridge program from incidences of staff
turnover. Teachers attending the 2-day institutes will be expected to coordinate monthly
professional development for staff at the high school that will further align traditional high
school diploma instruction with the needs of the Cambridge program.
As the Cambridge program grows from year 2 through year 5 the Cambridge Coordinator
will continue to target courses of need to support the Cambridge Diploma requirements and to
align with the academy offerings of the school. The goal is to train an additional 18 teachers
each year as the school works to retrain/reinforce the Cambridge requirements in previously
trained teachers, expose new teachers to the Cambridge requirements and also send teachers of
supporting “Pre-Cambridge” courses to build vertical capacity within the school.
AVID
Summer Institute AVID training for teachers will better serve all students in their path of
becoming college or career ready. In order for the AVID system to support all of our students,
multiple faculty, especially those that will teach Cambridge and Academy courses will need
training. By attending Summer Institute, many of the faculty will acquire skills and supports that
will assist in their instruction and create a common and synchronous schoolwide approach
improving student outcomes. This training will be important in ensuring that the students of
South are supported in developing the key characteristics of college and career-readiness,
organizing time and materials, advancing college preparedness, building career knowledge, and
promoting financial literacy.
PR/Award # S165A200036
Page e63

School District of Lee County 47
The AVID coordinator along with other AVID trained instructors will develop and host
multiple professional development opportunities designed to help all faculty at South to better
serve students in their journey of becoming college and career ready. Professional Development
will consist of topics including but not limited to AVID strategies, Use of Google drive for
students, portfolio management, time management for students supporting AICE course work,
supporting academies, and career and college readiness.
Career Academies
In order to ensure career academy students have highly effective certified teachers in
their respective areas of expertise, all academy instructors will keep up to date on their individual
state certifications. In addition, academy instructors will participate in annual professional
development that will, in part, include implementing AVID strategies and utilizing effective
BARR practices in the classroom. Academy Teachers will work particularly close with the
BARR instructor as explained in the next section.
BARR and Career Academy Elective Supports
South will expand its BARR program school-wide to create a culture of learning and
career readiness. Teachers will be trained in the basics of BARR through a variety of
professional development experiences throughout the school year, attending BARR conferences
and site visits. Teachers will then model and utilize strategies for other teachers in the school,
making the BARR approach the culture of the school. BARR combined with AVID engagement
strategies in all academic subject areas will help boost student engagement and learning once
teachers are effectively trained. Teachers will then apply these strategies into their own
instruction. BARR will train all teachers on how to use the nine steps of BARR to increase
PR/Award # S165A200036
Page e64

School District of Lee County 48
student performance through employability, and social-emotional skill-building. BARR
contracted support will include:
● Professional development training for the entire staff 2 days prior to preschool training days
to provide detailed training and procedures to produce high impact success supports.
● Co-planning between Career Academy facilitators and employability elective teachers to
better reflect the needs of the industry within the classroom elective setting.
● Instructional and mentor coaching to help teachers reflect on lesson implementation and job-
specific affiliation of the learning experience on student success.
● Intermittent professional development training led by coordinators, teachers, or career
professionals to share their learning and strategies with colleagues to embed the culture of
support school-wide.
Throughout the professional development process, teachers will be trained on how to
measure success by looking at student engagement and achievement. Teachers will look to
answer the questions - How are students connected to the school? What are the strengths of each
student? Does every student have at least one pivotal adult in the building? Is every student
connected to the school via a career academy, Cambridge, AVID, Advanced Placement, club, or
sport?
Professional Development Timeline
Year 1 - Cambridge
Preschool professional development delivered by the Cambridge Site team would focus on
the introduction and support of new Cambridge courses throughout the school’s curriculum
and the long term needs of Cambridge Diploma students.
PR/Award # S165A200036
Page e65

School District of Lee County 49
Site team will request ongoing feedback from Cambridge trained teachers as to needs for
monthly professional development.
Monthly professional development will focus on writing for Cambridge success as well as
vertical and horizontal alignment across subject areas, integration of Academy programs and
the specific needs indicated from teacher feedback.
Cambridge site team will attend required training for exam ordering, security and delivery
procedures.
Site team will deliver specific professional development for testing procedures for
Cambridge teachers and exam proctors.
Cambridge site team will identify the second cohort of teachers to attend Cambridge training.
Approximately 18 newly targeted teachers will attend Cambridge training in specific subject
areas (January/February).
Site team will attend the national conference during the summer to support the continued
improvement of the Cambridge program and the associated professional development.
Year 1 -AVID
AVID Summer Institute (10 Teachers 1 Administrator) to learn AVID strategies and train
new elective teachers. When the school year begins these teachers will be members of the
school
AVID Site Team. During the pre-week, the site team will hold a professional development
session for the entire staff. This team will also determine and execute the goals for the
school-wide AVID plan. They are also responsible for sharing methods and strategies back to
their departments and help collect data/evidence for the Secondary Coaching and
Certification Instrument (CCI).
PR/Award # S165A200036
Page e66

School District of Lee County 50
Monthly AVID Site Team Meetings to include the AVID Site Team, AVID administrator,
and any other teachers outside the site team that would like to attend. The AVID Coordinator
will be responsible for the logistics and agenda. To gage and further implement AVID
strategies being used in each department. Team will also ensure the forward movement
towards the goals set in the yearly site team plan. Collection of data and evidence for the CCI
will also be addressed each meeting. There will be focus on the development and
maintenance of student portfolios. Vertical and horizontal planning to implement the site
team plan with fidelity as well as support Cambridge and other academic departments.
Monthly Professional Development - the members of the AVID site team will host one of the
monthly PD sessions every month of the school year. One of the sessions would be strategies
for organizing and better utilization of google drive and classroom. Other PD sessions would
be targeting WICOR strategies to assist with effective literacy and critical thinking strategies.
Year 1-BARR (Semester 1)
Obtain teachers and participating staff’s current level of knowledge about BARR strategies.
Survey faculty and instructors’ knowledge or use of employability skills to establish a
baseline for instructional practices.
Provide facilitated onboarding training to all instructional staff and participating support staff
prior to pre-school week. Training will include supportive research, background, current
practices, procedures, and/or implementation.
Monthly facilitated coaching from the BARR institute to the school coordinators to facilitate
increased fidelity, problem-solving, and professional growth.
Weekly in-house training will be provided to expand the knowledge base of participating
team members.
PR/Award # S165A200036
Page e67

School District of Lee County 51
Host diversity and race book studies.
BARR (Semester 2)
Create a professional development plan of action to include training, conferences,
workshops, and coaching in including increased professional writing in the classrooms and
BARR strategies.
Implementation, evaluations, on-going training will be supported by the use of Google Apps.
Obtain teachers and participating staff in their knowledge about BARR strategies. as well as
faculty and instructors’ knowledge or use of employability skills to provide a formative
evaluation regarding professional development success.
Weekly in-house training will be provided to expand the knowledge base of participating
team members.
Year 2 – Cambridge
Preschool professional development delivered by the Cambridge Site team would focus on
the introduction and support of new Cambridge courses throughout the school’s curriculum
and the long term needs of Cambridge Diploma students.
Site team will request ongoing feedback from Cambridge trained teachers as to needs for
monthly professional development.
Monthly professional development will focus on writing for Cambridge success as well as
vertical and horizontal alignment across subject areas, integration of Academy programs and
the specific needs indicated from teacher feedback.
Cambridge site team will attend required training for exam ordering, security and delivery
procedures.
PR/Award # S165A200036
Page e68

School District of Lee County 52
Site team will deliver specific professional development for testing procedures for
Cambridge teachers and exam proctors.
Cambridge site team will identify the second cohort of teachers to attend Cambridge training.
Approximately 18 newly targeted teachers will attend Cambridge training in specific subject
areas (January/February).
Site team will attend the national conference during the summer to support the continued
improvement of the Cambridge program and the associated professional development.
Year 2- AVID
AVID Summer Institute (10 Teachers 1 Administrator) to learn AVID strategies and train
new elective teachers. The goal is to send teachers that have not previously attended. This
expands the number of AVID trained teachers in the school furthering school-wide goals. As
for the site team, there will be retention of some of the previous year’s team to ensure
continuity. Responsibilities will be to develop and conduct a pre-week professional
development session for the entire staff, utilizing past year data and information learned at
the AVID SI to determine the appropriate direction and content for the pre-week professional
development sessions. Produce and execute an AVID school-wide site team plan with
specific and measurable goals, with the overall goal of expanding the number of students in
the AVID program and use of AVID strategies/methods to all classrooms.
Monthly AVID Site Team Meetings to include the AVID Site Team, AVID administrator,
and any other teachers outside the site time that would like to attend. The AVID Coordinator
will be responsible for the logistics and agenda. To gage and further implement AVID
strategies being used in each department. The team will also ensure the forward movement
towards the goals set in the yearly site team plan. The collection of data and evidence for the
PR/Award # S165A200036
Page e69

School District of Lee County 53
CCI will also be addressed in each meeting. There will be focus on the development and
maintenance of student portfolios. Input from the Cambridge and BARR teams will be
solicited and used to ensure that AVID continuously supports both programs. Vertical and
horizontal planning to implement the site team plan with fidelity as well as support
Cambridge and other academic departments.
Monthly Professional Development - the members of the AVID site team will host one of the
monthly PD sessions every month of the school year. One of the sessions would be strategies
for organizing and better utilization of google drive and classroom. Other PD sessions would
be targeting WICOR strategies to assist with effective literacy and critical thinking strategies.
Content will also include information on development and maintenance of student portfolios.
Collaboration with the Cambridge and BARR teams to support their goals. To be achieved
either through assisting with their PD and/or AVID PD sessions.
Year 2 - BARR
Provide facilitated training to all instructional staff and participating support staff prior to the
pre-school week. Training will include data review of lasts years outcomes, in-depth training
on supportive research, background,
The second round of BARR team members, coordinators, and administrators will continue
training via yearly conference.
Weekly in-house training will be provided to expand the knowledge base of participating
team members.
End of year survey of faculty and instructors’ knowledge or use of employability skills to
establish a baseline for instructional practices.
PR/Award # S165A200036
Page e70

School District of Lee County 54
Portfolio and/or Resume training will be provided to teacher leaders, coordinators, AVID,
and Professional and Career Development elective teachers.
Host diversity and race book studies.
Year 3 – Cambridge
Preschool professional development delivered by the Cambridge Site team would focus on
the ongoing support of Cambridge courses across the school.
Site team will encourage newly trained teachers to take on additional responsibilities to
model classroom instruction and provide professional development in order to build
leadership capacity within the program.
Site team will request ongoing feedback from Cambridge trained teachers as to needs for
monthly professional development.
Monthly professional development will focus on vertical and horizontal alignment across
subject areas, integration of Academy programs and the specific needs indicated from teacher
feedback.
Site team will deliver specific professional development for testing procedures for
Cambridge teachers and exam proctors.
Cambridge site team will identify the third cohort of teachers to attend Cambridge training.
Approximately 18 newly targeted teachers will attend Cambridge training in specific subject
areas (January/February).
Site team will attend the national conference during the summer to support the continued
improvement of the Cambridge program and the associated professional development.
Year 3 - AVID
AVID Summer Institute
PR/Award # S165A200036
Page e71

School District of Lee County 55
Build on number of teachers that are AVID trained
Conduct pre-week PD sessions for the entire school utilizing AVID strategies learned at SI,
data from the previous year and needs of Cambridge and BARR programs. Determine
members of the site team
Develop the AVID Site Team Plan
Continual expansion of the AVID program
Monthly AVID Site Team Meetings
To ensure the execution of the site team plan
To continue the dissemination and utilization of AVID strategies in all departments
To collect evidence and data for CCI
To support the development and maintenance of student portfolios
To provide continual support of the Cambridge and BARR programs
Vertical and horizontal planning to implement the site team plan with fidelity as well as
support Cambridge and other academic departments.
Monthly Professional Development
To provide useful monthly PD to staff on AVID WICOR strategies, critical thinking, inquiry,
digital organization and effective use of google classroom and drive
Resources for new teachers
To support the development and maintenance of student portfolios
Continual support of the Cambridge and BAR programs
Year 3 – BARR
PR/Award # S165A200036
Page e72

School District of Lee County 56
Provide training to instructional staff and participating support staff prior to the pre-school
week in BARR practices. Training will include data review of lasts years outcomes, in-depth
training on supportive research, background,
Some BARR team members, coordinators, and administrators will continue training via
yearly conferences and coaching visits
End of year survey of faculty and instructors’ knowledge or use of employability skills to
establish a baseline for instructional practices.
Portfolio and/or Resume training will be provided to teacher leaders, AVID, and Professional
and Career Development elective teachers.
Host diversity and race book studies.
Year 4 – Cambridge
Preschool professional development delivered by the Cambridge Site team would focus on
the ongoing support of Cambridge courses across the school.
Site team will encourage newly trained teachers to take on additional responsibilities to
model classroom instruction and provide professional development in order to build
leadership capacity within the program.
Site team will request ongoing feedback from Cambridge trained teachers as to needs for
monthly professional development.
Monthly professional development will focus on writing for Cambridge success as well as
vertical and horizontal alignment across subject areas, integration of Academy programs and
the specific needs indicated from teacher feedback.
Site team will deliver specific professional development for testing procedures for
Cambridge teachers and exam proctors.
PR/Award # S165A200036
Page e73

School District of Lee County 57
Cambridge site team will identify the third cohort of teachers to attend Cambridge training.
Approximately 18 newly targeted teachers will attend Cambridge training in specific subject
areas (January/February).
Site team will attend the national conference during the summer to support the continued
improvement of the Cambridge program and the associated professional development.
Year 4 – AVID
AVID Summer Institute
Build on number of teachers that are AVID trained
Conduct pre-week PD sessions for the entire school utilizing AVID strategies learned at SI,
data from the previous year and needs of Cambridge and BARR programs.
Determine members of the site team
Develop the AVID Site Team Plan
Continual expansion of the AVID program
Monthly AVID Site Team Meetings
To ensure the execution of the site team plan
To continue the dissemination and utilization of AVID strategies in all departments
To collect evidence and data for CCI
To support the development and maintenance of student portfolios
To provide continual support of the Cambridge and BARR programs
Vertical and horizontal planning to implement the site team plan with fidelity as well as
support Cambridge and other academic departments.
Monthly Professional Development
PR/Award # S165A200036
Page e74

School District of Lee County 58
To provide useful monthly PD to staff on AVID WICOR strategies, critical thinking, inquiry,
digital organization and effective use of google classroom and drive
Resources for new teachers
To support the development and maintenance of student portfolios
Continual support of the Cambridge and BARR programs
Year 4 - BARR
Provide training to instructional staff and participating support staff prior to the pre-school
week in BARR practices. Training will include data review of lasts years outcomes, in-depth
training on supportive research, background,
Some BARR team members, coordinators, and administrators will continue training via
yearly conferences and coaching visits
End of year survey of faculty and instructors’ knowledge or use of employability skills to
establish a baseline for instructional practices.
Portfolio and/or Resume training will be provided to teacher leaders, AVID, and Professional
and Career Development elective teachers.
Host diversity and race book studies.
Year 5 – Cambridge
Preschool professional development delivered by the Cambridge Site team would focus on
the ongoing support of Cambridge courses across the school.
Site team will encourage newly trained teachers to take on additional responsibilities to
model classroom instruction and provide professional development in order to build
leadership capacity within the program.
PR/Award # S165A200036
Page e75

School District of Lee County 59
Site team will request ongoing feedback from Cambridge trained teachers as to needs for
monthly professional development.
Monthly professional development will focus on writing for Cambridge success as well as
vertical and horizontal alignment across subject areas, integration of Academy programs and
the specific needs indicated from teacher feedback.
Site team will deliver specific professional development for testing procedures for
Cambridge teachers and exam proctors.
Cambridge site team will identify the third cohort of teachers to attend Cambridge training.
Approximately 18 newly targeted teachers will attend Cambridge training in specific subject
areas (January/February).
Site team will attend the national conference during the summer to support the continued
improvement of the Cambridge program and the associated professional development.
Year 5 – AVID
AVID Summer Institute
Build on number of teachers that are AVID trained
Conduct pre-week PD sessions for the entire school utilizing AVID strategies learned at SI,
data from the previous year and needs of Cambridge and BARR programs.
Determine members of the site team
Develop the AVID Site Team Plan
Continual expansion of the AVID program
Monthly AVID Site Team Meetings
To ensure the execution of the site team plan
To continue the dissemination and utilization of AVID strategies in all departments
PR/Award # S165A200036
Page e76

School District of Lee County 60
To collect evidence and data for CCI
To support the development and maintenance of student portfolios
To provide continual support of the Cambridge and BARR programs
Vertical and horizontal planning to implement the site team plan with fidelity as well as
support Cambridge and other academic departments.
Monthly Professional Development
To provide useful monthly PD to staff on AVID WICOR strategies, critical thinking, inquiry,
digital organization and effective use of google classroom and drive
Resources for new teachers
To support the development and maintenance of student portfolios
Continual support of the Cambridge and BARR programs
Year – 5 BARR
Provide training to instructional staff and participating support staff prior to the pre-school
week in BARR practices. Training will include data review of lasts years outcomes, in-depth
training on supportive research, background,
Some BARR team members, coordinators, and administrators will continue training via
yearly conferences and coaching visits
End of year survey of faculty and instructors’ knowledge or use of employability skills to
establish a baseline for instructional practices.
Portfolio and/or Resume training will be provided to teacher leaders, AVID, and Professional
and Career Development elective teachers.
Host diversity and race book studies.
PR/Award # S165A200036
Page e77

School District of Lee County 61
(3) Collaboration of appropriate partners for maximizing effectiveness of project services.
Collaborative partnerships are a significant part of this proposed project, much like what
is currently in place with the magnet middle schools. Lee understands the enormous value in
collaborative partnerships and works diligently to nurture existing ones and forge new ones. Both
schools are drawing upon their existing partnerships and reach out to new entities to expand and
collaborate. Additionally, we are adding the position of Family-Community Engagement
Specialist to help build new partnerships and nurture existing ones. Current and new partnerships
are reflected in the numerous letters of support that are in the Appendix.
The I-DARE, Phase II project has received support from our U.S. Congressman, Francis
Rooney, who also lent support to our current Magnet project and visited with magnet staff from
our schools in his D.C. office. Our Fort Myers Mayor, Randall Henderson provided a letter of
support because he knows the value of diverse schools with enriching programs. A letter of
support from the president of the Teachers Association of Lee County is included to illustrate the
value our teachers place on diversity and student success. Also included are letters from the
president of the Foundation for Lee County Public Schools and the president of the Southwest
Florida Community Foundation. Both foundations are well-established and have provided
millions of dollars over the decades to support education in Lee County through meeting student
basic needs, providing funding for special programs, assisting with internships, job placement,
and through scholarships that support all students, but especially to minority students and
students with greater financial need.
James Stephens has established partnerships with Blessings in a Backpack, Bobby
Nichols Charity Foundation, City First Church, and the Dr. Piper Center. These organizations
provide needed items for students such as school supplies, school uniforms, shoes, and
PR/Award # S165A200036
Page e78

School District of Lee County 62
supplemental food. They also provide mentoring and reading support to students. James
Stephens is developing a partnership with Florida Gulf Coast University and its K-20 STEM
education program. Additionally, James Stephens is nurturing a partnership with the IMAG
History and Science Center in Fort Myers to provide STEM professional development for
teachers and extended learning for students through classroom visits and hosting camps.
Tri-County Apprenticeship Academy, B&I Construction, Preferred Concrete, United
Mechanical, Lee County Builders Association (Letter of Support in Appendix) and Crowther
Roofing are all community partners that will provide meaningful internships and possible
employment to students at South Fort Myers High. The College of Engineering at Florida Gulf
Coast University (letter of support in Appendix) will share their expertise with teachers and
students as they learn the engineering concepts of building and construction. With the help of
community partners, instructors will set-up internships, field trips, classroom speakers and job
fairs for the Automotive and Construction Academy students. Business leaders and mentors will
help students to understand the different roles in running a business and give students a peak into
management and its requirements.
In the Health & Safety Academy, South will continue to nurture existing community
relationships. This is important to the sustainability of the programs. The community partners
offer many opportunities for the students: site visits for observations, job opportunities,
internships, guest speakers and even donating to the programs. Students are required to have a
certain number of hours of internships prior to taking certification exams. Through existing
community partnerships South students are offered these opportunities. Lee Health Systems, Lee
Health Skilled Nursing Facility have partnered with South to offer clinicals for students in the
medical academy. Gulf Coast Humane Society, Specialist in Veterinary Medicine, Animal Care
PR/Award # S165A200036
Page e79

School District of Lee County 63
Technologies, San Carlos Park Animal Hospital, Animal Hospital of Bonita and Boarding, and
many others are all partners with the Health & Safety Academy. G & G Cattle donates cattle
stock and provides complimentary cattle care and artificial insemination clinics for students.
Sweet Cypress Ranch sponsors the school chicken project by donating baby chickens two times
per year and feed for every month. Everglades Farm Equipment gives the school a large discount
on equipment maintenance and offers two paid internships per year.
The Technology Career Academy at South is looking to the partnership success that the
other academies have already developed and will work closely with the Family-Community
Engagement specialist to help them build their partnerships. Some potential partnerships include
Priority Marketing and ConRic PR and Marketing, d3 Creative Studio, 1Pro Media, and the
Greater Fort Myers Chamber of Commerce. The students would benefit from guest speakers,
studio tours, and internships.
The new Hospitality and Tourism Academy will benefit from a relationship with the
Visitors Convention Bureau, the Greater Fort Myers Chamber of Commerce and numerous
hotels, restaurants, and resorts in Lee County. Students will learn all aspects of hospitality from
etiquette to customer service. They will experience roles such as front desk staff and manager.
South is building on its existing partnership with the Minnesota Twins (Letter of Support in
Appendix) to provide hospitality experiences for the academy students. The spring training
complex for the Twins is located across from the high school making it an ideal location for
student interning. Students in the Health and Safety Academy will also have opportunities to job
shadow or intern with the Twins in relation to sports medicine and emergency medical staff who
are present at events.
PR/Award # S165A200036
Page e80

School District of Lee County 64
(4) Quality of conceptual framework.
District magnet support and each proposed magnet school have worked together to
develop the proposed project and the work is framed by three logic models representing the
district and each school. The logic models (in Appendix) represent a road map for the project
work and include project resources, activities, outputs, short-, medium-, and long-term outcomes.
The logic models reflect the project’s theory of action. The theory of action is:
If all teachers, in each school, receive 50 hours of high quality professional development
each year focused on improvement of core subject curricula and instruction, reading
comprehension for low performing students and development of a magnet theme and its
integration into those curricula, then teachers will develop and implement quality magnet
curriculum and instruction (a special curriculum capable of attracting substantial numbers of
students of different racial and socioeconomic backgrounds);
If quality magnet curriculum and instruction is taught to students and becomes the core of the
school’s instructional program, and that is widely known by students and families, then a
large, diverse group of students will apply to a magnet school and minority group and
socioeconomic isolation will be reduced; and
If a magnet school’s students are exposed to quality magnet curriculum and instruction for 10
hours per week (project year 5 performance measure target) and parents are partners with
schools in helping their students;
Then they will attain higher levels of achievement than carefully matched students who do
not attend a magnet school.
PR/Award # S165A200036
Page e81

School District of Lee County 65
(c) Quality of Management Plan
(1) Adequacy of management plan to achieve objectives on time and within budget; and
The logic model is the framework for the project. Project objectives support five project
activities. The project objectives include:
1. Minority group and socioeconomic isolation will be reduced at the proposed magnet
schools;
2. All students will receive high quality instruction that includes their school's systemic
reforms and magnet themes in units and courses aligned with Florida Standards;
3. All students, at each magnet school, will receive magnet theme instruction;
4. a) Student academic achievement will increase each year in English/Language Arts,
mathematics, and science for all students; b) The percentage of students from major
ethnic and racial subgroups attaining level 3 or 4 on the state assessments will increase;
5. Staff will receive professional development related to improvement of curriculum,
instruction and magnet theme development and implementation;
6. a) All students will have equitable access to high quality education; and b) There will be
an increase in parent participation at each magnet school.
The five major activities are 1) desegregation associated with marketing and student recruitment
supporting objective 1; 2) improvement of curriculum and instruction and student academic and
3) magnet theme integration supports objectives 2, 3, 4 and 6; 4) professional development
supports objective 5; and 5) parent involvement supports objective 7. The following table
presents the objectives, major annual activities, persons responsible, timelines, and milestones
for accomplishing tasks.
PR/Award # S165A200036
Page e82

School District of Lee County 66
School magnet principals report to executive directors for school support who then report
to the school superintendent. The project director will work closely with each school’s principal
and magnet teams to achieve the objectives of the magnet project, outlined above, on time and
within budget. The project director will manage all aspects of the I-DARE II project and
supervise all magnet district-level staff: a full-time grant specialist and full-time family-
community engagement specialist and will work closely with each school’s principal in the
supervision of the full-time magnet lead teachers who will guide the implementation of curricula
related to the magnet theme at each of the three magnet schools. (Please see section (d) Quality
of Personnel for a description of the roles, responsibilities and qualifications of the project
director, grant specialist, family-community engagement specialist, magnet lead teachers, other
key magnet teachers, executive directors for school support and magnet school principals).
Table: Management Plan Timeline
Annual Project Management Plan (October 1 – September 30)
Obj(s) Activities Milestones Person(s)
Responsible
Timeline
1-7 Hire (Years 2-5 renew or
replace) project personnel for
district and schools
Project personnel
in place
Project Director,
Magnet
Principals
Oct - Nov
1-7 Establish and maintain Magnet
advisory board
Monthly first
year then
Quarterly
minutes
Project Director,
Engagement Sp,
School teams (5-
Principal, lead
teacher, other
Nov,
monthly,
then
quarterly
PR/Award # S165A200036
Page e83

School District of Lee County 67
staff, parent, and
partner)
1 Develop marketing/public
information campaign plans,
Plans approved
by Equity and
Diversity
Committee
Project director,
magnet
principals,
magnet lead
teachers
Dec Yr 1,
Sept Yrs 2-
5
1-7 Ordering annual specified
supplies and equipment
Documented
orders and
receipts, items
inventoried
Grant specialist,
magnet lead
teachers
July -
April
1 Implement marketing/public
information campaign
Events,
brochures, signs,
social media,
open houses
Project director,
Engagement
specialist,
magnet
principals
Oct - Jan
1 Application period Application
numbers for
magnets
Student
Assignment
Jan - Mar
2, 3,
4, 6
Magnet unit development /
magnet class development
Units
documented,
lessons
Magnet lead
teachers, teacher
leaders
April -
Aug
PR/Award # S165A200036
Page e84

School District of Lee County 68
2, 3,
4, 6
Magnet units and magnet class
implementation
Lessons
observed,
documented
Teachers Aug - May
4, 6 Magnet theme-based learning Student
portfolios
Students Aug - May
5 Professional development
related to the improvement of
curriculum and instruction
(PLCs, workshops, institutes,
courses, coaching, mentoring)
PD records,
improved
instruction
documented
PD partners,
partner schools,
Teachers
Year round
5 Professional development
related to the magnet theme
(PLCs, workshops, institutes,
courses, coaching, mentoring)
PD records,
improved
instruction
documented
PD partners,
partner schools,
Teachers
Year round
7 Development of parent
involvement plan
Plan documents,
calendar of
events
Family-
community
engagement
specialist,
Magnet school
teams
July
7 Implementation of parent
involvement plan
Parent logs,
parent survey
results
Family-
community
engagement
Aug - May
PR/Award # S165A200036
Page e85

School District of Lee County 69
specialist,
Magnet school
teams
1-7 Evaluation planning and
implementation
Site visits,
Formative and
summative
reports
Project director,
Grant specialist,
Evaluator
Dec and
April Yr 1,
3 times
Yrs 2-5
1-7 MSAP required reporting Submitted timely
reports
Project Director,
grant specialist
As
required
1-7 MSAP and MSA conferences Attendance and
reports
Project Director,
Magnet school
teams
As
scheduled
(2) Ensure diversity of perspectives are brought to bear in operation of project, including
parents, teachers, business community, professional fields, recipients or beneficiaries.
In order to ensure that a diversity of perspectives is brought to bear throughout the
project, the project director, director of equity and inclusion, school principals and school
leadership teams will form a committee to establish a Magnet Advisory Board for the project.
The board will consist of representative parents, students, and teachers from the two magnet
schools and community partners. The board will meet monthly in Year 1 and quarterly in Years
2-5 and will review progress the schools are making towards meeting project objectives,
including reviewing summaries of formative evaluations provided by the evaluator and the
project director. The members will provide input to the project director on the operation of the
PR/Award # S165A200036
Page e86

School District of Lee County 70
project, including suggestions for project improvement, where necessary. The membership of the
Magnet Advisory Board will be established each project year to ensure that the board continues
to reflect a diversity of perspectives. Additionally, the board will garner input from Lee’s Equity
and Diversity Advisory Committee (explained in the next section).
The School Advisory Council (SAC) in each school will assume a major role in the
project, and provide local oversight to address the development and needs of their respective
magnet programs. The implementation of the magnet project will be included in each school’s
improvement plan. The SAC is established by Florida Statute and given authority over each
school’s plan. The SAC meets on a monthly basis to review, approve, guide, and advise on
activities for the school. By Florida statute, a SAC is comprised of parents, community members,
business partners, teachers, students, and administrators, and each school's SAC is required by
statute to reflect that school's racial/ethnic representation.
The school leadership teams (teachers, administrators, parents, students and community
partners) will ensure that parents are key players and well informed in relation to the magnet
project. The family-community engagement specialist will work with school leadership teams to
inform and receive information from families through newsletters, websites, e- mails, opinion
polls and surveys, and telephone contacts. Parents will be needed to attend workshops with their
children and to assist and participate in school events. Parents will attend meetings and events to
learn about and provide feedback on the magnet theme in their child's school, the school
advisory council, the school's progress toward improvement and meeting MSAP objectives,
strategies for supporting student academic performance at home, and other planned magnet
parent events. Parents will actively help to build a positive image for the schools to attract other
families to send their children to the magnet schools by choice.
PR/Award # S165A200036
Page e87

School District of Lee County 71
(3) Resources beyond grant, multi-year model and plan, partners, broad support
James Stephens and South Fort Myers High School would not be able to implement the
extensive magnet programs at their schools without federal magnet funds. Once grant funding
ends the schools will not be able to fund and support at the same level that would be funded by
the grant, but each school will take a comprehensive, step-by-step approach to sustain the critical
aspects of each program. This will be done through critical program identification and with
funding from partnership contributions, district support, federal grants, and other grant funds.
The Teachers Association of Lee County has provided a letter for evidence of broad support
(Included in Appendix).
Critical program identification requires answers to the following questions: What are the
key components in our magnet programs? How are we going to continue to support these key
components? What would optimal implementation of these key components look like? And what
is needed to support them with funding and in-kind support? What would adequate levels of
support of each key component look like? What would minimal levels of support of each key
component look like? These important questions will help identify each area critical to
maintaining a high performing magnet program and will identify the level to which each critical
area can be supported (optimal, adequate, minimal).
These questions are best answered once implementation of the proposed project begins.
This application provides detailed plans, but until these plans are implemented is it difficult to
know the critical elements (the multi-year financial and operating model and accompanying
plan) needed to sustain each of these magnet programs. That is why the proposed project calls
for a Magnet Advisory Board that will oversee and guide the project throughout the five years
and will lead the sustainability plan once magnet funding ends. This Board approach is utilized
PR/Award # S165A200036
Page e88

School District of Lee County 72
in the current magnet grant and the schools are working through their action plans related to
responses to the above critical questions.
The resources that are available to the magnet schools include partnership contributions,
district and school resources, federal grants (Titles I, II, III, IV, Perkins), and other grant funds.
The principals with district support are committed to continuing to fund positions and/or acquire
them into evolving roles in order to maintain magnet programming. For instance, the Cambridge
teacher position funded from the grant would instruct Cambridge students and they would sit for
more Cambridge exams and increase their passing rate thereby increasing the amount of money
the school would earn from the State of Florida (.16 for Cambridge test passed + 1 FTE X
$ per pupil allocation = $ There is additional funding for Career Academy
certifications earned similar to Cambridge tests passed. Additionally, as the internships grow at
South, business partners will see the money savings by investing in a well-trained workforce that
will then take on employee roles in local businesses.
James Stephens will look to the success of other schools, like a K-8 arts school within the
county that has built their own foundation to support their arts enrichment. The Magnet Advisory
Board will consider a foundation or strengthening their PTO to create a greater fund-raising
effort. These considerations will be part of the critical program identification and resource needs
to address sustainable magnet programming.
(d) Quality of Personnel
(1) Qualifications of personnel-(a) The project director is qualified to manage the project;
The project director is highly qualified to manage the project. Dr. Terri Kinsey manages
the current magnet grant that was awarded in 2017. She has demonstrated success in managing
PR/Award # S165A200036
Page e89

School District of Lee County 73
the magnet project by regularly monitoring project objectives through use of an action plan
spreadsheet with incremental tasks/activities, timelines, and benchmarks. She regularly monitors
the budget to ensure funds are spent on time, within budget, and align to project objectives. She
completes all reporting on time, within budget and is compliant. Weekly, she meets with magnet
lead teachers regarding action plans and funding that support objectives. Adjustments are made
as needed to ensure forward movement towards performance measures.
The project director’s prior experience and education also qualify her to manage the
project. She has previously held positions as a magnet teacher, assistant principal, district grant
coordinator among other positions. Her doctoral dissertation addressed diversity and how its
importance developed in positive student-teacher relationships. During the first two years of the
proposed project, the project director will divide her time 50% on the proposed project and 50%
on the current magnet project (Resume in Appendix). This is reflected in the proposed budget.
The job description used for the project director is that of assistant director of magnet schools
(job description in Appendix). Dr. Kinsey reports to Ms. Teri Cannady the Director of Grants
and Program Development.
(b) Other key personnel are qualified to manage the project; and
Ms. Teri Cannady is the Director of Grants and Program Development ( )
and oversees the current project director as well as serving on the current Magnet Advisory
Board. She is an accomplished former principal who opened a new school with an attractor
program and oversaw its success for 13 years before accepting her current position. Ms. Cannady
is a model, accomplished principal who serves as a principal-lead mentoring newer principals,
including principals of two magnet schools. Her primary role in the grant is to serve on the
Magnet Advisory Board and be the liaison between the Chief Academic Services Officer, School
PR/Award # S165A200036
Page e90

School District of Lee County 74
Superintendent and the Magnet Advisory Board. She will guide and support the project director
in meeting project objectives.
The Magnet Advisory Board will be made up of the project director, Dr. Terri Kinsey,
Teri Cannady (grants director), the magnet family-community engagement specialist, Kelly
Stedman and Ed Mathews (magnet school principals), and their school magnet teams - magnet
lead teacher, other magnet school staff member, parent representative, student, and community
partner. The board will meet monthly in Year 1 and quarterly in Years 2-5 to monitor progress
toward project goals and make mid-course changes as needed. The board will share updates with
the Equity and Diversity Advisory Committee (EDAC) as needed.
Equity and Diversity Advisory Committee (EDAC) The School Board Chair shall
select three members and each of the other six School Board Members shall select two members
to be appointed by the Board. Each Board Member will make reasonable efforts to ensure that at
least one of his/her appointees resides in that Member's residence area, at least one is a minority
and that appointees have knowledge and skills pertinent to the committee. The Superintendent
designated Jarrett Eady, Director of Diversity and Inclusion as the staff liaison. The mission of
the committee shall be to monitor the District’s maintenance of a unitary school system and
adherence to School Board Policies concerning equity and diversity. The committee shall review
and provide input concerning revisions to the student assignment plan and any proposal to
acquire a school site, construct or abandon a school facility.
Magnet Schools’ Principals ( ) Kelly Stedman is the principal of James
Stephens Elementary. She has worked as an administrator at the school for four years, serving as
principal since 2018. In 2017, Ms. Stedman was named Assistant Principal of the Year for the
entire State of Florida. She is an exemplary administrator who is committed to engaging and
PR/Award # S165A200036
Page e91

School District of Lee County 75
developing students, especially to students who are marginalized or come from families who are
marginalized in our society. She has been instrumental in moving her school grade from an “F”
to a “B” rating by the Florida Department of Education. Prior to James Stephens, she was an
administrator at an academy for the arts, K-8 school where she supported and promoted the arts
as a choice option for families in the community. Ms. Stedman is committed to the magnet
project and its sustainability.
Edward Mathews is the principal of South Fort Myers High School. He has served as
principal of South for four years. During those fours years he has been honored with multiple
leadership awards, including the most recent, 2020 Principal of the Year award from the
Teachers Association of Lee County. Before becoming principal he worked as an administrator
at three other area high schools (including an International Baccalaureate program) and one
middle school. Mr. Mathews’ varied experience has contributed to his success at South. He is the
proudest cheerleader at South and thrives on seeing his students grow and experience success.
He is supportive and respectful to his staff and his staff in turn chose to honor him with the
Teachers Association award. Mr. Mathews is enthusiastically committed to the magnet project
and its future beyond the grant period.
Grant Specialist (100% FTE, ) - Lee will adhere to hiring regulations as
set forth by the school district and the state of Florida and in compliance with the law. The grant
specialist job description is provided in the Appendix. The grant specialist reports to the project
director. The grant specialist’s primary function is to ensure effective and appropriate
implementation of a major grant program by assisting the project director with duties related to
grant accountability, application, auditing, communications, compliance, forecasting,
management, needs assessment, reporting, and tracking requirements.
PR/Award # S165A200036
Page e92

School District of Lee County 76
Family-community engagement specialist (100% FTE, ) - Lee will
adhere to hiring regulations. This position will be partially funded in years 1 and 2, dividing time
between the current and proposed magnet grant and fully funded in years 3-5. The family-
community engagement specialist will require a high school diploma or greater, experience
working in schools, experience in working with students and families from different racial and
ethnic backgrounds, experience in prioritizing and coordinating school-based and community-
based outreach and recruitment activities; experience in creating multi-media materials and
documents using technology; familiarity with use of presentation tools and media; and ability to
be creative, flexible and project-oriented in a large, grant-funded initiative serving multiple
schools (job description in Appendix).
The family-community engagement specialist will: (1) work collaboratively with the
project director and with each district’s parent advocates and each school’s parent coordinator
and school based teams, be responsible for planning, coordinating and implementing a
comprehensive magnet outreach program utilizing technology and multi- media resources; (2)
help to develop magnet materials, products and technology tools, such as websites, flyers,
brochures, banners, advertisements, and databases; (3) provide information to parents,
community members, and community agencies on the schools’ magnet programs; (4) attend
citywide parent meetings; (5) participate in annual School Fairs and other recruitment activities
and coordinate the presentations of the magnet schools; (6) help develop a plan for recruitment
and advertisement, in conjunction with each of the magnet school recruitment teams; and (7)
work cooperatively on a regular basis with parent groups and the schools’ School Leadership
Teams.
PR/Award # S165A200036
Page e93

School District of Lee County 77
Project Evaluator - American Educations Solutions (AES) will be the
external evaluator for this project, in collaboration with the National Center for Research on
Evaluation, Standards, and Student Testing (CRESST) at UCLA. Since 1995, AES has evaluated
61 Magnet Schools Assistance Program grants. The AES team includes highly experienced
magnet practitioners and university partners. AES practitioner teams include site visitors who
have many years of experience as teachers and as magnet school principals, as well as
administrators of magnet projects and other equity programs. For the past ten years AES has
partnered with CRESST on rigorous evaluations and on survey development and analysis for
Magnet Schools Assistance Program projects. For the 2010-2013 cycle AES partnered with
CRESST on 5 rigorous MSAP evaluations. For the 2013-2016 cycle, AES partnered with
CRESST on another 5 rigorous MSAP evaluations. And for the 2016 – 2019 cycle, AES and
CRESST worked together on another 3 rigorous MSAP evaluations. AES and CRESST currently
partner with Lee on their 2017 – 2022 MSAP rigorous evaluation. Prior to 2010, AES worked
with Education Alliance at Brown University and the SERVE Center at the University of North
Carolina on 10 rigorous MSAP evaluations. CRESST will perform the quasi-experimental
design study, as well as survey design, analysis and reporting described in the evaluation section
of this proposal. CRESST has done hundreds of high-quality education studies. The Principal
Investigator (PI), Dr. Jia Wang, has performed high quality research for many years. (Please see
the description of CRESST and the researchers in the appendix.) The duties and responsibilities
of the evaluators are described in this proposal's evaluation section.
PR/Award # S165A200036
Page e94

School District of Lee County 78
(c) Qualified teachers in magnet schools to implement special magnet curriculum.
Magnet Lead Teachers MLT) (100% FTE, ) - Lee will adhere to hiring
regulations as set forth by the school district and the state of Florida and in compliance with the
law. Each school will add a Magnet Lead Teacher. Magnet Lead Teachers will be highly
effective teachers with at least four years’ teaching experience as well as experience teaching in
a specialized program. Additionally, MLTs will need clinical educator training and project
management experience in order to lead magnet implementation and coach other teachers within
the school. MLTs will work closely with the school principal and project director and serve on
the Magnet Advisory Board. MLTs will attend magnet conference and trainings related to their
magnet themes. They will help develop marketing, communication, training, and implementation
plans related to magnet. MLTs will help promote their school and magnet program by attending
community and school-based events and sharing information. MLTs will help monitor progress
toward project goals at their school sites. MLTs will work with the magnet grant specialist to
insure budgeted items are ordered timely, received, inventoried and utilized to support project
objectives. The job description for the Magnet Lead Teacher is the Learning and Leadership
Teacher job description approved by Lee (job description in Appendix).
Other Magnet-theme Teachers (100% FTE, ) Lee will adhere to hiring
regulations as set forth by the school district and the state of Florida and in compliance with the
law. James Stephens will add a STEM teacher who will help develop STEM curriculum and
provide STEM instruction to students. The STEM teacher will work closely with the MLT to
align work to project goals and support action plans related to the project.
South is a large high school and the population will expand to 2,000+ students. In order
to fully implement the magnet throughout the school, South plans to add four positions paid from
PR/Award # S165A200036
Page e95

School District of Lee County 79
the magnet grant in addition to the MLT. South will add a Hospitality and Tourism teacher
because this is a new academy that they intend to grow. South will also add an Athletic trainer to
support expansion of the Health and Safety Academy by adding sports and exercise medicine. A
Cambridge teacher will oversee the new Cambridge program and will guide students and other
staff through the Cambridge adoption process. Finally, South will add a BARR (Building Assets,
Reducing Risks) teacher to provide personal and career development for students.
Other Magnet-theme Teachers ( ) Inez Mata is a highly-qualified teacher
and facilitator of learning for her students and colleagues at James Stephens (resume in
Appendix). Ms. Mata is a life long learning exceling in instructional strategies and sharing her
knowledge with other colleagues. She was on the STEM writing team that helped developed this
proposal. She is also a qualified candidate for the MLT or STEM position.
Karie Rathbun is an outstanding mathematics and technology instructor at James
Stephens (resume in Appendix). Ms. Rathbun customizes lessons based on standard-based
instruction utilizing technology. She trains other teachers when not instructing students; coaching
teachers through troubleshooting, and data questions. She is comfortable and confident in using
software programs and technology enhancements such as 3D printing to support student
learning. She understands and promotes the importance and validity of computer lab for
elementary students as they develop as learners. She is also a qualified candidate for the MLT or
STEM position.
Steven Wilkie is a teacher leader at South, which means he is a successful, highly-
qualified instructor and instructional coach (resume in Appendix). He served on the team that
developed the project proposal. Mr. Wilkie’s experience as a teacher leader and advanced
placement coordinator have greatly contributed to the thoughtful plan for implementing
PR/Award # S165A200036
Page e96

School District of Lee County 80
Cambridge and enhancing the Career Academies. He is also a qualified candidate for the MLT
or Cambridge teaching position.
Bethany Lloyd is a three-time Florida Department of Education High Impact teacher
award winner for student learning growth (resume in Appendix). She has earned seven
consecutive years as a highly-effective teacher working with students who read well below grade
level. Ms. Lloyd has actively participated in training on diversity and culture, BARR, and social
and emotional learning. She is also a qualified candidate for the MLT or BARR teaching
position.
(2) Experience and training in fields related to objectives of project, including knowledge
and experience in curriculum development and desegregation strategies.
Key personnel hired to implement project objectives will have extensive instructional
experience and highly-effective teacher ratings. Key personnel will have had training related to
the magnet theme and with culturally responsive pedagogy. Key personnel will work to ensure
all children, especially child of color feel safe and are able to learn in a caring environment.
As demonstrated by the descriptions of their experience presented earlier, the magnet
principals and teacher leaders have extensive expertise in magnet-themed curriculum
development and working to increase equity for all students, especially English language
learners. A theme-based approach to instruction to improve academic achievement and promote
diversity will be used in the magnet schools. A particular focus has been the development of
interdisciplinary curriculum materials and activities that cut across content areas and enhance
and enrich student learning.
PR/Award # S165A200036
Page e97

School District of Lee County 81
Lee and its school principals, have extensive knowledge and experience in desegregation
strategies. The superintendent, chief academic officer, director of grants, project director and
principals have been teachers and supervisors in high minority group isolated schools and have
worked with school staff to implement equity and desegregation strategies. Lee has been actively
involved in desegregation strategies in order to meet the needs of a student population that is
characterized by great diversity. Specifically, they have participated in strategies, as part of the
Student Assignment Plan, related to Student Achievement, Equity, and Diversity. Diversity
specifically includes socio-economic status, achievement levels, English language learners, race
and ethnicity, and students with special needs. As a result of these initiatives, school and district
staff has gained experience in a full array of desegregation and equity issues and strategies.
Further, Lee has been fortunate to receive Magnet Schools Assistance Program funding
in former and current funding cycles. As a result, key district and project personnel, as well as
project school staff, have gained valuable knowledge and experience in all aspects of
desegregation strategies and in developing theme related curricula to promote equity and
excellence in the schools. Lee is continually learning and having more Courageous
Conversations about Race (Singleton and Linton, 2006) in order to not only create diverse, high
performing schools, but create anti-racist schools where all children of color feel safe.
(e) Quality of Project Evaluation
This evaluation, spanning the five years of this project, is designed to produce promising
evidence (rigorous evaluation with two sets of quasi-experimental studies) as well as provide
feedback to help school and district staffs improve project performance and attain high levels of
fidelity of implementation. The evaluation will also produce information needed by the United
PR/Award # S165A200036
Page e98

School District of Lee County 82
States Department of Education (USDOE) to properly evaluate project effectiveness, determine
if all project activities are implemented as designed and on time, and to ensure that adequate
progress is made toward the attainment of all project outcomes (two annual summative reports).
This evaluation will also consider the COVID-19 pandemic and how it has and will
continue to affect the schools in this project.
Lee County closed schools on March 13, 2020, as a result of the pandemic. As in many
districts, students and teachers progressed with their work through on-line learning. It is not
currently known when and under what conditions schools will reopen, but it is likely that school
schedules may be altered, curriculum and instruction may be somewhat different and school
visits may not be possible at the beginning of the 2020 – 2021 school year and possibly beyond.
The evaluation contractors (AES and UCLA CRESST) are currently evaluating ten
projects from the 2016 and 2017 MSAP cohorts and are working closely with school districts on
these issues. Virtual site visits using prior visit experiences, documents provided by the schools,
and extensive discussions with MSAP school-based staff, school principals, classroom teachers
and project directors have enabled this work to progress and has helped school-based personnel
to focus on how to incorporate MSAP activities and content into their on-line units, lessons and
assignments. That experience will be used to adjust evaluation activities for this grant.
Data Collection: This evaluation will draw on a wide variety of data to provide substance and
context for formative and summative reports and the quasi-experimental studies. The evaluation
contractor will develop a complete set of data collection instruments (including surveys, data and
document requests, and observation and interview protocols) designed to collect sufficient
information to address performance measures, perform the quasi-experimental analyses and
PR/Award # S165A200036
Page e99

School District of Lee County 83
supplement extant data. However, extant data will be used whenever possible to lessen the
burden on school and project staff. The data to be collected will include:
Student academic achievement, demographic, enrollment and other data: The contractor will
collect standardized test score data (e.g., school and grade level and individual student data
linked to their teachers) needed to address performance measures related to student academic
achievement and perform the quasi-experimental studies. School enrollment, applicant pool and
student selection data disaggregated by race/ethnicity and socioeconomic status data will indicate
the extent to which the schools succeed in meeting desegregation related performance measures.
Document requests: The contractor will request documentation from magnet school teachers and
MSAP staff to help determine the quality and extent of MSAP implementation. Examples
include: ► descriptions of and dosage (amount of program delivered) for units and courses that
present the magnet theme to students; and student recruitment, teacher professional development,
parent involvement; ► schedules of school-based magnet staff; ► School improvement plans.
Observation and interview data will be collected during site visits to each school (see schedule at
end of section), by trained evaluators with extensive experience in magnet schools. During site
visits, the evaluator will conduct walkthroughs, observe lessons, and interview teachers,
administrators, students and parents to help assess progress towards performance measures.
If school visits by the evaluators are not possible, especially at the beginning of the grant
period, because of COVID-19 precautions, these activities will be carried out through on-line
meetings and professional development using Zoom or a similar platform
Teacher Surveys will be administered annually to all teachers at each magnet and comparison
school. Comparison schools will be selected based on school size, grade span, and school-level
student achievement and demographics. Drawing on its 24-year history of MSAP and regular
PR/Award # S165A200036
Page e100

School District of Lee County 84
and rigorous evaluations, American Education Solutions developed survey items and scales with
its survey consultants, currently, Dr. Jia Wang, a senior research scientist at CRESST. These
survey items are directly related to the purposes of the MSAP and the logic model, objectives
and performance measures of this proposal. Validated survey items and scales measure
constructs including school climate, instructional leadership, professional development hours
(formal, collaborative and coaching) and effectiveness, and teacher perceptions of intergroup
relations and magnet theme implementation, standards-based instruction, systemic reform
implementation, parent involvement, and magnet-specific professional development dosage.
Student Interviews. Group interviews of students will help in the understanding of intergroup
relations and their perceptions of the magnet program being implemented in their schools.
(1) Extent to which methods of evaluation will produce promising evidence.
The rigorous evaluation design proposed below will be carried out by researchers at
University of California Los Angeles (UCLA), Center for Research on Evaluation, Standards,
and Student Testing (CRESST). Dr. Jia Wang will be the principal investigator (PI). The UCLA
team has many years of experience conducting similar studies, including evaluations of magnet
schools (e.g., Lee County, Los Angeles, New Haven), charter schools (e.g., Green Dot), after-
school programs in the state of California, and I3 validation grants (e.g., Literacy Design
Collaborative). We have many peer-reviewed publications based on our prior magnet work (e.g.
Herman, Tobiason, & Wang, 2020; Wang, Herman, & Haubner, 2020; Wang, Herman, &
Dockterman, 2018; Wang & Herman, 2017; Wang, Schweig, & Herman, 2014 & 2017).
UCLA CRESST’s rigorous evaluation of the impact of the School District of Lee
County’s Magnet Schools Assistance Program (MSAP) grant on student learning will be
PR/Award # S165A200036
Page e101

School District of Lee County 85
comprised of two sets of quasi-experimental design (QED) studies that will also examine the
fidelity of implementation at the target magnet schools. These QED studies are designed to
provide empirical evidence based on the What Works Clearinghouse Evidence Standards by
comparing treatment students with a comparison group that is equivalent at the baseline. If the
treatment programs are well implemented, we expect the QED studies to produce promising
evidence on the effectiveness of the treatment programs.
The first set of quasi-experimental studies will examine how the four Career Academies
impact the school outcomes of students in the target high school relative to academically and
demographically equivalent non-Academy students at the same high school in Lee County. The
second set of quasi-experimental studies will explore how students in two MSAP-funded schools
perform relative to academically and demographically equivalent peers in similar non-magnet
schools in Lee County. The following sections will describe these studies in detail.
Our studies will be conducted with the statistical rigor of a high-quality quasi-
experimental design, but with keen attention to limitations of available data and sample sizes,
and on a scale that is reasonable within the current funding structure. This evaluation strives to
bolster the current body of research with instrumentation and analytic methodology aligned
directly with the priorities and selection criteria of the MSAP, and it is intended to contribute to
the evidence-based database on magnet schools the Department of Education is building.
While we will administer annual surveys to teachers to get their perspectives on their
magnet schools and provide context for our student outcome analysis, the evaluation focuses on
measuring treatment impact on students’ academic and non-academic outcomes. The Career
Academy studies plan to focus on the documented non-academic student outcomes (Kemple &
Snipes, 2000) while exploring the Career Academy impacts on student academic outcomes. The
PR/Award # S165A200036
Page e102

School District of Lee County 86
magnet school attendance studies plan to focus on academic outcomes. The academic outcomes
include student achievement in English Language Arts (ELA) for students in grades 4-5 and 9-
10, math for students in grades 4-5, End-of-Course (EOC) assessments for Algebra 1 and
Geometry, science for students in grade 5, and EOC assessments for Science (Biology 1) and
Social Studies (U.S. History). The non-academic outcomes include indicators of students staying
in school, progressing in school, and graduating in four years. Using a statistically rigorous,
high-quality QED, we examine the following broad evaluation questions:
Evaluation Question 1a. How did students enrolled in a Career Academy in
South Fort Myers High School perform on academic outcomes, as described
above, relative to matched non-Academy students in the same school (South
Fort Myers High School)?
Evaluation Question 1b. How did students who are enrolled in a Career
Academy at South Fort Myers High School compare with matched non-
Academy students in the same school (South Fort Myers High School) on
measures related to completing school (percentage of students who graduated
in four years or received a GED), staying in school (percentage of students
who dropped out), and progressing in school (the number of course credits
competed). (These are outcomes are based on the What Works
Clearinghouse’s Dropout Prevention review protocol.)
Evaluation Question 2: What are the levels of Career Academy implementation
when compared with the plan described in this proposal, as measured by
enrollment in each academy, as well as the enrollment and successful
PR/Award # S165A200036
Page e103

School District of Lee County 87
completion of courses within each academy? How do levels of
implementation vary across the four academies?
Evaluation Question 3. How did students attending the two target MSAP schools
perform on academic outcomes in relation to matched students at comparison
non-magnet schools in the same district?
Evaluation Question 4. What are the levels of magnet implementation at the two
target MSAP schools?
The following sections will describe how we address each of these evaluation questions in detail.
Evaluation Question 1.
Quasi-Experimental Design Studies of Career Academies. As noted earlier, Lee
County will be implementing Career Academies as part of the MSAP grant at South Fort Myers
High School. The Academies plan to enroll approximately 300 9th-graders starting August 2021,
and adding 300 9th-graders each year, as each cohort of students progresses across grades. In
other words, the student enrollment will be 300 in 2021-22, 600 in 2022-23, 900 in 2023-24, and
1,200 in 2024-25. Academy students are expected to take career academy courses each year and
should have a minimum of 6-7 courses over the four-year period. They will also have multiple
opportunities to earn industry certifications and students will develop Portfolios over their four
years of their featured creations and accomplishments.
Student outcome measures will include both academic and non-academic outcomes as
described earlier. Our studies will be able to analyze the academic impact for three cohorts of
students (students starting as 9th-graders in Fall 2021, 2022, and 2023), and the EOC History in
2024; and non-academic outcomes for three cohorts of students. We also understand that this
PR/Award # S165A200036
Page e104

School District of Lee County 88
analysis and implementation schedule may be modified, with the approval of the U. S.
Department of Education, due to the COVID-19 pandemic and how it may affect the conditions
under which schools will operate for the 2020-2021 school year.
Identification and Matching of Comparison Group. We will utilize a radius matching
approach (Huber, Lechner, & Wunsch, 2010) to select non-Academy students who are similar to
Career Academy students across a broad range of variables. We intend to use the following
variables in the matching process: grade, gender, race/ethnicity, English Language Learner
(ELL) status, National School Lunch Program (NSLP) status or other available measure to
indicate family social economic status, special education status, and prior achievement scores.
Our radius matching approach will compute a distance measure comprised of both a
propensity score and a Mahalanobis distance score for all eligible comparison students. Any
comparison student whose distance measure falls within a defined distance (radius) of a
treatment student in the same grade will be matched to that student. Treatment students will be
removed from the analyses when they cannot be matched to any comparison student within the
defined radius.
Please note that the use of non-academy students at South Fort Myers High School for
comparison purposes is meant to address the single-unit confounding factor as described in the
WWC Standards Brief, Confounding Factors. “This type of cofounding factor occurs when,
within the sample used to examine outcomes, either the intervention group or the comparison
group contains only one student, classroom, teacher or school...Note that a single unit is not a
confounding factor if it is present in both groups. For example, if Mrs. Smith taught all students
in a study—half of the used the software package and half did not—having a single teacher in
the comparison group would not be a confounding factor.” Therefore, having a single school for
PR/Award # S165A200036
Page e105

School District of Lee County 89
QED 1 is not a confounding factor because this factor is present for both the treatment and
comparison groups.
Standardizing Test Scores. We will standardize student scale scores based on the
district mean and standard deviation for each subject test and each grade level, allowing us to
compare scores across grades more easily and compatibly. A standardized scale score of zero, for
example, indicates that the student scored at the mean for all other students in the district who
took the same test. A standardized scale score of 1.0 means the student scored one standard
deviation higher than the district mean. Conversely, a standardized scale score of -1.0 indicates
that the student scored one standard deviation lower than the district mean. Using generally
accepted benchmarks in statistical analysis, we consider a difference of 0.1 standard deviations
or less to be minor, a difference of 0.1 to 0.3 standard deviations to be small, a difference of 0.3
to 0.5 standard deviations to be moderate, and a difference greater than 0.5 to be large.
Analysis Approach. Our research will compare the outcomes of students in the Career
Academies to demographically and academically equivalent students in the other non-Academy
students at South Fort Myers High. To examine the effect of Career Academies on student school
outcomes, we will use a regression-based approach with bias adjustment, which performed well
in a recent simulation study as detailed in Huber, Lechner, & Steinmayr (2012). Specifically, we
will first use a Weighted Ordinary Least Square (WOLS) regression equation on the comparison
student population to produce the coefficient estimates.
A counterfactual estimate will then be obtained by adding a bias adjustment from the
regression results to the average observed score of the comparison population in an outcome
year. This counterfactual represents an estimate of how these students might have fared if they
had not entered the Career Academies and had instead experienced the regular magnet school at
PR/Award # S165A200036
Page e106

School District of Lee County 90
the high school. The average treatment effect on the treated (ATT) (Ho, Imai, King, & Stuart,
2007) is determined by subtracting the counterfactual estimate from the actual average observed
score of the Academy students. This approach is known as a double-robust regression as the
estimator is said to be consistent if either one of the two models (propensity score or regression)
is correctly specified (Huber et al., 2010). In other words, controlling for prior indicators relevant
to treatment status and achievement in both the matching model and the analysis model increases
the robustness of the estimates.
For both QED studies, CRESST will conduct analyses to ensure the data meet the normal
distribution and independence assumptions before running the statistical analysis. We will
conduct sensitivity testing and missing data imputation as needed. The intended sample sizes as
planned is reasonable enough to have the needed statistical power to detect program
effectiveness by cohort. We also intend to pool the students across Cohorts to conduct an overall
impact analysis with a much larger sample size.
Evaluation Question 2.
Academy Enrollment and Course Completion. We will use the school/district
enrollment data to keep track of the Academy student enrollment, course enrollment, and course
completion data to measure the fidelity of the program to the proposed plan as described in this
proposal. We will calculate the rate of Career Academy course enrollment and completion by
Academy and by grade. Descriptive analysis will be used to report the annual trend and pattern
across years.
Evaluation Question 3.
Quasi-Experimental Design Studies of Magnet School Attendance. To answer
Evaluation Question 3, we will conduct quasi-experimental design analyses for the two magnet
PR/Award # S165A200036
Page e107

School District of Lee County 91
schools in this grant application. We will employ the same radius matching approach described
above, this time to identify the comparison students at similar non-magnet schools in Lee
County, and the same WOLS regression equation to analyze the student data. As with QED 1,
CRESST will conduct analyses to ensure the data meet the normal distribution and independence
assumptions before running the statistical analysis. We will conduct sensitivity testing and
missing data imputation as needed. The intended sample sizes as planned is reasonable enough to
have the needed statistical power to detect program effectiveness.
However, there are four distinct differences between the first QED study design and this
second QED study design, with respect to: 1) analyzing the effects of attending a magnet school,
2) combining data from two schools, 3) analyzing students in grades 4-5 and 9-10, and 4)
selecting comparison schools and comparison students. The first difference is that instead of
investigating the effect of Career Academy on student outcomes, we will investigate the effect of
magnet school attendance on academic outcomes. Our research will examine the effect of MSAP
school attendance by comparing outcomes of students in MSAP schools to the counterfactual
condition of how they would have fared if they had not been a part of the MSAP program. As
described earlier, this effect is known in the literature as the average treatment effect on the
treated.
The second difference is that we will conduct our analysis by combining the data from
both MSAP schools instead of conducting the studies within one high school. The third
difference is that instead of analyzing school outcomes for students in grades 9-12, we will
investigate the academic outcomes for students in grades 4-5 and 9-10. The specific outcome
measures student achievement in English Language Arts (ELA) for students in grades 4-5 and 9-
10, math for students in grades 4-5, End-of-Course (EOC) assessments for Algebra 1 and
PR/Award # S165A200036
Page e108

School District of Lee County 92
Geometry, science for students in grade 5, and EOC assessments for Science (Biology 1) and
Social Studies (U.S. History).
The fourth difference is that instead of identifying comparison students from the same
magnet school, the comparison students will be identified from similar non-magnet schools in
Lee County via a two-step process. Specifically, the researchers will first select comparison
schools within the district based on how closely they match the characteristics of MSAP
supported schools in the year prior to magnet implementation using hierarchical cluster analysis.
A comparison school selection will take into consideration the grade span of the school, school
size based on enrollment, school racial composition (i.e., percentage of Black and Hispanic
students), the percentage of ELL students and the percentage of NSLP participants.
To identify comparison students, the research team will first restrict the pool of MSAP
and comparison students to those that had achievement outcomes for each outcome year and may
also limit the students to those at the same MSAP or comparison schools for a defined period of
time. A covariate balancing propensity score will then be computed for the eligible comparison
students. Students from each comparison sample will be matched to MSAP students with similar
propensity scores using radius matching.
Evaluation Question 4:
Variation in Magnet Implementation across Target MSAP Schools. As described
earlier, our evaluation will collect and analyze data on magnet implementation via teacher
surveys, site visits (by our collaborators at AES), and analysis of classroom artifacts. CRESST
will work closely with AES and the district in developing the rubrics used to rate the classroom
artifacts teachers submit for peer review. The classroom artifacts will include end-of-unit
assessments developed by teachers and the accompanying student work. Assignment/assessment
PR/Award # S165A200036
Page e109

School District of Lee County 93
tasks can serve as windows into such variables as teacher clarity of instruction, cognitive rigor of
instruction, and, in this case, degree and quality of magnet theme implementation. The CRESST
team will also independently score a random set of these artifacts to ensure that school-site peer
review teams are reliably scoring the artifacts in alignment with the expectations set forth in the
rubrics.
Based on collaboration with AES and the school district, the CRESST research team will
create a fidelity index incorporating the various variables which we will use to measure quality
of implementation at the school level. We will determine different levels of fidelity for each
construct, including a threshold for adequate implementation. The fidelity index will indicate
whether a particular school performed adequately across the different constructs, such magnet
theme implementation, quality of professional development, etc.
Rigorous Evaluation Reporting
Students are tested in late spring, and the testing data usually start to become available in
September, at the end of the grant year. To study the impact of Career Academy on student
outcomes, we will analyze student outcome scores in Years 3-4 at the beginning of Years 4-5.
Additionally, we will conduct the analysis on the student graduation indicator as of June of Year
5. The analysis of the impact of student attendance in the magnet schools in Years 3-4 will be
done at the beginning of Years 4 and 5. A draft report will be submitted to the district within 8
weeks of the receipt of the complete data set.
The report will contain an executive summary, introduction, description of the school
district and the participating schools, analysis procedure that describes data, data collection, and
analysis approaches, and the analysis results for both quasi-experimental design studies. For the
PR/Award # S165A200036
Page e110

School District of Lee County 94
magnet school study, when the sample size allows, the results will be disaggregated by school,
race/ethnicity, grade, free and reduced-price lunch status, ELL status, and disability status.
Rigorous Evaluation Activities and Timeline
Year
1
(Oct
2020
- Sept
2021)
Year
2
(Oct
2021
-
Sept
2022)
Year
3
(Oct
2022
-
Sept
2023)
Year
3
(Oct
2023
- Sept
2024)
Year 4
(Oct
2024 -
Sept
2025)
Study design revision X
Assisting APR reporting X X X X X
UCLA and district IRB application & renewal X X X X X
Requesting school level data to identify comparison
schools for survey administration
X
Data analysis to identify comparison schools for
survey administration
X
Survey development & revision X
Survey analysis and reporting X X X X
Development of artifact scoring rubrics X
Scoring and analysis of artifact data X X
Requesting student level demo and testing data X X X X
Requesting student graduation data for 2024-25 year X
PR/Award # S165A200036
Page e111

School District of Lee County 95
Student outcome data analysis & reporting (Career
Academy and magnet) Analysis of years 3 and 4
during years 4 and 5
X X
Promising Evidence
(1) The Career Academy studies, QED 1, will be conducted for the target high school, and
the study intends to establish a link between the Career Academy component of the logic
model for South Fort Myers High School and previously described student non-academic
and academic outcomes.
(2) The magnet school studies, QED 2, will be conducted for the two project schools, and the
study intends to establish a link between the Quality Magnet Curriculum and Instruction
component of their logic models and student academic outcomes.
UCLA CRESST Capacity
UCLA’s Center for Research on Evaluation, Standards and Student Testing (CRESST)
proposes to conduct this rigorous evaluation for the current MSAP grant application. CRESST
brings to the effort strong capacity in rigorous qualitative and quantitative methodologies and
wide experience in evaluating and supporting the improvement of state, district, and local
programs. CRESST is at the forefront of discussions in assessment and evaluation design,
implementation, and evidence of high-quality measures and their constructive applications to
students of various backgrounds across diverse educational settings. Dr. Jia Wang will serve as
Principal Investigator (PI) to lead the proposed evaluation study.
Dr. Jia Wang, with over a decade of experience in educational evaluation and
specializing in research design and methodology, has led multiple statewide evaluation projects
PR/Award # S165A200036
Page e112

School District of Lee County 96
and evaluation projects that involve multiple school districts. Dr. Wang will provide intellectual
leadership and oversight for all technical aspects of the project as well as provide technical
quality control for all project publications, documents, and dissemination. She will also have day
to day responsibility for project operations, including evaluation design and analysis, data
collection and analysis, reporting, and monitoring and assuring the quality, timeliness, and cost
effectiveness of project operation.
The current UCLA team has many years of experience conducting similar studies,
including evaluations of magnet schools (e.g., Los Angeles, New Haven), charter schools (e.g.,
Green Dot), and I3 validation grants (e.g., Literacy Design Collaborative). Our rich history in
studies of the implementation and effects of school reform programs particularly positions us to
understand and be sensitive to MSAP’s intended outcomes and the factors that are likely to
influence its success.
The same CRESST team has been engaged in the evaluation of magnet schools on
student learning and teacher effectiveness since June 2010. We worked with 11 MSAP grant
awardees in the 2010 cycle, 9 MSAP grant awardees in the 2013 cycle, 4 MSAP grant awardees
in the 2016 cycle, and 6 MSAP grant awardees in the 2017 cycle. We have many peer-reviewed
publications based on our prior magnet work (e.g. Herman, Tobiason, & Wang, 2020; Wang,
Herman, & Haubner, 2020; Wang, Herman, & Dockterman, 2018; Wang & Herman, 2017;
Wang, Schweig, & Herman, 2014 & 2017).
UCLA CRESST successfully completed two four-year statewide after-school evaluation
projects in California: Statewide Evaluation of ASES and 21st CCLC After School Programs:
May 1, 2008-December 31, 2011 and Statewide Evaluation of High School After School
Programs: May 1, 2008 - December 31, 2011. The reports (Huang & Wang, 2012; Huang, Wang,
PR/Award # S165A200036
Page e113

School District of Lee County 97
& the CRESST Team, 2012) can be found at the California Department of Education website
(cde.ca.gov/ls/ba/cp/uclaeval.asp). Dr. Jia Wang led the quantitative part of these evaluation
studies.
In these statewide after-school evaluation projects, CRESST employed both quantitative
and qualitative research methods to study the effect of after-school attendance on a wide range of
student outcomes, both academic (including standardized test data) and non-academic outcomes.
We administer surveys, conduct site visits and interviews, conduct on-site classroom
observations, organize focus groups with staff and students, compile school profiles, and more.
We utilized sampling strategies to select representative samples of after-school programs for
more intensive data collection and analysis. Multilevel analysis was used to measure student
achievement and behavioral outcomes, utilizing a quasi-experimental design framework with
propensity score matching. Specifically, separate cross-sectional analyses were conducted for
after school program participants by year to examine the after-school participation effect on
participants’ year-end academic and behavior outcomes within each given year of participation.
We also conducted longitudinal analyses to examine the effect of after school participation on
participants’ academic and behavior outcomes over the study’s three-year period. The
longitudinal analyses focused on how after school participation over the three years altered a
student’s outcome trajectory during the same three-year period.
Another example, completed in February 2013, is the Five-year Evaluation Project of
Green Dot’s Locke High School, funded by the Gates Foundation. Dr. Joan Herman was the
Principal Investigator and Dr. Jia Wang was the Project Director. The three associated reports
(Rickles, Wang, & Herman, 2013; Herman, Wang, Rickles, Hsu, Monroe, Leon, & Straubhaar,
2013; Herman, Wang, Ong, Straubhaar, Schwig, & Hsu, 2013) can be found at the CRESST
PR/Award # S165A200036
Page e114

School District of Lee County 98
website (http://www.cse.ucla.edu/products/reports.php). With a history of severe segregation that
mirrors the residential segregation of the surrounding neighborhoods, Locke High School had a
record of having among the lowest academic performance of any school in Los Angeles County.
With approval from Los Angeles Unified School District, Locke High School transitioned into a
set of smaller, Green Dot Locke (GDL) Charter High Schools in fall 2007.
The CRESST evaluation, employing a rigorous quasi-experimental design with
propensity score matching and comparing GDL students to similar students at three
neighborhood high schools, found statistically significant, positive effects for the GDL
transformation including improved achievement, school persistence, graduation, and completion
of college preparatory courses for both cohorts of GDL students. During the five-year evaluation,
we also conducted focus group with staff and students, conducted site visits and interviews. The
study was certified by WWC as meeting the WWC Standards with reservation (WWC, 2018).
(2) Evaluation measures relate to outcomes and produce quantitative and qualitative data;
Project performance measures follow the description of the formative evaluation.
Formative Evaluation: The evaluation contractor will aid in the continual improvement of the
project through formative evaluation, an examination of implementation that returns information
to project, school and district staff to help them improve program performance. Formative
evaluation includes the study of program fidelity (the degree to which a program is implemented
as designed) and reach (the proportion of the target group that participates). Components of
fidelity include: ► adherence – the degree to which the program adheres to its goals, plans,
activities, timeline; ► dosage – the amount of program delivered; ► quality – the quality of
PR/Award # S165A200036
Page e115

School District of Lee County 99
program activities and services; ► responsiveness of participants to program activities;
► program differentiation – unique features when compared to non-magnets.
Formative Evaluation Reporting: Data will be collected, as available, and analyzed, and
findings will be discussed with the project director, the school evaluation team and school staff
throughout the year.
Reduction of Minority Group Isolation (MGI) Report: This report will be written for years
two through four to help the district and the magnet schools build their capacity to better
understand and revise recruitment, selection and enrollment activities. Enrollment data will be
compared with applicant pool and student placement data (all disaggregated by race/ethnicity),
benchmarks and data from previous school years to determine why performance measures were
or were not attained and if previous recommendations were implemented. The October site
visits, will focus on desegregation activities including recruitment, student selection and
placement procedures and on the final results of the process. During this visit, the MGI report
and all related data will be discussed with the project director, each school’s recruitment and
formative evaluation teams, and MSAP project staff. If minority group isolation performance
measures were not attained, the data supporting the findings will be discussed and will inform
modifications to recruitment or selection procedures and the collection of additional information
(e.g., parent focus group results) if needed. Recommendations for improvement will be jointly
formulated by the evaluator, the project director and the school evaluation teams.
Site Visit Reports provide feedback based on data related to project implementation.
During the grant period, there will be eight site visits by the evaluation contractor who
will have an experienced magnet practitioner (site visitor) provide feedback based on
documentation and data submitted by the schools, to help teachers and administrators better
PR/Award # S165A200036
Page e116

School District of Lee County 100
understand how the implementation of grant activities are progressing. After each site visit by
the evaluation contractor, a report will be written by the site visitor and submitted within ten
days. It will summarize the findings of the visit, help school staff understand if they are on track
to attaining performance measures and benchmarks, discuss reasons they may not be attained and
highlight project successes. Recommendations for improvement, jointly arrived at by the staff
(school formative evaluation team), the project director and the evaluator, will be included.
Documentation Reviews, included in site visit reports, will summarize descriptive and
quantitative data related to magnet curricula and instruction, systemic reforms, parent activities
and professional development, and report on: adherence (e.g., activities implemented on time),
dosage (e.g., the amount of time students, teachers and parents are exposed to grant activities),
quality (e.g., peer reviews of units). Note: Because of the time involved in project start-up (e.g.,
hiring staff) there will be 2 visits for year 1.
Sustainability strategies for the MSAP program described in this application will include
building the capacity of the participating schools to study the implementation of their MSAP
programs by using the structure and tools designed by the evaluators and adapted by the schools,
including the establishment of school-wide formative evaluation teams. The members of the
team (classroom teachers and school-based magnet staff), established at the beginning of the
grant period at each school, will learn how to study the implementation of grant activities so that
by the middle of project year 3, they will be able to perform formative evaluation activities with
substantially less support from the evaluation contractor. In other words, the formative
evaluation will, increasingly, be carried out by school staff as the grant progresses.
The evaluation contractor will make two site visits during project year one. After year
one, there will be a minimum of 3 “visits” each year by either the outside evaluator or the school
PR/Award # S165A200036
Page e117

School District of Lee County 101
evaluation team. Of these, the evaluation contractor will perform six site visits (3 for year two; 2
for year three; 1 for year four) and the formative evaluation team will perform six (1 for year
three, 2 for year four, 3 for year five). As each school increases its in-house formative evaluation
capacity, it will decide the best ways to provide feedback to teachers and how to adapt formative
activities to maximize teacher support.
This capacity will be developed during professional development sessions, webinars and
site visits by the evaluation contractors and the MSAP supported staff beginning in project year
one. Professional development topics might include what constitutes a magnet unit and magnet
dosage, what types of professional development might be most productive and in what
combination, how many hours of specific PD might be required to bring about a change in
classroom practice, how can teachers, and school-based magnet staff help monitor, measure and
provide teachers feedback that will help them more effectively implement the grant.
School-level grant activity documentation will be submitted to the evaluators twice in
project year one and three times per year thereafter, regardless of the number of visits the
evaluation contractor makes during each project year. This allows the contractor to gain insights
into the extent and quality of the project implementation even as the school increases its in-house
formative evaluation activities. Prior to “site visits” made by each school’s formative evaluation
team, the evaluators will submit to the project director and the school a Documentation Review
Report that will include curriculum and professional development dosage as well as discussions
of areas that might need more study or clarity. These reports will support the building of the
capacity of the school level formative evaluation teams.
Teacher Survey Reports will include item by item results for each school and summaries of
survey construct results for each school. Relationships between variables (e.g, magnet
PR/Award # S165A200036
Page e118

School District of Lee County 102
implementation and professional development dosage and impact) will be explored as is change
over time. Other formative evaluation strategies include: Short Term Outcomes. Benchmarks
are short term outcomes that indicate whether adequate progress is being made towards the
attainment of annual performance measures. Most are derived from site visit and documentation
review reports, survey items or the MGI report. Examples of critical benchmarks are included in
the performance measure section which follows. The project director, evaluator and the school
evaluation teams can decide on additional benchmarks that could help guide one or more
schools. The degree to which benchmarks are attained will be reported in the site visit,
documentation review, survey and MGI reports or during Zoom or other platform sessions when
needed (e.g., at critical points during the recruitment period).
Continuous Cycle of Improvement. This evaluation uses a four-part iterative cycle that will
lead to better understanding of the components of this project’s logic model and theory of action
as well as improved outcomes for students: 1) Planning or Modifying Activities. The logic
model and the activities described in this proposal will form the basis of the implementation
plans that will be developed at the beginning of each project year. 2) Implementation.
Activities described in the MSAP proposal will be implemented by school and project staffs with
fidelity. 3) Formative Evaluation Feedback includes the reports listed above, site visits (please
see schedule at the end of this evaluation and the previous discussion), two annual summative
reports, and ongoing telephone, Zoom (or other platform) and e-mail discussions with the
evaluators about the reports and data. 4) Reflection/Discussion. This part of the cycle insures
that formative and summative data are discussed and used for project improvement. A school
formative evaluation team, composed of the magnet lead teachers, and teacher representatives
(determined by the school planning and management team), review all formative and summative
PR/Award # S165A200036
Page e119

School District of Lee County 103
reports and data, discuss report findings and recommendations with the principal and teachers
during faculty and grade conferences, give teachers’ feedback and monitor the implementation of
recommendations. The team will meet at least five times per year within a few days of the
receipt of each report. As previously discussed, the school formative evaluation teams will also,
gradually over the course of the grant period, take over formative evaluation activities from the
evaluation contractor. School administrators will not be part of the formative classroom visits
and other formative activities to ensure that classroom teachers understand that the purpose of
these activities is to provide formative feedback and are not part of the district’s and school’s
teacher evaluation system.
PLC’s for magnet lead teachers. Magnet resource teachers and the project director will meet at
least once per month to discuss project implementation, examine benchmark and short-term
outcome data and discuss barriers to implementation and how to solve them. Successes (best
practices) will be identified, shared and duplicated in other schools. The results of Reflection
and Discussion will be used for Planning or Modifying Activities as the cycle repeats
throughout each project year.
Summative Evaluation and Reporting: The evaluator will determine the extent to which
performance measures (medium term outcomes on the logic model) are attained. The evaluator
will collect and analyze the data, prepare two semi-annual summative performance reports (mid-
May and end of September), summarizing findings, and discuss the results with district and
magnet school staffs. The data and findings in the semi-annual summative reports can be used in
the Annual Performance and Ad Hoc Reports submitted to the U.S. Department of Education.
The following section describes the annual performance measures, their relationship to each
MSAP program purpose and to this project’s logic model and how the evaluators will assess
PR/Award # S165A200036
Page e120

School District of Lee County 104
their attainment (e.g., indicators, measures of change, data collection methods, data sources and
frequency of data collection). Some of the most important benchmarks associated with each
performance measure are also described. Long term outcomes on the logic model are the year 5
performance measures and represent the outcomes for the entire project period. They will be
reported on in the final report.
Program Purpose 1: The elimination, reduction, or prevention of minority group isolation in …
schools with substantial portions of minority students….
Logic Model Activity: Desegregation – Promote magnet program offerings to diverse families;
Logic Model Output: Large/diverse applicant pool. Benchmarks: applicant pool benchmarks
are attained. Both proposed magnet schools will reduce minority group isolation and increase
socioeconomic integration by decreasing the percentage of black or Hispanic students and
increasing the percentage of white and middle-class students. The percentage of black students at
James Stephens Elementary (39.05%) and Hispanic students at South Fort Myers High School
(51.41%) are greater than the district average of black students in the East Zone (19.6%) for
James Stephen Elementary and Hispanic students in the South Zone (37.9%) for South Fort
Myers High School. The proportion of low-income students at each school is also greater than
the zone averages.
Objective 1. Minority group and socioeconomic isolation will be reduced at the proposed magnet
schools. (This objective addresses MSAP Performance Measure a.)
Performance Measure 1.1-1.2: By October 1 of each project year, for the following magnet
schools, enrollment targets (see Table 3: Enrollment Data-Magnet Schools) will be attained by
reducing the isolation of black or Hispanic students (using 2019-2020 as the baseline). The schools
and their 2019-2020 enrollments (isolated groups in bold) are: 1.1 ► James Stephens Elementary
PR/Award # S165A200036
Page e121

School District of Lee County 105
(gr. Prek-5) 39.3% black, 41.73% Hispanic, 10% white, 8.54% 2 or more races, < 1% other
groups. Low Income: 73.45%; 1.2 South Fort Myers High School (gr. 9-12) 21.2% black, 51.04%
Hispanic, 20.61% white, 5.37% 2 or more races, <2% other groups. Low Income: 53.75%.
1.3- 1.4 By October 1 of each project year, the proportion of low-income students will be reduced
by at least 1.5 percentage points at each magnet school. See the 2019-2020 low income enrollments
for each school above.
Assessment: School enrollment data, disaggregated by race/ethnicity and socioeconomic status,
collected by the district, will help determine the degree of attainment of 1.1-1.4. Each year
(October 1), the percentage of students in the isolated racial/ethnic group and low-income
students enrolled in each school will decrease. Baselines are 2019-2020 school enrollments.
School census data is collected by teachers at each school and aggregated and confirmed by the
district.
Purpose 2: To develop, implement and expand magnet school programs that will assist LEAs
achieve systemic reforms, and provide all students the opportunity to meet challenging State
academic standards. Logic Model Activity: Develop/integrate magnet theme; Revise core
academics; Logic Model Output: Quality magnet curriculum and instruction. Benchmark: 90%
of each school’s teachers agree that a great deal of emphasis was placed on (a) alignment of
curriculum content and assessments with Florida standards; (b) data-based decision making; (c)
RtI; (d) Unit quality reviews. (Survey results.) Objective 2: All students will receive high quality
instruction that includes their school's systemic reforms and magnet themes in units and courses
aligned with Florida State standards. Performance Measure 2.1- 2.2. By the end of each project
year (September 30), at each magnet school, at least 70% (year 1), 75% (year 2), 80% (year 3),
85% (year 4) and 100% (year 5) of all core academic subject magnet units will meet district and
PR/Award # S165A200036
Page e122

School District of Lee County 106
project quality criteria determined by peer reviews using a unit quality rubric. Assessment: Unit
quality rubrics will be designed, and passing scores established, by each school under the guidance
of the curriculum and instruction department, the project director and the evaluator. Reviews will
occur 2-4 times per year as determined by School Planning & Management Teams. Teachers will
review each other’s units facilitated by magnet lead teachers who will monitor the process and
maintain a database of review results. Teachers will be trained in rubric use to insure inter-reader
reliability. Baseline is zero for 2019-20. Evaluators will review a sample of units to check for
inter-reader reliability. The percent of units meeting quality criteria increases each year.
Purpose 3: The development, design and expansion of innovative educational methods and
practices…Logic Model Activity: Develop/integrate magnet themes; Revise core academics;
Logic Model Output: Quality magnet curriculum and instruction. Benchmark:(a) Unit dosage
attains the target number of hours. (b) See Benchmark for Project Purpose 2.
Objective 3. All students, at each magnet school, will receive magnet theme instruction.
Performance Measures: 3.1-3.2 By the end of each project year, all students, at all magnet
schools, will receive magnet theme instruction coordinated with or including systemic reforms
for at least 3 (year 1), 4 (year 2), 6 (year 3), 8 (year 4) and 10 (year 5) hours per week.
Assessment: Success will be determined, by the evaluators or the school formative evaluation
team, through unit analysis and confirmed with surveys, interviews and walkthroughs. Unit
summaries for each teacher (including teacher dosage logs) are submitted to evaluators by each
school 3 times per year. Entire units are made available by schools (magnet lead teachers) to
evaluators (on-line access) on a continuous basis. The dosage is the average number of hours per
week each teacher presents magnet theme related instruction (integrated units and separate
PR/Award # S165A200036
Page e123

School District of Lee County 107
magnet theme classes) to students. The baseline is zero for 2019-20. The number of hours will
increase each year to meet the target.
Program Purpose 4: Courses of instruction within magnet schools that will substantially
strengthen the knowledge of academic subjects and the attainment of … career, technological,
and professional skills of students... Logic Model Activity: Develop/integrate magnet themes;
revise core academics. Logic Model Output: Quality magnet curriculum and instruction.
Benchmarks: See Benchmark for Project Purposes 2,3,5, and 6.
The State of Florida administers the Florida Standards Assessment (FSA) in English
language arts and mathematics to students in grades 3-10. In addition, Florida administers the
Statewide Science Assessment (SSA) to students in grades 5-8. Finally, for Florida high schools,
students in any grade completing courses in Algebra I, Geometry, Biology I, US History, or
Civics take the State's End of Course (EOC) assessment. Each year, the State determines and
provides the percentage of students reaching proficiency (identified as % satisfactory) for
English language arts, mathematics, and science. This data is provided for all students and each
of the following subgroups: Black/African-American, Hispanic, Asian, White, American
Indian/Alaskan Native, Economically Disadvantaged, Students with Disabilities, and English
Language Learners.
Further, the State of Florida assigns each school a School Grade. Each school is rated
based on percentages of students scoring satisfactory or above on the Florida Standards
Assessments (FSA) (for ELA and mathematics), the Statewide Science Assessment, and the
State's social studies assessment, as well as learning gains made by all students and learning
gains made by students in the lowest 25%. High schools also factor in college and career
acceleration data and a school's graduation rate. These ratings produce a scale score of up to 800
PR/Award # S165A200036
Page e124

School District of Lee County 108
points for elementary schools and 1,000 points for high schools. The total number of points a
school earns is then divided by 800 for elementary schools or 1,000 for high schools in order to
determine the percentage of points earned. This percentage is then converted to a School Grade
of A-F.
Objective 4: At each magnet school, student academic achievement will increase each year in
English language arts, mathematics, and science for the total population and for students in each
major ethnic and racial subgroup. The percentage of students from major ethnic and racial
subgroups attaining a score of Satisfactory or above on the Florida Standards Assessment will
increase.
Performance Measures: Performance Measures 4.1—4.4 address GPRA (U.S. Department of
Education) Performance Measures (b and c): The percentage of students from major racial and
ethnic groups in magnet schools receiving assistance who score proficient or above on State
assessments in reading/language arts and mathematics.
4.1: By the end of each project year, for James Stephens Elementary School, the percentage of
"All Students" and students from each student subgroup who score "Satisfactory" and above on
the FSA in English language arts will increase when compared with the previous year.
4.2: By the end of each project year, for South Fort Myers High School, the percentage of "All
Students" and students from each student subgroup who score "Satisfactory" and above on the
FSA in English language arts will increase when compared with the previous year.
4.3: By the end of each project year, for James Stephens Elementary School, the percentage of
"All Students" and students from each student subgroup who score "Satisfactory" and above on
the FSA in mathematics will increase when compared with the previous year.
PR/Award # S165A200036
Page e125

School District of Lee County 109
4.4: By the end of each project year, for South Fort Myers High School, the percentage of "All
Students" and students from each student subgroup who score "Satisfactory" and above on the
FSA in mathematics will increase when compared with the previous year.
4.5: By the end of each project year, for James Stephens Elementary School, the percentage of
"All Students" and students from each student subgroup who score "Satisfactory" and above on
the Statewide Science Assessment will increase when compared with the previous year.
4.6: By the end of each project year, for South Fort Myers High School, the percentage of "All
Students" and students from each student subgroup who score "Satisfactory" and above on the
End of Course assessments for science courses will increase when compared with the previous
year.
4.7: By the end of each project year, each magnet school will increase its School Grade score,
when compared to the previous year.
4.8: By the end of the project period, 75% of students at each school will develop mastery of the
magnet curriculum, as determined by project-based assessments scored by rubrics.
Assessment: All students are tested in April of each school year. Data is compiled by the State
Education Department and made available to school districts. This data (4.1-4.7) will be
presented in the Annual Summative Performance Reports in tabular form, highlighting the
performance targets and how each magnet school – both in aggregate and by subgroups –
performed in relation to these targets. Due to the elimination of state testing because of the
COVID-19 pandemic, baselines are 2019 scores and indexes.
Project based assessments (4.8) will be developed in year 1 for each grade by the magnet
lead teachers and classroom teachers with the support of the curriculum and instruction
department. Rubrics will be used in years 2 through 5 by teachers at least twice per year
PR/Award # S165A200036
Page e126

School District of Lee County 110
(frequency to be determined by each school’s planning and management team) and be approved
by the magnet project director. The baseline is zero for 2019-20 and will increase each year.
Purpose 5: Improvement of the capacity of LEAs, including through professional development, to
continue operating magnet schools at a high-performance level after Federal funding…is
terminated. Logic Model Activity: Develop teachers’ skills; Logic Model Output: New or
improved instructional practices used by teachers. Benchmarks: (a) PD is implemented as
designed. (Checked during site visits.) (b)At least 85% of teachers will agree with survey items
related to PD: (i) helped me integrate the magnet theme into lessons; (ii) deepened my content
knowledge; (iii) helped me better maintain student engagement; (iv) I use what I learned from PD
in my classroom; Objective 5. Provide professional development related to improvement of
curriculum, instruction and magnet theme development and implementation.
Performance Measures 5: By the end of project year one, at each magnet school, teachers will
receive at least 40 hours and by the end of project years two through five, teachers will receive at
least 50 hours of professional development (e.g., workshops, courses, coaching) in each of the
following areas: 5.1 directly related to the improvement of curriculum and instruction including
the development and implementation of the systemic reforms listed in the school improvement
plan; 5.2 directly related to the development and integration of the magnet theme.
Other performance measures related to capacity building include: (2.1, 3.1) development
and implementation of systemic reforms and magnet theme units and courses.
Assessment: Magnet lead teachers (MLTs) will collect professional development (PD) data
including the type of training, the number of hours provided and which teachers are involved and
summarize it. This information will be entered into a database at each school under the
PR/Award # S165A200036
Page e127

School District of Lee County 111
supervision of the MLTs. Attendance sheets and data, agendas, workshop materials and magnet
lead teacher logs and schedules will be available at each school and checked by the evaluator and
project director. The 2019-20 baseline is zero. The evaluation of PD effectiveness will include
teacher surveys, teacher logs (self-reports) of teaching strategies developed by the evaluators and
district staff, units created by teachers, and student testing data.
Purpose 6: Ensuring that all students … have equitable access to high quality education
that will enable the students to succeed academically …. Logic Model Activity: Theme integrated
family and community events and all other logic model activities; Benchmarks: The degree to
which: (a) parent activities described in the proposal are being implemented; (b) all classes reflect
the racial/ethnic composition of the school. (Items a and b will be determined during each site
visit.) Objective 6: All students will have equitable access to high quality education.
Performance Measure 6.1 By the end each project year, for each magnet school, at least 70% (yr.
1), 75% (yr. 2), 80% (yr. 3), 85% (yrs. 4 and 5) of classes will reflect their grade's enrollment for
each racial/ethnic group by ±15 percentage points. Assessment: Success will be determined by
analysis of class enrollments disaggregated by race/ethnicity. Please see the assessment for
measures 1.1-1.2. Baselines are 2019-2020 enrollments. The percentage of classes meeting the
criteria increases each year.
Parent involvement promotes equitable access to high quality education for all students.
Objective 7: There will be an increase in parent participation at each magnet school.
Performance Measure 7.1 By the end project years 2 through 5, for each school, there will be a
5% increase (compared with the previous year) in the numbers of parents who participate in school
activities. Assessment: Workshop materials, attendance records and parent interviews will
determine parent participation and satisfaction. They will be collected by the magnet lead teachers
PR/Award # S165A200036
Page e128

School District of Lee County 112
as sessions occur and summarized and submitted to evaluators and the project director 3 times per
year. The baseline year will be 2020-21. There will be an increase in the number of parents
involved in school activities for years 2 through 5.
Annual Evaluation Schedule: ► Initial meeting with project and district staff (Week 1);
► Refine data collection instruments and plan; refine analysis plan; (Weeks 1-3); ► Collect data
(Throughout year): Enrollment data (Week 1); Documents collected (e.g. units integrated with
magnet theme - Weeks 17, 29, 2 in next school year); Site visits including interviews,
observations, implementation data collection for quasi-experimental studies, etc. (Weeks 18, 30,
3 in next school year); Site Visit-Document Review Reports (Weeks 19, 33, 3 in next school
year); applicant pool data (Week 31); Dosage data (ongoing); Surveys administered (Week 33-
35); State test data (Week 49); Survey results reported (Week 40); ► Formative evaluation
including discussion of recommendations (Weeks 1-52); MGI Report (Week 3); ► Analyze and
process summative data (Weeks 30-32 and 50-52); ► Prepare Summative Evaluation Reports
(Weeks 29-30 and 50-52); ► Summative Evaluation Reports (Weeks 31 and 52); Quasi-
experimental Evaluation Reports (Week 3). Week 1 is the week the project begins each year.
For the 2017 MSAP cycle, October 1 was week 1. The site visits and related activity dates
denote two visits for year 1 and the third visit at the beginning of year 2, three visits in years 2
through 4, and one for year 5.
(3) Costs are reasonable in relation to the objectives, design, and significance of project.
This evaluation will be cost effective and, at the same time, provide appropriate levels of
service. It contains the most important activities that will provide the support and feedback that
schools need to modify and improve project activities and produce promising evidence, while
PR/Award # S165A200036
Page e129

School District of Lee County 113
keeping an eye on level of service in relation to cost. The frequency of major evaluation
activities implemented by the evaluation contractor is summarized in the table below and were
previously described.
Activities by Evaluators Year 1 Year 2 Year 3 Year 4 Year 5
Quasi-experimental Analyses 1 and 2 of
Years 3 and 4 Data, and Reports
No No No Yes Yes
Site Visits and Site Visit Reports 2 3 2 1 0
Documentation Reviews 2 3 3 2 2
PD for Formative Evaluation Teams Yes Yes Yes Yes No
Teacher Surveys Yes Yes Yes Yes No
MGI Reports No Yes Yes Yes No
Summative Reports 2 2 2 2 1
Project year 1 will most likely start on October 1, 2020. Project staff need to be
selected/assigned following district guidelines and procedures, and project activities are just
beginning. Therefore, it makes more sense to have two, rather than three, site visits during
project year 1 to allow time for startup. Also, MGI reports will start in year 2 after the first
recruitment/application/selection cycle during the first year. For years 2 through 4, there will be
a total of six site visits by the outside evaluator decreasing by one visit each year. As previously
explained, to build the capacity of each school to study its own MSAP project’s implementation
and provide feedback to teachers to improve the extent and quality of the implementation, the
formative evaluation teams will begin to provide their colleagues with feedback and support
beginning with year 3, after receiving professional development (PD) from the evaluation
PR/Award # S165A200036
Page e130

School District of Lee County 114
contractor. Beginning with year 2, the number of “site visits” each year will remain the same
because as site visits by the evaluation contractor decrease, the number of “visits” by the
formative evaluation team will increase. Beginning with project year 2, the minimum number of
“visits” will be no less than three.
An analysis for years 1 and 2 for QEDs 1 and 2, would probably not show significant
results because students may not be exposed to the treatments for a long enough period of time
and teachers may not be fully trained to provide the treatments effectively. Therefore, student
scores for project years 3 and 4 will be analyzed and reported on in years 4 and 5. Also, there
may not be enough time during year 5 for an analysis of test scores administered in the spring of
the last year of the grant before the end of the project period.
The QED analysis is significant, because it looks at the impact of career academies at the
magnet high school. The quasi-experimental analysis is significant, because it compares the test
scores of academy students within the project school with those of students in not in the
academies. There are very few high-quality studies of magnet schools that show significant and
positive results. Ballou (2009) examined 14 studies and found four that met high design quality
criteria. Of those, two, Crain, Heebner and Sim (1992 and 1999); Ballou, (2007) had statistically
significant positive results. The What Works Clearinghouse has only one study (Bifulco et al.,
2009) that meets its design standards and has positive, statistically significant results. A multi-
site study (Wang, et. al. 2016) of 24 MSAP magnet schools in five districts found no effect on
test scores, on average across all schools, but wide outcome variability. Using local
implementation data to differentiate among schools, Dr. Wang found that the variability in
student achievement was due to the degree of fidelity of implementation, which included magnet
theme implementation (e.g., curriculum and professional development dosage, quality and reach)
PR/Award # S165A200036
Page e131

School District of Lee County 115
and support of classroom teachers (e.g., time with coaches). The two study-level covariates,
explained about 60% of the variance between school sites for the magnet effect on math and
about 40% of the variance on reading. The effect of both factors was statistically significant.
Wang, et. al., indicates the importance of fidelity of implementation of key grant components.
If the magnet schools in this project are well implemented, as determined by the
evaluation described in this section, we believe that test scores of students attending project
schools will be higher than those of similar students attending non-magnet schools, and that the
differences will be statistically significant, an important result. This result would support the
findings of Wang, et. al., that the degree of fidelity of implementation of a magnet program is
related to student achievement and that attending a magnet school contributed to improved
student achievement, supporting the findings of Bifulco (2009).
The total 5-year cost of this evaluation is of the total 5-year budget of
. This is much less than evaluation budgets for grants such as I3, which can cost as
much as of a budget’s total. The is also reasonable considering the research
focus is part of the evaluation, which includes two quasi-experimental studies, as well as the
formative and summative evaluation components.
The cost of the “rigorous evaluation,” including the QED design, analyses, reporting,
collection of test score data, and teacher and student level implementation data related to the
QEDs as well as survey design and analysis and reporting, is for the five years of the
grant. The cost of the formative and summative parts of the evaluation ( for the five
years of the grant) includes the site visits and site visit reports and documentation reviews, the
MGI Reports, the summative reports, the collection of all data except for test scores including all
PR/Award # S165A200036
Page e132

School District of Lee County 116
data related to desegregation (e.g., enrollments, applicant pool, placements) and professional
development (PD) for the formative evaluation team by the evaluation contractors.
The average cost of the evaluation per year is therefore, for all evaluation
activities. That is per year, on average, for the “rigorous component” and per
year, on average for the formative and summative evaluations as described in this section.
We believe these costs are reasonable because: (1) two sets of quasi-experimental studies
are being performed and reported on to answer questions that the district feels are important; (2)
the formative evaluations include site visits to the magnet schools, formative evaluation reports
(site visit, documentation review, MGI, and teacher survey reports) and summative reports
reporting on project performance measures, as well as the rigorous evaluation. (3) The
evaluation will look at the quality of the magnet curriculum. (4) Using validated survey scales
and items, the evaluation will look at school climate, instructional leadership, magnet theme
implementation, etc. (please see survey descriptions); (5) the evaluators are very experienced.
The CRESST at UCLA has done hundreds of high-quality education studies. The principal
investigator, Dr. Wang, have done well received, high quality research for many years (please
see the description of CRESST and the researchers in the appendix) including studies examining
the efficacy of magnet schools. American Education Solutions (AES) has been doing magnet
evaluation work for over 20 years. AES has performed 61 MSAP evaluations since 1995
working in partnership not only with CRESST but also with the Education Alliance at Brown
University; CRESST and AES are currently evaluating four MSAP projects from the 2016
cohort and six from the 2017 cohort of MSAP grants. (6) the formative and summative
evaluations, as well as the rigorous evaluation, include only those activities that are necessary as
described above. For example, student test scores will be not be analyzed before project year 3 to
PR/Award # S165A200036
Page e133

School District of Lee County 117
ensure that enough time is given to teacher training and program implementation prior to
analysis. (7) the evaluation contractor is training school-based personnel (formative evaluation
teams) to perform formative evaluation activities beginning in project year 3 thereby increasing
the capacity of each school to study its own project implementation as well as provide classroom
teachers with feedback and support. (PD to build this capacity will occur in years 1-4.) The
evaluators have therefore reduced the number of site visits they will make, thereby reducing the
overall cost of the evaluation. Because of these factors, the cost of this evaluation is, we
believe, reasonable.
PR/Award # S165A200036
Page e134

School District of Lee County 118
References
Acar, D., Tertemiz, N., & Tasdemir, A. (2018). The effects of STEM training on the academic
achievement of 4th graders in science and mathematics and their views on STEM training
teachers. International Electronic Journal of Elementary Education, 10(4), pp. 505-513.
doi 10.26822/iejee.2018438141.
Askew, B.J., Fountas, I.C., Lyons, C.A., Pinnell, G.S., & Schmitt, M.C. (1998). Reading
Recovery Review: Understandings Outcomes & Implications. Reading Recovery Council
of North America, Columbus, OH. Retrieved from:
https://files.eric.ed.gov/fulltext/ED434320.pdf
Bifulco, R., Cobb, C. D., & Bell, C. (2009). Can interdistrict choice boost student achievement?
The case of Connecticut’s interdistrict magnet school program. Educational Evaluation
and Policy Analysis, 31(4), 323–345. Retrieved from
http://www.jstor.org/stable/25621589?seq=1#page_scan_tab_contents
Corsello, M., & Sharma, A. (2015). The Building Assets-Reducing Risks Program: Replication
and Expansion of an Effective Strategy to Turn Around Low-Achieving Schools. i3
Development Grant. Retrieved from https://files.eric.ed.gov/fulltext/ED560804.pdf
Huang, D. & Wang, J. (2012). Independent Statewide Evaluation of ASES and 21st CCLC After
School Programs: May 1, 2008-December 31, 2011.
http://www.cde.ca.gov/ls/ba/cp/uclaeval.asp
Huang, D., Wang, J., & the CRESST Team. (2012). Independent Statewide Evaluation of High
School After School Programs: May 1, 2008-December 31, 2011.
http://www.cde.ca.gov/ls/ba/cp/uclaeval.asp
PR/Award # S165A200036
Page e135

School District of Lee County 119
Herman, J. L., Rickles, J., Hansen, M., Thomas, L., Gualpa, A., & Wang, J. (2011). Evaluation
of Green Dot’s Locke Transformation Project: Findings from Cohort 1 and 2 Students.
Los Angeles: University of California, National Center for Research on Evaluation,
Standards, and Student Testing (CRESST).
Herman, J. L., Tobiason, G., & Wang, J. (2020). “What makes your school work?” A qualitative
study of eight magnet schools (CRESST Report 866). University of California, Los
Angeles, National Center for Research on Evaluation, Standards, and Student Testing
(CRESST).
Herman, J. L., Wang, J., Rickles, J., Hsu, V., Monroe, S., Leon, S., & Straubhaar, R. (2012).
Evaluation of Green Dot’s Locke Transformation Project: Findings from Cohort 1 and 2
Students. Los Angeles: University of California, National Center for Research on
Evaluation, Standards, and Student Testing (CRESST).
Hess, F.M., Kelly, A.P., & Meeks, O. (2011). The case for being bold: A new agenda for
business in improving STEM education. Washington, D.C.: Institute for Competitive
Workforce.
Ho, D., Imai, K., King, G., & Stuart, E. (2007). Matching as nonparametric preprocessing for
reducing model dependence in parametric causal inference. Political Analysis, 15, 199–
236.
Huber, M., Lechner, M., & Steinmayr, A. (2012). Radius matching on the propensity score with
bias adjustment: Finite sample behavior, tuning parameters and software implementation.
Paper for Swiss Institute for Empirical Economic Research. Sankt Gallen, Switzerland.
PR/Award # S165A200036
Page e136

School District of Lee County 120
Huber, M., Lechner, M., & Wunsch, C. (2010). How to control for many covariates? Reliable
estimators based on the propensity score. The Institute for the Study of Labor (IZA)
discussion paper 5268. Bonn, Germany.
Kemple, J.J., & Snipes, J.C. (2000). Career Academies: Impacts on Students’ Engagement and
Performance in High School. Retrieved from https://ies.ed.gov/ncee/wwc/Study/78544
Kemple, J. J., & Willner, C. J. (2008). Career Academies long-term impacts on labor market
outcomes, educational attainment, and transitions to adulthood. New York, NY: MDRC.
Ladson-Billings, G. (2009). The Dreamkeepers: Successful Teachers of African American
Children (2nd ed.). San Francisco, CA: Jossey-Bass.
Nelson, A.H. (2018). A Snapshot of Magnet Schools in America. Magnet Schools of America.
www.magnet.edu.
Nugent, G., Barker, B. S., Grandgenett, N., & Adamchuk, V. I. (2010). Impact of Robotics and
Geospatial Technology Interventions on Youth STEM Learning and Attitudes. Teacher
Education Faculty Publications, 33.
Rickles, J., Wang, J., & Herman, J. (2013). Evaluation of Green Dot’s Locke Transformation
Project: Supplemental Report on Cohort 2 Students. National Center for Research on
Evaluation, Standards, and Student Testing (CRESST), UCLA, Technical Report 825.
Sarama, J., Clements, D., Nielsen, N., Blanton, M., Romance, N., Hoover, M., Staudt, C.,
Baroody, A., McWayne, C., and McCulloch, C., (2018). Considerations for STEM
education from PreK through grade 3. Waltham, MA: Education Development Center,
Inc. Retrieved from http://cadrek12.org/resources/considerationsstem-education-prek-
through-grade-3.
PR/Award # S165A200036
Page e137

School District of Lee County 121
Schwartz, R. M. (2005). Literacy learning of at-risk first-grade students in the Reading Recovery
early intervention. Journal of Educational Psychology, 97(2), 257–267. DOI:
10.1037/0022-0663.97.2.257.
Shaw, S., & Bailey, C. (2011). Success in the US: Are Cambridge international assessments
good preparation for university study? Journal of College Admission, pp 7-16.
www.nacacnet.org
Singleton, G.E. & Linton, C. (2006). Courageous Conversations About Race. Thousand Oaks,
CA: Corwin Press.
University of Minnesota Law School, Institute on Metropolitan Opportunity. (2013, December).
Integrated Magnet Schools: Outcomes and Best Practices. Retrieved from University of
Minnesota Law School website:
https://www1.law.umn.edu/uploads/bb/2d/bb2d6851ec82150e69551d095398fb1f/Integrat
ed-Magnets-Best-Practices.pdf.
Wang, J., & Herman, J. (2017). Magnet schools: History, description, and effects. In R. Fox &
N. Buchanan (Eds.), Handbook of School Choice (pp. 158-179). New York, NY: John
Wiley and Sons.
Wang, J., Herman, J., & Dockterman, D. (2018). A research synthesis of magnet school effect on
student outcomes: Beyond descriptive studies. Journal of School Choice. DOI:
10.1080/15582159.2018.1440100
Wang, J., Herman, J., Haubner, J. (2020 in press). Exploring the variation in magnet school
success across 24 magnet schools. Magnet Schools: Public Schools of Choice in a
Changing Education Landscape.
PR/Award # S165A200036
Page e138

School District of Lee County 122
Wang, J., Schweig, J., & Herman, J. (2014). Is there a magnet school effect? Using meta-analysis
to explore variation in magnet school success. CRESST Technical Report 842. Los
Angeles: University of California, National Center for Research on Evaluation,
Standards, and Student Testing (CRESST).
Wang, J., Schweig, J., & Herman, J. (2017). Is there a magnet school effect? A Multisite Study
of MSAP-Funded Magnet Schools. Journal of Education for Students Placed at Risk.
22(2), 1–23.
What Works Clearinghouse. (2018). WWC Intervention Report: Green Dot Public Schools. U.S.
Department of Education. Washington, D.C. Retrieved at:
https://ies.ed.gov/ncee/wwc/Docs/InterventionReports/wwc_greendot_012318.pdf.
Schwartz, R. M. (2005). Literacy learning of at-risk first-grade students in the Reading Recovery
early intervention. Journal of Educational Psychology, 97(2), 257–267.
PR/Award # S165A200036
Page e139

Other Attachment File(s)
* Mandatory Other Attachment Filename:
To add more "Other Attachment" attachments, please use the attachment buttons below.
1236-Other_Attachments_Appendixes.pdf
Add Mandatory Other Attachment Delete Mandatory Other Attachment View Mandatory Other Attachment
Add Optional Other Attachment Delete Optional Other Attachment View Optional Other Attachment
Funding Opportunity Number:ED-GRANTS-031020-001 Received Date:Jun 25, 2020 01:06:52 PM EDTTracking Number:GRANT13152207
PR/Award # S165A200036
Page e140

Other Attachments Table of Contents Page Number(s)
A. Desegregation Plan Information form……………………………………………………….1
B. Voluntary Student Assignment Plan………………………………………………..…….2-33
C. School Board Resolution………………………………………………………..…………..34
D. Enrollment Data Tables
a. Tables 1 and 2…………………………………………...……………………….35-41
b. Table 3……………………………………………………………………………42-47
c. Table 4……………………………………………………………………………48-57
d. Table 5……………………………………………………………………………….58
e. Table 6……………………………………………………...………………………..59
E. Magnet Schools Assistance Program Assurances………………………….………………..60
F. Read 180 Study……………………………………………………………………..…..61-229
G. Resumes or Job Descriptions of Key Personnel
a. Principals’ resumes……………………………………………………………230-234
b. Project Director and other key staff resumes…………….……………………235-248
c. Job Descriptions………………………………...……………………………..249-269
H. Letters of Support
a. District magnet letters of support from U.S. Congressman Francis Rooney, Teachers
Association of Lee County, Foundation for Lee County Public Schools and
others………..…………………………………..............……………………..270-277
b. Businesses and organizations supporting the proposed magnet schools….…...278-286
I. District and School Logic Models……………………………………..………………287-289
PR/Award # S165A200036
Page e141

14
IV. DESEGREGATION PLAN INFORMATION FORMS
Type of Desegregation Plan (Check One & Attach the Appropriate Documents)
A Required Plan: A plan that is (1)implemented pursuant to a final order of a courtof the United States, or a court of any State, orany other state agency or official of competentjurisdiction and (2) the order requires thedesegregation of minority group segregatedchildren or faculty in the elementary andsecondary schools of that agency or thoseagencies.
Attach the Following Documents
A copy of the court or agency order thatdemonstrated that the magnet school(s) forwhich assistance is sought under the grant are apart of the approved plan.
Note: If the applicant is implementing apreviously approved plan that does not includethe magnet school(s) for which assistance isrequested, the plan must be modified to includethe new magnet school(s). The applicant mustobtain approval of the new magnet schools, orany other modification to its desegregation plan,from the court, agency or official that originallyapproved the plan. The date by which proof ofapproval of any desegregation plan modificationmust be submitted to the US Department ofEducation is identified in the closing date notice.
Any required desegregation plan modificationshould be received by June 11, 2020 and shouldbe sent to:
Gillian Cohen‐BoyerU.S. Department of EducationOffice of Elementary and Secondary Education400 Maryland Avenue SWWashington, DC 20202‐5970
X A Voluntary Plan: A plan to reduce,eliminate or prevent minority group isolation that is being implemented (or would be implemented if assistance under the Magnet Schools Assistance Program is made available) on either a voluntary basis or as required under Title VI of the Civil Rights Act of 1964.
Attach the Following Documents
A copy of the plan
A copy of the school board resolutionadopting and implementing the plan, oragreeing to adopt and implement theplan upon the award of assistance.
11
PR/Award # S165A200036
Page e142

THE PLAN FOR STUDENT ENROLLMENT 2020-2021
Student Enrollment PLC | Fall 2019 Approved 11.19.19 Amended – Briefed 12.10.19
The Plan for Student Enrollment informs and guides registering and enrolling students into
The School District of Lee County
2
PR/Award # S165A200036
Page e143

THE PLAN FOR STUDENT ENROLLMENT TABLE OF CONTENTS I. INTRODUCTION .......................................................................................................................... 1 II. STUDENT ENROLLMENT PROCESS ............................................................................................. 1 A. Application and School Selection ......................................................................................... 1 B. Factors Affecting Initial School Enrollment .......................................................................... 2 1. Instructional Capacity ..................................................................................................... 2 2. Sibling Preference ........................................................................................................... 2 3. Proximity Preferences..................................................................................................... 2 4. Zone Attractor Programs ................................................................................................ 3
5. Random Lottery .............................................................................................................. 3 C. Grandfathering ...................................................................................................................... 3 D. Continuation Opportunities .................................................................................................. 4 E. Kindergarten Pre-Registration ............................................................................................... 4 F. Rolling Enrollment .................................................................................................................. 5 G. Florida House Bill 7029 Enrollment and Transfers ................................................................. 5 H. Student Enrollment Office Location, Hours, and Contact Information ................................. 6
III. ENROLLMENT ZONES, SUB-ZONES AND PROGRAMS ............................................................... 6
A. Residential/Choice Zones ..................................................................................................... 6 B. Sub-Zones ............................................................................................................................. 7 C. Distribution ........................................................................................................................... 8 D. Zone Attractor and Advanced Programs .............................................................................. 9
IV. CHANGING SCHOOLS/TRANSFERS AND WAIVERS .................................................................. 10 A. Eligibility Pools .................................................................................................................... 10 B. Transfers ............................................................................................................................. 10 C. Waivers .............................................................................................................................. 10
1. Employee Waiver .......................................................................................................... 11 2. Hardship Waiver ........................................................................................................... 11 3. High School Waiver ....................................................................................................... 11 4. Medical Waiver ............................................................................................................. 11 5. Moving Waiver .............................................................................................................. 11 6. Advanced Programs ...................................................................................................... 12
V. PLAN HISTORICAL BACKGROUND ............................................................................................ 12
A. Brief History of the Lee County Public School Student Assignment Plan ........................... 13 B. Plan Development .............................................................................................................. 16
VI. KEY PLAN COMPONENTS ......................................................................................................... 18
3
PR/Award # S165A200036
Page e144

THE PLAN FOR STUDENT ENROLLMENT VII. PLAN GOALS ............................................................................................................................... 19
A. Student Achievement ......................................................................................................... 19 B. Equity .................................................................................................................................. 19 C. Diversity .............................................................................................................................. 19 D. Growth ................................................................................................................................ 24
VIII. PARENT ENGAGEMENT ............................................................................................................ 25 IX. PROMOTION AND PROGRAM PLACEMENT ............................................................................ 27 X. FALSIFICATION OF INFORMATION .......................................................................................... 27 XI. ANNUAL REPORT TO SCHOOL BOARD ..................................................................................... 28 APPENDIX
A. Student Enrollment Zone Map B. Zone and Sub-Zone School Groupings C. Sister Schools List
4
PR/Award # S165A200036
Page e145

THE PLAN FOR STUDENT ENROLLMENT
1
I. INTRODUCTION
The School District of Lee County Plan for Student Enrollment informs and guides the necessary components of enrolling students into the schools of Lee County. This plan builds on the successes of the past, addresses current needs, and has the flexibility to meet the opportunities and challenges of Lee County’s students in the future. The Plan’s focus on offering parental choice reflects a belief in the educational benefits of providing a variety of options for enhancement in a student’s learning while maintaining the District’s focus on continuous improvement of student achievement. Each student has the opportunity to achieve his/her highest personal potential.
This plan differs from the systems of enrolling students in other Florida school districts as well as those used in most other states. Families enrolling in Lee County Schools for the first time will find that school enrollment is not bound by a boundary drawn around a school. The enrollment concept, developed around zones, provides Lee County families with added choice and flexibility enabling them to find the best fit for their child. Parents have multiple choices for the education of their child and are encouraged to research each school to find the learning environment that best meets the needs of their child. The School District of Lee County is a strong and competitive school system. Each school in The School District of Lee County provides equitable services to meet the needs of the whole child and each school is academically, athletically and programmatically competitive with other school options available within the District and the county, surrounding counties and across the State of Florida. Since its implementation, more than twenty years ago, The Student Enrollment Plan is subject to constant review and refinement.
II. STUDENT ENROLLMENT PROCESS
A. Open Enrollment / School Selection During each school year, the District holds a single formal enrollment period (Open Enrollment) for the
parents and guardians of students entering kindergarten, grade six, and grade nine, also during this period students who are new to the District or students that have changed residential/choice zones or sub-zones submit enrollment applications. Participation in the enrollment process by students at other grade levels is optional, but limited to two schools of enrollment per level (elementary, middle and high). Parents and guardians are encouraged to submit their children’s applications during the specified period to the student enrollment office through the on-line application process, by mail, or in person. Students that have been enrolled in a District school and withdrawn will be enrolled in the same school upon re-enrollment. This is contingent on residential address, level (elementary, middle, high) and SDM remaining unchanged.
Parents may come ANY Day during the advertised Open Enrollment period. Placements are made at the
end of the enrollment period. Enrolling the first day does NOT impact a parent’s guarantee of a particular school. Parents and guardians will be notified of their school after the lottery is run at the end of the enrollment period. At the time of application or at the time a transfer is requested, families are required to rank, in preference order, all of the available schools in their residential/choice zone as well as any available zone attractor programs or multi-zone attractor programs. The District makes every attempt to accommodate parental preferences using the factors established in this policy, as described below.
5
PR/Award # S165A200036
Page e146

THE PLAN FOR STUDENT ENROLLMENT
2
B. Factors Affecting Initial School Enrollment In addition to parental preference, the primary factor relied upon by The Plan, other factors impact the
enrollment of students to schools.
1. Instructional Capacity
Prior to making student enrollments for each school year, the Superintendent (or designee) determines the capacity of each school. The capacity determination for any school will include class size requirements, as required by Florida Constitution and state law. The capacity determination also may include seats set aside for ESE, or other specialized programs.
2. Sibling Preference
Parents may choose to request their younger child(ren) be enrolled in the same school by providing an application with all siblings on the same application. Siblings are defined as children residing at the same address and having the same guardians.
• Parents with siblings currently enrolled in The School District of Lee County will receive written notification prior to the first enrollment period indicating that their siblings are enrolled in the same school for the upcoming school year. There is no need for the parent to complete any paperwork unless there is a request to change the school of enrollment.
• Parents are responsible to ensure siblings connect via parents and address. • Children entering elementary school (kindergarten) desiring to attend the same school as a sibling is
currently enrolled will be granted the request IF the parent completes an application during pre-registration, or during the first application period.
• The District will attempt to give parents with siblings enrolling after the first application period priority in the lottery process; however, if capacity does not exist, the parent will need to decide to accept an enrollment to a different school for the incoming student or to move the siblings together to a different elementary school where capacity exists for their kindergarten child.
• If a student has been “grandfathered” under the provisions of the Student Enrollment Plan the sibling is NOT guaranteed enrollment. *Transportation is NOT guaranteed in “grandfathered” enrollments.
3. Proximity Preferences - Proximity 1, Proximity 2 and Proximity 3
Each Residential/Choice Zone school has a “Safe-Walk Zone” (a two-mile range per Florida Statute) delineated by the District. The size of the Safe-Walk Zone varies according to (1) Residential/Choice Zone boundaries, (2) the reasonable walking distance limit defined by Florida Statute, and (3) safe walking conditions. Students who reside within the Safe-Walk Zone-Proximity preference 1 (P1) and select that school, are given a preference in the student enrollment process over students who live outside the P1 Safe-Walk Zone, subject to higher ranked priorities and capacity. High Schools have only P1 as a proximity preference. This is due to high schools offering specific programs that may attract students from multiple subzones within the zone. Students may choose to have longer travel times on the bus at the high school level to meet their educational needs.
Proximity preference 2 (P2) is implemented for students applying for grades KG through 8. This provides
a second level of proximity preference from the end of the P1 area reaching up to approximately 5 miles.
6
PR/Award # S165A200036
Page e147

THE PLAN FOR STUDENT ENROLLMENT
3
Students residing in this zone will be provided a preference in the lottery for schools that fall within that distance from their permanent residence.
All students applying for grades KG through 8 that live beyond approximately 5 miles from a school will
be provided a Proximity preference 3 (P3) to the school in their enrollment zone that is the closest to their permanent residence of equal weight to P2 in the random lottery.
4. Zone Attractor Programs
Requests for zone attractor programs are processed and enrollments are made in accordance with established policies and practices, subject to the student enrollment lottery, instructional capacity and applicable preferences. A zone attractor program choice is processed first. If a student is enrolled to a zone attractor program school, his or her application for zone schools will not be processed. Students not receiving an enrollment to the requested zone attractor program school will have their name placed in the eligibility pool for possible transfer to their first-choice zone attractor program school. Zone attractor programs are subject to revisions.
5. Random Lottery
A lottery process is used in situations in which the number of applicants for a school exceeds the available seats. Student applications are provided random numbers to determine the order in which their applications will be considered in the student enrollment process. If more students apply to a residential/choice school than there are seats available, enrollments are made to fill the capacity of the school according to the following preferences:
• Zone attractor programs (unique curriculum program(s) specific to a school/zone) • ESE and special programs • Sibling preference • Proximity 1 (P1) • Sibling guarantee • Proximity 2 (P2) and Proximity 3 (P3) • Serious illness or death of custodial parent • Dependent child of active duty military personnel whose move is a result of military orders • Relocated due to foster care placement in a different school zone • A move due to court-ordered change in custody • Random lottery number
C. Grandfathering
Under The Plan, students have the option to continue in their current schools until they complete the highest grade offered at that school. Younger siblings at the school with older sibling will be required to move to a school within their residential sub-zone when older sibling completes highest grade offered. Such “grandfathering” includes students at zone attractor programs. Siblings of students enrolled at schools transitioning from one zone to another, from one sub-zone to another are not permitted to enroll at schools that are not in their Residential/Choice Zones. Transportation is NOT guaranteed under the “grandfathering” enrollment option.
7
PR/Award # S165A200036
Page e148

THE PLAN FOR STUDENT ENROLLMENT
4
D. Continuation Opportunities
Once a student has been enrolled to a school, he or she may remain at that school until he or she completes the highest grade offered by that school. Exceptions are referenced in section II,C; Grandfathering. Students who move from one Residential/Choice Zone to another within the District are treated as a student new to the District and are required to choose from among the schools in their new Residential/Choice Zone in accordance with the student enrollment process outlined in The Plan. Students who move to a different Residential/Choice Zone after enrollment is complete have the option to request to remain in their school of enrollment for the remainder of the academic school year. Parents or guardians apply for and receive a moving waiver for temporary (current school year) continuation of enrollment as described herein. Transportation for such students is provided only if transportation routes exist and seats are available on the bus. Moving waivers may be revoked due to discipline matters, attendance/tardiness and academic issues.
A change of residence within a Residential/Choice Zone has no impact on student enrollment; however, the parent or guardian must provide notification of the residential address change at the school where the student is enrolled so that student transportation may be arranged. Students who move from one sub-zone to another within a Residential/Choice Zone may remain in their current school of enrollment to the highest grade available. If they move to a sub-zone in which they would otherwise be ineligible to attend their current school, the District only provides transportation if routes exist and seats are available on the bus.
E. Kindergarten Pre-Registration
Student Enrollment offers Kindergarten Pre-registration in the fall for the upcoming school year. This allows parents to pre-register their child for kindergarten. For the upcoming school year, child must be 5 years old on or before September 1 2020 to be enrolled. Pre-registering allows parents to avoid lengthy wait times at the Student Enrollment Office during the Open Enrollment application period which runs mid-January through February. Parents that pre-register will receive a preprinted application mailed in January and may go online to rank order schools in order of preference during the open enrollment. Parents are required to provide the following documents:
Physical exam Florida certificate of immunization Original birth certificate Proof of address Social security card (if available) Custody documents (if applicable)
Parents will also receive information about the District of Lee County’s kindergarten screener and suggestions to assist their child with Language and Math development. Guidance will be provided on the steps for a smooth transition into school. Additionally, parents will be provided information on making connections to their school. The School District wants to ensure that families are involved in their child’s learning. This early interaction helps children to be more successful in school.
F. Rolling Enrollment
8
PR/Award # S165A200036
Page e149

THE PLAN FOR STUDENT ENROLLMENT
5
Enrollments are processed on a first-come, first-serve basis after the Open Enrollment application period in order to enroll students to schools as quickly as possible. The District enrolls these students to schools on the day their initial application is completed.
G. Florida House Bill 7029 Enrollment and Transfers
In addition to the opportunities for school enrollment addressed in other provisions of this plan, students residing in other school districts in the state of Florida, who are not subject to suspension or expulsion, may exercise their right under Florida House Bill 7029, to seek enrollment to a school in the Lee County School District which has not reached capacity. Such school enrollments shall be made according to the following process. Other provisions of The Plan do not apply to enrollment under this section unless specifically stated.
1. Applications will be accepted during a two-week period beginning four weeks prior to the start of the following school year. A lottery will be conducted at the end of the two weeks to determine available capacity based on the following lottery preferences (b through e carry the same weight):
a. Serious illness or death of custodial Parent b. Dependent child of an active duty military personnel whose move is a result of military orders c. Relocated due to foster care placement in a different school zone d. A move due to court-ordered change in custody
2. Capacity – School capacity for purposes of Florida House Bill 7029 under this section is defined as 90% of
program capacity to meet growth in five years based on projections. The capacity of each school in the District and a separate listing of schools that have not reached capacity is maintained on the District website. If the District website shows capacity is available at a school in which the student is seeking to enroll, the parent must contact the student enrollment office to determine whether the available seat(s) are of the grade and service delivery model appropriate to serve the student. School enrollment of students pursuant to this provision is based on the availability of a seat appropriate to meet the student’s educational needs. If the student’s needs change such that the seat is no longer appropriate to serve the student, the parent must return to the Student Enrollment office to determine if an appropriate seat is available. If there is no seat available in the school that is appropriate to serve the student, the student will be required to return to the district of residence to seek enrollment at a school with services needed to serve the student appropriately.
3. Grandfathering – Students will be grandfathered to the highest level of school enrolled.
4. Transportation – Transportation is not provided to students enrolled to a district school under this section.
5. Limitations – School transfer under this provision is not permitted.
6. Preferences – The preferences addressed in section II.B. of The Student Enrollment Plan, including proximity
and sibling preferences do not apply to students residing outside of the Lee County School District enrolled or transferred under this section. Only the preferences listed in Section III.C.1. apply to such students.
7. Revocation – The enrollment or transfer of a student to a Lee County District school under this section shall be revoked: 1) immediately, if the student receives an expulsion or out of school suspension, and 2) at the
9
PR/Award # S165A200036
Page e150

THE PLAN FOR STUDENT ENROLLMENT
6
semester break, if the student’s attendance is insufficient to meet educational needs as determined in the sole judgment of the school principal.
8. Eligibility Pools – Eligibility pools are not open to students seeking enrollment under this section.
9. Waivers – School enrollment waivers addressed in section III.C. of The Plan are not available to students seeking enrollment or transfer under this section.
*NOTE: The term “Enrollment House Bill 7029” will be placed on the student enrollment application.
H. Student Enrollment Office Location, Hours, and Contact Information
The District Student Enrollment Office is located in the Lee County Public Education Center at 2855 Colonial Blvd., in Fort Myers. Parents and guardians may email questions to [email protected], visit the District website www.leeschools.net, or visit the Student Enrollment Office.
Public office hours: Monday-Friday, 9:00 AM – 4:00 PM.
Student Enrollment Office - Located in The Lee County Public Education Center 2855 Colonial Blvd. Fort Myers, FL 33966 [email protected]
III. ENROLLMENT RESIDENTIAL/CHOICE ZONES, SUB-ZONES AND PROGRAMS
As explained more fully below, The Plan divides the District into three Residential/Choice Zones and each
of these three zones is further divided into three sub-zones. This makes a total of nine areas, excluding the three barrier islands. Because of the strong community concern about equity, the District established funding priorities for capital improvement projects to maintain equivalency of facilities among the Residential/Choice Zones and sub-zones, as well as, to maintain adequate capacity for students residing within each zone and sub-zone.
A. Residential/Choice Zones
In order to provide all parents and guardians with a significant number of school options closer to their homes and to allow for diverse school enrollments, The Plan divides the District into three large, contiguous, geographic regions or residential/choice zones.
The West Zone is generally the portion of Lee County located west and north of the Caloosahatchee River.
The East Zone is generally east of Interstate 75 and north of Martin Luther King Boulevard. The South Zone is generally south of Martin Luther King Boulevard and the Caloosahatchee River. The boundaries of the Residential/Choice Zones are shown in the maps in Appendix A.
10
PR/Award # S165A200036
Page e151

THE PLAN FOR STUDENT ENROLLMENT
7
Existing and planned transportation networks, topographical constraints, available school capacity at each level, and student demographic characteristics were considered in developing the Residential/Choice Zone boundaries. Community cohesiveness and the proximity of schools to concentrated student populations also were considerations in the formation of the zones. The zone boundaries maximize the availability of nearby schools for all families in the District and minimize the need for cross-zone and cross-county transportation networks.
As in the former school choice plan, schools located on the barrier islands (e.g., Sanibel Island, Pine Island and Estero Island) are not considered as part of any residential/choice zone, and students residing in the attendance areas for these schools do not participate in the student enrollment process for as long as they are at an appropriate grade level to attend those schools. This is because the geographic isolation of these areas precludes offering efficient transportation to or from these locations. Students on the barrier islands, however, may apply for zone attractor program schools under the procedures discussed below. Students residing in the geographic boundary of schools on these barrier islands are enrolled to their respective schools if their grade level and Exceptional Student Education (“ESE”) Service Delivery Model (SDM) (if any) can be accommodated. Students in these areas will continue to be accommodated in English Language Learner (“ELL”) and ESE programs for which they qualify and/or for which they are recommended according to the ELL Plan and Individualized Education Plan (“IEP”) processes.
B. Sub-ZonesIn response to the desire of Lee County residents for increased opportunities to attend schools closer to
their homes and to help the District manage transportation more effectively, The Plan relies on sub-zones within each of the three Residential/Choice Zones. This increased the opportunity for students to attend schools closer to their homes and helped to reduce transportation costs.
Each of the three zones is divided into three sub-zones. Under the school selection procedures discussed further in this plan, parents or guardians select from among the schools in the sub-zone in which he or she resides and in any contiguous sub-zone within the same zone. In the event all schools at the student’s level in the student’s sub-zone and contiguous sub-zone are over capacity, the Superintendent (or his designee) may authorize enrollments to a noncontiguous sub-zone within the zone.
A map of each zone including the sub-zones is attached as Appendix B. The sub-zones labeled W-4, S-4 and S-5 are included on the map to identify the geographic boundaries associated with the three-barrier island schools identified above.
The sub-zones were drawn relying on the same types of factors used in drawing the zones, and their purpose is similar. A primary factor in grouping of schools in sub-zones was matching grade level capacities for students rising from elementary to middle and from middle to high school.
The Plan provides for the District to continue providing the highest quality educational programs possible. To that end, a rigorous, standardized, and educationally equivalent curriculum is provided in each school, and serves as the core educational program for Lee County students. The core educational program is designed to provide all students with the content and skills necessary to successfully pursue post-secondary education or to enter the workforce upon completion of their secondary education.
11
PR/Award # S165A200036
Page e152

THE PLAN FOR STUDENT ENROLLMENT
8
In addition to the core educational program, advanced educational programs offer students to enroll to meet their academic needs. Such programs also promote diverse school enrollments and prevent isolation. Advanced programs build upon the core educational program and offer additional courses that focus on the talents, interests, and skills of the students. These advanced programs may be located in a variety of schools at all levels. As mentioned in Section VII, in order to ensure educational equity, to accommodate increasing enrollment, to satisfy parental demand and to promote diverse school enrollments, The Plan provides for the District to consistently monitor and reevaluate the placement of all educational programs. Because of the dynamic growth in the District and the inevitable changes in a student enrollment system based upon parental choice, the District continues to review and monitor the extent to which the placement of educational programs serves or impedes its goals.
C. Distribution
The school groupings for each of the three zones and for the nine sub-zones are shown in the table in Appendix B. The zone attractor program schools are also are identified.
The Plan provides for the District to offer an educationally equivalent range of programs, curriculum, and
instruction in each zone and sub-zone. In general, both ESE and ELL programs, for example, are placed equitably throughout each zone and placed in reasonable proximity to the students they serve. Moreover, other specialized programs, such as zone and multi-zone attractor programs, are replicated in each zone to the extent practicable and otherwise located so that they provide all Lee County students with equitable educational opportunities.
As a result of the strong community concern about equity, the District established funding priorities for capital improvement projects to maintain equivalency of facilities among the Residential/Choice Zones and sub-zones, as well as, maintain adequate capacity for the students residing within each zone and sub-zone.
D. Advanced Programs and Zone Attractor Programs
The Plan provides for the District to offer advanced educational programs in the Arts, International Baccalaureate, FGCU Associate’s Degree Program and the AICE/Cambridge Program. These advanced programs continue to have admissions or eligibility criteria. Parents and guardians of students applying to advanced programs must comply with the application procedures of this Plan, and students must meet the application requirements for the selected program.
Advanced Programs available for high school students include the Florida Gulf Coast University (FGCU)
Associate Degree Program at Bonita Springs High and Gateway High; the International Baccalaureate Programs at Cape Coral High, Dunbar High, Fort Myers High, and Riverdale High; the AICE/Cambridge Programs at East Lee County High, Estero High, Lehigh Senior High, and North Fort Myers High and the Arts programs at Cypress Lake High, Lehigh Senior High, and North Fort Myers High.
Middle schools also offer advanced programs in the area of Arts at the school sites of Bonita Springs Middle,
Cypress Lake Middle, North Fort Myers Academy, Harns Marsh Middle, Oak Hammock Middle and Veterans Park Academy.
Parents and guardians of students residing in Lee County must submit an enrollment application for these
advanced high school and middle school programs during the designated annual open enrollment period mid-January until February. Only “new” students to the District are permitted to apply and enroll in a special high school or middle school program after the open application period has ended. By definition, a “new” student to the District
12
PR/Award # S165A200036
Page e153

THE PLAN FOR STUDENT ENROLLMENT
9
is one that moves to Lee County from another Florida county, from outside of the State of Florida, or from outside of the country. Students enrolling from another zone or subzone within the District are not considered “new” students. Additionally, students enrolling from a private school, virtual program, charter school or homeschooled in Lee County are not considered “new” students for purposes of The Plan. High schools and Middle schools also offer career academies that students and parents are encouraged to review. In a limited number of sub-zones the District offers attractor schools offering a specific program that the parent may select.
Under The Plan, the District replicates and expands educational programs by following a district process to ensure that all programs meet the same high standards of quality and instructional value. Current information is available on the District website www.leeschools.net.
IV. CHANGING SCHOOLS/TRANSFERS & WAIVERS
A. Eligibility Pools
Every effort is made to accommodate the choices of parents or guardians within the parameter of school capacity and preferences discussed above. Enrollments are made in accordance with this system until all students are enrolled or until no seats remain at the school and grade level.
If an elementary student (not including ESE, or limited option zones) cannot be accommodated at his or
her first, second, third choice school, the student’s name automatically is placed in an eligibility pool for possible transfer to their first-choice school when seats in the grade needed become available. Regardless of the student’s choices, a student may enter the eligibility pool for only one zone school and only one zone attractor program school.
Vacancies are filled by applicants in the eligibility pool in accordance with the factors affecting school
Enrollments described in The Plan. Students in the eligibility pool who decline an available seat will have their name removed from the eligibility pool and the seat will be offered to another student.
Students who accept an available seat in an attractor program school are removed from any other eligibility
pool. This process continues for the upcoming school year until the last day of July.
B. Transfers 1. In-zone Transfers
Parents or guardians may request one transfer for their child to attend another school in their Residential/Choice Zone one time during each of the three levels (elementary, middle and high) by reapplying through the student enrollment application process. Such transfers are subject to the same factors affecting initial school enrollments. The parent or guardian must make any request for transfer at the Student Enrollment office, indicating their ordered preference of the schools in the Residential/Choice Zone for which they are eligible. A student’s last opportunity for the one transfer is at the end of the first semester of his or her eleventh (11th) grade year. Absent
13
PR/Award # S165A200036
Page e154

THE PLAN FOR STUDENT ENROLLMENT
10
extenuating circumstances, only one such transfer is permitted during these levels. The District is focused on stabilization, continuity and each student’s academic success. The District has one scheduled opportunity for students in grades KG through 11 to apply for a transfer. Applications will be available in mid-November for a second semester transfer. Approval is dependent on seat availability. C. Waiver
There are seven recognized grounds for waivers allowing permanent enrollments that are not subject to the enrollment factors of The Plan:
• Employee Waiver • Hardship Waiver • High School Waiver • Medical Waiver • Moving Waiver • Advanced Program Exit Waiver • Career Academy Waiver
Additional waivers may be added to support student needs and the need to track student mobility.
Parents must provide their own transportation if a waiver is approved unless transportation is already set up and there are seats available on the bus.
1. Employee Waiver In-County / Out-County An employee may request a waiver when he or she works at a school on a full-time basis, as defined by the
employment contract, and wants his/her child to attend the school the employee is staffed or the sister school to that location*. Waiver requests may be approved based upon capacity and impact on class size at the time the waiver is submitted. An employee waiver may be renewed annually for as long as the employee maintains full-time employment at that school. * Appendix B Zone and Sub-Zones and Appendix C Sister Schools
2. Hardship Waiver A waiver may be granted when extenuating circumstances, which can be documented, exist for a family and
those circumstances necessitate the placement of a student at a different school than the school enrolled. An older sibling requesting a transfer to younger sibling’s school of enrollment is not considered a hardship. If the hardship waiver is denied the first time it is submitted (level1), the parent or guardian has the right to request a second review (level 2). A waiver denied a second time may have a third and final review (level 3). The deadline for submitting a hardship waiver for the upcoming school year is July 31st. A committee composed of three-to-five community members selected by the Superintendent from advisory committees, or community members will conduct the third review. The committee is known as the Student Enrollment Community Committee. No District staff serve on this Student Enrollment Community Committee. Parents and guardians are encouraged to provide additional documentation to support their hardship as they move to a higher level in the review process. All decisions by the Student Enrollment Community Committee is reviewed and approved by the Superintendent or his/her designee. The deadline for submitting a hardship waiver is July 31st, unless an extenuating circumstance exists.
14
PR/Award # S165A200036
Page e155

THE PLAN FOR STUDENT ENROLLMENT
11
3. High School Waiver
A student who has been in attendance at a high school for four consecutive semesters and moves to a different zone may request a waiver. He/she is eligible for a High School waiver in order to stay at that school until graduation.
4. Medical Waiver A parent may submit a Medical Waiver Application when extenuating medical circumstances exist for the
student. A letter from parent along with documentation from physician must accompany request. Documentation should include medical condition, date of diagnosis, severity of condition, frequency of condition, hospitalizations, medication required, additional information or procedure to be performed.
5. Moving Waiver
In the interest of promoting student enrollment stability, the District may approve a temporary student enrollment moving waiver. Such a waiver shall expire at the end of the academic year in which it is requested.
Students who move to a different choice zone in the District following enrollment may remain in their school of enrollment for the remainder of the academic school year if their parents or guardians apply for and receive a waiver for temporary continuation of enrollment. The parents or guardians must apply for permanent school enrollment in the new zone under the school selection and student enrollment process during the next appropriate registration period.
The District may also grant a waiver in the form of a temporary reenrollment to a school in another Choice
Zone if it can be assured, to the satisfaction of the Executive Director/Director of Student Enrollment, that the student’s residence will change to the new zone in the first semester of the academic year and that it is in the best interest of the child to begin and complete the school year in the new zone of residence.
Parents or guardians shall apply for change of residence waivers at the Student Enrollment Office.
Transportation for students under either of these waivers may be provided if transportation routes exist and if seats are available on the bus.
6. Advanced Program Exit Waiver
Advanced program exit waivers may also be granted for those students who have not remained in the IB, AICE/Cambridge, Center for the Arts or FGCU Associate’s programs for four consecutive semesters and want to leave the program but remain at the same school of enrollment. School Principal and Coordinator of Program will review waiver and approve prior to submittal to the Student Enrollment Department.
7. Career Academy Waiver
Career Academy waivers may be granted for those students requesting enrollment in a school with a particular academy of interest. Request will be received by The Student Enrollment Department and reviewed by the Career and Technical Education (CTE) Department.
V. HISTORY
15
PR/Award # S165A200036
Page e156

THE PLAN FOR STUDENT ENROLLMENT
12
In a 1964 lawsuit, a Federal District court found that the District was operating an unconstitutionally racially segregated school system in which students and faculty were assigned on the basis of race and access to parts of the school curriculum was limited on the basis of race. The court ordered the District to desegregate. Over the next 35 years, the District, under the supervision of the court, made numerous more and less successful efforts to move towards becoming a unitary school system.
In 1997, the District adopted a controlled choice plan that subsequently allowed it to become unitary in the area of student assignment. In 1999, the District entered into a settlement agreement with the plaintiffs in the desegregation case. The court approved the settlement and released the District from its jurisdiction.
As part of the settlement agreement, the District agreed to complete the implementation of the School Choice Plan over a five-year period. The School Choice Plan was designed to foster school improvement and to provide diverse enrollments in the District. As a result of implementing the School Choice Plan, the District accomplished both of these goals.
Following years of court supervision and almost two years of extensive community input and discussion during 2003 and 2004, the School District of Lee County (the “District”) developed The Plan for Student Enrollment (“The Plan”). The Board approved the Plan on February 24, 2004 and implemented in the 2005-2006 school year. The Plan has undergone fifteen annual reviews for possible changes, revisions and improvements. The provisions of this plan apply to school enrollments made for the 2020-2021 school year and each school year thereafter until The Plan for Student Enrollment is revised.
The Plan builds on the successes of the past, addresses the needs of the present, and is flexible enough to meet the challenges of the future. The Plan’s focus on providing parental choice, reflects a longstanding belief in the educational benefits of diversity, and facilitates the District’s continuous improvement of student achievement. The Plan is flexible and subject to constant review and refinement throughout its implementation.
Prior to its adoption in 2004, the District sought extensive community input. In response to interest from approximately 2,100 Lee County stakeholders, The Plan was designed to give all parents and guardians in Lee County, the opportunity to make selections from a wide range of schools offering appropriate educational program options for their children. In addition, The Plan was designed to provide greater opportunities for students to attend schools closer to home, decrease ride time for students and reduce transportation costs. The Plan was also developed to promote stability of Enrollments for students and encourage a healthy competition among schools striving for academic excellence. Under The Plan, students continue to be enrolled to schools within the parameters of physical space, popular Enrollment preferences, such as sibling and proximity preferences and, unless students move, they are allowed to remain in the school to which they are enrolled until they finish the highest grade level in that school. Such stability continues to promote higher levels of student achievement in the District.
A. Brief History of the Lee County Public Schools Student Assignment Plan
1964 Lawsuit - Rosalind Blalock vs. Lee County Schools. District found operating an unconstitutionally racially segregated school system.
1970 Beginning of Court Ordered Desegregation in the Lee County Public Schools utilizing Boundary System.
1970-1995 Issues during this time period included frequent changes in Boundaries, lengthy bus rides for minority students, and inability to achieve unitary status under the existing system.
16
PR/Award # S165A200036
Page e157

THE PLAN FOR STUDENT ENROLLMENT
13
1995 Adopted the policy of school choice in order to achieve unitary status utilizing a Unitary School System Advisory Committee (USSAC). Included a combination of boundary changes and magnet programs pending implementation of managed choice within three years.
1996 Controlled Choice Plan adopted for implementation in the 1998-1999 school year.
1997 School District makes last boundary changes for the 1997-1998 school year.
1998-1999 School Choice implemented with three attendance zones. Magnet programs served all three attendance zones.
1999 Unitary Status achieved.
1999-2004 Federal monitoring for full compliance of Unitary Status based upon School Choice plan.
2002-2004 Planning time frame for reconsideration of the student assignment options.
2004
The current plan for Student Assignment was approved by the School Board. The Plan was modified for zones and subzones, replication of programs for equal and more convenient access, and elimination of race as criteria for student assignment. Implementation began in 2005-2006 school year.
2005-2006 Plan updates for the 2006-2007 school year provided for the possibility of waiving the non-contiguous sub-zone assignment principle under certain circumstances and implemented the sub-zone preference as an additional assignment factor. Other updates included modification of the mix of educational facilities and opportunities in each zone through the addition of new schools and modification of sub-zone program availabilities.
2006-2007 Plan updates for the 2007-2008 school year included a clarification of the qualifications for assignment waivers and modified the mix of educational facilities and opportunities in each zone through the addition of new schools.
2007-2008 Plan updates for the 2008-2009 school year included a change in language to improve clarity and understandability, the term “attractor” has been changed to “magnet.” A reference to racial and ethnic guidelines and racial isolation as assignment criteria was removed or modified to reflect the broader perspective of diversity addressed in The Plan. The term Parent Information Center (PIC) was replaced with “student assignment office” and language reinforcing on-line application completion was added. Additional language was added to include constitutional class size limits in the determination of school instructional capacity and to enhance identification of goals around the diversity factors of race and ethnicity, English language learners (ELL), socio-economic status, achievement level, and Exceptional Student Education needs. In-zone transfers were further restricted and precluded in the final quarter of each school year as opposed to the final 20 days. A reference to parental designation of children’s race was removed from Section IX. FALSIFICATION OF INFORMATION since it was irrelevant.
17
PR/Award # S165A200036
Page e158

THE PLAN FOR STUDENT ENROLLMENT
14
2008-2009 Plan updates for the 2009-2010 school year included additional language to strengthen and clarify the distinction between sibling guarantee and sibling preference. The sub-zone preference implemented in 2006-2007 was eliminated to allow students without preferences reasonable opportunities to attend more Lee District schools. The maintenance and proactive processing of eligibility pools was shortened from twenty to fifteen days after the school year begins. Employee waivers were restricted based upon capacity and impact on class size at the time the waiver was requested. Dunbar High School was redefined as an East Zone school with multi-zone magnet seats available for South Zone students. South Zone students living in proximity to Dunbar High School were to receive an assignment preference to magnet seats over non-proximity students living in the South Zone. The geographic sub-zone boundary between E-1 and E-2 was adjusted to incorporate the area lying south of the Caloosahatchee River, east of I-75 and north of Hwy 82 into the E-2 sub-zone. This redefined Manatee Elementary and Oak Hammock Middle schools as E-2 schools, available to students in the entire zone. Lee Middle School was removed as an option in the East Zone.
2009-2010 No recommended changes to Plan for the 2010-2011 school year. 2010-2011 No recommended changes to Plan for the 2011-2012 school year. 2011-2012 Plan updates for the 2012-2013 school year included language to accommodate an
application preference for middle school students applying to specific high schools (if an when middle school career academies are implemented), language clarifying that similar magnet application preferences end when schools are no longer considered magnets, a second proximity zone preference for elementary and middle school students residing between approximately 2 and 5 miles from each school, and committing the District to study the potential for adding an additional assignment preference based upon parent involvement.
2012-2013 Plan updates for the 2013-2014 school year included adding the high school Cambridge Academy Program (AICE) as a choice magnet requiring specific entrance criteria and committing the District to study the potential for adding an additional assignment preference based upon parent involvement.
2013-2014 Plan updates for the 2014-2015 school year included clearly defining the various types of waivers, documenting waiver qualification information, and updating the waiver review/approval process. Updates also included the establishment of systematic enrollment deadlines for special high school programs to occur prior to the batch lottery process and a move to a longer, single formal school choice application period followed by a single batch lottery assignment process.
2014-2015 Plan updates for the 2015-2016 school year include providing students applying for grades KG through 8 who reside beyond 5 miles from any school with a proximity preference to the school located closest to their home, establishing Dunbar High School as a choice school for all East subzone 3 (E3) resident students, and restricting in-zone transfers for all high school students to the end of the first semester.
18
PR/Award # S165A200036
Page e159

THE PLAN FOR STUDENT ENROLLMENT
15
2015-2016 Plan updates for the 2016-2017 include a restructuring of the content of the plan as well as the addition of relevant information to make the document easier to read and comprehend and updated to reflect the change of James Stephens (K-8) to James Stephens (K-5).
2016-2017 Plan updates for the 2017-2018 were made to include school program updates removing STEM from Tortuga Elementary, adding Cambridge to East Lee County High, changing final opportunity to transfer to end of first semester GR 11th (junior year). Seniors are not transferred. Updates also included Piloted programs, addition of relevant information and changes due to House Bill 7029-Florida Open Enrollment Law.
2017-2018 Plan updates for the 2018-2019 were made to include middle school arts programs to become part of the Plan with the same eligibility criteria as high school. Update also includes a revision to the sibling preference allowing an incoming student with a sibling currently assigned at a school of the same level, a greater preference than multiple siblings applying together with no sibling currently attending.
2018 Plan update for second semester transfer process was approved to include middle schools as well as high schools for 2018-19.
2019-2020 Plan updates for 2019-2020 include: • Reordering the text of The Plan, putting emphasis on the process of enrollment of
students into The School District of Lee County while maintaining the document’s intent and history
• Changing the name “student assignment” to the Student Enrollment to accurately align with the work and responsibility of the department
• Elementary student’s name automatically is placed in an eligibility pool if first, second or third choice is not accommodated
• Adding Kindergarten Pre-Registration • Consolidating In-County and Out-County Employee Waivers • Reducing Eligibility Pool to 10 days
19
PR/Award # S165A200036
Page e160

THE PLAN FOR STUDENT ENROLLMENT
16
2020-2021 Plan updates for 2020-2021 include: • Addition of a Medical Waiver and medical waiver code (92). • Addition of an Advanced Program Exit Waiver and Advanced Program Exit waiver
code (94). • Sibling defined as younger sibling enrolled at school location with an older sibling.
Sibling enrollment does not apply to an older sibling requesting enrollment with a younger sibling.
• Addition of July 31st as End Date to submit Hardship Waiver for the upcoming school year.
• Align End Date for Eligibility Pool (waitlist) with end date for hardship waivers, July 31st.
• Align Elementary School in-zone transfer requests with 2nd semester transfer request process implemented for Middle School and High School students.
• Enroll students returning to SDLC into the student’s previous school of enrollment. (Level [elementary, middle, high], residential sub-zone options and SDM unchanged.)
• Change of enrollment to different school during elementary, middle and high years is limited to one change of school per level.
• Gateway High School added in East Zone. • Revision and elimination of zone magnet/attractor programs. (Specifics are
indicated on Student Enrollment applications). • First steps implemented to transition toward proximity.
B. Plan Development History As the requirement, under the desegregation settlement agreement, to implement the former School
Choice Plan drew to an end, the School Board adopted Policy establishing a Student Assignment Task Force (the “Task Force”) to review information and develop options for the District with respect to adoption of a student assignment plan to be implemented after expiration of the settlement agreement. The Task Force, which was composed of a diverse group of members from the Lee County community, worked during the 2002-03 school year and the fall of 2003, studying the former School Choice Plan and numerous student assignment plans from other school districts and developing five options for the District’s consideration. Each of the five different options presented to the School Board, the Unitary School System Advisory Committee (the “USSAC”), and the public supported continuing in some form a student assignment system premised on parental choice.
The USSAC reviewed the five options developed by the Task Force and provided input regarding each of the options. The USSAC -- which was established to monitor and advise the District with respect to its efforts to operate a unitary, non-discriminatory school system -- also favored a system based on parental choice and emphasized the importance of maintaining diverse school enrollments that ensured equity.
In order to give everyone in the community the opportunity to provide additional input concerning the new student assignment plan for the District, “community conversations” were held at four different locations throughout Lee County. At each meeting, listening devices were available in Spanish and Creole in order to ensure that parents and guardians who do not speak English as their native language could fully participate. All Board members and the Superintendent attended these forums. During each session, the Superintendent shared information about the history of student assignment in Lee County. In addition, the five options proposed by the Task Force were distributed and their major characteristics were discussed. Those present, were encouraged to add any additional factors that they felt were important to a student assignment plan. People in attendance were then asked to indicate the level of importance of each characteristic.
20
PR/Award # S165A200036
Page e161

THE PLAN FOR STUDENT ENROLLMENT
17
The “community conversations” were recapped during School Talk, a one-hour program on the District’s television channel. Viewers were encouraged to call in and ask questions or make comments about the various issues raised at the community conversations.
For citizens who could not attend the community conversations or participate through the School Talk program, the District provided other ways in which community members could share their views. For example, a multilingual voice server was provided through the help of the Strategic Listening Institute, any concerned citizens could call at any time and respond to the same set of questions asked at the community conversations. An e-mail address also was established for community members to access the set of questions discussed during the community conversations. In addition, teams of District staff manned information booths at public locations where high concentrations of people could be found. At each such location, phones were provided so that community members could answer the same set of questions posed during the community conversations. If people did not have the time to complete the phone questionnaire on the spot, they received cards with the phone number and e-mail address where these questions could be accessed at their convenience.
During the week of December 1, 2003, District staff gathered and analyzed the information obtained from the community in order to share the data with the Superintendent, the School Board, School and District personnel, and the community at large. At that point, more than 1,600 Lee County residents had participated in the process and provided their input. The Board received a preliminary presentation of this information at a workshop on December 11, 2003. In addition, the results of the District’s community-input process were posted on the District website in December 2003.
On January 15, 2004, the School Board conducted a second workshop to review, analyze, and interpret the information gathered through this extensive process. At this workshop, the Board discussed all of the information gathered to date, including the work of the Task Force and the USSAC, the community input and the analysis by the Superintendent and his staff.
Based on the data compiled in December 2003, and updated in mid-January of 2004, the feedback from the community echoed many of the issues and concerns raised by the Task Force and the USSAC. For example:
• Most of those surveyed were not satisfied with the old boundary process and wanted a system in which parents and guardians have some choices in picking the schools their children attend;
• Many of those surveyed favored choice, but were less than fully satisfied with the current School Choice Plan;
• Many suggested that the opportunity to attend a school closer to home and a reduction in ride time were very important;
• A majority of those surveyed expressed strong belief in the importance of academic excellence and educational equity;
• A majority indicated that diversity is important in schools; • Many wanted the opportunity for siblings to attend the same school; • Many wanted their children to be “grandfathered” into their current school as the new Plan is implemented; • Most of those who provided feedback considered safe schools to be critical; and • A number of individuals believed that successful and popular programs should be replicated in each zone.
VIII. KEY PLAN COMPONENTS
Based on extensive community input from the Student Advisory Committee, Equity & Diversity Advisory
Committee (EDAC), District Advisory Committee (DAC), Community Forum at Dunbar Community School, Academic
21
PR/Award # S165A200036
Page e162

THE PLAN FOR STUDENT ENROLLMENT
18
Cabinet and School Administrators and the Student Enrollment Professional Learning Community (PLC), The Plan for Student Enrollment builds on the success of the former School Choice Plan in facilitating educational improvement, satisfying the parental demand for choice, promoting diverse school enrollments, and managing growth equitably. The Plan also refines and enhances a number of important elements from previous plans.
Residential/Choice Zones
• Provides opportunity for parents to send their child to a school close to home • Allows parents to determine the ride time for the child
Programs
• Promotion of programs • Continuation of educational equity is schools • Maintaining the diversity for the District • Promotes student achievement through rigorous curriculum • Replicating of content to meet student needs
The Plan also is flexible by design to address the dynamic circumstances in which the District finds itself
today. The District’s enrollment continues to grow and become more diverse. The District faces the on-going challenge of increased educational demands and limited resources. In this context, Lee County families continue to desire both a variety of school preferences and the opportunity to attend a school closer to home. The Plan, as discussed in detail below, will help the District to meet these complex challenges.
IX. PLAN GOALS
What emerged from the process in 2003 and 2004 was a broad consensus around four overarching goals
for the District and its new student assignment plan. These goals were improving student achievement, ensuring educational equity, promoting the educational benefits of diversity, and managing growth effectively. The District remains committed to these important goals.
A. Student Achievement
Responding to the primary concern of Lee County residents, The Plan is designed to continue to improve student achievement by fostering a healthy competition among schools and by providing stability for students. It promotes the effectiveness of the District by ensuring that all schools serve students with varied achievement levels. The Plan attempts to equally distribute students to ensure that there are not higher concentrations of lower-achieving students in a particular school. All schools continue to maintain high expectations for all students, demand excellence, and provide the necessary supports for students in need. Ensuring that students from varied achievement levels are fairly distributed throughout the District helps all schools meet the Adequate Yearly Progress (“AYP”) goals of the No Child Left Behind Act of 2001 (“NCLB”), and The Every Child Succeeds Act of 2015 (ESSA).
B. Equity
22
PR/Award # S165A200036
Page e163

THE PLAN FOR STUDENT ENROLLMENT
19
Lee County parents and guardians also are concerned about fairness. The Plan is designed to continue to give every student an equal opportunity to attend a quality school of their choice by providing an educationally equivalent range of programs, curriculum, and instruction in all schools in each zone. In addition, using all facilities at a similar utilization rate and maintaining them equitably promotes fairness.
C. DiversityThe District strongly believes in the educational benefits of diversity. The District defines diversity broadly
to include a number of factors: gender, gender identity, gender expression, sexual orientation, socioeconomic status, race, ethnicity, academic achievement, language ability, and exceptional education needs. It is well established that schools with such multifaceted diversity contribute to a number of educational values. Experience in a diverse classroom better prepares students for the work force and trains students to better exercise their civic responsibilities. Education in a diverse school environment enhances students’ values by bringing them together in ways that can reduce racial fears and stereotypes, teaches students how to interact comfortably and respectfully with people who are different from them, and prepares students to be better neighbors, colleagues, and citizens in our multicultural, democratic society.
Diversity in the student body also helps to improve teaching and learning for all students by encouraging a multiplicity of viewpoints. Moreover, placing students in diverse classrooms in which teachers have high expectations for all students, can positively affect their educational achievement and long-term prospects, without negatively affecting the performance of other students. In addition, diverse enrollments can improve preparation for employment and post-secondary education by teaching students the value of different perspectives, how to function in multicultural business and educational settings, and how to communicate effectively in our increasingly heterogeneous domestic workforce and expanding global marketplace.
In contrast, high concentrations of poverty, high percentages of low achieving students, and racial isolation can all cause or contribute to serious educational harms. It is widely known that many of the conditions associated with poverty present significant challenges for educators. Research has shown that when high concentrations of poor students are assigned to any given school, the academic achievement of all students in that school may be adversely affected.
Similarly, students who are not achieving on grade level, present significant challenges for educators, and high concentrations of such students can have a negative impact on all students in the school. Finally, as the District has learned through its own history of desegregation, students at racially isolated schools not only miss-out on the educational benefits of learning in a diverse environment, but also may suffer additional educational harms from such isolation.
In monitoring its progress in achieving diverse enrollments, the District will consider the following factors and specific targets to assure diverse enrollments are maintained at all schools:
1. Socio-economic Status
Beginning in 2015-2016, Lee County became a Community Eligibility Provision (CEP) School District. In 2018-2019 students in all district schools received Free Lunch. The Free and Reduced lunch data that was previously used in The Plan as socio-economic is no longer valid.
23
PR/Award # S165A200036
Page e164

THE PLAN FOR STUDENT ENROLLMENT
20
2. Achievement Level
The District’s goal is to improve student achievement by ensuring that all schools serve students with varied achievement levels. The District’s target is for each school to have no more than a 20 percent variance from the zone-wide average of students scoring in level 1, as measured by the reading portion of the Florida Standards Assessments (FSA). As shown in the following example, a west zone middle school would be within an acceptable range if the student population scoring at level 1 on the reading portion of the FSA represented between 15 percent and 22 percent.
Level 1 West Zone Average
20 Percent Variance
Lower Limit
Upper Limit
Elementary 15% 3% 12% 18%
Middle 18% 4% 15% 22%
High 20% 4% 16% 24%
K-8 17% 3% 14% 20%
Level 1 South Zone Average
20 Percent Variance
Lower Limit
Upper Limit
Elementary 19% 4% 15% 23%
Middle 25% 5% 20% 30%
High 23% 5% 18% 28%
Level 1 East Zone Average
20 Percent Variance
Lower Limit
Upper Limit
Elementary 26% 5% 21% 31%
Middle 32% 6% 26% 38%
High 31% 6% 25% 37%
K-8 21% 4% 17% 25%
By avoiding the existence of schools with high concentrations of lower-achieving students, all schools continue to maintain high expectations for all students, demand excellence, and provide the necessary support for students who need it. Ensuring that students from varied achievement levels are fairly distributed throughout the District, helps all schools meet appropriate academic progress under State and Federal accountability guidelines.
3. English Language Learners (ELL)
24
PR/Award # S165A200036
Page e165

THE PLAN FOR STUDENT ENROLLMENT
21
The District seeks to ensure that ELL students have equitable access to schools through the enrollment process and that ELL students are not concentrated in any school in the District. The District’s target for each school is to maintain student enrollment that is within 3 percentage points, plus or minus, of the zone-wide average of ELL at each level (elementary, middle and high). The table below suggests that a west zone high school’s ELL student population would meet the established target if it fell between 2 percent and 8 percent.
ELL West Zone
Average Acceptable Variation
Lower Limit Upper Limit
Elementary 10% 3% 7% 13% Middle 6% 3% 3% 9% High 5% 3% 2% 8% K-8 5% 3% 2% 8% ELL South
Zone Average Acceptable Variation
Lower Limit Upper Limit
Elementary 18% 3% 15% 21% Middle 12% 3% 9% 15% High 11% 3% 8% 14%
ELL East Zone
Average Acceptable Variation
Lower Limit Upper Limit
Elementary 27% 3% 24% 30% Middle 17% 3% 14% 20% High 14% 3% 11% 17% K-8 7% 3% 4% 10%
4. Race and Ethnicity The District’s goal is for its schools to have enrollments that include all racial and ethnic groups
enrolled in the District and sets a target that no racial or ethnic group representing at least 5 percent of a zone’s enrollment will vary from one school to another by more than 20 percent of the zone average for each level (elementary, middle and high). In the following example, the proportion of elementary Hispanic children at any west zone elementary school should fall between 28 percent and 42 percent of the total west zone elementary population; whereas, the proportion of White students would be targeted to range from 39 percent to 59 percent. Specific targets would not be set for Asian and Indian students in this example because they do not represent more than 5 percent of the zone population at any level.
Zone Average - West
25
PR/Award # S165A200036
Page e166

THE PLAN FOR STUDENT ENROLLMENT
22
BLACK HISPANIC ASIAN INDIAN MULTI WHITE
Elem. Average 7% 35% 1% 0% 8% 49% Acceptable Variance 1% 7% NA NA 2% 10% Lower Limit 6% 28% NA NA 6% 39% Upper Limit 8% 42% NA NA 10% 59%
Middle Average 6% 35% 2% 0% 6% 51% Acceptable Variance 1% 5% NA NA 1% 10% Lower Limit 5% 28% NA NA 5% 41% Upper Limit 7% 42% NA NA 7% 61%
High Average 7% 33% 2% 0% 5% 54% Acceptable Variance 3% 4% NA NA 1% 11% Lower Limit 12% 32% NA NA NA 43% Upper Limit 18% 40% NA NA NA 65%
K-8 5% 32% 1% 0% 5% 55% Acceptable Variance NA 6% NA NA 1% 11%
Lower Limit NA 25% NA NA NA 44%
Upper Limit NA 38% NA NA NA 66% Zone Average - South
BLACK HISPANIC ASIAN INDIAN MULTI WHITE
Elem. Average 18% 39% 2% 0% 7% 34% Acceptable Variance 4% 8% NA NA 1% 7% Lower Limit 14% 31% NA NA 6% 28% Upper Limit 22% 47% NA NA 8% 41%
Middle Average 17% 39% 3% 0% 5% 36% Acceptable Variance 3% 8% NA NA NA 7% Lower Limit 14% 31% NA NA NA 29% Upper Limit 21% 47% NA NA NA 43%
High Average 13% 36% 3% 0% 4% 43% Acceptable Variance 3% 7% NA NA NA 9% Lower Limit 10% 29% NA NA NA 34% Upper Limit 16% 43% NA NA NA 52%
Zone Average - East
26
PR/Award # S165A200036
Page e167

THE PLAN FOR STUDENT ENROLLMENT
23
BLACK HISPANIC ASIAN INDIAN MULTI WHITE
Elem. Average 18% 53% 1% 0% 7% 20% Acceptable Variance 4% 11% NA NA 1% 4% Lower Limit 14% 42% NA NA 6% 16% Upper Limit 22% 64% NA NA 9% 24%
Middle Average 21% 54% 1% 0% 7% 17% Acceptable Variance 4% 11% NA NA 1% 3% Lower Limit 17% 43% NA NA 6% 14% Upper Limit 25% 65% NA NA 8% 20%
High Average 23% 48% 1% 0% 5% 22% Acceptable Variance 5% 10% NA NA 1% 4% Lower Limit 18% 38% NA NA NA 18% Upper Limit 28% 58% NA NA NA 26%
K-8 14% 41% 1% 0% 6% 38% Acceptable Variance 3% 8% NA NA 1% 8%
Lower Limit 11% 33% NA NA 5% 30%
Upper Limit 17% 49% NA NA 7% 46% As the District has learned through its own history of desegregation, students at racially isolated
schools not only miss out on the educational benefits of learning in a diverse environment, but also may suffer additional educational harms from such isolation.
5. Exceptional Student Education (ESE)
The District seeks to ensure that Exceptional Student Education programs provide equitable access to schools through the Choice process that is consistent with the students’ IEPs and provides the opportunity to be educated in the Least Restrictive Environment.
D. Growth
The Plan also responds to growth and demographic shifts within the District and provides equitable use of the capacity of all schools. Even in the face of dynamic changes, The Plan allows the District to continue providing the stability in enrollments that the families in Lee County desire.
In addition to these goals, The Plan continues to use choice as the heart of the student enrollment method. It responds to the clear desire of some Lee County families to have more school options closer to home and to avoid being required to have their child attend a school distant from home. By dividing the large Residential/Choice Zones into smaller sub-zones, The Plan responds to the desires of many families to reduce the ride time for their children. To enhance the role of parental choice, The Plan relies extensively on enhanced marketing and outreach efforts.
27
PR/Award # S165A200036
Page e168

THE PLAN FOR STUDENT ENROLLMENT
24
Finally, The Plan provides a phased in implementation and constant review to ensure that these complex, inter-related goals are achieved in the most effective way possible.
X. PARENT ENGAGEMENT
Effective school promotion is critical to ensuring that all families have equitable access to information about
school enrollment and to attracting and retaining a diverse student body for each school. The goal of the District’s efforts, therefore, is to attract a diverse pool of student applicants to each school, drawn by the school’s challenging educational programs and the students’ own diverse and varying interests. The District realizes that families may not always have information necessary to make informed choices; therefore, it is the responsibility of the District to provide information and assistance to all parents and guardians as they make choices for their children. Under The Plan, the District continues to implement engagement strategies at both the District level and at the school level with support from District staff. Of course, engagement does not exist in a vacuum and the District, site administrators, and staff continue to develop and maintain high quality educational programs at each school and provide adequate facilities, faculty, and resources to attract and retain students and faculty.
Under The Plan, the District operates one student enrollment office. Additional temporary locations may be
established during peak enrollment periods as the need arises. The function of The Student Enrollment Office is to register and enroll students into The School District of Lee County. The office is open Monday – Friday from 9:00 AM – 4:00 PM. The Student Enrollment Office follows the District’s calendar that is adopted annually for twelve-month personnel.
The District has developed a number of other strategies to attract students from throughout Lee County,
including the following: • Ensuring enrollment and school information are readily available on the District’s website to all families
and through effective use of brochures, posters, and other materials, which explains the application process. Information is available in English, Spanish and Creole.
• Hosting and widely publicizing annual school open houses in order to provide families with the opportunity to learn about programs and services offered at different schools and to meet school administrators and teachers;
• Utilizing the communications and student enrollment departments to inform parents and guardians about programs in Lee County schools; and
• Encouraging principals to develop and implement strategies and campaigns to attract a diverse student population.
Strategies utilizing media and technology to be employed at the District under the direction of the
Communications Department includes the following: • Working with the independent media to highlight the opening of the District’s application period and the
annual school open houses; • Placing application information, such as enrollment period dates, school descriptions, an explanation of
the enrollment process, and frequently asked questions and answers, prominently on the District’s website and widely publicizing the website’s existence;
28
PR/Award # S165A200036
Page e169
THE PLAN FOR STUDENT ENROLLMENT
25
• Working with schools to enhance their own websites to promote each school and to provide resource links for families; and
• Sending enrollment information to parents and guardians who request further information.
The District also reaches out to parents and guardians of fifth and eighth grade students who attend district public schools by mailing pre-printed applications to the families. All families receiving pre-printed applications are encouraged to complete their application process on-line. A unique personal identification number (PIN) is issued for each student authorized to participate in this manner. In addition, the principals at elementary and middle schools will encourage all of their students to complete and return applications in a timely manner.
The District encourages schools to develop and implement the following strategies to promote their unique
educational programs and to attract students. • Developing visually exciting and useful school websites that parents and guardians will want to visit (for
example, posting student artwork or links to sites helpful for homework); • Developing a school logo and school branding for use on brochures, posters, and other materials; • Developing interesting and informative school brochures that describe the school’s unique features,
educational vision, and goals, and that invite and welcome parental contact and questions; • Conducting organized efforts during the enrollment application period to promote the school (for
example, by posting application information on the school website, putting colorful banners up at the school, and distributing applications);
• Encouraging potential students and families to visit the school for open houses, tours, classroom visits, and special events relevant to the school (for example, a session on making the transition to middle school);
• Publishing regularly a school-wide newsletter for distribution to community groups, libraries, retail locations, real estate offices, and other locations visited by families with children;
• Establishing a partnership and communication structure that includes community-based groups in the attendance area, local businesses, and other educational institutions. (for example: Working with neighborhood and community groups on projects and issues of concern can help build positive relations with families);
• Including school promotion in class or club projects, such as having students plan how to distribute the school newsletter and then implement their plan; and
• Engaging in activities that can gain the school a high, positive profile in the community. (For example, school events such as theater performances, art displays, and mural projects can be publicized to the community through posters, announcements in community newspapers, and mailings to local community groups or churches.
XI. PROMOTION AND PROGRAM PLACEMENT
29
PR/Award # S165A200036
Page e170

THE PLAN FOR STUDENT ENROLLMENT
26
Because school promotion and program placement are crucial to the success of The Plan and present ongoing challenges, the Superintendent has directed District staff with oversight responsibility for these two critical functions. These staff members may individually or collectively make recommendations to the Superintendent’s Cabinet.
The directors from departments including Communications, Student Enrollment, Accountability, Research and Continuous Improvement, Curriculum, Diversity and Inclusion, Exceptional Student Education, School Operations, Academic Services, Intervention Programs, Professional Standards and Equity and Planning, Growth and School Capacity will review enrollment data, applicant data, and student achievement data for every school annually. Based upon this review, conclusions whether any schools have too few or too many applicants or an overall applicant pool that is not diverse are made. Likewise, the level of student achievement in each school is assessed, including whether each school is making appropriate academic progress under State and Federal accountability guidelines. Recommendations are made to the Superintendent’s cabinet to address any specific challenge for possible corrective action among the following:
• Does a particular program need to be replicated? • Does a school’s engagement effort need to be modified/improved? • Does District-wide engagement need to be modified/improved? • Does engagement for a particular school need to be targeted differently? • Does the educational curriculum at a school need enhancement? • Should an attractor program be implemented or phased out at a given school? • Are special education programs appropriately placed? • Does the location of academic and non-academic programs affect diversity? How?
This annual review takes place in early summer so that necessary changes can be approved for the following
school year. The review by members of The Student Enrollment Professional Learning Community (PLC) is facilitated by the Executive Director of Student Enrollment.
XII. FALSIFICATION OF INFORMATION
Fair and equitable implementation of Lee County’s Plan for Student Enrollment relies on sincere and honest
compliance with process guidelines. Falsification of information on applications with the intent to circumvent established procedures or to unfairly gain advantage over other applicants is considered a serious offense and is a misdemeanor of the second degree pursuant to Florida State Statute 837.06.
If falsification of any information results in an enrollment outside the student’s resident Choice Zone or if a student is found to be inappropriately attending a school without an approved transfer or enrollment waiver, the student will be withdrawn from the enrolled school and transferred (without regard to parental preference) to a school in the zone of residence on the basis of established enrollment factors.
Falsification of information by parents or guardians of high school students could also jeopardize their eligibility to participate in extracurricular activities under the bylaws of the Florida High School Activities Association (FHSAA).
XIII. ANNUAL REPORT TO BOARD
30
PR/Award # S165A200036
Page e171

THE PLAN FOR STUDENT ENROLLMENT
27
As stated throughout, The Plan is a work in progress. It is a plan that is designed to be flexible and subject to constant review. In order to carry out these commitments, the Superintendent shall continue to present an annual report to the Board regarding the implementation of The Plan for the previous school year and any recommendations for changes for the upcoming school year.
31
PR/Award # S165A200036
Page e172

APPENDIX A
STUDENT ENROLLMENT ZONE MAP
32
PR/Award # S165A200036
Page e173

Caloosa Elem / Caloosa Middle
Cypress Middle / Cypress High
Diplomat Elem / Diplomat Middle
Gulf Elem /Gulf Middle/ Ida S. Baker High
Harns Marsh Elem / Harns Marsh Middle
Hector A. Cafferata Jr. / Cape Coral Technical College
Manatee Elem / Oak Hammock Middle
Mariner Middle / Mariner High
Patriot Elem / Challenger Middle
Ray V. Pottorf / PL Dunbar Middle
Trafalgar Elem / Trafalgar Middle
Tropic Isles Elem / North Fort Myers High
Varsity Lakes Middle / Lehigh Sr. High
APPENDIX B – 2020-2021 Updated 12/10/19 STUDENT ENROLLMENT PROGRAM CHART
APPENDIX C SISTER SCHOOLS LIST
33
PR/Award # S165A200036
Page e174

34
PR/Award # S165A200036
Page e175

LEA Name:
Table 1: Enrollment Data-LEA Level OMB-1855-0011- Expiration 07/31/2022 Check this box if all the magnet schools included in the program are implementing a magnet program for the first time.
Actual Enrollment (Current School Year—October 1, 2019)
Gra
de L
evel
Am
eric
an In
dian
/
A
lask
an N
ativ
e (N
umbe
r)
Am
eric
an In
dian
/
Ala
skan
Nat
ive
(%)
Asi
an (N
umbe
r)
Asi
an (%
)
Bla
ck o
r Afr
ican
A
mer
ican
(Num
ber)
Bla
ck o
r Afr
ican
A
mer
ican
(%)
His
pani
c/La
tino
(Num
ber)
His
pani
c/La
tino
(%)
Nat
ive
Haw
aiia
n or
Oth
er
Paci
fic Is
land
er (N
umbe
r)
Nat
ive
Haw
aiia
n or
Oth
er
Paci
fic Is
land
er (%
)
Whi
te (N
umbe
r)
Whi
te (%
)
Two
or m
ore
race
s (N
umbe
r)
Two
or m
ore
race
s (%
)
Tot
al S
tude
nts
PK K 1 2 3 4 5 6 7 8 9 10 11 12 Total
35
364
419373
5.79
474486
422513
446
433
159
111
122110
150149139
112
4141
40
4142
4341
42
40
11
11
12
8
5
1615
19
10
95,655
1
2,861
2,9273,078
2,778
2,7992,834
0
0.16 1,691
0
00
22
2
371 2,002
1,0291,0631,054
1,026
971
957
973
1,050
948
388
7
6
14 6,65152
92
39,110
School District of Lee County
5
35,615
2,524
2,607
2,542
2,523
2,7902,729
2,643
2,812
2,791
36
7,202
7,450
7,389
7,030
7,226
7,5427,346
7,000
7,010
7,423
7,1207,264
1
1,003
1,0431,123
1,034
3839
39
40.89
2,886
3,183
2,931
2,875
3,029
13,549
3,047
2,892
3,1063,008
1.77
4041
40
1968
6
✔
7
412,708 0
131151
1364
117
37.23
0
0 0.00
736
0
0
0
0
0
0
0
0
0
0
0 0
0
34
36
37
37
3738
39
37
140
140
130
150
140
14
14
14
14
0
00
326
298281
5
6
19
921
4
0
7
5,537
919
14.16
22
22
2
222
2
1111
2,417
16
1
153
5
6
14
1515
12
506
PR/Award # S165A200036
Page e176

LEA Name:
Table 1: Enrollment Data-LEA Level OMB-1855-0011- Expiration 07/31/2022 Check this box if all the magnet schools included in the program are implementing a magnet program for the first time.
Projected Enrollment (Year 1 of Project—October 1, 2020)
Gra
de L
evel
Am
eric
an In
dian
/
Ala
skan
Nat
ive
(Num
ber)
Am
eric
an In
dian
/
Ala
skan
Nat
ive
(%)
Asi
an (N
umbe
r)
Asi
an (%
)
Bla
ck o
r Afr
ican
A
mer
ican
(Num
ber)
Bla
ck o
r Afr
ican
A
mer
ican
(%)
His
pani
c/La
tino
(Num
ber)
His
pani
c/La
tino
(%)
Nat
ive
Haw
aiia
n or
Oth
er
Paci
fic Is
land
er (N
umbe
r)
Nat
ive
Haw
aiia
n or
Oth
er
Paci
fic Is
land
er (%
)
Whi
te (N
umbe
r)
Whi
te (%
)
Two
or m
ore
race
s (N
umbe
r)
Two
or m
ore
race
s (%
)
Tot
al S
tude
nts
PK K 1 2 3 4 5 6 7 8 9 10 11 12 Total
36
1414
1314
1414
14
14
13
6,735
0
0 37
39
0
0 380
37
39,411
00
0
0
36
363437
37
1
0.00
190 19
812
5
15
1610
19
11
11 2
2
2
2
2
2
21
2
0
1
15
14
14
35,866
143
150
136
14
515423
481
474
380
419391
430435
2,5752,582
2,462
40.89
2,532
2,853
2,8002,879
2,6302,740
196
5
4
4
371
96,374153
School District of Lee County
508
1.77
0
0
0
2,874
2,770
2,920
1,709
93152
7,118
7,353
7,720
8
1,030
1,114
9481,095
956
993
1,065
958
950
40
41
424341
4240
4141
39
39
38
✔
13,651
16
11
11
0.16
36
7,726
7,559
7,387
6,970
7,575
7,250
7,152
7,029
6,800
93
388
5,584
0
0
0
2,000
0
0
0
0
0
00
0
0
14.16
298
290
344
1 07
0
00
00
000
0041
1,165
1,022
2,9401,036
2,875
3,190
2,759
40
41
40
2,786
2,437
0
2,871
3,022
2,9413,271
3,179
2,950
2,925
3,111
2
2
2
37.22
12
6
6
5
5
0
6
677
7
5.79
122
110
117111
141110
149152
163
10
0
1,032
0
0
0
PR/Award # S165A200036
Page e177

LEA Name:
Table 1: Enrollment Data-LEA Level OMB-1855-0011- Expiration 07/31/2022 Check this box if all the magnet schools included in the program are implementing a magnet program for the first time.
Projected Enrollment (Year 2 of Project—October 1, 2021)
Gra
de L
evel
Am
eric
an In
dian
/
Ala
skan
Nat
ive
(Num
ber)
Am
eric
an In
dian
/
Ala
skan
Nat
ive
(%)
Asi
an (N
umbe
r)
Asi
an (%
)
Bla
ck o
r Afr
ican
A
mer
ican
(Num
ber)
Bla
ck o
r Afr
ican
A
mer
ican
(%)
His
pani
c/La
tino
(Num
ber)
His
pani
c/La
tino
(%)
Nat
ive
Haw
aiia
n or
Oth
er
Paci
fic Is
land
er (N
umbe
r)
Nat
ive
Haw
aiia
n or
Oth
er
Paci
fic Is
land
er (%
)
Whi
te (N
umbe
r)
Whi
te (%
)
Two
or m
ore
race
s (N
umbe
r)
Two
or m
ore
race
s (%
)
Tot
al S
tude
nts
PK K 1 2 3 4 5 6 7 8 9 10 11 12 Total
37
0
0
0
0
0
0
0
0
0
13,748
2
2
1
2
0
00
0.00
6,800
7,578
7,368
7,544
2
2
2
2
2
1.77 5,623
308290
353
11
16
11
1
36
3710
936
3,005
2,892
2,610
2,650
2,7242,726
2,502
2,5902,465
7
School District of Lee County
2,865
2,950
2,870
1,032
72,475
1,064
1,057
1,145
3,006
2,907
3,029
3,195
2,836
2,869
3,282
2,951
3,113
0
153
3,1352,967
3,015
5.79
91 0
✔
0
7,782
7,106
7,211
7,362
7,767
7,153
7,610
6,850
6,928
1,121
1,041
1,085
41
8
19
5
12
11
15
11
10
16
976
925
940
990
1,098
982
19
2
2
20
388
97,059
2,0001
00
0
00
0
0
00
00
0
14
41
40
40
36
36
39
373738
37
37
34
5
44
39
3840.89
196
0.16
39
0
1,718
432406
431
430
460521
494
37.2239,690
395
401
140
147
153
167
00
0
00
0
0
1
0
0
115
110
120
111
119
0
0
014
1514
12
14.16
5
6
6
56
7
7
6
7
52
14
1414
13
14
14
14
1414
10
40
41
2,785
41
43
42
42
41
41
40
0
19
506
36,127
155
132
146
PR/Award # S165A200036
Page e178

LEA Name:
Table 1: Enrollment Data-LEA Level OMB-1855-0011- Expiration 07/31/2022 Check this box if all the magnet schools included in the program are implementing a magnet program for the first time.
Projected Enrollment (Year 3 of Project—October 1, 2022)
Gra
de L
evel
Am
eric
an In
dian
/
Ala
skan
Nat
ive
(Num
ber)
Am
eric
an In
dian
/
Ala
skan
Nat
ive
(%)
Asi
an (N
umbe
r)
Asi
an (%
)
Bla
ck o
r Afr
ican
A
mer
ican
(Num
ber)
Bla
ck o
r Afr
ican
A
mer
ican
(%)
His
pani
c/La
tino
(Num
ber)
His
pani
c/La
tino
(%)
Nat
ive
Haw
aiia
n or
Oth
er
Paci
fic Is
land
er (N
umbe
r)
Nat
ive
Haw
aiia
n or
Oth
er
Paci
fic Is
land
er (%
)
Whi
te (N
umbe
r)
Whi
te (%
)
Two
or m
ore
race
s (N
umbe
r)
Two
or m
ore
race
s (%
)
Tot
al S
tude
nts
PK K 1 2 3 4 5 6 7 8 9 10 11 12 Total
38
0
2
50910
2
00
00
0
0000
2
0
2
2
1
153
159
136
1
16
38
39
2
945
39
2
37.22
1
0
2
2
2
7,29310
16
8
19
11
11
13
5
40
19
41
407,947
School District of Lee County
13,872
14
986
1,067
983
975
943
982
1,032
1,095
1,090 14
0
14
14
14
370320
7
13
305
2,50192
40.89
76
66
371
555
41
2,977
3,1172,945
2,527
2,517
2,514
3,0222,812
2,679
2,663
2,7102,705
52
41
0
40
388
4341
✔
42
41
7,8434
7
4
19
0
15
014
14
387400
403
433510
433436
467500
12
0
2,811
5
5.79
36
42
0
7,322
.21
6,979
.15
14
196
.15
115
110
122
115
120
138
149
149
168
7,559
7,416
0.0014.16
14
1.77
014
14
1,120
1,087
1,179
41
36,462
2,9202,866
2,9653,204
2,8903,078
3,1103,015
40
3,129
6,995
39
37
2
37
7,186
1
7,823
95,957
7
0
0.22
.14
.15
0
0.14
0
40,059
.22
.11
.26
0
12
11
17
.07
0
.19 7
7,1653837
0
3734
7,564
36
1,738
0
5,669
00
3,170
0 3,234
3,037
360
6,865
0.16
1,032
PR/Award # S165A200036
Page e179

LEA Name:
Table 1: Enrollment Data-LEA Level OMB-1855-0011- Expiration 07/31/2022 Check this box if all the magnet schools included in the program are implementing a magnet program for the first time.
Projected Enrollment (Year 4 of Project—October 1, 2023)
Gra
de L
evel
Am
eric
an In
dian
/
Ala
skan
Nat
ive
(Num
ber)
Am
eric
an In
dian
/
Ala
skan
Nat
ive
(%)
Asi
an (N
umbe
r)
Asi
an (%
)
Bla
ck o
r Afr
ican
A
mer
ican
(Num
ber)
Bla
ck o
r Afr
ican
A
mer
ican
(%)
His
pani
c/La
tino
(Num
ber)
His
pani
c/La
tino
(%)
Nat
ive
Haw
aiia
n or
Oth
er
Paci
fic Is
land
er (N
umbe
r)
Nat
ive
Haw
aiia
n or
Oth
er
Paci
fic Is
land
er (%
)
Whi
te (N
umbe
r)
Whi
te (%
)
Two
or m
ore
race
s (N
umbe
r)
Two
or m
ore
race
s (%
)
Tot
al S
tude
nts
PK K 1 2 3 4 5 6 7 8 9 10 11 12 Total
39
7,524
0
7,556
37.22
6,9300
8,047
14.16 40,360
10
0
0
0
00
0
0
00 39
37
7,619
019
3,1853,189
36,738
3,309
36
38
7
34
954
36
39
37
39
37
3738
2,527
School District of Lee County
40
0.00
196
7,327
41
427,353
0
40
5.79
0
41
1,032
41
5,714
13
8
5
7
11
11
11
19
16
16
13,978
2,8922,949
3,2602,883
3,0942,9732,9953,0923,044
506472
517427
438442396385393.14
1.77
5
1
4 7,9634
019
17
12
12
.07
.18
.11
.27
2
52
2
.15
2
✔
.22
.22
.15
0.16
00
159
40
41
41 512
40
7,275
14
388
7,0621
42
43
41
3,134
12
3,115
3,060
1,746
994
980
960
1,087
953
1,090
1,062
1,002
1,027
40.89
2,837
124
116
116
112
163
116
142
148
148
0
14
140
154
162
2
0
14
2
13
0
2
1
140
1
2
0
2
14
25
2
.15
5
.15
566
14
67
14
714
340
320
370
7
1,206
1,145
1,130
14
.21
2,946
2,6932,798
2,6882,778
2,5722,598
2,5492,535
0
36
7,003
371
2
15
14
14
98,695
7,990
0
0
0
0
0
0
0
7,046
2,000
0
93
PR/Award # S165A200036
Page e180

LEA Name:
Table 1: Enrollment Data-LEA Level OMB-1855-0011- Expiration 07/31/2022 Check this box if all the magnet schools included in the program are implementing a magnet program for the first time.
Projected Enrollment (Year 5 of Project—October 1, 2024)
Gra
de L
evel
Am
eric
an In
dian
/
Ala
skan
Nat
ive
(Num
ber)
Am
eric
an In
dian
/
Ala
skan
Nat
ive
(%)
Asi
an (N
umbe
r)
Asi
an (%
)
Bla
ck o
r Afr
ican
A
mer
ican
(Num
ber)
Bla
ck o
r Afr
ican
A
mer
ican
(%)
His
pani
c/La
tino
(Num
ber)
His
pani
c/La
tino
(%)
Nat
ive
Haw
aiia
n or
Oth
er
Paci
fic Is
land
er (N
umbe
r)
Nat
ive
Haw
aiia
n or
Oth
er
Paci
fic Is
land
er (%
)
Whi
te (N
umbe
r)
Whi
te (%
)
Two
or m
ore
race
s (N
umbe
r)
Two
or m
ore
race
s (%
)
Tot
al S
tude
nts
PK K 1 2 3 4 5 6 7 8 9 10 11 12 Total
40
0
0
0
7
37
36
34
36
3,470
3,209
3,102
2 362,550
37
0
37
1,032
38
37
476510
436520
445430
2384405
391
2
2
2
0.00
1
40
2
150
145
163
41
2
41
2
40
14.16
3,240
41
3,130
3,048
42
43
42
41
School District of Lee County
0
52
0
14,064
0
0
0
0
0
05
13
8
20
1,758
11
16
16
11
11
40.89
14
14
6,995
14
14
0
1
7,578
196
0
10
0
41
0
37.22
14 2,574
2,930
2,779
2,770
2,790
2,615
2,647
2,598
2,560
0
962
1,002
975
1,099
1,057
957
14
1,006
1,047
1,082
94
1,149
1,105
1,270
14
13
14
12
✔
40,612
1 388 19
40
8,47741
40
.15
2,86414
.28
7,628.1
0.16
.18
12
17
12
.07
.15
.21
7,140
.22
36,965
.15
0
19
5
371
118
114
127
119
114
142
150
147
163 5
5,750
5
0
4
7,466
4
7
340
34335914
15
7
14
7,134
5.79
7
515
7,781.22
6
3,026
3,078
3,072
2,920
2,975
3,013
2,988
3,289
2,937
6
.15
.14
65
0
7,113
0 9651
39
07
1.77
2,000
3939
2 38
2
2
99,309
7,387
7,129
0
0
0
0
0
0
0
7,475
00
8,006
160
PR/Award # S165A200036
Page e181

LEA Name: Table 2: Year of Implementation for Existing Magnet Schools included in the Project - OMB-1855-0011- Expiration 07/31/2022 School Name First School Year as a Magnet School
41
School District of Lee County
NEWNEWSouth Fort Myers High School
James Stephens International Academy
PR/Award # S165A200036
Page e182

LEA Name:
School Name: Table 3: Enrollment Data-Magnet Schools OMB-1855-0011- Expiration 07/31/2022 • Use this format (or the applicant’s own format) for each magnet school participating in the project.• Provide data for all students in each grade for which the school enrolls students.• Remember, the projected data for Years 1, 2, 3, 4 and 5 of the project should be based on projections showing the anticipated enrollment of the magnet school if the project is
successfully implemented. Projected Enrollment Actual Enrollment
(Current School Year—October 1, 2019) (Year 1 of Project—October 1, 2020)
Gra
de L
evel
Am
eric
an In
dian
/
A
lask
an N
ativ
e (N
umbe
r)
Am
eric
an In
dian
/
Ala
skan
Nat
ive
(%)
Asi
an (N
umbe
r)
Asi
an (%
) B
lack
or A
fric
an A
mer
ican
(N
umbe
r)
Bla
ck o
r Afr
ican
Am
eric
an
(%)
His
pani
c/La
tino
(Num
ber)
His
pani
c/La
tino
(%)
Nat
ive
Haw
aiia
n or
Oth
er
Paci
fic Is
land
er (N
umbe
r)
Nat
ive
Haw
aiia
n or
Oth
er
Paci
fic Is
land
er (%
)
Whi
te (N
umbe
r)
Whi
te (%
) Tw
o or
mor
e ra
ces
(Num
ber)
Two
or m
ore
race
s (%
)
Tot
al S
tude
nts
Gra
de L
evel
Am
eric
an In
dian
/ A
lask
an N
ativ
e (N
umbe
r)
Am
eric
an In
dian
/ A
lask
an N
ativ
e (%
) A
sian
(Num
ber)
Asi
an (%
) B
lack
or A
fric
an A
mer
ican
(N
umbe
r)
Bla
ck o
r Afr
ican
Am
eric
an
(%)
His
pani
c/La
tino
(Num
ber)
His
pani
c/La
tino
(%)
Nat
ive
Haw
aiia
n or
Oth
er
Paci
fic Is
land
er (N
umbe
r)
Nat
ive
Haw
aiia
n or
Oth
er
Paci
fic Is
land
er (%
)
Whi
te (N
umbe
r)
Whi
te (%
) Tw
o or
mor
e ra
ces
(Num
ber)
Two
or m
ore
race
s (%
)
Tot
al S
tude
nts
PK PK K K 1 1 2 2 3 3 4 4 5 5 6 6 7 7 8 8 9 9 10 10 11 11 12 12 Total Total
Page 1 of 3
42
364
419373
14
0
14
0
13
0
1414
1414
1413474
486
422
513
446
433
159 00 37
39
00 38
0
37
111122
110
150149139
112
0
0
00
363634
37
37
4141
40
35
41
4243
4142
40
11
11
128
5
1615
1910
1 190 19
45
1
8125
1516
10
19
1111
2,861
2,9273,078
22
22
2
2
21
2
2,778
2,7992,834
0
0
1
14
140
0
143
150
136
14
37.36
2
2
02
371
1,029
515
1,063
423
1,054
481
1,026
474
380
419
391
430
435
971
957973
201
1,050948
2,575
2,582
2,4622,532
2,853
2,800
2,879
2,630
2,740
196388
5
4
371
7
6
14
0
52
.37
0
0
0
0
92
86
77
89
79
86
39,110 44.98
School District of Lee County
5
508
491
2,524
2,607
2,542
2,523
2,7902,729
2,643
2,812
2,791
0
0
87
48
0
0
3676
77
84
0 53849
0
0
9.11
2,874
2,770
2,920
1
35
1,003
1,0431,123
1,034
39
39
2,886
3,1832,931
2,875
3,029
3,0472,892
3,1063,008
40
40
40
931
52196
8 8
8.15
1,0301,114
9481,095
956
9931,065
958
950
6
40
414243
41
42
4041
41
39
39
0
7
0
0
16
41
11
11
362,708 0 8693
131151
136
4
388
117
0
0
0
00
00
0
00
0
0
736
0
0
0
00
000
0
0 0
0
3436
3737
37
298
38
290
39
344
37
140
140
130
150140
14
14
14
14
01
0
0
326
298
0
281
8.18
5
6
7
0
0
0
0
0
0
000
0
19
41921
1,165
1,022
2,9401,036
2,875
3,190
2,759
40
40
2,786
44
0 2,437
.41
0
7
242
2,871
3,022
2,9413,271
3,1792,950
2,9253,111
2
2
45.01
9
0 0 0
19
2
22
37.27
22
222
2
84
12
0
James Stephens International Academy
66
55
0
1111
6
6
777
2,417
16
1
122110
117
111
141
110
149
152163
9.16
5
10
6
183
14
15
1,032
0
0
12
0
506
PR/Award # S165A200036
Page e183

LEA Name:
School Name:
Table 3 (Cont'd): Enrollment Data-Magnet Schools • Use this format (or the applicant’s own format) for each magnet school participating in the project.• Provide data for all students in each grade for which the school enrolls students.• Remember, the projected data for Years 1, 2, 3, 4 and 5 of the project should be based on projections showing the anticipated enrollment of the magnet school if the project is
successfully implemented.
Projected Enrollment (Year 2 of Project—October 1, 2021)
Projected Enrollment (Year 3 of Project—October 1, 2022)
Gra
de L
evel
Am
eric
an In
dian
/
A
lask
an N
ativ
e (N
umbe
r)
Am
eric
an In
dian
/
Ala
skan
Nat
ive
(%)
Asi
an (N
umbe
r)
Asi
an (%
) B
lack
or A
fric
an A
mer
ican
(N
umbe
r)
Bla
ck o
r Afr
ican
Am
eric
an
(%)
His
pani
c/La
tino
(Num
ber)
His
pani
c/La
tino
(%)
Nat
ive
Haw
aiia
n or
Oth
er
Paci
fic Is
land
er (N
umbe
r)
Nat
ive
Haw
aiia
n or
Oth
er
Paci
fic Is
land
er (%
)
Whi
te (N
umbe
r)
Whi
te (%
) Tw
o or
mor
e ra
ces
(Num
ber)
Two
or m
ore
race
s (%
)
Tot
al S
tude
nts
Gra
de L
evel
Am
eric
an In
dian
/ A
lask
an N
ativ
e (N
umbe
r)
Am
eric
an In
dian
/ A
lask
an N
ativ
e (%
) A
sian
(Num
ber)
Asi
an (%
) B
lack
or A
fric
an A
mer
ican
(N
umbe
r)
Bla
ck o
r Afr
ican
Am
eric
an
(%)
His
pani
c/La
tino
(Num
ber)
His
pani
c/La
tino
(%)
Nat
ive
Haw
aiia
n or
Oth
er
Paci
fic Is
land
er (N
umbe
r)
Nat
ive
Haw
aiia
n or
Oth
er
Paci
fic Is
land
er (%
)
Whi
te (N
umbe
r)
Whi
te (%
) Tw
o or
mor
e ra
ces
(Num
ber)
Two
or m
ore
race
s (%
)
Tot
al S
tude
nts
PK PK K K 1 1 2 2 3 3 4 4 5 5 6 6 7 7 8 8 9 9 10 10 11 11 12 12 Total Total
Page 2 of 343
44
46
39
47
46
9.04
8
8
10
7
9
0
00
0
0
0
000
13,748
2
21
2
6,800
0
0
0
0
0
7,5787,368
7,544
2
222
2
51 00
05,623
308290
353
11
16
11
1
36
371
250
0
50
9360
0
0
0
0
0
553
3,005
2,892
2,6102,650
2,7242,726
2,502
2,5902,465
7
School District of Lee County
2,865
2,950
2,870
191,032
40 0
7
72,4758
11
7
10
8
0
0
0
0
0
35
30
34
29
31
1,064
1,057
0
1,145
33
44
34
36
39
14
45.21
3,006
2,9073,0293,195
2,836
2,8693,282
2,951
3,113
0
470
9
11
9
10
9
60 0
0
153
0
86
8.87
3,1352,967
10.13
3,015
0
0
0
0
0
0
0
16
91 0 36
0
7,782
7,106
7,2117,3627,767
7,153
7,6106,850
6,928
19
1,1211,041
1,085
041
8
19
5
12
197
11
1511
10
16
976
925
940
990
1,098
982
19
45.1
2
2
0
388
0
37
97,059
2,000 51
310
00
0
00
00
0
0
0
0
14
40
40
36
36
39
373738
3737
34
0
5
439
0
0
0
0
35.620
9
196
39
01,718 9.43
432406
431430
460521
494
39,690
395
401
87
79
88
88
880
0
0
0
0
0
0
0
140147153
167
0
0
0
1
115
110120
111119
56
0
0
0
14
14
0
12
7
0
5
6
6
56
7
7
6
7
52
0
14
1414
1314
14
14
1414
James Stephens International Academy
8
36.6
40
40
41
39
31
0
0
0
0
0
0
10
40
6
41
10
6
7
2,785
9
41
4342
4241
4140
0
19
8506
36,127
155132
146
PR/Award # S165A200036
Page e184

LEA Name:
School Name:
Table 3 (Cont'd): Enrollment Data-Magnet Schools • Use this format (or the applicant’s own format) for each magnet school participating in the project.• Provide data for all students in each grade for which the school enrolls students.• Remember, the projected data for Years 1, 2, 3, 4 and 5 of the project should be based on projections showing the anticipated enrollment of the magnet school if the project is
successfully implemented.
Projected Enrollment (Year 4 of Project—October 1, 2023)
Projected Enrollment (Year 5 of Project—October 1, 2024)
Gra
de L
evel
Am
eric
an In
dian
/
A
lask
an N
ativ
e (N
umbe
r)
Am
eric
an In
dian
/
Ala
skan
Nat
ive
(%)
Asi
an (N
umbe
r)
Asi
an (%
) B
lack
or A
fric
an A
mer
ican
(N
umbe
r)
Bla
ck o
r Afr
ican
Am
eric
an
(%)
His
pani
c/La
tino
(Num
ber)
His
pani
c/La
tino
(%)
Nat
ive
Haw
aiia
n or
Oth
er
Paci
fic Is
land
er (N
umbe
r)
Nat
ive
Haw
aiia
n or
Oth
er
Paci
fic Is
land
er (%
)
Whi
te (N
umbe
r)
Whi
te (%
) Tw
o or
mor
e ra
ces
(Num
ber)
Two
or m
ore
race
s (%
)
Tot
al S
tude
nts
Gra
de L
evel
Am
eric
an In
dian
/ A
lask
an N
ativ
e (N
umbe
r)
Am
eric
an In
dian
/ A
lask
an N
ativ
e (%
) A
sian
(Num
ber)
Asi
an (%
) B
lack
or A
fric
an A
mer
ican
(N
umbe
r)
Bla
ck o
r Afr
ican
Am
eric
an
(%)
His
pani
c/La
tino
(Num
ber)
His
pani
c/La
tino
(%)
Nat
ive
Haw
aiia
n or
Oth
er
Paci
fic Is
land
er (N
umbe
r)
Nat
ive
Haw
aiia
n or
Oth
er
Paci
fic Is
land
er (%
)
Whi
te (N
umbe
r)
Whi
te (%
) Tw
o or
mor
e ra
ces
(Num
ber)
Two
or m
ore
race
s (%
)
Tot
al S
tude
nts
PK PK K K 1 1 2 2 3 3 4 4 5 5 6 6 7 7 8 8 9 9 10 10 11 11 12 12 Total Total
Page 3 of 3
44
13
0
0
0
0
0
0
0
0
10
0
0
10.23
0
0
0
0
0
29 12
0
36
0
0
0
0
0
0
45.96
0
0
0
0
90
90
89
88
87
0
0
0
0
33.39 0
5 0
60
0
100
16
9.72
90
100
6
100
110
0
0
256 0
47
9
9
8
9
10
0
0
School District of Lee County
0
14
0
0
87
88
89
89
80
0
9
9
9
10
10
44
33
35
38
34
0
0
0
0
0
0
0
0
0
0
0
9
7
8
9
8
0 0
0
5
7
6
8
6
11
0
0
0
0
0
57
0
0 34
0
0
0
566
28
0
0
0
34.65
0
0
0
557
0
0
0
108
9.16
80
0
0
0
0
0
22
8
9
8
7
12
387
0
29
34
30
30
35
940 0 1044
53
0
0
0
0
0
0
3886
53
0
11
55189
19
051
20
9
8
12
8
10
0
193
28
30
31
34
29
18
33 9
41
42
41
41
40
42
42
32
40
40
0
0
0
0
0
0
46.29 10.6
12
0
0
0
SAVE
86
262
45
40
48
45
48
0
James Stephens International Academy
32
34
38
32
35
4
0
47
47
47
44
46
0
8
7
7
9
0
11
PR/Award # S165A200036
Page e185

LEA Name:
School Name: Table 3: Enrollment Data-Magnet Schools OMB-1855-0011- Expiration 0 /31/20 • Use this format (or the applicant’s own format) for each magnet school participating in the project.• Provide data for all students in each grade for which the school enrolls students.• Remember, the projected data for Years 1, 2, 3, 4 and 5 of the project should be based on projections showing the anticipated enrollment of the magnet school if the project is
successfully implemented. Projected Enrollment Actual Enrollment
(Current School Year—October 1, 201 ) (Year 1 of Project—October 1, 20 )
Gra
de L
evel
Am
eric
an In
dian
/
A
lask
an N
ativ
e (N
umbe
r)
Am
eric
an In
dian
/
Ala
skan
Nat
ive
(%)
Asi
an (N
umbe
r)
Asi
an (%
) B
lack
or A
fric
an A
mer
ican
(N
umbe
r)
Bla
ck o
r Afr
ican
Am
eric
an
(%)
His
pani
c/La
tino
(Num
ber)
His
pani
c/La
tino
(%)
Nat
ive
Haw
aiia
n or
Oth
er
Paci
fic Is
land
er (N
umbe
r)
Nat
ive
Haw
aiia
n or
Oth
er
Paci
fic Is
land
er (%
)
Whi
te (N
umbe
r)
Whi
te (%
) Tw
o or
mor
e ra
ces
(Num
ber)
Two
or m
ore
race
s (%
)
Tot
al S
tude
nts
Gra
de L
evel
Am
eric
an In
dian
/ A
lask
an N
ativ
e (N
umbe
r)
Am
eric
an In
dian
/ A
lask
an N
ativ
e (%
) A
sian
(Num
ber)
Asi
an (%
) B
lack
or A
fric
an A
mer
ican
(N
umbe
r)
Bla
ck o
r Afr
ican
Am
eric
an
(%)
His
pani
c/La
tino
(Num
ber)
His
pani
c/La
tino
(%)
Nat
ive
Haw
aiia
n or
Oth
er
Paci
fic Is
land
er (N
umbe
r)
Nat
ive
Haw
aiia
n or
Oth
er
Paci
fic Is
land
er (%
)
Whi
te (N
umbe
r)
Whi
te (%
) Tw
o or
mor
e ra
ces
(Num
ber)
Two
or m
ore
race
s (%
)
Tot
al S
tude
nts
PK PK K K 1 1 2 2 3 3 4 4 5 5 6 6 7 7 8 8 9 9 10 10 11 11 12 12 Total Total
School District of Lee County
South Fort Myers High School
0 0
0 0
0 0
0 0
0 0
0 0
0 0
0 0
0 0
0 0
1 0 7 1 108 22 258 52 0 0 85 17 37 7 496 1 0 7 1 116 22 273 52 0 0 89 17 39 7 525
1 0 4 1 110 23 245 51 0 0 98 20 23 5 481 1 0 5 1 114 22 261 51 0 0 104 20 24 5 509
0 0 9 2 100 20 248 51 0 0 111 23 21 4 489 1 0 8 2 107 21 262 51 0 0 118 23 22 4 518
1 0 8 2 82 19 212 50 0 0 98 23 20 5 421 0 0 9 2 86 19 223 50 0 0 104 23 22 5 444
3 .15 28 1.48 400 21.2 963 51.03 0 0 392 20.77 101 5.35 1,887 3 .15 29 1.45 423 21.19 1,019 51.05 0 0 415 20.79 107 5.36 1,996
45
PR/Award # S165A200036
Page e186

LEA Name:
School Name:
Table 3 (Cont'd): Enrollment Data-Magnet Schools • Use this format (or the applicant’s own format) for each magnet school participating in the project.• Provide data for all students in each grade for which the school enrolls students.• Remember, the projected data for Years 1, 2, 3, 4 and 5 of the project should be based on projections showing the anticipated enrollment of the magnet school if the project is
successfully implemented.
Projected Enrollment (Year 2 of Project—October 1, 20 )
Projected Enrollment (Year 3 of Project—October 1, 20 )
Gra
de L
evel
Am
eric
an In
dian
/
A
lask
an N
ativ
e (N
umbe
r)
Am
eric
an In
dian
/
Ala
skan
Nat
ive
(%)
Asi
an (N
umbe
r)
Asi
an (%
) B
lack
or A
fric
an A
mer
ican
(N
umbe
r)
Bla
ck o
r Afr
ican
Am
eric
an
(%)
His
pani
c/La
tino
(Num
ber)
His
pani
c/La
tino
(%)
Nat
ive
Haw
aiia
n or
Oth
er
Paci
fic Is
land
er (N
umbe
r)
Nat
ive
Haw
aiia
n or
Oth
er
Paci
fic Is
land
er (%
)
Whi
te (N
umbe
r)
Whi
te (%
) Tw
o or
mor
e ra
ces
(Num
ber)
Two
or m
ore
race
s (%
)
Tot
al S
tude
nts
Gra
de L
evel
Am
eric
an In
dian
/ A
lask
an N
ativ
e (N
umbe
r)
Am
eric
an In
dian
/ A
lask
an N
ativ
e (%
) A
sian
(Num
ber)
Asi
an (%
) B
lack
or A
fric
an A
mer
ican
(N
umbe
r)
Bla
ck o
r Afr
ican
Am
eric
an
(%)
His
pani
c/La
tino
(Num
ber)
His
pani
c/La
tino
(%)
Nat
ive
Haw
aiia
n or
Oth
er
Paci
fic Is
land
er (N
umbe
r)
Nat
ive
Haw
aiia
n or
Oth
er
Paci
fic Is
land
er (%
)
Whi
te (N
umbe
r)
Whi
te (%
) Tw
o or
mor
e ra
ces
(Num
ber)
Two
or m
ore
race
s (%
)
Tot
al S
tude
nts
PK PK K K 1 1 2 2 3 3 4 4 5 5 6 6 7 7 8 8 9 9 10 10 11 11 12 12 Total Total
School District of Lee County
South Fort Myers High School
0 0
0 0
0 0
0 0
0 0
0 0
0 0
0 0
0 0
0 0
0 0 7 1 121 22 276 51 0 0 93 17 40 7 537 1 0 8 2 121 23 264 50 0 0 93 18 40 8 527
1 0 5 1 120 23 263 50 0 0 108 21 25 5 522 0 0 5 1 119 23 252 49 0 0 108 21 26 5 510
1 0 9 2 110 21 265 50 0 0 122 23 24 5 531 1 0 9 2 110 21 254 49 0 0 122 24 24 5 520
1 0 10 2 90 20 226 50 0 0 106 23 23 5 456 1 0 9 2 90 20 218 49 0 0 105 24 23 5 446
3 .15 31 1.52 441 21.55 1,030 50.34 0 0 429 20.97 112 5.47 2,046 3 .15 31 1.55 440 21.97 988 49.33 0 0 428 21.37 113 5.64 2,003
46
PR/Award # S165A200036
Page e187

LEA Name:
School Name:
Table 3 (Cont'd): Enrollment Data-Magnet Schools • Use this format (or the applicant’s own format) for each magnet school participating in the project.• Provide data for all students in each grade for which the school enrolls students.• Remember, the projected data for Years 1, 2, 3, 4 and 5 of the project should be based on projections showing the anticipated enrollment of the magnet school if the project is
successfully implemented.
Projected Enrollment (Year 4 of Project—October 1, 202 )
Projected Enrollment (Year 5 of Project—October 1, 202 )
Gra
de L
evel
Am
eric
an In
dian
/
A
lask
an N
ativ
e (N
umbe
r)
Am
eric
an In
dian
/
Ala
skan
Nat
ive
(%)
Asi
an (N
umbe
r)
Asi
an (%
) B
lack
or A
fric
an A
mer
ican
(N
umbe
r)
Bla
ck o
r Afr
ican
Am
eric
an
(%)
His
pani
c/La
tino
(Num
ber)
His
pani
c/La
tino
(%)
Nat
ive
Haw
aiia
n or
Oth
er
Paci
fic Is
land
er (N
umbe
r)
Nat
ive
Haw
aiia
n or
Oth
er
Paci
fic Is
land
er (%
)
Whi
te (N
umbe
r)
Whi
te (%
) Tw
o or
mor
e ra
ces
(Num
ber)
Two
or m
ore
race
s (%
)
Tot
al S
tude
nts
Gra
de L
evel
Am
eric
an In
dian
/ A
lask
an N
ativ
e (N
umbe
r)
Am
eric
an In
dian
/ A
lask
an N
ativ
e (%
) A
sian
(Num
ber)
Asi
an (%
) B
lack
or A
fric
an A
mer
ican
(N
umbe
r)
Bla
ck o
r Afr
ican
Am
eric
an
(%)
His
pani
c/La
tino
(Num
ber)
His
pani
c/La
tino
(%)
Nat
ive
Haw
aiia
n or
Oth
er
Paci
fic Is
land
er (N
umbe
r)
Nat
ive
Haw
aiia
n or
Oth
er
Paci
fic Is
land
er (%
)
Whi
te (N
umbe
r)
Whi
te (%
) Tw
o or
mor
e ra
ces
(Num
ber)
Two
or m
ore
race
s (%
)
Tot
al S
tude
nts
PK PK K K 1 1 2 2 3 3 4 4 5 5 6 6 7 7 8 8 9 9 10 10 11 11 12 12 Total Total
School District of Lee County
South Fort Myers High School
0 0
0 0
0 0
0 0
0 0
0 0
0 0
0 0
0 0
0 0
1 0 10 2 129 24 265 49 0 0 95 18 41 8 541 1 0 10 2 133 25 258 48 0 0 97 18 42 8 541
1 0 5 1 124 24 254 48 0 0 114 22 27 5 525 1 0 6 1 127 25 246 47 0 0 117 22 27 5 524
0 0 9 2 117 22 255 48 0 0 128 24 25 5 534 1 0 9 2 119 22 248 47 0 0 132 25 25 5 534
1 0 9 2 93 20 220 48 0 0 111 24 24 5 458 0 0 9 2 94 21 215 47 0 0 114 25 25 5 457
3 .15 33 1.6 463 22.5 994 48.3 0 0 448 21.77 117 5.69 2,058 3 .15 34 1.65 473 23.01 967 47.03 0 0 460 22.37 119 5.79 2,056
PRINT SAVE
47
PR/Award # S165A200036
Page e188

FEED
ER
FEED
ER GRADE SP
AN
MAGNET
(S)
American
Indian/
Alaskian Native #
American
Indian/
Alaskian Native %
Asian
#
Asian
%
Black or African
American
#
Black or African
American
%
Hispan
ic/ Latino #
Hispan
ic/ Latino %
Native Haw
aiian or Other
Pacific Islander #
Native Haw
aiian or Other
Pacific Islander %
White #
White %
Two or more races #
Two or more races %
Total Students
Bayshore Elementary 0521 K‐5 James Stephens Elem 0 0 4 1 29 4 212 33 0 0 373 57 34 5 652
Edgewood Academy 0181 K‐5 James Stephens Elem 0 0 1 0 152 27 327 58 0 0 47 8 42 7 569
Gateway Elementary 0811 K‐5 James Stephens Elem 0 0 18 2 122 16 295 38 0 0 284 37 57 7 776
Harns Marsh Elementary 0231 K‐5 James Stephens Elem 0 0 8 1 216 20 581 55 0 0 170 16 81 8 1056
Manatee Elementary 0763 K‐5 James Stephens Elem 0 0 8 1 164 18 602 66 0 0 83 9 50 6 907
Orange River Elementary 0321 K‐5 James Stephens Elem 0 0 1 2 50 6 682 84 0 0 46 6 35 4 814
River Hall Elementary 0093 K‐5 James Stephens Elem 1 0 7 1 119 12 361 36 0 0 448 44 72 7 1008
Sunshine Elementary 0711 K‐5 James Stephens Elem 0 0 9 1 266 24 625 55 0 0 140 12 87 8 1127
Tice Elementary 0381 K‐5 James Stephens Elem 0 0 0 0 48 8 503 83 0 0 26 4 28 5 605
Tortuga Preserve Elementary 05 K‐5 James Stephens Elem 5 0 8 1 205 21 529 53 0 0 177 18 73 7 997
Treeline Elementary 0471 K‐5 James Stephens Elem 2 0 50 5 256 24 361 33 0 0 326 30 90 8 1085
TOTALS 8 0.08 114 1.19 1627 16.95 5078 52.92 0 0 2120 22.09 649 6.76 9596
LEA Name: School District of Lee County
Table 4: Enrollment Data‐Feeder School
Schools Actual Enrollment as of October 1, 2019 (Current School Year)
48
PR/Award # S165A200036
Page e189

FEED
ER
FEED
ER GRADE SP
AN
MAGNET
(S)
American
Indian/ Alaskian Native #
American
Indian/ Alaskian Native %
Asian
#
Asian
%
Black or African
American
#
Black or African
American
%
Hispan
ic/ Latino #
Hispan
ic/ Latino %
Native Haw
aiian or Other Pacific Islander #
Native Haw
aiian or Other Pacific Islander %
White #
White %
Two or more races #
Two or more races %
Total Students
Bayshore Elementary 0521 K‐5 James Stephens Elem 0 0.0 5 0.7 37 5.5 219 32.4 0 0 378 56.0 36 5.3 675
Edgewood Academy 0181 K‐5 James Stephens Elem 0 0.0 1 0.2 163 27.7 333 56.5 0 0 48 8.1 44 7.5 589
Gateway Elementary 0811 K‐5 James Stephens Elem 0 0.0 19 2.4 134 16.7 303 37.7 0 0 289 35.9 59 7.3 804
Harns Marsh Elementary 0231 K‐5 James Stephens Elem 0 0.0 9 0.8 228 20.9 596 54.5 0 0 177 16.2 83 7.6 1093
Manatee Elementary 0763 K‐5 James Stephens Elem 0 0.0 9 1.0 176 18.7 617 65.7 0 0 85 9.1 52 5.5 939
Orange River Elementary 0321 K‐5 James Stephens Elem 0 0.0 1 0.1 56 6.7 700 83.1 0 0 48 5.7 37 4.4 842
River Hall Elementary 0093 K‐5 James Stephens Elem 1 0.0 8 0.8 130 12.5 372 35.7 0 0 460 44.1 72 6.9 1043
Sunshine Elementary 0711 K‐5 James Stephens Elem 0 0.0 10 0.9 286 24.5 638 54.7 0 0 144 12.3 88 7.5 1166
Tice Elementary 0381 K‐5 James Stephens Elem 0 0.0 0 0.0 53 8.5 518 82.7 0 0 27 4.3 28 4.5 626
Tortuga Preserve Elementary 05 K‐5 James Stephens Elem 5 0.5 8 0.8 216 20.9 546 52.9 0 0 183 17.7 74 7.2 1032
Treeline Elementary 0471 K‐5 James Stephens Elem 2 0.2 51 4.5 273 24.3 369 32.9 0 0 336 29.9 92 8.2 1123
TOTALS 8 0.08 121 1.22 1752 17.64 5211 52.47 0 0 2175 21.90 665 6.70 9932
Schools Projected Enrollment as of October 1, 2021 (Year 2 of Project)
LEA Name: School District of Lee County
Table 4: Enrollment Data‐Feeder School
49
PR/Award # S165A200036
Page e190

FEED
ER
FEED
ER GRADE SP
AN
MAGNET
(S)
American
Indian/ Alaskian Native #
American
Indian/ Alaskian Native %
Asian
#
Asian
%
Black or African
American
#
Black or African
American
%
Hispan
ic/ Latino #
Hispan
ic/ Latino %
Native Haw
aiian or Other Pacific Islander #
Native Haw
aiian or Other Pacific Islander %
White #
White %
Two or more races #
Two or more races %
Total Students
Bayshore Elementary 0521 K‐5 James Stephens Elem 0 0.0 5 0.7 44 6.4 219 32.0 0 0 380 55.6 36 5.3 684
Edgewood Academy 0181 K‐5 James Stephens Elem 0 0.0 1 0.2 174 29.1 332 55.6 0 0 46 7.7 44 7.4 597
Gateway Elementary 0811 K‐5 James Stephens Elem 0 0.0 19 2.3 147 18.0 303 37.2 0 0 286 35.1 60 7.4 815
Harns Marsh Elementary 0231 K‐5 James Stephens Elem 0 0.0 9 0.8 241 21.8 595 53.7 0 0 180 16.2 83 7.5 1108
Manatee Elementary 0763 K‐5 James Stephens Elem 0 0.0 9 0.9 186 19.5 618 64.9 0 0 86 9.0 53 5.6 952
Orange River Elementary 0321 K‐5 James Stephens Elem 0 0.0 1 0.1 65 7.6 700 82.1 0 0 50 5.9 37 4.3 853
River Hall Elementary 0093 K‐5 James Stephens Elem 1 0.0 8 0.8 142 13.4 375 35.5 0 0 459 43.4 72 6.8 1057
Sunshine Elementary 0711 K‐5 James Stephens Elem 0 0.0 10 0.8 302 25.5 637 53.9 0 0 145 12.3 88 7.4 1182
Tice Elementary 0381 K‐5 James Stephens Elem 0 0.0 0 0.0 61 9.6 516 81.4 0 0 29 4.6 28 4.4 634
Tortuga Preserve Elementary 05 K‐5 James Stephens Elem 5 0.5 8 0.8 228 21.8 545 52.1 0 0 186 17.8 74 7.1 1046
Treeline Elementary 0471 K‐5 James Stephens Elem 2 0.2 51 4.5 286 25.1 372 32.7 0 0 335 29.4 92 8.1 1138
TOTALS 8 0.08 121 1.20 1876 18.64 5212 51.78 0 0 2182 21.68 667 6.63 10066
Schools Projected Enrollment as of October 1, 2022 (Year 3 of Project)
LEA Name: School District of Lee County
Table 4: Enrollment Data‐Feeder School
50
PR/Award # S165A200036
Page e191

FEED
ER
FEED
ER GRADE SP
AN
MAGNET
(S)
American
Indian/ Alaskian Native #
American
Indian/ Alaskian Native %
Asian
#
Asian
%
Black or African
American
#
Black or African
American
%
Hispan
ic/ Latino #
Hispan
ic/ Latino %
Native Haw
aiian or Other Pacific Islander #
Native Haw
aiian or Other Pacific Islander %
White #
White %
Two or more races #
Two or more races %
Total Students
Bayshore Elementary 0521 K‐5 James Stephens Elem 0 0.0 5 0.7 52 7.5 220 31.7 0 0 381 55.0 35 5.1 693
Edgewood Academy 0181 K‐5 James Stephens Elem 0 0.0 1 0.2 184 30.4 330 54.5 0 0 46 7.6 44 7.3 605
Gateway Elementary 0811 K‐5 James Stephens Elem 0 0.0 19 2.3 159 19.2 300 36.3 0 0 287 34.7 61 7.4 826
Harns Marsh Elementary 0231 K‐5 James Stephens Elem 0 0.0 9 0.8 258 23.0 596 53.1 0 0 177 15.8 83 7.4 1123
Manatee Elementary 0763 K‐5 James Stephens Elem 0 0.0 9 0.9 199 20.6 617 63.9 0 0 87 9.0 53 5.5 965
Orange River Elementary 0321 K‐5 James Stephens Elem 0 0.0 1 0.1 71 8.2 705 81.5 0 0 51 5.9 37 4.3 865
River Hall Elementary 0093 K‐5 James Stephens Elem 1 0.0 8 0.7 155 14.5 379 35.4 0 0 457 42.6 72 6.7 1072
Sunshine Elementary 0711 K‐5 James Stephens Elem 0 0.0 10 0.8 318 26.5 637 53.1 0 0 145 12.1 89 7.4 1199
Tice Elementary 0381 K‐5 James Stephens Elem 0 0.0 0 0.0 68 10.6 515 80.2 0 0 30 4.7 29 4.5 642
Tortuga Preserve Elementary 05 K‐5 James Stephens Elem 5 0.5 8 0.8 241 22.7 548 51.6 0 0 184 17.3 75 7.1 1061
Treeline Elementary 0471 K‐5 James Stephens Elem 2 0.2 51 4.4 299 25.9 375 32.5 0 0 334 28.9 93 8.1 1154
TOTALS 8 0.08 121 1.19 2004 19.64 5222 51.17 0 0 2179 21.35 671 6.58 10205
Schools Projected Enrollment as of October 1, 2023 (Year 4 of Project)
LEA Name: School District of Lee County
Table 4: Enrollment Data‐Feeder School
51
PR/Award # S165A200036
Page e192

FEED
ER
FEED
ER GRADE SP
AN
MAGNET
(S)
American
Indian/ Alaskian Native #
American
Indian/ Alaskian Native %
Asian
#
Asian
%
Black or African
American
#
Black or African
American
%
Hispan
ic/ Latino #
Hispan
ic/ Latino %
Native Haw
aiian or Other Pacific Islander #
Native Haw
aiian or Other Pacific Islander %
White #
White %
Two or more races #
Two or more races %
Total Students
Bayshore Elementary 0521 K‐5 James Stephens Elem 0 0.0 5 0.7 61 8.7 220 31.3 0 0 382 54.3 35 5.0 703
Edgewood Academy 0181 K‐5 James Stephens Elem 0 0.0 1 0.2 199 32.5 326 53.2 0 0 45 7.3 42 6.9 613
Gateway Elementary 0811 K‐5 James Stephens Elem 0 0.0 18 2.1 173 20.6 301 35.9 0 0 285 34.0 61 7.3 838
Harns Marsh Elementary 0231 K‐5 James Stephens Elem 0 0.0 9 0.8 277 24.3 593 52.1 0 0 177 15.5 83 7.3 1139
Manatee Elementary 0763 K‐5 James Stephens Elem 0 0.0 9 0.9 217 22.2 615 62.8 0 0 86 8.8 52 5.3 979
Orange River Elementary 0321 K‐5 James Stephens Elem 0 0.0 1 0.1 79 9.0 708 80.7 0 0 52 5.9 37 4.2 877
River Hall Elementary 0093 K‐5 James Stephens Elem 1 0.0 8 0.7 170 15.6 380 35.0 0 0 456 42.0 72 6.6 1087
Sunshine Elementary 0711 K‐5 James Stephens Elem 0 0.0 10 0.8 337 27.7 636 52.3 0 0 143 11.8 90 7.4 1216
Tice Elementary 0381 K‐5 James Stephens Elem 0 0.0 0 0.0 76 11.7 517 79.3 0 0 30 4.6 29 4.4 652
Tortuga Preserve Elementary 05 K‐5 James Stephens Elem 5 0.5 8 0.7 260 24.2 543 50.5 0 0 185 17.2 75 7.0 1076
Treeline Elementary 0471 K‐5 James Stephens Elem 2 0.2 52 4.4 318 27.2 372 31.8 0 0 333 28.5 93 7.9 1170
TOTALS 8 0.08 121 1.17 2167 20.94 5211 50.35 0 0 2174 21.00 669 6.46 10350
Schools Projected Enrollment as of October 1, 2024 (Year 5 of Project)
LEA Name: School District of Lee County
Table 4: Enrollment Data‐Feeder School
52
PR/Award # S165A200036
Page e193

FEED
ER
FEED
ER GRADE SP
AN
MAGNET
(S)
American
Indian/
Alaskian Native #
American
Indian/
Alaskian Native %
Asian
#
Asian
%
Black or African
American
#
Black or African
American
%
Hispan
ic/ Latino #
Hispan
ic/ Latino %
Native Haw
aiian or Other
Pacific Islander #
Native Haw
aiian or Other
Pacific Islander %
White #
White %
Two or more races #
Two or more races %
Total Students
Bonita Springs High School 0841 9‐11 South FM High 0 0.0 27 2.5 17 1.6 615 57.4 0 0 384 35.8 29 2.7 1072
Cypress Lake High School 0531 9‐12 South FM High 2 0.0 23 1.5 218 13.9 479 30.6 0 0 773 49.3 72 4.6 1567
Dunbar High School 0831 9‐12 South FM High 0 0.0 16 0.8 600 31.8 967 51.2 0 0 227 12.0 78 4.1 1888
Estero High School 0731 9‐12 South FM High 3 0.2 38 2.5 46 3.0 517 34.1 0 0 872 57.5 40 2.6 1516
Fort Myers High School 0221 9‐12 South FM High 4 0.2 110 5.6 383 19.5 329 16.8 0 0 1064 54.2 74 3.8 1964
TOTALS 9 0.11 214 2.67 1264 15.79 2907 36.31 0 0 3320 41.46 293 3.66 8007
LEA Name: School District of Lee County
Table 4: Enrollment Data‐Feeder School
Schools Actual Enrollment as of October 1, 2019 (Current School Year)
53
PR/Award # S165A200036
Page e194

FEED
ER
FEED
ER GRADE SP
AN
MAGNET
(S)
American
Indian/ Alaskian Native #
American
Indian/ Alaskian Native %
Asian
#
Asian
%
Black or African
American
#
Black or African
American
%
Hispan
ic/ Latino #
Hispan
ic/ Latino %
Native Haw
aiian or Other Pacific Islander #
Native Haw
aiian or Other Pacific Islander %
White #
White %
Two or more races #
Two or more races %
Total Students
Bonita Springs High School 0841 9‐12 South FM High 0 0.0 43 2.6 107 6.5 837 51.0 0 0 605 36.9 49 3.0 1641
Cypress Lake High School 0531 9‐12 South FM High 2 0.0 22 1.5 207 13.7 467 31.0 0 0 737 48.9 71 4.7 1506
Dunbar High School 0831 9‐12 South FM High 0 0.0 10 0.6 567 32.2 935 53.1 0 0 178 10.1 72 4.1 1762
Estero High School 0731 9‐12 South FM High 3 0.2 47 2.5 97 5.3 647 35.1 0 0 997 54.1 53 2.9 1844
Fort Myers High School 0221 9‐12 South FM High 4 0.2 108 5.8 360 19.5 297 16.1 0 0 1012 54.7 69 3.7 1850
TOTALS 9 0.10 230 2.67 1338 15.55 3183 37.00 0 0 3529 41.02 314 3.65 8603
Schools Projected Enrollment as of October 1, 2021 (Year 2 of Project)
LEA Name: School District of Lee County
Table 4: Enrollment Data‐Feeder School
54
PR/Award # S165A200036
Page e195

FEED
ER
FEED
ER GRADE SP
AN
MAGNET
(S)
American
Indian/ Alaskian Native #
American
Indian/ Alaskian Native %
Asian
#
Asian
%
Black or African
American
#
Black or African
American
%
Hispan
ic/ Latino #
Hispan
ic/ Latino %
Native Haw
aiian or Other Pacific Islander #
Native Haw
aiian or Other Pacific Islander %
White #
White %
Two or more races #
Two or more races %
Total Students
Bonita Springs High School 0841 9‐12 South FM High 0 0.0 43 2.6 106 6.3 871 52.0 0 0 607 36.2 49 2.9 1676
Cypress Lake High School 0531 9‐12 South FM High 2 0.0 22 1.4 207 13.1 520 32.9 0 0 758 48.0 71 4.5 1580
Dunbar High School 0831 9‐12 South FM High 0 0.0 10 0.6 560 31.8 940 53.4 0 0 178 10.1 72 4.1 1760
Estero High School 0731 9‐12 South FM High 3 0.2 47 2.5 97 5.1 683 36.2 0 0 1002 53.2 53 2.8 1885
Fort Myers High School 0221 9‐12 South FM High 4 0.2 108 5.6 361 18.6 347 17.9 0 0 1052 54.2 69 3.6 1941
TOTALS 9 0.10 230 2.60 1331 15.05 3361 38.01 0 0 3597 40.68 314 3.55 8842
Schools Projected Enrollment as of October 1, 2022 (Year 3 of Project)
LEA Name: School District of Lee County
Table 4: Enrollment Data‐Feeder School
55
PR/Award # S165A200036
Page e196

FEED
ER
FEED
ER GRADE SP
AN
MAGNET
(S)
American
Indian/ Alaskian Native #
American
Indian/ Alaskian Native %
Asian
#
Asian
%
Black or African
American
#
Black or African
American
%
Hispan
ic/ Latino #
Hispan
ic/ Latino %
Native Haw
aiian or Other Pacific Islander #
Native Haw
aiian or Other Pacific Islander %
White #
White %
Two or more races #
Two or more races %
Total Students
Bonita Springs High School 0841 9‐12 South FM High 0 0.0 43 2.5 107 6.2 918 53.3 0 0 607 35.2 48 2.8 1723
Cypress Lake High School 0531 9‐12 South FM High 2 0.0 22 1.4 208 12.8 560 34.5 0 0 761 46.9 71 4.4 1624
Dunbar High School 0831 9‐12 South FM High 0 0.0 10 0.6 558 31.5 959 54.1 0 0 175 9.9 72 4.1 1774
Estero High School 0731 9‐12 South FM High 3 0.2 47 2.4 97 5.0 718 37.0 0 0 1020 52.6 53 2.7 1938
Fort Myers High School 0221 9‐12 South FM High 4 0.2 108 5.4 362 18.1 377 18.9 0 0 1075 53.9 69 3.5 1995
TOTALS 9 0.10 230 2.54 1332 14.71 3532 39.01 0 0 3638 40.18 313 3.46 9054
Schools Projected Enrollment as of October 1, 2023 (Year 4 of Project)
LEA Name: School District of Lee County
Table 4: Enrollment Data‐Feeder School
56
PR/Award # S165A200036
Page e197

FEED
ER
FEED
ER GRADE SP
AN
MAGNET
(S)
American
Indian/ Alaskian Native #
American
Indian/ Alaskian Native %
Asian
#
Asian
%
Black or African
American
#
Black or African
American
%
Hispan
ic/ Latino #
Hispan
ic/ Latino %
Native Haw
aiian or Other Pacific Islander #
Native Haw
aiian or Other Pacific Islander %
White #
White %
Two or more races #
Two or more races %
Total Students
Bonita Springs High School 0841 9‐12 South FM High 0 0.0 41 2.4 104 6.0 945 54.9 0 0 583 33.9 48 2.8 1721
Cypress Lake High School 0531 9‐12 South FM High 2 0.0 21 1.3 204 12.6 581 35.8 0 0 743 45.8 71 4.4 1622
Dunbar High School 0831 9‐12 South FM High 0 0.0 10 0.6 539 30.3 985 55.4 0 0 173 9.7 71 4.0 1778
Estero High School 0731 9‐12 South FM High 3 0.2 47 2.4 97 5.0 739 38.2 0 0 1000 51.7 50 2.6 1936
Fort Myers High School 0221 9‐12 South FM High 4 0.2 107 5.4 355 17.8 398 20.0 0 0 1060 53.2 69 3.5 1993
TOTALS 9 0.10 226 2.50 1299 14.35 3648 40.31 0 0 3559 39.33 309 3.41 9050
Schools Projected Enrollment as of October 1, 2024 (Year 5 of Project)
LEA Name: School District of Lee County
Table 4: Enrollment Data‐Feeder School
57
PR/Award # S165A200036
Page e198

Table 5: Selection of Students-Competitive Preference 3
Instructions:
For each magnet school included in the project:
" Indicate whether or not academic examination is used as a factor in the selection of students for the magnet school and, if so, how it is used. " Briefly describe how students are selected (e.g., weighted lottery, first come/first served, etc.). In the description, identify the criteria that are used, if any,
in selecting students and indicate how each of those criteria is used in the process. " If the same process and use of academic criteria applies to more than one of the magnet schools included in the project, in the “Magnet School(s)” identify
all of the schools for which the student selection process applies. " Use additional sheets or space, if necessary. " Information on the student selection processes used by other magnet schools (i.e., magnet schools that are not included in the project) is not needed.
LEA Name: Magnet School(s): Check the appropriate box:
! Academic examination is a criterion in the magnet school student selection process.
! Academic examination is not a criterion in the magnet school student selection process.
Describe the student selection process.
Magnet School(s):
Check the appropriate box: !Academic examination is a criterion in the magnet school student selection process.
!Academic examination is not a criterion in the magnet school student selection process.
Describe the student selection process.
5858
South Fort Myers High School (both academic and non academic criterion)
School District of Lee County
James Stephens International Academy
South offers two programs. One, Cambridge, does have academic requirements, but doesn't prevent current South students from taking Cambridge Classes. The other program, Career Academies does not require an academic examination so all students are eligible. If a student doesn't enter through Cambridge they can apply for Career Academies. All students complete an application. Factors effecting enrollment include instructional capacity which is based on Florida's Class size Amendment and any other state requirements. There is also sibling preference for families with more than one child who can attend the same school with the same home address. Sibling preference may allow the family to directly enroll in a school once older sibling is established. Every student is a given a proximity preference based on their home address and nearest school locations. There are zone attractor or magnet programs available in enrollment. Finally there is a random lottery for every student applicant and preferences are weighted then students are assigned through the lottery process.
All students complete an application. Factors effecting enrollment include instructional capacity which is based on Florida's Class size Amendment and any other state requirements. There is also sibling preference for families with more than one child who can attend the same school with the same home address. Sibling preference may allow the family to directly enroll in a school once older sibling is established. Every student is a given a proximity preference based on their home address and nearest school locations. There are zone attractor or magnet programs available in enrollment. Finally there is a random lottery for every student applicant and preferences are weighted then students are assigned through the lottery process.
✔
✔
PR/Award # S165A200036
Page e199

Table 6: New or Revised Magnet School Projects-Competitive Preference 2
Instructions: For each magnet school identified in Tables 1 – 5:
" Briefly describe the nature of the change that is being made to the magnet school program at that school (for example, expansion of program from within school program serving 50 students to whole school program serving 400 students; adding medical sciences within school to complement other within school programs and serve greater total number of students; upgrade thematic curriculum to maintain program attractiveness; replace existing magnet program, etc.); and
" Explain the significance of the revision to the magnet school. Relevant information might include, for example, discussion of diminishing effectiveness of the existing program; what would be accomplished or achieved as a result of the revision to the magnet program; the expected benefits or effects that would result from implementation of the revision; the need, if appropriate, to expand from a within school program to a whole program; etc.
" If all of the schools participating in the project are new magnet schools, indicate “No Revised Magnet Schools Participating in the Project” in the first “Nature of Revision or Change to the Magnet School” box.
• Use additional sheets, if necessary. LEA Name: Magnet School: Nature of Revision or Change to the Magnet School: Explanation of How or Why the Revision is Significant:
5959
School District of Lee County
PRINT SAVE
No Revised Magnet Schools Participating in the Project
PR/Award # S165A200036
Page e200

60
PR/Award # S165A200036
Page e201

i
Career Academies Impacts on Students’ Engagement and Performance in High School
James J. Kemple Jason C. Snipes
March 2000
Manpower Demonstration Research Corporation
61
PR/Award # S165A200036
Page e202

Funders of the Career Academies Evaluation DeWitt Wallace–Reader’s Digest Fund Ford Foundation U.S. Department of Education U.S. Department of Labor The Commonwealth Fund Charles Stewart Mott Foundation William T. Grant Foundation The Pew Charitable Trusts The Rockefeller Foundation The George Gund Foundation
The Grable Foundation Richard King Mellon Foundation American Express Foundation Alcoa Foundation Russell Sage Foundation Center for Research on the Education
of Students Placed At Risk (CRESPAR) Westinghouse Foundation The Citigroup Foundation Bristol-Myers Squibb Foundation, Inc.
Dissemination of MDRC publications is also supported by MDRC’s Public Policy Outreach funders: the Ford Foundation, Ambrose Monell Foundation, Alcoa Foundation, and James Irvine Foundation. The findings and conclusions in this report do not necessarily represent the official positions or policies of the funders. For information about MDRC and copies of our publications, see our Web site: www.mdrc.org. MDRC® is a registered trademark of the Manpower Demonstration Research Corporation. Copyright © 2000 by the Manpower Demonstration Research Corporation
62
PR/Award # S165A200036
Page e203

-iii-
Contents
Tables and Figures iv Preface vii Acknowledgments ix Executive Summary ES-1
1 Introduction 1
I. The Origins of the Career Academy Approach and the Policy Context for This Report 2 II. Previous Research on Career Academies 6 III. A Conceptual Framework of the Career Academy Approach and
Its Potential Impact on Student Outcomes 8 IV. Key Features of the Career Academies Evaluation 13 V. Overview of This Report 18
2 Career Academy Students and Their Patterns of Enrollment in the Academy Programs 20
I. Students in the Study Sample for This Report 20 II. Subgroups of Students Defined by Characteristics Associated with
Dropping Out of High School 26 III. Career Academy Enrollment and Attrition Patterns 32
3 Career Academy Impacts on Student Engagement, Performance, and Achievement 43
I. Analysis Issues 44 II. Career Academy Impacts for Students in the High-Risk Subgroup 46 III. Career Academy Impacts for Students in the Low-Risk Subgroup 56 IV. Career Academy Impacts for Students in the Medium-Risk Subgroup 65 V. Career Academy Impacts Averaged Across the Student Subgroups 71 VI. Conclusions 72
4 Factors Associated with Student Outcomes and the Pattern of Career Academy Impacts 74
I. Potential Pathways to Positive Student Outcomes 74 II. Sources of Variation Among the Sites That May Be Associated
with Differences in Impacts 76
5 The Relationship Between Career Academy Implementation and Impacts 82
I. Contrasting Impacts for Students in the Medium-Risk Subgroup 83 II. Contrasting Impacts for Students in the High-Risk Subgroup 89 III. Contrasting Impacts for Students in the Low-Risk Subgroup 92 IV. Summary 94
Appendix A Supplementary Information About the Career Academies Evaluation Research Sample and Data Sources 97 Appendix B Strategies for Creating Subgroups of Students Defined by Characteristics Associated with Risk of Dropping Out 115
References 134 Recent Publications on MDRC Projects 136
63
PR/Award # S165A200036
Page e204

-iv-
Tables and Figures Table
ES-1 Background Characteristics of Students, by Subgroups Defined by Risk of Dropping Out of School ES-10
2.1 Background Characteristics of Study Sample, by Research Status 21
2.2 Background Characteristics of Study Sample, by Subgroups Defined by Risk of Dropping Out of School 29
2.3 Career Academy Enrollment and Attrition Rates for Selected Subgroups of the Academy Group 38
3.1 Impacts on School Enrollment and Attendance for Students in the High-Risk Subgroup 48
3.2 Impacts on Credits Earned and Course-Taking for Students in the High-Risk Subgroup 49
3.3 Impacts on Achievement Test Scores for Students in the High-Risk Subgroup 52
3.4 Impacts on Experiences During the 12th Grade Year for Students in the High-Risk Subgroup 54
3.5 Impacts on Planning and Preparation for College and Work for Students in the High-Risk Subgroup 57
3.6 Impacts on School Enrollment and Attendance for Students in the Low-Risk Subgroup 59
3.7 Impacts on Credits Earned and Course-Taking for Students in the Low-Risk Subgroup 61
3.8 Impacts on Achievement Test Scores for Students in the Low-Risk Subgroup 62
3.9 Impacts on Experiences During the 12th Grade Year for Students in the Low-Risk Subgroup 63
3.10 Impacts on Planning and Preparation for College and Work for Students in the Low-Risk Subgroup 64
3.11 Impacts on School Enrollment and Attendance for Students in the Medium-Risk Subgroup 66
3.12 Impacts on Credits Earned and Course-Taking for Students in the Medium-Risk Subgroup 67
3.13 Impacts on Achievement Test Scores for Students in the Medium-Risk Subgroup 68
3.14 Impacts on Experiences During the 12th Grade Year for Students in the Medium-Risk Subgroup 69
3.15 Impacts on Planning and Preparation for College and Work for Students in the Medium-Risk Subgroup 70
3.16 Impacts on Selected High School Outcomes for Students in the Study Sample 71
4.1 Students’ Perceptions of Interpersonal and Instructional Supports and Participation in Work-Related Activities, by High-Contrast and Low-Contrast Academies 78
5.1 Impacts on Enrollment, Attendance, and Course-Taking for Students in the Medium-Risk Subgroup, by High-Contrast and Low-Contrast Academies 84
5.2 Impacts on Youth Development Experiences and Preparation for the Future for Students in the Medium-Risk Subgroup, by High-Contrast and Low-Contrast Academies 87
64
PR/Award # S165A200036
Page e205

-v-
5.3 Impacts on Enrollment, Attendance, and Course-Taking for Students in the High-Risk Subgroup, by High-Contrast and Low-Contrast Academies 90
5.4 Impacts on Youth Development Experiences and Preparation for the Future for Students in the High-Risk Subgroup, by High-Contrast and Low-Contrast Academies 91
5.5 Impacts on Enrollment, Attendance, and Course-Taking for Students in the Low-Risk Subgroup, by High-Contrast and Low-Contrast Academies 93
5.6 Impacts on Youth Development Experiences and Preparation for the Future for Students in the Low-Risk Subgroup, by High-Contrast and Low-Contrast Academies 95
A.1 Data Availability for the Full Study Sample and the Risk Subgroups 99
A.2 Regression Coefficients for Probability of Being Assigned to the Academy Group for Full Study Sample and by Risk Subgroups 103
A.3 Regression Coefficients for Probability of Being Assigned to the Academy Group, Student School Records Database, for Full Study Sample and by Risk Subgroups 106
A.4 Regression Coefficients for Probability of Being Assigned to the Academy Group, 12th Grade Survey Database, for Full Study Sample and by Risk Subgroups 109
A.5 Regression Coefficients for Probability of Being Assigned to the Academy Group, 12th Grade Achievement Test Sample, for Full Sample and by Risk Subgroups 112
B.1 Relationship Between Baseline Characteristics and the Probability of Dropping Out of High School Among Non-Academy Students 119
B.2 Selected Outcomes Among Non-Academy Students, by Risk Subgroups Defined Using Risk-Factor Accumulation and Regression-Based Index 124
B.3 Outcome Levels for Bootstrap Control Samples and Program Group, by Risk Subgroups 130
Figure
ES-1 Career Academy Impacts on High School Outcomes in the High-Risk Subgroup ES-12
ES-2 Career Academy Impacts on High School Outcomes in the Low-Risk Subgroup ES-13
ES-3 Career Academy Impacts on High School Outcomes in the Medium-Risk Subgroup ES-15
ES-4 Career Academy Impacts on High School Outcomes for the Full Study Sample ES-16
ES-5 Simplified Conceptual Model of the Career Academy Approach ES-18
ES-6 Career Academy Impacts on High School Outcomes for Students in the Medium-Risk Subgroup, by High-Contrast and Low-Contrast Academies ES-20
1.1 Simplified Conceptual Model of the Career Academy Approach 9
1.2 Random Assignment Design 14
2.1 12th Grade Outcomes Among Non-Academy Students, by Risk Subgroup 33
2.2 Career Academy Enrollment and Attrition Patterns Among Students Selected to Enroll 35
B.1 Impact of Career Academies on Dropout Rate, by Deciles of the Regression-Based Risk Index 122
65
PR/Award # S165A200036
Page e206

-vi- 66
PR/Award # S165A200036
Page e207

-vii-
Preface
Career Academies have existed for more than 30 years, and they can now be found in an estimated 1,500 high schools nationwide. The durability and broad appeal of the Career Academy approach can be attributed, in part, to the fact that its core features offer direct responses to a number of problems that have been identified in large comprehensive high schools. Career Acad-emies consist of small learning communities that aim to create a more personalized and supportive learning environment for students and teachers. They combine academic and career-related courses in an effort to enhance both the rigor and the relevance of the high school curriculum. Ca-reer Academies form partnerships with local employers to expand students’ exposure to career options and skills requirements and to provide them with work-based learning experiences. The primary goals of the Career Academy approach are to enhance students’ engagement and per-formance in high school and provide them with the credentials and skills needed to make success-ful transitions to post-secondary education and, eventually, a career.
This report from MDRC’s ongoing Career Academies Evaluation is being released at a time when education policymakers and practitioners are pursuing a number of far-reaching strate-gies for improving American high schools. Many of these strategies include principles embedded in the Career Academy approach, while others include the Career Academy model as an explicit component. In short, Career Academies stand at the intersection of several major education re-forms aimed at transforming high schools into nurturing, productive places where students learn and grow and are prepared for careers in an economy that demands high skills and adaptability.
In partnership with the funding organizations listed at the front of this report and with staff from the participating sites, MDRC began an in-depth evaluation of the Career Academy ap-proach in 1993. The primary purpose is to provide policymakers and educators with reliable evi-dence about the extent to which the Academies deliver on their ambitious goals, outlined above. In particular, the evaluation provides a rigorous assessment of Career Academies’ effects on a range of education, developmental, and work-related outcomes for high school students. The study also offers lessons about how Career Academies operate and are sustained and about the pathways through which they affect students’ engagement and performance during high school and beyond.
This report marks an important milestone in the Career Academies Evaluation. Previous reports and papers from the study described some distinctive features of the Career Academies, relative to their regular school environments, and examined some differences in the school- and work-based experiences of Academy and non-Academy students in the study sample. These re-ports concluded that the distinctive features of the participating Career Academies had indeed en-hanced students’ experiences in school and the workplace. The current report provides evidence about the extent to which these enhancements translated into higher levels of school engagement and performance and whether Academy students are better prepared than their non-Academy peers to make the transition from high school to further education and the labor market.
The findings suggest that a growing number of high schools may be on the right path to-ward keeping students engaged in school and preparing them for further education and a career. Career Academies reduced dropout rates and improved school engagement among students least likely to do well in a regular school environment. While the Academies produced more modest
67
PR/Award # S165A200036
Page e208

-viii-
effects for other students, they created a more supportive school environment for all students and provided them with more opportunities to explore careers and engage in work-based learning op-portunities. It is not yet clear how the Academies affect students as they navigate the transition between high school and college and the labor market. The evaluation will continue to follow stu-dents in the study sample to assess the Academies’ longer-term post-high school effects.
The report draws on a particularly rigorous research design and an unusually rich data-base. This evaluation has demonstrated the feasibility and benefits of using a random assignment research design to determine the impact of Career Academies on student outcomes. A rarity in education research, this design provides an especially reliable way of comparing the performance of students who had access to an Academy with that of a truly comparable group of students who did not have access to the programs. The database consists of survey information provided by Academy and non-Academy students in the study sample, performance indicators obtained from school records and transcripts, and standardized test scores from a test MDRC administered to a sample of the students. The report also draws on qualitative information collected during the many field visits to each of the participating sites over the past seven years and through ongoing communication with the staff in the sites. Students in the study sample were identified in the 8th or 9th grade, and this report follows them through the end of their scheduled 12th-grade year until just before they would have graduated from high school.
It is our hope that the Career Academies Evaluation will continue to offer policymakers and educators useful lessons about what works for high school students and about the value of subjecting promising school reform approaches to rigorous tests of their effectiveness.
Judith M. Gueron President
68
PR/Award # S165A200036
Page e209

-ix-
Acknowledgments
This report marks the end of the first phase of the Career Academies Evaluation. Over the last seven years, the staff at MDRC have had the opportunity to work with and learn from an extraordinary group of sites, funders, and advisers. The products of this collaboration include the implementation of an exceptionally strong research design and the compilation of a deep and rich database. Previous reports from the study have acknowledged the contributions of the many individuals and organizations who helped lay the foundation for the evaluation and who played key roles in the preparation of those documents. This report is built upon that foundation and owes a special debt to these individuals and organizations.
First, the authors are indebted to the teachers, administrators, students, and employer partners at all of the Career Academy programs. Their experiences and insights taught us a great deal about life in Career Academies and in high schools. We also greatly appreciate the help of staff from each of the participating school districts who assisted MDRC in collecting the data for this report. Second, several key advisers to the evaluation offered useful feedback. In particular, David Stern of the University of California at Berkeley has been invaluable in providing guidance for further analyses and helping us gain better insights into the results. The theoretical framework for describing the likely effects of the Career Academy approach benefited from perspectives and analyses provided by James P. Connell and Lisa Bridges of the Institute for Research and Reform for Education, and from analyses conducted by Lauren Brown, a consultant to the project.
The following people provided thoughtful feedback on earlier drafts of the report or offered suggestions at briefings we held to discuss the findings: Kent McGuire and Nevzer Stacey of the U.S. Department of Education’s Office of Educational Research and Improvement; David Goodwin and Marcia Silverberg of the U.S. Department of Education’s Planning and Evaluation Service; Patricia McNeil of the U.S. Department of Education’s Office of Vocational and Adult Education; Stephanie Powers, Sharon Belli, and Chris Kulick of the National School-to-Work Office; Lorenzo Harrison, Gerri Fiala, Irene Lynn, Gerald Gunderson, Harry Holzer, David Lah, Eileen Pederson, Daniel Ryan, and Marlin Ferral of the U.S. Department of Labor.
The following individuals from the study’s funding organizations provided useful suggestions and advice during briefings we held to discuss the early findings: Kathy Beuchel of the Alcoa Foundation; Cyrus Driver of the Ford Foundation; Jeffery Glebocki of the George Gund Foundation; Peter Kleinbard and Edward Pauly of the Wallace Funds; Lonnie Sherrod of the William T. Grant Foundation; Terry Savage of the American Express Foundation; Christine Sturgis of the Charles Stewart Mott Foundation; and Michelle Yellowitz of the Commonwealth Fund.
Leaders from several of the Career Academy network organizations provided useful feedback on the findings: Charles Dayton of the Career Academy Support Network; Susan Tidyman of the California Department of Education; John Ferrandino and Bonnie Silvers of the National Academy Foundation; and Natalie Allen of Philadelphia Academies, Inc., and the National Career Academy Coalition.
Finally, members of MDRC’s Education Studies committee also provided valuable
69
PR/Award # S165A200036
Page e210

-x-
feedback on the findings: Richard Murnane, Anthony Alvarado, Thomas Bailey, Mary Jo Bane, A. Wayne Boykin, Michael Casserly, Jacquelyne Eccles, Richard Elmore, Charles M. Payne, and Isabel Sawhill.
From the beginning of the Career Academies Evaluation, Robert Ivry, MDRC’s Senior Vice President for Development and External Affairs, has played a pivotal role in building the partnerships with sites, funders, and advisers that form the foundation for the study. This report benefited greatly from his insights and guidance on sharpening the presentation of the findings and policy implications. Several MDRC staff members played key roles in acquiring and analyzing data for the evaluation. Anita Kraus, with help from Joel Gordon, prepared the final school records data files for analysis. Special thanks to Richard Hendra for processing the thousands of school transcript records and creating a rich set of outcome measures from them. Susan Poglinco conducted field research activities in several of the sites and provided useful information about the context within which the programs operated.
Katherine Jamieson provided research assistance, prepared the tables and figures, and coordinated the production of this report. Howard Bloom, Hans Bos, Charles Michalopoulos, and Winston Lin provided valuable perspectives and guidance on the strategy used to identify the subgroups discussed in the report. Fred Doolittle, Robert Granger, Robert Ivry, Susan Kagehiro, Marilyn Price, and JoAnn Rock reviewed drafts of the report. Robert Weber edited the report, and Stephanie Cowell prepared the manuscript for publication.
The Authors
70
PR/Award # S165A200036
Page e211

ES - 1
Executive Summary
The Career Academy approach is one of the oldest and most widely established highschool reforms in the United States. Career Academies have existed for more than 30 years andhave been implemented in more than 1,500 high schools across the country. The durability andbroad appeal of the Academy approach can be attributed, in part, to the fact that its core featuresoffer direct responses to a number of problems that have been identified in large comprehensivehigh schools. Career Academies attempt to create more supportive and personalized learning en-vironments through a school-within-a-school structure. Their curricula combine academic and oc-cupation-related course requirements that aim both to promote applied learning and to satisfycollege entrance requirements. Academies establish partnerships with local employers to build se-quences of career awareness and work-based learning opportunities for their students.
While the basic organizational features of the approach have remained the same since Ca-reer Academies’ inception, the goals and target population have changed. The original Academieswere designed primarily to prevent dropping out of high school and to increase preparation forwork among students who began high school at high risk of school failure. There is now wide-spread agreement that Career Academies should seek to prepare students for both work and col-lege, and that they should include a broad cross-section of students, including those who arehighly engaged in school.
There has been a great deal of research on the Academy approach. Nevertheless, previousstudies have been unable to determine reliably whether differences between Academy students’ highschool experiences and outcomes and those of other students result from the Academy itself or fromthe program’s student targeting or its selection practices. Further, little is known about the relative ef-fectiveness of Academies for different groups within the broad cross-section of students they nowserve. There have also been few opportunities to explore the extent to which different contexts andimplementation strategies may influence the effectiveness of the Academy approach.
This evaluation has demonstrated the feasibility and benefits of using a large-scale, multi-site random assignment research design to determine the impact of Career Academies on studentoutcomes. A rarity in education research, this design provides a uniquely rigorous way of com-paring the performance of students who had access to an Academy with the performance of atruly comparable group of students who did not have access to the programs. In order to addressa number of key policy issues for Academies and related high school reforms, this report focuseson three questions:
• To what extent does the Career Academy approach alter the high school environ-ment in ways that better support students academically and developmentally?
• To what extent does the Career Academy approach change educational, em-ployment, and youth development outcomes for students at greater or lesserrisk of school failure?
• How do the manner and context in which Career Academy programs are im-plemented influence their effects on student outcomes?
71
PR/Award # S165A200036
Page e212

ES - 2
This report marks a milestone in the Manpower Demonstration Research Corporation’s(MDRC) 10-year Career Academies Evaluation, which is being supported by the U.S. Depart-ments of Education and Labor and by 17 private foundations and organizations. The report fo-cuses on over 1,700 students who had applied for one of nine Career Academies participating inthe evaluation.1 The participating Academies were able to implement and sustain the basic fea-tures of the approach and have adapted to a wide range of local needs and circumstances. Theyinclude a range of technical, service-oriented, and business-related career themes and are locatedin small cities and large urban school districts. Students in the study sample were identified whenthey were in 8th or 9th grade, and this report follows them through the end of their scheduled 12th-grade year.
Findings in Brief and Policy Implications
Throughout this report, the term impact refers to differences between outcomes for stu-dents who were randomly selected to enroll in an Academy and those of students who also ap-plied but were not selected to enroll. Academy applicants were assigned to these groups at ran-dom, so there were no systematic differences in the characteristics or school experiences of theapplicants initially. Thus, subsequent differences in outcomes for the two groups reflect increasesor decreases caused by the Career Academies. Following is a summary of the key findings fromthe report.
• The Career Academies in this study increased both the level of interpersonalsupport students experienced during high school and their participation in ca-reer awareness and work-based learning activities.
• The Career Academies substantially improved high school outcomes amongstudents at high risk of dropping out. For this group, the Academies reduceddropout rates, improved attendance, increased academic course-taking, and in-creased the likelihood of earning enough credits to graduate on time.
• Among students least likely to drop out of high school, the Career Academiesincreased the likelihood of graduating on time. The Academies also increasedvocational course-taking for these students without reducing their likelihood ofcompleting a basic core academic curriculum.
• In sites where the Academies produced particularly dramatic enhancements inthe interpersonal support that students received from teachers and peers, theCareer Academies reduced dropout rates and improved school engagement forboth high-risk and medium-risk subgroups (about 75 percent of the studentsserved). Academies that did not enhance these supports actually increaseddropout rates and reduced school engagement for some students.
1Ten sites were initially selected for the evaluation. One of the initial Career Academies was disbanded after
two years in the study and was unable to provide sufficient follow-up data to be included in the impact analysis forthis report.
72
PR/Award # S165A200036
Page e213

ES - 3
• The Career Academies did not improve standardized math and readingachievement test scores.
• When the findings are averaged across the diverse groups of students in the fullstudy sample, it appears that the Career Academies produced only slight re-ductions in dropout rates and modest increases in other measures of school en-gagement. These aggregated findings, however, mask the high degree of varia-tion in effectiveness among different groups of students and across the differ-ent program contexts.
The findings that have emerged from the Career Academies Evaluation to date suggest thefollowing implications for policies aimed at improving high schools and helping students preparefor the transition from high school to further education and work.
• Career Academies provide a well-defined approach to creating more suppor-tive high school environments and increasing students’ exposure to careerawareness and work-based learning activities.
• Among students who are most at risk of dropping out of high school, CareerAcademies are an effective means of preventing dropout, increasing school en-gagement, and helping students acquire the credentials they need to graduateand prepare for post-secondary education.
• Career Academies should continue to serve a heterogeneous population of stu-dents. The pervasive positive impacts for students at high risk of dropping outmay derive, in part, from exposure to a highly engaged peer group who, onbalance, also benefit from exposure to several key dimensions of the Academyexperience.
• If Career Academies do not complement their career-related curriculum andwork-based learning activities with strong interpersonal and academic sup-ports, they risk reducing school engagement for some students. A highlystructured school-within-a-school organization can create a necessary set ofconditions for providing these supports.
• Career Academies should build on the effective organizational enhancementsthey bring to high school reform efforts if they are to improve academicachievement as measured by most standardized tests currently in use. Promis-ing approaches may involve aligning Career Academy curricula with high stan-dards and providing teachers with the incentives and capacity to deliver onsuch standards.
The above results capture the effects that the Career Academies have had on studentsthrough the end of their scheduled 12th-grade year. The evaluation does not yet include informa-tion about the rates at which these students actually graduated from high school and whether thedropouts eventually returned to high school or pursued an alternative credential. The next phaseof this evaluation will include this information and will follow the students in the study sample for
73
PR/Award # S165A200036
Page e214

ES - 4
four additional years as they make the transition from high school to post-secondary educationand employment opportunities.
The remainder of this Executive Summary describes the Career Academy approach ingreater detail, including its history, and discusses the current policy context and previous researchin the Career Academies Evaluation. It then describes the results of the evaluation and their impli-cations for policy and practice.
The Career Academy Approach
The Career Academy approach is distinguished by three core features that offer direct re-sponses to several problems that have been identified in high schools, particularly those serving low-income communities and students at risk of school failure. First, a Career Academy is organized as aschool-within-a-school in which students stay with a group of teachers over three or four years in highschool. Such arrangements are often referred to as “small learning communities.” The aim is to create amore personalized and supportive learning environment for students and teachers. Second, a CareerAcademy offers students a combination of academic and vocational curricula and uses a career themeto integrate the two. Third, a Career Academy establishes partnerships with local employers in an ef-fort to build connections between school and work and to provide students with a range of career de-velopment and work-based learning opportunities. This definition of an Academy is now commonlyaccepted and was reviewed by a broad range of researchers, policymakers, and practitioners who haveworked closely with Career Academies.
The initial Career Academies of the 1970s and 1980s were primarily vocational educationprograms targeted at students who appeared to be at high risk of dropping out of high school.The central goals of these early programs were to keep students engaged in school, provide themwith work-related learning experiences both in the classroom and on the job, and establish clearerpathways between high school and post-secondary employment.
Since the late 1980s, there has been a shift in the primary goals and target population ofmost Career Academies. In particular, there is now wide agreement that the Career Academy ap-proach should be explicitly distinct from traditional vocational education by seeking to preparestudents for both work and college. Vocational education, as defined in federal law and throughits historical legacy, has been directed at preparing young people for occupations that do not tra-ditionally require advanced degrees. In line with what has been called “the new vocational educa-tion,” Career Academies now seek to include a broad range of students and to combine a rigorousacademic curriculum with exposure to extensive information about an industry both in the work-place and in the classroom. The career theme is used to integrate curricula and provide exposureto a broad array of careers in a given field and does not typically focus on preparing students forjobs in those areas.
The 1990s have seen extraordinary growth in the number of Career Academies around thecountry. There are estimated to be more than 1,500 Career Academies nationwide, representingnearly a 15-fold increase in approximately 10 years; many more Academies are in the planningstages. Much of this growth can be traced to the increasing number of national, state, and districtAcademy support networks. Although most Career Academies share the approach’s basic ele-
74
PR/Award # S165A200036
Page e215

ES - 5
ments, the Academy model has been adapted to a wide range of local needs and circumstances,resulting in a variety of versions that emphasize different features over others.
The expansion of Career Academy target populations and goals and the rapid growth inthe number of Academies have raised several questions about how the Academy approach may beaffecting students’ performance in high school. How well does it meet the needs of a muchbroader range of students than it was initially designed to serve? Is the Academy approach moreeffective under some conditions than under others? Which features of the Academy model makethe most difference for students? MDRC’s Career Academies Evaluation is intended to shed lighton these and other questions.
The Current Policy Context
This report is being released at a time when education policymakers and practitioners are pur-suing a number of far-reaching strategies for improving American high schools. Many of these strate-gies include principles embedded in the Career Academy approach, while others include the CareerAcademy model as an explicit component. Two key policy initiatives are particularly relevant.
First, states, school districts, and employers are now looking for strategies and approachesthat can build on the foundation established by the School-to-Work Opportunities Act (STWOA)of 1994. STWOA was aimed at enhancing the relevance and rigor of school- and work-basedlearning and at creating clearer pathways between high school and post-secondary education andcareers. This was to be done primarily through partnerships between schools and local employers.STWOA specifically identifies Career Academies as a “preferred approach” to creating such part-nerships and implementing the principles embedded in the legislation. STWOA is scheduled tosunset in 2001 — adding urgency to these efforts and heightening interest in concrete evidence ofthe potential payoff of Career Academies.
Second, the U.S. Department of Education has committed itself to several initiativesaimed specifically at addressing problems that are unique to high schools. Many of these initiativesare being supported under the Comprehensive School Reform Demonstration developed withinthe Office of Educational Research and Improvement (OERI) and the New American HighSchools established by the Office of Vocational and Adult Education (OVAE). Although most ofthe strategies that are being developed involve comprehensive reforms of entire high schools,many include key elements of the Academy approach, including the creation of a small school-within-a-school, integration of academic and vocational curricula, and the establishment of part-nerships with employers and other organizations in the community.
The findings presented in this report will shed light on the extent to which the CareerAcademy model, and some of the high school reform approaches embedded in the model, canachieve the goals sought by their proponents.
75
PR/Award # S165A200036
Page e216

ES - 6
The Career Academies Evaluation
In 1993, MDRC began an evaluation of the Career Academy approach as it had been de-fined in previous research and implemented in a broad range of settings across the country. Theevaluation’s primary goal is to provide policymakers and educators with reliable evidence aboutthe impact that Career Academies have on students’ success in high school and their transition tofurther education and the labor market. The evaluation will also offer lessons about how CareerAcademies operate and are sustained and about the pathways through which Academies affectstudent engagement and performance in school.
The current report is based on information collected over a six-year period and focuses on ninehigh schools and their Career Academies.2 Each of the Academies had established the basic CareerAcademy components described earlier: a school-within-a-school organization, an integratedacademic/vocational curriculum, and employer partnerships. Moreover, this combination of featureswas not available elsewhere in the participating high schools.3 These Academies were selected toinclude school districts and high schools reflecting the typical conditions (large urban centers and smallcities) under which Career Academies have been implemented across the country. MDRC wasspecifically interested in Academies serving a broad range of students, including those who wereperceived to be at risk of not succeeding in the regular high school environment. Most of the schooldistricts in the evaluation are large and enroll substantially higher percentages of African-American andHispanic students than school districts nationally. On average, these school districts have higherdropout rates, higher unemployment rates, and higher percentages of low-income families.
The Career Academies Evaluation is a rarity in the field of education research in that it hasdemonstrated the feasibility and benefits of implementing a large-scale, multi-site random assign-ment research design within an ongoing high school program. This was made possible becauseeach of the Career Academies in the study received applications from approximately twice asmany students as it was able to serve. This reports focuses on a sample of 1,764 students (referredto in this report as the study sample) who applied for one of the Career Academies selected forthe study. Of these, 959 students were randomly assigned to the program group (referred to inthis report as the Academy group) and were accepted for admission to the Academies. The re-maining 805 students were randomly assigned to a control group (referred to in this report as thenon-Academy group) and were not invited to participate in the Academies, although they couldchoose other options in the high school or school district.
The random assignment process ensured that there were no systematic differences be-tween the two groups of students in terms of their observable and unobservable background char-acteristics, prior school experiences, and initial motivation and attitudes toward school. Any sys-
2For a more detailed description of the criteria and process used to select sites for this study, see James J.
Kemple and JoAnn Leah Rock, Career Academies: Early Implementation Lessons from a 10-Site Evaluation (NewYork: MDRC, 1996).
3Although some participating high schools do operate other programs that they classify as Career Academies,information collected for this study indicated that most such programs do not include all the basic components ofthe Academy approach described earlier. As a result, the participating Career Academy programs represent a clearcontrast with the other programs in the high schools.
76
PR/Award # S165A200036
Page e217

ES - 7
tematic differences that subsequently emerged between the groups can be attributed with confi-dence to differences in their access and exposure to the Career Academies.
MDRC obtained data for this report from four sources:
• school transcript records, including information about students’ daily atten-dance rates, credits earned toward graduation, and course-taking patterns;
• student surveys that asked a wide range of questions about school experi-ences, employment and work-related experiences, extracurricular activities,preparation for college and post-secondary jobs, and plans for the future;
• standardized math computation and reading comprehension tests admin-istered to 490 students from the study’s sample (from both the Academy andthe non-Academy groups) at the end of their 12th-grade year;4 and
• qualitative field research conducted throughout the evaluation to documentAcademies’ characteristics, local contexts, staff, students, and employer partners.
Students in the study sample were identified at the end of 8th or 9th grade. This report fol-lows them for three or four years through the end of their scheduled 12th-grade year, until justbefore they would have graduated from high school. The primary focus of the report is on out-comes measured at the end of students’ scheduled 12th-grade year. Unless otherwise noted, theimpact findings discussed in the report are statistically significant, indicating that one may have ahigh degree of confidence that measured differences in outcomes between the Academy and thenon-Academy groups were not a result of chance.
Previously Reported Findings on How Career Academies Changed Students’High School Experiences
The previous reports from this evaluation examined the extent to which Career Academieschanged the high school environment as indicated by differences between Academy and non-Academy students’ experiences during high school.5 Following is a brief overview of key findingsfrom these reports.
•• The Career Academies enhanced the degree of interpersonal support stu-dents received from teachers and peers.
4The test instrument comprised the reading comprehension and math test batteries from the National Educa-
tional Longitudinal Survey of 1988 (NELS: 88) Follow-up Study. A total of 490 students from the study samplecompleted the test, including both high school dropouts and students who remained enrolled in school.
5For a more detailed discussion of these findings, see James J. Kemple, Career Academies: Communities ofSupport for Students and Teachers: Emerging Findings from a 10-Site Evaluation (New York: MDRC, 1997); James J.Kemple, “Selected Dimensions of Applied Learning in Career Academy Classrooms,” unpublished MDRC paper, 1997;and James J. Kemple, Susan M. Poglinco, and Jason C. Snipes, Career Academies: Building Career Awareness andWork-Based Learning Activities Through Employer Partnerships (New York: MDRC, 1999).
77
PR/Award # S165A200036
Page e218

ES - 8
During their early years in high school, Academy students received more support fromtheir teachers and peers than did their counterparts in non-Academy high school environments.For example, compared with their non-Academy peers, Academy students reported that theirteachers had higher expectations of them and that teachers provided them with more individual-ized attention. Moreover, compared with their non-Academy counterparts, Academy studentswere more likely to report that their classmates were highly engaged in school and that they hadmany opportunities to collaborate with their peers on school and work-related projects.
• Career Academies increased students’ participation in career awarenessand work-based learning experiences during high school.
Academies also increased students’ exposure to work-related learning experiences inschool and in the workplace. Academy students were more likely than their non-Academy peersto be exposed to career-related themes or activities in the classroom. They were also more likelyto participate in career-related activities such as job-shadowing or field trips. Finally, Academystudents were more likely than non-Academy students to participate in a planned program ofwork experience and to have high-quality work-based learning experiences during high school.
• The Career Academies in this evaluation demonstrated their capacity toattract large numbers of applicants and to include students with a widerange of demographic and education characteristics.
The growth of the Career Academy movement has been accompanied by questions aboutwhether the programs can and should serve a broad range of students and about which studentsbenefit most from them. Reflecting the shift in goals and target populations of Career Academiesnationwide, the programs in this evaluation attracted a mix of students including those at risk ofdropping out of high school or failing academically as well as students who had done well inschool. Most of the students in the study sample are from minority backgrounds — 56 percent areHispanic, and 30 percent are African-American — reflecting the racial and ethnic make-up of theircommunities. Also, more than one-third of the students came from single-parent households, andabout one-quarter indicated that their families received public assistance. At the same time, justunder half the students reported that both their parents were employed, and about one-third re-ported that at least one parent had attended college.
• Approximately 88 percent of the students selected for admission to a Ca-reer Academy actually enrolled in the programs, and 58 percent of thoseselected remained in an Academy throughout high school.
Of the students who were initially selected for admission, about 12 percent chose not toenroll, and another 30 percent enrolled in the programs and then left before the end of their 12th-grade year. It is unclear how much of this attrition could possibly be controlled or avoided by theCareer Academies. Student mobility and early dropout are common in most urban school districts,and they were reasons for attrition from the Academies in this evaluation. Just under one-quarterof the students who never enrolled in an Academy or who enrolled and then left reported that theydid so because their families moved and they had to transfer to other schools. Another 20 percentreported that they were asked to leave the programs or dropped out of high school altogether.The remaining students (approximately 55 percent of those who were not enrolled in an Academy
78
PR/Award # S165A200036
Page e219

ES - 9
in the 12th grade) chose not to enroll or chose to leave the programs. The most common reasonsstudents gave for not enrolling or for not remaining enrolled in an Academy were that theywanted to enroll in another program, they lost interest in the occupational area, or they did notthink the Academy would help them get into a good college.
The Impact of Career Academies on Student Outcomes
The central theme that has emerged from the Career Academies Evaluation thus far is thatthe Academies affected the outcomes for students who were likely to drop out of high schoolmuch more than they affected the outcomes for other students. When the results are averagedacross the diverse groups of students they serve, it appears that the Academies produced onlyslight reductions in dropout rates, modest improvements in students’ progress toward high schoolgraduation, and increases in career-related course-taking and involvement in positive youth devel-opment activities. These aggregate results mask a high degree of variation in the Career Acade-mies’ potential to make a difference and in the actual differences they made for some students.
To assess this variation in impacts, the study sample was divided into three subgroups based onselected background characteristics and prior school experiences. These characteristics were chosen asindicators of students’ engagement in school at the time they applied for an Academy and as factorsassociated with the likelihood of their eventually dropping out of school. (See Table ES-1 for a list ofthe background characteristics used to define these subgroups.) Just over one-quarter of the studentswere classified as being in the high-risk subgroup and reflected the combination of characteristics asso-ciated with the highest probability of dropping out among those in the non-Academy group. Approxi-mately one-quarter of the students in the sample were classified as being in the low-risk subgroup andreflected the combination of characteristics associated with the lowest probability of dropping outamong those in the non-Academy group. The remaining students (approximately half the sample) weredefined as being in the medium-risk subgroup.
Because each of the characteristics used to define the subgroups was measured beforestudents were randomly assigned to the two main study groups, there are no systematic differ-ences in observed background characteristics between Academy and non-Academy groups withineach of the three risk subgroups.6 The following sections summarize the impact findings for thesesubgroups.
6The definition of these subgroups involved analyses using background characteristics to predict dropping out
among students in the non-Academy group. This generated an index of average characteristics of likely dropoutswho did not have access to an Academy. The index was then calculated for the Academy group using the samecharacteristics. Because the predicted relationship between background characteristics and dropout rates was basedon the non-Academy group, however, it is likely to yield somewhat more accurate predictions of likely dropouts forthat group than for the Academy group. This means that the dropout rate for the students in the high-risk non-Academy group may be artificially high. Extensive analyses were conducted to identify the potential magnitude ofthis distortion. These analyses indicate that whatever distortion exists is minimal and could not have changed thepattern of impacts. This issue is discussed in greater detail in Appendix B of the report.
79
PR/Award # S165A200036
Page e220

ES - 10
Table ES-1
Career Academies Evaluation
Background Characteristics of Students,by Subgroups Defined by Risk of Dropping Out of School
High-Risk Medium-Risk Low-RiskSubgroup Subgroup Subgroup
Characteristic (%) (%) (%)
Characteristics associated with dropping out of school
Attendance rate, year prior to random assignment96-100% 24.4 52.5 91.091-95% 23.6 32.3 7.986-90% 18.7 11.7 1.085% or lower 33.3 3.6 0.2
Credits earned in 9th grade.a
5 or more credits 47.2 93.8 100.03-4 credits 35.1 6.3 0.02 or fewer credits 17.7 0.0 0.0
Grade point average in year of random assignmentb
3.1 or higher 12.5 37.2 58.62.1-3.0 25.5 44.0 39.32.0 or lower 62.0 18.7 2.1
Student is overage for grade levelc 43.0 18.2 2.4
School mobilityd
0 or 1 different school 50.0 71.9 99.02 or more different schools 50.0 28.1 1.0
Student has sibling who dropped out of high school 42.7 17.5 0.5
Sample size (N=1,764) 474 869 421
SOURCES: MDRC calculations from the Career Academies Evaluation Student Baseline Questionnaire and StudentSchool Records Databases.
NOTES: All characteristics were measured at the time students applied to the Career Academy program and prior tobeing randomly selected to the Academy and non-Academy groups. Invalid or missing values are not included in individual variable distribution. Rounding may cause slightdiscrepancies in calculating of sums and differences. Statistical significance tests are not included.
aThis was applicable only to students who applied to the Career Academy at the end of their 9th-grade year.
bGrade point averages were converted to a standard 4.0 scale from 100-point or 5-point scales for some sites. cA student is defined as overage for grade at the time of random assignment if she or he turned 15 before the start
of the 9th grade, or 16 before the start of the 10th grade. This indicates that the student was likely to have been heldback in a previous grade.
dSchool mobility is defined as the number of schools attended since the 1st grade beyond the number expectedtoresult from promotions in grade level or graduations.
80
PR/Award # S165A200036
Page e221

ES - 11
Career Academy Impacts for Students in the High-Risk Subgroup
As shown in Table ES-1, students in the high-risk subgroup entered the study with back-ground characteristics and prior school experiences indicating that they were disengaged fromschool. More than half had failed courses during the 9th grade, and about one-third could be clas-sified as chronic absentees (having attendance rates lower than 85 percent). Most of these stu-dents had low grade point averages (2.0 or lower), and over 40 percent had been held back in aprevious grade (as indicated by being overage for their current grade).
Figure ES-1 provides a summary of the impact findings for students in the high-risk sub-group. It shows first that, without access to an Academy, a high percentage of non-Academy stu-dents in the high-risk subgroup had become even more disengaged from school. In all, 32 percentof these students dropped out of high school, and only 26 percent had earned sufficient credits tomeet the district’s graduation requirements by the end of their scheduled 12th-grade year.
•• Among students at high risk of school failure, Career Academies signifi-cantly cut dropout rates and increased attendance rates, credits earnedtoward graduation, and preparation for post-secondary education.
Figure ES-1 shows that the Career Academies produced substantial improvements in manyeducational outcomes for students in the high-risk subgroup. In particular, while 32 percent of thenon-Academy students in the high-risk subgroup dropped out of high school, 21 percent of theAcademy students did so. This 11 percentage point difference represents a one-third reduction inthe dropout rate for the non-Academy group. This can be classified as a particularly large reduc-tion in dropout rates. Reductions of this magnitude are rare for school-based interventions.
The Academies also significantly increased average attendance throughout high school forstudents in the high-risk subgroup (not shown in Figure ES-1). Average attendance ratesthroughout high school were approximately 76 percent for students in the non-Academy group,compared with 82 percent for students in the Academy group. This amounts to an additional 11days of school per year over four years.
Moreover, while 26 percent of the high-risk non-Academy group had earned enoughcredits to meet district graduation requirements, 40 percent of the students in the Academy groupdid so (an increase of over 50 percent beyond the non-Academy group average). This suggeststhat, besides improving attendance and preventing students from dropping out, the Academieshelped a significant portion of the high-risk subgroup to make up enough of the initial gap incredits earned to meet the district’s graduation requirements three year later.
Also, as indicated by the third set of bars in Figure ES-1, the Academies doubled the per-centage of students in the high-risk subgroup who completed a basic core academic curriculum(four English courses, three social studies courses, two math courses, and two science courses).At the same time, students in the Academy group were significantly more likely than their non-Academy counterparts to complete three or more career-related or vocational courses.
The fifth set of bars in Figure ES-1 indicates that the Academies increased the percentageof students in the high-risk subgroup who reported that they had submitted an application to atwo-year or four-year college by the end of their 12th-grade year. In particular, 35 percent of stu-
81
PR/Award # S165A200036
Page e222

ES - 12
dents in the high-risk non-Academy group reported submitting a college application, comparedwith 51 percent in the Academy group. Academy students in the high-risk subgroup were alsomore likely to report taking the SATs or ACTs (not shown in the figure).
Figure ES-1
Career Academy Impacts on High School Outcomes in the High-Risk Subgroup
SOURCES: MDRC calculations from the Career Academies Evaluation Student School Records and 12th Grade Survey Databases.
NOTE: A two-tailed t-test was applied to differences between Academy and non-Academy groups. Statistical significance levels are indicated as: *** = 1 percent; ** = 5 percent; * = 10 percent.
21%
40%
32%
58%
51%
61% 63%
35%32%
26%
16%
38%35%
56% 55%
39%
0%
10%
20%
30%
40%
50%
60%
70%
80%
90%
100%
Dropped Outof School
CompletedCredits toGraduate
CompletedAcademic
Core Courses
3+ Career orVocational
Courses
Applied toCollege
Applied forEmployment
YouthDevelopment
Activities
Risk-TakingBehavior
High School Outcomes
Per
cent
age
of S
tude
nts
Academy
Non-Academy
***
***
***
***
**
Finally, the last two sets of bars in Figure ES-1 indicate that Academies did not produce asystematic change in involvement in positive youth development activities or in negative risk-taking behaviors. Positive youth development activities included participation in community vol-unteer work, receiving recognition for participation in academic or extracurricular activities, andreceiving an academic award. Negative risk-taking behaviors included coming to school on drugs,becoming a parent, being expelled from school, and being arrested. Although the differences be-tween the groups shown in Figure ES-1 were not statistically significant, they indicate trends in apositive direction.
Career Academy Impacts for Students in the Low-Risk Subgroup
Figure ES-2 presents a summary of the impact findings for students in the low-risk sub-group. The results for the non-Academy group indicate that, even without access to the Academyintervention, these students appear to be unlikely to disengage from school. For example, as thefirst set of bars in Figure ES-2 illustrates, only 3 percent of the non-Academy students in the low-risk subgroup dropped out of high school before the end of 12th grade. Almost the same percent-age of Academy students (2 percent) dropped out.
82
PR/Award # S165A200036
Page e223

ES - 13
•• Career Academies increased the likelihood that students in the low-risksubgroup were prepared to graduate on time. For these students, theAcademies also increased career-related and vocational course-takingwithout reducing the likelihood of completing a basic academic core cur-riculum.
Figure ES-2
Career Academy Impacts on High School Outcomes in the Low-Risk Subgroup
2%
86%
59%
77%
71%
56%
80%
16%
3%
75%
61%
42%
79%
57%
76%
16%
0%
10%
20%
30%
40%
50%
60%
70%
80%
90%
100%
Dropped Outof School
CompletedCredits toGraduate
CompletedAcademic
Core Courses
3+ Career orVocational
Courses
Applied toCollege
Applied forEmployment
YouthDevelopment
Activities
Risk-TakingBehavior
High School Outcomes
Per
cent
age
of S
tude
nts
Academy
Non-Academy**
****
SOURCES: MDRC calculations from the Career Academies Evaluation Student School Records and 12th Grade Survey Databases.
NOTE: A two-tailed t-test was applied to differences between Academy and non-Academy groups. Statistical significance levels are indicated as: *** = 1 percent; ** = 5 percent; * = 10 percent.
The second set of bars in Figure ES-2 indicates that the Academies increased the percentage ofstudents in the low-risk subgroup who earned sufficient credits to meet their district’s graduation re-quirement. The figure shows that 86 percent of the Academy students met their districts’ graduationrequirement, compared with 75 percent of the students in the non-Academy group.
Also, while approximately equal percentages of Academy and non-Academy students inthe low-risk subgroup completed a basic core academic curriculum, the Academies significantlyincreased the percentage who completed at least three career-related or vocational courses. Itshould be noted than many students in the low-risk non-Academy group were likely to be enrolledin their high school’s college preparatory programs and courses. Thus, the Academies increasedvocational course-taking for the low-risk subgroup while enabling students to complete as manycore academic courses as their non-Academy peers.
The fifth set of bars in Figure ES-2 indicates that the Academies reduced the percentage ofthe low-risk subgroup who reported that they had submitted an application to a two-year or four-year college by the end of their 12th-grade year. Among these students, 79 percent of the non-
83
PR/Award # S165A200036
Page e224

ES - 14
Academy group reported submitting a college application, compared with 71 percent of theAcademy group. Although not shown in the figure, this occurred despite the fact that Academyand non-Academy students were equally likely to have taken the SATs and ACTs. In addition,over 85 percent of students in both low-risk groups reported that they had conducted at least amodest amount of research on college options during their 12th-grade year.
Figure ES-2 also shows that Academy and non-Academy students in the low-risk sub-group were equally likely to pursue post-secondary employment opportunities. Further analysesindicated that the Academies do not appear to have induced students to pursue post-secondaryemployment opportunities instead of either a two-year or four-year college. Further follow-up isneeded to determine the effects that the Career Academies may have had on actual college en-rollment and employment during the years following high school graduation. This will be exploredfurther in subsequent reports from the Career Academies Evaluation.
Finally, the last two sets of bars in Figure ES-2 show that the Academies did not producestatistically significant changes in the low-risk subgroup’s involvement in positive youth develop-ment activities or risk-taking behavior.
Career Academy Impacts for Students in the Medium-Risk Subgroup
• On average, the Career Academies produced little or no change in out-comes for students in the medium-risk subgroup. Results for medium-riskstudents differed considerably across the participating sites.
The medium-risk subgroup represents approximately 50 percent of the students in the studysample. As shown in Table ES-1, the characteristics of this subgroup do not provide a clear indicationof likely school success or disengagement. Figure ES-3 presents a summary of impact findings for stu-dents in the medium-risk subgroup. The figure indicates that, on average, the Academies had little orno impact on most outcomes for these students. As discussed below, however, the results for the me-dium-risk subgroup differed dramatically across the participating sites.
Impact Findings for the Full Sample
• When averaged across the diverse groups of students and sites partici-pating in the evaluation, it appears that the Career Academies producedonly modest improvements in students’ engagement and performanceduring high school.
Figure ES-4 provides a summary of impact findings that are averaged across the full sam-ple of students in the study. It suggests that the Academies produced only slight (and not statisti-cally significant) reductions in dropout rates and in student involvement in negative risk-takingbehaviors. On average, the Academies produced modest increases in the percentage of studentswho earned sufficient credits to meet district graduation requirements and in student involvementin youth development activities. In keeping with one of the central features of the Academy ap-proach, Figure ES-4 indicates a more substantial increase in vocational course-taking. This in-crease did not come at the expense of students’ being less likely to complete at least a basic core
84
PR/Award # S165A200036
Page e225

ES - 15
academic curriculum. In general, however, according to the full sample findings, the CareerAcademies tended to produce small, positive (but not statistically significant) impacts on manystudent outcomes. As discussed earlier, these aggregate findings mask a great deal of underlyingvariation that sheds light on the potential strengths and limitations of the Academy approach.
Figure ES-3
Career Academy Impacts on High School Outcomesin the Medium-Risk Subgroup
9%
65%
49%
66%63% 61%
71%
24%
8%
65%
51%48%
63%
55%
69%
26%
0%
10%
20%
30%
40%
50%
60%
70%
80%
90%
100%
Dropped Outof School
CompletedCredits toGraduate
CompletedAcademic
Core Courses
3+ Career orVocational
Courses
Applied toCollege
Applied forEmployment
YouthDevelopment
Activities
Risk-TakingBehavior
High School Outcomes
Per
cent
age
of S
tude
nts
Academy
Non-Academy
***
SOURCES: MDRC calculations from the Career Academies Evaluation Student School Records and 12th GradeSurvey Databases.
NOTE: A two-tailed t-test was applied to differences between Academy and non-Academy groups. Statisticalsignificance levels are indicated as: *** = 1 percent; ** = 5 percent; * = 10 percent.
•• The Career Academies did not improve standardized measures of readingand math achievement either on average or for any subgroup of students.
According to standardized achievement tests completed by 490 students in the study sam-ple, the Career Academies did not produce any systematic improvement in students’ math andreading test scores. Although impacts on test scores followed trends found for other outcomes,such as academic course-taking, there was no clear pattern of increases or decreases either on av-erage or among the risk subgroups.
Among students in the high-risk subgroup, average math and reading test scores for theAcademy group were somewhat higher than scores for the non-Academy group. While none ofthe differences was statistically significant, test scores followed this subgroup’s trend of increasesin academic course-taking and total credits earned toward graduation. Academy students in thelow- and medium-risk subgroups had slightly lower reading test scores than their non-Academycounterparts. This is consistent with the slight (but not statistically significant) reduction in aca-
85
PR/Award # S165A200036
Page e226

ES - 16
demic course-taking, which was found to be more highly correlated with reading test scores thanwas non-academic course-taking. There was almost no difference in math test scores betweenAcademy and non-Academy students in the low- and medium-risk subgroups.
Figure ES-4
Career Academy Impacts on High School Outcomes for the Full Study Sample
10%
65%
48%
67%62%
59%
72%
24%
12%
44%
56%
67%
27%
59% 60%
46%
0%
10%
20%
30%
40%
50%
60%
70%
80%
90%
100%
Dropped Outof School
CompletedCredits toGraduate
CompletedBasic CoreCoursesa
3+ Career orVocational
Courses
Applied tocollege
Applied foremployment
YouthDevelopment
Activities
Risk TakingBehavior
High School Outcomes
Per
cent
age
of S
tude
nts
Academy
Non-Academy
**
*
a
**
SOURCES: MDRC calculations from the Career Academies Evaluation Student School Records and 12th Grade Survey Databases.
NOTE: A two-tailed t-test was applied to differences between Academy and non-Academy groups. Statistical significance levels are indicated as: *** = 1 percent; ** = 5 percent; * = 10 percent.
10%
65%
48%
67%62%
59%
72%
24%
12%
44%
56%
67%
27%
59% 60%
46%
0%
10%
20%
30%
40%
50%
60%
70%
80%
90%
100%
Dropped Outof School
CompletedCredits toGraduate
CompletedAcademic
Core Courses
3+ Career orVocational
Courses
Applied toCollege
Applied forEmployment
YouthDevelopment
Activities
Risk-TakingBehavior
High School Outcomes
Per
cent
age
of S
tude
nts
Academy
Non-Academy
***
***
Several factors may account for these test score findings. First, qualitative field researchinformation collected for this evaluation indicated that academic curricula and instruction in mostof the Career Academies did not differ substantially from those of typical high schools; Academyteachers were required to cover the same basic material as teachers of the same subjects in therest of the high school. Nor were Academy teachers typically provided with professional devel-opment opportunities beyond those offered to their non-Academy counterparts, which focused onstandard-setting and instructional strategies in the academic subjects.
Second, there were some important differences between the sample of students who com-pleted the math and reading achievement tests and those who did not. In particular, the magnitudeof impacts for the achievement test sample was somewhat smaller and more mixed than the mag-nitude of impacts described above. For example, among students in the high-risk subgroup whocompleted the math and reading tests, the Academies produced a somewhat smaller reduction indropout rates and a somewhat smaller increase in academic course-taking compared with the im-pacts displayed in Figure ES-1. Among students in the medium-risk subgroup who completed thetest, it appears that the Academies actually reduced academic course-taking. In short, the test
86
PR/Award # S165A200036
Page e227

ES - 17
score sample does not appear to be representative of the full study sample. Nonetheless, there wasnot a systematic difference in background characteristics between the Academy and non-Academystudents in the achievement test sample. Thus, test score impact estimates provide a reliable indi-cation of the Academies’ impact (or lack of impact) on test scores.
Finally, the types of standardized measures of achievement used in this evaluation, and inmany school districts, may not adequately capture learning gains that Academy students achieverelative to their non-Academy counterparts. As discussed in an earlier report from this evaluation,Academy teachers were more likely than their non-Academy colleagues to state that they madeexplicit efforts to plan lessons and activities that cut across academic and non-academic subjectareas.7 They were also more likely to have students focus on problem-solving activities and to in-tegrate problems and examples from the world of work into their lessons. Academy students weremore likely than their non-Academy peers to indicate that they received instruction that includedcross-discipline integration and connections between school-based and work-based learning. If thepotential benefits of such activities and experiences are of value to schools, they will likely need tobe measured through some alternative forms of assessment.
What Factors Help Explain the Pattern of Career Academy Effects?
Figure ES-5 illustrates a conceptual model of the pathways through which the core or-ganizational features of the Career Academy approach are hypothesized to affect student out-comes during high school and beyond. The first column of the figure lists the three core organiza-tional elements of the Career Academy approach: (1) the school-within-a-school, (2) the inte-grated academic and vocational curricula based on the Academy’s career theme, and (3) the em-ployer partnerships. Three types of supports and learning opportunities (the second column inFigure ES-5) are hypothesized to evolve from the core organizational elements and their interac-tion: (1) enhanced interpersonal support through the intensive collaboration offered by the school-within-a-school, (2) focused curricula and enriched teaching and learning through the combinationof academic and vocational courses, and (3) exposure to career awareness and work-based learn-ing opportunities through the employer partnerships. Together, these supports are intended to in-crease students’ school engagement and prevent them from dropping out, enhance their perform-ance and help them meet graduation requirements and prepare for post-secondary education andemployment, and promote constructive use of non-school hours by increasing developmentallyappropriate activities and reducing risk-taking behaviors.
For this report, a variety of analyses were aimed at assessing the relationships betweenstudent outcomes and measures of supports and learning opportunities that are likely to arise fromthe Career Academy’s organizational elements. The findings from these analyses suggest that thestrongest associations appear to exist between the interpersonal supports students received earlyin high school and various measures of their subsequent engagement and performance. The inter-personal supports include students’ perceptions of their teachers’ expectations for them, person-alized attention they receive from teachers, the degree to which they see their peers as being en-
7James J. Kemple, “Selected Dimensions,” cited above.
87
PR/Award # S165A200036
Page e228

ES - 18
gaged in school, and the degree to which they have opportunities to work collaboratively withpeers.
Both Academy and non-Academy students who reported that they received particularlyhigh levels of support from their teachers and peers in 9th or 10th grade were less likely to drop outof high school, exhibit chronic absenteeism, or engage in risk-taking behaviors than were studentswho reported lower levels of interpersonal support. They were also more likely to make steadyprogress toward graduation and to engage in positive youth development activities. One should becautious about making inferences about causal relationships in this regard. For example, studentswho achieve positive outcomes may attract strong support from teachers and peers, rather thanthe other way around. Nevertheless, the patterns of cross-site impacts described below providefurther evidence that interpersonal supports are likely to be important antecedents to positive out-comes for students.
Figure ES-5
Career Academies Evaluation
Simplified Conceptual Model of the Career Academy Approach
College degreesand other educationalattainment
Integration of schooland work
High-wage andcareer-orientedemployment
Post-SecondaryOutcomes
High SchoolOutcomes
School engagement
School performance
Youth developmentand risk-takingexperiences
College andemploymentpreparation
Supports andLearning
Opportunities
Interpersonalsupports
Focused curriculaand enrichedlearningopportunities
Career awarenessand work-basedlearningopportunities
Career AcademyOrganizational
Elements
School-within-a-school organization
Academic andvocationalcurricula based oncareer theme
Employerpartnerships
88
PR/Award # S165A200036
Page e229

ES - 19
•• In several participating sites, the Career Academies represented a particu-larly dramatic contrast with their non-Academy school environments. Spe-cifically, these Academies produced particularly large increases in the level ofinterpersonal support students received early in high school, relative to thelevel experienced by students in the non-Academy environments.
To explore the relationship between changes in the school environment that the Acade-mies represent and the impact that Academies have on student outcomes, the evaluation at-tempted to identify sites in which Academies produced the largest differences in the level of inter-personal support students experienced. Specifically, the individual sites in the evaluation wereranked according to the difference between the percentages of Academy and non-Academy stu-dents who reported receiving a high level of support from teachers and peers during 9th or 10th
grade. For the purposes of this report, the sites with the largest differences are referred to as high-contrast Academies. In the remaining sites, there was little difference in the level of support re-ported by Academy and non-Academy students; these sites are referred to as low-contrastAcademies.
Finally, there are several important similarities between the two groups of sites. Both high-contrast and low-contrast Academies produced substantial increases in students’ exposure to ca-reer awareness and development opportunities and their participation in work-based learning ac-tivities. It should be noted, however, that within the two groups of sites, some Academies pro-duced much larger increases in students’ exposure to these activities and experiences than others.
• The high-contrast Academies produced a consistent pattern of positiveimpacts for students in the medium-risk subgroup. On average, the low-contrast Academies increased dropout rates and reduced academiccourse-taking among these students.
The patterns of impacts for students in the medium-risk subgroup differed dramaticallybetween the high-contrast Academies and the low-contrast Academies. As shown in Figure ES-6,in general the high-contrast Academies produced impacts that were similar but smaller in magni-tude to impacts for students in the high-risk subgroup (Figure ES-1): they reduced dropout rates,increased credits earned toward graduation, and increased the percentage of students completinga basic core academic curriculum. Figure ES-6 also indicates that the low-contrast Academiesactually increased dropout rates and reduced the percentage of students who completed a basiccore curriculum.
While it is not possible to pinpoint the source of differences in impact findings for high-and low-contrast Academies, differences in program implementation may suggest some explana-tions. For example, qualitative field research information collected for the evaluation indicatedthat the high-contrast Academies tended to have implemented a tighter school-within-a-schoolorganization compared with the low-contrast sites. The high-contrast Academies typically in-cluded a core group of four or five teachers whose responsibilities fell almost exclusively withinthe Academy. The vast majority of students in high-contrast sites were scheduled together inat least two or three core courses, and very few non-Academy students had to be included in theAcademy classes (for example, to ensure adequate enrollments). The high-contrast Academiesalso tended to be located in a distinct area of the school building or campus. These features of the
89
PR/Award # S165A200036
Page e230

ES - 20
high-contrast Academies may have nurtured a more personalized learning environment and helpedstudents and teachers feel that they were part of something unique within the school. The tightlyorganized school-within-a-school may also have served as a foundation for enhancing instruc-tional supports, curriculum integration, and connections between school and work.
The school-within-a-school organization of the low-contrast Academies tended to be moreloosely structured and typically included several teachers who had responsibilities both in and out-side the Academy. A number of Academy students in low-contrast sites were scheduled in non-Academy sections of core courses, and several of the Academy classes included non-Academystudents in order to ensure adequate enrollments. These aspects of program implementationtended to minimize the contrast between the Academy and non-Academy environments. It is diffi-cult to determine how this might account for the apparent reduction in school engagement amongthe medium-risk subgroup in these sites. It may be that without a tightly organized, highly sup-portive school-within-a-school environment, the other aspects of the Academy experience (addi-tional vocational courses, career awareness activities, and work-based learning) may have becomesomewhat of a distraction or burden.
Figure ES-6
Career Academy Impacts on High School Outcomesfor Students in the Medium-Risk Subgroup,
by High-Contrast and Low-Contrast Academies
HighContrast
LowContrast
5% 11% 13%5%
0%
20%
40%
60%
80%
100%
HighContrast
LowContrast
Academy
Non-Academy
Figure 1: Dropped Out of High School
HighContrast
LowContrast
68%62% 62%
69%
0%
20%
40%
60%
80%
100%
HighContrast
LowContrast
Academy
Non-Academy
Figure 2: Completed Credits to Graduate
HighContrast
LowContrast
58%49%
37%
54%
0%
20%
40%
60%
80%
100%
HighContrast
LowContrast
Academy
Non-Academy
Figure 3: Completed Academic Core Courses
HighContrast
LowContrast
62%50%
72%
46%
0%
20%
40%
60%
80%
100%
HighContrast
LowContrast
Academy
Non-Academy
Figure 4: Earned 3+ Career/Vocational Credits
***
***
SOURCE: MDRC calculations from the Career Academies Evaluation Student School RecordsDatabase.
NOTE: A two-tailed t-test was applied to differences between Academy and non-Academy groups.Statistical significance levels are indicated as: *** = 1 percent; ** = 5 percent; * = 10 percent.
***
**
***
90
PR/Award # S165A200036
Page e231

ES - 21
In general, the patterns of impacts for the high-risk and low-risk subgroups were consis-tent across both groups of sites, with two notable exceptions. First, the low-contrast Academiesproduced a somewhat larger reduction in dropout rates among the high-risk subgroup. Althoughthe difference in impacts on dropout rates was not statistically significant, this pattern is not con-sistent with the hypothesis that greater enhancement of interpersonal supports should lead tolarger reductions in dropout rates. It is not clear what accounts for the pattern. Second, the low-contrast Academies produced somewhat larger increases in vocational course-taking for both thehigh-risk and the low-risk subgroups. This may reflect a greater emphasis on vocational course-taking in low-contrast sites and the fact that, on average, relatively few non-Academy students inthese sites completed three or more career-related or vocational courses during high school.
Policy Implications and Lessons for Practice
Although the story of the Career Academies’ longer-term effectiveness is not yet com-plete, the findings to date suggest the following implications and lessons.
• The Career Academies in this study demonstrate the feasibility of imple-menting a well-defined and effective approach to creating a more suppor-tive high school environment and increasing students’ exposure to careerawareness and work-based learning activities.
Large comprehensive high schools (including those participating in this study) have beencriticized for being impersonal and for preventing students and teachers from working as teams tocreate a sense of community and common values. Students in such schools do not have a consis-tent group of teachers who are accountable for their success, and they see few of the same class-mates from course to course. Teachers rarely share the same group of students with a small num-ber of colleagues, and they have few opportunities to coordinate their coursework with teachersin other disciplines. The findings from this evaluation provide evidence that the Career Academiescan provide well-defined and effective approaches to addressing such problems.
Another common problem identified in high schools is that students and teachers are iso-lated from other institutions in the community, particularly employers. Such isolation insulatesstudents from the world of work and misses an opportunity to provide them with learning-oriented exposure to it at a particularly formative point in their development. With few connec-tions among classes or between school and work, many students are inadequately informed aboutor are unprepared for post-secondary education and employment opportunities. Even with the riseof the school-to-work movement and with the federal School-to-Work Opportunities Act of1994, there has been a struggle to identify widely implemented strategies that address these con-cerns. The findings from this evaluation indicate that Career Academies can provide concrete ex-amples of partnerships between schools and employers and can substantially enhance students’exposure to career development and work-based learning opportunities.
• Career Academies are an effective means of enhancing the school en-gagement of students who are at high risk of dropping out of high school.
91
PR/Award # S165A200036
Page e232

ES - 22
Many of the students served by Career Academies enter high school at a substantial risk ofdropping out; many others are likely to become psychologically disengaged from school and tomake only limited progress toward graduation. Some of these students have already fallen behindor are disengaged when they enter high school, while others come from home environments thatlack the support or resources to facilitate academic persistence and success. Without the inter-vention of the Academies, about 1 in 3 of these young people will drop out of high school. Previ-ous research has shown that the economic and social costs of not securing a high school diplomaare extremely high.
The findings from this evaluation show that the Career Academies substantially reduceddropout rates and substantially improved a variety of measures of school engagement among stu-dents in the high-risk subgroup. Not only are effects of this magnitude and pervasiveness rare inthe world of education policy interventions, but the long-term payoff, if the effects persist, islikely to be large.
• Career Academies should continue to serve a heterogeneous studentpopulation.
Because the largest and most pervasive positive effects in this evaluation were foundamong students in the high-risk subgroup, it might be argued that the Career Academies shouldserve only such students. This approach is likely to create a number of problems, however. First,Career Academies have explicitly attempted to move away from targeting students on the basis oftheir estimated trajectories for school success in order to avoid the tracking and stigma that havebeen associated with vocational and career-related programs. Second, and perhaps more impor-tant, it is likely that exposure to a broad cross-section of students — particularly those who enterthe programs highly engaged in school — is an important factor driving the positive effects of Ca-reer Academies on the high-risk subgroup. Perhaps the presence of other, highly engaged studentsin their classrooms helps increase teachers’ attention to and expectations for all students. Exclud-ing engaged students, therefore, would dramatically change the nature of the Academy experiencefor students at high risk of dropping out.
• Interpersonal supports appear to be necessary conditions for maximizingthe positive effects Career Academies have on student engagement. Theschool-within-a-school organization can provide an effective strategy forenhancing these supports.
The findings indicate that enhancing interpersonal supports may be a key element ofschool reform initiatives aimed at increasing retention and engagement in school. A highly struc-tured school-within-a-school organization can provide some of the necessary conditions for pro-moting such supports as personalized attention and high expectations from teachers, high levels ofpeer engagement, and opportunities for teachers and students to work collaboratively. CareerAcademies that did not complement their career awareness and work-based learning activitieswith increased supports (relative to what was already available in the regular school environment)risked having some of their students become disengaged from school.
92
PR/Award # S165A200036
Page e233

ES - 23
• Although Career Academies provide a number of supports necessary tokeep students engaged in school, these have not been sufficient to enhanceachievement, at least as measured by commonly used standardized tests.
The primary added value of Career Academies appears to rest on their enhanced interper-sonal supports and increased access to career awareness and work-based learning opportunities.Although these factors may be necessary to keep many students engaged in school, they were notsufficient to improve student achievement. The findings from this evaluation indicate that the Ca-reer Academies were quite similar to regular school environments in terms of their academic cur-ricula and typical instructional strategies. From this standpoint, it should not be too surprising thatthe Academies did not I mprove student achievement as measured by the standardized math andreading tests used in the evaluation. Academies face many of the same challenges that most highschools do in providing teachers and students with appropriate incentives and supports to ensurethat they focus on clearly specified learning objectives and that they have the capacity to meetthose objectives. The personalized and collaborative nature of the Career Academy’s school-within-a-school organization can serve as a solid foundation on which to build these enhance-ments.
There is also a question about whether current assessment instruments (including theachievement tests used in this evaluation) adequately capture the distinctive learning gains thatAcademy students may attain. Such skills may include, for example, the type of work-relatedcompetencies outlined in the Secretary’s Commission on Achieving Necessary Skills (SCANS) orthe presentation and organizational skills often exhibited in student portfolio assessments. In orderto measure such potential benefits of a Career Academy, school officials may want to considerincorporating alternative forms of student and teacher assessment. They may also want to developforums that recognize efforts by teachers to integrate academic course content with the appliedlearning and problem-solving approaches of high-quality vocational curricula. Few examples ofsuch assessments and incentives currently exist.
• Longer-term follow-up is needed to ascertain the effects of CareerAcademies on post-secondary labor market and educational outcomes.
The results in the report summarize the effects that the Career Academies have had onstudents through the end of the year they were scheduled to be in 12th grade. The data do not in-clude complete information about actual high school graduation rates or about the critical transi-tion between high school and post-secondary education and work. Further follow-up is needed inorder to get a more complete picture of the Academies’ effectiveness and limitations. For exam-ple, it will be important to determine whether the reduction in dropout rates among students in thehigh-risk subgroup translates into higher levels of educational attainment or whether these stu-dents simply remain in school longer without earning a diploma or do not go beyond high school.It will also be important to determine whether the Career Academy experience helped or hinderedstudents in the low-risk subgroup, particularly regarding their actual rates of college enrollmentand completion. Ultimately, measures of success for Career Academies are likely to depend, inpart, on whether the students they attempted to serve are better attached and more successful inthe labor market than their non-Academy counterparts.
93
PR/Award # S165A200036
Page e234

ES - 24
In order to examine these issues, MDRC’s Career Academies Evaluation will continuethrough 2003, following the students in the study sample for up to four years after their scheduledgraduation from high school. As part of this second phase of the evaluation, MDRC will be ad-ministering follow-up surveys to students in the study sample at one year and four years followingtheir scheduled graduation. These surveys will provide information about whether the students’actually graduated from high school (or received an alternative credential) and about their enroll-ment and progress through post-secondary education, their labor market experiences, their prepa-ration and planning for the future, and a range of youth development experiences.
94
PR/Award # S165A200036
Page e235

-1-
Chapter 1
Introduction
This report summarizes results from the first phase of the Career Academies Evaluation being conducted by the Manpower Demonstration Research Corporation (MDRC). Career Acad-emies have existed for over 30 years and have been implemented in approximately 1,500 high schools across the country. The durability and broad appeal of the Academy approach can be at-tributed, in part, to the fact that its core features offer direct responses to a number of problems that have been identified in large comprehensive high schools.
Career Academies attempt to create more supportive and personalized learning environ-ments through a school-within-a-school structure. Their curricula combine academic and occupa-tion-related course requirements that aim both to promote applied learning and to satisfy college entrance requirements. Academies establish partnerships with local employers to build sequences of career awareness and work-based learning opportunities for their students. The primary goals of the Career Academy approach are to enhance students’ performance in high school and provide them with the credentials and skills needed to make a successful transition to post-secondary edu-cation and, eventually, a career.
This is the latest in a series of reports and papers from MDRC’s Career Academies Evaluation, which is being funded by the U.S. Departments of Education and Labor and 17 pri-vate foundations and organizations. It adds to findings presented earlier in this evaluation in sev-eral ways.
First, this report assesses the impact Career Academies have on students’ high school en-gagement and performance and on their preparation for post-secondary education and employ-ment. The previous reports from this study presented descriptive information about the Academy programs and focused on measures of students’ exposure to key dimensions of the Academy ap-proach earlier in their high school careers. This report adds to these findings by following students in the study sample through the end of their 12th-grade year and by examining a much more exten-sive set of student outcomes. It assesses the impact Career Academies have on keeping students enrolled and engaged in school, on the types of courses they take, on math and reading achieve-ment test scores, on participation in extracurricular activities, on risk-taking behaviors, and on whether students are prepared to enter post-secondary education and employment. As discussed later in this chapter, the evaluation is built on a random assignment research design that can pro-vide unusually rigorous evidence about the impact Career Academies have on students.
Second, this report examines the relative effectiveness of the Academy approach for sev-eral key subgroups of students and among the sites represented in the study sample. The previous reports and papers from MDRC’s Career Academies Evaluation focused primarily on findings that were aggregated across the full sample of students and sites in the study sample. While such find-ings shed light on the implementation and impact of the Career Academy approach more gener-ally, they mask the extent to which the Career Academies may change certain outcomes for some students but not necessarily for others. They also mask the high degree of variation among the sites and the ways this variation may be associated with differences in effectiveness. A central goal
95
PR/Award # S165A200036
Page e236

-2-
of this report, therefore, is to determine how the manner and context in which Career Academies are implemented affect their capacity to make a difference for students.
Third, this report attempts to push much further in offering lessons about the efficacy of the Career Academy approach and of other school reform initiatives that are embedded in it. While the findings presented here provide an assessment of the effectiveness of particular Career Academies, the study design and the available data provide unique opportunities to go beyond this. For example, the sites vary significantly in terms of the types of interpersonal and instruc-tional supports they offer students and in the types of work-related learning opportunities they provide. The contrast among the sites and the differences in effectiveness for key subgroups of students provide a rich context for making judgments about what types of school reform initia-tives are likely to be effective and for whom.
Finally, this report serves as a platform for further analyses to determine the long-term im-pact of the Career Academy approach. MDRC’s Career Academies Evaluation is scheduled to continue until 2003, following students for up to four years beyond high school. During this sec-ond phase of the evaluation, MDRC will prepare additional reports examining the effect Career Academies have on students’ post-secondary outcomes and exploring connections between high school experiences and success in higher education and the labor market.
The remainder of this introductory chapter sets the context for the Career Academies Evalua-tion and this report. It is divided into four sections. Section I presents a short history of the Career Academy approach and sets the current policy context for the evaluation and its findings. Section II reviews findings from previous research on Career Academies and highlights areas where the current evaluation can fill important gaps in what is known about their effectiveness. Section III describes a conceptual framework for understanding the Career Academy approach and its potential effects on students during high school and beyond. Section IV describes several key features of the Career Acad-emies Evaluation design that are particularly relevant to this report.
I. The Origins of the Career Academy Approach and the Policy Contextfor This Report
The interpretation and significance of the findings from this evaluation should be viewed inthe context of both the history of the Career Academy approach and the current policy initiatives that intersect with that history. This section of the chapter provides a brief summary of the origins of the Career Academy approach and an overview of the policy context into which this report will be released.
A. The Origins and Growth of the Career Academy Approach
The first Career Academy was established in 1969 in Philadelphia, Pennsylvania.1 This Electrical Academy was designed primarily as a vocational training program targeted to non-
1For a more detailed history of the Career Academies, see Stern, Raby, and Dayton, 1992; Academy for Educa-tional Development, 1989; Snyder and McMullan, 1987. The term Career Academy was designated by Stern, Raby, and Dayton to encompass all the various strands of academies that had evolved up to that point.
96
PR/Award # S165A200036
Page e237

-3-
college-bound students. Building on the Philadelphia experience, in the 1980s, the Edna McCon-nell Clark Foundation provided initial funding to establish Academies in Pittsburgh, Pennsylvania; Portland, Oregon; and Menlo-Atherton and Redwood City, California. Based on the experience of the programs established in Menlo-Atherton and Redwood City (known as the Peninsula Acad-emies), the California State Legislature passed a bill providing funding for up to 10 school dis-tricts to establish new Academies (later referred to as California Partnership Academies) begin-ning in the 1985-86 school year. Meanwhile, the American Express Company, in collaboration with the New York City Public schools, established Academy programs focused on the financial industry. By the end of the 1980s, it is estimated that there were over 100 Academies in Philadel-phia, California, and the cities that received Clark Foundation start-up grants or support from the American Express Company.
These early Career Academies shared several characteristics that have important implica-tions for the current state of Academies and the Academy movement. First, the initial Academies were primarily vocational education programs targeted for students who appeared to be at high risk of dropping out of high school. The central goals of these early programs were to keep stu-dents engaged in school, provide them with work-related learning experiences both in the class-room and on the job, and establish clearer pathways between high school and work. This vision for the Career Academy approach was adopted, in large part, to deal with many of the major problems that were identified with American high schools in the 1970s and 1980s. In fact, the leg-islation authorizing funding for the California Partnership Academies expressly states that the programs must target “educationally disadvantaged high school students,” defined as “students who are at risk of dropping out of high school.”2
Second, the early programs in Philadelphia and California established the basic organiza-tional elements that eventually came to define the Career Academy approach as a distinctive high school reform initiative. They were organized as schools-within-schools and used a career theme to help coordinate academic and vocational curricula. Each of the programs also established part-nerships with local employers to build connections between school and work for its students, and to secure funding for the programs. Although these organizational features were not used explic-itly to define the Career Academy approach until recently, they were clearly identifiable and could be replicated under a wide range of circumstances.3
Third, beginning with the very first Academies in Philadelphia, there have been efforts to document their success and to justify their ongoing operation and expansion on the basis of their evidence. The initial replications sponsored by the Edna McConnell Clark Foundation were under-taken, in part, because of the documented success of the Philadelphia Academies. The Clark Foundation, along with the William and Flora Hewlett Foundation, also provided funding for an evaluation of the first 10 California Academies. The evidence from this evaluation played a key role in extending and expanding the state legislation to create many more Academies. In addition to evaluation research, the initial Academies were the subject of implementation research to document strategies for creating and sustaining new programs. This research and documentation
2Stern, Raby, and Dayton, 1992. 3Researchers, policy advisors, and practitioners at the Career Academy Support Network engaged in an exten-
sive consensus-building process among various organizations and individuals associated with Career Academies to arrive at a commonly agreed-upon definition of a Career Academy. This definition is articulated in Stern, Dayton, and Raby, 1998.
97
PR/Award # S165A200036
Page e238

-4-
led to more systematic technical assistance and staff development efforts for both existing Acad-emies and those in the planning stages.
B. The Current State of the Career Academy Movement
The 1990s have seen extraordinary growth in the number of Career Academies around the country. Currently, there are estimated to be approximately 1,500 Career Academies nationwide (nearly a 15-fold increase over 10 years) and many more in the planning stages. Much of this growth can be traced to the increasing number of national, state, and district Academy support networks. As of the 1998-99 school year, the California Department of Education has provided funding for nearly 200 Partnership Academies. It also provides support for several technical assis-tance and professional development services, including an annual conference. In addition to the state-funded Partnership Academies, there are estimated to be over 200 other Academies in Cali-fornia that are patterned after the Partnership Academy model but are supported through local efforts. Building on the California legislation and Partnership Academy model, Illinois, Florida, Hawaii, and other states have also established statewide networks of Academies. In 1988, a con-sortium of business, labor, and education leaders established the Philadephia High School Acad-emies (PHSA), Inc., to oversee the network of 28 Academies in Philadelphia. Since then, a grow-ing number of other cities have developed Academy networks, including Atlanta, Baltimore, Chi-cago, Denver, Oakland, Pasadena, Seattle, and Washington, DC.
In 1988, the American Express Company and other employer partners established the Na-tional Academy Foundation (NAF) to coordinate the expansion and ongoing development of the Academy of Finance model. Since then, NAF has received its largest support from American Ex-press and Citigroup and has grown to include nearly 400 Academies nationwide. The NAF model has also been expanded to include themes in travel and tourism and public service. Recently, NAF began work on an Information Technology Academy model.
More recently, there have been other initiatives to create national Academy support net-works, and these networks have begun working together to coordinate their efforts. In 1996, the National Career Academy Coalition (NCAC) was established by a consortium of technical assis-tance providers including PHSA, Inc., and GMS Partners, which had been providing technical as-sistance to Academies in Washington, DC. NCAC received endorsements from several federal agencies led by the U.S. Department of the Treasury, and it offers an annual technical assistance conference for new and established Academies nationwide. In 1998, the Dewitt Wallace-Reader’s Digest Fund provided funding to establish the Career Academy Support Network (CASN) based at the University of California at Berkeley. CASN had led an effort to build consensus for a defini-tion of a Career Academy and has developed a range of technical assistance tools for states, school districts, and schools interested in creating new Academies.
In addition to growth in the number of Academies, there has been a shift in the primary goals and target population of most Career Academies. In particular, there is now wide agreement that the Career Academy approach should be explicitly distinct from traditional vocational education by seeking to prepare students for both work and college.4 Vocational education, as defined in federal law and
4See Stern, Dayton, and Raby, 1998, for a discussion of the current definition of a Career Academy and its key goals.
98
PR/Award # S165A200036
Page e239

-5-
through its historical legacy, has been directed at preparing young people for occupations that do not traditionally require advanced degrees. By contrast, Career Academies now seek to include a broad range of students and to combine a rigorous academic curriculum with exposure to extensive informa-tion about an industry, both in the workplace and in the classroom.
Finally, although most Career Academies today continue to share the approach’s basic or-ganizational elements, the Academy model has been adapted to a wide range of local needs and circumstances, resulting in different versions of the approach that emphasize some features over others. For example, the NAF network has focused a great deal on creating theme-related curric-ula in finance and travel and tourism, while many of the California programs placed somewhat greater emphasis on creating smaller learning communities through the school-within-a-school structure. Both types of programs have sought to develop strong employer partnerships. Even within the California, Philadelphia, and NAF expansion efforts there has been considerable varia-tion in the roles employers played, the strategies used to integrate academic and vocational cur-ricula, and the particular characteristics of their school-with-a-school organization. This variation highlights the adaptability of the Academy approach.
The expansion of the target populations and goals of the Career Academy approach, as well as the rapid growth in the number of Academies, has placed a premium on obtaining high-quality information about how the Academies may be affecting students’ performance in high school. How well does the Academy approach fit the needs of college-bound students, as well as those who may be at high risk of dropping out? Are Academies more effective under some condi-tions than under others? Which aspects of the Academy approach make the most difference for students? MDRC’s evaluation is intended to shed valuable light on these and other questions.
C. The Current Policy Context
This report is being released at a time when education policymakers and practitioners are pursuing a number of far-reaching strategies for improving American high schools. In addition to the rapid expansion of Career Academies and Academy support networks, there have been several policy and school reform initiatives that build on or directly incorporate the Career Academy ap-proach. Most notably, the School-to-Work Opportunities Act (STWOA) of 1994 was designed to catalyze fundamental changes in the way states and localities support partnerships between em-ployers and schools. These partnerships have been aimed at enhancing the relevance and rigor of school- and work-based learning and at creating clearer pathways between high school and post-secondary education and careers. STWOA specifically identifies Career Academies as a “preferred approach” to creating such partnerships and implementing the principles embedded in the legisla-tion. States, school districts, and employers are now looking for strategies and approaches that can build on the foundation established by STWOA and address some of its limitations.
Federal education policymakers have been considering significant changes to the Elemen-tary and Secondary Education Act (ESEA). Such changes are likely to build on proposals that have already been put forward to address problems unique to high schools. For example, the Edu-cational Excellence for All Children Act of 1999 supports education reforms in 5,000 American high schools that will aid students by improving schoolwide Title I school programs, strengthen-ing curricula and instruction and providing better professional development opportunities for school staff. The act emphasizes the need for creating smaller learning environments, involving
99
PR/Award # S165A200036
Page e240

-6-
members of the community in schools, and establishing partnerships with other institutions as im-portant ways to promote safer and more supportive schools. These are all elements that are pre-sent in the Career Academy approach.
The Office of Vocational and Adult Education (OVAE) has established the New American High Schools Initiative to showcase high schools that have implemented a diverse set of strategies for education reform, particularly focused on preparation for college and work. The initiative has provided evidence that high school reforms that are locally driven and standards-based are associ-ated with better attendance and graduation rates for students.
Other researchers and reformers have also been developing a variety of approaches to im-proving high schools. These reforms include High Schools That Work (HSTW), developed by the Southern Regional Education Board. HSTW is a whole-school, research-based reform designed to raise the academic achievement of career-bound high school students by combining the tradi-tional college preparatory curriculum with vocational classes. The Talent Development Model High School, developed at the Center for Research on the Education of Students Placed at Risk (CRESPAR), specifically includes Career Academies as a central feature of its reform approach. The program divides large, urban high schools into smaller learning communities: a 9th Grade Success Academy and Career Academies in grades 10 through 12. Project Graduation Really Achieves Dreams (GRAD) was developed by the Houston Public Schools and uses a combination of innovative programs to build students’ interpersonal and academic skills. Project GRAD begins in elementary and middle schools and then, in high schools, seeks to implement personal mentor-ing relationships and financial incentives for college. Currently, Project GRAD is considering im-plementing a series of Career Academies within secondary schools to ensure that the gains made in elementary and middle school are sustained and enhanced by small learning communities and integrated curricula. Finally, the Institute for Research and Reform in Education (IRRE) has de-veloped the First Things First (FTF) initiative in Kansas City, Kansas, to help improve feeder sys-tems of elementary, middle, and high schools. The cornerstones of FTF are consistent with key features of the Academy approach, including efforts to create small learning communities; build strong relationships among students, parents, and teachers; and foster collaborative and active learning opportunities based on academic standards.
Virtually all these approaches to improving American high schools include principles em-bedded in the Career Academy approach and, in some cases, include the Career Academy model as an explicit component. The findings presented in this report will shed light on the extent to which the Career Academy model, and the key reform approaches embedded in the model, can achieve the goals that have been espoused by their proponents, including improving students’ per-formance and engagement in high school as well as their preparation for post-secondary education and work.
II. Previous Research on Career Academies
MDRC’s Career Academies Evaluation is built on a foundation laid by several earlier stud-ies of Academies. Some of these have documented the feasibility and institutional growth of the
100
PR/Award # S165A200036
Page e241

-7-
Career Academy approach in a range of local settings.5 Other studies have included assessments of the Academies’ effects on student outcomes, such as graduation from high school, enrollment in post-secondary education, and labor market participation.6
A number of studies have focused on the California Partnership Academies.7 Several of these studies compared the performance of Academy students with that of other students in the same high schools who had similar demographic characteristics and prior records of low grades, high absenteeism, and disciplinary problems. The results indicated that the Academy students earned more credits and had significantly better attendance, grades, and graduation rates than stu-dents in the comparison groups. Other Partnership Academy studies have relied on school records or survey data that compare Academy students with the general high school population. These studies also found that Academy students and graduates outperformed their non-Academy peers.8 These results have been highlighted as particularly impressive, given that the state-funded Partner-ship Academies are required to recruit a majority of students who have been identified as eco-nomically or educationally disadvantaged.
Outside California, several other studies using similar methodologies also reported posi-tive results. Evaluations of Academies in Philadelphia found that Academy students had higher attendance and graduation rates than the citywide average.9 An evaluation of Academies affiliated with the Junior Reserve Officers’ Training Corps (JROTC) found positive effects on attendance, credits earned, grades, and dropout prevention.10
Despite the broad array of research on Career Academies, a number of questions remain unanswered. Most important, several of the prior studies recognized that the positive effects they found may actually under- or overestimate the true effects of the Academies on student out-comes.11 On the one hand, it may have been that these effects were the result of the extra motiva-tion of students who were attracted to the Academies rather than to the unique experiences of-fered by the programs. In other words, the Academies may attract students (even students whose background characteristics may indicate a risk of dropping out) who are motivated enough to do well under a wide range of circumstances. On the other hand, because many Academies explicitly attempt to serve at-risk students, the true effects of the programs may be understated in cases where such students are being compared with the general high school population, which includes many highly engaged and high-performing students. Many who conducted prior evaluations of Career Academies have emphasized that a random assignment research design would be necessary to eliminate these types of concern. In recognition of this, the California state legislature passed legislation in 1993 authorizing an evaluation of the Academies using random assignment of stu-dents under appropriate circumstances. The governor subsequently approved the present study as that evaluation.
5Snyder and McMullan, 1987; Stern, Raby, and Dayton, 1992; Academy for Educational Development, 1989,
1990; Pauly, Kopp, and Haimson, 1995; Stern, Finkelstein, Stone, Latting, and Dornsife, 1994. 6For the most comprehensive summary of this research, see Stern, Raby, and Dayton, 1992. 7Stern, Dayton, Paik, and Weisberg, 1989; Stern, Raby, and Dayton, 1992. 8Maxwell and Rubin, 1997, 1999; Dayton, 1997; Reller, 1987. 9Snyder and McMullen, 1987; Academy for Educational Development, 1989; Linnehan, 1996. 10Hansner, Elliott, and Gilroy, 1999; Hanser and Stasz, 1999; Stasz, 1999. 11Stern, Raby, and Dayton, 1992.
101
PR/Award # S165A200036
Page e242

-8-
A second important set of questions that has not received much attention concerns the variation in Academy effectiveness across a wide range of contexts and networks. On a related issue, little is known about the relative effectiveness of Academies for several key subgroups of students, such as those at high risk of dropping out of high school versus those highly likely to be college bound. MDRC’s Career Academies Evaluation is positioned to answer these questions and fill other gaps in the research on Academies.
III. A Conceptual Framework of the Career Academy Approach and Its Potential Impact on Student Outcomes
The key goal of this evaluation has been to assess the extent to which Career Academies keep students engaged in school, help them progress toward graduation, and prepare them for post-secondary education and work. In an effort to shed light on how and why the Academies do or do not affect changes in these outcomes, the evaluation has attempted to articulate a concep-tual framework, or theory of change, for the Career Academy approach. This framework identi-fies many of the key goals that have been proposed for Academies and attempts to make explicit some of the pathways through which the core elements of the approach are likely to improve out-comes for students. It has also been used to guide the design and implementation of several key features of the evaluation, including site selection, data collection, and analyses strategies.12
Figure 1.1 is a simplified conceptual model listing the basic Career Academy elements on the left and showing the hypothesized pathways through which these elements are likely to affect student outcomes during high school and beyond. The conceptual model covers four sets of con-structs delineated by the four columns in Figure 1.1:
• Career Academy organizational elements that distinguish the Academy ap-proach from the regular high school environments in which it is implemented;
• supports and learning opportunities that are intended to evolve from the or-ganizational elements;
• high school outcomes that the Academies aim to improve by enhancing the supports and learning opportunities in the previous column; and
• post-secondary outcomes that reflect some of the long-term goals of the Academy approach.
12While the concept of grounding program evaluations in theories of change is not new (see Weiss, 1995, for a
detailed discussion of theory-based evaluation strategies), this evaluation marks the first attempt to make the theory behind Career Academies more explicit and then to collect and analyze data to examine empirically the hypotheses embedded in the theory. As such, the conceptual framework articulated in this report, and in the previous reports from the study, does not necessarily reflect a previously agreed-upon set of program characteristics and underlying principles on which Career Academies have been planned, implemented, and sustained. As noted earlier, only re-cently has a commonly agreed-upon definition of a Career Academy been articulated and disseminated. Also, the history and diversity of Career Academies highlights the fact that the goals of the approach are broad and evolving.
102
PR/Award # S165A200036
Page e243

-9-
Figure 1.1
Career Academies Evaluation Simplified Conceptual Model of the Career Academy Approach
Career Academy Organizational
Elements
Supports and Learning
Opportunities High School Outcomes
School engagement
School performance
Youth development and risk-taking experiences
College and employment preparation
College degrees and other educational attainment
Integration of school and work
High-wage and career-oriented employment
Post-Secondary Outcomes
School-within-a- school organization
Academic and vocational curricula based on career theme
Employer partnerships
Interpersonal supports
Focused curricula and enriched learning opportunities
Career awareness and work-based learning opportunities
Linkages among these sections of the framework highlight the pathways through which the Acad-emies are hypothesized to affect students’ experiences and behaviors. The conceptual framework is described briefly below.
A. Career Academy Organizational Elements
School-Within-a-School Organization. In this organizational arrangement, clusters of students share several classes each day and often have the same small group of teachers from year to year. The student clusters vary in size but usually range from 30 to 60 students per grade in grades 9 through 12 or in grades 10 through 12. The number of classes students take within an Academy, and thus the number of teachers they share, also varies from Academy to Academy and from year to year, but usually students take from two to seven Academy classes. Teachers, who come from a variety of academic and vocational disciplines, are scheduled to have mostly Acad-emy students in their classes. These teachers make a commitment to meeting with each other on a regular basis, and they share in decision-making related to administrative policies, curriculum con-tent, and instruction. One teacher usually assumes lead responsibility for administrative tasks and serves as a liaison with the school principal and other administrators, school district officials, and employer partners. Students also take some regular classes along with the other students in the high school, and all courses in the Academy are counted as credits toward a high school diploma. Academy classes are often scheduled in blocks of three or four during the morning, leaving the remainder of the day for regular courses. This block scheduling allows for special activities during
103
PR/Award # S165A200036
Page e244

-10-
this time: field trips, for instance, or team teaching, or hosting speakers from the business com-munity. Teachers also attempt to involve parents in the Academy program, and schools often re-quire parents to attend meetings with their children.
Academic and Vocational Curricula Based on Career Theme. The Career Academies’ curricula usually consist of three or more academic courses per year and at least one vocational or occupation-related course per year that focuses on the selected career theme. These classes enable students to meet high school graduation and college entrance requirements and, at the same time, provide them with marketable skills. Students take their remaining course requirements and elec-tives (usually 20 to 50 percent of the credits needed to graduate) outside the Career Academy in the regular high school. To link the academic and occupational classes, Academy teachers work together to coordinate course content and instructional strategies. They also focus on providing instruction in employability skills, both in the occupational theme courses and in one or more aca-demic courses. Occupational classes are structured around whole industries: Health Academies, for example, attempt to expose students to diverse medical occupations in the areas of direct care, technology, and administration. The Academy’s career theme is typically chosen on the basis of local employment needs and demand for expertise in the national marketplace.
Employer Partnerships. Career Academies strive to build formal relationships with a group of employers in their community. In general, the employer partnerships can be defined as ongoing coordinated efforts to engage local employers in supporting the Academy’s programs and sponsoring a range of work- and career-related activities for students. The partnership typi-cally includes employer representatives, teachers, school administrators, parents, and students. Many Academies create formal advisory boards that provide guidance on curricular and extracur-ricular activity development and may even assist with the management and administration of the program. Employer partners typically support the Academies by providing additional material re-sources or even making financial contributions. Most important, however, is that employer part-ners contribute the time for their employees to appear as guest speakers in the school, supervise student internships, serve as mentors for individual students, and provide other kinds of support.
Many Career Academies designate staff who serve as liaisons between the employers and the Academies and coordinate the various employer-sponsored activities. This role is crucial in creating and sustaining the various career development and awareness activities that are offered to students, both in school and outside school. The people in this role also take responsibility for developing work-based learning opportunities for students and moni-toring student involvement in these activities. In some cases, this role is filled by Career Academy teachers who also have classroom responsibilities (although, usually, with a re-duced course load). In other cases, the role is filled by non-teaching administrators whose primary responsibilities focus on one or more Academies.
B. Supports and Learning Opportunities
The basic organizational elements of the Career Academy approach have particular appeal because they offer direct responses to several common structural problems that have been identi-fied in high schools, particularly schools serving low-income communities and students placed at
104
PR/Award # S165A200036
Page e245

-11-
risk of school failure.13 These core elements should be viewed as institutional mechanisms that are mutually reinforcing and, together, are intended to facilitate enhancements of interpersonal sup-ports and enriched teaching and learning opportunities.
The second column of Figure 1.1 lists the types of supports and opportunities that are hy-pothesized to evolve from each of the three core organizational elements: (1) enhanced interper-sonal support through the intensive interaction and collaboration offered by the school-within-a-school; (2) a focused curriculum and enriched teaching and learning experiences through the in-tegration of academic and occupational content; and (3) exposure to career awareness and work-based education through the employer partnerships. These are discussed briefly below.
Interpersonal Supports. Career Academies aim to function as “communities of support” for students and teachers. For students, such support includes the personalized attention they get from their teachers, their teachers’ expectations of them, their classmates’ level of engagement in school, and the opportunities they have to collaborate with their peers on school projects. Acad-emy teachers in this study indicated that they were supported by, among other things, opportuni-ties for professional collaboration and development, adequate resources, the capacity to influence instructional and administrative decisions, and opportunities to give personalized attention to stu-dents. Both this study and previous research have identified these dimensions of support as factors that can have important effects on both students’ motivation and engagement in school and teach-ers’ job satisfaction and sense of having an impact on students’ lives.
Focused Curricula and Enriched Learning Opportunities. Key goals of the Career Academy curricula are to ensure that students meet the core academic requirements they need to graduate and prepare for college and to focus students’ non-Academy course-taking on a coher-ent set of vocational or occupation-related classes. In addition, curricula attempt to provide stu-dents with applied learning opportunities, including developing problem-solving skills, using com-puters or manipulative materials, working on long-term projects, and connecting what they learn to other subjects or the world of work. These types of activities have been identified as strategies for breaking down the dichotomy between academic and vocational curricula, or between abstract and applied learning. Such a dichotomy is often seen as a structural feature of high schools that limits their capacity to help students make the transition from school to work or to post-secondary education. Previous research has suggested that the separation of curricular tracks has created a false and unnecessary dichotomy between academic rigor and real-world relevance.14
Career Awareness and Work-Based Learning Opportunities. In general, Career Acad-emies aim to provide students with two types of work-related learning opportunities that are built on the employer partnerships. The first, referred to as career awareness and development activities, are intended to enhance students’ understanding of the world of work in general as well as their awareness of occupations within the program’s broad career theme. Some of these activities occur outside school. They include field trips designed to expose students to various work environments and to provide op-portunities to observe a regular workday. Another example is job-shadowing, which gives students the opportunity to accompany an adult on her or his job for a day or more. Some Career Academies de-
13See Kemple and Rock, 1996; Kemple, 1997a. 14Berryman, 1991; Raizen, 1989; Resnick, 1987; Dewey, 1916.
105
PR/Award # S165A200036
Page e246

-12-
velop mentoring programs to help students make connections with caring adults who can provide per-sonal support and career guidance. Other career awareness and development activities occur in school. These include formal and structured attempts to infuse Career Academy classes with discussions and activities focusing on careers or students’ work-based learning experiences. They also include career counseling and the formal and informal discussions students have with their teachers and peers regard-ing preparation for work.
The second type of work-related learning opportunities are typically referred to as work-based learning, which has been defined as “work experiences that are planned to contribute to the intellectual and career development of students.”15 Work-based learning activities are probably the most intensive and distinctive work-related aspect of the Career Academy approach. Students are typically placed in jobs that have been developed in collaboration with the employer partners and are connected to school. Students have the opportunity to learn both job-specific skills and more general work habits and behaviors.
C. High School Outcomes
The supports and opportunities listed in the second column of Figure 1.1 are also mutually reinforcing and, together, are intended to affect students’ engagement, performance, and devel-opment during their high school years The third column of the figure summarizes several key stu-dent outcomes that Career Academies are intended to improve. These include preventing students from dropping out of high school, helping them meet graduation requirements, enhancing their achievement, helping them meet college entrance requirements, providing necessary steps to apply for and be accepted into college or a job, promoting constructive use of non-school hours, and reducing risk-taking behaviors.
As noted earlier, this report focuses on the extent to which the Career Academies change these and other outcomes during students’ high school years. Analyses presented later in the re-port will explore how particular organizational features of the Academies — or the types of sup-ports or learning opportunities that develop from them — may or may not help account for the program impacts or lack of impacts.
D. Post-Secondary Outcomes
As shown in Figure 1.1, graduating from high school and acquiring various credentials should be viewed as transitional outcomes — as indications of students’ level of preparedness for future education and work after high school. Ultimately, as indicated in the fourth column of the figure, the Career Academies are intended to lead to higher levels of post-secondary education and to higher-skilled and higher-paying careers.
Future reports from the Career Academies Evaluation will examine the impact Academies may have on these types of outcomes and will explore the connections between high school ex-periences and the impacts that may accrue after high school.
15Office of Technology Assessment, 1995, p. 13.
106
PR/Award # S165A200036
Page e247

-13-
IV. Key Features of the Career Academies Evaluation
In 1993, MDRC began development work for a unique study of the Career Academy ap-proach. Its primary purpose has been to provide reliable evidence about the efficacy of the theo-ries and hypotheses embedded in the conceptual framework illustrated in Figure 1.1. The evalua-tion responds to the growing demand for rigorous evidence about the effectiveness of school-to-work and other high school reform initiatives. This section of the chapter describes the key fea-tures of the evaluation design that are central to understanding the findings presented in this re-port.
A. The Random Assignment Design
The Career Academies Evaluation is a rarity in the field of education research in that it has been built on a random assignment research design and demonstrates the feasibility of implement-ing such a design within an ongoing high school program. In order to assess the difference that Career Academies make in the lives of high school students, the research design involves a com-parison between students who applied for and were randomly selected to enroll in a Career Acad-emy and students who also applied but were not selected. During the evaluation period, a random selection process, or lottery, was used to make the final selection of students for the Academies. This was possible because each Academy had more qualified applicants than it was able to serve and the sites were willing to implement the protocols called for in the random selection process.16
This report focuses on a sample of 1,764 students from nine of the sites selected for the study.17 For the purposes of this report, this group of students is referred to as the study sample. Of the students in the study sample, 959 (54 percent) were randomly selected to enroll in an Academy. For the purposes of this report, these students are referred to as the Academy group. The remaining 805 students (46 percent of the study sample) were not invited to participate in the Academies but could choose other options available in the high school or school district. These students constitute the study’s control group and are referred to in this report as the non-Academy group. In most cases, non-Academy group students enrolled in the general programs in the participating high schools, but in some cases they enrolled in citywide magnet programs or schools.
Figure 1.2 illustrates the random assignment research design and shows the comparison being made to determine the impact Career Academies have on high school outcomes. The boxes on the lower right side of Figure 1.2 correspond to the first three columns of Figure 1.1. The first box represents the distinctive organizational features of the Academies, and the second box repre-sents the resulting supports and learning opportunities that derive from those features. The third box indicates the high school outcomes achieved by students randomly selected for the Academy group. Each of these boxes has a counterpart on the left side of Figure 1.2 for students randomly selected for the non-Academy group. The differences in outcomes between the two groups of students represent impacts of the Career Academies.
16See Chapter 4 in Kemple and Rock, 1996, for a more detailed description of how the random assignment procedure was implemented for this study.
17One of the 10 initial Career Academies was disbanded after two years in the study and was unable to provide sufficient follow-up data for its students in the study sample.
107
PR/Award # S165A200036
Page e248

-14-
Figure 1.2
Career Academies Evaluation
Random Assignment Design
Random selection for enrollment in an Academy
Students apply and are eligible for Career Academy
Non-Academy group (notselected to enroll in Career
Academy)
Exposure to regular high school
Supports and learning opportunitiesexperienced in regular high school
High school outcomes for non-Academygroup
Academy group (selected toenroll in Career Academy)
Exposure to Career Academyorganizational elements
Supports and learning opportunitiesexperienced in Career Academy
High school outcomes for Academygroup
IMPACTS
Differences in high schooloutcomes
See Figure 1.1
108
PR/Award # S165A200036
Page e249

-15-
The random selection process ensured that the two groups of students were virtually the same on average in terms of their background characteristics, prior school experiences, and initial motivation and attitudes toward school. Any systematic differences in the outcomes that subse-quently emerged between the groups resulted from differences in their access and exposure to the Career Academies.18 Differences in these school environments should have produced differences in the types of supports and learning opportunities experienced by students in the Academy and non-Academy groups. In fact, the previous reports and papers from the evaluation provide exten-sive evidence that Academy students experienced significant enhancements in the supports and learning opportunities illustrated in Figure 1.1, compared with their non-Academy counterparts. Academy students were also more likely to participate in a broad range of career awareness and work-based learning activities. Finally, Academy students were also somewhat more likely than their non-Academy counterparts to be exposed to various enriched learning activities in the class-room, such as applied learning and work-related problem-solving activities. The current report addresses the question of whether the Academies produced impacts on high school outcomes as represented by the three boxes at the bottom of Figure 1.2.
B. Sites in the Career Academy Evaluation
A second critical feature of the Career Academies Evaluation research design involves the selection of sites for participation in the study. MDRC was primarily interested in selecting sites that had already implemented versions of the organizational elements listed in the first column of Figure 1.1.19 This was important because a key goal of the evaluation was to include functioning Academies that encompassed the central elements of the approach, rather than programs that were in the initial stages of implementation.
In addition, MDRC sought high schools in which there was a clear contrast between the Career Academy and other programs available to potential Academy students. This was important because one of the primary concerns of the study was whether Career Academies improve stu-dents’ post-secondary education and employment outcomes above and beyond what would have occurred had they not had the opportunity to attend an Academy. Some high schools and school districts operate more than one Career Academy or other Academy-like programs. In such cir-cumstances, many students in both groups would likely be involved in similar programs. This would reduce the contrast between their experiences and could mistakenly obscure the real effects of the Academies and make it appear that the Academies were ineffective.
Each participating site had established the basic Career Academy components described in this chapter: a school-within-a-school organization, academic and vocational curricula based on a career theme, and employer partnerships. This combination of features was not available else-where in the participating high schools.20 Each Career Academy attempted to serve a wide range
18As discussed in Chapter 2, not all students randomly selected for the Academy group actually enrolled and
remained in an Academy, and a small percentage of students selected for the non-Academy group did enroll. 19The site selection process is described in greater detail in Kemple and Rock, 1996, which also includes a de-
tailed description of the Career Academies in the sites. 20Although some participating high schools do operate other programs that they classify as Career Academies,
information collected for this study indicated that most such programs do not include the basic components of the (continued)
109
PR/Award # S165A200036
Page e250

-16-
of students, including those with a history of poor school engagement and performance as well as those who were engaged in school at the time they applied for the programs.
The participating Academies offer a range of occupational themes: three are in the business and finance fields; three focus on high-technology areas such as electronics and aerospace technology; and there is one each in the fields of health occupations, public service, travel and tourism, and video tech-nology. The participating programs were drawn from most of the major established networks of Career Academies across the country, with four from the California Partnership Academy network, two from the National Academy Foundation network, one from the Florida network of Academies for Career Development and Applied Technology, and one from the network of Academy programs created by the District of Columbia Public Schools. Two of the participating Academies were developed inde-pendently through local high school or district initiatives.
As of the 1994-95 school year (when the last sites joined the study), the participating Career Academies had been in operation for as few as two years and as many as 11 years. Nine of the 10 Ca-reer Academies remained in operation throughout the evaluation period and were able to meet the data and other research-related needs of the evaluation. One site was disbanded after the 1995-96 school year and was unable to meet the data needs of the evaluation.
In summary, the sites participating in the Career Academies Evaluation provide a solid founda-tion on which to build a credible assessment of the implementation and impact of the Career Academy approach. Three important cautions should be kept in mind, however, in interpreting the findings from this study and, in particular, the findings presented in this report.
First, because the participating sites were chosen strategically, rather than randomly, the find-ings from this study cannot necessarily be generalized to all schools and school districts. These are school districts and high schools that were willing and able to commit the financial and personnel re-sources needed to implement and sustain a Career Academy. At the same time, however, these sites, as a group, share the characteristics of typical urban and small-city school districts, and, individually, they reflect much of the diversity of such districts. This provides some basis for extending the findings and lessons from this study beyond the participating schools.
Second, like their host high schools and school districts, the participating Career Academies are dynamic and evolving. Over the course of the evaluation, they have had to confront staff turnover, in-creases or decreases in funding, changes in local or state education policy, shifting levels of support from building or district staff, and changes in the amount and types of support they receive from em-ployer partners. Because this is a longitudinal study, it has been able to provide a realistic picture of how ongoing programs evolve and change in the context of dynamic high schools. In general, most of the programs modified various components of the Career Academy approach in response to changing conditions in their host high schools or school districts, and many of them evolved toward more com-plete versions of the model. It should be noted, however, that some of the programs were weakened by staff turnover, funding reductions, or decreased support from school staff or employer partners. As noted earlier, one Academy was disbanded at the end of the 1995-96 school year. Although this site provides some useful lessons about institutional stresses that are likely to affect the sustainability of Ca-reer Academies, its dissolution and lack of comparable data prevent it from providing information to assess its impact on student outcomes. Academy approach described earlier. As a result, the participating Career Academy programs represent a clear contrast with other programs in the high schools.
110
PR/Award # S165A200036
Page e251

-17-
Third, the previous reports from MDRC’s Career Academies Evaluation focused primarily on findings that were aggregated across all participating sites. Although such findings shed light on the implementation and impact of the Career Academy approach more generally, they mask the high degree of variation among the sites and the ways this variation may be associated with differ-ences in program effectiveness. For example, some sites were able to develop a particularly cohe-sive school-within-a-school, while others made strong investments in their employer partnerships. More important, the Academies in some sites represented an especially dramatic contrast with the regular school environment in terms of the degree of interpersonal and instructional support they offered students. A central focus of this report, therefore, is on determining whether some ver-sions or contexts for the Academy approach are more effective than others.
C. Data Used in This Report
The conceptual framework described above has helped guide data-collection activities for the evaluation. For example, MDRC researchers conducted a variety of field research activities to document and describe the organizational features illustrated in the first column of Figure 1.1. Several surveys were developed and administered to students and teachers to gain systematic in-formation about various supports and learning opportunities that might be captured by the second column. MDRC has also collected data from school records and students’ transcripts to obtain information about their progress and performance in high school. As part of the evaluation, MDRC administered standardized math and reading tests to a subsample of students, and it con-ducted a survey at the end of students’ 12th-grade year to learn about their use of non-school hours and preparation and plans for the future. Finally, as the evaluation moves forward, MDRC will continue to follow students beyond their high school years to collect information about their progress in post-secondary education and the labor market.
The primary data for this report were obtained from three sources: school transcript re-cords, a survey that students in the study sample completed at the end of their 12th-grade year, and a standardized math computation and reading comprehension test administered to a subsam-ple of the students at the end of their 12th-grade year. These are described briefly below.21
School Transcript Records. A complete set of school transcript records is available for 1,454 students in the study sample.22 This is referred to in the report as the Student School Re-cords Database. The Student School Records Database includes information about students’ daily attendance rates, credits earned toward graduation, and course-taking patterns. Of the students in the Student School Records Database sample, 1,293 remained enrolled in high school through the
21See Appendix A for a more detailed discussion of the response rates and analytical issues associated with the
data-collection efforts for the evaluation. 22MDRC attempted to collect school transcript records for all students in the study sample even if they had transferred
to other high schools within the districts in which the participating Career Academies were located. MDRC was not able to obtain school transcript records for students who transferred to high schools outside these districts. Analyses of differ-ences in data availability among students in the study sample indicated that there were no systematic differences in school records availability between Academy and non-Academy group students. MDRC obtained school records data for 82 per-cent of students in the Academy group and for 84 percent of students in the non-Academy group. Among students in the Student School Records sample, there were no systematic differences in the background characteristics of Academy and non-Academy group students. These analyses provide greater confidence that the Student School Records Database will yield valid estimates of Career Academy impacts.
111
PR/Award # S165A200036
Page e252

-18-
end of their 12th-grade year. The remaining 161 students (12 percent) were confirmed to have dropped out of high school before the end of their 12th-grade year. A complete set of school tran-script records was obtained for these students up to the point at which they dropped out.
12th Grade Survey. The 12th Grade Survey was completed by 1,510 students in the study sample at the end of their 12th-grade year.23 This is referred to as the 12th Grade Survey Database. The 12th Grade Survey asked students a wide range of questions about their school experiences, employment and work-related experiences, extracurricular activities, preparation for college and post-secondary jobs, and plans for the future.
Achievement Test Scores. Math computation and reading comprehension achievement tests were administered to 490 students in the study sample.24 This is referred to as the 12th Grade Achievement Test Database. This test was initially designed by the Educational Testing Service (ETS) for the National Educational Longitudinal Surveys of 1988 (NELS: 88) follow-up and was administered to a nationally representative sample of students in their 12th-grade year. ETS per-mitted MDRC to administer the test to a subsample of students in the Career Academies Evalua-tion sample.25 The Achievement Test Database provides national percentile scores both in reading comprehension and in math computation and problem-solving. It also provides criterion-referenced scores that indicate whether students demonstrated proficiency at particular skill levels of math and reading.
V. Overview of This Report
A central theme that has emerged from this evaluation is that an accurate and useful as-sessment of the effectiveness of the Career Academy approach must recognize that the program is not a “one-size-fits-all” initiative and that it produces different impacts for different types of stu-
23MDRC attempted to survey all students in the study sample even if they had transferred to high schools out-
side the participating districts or had dropped out of high school altogether. Analyses of differences in data avail-ability among students in the study sample indicated that there were no systematic differences in 12th Grade Sur-vey response rates between Academy and non-Academy group students. MDRC obtained completed surveys from 86 percent of students in the Academy group and from 85 percent of students in the non-Academy group. Among students in the 12th Grade Survey sample, there were no systematic differences in the background characteristics of Academy and non-Academy group students. These analyses provide greater confidence that the 12th Grade Survey Database will yield valid estimates of Career Academy impacts.
24MDRC attempted to administer the achievement test to the 691 students in the study sample who were scheduled to be in 12th grade at the end of the 1997-98 school year. The 490 students who completed the achieve-ment test represents 71 percent of those attempted. Analyses of differences in data availability among students in the study sample indicated that there were no systematic differences in achievement test completion rates between Academy and non-Academy group students who were attempted. MDRC obtained completed achievement tests from 72 percent of the Academy group students attempted and from 70 percent of the non-Academy group students attempted. Among students in the Achievement Test sample, there were no systematic differences in the back-ground characteristics of Academy and non-Academy group students. These analyses provide greater confidence that the Achievement Test Database will yield valid estimates of Career Academy impacts.
25The achievement test was administered to students on a Saturday morning near the end of their 12th- grade year. They were offered a stipend of $50 if they completed the test. Some concerns have been raised about whether this test instrument and the conditions under which it was administered provide an adequate indication of student achievement in math computation and reading comprehension. It should be noted, however, that the same test was administered under similar conditions as part of the U.S. Department of Education’s National Educational Longi-tudinal Surveys of 1988 (NELS:88).
112
PR/Award # S165A200036
Page e253

-19-
dents. In order to highlight the importance of this theme, Chapter 2 describes the students who are in the study sample and identifies subgroups of students who are most likely to derive various benefits from the programs. All the key analyses and findings presented in this report are broken down by these subgroups. Chapter 2 also presents findings from an analysis of the patterns by which students in the study’s Academy group enrolled and remained in the Career Academy programs.
Chapter 3 assesses the impact Career Academies have on students’ high school engagement and performance and on their preparation for post-secondary education and employment. It focuses first on the impacts Career Academies produce for students who were at high risk of dropping out of high school. It then presents the results for students who entered the study highly engaged in school and were at very low risk of dropping out. Finally, it presents the impact findings for students who fell into a middle range of characteristics associated with a risk of school failure.
As noted earlier, this report also attempts to push much further in offering lessons about the efficacy of the Career Academy approach and other school reform initiatives that are embed-ded in it. The contrast among the sites and the differences in effectiveness for key subgroups of students provide a rich context for making judgments about what types of school reform initia-tives are likely to be effective and for whom. Chapter 4 presents findings from an analysis that be-gins to highlight some of the key mechanisms by which the Academies may produce the impacts described in Chapter 3. This chapter identifies a group of sites, within the evaluation sample, in which the Career Academies represented a particularly dramatic contrast with their non-Academy school environments in terms of some of the key supports and learning opportunities described earlier. It also identifies a second group of sites that had very little contrast between the Academy and non-Academy school environments in these areas. Chapter 5 examines variation in impacts across these two groups of sites.
113
PR/Award # S165A200036
Page e254

-20-
Chapter 2
Career Academy Students and Their Patterns of Enrollment in the Academy Programs
This chapter describes the background characteristics and prior school experiences of the students in the research sample for this report. It also summarizes findings on the patterns by which those selected for the Career Academies actually enrolled and remained in the programs. The chapter makes two key points.
First, the chapter highlights the fact that the students in the study sample come from di-verse backgrounds and prior school experiences. This suggests that analyses that do not account for this diversity are likely to mask variation in the difference that Career Academies may make for some students and not for others. Section II of this chapter, therefore, identifies subgroups of students defined by background characteristics and prior school experiences associated with dif-ferent patterns of school success or failure. The impact findings presented in Chapter 3 show that the Career Academies produced quite difference patterns of impacts for these three subgroups of students.
Second, the analyses presented in this chapter show that 88 percent of the students ran-domly selected for the study’s Academy group (and invited to enroll in a Career Academy pro-gram) actually enrolled. By the end of 12th grade, 59 percent of the students initially selected for the programs were still enrolled in them. These enrollment and attrition patterns have implications for Career Academy policies and implementation practices. They also provide an important con-text for interpreting the impact findings presented later in the report.
I. Students in the Study Sample for This Report
This section of the chapter describes the background characteristics of the 1,764 students who constitute the study sample for this report. The description highlights the fact that no system-atic differences were found in the background characteristics of the Academy group and the non-Academy group. This is the central purpose of the random selection process used in creating these two groups, and it extends to measured as well as unmeasured characteristics.
A. Background Characteristics of Students in the Study Sample
The Career Academies Evaluation has included efforts to collect information about 1,764 students who applied for one of nine Career Academies across the country between 1993 and 1996.1 In this report these students are referred to as the study sample. Table 2.1 lists a variety of
1See Kemple and Rock, 1996, for a more detailed discussion of the procedures used to select students for the
Career Academies Evaluation study sample. The initial sample for the Career Academies Evaluation consisted of 1,953 students from 10 sites. As noted earlier, one of the initial sites was disbanded and was not able to provide follow-up information needed for the analyses in this report. Thus, the 126 students in the initial study sample from that site are not included in the analyses. Also, MDRC found that information could not be obtained for 59 of the initial group of students because they should not have been included in the study sample. Four other students were found to be deceased.
114
PR/Award # S165A200036
Page e255

-21-
Table 2.1
Career Academies Evaluation
Background Characteristics of Study Sample,by Research Status
Academy Non-AcademyFull Sample Group Group
Characteristic (%) (%) (%)
Demographic and family characteristics
GenderMale 43.8 44.6 42.9Female 56.2 55.4 57.1
Age of student at time of application13 or younger 8.6 7.3 10.114 35.6 35.7 35.515 46.1 46.8 45.216 or older 9.7 10.1 9.2
Race/ethnicityBlack 30.2 30.9 29.4White 6.4 6.0 6.9Hispanic 56.2 55.5 57.0Asian or Native American 7.2 7.5 6.7
Student speaks limited Englisha 7.6 7.0 8.3
Student lives withMother and father 61.7 61.1 62.5Mother only 28.6 29.0 28.1Father only 4.6 5.0 4.1Other family/nonrelative 5.1 4.9 5.4
Student lives in single-parent household 38.3 38.9 37.5
Father's education levelDid not finish high school 39.8 38.9 40.9High school graduate 32.4 32.2 32.6Completed some post-secondary 27.8 28.9 26.6
Mother's education levelDid not finish high school 36.1 35.2 37.1High school graduate 34.8 34.5 35.3Completed some post-secondary 29.1 30.3 27.6
Neither parent has high school diploma 28.6 29.0 28.2
Parental WorkBoth parents work 47.3 46.5 48.3Father works 23.8 23.5 24.1Mother works 17.8 19.2 16.2Neither parent works 11.1 10.8 11.4
(continued)
115
PR/Award # S165A200036
Page e256

-22-
Table 2.1 (continued)
Academy Non-AcademyFull Sample Group Group
Characteristic (%) (%) (%)
Family receives welfare or Food Stamps 24.2 23.6 25.0
Family mobility in past two yearsHave not moved 59.4 58.8 60.2Moved 1 or 2 times 33.6 34.8 32.2Moved 3 or more times 7.0 6.5 7.6
Student is home alone more than 3 hours per day 13.5 13.5 13.6
Educational characteristics
8th-grade math test scoreb
75th percentile or higher 8.5 8.8 8.150th to 74th percentile 20.4 21.0 19.725th to 49th percentile 32.2 29.9 35.024th percentile or lower 38.9 40.3 37.2
8th-grade reading test scorec
75th percentile or higher 9.8 10.4 9.050th to 74th percentile 19.4 20.8 17.725th to 49th percentile 36.3 33.7 39.424th percentile or lower 34.6 35.1 33.9
Student does not feel safe at school 23.2 22.7 23.9
Frequency of cutting classesNever 78.9 79.5 78.3At least 1 time a week 19.7 19.4 20.1Daily 1.4 1.2 1.6
Sent to office for misbehavior Never 81.3 81.0 81.6
1-2 times 15.7 16.2 15.23-10 times 3.0 2.8 3.2
Hours per week spent on homework1 hour or less 28.8 27.9 30.02-3 hours 38.2 39.3 36.94-6 hours 17.4 18.5 16.07 hours or more 15.6 14.3 17.2
Hours per day spent watching TVLess than an hour 12.3 11.7 13.01-2 hours 27.1 27.4 26.72-3 hours 26.8 24.9 29.1Over 3 hours 33.8 36.0 31.3
Student has worked for pay 36.3 35.8 36.9(continued)
116
PR/Award # S165A200036
Page e257

-23-
Table 2.1 (continued)
Academy Non-AcademyFull Sample Group Group
Characteristic (%) (%) (%)
Characteristics associated with dropping out of school
Attendance rate, year prior to random assignment96-100% 54.2 53.1 55.491-95% 24.1 23.3 24.986-90% 11.0 12.2 9.585% or lower 10.8 11.4 10.2
Credits earned in 9th graded
5 or more credits 80.9 80.4 81.43-4 credits 13.7 14.3 12.92 or fewer credits 5.5 5.3 5.7
Grade point average in year of random assignmente
3.1 or higher 36.2 34.4 38.32.1-3.0 38.1 39.5 36.52.0 or lower 25.7 26.1 25.2
Student is overage for grade levelf 21.1 21.5 20.7
School mobilityg
0 or 1 different school 72.7 72.9 72.42 or more different schools 27.4 27.1 27.6
Student has sibling who dropped out of high school 20.2 19.8 20.6
Sample size 1,764 959 805
SOURCES: MDRC calculations from the Career Academies Evaluation Student Baseline Questionnaire Database and Student School Records Database.
NOTES: All characteristics were measured at the time students applied to the Career Academy program and prior to being randomly selected to the Academy and non-Academy groups. Invalid or missing values are not included in individual variable distribution. Rounding may cause slight discrepancies in calculating of sums and differences. A chi-square test was applied to differences in the distribution of characteristics across the Academy and non-Academy groups. Statistical significance levels are indicated as: *** = 1 percent; ** = 5 percent; * = 10 percent.
aThese are students who responded that they spoke English "not well" or "not at all."
bSeveral different standardized, nationally normed math tests were administered to students, depending on the district where their school was located and the year they entered the study. National percentile scores were used because they were the only standardized scores available across tests.
cSeveral different standardized, nationally normed reading tests were administered to students, depending on the district where their school was located and the year they entered the study. National percentile scores were used because they were the only standardized scores available across tests.
dThis was applicable only to students who applied to the Career Academy at the end of their 9 th-grade year.
eGrade point averages were converted to a standard 4.0 scale from 100-point or 5-point scales for some sites.
fA student is defined as overage for grade at the time of random assignment if she or he turns 15 before the start of the
9th grade, or 16 before the start of the 10th grade. This indicates that the student was likely to have been held back in a previous grade.
gSchool mobility is defined as the number of schools attended since the 1st grade beyond the number expected to result from promotions in grade level or graduations.
117
PR/Award # S165A200036
Page e258

-24-
background characteristics and measures of prior school experiences for students in the study sample. The first column in the table lists the percentages of students in the full sample who had each of the characteristics listed.
The first section of Table 2.1 indicates that students in the study sample come from a wide range of family backgrounds. The vast majority of students identified themselves as either His-panic (56 percent) or black (30 percent). The relatively large proportion of Hispanic students re-flects the fact that several of the sites are located in predominantly Chicano and Latino communi-ties in California, south Texas, and south Florida. The black students are concentrated in several large eastern cities.
The data collected for the evaluation does not include a direct measure of family income, but there are several indicators that the study sample includes a moderate proportion of students from low-income families. For example, Table 2.1 shows that 38 percent of the students lived in single-parent households at the time they applied for an Academy. Further, 11 percent of the stu-dents indicated that neither of their parents was working, and 24 percent indicated that their fami-lies were receiving welfare or Food Stamps. Twenty-nine percent reported that neither parent had received a high school diploma or a GED. Forty-one percent indicated that their families had moved at least once during the two years prior to applying for the Academy. The table also indi-cates that many students may come from middle-income families. Forty-seven percent of the stu-dents reported that both parents were working, and many students indicated that at least one of their parents completed some post-secondary education.
The second section of Table 2.1 lists a variety of indicators of students’ prior school en-gagement and performance. The vast majority of students indicated that they did not have disci-pline problems in school and had high aspirations for their education. For example, approximately 80 percent reported that they had never skipped class during the second semester of 8th or 9th grade, and about the same percentage reported that they had never been sent to the school office for misbehavior. Also, although not shown in the table, virtually all the students reported that they expected to graduate from high school, and nearly two-thirds indicated that they expected to graduate from college.
At the same time, many students appeared to be struggling somewhat in school. Less than 10 percent of the students had 8th-grade math or reading test scores in the 75th percentile or higher, while 35 to 40 percent had test scores below the 25th percentile. Twenty percent of the students reported that they had cut class at least once per week during the second semester of 8th or 9th grade, and nearly 20 percent indicated that they had been sent to the school office for mis-behavior. The table indicates an interesting comparison between the time students reported spend-ing on homework and the time they spent watching television. One-third reported that they spent four or more hours per week doing homework (about one hour per weekday), and 61 percent that they spent two or more hours per day watching television.
The third section of Table 2.1 lists several demographic and school-related characteristics that have been found, both in prior research and in analyses conducted for this evaluation, to have particularly strong associations with later school engagement and performance. As discussed later in this chapter, these characteristics were used to create subgroups of students for the impact analyses. The respective subgroups include students with markedly different prospects for school success.
118
PR/Award # S165A200036
Page e259

-25-
Many of the students appeared to be highly engaged in school. Over half the students in the study sample (54 percent) had attendance rates over 95 percent in the year they entered the study, and another 24 percent had attendance rates between 91 and 95 percent. Eighty-one per-cent of the students who applied to the Academies as 9th-graders had earned at least five credits in that year and would be considered to be on track toward graduation.2 Over one-third of the stu-dents had a 3.1 grade point average or higher (approximately equivalent to a B average or higher) during the year they applied for an Academy.
A significant percentage of students in the study sample appeared to be disengaged from school. Eleven percent might be characterized as chronic absentees with attendance rates of less that 86 percent in the year they applied for the Academy programs. Nearly 20 percent of the stu-dents had already fallen behind in course credits, earning less than five in the 9th grade; 6 percent had fallen well behind, earning two or fewer course credits in the 9th grade. Approximately 21 percent of the students were overage for their grade level, indicating that they had been retained in a previous grade. About 27 percent of the students reported that they had transferred schools two or more times beyond the regular school transitions (such as from elementary to middle school or middle school to high school), indicating that their attachment to school may have been disrupted by family mobility or other reasons. Finally, about 20 percent of the students indicated that they had a sibling who had dropped out of high school.
B. Characteristics of Students in the Academy and Non-Academy Groups
As noted in Chapter 1, each of the students in the study sample applied for and was de-termined to be eligible for enrollment in one of the participating Career Academies. Because the programs had attracted more eligible students than they were able to serve, a lottery was used to select students for enrollment in the Academies. Of the students in the study sample, 959 (54 per-cent) were randomly selected to enroll in an Academy, and 805 (46 percent) were not selected for enrollment in an Academy but were eligible to enroll in other programs or classes in the host schools or school district.
The second and third columns of Table 2.1 provide a comparison between characteristics of students selected for the study’s Academy group and those of students in the non-Academy group. The table indicates that there were no statistically significant differences between the background character-istics and prior school experiences of students in the two groups. This is a result of the random assign-ment design and can also be extended to characteristics that are not directly measured by the data col-lected for this evaluation. These include such constructs as initial motivation, attitudes toward school, and other baseline attributes that may be associated with school engagement and performance. In other words, the random assignment process created two groups for which there were no systematic differ-ences initially, in both measured and unmeasured characteristics. As a result, one can be confident that any systematic differences that emerged after random selection can be attributed to the fact that the Academy group was selected to enroll in the programs and the non-Academy group was not. This chapter also includes a discussion of the rates at which students actually enrolled in the Academies and
2It should be noted here that approximately 22 percent of the students were applying for the Academies as 8th-
graders by virtue of the fact that the Academies began in 9th grade. These students were not included in calcula-tions of credits earned in 9th grade.
119
PR/Award # S165A200036
Page e260

-26-
examines the extent to which students remained in the programs and, thus, were likely to be exposed to the full range of Academy experiences.
II. Subgroups of Students Defined by Characteristics Associated with Dropping Out of High School
Previous research on Career Academies has not typically examined the relative effective-ness of the approach among the different types of students the programs serve. Although findings from previous research have been useful, they do not recognize the fact that Career Academies may change certain outcomes for some students but not necessarily for others. The random as-signment research design used in this evaluation provides a unique opportunity to assess the po-tential for the Academies to make a difference for various groups of students. As noted above, engagement and performance of students in the study’s non-Academy group provide the best in-dication of how students in the Academy group were likely to behave if they did not have the op-portunity to enroll in an Academy.
In particular, many students in the study’s non-Academy group were unlikely to drop out of high school, making it unlikely that the Academies could reduce dropout rates or increase basic school engagement much further for them. An important question about these students, however, is whether the Academies expanded (or at least did not limit) their opportunities to pursue a more rigorous curriculum or increased their preparation for post-secondary education and employment. By contrast, other students in the non-Academy group (for example, those who had failed several courses in 9th grade) were at relatively high risk of school failure and could be seen as having the potential to benefit from involvement in the Academies in a variety of ways, including being pre-vented from dropping out.
Given the dramatic differences in outcomes for various subgroups of students within the non-Academy group, the primary focus of this report is on the impact Career Academies have for students at greater or lesser risk of dropping out of high school or of doing poorly, if they remain in high school. To assess this variation in impacts, students in the study sample were divided into three subgroups based on selected background characteristics and prior school experiences that were associated with dropping out of high school. This section of the chapter provides an overview of the strategy used to identify these subgroups and highlights the basic distinctions among them.
Student subgroups were defined using six characteristics found to be strong predictors of dropping out among students in the study’s non-Academy group. These characteristics were all measured at the time students applied for a Career Academy and before they were randomly se-lected for the Academy or non-Academy group. Each of these characteristics has also been identi-fied in prior research as being highly correlated with dropping out of high school.3 They include:
• average daily attendance in the year the student applied for an Academy;
• grade point average for the year the student applied for an Academy;
3For a review of research literature on background characteristics, measures of prior school performance, and other factors associated with dropping out of school, see Natriello, 1987, and Roderick, 1993.
120
PR/Award # S165A200036
Page e261

-27-
• the number of credits earned toward graduation in 9th grade (for students applying for an Academy at the end of 9th grade);
• whether the student was overage for grade (indicating the student had been re-tained in a prior grade);
• whether the student had a sibling who dropped out of high school; and
• whether the student had transferred schools two or more times beyond the typical school transitions.
In other random assignment studies, subgroups have been determined by identifying sample members using one or more characteristics associated with a difference in the way they are likely to be treated by the program under study or in the outcomes they are likely to achieve without having access to the program.4 In education research, subgroups have been created by distinguishing between stu-dents who have, for example, two or more characteristics associated with school failure and those who have only one such characteristic or none.5 Such methods might be called “risk-factor accumulation” strategies because they involve simply adding up particular indicators and defining the subgroups based on the number of risk-related characteristics a given student has.
Risk-factor accumulation strategies, however, have some limitations. In particular, they give equal weight to each of the selected risk-related background characteristics and prior school experiences. As a result, they do not account for the fact that some characteristics are more highly associated with school failure than others. In addition, this strategy does not account for the fact that some students also have a number of related characteristics that are associated with school success and that may offset the risk associated with other characteristics. For example, some stu-dents may have failed several courses in 9th grade even though they attended regularly and did not have other background characteristics associated with dropping out. As a result, various combina-tions of characteristics, along with different degrees of importance attached to some characteris-tics, may indicate a different degree of risk.
Given these limitations, a more systematic approach was used for this report, in order to identify groups of students who were clearly distinct in terms of their likelihood of dropping out in the absence of access to a Career Academy.6 In particular, the background characteristics and prior school experiences listed above were used to predict the probability that students in the non-Academy group would drop out of high school. This provided an estimate of the unique contribu-tion that each characteristic made to predicting that these students would drop out. For example, attendance rates and credits earned toward graduation were found to be better predictors of dropping out than students’ being overage for grade. Also, the prediction model provided the op-portunity to give more weight to different specifications of a characteristic. For example, the lower a student’s prior attendance rate, the more likely that he or she would drop out. Thus, stu-dents with very low attendance rates might be considered at high risk of dropping out, even
4See, for example, Friedlander, 1988. 5See, for example, NCES, 1990 and NCES, 1992. 6Appendix B provides a more detailed and technical discussion of the subgroup identification strategy used for
this report, including some potential limitations of this approach.
121
PR/Award # S165A200036
Page e262

-28-
though they had not been held back in a previous grade and did not have a sibling who dropped out of school.
Because of the random assignment research design, this approach, based on these characteris-tics, best predicts which students in the Academy group would have dropped out in absence of access to an Academy. Thus, students in the Academy group were sorted using the same average background characteristics that were used to predict dropping out for the non-Academy group. Following are brief definitions of the three risk subgroups, which are described further below.
• High-risk subgroup: students in the study sample (approximately 25 percent of both the Academy and the non-Academy groups) with the combination of characteristics associated with the highest likelihood of dropping out
• Low-risk subgroup: students in the study sample (approximately 25 percent of both the Academy and the non-Academy groups) with the combination of characteristics associated with the lowest likelihood of dropping out
• Medium-risk subgroup: the remaining students in the study sample (ap-proximately 50 percent of both the Academy and the non-Academy groups) with a mix of characteristics indicating that they were not particularly likely to drop out but were not necessarily highly engaged in school
A. Characteristics of Students in the Risk Subgroups
Table 2.2 presents selected characteristics of students in the three risk subgroups, includ-ing the background characteristics and prior school experiences used to define the subgroups. Be-cause each of the characteristics used to define the subgroups was measured before students were randomly assigned to the two main study groups, there are no systematic differences in observed background characteristics between Academy and non-Academy groups within each of the three risk subgroups.7
Students in the High-Risk Subgroup. The third section of Table 2.2 lists the six charac-teristics that were used to define the risk subgroups. It shows, for example, that 43 percent stu-dents in the high-risk subgroup had a sibling who dropped out of high school and that 43 percent were overage for their grade level (indicating they had been held back in a prior grade). About one-third of these students could be classified as chronic absentees (having an attendance rate of 85 percent or lower in the year they applied to an Academy), and 62 percent had a grade point average of 2.0 or lower (out of a possible 4.0). Also, over half of the students in the high-risk
7The initial prediction of dropping out was based on analyses using the non-Academy group. An index of av-
erage characteristics of likely dropouts from the non-Academy group was then applied to the Academy group. Given the statistical properties of the analyses used, random differences in characteristics between the Academy and the non-Academy groups are likely to yield somewhat more accurate predictions of likely dropouts for the non-Academy group. This means that, in the high-risk subgroups, the dropout rate for non-Academy students may be artificially higher than the dropout rate for Academy students. Extensive analyses were conducted to identify the potential magnitude of this distortion. These analyses indicate that whatever distortion exists is negligible and did not change the pattern of impacts. This issue is discussed in greater detail in Appendix B.
122
PR/Award # S165A200036
Page e263

-29-
Table 2.2
Career Academies Evaluation
Background Characteristics of Study Sample,by Subgroups Defined by Risk of Dropping Out of School
High-Risk Medium-Risk Low-RiskSubgroup Subgroup Subgroup
Characteristic (%) (%) (%)
Demographic and family characteristics
GenderMale 43.0 45.5 41.3Female 57.0 54.6 58.7
Age of student at time of application13 or younger 2.1 10.6 11.7 ***14 22.2 39.2 43.615 54.4 42.8 43.316 or older 21.3 7.4 1.4
Race/ethnicityBlack 37.6 29.9 22.7 ***White 4.7 7.2 6.8Hispanic 51.8 56.0 61.5Asian or Native American 5.9 6.9 9.2
Student speaks limited Englisha 8.7 7.7 6.2
Student lives in single-parent household 49.7 39.2 23.8 ***
Neither parent has high school diploma 26.6 29.5 28.8
Parental WorkBoth parents work 41.3 48.3 51.9 ***Father works 24.9 20.6 29.0Mother works 19.4 19.8 12.1Neither parent works 14.3 11.3 7.1
Family receives welfare or Food Stamps 31.8 23.0 18.6 ***
Family mobility in past two yearsHave not moved 54.2 60.5 63.3 ***Moved 1 or 2 times 33.5 34.6 31.7Moved 3 or more times 12.4 5.0 5.0
Educational characteristics
8th-grade math test scoreb
75th percentile or higher 3.1 8.8 14.0 ***50th to 74th percentile 16.3 20.5 24.825th to 49th percentile 31.0 33.9 29.924th percentile or lower 49.5 36.8 31.3
(continued)
123
PR/Award # S165A200036
Page e264

-30-
Table 2.2 (continued)
High-Risk Medium-Risk Low-RiskSubgroup Subgroup Subgroup
Characteristic (%) (%) (%)
8th-grade reading test scorec
75th percentile or higher 4.1 10.6 14.6 ***50th to 74th percentile 19.7 19.5 18.925th to 49th percentile 36.3 37.6 33.524th percentile or lower 40.0 32.3 33.1
Student does not feel safe at school 27.0 22.5 20.6 *
Frequency of cutting classesNever 63.4 82.2 89.7 ***At least 1 time a week 33.2 16.9 10.3Daily 3.4 0.9 0.0
Sent to office for misbehavior Never 73.6 81.0 90.4 ***
1-2 times 20.7 16.4 8.73-10 times 5.7 2.5 1.0
Characteristics associated with dropping out of school
Attendance rate, year prior to random assignment96-100% 24.4 52.5 91.0 ***91-95% 23.6 32.3 7.986-90% 18.7 11.7 1.085% or lower 33.3 3.6 0.2
Credits earned in 9th graded
5 or more credits 47.2 93.8 100.0 ***3-4 credits 35.1 6.3 0.02 or fewer credits 17.7 0.0 0.0
Grade point average in year of random assignmente
3.1 or higher 12.5 37.2 58.6 ***2.1-3.0 25.5 44.0 39.32.0 or lower 62.0 18.7 2.1
Student is overage for grade levelf 43.0 18.2 2.4 ***
School mobilityg
0 or 1 different school 50.0 71.9 99.0 ***2 or more different schools 50.0 28.1 1.0
Student has sibling who dropped out of high school 42.7 17.5 0.5 ***
Sample size (N=1,764) 474 869 421 (continued)
124
PR/Award # S165A200036
Page e265

-31-
Table 2.2 (continued)
SOURCES: See Table 2.1.
NOTES: All characteristics were measured at the time students applied to the Career Academy program and prior to being randomly selected to the Academy and non-Academy groups. Invalid or missing values are not included in individual variable distribution. Rounding may cause slight discrepancies in calculating of sums and differences. A chi-square test was applied to differences in the distribution of characteristics across the Academy and non-Academy groups. Statistical significance levels are indicated as: *** = 1 percent; ** = 5 percent; * = 10 percent.
aThese are students who responded that they spoke English "not well" or "not at all."
bSeveral different standardized, nationally normed math tests were administered to students, depending on the district where their school was located and the year they entered the study. National percentile scores were used because they were the only standardized scores available across tests.
cSeveral different standardized, nationally normed reading tests were administered to students, depending on the district where their school was located and the year they entered the study. National percentile scores were used because they were the only standardized scores available across tests.
dThis was applicable only to students who applied to the Career Academy at the end of their 9th-grade year.
eGrade point averages were converted to a standard 4.0 scale from 100-point or 5-point scales for some sites.
fA student is defined as overage for grade at the time of random assignment if she or he turns 15 before the start
of the 9th grade, or 16 before the start of the 10th grade. This indicates that the student was likely to have been held back in a previous grade.
gSchool mobility is defined as the number of schools attended since the 1st grade beyond the number expected to result from promotions in grade level or graduations.
subgroup who applied for an Academy at the end of 9th grade had already fallen behind in the number of course credits they needed to graduate.
Table 2.2 also highlights a number of other distinctive characteristics of students in the high-risk subgroup. It shows that these students were the most likely to have 8th-grade math or reading test scores below the 25th percentile nationally. About half of them lived in single-parent households, and 32 percent reported that their families received public assistance.
Students in the Low-Risk Subgroup. The vast majority of students in the low-risk sub-group had attendance rates higher than 95 percent, and all of those who applied to an Academy at the end of 9th grade had earned at least five credits toward graduation. Over half had a grade point average of 3.1 or higher, and very few were overage for grade. Almost none of the low-risk stu-dents had a sibling who dropped out of high school, and very few had transferred schools other than at the typical school transition points. The majority of these students lived in households where at least one parent had a high school diploma or GED (over 70 percent), and over half lived in households where both parents worked.
Although students in the low-risk subgroup appeared to be highly engaged in school at the time they applied to an Academy, their standardized test scores indicate that they were not necessarily high-achieving students. Less than 15 percent of the low-risk subgroup had
125
PR/Award # S165A200036
Page e266

-32-
math or reading test scores above the 75th percentile nationally, and almost a third scored in the bottom quartile.
Students in the Medium-Risk Subgroup. The students in the medium-risk subgroup reflect a mix of background characteristics and prior school experiences. Many of these students appeared to be highly engaged in school; the vast majority of those who applied for an Academy at the end of 9th grade had earned five or more course credits, and about half had attendance rates of higher than 95 percent. At the same time, just under 20 percent were overage for their grade level, and just under 20 percent had a grade point average of 2.0 or lower.
B. Selected Outcomes by Risk Subgroup for the Non-Academy Group
Figure 2.1 shows three outcomes that are central to the analyses conducted for this report: the dropout rate, the percentage of students who completed sufficient course credits to meet their districts’ graduation requirements, and the percentage of students who completed a basic core academic curriculum (four course credits in English, three course credits in social studies, and two course credits each in science and math). Each outcome was measured at the end of the students’ 12th-grade year. The figure illustrates the percentages of students in the non-Academy group from each of the three risk subgroups who attained each of these outcomes. It illustrates the dramatic differences among the three subgroups.
Thirty-two percent of non-Academy students in the high-risk subgroup dropped out of high school, and nearly three-quarters had not earned enough credits to graduate from high school by the end of their 12th-grade year. Only 16 percent of the non-Academy students in this subgroup had completed the basic core academic curriculum. The analysis in Chapter 3 assesses the extent to which students in the Academy group who had the same background characteristics fared bet-ter than their non-Academy counterparts.
Figure 2.1 also illustrates the relatively high level of engagement among non-Academy students in the low-risk subgroup. In all, only 3 percent of these students in the non-Academy group dropped out of high school, and 75 percent had earned enough credits to meet their dis-tricts’ graduation requirements. Just over 60 percent had completed the basic core curriculum. The analysis in Chapter 3 assesses the extent to which the Career Academies enhanced or limited the capacity of these students to complete their course requirements for graduation and to prepare for post-secondary education.
As expected, the outcome levels for non-Academy students in the medium-risk subgroup fell between those in the high- and low-risk subgroups. Eight percent of non-Academy students in the me-dium-risk subgroup dropped out of high school, while 65 percent earned sufficient credits to meet dis-trict graduation requirements. About half of these students completed the basic core curriculum.
III. Career Academy Enrollment and Attrition Patterns
This section of the chapter examines the patterns by which students in the study sample enrolled and remained in the Career Academies. This information is important to the evaluation because the patterns of Academy enrollment and attrition are the key indicators of the extent to which students in the sample were exposed to the full range of Academy experiences. Thus, these
126
PR/Award # S165A200036
Page e267

-33-
patterns are key determinants of program impacts and provide a crucial context for interpreting the results discussed later in the report. This information is also relevant to policies and practices affecting Career Academies because they shed light on the demand for the programs and assess their capacity to keep students engaged in their activities and services.
Figure 2.1
Career Academies Evaluation
12th Grade Outcomes AmongNon-Academy Students, by Risk Subgroup
32%
26%
16%
8%3%
75%
61%65%
51%
0%
10%
20%
30%
40%
50%
60%
70%
80%
90%
100%
Dropped Out of School Completed Credits to Graduate Completed Basic Core Courses
High School Outcomes
Per
cent
age
of S
tude
nts
High RiskMedium RiskLow Risk
a
SOURCES: MDRC calculations from the Career Academies Evaluation School Records and 12th Grade Survey Databases.
NOTES: A two-tailed t-test was applied to differences between Academy and non-Academy groups. Statistical significance levels are indicated as *** = 1 percent; ** = 5 percent; * = 10 percent.
aIndicates completion of four English, three social studies, two math, and two science courses during high school.
The findings discussed in this section of the chapter are based on 782 students in the study sample who were randomly selected for the Academy group at the end of 8th or 9th grade.8 The analysis follows these students through the end of their 12th-grade year to determine the percent-age who actually enrolled in a Career Academy and then examines the patterns by which they left or remained in the programs. It also examines the reasons why some of these students chose not to enroll in a Career Academy or why they enrolled for a time and then left.
A. How Many Students Enrolled in a Career Academy and How Many Stayed in the Programs?
Figure 2.2 illustrates the enrollment patterns of a typical group of 100 students in the
8This includes students in the Academy group from the Career Academies Evaluation Student School Records
Database. The remaining Academy students in the study sample did not have a complete set of school records and, therefore, did not have a complete record of their school enrollment status.
127
PR/Award # S165A200036
Page e268

-34-
study sample selected to enroll in the Academy programs. The numbers in the boxes thus repre-sent percentages of the 782 students in the Academy group who were randomly selected to enroll in programs. The figure shows that 88 percent of these students enrolled in a Career Academy at some point during high school; the vast majority did so during the year following their application to the programs (the first semester of 9th or 10th grade). Figure 2.2 also shows that 58 percent of the initial group of students were still enrolled in an Academy at the end of their 12th-grade year. This means that 66 percent of those who were enrolled in an Academy for at least one semester remained in the programs throughout high school.
Figure 2.2 also indicates that a significant portion of those initially selected for the pro-grams were not exposed to the full range of Career Academy experiences. In all, 42 percent of the Academy group either did not enroll in the program or enrolled for a semester or more and then left. The next two sections provide an overview of what happened to these students and review some of the factors that led to their not enrolling or not remaining in the programs.
B. What Happened to the Students Who Never Enrolled in a Career Academy or Who Enrolled and Later Left the Programs?
The following is a summary of the high school enrollment status of those students who either never enrolled in a Career Academy or enrolled and then left the programs before the end of high school.
• 12 percent of the students randomly selected for the Academy group never enrolled in a Career Academy. Following is a summary of the high school enrollment status at the end of their 12th-grade year:
• 4 percent were still enrolled in the high school in which the Academy was located (but were not enrolled in the Academy).
• 5 percent were enrolled in another high school in the same district.
• 1 percent were enrolled in a high school in another district.
• 2 percent dropped out of high school.
• 30 percent of the students randomly selected for the Academy group enrolled in a Career Academy during at least one semester of high school, but they left the program before the second semester of their 12th-grade year. Nearly 90 percent of these students had left a Career Academy by the end of their 11th-grade year. This begins an important stage of involvement in an Academy because most work-based learning activities occur during the summer between 11th and 12th grades or during the 12th-grade year. These students spent an average of three se-mesters in the program before they left. Following is a summary of their school en-rollment status at the end of their 12th-grade year:
• 12 percent were still enrolled in the high school in which the Academy was located (but were not enrolled in the Academy).
• 9 percent were enrolled in another high school in the same district.
• 1 percent were enrolled in a high school in another district.
• 8 percent had dropped out of high school.
128
PR/Award # S165A200036
Page e269

-35-
Figure 2.2
Career Academies Evaluation
Career Academy Enrollment and Attrition PatternsAmong Students Selected to Enroll
Students selected toenroll in Career
Academy100
Enrolled in CareerAcademy
88
Never enrolled inCareer Academy
12
Left CareerAcademy
30
Stayed in CareerAcademy
58
Stayed in highschool
22
Dropped out of highschool
8
Stayed in highschool
10
Dropped out of highschool
2
Enrollment Status at End of 12th GradeYear
SOURCE: MDRC calculations from the Career Academies Evaluation Student School Records Database.
NOTE: Numbers are derived in proportion to 782 students who were selected to enroll in Career Academies.
In sum, therefore, 90 percent of the students randomly selected for the Academy group were still enrolled in high school at the end of their 12th-grade year. Following is a summary of where they were enrolled in school:
• 58 percent were enrolled in a Career Academy.
• 16 percent were enrolled in the high school in which the Academy was located.
• 15 percent were enrolled in another high school in the same district.
• 1 percent were enrolled in a high school in another district.
Also, by the end of their 12th-grade year, approximately 10 percent of the students in the Academy group had dropped out of high school.
C. Why Did Students Not Enroll in a Career Academy or Enroll and Then Leave?
Of the students who applied for a Career Academy and were selected to enroll, 42 percent had either never enrolled in an Academy or had enrolled and then left before the second semester of their 12th-grade year. A subset of 251 completed the 12th Grade Survey and provided informa-tion about why they did not enroll in an Academy or why they enrolled and then left. Students were asked to rate up to 16 items in terms of how important each was as a reason for not enroll-ing in an Academy or enrolling and then leaving. For the purposes of this analysis, the primary
129
PR/Award # S165A200036
Page e270

-36-
reasons for never enrolling, or for enrolling and then leaving, were divided into four mutually ex-clusive groups: student choice, family mobility and school transfer, being asked to leave, and dropping out.9
The following is a summary of the reasons that students listed as the most important fac-tors that led them to never enroll in a Career Academy or to enroll for at least one semester and then leave before the end of their 12th-grade year.
• Student choice. 54 percent of the students reported one or more reasons, in-dicating that they chose not to enroll or chose to leave the Academy. Among those who chose to leave or not to enroll, the most common reasons in-cluded:10
• I wanted to enroll in another program. (42 percent)
• I was not really interested in the program to begin with. (39 percent)
• I did not think the program would help me get into the college I wanted. (32 percent)
• I did not like the teachers. (36 percent)
• I lost interest in the occupational area. (35 percent)
• Mobility. 23 percent of the students reported that they moved and had to transfer to another high school.
• Being asked to leave. 16 percent reported that they were asked to leave the Academy.
• Dropping out. 5 percent reported that they stopped going to high school.
• No primary reason. 2 percent did not indicate a primary or secondary reason.
This suggests that most of the attrition from the Career Academies is the result of a deci-sion on the part of students. However, nearly one-quarter of the attrition appears to be a function of family mobility and school transfers.
9Students were asked to rate each reason on a 4-point scale: 1 = very important, 2 = sort of important, 3 = not
very important, and 4 = not important at all. Items that were rated as “very important” were designated as primary reasons, and items rated as “sort of important” were designated as secondary reasons. If a student did not list a primary reason, then the secondary reason was designated as the primary reason.
10These are not mutually exclusive categories. Many students listed several reasons as being “very important” or “sort of important.” In addition to the reasons listed, other reasons students chose to leave or not enroll in the Academies included: “The program was too hard”; “I wanted to be in classes with more of my friends”; “I was tired of being in classes with the same students”; “I did not think the program would help me get the job I wanted”; and “I chose to leave for other reasons.”
130
PR/Award # S165A200036
Page e271

-37-
D. Who Is Most Likely to Enroll and Remain in a Career Academy?
Table 2.3 presents the Career Academy enrollment and attrition rates for selected sub-groups of students who were randomly selected for the Academy group. The table shows the per-centage of each subgroup who had enrolled in an Academy at some point during high school and the percentage who remained enrolled in the programs through the end of 12th grade. The table also shows the percentage of each subgroup who enrolled during at least one semester of high school but who then left before the end of 12th grade. Finally, the last column of the table shows the average number of semesters that students in each subgroup were enrolled in an Academy.
In general, the table indicates that there were some modest differences among various subgroups in the percentage of students who had enrolled in an Academy during at least one se-mester during high school. Academy enrollment rates ranged from 80 to 95 percent for most of the subgroups. It is interesting to note that the initial Career Academy enrollment rates were quite similar among the three risk subgroups.
Table 2.3 does indicate somewhat more variation among the various subgroups in the percent-age of students who remained in a Career Academy through the end of their 12th-grade year. In gen-eral, students in the high-risk subgroup were less likely than medium- and low-risk students to be en-rolled in a Career Academy through the end of 12th grade. This can be seen in the last section of the table, which shows the enrollment rates for the risk subgroups. It shows that 43 percent of students in the high-risk subgroup were enrolled in an Academy at the end of 12th grade, indicating that about half of those who initially enrolled eventually left the programs. On average, these students spent just under four semesters in a Career Academy. For the majority of high-risk students, therefore, the benefits that may have derived from the Academies were likely to occur during 10th and 11th grades (or 9th and 10th grades in sites where the Academies began in 9th grade). Thus, many students in the high-risk subgroup did not stay in the programs long enough to participate in the work-based learning programs and work internships, which typically occur after 11th grade.
By contrast, 73 percent of the students in the low-risk subgroup were enrolled in a Career Academy at the end of 12th grade. This means that over 80 percent of these students who initially enrolled in a Career Academy remained enrolled in the programs throughout high school. On av-erage, students in the low-risk subgroup spent over five semesters in a Career Academy.11
E. Implications for Career Academy Implementation and for the Career Academies Evaluation
The enrollment and attrition patterns discussed above have implications for policy and practice related to the Career Academies. They also provide an important context for interpreting the impact findings discussed in Chapter 3. These are discussed briefly below.
Implications for Career Academy Policies and Implementation. It is unclear how much of the attrition could theoretically be controlled or avoided by the Academies. Student mo-
11Note that for approximately 80 percent of the students in the sample, the Career Academies began in 10th
grade. These students had the opportunity to remain enrolled in an Academy for up to six semesters. For the remaining students, the Career Academies began in 9th grade, providing students with the opportunity to enroll for up to eight semesters.
131
PR/Award # S165A200036
Page e272

-38-
Table 2.3
Career Academies Evaluation
Career Academy Enrollment and Attrition Ratesfor Selected Subgroups of the Academy Group
Ever Enrolled Enrolled in a Average Numberin a Career Enrolled through Career Academy of Semesters
Sample Academy 12th Grade and Then Left Enrolled in a Subgroups Size (%) (%) (%) Career Academy
All students randomly selected for Academy group 782 88.4 58.7 29.7 4.6
Demographic and family characteristicsMale 345 88.4 55.4 33.0 4.4Female 437 88.3 61.3 27.0 4.7
Age of student at time of application13 or younger 60 85.0 58.3 26.7 5.614 283 88.3 59.0 29.3 4.815 369 90.0 60.4 29.5 4.516 or older 69 82.6 47.8 34.8 3.7
Race/ethnicityBlack 240 80.0 50.8 29.2 4.3White 45 97.8 64.4 33.3 4.7Hispanic 423 92.7 61.9 30.7 4.8Asian or Native American 62 83.9 61.3 22.6 4.3
Student speaks limited Englisha
46 95.7 76.1 19.6 5.1
Student lives in single-parent household 285 82.8 50.9 31.9 4.2
Neither parent has high school diploma 194 94.8 66.0 28.9 4.9
Parental WorkBoth parents work 339 88.5 60.8 27.7 4.6Father works 171 92.4 61.4 31.0 4.8Mother works 139 87.8 59.0 28.8 4.7Neither parent works 79 78.5 45.6 32.9 4.0
(continued)
132
PR/Award # S165A200036
Page e273

-39-
Table 2.3 (continued)
Ever Enrolled Enrolled in a Average Number in a Career Enrolled through Career Academy of Semesters
Sample Academy 12th Grade and Then Left Enrolled in a Subgroups Size (%) (%) (%) Career Academy Family receives welfare or Food Stamps 159 85.5 49.7 35.8 4.4 Family mobility in past two years
Have not moved 498 87.1 54.2 32.9 4.5 Moved 1 or 2 times 231 92.2 67.1 25.1 4.9 Moved 3 or more times 43 79.1 58.1 20.9 4.3
Characteristics associated with dropping out of school
Student has sibling who dropped out of high school 151 88.1 53.0 35.1 4.3 Attendance rate, year prior to random assignment
96-100% 430 90.7 67.2 23.5 5.0 91-95% 185 86.5 54.6 31.9 4.5 86-90% 94 85.1 46.8 38.3 4.0 Less than 85% 70 82.9 32.9 50.0 3.2
Credits earned in 9 th grade b
5 or more credits 482 90.5 65.4 25.1 4.6 3-4 credits 76 88.2 39.5 48.7 3.6 2 or fewer credits 18 81.3 25.0 56.3 2.8
Grade point average in year of random assignment c
3.1 or higher 253 85.0 63.2 21.7 5.2 2.1-3.0 282 91.5 61.7 29.8 4.5 2.0 or lower 172 87.8 46.5 41.3 3.8
Student is overage for grade level d 153 83.7 46.4 37.3 4.0
School mobility e 0 or 1 different school 558 88.5 60.6 28.0 4.7 2 or more different schools 189 87.8 56.1 31.7 4.5
(continued)
133
PR/Award # S165A200036
Page e274

-40-
Table 2.3 (continued)
Ever Enrolled Enrolled in a Average Numberin a Career Enrolled through Career Academy of Semesters
Sample Academy 12th Grade and Then Left Enrolled in a Subgroups Size (%) (%) (%) Career Academy
Overall risk of dropping outf
High risk 185 86.5 42.7 43.8 3.8Medium risk 393 88.8 58.8 30.0 4.6Low risk 204 89.2 73.0 16.2 5.2
Sample size 782SOURCES: MDRC calculations from the Career Academies Evaluation Student School Records Database.
NOTES: All characteristics were measured at the time students applied to the Career Academy program and prior to being randomly selected to the Academy group. Invalid or missing values are not included in individual variable distribution. Rounding may cause slight discrepancies in calculating of sums and differences. Tests of statistical significance were not performed. Sample sizes may vary due to missing data.
aThese are students who responded that they spoke English "not well" or "not at all."
bThis was applicable only to students who applied to the Career Academy at the end of their 9th-grade year.
cGrade point averages were converted to a standard 4.0 scale from 100-point or 5-point scales for some sites.
dA student is defined as overage for grade at the time of random assignment if she or he turns 15 before the start of the 9th grade, or 16 before the
start of the 10th grade. This indicates that the student was likely to have been held back in a previous grade.
eSchool mobility is defined as the number of schools attended since the 1st grade beyond the number expected to result from promotions in grade level or graduations.
fThese subgroups were defined using a combination of the characteristics listed above under "characteristics associated with dropping out of school." See text for details.
134
PR/Award # S165A200036
Page e275

-41-
bility and dropout are not uncommon problems in most urban high school districts, and they were factors associated with the attrition from the Career Academies in this evaluation. As discussed earlier, nearly one-quarter of the students who never enrolled or left the Academies did so be-cause they moved. This finding suggests that at least part of the attrition from the Academies re-sults more from family relocation patterns than from any particular feature or shortcoming of the Academy (although some families may have moved to find better schools).
However, just over half of those who never enrolled or who enrolled and then left indi-cated that they chose to do so. It is not unreasonable to expect that a substantial number of the Academy students who enroll in 9th or 10th grade would decide that the Academy program is not the best context in which to pursue their education. In some cases students may leave the Acad-emy because they decide that they are no longer interested in the career theme or in the various work-related learning activities. This attrition need not imply shortcomings in the Academy model or its implementation if the students made the choice to leave because they had access to oppor-tunities that better suited their needs and interests.
Many high schools and school districts around the country are attempting to expand the number of Career Academies they operate. In some cases, there are efforts to convert entire high schools to a series of Career Academies (often referred to as “wall-to-wall” Academies). In these cases, every student in the school would be required to enroll in an Academy beginning in 10th grade (or, in some cases, in 9th grade). The findings on enrollment and attrition from this study suggest that there may not be an excess of demand for Academies, at least under circumstances where students have the opportunity to choose to leave and staff have the opportunity to ask stu-dents to leave.
Each of the programs in the study received applications from more students than it was able to serve. This suggests that there was likely to be enough demand for Career Academies to justify expanding the number of programs within the high schools. However, given the opportu-nity to choose to leave the programs — or, on the part of staff, given the opportunity to dismiss students from the programs — less than 60 percent of the students remained in the programs throughout high school. This suggests that the current programs may be operating at capacity, based on the number of students who choose to stay and whose mobility patterns permit them to do so.
Interpreting the Impact Findings. The fundamental comparison being made in the im-pact analysis is between outcomes for students who were selected to enroll in an Academy (the Academy group) and outcomes for students who were not selected (the non-Academy group). Differences between the groups were driven by the extent to which the Academy group was ex-posed to the Academy experiences and the extent to which the non-Academy group was not. The analysis in this chapter shows, however, that not all the students randomly assigned to the Acad-emy group actually enrolled in an Academy. In addition, approximately 6 percent of the students in the non-Academy group were inadvertently allowed to enroll in Academies. Thus, differences between the two groups reflect the Academy-related experiences of those students in the Acad-emy group who enrolled in an Academy (88 percent) and the experiences of those students in the non-Academy group who did not enroll in an Academy (94 percent).
135
PR/Award # S165A200036
Page e276

-42-
In order to produce unbiased estimates of the Academies’ true impact, it is necessary to include all sample members in the analysis, regardless of their Academy enrollment status. For ex-ample, students who dropped out of high school are considered to have attended school for zero days and to have earned zero credits during the period they had left school. To the extent that the Career Academies keep students in their programs and prevent them from dropping out, exclud-ing these zero values from the analysis would lead to a serious underestimation of the program impacts. At the same time, the findings in the chapter show that students in the high-risk subgroup are more likely to leave the Academies. If these students were excluded from the Academy group but not from the non-Academy group, it would appear that the Academies include fewer low-achieving and less engaged students. This would represent a serious overestimation of the impact of Career Academies.
Nevertheless, it is highly unlikely that the Career Academies had much effect on students in the study’s Academy group who never enrolled in them. It is also not accurate to assume that the Academies had no effect on students in the study’s non-Academy group who did enroll. From this perspective, the impact estimates may be perceived as being “diluted.” Thus, it is useful to provide impact estimates that account for these “crossovers” in research status.
In the case of the Career Academies Evaluation, the impacts are adjusted based on the dif-ference in actual enrollment rates among Academy and non-Academy groups. In particular, each of the tables in Chapters 3 and 5 includes the impact per enrollee for each outcome. This is de-fined as the difference between the outcomes of Academy and non-Academy students divided by the difference between the percentage of Academy and non-Academy students who ever enrolled in an Academy. This adjustment is discussed further in Chapter 3.
These adjustments do not substantially change the overall impact story discussed in Chap-ters 3 and 5. The impact per enrollee can be interpreted as the impact from actually enrolling in an Academy, as opposed to simply being recruited and selected for admission. Chapters 3 and 5 ex-plore the extent to which the patterns of the impacts of Career Academies on student outcomes vary across different subgroups of students. The analysis presented above suggests that these im-pacts are not greatly affected by differences across the subgroups in the extent to which these stu-dents ever enroll in an Academy. However, it suggests the possibility that impacts are affected by differences in how long subgroups remain in an Academy.
136
PR/Award # S165A200036
Page e277

-43-
Chapter 3
Career Academy Impacts on Student Engagement, Performance, and Achievement
Chapter 2 described the background characteristics and prior school experiences of the students who are the focus of this report. This chapter evaluates the impact of Career Academies on a broad range of high school outcomes for students at different levels of risk of school failure.
The random assignment research design used in this study provides a uniquely rigorous way to identify the impact of Career Academies. The students in this study were randomly as-signed to either the Academy group, which had access to an Academy, or to the non-Academy group, which did not. As a result, the impact of the Career Academies is defined as the difference in the outcome levels achieved by Academy students over and above those achieved by their non-Academy counterparts. These impact findings provide the most reliable estimates of the true dif-ference these Academies made for the students they aimed to serve.
Most previous evaluations of Career Academies have tended to focus on program out-comes and impacts for the “typical” or “average” Career Academy student. Like these previous studies, this chapter provides a brief summary of results that are averaged across the diverse group of students and sites participating in this evaluation. However, as discussed in Chapter 2, it is clear from both a substantive and a statistical standpoint that these “average” results mask the high degree of underlying variation in impacts. In particular, the analysis in Chapter 2 revealed that, within this study sample, there are groups of students who had substantially different back-ground characteristics and who, in the absence of the Academy treatment, experienced substan-tially different academic outcomes at the end of high school.
Therefore, to adequately understand the impact of these Career Academies, it is important to recognize that they affect students differently depending on the types of skills, attributes, and prior experiences that the students bring to the programs. Thus, the impact findings discussed in this chapter are presented separately for the three subgroups of students described in Chapter 2: students at high risk of dropping out and highly likely to be disengaged if they stayed in school (approximately 25 percent of the study sample); students at low risk of dropping out and likely to remain engaged and perform well in school (approximately 25 percent of the study sample); and students at only medium risk of dropping out but not necessarily highly engaged in school (ap-proximately 50 percent of the study sample).1
The evidence presented in this chapter suggests the following conclusions:
• Among students most at risk of dropping out, Career Academies significantly improved high school outcomes. The Academies reduced dropout rates, im-proved attendance, increased academic course-taking, and increased the likeli-hood that students graduated on time.
1Each of these subgroups comprises students from the study’s Academy and non-Academy groups as deter-
mined at random assignment. As discussed in Appendix B, there are no systematic differences in measured back-ground characteristics between Academy and non-Academy students within each subgroup.
137
PR/Award # S165A200036
Page e278

-44-
• Among the students least likely to drop out of high school, Career Academies increased the likelihood that students were prepared to graduate on time. Be-cause both Academy and non-Academy students in the low-risk subgroup were likely to remain strongly engaged in high school, the Academies had little or no impact on most indicators of student engagement and performance.
• On average, the Career Academies produced little or no change in outcomes for students in the medium-risk subgroup.
• When data are averaged across the diverse groups of students and sites partici-pating in the evaluation, it appears that the Career Academies produced only modest improvements in students’ engagement and performance during high school.
To provide a context for interpreting the estimates presented in this chapter, Section I briefly reviews several important analysis issues.
I. Analysis Issues
When examining the effectiveness of Career Academies in influencing students’ behavior and experiences, it is important to distinguish between measures of program “outcomes” and measures of program “impacts.” Outcomes refers to the measures of student engagement, per-formance, behaviors, achievement, and attitudes — in this case, during their high school years. The chapter examines five sets of outcomes that were measured through the end of each student’s 12th-grade year:
• high school enrollment and attendance rates;
• credits earned and course-taking patterns;
• math and reading achievement test scores;
• use of non-school hours and involvement in negative risk-taking behaviors; and
• steps taken toward further education and work and plans for the future.
As noted in Chapter 1, these outcomes were measured using data collected from school transcript records, a survey that students completed at the end of their 12th-grade year, and a math and read-ing achievement test that a subsample of students completed at the end of their 12th-grade year.
An impact is defined as the effect that a Career Academy has on an outcome. The average outcome levels for students in the Academy group alone provide potentially misleading conclu-sions. Previous research and prior experience highlight the fact that many students succeed or fail in high school for reasons not related to a special intervention like a Career Academy. In order to determine the net effect, or “value added,” of a Career Academy, it is necessary to compare the experiences of a group of students who were exposed to a Career Academy with a similar group of students who also applied but were not selected to enroll. As discussed in Chapter 1, the Acad-emy and non-Academy groups participating in this study were determined through a random se-
138
PR/Award # S165A200036
Page e279

-45-
lection process. The non-Academy group serves as a benchmark for how students in the Academy group would have performed if they had not had access to the programs. Therefore, the impacts (differences in outcomes between the Academy and the non-Academy groups) represent the dif-ference in outcomes that Career Academies generate over and above what non-Academy envi-ronments do for comparable students.
Unless otherwise noted, the measures presented in the tables for this chapter indicate the percentages of students in the Academy and non-Academy groups who attained a given outcome or reported a given behavior or experience. For example, some tables report the percentages of students who dropped out of high school, who attended 95 percent or more of the time through-out high school, or who earned a sufficient number of course credits to meet the school district’s graduation requirements. Other tables report the percentages of students who reported working on volunteer projects, who reported being arrested, or who reported submitting a college applica-tion.
Each table compares the percentage of Academy group students who attained a given out-come with the percentage of non-Academy group students who did so. The difference between the groups represents the impact of the Career Academies. The tables also present the percentage change in the non-Academy group outcome level represented by the impact. This is defined as the impact divided by the non-Academy group average. For example, if 60 percent of the Academy group attained a certain outcome compared with 50 percent of the non-Academy group, this 10 percentage point difference would represent a 20 percent increase (10 divided by 50) over the non-Academy group level of 50 percent.
It is important to note that the impact estimates discussed in this report are based on analyses that include all students in both the Academy and the non-Academy groups. This includes both Academy group students who may not have enrolled in a Career Academy and students from both groups who may have dropped out of high school altogether. As discussed in Chapter 2, not all students randomly selected for the Academy group actually enrolled in an Academy. To the extent that these students are different from their counterparts who did enroll (and, more important, different from students in the non-Academy group), excluding them from the analyses would lead to serious misrepresentation of the impacts.
At the same time, it is unlikely that the Academies had any effect on students who were never involved with the program after they were selected to enroll. In an effort to account for this, each table presents the impact per enrollee, defined as the estimated impact divided by the difference in actual Academy enrollment rates of Academy and non-Academy students. In other words, the impact per enrollee can be interpreted as the impact from actually enrolling in an Academy, as opposed to simply being recruited and selected for admission.2
2This adjustment was proposed by Bloom, 1984, and was used by Orr, Bloom, Bell, Doolittle, Lin, and Cave,
1996. It relies on two assumptions: (1) selection for the Academy group had no effect on students who did not en-roll in an Academy and (2) the average outcome levels for non-Academy students who did enroll would have been the same if they had been assigned to the Academy group initially. Thus, the adjustment can be seen as discounting both the zero impact for that portion of the Academy group who did not receive any part of the Academy treatment and the non-zero impact for that portion of the non-Academy group who got the same treatment as the Academy
(continued)
139
PR/Award # S165A200036
Page e280
-46-
It is also important to note that high school dropouts from both the Academy and the non-Academy groups are included in calculations of outcomes. For example, estimates of average atten-dance rates or credits earned toward graduation include zero values for school years or semesters in which students were confirmed to have dropped out of high school. To the extent that Career Acad-emies prevent Academy students from dropping out, excluding non-Academy group students with zero values (that is, dropouts) would lead to serious underestimation of program impacts.
Finally, another issue of interpretation concerns the “statistical significance” of impact estimates. Statistical significance is a measure of the degree of certainty one may have that some non-zero impact actually occurred. If an impact estimate is statistically significant, then one may conclude with some confidence that the program really had an effect. If an impact estimate is not statistically significant, then the non-zero estimate is more likely to be the product of chance. Unless otherwise noted, the impacts discussed in this chapter were statistically significant at the 10 percent level or lower. This means that there is no more that a 10 percent probability that the difference resulted only from chance.
Statistical significance does not directly indicate the magnitude or importance of an impact estimate — only whether any impact occurred. In an evaluation such as this one, numerically small impact estimates are usually not statistically significant; however, some numerically large impact estimates may not be statistically significant, particularly when sample sizes are small. Smaller sample sizes yield less reliable impact estimates — estimates in which one can have less confidence — than are possible when samples are larger. Therefore, an estimate of a given magnitude that is statistically significant for a relatively large subgroup may not be statistically significant for a smaller subgroup.
II. Career Academy Impacts for Students in the High-Risk Subgroup
This section of the chapter focuses on those students in the study sample who were most likely to drop out of high school or to perform poorly if they stayed in school. As discussed in Chapter 2, this subgroup of students was identified based on background characteristics and school experiences prior to their applying for an Academy program. The high-risk subgroup represents approximately 25 percent of the study sample. The subsequent behavior and perform-ance of students in the non-Academy group provide the best indication of how these students per-formed in high school without the opportunity to attend an Academy.
In general, non-Academy students in the high-risk subgroup dropped out of high school at relatively high rates and appeared to be quite disengaged if they stayed. In all, nearly one-third of these students dropped out of high school before the end of their 12th-grade year, and approxi-mately one-quarter had earned sufficient credits to meet their districts’ graduation requirements. Sixteen percent of the high-risk non-Academy group had completed what might be called a basic core academic curriculum (four credits of English, three credits of social studies, two credits of math, and two credits of science). On average, these students scored below the 20th percentile na-
enrollees. This adjustment does not account for the fact that some students enrolled in an Academy for a semester or more and then left. Further analysis is needed to explore the impact of different “doses” of Academy treatment.
140
PR/Award # S165A200036
Page e281

-47-
tionally on a standardized math and reading achievement test, and just over 20 percent reported that they had taken the SATs or ACTs by the end of their 12th grade year.
The findings discussed in this section of the chapter indicate that the Career Academies significantly improved high school outcomes among students in the high-risk subgroup. For these students, the Career Academies substantially reduced dropout rates and chronic absenteeism, and they improved attendance, credits earned, course-taking patterns, and preparation for post-secondary educational and employment opportunities. Despite these significant positive impacts, the Academies did not produce changes in the high-risk subgroup’s math or reading achievement test scores. Before discussing these findings in detail, it is useful to review the rates at which these students enrolled in and remained in the Academy programs.
Table 3.1 provides a summary of Career Academy impacts on the school enrollment status and attendance rates of students in the high-risk subgroup. The first row of the table shows the percentage of Academy and non-Academy group students who enrolled in a Career Academy. The difference between these percentages represents the basic difference in exposure to the Ca-reer Academies between these groups. This is the primary source of impacts that are discussed in this section of the chapter. As noted above, in addition to the basic impact estimates, each table presents the impact per enrollee.
The second row of Table 3.1 shows the percentage of students in the high-risk subgroup who remained enrolled in an Academy through the end of their 12th-grade year. It indicates that 43 percent of the Academy students in the high-risk subgroup did so — just under half of those who initially enrolled. This may be perceived as a high retention rate in the Career Academies, given that many of the students in the high-risk subgroup would have dropped out of high school altogether, if they did not have access to an Academy. Also, as discussed in Chapter 2, a relatively high proportion of the high-risk subgroup came from families with a history of relatively high mo-bility.
A. Impacts on School Enrollment and Attendance
The third row of Table 3.1 indicates that the Academies significantly reduced the percent-age of students in the high-risk subgroup who dropped out of high school. Among those in the non-Academy group, 32 percent dropped out of high school before the end of 12th grade. In other words, without access to an Academy, nearly one-third of the high-risk subgroup left high school before they were scheduled to graduate. By comparison, 21 percent of the high-risk Academy group had dropped out before the end of their 12th-grade year. This 11 percentage point differ-ence represents a 34 percent reduction in dropout rates among students in the high-risk subgroup.
Rows 4 and 6 of Table 3.1 shows that the Academies also improved attendance rates, par-ticularly by reducing chronic absenteeism (defined as attending class less than 85 percent of the time throughout high school). The non-Academy students in the high-risk subgroup, without the opportunity to attend an Academy, had average attendance rates of 76 percent. Over half of these students were chronically absent, but the Academies significantly increased average attendance, from 76 to 82 percent. They also reduced chronic absenteeism, from 53 to 42 percent.
141
PR/Award # S165A200036
Page e282

-48-
Table 3.1
Career Academies Evaluation
Impacts on School Enrollment and Attendance for Students in the High-Risk Subgroup
Academy Non-Academy Percent Impact per Outcome Group Group Impact Changea Enrollee b
Ever enrolled in a Career Academyduring high school (%) 86.4 3.2 83.3 ***
Was enrolled in a Career Academyat the end of grade 12 (%) 42.5 2.1 40.5 ***
Dropped out of high schoolbefore the end of grade 12 (%) 21.3 32.2 -10.9 *** -33.8 -13.1
Average attendance,grades 9-12 (%) 81.5 76.0 5.6 *** 7.3 6.7
More than 95 percent average attendance, grades 9-12 (%) 16.9 12.9 4.0 31.3 4.8
Less than 85 percent average attendance, grades 9-12 (%) 41.9 53.4 -11.5 *** -21.5 -13.8
Sample size (N=345) 185 160
SOURCE: MDRC calculations from Career Academies Evaluation Student School Records Database.
NOTES: Attendance rates include zero values for grades in which sample members were identified as school dropouts. Estimates are regression-adjusted using ordinary least squares, controlling for background characteristics of sample members. Rounding may cause slight discrepancies in calculating differences. A two-tailed t-test was applied to differences between the Academy and non-Academy groups. In both cases, statistical significance levels are indicated as: *** = 1 percent; ** = 5 percent; * = 10 percent.
aPercent change is defined as the impact divided by the non-Academy group average.
bImpact per enrollee is defined as the impact divided by the difference in the percentage of Academy and non-Academy group members ever enrolled in a Career Academy. It is italicized because its calculation does not involve a direct comparison of Academy and non-Academy students.
B. Impacts on Credits Earned and Course-Taking
Table 3.2 presents several outcome measures that indicate the distribution of course cred-its earned by Academy and non-Academy students in the high-risk subgroup.3 The table indicates
3Throughout this report, one credit is equivalent to completing one full-year course, and a half-credit is
equivalent to completing one semester-long course. In general, the grouping of courses into subject areas (such as English, math, vocational/career-related, and so on) and subject types (academic and non-academic) follows con-ventions outlined in NCES, 1995.
142
PR/Award # S165A200036
Page e283

-49-
Table 3.2
Career Academies Evaluation
Impacts on Credits Earned and Course-Takingfor Students in the High-Risk Subgroup
Academy Non-Academy Percent Impact per Outcome Group Group Impact Changea Enrollee b
Credits earned
Total course credits 19.3 17.3 2.0 *** 11.7 2.4
Total course credits meet thegraduation requirement (%) 39.9 26.2 13.7 *** 52.3 16.5
Earned 12 or more academiccourse credits (%) 47.6 31.9 15.8 *** 49.5 19.0
Earned 8 or more non-academiccourse credits (%) 46.4 47.2 -0.8 -1.8 -1.0
Course-taking
English (4), Social Studies (3),Math (3), Science (3)c (%) 13.9 5.7 8.2 145.4 9.9
English (4), Social Studies (3),Math (2), Science (2)c (%) 31.8 16.3 15.5 *** 94.8 18.6
Earned 2 or more foreign-language credits (%) 26.7 19.1 7.5 39.4 9.1
Earned 1/2 or more computercredits (%) 43.4 45.0 -1.6 -3.6 -2.0
Earned 3 or more career/vocational credits (%) 58.3 37.7 20.6 *** 54.5 24.7
Sample size (N=345) 185 160SOURCE: See Table 3.1.
NOTES: Credits include zero values for grades in which sample members were identified as school dropouts. Course credit data were not provided for approximately 4.5 percent of the sample. Course-taking data were not provided for approximately 21 percentof the sample. Estimates are regression-adjusted using ordinary least squares, controlling for background characteristics of sample members. Rounding may cause slight discrepancies in calculating differences. All measures indicate credits earned up until the end of the
12th-grade year. 12th-grade year indicates the year that students were projected to reach the 12th grade when they initially enrolled in the Career Academy or regular high school program. A two-tailed t-test was applied to differences between the Academy and non-Academy groups. In both cases, statistical significance levels are indicated as: *** = 1 percent; ** = 5 percent; * = 10 percent.
aPercent change is defined as the impact divided by the non-Academy group average.
bImpact per enrollee is defined as the impact divided by the difference in the percentage of Academy and non-Academy group members ever enrolled in a Career Academy. It is italicized because its calculation does not involve a direct comparison of Academy and non-Academy students.
cNumbers refer to the amount of credits that were earned in each subject area.
143
PR/Award # S165A200036
Page e284

-50-
that Career Academies increased total course credits earned by high-risk students and increased the percentage of students who earned sufficient course credits to meet their districts’ graduation requirements. Moreover, much of the increase in total course credits came from an increase in the number of academic course credits earned.
The first row of Table 3.2 reports the average number of course credits earned by Acad-emy and non-Academy students in the high-risk subgroup by the end of their scheduled 12th-grade year.4 It indicates that the Academies produced an increase of two full credits. While non-Academy students earned an average of approximately 17 credits by the end of 12th grade, their Academy counterparts earned an average of approximately 19 credits. This difference represents an increase of 12 percent over the non-Academy group level.
The second row of Table 3.2 reports the percentage of students in the Academy and non-Academy groups who earned enough credits to meet their districts’ graduation requirements by the end of their 12th-grade year.5 It shows that 26 percent of the high-risk non-Academy group earned enough credits to graduate. By contrast, nearly 40 percent of the Academy group students earned enough credits to graduate. This 14 percentage point difference represents a 52 percent increase over the non-Academy group average.
The remainder of Table 3.2 presents findings on the credits earned in various subject areas by Academy and non-Academy students in the high-risk subgroup. Career Academies significantly increased the number of academic courses students completed, as well as the number of career-related and vocational courses.6 The third row of the table indicates that the Academies signifi-cantly increased the percentage of students in the high-risk subgroup who completed 12 or more academic credits (a minimum of three per year). While 32 percent of the non-Academy group earned 12 or more credits in academic courses, 48 percent of students in the Academy group did so. This 16 percentage point difference represents a 50 percent increase over the non-Academy group average.
This overall increase in academic course credits translated into a substantial increase in the percentage of students who completed a core academic curriculum. The fifth and sixth rows of Table 3.2 indicate the percentages of Academy and non-Academy students from the high-risk subgroup who completed two versions of an academic curriculum that prepared them for college.7 The second measure (row 6) can be classified as a basic academic core curriculum consisting of four credits of English, three of social studies, two of math, and two of science. The first measure (row 5) might be classified as a more intensive core curriculum that adds an extra credit in both
4When available, this measure includes credits that students earned during summer school. Some of the par-ticipating school districts were unable to provide a complete record of summer school credits.
5Students were considered to have earned enough credits to graduate from high school if their transcripts indi-cated that they had accumulated the number of credits needed to meet the official graduation requirements in their school district. This ranges from 21 to 24 credits, depending on the district. It is also important to note that this measure does not necessarily indicate that a student actually graduated from high school on time. Most school dis-tricts also require students to complete a certain number of courses in specific subject areas.
6Academic courses included those in English, social studies, math, science, and foreign language. Non-academic courses were all other courses, including career-related and vocational subjects, accredited work experi-ences, fine arts, physical education and health, and a broad range of school-specific electives.
7These measures have been proposed by the National Center for Education Statistics; see NCES, 1995.
144
PR/Award # S165A200036
Page e285

-51-
math and science. Many school districts require student to complete this type of course distribu-tion in order to graduate, and many four-year colleges require that students complete these types of courses for admission.
Table 3.2 indicates that very few non-Academy students in the high-risk subgroup com-pleted enough academic courses to meet requirements for either of the core academic curricula. Sixteen percent of non-Academy students completed the basic academic curriculum, and less than 6 percent completed the more intensive version. In all, Career Academies nearly doubled the per-centage of students in the high-risk subgroup who completed the basic core academic curriculum, from 16 percent of the non-Academy group to nearly 32 percent of the Academy group. Although the Academy group students were much more likely than their non-Academy counterparts to complete the more intensive core curriculum, this difference was not statistically significant.
Finally, Table 3.2 shows that although the Academies did not increase the overall number of credits that the high-risk subgroup earned in non-academic subject areas, they substantially in-creased credits earned in career-related and vocational courses. The fourth row of the table indi-cates that Academy and non-Academy students were about equally likely to complete eight or more credits in non-academic subject areas. As shown in the last row of the table, however, the Academies increased the percentage of students completing three or more career-related and vo-cational courses from approximately 38 percent for the non-Academy group to 58 percent for the Academy group — an increase of nearly 55 percent over the non-Academy group average.
In summary, this combination of findings is significant for several reasons. First, many stu-dents in the high-risk subgroup were already lagging behind in credits at the time they entered an Academy. Thus, the Academies not only prevented students from dropping out but also helped a number of students close their initial gap in credits and meet the graduation requirements. Second, the Academies’ positive impact on credits earned resulted primarily from an increase in academic course-taking and there was no overall increase in non-academic course-taking. In fact, students in the high-risk subgroup were more likely to concentrate their elective and non-academic courses in career-related or vocational subject areas rather than to substitute non-academic courses for academic courses.
C. Impacts on Math and Reading Achievement Test Scores
The evidence presented so far suggests that, among students at high risk of school failure, Career Academies reduced dropout rates and increased engagement in school. The evidence pre-sented below suggests that, despite the effects of Career Academies on these outcomes, they ap-pear to have little or no effect on standardized measures of student achievement in math and read-ing.
Table 3.3 presents estimates of the differences in achievement test scores between Acad-emy and non-Academy students from the high-risk subgroup. The first row of the table presents the students’ average percentile scores on the mathematics portion of the achievement test from the National Educational Longitudinal Study of 1988 (NELS: 88). These percentile scores reflect the average performance of students relative to the sample of 17- to 18-year-olds who made up
145
PR/Award # S165A200036
Page e286

-52-
Table 3.3
Career Academies Evaluation
Impacts on Achievement Test Scoresfor Students in the High-Risk Subgroup
Academy Non-Academy Percent Impact per Outcome Group Group Impact Changea Enrollee b
Math achievement test scores
Average national percentile 19.5 16.1 3.5 21.7 4.2
Proficiency level (%) 1: Rote memory operations 74.1 62.5 11.6 18.5 13.9 3: Simple problem-solving 11.0 12.1 -1.2 -9.6 -1.4
Reading achievement test scores
Average national percentile 23.4 18.9 4.6 24.2 5.5
Proficiency level (%) 1: Simple comprehension 69.2 70.8 -1.6 -2.3 -1.9 2: Simple inferences 27.6 17.3 10.3 59.8 12.4
Sample size (N=110) 63 47SOURCE: MDRC calculations from Career Academies Evaluation 12th Grade Achievement Test Database.
NOTES: Estimates are regression-adjusted using ordinary least squares, controlling for background characteristics of sample members. Rounding may cause slight discrepancies in calculating differences. The reading and math achievement tests are the cognitive battery tests of reading and mathematics used in the NELS: 88 study. There were a total of five proficiency levels for mathematics and three for reading. Particular proficiency levels are reported in the table to illustrate general trends in performance in the distribution of students. Percentile scores reflect students' performance in relation to a nationally
representative sample of 12th-graders. A two-tailed t-test was applied to differences between the Academy and non-Academy groups. In both cases, statistical significance levels are indicated as: *** = 1 percent; ** = 5 percent; * = 10 percent.
aPercent change is defined as the impact divided by the non-Academy group average.
bImpact per enrollee is defined as the impact divided by the difference in the percentage of Academy and non-Academy group members ever enrolled in a Career Academy. It is italicized because its calculation does not involve a direct comparison of Academy and non-Academy students.
the original NELS: 88 sample.8 The table indicates that, on average, the non-Academy students in the high-risk subgroup scored at the 16th percentile on the math achievement test and at the 19th
8The NELS: 88 sample comprised a nationally representative group of students who were identified as 8th-graders in 1988. These young people were surveyed every two years through 1992, when they were scheduled to graduate from high school, and again in 1994, approximately two years after scheduled graduation. The achieve-ment test being used in the Career Academies Evaluation was administered to the NELS: 88 sample in 1992, at the end of their 12th-grade year.
146
PR/Award # S165A200036
Page e287

-53-
percentile on the reading achievement test. Although students in the high-risk Academy group scored somewhat higher, the differences were not statistically significant.
The second and third rows of Table 3.3 present the percentages of Academy and non-Academy students in the high-risk subgroup who, on the basis of their test scores, exhibited profi-ciency at each of two different levels of math skills. Overall, the testing instrument covers five levels of math proficiency. Level 1 represents the most basic skills, and level 5 represents the highest. Level 1, or basic proficiency, includes the abilities to perform simple rote memory opera-tions and to carry out simple arithmetical operations on whole numbers. Level 3 reflects a some-what more advanced level of proficiency, including the ability to perform simple problem- solv-ing.9 Table 3.3 indicates that the Academy students were somewhat more likely to attain the basic proficiency level than their non-Academy counterparts. Again, however, this difference is not sta-tistically significant, indicating that there was no systematic difference between the Academy and non-Academy students on this measure. The table also indicates that very few of the high-risk subgroup attained the third level of proficiency and that the Academy and non-Academy students were about equally likely to do so.
The results for reading achievement test scores show a similar pattern. The average per-centile scores on the reading portion of the NELS: 88 achievement test indicate that non-Academy students scored at about the bottom fifth of the national distribution. Although the Academy group scored somewhat higher, the difference was not statistically significant. The read-ing test included three levels of proficiency. Approximately 70 percent of students in the Academy and non-Academy groups scored at level 1, demonstrating basic reading comprehension skills. Students in the Academy group were somewhat more likely than their counterparts in the non-Academy group to attain level 2 reading proficiency, indicating that they were able to make “sim-ple inferences” from a reading passage. Again, however, these differences were not statistically significant.
D. Impacts on Youth Development Experiences
Beyond their effect on student performance and engagement in school, Career Academies are intended to improve a variety of outcomes that have been identified as important to youth de-velopment more generally. In particular, Career Academies aim to increase students’ contact with caring adults and to help them make constructive use of non-school hours. To the extent that this occurs, one might expect the high-risk Academy group to have more developmentally healthy high school experiences, to participate more in extracurricular activities, and to better avoid nega-tive behaviors.
The first three rows of Table 3.4 show the distribution of time spent on homework among Academy and non-Academy students in the high-risk subgroup. These estimates suggest that there were no systematic differences in the amount of time that these students spent on home-work.
Table 3.4 does indicate that the Academies increased the percentage of students who re-ported spending some time in extracurricular activities. Specifically, 69 percent of students in the
9NCES, 1995.
147
PR/Award # S165A200036
Page e288

-54-
high-risk non-Academy group indicated that they did not spend any time in extracurricular activi-ties during their 12th-grade year. By contrast, 59 percent of the Academy students indicated that they had not participated in extracurricular activities. To the extent that participation in extracur-ricular activities is an effective measure of engagement, this indicates that, among the high-risk subgroup, Academy students were more engaged in school than their non-Academy counterparts.
Table 3.4
Career Academies Evaluation
Impacts on Experiences During the 12th Grade Yearfor Students in the High-Risk Subgroup
Academy Non-Academy Percent ImpactOutcome Group Group Impact Changea per Enrollee b
Use of non-school hours
Average time spent on homework (%) Less than 1 hour per week 49.8 52.5 -2.7 -5.2 -3.3 2 to 6 hours per week 34.7 36.6 -1.9 -5.3 -2.3 More than 6 hours per week 15.5 10.9 4.6 42.8 5.6
Average time spent on extra-curricular activities (%) None 58.5 68.9 -10.4 ** -15.2 -12.5 1 to 4 hours per week 23.5 18.4 5.2 28.2 6.2 More than 4 hours per week 18.0 12.7 5.3 41.4 6.3
Youth development experiences
Reported any positive youth development experiences in past year (%)c 62.7 55.2 7.5 13.5 9.0
Worked on a volunteer project 41.9 31.6 10.3 ** 32.7 12.4
Received award for participationin athletics or a school organization 40.6 34.8 5.9 16.9 7.0
Received an academic award or scholarship 26.6 15.5 11.1 ** 71.6 13.3
Reported any risk-taking behaviorsin past year (%)d 34.8 39.1 -4.3 -11.0 -5.2
Has become a parent or is pregnant 20.5 21.4 -1.0 -4.5 -1.1
Has been expelled from school 9.0 8.3 0.8 9.4 0.9
Has come to school high on drugs or alcohol 8.0 11.1 -3.1 -28.3 -3.8
Has been arrested 8.6 13.4 -4.8 * -36.0 -5.8
Sample size (N=366) 202 164 (continued)
148
PR/Award # S165A200036
Page e289

-55-
Table 3.4 (continued)SOURCE: MDRC calculations from Career Academies Evaluation 12th Grade Survey Database.
NOTES: 12th grade year indicates the year that students were projected to reach the 12th grade when they initially enrolled in the Career Academy or regular high school program. Estimates are regression-adjusted using ordinary least squares, controlling for background characteristics of sample members. Rounding may cause slight discrepancies in calculating differences. A two-tailed t-test was applied to differences between the Academy and non-Academy groups. In both cases, statistical significance levels are indicated as: *** = 1 percent; ** = 5 percent; * = 10 percent.
aPercent change is defined as the impact divided by the non-Academy group average.
bImpact per enrollee is defined as the impact divided by the difference in the percentage of Academy and non-Academy group members ever enrolled in a Career Academy. It is italicized because its calculation does not involve a direct comparison of Academy and non-Academy students.
cStudents reported one or more of the positive youth development submeasures.
dStudents reported one or more of the risk-taking behaviors submeasures.
The bottom panel of Table 3.4 lists the percentages of students who reported participation in various positive and negative youth development experiences. Specifically, the 12th Grade Sur-vey asked students whether, during the past year, they had worked on a volunteer project in their community, received an award or recognition for participation in an athletic team or school or-ganization, or received an academic award or scholarship. The 12th Grade Survey also asked stu-dents whether they had become a parent or were currently pregnant, had been expelled from school, had come to school high on drugs or alcohol, or had been arrested.
The findings presented in Table 3.4 indicate that the Career Academies increased high-risk students’ involvement in volunteer projects and increased the likelihood that they received recog-nition for academic performance. Academies also reduced the percentage of students who had been arrested.
E. Impacts on Plans and Steps Taken Toward Post-Secondary Education and Work
The 12th Grade survey also asked students about their plans and preparation for college and work. Table 3.5 presents a summary of the impacts that Career Academies had on students’ future plans, the steps they took toward admission to a two- or four-year college, and their overall outlook for the future. The findings for the high-risk subgroup indicate that Career Academies had a small impact on students’ educational plans for the next year, at least in terms of reducing the likelihood that they reported being unsure of whether they were going to school or work. The Academies also increased the percentage of students in the high-risk subgroup who took a num-ber of important steps toward attending a two-year or four-year college, and they enhanced stu-dents’ ultimate expectations for their educational attainment.
The top four rows of the table present the distribution of students who planned to attend school, work, or combine the two during the year following their scheduled graduation. In gen-eral, the table shows that the vast majority of students in both the Academy and the non-Academy groups planned to combine school and work. The estimates indicate that approximately the same proportions of Academy and non-Academy students planned to attend school only, work only, or
149
PR/Award # S165A200036
Page e290

-56-
combine school and work. The last row in this section of the table does show that Academy stu-dents were somewhat less likely than their non-Academy counterparts to report that they did not know whether they would attend school or go to work during the following year. Thus, the Academies appear to help students plan for some type of constructive activities after high school.
The Academies increased the extent to which students in the high-risk subgroup were pre-pared to execute their plans for post-secondary education and employment. Table 3.5 shows the percentages of Academy and non-Academy students in the high-risk subgroup who reported completing a variety of steps needed to apply for and attend college or to find a job. These activi-ties included collecting information about two- and four-year colleges, taking the SATs or ACTs, submitting an application, and having an interview. The measures in Table 3.5 indicate the per-centage of students who reported completing these activities,10 as well as the percentage of stu-dents who completed various activities aimed at securing a job during the following year.
Table 3.5 first indicates that the Academies significantly increased the percentage of stu-dents in the high-risk subgroup who researched college options, took the SATs or ACTs, and submitted an application to a two-year or four-year college. For example, it shows that 22 percent of non-Academy students reported taking the SATs or ACTs during their 12th-grade year, com-pared with 35 percent of Academy students in the high-risk subgroup. This 12 percentage point difference represents a 55 percent increase over the non-Academy group average. In addition, just over half of the Academy group students reported that they had submitted an application to a two-year or a four-year college, compared with 35 percent of the students in the non-Academy group.
Table 3.5 also shows that the Academies produced slight increases in the percentages of students in the high-risk subgroup who took concrete steps toward post-secondary employment, although none of these differences was statistically significant.
Finally, the last several rows in Table 3.5 provide an indication of students’ educational expectations and general outlook for their future. Most notably, the Academy students were more likely than their non-Academy counterparts to report that they expected to graduate from college.
III. Career Academy Impacts for Students in the Low-Risk Subgroup
The behavior and performance of the students in the low-risk non-Academy group provide the best indication of how these students performed in high school without the opportunity to at-tend an Academy. In general, these students were unlikely to drop out and appeared to remain engaged in high school on a number of dimensions. In all, only 3 percent of the low-risk non-Academy group dropped out of high school before the end of their 12th-grade year, and approxi-mately three-quarters had earned sufficient credits to meet their districts’ graduation require-ments. Just over 60 percent had completed the basic core academic curriculum, and over one-
10Students were asked about these activities in terms of their efforts to attend a two-year or a four-year college.
Information-gathering activities included talking with a teacher or other advisor about college, looking at college catalogues, visiting a college campus, and talking with one’s parents about how to pay for college. The measures presented in Table 3.5 indicate the percentage of students who reported engaging in two or more of these activities.
150
PR/Award # S165A200036
Page e291

-57-
third had completed the more intensive core curriculum. On average, these students scored at about the 40th percentile nationally on a standardized math and reading achievement test. Sixty percent of non-Academy students in the low-risk subgroup reported that they had taken the SATs or ACTs, and nearly 80 percent reported that they had submitted an application to a two-year or a four-year college by the end of their 12th-grade year.
Table 3.5
Career Academies Evaluation
Impacts on Planning and Preparation for College and Workfor Students in the High-Risk Subgroup
Academy Non-Academy Percent ImpactOutcome Group Group Impact Changea per Enrollee b
Plans for next year (%)School only 8.7 6.7 2.0 30.4 2.4Work only 8.3 7.1 1.2 17.2 1.5Combine school and work 79.3 78.9 0.4 0.5 0.4Unknown 3.7 7.3 -3.6 ** -49.7 -4.4
Steps taken toward 2-year or 4-year college admission
Researched college optionsc 82.1 72.5 9.6 *** 13.2 11.5
Took SATs or ACTs 34.5 22.3 12.2 ** 55.0 14.7
Submitted an application 50.5 35.3 15.2 *** 43.1 18.3
Had an interview 24.8 18.5 6.3 34.1 7.6
Steps taken toward post-secondary employment (%)
Talked with a teacher or advisor about a job 44.1 43.8 0.3 0.6 0.3
Submitted an application for employment 60.7 55.8 4.9 8.7 5.8
Interviewed for a position 46.2 43.6 2.7 6.2 3.2
Has previous work experience with prospective employer 35.3 31.1 4.2 13.5 5.0
Education expectations (%)Complete some post-secondary education 91.6 91.7 -0.1 -0.1 -0.1Attend college 71.3 66.1 5.2 7.9 6.3Graduate from college 53.7 45.3 8.3 * 18.4 10.0
Has overall positive outlook for the futured 72.6 66.0 6.6 10.0 7.9
Sample size (N=366) 202 164
(continued)
151
PR/Award # S165A200036
Page e292

-58-
Table 3.5 (continued)SOURCE: MDRC calculations from Career Academies Evaluation 12th Grade Survey Database.
NOTES: Estimates are regression-adjusted using ordinary least squares, controlling for background characteristics of sample members. Rounding may cause slight discrepancies in calculating differences. A two-tailed t-test was applied to differences between the Academy and non-Academy groups. In both cases, statistical significance levels are indicated as: *** = 1 percent; ** = 5 percent; * = 10 percent.
aPercent change is defined as the impact divided by the non-Academy group average.
bImpact per enrollee is defined as the impact divided by the difference in the percentage of Academy and non-Academy group members ever enrolled in a Career Academy. It is italicized because its calculation does not involve a direct comparison of Academy and non-Academy students.
cIndicates student engaged in two or more of the following activities: talking with teachers or advisors about college, discussing financing with parents, looking at college catalogues, or visiting schools.
dOverall positive outlook for the future was defined by high ratings on questions about expectations for achievement, potential for attaining jobs, and knowledge of methods of finding jobs.
For students in the low-risk Academy group, the findings discussed in this section indicate that, on most outcome measures, they remained engaged in high school at levels similar to their non-Academy counterparts. The findings also show, however, that the Career Academies did im-prove several important outcomes. Academies significantly increased the likelihood that these stu-dents would earn sufficient credits to meet their districts’ graduation requirements. They also in-creased career-related and vocational course-taking while enabling students in the low-risk sub-group to keep pace with their non-Academy peers in academic course-taking. The Academy stu-dents were somewhat less likely than their non-Academy counterparts to report that they had submitted an application to a two-year or a four-year college by the end of their 12th-grade year. Finally, the Academies did not produce systematic changes in the low-risk Academy group’s math or reading achievement test scores.
Table 3.6 provides a summary of Career Academy impacts on the school enrollment status and attendance rates of students in the low-risk subgroup. The first row in the table shows the percentages of Academy and non-Academy students who enrolled in a Career Academy. Most notably, it shows that 10 percent of students in the non-Academy group enrolled in a Career Academy. Although 8 percent of the non-Academy group students were identified as being en-rolled in an Academy at the end of 12th grade, very few of these students were enrolled in an Academy throughout high school. Further analysis of this finding indicated that most of the non-Academy students enrolled in an Academy in 11th or 12th grade, typically because they were inter-ested in taking elective classes that were offered only within the Career Academies.
The second row of Table 3.6 shows the percentage of students in the low-risk subgroup who remained enrolled in an Academy through the end of their 12th-grade year. A relatively high percentage in the Academy group (nearly 74 percent of those initially selected) remained in the programs through the end of 12th grade. This represents 82 percent of those who initially enrolled — a rate that is particularly high compared with the retention rate of students in the high-risk subgroup.
152
PR/Award # S165A200036
Page e293

-59-
Table 3.6
Career Academies Evaluation
Impacts on School Enrollment and Attendancefor Students in the Low-Risk Subgroup
Academy Non-Academy Percent Impact per Outcome Group Group Impact Changea Enrollee b
Ever enrolled in a Career Academyduring high school (%) 89.5 10.2 79.3 ***
Was enrolled in a Career Academyat the end of grade 12 (%) 73.5 8.3 65.2 ***
Dropped out of high schoolbefore the end of grade 12 (%) 1.9 2.9 -1.0 -34.4 -1.2
Average attendance,grades 9-12 (%) 95.0 94.2 0.8 0.8 1.0
More than 95 percent average attendance, grades 9-12 (%) 67.3 68.9 -1.6 -2.3 -2.0
Less than 85 percent average attendance, grades 9-12 (%) 2.2 7.5 -5.3 -70.8 -6.7
Sample size (N=385) 204 181
SOURCE: See Table 3.1.
NOTES: See Table 3.1.
A. Impacts on School Enrollment and Attendance
Table 3.6 reports the dropout rates and average attendance rates for students in the low-risk subgroup. This data indicate that Career Academies had no significant impact on these stu-dents’ attendance or retention in high school. A likely explanation for this finding is that very few students in the “low-risk” subgroup dropped out of high school, and few exhibited attendance problems or chronic absenteeism.
In general, Table 3.6 shows that students in the low-risk subgroup were likely to remain enrolled in high school and to attend regularly, regardless of whether they were in a Career Acad-emy. Very few students in the low-risk subgroup dropped out of high school (3 percent of the non-Academy group and 2 percent of the Academy group). Although this is in sharp contrast to the relatively high dropout rates among students in the high-risk subgroup, it was difficult for the Career Academies to improve on the very low dropout rates of non-Academy students in the low-risk subgroup. Similarly, average attendance rates were nearly 95 percent throughout high school for Academy and non-Academy group students. Interestingly, for the low-risk subgroup, the Academies did produce a slight reduction in chronic absenteeism (defined as having attendance rates of 85 percent or less throughout high school), although this difference was not statistically significant.
153
PR/Award # S165A200036
Page e294

-60-
B. Impacts on Credits Earned and Course-Taking
Table 3.7 shows the distribution of course credits earned by Academy and non-Academy students in the low-risk subgroup. It indicates that Career Academies increased the percentage of these students who earned enough total credits to meet their districts’ graduation requirements. In particular, while approximately 75 percent of non-Academy students in this subgroup earned enough credits to meet the graduation requirement, nearly 86 percent of students in the Academy group did so. This 11 percentage point difference represents a 15 percent increase over the non-Academy group average. This finding suggests that although students in the low-risk subgroup of the study sample were highly unlikely to drop out of high school, a significant portion did not re-main on course to earn enough credits to graduate on time. The Career Academies increased the likelihood that they would.
The Career Academies also changed the mix of courses that students in the low-risk sub-group completed during high school. Most notably, the Academies substantially increased the number of non-academic courses these students completed, particularly career-related and voca-tional courses. For example, the last row of Table 3.7 indicates that 42 percent of the low-risk non-Academy group completed three or more credits in career-related or vocational courses, compared with approximately 77 percent of students in the low-risk Academy group. This is more than an 80 percent increase in career-related or vocational course-taking.
Table 3.7 also shows that this increase did not come at the expense of students’ complet-ing academic courses, nor did it reduce the percentage of students in the low-risk subgroup who completed either the basic or the more intensive core academic curriculum. For example, 85 per-cent of the Academy group and approximately 89 percent of the non-Academy group completed 12 or more academic credits (a difference that was not statistically significant).
Table 3.7 does suggest, however, that the increase in career-related and vocational courses may have led the Academy group students to take fewer foreign-language courses. For example, 74 percent of the non-Academy group students earned at least two course credits in a foreign language, compared with 50 percent of the Academy group students. This represents nearly a one-third reduction in the non-Academy group average. It is not clear how this potential tradeoff may affect Academy students’ attractiveness to colleges, particularly four-year colleges that may prefer or require students to complete a foreign-language sequence during high school.
C. Impacts on Math and Reading Achievement Test Scores
Table 3.8 presents estimates of the impact of Career Academies on standardized measures of student achievement for the low-risk subgroup. In general, these findings do not reveal any sys-tematic differences between Academy and non-Academy students; they exhibited similar levels of academic achievement as measured by standardized tests.
Both Academy and non-Academy students in the low-risk subgroup had math scores aver-aging at about the 39th percentile nationally. The vast majority of students in both groups per-formed at the basic proficiency level or higher, and just over 40 percent of both groups scored at the middle proficiency level or higher. Although the reading test scores of Academy students in the low-risk subgroup were slightly lower than those of non-Academy students, the differences were not statistically significant.
154
PR/Award # S165A200036
Page e295

-61-
Table 3.7
Career Academies Evaluation
Impacts on Credits Earned and Course-Takingfor Students in the Low-Risk Subgroup
Academy Non-Academy Percent Impact per Outcome Group Group Impact Changea Enrollee b
Credits earned
Total course credits 24.4 23.6 0.8 3.2 0.9
Total course credits meet thegraduation requirement (%) 85.7 74.6 11.1 ** 14.9 14.0
Earned 12 or more academiccourse credits (%) 85.0 88.5 -3.5 -3.9 -4.4
Earned 8 or more non-academiccourse credits (%) 68.4 51.1 17.2 *** 33.7 21.7
Course-taking
English (4), Social Studies (3),Math (3), Science (3)c (%) 39.2 36.3 2.9 8.1 3.7
English (4), Social Studies (3),Math (2), Science (2)c (%) 58.5 61.2 -2.7 -4.4 -3.4
Earned 2 or more foreign-language credits (%) 49.5 73.6 -24.1 *** -32.8 -30.4
Earned 1/2 or more computercredits (%) 59.2 65.4 -6.1 -9.4 -7.7
Earned 3 or more career/vocational credits (%) 76.5 42.0 34.6 *** 82.4 43.6
Sample size (N=385) 204 181
SOURCE: See Table 3.2.
NOTES: See Table 3.2.
155
PR/Award # S165A200036
Page e296

-62-
Table 3.8
Career Academies Evaluation
Impacts on Achievement Test Scoresfor Students in the Low-Risk Subgroup
Academy Non-Academy Percent Impact per Outcome Group Group Impact Changea Enrollee b
Math achievement test scores
Average national percentile 38.6 39.1 -0.5 -1.2 -0.6
Proficiency level (%) 1: Rote memory operations 91.0 86.0 5.0 5.9 6.3 3: Simple problem-solving 45.8 42.3 3.5 8.3 4.4
Reading achievement test scores
Average national percentile 37.3 39.8 -2.5 -6.3 -3.2
Proficiency level (%) 1: Simple comprehension 86.6 95.6 -9.0 -9.4 -11.4 2: Simple inferences 40.0 49.2 -9.2 -18.7 -11.6
Sample size (N=147) 80 67
SOURCE: See Table 3.3.
NOTES: See Table 3.3.
D. Impacts on Youth Development Experiences
Table 3.9 shows the impacts that Career Academies had on a variety of student experi-ences during 12th grade. In general, these estimates do not reveal substantial differences between Academy and non-Academy students in the low-risk subgroup, who exhibited similar levels of participation both in positive youth development activities and in negative risk-taking behaviors. Career Academies did produce a modest increase in the percentage of students in the low-risk subgroup who were involved in a volunteer project during their 12th-grade year.
E. Impacts on Plans and Steps Taken Toward Post-Secondary Education and Work
Table 3.10 lists a set of indicators of students’ plans and preparation for education and work during the year following their 12th-grade year. It shows that the vast majority of Academy and non-Academy students in the low-risk subgroup reported that they planned both to work and to go to school in the following year. The second-to-last row of the table also indicates that about three-quarters of both Academy and non-Academy students reported that they eventually expect to graduate from college.
156
PR/Award # S165A200036
Page e297

-63-
Table 3.9
Career Academies Evaluation
Impacts on Experiences During the 12th Grade Yearfor Students in the Low-Risk Subgroup
Academy Non-Academy Percent ImpactOutcome Group Group Impact Changea per Enrollee b
Use of non-school hours
Average time spent on homework (%) Less than 1 hour per week 23.0 24.6 -1.6 -6.6 -2.0 2 to 6 hours per week 58.4 49.6 8.8 * 17.7 11.0 More than 6 hours per week 18.7 25.8 -7.1 * -27.6 -9.0
Average time spent on extra-curricular activities (%) None 36.5 33.0 3.6 10.8 4.5 1 to 4 hours per week 29.0 33.4 -4.4 -13.3 -5.6 More than 4 hours per week 34.5 33.6 0.9 2.6 1.1
Youth development experiences
Reported any positive youth development experiences in past year (%)c 80.3 75.9 4.4 5.7 5.5
Worked on a volunteer project 65.8 50.0 15.9 *** 31.7 20.0
Received award for participationin athletics or a school organization 56.0 56.2 -0.2 -0.4 -0.3
Received an academic award or scholarship 41.7 36.9 4.8 12.9 6.0
Reported any risk-taking behaviorsin past year (%)d 15.6 16.1 -0.5 -2.9 -0.6
Has become a parent or is pregnant 6.0 4.6 1.4 30.5 1.8
Has been expelled from school 1.7 2.0 -0.3 -13.3 -0.3
Has come to school high on drugs or alcohol 6.5 9.7 -3.3 -33.6 -4.1
Has been arrested 4.4 4.5 -0.1 -1.8 -0.1
Sample size (N=389) 218 171
SOURCE: See Table 3.4.
NOTES: See Table 3.4.
157
PR/Award # S165A200036
Page e298

-64-
Table 3.10
Career Academies Evaluation
Impacts on Planning and Preparation for College and Workfor Students in the Low-Risk Subgroup
Academy Non-Academy Percent ImpactOutcome Group Group Impact Changea per Enrollee b
Plans for next year (%)School only 9.2 8.9 0.3 2.9 0.3Work only 2.2 2.6 -0.4 -15.7 -0.5Combine school and work 86.3 86.9 -0.6 -0.6 -0.7Unknown 2.4 1.7 0.7 41.9 0.9
Steps taken toward 2-year or 4-year college admission
Researched college optionsc 92.7 96.3 -3.7 -3.8 -4.6
Took SATs or ACTs 60.0 60.0 -0.1 -0.1 -0.1
Submitted an application 70.8 78.7 -7.9 * -10.0 -10.0
Had an interview 23.0 29.8 -6.7 -22.6 -8.5
Steps taken toward post-secondary employment (%)
Talked with a teacher or advisor about a job 47.6 37.8 9.8 * 25.9 12.4
Submitted an application for employment 55.8 56.6 -0.8 -1.5 -1.1
Interviewed for a position 38.7 38.7 -0.1 -0.2 -0.1
Has previous work experience with prospective employer 27.7 26.8 0.9 3.4 1.2
Education expectations (%)Complete some post-secondary education 97.4 97.3 0.0 0.0 0.0Attend college 88.7 85.8 2.8 3.3 3.6Graduate from college 75.2 74.5 0.6 0.9 0.8
Has overall positive outlook for the futured 78.4 78.1 0.2 0.3 0.3
Sample size (N=389) 218 171
SOURCE: See Table 3.5.
NOTES: See Table 3.5.
Table 3.10 does indicate that students in the Academy group were somewhat less likely than their non-Academy counterparts to have submitted an application to a two-year or four-year college by the end of their 12th-grade year. Interestingly, over 90 percent of students in both groups had investigated college options, and 60 percent had taken the SATs or ACTs — a critical step in applying for college. However, whereas 79 percent of students in the non-Academy group had submitted an application to college, only 71 percent of Academy students in the low-risk sub-group had done so.
158
PR/Award # S165A200036
Page e299

-65-
The reason for this lower rate of applying for college is not clear. One hypothesis is that Academy students in the low-risk subgroup may have been opting to go to work rather than to college. In general, there does not appear to be any support for this hypothesis. First, as noted earlier, Academy and non-Academy students were about equally likely to report that they planned to work or to combine work and school in the year following graduation. Table 3.10 also indi-cates that the groups were about equally likely to have applied or interviewed for a job for the fol-lowing year. Another hypothesis is that Academy students may have been more likely to plan on attending a two-year college, many of which may not require a formal application to be submitted while students are still in high school. The 12th Grade Survey did not ask students to differentiate between activities aimed at a two-year as opposed to a four-year college.
The findings regarding students’ post-secondary activities are not clear. A longer follow-up period is needed to determine the actual college enrollment and completion rates of the Acad-emy and non-Academy groups and to assess the types of college programs they attend. This is a key feature of the second phase of the Career Academies Evaluation, which includes asking stu-dents in the study sample to complete a survey 12 months after their scheduled graduation from high school and again four years after their scheduled graduation.
IV. Career Academy Impacts for Students in the Medium-Risk Subgroup
The final subgroup of students include those who were not at particularly high risk of dropping out of high school, but appeared to exhibit at least a moderate level of disengagement from school. This medium-risk subgroup represents about half the student sample. Overall, 8 per-cent of non-Academy students in the medium-risk subgroup dropped out of high school before the end of their 12th-grade year, and approximately two-thirds earned sufficient credits to meet their districts’ graduation requirements. Just over half completed the basic core academic curricu-lum, and about 30 percent completed the more intensive core curriculum. On average, these stu-dents scored at about the 30th percentile nationally on a standardized math and achievement test and at the 35th percentile in a standardized reading test. About 47 percent of non-Academy stu-dents in the medium-risk subgroup reported that they had taken the SATs or ACTs, and over 60 percent reported that they had submitted an application to a two-year or a four-year college by the end of their 12th-grade year.
The findings discussed in this section indicate that, on average, the Career Academies had little or no impact on most outcomes for students in the medium-risk subgroup. In other words, most outcome levels for students in the Academy group were about the same as they were for students in the non-Academy group. As discussed in Chapter 5, however, these overall averages for students in the medium-risk subgroup mask a high degree of variation in impacts across the sites in the study.
Table 3.11 provides a summary of Career Academy impacts on the school enrollment status and attendance rates of students in the medium-risk subgroup. The first two rows of the table show that 89 percent of the Academy group enrolled in an Academy during at least one semester of high school and that 59 percent remained enrolled in the programs through the end of their 12th-grade year. This means that, on average, about two-thirds of students in the medium-risk subgroup who initially enrolled in an Academy remained in the program throughout high school.
159
PR/Award # S165A200036
Page e300

-66-
A. Impacts on School Enrollment and Attendance
Table 3.11 shows the average school enrollment and attendance outcomes among students in the medium-risk subgroup. The data suggest that the Career Academies had no impact on dropout prevention or average attendance for this subgroup. The third row of the table provides an estimate of the dropout rate among Academy and non-Academy students in this subgroup. It shows that 9 percent of Academy students in the medium-risk subgroup dropped out of high school, compared with 8 percent of their non-Academy peers. This difference was not statistically significant. Similarly, the next three rows present estimates of several different measures of atten-dance among Academy and non-Academy students in this subgroup. The results suggest no sys-tematic differences in the attendance patterns of Academy and non-Academy students in the me-dium-risk subgroup.
Table 3.11
Career Academies Evaluation
Impacts on School Enrollment and Attendance for Students in the Medium-Risk Subgroup
Academy Non-Academy Percent Impact per Outcome Group Group Impact Changea enrollee b
Ever enrolled in a Career Academyduring high school (%) 89.0 6.7 82.3 ***
Was enrolled in a Career Academyat the end of grade 12 (%) 58.8 3.0 55.9 ***
Dropped out of high schoolbefore the end of grade 12 (%) 9.0 8.0 1.0 12.1 1.2
Average attendance,grades 9-12 (%) 88.4 89.6 -1.2 -1.4 -1.5
More than 95 percent average attendance, grades 9-12 (%) 36.2 37.7 -1.5 -3.9 -1.8
Less than 85 percent average attendance, grades 9-12 (%) 22.4 19.3 3.1 15.9 3.7
Sample size (N=724) 393 331
SOURCE: See Table 3.1.
NOTES: See Table 3.1.
160
PR/Award # S165A200036
Page e301

-67-
B. Impacts on Credits Earned and Course-Taking
Table 3.12 presents measures of course-taking patterns for Academy and non-Academy students in the medium-risk subgroup. The top panel of the table indicates that the Academies did not have a systematic effect on the number of credits students earned in high school or on the number of credits they earned in academic and non-academic courses. Also, about 65 percent of students in both the medium-risk Academy and non-Academy groups had earned sufficient credits to meet their districts’ graduation requirements.
Table 3.12
Career Academies Evaluation
Impacts on Credits Earned and Course-Takingfor Students in the Medium-Risk Subgroup
Academy Non-Academy Percent Impact per Outcome Group Group Impact Changea Enrollee b
Credits earned
Total course credits 22.6 22.9 -0.4 -1.6 -0.4
Total course credits meet thegraduation requirement (%) 64.8 65.2 -0.3 -0.5 -0.4
Earned 12 or more academiccourse credits (%) 69.8 69.4 0.4 0.6 0.5
Earned 8 or more non-academiccourse credits (%) 59.1 56.9 2.2 3.9 2.7
Course-taking
English (4), Social Studies (3),Math (3), Science (3)c (%) 28.8 30.5 -1.7 -5.6 -2.1
English (4), Social Studies (3),Math (2), Science (2)c (%) 48.7 51.0 -2.3 -4.4 -2.7
Earned 2 or more foreign-language credits (%) 42.2 49.0 -6.8 * -13.9 -8.3
Earned 1/2 or more computercredits (%) 66.3 57.7 8.6 ** 15.0 10.5
Earned 3 or more career/vocational credits (%) 65.7 48.4 17.3 *** 35.9 21.1
Sample size (N=724) 393 331
SOURCE: See Table 3.2.
NOTES: See Table 3.2.
161
PR/Award # S165A200036
Page e302

-68-
Table 3.12 does indicate that the Academies produced changes in some specific subject areas for the medium-risk subgroups. Academy students were more likely to complete three or more credits in career-related or vocational courses and were more likely to complete at least one semester of com-puter-related courses. At the same time, the Academies reduced the percentage of students who com-pleted a sequence of at least two years in a foreign language. Given that there was no overall change in the total number of non-academic credits earned by students in the medium-risk subgroups, it appears that the Academy students were taking the career-related and computer-related courses instead of other non-Academy courses or electives. Also, because there was no overall reduction in academic course-taking, it appears that Academy students were more likely than their non-Academy counter-parts to take other academic courses instead of a foreign language.
C. Impacts on Math and Reading Achievement Test Scores
Table 3.13 summarizes the results for students in the medium-risk subgroup who took the NELS: 88 reading and math achievement tests. It appears that the Academies produced a slight reduction in reading test scores. On average, students in the non-Academy group scored at the 35th percentile nationally, compared with the 31st percentile for Academy group students. It is possible that some of this difference may be due to differences in the composition of the Academy and non-Academy students who completed the achievement tests. This may have resulted from the fact that the medium-risk Academy students were somewhat more likely than medium-risk non-Academy students to complete the test.
Table 3.13
Career Academies Evaluation
Impacts on Achievement Test Scoresfor Students in the Medium-Risk Subgroup
Academy Non-Academy Percent Impact per Outcome Group Group Impact Changea Enrollee b
Math achievement test scores
Average national percentile 29.1 29.7 -0.6 -2.0 -0.7
Proficiency level (%) 1: Rote memory operations 84.8 80.9 3.9 4.8 4.7 3: Simple problem-solving 28.5 31.3 -2.8 -8.9 -3.4
Reading achievement test scores
Average national percentile 30.8 35.1 -4.3 * -12.2 -5.2
Proficiency level (%) 1: Simple comprehension 80.1 85.9 -5.7 -6.7 -7.0 2: Simple inferences 39.7 43.5 -3.8 -8.7 -4.6
Sample size (N=233) 124 109
SOURCE: See Table 3.3.
NOTES: See Table 3.3.
162
PR/Award # S165A200036
Page e303

-69-
D. Impacts on Youth Development Experiences
Table 3.14 lists measures of various high school experiences and extracurricular activities among Academy and non-Academy students in the medium-risk subgroup. In general, the table indicates that there was no systematic difference between Academy and non-Academy students in terms of their use of non-school hours or in their exposure to various positive or risk-related ac-tivities.
Table 3.14
Career Academies Evaluation
Impacts on Experiences During the 12th Grade Yearfor Students in the Medium-Risk Subgroup
Academy Non-Academy Percent ImpactOutcome Group Group Impact Changea per Enrollee b
Use of non-school hours
Average time spent on homework (%) Less than 1 hour per week 37.0 32.9 4.1 12.4 5.0 2 to 6 hours per week 47.9 46.0 1.9 4.1 2.3 More than 6 hours per week 15.1 21.1 -6.0 ** -28.3 -7.2
Average time spent on extra-curricular activities (%) None 47.0 52.3 -5.3 -10.1 -6.4 1 to 4 hours per week 30.3 25.9 4.4 17.0 5.3 More than 4 hours per week 22.7 21.8 0.9 4.2 1.1
Youth development experiences
Reported any positive youth development experiences in past year (%)c 71.3 69.2 2.0 2.9 2.5
Worked on a volunteer project 53.7 48.9 4.8 9.8 5.8
Received award for participationin athletics or a school organization 46.7 41.7 5.0 11.9 6.0
Received an academic award or scholarship 28.0 25.1 2.8 11.3 3.4
Reported any risk-taking behaviorsin past year (%)d 23.8 25.6 -1.8 -7.2 -2.2
Has become a parent or is pregnant 11.1 10.8 0.4 3.6 0.5
Has been expelled from school 3.9 6.0 -2.1 -35.5 -2.6
Has come to school high on drugs or alcohol 8.4 8.7 -0.3 -3.6 -0.4
Has been arrested 5.3 5.2 0.1 1.8 0.1
Sample size (N=755) 407 348
SOURCE: See Table 3.4.
NOTES: See Table 3.4.
163
PR/Award # S165A200036
Page e304

-70-
E. Impacts on Plans and Steps Taken Toward Post-Secondary Education and Work
Table 3.15 presents findings on the Career Academies’ impacts on the medium-risk sub-group’s plans and preparation for post-secondary education and work. As with many outcomes discussed in this section, the table indicates that in the medium-risk subgroup there was no sys-tematic difference between Academy and non-Academy students in terms of their plans and preparation for post-secondary education and work.
Table 3.15
Career Academies Evaluation
Impacts on Planning and Preparation for College and Workfor Students in the Medium-Risk Subgroup
Academy Non-Academy Percent ImpactOutcome Group Group Impact Changea per Enrollee b
Plans for next year (%)School only 8.3 8.9 -0.7 -7.4 -0.8Work only 4.8 5.1 -0.3 -5.5 -0.3Combine school and work 83.9 83.9 0.1 0.1 0.1Unknown 3.0 2.1 0.9 41.8 1.1
Steps taken toward 2-year or 4-year college admission
Researched college optionsc 87.1 85.7 1.4 1.6 1.7
Took SATs or ACTs 44.3 46.9 -2.5 -5.4 -3.1
Submitted an application 62.6 63.1 -0.5 -0.7 -0.6
Had an interview 24.3 25.6 -1.3 -5.0 -1.6
Steps taken toward post-secondary employment (%)
Talked with a teacher or advisor about a job 39.1 40.9 -1.8 -4.4 -2.2
Submitted an application for employment 60.7 55.4 5.3 9.5 6.4
Interviewed for a position 42.1 41.9 0.2 0.6 0.3
Has previous work experience with prospective employer 30.8 26.8 4.0 14.9 4.9
Education expectations (%)Complete some post-secondary education 93.6 93.9 -0.3 -0.3 -0.3Attend college 81.4 81.2 0.2 0.3 0.3Graduate from college 63.4 66.2 -2.8 -4.2 -3.4
Has overall positive outlook for the futured 75.1 78.5 -3.4 -4.4 -4.2
Sample size (N=755) 407 348
SOURCE: See Table 3.5.
NOTES: See Table 3.5.
164
PR/Award # S165A200036
Page e305
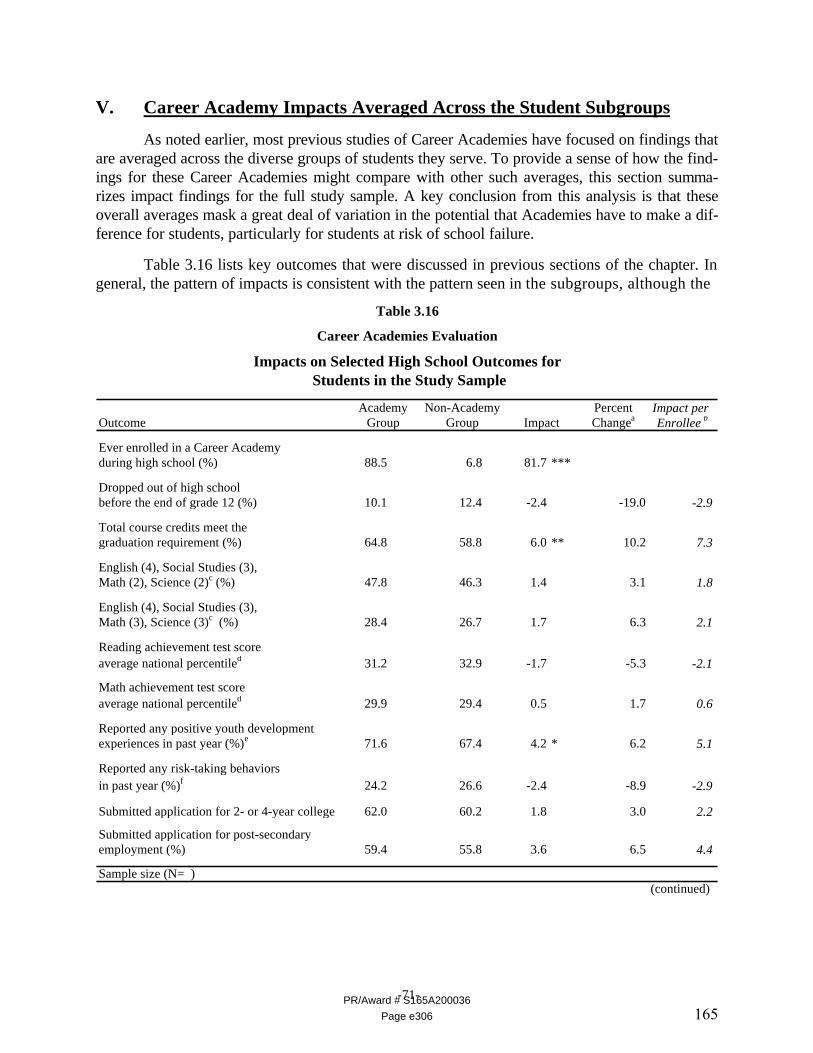
-71-
V. Career Academy Impacts Averaged Across the Student Subgroups
As noted earlier, most previous studies of Career Academies have focused on findings that are averaged across the diverse groups of students they serve. To provide a sense of how the find-ings for these Career Academies might compare with other such averages, this section summa-rizes impact findings for the full study sample. A key conclusion from this analysis is that these overall averages mask a great deal of variation in the potential that Academies have to make a dif-ference for students, particularly for students at risk of school failure.
Table 3.16 lists key outcomes that were discussed in previous sections of the chapter. In general, the pattern of impacts is consistent with the pattern seen in the subgroups, although the
Table 3.16
Career Academies Evaluation
Impacts on Selected High School Outcomes for Students in the Study Sample
Academy Non-Academy Percent Impact per Outcome Group Group Impact Changea Enrollee b
Ever enrolled in a Career Academyduring high school (%) 88.5 6.8 81.7 ***
Dropped out of high schoolbefore the end of grade 12 (%) 10.1 12.4 -2.4 -19.0 -2.9
Total course credits meet thegraduation requirement (%) 64.8 58.8 6.0 ** 10.2 7.3
English (4), Social Studies (3),Math (2), Science (2)c (%) 47.8 46.3 1.4 3.1 1.8
English (4), Social Studies (3),Math (3), Science (3)c (%) 28.4 26.7 1.7 6.3 2.1
Reading achievement test scoreaverage national percentiled 31.2 32.9 -1.7 -5.3 -2.1
Math achievement test scoreaverage national percentiled 29.9 29.4 0.5 1.7 0.6
Reported any positive youth developmentexperiences in past year (%)e 71.6 67.4 4.2 * 6.2 5.1
Reported any risk-taking behaviorsin past year (%)f 24.2 26.6 -2.4 -8.9 -2.9
Submitted application for 2- or 4-year college 62.0 60.2 1.8 3.0 2.2
Submitted application for post-secondary employment (%) 59.4 55.8 3.6 6.5 4.4
Sample size (N= )(continued)
165
PR/Award # S165A200036
Page e306

-72-
Table 3.16 (continued)
SOURCES: MDRC calculations from Career Academies Evaluation Student School Records, 12th Grade Achievement Test, and 12th Grade Survey Databases.
NOTES: Credits include zero values for grades in which sample members were identified as school dropouts. Estimates are regression-adjusted using ordinary least squares, controlling for background characteristics of sample members. Rounding may cause slight discrepancies in calculating differences. All measures indicate credits earned up
until the end of the 12th-grade year. 12th-grade year indicates the year that students were projected to reach the 12th-grade when they initially enrolled in the Career Academy or regular high school program. A two-tailed t-test was applied to differences between the Academy and non-Academy groups. In both cases, statistical significance levels are indicated as: *** = 1 percent; ** = 5 percent; * = 10 percent.
aPercent change is defined as the impact divided by the non-Academy group average.
bImpact per enrollee is defined as the impact divided by the difference in the percentage of Academy and non-Academy group members ever enrolled in a Career Academy. It is italicized because its calculation does not involve a direct comparison of Academy and non-Academy students.
cNumbers refer to the amount of credits that were earned in each subject area.
dThe reading and math achievement tests are the cognitive battery tests of reading and mathematics used in the NELS: 88 study. There were a total of five proficiency levels for mathematics and three for reading. Particular proficiency levels are reported in the table to illustrate general trends in performance in the distribution of students.
Percentile scores reflect students' performance in relation to a nationally representative sample of 12th-graders.
eStudents reported one or more of the positive youth development submeasures.
fStudents reported one or more of the risk-taking behaviors submeasures.
magnitude of impacts for the full study sample is smaller. On average, across all the participating students and sites, the Academies produced increases in credits earned toward graduation, par-ticularly in career-related and vocational courses. They also increased students’ exposure to posi-tive youth development activities. Not surprisingly, the averaged impacts tend to look more like those for the medium-risk subgroup, the largest of the three.
VI. Conclusions
The evidence presented in this chapter suggests that the Career Academies have the strongest positive effects on the outcomes of students who begin high school at a high risk of school failure. The Academies reduce dropout rates, increase attendance, and increase credits earned in both academic and vocational subjects. They also appear to improve outcomes among students who are at low risk of school failure. Although these students are already highly engaged in school and are unlikely to drop out, the Academies appear to improve several outcomes, in-cluding the percentage of these students who earn enough credits to graduate on time. On the other hand, the Academies do not appear to have much effect on students in the medium-risk sub-group.
Importantly, although the estimates in this chapter are focused on individual subgroups, they are aggregated across all the sites in the study. To the extent that differences in the imple-mentation of the Academy model affect the impact of the Career Academies, these estimates may
166
PR/Award # S165A200036
Page e307

-73-
still mask important variation in the effects of Academies on students’ performance, engagement, and achievement in high school. To pursue this issue, Chapter 4 explores the variation across sites in the implementation of the Academy model, and Chapter 5 explores the effect of this variation on the impact of Academies on student outcomes.
167
PR/Award # S165A200036
Page e308

-74-
Chapter 4
Factors Associated with Student Outcomes and the Pattern of Career Academy Impacts
This chapter and Chapter 5 explore some potential pathways through which the core ele-ments of the Career Academy approach may change students’ educational and work-related out-comes. The findings from these chapters provide some further context for explaining and inter-preting the pattern of impacts discussed in Chapter 3.
Section I of this chapter identifies several aspects of students’ high school environments and experiences that are most strongly associated with positive outcomes that students may attain by the end of 12th grade. In particular, it examines students’ perspectives on three school-related domains: the degree of interpersonal support they received from teachers and peers, the extent to which their classes included applied teaching and learning activities, and their level of exposure to career awareness and work-based learning activities. This analysis focuses on both Academy and non-Academy students to shed light on the relationship between these domains and students’ level of school engagement through the end of 12th grade.
Section II of this chapter examines differences across the participating sites in the extent to which the Career Academies increased the level of interpersonal support, applied learning, and work-related learning activities available to students. This analysis shows that a subset of Academies represent a large contrast with their non-Academy environments, particularly in terms of the interpersonal supports they offer to students. Chapter 5 explores the extent to which these Academies produced a different pattern of impacts on student outcomes than Academies that represented less of a contrast from their non-Academy environments.
I. Potential Pathways to Positive Student Outcomes
As discussed in Chapter 1, the Career Academy approach has attracted a great deal of at-tention in recent years, in part because its core features offer direct responses to a variety of prob-lems that have been identified in high schools. Figure 1.1 provided a conceptual model showing the potential pathways through which these features may affect student outcomes in ways that are consistent with the broad range of goals that have been ascribed to Career Academies. Analyses conducted earlier in the Career Academies Evaluation, and updated for this report, provide em-pirical support for the conceptual framework illustrated in Figure 1.1. This section of the chapter briefly reviews the general findings from these analyses.1
Recall that the conceptual model listed four groups of constructs leading from the core elements of the Academy approach to various short- and long-term outcomes. The four sets of constructs are:
1See Kemple 1997a, 1997b; and Kemple, Poglinco, and Snipes, 1999.
168
PR/Award # S165A200036
Page e309

-75-
• Career Academy organizational elements that distinguish the Academy ap-proach from the regular high school environment in which it is implemented;
• supports and learning opportunities that are intended to evolve from the or-ganizational elements;
• high school outcomes that the Academies aim to improve by enhancing the supports and learning opportunities; and
• post-secondary outcomes that reflect some of the long-term goals of the Academy approach.
Analyses conducted for previous reports from this evaluation and updated for the current report have focused on testing the correlation between measures of constructs indicated in the second column of Figure 1.1 and measures of the outcomes indicated in the third column. In other words, the analyses have explored empirical relationships between supports and learning opportunities and the outcomes students attain during high school.
One strand of analysis has examined the relationships between supports and outcomes for all students in the study sample, regardless of whether they had access to an Academy. This has been aimed at addressing such questions as whether students who experience higher levels of in-terpersonal support from teachers and peers are more likely to remain enrolled and engaged in school than students who experience lower levels of such supports. In fact, survey data collected for the evaluation indicate that students who reported receiving a high degree of support from their teachers and peers during 9th and 10th grades were less likely to drop out of high school and more likely to complete a core curriculum.2 Similarly, students who participated intensively in ca-reer awareness and work-based learning activities tended to be more engaged in school and were more likely to be prepared to graduate and go on to college than those who did not participate in such activities or participated less intensively.3 Finally, the analyses indicated a positive, yet weaker, association between students’ exposure to integrated and applied learning activities and their school engagement and performance. In general, however, the strongest associations have been found between the interpersonal supports (such as teachers’ expectations and peer collabora-tion) and various measures of student performance and engagement in school.4
To the extent that such relationships exist, on average, for all students in the study sample, it is likely that these types of supports serve as key pathways through which the Career Academies improve student engagement in school. As noted earlier, this is because the supports and learning opportunities are closely aligned with the organizational features of the Academy approach. For example, enhanced
2These supports included students’ perceptions of the personalized attention they receive from teachers, teach-
ers’ expectations for student performance and achievement, engagement levels of classmates, and opportunities to work closely with classmates.
3This finding should be interpreted with some caution because participation in these activities typically oc-curred after 11th grade. Some Career Academies, as well as other high school programs, tended to select students for their intensive career awareness and work-based learning activities based on students’ level of engagement and performance in school. As a result, a high degree of school engagement may lead to higher levels of participation in career awareness and work-based learning activities, rather than the other way around.
4For additional information on these analyses, please contact the authors.
169
PR/Award # S165A200036
Page e310

-76-
interpersonal support is likely to evolve from the intensive interaction and collaboration offered by the school-within-a-school. A more focused curriculum and enriched teaching and learning are intended to develop through the Academy’s integration of academic and occupational content. Greater exposure to career awareness and work-based education is promoted through the employer partnerships.
In fact, as discussed in the previous reports from this evaluation, Academy students were considerably more likely to experience the types of support and learning opportunities listed in Figure 1.1 than were their non-Academy counterparts in the study. It should be noted, however, that Career Academy impacts on supports and learning opportunities may not directly cause any of the impacts on such outcomes as dropout rates and credits earned toward graduation. Al-though these linkages make sense from an conceptual standpoint, it may be that the students who experienced the greatest increase in supports are different from the students who experienced the largest reductions in dropout rates or the greatest increases in credits earned. This suggests that the Career Academy impacts may follow from pathways other than those leading through the types of supports and learning opportunities listed in Figure 1.1.
One way to further test these relationships is to identify subgroups of sites in the study where the Career Academies generated particularly large increases in the supports and learning opportunities listed in Figure 1.1. The next step would be to determine whether the Academies in these sites also generated larger impacts on such outcomes as dropout rates and progress toward graduation. The next section of the chapter summarizes analyses that identify a group of sites that represented a particularly dramatic contrast with their non-Academy environments, at least in terms of the supports and learning opportunities discussed above.
II. Sources of Variation Among the Sites That May Be Associated with Differences in Impacts
The primary focus of this report is on the difference between Academy and non-Academy environments and on the effects that this difference may have on students’ experiences and behav-iors. As discussed in previous reports and earlier in this report, all the Career Academies had im-plemented the core features of the Academy approach and represented a clear contrast with the non-Academy environments in their schools. This section of the report begins an exploration of whether some versions or contexts for the Academy approach produce larger impacts on student outcomes than others.
As noted above and in previous reports from this study, the sites participating in the Ca-reer Academies Evaluation differ from one another along a number of dimensions.5 As a result, there are numerous characteristics or criteria that might be used to differentiate the sites. For the purposes of this report, the strategy for exploring cross-site variation in the impacts of Career Academies focuses on similarities and differences among sites in terms of the contrast between their Academy and non-Academy environments, as opposed to exploring variation only on the basis of differences among the Career Academy programs. For example, some Career Academies with highly supportive school-within-a-school environments are located in high schools where the vast majority of students feel safe, challenged, and supported by their teachers and peers. In such
5See Kemple and Rock, 1996, for more detailed information about the similarities and differences among sites.
170
PR/Award # S165A200036
Page e311

-77-
a context, the Academies may not add much to the high degree of support already offered by the non-Academy environment.
Conversely, other Academies are located in high schools where very high percentages of students do not receive the support or instruction required to keep them engaged in school and on a path toward graduation. Even though these Academies may not be as “well implemented” as Academies in other contexts, they provide much more support and challenge for their students than is available in the non-Academy environments.
The strategy used in this report to highlight contrasts among the participating sites was guided by the theory of change described in Chapter 1 and by analyses of the relationships among the key constructs described above. As noted earlier, interpersonal supports were found to have the strongest relationship with later outcomes such as dropout prevention and progress toward graduation. In other words, students who reported a high degree of support from their teachers and peers in 9th or 10th grade were more likely, by the end of 12th grade, to remain enrolled in high school, to have high attendance rates (95 percent or higher), and to have completed a core cur-riculum. In general, Career Academy students were more likely to experience high levels of inter-personal supports than their counterparts in non-Academy environments.
Given the strong association between interpersonal supports and later outcomes, the primary construct used to distinguish among sites in the study was the difference in the level of interpersonal supports that Academy and non-Academy students received. In short, individual sites were ranked ac-cording to the difference between the percentage of Academy and non-Academy students who re-ported receiving a high level of support from teachers and peers. Such ranking indicated that a subset of five participating sites showed a particularly large difference in the interpersonal supports of Acad-emy and non-Academy students. Moreover, as a group, these sites generated larger differences in the school experiences of Academy and non-Academy students along several other important dimensions. Therefore, throughout the report, the Career Academies in these sites are referred to as high-contrast Academies.6 The remaining sites showed a substantially smaller difference in the level of teacher and peer support reported by Academy and non-Academy students, as well as somewhat smaller differ-ences along other dimensions of the high school experience. The Career Academies in these sites are referred to as low-contrast Academies.
Table 4.1 lists a variety of measures that highlight some of the key differences between high- and low-contrast sites and their Career Academies.7 The first row in Table 4.1 shows the average percentages of Academy and non-Academy students who gave a high rating on an overall measure of teacher support. The left panel of the table shows the differences in these percentages for the high-contrast Academies, and the right panel shows the differences for the low-contrast Academies. The difference in this outcome was much larger for the high-contrast
6It is important to note that high-contrast Academies are not necessarily the most highly supportive or best-implemented Academies in the study. Rather, they are the sites where the Career Academies presented the greatest contrast with their non-Academy school environments according to the student survey data collected for the evaluation. In some low-contrast sites, a high percentage of Academy students reported receiving high levels of support from teachers and peers, but they are characterized as “low-contrast” sites because equally high or higher percentages of non-Academy students also reported receiving high levels of support.
7For a detailed description of the measures presented in Table 4.1, see Kemple, 1997a, 1997b; and Kemple, Poglinco, and Snipes, 1999.
171
PR/Award # S165A200036
Page e312

-78-
Table 4.1
Career Academies Evaluation
Students' Perceptions of Interpersonal and Instructional Supportsand Participation in Work-Related Activities,
by High-Contrast and Low-Contrast Academies
High-Contrast Academiesa Low-Contrast Academiesa
Academy Non-Academy Percent Academy Non-Academy PercentOutcome Group Group Impact Changeb Group Group Impact Changeb
Students who gave a high rating on overall measure of teacher support 67.9 47.8 20.1 *** 42.1 51.1 46.6 4.5 9.6 †††
Students who gave a high rating on overall measure of peer support 54.0 39.7 14.3 *** 36.0 49.5 46.7 2.8 5.9 ††
Students who gave a high ratingon parent involvement 54.6 45.1 9.5 ** 21.0 52.5 47.3 5.2 11.0
Students who reported a high degree of exposure to enriched classroom instruction 63.4 44.2 19.3 *** 43.6 51.9 50.8 1.2 2.3 †††
Students who reported a high degree of exposure to work-related learning activities 54.7 33.3 21.4 *** 64.4 52.4 34.3 18.1 *** 52.9
Students who reported intensive participation in career awareness and development activitiesin and outside school 60.9 42.2 18.8 *** 44.5 62.9 47.7 15.2 *** 31.9
Students who reported working at a job with high-quality learning opportunities 47.3 41.2 6.2 15.0 50.8 45.9 4.9 10.8
Sample size 328 233 394 328 (continued)
172
PR/Award # S165A200036
Page e313

-79-
Table 4.1 (continued)
SOURCES: MDRC calculations from Career Academies Evaluation Student School Experience Questionnaire Database and 12th Grade Survey Database.
NOTES: Estimates are regression-adjusted using ordinary least squares, controlling for background characteristics of sample members. Rounding may cause slight discrepancies in calculating differences. A two-tailed t-test was applied to differences between the program and control groups. In both cases, statistical significance levels are indicated as: *** = 1 percent; ** = 5 percent; * = 10 percent.
aHigh-contrast Academies are defined as Academies that produced a significant difference in the percentage of Academy and non-Academy students who reported a high level
of support from teachers and peers. Low-contrast Academies are defined as Academies that produced very little difference between the percentage of Academy and non-Academy students who reported a high level of support from teachers and peers.
b
Percent change is defined as the impact divided by the non-Academy group average.
173
PR/Award # S165A200036
Page e314

-80-
Academies, where there was a 20 percentage point difference between Academy and non-Academy students. This represents an increase of 42 percent in the proportion of Academy stu-dents who felt that they received a high degree of support from their teachers. For the low-contrast Academies, there was no statistically significant difference between the percentages of Academy and non-Academy students who indicated that they received a high degree of support from their teachers.
The first row of Table 4.1 further indicates that the contrast between the two groups of sites can be attributed mostly to differences between the Academy groups rather than to differ-ences between the non-Academy groups. In the high-contrast sites, 68 percent of the Academy students reported receiving a high level of teacher support, compared with 51 percent of the Academy students in the low-contrast sites. On the other hand, very similar percentages of the non-Academy students from both groups of sites reported that they received a high level of teacher support. This pattern suggests that a key difference between these two groups of sites re-flects differences among Academy implementation strategies or differences among Academy teachers (or, more likely, a combination of the two). There is little contrast — at least on this measure — in the non-Academy environments.
The second row of Table 4.1 indicates a somewhat different pattern with respect to peer support. Again, there is a clear contrast in the difference in peer support reported by Academy and non-Academy students across the two groups of sites. In this case, however, the difference across the two groups of sites is driven both by differences between Academy students and by differences between non-Academy students. Academy students in the high-contrast sites were more likely to give a high rating on peer support than were Academy students in the low-contrast sites. At the same time, non-Academy students in the high-contrast sites were less likely to give a high rating on peer support than were non-Academy students in the low-contrast sites.
What did the high-contrast Academies do that was different from the low-contrast Acad-emies? In general, they tended to implement tightly organized school-within-a-school organiza-tions. Programs in high-contrast Academies tended to include a core group of four or five teach-ers whose responsibilities fell exclusively within the Academy. The vast majority of students in these programs had their core courses scheduled in blocks within the Academy, and very few non-Academy students were included (except, for example, to ensure adequate enrollments).8 These programs also tended to be located in a clearly identifiable area of the school building or campus. In addition, the Academy teachers in high-contrast sites tended to indicate that they had more op-portunities to collaborate with colleagues, that they felt part of a strong learning community, that they were able to influence key areas of their work, and that they emphasized personalized atten-tion to their students.9
It is important to note, however, that considerable variation existed among the Academies within the two groups of sites. In some sites, for example, the high contrast between the Acad-emies and regular school environments appears to have stemmed from an advanced level of pro-gram implementation — a level that was closer to the ideal Academy model. In other cases, how-ever, the high contrast appears to reflect that the regular high school environment was particularly stressful and unsupportive, and so the Academies provided considerably higher levels of support
8See Kemple, 1997a, 1997b. 9This information comes from site visits, teacher interviews, and classroom observations completed as part of
the Career Academies Evaluation.
174
PR/Award # S165A200036
Page e315

-81-
even though their programs were less well implemented than programs in other sites. In some high-contrast sites, a relatively low percentage of Academy students reported high levels of teacher and peer support, but an even lower percentage of non-Academy students did so.
There was also variation among the low-contrast sites. In some of them, relatively large percentages of both Academy and non-Academy students reported high levels of support from teachers and peers; in others, relatively small percentages did so. This suggests that, in some cases, the smaller effects on interpersonal support in the low-contrast sites were partly a function of weaker implementation of the Academy model. In other cases, however, the lack of effect was a function of the Academies’ being implemented in environments that were already relatively sup-portive.
The remainder of Table 4.1 reveals that the two groups of sites differed along several other dimensions of the Academy experience, including students’ exposure to enriched learning opportunities and participation in career awareness and work-based learning activities. In general, there were larger differences between the experiences of Academy and non-Academy students in the high-contrast sites than in the low-contrast sites. As discussed above and in Chapter 1, how-ever, these constructs were not as strongly related to student engagement and performance. In addition, the variation within the two groups of sites was greater on these dimensions than on the interpersonal supports.
The analyses in Chapter 5 focus primarily on the differences in impacts between these two groups of sites. In general, the chapter explores the hypothesis that the high-contrast Academies produced larger impacts on student engagement and performance than the low-contrast Acad-emies.
175
PR/Award # S165A200036
Page e316

-82-
Chapter 5
The Relationship Between Career Academy Implementation and Impacts
This chapter explores the relationship between variation in Career Academy implementa-tion across the sites in the study and variation in the impacts the different Academies had on stu-dent outcomes. In particular, this chapter explores the extent to which the pattern of impacts dis-cussed in Chapter 3 differed across the high- and low-contrast sites identified in Chapter 4. Chap-ter 3 found that the positive effects of Career Academies were concentrated among students at a high risk of dropping out but that impacts were relatively modest among students who were not at such risk. The findings in Chapter 4 revealed that outcomes were strongly related to measures of the interpersonal support that students experienced in their school environments; the Academies in this evaluation substantially varied in the magnitude of contrast between the level of interpersonal support experienced by Academy students and the level experienced by non-Academy students in the regular high school environment.
In short, this chapter explores the hypothesis that Academies which represented the most dramatic contrast with their non-Academy environments produced larger and more consistent positive impacts than did Academies that were more similar to their non-Academy environments. Following is a summary of key findings discussed in this chapter.
• Among students in the medium-risk subgroup, Career Academies that repre-sented the greatest contrast with the regular high school environment produced positive impacts, including lower dropout rates and increased completion of a core academic curriculum.
• Academies that represented less contrast with the non-Academy environment in terms of interpersonal support produced some negative effects for students in the medium-risk subgroup, including higher dropout rates, reduced atten-dance, and lower rates of academic course-taking.
• In general, both high-contrast and low-contrast Academies produced similar patterns of impacts among students in the high-risk subgroup. The primary dif-ference across these sites is that the low-contrast Academies somewhat re-duced this subgroup’s dropout rates and produced much larger increases in vo-cational and career-related course-taking.
• In general, both high-contrast and low-contrast Academies also produced simi-lar patterns of impacts among students in the low-risk subgroup. The primary difference across the sites for this subgroup is that the low-contrast Academies somewhat increased career-related and vocational credits while reducing aca-demic course-taking.
In sum, these findings do not clearly support the hypothesis that the high-contrast Acad-emies produced larger and more consistently positive impacts than the low-contrast Academies. Although this pattern can be seen among students in the medium-risk subgroup, for the high- and
176
PR/Award # S165A200036
Page e317

-83-
low-risk subgroups the impacts across the groups of sites had more similarities than differences. Nevertheless, the differences that do exist suggest two implications:
• Increasing the level of interpersonal support for students — in addition to of-fering more opportunities to participate in career awareness and work-based learning activities — can produce a consistent pattern of positive effects for both the high- and the medium-risk subgroups (representing approximately 75 percent of the students Academies serve). Under such circumstances, students in the low-risk Academy group are likely to do at least as well as their non-Academy counterparts.
• If Academies do not increase the level of interpersonal support (again, relative to the regular school environment), they may actually reduce engagement among the medium-risk subgroup, and they may also lead the low-risk subgroup to replace some academic courses with career-related or vocational courses.
These findings and implications are discussed in greater detail below.
I. Contrasting Impacts for Students in the Medium-Risk Subgroup
Tables 5.1 and 5.2 report the impacts among students in the medium-risk subgroup (that is, students who were not identified as being at a particularly high or low risk of dropping out). The left panel of each table presents findings for the high-contrast Academies, and the right panel presents findings for the low-contrast Academies.1
The findings in the left panel of Table 5.1 indicate that, among students in the medium-risk subgroup, the high-contrast Academies had a positive impact on a number of key outcomes. In particular, the high-contrast Academies appeared to reduce dropout rates and increase the per-centage of students who completed a core academic curriculum. Specifically, the high-contrast Academies reduced dropout rates for the medium-risk subgroup from 11 percent among non-Academy students to 5 percent among their Academy group counterparts. This 6 percentage point difference represents a 54 percent reduction in the dropout rate for non-Academy students in the medium-risk subgroup. In addition, the high-contrast Academies increased the percentage of the medium-risk subgroup who completed a basic core academic curriculum. Whereas 49 per-cent of non-Academy students in these sites completed the curriculum, 58 percent of Academy students did so.
The right panel of Table 5.1 indicates that impacts at the low-contrast Academies oc-curred in the opposite direction from impacts at the high-contrast Academies. In particular, the
1In addition to providing statistical significance tests of the impacts within each group of sites, the tables in
this chapter provide statistical significance tests of the difference in impacts across the two groups of sites. The dagger symbols (†) in the rightmost column of each table indicate whether or not the impact for the high-contrast Academies was statistically significantly different from the impact observed for the low-contrast Academies. If a difference in impacts is statistically significant, one may have greater confidence that it is a systematic difference between the groups of sites and does not arise merely from chance.
177
PR/Award # S165A200036
Page e318

-84-
Table 5.1
Career Academies Evaluation
Impacts on Enrollment, Attendance, and Course-Taking for Students in the Medium-Risk Subgroup,
by High-Contrast and Low-Contrast Academies
High-Contrast Academiesa Low-Contrast Academiesa
Academy Non-Academy Percent Impact per Academy Non-Academy Percent Impact per Outcome Group Group Impact Changeb
Enrolleec Group Group Impact Changeb
Enrolleec
Ever enrolled in a Career Academyduring high school (%) 85.8 6.5 79.3 *** 92.2 6.9 85.3 ***
Dropped out of high schoolbefore the end of grade 12 (%) 5.3 11.3 -6.1 ** -53.5 -7.7 12.6 4.8 7.8 *** 161.0 9.1 †††
Average attendancegrades 9-12 (%) 87.5 85.7 1.7 2.0 2.2 89.5 93.4 -3.9 *** -4.2 -4.6 †††
Total course credits meet thegraduation requirement (%) 68.4 61.5 6.9 11.2 8.6 61.6 68.6 -7.0 -10.2 -8.2 †
English (4), Social Studies(3),Math (2), Science (2)d (%) 58.0 48.5 9.4 * 19.5 11.9 37.2 54.2 -17.0 *** -31.4 -19.9 †††
Earned 2 or more foreign-language credits (%) 54.5 48.6 5.9 12.1 7.4 25.7 49.8 -24.1 *** -48.4 -28.2 †††
Earned 3 or more career/vocational credits (%) 61.5 49.9 11.6 ** 23.3 14.6 72.0 45.7 26.2 *** 57.4 30.8 †
Sample size 195 165 198 166
(continued)
178
PR/Award # S165A200036
Page e319

-85-
Table 5.1 (continued)
SOURCE: MDRC calculations from Career Academies Evaluation School Records Database.
NOTES: Attendance rates include zero values for grades in which sample members were identified as school dropouts. Estimates are regression-adjusted using ordinary least squares, controlling for background characteristics of sample members. Rounding may cause slight discrepancies in calculating differences. A two-tailed t-test was applied to differences between the Academy and non-Academy groups. Statistical significance levels are indicated as: *** = 1 percent; ** = 5 percent; * = 10 percent. An f-test was performed to determine whether the variation in impacts across site-subgroups was statistically significant. Statistical significance of these tests are indicated as: ††† = 1 percent; †† = 5 percent; † = 10 percent.
aHigh-contrast Academies are defined as Academies that produced a significant difference in the percentage of Academy and non-Academy students who reported a "high" level of
support from their teachers and peers early on in high school. Low-contrast Academies are defined as Academies that produced very little difference between the percentage of Academy and non-Academy students who reported a "high" level of support from teachers and peers.
bPercent change is defined as the impact divided by the non-Academy group average.
cImpact per enrollee is defined as the impact divided by the difference in the percentage of program and control group members ever enrolled in a Career Academy.
dNumbers refer to the amount of credits that were earned in each subject area.
179
PR/Award # S165A200036
Page e320

-86-
low-contrast Academies appear to have increased dropout rates for the medium-risk subgroup, from 5 percent among the non-Academy students to 13 percent among the Academy students. The dropout rate for Academy students in these sites was about two and a half times larger than it was for their non-Academy counterparts. Furthermore, while neither group of Academies pro-duced statistically significant changes in the percentage of students in the medium-risk subgroup who earned enough credits to graduate on time, the patterns of impacts run in opposite directions. That is, the high-contrast Academies increased the percentage of students who earned enough credits to meet the districts’ graduation requirements, while the low-contrast Academies de-creased this percentage. (Note that the difference in these impacts is statistically significant even though the individual impact estimates are not.)
There were particularly dramatic differences in impacts on course-taking patterns between the high-contrast and low-contrast Academies. The low-contrast Academies reduced the percent-age of students in the medium-risk subgroup who completed the basic core academic curriculum, from 54 percent for students in the non-Academy group to 37 percent for students in the Acad-emy group. A similar reduction occurred in the percentage of students who completed two or more foreign-language courses (from 50 percent for the non-Academy group to 26 percent for the Academy group).
The last row of Table 5.1 indicates that the low-contrast Academies produced more than twice as large an impact on vocational course-taking than did the high-contrast Academies. Specifically, in the high-contrast Academies, the percentage of students in the medium-risk subgroups who completed three or more career-related or vocational courses increased from 50 percent for the non-Academy group to 62 percent for the Academy group. This 12 percentage point difference represents an increase of about 23 percent over the non-Academy group average. In the low-contrast Academies, however, the percentage of students who completed three or more career-related or vocational courses increased from 46 percent for the non-Academy group to 72 percent for the Academy group — an increase of 57 percent over the non-Academy group average. Table 5.2 presents the impacts of each group of Academies on the medium-risk sub-group’s youth development activities and the steps these students took toward post-secondary education or employment opportunities. The primary differences between the two groups of sites relate to the steps students took toward employment. The high-contrast Academies slightly re-duced the percentages both of students who applied for post-secondary employment and of stu-dents who interviewed for a position, whereas the low-contrast Academies had significant positive impacts on both outcomes.
Although the two groups of sites were differentiated by the level of interpersonal support that the Academies offered to students (relative to the non-Academy environment), it is notable that several differences in impacts relate to curriculum and work-related activities. The patterns of findings presented in Tables 5.1 and 5.2 suggest that the low-contrast Academies placed greater emphasis on career-related and vocational course-taking and on helping students take concrete steps toward post-secondary employment opportunities. Nonetheless, the high-contrast Acad-emies do appear to have produced stronger impacts on school engagement for students in the me-dium-risk subgroup.
180
PR/Award # S165A200036
Page e321

-87-
Table 5.2
Career Academies Evaluation
Impacts on Youth Development Experiences and Preparation for the Futurefor Students in the Medium-Risk Subgroup,
by High-Contrast and Low-Contrast Academies
High-Contrast Academiesa Low-Contrast Academiesa
Academy Non-Academy Percent Impact per Academy Non-Academy Percent Impact per Outcome Group Group Impact Changeb
Enrolleec Group Group Impact Changeb
Enrolleec
Reported two or more positive youth development experiences in past year (%)d 73.3 66.1 7.3 11.0 9.2 69.3 72.3 -3.0 -4.2 -3.5
Reported any risk-taking behaviorsin past year (%)e 24.9 25.7 -0.8 -3.0 -1.0 22.7 25.7 -3.1 -11.9 -3.6
Took steps toward 2-year or 4-year college admission (%)
Took SATs or ACTs 46.3 48.7 -2.4 -5.0 -3.0 42.7 45.3 -2.6 -5.7 -3.0
Submitted an application 67.9 63.2 4.7 7.4 5.9 57.8 63.1 -5.2 -8.3 -6.2
Took steps toward post-secondaryemployment (%)
Submitted an application for employment 59.7 63.2 -3.5 -5.6 -4.5 62.1 48.0 14.1 *** 29.4 16.5 ††
Interviewed for a position 41.5 50.3 -8.8 * -17.5 -11.1 43.1 33.9 9.1 * 26.9 10.7 ††
Has an overall positive outlook for the futuref 74.4 73.6 0.8 1.0 1.0 75.8 82.9 -7.1 * -8.6 -8.3
Sample size 191 161 216 187
(continued)
181
PR/Award # S165A200036
Page e322

-88-
Table 5.2 (continued)
SOURCE: MDRC calculations from Career Academies Evaluation 12th Grade Student Survey Database
NOTES: Attendance rates include zero values for grades in which sample members were identified as school dropouts. Estimates are regression-adjusted using ordinary least squares, controlling for background characteristics of sample members. Rounding may cause slight discrepancies in calculating differences. A two-tailed t-test was applied to differences between the Academy and non-Academy groups. Statistical significance levels are indicated as: *** = 1 percent; ** = 5 percent; * = 10 percent. An f-test was performed to determine whether the variation in impacts across site-subgroups was statistically significant. Statistical significance of these tests are indicated as: ††† = 1 percent; †† = 5 percent; † = 10 percent.
aHigh-contrast Academies are defined as Academies that produced a significant difference in the percentage of Academy and non-Academy students who reported a "high" level of
support from their teachers and peers. Low-contrast Academies are defined as Acadmies that produced very little difference between the percentage of Academy and non-Academy students who reported a "high" level of support from teachers and peers.
bPercent change is defined as the impact divided by the non-Academy group average.
cImpact per enrollee is defined as the impact divided by the difference in the percentage of program and control group members ever enrolled in a Career Academy.
dPositive youth development experiences include working on a volunteer project in the community, receiving an award or recognition for participation
in an athletic team or school organization, or receiving an academic award or scholarship.
eRisk-taking behaviors include being expelled from school, coming to school high on drugs or alcohol, or being arrested.
fOverall positive outlook for the future was defined by high ratings on questions about expectations for achievement, potential for attaining jobs, and knowledge of methods of finding
jobs.
182
PR/Award # S165A200036
Page e323

-89-
II. Contrasting Impacts for Students in the High-Risk Subgroup
Tables 5.3 and 5.4 present the impact findings for the high-risk subgroup. These findings indicate that the patterns of impacts across the high-contrast and low-contrast Academies are generally similar. Both groups of Academies had positive effects on dropout rates, attendance, credits earned toward graduation, and completion of a core academic curriculum. With the excep-tion of the impacts on career-related and vocational course-taking, none of the differences in im-pacts across the site groups is statistically significant.2
There are two notable exceptions to the pattern of similar impacts for students in the high-risk subgroups across the sites. First, although both groups of Academies produced reductions in dropout rates, the impact on dropout rates for the high-contrast Academies was not statistically significant. (Note that the differences in dropout rate impacts across the groups of sites is not sta-tistically significant.) In particular, the low-contrast Academies cut dropout rates in half for the high-risk subgroups, while the high-contrast Academies reduced dropout rates by about 25 per-cent. There is no clear explanation for this pattern of findings, and it runs counter to the hypothe-sis that increased interpersonal support in the high-contrast sites should have produced larger reductions in dropout rates.
Despite the somewhat smaller impact on dropout rate reduction, however, Table 5.3 shows that the high-contrast Academies produced comparable impacts on attendance and credits. For example, the high-contrast Academies increased the percentage of the high-risk subgroup who earned sufficient credits to graduate, from 30 percent for the non-Academy students to 43 percent for the Academy students. A similar pattern occurred among the low-contrast Academies. Whereas 19 percent of the high-risk non-Academy group at the low-contrast sites earned enough credits to graduate by the end of 12th grade, 36 percent of their peers in the Academy group did so — a difference of 87 percent. Again, although this impact appears to be somewhat larger among the low-contrast Academies, the difference in impacts is not statistically significant.
Both high-contrast and low-contrast Academies increased the percentage of the high-risk subgroup who completed the basic core academic curriculum. Again, while this impact is statisti-cally significant only in the high-contrast sites, there is no significant difference across the sites in the magnitude of this impact. In fact, to the extent that there is a difference, the percentage change at the low-contrast sites appears to be larger than at the high-contrast sites.
As noted above, vocational or career-related course-taking reflects the only dimension along which the difference in impacts across sites is statistically significant. While the impact on the percentage of students who took three or more vocational courses is significant for both high-contrast and low-contrast Academies, the impact on vocational course-taking is substantially larger for low-contrast Academies. At these sites, 28 percent of the high-risk non-Academy group completed at least three career-related or vocational courses, compared with 66 per-cent of the Academy group. This impact represents an increase of 141 percent over the non-Academy group and is nearly four times larger than the impact for the high-contrast Acad-emies. This suggests that while the high-contrast and low-contrast Academies produced
2In other words, one cannot reject the hypothesis that the impacts for high-contrast Academies are the same as
the impacts for low-contrast Academies.
183
PR/Award # S165A200036
Page e324

-90-
Table 5.3
Career Academies Evaluation
Impacts on Enrollment, Attendance, and Course-Taking for Students in the High-Risk Subgroup,
by High-Contrast and Low-Contrast Academies
High-Contrast Academiesa
Low-Contrast Academiesa
Academy Non-Academy Percent Impact per Academy Non-Academy Percent Impact per Outcome Group Group Impact Change
bEnrollee
cGroup Group Impact Change
bEnrollee
c
Ever enrolled in a Career Academyduring high school (%) 86.2 4.4 81.8 *** 87.5 0.4 87.1 ***
Dropped out of high schoolbefore the end of grade 12 (%) 24.2 32.0 -7.9 -24.6 -9.6 16.2 34.4 -18.2 ** -52.9 -20.9
Average attendancegrades 9-12 (%) 79.0 73.5 5.5 ** 7.5 6.7 85.3 78.7 6.6 ** 8.4 7.6
Total course credits meet thegraduation requirement (%) 43.4 30.2 13.1 * 43.5 16.1 35.8 19.1 16.6 ** 87.0 19.1
English (4), Social Studies(3),Math (2), Science (2)
d (%) 36.1 19.6 16.5 ** 84.4 20.2 20.9 8.9 12.0 134.6 13.8
Earned 2 or more foreign-languagecredits (%) 29.4 21.4 8.0 37.5 9.8 16.0 13.6 2.3 17.2 2.7
Earned 3 or more career/vocationalcredits (%) 55.3 40.3 15.0 * 37.2 18.3 66.3 27.5 38.8 *** 140.8 44.5 †
Sample size 103 94 82 66
SOURCE: See Table 5.1.
NOTES: See Table 5.1.
184
PR/Award # S165A200036
Page e325

-91-
Table 5.4
Career Academies Evaluation
Impacts on Youth Development Experiences and Preparation for the Futurefor Students in the High-Risk Subgroup,
by High-Contrast and Low-Contrast Academies
High-Contrast Academiesa Low-Contrast Academiesa
Academy Non-Academy Percent Impact per Academy Non-Academy Percent Impact per Outcome Group Group Impact Changeb
Enrolleec Group Group Impact Changeb
Enrolleec
Reported two or more positive youth development experiences in past year (%)d 62.1 52.7 9.4 17.9 11.5 63.0 59.0 4.0 6.7 4.6
Reported any risk-taking behaviorsin past year (%)e 34.3 45.2 -10.9 -24.1 -13.3 35.2 31.4 3.8 12.1 4.4
Took steps toward 2-year or 4-year college admission (%)
Took SATs or ACTs 33.6 22.2 11.4 * 51.5 14.0 34.5 23.5 11.0 46.8 12.6
Submitted an application 47.5 35.5 12.0 * 33.7 14.6 53.5 35.7 17.8 ** 50.0 20.5
Took steps toward post-secondaryemployment (%)
Submitted an application for employment 61.7 60.9 0.8 1.3 1.0 59.9 48.4 11.5 23.8 13.2
Interviewed for a position 47.5 46.6 0.9 2.0 1.1 44.6 39.7 4.9 12.3 5.6
Has an overall positive outlook for the futuref 75.8 66.8 9.0 13.5 11.0 69.7 63.3 6.5 10.2 7.4
Sample size 112 95 90 69
SOURCE: See Table 5.2.
NOTES: See Table 5.2.
185
PR/Award # S165A200036
Page e326

-92-
similar patterns of impacts on student engagement generally, the low-contrast Academies pro-duced a much larger impact on career-related and vocational course-taking. It is important to note that, for the high-risk subgroup, this increase in career-related and vocational course-taking did not appear to result in a reduction in academic course-taking.
Table 5.4 presents the impacts for the high-contrast and low-contrast Academies on youth development outcomes and steps taken toward post-secondary education and employment. In general, the data suggest no real differences in impacts between the two groups of sites.
III. Contrasting Impacts for Students in the Low-Risk Subgroup
Table 5.5 presents the impact findings for the low-risk subgroups across the high-contrast and low-contrast Academies. Not surprisingly, the findings suggest that neither group of Acad-emies had a meaningful impact on dropout rates or attendance. Students in the low-risk subgroup at both groups of sites were unlikely to drop out of high school and had relatively high attendance rates, even in the absence of the Academy treatment. Given these outcome levels, there was little opportunity for either group of Academies to make much difference.
Table 5.5 does show that both groups of Academies increased the percentage of the low-risk subgroup who earned enough credits to meet their districts’ graduation requirements. The table indicates that, at the low-contrast sites, 75 percent of the non-Academy students earned enough credits by the end of their scheduled 12th-grade year, compared with 88 percent of the Academy students. Similarly, at the high-contrast sites, 73 percent of the non-Academy students earned enough credits to graduate on time, compared with 84 percent of the Academy students in the low-risk subgroup.
The last three rows of Table 5.5 show that the primary differences in impacts across the two groups of sites occurred in course-taking patterns. The low-contrast Academies reduced the percentage of students in the low-risk subgroup who completed the basic academic curriculum as well as the percentage who completed two or more foreign-language courses. On the other hand, the high-contrast Academies produced a slight increase in the percentage of students who com-pleted the basic core curriculum and a smaller (not statistically significant) reduction in the per-centage taking two or more foreign-language courses.
Table 5.5 indicates that, at the low-contrast sites, 64 percent of the non-Academy students in the low-risk subgroup completed the basic core academic curriculum. In comparison, 54 per-cent of Academy students did so. Although this difference is not statistically significant, it is sig-nificantly different from the pattern at the high-contrast sites, where the Academies increased by almost the same magnitude the percentage of students who completed the basic core curriculum.
Table 5.5 also indicates that the low-contrast Academies reduced the percentage of the low-risk subgroup who completed two or more foreign-language courses. While 79 percent of the non-Academy students at these sites earned two or more foreign-language credits, 44 percent of their Academy counterparts did so. This difference is statistically significant and represents a re-duction of 44 percent. Although there is a negative effect on this outcome for the high-contrast sites, it is not statistically significant; moreover, it is substantially smaller than the effect at the low-contrast sites.
186
PR/Award # S165A200036
Page e327

-93-
Table 5.5
Career Academies Evaluation
Impacts on Enrollment, Attendance, and Course-Taking for Students in the Low-Risk Subgroup,
by High-Contrast and Low-Contrast Academies
High-Contrast Academiesa Low-Contrast Academiesa
Academy Non-Academy Percent Impact per Academy Non-Academy Percent Impact per Outcome Group Group Impact Changeb
Enrolleec Group Group Impact Changeb
Enrolleec
Ever enrolled in a Career Academyduring high school (%) 82.6 6.9 75.7 *** 94.1 12.5 81.6 ***
Dropped out of high schoolbefore the end of grade 12 (%) 2.4 4.3 -1.8 -42.9 -2.4 1.7 1.8 -0.1 -5.4 -0.1
Average attendancegrades 9-12 (%) 93.1 92.0 1.1 1.2 1.5 95.9 95.9 0.1 0.1 0.1
Total course credits meet thegraduation requirement (%) 83.7 72.8 10.9 * 15.0 14.4 87.9 75.1 12.7 ** 16.9 15.6
English (4), Social Studies(3),Math (2), Science (2)d (%) 64.6 55.7 8.9 16.0 11.8 53.8 64.4 -10.6 -16.5 -13.0 †
Earned 2 or more foreign-language credits (%)57.6 66.9 -9.3 -14.0 -12.3 44.1 79.2 -35.1 *** -44.3 -43.0 ††
Earned 3 or more career/vocational credits (%)72.8 44.3 28.5 *** 64.5 37.7 79.8 41.0 38.7 *** 94.4 47.4
Sample size 85 69 119 112
SOURCE: See Table 5.1.
NOTES: See Table 5.1.
187
PR/Award # S165A200036
Page e328

-94-
Finally, while both groups of Academies increased the vocational course-taking for stu-dents in the low-risk subgroup, the impact at low-contrast sites was slightly larger. The high-contrast Academies increased the percentage of students who earned three or more career-related or vocational credits from 44 to 73 percent (an increase of 65 percent), whereas the low-contrast Academies increased this percentage from 41 to 80 percent (an increase of 94 percent).
Table 5.6 presents findings on the low-risk subgroup’s youth development experiences and steps taken toward post-secondary education and employment. In general, there were few impacts on these outcomes and few differences in the patterns at high-contrast and low-contrast Academies. The one exception is the effect of Academies on positive youth development experi-ences. The first row of Table 5.6 presents the percentages of the low-risk subgroup who reported such positive youth development experiences as working on a volunteer project in their commu-nity, receiving an award or recognition for participating in an athletic team or school organization, and receiving an academic award or scholarship. Among the high-contrast Academies, 70 percent of the low-risk non-Academy group reported positive youth development experiences, compared with 84 percent of the Academy students. The low-contrast Academies did not have an impact on this outcome.
IV. Summary
The findings reported in this chapter have several implications for policy and practice. First, it appears that Academies which produced the largest increases in interpersonal supports for students (relative to their non-Academy environments) also produced positive impacts on student engagement among both the high-risk and the medium-risk subgroups (which represent about 75 percent of the students they serve). Thus, focusing on interpersonal supports appears to be a par-ticularly important factor for both policymakers and practitioners when implementing Academies. As discussed in Chapter 4, such supports as increased teachers’ expectations, personalized atten-tion, and students’ connections with an engaged peer group are most likely to be derived from the school-within-a-school component of the Academy approach. This component may be a neces-sary, though perhaps not sufficient, condition to keep students in school and to provide a founda-tion for improving their achievement.
Second, it appears that high-contrast and low-contrast Academies may differ in important ways other than in their levels of interpersonal support. This is suggested by the larger impacts that the low-contrast Academies had on career-related and vocational course-taking and by their reductions in academic course-taking, particularly among the medium-risk and low-risk sub-groups. Given that completion of a core academic curriculum and foreign-language courses are often key requirements for admission to a four-year college, to the extent that the mission of the Academies has evolved to include preparation for work and college, it is important that the Acad-emies avoid limiting opportunities for any subset of students. Therefore, policymakers and practi-tioners may need to ensure that Academies are implemented in a way that increases both interper-sonal support and exposure to career-related themes and experiences in school but that does not limit students’ opportunities to complete key academic courses.
188
PR/Award # S165A200036
Page e329

-95-
Table 5.6
Career Academies Evaluation
Impacts on Youth Development Experiences and Preparation for the Futurefor Students in the Low-Risk Subgroup,
by High-Contrast and Low-Contrast Academies
High-Contrast Academiesa Low-Contrast Academiesa
Academy Non-Academy Percent Impact per Academy Non-Academy Percent Impact per Outcome Group Group Impact Changeb Enrollee c Group Group Impact Changeb Enrollee c
Reported two or more positive youth development experiences in past year (%)d 84.1 70.3 13.8 ** 19.6 18.2 78.0 78.9 -0.9 -1.1 -1.0 †
Reported any risk-taking behaviorsin past year (%)e 10.4 16.0 -5.6 -35.0 -7.4 19.5 15.7 3.8 24.3 4.7
Took steps toward 2-year or 4-year college admission (%)
Took SATs or ACTs 63.6 58.7 4.9 8.3 6.4 57.7 60.5 -2.8 -4.6 -3.4
Submitted an application 73.0 81.5 -8.5 -10.5 -11.3 69.0 77.3 -8.3 -10.7 -10.1
Took steps toward post-secondaryemployment (%)
Submitted an application for employment 55.1 64.2 -9.1 -14.2 -12.0 56.4 51.9 4.5 8.7 5.5
Interviewed for a position 33.8 32.8 1.0 2.9 1.3 41.7 42.8 -1.1 -2.6 -1.3
Has an overall positive outlook for the futuref 80.1 81.1 -1.0 -1.2 -1.3 76.9 76.8 0.1 0.1 0.1
Sample size 90 64 128 107
SOURCE: See Table 5.2.
NOTES: See Table 5.2.
189
PR/Award # S165A200036
Page e330

-98-
Appendix A
Supplementary Information About the Career Academies Evaluation Research Sample and Data Sources
190
PR/Award # S165A200036
Page e331

-99-
As discussed in Chapter 1, the primary data used in this report were obtained from three sources: school transcript records, a survey administered to students at the end of their 12th-grade year, and a standardized math and reading achievement test administered to a subsample of stu-dents at the end of their 12th-grade year. This appendix presents the percentage of students in the full study sample for whom these data are available. It also examines the comparability of students in the Academy and non-Academy groups for whom data are availabile.
I. Data Availability for Students in the Study Sample
As noted in Chapter 1, MDRC attempted to obtain data for a sample of 1,764 students from nine of the sites selected for the study.1 For the purposes of this report, this group of stu-dents is referred to as the study sample. Of the students in the study sample, 959 (55 percent) were randomly selected to enroll in an Academy. For the purposes of this report, these students are referred to as the Academy group. The remaining 805 students (45 percent of the study sam-ple) were not invited to participate in the Academies but could choose other options available in their high school or school district. These students constitute the study’s control group and are referred to in this report as the non-Academy group.
These groups of students were identified over a three-year period including the 1992-93, 1993-94, and 1994-95 school years. The students in the study sample were identified at the end of their 8th- or 9th-grade year, depending on when they applied for an Academy program. Recall that two of the Academies began in the 9th grade and that the remaining seven began in the 10th grade. Students applied for admission to the programs at the end of the year prior to expected enroll-ment. This report follows students in the study sample through the end of the year they were scheduled to graduate from high school. This corresponds to the 1995-96, 1996-97, or 1997-98 school year, depending on the year and grade level when a student entered the study. In short, MDRC attempted to collect data for students over the four-year period they were scheduled to enroll in high school.
Table A.1 lists the percentages of students in the Academy and non-Academy groups for whom each of the key data sources is available. These percentages are referred to here as re-sponse rates. The top panel of the table shows the response rates for the full study sample, and the bottom three panels show the response rates for each of the three risk subgroups discussed throughout the report. Although not shown in the table, the overall response rates are as follows: Student School Records data are available for just over 82 percent of the students in the study sample, and 12th Grade Survey data are available for just over 85 percent of the study sample.
1As discussed in Kemple and Rock, 1996, the initial research sample consisted of 1,953 students from 10 sites.
A total of 189 of these students were dropped from the initial research sample, and efforts to collect data for them were discontinued. These students include the following. First, as noted in Chapter 1, one of the initial Career Academies was disbanded after two years in the study and was unable to provide sufficient follow-up data for its students in the study sample. Thus, the 126 students in the research sample from this site are not included in the study sample for this report. Second, MDRC learned that 59 of the students in the initial research sample applied for an Academy program during their 10th-grade year and should not have been included in the study. This infor-mation was obtained from pre-random assignment school records and was confirmed with school staff. Finally, over the course of the data collection period, MDRC learned through contact with the schools and families that four additional students were deceased.
191
PR/Award # S165A200036
Page e332

-100-
Table A.1
Career Academies Evaluation
Data Availability for the Full Study Sample and the Risk Subgroups
Academy Non-AcademySubgroup and Data Source Group Group Difference
Full study sample
In Student School Records Database (%) 81.5 83.5 -2.0
In 12th Grade Survey Database (%) 86.2 84.8 1.4
In 12th Grade Achievement Test Databasea (%) 71.8 69.9 1.9
Sample size (n=1,764) 959 805
High-risk subgroup
In Student School Records Database (%) 71.7 74.1 -2.4
In 12th Grade Survey Database (%) 78.3 75.9 2.4
In 12th Grade Achievement Test Databasea (%) 60.0 56.0 4.0
Sample size (n=474) 258 216
Medium-risk subgroup
In Student School Records Database (%) 83.4 83.2 0.2
In 12th Grade Survey Database (%) 86.4 87.4 -1.0
In 12th Grade Achievement Test Databasea (%) 74.3 69.9 4.4
Sample size (n=869) 471 398
Low-risk subgroup
In Student School Records Database (%) 88.7 94.8 -6.1 *
In 12th Grade Survey Database (%) 94.8 89.5 5.3 *
In 12th Grade Achievement Test Databasea (%) 80.0 84.8 -4.8
Sample size (n=421) 230 191
Academy Non-AcademyGroup Group
Full sample 372 319High-risk subgroup 105 84Medium-risk subgroup 167 156Low-risk subgroup 100 79
SOURCES: MDRC calculations from Career Academies Evaluation Student Baseline Questionnaire Database, Student School Records Database, and 12th Grade Survey Database.
NOTES: The statistical significance of the difference between Academy and non-Academy groups is indicated as *** = 1 percent; ** = 5 percent; * = 10 percent.aPercentages based on those attempted for the 12th-grade achievement test:
192
PR/Award # S165A200036
Page e333

-101-
These response rates are considered to be high, particularly given that they cover a four-year fol-low-up period. Typically, program evaluations such as this aim for response rates of 80 percent or higher. The 12th Grade Achievement Test data are available for approximately 71 percent of the students in the study sample who were attempted for the test administration.2
The top panel of Table A.1 shows that there are no systematic differences between the Academy and non-Academy groups in the proportion of students for whom these data are avail-able. Thus, although these data are not available for all students in the study sample, data availability is virtually the same for the Academy and non-Academy groups. The second and third panels in the table show that there also are no systematic differences in response rates for each of the data sources for the high-risk and medium-risk subgroups.
There are slight differences in response rates, however, between Academy and non-Academy students in the low-risk subgroup. In particular, response rates for Student School Re-cords data are somewhat higher among the students in the low-risk non-Academy group than they are for the students in the low-risk Academy group. Conversely, response rates for the 12th Grade Survey are somewhat higher among students in the low-risk Academy group. When re-sponse rates are larger for one research group, impact estimates may be biased slightly if there are systematic differences in background characteristics and pre-random assignment experiences be-tween Academy and non-Academy students who did respond. As discussed in the next section of this Appendix, there are no systematic differences between Academy and non-Academy students in any of the subgroups for any of the data sources.
A key question for interpreting the findings presented in this report is whether students for whom data are available are representative of the full study sample. To address this question, mul-tiple regression was used to determine the extent to which the average characteristics of the stu-dents with data differed from the average characteristics of students for whom data are not avail-able. This analysis was carried out for each of the three data sources. In each case, the analysis indicated that there were systematic differences in background characteristics between students with data and those without data. An illustration of the differences can be seen by comparing the response rates of the high-risk, medium-risk, and low-risk subgroups in Table A.1. Across all three data sources, response rates are lowest for the students in the high-risk subgroup and are highest for students in the low-risk subgroup.
In short, the analysis of response rates indicates that the samples of students for whom data are available are not completely representative of the full study sample of 1,764 students. Thus, caution should be exercised when attempting to generalize the findings beyond the students who are included in the analyses. Nevertheless, the overall response rates show that data are available for the vast majority of students in the study sample, making the findings reflective of the behavior of most of the sample.
2As noted in Chapter 1, MDRC attempted to administer the achievement test to the 691 students in the study
sample who were scheduled to be in the 12th grade at the end of the 1997-98 school year.
193
PR/Award # S165A200036
Page e334

-102-
II. Comparison of Characteristics of Academy and Non-Academy Groups in the Database Samples
The unique strength of a random assignment research design is that it yields two groups for which there are no systematic differences in measured and unmeasured background character-istics at the time sample members are identified for the study. Because the two groups entered the study with equivalent characteristics, any differences that emerge after that point can be attributed with confidence to the fact that one group had access to an Academy and the other group did not.
Table 2.1 in Chapter 2 presents, one at a time, average characteristics of Academy and non-Academy students in the full study sample. This table shows that there are not statistically significant differences between the groups on any of the characteristics. A more rigorous way to test for such differences is to use multiple regression analysis. Table A.2 presents linear regression estimates and statistical tests of whether there are any systematic differences between Academy and non-Academy students in the full study sample and in each of the three risk subgroups. The first column in Table A.2 shows that only one characteristic (age at application to Academy) is statistically significant and that there is no systematic difference. The final entry in the column, the p-value of the F-statistic, is very close to 1, providing strong evidence that there is no overall pat-tern of differences between Academy and non-Academy students in the full study sample. A p-value of .1 or lower is typically used to indicate a “high” likelihood that there are systematic dif-ferences between the groups.
The three remaining columns in Table A.2 present the same analysis for each of the three risk subgroups. These columns indicate that there are slight differences in a few individual charac-teristics but no overall pattern of differences between Academy and non-Academy students for any of the subgroups. The p-value of the F-statistic for each subgroup ranges from .767 to .879.
As discussed in the previous section of this appendix, MDRC obtained school records for approximately 82 percent of the full sample; obtained 12th Grade Survey data for approximately 84 percent of the full study sample; and obtained 12th Grade Achievement Test data for approxi-mately 71 percent of those attempted for the test. Thus, the Student School Records Database sample consists of 1,454 students; the 12th Grade Survey Database sample consists of 1,510 stu-dents; and the 12th Grade Achievement Test Database sample consists of 490 students.
A key question underlying the analyses presented in this report is: Do these response patterns preserve the random assignment design? In other words, does each of the database samples exhibit the same lack of systematic differences between Academy and non-Academy students, both overall and for each of the risk subgroups? To assess this question, regression analyses were used in the same manner as exhibited in Table A.2. Table A.3 presents the results for the Student School Records Database sample; Table A.4 presents the results for the 12th Grade Survey Database sample; and Table A.5 pre-sents the results for the 12th Grade Achievement Test Database sample.
These tables each indicate slight differences in a few particular characteristics, but there are no systematic differences between the Academy and non-Academy groups for any of the data-base samples. This is true for the full study sample and for each of the risk subgroups. Given the overall lack of differences in background characteristics between the two groups, one can be con-fident that differences in the outcome measures used throughout the report were caused by one
194
PR/Award # S165A200036
Page e335

-103-
group’s having had access to the Career Academies and the other group’s not having had such access.
In summary, random assignment created two groups of students without systematic over-all differences in background characteristics and prior school experiences. The pattern of response rates for each of the data sources preserves this feature of the research design. The lack of sys-tematic differences between the Academy and non-Academy research groups is also preserved within each of the risk subgroups that are used throughout the report.
195
PR/Award # S165A200036
Page e336

-104-
Table A.2
Career Academies Evaluation
Regression Coefficients for Probability of Being Assigned to the Academy Groupfor Full Study Sample and by Risk Subgroups
Full Study Sample High-Risk Subgroup Medium-Risk Subgroup Low-Risk SubgroupParameter Parameter Parameter ParameterEstimate Estimate Estimate Estimate
Variable (Standard Error) (Standard Error) (Standard Error) (Standard Error)
Intercept 0.047 -0.685 0.676 2.363(0.383) (0.682) (0.734) (1.689)
Sites Site 1 -0.052 -0.277 ** 0.114 -0.083
(0.072) (0.139) (0.110) (0.153) Site 2 -0.071 -0.251 * -0.004 -0.127
(0.081) (0.149) (0.121) (0.204) Site 3 0.034 -0.132 0.028 0.022
(0.093) (0.199) (0.134) (0.237) Site 4 -0.093 -0.207 -0.088 -0.019
(0.091) (0.157) (0.138) (0.284) Site 5 -0.008 0.024 -0.032 -0.024
(0.060) (0.100) (0.093) (0.146) Site 6 -0.011 0.000 0.085 -0.236 *
(0.055) (0.097) (0.084) (0.126) Site 7 0.006 -0.086 0.056 0.045
(0.047) (0.086) (0.071) (0.103) Site 8 0.023 -0.031 0.019 0.034
(0.045) (0.092) (0.068) (0.096)
Expected graduation year 1996 0.018 -0.021 0.045 -0.038
(0.038) (0.082) (0.055) (0.080) 1997 0.015 -0.069 0.025 0.015
(0.033) (0.077) (0.045) (0.065)(continued)
196
PR/Award # S165A200036
Page e337

-105-
Table A.2 (continued)
Full Study Sample High-Risk Subgroup Medium-Risk Subgroup Low-Risk SubgroupParameter Parameter Parameter ParameterEstimate Estimate Estimate Estimate
Variable (Standard Error) (Standard Error) (Standard Error) (Standard Error)
In 8th
grade at application to Academy 0.043 0.082 -0.023 0.192(0.076) (0.136) (0.109) (0.212)
Female -0.023 0.043 -0.051 -0.021(0.025) (0.051) (0.036) (0.053)
Age at application to Academy 0.045 ** 0.092 ** 0.009 0.047(0.023) (0.042) (0.033) (0.049)
Race/ethnicity Hispanic 0.032 0.147 -0.023 0.054
(0.053) (0.119) (0.073) (0.110) African-American 0.104 0.251 * 0.015 0.132
(0.068) (0.141) (0.099) (0.142) Asian/Native American 0.073 0.094 0.059 0.168
(0.069) (0.148) (0.099) (0.145)
Average 8th
-grade math test percentile 0.000 0.000 -0.001 0.001(0.001) (0.002) (0.001) (0.002)
Missing 8th
-grade math test score 0.168 0.102 0.437 * 0.060(0.139) (0.239) (0.257) (0.252)
Average 8th-grade reading test percentile 0.001 -0.002 0.002 * 0.001(0.001) (0.002) (0.001) (0.002)
Missing 8th-grade reading test score -0.185 0.000 -0.385 -0.074(0.140) (0.239) (0.258) (0.252)
Has sibling who dropped out -0.021 0.007 -0.025 -0.505(0.031) (0.053) (0.053) (0.372)
Is overage for grade level -0.034 -0.049 -0.014 0.205(0.038) (0.067) (0.060) (0.184)
(continued)
197
PR/Award # S165A200036
Page e338

-106-
Table A.2 (continued)
Full Study Sample High-Risk Subgroup Medium-Risk Subgroup Low-Risk SubgroupParameter Parameter Parameter ParameterEstimate Estimate Estimate Estimate
Variable (Standard Error) (Standard Error) (Standard Error) (Standard Error)
Transferred school 2 or more times -0.015 -0.016 -0.009 0.188(0.028) (0.051) (0.047) (0.252)
Attendance rate -0.002 -0.003 -0.001 -0.024 *(0.002) (0.003) (0.005) (0.013)
Credits earned 0.000 0.000 -0.049 0.006(0.014) (0.019) (0.041) (0.085)
Grade point average 0.006 0.046 0.028 -0.107(0.023) (0.044) (0.040) (0.070)
Sample size 1,764 474 869 421Degree of freedom 26 26 26 26Mean of dependent variable 0.544 0.544 0.542 0.546R-square 0.008 0.038 0.021 0.049F-statistic 0.506 0.684 0.691 0.785p-value of F-statistic 0.982 0.879 0.875 0.767
SOURCES: MDRC calculations from Career Academies Evaluation Student Baseline Questionnaire Database and Student School Records Database.
NOTE: The statistical significance of parameter estimates is indicated as *** = 1 percent; ** = 5 percent; * = 10 percent.
198
PR/Award # S165A200036
Page e339

-107-
Table A.3
Career Academies Evaluation
Regression Coefficients for Probability of Being Assigned to the Academy Group,Student School Records Database,
for Full Study Sample and by Risk Subgroups
Full Study Sample High-Risk Subgroup Medium-Risk Subgroup Low-Risk SubgroupParameter Parameter Parameter ParameterEstimate Estimate Estimate Estimate
Variable (Standard Error) (Standard Error) (Standard Error) (Standard Error)
Intercept 0.070 -0.599 0.800 1.392(0.440) (0.837) (0.813) (1.790)
Sites Site 1 -0.019 -0.215 0.137 -0.139
(0.081) (0.168) (0.118) (0.168) Site 2 0.037 -0.078 0.057 -0.101
(0.090) (0.181) (0.128) (0.219) Site 3 0.118 0.175 -0.026 0.098
(0.104) (0.243) (0.146) (0.253) Site 4 -0.035 -0.080 -0.077 0.015
(0.100) (0.189) (0.145) (0.292) Site 5 -0.002 0.071 -0.040 0.011
(0.066) (0.119) (0.099) (0.150) Site 6 0.010 0.075 0.119 -0.250 *
(0.062) (0.117) (0.093) (0.131) Site 7 0.015 -0.063 0.031 0.090
(0.053) (0.102) (0.078) (0.109) Site 8 0.020 -0.008 -0.006 0.086
(0.051) (0.115) (0.076) (0.102)Expected graduation year 1996 0.060 0.039 0.065 0.034
(0.042) (0.100) (0.060) (0.084) 1997 0.033 -0.046 0.028 0.046
(0.036) (0.093) (0.051) (0.068)(continued)
199
PR/Award # S165A200036
Page e340

-108-
Table A.3 (continued)
Full Study Sample High-Risk Subgroup Medium-Risk Subgroup Low-Risk SubgroupParameter Parameter Parameter ParameterEstimate Estimate Estimate Estimate
Variable (Standard Error) (Standard Error) (Standard Error) (Standard Error)
In 8th grade at application to Academy -0.027 -0.135 -0.044 0.282(0.083) (0.159) (0.115) (0.225)
Female -0.013 0.028 -0.018 -0.016(0.028) (0.061) (0.040) (0.055)
Age at application to academy 0.032 0.055 0.007 0.056(0.025) (0.051) (0.037) (0.052)
Race/ethnicity Hispanic 0.003 0.220 -0.094 0.008
(0.061) (0.143) (0.085) (0.119) African-American 0.050 0.290 * -0.105 0.129
(0.078) (0.164) (0.113) (0.160) Asian/Native American 0.048 0.174 0.003 0.121
(0.079) (0.180) (0.112) (0.153)
Average 8th
-grade math test percentile 0.000 -0.001 -0.001 0.003(0.001) (0.002) (0.001) (0.002)
Missing 8th
-grade math test score 0.224 0.109 0.449 * 0.173(0.151) (0.312) (0.257) (0.256)
Average 8th
-grade reading test percentile 0.000 -0.001 0.001 0.000(0.001) (0.002) (0.001) (0.002)
Missing 8th
-grade reading test score -0.248 -0.250 -0.399 -0.177(0.152) (0.313) (0.259) (0.256)
Has sibling who dropped out -0.008 0.027 -0.040 -0.463(0.034) (0.065) (0.056) (0.496)
Is overage for grade level -0.016 -0.020 -0.002 0.131(0.043) (0.079) (0.068) (0.193)
(continued)
200
PR/Award # S165A200036
Page e341

-109-
Table A.3 (continued)
Full Study Sample High-Risk Subgroup Medium-Risk Subgroup Low-Risk SubgroupParameter Parameter Parameter ParameterEstimate Estimate Estimate Estimate
Variable (Standard Error) (Standard Error) (Standard Error) (Standard Error)
Transferred school 2 or more times -0.017 -0.077 0.015 0.076(0.032) (0.062) (0.052) (0.289)
Attendance rate 0.000 0.001 -0.002 -0.019(0.002) (0.004) (0.005) (0.014)
Credits earned 0.000 -0.004 -0.043 0.063(0.017) (0.026) (0.045) (0.091)
Grade point average -0.006 0.061 0.031 -0.135 *(0.027) (0.057) (0.043) (0.074)
Sample size 1,454 345 724 385Degree of freedom 26 26 26 26Mean of dependent variable 0.538 0.536 0.543 0.530R-square 0.008 0.047 0.029 0.060F-statistic 0.432 0.601 0.797 0.881p-value of F-statistic 0.995 0.940 0.754 0.636
SOURCES: MDRC calculations from Career Academies Evaluation Student Baseline Questionnaire Database and Student School Records Database.
NOTE: The statistical significance of parameter estimates is indicated as *** = 1 percent; ** = 5 percent; * = 10 percent.
201
PR/Award # S165A200036
Page e342

-110-
Table A.4
Career Academies Evaluation
Regression Coefficients for Probability of Being Assigned to the Academy Group,12th Grade Survey Database,
for Full Study Sample and by Risk Subgroups
Full Study Sample High-Risk Subgroup Medium-Risk Subgroup Low-Risk SubgroupParameter Parameter Parameter ParameterEstimate Estimate Estimate Estimate
Variable (Standard Error) (Standard Error) (Standard Error) (Standard Error)
Intercept -0.224 -1.142 0.585 1.964(0.430) (0.799) (0.802) (1.768)
Sites Site 1 0.004 -0.168 0.144 -0.020
(0.079) (0.161) (0.121) (0.160) Site 2 -0.033 -0.180 0.008 -0.059
(0.088) (0.168) (0.127) (0.230) Site 3 0.075 -0.087 0.089 0.061
(0.100) (0.224) (0.142) (0.261) Site 4 -0.057 -0.105 -0.127 -0.016
(0.099) (0.183) (0.146) (0.287) Site 5 -0.010 -0.042 0.002 -0.026
(0.066) (0.118) (0.100) (0.150) Site 6 -0.010 -0.015 0.092 -0.244 *
(0.061) (0.115) (0.092) (0.130) Site 7 -0.005 -0.154 0.058 0.052
(0.051) (0.099) (0.076) (0.106) Site 8 -0.003 -0.173 -0.006 0.067
(0.050) (0.109) (0.073) (0.101)Expected graduation year 1996 0.052 0.086 0.065 -0.006
(0.041) (0.096) (0.059) (0.083) 1997 0.042 -0.002 0.030 0.056
(0.035) (0.089) (0.049) (0.067)(continued)
202
PR/Award # S165A200036
Page e343

-111-
Table A.4 (continued)
Full Study Sample High-Risk Subgroup Medium-Risk Subgroup Low-Risk SubgroupParameter Parameter Parameter ParameterEstimate Estimate Estimate Estimate
Variable (Standard Error) (Standard Error) (Standard Error) (Standard Error)
In 8th
grade at application to Academy 0.019 0.064 -0.037 0.141(0.082) (0.153) (0.115) (0.240)
Female -0.045 -0.007 -0.052 -0.032(0.027) (0.059) (0.039) (0.055)
Age at application to Academy 0.053 ** 0.102 ** 0.010 0.062(0.025) (0.048) (0.036) (0.052)
Race/ethnicity Hispanic 0.049 0.241 * -0.037 0.074
(0.057) (0.131) (0.079) (0.115) African-American 0.108 0.275 * -0.001 0.156
(0.073) (0.152) (0.107) (0.147) Asian/Native American 0.063 0.166 -0.004 0.191
(0.075) (0.167) (0.107) (0.148)
Average 8th
-grade math test percentile -0.001 -0.002 -0.001 0.002(0.001) (0.002) (0.001) (0.002)
Missing 8th
-grade math test score 0.120 0.294 0.408 -0.190(0.195) (0.522) (0.298) (0.326)
Average 8th
-grade reading test percentile 0.001 0.000 0.002 * 0.000(0.001) (0.002) (0.001) (0.002)
Missing 8th
-grade reading test score -0.150 -0.446 -0.383 0.218(0.196) (0.527) (0.299) (0.324)
Has sibling who dropped out -0.015 0.003 -0.021 -0.600(0.034) (0.060) (0.057) (0.373)
Is overage for grade level -0.059 -0.072 -0.045 0.104(0.041) (0.077) (0.064) (0.192)
(continued)
203
PR/Award # S165A200036
Page e344

-112-
Table A.4 (continued)
Full Study Sample High-Risk Subgroup Medium-Risk Subgroup Low-Risk SubgroupParameter Parameter Parameter ParameterEstimate Estimate Estimate Estimate
Variable (Standard Error) (Standard Error) (Standard Error) (Standard Error)
Transferred school 2 or more times 0.005 0.007 -0.001 0.046(0.030) (0.059) (0.050) (0.287)
Attendance rate 0.000 0.001 0.000 -0.024(0.002) (0.003) (0.005) (0.014)
Credits earned -0.009 -0.016 -0.051 0.027(0.016) (0.024) (0.044) (0.089)
Grade point average 0.016 0.076 0.040 -0.101(0.026) (0.054) (0.043) (0.072)
Sample size 1,510 366 755 389Degree of freedom 26 26 26 26Mean of dependent variable 0.548 0.552 0.539 0.560R-square 0.099 0.053 0.025 0.057F-statistic 0.571 0.729 0.712 0.839p-value of F-statistic 0.959 0.832 0.854 0.696
SOURCES: MDRC calculations from Career Academies Evaluation Student Baseline Questionnaire Database, Student School Records Database, and 12th Grade Survey Database.
NOTE: The statistical significance of parameter estimates is indicated as *** = 1 percent; ** = 5 percent; * = 10 percent.
204
PR/Award # S165A200036
Page e345

-113-
Table A.5
Career Academies Evaluation
Regression Coefficients for Probability of Being Assigned to the Academy Group,12th Grade Achievement Test Sample,
for Full Study Sample and by Risk Subgroups
Full Study Sample High-Risk Subgroup Medium-Risk Subgroup Low-Risk SubgroupParameter Parameter Parameter ParameterEstimate Estimate Estimate Estimate
Variable (Standard Error) (Standard Error) (Standard Error) (Standard Error)
Intercept 0.303 6.726 3.132 ** 1.228(0.760) (9.781) (1.475) (2.787)
Sites Site 1 0.168 -0.088 0.294 -0.081
(0.138) (0.335) (0.196) (0.343) Site 2 0.162 -0.027 0.020 -0.013
(0.145) (0.367) (0.199) (0.388) Site 3 0.123 0.184 0.052 -0.252
(0.149) (0.352) (0.209) (0.431) Site 4 0.036 -0.120 -0.104 -0.032
(0.153) (0.389) (0.215) (0.432) Site 5 -- -- -- --
Site 6 -- -- -- --
Site 7 0.097 0.108 0.240 0.231(0.110) (0.247) (0.170) (0.228)
Site 8 0.035 -0.179 0.077 0.134(0.103) (0.307) (0.149) (0.217)
Expected graduation year 1996 -- -- -- --
1997 -- -- -- --
(continued)
205
PR/Award # S165A200036
Page e346

-114-
Table A.5 (continued)
Full Study Sample High-Risk Subgroup Medium-Risk Subgroup Low-Risk SubgroupParameter Parameter Parameter ParameterEstimate Estimate Estimate Estimate
Variable (Standard Error) (Standard Error) (Standard Error) (Standard Error)
In 8th
grade at application to Academy 0.030 0.156 -0.079 0.456(0.107) (0.207) (0.152) (0.343)
Female 0.002 -0.039 0.012 0.125(0.049) (0.114) (0.073) (0.098)
Age at application to Academy 0.023 0.159 * -0.055 -0.051(0.045) (0.092) (0.072) (0.091)
Race/ethnicity Hispanic -0.043 -8.717 -0.181 0.284
(0.151) (9.472) (0.180) (0.343) African-American -0.102 -8.610 -0.147 0.245
(0.188) (9.357) (0.231) (0.455) Asian/Native American -0.175 -9.347 -0.289 0.584
(0.306) (9.577) (0.427) (0.712)
Average 8th
-grade math test percentile -0.002 0.000 -0.004 * 0.001(0.001) (0.004) (0.002) (0.003)
Missing 8th
-grade math test score 0.209 0.528 0.344 0.098(0.238) (0.570) (0.380) (0.439)
Average 8th
-grade reading test percentile 0.003 * 0.001 0.003 0.003(0.001) (0.004) (0.002) (0.003)
Missing 8th
-grade reading test score -0.185 -0.742 -0.280 0.204(0.243) (0.601) (0.376) (0.453)
Has sibling who dropped out 0.014 -0.042 0.084 -0.801 *(0.061) (0.118) (0.100) (0.427)
Is overage for grade level 0.026 0.005 0.039 2.770(0.079) (0.154) (0.123) (2.509)
(continued)
206
PR/Award # S165A200036
Page e347

-115-
Table A.5 (continued)
Full Study Sample High-Risk Subgroup Medium-Risk Subgroup Low-Risk SubgroupParameter Parameter Parameter ParameterEstimate Estimate Estimate Estimate
Variable (Standard Error) (Standard Error) (Standard Error) (Standard Error)
Transferred school 2 or more times -0.050 -0.034 -0.048 -0.513(0.059) (0.111) (0.091) (0.505)
Attendance rate 0.000 0.000 0.000 0.0000.000 0.000 0.000 0.000
Credits earned -0.015 -0.039 -0.138 * 0.228(0.029) (0.043) (0.079) (0.141)
Grade point average -0.009 0.022 0.059 -0.186(0.049) (0.140) (0.077) (0.126)
Sample size 490 110 233 147Degree of freedom 22 22 22 22Mean of dependent variable 0.545 0.573 0.532 0.544R-square 0.027 0.144 0.095 0.123F-statistic 0.568 0.667 0.997 0.792p-value of F-statistic 0.926 0.860 0.470 0.731
SOURCES: MDRC calculations from Career Academies Evaluation Student Baseline Questionnaire Database, Student School Records Database, and 12th Grade Achievement Test Database.
NOTE: The statistical significance of parameter estimates is indicated as *** = 1 percent; ** = 5 percent; * = 10 percent.
207
PR/Award # S165A200036
Page e348

-116-
Appendix B
Strategies for Creating Subgroups of Students Defined by Characteristics Associated with Risk
of Dropping Out
208
PR/Award # S165A200036
Page e349

-117-
Much of the analysis presented in this report focuses on subgroups of students defined by background characteristics and prior school experiences associated with dropping out of high school. This appendix explains the manner in which these subgroups were created, including the rationale behind this strategy and the implications it has for interpreting the findings presented in this report.
I. Analytic Importance of Subgroup Analysis
A central theme that has emerged from the Career Academies Evaluation thus far is that in order to understand the impact of the programs, it is important to recognize the heterogeneity of the student population and the likelihood that some groups of students may benefit differently than others. As discussed in Chapter 3, when the impact results are averaged across the diverse groups of students the Career Academies served, it appears that the programs produced only slight reductions in dropout rates and modest improvements in students’ progress toward gradua-tion and increases in participation in youth development activities. These aggregate results mask the high degree of variation in the Career Academies’ potential to make a difference and in the actual differences they made for some students. In short, findings that are aggregated across the diverse groups of students served by the Academies are unlikely to reveal many of the most im-portant effects that Academies have. Positive effects for some subgroups of students may be off-set or muted by small or zero impacts for other subgroups.
For example, an important goal of the Career Academies is to reduce dropout rates and increase students’ engagement in school. As noted earlier in the evaluation, Career Academies serve a broad cross section of students, many of whom enter the programs highly engaged in school. It is unlikely that the programs will have an effect on dropout rates among these students, who are highly unlikely to drop out of school even if they do not attend an Academy. On the other hand, a number of students in the sample who applied for the Academies were relatively dis-engaged from high school and appeared to be at risk of dropping out of high school. To the extent that the Academies can have an effect on dropout rates, it is likely to be concentrated among these students. The magnitude of this effect could be diluted or even completely hidden if aver-aged with the lack of impact for the rest of the students in the sample.
In order to assess the effect of the Academies more sensitively, therefore, it was necessary to differentiate among students with different needs and trajectories at the time they entered the Academy. The attempt to make distinctions among groups of individuals with different needs and characteristics, who might experience substantially different benefits from an intervention, is not uncommon to experimental research in general or to education research in particular. An impor-tant goal of these subgroup strategies is often to make distinctions among groups of individuals who, in the absence of the treatment under study, would have experienced substantially different outcomes.
The random assignment research design used in this evaluation provides a unique oppor-tunity to identify subgroups of students who, without access to an Academy, were relatively highly likely to drop out of high school and to compare them with similar students who did have access to an Academy. The use of the random assignment research design is relatively rare in the context of large-scale evaluations of education programs, particularly at the secondary school level. Not only does such a design provide the unusual opportunity to establish which outcomes would have been observed in the absence of the Academy treatment, but it also provides an op-
209
PR/Award # S165A200036
Page e350

-118-
portunity to observe the relationships between background characteristics and important out-comes in the absence of the intervention.
There are several strategies for identifying subgroups. The following section describes a more traditional approach and highlights several limitations that led to the use of a strategy that provides greater insight into the variation in program effects.
II. Traditional Approach to Defining Subgroups: Risk-Factor Accumulation
One of the strategies most frequently used to define subgroups might be called “risk-factor accumulation.” It entails first identifying a list of background characteristics typically associated with an important outcome or with the manner in which the program treatment is likely to be de-livered. A critical outcome for many high school interventions, including the Career Academy’s approach, is dropping out of high school. A number of education research studies have identified several background characteristics and prior school experiences that are associated with a high likelihood of dropping out of high school. This includes prior school experiences such as poor at-tendance, low grades, or being held back in a previous grade. It also includes demographic char-acteristics such as being from a low-income family, having a sibling who dropped out, or having moved and transferred schools several times.
The risk-factor accumulation strategy classifies students into risk subgroups by counting the number of risk factors an individual has, weighting all the factors equally. For example, if one identified six characteristics associated with dropping out, individuals with two or more of these characteristics might be considered to be at “high risk” of dropping out; those with only one of the characteristics might be considered to be at “moderate” or “medium” risk of dropping out; and those with none of the characteristic factors might be considered at “low risk.”
This strategy has the appeal of being straightforward in execution, and it can be translated directly into a strategy for targeting students to receive special services. For example, if a particu-lar school intervention were found to prevent students in the high-risk subgroup from dropping out, teachers or administrators might wish to ensure that students with two or more of the risk characteristics be included in that program.
At the same time, the accumulation strategy has several important limitations. First, such an analysis gives equal weight to each of the risk-related background characteristics and prior school experiences examined. As a result, it does not account for the fact that some characteristics are more highly associated with school failure than others. This strategy also does not account for the fact that some characteristics are associated with school success and may offset the risk asso-ciated with other characteristics. As a result, it fails to account for the possibility that, given the same number of risk factors, different combinations of characteristics may indicate different de-grees of risk. In other words, because some characteristics are more strongly associated with aca-demic outcomes than others, students with the same number of characteristics may actually be substantially more or less likely than one another to drop out of high school. Finally, this strategy is based on categorical variables and is therefore unable to take advantage of the more subtle dis-tinctions among students that are captured by continuous variables.
210
PR/Award # S165A200036
Page e351

-119-
Because it does not allow for a more complex set of relationships between risk factors and student outcomes, the simple risk-factor accumulation strategy may fail to produce subgroups with distinctly different academic trajectories. Therefore, in order to distinguish more effectively among subgroups of students who, in the absence of the program, would have experienced dis-tinctly different outcomes, the Career Academies Evaluation employed an imputation strategy for identifying subgroups. This is referred to throughout this report as a regression-based subgroup strategy.
III. Regression-Based Subgroup Strategy
A. Overview of the Approach
The basic idea behind the regression-based subgroup strategy is to build on the opportu-nity created by the random assignment experimental design in order to identify the relationships between background characteristics and student failure in the absence of the Academy interven-tion. Based on these relationships, one then identifies the characteristics of the students who, in the absence of the program, are most likely to drop out of high school.
The regression-based strategy involves three steps. The first step is to use multiple regression to estimate the relationship between several background characteristics measured at the time students applied to the Academy and the probability that they would drop out of high school before the end of the 12th grade. The background characteristics included in the Career Academies Evaluation are:
• average daily attendance in the year the student applied for an Academy;
• grade point average for the year the student applied for an Academy;
• the number of credits earned toward graduation in the year the student applied for an Academy;
• whether the student was overage for grade when entering the Academy;
• whether the student had a sibling who dropped out of high school; and
• whether the student had transferred schools two or more times beyond the typical school transitions.
The goal of this analysis is to capitalize on the experimental design and estimate the rela-tionships between background characteristics and dropping out of high school in the absence of access to an Academy. The random assignment research design ensures that the non-Academy group provides the best counterfactual for what would have occurred to students in the absence of access to an Academy. Thus, the non-Academy group was used as the basis for this regression. Table B.1 presents the results of this regression analysis. The first column of parameter estimates reflects the relationship between the dropout rate and a unit change in the background characteris-tics. Numbers in the second column are standardized to reflect the relationship between the drop-out rate and a standard deviation change in the background characteristics. As the table suggests, all the characteristics included in this regression model are statistically significant and are
211
PR/Award # S165A200036
Page e352

-120-
Table B.1
Career Academies Evaluation
Relationship Between Baseline Characteristics and the Probability of Dropping Outof High School Among Non-Academy Students
CoefficientsBaseline Characteristic Unstandardized Standardized
Sibling dropped out 0.08 *** 0.03 ***(0.03) (0.01)
Overage for grade 0.06 ** 0.02 **(0.03) (0.01)
Transferred schools 2 or more times 0.07 *** 0.03 ***(0.03) (0.01)
Attendance rate in year of random assignment -0.01 *** -0.04 ***(0.00) (0.01)
Credits earned in year of random assignment -0.05 *** -0.05 ***(0.01) (0.01)
Grade point average in year of random assignment -0.03 * -0.02 *(0.02) (0.01)
Intercept 0.94 *** 0.12 ***(0.14) -(0.14)
R-squared 0.10 0.10
Sample size 763 763
SOURCES: MDRC calculations from Student Baseline Questionnaire Database and Student School Records Database.
NOTES: Estimates are regression-adjusted using ordinary least squares, controlling for background characteristics of sample members. Rounding may cause slight discrepancies in calculating differences. A two-tailed t-test was applied to differences between the Academy and non-Academy groups. In both cases, statistical significance levels are indicated as *** = 1 percent; ** = 5 percent; * = 10 percent.
related to the probability that students would drop out of high school before the end of the 12th grade.3
The second step in this analysis is to combine the coefficients from the regression esti-mates for the non-Academy sample with the background characteristics of each individual in both
3Other specifications of this model were tried. However, through an informal process of model specification,
this six-variable model was found to be the most sensible and effective. The estimates (below) of the potential dis-tortion caused by the regression-based approach do not take into account any effects of the model specification pro-cess on the impact estimates.
212
PR/Award # S165A200036
Page e353

-121-
the Academy and the non-Academy groups. In other words, the coefficient estimates from the regres-sion are used as weights multiplied by the relevant measured background characteristics of each indi-vidual. The weighted sum of these characteristics yields an index indicating the probability of dropping out of high school. This is referred to as the risk index, and it provides a basis for ranking sample mem-bers according to the predicted probability that they would drop out of high school.
For example, the parameter estimate associated with having a sibling who dropped out of school is .08 (that is, controlling for other background characteristics, students in the evaluation who had a sibling who already dropped out of high school were predicted to be 8 percentage points more likely to drop out of high school). Therefore, students with siblings who dropped out had .08 added to the index measuring their own risk of dropping out. By the same token, the re-gression estimates indicate that some characteristics are negatively correlated with dropping out. The weights assigned to these characteristics were multiplied by individual attributes and sub-tracted from the risk index.
In the third step of this regression analysis, the Academy and non-Academy students are divided into three subgroups based on the risk index. Following is a brief definition of each of the three risk subgroups.
• The high-risk subgroup: the students in the Academy and non-Academy groups with the combination of characteristics yielding scores at or above the 75th percentile of scores on the risk index (that is, those with the highest likelihood of dropping out)
• The low-risk subgroup: the students in the Academy and non-Academy groups with the combination of characteristics yielding scores at or below the 25th percentile of scores on the risk index (that is, those with the lowest likelihood of dropping out)
• The medium-risk subgroup: the remaining students in the Academy and non-Academy groups (approximately 50 percent of the study sample) with a mix of characteristics yielding scores between the 25th and 75th percentile on the risk index (that is, indicating they were not particularly likely to drop out but not necessarily highly engaged in school)4
B. Strengths of the Regression-Based Strategy
There are several important advantages to the regression-based strategy for defining sub-groups. First, it incorporates factors which are both conceptually and empirically related to stu-dents’ risk of dropping out of high school. At the same time, because these characteristics were measured prior to students’ random assignment to the Academy and non-Academy groups, they are exogenous to the Academy treatment. In other words, while the background characteristics used to create the subgroups were correlated with the likelihood of dropping out, these character-istics did not influence the selection of students into the Academy group.
4The 25th and 75th percentile cutoffs were based on the distribution of the risk index among the non-Academy
students.
213
PR/Award # S165A200036
Page e354

-122-
An important question for such an impact analysis is whether, within each subgroup, the random assignment research design is preserved. In other words, are there systematic differences between the background characteristics of the Academy and non-Academy students within each subgroup? To test this, a set of background characteristics is regressed against a dummy variable indicating whether the student was assigned to the Academy group. Appendix A presents the re-sults of this analysis, which revealed that while there are a few differences between the back-ground characteristics of Academy and non-Academy students within each subgroup, f-tests failed to reject the hypothesis that there are no overall systematic differences between the background characteristics of the Academy and non-Academy students. This suggests that the random as-signment research design was preserved within each subgroup. In other words, the existing differ-ences are not greater than those which would be expected to occur by chance.
A second strength of this approach is that it incorporates the fact that the relationships be-tween “risk factors” and student outcomes vary, depending on the background characteristic. For example, the coefficient estimates suggest that the effect of the number of credits earned in the year prior to random assignment and the effect of baseline attendance on the dropout rate are each at least twice as large as the effect of a student’s baseline grade point average or whether a student was overage for grade.5 Basing the subgroup definitions on these relationships allows these differences to be factored into the classification of students into the three risk subgroups. For example, these regression estimates suggest that an average student who had a sibling who had dropped out and who was overage for grade would have approximately a 24 percent chance of dropping out of high school before the end of the 12th grade. However, if that same student also had 98 percent attendance and was about a standard deviation above the average in terms of credits earned, he or she would have only a 16 percent chance of dropping out.6
Moreover, the regression-based strategy is capable of incorporating variation across stu-dents along continuous variables such as attendance and grade point average. Less flexible strate-gies that fail to incorporate these factors would not be as effective at distinguishing among stu-dents at different levels of academic risk. For example, an otherwise average student with perfect attendance (that is, 100 percent) has a 9 percent chance of dropping out; a similar student with an attendance rate of 95 percent has a 12 percent chance of dropping out; a student with a 90 per-cent attendance rate has a 15 percent chance of dropping out; and one with 85 percent attendance has a 17 percent chance of dropping out. In other words, there appears to be meaningful variation in the probability of dropping out that would not be captured by a simple categorical measure of attendance. The regression-based subgroup strategy captures such variation and incorporates it into the assessment of each student’s risk of school failure.
The third and perhaps most important strength of the regression-based strategy is that it effectively identifies students with distinct academic trajectories. Figure B.1 presents the dropout rates for Academy and non-Academy students, as well as the difference between their dropout
5Note that these coefficients have been standardized to reflect the effect of a standard deviation change in the
independent variable on the dropout rate, thus making the coefficient estimates directly comparable with one an-other.
6The predicted probability of dropping out for the average student was estimated by multiplying the mean val-ues of the independent variables among the students in the study sample by the coefficients in Table B.1. The esti-mated probabilities for students with the hypothesized characteristics were estimated by substituting the hypothe-sized values for the mean values where appropriate.
214
PR/Award # S165A200036
Page e355

-123-
Figure B.1
Impact of Career Academies on Dropout Rate, by Deciles of theRegression-Based Risk Index
-20%
-10%
0%
10%
20%
30%
40%
0-10 10-20 20-30 30-40 40-50 50-60 60-70 70-80 80-90 90-100
Deciles of the Regression-Based Risk Index
Dro
pout
Rat
e (%
)
Non-Academy Group
Academy Group
Impact
0-10 10-20 20-30 30-40 40-50 50-60 60-70
70-80
80-9090-100
SOURCES: MDRC calculations from Career Academies Evaluation Student School Records Database and 12th Grade Survey Database.
215
PR/Award # S165A200036
Page e356

-124-
rates, at 10 percentile intervals on the regression-based risk index. The black bars represent the percentage of non-Academy students who dropped out of high school, and the white bars repre-sent the percentage of Academy students who did so. The striped bars represent the difference between these two groups, that is, the impact of the Academy treatment on dropout rates. The pattern in this figure suggests that the risk index very effectively differentiates among students with different academic trajectories, and that the relationship between risk and the impact of Academies on dropout rates is not isolated to a small segment of the student population.
The figure indicates that both the risk of dropping out and the impact of the program on this outcome generally increase with the percentiles of the risk index. In particular, the dropout rate among the non-Academy group appears to increase steadily with the percentiles of the risk index, and it grows sharply after the 70th percentile. The impact on the dropout rate follows essen-tially the same pattern. From the 30th percentile through the 90th, the difference between the Academy and non-Academy groups becomes increasingly negative. The magnitude of this reduc-tion in dropout rates appears to increase dramatically after the 70th percentile, and then it shrinks slightly among students above the 90th percentile of risk. This pattern suggests that, for the indi-viduals with low to moderate risk of dropping out, the impact of the program on dropout rates appears to be rather negligible. However, as the risk of academic failure becomes more serious, the impact of the Academy approach appears to grow. Finally, for those at greatest risk, the im-pact on dropout rates is substantial, but it is not as great as for those who are slightly less at risk.
In short, this graph illustrates that the regression-based strategy is quite effective at differ-entiating among students with different degrees of Academic risk, and that the impact of the Academies on the dropout rate is strongly related to this definition of academic risk.
Table B.2 illustrates that the regression-based strategy is effective at differentiating among students with different trajectories across a variety of school outcomes, and that it is more effec-tive than the risk-factor accumulation strategy for making these distinctions. The table presents several key measures of student performance during high school for the non-Academy students within each risk subgroup. The first panel of the table presents non-Academy outcome levels and estimated impacts based on the risk-factor accumulation approach, and the second panel presents these estimates based on the regression-based approach to defining subgroups. As the table illus-trates, the regression-based strategy does a better job of making distinctions among students with different levels of academic risk.
According to the estimates generated by the regression-based approach, while 32 percent of the non-Academy students in the high-risk subgroup dropped out of high school before the end of the 12th grade, 8 percent in the medium-risk subgroup dropped out, and less than 3 percent in the low-risk subgroup did so. Moreover, while only 27 percent of the non-Academy students in the high-risk subgroup earned enough credits to graduate from high school, 65 percent in the me-dium-risk subgroup and 75 percent in the low-risk subgroup did so. Similar patterns were found for most other measures as well. This indicates that, without access to a Career Academy, the students in the different risk subgroups would have had substantially different outcomes.
Table B.2 also provides outcome levels and estimated impacts for subgroups based on the risk-factor accumulation approach. Not surprisingly, these estimates are not as distinct from one another as the estimates generated by the regression-based approach. For example, 22 percent of
216
PR/Award # S165A200036
Page e357

-125-
Table B.2
Career Academies Evaluation
Selected Outcomes Among Non-Academy Students,by Risk Subgroups Defined Using Risk-Factor
Accumulation and Regression-Based Index
Accumulation Approach Regression-Based ApproachNon-Academy Non-Academy
Outcome Outcomes (%) Impact Outcomes (%) Impact
High-risk subgroup
Dropped out of high school 27.4 -5.6 * 32.3 -11.4 ***
Earned credits to graduate 34.1 10.0 ** 27.0 12.8 ***
Completed basic academic core 9.9 9.1 * 5.6 8.0 *
Reported any negative risk-taking 36.9 -5.9 38.9 -3.8
Reported positive youth development 56.8 8.7 * 54.9 8.0
Medium-risk subgroup
Dropped out of high school 9.3 -2.0 7.9 0.9
Earned credits to graduate 66.2 -0.6 64.8 0.8
Completed basic academic core 31.0 -2.7 30.3 -1.2
Reported any negative risk-taking 23.1 0.5 25.7 -2.2
Reported positive youth development 67.5 4.1 69.7 1.6
Low-risk subgroup
Dropped out of high school 4.2 0.5 2.8 -1.2
Earned credits to graduate 69.5 8.4 ** 74.8 12.9 **
Completed basic academic core 33.9 0.9 36.6 4.5
Reported any negative risk-taking 22.0 -2.1 15.8 -1.0
Reported positive youth development 75.4 0.8 75.5 6.3
SOURCES: MDRC calculations from Career Academies Evaluation Student School Records Database and 12th Grade Survey Database.
NOTES: Estimates are regression-adjusted using ordinary least squares, controlling for background characteristics of sample members. Rounding may cause slight discrepancies in calculating differences. A two-tailed t-test was applied to differences between the Academy and non-Academy groups. In both cases, statistical significance levels are indicated as *** = 1 percent; ** = 5 percent; * = 10 percent.
217
PR/Award # S165A200036
Page e358

-126-
students in the “high-risk” subgroup dropped out of high school before the end of the 12th grade, compared with 7 percent in the “medium-risk” subgroup and 5 percent in the “low-risk” sub-group. Moreover, 44 percent in the “high-risk” subgroup earned enough credits to graduate, compared with 66 and 78 percent in the “medium-risk” and “low-risk” subgroups, respectively.
These patterns in outcome levels among students who weren’t exposed to the Academy treatment suggest that the regression-based strategy is the more effective means for defining sub-groups of Career Academy students with substantially different academic trajectories. Interest-ingly, the impact estimates suggest that while the estimates generated by the regression-based ap-proach tend to be somewhat larger, their pattern is similar to the pattern of estimates based on the risk-factor accumulation model. For example, among students in the high-risk subgroup, both the regression-based approach and the risk-factor accumulation approach found that Academies sig-nificantly reduced dropout rates, increased credits earned toward graduation, and increased the percentage of students who completed a core academic curriculum. So while the regression-based approach was more effective at identifying students who, in the absence of the Academy treat-ment, would have had substantially different outcomes, it did not distort the basic pattern of im-pacts generated by the experiment.
C. Potential Limitations of the Regression-Based Approach
While the regression-based strategy is more effective than the risk-factor accumulation strategy at identifying students who were likely to experience different academic trajectories in the absence of the Academy, it has some potentially important limitations. First, although it is more systematic, it is also less straightforward than the risk-accumulation strategy in terms of the man-ner by which subgroups of students might be identified by school administrators. In particular, to the extent that these subgroup findings might be used to target program resources toward particu-lar individuals, the subgroups defined using the regression-based strategy might be more difficult to identify than subgroups based on a simple accumulation approach. While it is unclear that the implications of the findings from this particular study suggest that targeting would be advanta-geous, such thinking may be a factor when applying this strategy to the study of programs in which the implications of targeting are less ambiguous. Although it is not discussed in this appen-dix, the regression-based approach can be applied in a practical way and may, in fact, be a more systematic way of targeting resources toward students most likely to benefit from them. For ex-ample, this type of approach has been used in research designed to develop approaches for the targeting of benefits and associated employment services to workers eligible for unemployment insurance as well as for targeting employment resources to individuals in welfare-to-work pro-grams. In particular, several of these programs have used historical data to estimate the relation-ship between background characteristics and policy-relevant outcomes, and then to combine these estimates with individual characteristics in order to predict outcomes and target services. This has been done in welfare-to-work programs in Michigan as well as in unemployment programs in Michigan, New Jersey, and Washington (O’Leary, Decker, and Wadner, 1998; Eberts, 1997).
A more important potential limitation of the regression-based subgroup strategy is related to the manner in which the strategy generates weights relating background characteristics to risk. In short, theoretically, the strategy has the potential to overstate any positive impacts of the pro-gram on the high-risk subgroup and to overstate the magnitude of any negative impacts on the low- and medium-risk subgroups.
218
PR/Award # S165A200036
Page e359

-127-
The problem has its genesis in the fact that the regression parameter estimates that are used as weights to translate student characteristics into academic risk are the result of estimates that are specific to the non-Academy group. In a sample from any population, estimated regres-sion coefficients reflect both the relationships that exist in the population and a random element that is specific to that sample. In other words, on average, each coefficient from such a random sample is unbiased. However, it is highly unlikely that, in any given sample, the estimated regres-sion coefficient will exactly equal the true regression coefficient from the entire population from which that sample is drawn. Therefore, the regression estimates from the non-Academy group in-clude some random error that is particular to the non-Academy group and that is correlated with the outcome in question — in this case, whether or not a student dropped out before the end of the 12th grade.
For example, Equation 1 is a simple regression predicting dropout from a set of back-ground characteristics for a sample of students drawn from the population of students who ap-plied to a Career Academy:
Y X ei i i= + +$ $α β (1)
where:
Yi = 1 if student i dropped out; 0 otherwise;
X i = 1 if student i had ever been held back; 0 otherwise (this could be any important background characteristic);
$α = the intercept term, that is, the average outcome (Yi ) among those where X = 0; and
$β = the estimated relationship between X i and Yi , that is, the estimated effect of X i on the probability that a student drops out of high school.
In this case, it would also be true that:
$β β β= + s (2)
where:
β = the true relationship between X and Y in the population from which our sample was drawn; and
β s = the difference (or error) between the relationship between X and Y in the population from which the sample was drawn and the relationship between X
219
PR/Award # S165A200036
Page e360

-128-
and Y in the sample, that is, the element of the estimate which is idiosyncratic to the particular sample.
While β is a characteristic of the population and does not change from sample to sample, β s is particular to the sample upon which the regression is estimated, and it will vary from sample
to sample. As a result, while β never changes, $β will vary from sample to sample. Furthermore, it is also highly unlikely that the random error in a coefficient estimated from one sample drawn from a population will be exactly the same as the random element in any other sample drawn from the same population.
The students in the Career Academies evaluation sample were assigned to the Academy or non-Academy groups at random; therefore, one can have a high degree of confidence that there are no systematic differences between these two groups in terms of observable or unobservable characteristics. They can be thought of as two random samples drawn from the same population of students at these sites who applied to and were eligible for the Career Academies. While the program may have changed the relationships between background characteristics and the prob-ability of dropping out, the underlying relationship between background characteristics and the likelihood of dropping out in the absence of the Academy intervention ( β ) is the same for these two groups.
However, even in the absence of the Academy program, it is unlikely that the estimated coefficients relating the background characteristics to the dropout rate among the students who ended up in the program group would have been exactly the same as those in the non-Academy group. In other words, while the underlying relationship between background characteristics and the probability of dropping out ( β ) would not vary across these two samples, the idiosyncratic element (or error term) of the estimated relationship ( β s ), and therefore the estimated relationship
itself ( $β ), would vary.
Therefore, it is highly unlikely that the estimated relationship between background charac-teristics and dropout would have been exactly the same among the Academy group as it was among their non-Academy group counterparts. Because the regression weights were generated from the non-Academy group, the regression-based strategy might more accurately distinguish among students with different levels of academic risk for this group than it does for the Academy group. In other words, the risk index might distinguish different levels of risk more effectively among non-Academy students that it does among Academy group students.
This creates the possibility that, although their observable characteristics were the same, students in the “high-risk” non-Academy group were actually more at risk than students in the “high-risk” Academy group. It also creates the possibility that students in the “low-risk” non-Academy group were actually less at risk than students in the “low-risk” Aademy group.
To the extent that this occurred, it would result in overstating positive impacts for the high-risk subgroups and overstating the magnitude of negative impacts for the “low-risk” sub-groups. However, as the next section will reveal, the magnitude of this potential distortion can be estimated. Furthermore, the magnitude of the distortion appears to be minimal, and it is not large enough to have a meaningful effect on the overall pattern of impact estimates.
220
PR/Award # S165A200036
Page e361

-129-
IV. Magnitude of Potential Distortion in the Regressions-Based Approach
In order to understand whether this potential limitation outweighs the analytic advantages of the regression-based approach discussed earlier, it is important to estimate the magnitude of the potential distortion.
Theoretically, in order to estimate the magnitude of this distortion, one would like to compare the outcomes of the students within each risk category in the non-Academy group with what would have been observed among the Academy students in the same risk subgroup in the absence of the treatment. However, because the Academy group received the treatment and the treatment may have actually affected these outcomes, this comparison cannot be made. The ideal basis for such a comparison would be a second non-Academy group that was neither used in or-der to estimate the dropout regression nor exposed to the program. In the absence of any distor-tion, one would expect that, within each risk subgroup, the outcomes for the students in this sam-ple would be identical to the outcomes for these in the original non-Academy group. Therefore, any differences between outcomes for these students and outcomes for the original non-Academy group could be confidently attributed to the distortion created by the regression-based strategy.
Although a second non-Academy group for this study is not available, a strategy for esti-mating the potential distortion in the original estimates is to use bootstrap sampling in order to simulate a second sample. Bootstrap sampling is commonly used to generate estimates of standard errors and other population characteristics from relatively small samples (Stine, 1990). It rests on the assumption that the sample from which the observations are drawn is representative of the population as a whole. In this case, to the extent that the initial non-Academy group can be thought of as representative of the population of students from whom the evaluation sample was drawn, bootstrap sampling procedures can be used to simulate new samples of non-Academy group students. Within each subgroup, these samples can be used in order to compare the out-comes for the students on whom the dropout regression was based with the outcomes for a sam-ple of students who were not included in this regression. These differences would constitute a re-liable estimate of the distortion created by the regression-based subgroup strategy.
The mechanics of this process are as follows:
1. Use a random number generator to draw a bootstrap sample of students the size of the original non-Academy group, sampling with replacement the observations from the original non-Academy group sample.
a. Use a random number generator to select an observation from the original non-Academy group.
b. Copy that observation to a new data set.
c. Replace that observation into the sampling frame from which it was drawn (the original non-Academy group sample).
d. Repeat steps a through c until the new sample equals the size of the original non-Academy group (n=805 times). This sample will be referred to as the model group.
221
PR/Award # S165A200036
Page e362

-130-
This creates a sample which is the same size as the original non-Academy sample and which, theoretically, is drawn from the same population.7 However, this sample is not the same as the non-Academy group, because steps a through d typically create a sample which omits several observations from the original sample and creates multiple copies of other observations.
2. Use this bootstrap sample to estimate the relationship between the six back-ground characteristics used to define academic risk and the probability that a student will drop out of high school prior to the end of the 12th grade.
3. Repeat steps 1a through 1d to draw (with replacement) a second bootstrap sample, the size of the Academy group, from the original non-Academy sam-ple. This sample will be referred to as the non-model group.
4. Repeat steps 1a through 1d once more, this time drawing from the Academy sample, to produce a bootstrap sample of students from each risk subgroup who received the Academy treatment. This sample will be referred to as the simulated Academy group.
5. Apply the coefficients from the regression model to the background character-istics of the individuals in all three bootstrap samples in order to create the risk index.
6. Use the 25th and 75th percentiles of the risk index in the first bootstrap sample (the model group) in order to divide the samples into high-, medium-, and low-risk subgroups.
7. Compare the average outcomes from the model group with those from the second bootstrap sample (the non-model group). The difference between the two groups represents the distortion created by the regression-based strategy.
8. Repeat steps 1 through 7 another 200 times. The average difference across these iterations between the subgroup outcomes for the model group and the non-model group provides a bootstrap estimate of the potential distortion cre-ated by the regression-based subgroup strategy. The average levels across these iterations among the simulated Academy group represents a bootstrap es-timate of the outcome levels among the Academy students.
Table B.3 presents the results of this estimation process for five key outcomes. The num-bers in this table represent the average outcomes of 200 iterations of the bootstrap process de-scribe above. As such, they are intended to simulate what one would expect to observe if one re-peated the experimental analysis contained in the report 200 times, with 200 different samples from the same population. The first column of the table presents the average outcomes among students from the bootstrap samples upon which the dropout regression was estimated (the model group). The numbers in this column represent the outcome levels one would expect to observe as
7In particular, this replaces the unknown theoretical distribution of the population from which the non-Academy group is drawn with the empirical distribution of the non-Academy sample itself.
222
PR/Award # S165A200036
Page e363

-131-
Table B.3
Career Academies Evaluation
Outcome Levels for Bootstrap Control Samples and Program Group,by Risk Subgroups
Model Non-Model Model Program Program ProgramGroup Group Minus Group Minus Minus
Outcome (%) (%) Non-Model (%) Model Non-Model
High-risk subgroup
Dropped out of high school 31 30.3 0.7 ** 20.7 -10.3 -9.6
Earned credits to graduate 28.5 28.6 -0.1 40.2 11.7 11.6
Completed basic academic core 7.3 7.2 0.1 15.3 8 8.1
Reported any negative risk-taking 39.5 39 0.5 32.9 -6.6 -6.1
Reported positive youth development 55.4 56.1 -0.7 * 64.5 9.1 8.4
Medium-risk subgroup
Dropped out of high school 8.4 8.9 -0.5 *** 9 0.6 0.1
Earned credits to graduate 63.4 63.4 0 65.6 2.2 2.2
Completed basic academic core 28.9 29 -0.1 28.2 -0.7 -0.8
Reported any negative risk-taking 25.3 25.1 0.2 24.2 -1.1 -0.9
Reported positive youth development 68.6 68.8 -0.2 70.6 2 1.8
Low-risk subgroup
Dropped out of high school 2.8 2.9 -0.1 2.2 -0.6 -0.7
Earned credits to graduate 75.8 76.1 -0.3 84.9 9.1 8.8
Completed basic academic core 36.7 36.6 0.1 39 2.3 2.4
Reported any negative risk-taking 16.8 16.7 0.1 15.7 -1.1 -1
Reported positive youth development 77.2 76.8 0.4 80.3 3.1 3.5
SOURCES: MDRC calculations from Career Academies Evaluation Student School Records Database and 12th Grade Survey Database.
NOTES: Estimates are regression-adjusted using ordinary least squares, controlling for background characteristics of sample members. Rounding may cause slight discrepancies in calculating differences. A two-tailed t-test was applied to differences between the model and non-model groups. In both cases, statistical significance levels are indicated as *** = 1 percent; ** = 5 percent; * = 10 percent.
a result of the regression-based approach among the sample of non-Academy students on whom the regression was fit.
Column 2 of Table B.3 presents the average outcomes among students from the bootstrap samples which were not used for this regression (the non-model group). The numbers in this col-umn represent the pattern of outcomes one would expect to observe if one had a sample of non-
223
PR/Award # S165A200036
Page e364

-132-
Academy students who were not the basis for the regression model but for whom the coefficients from the regression-based strategy were combined with individual characteristics in order to esti-mate the risk of school failure.
The third column of Table B.3 presents the differences between the two averages for the model and non-model groups. Because the second column of estimates is not affected by the po-tential distortion described above, these numbers represent the estimate of the potential distortion created by the regression-based strategy for each outcome.
The fourth column of Table B.3 presents the average outcomes for the high-, medium-, and low-risk subgroups from the simulated Academy (program) group. The fifth column presents the average differences between the simulated Academy group and the model group from column 1. This represents a bootstrap estimate of the program impact. The sixth column presents the av-erage differences between the simulated Academy group and the non-model group from column 2. This represents a bootstrap estimate of the program impact, absent any distortion created by the regression-based subgroup strategy.
The estimates in Table B.3 suggest that the magnitude of the distortion created by the re-gression-based subgroup strategy is not large enough to have a meaningful effect on the pattern of impacts described in the report. In particular, for each of the outcomes in this table, the estimated distortion appears to be less than 1 percentage point. For example, the first row of the table pre-sents the bootstrap estimates of the dropout rate for the high-risk subgroup. Inasmuch as whether or not a student dropped out of high school was the dependent variable in the regression used to define the subgroups, the potential magnitude of the distortion should be largest with respect to that outcome. However, the estimate in this row suggests that the potential distortion in the im-pact estimate is seven-tenths of 1 percentage point. In particular, across 200 replications, the av-erage dropout rate for the high-risk sample from the model group is 31 percent, while the average for the sample that was not used to estimate the regression (from the non-model group) is 30.3 percent, a difference of .7 percentage points.8
Columns 4 and 5 of Table B.3 indicate that subtracting the potential distortion does not result in a meaningfully different estimate of the program impact. In particular, the estimate of the impact and the estimate of the impact minus any potential distortion appear to be within rounding error of one another. Moreover, the other estimates in this table reveal a similar pattern. The esti-mated distortion is never larger than seven-tenths of a percentage point, and the pattern of effects in the impact estimates is not substantially different from the pattern of effects in the column esti-mates that account for the distortion. This suggests that, while the regression-based subgroup
8An alternate estimate of the distortion was generated by performing what might be called a randomization
test. This entailed taking the entire evaluation sample, including Academy and non-Academy students, and ran-domly assigning them to two groups. The dropout regression was then estimated within one group, and the coeffi-cients were used to generate an index and divide the sample into risk categories in both groups. The difference between the outcomes for these groups would represent an alternative estimate of the distortion. After performing this process 200 times, it was found that this alternative method yielded a pattern of estimated distortion similar to that produced by the initial method. In particular, the estimated distortion on the dropout variable was 1.3 percent-age points, and the estimated distortion on all other variables was smaller than that.
224
PR/Award # S165A200036
Page e365

-133-
strategy has theoretical limitations, the limitations do not have any meaningful effect on the pat-tern of impacts presented in this report.
The asterisks in the table indicate the results of statistical significance tests regarding the differences between the model and non-model groups. They suggest that, across the five out-comes and three subgroups considered, the estimated distortion created by the regression-based subgroup strategy was statistically significant in only three cases. In particular, for the high-risk subgroup, the estimated distortion created with respect to the dropout variable and the percentage of students who participated in positive youth development activities was significantly different from zero. For the medium-risk subgroup, the distortion created regarding the dropout rate was also statistically significant. The estimated distortion across all other outcomes was not signifi-cantly different from zero.
This pattern, combined with the magnitude of the effects, suggests two conclusions. First, the estimated distortion created by the regression-based subgroup strategy appears to converge around some non-zero number, but that effect does not appear to be large enough to affect the basic pattern of impacts. Second, the distortion appears to be restricted mainly to the outcome variable that was the basis for defining the subgroups, and it was concentrated within the high-risk subgroup.
V. Conclusions
The evidence and discussion in this appendix strongly support the idea that accounting for the heterogeneity of students in the Career Academies Evaluation is an important element of any strategy designed to assess the impact of the Academies on the diverse group of students they serve. Impact estimates which aggregate results across students with different academic trajecto-ries conceal a substantial amount of variation across students in the effects of the Academies on key outcomes. Therefore, in order to assess the effects of Career Academies more sensitively, it is necessary to develop a strategy for differentiating among students who, in the absence of the Academy treatment, would experience different academic outcomes.
Traditional approaches toward defining subgroups go part of the way toward differentiat-ing among students with different academic trajectories. However, the experimental design pre-sent in the Career Academies Evaluation provides a rare opportunity to improve on these strate-gies by estimating the relationship between student characteristics and the likelihood of school failure in the absence of the Academy treatment.
This regression-based approach offers a number of distinct advantages over its alterna-tives, and its potential limitations are highly unlikely to change the pattern of any of the findings. The regression-based approach takes multiple factors into account, weighting them according to the strength of their effect on student failure. It also allows the use of all relevant variation in stu-dent characteristics in order to estimate risk, as opposed to classifying students on the basis of arbitrary cutoffs in otherwise continuous measures of risk. Most important, it is a highly effective strategy for identifying students who, in the absence of the Academy intervention, would have had substantially different outcomes. As a result, it reveals differences in the effects of Career Academies that would be masked by impacts which are averaged across the entire population of
225
PR/Award # S165A200036
Page e366

-134-
Academy students — and would be at least partly masked by traditional approaches to defining subgroups.
The major drawback of the regression-based strategy is that it has the potential to gener-ate a distortion in the impact estimates that would overstate the impact of the Academies on stu-dents in the high-risk subgroup. However, the best estimates of the potential distortion in impact estimates suggest that its magnitude is negligible. In particular, the estimates suggest that the dis-tortion, at it largest, is seven-tenths of a percentage point. Moreover, any distortion which exists appears to be concentrated within the high-risk subgroup and to be restricted primarily to one outcome. In other words, both the magnitude and pattern of distortion suggest that this phenome-non is neither large nor pervasive enough to affect the overall pattern of impacts presented in the report.
226
PR/Award # S165A200036
Page e367

-134-
References Academy for Educational Development. 1989. Partnerships for Learning: School Completion and
Employment Preparation in the High School Academies. New York: Academy for Educational Development.
Academy for Educational Development. 1990. Employment and Educational Experiences of Academy of
Finance Graduates. New York: Academy for Educational Development. Berryman, Sue. 1991. Cognitive Science: Indicting Today’s Schools and Designing Effective Learning
Environments. Washington, DC: U.S. Department of Labor, National Council on Vocational Education and Employment and Training Administration.
Bloom, Howard S. 1984. “Accounting for No-Shows in Experimental Evaluation Designs.” Evaluation
Review 8 (2): 225-246. Dayton, Charles. 1997. California Partnership Academies: 1995-96 Evaluation Report. Nevada City,
CA: Foothill Associates. Dewey, John. 1916. Democracy and Education: An Introduction to the Philosophy of Education. New
York. Macmillan. Friedlander, Daniel. 1988. Subgroup Impacts and Performance Indicators for Selected Welfare
Employment Programs. New York: Manpower Demonstration Research Corporation. Hanser, Lawrence, M. Elliott, and C. Gilroy. 1999. Career Academies: Evidence of Positive Student
Outcomes. Santa Monica, CA: Rand Corporation. Hanser, Lawrence, and Cathleen Stasz. 1999. “The Effects of Enrollment in the Transportation Career
Academy Program on Student Outcomes.” Unpublished paper. Santa Monica, CA: Rand Corporation.
Kemple, James J. 1997a. Career Academies: Communities of Support for Students and Teachers —
Emerging Findings from a 10-Site Evaluation. New York: Manpower Demonstration Research Corporation.
Kemple, James J. 1997b. “Selected Dimensions of Applied Learning in Career Academy Classrooms.”
Unpublished paper. New York: Manpower Demonstration Research Corporation. Kemple, James J., Susan M. Poglinco, and Jason C. Snipes. 1999. Career Academies: Building Career
Awareness and Work-Based Learning Activities Through Employer Partnerships. New York: Manpower Demonstration Research Corporation.
Kemple, James, and JoAnn Leah Rock. 1996. Career Academies: Early Implementation Lessons from a
10-Site Evaluation. New York: Manpower Demonstration Research Corporation. Linnehan, Frank. 1996. “Measuring the Effectiveness of a Career Academy Program from an Employer’s
Perspective.” Educational Evaluation and Policy Analysis 18 (1):73-89. Maxwell, Nan, and Victor Rubin. 1997. The Relative Impact of a Career Academy on Post-Secondary
Work and Education Skills in Urban, Public High Schools. Hayward, CA: Human Investment Research and Education Center.
Maxwell, Nan, and Victor Rubin. 1999. Improving the Transition from School to Work: Assessing the
Impact of Old and New Strategies. Hayward, CA: Human Investment Research and Education Center.
227
PR/Award # S165A200036
Page e368

-135-
National Center for Education Statistics (NCES). 1990. National Education Longitudinal Study of 1988:
A Profile of the American Eighth Grade — NELS: 88 Student Descriptive Summary. Washington, DC: U.S. Government Printing Office.
National Center for Education Statistics (NCES). 1992. National Education Longitudinal Study of 1988:
Characteristics of At-Risk Students in NELS: 88. Washington, DC: U.S. Government Printing Office.
National Center for Education Statistics (NCES). 1995. National Education Longitudinal Study of 1988:
Second Follow-Up: Transcript Component Data File User’s Manual. Washington, DC: U.S. Government Printing Office.
Natriello, Gary, ed. 1987. School Dropouts: Patterns and Policies. New York: Teachers College Press. Office of Technology Assessment (OTA), U.S. Congress. 1995. Learning to Work: Making the Transition
from School to Work (OTA-EHR-637). Washington, DC: U.S. Government Printing Office. Orr, Larry, Howard Bloom, Stephen Bell, Fred Doolittle, Winston Lin, and George Cave. 1996. Does
Training for the Disadvantaged Work? Washington, DC: Urban Institute Press. Pauly, Edward, Hilary Kopp, and Joshua Haimson. 1995. Home-Grown Lessons: Innovative Programs
Linking School and Work. San Francisco: Jossey-Bass. Raizen, Senta. 1989. Reforming Education for Work: A Cognitive Science Perspective. Berkeley: National
Center for Research in Vocational Education, University of California at Berkeley. Reller, D. 1987. A Longitudinal Study of the Graduates of the Peninsula Academies, Final Report. Palo
Alto, CA: American Institutes for Research in the Behavioral Sciences. Resnick, Lauren. 1987. Education and Learning to Think. Washington, DC: National Academy Press. Roderick, Melissa. 1993. The Path to Dropping Out: Evidence for Intervention. Westport, CT: Auburn
House. Snyder, Phyllis, and Bernard McMullan. 1987. Allies in Education: A Profile of Philadelphia High
School Academies. Philadelphia: Public/Private Ventures. Stasz, Cathleen. 1999. “Students’ Perceptions of Their Work-Based Learning Experiences: A Comparison
of Four Programs.” Unpublished paper. Santa Monica, CA: Rand Corporation. Stern, David, Charles Dayton, Il-Wu Paik, and Allen Weisberg. 1989. “Benefits and Costs of Dropout
Prevention in a High School Program Combining Academic and Vocational Education: Third-Year Results from Replications of the California Peninsula Academies.” Educational Evaluation and Policy Analysis 11(4): 405-416.
Stern, David, Charles Dayton, and Marilyn Raby. 1998. Career Academies and High School Reform.
Berkeley: Career Academy Support Network, University of California at Berkeley. Stern, David, Marilyn Raby, and Charles Dayton. 1992. Career Academies: Partnerships for
Reconstructing American High Schools. San Francisco: Jossey-Bass. Stern, David, Neal Finkelstein, James Stone III, John Latting, and Carolyn Dornsife. 1994. Research on
School-to-Work Transition Programs in the United States. Berkeley, CA: National Center for Research in Vocational Education, University of California at Berkeley.
228
PR/Award # S165A200036
Page e369

-136-
229
PR/Award # S165A200036
Page e370

Kelly A. Stedman
Professional
Experience
2018-present James Stephens Academy Fort Myers, FL Principal
● Initiated guided reading framework to increase student reading achievement
● Coached PLC facilitators in using multiple data points to make instructional decisions.
● Initiated an online standards based tracker to measure student success in standards on formative and summative assessments.
2016-2018 James Stephens Academy Fort Myers, FL Assistant Principal of Curriculum
● Facilitated PLC process with grades 2-5 using standards based assessments and standards based instructional strategies.
● Led teachers through standards based grading using the FOCUS system. ● Coached teachers through Marzano’s Proficiency Scales
● Created proficiency scales for English Language Arts with a team of teachers and infused those into instruction at the student level.
● Led the school through Marzano’s practices of prioritizing standards, creating scales and tasks that measure the complexity of each level.
● Presented at the Florida School Board Association on the James Stephens Turnaround Story.
2014 - 2016 Veterans Park Academy for the Arts Lehigh Acres, FL Assistant Principal of Curriculum
● Initiated and led a Professional Development Partnership (PDS) with the local university (Florida Gulf Coast University) to increase teacher retention at the school and district levels.
● Planned and presented at Florida Gulf Coast University and at various Lee County Schools as the Secretary of the PDS steering committee.
● Presented at the Professional Development Schools conference in Washington D.C.
● Coached and supported the use of Standards Based instruction at the elementary and middle school levels.
● Modeled and supported appropriate Professional Learning Community expectations through the use of DuFour’s four questions.
● Modeled and coached teachers through Kagan structures to increase engagement in classrooms.
2009-2014 G. Weaver Hipps Elementary Lehigh Acres, FL Math and Writing Specialist
● Math Common Core Master Trainer (Grades 3-5) for Lee County Math Department
● Attended Common Core Institute in Orlando, Florida for Mathematics and Language Arts
230
PR/Award # S165A200036
Page e371

● Presented on math power standards for grades 3-5 which included best practices in the classroom
● Developed math journaling class for the district and initiated math journals in grades 3-5 in to increase written response accuracy
● Observed and monitored 4th grade writing classes while providing feedback for teachers to guide their instruction
▪ Initiated daily pullout of Supportive Behavior students for writing instruction using the Kathy Robinson writing curriculum
▪ Collaborated with grades 3, 4, and 5 to co-teach whole group, pull out small group lowest 25% of student population, and planned cooperative lessons
▪ Facilitated FCAT 2.0 (Florida Comprehensive Achievement Test) training which incorporated information about the three learning styles for math (CRA), Webb’s Depth of Knowledge, and analysis of FCAT data.
▪ Created a writing boot camp for students to practice expository and narrative writing genres.
▪ Collaborated with Kathy Robinson to model writing lessons, conference with teachers, and monitor student progress.
▪ Created a Family Math Night with the math professional learning teacher from the district office and serviced over 10 schools district wide.
▪ Qualified trainer for Math and Parent Partnerships Workshops
Kagan Coach
▪ Created Structure of the Month Club (SAMs) which introduces a new structure each month to teachers.
▪ Modeled new structures at faculty meetings
▪ Coached individual teachers monthly on new structures in the classroom setting
▪ Provided activities and resources for teachers to use in their classrooms to strengthen our movement to become a Kagan School
▪ Implemented a Kagan blog and Sharepoint site for staff members to find teacher modeled videos, lessons, and pictures of students interacting through cooperative learning.
Fourth Grade Teacher
▪ Collaborated with peers as the grade level chair for fourth grade and the school math contact.
▪ Trained one – on –one with a hired Kagan coach for a 2 day briefing. ▪ Edited the new math academic plans and common district math
assessments to accommodate the Next Generation Sunshine State Standards.
▪ Trainer for the district teaching Lee County Employees Primary Math and a specialized training on 2-D/3-D Shapes.
▪ Actively involved on committees, such as A+ Leadership Team, Reading Leadership, Accelerated Reading, and Odyssey of the Mind that work towards school improvement.
▪ Presented and taught several in-services to staff members; some of them include FCAT task cards, math standards based teaching, FCAT 2.0 and Win – Win Discipline.
▪ Analyzed FCAT data to identify lowest 25% and created the School Improvement Plan based on previous year data.
231
PR/Award # S165A200036
Page e372

▪ Lehigh Acres Chamber of Commerce Teacher of the Year Recipient for 2011
Education 2012-2013 American College of Education Indianapolis, IN ▪ Masters in Education ▪ Major: Educational Leadership ▪ GPA: 4.0 2000-2004 Ohio University Athens,
Ohio ▪ Bachelor of Science in Education ▪ Major: Early Childhood Education ▪ GPA (major) 3.956; (overall) 3.815
Professional
Membership
s
Treasurer for the Ohio University Education Association 2000-2003
Lee County Math Council
National Council of Teachers of Mathematics
Professional Development Schools Member
Florida Association of School Administrators
Professional
Awards
Lehigh Acres Chamber of Commerce Teacher of the Year 2011
Florida Assistant Principal of the Year 2017
232
PR/Award # S165A200036
Page e373

Edward A. Mathews
Gallup Strengths:
Connectedness| Arranger| Input| Activator| Self-Assurance
Education
M.S. Educational Leadership, 2007 Nova Southeastern University, Fort Lauderdale, FL
B.A. History, 2002 Florida Atlantic University, Boca Raton, FL
Awards
• 2017 “Person of the Year” by the Fort Myers News-Press • 2019 “Best and Brightest Principal Award” by the Florida Department of Education • 2020 “Principal of the Year” by the Teachers Association of Lee County
Professional Experience
Principal, South Fort Myers High School, Fort Myers, Fl, August 2016- Present
I am the Proud Principal of SFMHS, focused on building a powerful school culture that meets the needs of our students and community. I have worked hard to build business partnerships with LeeHealth, Minnesota Twins, Lee Building Industry Association, Fort Myers Chamber of Commerce, Career Source, Florida Gulf Coast University, Florida SouthWestern State College, Fort Myers Techincal College, etc. I believe that every student has a pathway for success. In the time that I have been at SFMHS we have increased our graduation rate by 13%. In addition, I am proud to share that we reduced our students out-of-school suspension rate by 94% and our students in-school suspension rate by 77%. Academic achievement has become more of a reality for our students since 2016. We currently have a school record number of SFMHS graduates attending a vocational school, 2 year college, or 4 year college/university.
Assistant Principal, East Lee County High School, Lehigh Acres, Fl, January 2016- Present
I was asked by the Superintendent to work at East Lee County High School. I was directly involved in the daily operations of the building. I worked to help create a positive culture for the building by using Positive Behavior Support and by reaching out to the students, staff, and community. I am proud to state from a qualitative perspective the school culture improved greatly during my time at the school.
Assistant Principal, Varsity Lakes Middle School, Lehigh Acres, Fl, July 2015- December 2015
233PR/Award # S165A200036
Page e374

I helped supervise the daily academic and operational goals of the building. I was placed in charge of the 6th grade students and staff. I worked directly with the Science and ESE departments on attaing the goals of the School Improvement Plan. During my short stay at the school I was able to help create a positive collegial coaching process that developed the academic rigor of the schools classrooms as we made the transition to Google Chromebooks to facilitate instruction. I am proud to note that I was able to do a few innovative things with the building facility that increased curb appeal and helped the school culture.
Assistant Principal, Riverdale High School, Fort Myers, FL, June 2011- June 2015
I was the supervisor for the school facility, personnel supervisor, and manager for daily operations. I worked with others to analyze data for student achievement. I served as the administrator for the International Baccalaureate Program, Art, Business, ESE, JROTC and the Science Department. I was responsible for faculty meetings, award ceremony programs, professional development workshops and served as the principal designee when the principal was out of the building.
Assistant Principal, Island Coast High School, Cape Coral, FL, August 2009—May 2011
I supervised the Student Affairs Office, managed school discipline, created and implemented school procedures for athletics and after-school activities. Created and produced assemblies to entertain and honor deserving students for academics, discipline and athletic abilities.
234
PR/Award # S165A200036
Page e375

1
Terri M. Kinsey, Ed.D.
Education August 2010 - May 2014
Doctor of Education in Educational Leadership University of Florida, Gainesville, FL Dissertation: A single case study describing an elementary teacher-student relationship and student attainment using a culturally sensitive research approach
January 1994 - August 1996
Master of Science in Educational Leadership Nova Southeastern University, Fort Lauderdale, FL
June 1987 - April 1992
Bachelor of Arts in English Florida State University, Tallahassee, FL Emphasis: Creative writing Minor: Business
Certifications English, 6-12 and School Principal, K-12
Professional Experience November 2017 - present July 2007 – July 2017
Project Director of Magnet Schools School District of Lee County, Florida Responsibilities include: Oversee a $10 million magnet grant, manage budget and project operations and work with three middle school magnet programs to recruit and retain a diverse student population while improving student outcomes. Evaluator, formerly Principal Partner (July 2007-June 2011) William Bozeman & Associates, LLC. Responsibilities include: evaluation proposal design, development and evaluation implementation for local education agencies; provide support to clients through evaluation of project and monitoring of progress toward project goals and objectives. Prior responsibilities included - all financial and organizational activities associated with operating one’s own organization. www.Bozemanassociates.com Current or Recent Past Clients: Orange County Public Schools, School Board of Pasco County, Polk County Public Schools, Marion County Public Schools
July 2005 – November 2017
Coordinator, Grants and Program Development School District of Lee County, Florida Responsibilities include: grants development for federal and state programs and private foundations, writing, research, budget development, community
235PR/Award # S165A200036
Page e376

2
support, contract development, grant training for teachers and community, receive grants in excess of $1 million each year. Major Competitive Grant Awards: Federal Teacher Incentive Fund Program, $45 million; Federal Magnet Schools Assistance Program, $10.2 million; Federal Magnet Schools Assistance Program, $4.7 million; School Improvement Grant-4, $2.2 million; National Education Association Foundation Closing Achievement Gap, $1.25 million; Federal Professional Development for Arts Educators Program, $800,000; Federal Teaching American History Program, $989,793; Federal Advanced Placement Incentive Program, $906,983; Federal Carol M White Physical Education Program, $583,192; Federal Transition to Teaching Program in Partnership with Florida Gulf Coast University, $2 million; Federal Readiness and Emergency Management for Schools, $457,000; 21st Century Community Learning Center, $307,000; Florida New Teacher Mentor Grant, $245,000; Florida Safe Routes to School, $200,000; South Florida Water Management District, $50,000.
May 2004 - June 2005 Maternity Leave June 2003 - May 2004
Assistant Director for Communications School District of Lee County, Florida Responsibilities include: all print and electronic media, public relations, superintendent’s speech writing, superintendent’s liaison for community activities, coordinating district events, public information requests.
July 2002 - June 2003
Chief of Staff to the Superintendent School District of Lee County, Florida Responsibilities include: facilitate superintendent’s executive team, develop district process improvements, coordinate district strategic planning, superintendent’s liaison for community activities, coordinating district events, revise district policies and administrative regulations, superintendent’s liaison to the School Board.
April 1999 - July 2002
Assistant Principal J. Colin English Elementary, N. Fort Myers, FL
August 1998 - April 1999
Assistant Principal for Administration Trafalgar Middle School, Cape Coral, FL
August 1997 - August 1998
Assistant Principal of Student Affairs Fort Myers High School, Fort Myers, FL
March 1993 - August 1997
International Baccalaureate English & Inquiry Skills Teacher Fort Myers High School, Fort Myers, FL
August 1992 -March 1993
Exceptional Student Education Language Arts Teacher Cypress Lake Middle School, Fort Myers, FL
Additional Educational Experience
236
PR/Award # S165A200036
Page e377

3
District Innovation Team District Interest-based facilitator Grants Trainer District Negotiating Team for Teacher Incentive Pay District Strategic Planning Targeted Selection Interview Team for Principals and District-level positions District reviewer, assistant principal pool applicant writing samples District Chair for United Way District Quality Advisory Committee District Media Relations Development of district electronic and print media
Conference Presenter: Southeast Evaluation Association 2010 Conference presentation, Planning Program Evaluations: Toward a Systems Approach
Professional Associations
American Education Research Association American Evaluation Association American Association for the Advancement of Science Florida Association of School Administrators Association for Supervision and Curriculum Development Florida Sterling Examiner (2003, 2015)
Service Organizations & Activities
Board of Directors for the Dr. Piper Center Board of Directors Greater Fort Myers Chamber Education Foundation Member, Women’s Community Club Judge of Young Inventor’s Fair Volunteer, Elementary Science Expo Traveling, skiing, gardening, running and mentoring children
References
Dr. J. F. “Jeff” McCullers (current supervisor) Director, Grants and Charter Schools, School District of Lee County [email protected] (239) 337-8115 Dr. William Bozeman (current colleague) Retired Professor Emeritus, University of Central Florida CEO Bozeman and Associates, LLC [email protected] (386) 690-6665 Dr. Denise Phillips-Luster (former supervisor) Principal, Hancock Creek Elementary, School District of Lee County [email protected] (239) 461-8489
237
PR/Award # S165A200036
Page e378

Teri L. Cannady
Objective To continue to support other leaders in improving student achievement in Lee County Effective Instructional Leader, coaching & facilitating opportunities for leaders to share research-based strategies and best practices to help create a data-driven environment with a master schedule that provides a positive learning culture for all. Devoted Educator, routinely sharing examples of specific leadership, teaching, and instructional strategies that are associated with improved student achievement. Through coaching and providing assistance to staff and colleagues, the results are a continuous expansion of professionals’ capacity to create desired results. Recent Leadership/Committee Roles
Florida Association of Instructional Supervisors and Administrators Board 2020 Magnet Advisory Board 2020 Facilitator for National Institute of School Leadership Brian Dassler - Commissioners Leadership Academy FIT (Facilitator in Training) 2019 Board Member for Florida School Music Association 2019 Florida Standards Academy Completion 2019 Lead Principal 2016 - 2020 Completed NISL Executive Development Program - 2018 Completed Brian Dassler Leadership Academy through DOE 2018 Lee County Educational Administrators Association – President Florida Association of Secondary School Principals Board Member Administrator Mentor Middle School Association Chair Legislative Days – Lobby Legislators for Lee County Platform – 4 years Committee Member – Strategic Planning Steering Committee, Career Ladder Committee, Appeals Committee QUAIC – Chairperson & Member / CSI Lee Lead for Site Visit Intern with Roger Chen, Lean Transformation, Lee Memorial Hospital Sterling Examiner
Professional Experience Director Grants & Program Development, Fort Myers, FL October 2019 - Present Principal Challenger Middle School, Cape Coral, FL – April 2006 – October 2019 Assistant Principal Caloosa Middle School, Cape Coral FL – July 1998 – April 2006 Assistant Principal Lehigh Senior High School, Lehigh Acres FL – October 1995 –July 1998 Teacher Gulf Middle School, Math and Computer Technology, Cape Coral FL - August 1994-October 1995 Teacher Trafalgar Middle School, Math and History, Cape Coral FL- September 1991-July 1991 Account Executive L.M. Berry Directories America, Cape Coral FL- July 1998-July 1991 Marketing Support Manager, Direct Office Equipment, Cape Coal FL- June 1986- June 1998 Education Masters of Education Educational Leadership 1991-1995 University of South Florida B.A.S. Computer Information Systems 1983-1986 Florida Atlantic University Associates Degree in Business 1981-1983 Edison Community College Certification in: School Principal All Levels Educational Leadership Math (Grades 5-9) Computer Science (Grades K-12) 238
PR/Award # S165A200036
Page e379

Inez Mata
Meticulous educator who undertakes complex assignments, meets deadlines, and delivers superior performance. Leads teachers and faculty toward the fulfillment of their potential in support of student’s intellectual, emotional, physical, and social growth in a safe and cost-effective manner that supports the goals of the Lee County School District.
Professional Development Facilitated
2019-2020 Notice and Note Reading Strategies K-5 Literature
2019-2020 Notice and Note Reading Strategies 6-8 Non-Fiction
2019-2020 DBQ: An Overview 6-8 Reading Department
2019-2020 STAR Reading: An Overview SAC
2019-2020 Higher Order Thinking Questioning Apples Mentees and Mentors
2019-2020 Standards Based Instruction 6-8 Reading Department
2018-2019 High Yield Instructional Strategies PreK-5
2018-2019 Learning Focused Instructional Framework PreK-5
2018-2019 Marzano’s Proficiency Scales PreK-5
2018-2019 DBQ: An Overview 4-5th Grade ELA
2014-2015 UbD: Universal by Design K-5
2013-2014 Differentiated Instruction K-5
Experience
Veterans Park Academy of the Arts Year Title[s] Experience
2019-2020
Middle School Reading
Coach
6-8 Grade Advanced
Reading
Reading Department Head DATA Schoolwide PLC
PLC Leader Professional Development
Trainer SAC Committee
Girls’ Soccer Coach
✓ Provide in-depth diagnostic assessments for students referred for reading and oral and/or written language deficiencies. ✓ Coordinate the development of an academic improvement plan for students identified as having substantial reading and oral and/or written language
deficiencies. ✓ Assist teachers in developing and implementing appropriate reading and oral and/or written language acceleration strategies. ✓ Design, select, modify, and evaluate materials that reflect curriculum goals, current knowledge, and interests, motivation, and needs of individual learners. ✓ Work with the principal and assistant principal to develop a teaching schedule that will include intensive reading assistance when deemed appropriate in the
academic improvement plan. ✓ Use information from norm-referenced tests, criterion-referenced tests, formal and informal inventories, constructed-response measures, portfolio based
assessment, observations, anecdotal records, journals, and multiple other indicators of students’ progress to improve instruction and student learning. ✓ Conduct assessment of multiple indicators of learner progress, taking into account the context of teaching and learning, and collaboratively assist teachers in
developing instructional strategies. ✓ Design and deliver professional development opportunities. ✓ Share knowledge, collaborate, and teach with colleagues and parents.
✓ Work with school administrators and staff to accomplish the reading-related goals of the School Improvement Plan
239PR/Award # S165A200036
Page e380

James Stephens International Academy Year Title[s] Experience
2018-2019
5th Grade ELA/Science
4th Grade Intervention FGCU Cooperative Teacher
✓ 50% Resource supporting 3rd/4th/5th Grade by mentoring, modeling standards based instructional strategies that align with our School Improvement Plan to increase student achievement.
✓ Facilitation of PLCs by maintaining focus on student achievement through the development and incorporation of standards based instructional practices.
✓ Development of pacing guides, proficiency scales, and deconstructed standards for English Language Arts. Creation of standards-based assessments for 3-5th grade in English Language Arts and 5th Grade Science.
✓ Implementation and training of Document Based Questions (DBQs) strategies and delivery for individualized support to fellow teachers. Support 4th Grade ELA with Science and Social Studies integration through the DBQ process.
✓ Collaboration with administration and faculty during PLC times in order to build capacity through trainings, modeling, and coaching to increase student achievement.
✓ Implementation and organization of Intervention 3-5th grade through Deconstruction of Standards and utilizing tool “Standard Tracker” to track each students progress of mastery of standards.
✓ Increase student achievement, motivation, and engagement by fostering a mastery-learning classroom through the utilization of Marzano’s proficiency scales and daily student self-reflection.
2017-2018
TIF Teacher Teacher Leader 4th Grade ELA
4/5 Grade Intervention FGCU Cooperative Teacher
2016-2017 4th Grade
ELA/Science
Veterans Park Academy of the Arts Year Title[s] Experience
2015-2016
5th Grade Educator
5th Grade ELA/Social Studies
✓ Instruction in 5th Grade English Language Arts with Science and Social Studies integration utilizing DBQs. ✓ Increase student achievement, motivation, and engagement by fostering a mastery-learning classroom through the utilization of Marzano’s
proficiency scales and daily student self-reflection. ✓ Development of pacing guides, proficiency scales, standards-based assessments and deconstructed standards for English Language Arts. ✓ Member of Lighthouse Team ✓ Member of Steering Committee
Tortuga Preserve Elementary Year Title[s] Experience
2014-2015
4th Grade STEM 4th Grade Team Leader Robotics’ FLL Coach Robotics’ Head Judge
Math Leader FGCU Cooperative Teacher
✓ Instruction in 4th Grade English Language Arts with Science integration utilizing standards based instructional practices. ✓ Increase student achievement, motivation, and engagement by fostering a mastery-learning classroom through the utilization daily student self-
reflection. ✓ Development of pacing guides, proficiency scales, standards-based assessments and deconstructed standards for English Language Arts. ✓ PLC Coordinator for grade level team of 6-8 teachers. ✓ Developed and Led Training in Differentiated Instruction to staff of 100+. ✓ Developed and Led Training to potential Robotics’ Coaches in South West Florida. ✓ Ran, directed, and judged two Robotics Tournaments on Campus to 10+ Robotics Teams from all over the state of Florida. ✓ Organized and ran “Tortuga Community Day” which included free services for Health by Lee Memorial Health System, haircuts from Magnolia
Salon, Bicycle Helmet Fittings, Massages, Lunch from Costco, Tire Rotations, Oil Changes, Face Painting, and other services.. ✓ Member of A-Team [Turnaround Team through DA Status] ✓ Hosted Tortuga Tech Team Robotics Competition at our Site three years in a row, hosting teams from surrounding SW Florida area and
Caribbean. Coordinated with Cypress Lake Middle School, IMAG, and Trane Engineers. ✓ Hosted first ever Lee County F.I.R.S.T FLL Robotics Qualifying event Tortuga STEMquest Jan 11, 2014 ✓ FLL Robotics Head Judge for 2014-2015 Tournament with 12+ Teams
2013-2014 4th Grade STEM 4th Grade Team Leader Robotics’ FLL Coach
2012-2013 4th Grade STEM Robotics’ FLL Coach
240
PR/Award # S165A200036
Page e381

Career Development
2019-2020 E-Learning Walks Protocol 2019-2020 CLOSE Reading: Notice and Note Non-Fic 2019-2020 Leader in Me Empowering Instruction
2019-2020 Language Live! / Inside C 2019-2020 Expert 21 Advanced Reading 2019-2020 Performance Matters Training
2019-2020 KAGAN Day 2 2019-2020 AVID 6-8 2019-2020 Marzano Strategies
2018-2019 Clinical Educator Refresher 2018-2019 High Yield Instructional Strategies 2018-2019 High Yield Train the Trainer
2018-2019 Instructional Framework 2018-2019 Research-Based Instructional Strategies 2018-2019 SRA, Ready Gen, Read 180
2017-2018 The Differentiated Classroom 2017-2018 Vocabulary and Comprehension Strat 2017-2018 Meeting Needs with UDL/AIM
2016-2017 KAGAN Win-Win Discipline 2016-2017 Summer Design Train a Trainer 2016-2017 NSRF Critical Friends Coaches Training
2015-2016 Clinical Educator 2015-2016 CLOSE Reading: Notice and Note Fiction 2015-2016 P-Sell Science Training
2015-2016 Leader in Me: Character 2014-2015 Leader in Me: Classroom Management 2014-2015 FLL Robotics Head Judge Training
2014-2015 Castle Training 2014-2015 FSA Writing Range/Rubric Finder 2014-2015 Math Leaders
2014-2015 F.I.R.S.T Lego Education Academy Workshop: EV3 Coding and Robotics
2013-2014 Summer Design Train a Trainer 2013-2014 STEM Engineering is Elementary [EiE] Training
2013-2014 CLOSE Reading 2013-2014 High Yield Instructional Strategies 2013-2014 High Yield K-5
2013-2014 Super Science STEM Saturday 2013-2014 High Yield Train the Trainer K-8 2013-2014 Choosing Excellence
2012-2013 Gizmos Virtual Science Inquiry 2012-2013 Read Aloud FDLRs 2012-2013 Write Out Loud FDLRs
2012-2013 Co-Writer FDLRs 2012-2013 High Yield Instructional Strategies 2012-2013 STEM FLL Robotics Coach Training
2012-2013 Blackboard Education 2012-2013 Compass Learning 2012-2013 Kagan Day 1
2012-2013 Glasser Quality Schools 2012-2013 STEM Engineer Design Process Training
2012-2013 Math Journaling
Education
2012-2013
Florida Gulf Coast University
National Writing Project Grant Recipient
2008-2012 Edison State College Bachelor Degree Elementary Education K-6 ESOL K-12 Endorsement Reading K-12 Endorsement
References
Kelly Stedman
Principal James Stephens International Academy (239) 337-1333
Mary Blackmon
Principal Veterans Park Academy of the Arts (239) 303-3003
Dr. Brain Pollitt
Assistant Principal Veterans Park Academy of the Arts (239) 303-3003
241
PR/Award # S165A200036
Page e382

Karie Rathbun
May 12, 2020
Magnet Schools Assistance Program (MSAP) Grant (US Department of Education) To Whom It May Concern: I'm contacting you in regards to the Magnet Schools Assistance Program. What a thrill it would be to work for the magnet team at James Stephens! I would be so proud to tell people that I am a part of the magnet team.
My previous experience working as teacher for Lee County School District, gave me teaching and leadership experience. I have an excellent track record of consistently customizing the lessons based on standard-based instruction utilizing technology. I train other teachers when I am not instructing; coaching teachers through trouble-shooting, and data questions. I use and support STAR, Aleks, I-Ready, Freckle and Unify. I understand and promote the importance and validity of computer lab for elementary students.
I have served as Math Department Head, Chrome Trainer and A+ Team member. At the district level, I serve as our in-house trainer on all updates regarding Focus, Performance Matters, Castle, What's Important in Math Today, Compass, Safari Montage, and Math initiatives at the local and state levels. I have completed clinical educator training to be an APPLES or college student mentor. I support my students by utilizing school messenger as a way to share online resources for home usage. I am teaching Google Apps. I am using Tinkercad 3D printing software in the classroom with a small 3D printer I purchased. This grant could expand this program. I hope to promote student solutions to real world problems by encouraging creative thinking by our students. I understand the importance of collaboration to increase student achievement. I work closely with my colleagues not only at my school but throughout the district. I look forward to continuing to work with my colleagues using my teaching and technology experience. My expertise will make me a great addition to your magnet grant team. I'd be happy to provide greater detail about my skills and experience upon request. I welcome the opportunity to contribute my skills to the magnet grant team.
With regards, Rathbun, Karie
242PR/Award # S165A200036
Page e383

Page 2
Karie Rathbun
Objective
My goals are to continue employment in the education field where I can enhance the already outstanding School District of Lee County at James Stephens. To accomplish these goals, I am seeking to become a magnet team member who can implement the grant to enhance the education of our diverse population of students.
Professional Profile
Teaching Skills Served on The Charter School Authority Board
Paraprofessional Challenger Middle Teacher 7th grade math North Fort Myers Academy for the Arts Teacher 3rd,4th,5th and 7th grade math James Stephens
International Academy Teacher Technology James Stephens International Academy
Management Skills Analyzed Data Developed Procedures Prioritized and Delegated Duties Coordinated Training Coached Fellow Employees Math Department Head Chrome Training Team A+ Team
Communication Skills Facilitated Employer and Employee Relations Encouraged Positive Communication Informed Employers of Important Matters Initiate Parent Communication in Multiple Formats
243PR/Award # S165A200036
Page e384

Page 3
Accounting Skills Collected and Organized Data Tabulated and Specified Cost Savings Ideas Set Financial and Business Goals Advised Employers in Areas of Business Finance
Work History 2012- Present, Teacher, Lee County School District 2010- 2012, Paraprofessional, Lee County School District 2010-2012, Tutor, Edison State College, Fort Myers, FL
2005-2008, MIS Manager, Tropic Enterprises LLC, Fort Myers, FL 1997-2007, IT Manager/Owner, Karie’s Business Solutions, Cape Coral, FL
1995-1999, IT Manager, Lawns-R-Us, Cape Coral, FL
Education AA with Concentration in Early Childhood 08/11/2010 Bachelor’s in Elementary Education 5/04/2012 ESOL endorsement 05/04/2012 Reading Endorsement 05/04/2012 Middle Grades Math 5-9 07/01/2012
Technology Experience and or Training Dell Educator Certification Chrome trainer for the Lee County School District
McGraw hill Trainer Microsoft Certifications Computer Hardware and Software Experience Computer Coding Website Designer 3D Printing References References are available on request.
244
PR/Award # S165A200036
Page e385

BETHANY LOESCHER LLOYD
CROSS-CONTENT READING STRATEGIST | TEACHER COACH & MENTOR
Reading Content Expert and nine-year reading teaching veteran with career marked by successfully teaching research-based reading strategies across Social Studies and ELA content area. Achieved outcomes that surpassed goals and benchmarks.
Accomplished Teacher Leader with proven success in facilitating teacher professional development through training, coaching, and mentoring in materials, assessments, and best practices that improve student achievement.
Strong collaborator skilled in building and leveraging relationships to deliver instructional solutions that meet student and school needs. Known for “heart” for students and inclusive, empowering approach to decision making.
Three-time Florida DOE High Impact Teacher award winner for impact on student learning growth at South Fort Myers High School and East Lee County High School.
Seven consecutive years of Highly Effective Teacher evaluations based on VAM scores.
A re as of Expe rti se: Reading Content Strategies Teacher Professional Development Struggling Standards Instruction Instructional Strategies Teacher Coaching & Mentoring Content & Strategy Alignment Literacy Instruction Techniques Faculty & Staff Collaborations Learning Data Analysis
PR O F E S S I ON A L EX P E RI E N C E SOUTH FORT MYERS HIGH SCHOOL- FORT MYERS JUNE 2019-CURRENT SAT/ACT Preparatory Reading Teacher,11th Grade | MTSS
Worked with both ESOL and General Education 11th grade students to provide SAT and ACT test strategies resulting in a 68% pass rate for students who took the test in Semester 1.
Played a key role in constructing a short term program targeted at 9th-11th graders failing one or more core courses. The program resulted in decreasing the failure rate of an average of 13.37% across grade levels: Including a reduction of 11.39% in our ESOL population.
Attended " Leveraging Diversity and Culture to Foster a Supportive Community" In order to study better and more productive ways to work with a divers student population.
Oversaw the 11th grade BARR program: which fosters a culture of learning and career readiness as well as builds soci0-emotional skills
Mentored teachers in the APPLES program to help guide new teachers into a successful career in education and provide best practice teaching pedagogy.
Provided academic support to our Tier 3 MTSS popultaion through tutoring and individual pull out. Sponsored school's National Honor Society and Future Teachers of America branch,
HARNS MARSH MIDDLE SCHOOL- LEHIGH ACRES, FL JUNE 2018-JUNE 2019 English Language Teacher, 6th Grade | Peer Collaborative Teacher, ELA/Social Studies Joined one of Lee Counties East Zones magnet grant recipients - Magnet Grant for the Arts and Academics- and title 1 schools, in order to work with teachers to increase reading data school wide, coach and mentor "career changer" teachers, and develop focused academic programs to decrease the number of L25 students. As an ELA teacher, STAR data consistently showed quarterly growth above other lateral ELA classes. Created a focused targeted academic plan focused on HMMS L25 learners. Facilitated weekly Professional Learning Communities. Developed school wide Professional Development of Kagan, Learning Focused, AVID, and John Hattie Effect Size. Worked with the school Magnet grant Coordinator to develop lesson plans that embedded the arts into ELA lessons plans.
Co-Created a focused academic classes that target L25 students. This objective was to target the Individual skill needs to each student in Math and Reading. The resulting in an increase of both math and reading STAR and FSA data in targeted L25 population.
Spearheaded school wide Learning Focused Initiative though Implementation of LF strategies and continuing professional development training of Learning Focused approach and lesson plans.
Ensured ELA teacher were Integrating the arts within lesson plans in order to meet Magnet Grant goals and enhance student learning.
Facilitated PLC of both Social Studies and ELA departments.
245PR/Award # S165A200036
Page e386

Bethany Loescher Lloyd | Page 2 of 3
Created and presented Professional Development in the areas of AVID reading strategies, Hattie’s Effect size,
APPLES mentoring, and utilizing school data to drive Instruction.
LEHIGH SENIOR HIGH SCHOOL – Lehigh Acres, FL June 2017 – June 2018 Intensive Reading Teacher, 9th and 10th Grades | Teacher Leader, Social Studies Joined the East Zone’s largest high school, AVID School of Distinction, AVID Demo School, and Kagan School to lead Social Studies teachers in meeting district goals to grow students’ intellectual, emotional, physical, and social capacity. Facilitate weekly Professional Learning Communities (PLCs). Embed research-based reading strategies in department through professional development opportunities, training, and coaching. Work with principal, assistant principals, faculty, and staff to support student achievement. Identify and develop future Teacher Leaders. As Reading Teacher, increase student reading comprehensive and FSA / STAR testing scores. Design, select, modify, and align instructional strategies with curriculum goals and learner interests / needs. Model and coach teachers in research-based literacy instruction and latest techniques for preventing and remediating reading problems.
Surpassed Vision 20/20 district goal of 60% U.S. History EOC score with 62% after third quarter U.S. History Compass test. At current trend, proficiency could reach 70%+ by the end of the school year.
Guided Social Studies teachers in pairing content with appropriate reading strategies and developing higher-level questions for assessments and classroom instruction.
Ensured Social Studies teachers were implementing scientifically researched reading programs. Worked with PDL Specialist to rewrite low rigor questions in textbooks into high-level questions with many in FSA
format. Informed development of U.S. History instruction / re-instruction and selection of targeted reading strategies through
regular data analysis. Modeled strategies to teachers, PLCs, and department meetings. Crafted struggling standards instruction in partnership with U.S. History team. Analyzed U.S. Compass data, identified
patterns, and created U.S. History “Boot Camp” to help students gain better grasp of content. Propelled students’ STAR reading scores 81 points and six percentile rank points on average in one quarter. Average
performance of other classes / departments is either stagnant or only a few points of increase. Contributed to first-year teacher success and retention as Certified APPLES Program Mentor. Played key role in hiring and orienting new Social Studies teacher at midyear as member of hiring team.
Mentored teacher during transition to new environment. Orchestrated and led needs-based staff development programs on topics including: Upping the Rigor with
High-Level Questioning; Creating an Engaging Classroom using Kagan; Monthly PD on Reading Strategies to Increase Curriculum Comprehension; ELA Instructional Shifts; and Class and Team Builders.
SOUTH FORT MYERS HIGH SCHOOL – Fort Myers, FL July 2014 – June 2017 Intensive Reading Teacher, 9th and 10th Grades | AVID Instructor Modeled and delivered lessons in effective, differentiated reading instruction designed to increase student reading comprehension and FSA / STAR test scores. Promoted learning strategies including AVID program to support student growth school-wide; member of AVID Site Team. Sponsored school’s National Honor Society (NHS) branch.
Achieved highest rate of improvement on FSA in school’s reading department. Educated faculty, staff, parents, and students on AVID program and its benefits across curriculum areas by
presenting AVID strategies during pre-school session and at School Choice Open House. Played vital role in positioning at-risk elementary students for future success by collaborating with fellow NHS team
members to develop Mentor Program at Franklin Park Elementary School. Program paired at-risk students with NHS high school students for biweekly reading, math, and science assistance
plus social / emotional support. Mentored and guided MTSS at-risk students through academic and behavioral challenges as appointed MTSS
Mentor. Equipped students to pursue positive behavior that would impact morale, academics, and overall well-being as
member of Positive Behavior Site Team that designed and deployed school-wide PBS program. Reduced behavior problems among female students by co-sponsoring all-girls Student Success Club to instruct
students in anger management and coping skills. Honored college-bound seniors and their academic achievements by working with team to conceptualize, develop, and
implement College Signing Day, a school-wide celebration culminating in college signing ceremony.
246PR/Award # S165A200036
Page e387

Bethany Loescher Lloyd | Page 3 of 3
EAST LEE COUNTY HIGH SCHOOL – Lehigh Acres, FL August 2011 – June 2014 Intensive Reading Teacher, 9th and 10th Grades Implemented learning methods and strategies to improve student reading comprehension and scores on FSA and STAR test instruments. Maintained up-to-date knowledge of current trends in reading instruction by participating in workshops, seminars, conferences, and advanced coursework.
Improved academic performance among lowest 25% of student population (zero failures) by facilitating Lowest 25% Mentor program. Worked with students to develop academic goals and plan for attainment.
Achieved highest growth rate on FSA by developing and leading school-wide FSA “Boot Camp” plus After-School Reading Tutoring program.
Contributed to improved school ranking from “D” to “C” by working with core group of teachers to develop and deploy comprehensive, strategic, and targeted school improvement plan (SIP) to all staff and faculty. SIP involved smaller task force teams focused on goals in reading, writing, math, and science.
Implemented AVID strategies across curriculum school-wide after attending AVID Summer Institute and gaining proficiency in all areas of WICOR. Presented AVID training during pre-school session.
Initiated, launched, and sponsored National Honor Society (NHS) branch at the high school. Ensured school-wide alignment with FCAT requirements by delivering regular faculty presentations during pre-
school session and throughout school year.
Early Career: Account Consultant | SkillSoft | Conducted web-based pilot programs for Fortune 500 clients with 83% contract rate. Thompson NETg | Learning Consultant | Led creation of custom eLearning solutions for major university and large bank. Gartner | Government Sales Manager | Created global eLearning training proposal for U.S. Navy valued at $3M annually.
ED U CA T I ON & SK I L L S
EDISON STATE COLLEGE | Bachelor of Science, Elementary Education | summa cum laude | Reading & ESOL Endorsements
Microsoft Office Suite: Word, Excel, PowerPoint, Outlook, Project
247PR/Award # S165A200036
Page e388

STEVEN WILKIE
Teacher Leader/Advanced Placement Capstone Coordinator
South Fort Myers High School
PROFILE
CONTACT
I have been teaching since 2003 in the school district of Lee County, Florida. My approach to teaching is driven by the relationships I build with my students. I work hard to understand their short- and long-term goals and provide them with the framework that best supports their pursuit of those goals. As a science teacher I look to provide as much hands on, real world experience as possible. Because of this I have been able to author and successfully facilitate a variety of grants that have taken students out of the classroom and into the environment to experience science first hand.
EXPERIENCE
SKILLS
South Fort Myers High School 2005-PRESENT I currently hold the position of Teacher Leader at the school This position requires me to maintain a partial teaching schedule (Honors Biology, AP Biology, AP Seminar, AP Research) while also providing support to teachers and students across the entire school, including the design and delivery of school wide professional development. I coordinate the AP Capstone Diploma program. This program provides students with the opportunity to earn college credit through College Board’s rigorous instruction and examination program.
Effective communicator and
team leader
Technology proficient: o Google Education Suite
Applications o Microsoft Office
Applications o Statistical Analysis
Platforms
Grant writing and
implementation
EDUCATION Barry University 2008-2010 I held the position of Adjunct Science Professor. The focus was on delivering relevant environmental and marine science instruction at the graduate level to non-science degree seeking students.
Florida Gulf Coast University 2011-2018 Masters of Science Degree Research focused on changes in fish population in estuaries of southwest Florida due to habitat alteration.
University of Tampa 1998-2000 Bachelors of Science Degree Majors: Biology and Marine Science Minors: Chemistry and Environmental Science
248248
PR/Award # S165A200036
Page e389

The School District of Lee County Job Description
1
JOB TITLE: Assistant Director, Magnet Schools
FLSA STATUS: Exempt PAY GRADE: 13 SALARY SCHEDULE: Administrator JOB CODE: 100470 BARGAINING UNIT: Non-bargaining DAYS PER YEAR: 255 WORKER’S COMP CATEGORY: 9101 - All Other
MAJOR FUNCTION: Plan, develop, coordinate, and facilitate grants to support the District’s programs, activities, and goals.
MINIMUM QUALIFICATIONS: Master’s degree in educational leadership, administration/supervision,
curriculum and instruction, or other related areas. Certification in educational leadership or administration and supervision. Four (4) years of experience in teaching, educational administration, grant
proposal writing, program development, or combination thereof.
Such alternatives to the above qualifications as the Board may find acceptable. KNOWLEDGE, SKILLS, AND ABILITIES:
Skill in persuasive, technical, and/or legal writing. Knowledge of current research and practice in curriculum, instruction, and
assessment. Knowledge of legislation, regulations, and standards related to management
of major grant programs. Knowledge of the principles of professional development, human resources
management, budgeting, and school law. Oral and written communication skills. Ability to work with diverse groups of people. Knowledge of and experience with industry-standard computer applications.
REPORTS TO: Director, Grants and Program Development or Designated Administrator ESSENTIAL JOB FUNCTIONS:
Assist in the planning, development, and approval of grant proposals in support of District goals and priorities to generate additional revenue for the District.
Supervise the development, analysis, approval, and assessment of grant-funded special projects and pilot programs.
Consult with District employees, external agency and organizational officials, funding representatives, and community members to assess needs and recommend appropriate grant opportunities.
249
PR/Award # S165A200036
Page e390

The School District of Lee County Job Description
2
Advise grant administrators in ensuring compliance with applicable laws, rules, policies, standards, protocols, regulations, and agreements pertaining to grant administration.
Monitor and assess federal and state governmental action and public policy recommendations that may affect future federal and state grant funding and advise appropriate District employees of most likely trends and changes in federal and state grant funding.
OTHER JOB FUNCTIONS:
Attend staff meetings and participate in conferences and other trainings to enhance job performance.
Seek out professional development opportunities and maintain professional licensure and certifications.
Promote the District’s interest in increasing student achievement by working with the educational interests of students in mind at all times.
Maintain positive communication with colleagues, community members, parents, and students to promote an increase in community engagement in education.
Support the retention of Highly Effective and Effective employees by exhibiting professionalism and making positive contributions to workplace morale.
Promote a culture of high performance and continuous improvement by valuing learning and making a commitment to quality.
EXERTION TYPE:
Light work. Position requires exerting up to 20 pounds of force occasionally, and/or up to 10 pounds of force frequently, and/or a negligible amount of force constantly to move objects.
OTHER PHYSICAL REQUIREMENTS: The following selected physical activities are required to perform the essential functions of this position.
The physical requirements of this position. (Please check all boxes that apply)
Physical Requirement
Description Percent of Time
☒ Balancing Maintaining body equilibrium to prevent falling and walking, standing or crouching on narrow, slippery, or erratically moving surfaces. This factor is important if the amount of balancing exceeds that needed for ordinary locomotion and maintenance of body equilibrium.
10%
☒ Climbing Ascending or descending ladders, stairs, scaffolding, ramps, poles and the like, using feet and legs and/or hands and arms. Body agility is emphasized. This factor is important if the amount and kind of climbing required exceeds that required for ordinary locomotion.
10%
☒ Crawling Moving about on hands and knees or hands and feet. 10%
250
PR/Award # S165A200036
Page e391

The School District of Lee County Job Description
3
☒ Crouching Bending the body downward and forward by bending leg and spine. 10%
☒ Feeling Perceiving attributes of objects, such as size, shape, temperature or texture by touching with skin, particularly that of fingertips.
80%
☒ Finger Dexterity
Picking, pinching, typing or otherwise working, primarily with fingers rather than with the whole hand as in handling.
90%
☒ Grasping Applying pressure to an object with the fingers and palm. 80%
☒ Hearing Perceiving the nature of sounds at normal speaking levels with or without correction. Ability to receive detailed information through oral communication, and to make the discriminations in sound.
100%
☒ Kneeling Bending legs at knee to come to a rest on knee or knees. 10%
☒ Lifting Raising objects from a lower to a higher position or moving objects horizontally from position-to-position. This factor is important if it occurs to a considerable degree and requires substantial use of upper extremities and back muscles.
10%
☒ Pulling Using upper extremities to exert force in order to draw, haul, or tug objects in a sustained motion.
10%
☒ Pushing Using upper extremities to press against something with steady force in order to thrust forward, downward, or outward.
10%
☒ Reaching Extending hand(s) and arm(s) in any direction. 10%
☒ Repetitive Motion
Substantial movements (motions) of the wrists, hands, and/or fingers. 80%
☒ Seeing The ability to perceive the nature of objects by the eye. 100%
☒ Sitting Particularly for sustained periods of time. 90%
☒ Standing Particularly for sustained periods of time. 10%
☒ Stooping Bending body downward and forward by bending spine at the waist. This factor is important if it occurs to a considerable degree and requires full motion of the lower extremities and back muscles.
10%
☒ Talking Expressing or exchanging ideas by means of the spoken word. Those activities in which they must convey detailed or important spoken instructions to other workers accurately, loudly, or quickly.
80%
☒ Walking Moving about on foot to accomplish tasks, particularly for long distances or moving from one work site to another.
20%
TERMS OF EMPLOYMENT:
Twelve month year. Salary as established by the Board.
JDE NUMBER: A-21.35 BOARD ADOPTION: 12-6-11
251
PR/Award # S165A200036
Page e392

The School District of Lee County Job Description
4
REVISIONS: 7-31-18 REVIEWED: COMPENSATION & LABOR RELATIONS WILL COMPLETE
Every job duty in a job description need not always be specifically described, and any omission does not preclude the required performance of all duties that are job related.
252
PR/Award # S165A200036
Page e393

S-11.42
P:\Job Descriptions\ Page 1 of 2
TITLE: Grants Specialist QUALIFICATIONS: 1. High School diploma or equivalent.
2. Minimum three years related experience and/or postsecondary education: or equivalent combination of education and experience.
3. Knowledge of legislation, regulations, operating practices, methods, planning, research protocols, and program/fiscal reporting related to management of major grant program.
4. Ability to collaborate and communicate effectively with representatives from federal, state, local, corporate and private grantors.
5. Ability to analyze program and fiscal data and prepare written informational reports.
6. Experience with industry-standard computer applications. 7. Demonstrated skill in oral and written communication. 8. Such alternatives to the above qualifications as the Board
may find appropriate and acceptable. REPORTS TO: Designated Administrator JOB GOAL: To ensure effective and appropriate implementation of major
grant programs by assisting the grand administrator with duties related to grant accountability, application, auditing, communications, compliance, forecasting, management, needs assessment, reporting, and tracking requirements.
ESSENTIAL FUNCTIONS:
1. Prepares, monitors, reviews, and modified grant-related documents, forms, processes, budgets, reports and Web pages.
2. Prepares and submits necessary applications and reports in a timely manner. 3. Uses appropriate technology to track grant budgets, account balances, activities
and operations. 4. Collaborates and communicates with appropriate District personnel, community
grant partners, granting agency representatives, public and private school employees, vendors, and to support grant goals, processes, and requirements.
5. Maintains complete record of grant projects according to applicable requirements.
6. Maintains currency in understanding and communicating legislation, regulations, operating practices, method, planning, research protocols, and program and fiscal reporting related to management of major grant programs.
7. Assists in data collection and analysis as directed. 8. Attends grant-related training, workshops, meeting, and conference.
253
PR/Award # S165A200036
Page e394

S-11.42
P:\Job Descriptions\ Page 2 of 2
OTHER RESPONSIBILITIES: Performs related work as required. (NOTE: The omission of specific statements of
duties does not exclude them from the position if the work is similar, related, or a logical assignment to the position.)
This position may occasionally require overnight, out of county travel. PHYSICAL REQUIREMENTS:
Position requires light work exerting up to 20 pounds of force occasionally and /or up to 10 pounds of force as frequently as need to move objects.
TERMS OF EMPLOYMENT: Twelve-month year. Salary as established by the Board. ASSESSMENT: Performance of this job will be assessed annually in accordance with provisions of
the Board’s policy on assessment of supervisory/technical personnel. Adopted: 10-06-04
254
PR/Award # S165A200036
Page e395

The School District of Lee County Job Description
1
JOB TITLE: Specialist, Family-Community Engagement
FLSA STATUS: Non-exempt PAY GRADE: 6 SALARY SCHEDULE: Support JOB CODE: 505550 BARGAINING UNIT: SPALC DAYS PER YEAR: 187 WORKER’S COMP CATEGORY: 8868 - School Professionals
MAJOR FUNCTION: Connect families and communities to the magnet program offerings and build positive relationships between families and magnet schools.
MINIMUM QUALIFICATIONS: ▪ High School diploma or equivalent. ▪ One (1) year of related work experience in a K-12 school setting.
Such alternatives to the above qualifications as the Board may find acceptable.
KNOWLEDGE, SKILLS, AND ABILITIES:
▪ Oral and written communication skills. ▪ Ability to provide written and oral translation of multiple languages. ▪ Knowledge of and experience with various marketing and social media
platforms. ▪ Ability to work with diverse groups of people. ▪ Knowledge of and experience with industry-standard computer applications.
REPORTS TO: Director, Grants and Program Development or Designated Administrator ESSENTIAL JOB FUNCTIONS:
▪ Work collaboratively with project directors and school-based teams to plan, coordinate, and implement a comprehensive magnet outreach program.
▪ Assist in developing materials to market and promote school programs. ▪ Provide information to families, community members, and community
agencies on each school’s program. ▪ Attend city-wide parent meetings. ▪ Participate in annual school fairs and other recruitment activities on and off
school campuses. ▪ Coordinate presentations about schools. ▪ Help identify and implement a plan to inform families of diverse backgrounds
about school offerings. ▪ Work cooperatively with parent groups and school leadership teams.
OTHER JOB FUNCTIONS:
▪ Attend staff meetings and participate in conferences and other trainings to
enhance job performance.
255
PR/Award # S165A200036
Page e396

The School District of Lee County Job Description
2
▪ Seek out professional development opportunities and maintain professional licensure and certifications.
▪ Promote the District’s interest in increasing student achievement by working with the educational interests of students in mind at all times.
▪ Maintain positive communication with colleagues, community members, parents, and students to promote an increase in community engagement in education.
▪ Support the retention of Highly Effective and Effective employees by exhibiting professionalism and making positive contributions to workplace morale.
▪ Promote a culture of high performance and continuous improvement by valuing learning and making a commitment to quality.
EXERTION TYPE: ▪ Light work. Position requires exerting up to 20 pounds of force occasionally,
and/or up to 10 pounds of force frequently, and/or a negligible amount of force constantly to move objects.
OTHER PHYSICAL REQUIREMENTS: The following selected physical activities are required to perform the essential functions of this position.
The physical requirements of this position. (Please check all boxes that apply)
Physical Requirement
Description Percent of Time
☒ Balancing Maintaining body equilibrium to prevent falling and walking, standing or crouching on narrow, slippery, or erratically moving surfaces. This factor is important if the amount of balancing exceeds that needed for ordinary locomotion and maintenance of body equilibrium.
10%
☒ Climbing Ascending or descending ladders, stairs, scaffolding, ramps, poles and the like, using feet and legs and/or hands and arms. Body agility is emphasized. This factor is important if the amount and kind of climbing required exceeds that required for ordinary locomotion.
10%
☒ Crawling Moving about on hands and knees or hands and feet. 10%
☒ Crouching Bending the body downward and forward by bending leg and spine. 10%
☒ Feeling Perceiving attributes of objects, such as size, shape, temperature or texture by touching with skin, particularly that of fingertips.
10%
☒ Finger Dexterity
Picking, pinching, typing or otherwise working, primarily with fingers rather than with the whole hand as in handling.
80%
☒ Grasping Applying pressure to an object with the fingers and palm. 10%
☒ Hearing Perceiving the nature of sounds at normal speaking levels with or without correction. Ability to receive detailed information through oral communication, and to make the discriminations in sound.
100%
256
PR/Award # S165A200036
Page e397

The School District of Lee County Job Description
3
☒ Kneeling Bending legs at knee to come to a rest on knee or knees. 10%
☒ Lifting Raising objects from a lower to a higher position or moving objects horizontally from position-to-position. This factor is important if it occurs to a considerable degree and requires substantial use of upper extremities and back muscles.
10%
☒ Pulling Using upper extremities to exert force in order to draw, haul, or tug objects in a sustained motion.
10%
☒ Pushing Using upper extremities to press against something with steady force in order to thrust forward, downward, or outward.
10%
☒ Reaching Extending hand(s) and arm(s) in any direction. 10%
☒ Repetitive Motion
Substantial movements (motions) of the wrists, hands, and/or fingers. 80%
☒ Seeing The ability to perceive the nature of objects by the eye. 100%
☒ Sitting Particularly for sustained periods of time. 60%
☒ Standing Particularly for sustained periods of time. 20%
☒ Stooping Bending body downward and forward by bending spine at the waist. This factor is important if it occurs to a considerable degree and requires full motion of the lower extremities and back muscles.
10%
☒ Talking Expressing or exchanging ideas by means of the spoken word. Those activities in which they must convey detailed or important spoken instructions to other workers accurately, loudly, or quickly.
70%
☒ Walking Moving about on foot to accomplish tasks, particularly for long distances or moving from one work site to another.
20%
TERMS OF EMPLOYMENT:
Work year and salary as established by the Board and SPALC bargaining unit through the collective bargaining process.
JDE NUMBER: S-11.43 BOARD ADOPTION: 2-13-18 REVISIONS: 12-11-18 REVIEWED: COMPENSATION & LABOR RELATIONS WILL COMPLETE
Every job duty in a job description need not always be specifically described, and any omission does not preclude the required performance of all duties that are job related.
257
PR/Award # S165A200036
Page e398

The School District of Lee County Job Description
1
JOB TITLE: Teacher, Learning and Leadership
FLSA STATUS: Exempt PAY GRADE: Instructional SALARY SCHEDULE: Instructional JOB CODE: 307690 BARGAINING UNIT: TALC DAYS PER YEAR: 226 WORKER’S COMP CATEGORY: 8868 - School Professionals
MAJOR FUNCTION: Provide high quality professional development and instruction that leads to improved educator effectiveness and student achievement.
MINIMUM QUALIFICATIONS: ▪ Bachelor’s degree or higher; Master’s degree preferred. ▪ Valid Florida professional teaching certificate in assigned subject area/grade
level. ▪ Four (4) years or more of creditable teaching experience. ▪ One (1) year or more of teaching experience in the School District of Lee County. ▪ Two (2) years or more of Highly Effective or Effective Manager’s ratings. ▪ Two (2) years or more of Highly Effective or Effective Value Added Model (VAM)
ratings. ▪ Successful completion of the School District of Lee County Clinical Educator
training.
Such alternatives to the above qualifications as the Board may find acceptable.
KNOWLEDGE, SKILLS, AND ABILITIES: ▪ Written, verbal, and listening skills; organizational skills. ▪ Skill in presentation development and delivery to adult learners. ▪ Ability to assist with the implementation of practical strategies, plans, and
solutions to identified issues and problems. ▪ Ability to work with diverse groups of people. ▪ Ability to establish and maintain collaborative relationships. ▪ Knowledge of and experience with industry-standard computer applications.
REPORTS TO: Designated Supervisor or Designated Administrator ESSENTIAL JOB FUNCTIONS:
▪ Instruct students approximately 20% of the time and fulfill leadership duties 80% of the time.
▪ Design and deliver professional learning opportunities at the school and District level for administrators, faculty, and staff.
▪ Provide one-on-one and group mentoring to apprentice, mentor, and career teachers.
▪ Visit schools to research learning needs, observe lessons, and give feedback through the utilization of an instructional coaching cycle.
258
PR/Award # S165A200036
Page e399

The School District of Lee County Job Description
2
▪ Work collaboratively with building principals, assistant principals, and peer collaborative teachers to create plans to address site-based professional learning needs.
▪ Provide a schedule of activities including lesson plans and a professional development calendar to be shared with teachers and administrators.
▪ Assist in identifying and developing future leaders in the District.
OTHER JOB FUNCTIONS: ▪ Attend staff meetings and participate in conferences and other trainings to
enhance job performance. ▪ Seek out professional development opportunities and maintain professional
licensure and certifications. ▪ Promote the District’s interest in increasing student achievement by working
with the educational interests of students in mind at all times. ▪ Maintain positive communication with colleagues, community members,
parents, and students to promote an increase in community engagement in
education. ▪ Support the retention of Highly Effective and Effective employees by exhibiting
professionalism and making positive contributions to workplace morale. ▪ Promote a culture of high performance and continuous improvement by valuing
learning and making a commitment to quality.
EXERTION TYPE: ▪ Light work. Position requires exerting up to 20 pounds of force occasionally,
and/or up to 10 pounds of force frequently, and/or a negligible amount of force constantly to move objects.
OTHER PHYSICAL REQUIREMENTS: The following selected physical activities are required to perform the essential functions of this position.
259
PR/Award # S165A200036
Page e400

The School District of Lee County Job Description
3
The physical requirements of this position. (Please check all boxes that apply)
Physical Requirement
Description Percent of Time
☒ Balancing Maintaining body equilibrium to prevent falling and walking, standing or crouching on narrow, slippery, or erratically moving surfaces. This factor is important if the amount of balancing exceeds that needed for ordinary locomotion and maintenance of body equilibrium.
10%
☒ Climbing Ascending or descending ladders, stairs, scaffolding, ramps, poles and the like, using feet and legs and/or hands and arms. Body agility is emphasized. This factor is important if the amount and kind of climbing required exceeds that required for ordinary locomotion.
10%
☒ Crawling Moving about on hands and knees or hands and feet. 10%
☒ Crouching Bending the body downward and forward by bending leg and spine. 10%
☒ Feeling Perceiving attributes of objects, such as size, shape, temperature or texture by touching with skin, particularly that of fingertips.
30%
☒ Finger Dexterity
Picking, pinching, typing or otherwise working, primarily with fingers rather than with the whole hand as in handling.
70%
☒ Grasping Applying pressure to an object with the fingers and palm. 30%
☒ Hearing Perceiving the nature of sounds at normal speaking levels with or without correction. Ability to receive detailed information through oral communication, and to make the discriminations in sound.
100%
☒ Kneeling Bending legs at knee to come to a rest on knee or knees. 10%
☒ Lifting Raising objects from a lower to a higher position or moving objects horizontally from position-to-position. This factor is important if it occurs to a considerable degree and requires substantial use of upper extremities and back muscles.
10%
☒ Pulling Using upper extremities to exert force in order to draw, haul, or tug objects in a sustained motion.
10%
☒ Pushing Using upper extremities to press against something with steady force in order to thrust forward, downward, or outward.
10%
☒ Reaching Extending hand(s) and arm(s) in any direction. 30%
☒ Repetitive Motion
Substantial movements (motions) of the wrists, hands, and/or fingers. 10%
☒ Seeing The ability to perceive the nature of objects by the eye. 100%
☒ Sitting Particularly for sustained periods of time. 70%
☒ Standing Particularly for sustained periods of time. 10%
☒ Stooping Bending body downward and forward by bending spine at the waist. 10%
260
PR/Award # S165A200036
Page e401

The School District of Lee County Job Description
4
This factor is important if it occurs to a considerable degree and requires full motion of the lower extremities and back muscles.
☒ Talking Expressing or exchanging ideas by means of the spoken word. Those activities in which they must convey detailed or important spoken instructions to other workers accurately, loudly, or quickly.
90%
☒ Walking Moving about on foot to accomplish tasks, particularly for long distances or moving from one work site to another.
30%
TERMS OF EMPLOYMENT:
Work year and salary as established by the Board and the TALC bargaining unit through the collective bargaining process.
JDE NUMBER: T-1.16 BOARD ADOPTION: 4-10-18 REVISIONS: 12-11-18 REVIEWED: COMPENSATION & LABOR RELATIONS WILL COMPLETE
Every job duty in a job description need not always be specifically described, and any omission does not preclude the required performance of all duties that are job related.
261
PR/Award # S165A200036
Page e402

The School District of Lee County Job Description
1
JOB TITLE: Athletic Trainer
FLSA STATUS: Exempt PAY GRADE: Instructional SALARY SCHEDULE: Instructional JOB CODE: 300350 BARGAINING UNIT: TALC DAYS PER YEAR: 196 WORKER’S COMP CATEGORY: 8868 - School Professionals
MAJOR FUNCTION: Develop, monitor, and participate in a successful preventive and injury treatment program in a safe and cost-effective manner that supports the goals of the District.
MINIMUM QUALIFICATIONS: ▪ Bachelor’s degree in athletics or related field. ▪ Valid Florida Athletic Trainer License (Florida Statute XII, Section 468, Level II,
s. 1012.56 or s. 1012.57). ▪ Valid First Aid/CPR/AED certificate issued by the American Heart Association,
American Red Cross, or entity approved by the Florida Department of Health. ▪ Fifteen (15) hours in courses such as care and prevention of athletic injuries,
anatomy, physiology, nutrition, counseling, and or similar courses.
Such alternatives to the above qualifications as the Board may find acceptable. KNOWLEDGE, SKILLS, AND ABILITIES:
▪ Ability to work flexible hours and work days. ▪ Ability to work in indoor and outdoor environments. ▪ Oral and written communication skills. ▪ Ability to work with diverse groups of people. ▪ Knowledge of and experience with industry-standard computer applications.
REPORTS TO: Principal or Designated Administrator ESSENTIAL JOB FUNCTIONS:
▪ Work with the Activities/Athletic Director in developing injury treatment and prevention programs.
▪ Establish work schedules of assigned first responders to provide coverage for athletic events.
▪ Meet with first responders at each school site on a regular basis to determine coverage needs for athletic events, provide updates, and discuss topics/issues related to students and programs.
▪ Work in conjunction with the Activities/Athletic Director and coordinate a sports physical program for all sports/genders with appropriate health facility.
262
PR/Award # S165A200036
Page e403

The School District of Lee County Job Description
2
▪ Report all major injuries to the appropriate administrator and head coach within mandatory time limits.
▪ Consult with the treating physician the appropriate method of treatment for the injury.
▪ Consult with the head coach to determine an athlete’s level of participation in a sport and the treatment being used.
▪ Schedule and conduct, in conjunction with the head coach, training for student athletes on injury prevention and proper conditioning for individual sports.
▪ Communicate with parents the specific rehabilitation programs for the student.
▪ Complete and file insurance claim forms/reports in a timely manner. ▪ Allocate time between sports on an equitable basis. ▪ Abide by and enforce School Board and Florida High School Athletic
Association policies on tobacco, alcohol, and drugs. ▪ Schedule and attend meeting with Activities/Athletic Directors and/or head
coaches to evaluate the performance of established programs. ▪ Adhere to District policies and procedures. ▪ Assist in the recruitment of trainers.
OTHER JOB FUNCTIONS:
▪ Attend staff meetings and participate in conferences and other trainings to enhance job performance.
▪ Seek out professional development opportunities and maintain professional licensure and certifications.
▪ Promote the District’s interest in increasing student achievement by working with the educational interests of students in mind at all times.
▪ Maintain positive communication with colleagues, community members, parents, and students to promote an increase in community engagement in education.
▪ Support the retention of Highly Effective and Effective employees by exhibiting professionalism and making positive contributions to workplace morale.
▪ Promote a culture of high performance and continuous improvement by valuing learning and making a commitment to quality.
EXERTION TYPE:
▪ Light work. Position requires exerting up to 20 pounds of force occasionally, and/or up to 10 pounds of force frequently, and/or a negligible amount of force constantly to move objects.
OTHER PHYSICAL REQUIREMENTS: The following selected physical activities are required to perform the essential functions of this position.
The physical requirements of this position. (Please check all boxes that apply)
Physical Description Percent
263
PR/Award # S165A200036
Page e404

The School District of Lee County Job Description
3
Requirement of Time
☒ Balancing Maintaining body equilibrium to prevent falling and walking, standing or crouching on narrow, slippery, or erratically moving surfaces. This factor is important if the amount of balancing exceeds that needed for ordinary locomotion and maintenance of body equilibrium.
10%
☒ Climbing Ascending or descending ladders, stairs, scaffolding, ramps, poles and the like, using feet and legs and/or hands and arms. Body agility is emphasized. This factor is important if the amount and kind of climbing required exceeds that required for ordinary locomotion.
10%
☒ Crawling Moving about on hands and knees or hands and feet. 10%
☒ Crouching Bending the body downward and forward by bending leg and spine. 10%
☒ Feeling Perceiving attributes of objects, such as size, shape, temperature or texture by touching with skin, particularly that of fingertips.
80%
☒ Finger Dexterity
Picking, pinching, typing or otherwise working, primarily with fingers rather than with the whole hand as in handling.
90%
☒ Grasping Applying pressure to an object with the fingers and palm. 10%
☒ Hearing Perceiving the nature of sounds at normal speaking levels with or without correction. Ability to receive detailed information through oral communication, and to make the discriminations in sound.
100%
☒ Kneeling Bending legs at knee to come to a rest on knee or knees. 10%
☒ Lifting Raising objects from a lower to a higher position or moving objects horizontally from position-to-position. This factor is important if it occurs to a considerable degree and requires substantial use of upper extremities and back muscles.
10%
☒ Pulling Using upper extremities to exert force in order to draw, haul, or tug objects in a sustained motion.
10%
☒ Pushing Using upper extremities to press against something with steady force in order to thrust forward, downward, or outward.
10%
☒ Reaching Extending hand(s) and arm(s) in any direction. 10%
☒ Repetitive Motion
Substantial movements (motions) of the wrists, hands, and/or fingers. 80%
☒ Seeing The ability to perceive the nature of objects by the eye. 100%
☒ Sitting Particularly for sustained periods of time. 50%
☒ Standing Particularly for sustained periods of time. 30%
☒ Stooping Bending body downward and forward by bending spine at the waist. This factor is important if it occurs to a considerable degree and requires full motion of the lower extremities and back muscles.
10%
☒ Talking Expressing or exchanging ideas by means of the spoken word. Those 80%
264
PR/Award # S165A200036
Page e405

The School District of Lee County Job Description
4
activities in which they must convey detailed or important spoken instructions to other workers accurately, loudly, or quickly.
☒ Walking Moving about on foot to accomplish tasks, particularly for long distances or moving from one work site to another.
20%
TERMS OF EMPLOYMENT:
Work year and salary as established by the Board and the TALC bargaining unit through the collective bargaining process.
JDE NUMBER: T-16.03 BOARD ADOPTION: 9-28-05 REVISIONS: 8-15-06, 10-23-12, 11-7-18 REVIEWED: COMPENSATION & LABOR RELATIONS WILL COMPLETE
Every job duty in a job description need not always be specifically described, and any omission does not preclude the required performance of all duties that are job related.
265
PR/Award # S165A200036
Page e406

The School District of Lee County Job Description
1
JOB TITLE: Teacher, Classroom
FLSA STATUS: Exempt PAY GRADE: Instructional SALARY SCHEDULE: Instructional JOB CODE: Multiple BARGAINING UNIT: TALC DAYS PER YEAR: 196, 201, 206,
216, 226, 255, Casual
WORKER’S COMP CATEGORY: 8868 - School Professionals
MAJOR FUNCTION:
Lead students toward the fulfillment of their potential for intellectual, emotional, physical, and social growth in a safe and cost-effective manner that supports the goals of the District.
MINIMUM QUALIFICATIONS: Bachelor’s degree from an accredited institution. Valid Florida teaching certificate covering appropriate area of responsibility.
Such alternatives to the above qualifications as the Board may find acceptable.
KNOWLEDGE, SKILLS, AND ABILITIES:
Oral and written communication skills. Knowledge of and experience with industry-standard computer applications. Ability to work with diverse groups of people. Ability to work effectively under stress of deadlines, volume of workload, and
multitasking requirements. Ability to organize self, prioritize tasks, and maintain a high level of energy in
a fast-paced environment to provide efficient services. REPORTS TO: Principal or Designated Administrator ESSENTIAL JOB FUNCTIONS:
Plan individually or cooperatively a program of study that meets the individual needs, interests, diverse backgrounds, and abilities of students.
Assist in establishing department or grade-level curriculum objectives and the development of the comprehensive plan for the implementation and evaluation of the objectives.
Create a classroom environment that is conducive to learning and appropriate to the maturity and interests of students.
Guide the learning process toward the achievement of curriculum goals and, in harmony with the goals, establish clear objectives for all lessons, units, projects, and the like to communicate these objectives to students.
Employ instructional methods and materials that are most appropriate for meeting stated objectives.
266
PR/Award # S165A200036
Page e407

The School District of Lee County Job Description
2
Assess the accomplishments of students on a regular basis and provide progress reports as required.
Diagnose the learning strengths and weaknesses of students on a regular basis, seeking the assistance of District specialists as deemed appropriate.
Counsel with colleagues, students, and/or parents on a regular basis. Assist administration in implementing all policies and/or rules governing
student life and conduct and, for the classroom, develop reasonable rules of classroom behavior and procedures and maintain order in the classroom in a fair and just manner.
Plan and supervise purposeful assignments for support personnel and school volunteers to work cooperatively with department heads or grade level chairmen; evaluate their effectiveness.
Use appropriate technology in teaching and the learning process. Maintain accurate, complete, and correct records and reports as required by
law, District policy, and administrative regulation. Adhere to the Code of Ethics of the Education Profession in Florida and meet
all school and District policy requirements. Support school improvement initiatives by actively participating in school
activities, services, and programs. Recognize overt indicators of student distress or abuse and take appropriate
action based on school procedures and law. Establish an appropriate testing environment and test security.
OTHER JOB FUNCTIONS:
Attend staff meetings and participate in conferences and other trainings to
enhance job performance. Seek out professional development opportunities and maintain professional licensure and certifications. Promote the District’s interest in increasing student achievement by working
with the educational interests of students in mind at all times. Maintain positive communication with colleagues, community members, parents, and students to promote an increase in community engagement in education. Support the retention of Highly Effective and Effective employees by
exhibiting professionalism and making positive contributions to workplace morale.
Promote a culture of high performance and continuous improvement by
valuing learning and making a commitment to quality. EXERTION TYPE:
Light work. Position requires exerting up to 20 pounds of force occasionally, and/or up to 10 pounds of force frequently, and/or a negligible amount of force constantly to move objects.
OTHER PHYSICAL REQUIREMENTS:
267
PR/Award # S165A200036
Page e408

The School District of Lee County Job Description
3
The following selected physical activities are required to perform the essential functions of this position.
The physical requirements of this position. (Please check all boxes that apply)
Physical Requirement
Description Percent of Time
☒ Balancing Maintaining body equilibrium to prevent falling and walking, standing or crouching on narrow, slippery, or erratically moving surfaces. This factor is important if the amount of balancing exceeds that needed for ordinary locomotion and maintenance of body equilibrium.
10%
☒ Climbing Ascending or descending ladders, stairs, scaffolding, ramps, poles and the like, using feet and legs and/or hands and arms. Body agility is emphasized. This factor is important if the amount and kind of climbing required exceeds that required for ordinary locomotion.
10%
☒ Crawling Moving about on hands and knees or hands and feet. 10%
☒ Crouching Bending the body downward and forward by bending leg and spine. 20%
☒ Feeling Perceiving attributes of objects, such as size, shape, temperature or texture by touching with skin, particularly that of fingertips.
80%
☒ Finger Dexterity
Picking, pinching, typing or otherwise working, primarily with fingers rather than with the whole hand as in handling.
100%
☒ Grasping Applying pressure to an object with the fingers and palm. 40%
☒ Hearing Perceiving the nature of sounds at normal speaking levels with or without correction. Ability to receive detailed information through oral communication, and to make the discriminations in sound.
100%
☒ Kneeling Bending legs at knee to come to a rest on knee or knees. 10%
☒ Lifting Raising objects from a lower to a higher position or moving objects horizontally from position-to-position. This factor is important if it occurs to a considerable degree and requires substantial use of upper extremities and back muscles.
10%
☒ Pulling Using upper extremities to exert force in order to draw, haul, or tug objects in a sustained motion.
10%
☒ Pushing Using upper extremities to press against something with steady force in order to thrust forward, downward, or outward.
10%
☒ Reaching Extending hand(s) and arm(s) in any direction. 10%
☒ Repetitive Motion
Substantial movements (motions) of the wrists, hands, and/or fingers. 90%
☒ Seeing The ability to perceive the nature of objects by the eye. 100%
☒ Sitting Particularly for sustained periods of time. 30%
☒ Standing Particularly for sustained periods of time. 40%
268
PR/Award # S165A200036
Page e409

The School District of Lee County Job Description
4
☒ Stooping Bending body downward and forward by bending spine at the waist. This factor is important if it occurs to a considerable degree and requires full motion of the lower extremities and back muscles.
10%
☒ Talking Expressing or exchanging ideas by means of the spoken word. Those activities in which they must convey detailed or important spoken instructions to other workers accurately, loudly, or quickly.
90%
☒ Walking Moving about on foot to accomplish tasks, particularly for long distances or moving from one work site to another.
30%
TERMS OF EMPLOYMENT:
Work year and salary as established by the Board and the TALC bargaining unit through the collective bargaining process.
JDE NUMBER: T-1.04 BOARD ADOPTION: 12-20-74 REVISIONS: 8-15-06, 11-7-18 REVIEWED: COMPENSATION & LABOR RELATIONS WILL COMPLETE
Every job duty in a job description need not always be specifically described, and any omission does not preclude the required performance of all duties that are job related.
269
PR/Award # S165A200036
Page e410

270
PR/Award # S165A200036
Page e411

271
PR/Award # S165A200036
Page e412

May 5, 2020 Terri Kinsey, Ed.D. Assistant Director, Grants and Program Development Magnet Grant Project Director THE SCHOOL DISTRICT OF LEE COUNTY 2855 Colonial Blvd, Fort Myers, FL 33966
Dear Terri,
This letter confirms UCLA GSE&IS-CRESST s commitment to partner with the School District of Lee County on the application to Magnet Schools Assistance Program (MSAP), Federal Register 84 FR 3768. We see this as a very exciting opportunity to continue our current collaboration and success in winning the earlier MSAP grant in 2017.
The UCLA evaluation team has many years of experience conducting similar studies, including evaluations of magnet schools funded under MSAP (e.g., Lee County, Los Angeles, New Haven), charter schools (e.g., Green Dot), and i3 validation grants (e.g., Literacy Design Collaborative). We have many peer-reviewed publications based on our prior magnet work (e.g. Wang, Herman, & Dockterman, 2018; Wang & Herman, 2017; Wang, Schweig, 2014 & 2017).
Our rich history in studies of the implementation and effects of school reform programs particularly positions us to understand and be sensitive to MSAP’s intended outcomes and the factors that are likely to influence its success. The same CRESST team has been engaged in the evaluation of magnet schools on student learning and teacher effectiveness since June 2010. We worked with 11 MSAP grant awardees in the 2010 cycle, 9 MSAP grant awardees in the 2013 cycle, 4 MSAP grant awardees in the 2016 cycle, and 6 MSAP grant awardees in the 2017 cycle.
I am committing between and starting October 2020 over 12 month period for the entire life of the grant to the work of the Center. As principal investigator at UCLA as sub, I will serve as the CRESST team lead, providing intellectual leadership and oversight for all technical aspects of the project as well as provide technical quality control for all project
272PR/Award # S165A200036
Page e413

publications, documents, and dissemination. I will lead all quantitative design and analysis for CRESST’s work.
Thank you for the opportunity to participate in this exciting project. I look forward to working with you and your colleagues. Please let us know if you need any need any additional information from us.
Sincerely
Adjunct Professor and Senior Research Scientist
273PR/Award # S165A200036
Page e414

274
PR/Award # S165A200036
Page e415

May 20, 2020 Dr. Gregory K. Adkins, Ed.D. School District of Lee County 2855 Colonial Blvd. Fort Myers, FL 33966 Dr. Adkins, I am writing in support of the School District of Lee County applying for the federal Magnet Schools Assistance Program (MSAP). We believe with funding from this grant, the programs that would be supported would benefit the students and schools to which it will be focused. Please know that the Diversity & Inclusion Department is in support of this grant application and the uses for which it is intended. Additionally, the federal Magnet Schools Assistance Program supports the district’s Equity and Diversity Advisory Committee’s mission, “To monitor the District’s maintenance of a unitary school system and adherence to School Board Policies concerning equity and diversity.” and vision for creating “A community where individuals feel safe, cared for, and connected as one; all having access to equity, feeling included to cultivate diversity and inclusiveness.” Sincerely,
Jarrett Eady Director Diversity and Inclusion
DIVERSITY & INCLUSION
DocuSign Envelope ID: 81F87CEA-1A92-477A-97A3-4BD6682167BA
275PR/Award # S165A200036
Page e416

A Space Created bySouthwest Florida Community Foundation
2031 Jackson Street • Fort Myers, Florida 33901 • fax www.floridacommunity.com • www.floridacollaboratory.com
May 4, 2020
Dr. Gregory K. Adkins, Ed.D. School District of Lee County 2855 Colonial Blvd. Fort Myers, FL 33966
Dr. Adkins, On behalf of Southwest Florida Community Foundation and the FutureMakers Coalition, please accept this letter as notice of my support of the Magnet Schools Assistance Program (MSAP). It is my understanding that the MSAP participants use specialized attractor programs to appeal to diverse student population, resulting in an enriched learning experience for all students. The expansion of the Arts and Science programs in MSAP schools here in Lee County is already showing great success in increasing student engagement and achievement. The new proposed projects address programs of excellence ranging from enhanced Career Academies, the Cambridge AICE program to science, technology, engineering, and mathematics (STEM) and are particularly appealing. By providing James Stephens International Academy with the needed curriculum, equipment, supplies, and teacher development, this school will be in a better position to attract more students and provide them with programs of academic excellence. This school will be able to benefit from this proposal by integrating STEM into every classroom on campus. Additionally, South Fort Myers High School plans to enhance their Career Academies and add Cambridge/AICE program to their academic offerings. The students deserve to be offered challenging opportunities through Career Academies in the areas of Health & Safety, Technology, Automotive/Construction and Hospitality, to not only release their full potential, but also earn industry certifications and potential internships.
I am pleased to lend my support for Lee County’s grant application to the Magnet Schools Assistance Program.
Sincerely,
Sarah Owen
276
PR/Award # S165A200036
Page e417

PR/Award # S165A200
Page e418

278
PR/Award # S165A200036
Page e419

279PR/Award # S165A200036
Page e420

280
PR/Award # S165A200036
Page e421

281
PR/Award # S165A200036
Page e422

IMAG His to r y & Sc ience Cen te r | 2000 Cran fo rd Avenue | Fo r t Myers , FL 33916 | the IMAG.org |
Discover Your Fun at the IMAG!
May 18, 2020 Dr. Gregory K. Adkins, Ed.D. School District of Lee County 2855 Colonial Blvd. Fort Myers, FL 33966 Dr. Adkins, I am writing in support of the School District of Lee County applying for federal funding through the Magnet Schools Assistance Program (MSAP). It is my understanding that the MSAP participants use specialized attractor programs to appeal to diverse student population, resulting in an enriched learning experience for all students. By providing James Stephens International Academy with the needed curriculum, equipment, supplies, and teacher development, this school will be in a better position to attract more students and provide them with programs of academic excellence. This school will be able to benefit from this proposal by integrating STEM into every classroom on campus. IMAG is proud to have a long history of partnering with the district on student enrichment and professional development projects. IMAG is available to support the District’s efforts through opportunities for internships, professional development programs for teachers, STEM based activities for field trips, and other related programs. I am pleased to lend my support for this grant application to the Magnet Schools Assistance Program. Sincerely,
Matthew Johnson Executive Director IMAG History & Science Center
282PR/Award # S165A200036
Page e423

Whitaker Center for STEM Education Brian Johnson, Ph.D., Interim Director
10501 FGCU Boulevard South Fort Myers, Florida 33965-6565 http://www.fgcu.edu/WhitakerCenter
An Affirmative Action Equal Opportunity Employer A member of the State University System of Florida
19 May 2020
Dr. Gregory K. Adkins, Ed.D. School District of Lee County 2855 Colonial Blvd. Fort Myers, FL 33966 Dear Dr. Adkins, I am writing in support of the School District of Lee County applying for federal funding through the Magnet Schools Assistance Program (MSAP). It is my understanding that the MSAP participants use specialized attractor programs to appeal to diverse student populations, resulting in an enriched learning experience for all students. By providing James Stephens International Academy with the needed curriculum, equipment, supplies, and teacher development, this school will be in a better position to attract more students and provide them with programs of academic excellence. This school will benefit from this proposal by integrating STEM into every classroom on campus. The Whitaker Center for STEM Education at Florida Gulf Coast University provides high quality STEM Education programming for both K-12 students and faculty. We will welcome applications from students of James Stephens International Academy in summer activities such as our Coding Academy, and we have supported teachers from all over the district in our Schulze Summer STEM Institutes for several years. I am pleased to lend my support for this grant application to the Magnet Schools Assistance Program. Sincerely,
Brian Johnson Interim Director, Whitaker Center for STEM Education Associate Professor, Department of Mathematics Florida Gulf Coast University
283 S165A200036
Page e424

6835 International Center Blvd., #4, Fort Myers, Florida 33912 | www.bia.net
May 20, 2020
Dr. Gregory K. Adkins, Ed.D. School District of Lee County 2855 Colonial Blvd. Fort Myers, FL 33966
Dr. Adkins, I am writing in support of the School District of Lee County applying for the federal funding through the Magnet Schools Assistance Program (MSAP). It is my understanding that the MSAP participants use specialized attractor programs to appeal to diverse student population, resulting in an enriched learning experience for all students.
By providing South Fort Myers High School with the needed curriculum, equipment, supplies, and teacher development, this school will be in a better position to attract more students and provide them with programs of academic excellence. This school plans to enhance their Career Academies and add Cambridge/AICE program to their academic offerings. The students deserve to be offered challenging opportunities through Career Academies in the areas of Health & Safety, Technology, Automotive/Construction and Hospitality, to not only release their full potential, but also earn industry certifications and potential internships. I am pleased to lend my support for Lee County’s grant application to the Magnet Schools Assistance Program.
Sincerely,
Phillip Ford
Executive Vice President
`
284PR/Award # S165A200036
Page e425

FLORIDA GULF COAST
UNIVERSilY
u .A. WHITAKER COLLEGE OF ENGINEERING
May 18, 2020
Dr. Gregory K. Adkins, Ed.D.
School District of Lee County
2855 Colonial Blvd.
Fort Myers, FL 33966
Dr. Adkins,
I am writing in support of the School District of Lee County applying for the federal
funding through the Magnet Schools Assistance Program (MSAP). It is my
understanding that the MSAP participants use specialized attractor programs to
appeal to diverse student population, resulting in an enriched learning experience for
all students.
By providing South Fort Myers High School with the needed curriculum, equipment,
supplies, and teacher development, this school will be in a better position to attract
more students and provide them with programs of academic excellence. This school
plans to enhance their Career Academies and add Cambridge/AICE program to their
academic offerings. The students deserve to be offered challenging opportunities
through Career Academies in the areas of Health & Safety, Technology, Automotive/Construction and Hospitality, to not only release their full potential, but also earn
industry certifications and potential internships.
I am pleased to lend my support for Lee County’s grant application to the Magnet
Schools Assistance Program.
Sincerely,
Craig D. Capano, Ph.D.,CPCProfessor and ChairDepartment of Construction Management
10501 FGCU Boulevard South, Fort Myers, Florida 33965-6565 • • http://www.fgcu.edu An Affirmative Action Equal Opportunity Employer • A member of the State University System of Florida
'-I 285
PR/Award # S165A200036
Page e426

286PR/Award # S165A200036
Page e427

Lee County District Level Logic Model
INPUTS District level -MSAP financial support for project director and 2 full-time staff -District support, policies, and personnel -Knowledge of research-based interventions and marketing School level -School leadership and MSAP staff (Magnet Lead Teacher and Magnet Theme Teacher(s) -Teachers’ knowledge, skills, and experience -Student interests, needs, skills, and knowledge -Parents -Experts
ACTIVITIES District Level -Manage project budget -Promote magnet program offerings to diverse families -Accept applications for magnet lottery School level -Host recruitment events -Revise core academics -Develop/Integrate magnet themes -Develop teachers’ skills- Provide 40 hrs. PD (Yr. 1) and 50 hrs PD (Yrs 2-5) for magnet theme development and implementation, and the same amount for school improvement. -Plan student/family and community theme events
OUTPUTS District Level -MSAP funds used as described in approved application or modifications. -Large/diverse applicant pool. -Diverse enrollment lists. School level -Large/diverse applicant pool. Quality Magnet C&I: High quality peer reviewed units that integrate themes with core academics. Discrete magnet classes. -New or improved instructional practices used by teachers -2+ theme integrated family and community events per year
LONG-TERM OUTCOMES
District Level -5-year targets attained -Compliance review meets USDOE criteria. Project Performance Measures (PMs) -PMs 1.1-1.4: Reduced MGI and SES isolation -PM 2.1-2.2:100% of magnet units are high quality -PM 3.1-3.2: Magnet theme dosage equals 10 hours per week -PM 4.1-4.6: Increased ELA, math & science proficiency -PM 4.7-4.8: Student master y of magnet curriculum -PM 5.1-5.2: +240 hrs. PD resulting in high quality magnet theme instruction -PM 7.1-7.2: Highest number of parents attained.
MID-TERM OUTCOMES
District Level -APR approved Annual Performance Measures (PMs) - PMs 1.1-1.4: Reduced MGI and SES isolation -PMs 6.1-6.2: Classes are heterogeneous -PMs 2.1-2.2, 3.1-3.2: Unit quality and dosage targets attained -PMs 4.1-4.8: Increased ELA, math & science proficiency -PMs 5.1-5.4: 40 hrs. (Yr. 1) and 50 hrs. PD (Yrs. 2-5) attained. -PMs 7.1-7.2: Increased annual number of parents attained.
SHORT-TERM OUTCOMES
District Level -Fidelity to budget -Applicant pool benchmarks attained School Level -Classes reflect racial/ ethnic enrollment of grade or school. - % of units meeting peer review quality criteria on track to attain target -Planned/Implemented Magnet Curriculum Dosage on track to attain target -PD planned/ implemented on track to attain target for magnet theme and school improvement related PD -Number of parents participating in school events on track to attain target
CONTEXT Continually growing large county population and student enrollment Residents are primarily geographically segregated by race and socioeconomics Disconnected community of retirees, part-time residents, already raised children in the North
287
PR/Award # S165A200036
Page e428

James Stephens Elementary: A STEM Magnet School
INPUTS
MSAP Financial Support for project director, MRTs, professional development, supplies /materials, etc. School Leadership and MSAP Personnel (1 full‐time STEM teacher and 1 magnet lead teacher) Teachers’ Knowledge, Skills and Experiences Students Interests, Needs, Skills and knowledge Partners Parents
ACTIVITIES Desegregation: Student Recruitment Develop School Recruitment Plan, open houses, school tours, brochure development, and parent focus groups Improvement of Curriculum, Instruction and Student Academic Supports Utilizing: STEM integration, Engineering is Elementary, Kagan, Reading Recovery, UDL, UbD, and Personalized Learning Magnet Theme Integration Into core content including work with thematic partners including: IMAG Science and History museum, FGCU STEM Whitaker Center and other science organizations Professional Development STEM integration, Kagan, Reading Recovery; Engineering is Elementary, and local scientists and engineers Parent Involvement Planning
OUTPUTS
Desegregation Diverse applicant pool positioned to decrease MGI of Black, maintain Hispanic students Quality Magnet Curriculum and Instruction High quality, peer reviewed units that integrate the STEM theme with core academic subjects and enrichment courses using Kagan strategies, STEM integration strategies using embodied learning, technology integration, project‐ based learning, experiential learning with community partners including IMAG Science and History museum, FGCU STEM Whitaker Center and other science organizations Parent Activities 2+ theme integrated family and community events
LONG-TERM OUTCOMES
5 Year Project Targets
PMs 1.1 & 1.3 Reduced MGI and SES Isolation PMs 4.1, 4.3, 4.5, and 4.7, Increased test scores: reading, math, science PM 4.8 Students will master magnet curriculum PM 3.1 Magnet Theme dosage 10 hr/ week PM 2.1 100% units are high quality
PMs 5.1, 5.3 PD for C&I Improvement, Magnet Theme. 50 hrs/teacher PM 7.1 Parent involvement largest number of parents
MID-TERM OUTCOMES
Desegregation Performance Measures 1.1 and 1.3 Annual Performance Measures (PM) PMs 2.1 and 3.1. Unit dosage and quality targets attained PM 6.1. Classes are heterogeneous PMs 4.1, 4.3, 4.5, and 4.7 Increased reading, math, and science test scores for all students Annual PMs 5.1, 5.3 PD for C&I Improvement and Magnet Theme. 40‐ 50 hrs/teacher Annual PM 7.1 Parent involvement increases 5% or more from previous year
SHORT-TERM OUTCOMES
Desegregation Benchmark Applicant pool Benchmark
Quality Magnet Curriculum and Instruction Benchmarks (Examples) High quality Magnet Dosage planned/ implemented; Student engagement & motivation increased; Professional development planned/ implemented to date meets standard; Magnet Theme and Systemic Reforms FOI improves or is excellent Parent Activities Benchmark Planned+ Implemented activities meet standard
CONTEXT Minority group isolation of Black students. Located in a Qualified Opportunity Zone where the community is economically distressed.
288
PR/Award # S165A200036
Page e429

South Fort Myers High School: A Cambridge and Career Academy High School
INPUTS
MSAP Financial Support for project director, MRTs, professional development, supplies /materials, etc.
School Leadership and MSAP Personnel (4 full‐time Cambridge or Career Academy teachers and 1 magnet lead teacher)
Teachers’ Knowledge, Skills and Experiences
Students Interests, Needs, Skills and knowledge
Partners Parents
ACTIVITIES Desegregation: Student Recruitment Develop School Recruitment Plan, open houses, school tours, brochure development, and parent focus groups Improvement of Curriculum, Instruction and Student Academic Supports Utilizing: Cambridge, AVID, BARR, and Personalized Learning
Magnet Theme Integration Into core content including work with thematic partners including: Tri‐County Apprenticeship Academy, Lee County Builders Association, FGCU College of Engineering, Lee Health Systems, Greater Fort Myers Chamber, and other business organizations
Professional Development Cambridge, AVID, BARR, and local business professionals and FGCU.
Parent Involvement Planning
OUTPUTS
Desegregation Diverse applicant pool positioned to decrease MGI of Hispanic students, maintain Black students
Quality Magnet Curriculum and Instruction High quality, peer reviewed units that integrate Cambridge and Career Academy theme with core academic subjects and enrichment courses using AVID and BARR strategies, technology integration, project‐ based learning, experiential learning with community partners including Business organizations, FGCU College of Engineering, Medical businesses, Chamber, and other business organizations
Parent Activities 2+ theme integrated family and community events
LONG-TERM OUTCOMES
5 Year Project Targets
PMs 1.2 & 1.4 Reduced MGI and SES Isolation PMs 4.2, 4.4, 4.6, and 4.7, Increased test scores: reading, math, science PM 4.8 Students will master magnet curriculum PM 3.2 Magnet Theme dosage 10 hr/ week PM 2.2 100% units are high quality
PMs 5.2, 5.4 PD for C&I Improvement, Magnet Theme. 50 hrs/teacher PM 7.2 Parent involvement largest number of parents
MID-TERM OUTCOMES
Desegregation Performance Measures 1.2 and 1.4 Annual Performance Measures (PM) PMs 2.2 and 3.2. Unit dosage and quality targets attained PM 6.2. Classes are heterogeneous PMs 4.2, 4.4, 4.6, and 4.7 Increased reading, math, and science test scores for all students
Annual PMs 5.2, 5.4 PD for C&I Improvement and Magnet Theme. 40‐ 50 hrs/teacher
Annual PM 7.2 Parent involvement increases 5% or more from previous year
SHORT-TERM OUTCOMES
Desegregation Benchmark Applicant pool Benchmark
Quality Magnet Curriculum and Instruction Benchmarks (Examples) High quality Magnet Dosage planned/ implemented; Student engagement & motivation increased; Professional development planned/ implemented to date meets standard; Magnet Theme and Systemic Reforms FOI improves or is excellent
Parent Activities Benchmark Planned+ Implemented activities meet standard
CONTEXT Minority group isolation of Hispanic students. Located near Qualified Opportunity Zones where communities are economically distressed.
289
PR/Award # S165A200036
Page e430

PR/Award # S165A200036
Page e431

PR/Award # S165A200036
Page e432

Budget Narrative File(s)
* Mandatory Budget Narrative Filename: 1239-Itemized_Budget_Narrative.pdf
To add more Budget Narrative attachments, please use the attachment buttons below.
Add Mandatory Budget Narrative Delete Mandatory Budget Narrative View Mandatory Budget Narrative
Add Optional Budget Narrative Delete Optional Budget Narrative View Optional Budget Narrative
Funding Opportunity Number:ED-GRANTS-031020-001 Received Date:Jun 25, 2020 01:06:52 PM EDTTracking Number:GRANT13152207
PR/Award # S165A200036
Page e433

James Stephens ElementarySTEM Magnet
School District of Lee County
1PR/Award # S165A200036
Page e434

James Stephens ElementarySTEM Magnet
School District of Lee County
2PR/Award # S165A200036
Page e435

James Stephens ElementarySTEM Magnet
School District of Lee County
3PR/Award # S165A200036
Page e436

South Fort Myers HighCambridge and Career Academy Magnet
School District of Lee County
4PR/Award # S165A200036
Page e437

South Fort Myers HighCambridge and Career Academy Magnet
School District of Lee County
5PR/Award # S165A200036
Page e438

South Fort Myers HighCambridge and Career Academy Magnet
School District of Lee County
6PR/Award # S165A200036
Page e439

South Fort Myers HighCambridge and Career Academy Magnet
School District of Lee County
7PR/Award # S165A200036
Page e440

South Fort Myers HighCambridge and Career Academy Magnet
School District of Lee County
8PR/Award # S165A200036
Page e441

South Fort Myers HighCambridge and Career Academy Magnet
School District of Lee County
9PR/Award # S165A200036
Page e442

District Budget
School District of Lee County
10PR/Award # S165A200036
Page e443

District Budget
School District of Lee County
11PR/Award # S165A200036
Page e444

Budget Totals
School District of Lee County12
PR/Award # S165A200036
Page e445

Budget Totals
School District of Lee County13
PR/Award # S165A200036
Page e446