lark ounty - Clark County School District
236
Clark County, Nevada lark ounty chool istrict C C S D Comprehensive Annual For Fiscal Year Ending June 30, 2015 Budget Report Every student in every classroom, without exceptions, without excuses www.ccsd.net
-
Upload
khangminh22 -
Category
Documents
-
view
2 -
download
0
Transcript of lark ounty - Clark County School District

Clark County, Nevada
lark ounty chool istrict
CCSD
Comprehensive Annual
For Fiscal Year EndingJune 30, 2015
Budget Report
Every student in every classroom, without exceptions, without excuses
www.ccsd.net


CLARK COUNTY SCHOOL DISTRICT
COMPREHENSIVE ANNUAL BUDGET REPORTFOR FISCAL YEAR ENDING JUNE 30, 2015
Prepared by:Budget Department
5100 West Sahara AvenueLas Vegas, NV 89146
(702) 799-5452

Special thanks to:
Bill SampsonDirector, Budget DepartmentRetired - August 1, 2014
Thank you for all your efforts and service.

iii2014-15 Comprehensive Annual Budget Report |
Introductory SectionGovernment Finance Officers Association Award ...........................................................................................................3Association of School Business Officials International Award ........................................................................................4Board of School Trustees................................................................................................................................................5Executive Officials...........................................................................................................................................................6Administrative Responsiblities Descriptions ...................................................................................................................7Superintendent’s Transmittal Letter ................................................................................................................................9Executive Summary:
Budget Presentation ....................................................................................................................................................10 Financial Reporting Entity ............................................................................................................................................10 Major Goals and Objectives .........................................................................................................................................10 Budget Process ............................................................................................................................................................11 Budget Policies and Organization ................................................................................................................................11 Governmental Accounting - Funds Overview ...............................................................................................................12 Financial Plan ..............................................................................................................................................................12 District-wide Funds Analysis ........................................................................................................................................13 The General Operating Budget – General and Special Education Funds Combined ..................................................14 Debt Service Funds .....................................................................................................................................................17 Capital Projects Funds .................................................................................................................................................17 Other Funds .................................................................................................................................................................18 Fiscal Year 2014-15 Budget Development Considerations ..........................................................................................18 Economic Environment in Southern Nevada ...............................................................................................................18 Enrollment ....................................................................................................................................................................19 District Organization Plan ............................................................................................................................................19 Need for Future Classrooms ........................................................................................................................................20 Student Achievement ...................................................................................................................................................20 School Accountability ...................................................................................................................................................21
Organizational Section The “District” Reporting Entity ......................................................................................................................................25 Board Policies - Budget Related...................................................................................................................................26 Executive Limitations - Budget Related ........................................................................................................................29 Summary of Significant Budgetary and Accounting Practices ......................................................................................31 Fund Accounting .........................................................................................................................................................32 General Fund............................................................................................................................................................32 Special Revenue Funds ...........................................................................................................................................33 Debt Service Funds ..................................................................................................................................................34 Capital Projects Funds .............................................................................................................................................35 Enterprise Fund ........................................................................................................................................................36 Internal Service Funds..............................................................................................................................................37 Organizational Structure ...............................................................................................................................................38 Policy Governance - Global Mission.............................................................................................................................39 District Strategies and Focus Areas .............................................................................................................................40 Academic Achievement Monitoring Report ...................................................................................................................41 Nevada School Performance Framework.....................................................................................................................47 Budget Development Process ......................................................................................................................................48 Budget Administration - Schools...................................................................................................................................49 Nevada Revised Statutes - Budget Requirement Summary ........................................................................................50
Table of Contents

iv | Clark County School District
Financial Section District Funds - Summary .............................................................................................................................................53 District Funds - Ending Fund Balances ........................................................................................................................54 District Funds - Projected Revenues Summary............................................................................................................55 District Funds - Projected Expenditures Summary .......................................................................................................56 General Operating Fund - Summary ............................................................................................................................61 General Operating Fund - Ending Fund Balance .........................................................................................................63 General Operating Fund Resources.............................................................................................................................63 General Operating Fund Expenditures .........................................................................................................................68 Descriptions of Functions .............................................................................................................................................72 Descriptions of Commitment Items...............................................................................................................................73 Division and Departmental Operating Budgets: Board of School Trustees ...........................................................................................................................................77 Office of the Superintendent .......................................................................................................................................78 Community and Government Relations......................................................................................................................81 Instruction Unit............................................................................................................................................................84 Education Services Division .......................................................................................................................................88 Educational and Operational Excellence Unit ............................................................................................................92 Operational Services Division.....................................................................................................................................94 Student Support Services Division .............................................................................................................................98 Business and Finance Division.................................................................................................................................101 Human Resources Unit ............................................................................................................................................107 Innovative Teaching and Learning Unit ....................................................................................................................110 Curriculum and Professional Development Division.................................................................................................115 Vegas PBS ...............................................................................................................................................................118 Other Governmental and Proprietary Funds: Special Revenue Funds ...........................................................................................................................................122 Debt Service Funds ..................................................................................................................................................126 Capital Projects Funds .............................................................................................................................................130 Proprietary Funds .....................................................................................................................................................139 Enterprise Fund ........................................................................................................................................................139 Internal Service Funds..............................................................................................................................................141
Informational Section Allocations and Schedules: Explanation of Budget Allocations ............................................................................................................................147 Full Time Equivalents Calculation.............................................................................................................................147 Annual Teacher Salary Schedule ..............................................................................................................................148 Teacher Duty Days ...................................................................................................................................................149 Budget Formulas for Allocating Licensed School Personnel ....................................................................................153 Secondary Magnet School Formulas Enhancements ..............................................................................................154 Administrative Titles and Salary Ranges ..................................................................................................................155 Adminstrative Salary Schedule Base - Monthly Salaries ..........................................................................................158 Professional-Technical Salary Schedule Base - Monthly Salaries ...........................................................................158 Support Staff Personnel Titles and Salary Pay Grades ............................................................................................159 Support Staff Personnel Pay Grades and Hourly Rates ...........................................................................................165 Budget Formulas for Allocating Support Staff Personnel .........................................................................................166 Fringe Benefit Rates .................................................................................................................................................170 Budget Formulas for Allocating School Supplies and Equipment ............................................................................171 Impact of New Schools on the General Operating Fund ..........................................................................................173
Table of Contents - Continued

v2014-15 Comprehensive Annual Budget Report |
Statistical Data: Birth History - Clark County ..................................................................................................................................... 176 Projected Enrollment by Grade ............................................................................................................................... 176 Summary of District Enrollment ............................................................................................................................... 176 District Enrollment - Average Daily Membership ..................................................................................................... 177 Ethnic Distribution by Grade .................................................................................................................................... 177 High School Graduates ........................................................................................................................................... 178 Criterion Referenced Tests ...................................................................................................................................... 179 Districtwide Survey .................................................................................................................................................. 180 State vs. Local Revenues ....................................................................................................................................... 181 Property Tax Levies and Collections ....................................................................................................................... 181 History of Assessed Valuation ................................................................................................................................. 181 History of Local Tax Support Per Pupil .................................................................................................................... 182 Impact of Tax Rate on Taxpayers ............................................................................................................................ 182 History of State Aid .................................................................................................................................................. 182 Indices of Economic Growth in Clark County .......................................................................................................... 183 History of Utility Costs ............................................................................................................................................. 183 General Operating Fund - Projected Budgets ......................................................................................................... 184 Special Revenue Funds - Projected Budgets .......................................................................................................... 185 Debt Service Funds - Projected Budgets ................................................................................................................ 185 Capital Projects Funds - Projected Budgets ............................................................................................................ 186 Schedule of Staff Positions – General Operating Fund ........................................................................................... 187 Schedule of Staff Positions – Other Funds .............................................................................................................. 188 Educational Level of Teaching Staff ........................................................................................................................ 188 History of Teachers’ Salary Schedules .................................................................................................................... 189 Teacher Salary Schedule – Full-Time Teacher Placement ...................................................................................... 189 Schedule of General Obligation Debt Outstanding.................................................................................................. 190 Combined Amortization Schedules.......................................................................................................................... 191 School Locations Within County .............................................................................................................................. 193 High School Attendance Boundaries ....................................................................................................................... 194 Middle/Junior High School Attendance Boundaries................................................................................................. 195 Elementary School Attendance Boundaries ............................................................................................................ 196 Assigned Schools for Outlying Communities ........................................................................................................... 197 Summary of Schools by Age and Size .................................................................................................................... 198 School Location and Enrollment Information ........................................................................................................... 199 2014-15 School Calendars ...................................................................................................................................... 206
Appendix .................................................................................................................................................................. 207
Abbreviations and Acronyms ................................................................................................................................. 218
Glossary of Terms ................................................................................................................................................... 220
Table of Contents - Continued
Informational Section - Continued

vi | Clark County School District
This page is intentionally left blank

Government Finance Officers Association Award .................................... 3Association of School Business Officials International Award .......................... 4Board of School Trustees ........................................................................ 5Executive Officials ................................................................................... 6Administrative Responsibilities Descriptions ........................................... 7Superintendent’s Transmittal Letter ......................................................... 9
Executive Summary: Budget Presentation ..............................................................................10 Financial Reporting Entity ......................................................................10 Majors Goals and Objectives .................................................................10 Budget Process ..................................................................................... 11 Budget Policies and Organization.......................................................... 11 Governmental Accounting - Funds Overview ........................................12 Financial Plan ........................................................................................12 District-wide Funds Analysis ..................................................................13 The General Operating Budget – General and Special Education Funds Combined ..............................14 Debt Service Funds ...............................................................................17 Capital Projects Funds...........................................................................17 Other Funds ...........................................................................................18 Fiscal Year 2014-15 Budget Development Considerations ...................18 Economic Environment in Southern Nevada .........................................18 Enrollment..............................................................................................19 District Organization Plan ......................................................................19 Need for Future Classrooms..................................................................20 Student Achievement .............................................................................20 School Accountability .............................................................................21
Introductory
Intr
oduc
tory
Sec
tion
Section
12014-15 Comprehensive Annual Budget Report |

2 | Clark County School District
This page is intentionally left blank

Intr
oduc
tory
Sec
tion
32014-15 Comprehensive Annual Budget Report |
Intr
oduc
tory
Sec
tion
The Government Finance Officers Association of the United States and Canada (GFOA) presented an award for Distinguished Presentation to the Clark County School District for its annual budget for the fiscal year beginning July 1, 2013.
In order to receive this award, a governmental unit must publish a budget document that meets program criteria as a policy document, as an operations guide, as a financial plan, and as a communications device.
The award is valid for a period of one year only. We believe our current budget continues to conform to program requirements, and we are submitting it to GFOA to determine its eligibility for another award.

4 | Clark County School District

52014-15 Comprehensive Annual Budget Report |
Intr
oduc
tory
Sec
tion
The Clark County Board of School Trustees is a dedicated group of community leaders who are elected to overlapping four-year terms and represent a specific geographic region of Clark County. Although each trustee represents a different region, they are dedicated to ensuring the success of every student in the district through clear, concise direction to the superintendent. The trustees bring a wealth of experience and concern for children
to their position.
Vision StatementAll students progress in school and graduate prepared to succeed and contribute in a diverse global society.
Board of School Trustees
PresidentErin E. CranorDistrict Ghttp://ccsd.net/trustees/trusteeDetail.php?district=G
MemberStavan Corbett
District Dhttp://ccsd.net/trustees/
trusteeDetail.php?district=D
MemberDeanna L. Wright
District Ahttp://ccsd.net/trustees/
trusteeDetail.php?district=AClerkPatrice TewDistrict Ehttp://ccsd.net/trustees/trusteeDetail.php?district=E
MemberCarolyn Edwards
District Fhttp://ccsd.net/trustees/
trusteeDetail.php?district=F
MemberChris Garvey
District Bhttp://ccsd.net/trustees/
trusteeDetail.php?district=BVice PresidentDr. Linda E. YoungDistrict Chttp://ccsd.net/trustees/trusteeDetail.php?district=C
5100 West Sahara AvenueLas Vegas, NV 89146
http://ccsd.net/trustees/

6 | Clark County School District
Carlos McDadeGeneral Counsel
This publication is designed to provide helpful information to parents, students, employees, and governmental agencies, and to better inform all readers about the District’s budget and our many strengths. You also will discover a host of facts about our financial history, capital improvement projects, day-to-day operations, and a great deal of other information. With the current economic challenges facing the District and our need to reduce costs while improving performance, this publication is more important than ever. We are committed to providing the best education possible for every child.
“Together, we can ensure the success of every student in every classroom, without exceptions, without excuses.”
Pat SkorkowskySuperintendentOffice of the Superintendent5100 West Sahara Avenue Las Vegas, NV 89146
Executive Officials
Communications Office(702) 799-5302, (702) 799-5303, or (702) 799-5304http://ccsd.net/news/communications.php
Kimberly WoodenDeputy Superintendent
Edward GoldmanAssociate Superintendent, Chief Negotiator
Jeremy HauserAssociate Superintendent, Operational Services
Jim McIntoshChief Financial Officer
Jhone EbertChief Innovation and Productivity Officer
Kirsten SearerChief of Staff and External Relations
Staci VesneskeChief Human Resources Officer
Joyce HaldemanAssociate Superintendent, Community and Government Relations
Mike BartonChief Student Achievement Officer

Intr
oduc
tory
Sec
tion
72014-15 Comprehensive Annual Budget Report |
Administrative Responsibilities Descriptions - Executive Officials
SuperintendentServes as the Chief Executive Officer (CEO) of the District. He is responsible for the effective operation of the District; general administration of all instructional, business or other operations of the District; and for advising and making recommendations to the Board of Education with respect to such activities.
General Counsel Serves as the chief legal officer on all matters related to the District’s operations and supervises all aspects of litigation in which the District is either a plaintiff or defendant.
Deputy SuperintendentAdministers instructional and educational support services including the development and preparation of special curriculum materials, and provides assistance to teachers in the instructional process that will increase student academic achievement.
Chief Student Achievement Officer
Administers activities related to the improvement of instruction for all K-12 schools by aligning student information, curriculum, instructional resources, testing and evaluation, student and family services, and school support with the District’s goal of improving academic achievement.
Chief Financial OfficerAdministers all activities related to the District’s financial operations including all bond financing, budgeting, accounting, payroll, purchasing, risk management, and financial reporting activities.
Chief Human Resources Officer
Administers all personnel activities including recruitment, development, implementing personnel policies, and maintaining personnel records.
Chief Innovation and Productivity Officer
Ensures every level of the organization nurtures a culture of innovation by providing leadership and support in the areas of assessment and accountability, research and school improvement, curriculum and instruction, professional development, technology, and innovative learning environments.
Associate Superintendent, Chief Negotiator
Represents the District in the negotiation process with all employee union groups in addition to ensuring compliance with applicable labor laws, contractual agreements, and District policies and procedures that relate to personnel issues
Chief of Staff and External Relations
Represents the District in the unified preparation, coordination, and release of communications to the media outlets and other interested outside parties as well as managing the daily operations of the District’s administrative center. Ensures coordination of accountability of those administrators who report directly to the Superintendent.
Associate Superintendent, Operational Services
Administers activities related to the safe and efficient operation of all K-12 schools. Administers construction and maintenance services of properties and equipment to ensure that they are operational, comfortable, safe, and in compliance with policies, procedures, and established standards of local, State, and federal requirements.
Associate Superintendent, Community and Government Relations
Administers the operations related to the development of legislative priorities, coordinates public relations functions, and directs the school-community partnership program.

8 | Clark County School District
This page is intentionally left blank

92014-15 Comprehensive Annual Budget Report |
Intr
oduc
tory
Sec
tion
To the Citizens of Clark County and the Board of School Trustees:
We are pleased to present the fiscal year 2014-2015 financial plan for the Clark County School District.
The 2014-2015 Comprehensive Annual Budget Report represents the personnel and programs behind the District’s vision statement: All students progress in school and graduate prepared to succeed and contribute in a diverse global society. It also outlines the District’s direction to ensure the success of “Every student in every classroom, without exceptions, without excuses!”
This document reflects the 2014-2015 Final Budget adopted by the Board of School Trustees on May 21, 2014. It is developed by administrative unit and includes historical financial information for purposes of comparison and analysis. Prior year Comprehensive Annual Budget Reports have earned the Distinguished Budget Presentation Award from the Government Finance Officers Association (GFOA) and the Meritorious Budget Award from the Association of School Business Officials (ASBO) International. This report continues to conform to the award requirements and will be submitted for consideration.
The Final Budget for 2014-2015 reflects basic state support of $5,544 per student, an increase of $87 (1.6 percent) over the 2013-2014 support of $5,457. It reflects the continued financial planning and alignment of expenditures in support of the Board’s strategic imperatives of increasing student achievement in accordance with Executive Limitation #5 (EL-5) that directs …”financial planning will not deviate materially from the Board’s Ends priorities, risk financial jeopardy, or fail to be derived from a multi-year plan.”
The District’s enrollment is expected to increase by over 3,300 students (1.1 percent) during 2014-2015. The challenges resulting from the impacts of funding existing salary and employee benefit commitments, coupled with the ongoing uncertainty and unpredictability of state and local revenue sources, continue to make the process of preparing and maintaining a balanced budget a demanding task. The ability of the District to successfully manage budget pressures while striving to improve student achievement with a major focus on classroom instruction continues to be essential to the District’s operations and capacity to provide comprehensive educational services.
The District is focused on providing the highest quality educational services to all students in Clark County. Established Board strategic imperatives are designed not only to benefit students, but also to provide guidelines for all the District staff that ensure the integrity of the support services network for the educational environment and commitment to a quality system of education.
The District has implemented an online and interactive budget information portal at www.ccsd.net/openbook. We encourage you to access it and ask that you provide feedback on its content and format. Should questions arise, please feel free to contact the Budget Department at (702) 799-5452 for additional information. To the many students, parents, citizens, and employees whose questions and suggestions continue to help refine the operations of the Clark County School District, our deepest appreciation is offered.
Sincerely,
Pat Skorkowsky Jim McIntoshSuperintendent Chief Financial Officer

10 | Clark County School District
Budget Presentation
The Comprehensive Annual Budget Report is intended to provide a comprehensive disclosure of all budgetary matters impacting the District’s financial plan. It is prepared in accordance with the professional best practices provided by the Government Finance Officers Association (GFOA) and Association of School Business Officials International (ASBO) budget preparation award programs for the benefit of the citizens and other users of its financial information.
The District’s budgeted financial information is prepared and maintained using the modified accrual basis of accounting for all governmental funds and the accrual basis of accounting for all proprietary funds. These bases conform with generally accepted accounting principles (GAAP). Unencumbered appropriations are not carried forward into subsequent fiscal periods.
The Comprehensive Annual Budget Report conforms to recommended practices put forth by the ASBO’s Meritorious Budget Award (MBA) program while maintaining its practices acceptable to the GFOA’s Distinguished Budget Presentation Award program. This report is organized into an introductory, organizational, financial, and informational sections. Please reference the table of contents for indexed location of financial information.
Financial Reporting Entity
The Comprehensive Annual Budget Report includes all of the activities that comprise the financial reporting entity of the Clark County School District (“District”). The District is governed by an elected, seven member Board of School Trustees (“Board”). The Board is legally separate and fiscally independent from other governing bodies; therefore,
the District is a primary government and is not reported as a component unit by any other governmental unit. The District’s boundaries are contiguous with Clark County, Nevada and encompass 8,012 square miles of the southern tip of the State.
Comprehensive educational services are provided to all resident students in grades kindergarten through twelfth. The District operates 356 schools and will serve an estimated 317,970 students during 2014-15.
Major Goals and Objectives
The District maintains its commitment to the vision set forth by the Board even through economic recessions and funding difficulties. That vision direct’s the superintendent to ensure: “All students progress in school and graduate prepared to succeed and contribute in a diverse global society.” To achieve this vision, the Board sets forth four specific goals. These goals, also called “Ends,” define expectations for students and are illustrated below:
1. Students meet State and federal guidelines as well as appropriate benchmarks for academic proficiency in all areas and all grade levels and pass the High School Proficiency Exam (HSPE).
2. Students meet State and District guidelines in art, career and technical education, physical education and lifelong wellness.
3. Students demonstrate personal and workplace skills.4. Students demonstrate positive character skills.
Academic achievement objectives drive the budget framework and financial management in order to support the board vision for our stakeholders and community.
Executive Summary
0
10
20
30
40
50
60
70
80
Mathematics Reading Science Writing
53.9
59.557.3
53.1 54.4
59.255.1
59.0 57.4
72.176.3 75.6
% P
rofic
ient
Nevada High School Proficiency ExamStudent First AttemptFiscal Years 2012 Through 2014
2012 2013 2014 Source: CCSD Assessment and Testing

Intr
oduc
tory
Sec
tion
112014-15 Comprehensive Annual Budget Report |
Budget Policies and Organization
Resource management is guided and constrained by Board policies. These policies, as they relate to budget and finance, are established through Board regulations 3110 and 3130. These Board regulations set forth the authority and expectations to manage District resources based on established guidelines.
Additional guidelines are provided through performance measurements set in the negative. These performance measurements, as they relate to budget and finance, are communicated through Executive Limitations (EL). Executive Limitations communicate expectations for management by limiting the abilities of management to harm the organization through strategic planning and/or day to day operational decision making.
The accounting and budgeting policies of the District conform to the accounting principles and budgeting best practices for local districts as prescribed by the Nevada Department of Education and generally accepted accounting principles.
Basis of budgeting refers to when revenues and expenditures or expenses are recognized in the accounts and reported on the financial statements. Basis of budgeting relates to the timing of the measurement made, regardless of the measurement focus applied.
Funds included in the preparation of the fiscal year 2014-15 budget are reflected on the following page titled District Funds.
Budget Process
Budgeting in the District is on a July 1 through June 30 fiscal year basis and is a year-round process. The cycle begins in the fall of the prior school year and continues until a final budget is filed with the Nevada Department of Education and the Nevada Department of Taxation in the spring of the following year. After the actual enrollment counts are taken in the fall, the District is required to adopt an amended final budget on or before January 1, reflecting any adjustments necessary as a result of the completed count of actual students.
The process of budget formulation involves a number of participants. Work Stream Chiefs, after reviewing their various budget needs, submit their requests for staffing, supplies, and equipment to the Budget Department. These requests are then summarized by the Budget Department, whose responsibility is to prepare a tentative budget for consideration by the superintendent and presentation to the Board for approval.
An augmented budget may be approved by the Board in any year in which the legislature increases (or decreases) the revenues of a local government, if the increase (or decrease) was not included or anticipated in the local government’s final budget as adopted. The 2014-15 Final Budget was adopted by the Board on May 21, 2014. This 2014-15 Comprehensive Annual Budget Report reflects the adopted final budget.
After the Board approved the final budget, it became the responsibility of the Budget Department to implement and monitor the budget. A system of budget allotments is established for each departmental unit (reference unit budgets in the General Operating Budget section). Daily review of transaction data is available with user access through network connections, which reflect appropriation levels, encumbrances, and year-to-date expenditures. This reporting system also enables the Budget Department to monitor all of the District’s budgets on a regular basis and provides the necessary controls.
If it becomes necessary during the course of the year to change any of the departmental budgets, transfers are initiated by department heads and approved by the appropriate administrator. Transfers between programs or function classifications require approval of the Board.

12 | Clark County School District
Governmental Accounting - Funds Overview
The District maintains 21 governmental funds that are used to account for all tax funded activities, including federal and State aid. Through the current financial resources measurement focus the following funds classifications are used to group District activities:
General Fund - This major governmental fund is the District’s operating fund and is used to account for all financial transactions and expenditures associated with the administration and daily operations of the schools except for federal and State grant-funded programs, school construction, debt service, food service operations, and interdepartmental services.
Special Revenue Funds - the District maintains two major governmental and five non-major governmental special revenue funds. These funds account for the proceeds of specific revenue sources that are legally restricted to expenditures for specified purposes.
Debt Service Funds - The District operates two major debt service funds that are used to account for the accumulation of resources for, and the payment of, general long term debt principal and interest.
Capital Projects Funds - the District maintains two major governmental and three non-major governmental capital projects funds to account for all resources used exclusively for acquiring and improving school sites, constructing and equipping new school facilities, and renovations.
Proprietary Funds - These funds account for the District’s business type activities. The economic resources measurement focus is proprietary in nature relying on the determination of operating income, changes in net assets, financial position and cash flows. There are two types of proprietary funds: enterprise and internal service funds.
There are three distinctions between enterprise and internal service funds: first, a fundamental difference between the customers serviced; second, the extent to which expenses are recovered through charges and fees; and thirdly, the application of private sector reporting requirements. The District maintains one enterprise fund and two internal service funds that provide for food services, graphic arts services, and risk management services.
Financial Plan
The District’s financial plan is developed within projected available resources and is presented by budget units within each fund. Total resources for all funds of the District, including beginning balances and other financing sources, are $4.2 billion. Expenditures total $3.3 billion, with ending balances for all funds combined totaling $365 million. The amount of ending balances primarily reflects the expectation
that the District will have balances in the Capital Projects ($225 million) and Debt Service Funds ($8 million) attributed to the final stages and wind down of the District’s 1998 Capital Improvement Program. The General Fund is the largest fund, and together with the Special Education and Class Size Reduction Funds, provides for the General Operating Fund and includes the budgets necessary to provide for the basic instruction of students and the day-to-day operational activities of the school system.
The final budget summary for all funds reflects a significant decrease in all ending fund balances of over $139 million, or greater than 27.6%. The General Operating Fund decrease of $27 million, or 34.1%, is the result of a planned spend-down of the beginning fund balance’s designation for future revenue shortfalls. The necessity for the spend-down is the impact of property tax collections resulting from an assessed valuation base that is projected to increase slightly but still significantly below 2008-09 amounts.
The $3.8 million decline in the Proprietary Funds ending balance is the result of a planned spend-down of the beginning balances of the Risk Management Fund for increased workers’ compensation claims. The Debt Service Funds ending balance reduction of 88% is also resulting from the impact of the decline in property tax collections since 2008-09. The Capital Projects Funds decrease of 17% is the spend-down of bond proceeds as the District completes its 1998 Capital Improvement Plan.
District Funds General Funds 01001 General Fund 01401 Indirect Cost Fund 01601 Donations And Trusts Fund 01701 District Projects Fund
Special Revenue Funds 0200 Class Size Reduction Fund 0220 Vegas PBS Fund 0230 Adult High School Diploma Program Fund 02501 Special Education Fund 0279 State Grants/Projects Fund 02801 Federal Projects Fund 0285 Medicaid Fund
Debt Service Funds 04001 Debt Service Fund 04011 Debt Service Revenue Bonds Fund
Capital Projects Funds 03081 Bond Fund - 1998 Building Program 0330 Building And Sites Fund 03351 AB 353 Fund - 1998 Building Program 0340 Governmental Services Tax Fund 0370 Capital Replacement Fund
Enterprise Fund 0600 Food Services Fund
Internal Service Funds 0700 Insurance And Risk Management Fund 0710 Graphic Arts Production Fund
(1) Major funds in the government-wide financial statements.

Intr
oduc
tory
Sec
tion
132014-15 Comprehensive Annual Budget Report |
Districtwide Funds Analysis
Revenue Highlights: In addition to the discussion of the General Operating Fund revenues on page 14, and with the exception of Proprietary Funds, all other funds will experience slight increases in total revenues with the largest increase in the General Operating Fund. It is expected to increase over $66 million from the increases in State funding and increases in sales tax collections.
Expenditure Highlights: Page 16 presents an overview of the General Operating Fund expenditures. Expenditures in the Capital Projects Funds will increase by over $39 million as the final spend-down of the 1998 Capital Improvement Program is completed. The Special Revenue Funds total expenditures will decrease by over $5 million as a result of lower categorical grant State revenues.
All District Funds - Final Budget SummaryStatement of Revenues, Expenditures, and Changes in Fund BalanceFiscal Year 2014-15
Description
General Operating
Funds
Special Revenue
FundsDebt Service
Funds
Capital Projects Funds
Proprietary Funds1
Total All Funds
Revenues:Local sources $1,339,975,000 $13,545,000 $307,800,000 $118,865,000 $37,690,000 $1,817,875,000 State sources 909,900,000 80,880,000 - - 450,000 991,230,000 Federal sources 4,300,000 244,850,000 - 6,075,000 98,975,000 354,200,000 Total revenues 2,254,175,000 339,275,000 307,800,000 124,940,000 137,115,000 3,163,305,000
Expenditures:Salaries 1,441,006,284 176,480,250 - 9,484,000 31,830,000 1,658,800,534 Employee fringe benefits 586,768,559 61,102,000 - 3,026,000 12,395,000 663,291,559 Purchased services 82,343,402 38,196,000 - 66,535,000 11,660,000 198,734,402 Supplies 152,980,844 57,017,750 - 8,595,000 66,715,000 285,308,594 Property and equipment 35,747,250 6,015,000 - 815,000 100,000 42,677,250 Other expenditures 2,363,661 12,539,000 - 95,000 17,170,000 32,167,661 Depreciation - - - - 2,245,000 2,245,000 Debt service - - 457,200,000 - - 457,200,000 Total expenditures 2,301,210,000 351,350,000 457,200,000 88,550,000 142,115,000 3,340,425,000
Excess (deficiency) of revenues over expenditures (47,035,000) (12,075,000) (149,400,000) 36,390,000 (5,000,000) (177,120,000)
Other sources (uses):Proceeds from insurance 100,000 - - - - 100,000 Sale of medium-term bonds 34,500,000 - - - - 34,500,000 Proceeds of refunding bonds - - 437,590,000 - - 437,590,000 Payment to escrow agent - - (435,185,000) - - (435,185,000)Transfers from other funds - 10,000,000 87,280,000 1,600,000 1,150,000 100,030,000 Transfer to other funds (14,880,000) - - (84,000,000) - (98,880,000)Total other sources (uses) 19,720,000 10,000,000 89,685,000 (82,400,000) 1,150,000 38,155,000
Fund balances, July 1 80,000,000 11,444,573 67,855,693 270,651,871 74,441,903 504,394,040
Fund balances, June 30 $52,685,000 $9,369,573 $8,140,693 $224,641,871 $70,591,903 $365,429,040 Percent increase (decrease) (34.1)% (18.1)% (88.0)% (17.0)% (5.2)% (27.6%)(1) Proprietary funds ending fund balances are reflected as cumulative unrestricted net assets.Source: CCSD Budget Department
Expenditures - All FundsFiscal Year 2014-15Final Budget
Total Expenditures $3.3 Billion
General Operating
Fund68.9%
Internal Service
.9%
Food Services
3.4%
Federal Projects
7.4%
Debt Service13.7%
Special Revenues
3.1%
Source: CCSD Budget Department
Capital Projects
2.6%

14 | Clark County School District
The General Operating Budget - General and Special Education Funds Combined
Revenues - During fiscal year 2014-15, it is anticipated that General Operating Fund revenues, excluding opening balances, will increase by 3% compared to last year’s increase of 5.6%. The largest factors contributing to the net change in financial resources are increases to the State funding formula of $21 million ($87 per pupil plus funding for an enrollment increase of over 3,300 students) along with an increase of $16 million in projected local school support (sales) tax collections in addition to an increase of $20 million in estimated property tax collections.
Projected General Operating Fund resources of $2.3 billion, including revenues, bond proceeds, and beginning balances, and expenditures of more than $2.3 billion generally reflect the continuation of current service levels and implementation of budgetary reductions and cost saving measures within projected revenues and provide for a projected ending balance of $52.7 million with no reserve for contingencies.
All District Funds - Final Budget AnalysisFor Fiscal Years 2012-13 Through 2014-15
DescriptionActual
2012-13Estimated 2013-14
Final Budget 2014-15
FY 2013-14 vs. FY 2014-15$ Change % Change
Revenues:Local sources $1,718,096,885 $1,763,423,513 $1,817,875,000 $ 54,451,487 3.1% State sources 856,322,629 971,385,000 991,230,000 19,845,000 2.0 Federal sources 286,416,544 347,715,000 354,200,000 6,485,000 1.9
Total revenues 2,860,836,058 3,082,523,513 3,163,305,000 80,781,487 2.6
Expenditures:Salaries 1,487,351,390 1,600,485,250 1,658,800,534 58,315,284 3.6 Employee fringe benefits 583,287,756 648,206,000 663,291,559 15,085,559 2.3 Purchased services 195,243,891 162,969,000 198,734,402 35,765,402 21.9 Supplies 246,334,521 271,303,750 285,308,594 14,004,844 5.2Property and equipment 13,221,535 48,680,000 42,677,250 (6,002,750) (12.3)Other expenditures 23,624,376 33,441,000 32,167,661 (1,273,339) (3.8)Depreciation 2,007,340 2,245,000 2,245,000 - 0.0 Debt service 500,965,771 497,980,000 457,200,000 (40,780,000) (8.2)
Total expenditures 3,052,036,580 3,265,310,000 3,340,425,000 75,115,000 2.3
Excess (deficiency) of revenues over expenditures (191,200,522) (182,786,487) (177,120,000) 5,666,487 3.1
Other sources (uses):Proceeds from insurance 7,452 100,000 100,000 - - Sale of medium-term bonds - 34,430,000 34,500,000 70,000 0.2 Proceeds of refunding bonds 199,248,293 324,725,000 437,590,000 112,865,000 34.8 Payment to escrow agent (189,574,194) (324,875,000) (435,185,000) (110,310,000) (34.0)Transfers from other funds 119,262,809 109,830,000 100,030,000 (9,800,000) (8.9)Transfers to other funds (118,176,422) (109,510,000) (98,880,000) 10,630,000 9.7
Total other sources 10,767,938 34,700,000 38,155,000 3,455,000 10.0 Fund balances - July 1 832,913,111 652,480,527 504,394,040 (148,086,487) (22.7)
Fund balances - June 30 $ 652,480,527 $ 504,394,040 $ 365,429,040 $(138,965,000) (27.6)%Source: CCSD Budget and Accounting Departments
Opening Fund Balance
3.3%
Property Taxes17.5%
State Aid38.4%
Local School Support Taxes
35.5%
Governmental Service Franchise Taxes
2.2% Other Revenues and Sources
1.6%
General Operating Fund ResourcesFiscal Year 2014-15Final Budget
Total resources of $2.3 billion
*County taxes include: Local School Support Taxes (Sales Tax), Property Taxes, Governmental Service Taxes, and Franchise Taxes.
Source: CCSD Budget Department
County local tax resources 55.2%*
Sale of Bonds1.5%

Intr
oduc
tory
Sec
tion
152014-15 Comprehensive Annual Budget Report |
Local sources are projected to total $1.3 billion, which is 55.2% of the General Operating Fund, while State funding is projected to total $910 million, or 38.4% of total revenues. Federal revenues from claims for Medicaid administration, Impact Aid, and the National Forest Service are estimated to total $4.3 million. Other resource components are the sale of $34.5 million in medium-term financing bonds and the projected beginning fund balance of $80 million. The opening fund balance component reflects the General Fund’s estimated 2013-14 ending fund balance and is subject to change based on the verification of the annual financial audit to be completed in October.
Expenditures - Expenditure appropriations are more than $2.3 billion to fund the District’s strategic priorities and reflect the intent to address and accomplish the Board’s strategic imperatives directed at improving student achievement with a major focus on classroom instruction. Total expenditure allocations are projected to increase by almost $80 million and will provide support and are aligned with budgetary priorities established by the Board of Trustees.
General Operating Fund - History Of ResourcesFor Fiscal Years 2005-06 Through 2014-15
County % of State % of Federal % of Other % of Opening % of TotalYear Taxes Total Sources Total Sources Total Sources Total Balances Total Resources
2005-06 $ 1,209,620,212 63.5% $ 509,298,783 26.7% $ 14,655 -% $ 29,593,890 1.6% $ 155,579,223 8.2% $ 1,904,106,763 2006-07 1,274,438,078 61.5 623,907,426 30.1 86,952 - 31,249,572 1.5 143,564,533 6.9 2,073,246,561 2007-08 1,304,601,148 57.9 744,247,587 33.0 547,130 - 49,088,717 2.2 155,623,283 6.9 2,254,107,865 2008-09 1,263,951,844 54.5 781,792,314 33.7 82,265,3772 3.6 28,162,582 1.2 163,474,529 7.0 2,319,646,646 2009-10 1,300,965,604 56.4 802,013,854 34.8 303,570 - 37,174,021 1.6 167,310,793 7.2 2,307,767,842 2010-11 1,206,926,415 54.0 797,169,570 35.6 337,954 - 88,290,574 3.9 145,055,694 6.5 2,237,780,207 2011-12 1,222,078,785 56.4 795,306,492 36.7 839,281 - 51,342,101 2.4 96,620,752 4.5 2,166,187,411 2012-13 1,238,522,974 57.1 802,484,056 37.0 374,155 - 49,660,847 2.3 76,982,721 3.6 2,168,024,753 2013-141 1,274,575,000 55.1 882,305,000 38.1 300,000 - 65,068,513 2.8 92,596,487 4.0 2,314,845,000 2014-151 1,307,555,000 55.2 909,900,000 38.4 4,300,000 0.2 67,020,0003 2.8 80,000,000 3.4 2,368,775,000
1 Projected amounts2 Includes $82,239,829 from the American Recovery and Reinvestment Act3 Includes $28,000,000 in transfers from other funds and $34,000,000 in sale of bonds
Source: CCSD Budget and Accounting Departments
General Operating Fund - Projected BudgetsFor Fiscal Years 2014-15 Through 2017-18
Description2014-15Budget
2015-16Projected
2016-17Projected
2017-18Projected Growth Rate
Revenues $ 2,254,175,000 $ 2,362,615,000 $ 2,447,300,000 $ 2,507,800,000 2.5%Expenditures (2,301,210,000) (2,350,000,000) (2,435,000,000) (2,500,000,000) 2.7%Deficiency of revenues over expenditues (47,035,000) 12,615,000 12,300,000 7,800,000Other sources and (uses) 19,720,000 (9,800,000) (9,800,000) (9,800,000)Opening fund balance - July 1 80,000,000 52,685,000 55,500,000 58,000,000
Ending fund balance - June 30 $ 52,685,000 $ 55,500,000 $ 58,000,000 $ 56,000,000
Fund Balance:Nonspendable $5,000,000 $4,000,000 $3,500,000 $3,000,000 Restricted 165,000 150,000 150,000 150,000 Assigned 15,590,000 13,000,000 10,000,000 7,000,000 Unassigned 31,930,000 38,350,000 44,350,000 45,850,000
Total Fund Balance $52,685,000 $55,500,000 $58,000,000 $56,000,000
Tax Base and Rate Trends
The taxable assessed valuation is expected to increase slightly by $8 billion, or 14%, which will increase fiscal year 2015 General Operating Fund property tax collections by $20 million and Debt Service Fund collections by $15 million while maintaining the prior year’s total tax levy ratio of .013034.
Projections - Looking Forward
Distributive School Account (DSA) funding is a significant component (79.1%) of the General Operating Fund revenues and is mostly determined by the biennial Nevada State Legislature. Key funding elements involve LSST (sales) taxes and property tax collections based upon fluctuating local property valuations. It is highly likely that the revenue projections below could vary somewhat. Expenditures for salaries and benefits could also fluctuate based upon final agreements from the ongoing negotiations with each of the employee unions.

16 | Clark County School District
Future LSST and property tax collection projections are based upon a conservative vision for a local economy that has not reflected a measurable return to pre-2009 levels of growth. Expenditure projections were determined through a conservative historical trending that assumes no cost of living increases to employee salary schedules and contained expenditure appropriations to arrive at a nominal ending fund balance.
District Staffing and Resource Allocation
Over 90% of General Operating Fund positions are allocated at school site locations where it is deemed essential towards fulfillment of Board goals and objectives. District salaries and benefits represent 88.1% of total expenditures while purchased service expenditures have been constrained within the confines of the available financial resources that continually challenge the Board’s ability to address new initiatives and realize its vision statement. With the increased funding from the State’s DSA revenue source and increased student enrollment, the District was able to increase staffing by over 590 positions.
Licensed Salaries and Benefits
57.0%
Support Salaries & Benefits22.5%
Instructional Materials
2.4%Utilities, Postage, Liability Insurance
4.0% Transportation2.6% Other
3.3%
General Operating Fund - ExpendituresFiscal Year 2014-15Final Budget
Based on total appropriations of $2.301 billion.
Administration Salaries and Benefits
7.4%
Police Salaries and Benefits
0.8%
2014-15 District salaries and benefits equal 88.1% of total
expendituresSource: CCSD Budget Department
General Operating Fund - Major Expenditure AreasFor Fiscal Years 2010-11 Through 2014-15
Actual Actual ActualEstimated
Actual Final Budget PercentageDescription 2010-11 2011-12 2012-13 2013-14 2014-15 Change
Salaries and benefits:Licensed salaries $ 959,518,796 $ 922,083,588 $ 892,183,845 $ 931,650,000 $ 968,815,761 4.0 %Licensed benefits 339,097,942 335,619,054 349,344,190 375,350,000 384,287,110 2.4 % Total licensed staff 1,298,616,738 1,257,702,642 1,241,528,035 1,307,000,000 1,353,102,871 3.5 %
Support salaries 318,549,563 331,940,950 309,169,598 326,135,000 341,616,830 4.7 %Support benefits 132,967,636 118,536,055 121,325,691 150,000,000 154,682,027 3.1 %Total support staff 451,517,200 450,477,005 430,495,289 476,135,000 496,298,857 4.2 %
Administrative salaries 102,412,466 102,365,986 104,384,508 115,000,000 119,259,219 3.7 %Administrative benefits 36,308,506 37,931,537 40,967,117 42,000,000 42,901,887 2.1 % Total administrative staff 138,720,972 140,297,523 145,351,624 157,000,000 162,161,106 3.3 %
Police salaries 12,009,089 11,667,097 10,719,320 10,860,000 11,314,474 4.2 %Police benefits 4,906,555 4,741,442 4,185,342 4,720,000 4,897,535 3.8 % Total police staff 16,915,644 16,408,539 14,904,662 15,580,000 16,212,009 4.1 %
Total salaries and benefits 1,905,770,553 1,864,885,709 1,832,279,611 1,955,715,000 2,027,774,843 3.7 %
Purchased services:Instructional materials 67,876,225 55,345,587 60,163,129 56,000,000 53,272,226 (4.9)%Transportation 15,071,642 19,558,789 34,824,480 60,000,000 57,830,704 (3.6)%Utilities, postage, property liability 79,187,681 77,798,990 83,154,100 85,300,000 89,967,937 5.5 %Other expenditures 66,756,177 69,365,034 60,189,830 64,285,000 72,364,290 12.6 %
Total expenditures $2,134,662,278 $2,086,954,109 $2,070,611,150 $2,221,300,000 $2,301,210,000 3.6 %
Expenditures per student $7,132 $7,011 $6,900 $7,320 $7,506 2.5 %Source: CCSD Budget and Accounting Departments

Intr
oduc
tory
Sec
tion
172014-15 Comprehensive Annual Budget Report |
Capital Projects Funds
The District has previously been ranked as one of the fastest growing school districts in the nation. Total enrollment increased by over 37,000 students since 2005, or an increase of over 13%. Prior growth in enrollment required the construction of 101 new, 13 replacement, and 6 phased replacement schools financed through the proactive Capital Improvement Program approved by voters in 1998. The Capital Projects Funds budget includes revenues of $125 million, along with a substantial draw down of the opening fund balance of $46 million, to fund expenditure appropriations in the amount of $89 million and transfers to other funds totaling $84 million. This budget outlines the District’s final stages for the capital improvements that are to be funded from the proceeds of the 1998 bond program described in the Other Funds Section.
Debt Service Funds
The Debt Service Funds budgeted revenues are projected to total $308 million using a continued tax rate of 55.34 cents per $100 of taxable property in Clark County. Statutory debt capacity is established by Nevada Statutes and is approved annually by the Board and filed with the Nevada Department of Taxation and the Clark County Debt Management Commission. The Statutory Debt Limitation Schedule shown in the Other Funds Section reveals that, notwithstanding the District’s significant capital programs, outstanding debt is only 30% of statutory limits based upon the Department of Taxation’s estimate of assessed valuation.
Balances in the District’s Debt Service Funds are restricted by statute only for debt service and reflect the fluctuations in property valuations in Clark County during the past decade. These balances, being restricted from other use, provide both a margin of security for the District’s school construction bonds and the opportunity to support substantial increases in bonded debt while maintaining stability in property tax rates.
Maintenance of the current property tax rate will be sufficient through fiscal 2015 to retire the existing bonded debt since the District issued previous bonds based upon the factors of growth in assessed valuation in addition to increases in student population. The Capital Improvement Program provided authority to issue general obligation bonds until June 2008 and will be repaid from a fixed tax rate of 55.34 cents per $100 of net taxable property. School districts in the State receive operational funding on a per student basis, which recognizes growth in enrollment. This funding is the basis for offsetting costs (school site staffing, additional instructional materials, utilities, etc.) to the General Operating Fund associated with the acquisition of new school facilities.
Summary of Debt ServiceAs of July 1, 2014
Fiscal Year Principal InterestTotal
Requirements2015 $ 312,475,000 $142,319,250 $ 454,794,250 2016 280,805,000 125,488,840 406,293,840 2017 289,590,000 111,645,490 401,235,490 2018 294,840,000 97,221,890 392,061,890 2019 289,720,000 82,805,040 372,525,040 2020 - 24 994,080,000 239,831,915 1,233,911,918 2025 - 28 432,615,000 41,459,650 474,074,650 Totals $2,894,125,000 $840,772,075 $3,734,897,075
Capital Improvement PlanFor Fiscal Year 2014-15Descriptions FY 2014-15
1998 Capital Improvement Program:Land Acquisition $ 3,000,000New Construction: Other Facilities 10,000,000Rehab/Modernization 52,000,000Fund Total 65,000,000
Governmental Services Tax Fund:Rehab/Modernization 13,700,000 Purchase of Portable Classrooms 2,000,000Relocation of Portable Classrooms 5,500,000Fund Total 21,200,000
Building And Sites Fund:Site Improvements 750,000
Capital Replacement Fund:Student Information System 1,600,000
Total All Capital Funds $ 88,550,000Source: CCSD Facilities and Bond Financial Management

18 | Clark County School District
Between 2009 and 2013, the State of Nevada experienced substantial revenue shortfalls estimated to have exceeded $3 billion. Fortunately, the 2013 legislative session was able to approve biennial funding in the amount of over $3.8 billion for K-12 education. However, subsequent reductions in anticipated funding from the State are always a possibility as it strives to balance funding fluctuations from unstable revenue sources.
Legislation was enacted in 2005 to provide partial abatement of ad valorem taxes to provide relief from escalating assessments resulting from previous increases to the market values of real property in Clark County. The cap limits each property’s tax increase to no more than 3% above that assessed during the prior year on all single-family, owner-occupied residences. All other real property categories are limited to an increase in tax of no more than 8%. As a result of this capping and although assessed valuations in the County are anticipated to increase by 14.1%, total property tax collections are estimated to only increase by 5%. The loss in potential tax revenues to the General Operating Fund from the capping effect is projected to approximate $35 million.
Economic Environment in Southern Nevada
Southern Nevada’s commitment to diversification in the business sector and a favorable tax base has made it an ideal area for relocation and business expansion. Nevada does not impose corporate or personal income taxes, or inventory, special intangible, inheritance, estate, or gift taxes. Nevada continues to maintain one of the most beneficial tax structures for both personal as well as business growth. Las Vegas’ offerings and infrastructure continue to affirm the desirability of living within this metropolitan area.
Situated in one of the nation’s fastest growing areas, the District has been previously challenged by an associated growth in student enrollment. Over 25 years ago, the District was ranked by the Educational Research Service as the 18th largest school district in the country. The District currently ranks as the fifth largest. The projected enrollment count for 2014-15 is 317,970, as compared to 314,598 last year, or an increase of 1.1%. The population of Clark County increased by over 53,600 residents (2.7%) during 2013, with the current population estimated to be over 2,062,300.
Las Vegas joined the classification of “major city” only during the last fifteen years. As a result, there are fewer older neighborhoods than in most other major cities, and the popular concept of master planned communities has become more desirable in residential planning. These communities are planned with a variety of amenities, including parks, schools, churches, libraries, and shopping. Some of the nation’s most successful master planned communities are located in southern Nevada.
Other Funds
Special Revenue Funds, Internal Service Funds, and the Enterprise Fund comprise a small percentage of the total budget and are discussed in more detail in the Other Funds Section.
Fiscal Year 2014-15 Budget Development Considerations
Planning for the fiscal 2015 budget began in October 2013. Budget calendars shown in the Budget Policy Section reveal the input and discussion received from all levels of the District. In addition to input from District administrators, work sessions were conducted throughout the year with the Board of School Trustees and the public to determine priorities, strategic imperatives, and focus areas to operate within a balanced budget.
Benchmarks for contingency and General Fund ending balances are specified in Clark County School District Regulation 3110. Due to limited funding resources, and in order to achieve a balanced budget, the Board of School Trustees (since 2010) has been forced to temporarily suspend the regulation that seeks an unassigned ending fund balance that is equal to approximately 2% of revenues. The fiscal 2015 budget projects an unassigned ending fund balance of 1.5% of revenues with no reserve for contingencies. The desired plan is to annually increase the unassigned balance incrementally by .25% until the benchmark is reached in 2017.
Employee salary and fringe benefits represent over 88% of total expenditure appropriations and are projected to increase by almost $70 million. No cost of living increases have been added to existing salary schedules for 2014-15. Employee group health insurance premiums are unchanged with no increases forecast. Should provider premiums increase subsequently, contract negotiations with employee association groups may be necessary to operate within a balanced budget.

Intr
oduc
tory
Sec
tion
192014-15 Comprehensive Annual Budget Report |
District Organization Plan
The District has structured its central administrative services to provide more mission-driven guidance and support to direct more focus on improving student achievement. The previous six school groupings were reorganized into 16 performance zones. All schools in each of these zones were vertically aligned, forming a cluster around a high school feeder school pattern. Although they were clustered by academic performances, they tended to cluster geographically.
Each performance zone includes an average between 15 and 25 schools. Where lower-performing schools faced greater challenges, fewer schools were included in the zone. Those schools receive more oversight and less autonomy. Benefits such as having the first opportunity to hire new talent or tap professional development funds are granted to schools in higher-need zones. Schools in a higher-performing zone receive less oversight and more autonomy.
Tourism and gaming jointly remain southern Nevada’s largest industry and somewhat cushion the effects from the substantial decline in the new housing construction market. Las Vegas is home to the largest 15 hotels in the nation. With a room inventory of over 150,000, an occupancy rate that decreased slightly during 2013 to 84.3%, and a visitor volume of almost 40 million, southern Nevada received an economic impact benefit of over $40 billion from the tourism industry.
Enrollment
During the past decade, the District has added more than 37,000 students creating a strain on facilities and service levels. Since 2012, the District has returned to being among the fastest growing school districts in the nation. The slow economic upturn should be a positive impact on the District’s future funding resources. The upward enrollment trends demand that the District utilize flexible, realistic methods of projection.
It is anticipated that total enrollment will consistently increase on an annual basis over the foreseeable future. New strategic imperatives and academic initiatives are directed at retention and improving student achievement. The chart below reflects expectations and projections for going forward into subsequent school years:
300,000
305,000
310,000
315,000
320,000
325,000
Official Enrollment And Projected GrowthFiscal Years 2009-2018
317,970
2011-12 2012-13 2013-14 2014-15 2015-16 2016-17 2017-182008-09 2009-10 2010-11
Official Enrollment Projected 2014-15 Enrollment Future Projected Enrollment
321,432
311,221
Source: CCSD Demographics and Zoning
Enr
ollm
ent
Summary Of District EnrollmentFor Fiscal Years 2005-06 Through 2017-18
4th Week Full Percent Weighted PercentYear Enrollment1 Increase Enrollment2 Increase2005-06 291,329 3.75% 281,646.2 3.85 %2006-07 302,547 3.85% 292,489.6 3.85 %2007-08 308,745 2.05% 298,551.6 2.07 %2008-09 311,221 0.80% 300,817.0 0.76 %
2009-10 309,442 (0.57)% 299,058.6 (0.58)%2010-11 309,899 0.15 % 299,325.2 0.09 %2011-12 308,377 (0.49)% 297,659.2 (0.56)%2012-13 311,218 0.92 % 300,081.8 0.81 %
2013-14 314,598 1.09 % 303,450.2 1.12 %2014-15 (Est) 317,970 1.07 % 306,600.0 1.04 %2015-16 (Proj) 319,325 0.43 % 307,920.0 0.43 %2016-17 (Proj) 320,127 0.25 % 308,690.0 0.25 %2017-18 (Proj) 321,432 0.41 % 309,955.0 0.41 %(1) 4th Week - This is the number of students enrolled on the Friday of the fourth
week of school. This enrollment figure is unweighted and includes students from other districts receiving an education in the district as reported on the Amended Final Budget.
(2) 4th Week Weighted - This is the number of students enrolled on the Friday of the fourth week of school with Kindergarten and Pre-K students counted as .6 per student. The weighted enrollment figure excludes students from other districts receiving an education in the district as reported on the Amended Final Budget.
Source: CCSD Demographics and Zoning

20 | Clark County School District
Need for Future Classrooms
In November 1998, voters approved a freeze of property tax rates for long-term bonding for school construction. This approval enabled the District to issue general obligation bonds through 2008, which resulted in no increase to the existing property tax debt levy. Funding for school construction is also provided from portions of the hotel room tax and the real property transfer tax. When economic conditions in Clark County stabilize, the District will seek to request voter approval for a similar 10-year building program, while maintaining the current tax levy of .5534. In fiscal 2015, ten elementary schools in the southwest area of the District will adopt a year round school schedule to alleviate overcrowding. In the near future, it is anticipated that numerous schools will also be forced to address the impacts of enrollments in excess of their housing capacities. This conundrum can only be resolved satisfactorily upon the passage of a similar comprehensive bonding program.
The 1998 Capital Improvement Program provided proceeds of $4.9 billion for:
• Construction of 101 new schools - 61 elementary, 22 middle, 16 high schools (including 5 career and technical academies), 1 alternative high school, and 1 special school - at a cost of $2.922 billion
• Renovations to existing schools, including phased replacements, additions, modernizations, lifecycle replacement, and life and safety upgrades at a cost of $1.288 billion
• Construction of 13 replacement schools, including 10 mandated by the Nevada Legislature, at a cost of $415 million
• Land acquisition funding for future school sites in the amount of $214 million
• Construction of two regional bus transportation centers at a cost of $61 million
Student Achievement
The District is committed to its pursuit of the goal to focus on every student in every classroom, without exceptions, without excuses. This becomes more difficult given the reality that a significant segment of the student body brings with them a variety of challenges, including poverty and limited English language skills. During fiscal 2014, more than 61% of the District’s enrollment (approximately 195,000 students) qualified for free or reduced-price meals, while over 24% (70,000 students) received English Language Learner services.
The effects of these student demographics and continual limited funding issues currently facing the District are major factors in the explanation that SAT scores are slightly below those of students nationwide.

Intr
oduc
tory
Sec
tion
212014-15 Comprehensive Annual Budget Report |
Academic Performance Test Scores2002-03 2012-13
ACT Scores: Clark County School District 21.0 21.1National 20.8 20.9
SAT Scores: Clark County School District 502 483Reading National 507 491
SAT Scores: Clark County School District 513 486Math National 519 503
SAT Scores: Clark County School District N/A 458Writing National N/A 480Source: CCSD AARSI
School Accountability
Nevada Revised Statutes require each school district to pro-vide school accountability information to both residents of the district and to the State Board of Education by March 31 of each year. Due to the size of the District, much of this information is not repeated in this Comprehensive Annual Budget Report.
A four-page report is produced for each school and sent to parents of students within the school, as well as made avail-able to the general public and the State Board of Education. These reports include the educational goals and objectives of each school and the progress towards meeting these goals. Statistical information is included such as test scores; dropout/retention rates; enrollment distribution by programs such as special education, English language learners, gifted and talented, etc.; education level and experience of teach-ers; and expenditure per student comparisons. Information on parental involvement and “celebrations” recognized by the school in the past year are also included.
School accountability information may also be obtained by accessing the District’s website at www.ccsd.net.

22 | Clark County School District
This page is intentionally left blank

The “District” Reporting Entity..................................................................25Board Policies - Budget Related ..............................................................26Executive Limitations - Budget Related ...................................................29Summary of Significant Budgetary and Accounting Practices .................31Fund Accounting ......................................................................................32 General Fund .......................................................................................32 Special Revenue Funds.......................................................................33 Debt Service Funds .............................................................................34 Capital Projects Funds.........................................................................35 Enterprise Fund ...................................................................................36 Internal Service Funds .........................................................................37Organizational Structure ..........................................................................38Policy Governance - Global Mission ........................................................39DIstrict Strategies and Focus Areas ........................................................40Academic Achievement Monitoring Report ..............................................41Nevada School Performance Framework ................................................47Budget Development Process .................................................................48Budget Administration - Schools ..............................................................49Nevada Revised Statutes - Budget Requirement Summary....................50
Organizational
Org
aniz
atio
nal S
ectio
n
Section
232014-15 Comprehensive Annual Budget Report |

24 | Clark County School District
This page is intentionally left blank

Org
aniz
atio
nal S
ectio
n
252014-15 Comprehensive Annual Budget Report |
The “District” Reporting Entity
Legal Autonomy
The District maintains an autonomous legal standing provided by Nevada Revised Statute (NRS) 386.110. This statute established a corporate entity with a legal name of “The Board of Trustees of the Clark County School District”.
Based on requirements set forth by NRS 386.165, the District is governed by an elected, seven member Board of School Trustees (“Board”). The Board is legally separate and fiscally independent from other governing bodies; therefore, the District is a primary government and is not reported as a component unit by any other governmental unit.
The District maintains its ability to establish its own budgets without interference from other governmental entities.
Size and Scope
The District’s boundaries are contiguous with Clark County, Nevada and encompass 8,012 square miles of the southern tip of the state.
The number of citizens residing within the District’s boundaries is more than two million. Clark County is experiencing a change in trended growth migration. The average growth of the County’s population for the past twenty years has exceeded five percent.
Comprehensive educational services are provided to all resident students in grades kindergarten through twelfth. The District operates 356 schools and will serve an estimated 317,970 students during 2014-15.
0
50
100
150
200
250
300
350
400
2008-09 2009-10 2010-11 2011-12 2013-14 2014-152005-06 2006-07 2007-08 2012-13
Clark County Schools SummaryHistorical Growth
Fiscal Years 2006-2015
Elementary Schools
Middle Schools
Senior High Schools
Special Schools
Alternative Schools
356
Source: CCSD Demographics and Zoning
322
Sch
ools
Number of School LocationsFiscal Year 2014-15
Year Elem
enta
ry
Mid
dle
High
Spec
ial
Alte
rnati
ve
2005-06 193 54 39 8 282006-07 199 56 40 8 282007-08 206 57 42 8 282008-09 210 57 44 8 282009-10 213 56 48 8 282010-11 217 56 49 9 262011-12 217 56 49 9 262012-13 217 56 49 8 262013-14 217 56 49 8 262014-15 217 56 49 8 26
Source: Clark County School District, Facilities
Organizational Section
Number of Schools1 1955-56 2014-15Elementary 42 217Middle Schools 0 56Senior High 6 49Special Schools 0 8Alternative Schools N/A 26Total 48 356
Value of all public property used for school purposes $18,426,057 $7.3 Billion2
Total number of employees (FTE) 1,171 30,2583
Pupil enrollment 20,045 317,9703
1Detailed listings of schools including enrollments, addresses, and ages, are shown in the Informational Section.
2Estimated value of property as of June 30, 2014.3Estimated

26 | Clark County School District
Board Policies - Budget Related
Regulation 3110 - Budget Development
I. In accordance with Nevada statutes, the annual budget shall be a plan to meet the Global Ends of the Board of School Trustees by indicating the services to be provided during the fiscal year. The budget development process shall include the following:• Involvement of the Board in all major decision-making
stages,• Incorporation of long-range planning,• Provision of a fiscally sound financial plan, and• Provision for informing and involving the community
and the administration at appropriate stages to promote an understanding of the budget.
II. The Business and Finance Division is responsible for coordinating the development of the annual District budget. The development of the budget shall include a process for input by the various divisions of the District through the division head and shall incorporate those decisions of the Board of School Trustees which have financial impact.
III. The Board of School Trustees shall provide decisions at each major stage in budget development, including approval of:• Proposed changes or additions to the instructional
program for the period covered by the budget,• Proposed salary schedules for the period covered by
the budget,• Schedules for maintenance and renovation of
buildings and schedules for maintenance and replacement of equipment,
• The tentative, final, and amended final budgets, and any augmented budgets as required by Nevada statutes.
The Board shall schedule at least annually, as part of a regular or special meeting, an opportunity for input by the public and District staff on the development of the budget, including allocations and formulas utilized for budget development.
IV. The Board and the community shall be provided adequate information at all stages of budget development to enable informed estimates of the budget’s adequacy.
V. Budget development, including preparation and filing, shall be in accordance with, and as detailed in Nevada statutes, using the forms prescribed by the Nevada Department of Taxation.
VI. Budget development and administration shall be based on Generally Accepted Accounting Principles for Governmental Accounting as set forth by the
Governmental Accounting Standards Board, or a successor organization recognized as the principal authority for governmental accounting practices.
VII. The Board will adopt a plan for scheduled maintenance and renovation of buildings and maintenance and replacement of equipment.
A. The Business and Finance Division, together with the Facilities Division, shall periodically perform or cause to be performed studies of standards recognized and applied both in private industry and in the public sector for maintenance and renovation of buildings, and equipment and its useful life, including, without limitation, depreciation criteria used in private industry, and shall present recommended standards to the Board of School Trustees for adoption.
B. The Business and Finance Division shall include in the budget of the District those allocations of funds which are required to fulfill the schedules of maintenance and renovation of buildings and maintenance and replacement of equipment which have been approved by the Board of School Trustees.
VIII. Allocation of funds as major appropriations for personnel and supplies shall be made in accordance with formulas developed on the basis of educational needs of schools. These budget formulas shall include factors for allocation of:
A. Staffing
1. School administrators 2. Classroom teachers 3. Other licensed personnel 4. School clerical personnel 5. Custodial personnel6. Maintenance, grounds, and operations personnel7. Attendance officers, police officers, and campus
monitors8. Other support staff
B. Instructional Materials/Services1. Textbooks 2. Library books and magazines 3. Other library expenses 4. Library computer supplies 5. Library technical services 6. Printing services 7. Computer supplies 8. Audiovisual supplies9. Field trips 10. Instructional supplies11. Special education instructional supplies12. Medical supplies

Org
aniz
atio
nal S
ectio
n
272014-15 Comprehensive Annual Budget Report |
13. Custodial supplies14. Athletic supplies, boys15. Athletic supplies, girls16. Other activity expenses17. Equipment18. Postage
IX. Contingency Reserve
In order to provide a means of funding unanticipated expenditures within the various appropriation areas, and whenever funding is available, a contingency reserve account shall be established in the General Fund budget to provide for such unanticipated needs. The contingency account may not be less than 1/4 of 1 percent for any year.
X. Ending Fund Balance
A. An unassigned ending fund balance of not less than 2 percent of total General Fund revenue for each fiscal year shall be included in the General Fund budget. An inability to meet this requirement must be approved by the Board of School Trustees. Unassigned ending fund balance is that fund balance exclusive of non-spendable amounts such as inventory and amounts restricted, committed, or assigned for preexisting obligations.
B. The Board of Trustees must take formal action, prior to the end of the reporting period, in order to establish an ending fund balance commitment for any specified purpose. Formal Board action is also required to modify or rescind an established commitment.
C. The Chief Financial Officer has the responsibility of assigning amounts of ending fund balance that are intended to be used for specific purposes. These assignments, however, are not legally binding and are meant to reflect intended future use of the District’s ending fund balance.
D. When an expenditure is incurred, and both restricted and unrestricted resources are available, the portion of the fund balance that was restricted for those purposes shall be reduced first. If no restricted resources exist, then the unrestricted fund balance shall be reduced. Furthermore, when an expenditure is incurred for purposes which amounts of committed, assigned, or unassigned are considered to have been spent, and any of these unrestricted fund balance classifications could be used, they are considered to be spent in the above order.
E. The Board shall include in the District’s budget a reserve for economic uncertainty as a special revenue fund. The Board of School Trustees may, through its approval of the budget, provide for management of balances in the special revenue fund either through transfers to or from other funds or by direct deposit of revenues. Any balances in the special revenue fund for economic uncertainty may be made available to the General Fund to compensate for shortfalls. Balances in the special revenue fund for economic uncertainty may be made available with Board approval in those fiscal years where ending fund balance would fall below the requirement in Section X(A) above.
XI. The Business and Finance Division is responsible for developing and implementing procedures for budget development.

28 | Clark County School District
Regulation 3130 - Budget Administration
I. Procedures shall be developed to ensure that the General Fund resources of the District are used to support a basic instructional program consistent with the Global Ends of the Board of School Trustees and to ensure that budget accounts will be properly managed.
II. The Superintendent of Schools has final responsibility for administration of the budget.
III. Members of the Executive Cabinet are responsible for administration of budgets within their jurisdiction.
A. Revenue
Funds available for appropriations are governed by revenue which is dependent to a great extent on student enrollment. Enrollment is projected for the succeeding school year and estimates of revenue, based on the latest enrollment projections, are revised periodically during the current school year.
B. Appropriations
1. Department heads are responsible for supervision of budget appropriations within their jurisdiction as directed by Executive Cabinet members.
2. School principals are responsible for supervision of budget appropriations within their jurisdiction as directed by Executive Cabinet members. Schools shall receive appropriations as determined by budget formulas for the following budget line items:
a. Textbooks m. Medical supplies b. Library books n. Custodial suppliesc. Other library expenses o. Athletic supplies, boysd. Library tech supplies p. Athletic supplies, girlse. Library tech services q. Other activity expensesf. Technical services r. Equipment g. Printing services s. Postage h. Computer supplies i. Audiovisual supplies j. Field tripsk. Instructional suppliesl. Special education instructional supplies
3. An initial allocation of a maximum of 75 percent of the estimated total appropriations for each budget line item, apportioned to each school, is made in June for the succeeding school year.
4. The second (and last) allocation, which is the remainder of the total allocation, will be made at the end of October. It is determined by budget formulas now applied against the actual enrollment as of the Friday of the fourth week of the school year.
5. Each principal, upon notification of the school’s total adjusted appropriations, may, upon approval of the appropriate academic manager or associate superintendent, reallocate the appropriations, provided minimum requirements are met, and any negative balances are covered.
6. In addition to the aforementioned allotments, schools that experience growth of ten students or more between Friday of the fourth week of the school year and the Friday preceding the December holiday recess will receive allotments for the increased enrollment determined by budget formulas for budget line items for textbooks and instructional supplies as follows:
a. New schools - The sum of the regular per student appropriation for each budget line item plus the growth appropriation for each budget line item.
b. Established schools - Regular per student appropriation for each budget line item.
7. The net balance at the end of the school year of all non-project, special education, and staff development budget line item appropriations to schools determines the carry-over allowed each school. The carry-over, which is in addition to the appropriations for the succeeding school year, may be allocated at the discretion of the principal and may not exceed the following amounts:
a. Elementary schools - $ 5,000b. Middle schools - $ 6,500c. Senior high schools - $ 10,000
8. The Budget Department is responsible for the daily updating of the Budget Inquiry System. The System is available for use by department heads and school principals and indicates the status of budget appropriations, encumbrances, expenditures, and ending balances of all projects within the principal’s responsibility, and contains several years of transaction detail.

Org
aniz
atio
nal S
ectio
n
292014-15 Comprehensive Annual Budget Report |
C. Transfer of Budget Appropriations
1. Appropriation transfers between program classifications shall be by action of the Board of School Trustees upon recommendation of the Superintendent and as detailed in Nevada statutes as follows:
a. At a regular meeting, the Board takes action on the change in the amount, accounts, programs, and funds.
b. Sets forth the reasons for the transfer.c. The action is recorded in the official minutes of
the Board meeting.
2. Transfer of contingency reserve funds shall be by action of the Board at any regular Board meeting. Such transfers may not be authorized prior to September 15 of a school year and may only be to budget appropriation accounts for expenditures. (Expenditures may not be made directly from the contingency reserve.)
3. Deferred appropriation transfers shall be by action of the Board upon recommendation of the Superintendent after the fourth week of the school year. Such transfers can be made at any regular Board meeting and are necessary to meet requirements of actual student enrollment.
4. Appropriation transfers within program classifications are approved by the appropriate Executive Cabinet member upon request of the school principal or department head. These transfers are summarized and included in the official minutes.
5. The Business and Finance Division is responsible for developing and implementing procedures for budget appropriation transfers.
The District has developed an effective budgeting system involving close cooperation among the Board of School Trustees, administration, and staff in all phases of budget development. The District prepares its budgets, which are submitted to the Nevada Department of Taxation, using generally accepted accounting principles (GAAP) applicable to governmental entities.
Executive Limitations - Budget Related
The Executive Limitations and Board Policies described below are limited to expectations that pertain to the budgetary and financial activities of the District. All Board policies can be viewed at the District’s website at www.ccsd.net.
EL-1: Global Executive Constraint
The Superintendent will not cause or allow any practice, activity, decision, or organizational circumstance, which is either unlawful, imprudent or in violation of commonly accepted business and professional ethics and practices.
EL-5: Financial Planning/Budgeting
Financial planning for any fiscal year or the remaining part of any fiscal year will not deviate materially from the Board’s Ends priorities, risk fiscal jeopardy, or fail to be derived from a multi-year plan.
Further, without limiting the scope of the foregoing by this enumeration, the Superintendent will not:
1. Make plans, which would cause the conditions described, as unacceptable to the policy EL-6, “Financial Condition and Activities.”
2. Fail to include credible projection of revenues and expenses, separation of capital and operational items, cash flow, and disclosure of planning assumption.
3. Fail to provide resources for Board prerogatives during the year as set forth in the policy GP-17, “Cost of Governance.”
4. Fail to present for public input a budget and plan with sufficient detail regarding spending levels that are under consideration to show alignment of said spending levels:A. With the Board’s Ends priorities, andB. With the District’s academic priorities, andC. With the District’s fiscal priorities.
5. Fail to provide a mid-year fiscal status report that includes narrative:a. Detailing the District’s progress toward its current
publicly stated fiscal priorities, andb. In the context of the District’s current publicly stated
academic priorities. EL-6: Financial Condition And Activities
6. Fail to appropriately pursue alternative or non-traditional potential funding sources if said potential sources:a. Supplement traditional funding sources, andb. Directly align with and support the Board’s Ends
priorities and the District’s current publicly stated academic and fiscal priorities.
7. Fail to inform the Board prior to a final vote on a budget or plan that could jeopardize current or future funding levels.

30 | Clark County School District
EL-6: Financial Condition and Activities
With respect to the actual ongoing financial condition and activities, the Superintendent will not cause or allow the development of fiscal jeopardy or a material deviation of actual expenditures from Board priorities established in Ends policies.
Further, without limiting the scope of the foregoing by this enumeration, he/she will not:
1. Expend more funds than will be received in the fiscal year unless the debt guideline (below) is met.
2. Indebt the District in an amount greater than can be repaid by identified and otherwise unencumbered general fund revenues within the current fiscal year.
3. Obligate the District to future bond issues or commit bond funds without Board approval.
4. Allow the unassigned ending fund balance to fall below 2% of total projected general fund revenue.
5. Take any action that would cause the bond rating to be downgraded.
6. Fail to settle payroll and debts in a timely manner.7. Allow tax payments or other government-ordered
payments or filings to be overdue or inaccurately filed.8. Fail to aggressively pursue receivables after a
reasonable grace period.9. Fail to ensure that Vegas Public Broadcasting Service
(PBS) follows all Federal Communication Commission (FCC) and Corporation for Public Broadcasting (CPB) guidelines.
10. Take any action, without Board notification, that could result in reduced funding levels for current or future periods.
11. Fail to notify the Board in a timely manner when functional level expenditures exceed budgeted appropriations.
EL-8: Asset Protection
The Superintendent will not allow the District’s assets to be unprotected, inadequately maintained, or unnecessarily risked or fail to be maximized.
Further, without limiting the scope of the foregoing by this enumeration, he or she will not:
1. Fail to maintain adequate insurance to protect the District’s assets.
2. Allow unbonded personnel access to material amounts of funds.
3. Subject property, plant or equipment to improper wear and tear or insufficient maintenance.
4. Unnecessarily expose the organization or its Board or staff to claims of liability.
5. Make any purchase:• Circumventing the District’s central purchasing rules
and authorization• Wherein normally prudent protection has not been
given against conflict of interest• Wherein preference has not been given to Nevada
vendors where appropriate• Of over $25,000 without obtaining bids • In any amount for which funding has not been included
in the budget without specific Board approval. Splitting orders to avoid these requirements is not allowed.
6. Fail to protect intellectual property, information, and files from loss or significant damage.
7. Receive, process, or disburse funds under controls, which are insufficient to meet the Board appointed auditor’s standards.
8. Fail to maintain and operate physical facilities in a manner that prolongs the life expectancy of the building and provides an appropriate educational environment.
9. Endanger the organization’s public image or credibility, particularly in ways that would hinder the accomplishment of its mission.
10. Fail to annually certify to the Board as to the District’s adequacy of insurance.
11. Fail to invest the District’s assets in a manner consistent with NRS 355 and District Regulation 3214.
12. Fail to design, establish and implement a system of internal controls, in accordance with Generally Accepted Accounting Principles, that effectively mitigates any significant and/or material risks to the District.
13. Fail to provide certification to the Board annually as to the effectiveness of the system of internal controls.
EL-9: Compensation And Benefits
With respect to employment, compensation, and benefits to employees, consultants, contract workers and volunteers, the Superintendent will not cause or allow jeopardy to fiscal integrity or to public image. Further, without limiting the scope of the foregoing by this enumeration, he or she will not:
1. Change his or her own compensation and benefits, except as his or her benefits are consistent with a package for all other employees.
2. Promise or imply permanent or guaranteed employment.

Org
aniz
atio
nal S
ectio
n
312014-15 Comprehensive Annual Budget Report |
EL-12: Annual Report To The Public
The Superintendent shall not fail to prepare an annual progress report to the public that includes the following items:
1. Student performance data indicating student progress toward accomplishing the Board’s Ends policies;
2. Information about District strategies, programs and operations intended to accomplish the Board’s Ends policies;
3. Revenues, expenditures and costs of major programs and elements of District operation.
Summary of Significant Budgetary and Accounting Practices
The accounting and budgeting practices of the District as reflected in this budget report and related budget documents conform to Generally Accepted Accounting Principles (GAAP) and budgeting requirements established for local school districts by the Nevada State Legislature. Basis of budgeting refers to when revenues and expenditures or expenses are recognized in the accounts and reported on the financial statements. Basis of budgeting relates to the timing of the measurement made, regardless of the measurement focus applied. Both this report and the Comprehensive Annual Financial Report (CAFR) are measured and reported on using the same basis of accounting.
All Governmental Funds use the modified accrual basis of accounting with budget practices coordinating allocations in respects to the modified accrual basis. Revenues are recognized when they become measurable and available as net current assets. Gross receipts and sales taxes are considered “measurable” when received by the intermediary collecting governments and are then recognized as revenue. Anticipated refunds of taxes are recorded as liabilities and reductions of revenue when they are measurable and the payment seems certain. The major revenue sources of the District include State distributive fund revenues, local school support taxes, property taxes, interest income, and governmental services taxes. Using the modified accrual basis, expenditures are recognized when the related fund liability is incurred. An exception to this rule is that principal and interest on general long-term debt are recognized when due.
All Business Type Funds (Enterprise and Internal Service) use the accrual basis of budgeting. Revenues are recognized when earned and expenses are recognized in the period incurred.
The basis of budgeting and basis of accounting are the same, except for differences in fund reporting structure. For financial statement purposes, the Medicaid Fund is shown individually; however, in this document it is combined with federal projects.
District Funds General Funds 01001 General Fund 01401 Indirect Cost Fund 01601 Donations And Trusts Fund 01701 District Projects Fund
Special Revenue Funds 0200 Class Size Reduction Fund 0220 Vegas PBS Fund 0230 Adult High School Diploma Program Fund 02501 Special Education Fund 0279 State Grants/Projects Fund 02801 Federal Projects Fund 0285 Medicaid Fund
Debt Service Funds 04001 Debt Service Fund 04011 Debt Service Revenue Bonds Fund
Capital Projects Funds 03081 Bond Fund - 1998 Building Program 0330 Building And Sites Fund 03351 AB 353 Fund - 1998 Building Program 0340 Governmental Services Tax Fund 0370 Capital Replacement Fund
Enterprise Fund 0600 Food Services Fund
Internal Service Funds 0700 Insurance And Risk Management Fund 0710 Graphic Arts Production Fund
(1) Major funds in the government-wide financial statements.

32 | Clark County School District
Fund Accounting
The District uses funds and account groups to report on its financial position and the results of its operations. Fund accounting is designed to demonstrate legal compliance and to aid financial management by segregating transactions related to certain governmental functions or activities.
A fund is a separate account entity with a self-balancing set of accounts. An account group is a financial reporting device designed to provide accountability for certain assets and liabilities that are not recorded in the funds because they do not directly affect net expendable available financial resources.
Funds are classified into governmental and proprietary categories. Each category in turn is divided into separate fund types. Governmental funds are used to account for all or most of a government’s general service activities. Proprietary funds are used to account for activities similar to those found in the private sector, where the determination of a net income is necessary or useful for sound financial administration. NRS 354 provides that an independent auditor must examine the operation of the District’s various funds for compliance with accounting and financial requirements related to the statutes. In order to meet this mandate, the Nevada Tax Commission has prescribed that local government entities adopt a resolution in a required format establishing the various funds to record the operations of the entity, state a plan for administration of the funds, and file the resolution with the Nevada Department of Taxation. The Resolution Establishing Various Funds was adopted by the Board of School Trustees on June 25, 1996, and amended on June 26, 1997, and July 22, 1999.
Governmental Funds - The District operates three major govermental fund groupings and four non-major governmental fund groupings.
General Fund - The General Fund is typically used to account for all financial resources except those required to be accounted in another fund.
General Fund—This major governmental fund is the District’s operating fund and is used to account for all financial transactions and expenditures associated with the administration and daily operations of the schools except for federal and State grant-funded programs, school construction, debt service, food service operations, and interdepartmental services.
The 1993 Nevada Legislature approved NRS 387.047, which requires all school districts in the state to account
separately for all funds received for the instruction of, and provision of related services to, students with disabilities. Throughout this document, General Operating Fund refers to the combination of this Special Education Fund along with the Indirect Cost Fund, Donations and Trusts Fund, District Projects Fund, Class Size Reduction1 and the regular operations General Fund.
Sources of revenue and assets in the General Fund include, but are not limited to, local school support sales taxes, property taxes, governmental services taxes, reimbursements for school operations, private and other governmental gifts and grants, franchise fees, sales of assets, federal forest reserve and impact aid payments, State payments, tuitions payable from other school districts, summer school tuition, investment earnings, income from student activities, and donations.
All resources of the General Fund shall be expended according to the budget as established by the Board under applicable statutes and regulations to deliver the highest possible quality of educational experience to the students of the District, taking into account the amount of available revenues and the outcome of deliberations by the Nevada Legislature. The budget shall be formulated under Board approved regulations and shall provide, within available revenue, for the allocation of resources for direct instruction to students and for such supporting services, facilities, and materials as may be necessary to effectively support the instructional program, taking into account the increase or decrease in overall enrollment and enrollment in individual schools and programs. Contingencies and ending balances will be budgeted and managed according to District regulation. Reserved and unreserved balances will be prudently retained by the District as protection against fluctuations or unforeseen reductions in revenue, unforeseen expenditures in excess of the budgeted contingency, and to maintain and improve bond credit ratings to minimize interest cost to taxpayers. Such balances will be managed according to District regulation. Reserved and unreserved ending balances, including amounts encumbered or specifically designated, shall be recorded and reported according to generally accepted accounting principles.
When the audited unassigned ending balance of the General Fund is less than the amount required to be maintained according to District regulation, the budgeted General Fund expenditures shall be adjusted as necessary in the current year and in the ensuing year to ensure that the unassigned balance is not less than the amount required by District regulation in the ensuing year.
For the General Fund, an amount no less than the amount of unassigned ending balance required by District regulation is deemed by the Board to be reasonable and necessary to achieve the purposes of the Fund.
1 The Class Size Reduction Fund has been included in the General Operating Fund for presentation purposes, where as, it was previously reported in the Special Revenue Funds.

Org
aniz
atio
nal S
ectio
n
332014-15 Comprehensive Annual Budget Report |
Resources in the Funds originate from special purpose grants and reimbursements from the State or other non-federal governmental entities.
All assets of the Funds are to be applied exclusively toward the purposes for which funding was generated, recognizing any conditions imposed by the granting or donating entity. The budget is developed annually to ensure that expenditure authority has been aligned as necessary with any requirements of the granting entity.
All balances and reserves in the Funds are to be retained and not be transferred or applied toward any purposes other than as permitted under the terms imposed by the granting entity. If the granting entity allows, balances may either be applied toward the grant or specified projects in the ensuing project year, or refunded to the granting entity.
Deficiencies in the Funds are to be removed by transfers from the General Fund or by a correcting entry in another fund if the deficiency is related to activity of that fund. Retention of the entire restricted, committed, and assigned balance is deemed by the Board to be reasonable and necessary to carry out the purposes of the Funds. Any amounts which may be due to the State or other granting entity will be reflected as such in the financial statements.
Vegas PBS Fund - This fund is used to account for the transactions and operations of the District’s educational media services channel. Sources of revenue and assets include bequests, donations, grants, interest on investments, special State appropriations, and other local sources of funding.
Expenditures include, but are not limited to, salaries and benefits, supplies and materials, professional and technical services, equipment purchases, and other costs associated with the channel’s operations. Planning for capital acquisition or other station improvements must be approved annually by the Board.
All balances and reserves in the Fund shall be retained and not transferred or applied to any purposes other than as permitted under terms imposed by grant and donor bequests. Deficiencies in the Fund will be removed by a correcting entry in another fund if the deficiency relates to activity in that fund. Retention of the entire restricted, committed, and assigned balance is deemed by the Board to be reasonable and necessary to carry out the purposes of the Fund.
Federal Projects Fund - This fund is a major governmental special revenue fund used to account for the costs and operations of programs and projects funded by federal grants, including, but not limited to, salaries and benefits, supplies and materials, professional and technical services, equipment and remodeling, and other purchases authorized by such programs. Resources are generated from federal grant and contract proceeds.
Special Revenue Funds — The District maintains two major governmental and five non-major governmental special revenue funds. These funds account for the proceeds of specific revenue sources that are legally restricted to expenditures for specified purposes.
Special Education Fund - This fund is a major governmental special revenue fund used to account for the costs and operations of education and related services to students with disabilities, including, but not limited to, salaries and benefits, supplies and materials, professional and technical services, equipment and other capital outlay, and other purchases associated with the programs.
Sources of funding in the Fund are state funds received specifically for the special education of disabled students and transfers from the General Fund. All assets of the Fund are to be applied exclusively toward the purposes for which funding has been generated.
The budget is established each year using realistic projections of revenues and expenditures. All ending balances are to be transferred into the General Fund while any deficiencies are eliminated either by a transfer from the General Fund or a correcting entry from the related fund that created the deficiency.
The anticipated and necessary unreserved year-end balance for the Fund is zero. Any deficits will be removed by transfers from the General Fund (or other funds) and any surpluses will be remitted to the General Fund. This practice is deemed by the Board to be reasonable and necessary to carry out the purposes of the Fund.
Class Size Reduction, Adult High School Diploma, and State Grants/Projects - These funds are used to account for the costs and operations of programs supported by special purpose grants and reimbursements from the State or other non-federal governmental entities. Expenditures include, but are not limited to, salaries and benefits, supplies and materials, professional and technical services, equipment and other capital outlay, depreciation, and other purchases associated with the programs.

34 | Clark County School District
All balances and reserves in the Fund are to be retained and not applied toward purposes other than that for which the Fund was established. Deficiencies in the Fund are to be removed by transfers from the General Fund or by a correcting entry in another fund if the deficiency is related to activity in that fund. Retention of an assigned balance in the Fund as described above is deemed by the Board to be reasonable and necessary to carry out the purposes of the Fund.
Debt Service Funds - The District operates one debt service funds that are used to account for the accumulation of resources for, and the payment of, general long term debt principal and interest.
Debt Service Fund - This fund is used to account for the costs and payment of debt service obligations including, but not limited to, principal and interest payments, related professional and financial services fees, bond premiums and discounts, and collection and distribution of property tax revenues and other permissible sources associated with debt service or capital projects tax levies as permitted by Nevada Statute. In addition, the Fund and its resources function as a guarantee to investors (who have purchased the District’s bonds) that the District will meet its debt obligations, to the citizens of the County that schools will be constructed and renovated with voter approval, and to taxpayers that the established tax rate shall not be exceeded.
Resources deposited into the Fund include property taxes, investment earnings, reimbursements, good faith deposits, bond premiums, and other permissible sources including, but not limited to, transfers from Capital Projects Funds, or other funds of the District, as well as proceeds of sales of capital assets required to be deposited to the Fund.
All revenues and assets in the Fund are exclusively restricted toward the purposes for which the funds are generated. Budgetary amounts are established each year through the District’s estimation of total resources (including the year-end assigned balance) and factored not to exceed the amount of the annual projected debt service and associated costs based on existing and proposed debt issues as well as permissible distributions of capital projects tax levies.
When the actual year-end assigned balance in the Debt Service Fund exceeds the amount of existing and proposed debt service and permissible distributions of capital projects tax levies for the ensuing fiscal year, the property tax rate or other permissible sources established for the Fund shall be decreased in the ensuing fiscal year in order that the budgeted year-end reserved balances are no more than the amount of the following year’s estimated payments for debt service and associated costs.
All assets in the Fund are to be applied exclusively toward the purposes for which the resources have been generated, taking into account all restrictions imposed by the grant or contract. The budget is established each year using projections that are aligned with the stated requirements of the granting agency.
All balances and reserves in the Fund are to be retained and not transferred or applied toward any purposes other than as permitted under the terms imposed by the granting entity. If the entity permits, balances may either be applied toward the grant or specified projects in the ensuing project year or refunded to the agency. Deficiencies in the Fund are to be removed by transfers from the General Fund or by a correcting entry in another fund if the deficiency relates to the activity of that fund.
Medicaid Fund - This fund is used to account for the receipt and expenditure of grants or reimbursements from the Medicaid Program for services rendered on behalf of eligible students. All revenues received in the Fund are to be applied exclusively toward the salaries and benefits, supplies and materials, professional and technical services, equipment and other capital purchases, any costs incurred in the collection of Medicaid funding, or other costs associated with providing services for disabled or other students who are eligible under federal statute and regulation for the Medicaid Program.
Resources in the Fund are comprised of grants or reimbursements received by the District under the guidelines and regulations governing the Medicaid Program.
All assets in the Fund are to be applied exclusively toward the purposes for which funding has been generated. The budget is established annually using projections that account for the authority to expend strictly for programs, services, activities, and purchases on behalf of students eligible to receive reimbursable Medicaid services.

Org
aniz
atio
nal S
ectio
n
352014-15 Comprehensive Annual Budget Report |
All revenues and assets in the Fund are exclusively restricted toward the purposes for which the funds are generated. Budgetary amounts are established each year through the District’s estimation of total resources (including the year-end reserved balance) and factored not to exceed the amount of the annual projected debt service and associated costs based upon existing and proposed debt issues.
Capital Projects Funds—The District maintains five non-major governmental capital projects funds to account for all resources used exclusively for acquiring and improving school sites, constructing and equipping new school facilities, and renovations.
Bond Fund - This fund is used to account for the costs of capital construction and improvements financed from bond proceeds including, but not limited to, capital outlays as permitted under Nevada Revised Statutes, salaries and benefits, supplies and materials, professional and technical services, equipment and remodeling, and other renovations.
Resources in the Fund represent the net proceeds from sales of general obligation or special obligation bonds issued pursuant to Nevada law. All assets of the Fund are to be applied exclusively toward the purposes for which funding was generated. All balances and reserves in the Fund shall be retained and not transferred or otherwise applied toward any purpose except that permitted by law. Deficiencies in the Fund are to be removed by transfers from the General Fund or by a correcting entry in another fund if the deficiency is related to the activity of that fund. The entire unexpended amount of the assigned balance of the Fund is determined by the Board.
Building and Sites Fund - This fund is used to account for the costs of construction, purchases, modernization, or furnishing of school buildings or sites, as specified in NRS 387.335 or successor statutes including, but not limited to, salaries and benefits, supplies and materials, professional and technical services, equipment and remodeling, and other renovations.
Sources of revenue in the Fund are receipts from the rental and sales of District property. All assets of the Fund are to be applied exclusively toward the purposes for which funding was received. All balances and reserves in the Fund shall be retained and not transferred or otherwise applied toward any purpose except that permitted by law. Deficiencies in the Fund are to be removed by transfers from the General Fund or by a correcting entry in another fund if the deficiency is related to the activity of that fund. The entire unexpended amount of the assigned balance of the Fund is deemed by the Board to be reasonable and necessary to carry out the purposes of the Fund.
Since the District has dedicated its “full faith and credit” backing toward all general obligation bond issues, the maintenance of an adequate fund balance and corresponding property tax rate is subject to the three separate determination criteria of deficiency, all of which must be met annually. These criteria are as follows:
• When the estimated revenues to be generated for the ensuing year (plus existing Fund balance) are not sufficient to avoid a reduction in the Fund balance (not created by the issuance of new debt), the property tax rate shall be increased for the ensuing year to a rate necessary to maintain the Fund balance at the same level during the ensuing year. That rate shall not exceed the sum of the maximum rates set forth in the sample ballots for outstanding bonds and shall not exceed the $3.64 per $100 property tax rate cap.
• When the sum of revenue estimates for the ensuing year (plus existing Fund balance) would be insufficient after the payment of debt service, the property tax rate shall be increased in the ensuing year to that rate necessary to achieve a sufficient Fund balance that avoids any adverse comments, notations, or other negative alerts from the rating agencies, subject to the $3.64 per $100 property tax rate cap.
• When the sum of revenue estimates for the ensuing year (plus existing Fund balance) would be insufficient to pay the expected debt service requirements and capital projects tax distributions for the ensuing year, the property tax rate shall be increased to enable funding of the District’s debt service obligations in a timely fashion, subject to the $3.64 per $100 property tax rate cap.
The District annually assigns a portion of the ending fund balance equal to 25% of the ensuing fiscal year’s principal and interest debt service requirements as a resource to supplement any potential revenue shortfalls that may occur. This is deemed by the Board to be reasonable and necessary to carry out the purposes of the Funds.
Debt Service Revenue Bonds Fund - This fund is used to account for the costs and payment of debt service obligations for general obligation revenue bonds pledged by the revenue generated from a 1 5/8% Clark County hotel room tax and the revenues of a tax equivalent to 60 cents for each $500 of value on transferred real property within Clark County. These revenues are deposited into the Capital Projects Fund and transferred into the Debt Service Revenue Bonds Fund in an amount sufficient to provide for the annual repayment of all obligations and required reserves associated with those revenue bonds issued pursuant to the provisions of NRS 387.325.
Should the hotel room and real property transfer tax revenues be insufficient, the full faith and credit of the District is pledged for the payment of principal and interest due thereon, subject to Nevada constitutional and statutory limitations on the aggregate amount of ad valorem taxes.

36 | Clark County School District
Governmental Services Tax Fund - This fund is used to account for the costs of capital projects funded from Governmental Services Taxes including, but not limited to, salaries and benefits, supplies and materials, professional and technical services, equipment and remodeling, and other renovations.
Resources in the Fund represent proceeds from the capital improvement portion of the Governmental Services Tax, bonds, or other obligations issued utilizing the tax proceeds as security.
All assets of the Fund are to be applied exclusively toward the purposes for which funding was generated. All balances and reserves in the Fund are to be retained and not transferred or otherwise applied toward any purpose except that permitted by statute. Deficiencies in the Fund are to be removed by transfers from the General Fund or by a correcting entry in another fund if the deficiency is related to the activity of that fund. The entire unexpended amount of assigned balance of the Fund is deemed by the Board to be reasonable and necessary to carry out the purposes of the Fund.
Capital Replacement Fund - This fund is used to account for the costs of capital projects ordinarily not undertaken more frequently than once every five years to maintain District facilities and equipment in a fit operating condition including, but not limited to, salaries and benefits, supplies and materials, professional and technical services, other permissible purchases, and replacement of equipment and other assets according to a schedule approved by the Board. The District shall provide a separate accounting of such projects for each classification of assets for which the District has established a schedule of useful life. If required by statute, the District shall provide separate accounting for each facility or group of facilities affected by such projects.
Resources in the Fund are transfers from other funds made pursuant to a plan approved by the Board based upon the estimated useful life of various classes of assets, proceeds of bonds or other obligations issued using such transfers as a source of payment or security, or applications of other funds as permitted by statute and approved by the Board.
Deficiencies in the Fund are to be removed by transfers from the General Fund or by a correcting entry in another fund if the deficiency is related to the activity of that fund.
The entire unexpended amount of the assigned balance of the Fund is deemed by the Board to be reasonable and necessary to carry out the purposes of the Fund.
Proprietary Funds - The District operates three proprietary funds that focus on the determination of operating income, changes in net assets, financial position and cash flows. There are two types of proprietary funds: enterprise and internal service funds.
Enterprise Fund—The District maintains one Enterprise Fund.
Food Services Fund—The Food Services Fund is a non-major enterprise fund used to account for the costs and operations of food services including, but not limited to, salaries and benefits, food purchases, supplies and materials, professional and technical services, utilities, building space, equipment and renovations, depreciation, and other costs associated with program operations.
Resources of the Fund include, but are not limited to, charges to students and other consumers for meals and food services, interest earnings, proceeds of obligations, federal subsidies, and donated commodities received by the program, and with reimbursements associated with providing food to populations as approved under federal guidelines or by Board action.
All assets of the Fund are to be applied exclusively toward the purposes for which funds and assets are generated. It is the intent of the Board that the Fund is to be operated such that all eligible costs associated with operating the program are borne exclusively by user charges, federal funding, and reimbursements to the program. No funds are to be transferred from other District funds to support the Fund unless approved by the voters as a component of a bond or capital projects tax ballot question.
The budget shall be established each year using projections of resources and expenditures that will create an ending cash and cash equivalents balance equal to the amount of three largest months’ operating costs for the ensuing fiscal year plus any additional amounts deemed part of a Board-approved plan for capital acquisition or improvement. If the cash and cash equivalents balance exceeds this amount, the rates charged for meals and food services may, if necessary, be adjusted in the ensuing fiscal year to enable a planned reduction of the balance to the desired level.
Should the year-end cash and cash equivalents balance in the Fund be less than the required amount of three largest months’ operating costs for the ensuing fiscal year (plus any additional amounts justified by a plan for capital acquisition or improvement approved by the Board), the rates charged for meals and food services are to be adjusted in the ensuing fiscal year to raise the cash and cash equivalents balance equal to the amount of three largest months’ operating costs for that fiscal year plus any amount which is part of a Board-approved plan for capital acquisition or improvement.

Org
aniz
atio
nal S
ectio
n
372014-15 Comprehensive Annual Budget Report |
The Board deems that an amount equal to three largest months’ operating costs (plus any Board-approved capital outlay) is reasonable and necessary to meet the objectives of the Fund. Its operations are intended to be wholly self-supporting, and therefore, must have sufficient reserves to meet fluctuations in program revenues and food prices as well as pay for necessary capital improvements.
Internal Service Funds—The District maintains two separate Internal Service Funds.
Graphic Arts Production Fund - This fund is used to account for the costs and operations of graphic arts production including, but not limited to, salaries and benefits, supplies and materials, professional and technical services, equipment and remodeling, depreciation, and other purchases associated with productions.
Resources of the Fund include, but are not limited to, user charges to schools and departments of the District in addition to reimbursements and transfers associated with graphic arts productions. It is intended by the Board that the Fund must be operated such that all costs associated with the program are borne exclusively by user charges to schools and departments of the District and by other reimbursements received for services. Any transfers of funds for capital needs to the Fund will be approved by the Board.
All assets in the Fund are to be applied exclusively for the purposes for which funds were generated. The budget is to be established using projections of resources and expenditures of charges to schools and departments that will maintain an ending retained earnings balance equal to the amount of two months’ operating costs for the ensuing year. Additional balances beyond two months’ operating costs may be retained only pursuant to a Board-approved plan for acquisition of capital to be used in graphic arts operations.
Should the year-end net assets balance exceed or be less than two months’ operating costs for the ensuing fiscal year (plus planned accumulations for capital acquisition), the rates charged, assessments, or transfers established for the Fund shall be adjusted in the ensuing fiscal year to meet the stated objective. The budgets for the District’s other funds shall be adjusted accordingly to fund such changes to rates, assessments, or transfers.
The Board deems that a net assets balance equal to two months’ operating costs (plus planned accumulations for capital acquisition) is reasonable and necessary to carry out the purposes of the Fund.
Insurance and Risk Management Fund - This fund is used to account for the costs and operations of insurance and risk management including, but not limited to, salaries and benefits, supplies and materials, professional and technical services, payment of premiums, establishment and operation of self-insurance reserves, equipment and renovations, depreciation, and other costs associated with program operations.
Resources in the Fund are generated from assessments to other District funds, investment earnings, transfers, and reimbursements. Assessments to other funds are proportionately allocated among the various funds operated by the District.
All assets of the Fund are to be applied exclusively toward the purposes for which the funds have been generated. The budget shall be established each year using projections that involve the establishment of rates to be charged and assessments to other funds, expenditures, and liability reserves in order that the ending retained earnings balance equals one-fourth of the ensuing year’s estimated losses based on an independent actuarial study that is conducted annually, utilizing an actuarial confidence level of not less than 50%.
When the net assets balance of the Fund exceeds or is less than the required budgeted amount for the ensuing fiscal year, the rates charged, assessments, or transfers established for that Fund are to be adjusted in the ensuing fiscal year to meet the objectives stated above. The budgets for the District’s other funds are also established accordingly to accommodate such rates, assessments, or transfers.
It is deemed by the Board that a net assets balance of one-fourth of the ensuing year’s anticipated losses (based upon the annual actuarial study at a confidence level of not less than 50%) is reasonable and necessary to carry out the purposes of the Fund.

38 | Clark County School District
Superintendent of Schools
Board of School Trustees
Legal Office
Equity and Diversity Education
Public Education Foundation
School Police Services and Emergency Management
Diversity and Affirmative Action
Educational and Operational
Excellence Unit(Results)
Human Resources Unit
(People)
Instruction Unit
(Achievement)
External Relations Unit
Community and Government
Relations(Community)
Innovative Teaching and Learning Unit(Innovation)
Business and Finance
Employee Management
Relations
Communications
Internal Audit
Board Office
Government Relations
School-Community Partnership
Parent Engagement
Student Achievement Officers(Schools)
Leadership Development
English Language Learners Program
Turnaround Zone Schools
Education Services Division
Prime 6 Schools
Instructional Support, Athletics, and Activites
School Support
Recruitment, Selection, and Placement
Induction and On-Boarding
Operational, Food, Maintenance, and Transportation Services
Student and Wraparound Services
Title 1
Grants
Technology and Information Systems Services
Curriculum and Professional Development
Assessment, Accountability, Research, and School Improvement
Budget, Accounting, and Payroll
Capital Programs
Demographics, Zoning, and Geographic Information Systems
Purchasing
Real Property Management
Risk Management and Environmental Services
Vegas PBS
Energy Management2014-15 Organizational Structure
(Opportunity)

Org
aniz
atio
nal S
ectio
n
392014-15 Comprehensive Annual Budget Report |
II. Students meet state and District guidelines in the following areas:
A. Arts: B. Career and1. Music Technical Education 2. Theater3. Visual Arts
C. Physical Education and Lifelong Wellness:
1. Dance2. Fitness
III. Students demonstrate personal and workplace skills which are integrated throughout the curriculum and include:
A. Creativity and Innovation
G. OrganizationH. Personal Finances
B. Critical Thinking I. Problem SolvingC. Goal Setting J. Team Building
and Collaboration D. Initiative E. Interpersonal Skills K. TechnologyF. Leadership
IV. Students demonstrate positive character skills which are integrated throughout the curriculum and include:
A. Citizenship E. Kindness and CaringB. Courtesy and
RespectF. Responsibility
C. Good SportsmanshipD. Honesty and Trustworthiness
Policy Governance - Global Mission
The Board follows a model of governing called Policy Governance. This method allows the Board to set the vision for public education in the District and to develop policies that direct this vision, and it includes rigorous monitoring to ensure accountability.
The Board’s mission statement defines the overall vision and directs the superintendent to ensure that: “All students progress in school and graduate prepared to succeed and contribute in a diverse global society.”
To achieve this vision, the Board sets specific goals. These goals, also called “Ends,” define expectations for students. The “Ends” define the desired outcomes or results.
I. Students meet State and federal guidelines as well as appropriate benchmarks for academic proficiency in all areas and all grade levels and pass the High School Proficiency Exam (HSPE).
The core curriculum is the highest priority:
Language Arts: 1. Foreign Language 2. Oral and Written Communication 3. Proficiency in English 4. Reading Fluency and Comprehension
Mathematics:1. Algebra and Functions2. Data Analysis, Statistics and Probability3. Measurement and Geometry4. Numbers and Number Sense Science: 1. Earth and Space Science 2. Life Science 3. Nature of Science 4. Physical Science
Social Studies:1. Civics2. Economics3. Geography4. History
40 | Clark County School District
District Strategies and Focus Areas
Previously, the District had limited its budget development communication to granular discussions that assumed compliance with the District’s global mission and visions. Recently, the Nevada State Legislature enacted Senate Bill 175 in the 77th Legislative Session. Senate Bill 175 established requirements for school districts to further refine planning to include budget priorities and linking strategies to student achievement and improving classroom instruction. The bill also requires the Superintendent to use this criteria established in making recommendations to the Board of School Trustees regarding budget.
As an accommodation to Senate Bill 175, District administration has developed the following criteria for which planning, communication, and budget development would encompass:
Strategic ImperativesThe Board identifies the following imperatives for student achievement:
Academic ExcellenceLiteracy across all subject areas pre-K through 12th grades
EngagementParent, student, community and employee engagement in learning
School SupportFocused support, preparation, training and resources for staff in the schools
Clarity and FocusFiscal and data transparency, accountability and strategic oversight
EvaluationThe Board directs the Superintendent to:
• develop strong strategies• identify work streams• define measurement indicators, and• devise tracking and reporting protocols
Focus AreasWe will track our progress on goals aligned to seven areas of focus:
ProficiencyElevate the percent of proficient students in assessed subjects and grades
Academic GrowthDemonstrate upwardly trending growth in student assessments
Achievement Gaps• Narrow gaps in assessments and graduation rates
among students with diverse backgrounds, including:Race/ethnicityEnglish Language LearnersEconomic challengesGenderStudents with disabilities
College and Career Readiness• Prepare all students for college and career• Enhance workplace skills and character traits
Value/Return on Investment• Expand programs and practices that demonstrate value/
return on investment• Eliminate programs and practices that do not
demonstrate value/return on investment
Disproportionality• Decrease the disproportionality of both students
and adults with diverse ethnicities who participate in advanced programs, secure jobs in our District, and face disciplinary outcomes
Family/Community Engagement and Customer Service• Engage parents and families as advocates for academic
achievement and lifelong learning through effective communication
• Create a culture that aligns business, government and nonprofit resources around the needs of children and families to support students
• Provide high-quality customer service• Ensure a safe learning environment for all students

Org
aniz
atio
nal S
ectio
n
412014-15 Comprehensive Annual Budget Report |
Academic Achievement Monitoring ReportFiscal Years 2011 Through 2013
TopicData
Source 2010-11 2011-12 2012-13 Results Supporting Data/InformationA. Language Arts
1 Elementary school Language Arts proficiency (Kindergarten)
Discovery Education
N/A N/A 36.7% No Change
Discovery Education assessments were utilized during the 2012-2013 school year for the first time. The data indicates the percentage of tested students whose level of proficiency was designated as meets or exceeds. The Kindergarten percentage represents approximately 3,359 of 24,000 kindergarteners during the 2012-2013 school year due to the opt-in nature (not mandatory) for the first year of implementation.
2 Elementary school Language Arts proficiency (Grade 1)
Discovery Education
N/A N/A 57.8% No Change
3 Elementary school Language Arts proficiency (Grade 2)
Discovery Education
N/A N/A 55.1% No Change
4 Elementary school Reading proficiency (Grade 3)
Criterion Referenced Test (CRT)
57.0% 60.0% 59.1%
The data indicates the percentage of tested students whose level of proficiency was designated as meets or exceeds.
5 Elementary school Reading proficiency (Grade 4)
CRT 57.0% 70.0% 69.5%
6 Elementary school Reading proficiency (Grade 5)
CRT 61.5% 66.0% 64.4%
7 Middle school Reading proficiency (Grade 6)
CRT 54.5% 58.0% 61.2%
8 Middle school Reading proficiency (Grade 7)
CRT 53.0% 56.0% 60.9%
9 Middle school Reading proficiency (Grade 8)
CRT 43.7% 47.7% 49.0%
10 High school Reading proficiency first-time pass rate (Grade 10)
Nevada High School Proficiency
Exam (NHSPE)
47.7% 53.1% 54.4% The first-time pass rate in reading continues to increase among first-time test takers of the NHSPE. The content assessed on the NHSPE in reading must be mastered by Grade 12; however, the first administration is during the spring semester of Grade 10.
11 "High school Reading proficiency pass rate (cumulative Grade 10-12)"
NHSPE 95.8% 95.9% 89.7% The NHSPE pass rate represents the percentage of students who met the proficiency requirement by the end of July of their graduation year. This cumulative statistic considers multiple testing opportunities during Grades 10, 11, and 12.
12 High school Writing proficiency first-time pass rate (Grade 11)
NHSPE 75.4% 72.1% 76.3% The first-time pass rate in writing increased among first-time test takers of the NHSPE. The writing portion of the NHSPE must be mastered by Grade 12; however, the first administration is during the fall semester of Grade 11.
13 High school Writing proficiency pass rate (cumulative Grade 11-12)
NHSPE 90.9% 90.3% 89.4% The NHSPE pass rate represents the percentage of students who met the writing proficiency requirement by the end of July of their graduation year. This cumulative statistic considers multiple testing opportunities during Grades 11 and 12.
14 "Percentage of test takers earning a C or better in English 9, 10, 11, and 12 (regular and honors courses)"
Student Information
System (SIS)
N/A* N/A* "70.84% 58,105 out of 82,019 students"
No Change
"Courses include: English 9/9H, English 10/10H/10H Pre-Advanced Placement (AP), English 11/11H, English 12/12H. *No comparison available due to consolidation of courses, therefore, 2012-2013 represents baseline data."

42 | Clark County School District
Academic Achievement Monitoring Report - ContinuedFiscal Years 2011 Through 2013
TopicData
Source 2010-11 2011-12 2012-13 Result Supporting Data/InformationA. Language Arts - Continued
15 Percentage of test takers earning a 3 or better on Advanced Placement Exams (English all courses)
College Board
Results
"50.5% 1,482 out of 2,936 students"
"49% 1,605 out of 3,275 students"
"49.4% 1,879 out of 3,801 students"
Research consistently shows that students who score a 3 or higher typically experience greater academic success in college and improved graduation rates than their non-AP student peers.
16 Percentage of test takers earning a 3 or better on Advanced Placement Exams in Language and Composition
College Board
Results
"53% 899 out of 1,696 students"
"49% 960 out of 1,959 students"
"49% 1,060 out of 2,163 students"
No Change
17 Percentage of test takers earning a 3 or better on Advanced Placement Exams in Literature and Composition
College Board
Results
"47% 583 out of 1,240 students"
"49% 645 out of 1,316 students"
"50% 819 out of 1,638 students"
18 Growth of English Language Learner (ELL) students
"English Language Proficiency Assessment
(ELPA) World-Class Instructional Design and Assessment
(WIDA) Language
Assessment Scales
(LAS) Links"
"16.1%
LAS Links"
"19.1%
LAS Links"
"13.0% WIDA
change in assessment"
No Change
"The identification of long-term learners will be determined by the disaggregated data from the WIDA Assessing Comprehension and Communication in English State-to-State (ACCESS) test. The goal is to reduce the number of long-term learners by ensuring ELL students in Grades K-12 make a minimum of one year’s growth in English proficiency in all four language domains on the WIDA ACCESS. *No comparison available due to change in assessment, therefore, 2012-2013 represents baseline data utilizing the new assessment."
19 "Proficiency of ELL students on state assessments (Grades 3-8)"
CRT 39.9% 20.4% 29.0% English Language Learner students in CCSD have traditionally underperformed academically when compared with their non-ELL peers, as measured by standardized tests. To address the existing achievement gap, the English Language Learner Program Department focuses resources to improve literacy instruction and language acquisition for English Language Learners by addressing Tier 1 instruction and Tier 2 interventions.
20 "Proficiency of ELL students on state Reading assessments (Grades 10-12)"
NHSPE 40.0% 36.4% 41.4%
B. Mathematics
21 Elementary school Math proficiency (Kindergarten)
Discovery Education
N/A N/A 37.1% No Change
Discovery Education assessments were used during the 2012-2013 school year for the first time, therefore the data represents a baseline, indicating the percentage of tested students whose level of proficiency was designated as meets or exceeds. The Kindergarten percentage represents approximately 3,300 of 24,000 kindergarteners during the 2012-2013 school year due to the opt-in nature (not mandatory) for the first year of implementation.
22 Elementary school Math proficiency (Grade 1)
Discovery Education
N/A N/A 51.0% No Change
23 Elementary school Math proficiency (Grade 2)
Discovery Education
N/A N/A 56.8% No Change

Org
aniz
atio
nal S
ectio
n
432014-15 Comprehensive Annual Budget Report |
Academic Achievement Monitoring Report - ContinuedFiscal Years 2011 Through 2013
TopicData
Source 2010-11 2011-12 2012-13 Result Supporting Data/InformationB. Mathematics - Continued
24 Elementary school Math proficiency (Grade 3)
CRT 69.1% 72.0% 69.6% Proficiency rates for 2013 were impacted by the implementation of the Nevada Academic Content Standards (NACS). This was the first year that a small percentage of NACS-based assessment items were incorporated into the CRT. A larger percentage of NACS-based assessment items will be incorporated into the 2014 CRT State assessments and in 2015, full NACS-based tests from the SBAC will be administered. Teachers continue to be provided professional development and resources to assist in preparing students for NACS-based instruction and assessments.
25 Elementary school Math proficiency (Grade 4)
CRT 68.9% 73.0% 72.7%
26 Elementary school Math proficiency (Grade 5)
CRT 69.1% 72.0% 69.6%
27 Middle school Math proficiency (Grade 6)
CRT 68.4% 73.0% "47.% cut score
change due to legislative
mandate"
"The Nevada Department of Education (NDE) eliminated Transitional Cut Scores put into place for use on the CRTs for a two-year period, 2010-2012, (255 for Grade 6 and 267 for Grade 7 and Grade 8) to accommodate a significant increase in the rigor of the tests and to give schools the opportunity to adjust instructional practices in order to prepare students for the higher, final cut scores (300). The cut score returned to 300 in 2012-2013. Proficiency rates for 2013 were also impacted by the implementation of the NACS. This was the first year that a small percentage of NACS-based assessment items were included in the CRT."
28 Middle school Math proficiency (Grade 7)
CRT 68.6% 71.3% "52.6% cut score
change due to legislative
mandate"
29 Middle school Math proficiency (Grade 8)
CRT 58.4% 61.3% "39.3% cut score
change due to legislative
mandate"
30 Percentage of students exiting Grade 8 who are proficient in Algebra I
SIS N/A 88.2% 86.3% The content of the Algebra I course changed significantly in 2012-2013. The Nevada State Content Standards for Algebra I were replaced with the more rigorous NACS. In addition, due to Nevada’s three-year rollout of the NACS, students represented in the 2012-13 data were only exposed to approximately one-half of the NACS in their previous year’s mathematics instruction, thereby causing gaps in content that required additional time and effort to address.

44 | Clark County School District
Academic Achievement Monitoring Report - ContinuedFiscal Years 2011 Through 2013
TopicData
Source 2010-11 2011-12 2012-13 Result Supporting Data/InformationB. Mathematics - Continued
31 "High school Mathematics proficiency first-time pass rate"
NHSPE 52.4% 53.9% "32.2% cut score
change due to legislative
mandate"
"The content assessed on the NHSPE in mathematics is material taught in Algebra I and Geometry which is material that some students have not yet been exposed. For 2012-2013, approximately 26% of Grade 10 students had only progressed through seven of nine months of the Algebra I curriculum and had no instruction in Geometry prior to taking the NHSPE. Another 51% of Grade 10 students had only progressed through seven of nine months of the Geometry curriculum prior to taking the NHSPE. In 2012-2013, the NDE eliminated Transitional Cut Scores (set at 242). These scores were put into place for use on the Mathematics portion of the NHSPE from 2010-2012 to accommodate a significant increase in the rigor of the tests and to give schools the opportunity to adjust instructional practices in order to prepare students for the higher, final cut scores (set at 300)."
32 "High school Mathematics proficiency Grade 12 pass rate (cumulative Grade 10 - 12)"
NHSPE 88.2% 89.2% 88.4% These percentages represent the pass rate for all students who met the proficiency requirement in Grades 10, 11 or 12. Typical improvements from Grade 10 through Grade 12 indicate a 40 percentage point gain in proficiency rates within the cohort. This is due to students being enrolled in courses which provide instruction on topics covered on the NHSPE. In addition, students who struggle with passing the NHSPE are provided assistance through coursework and tutoring specifically designed to prepare them for the exam.
C. Science
33 Elementary school Science proficiency (Grade 5)
CRT 52.1% 58.8% 60.0%Elementary and middle school science proficiency results in recent history have experienced an increase.34 Middle school Science
proficiency (Grade 8)CRT 47.0% 49.0% 53.2%
35 "High school Science proficiency first-time pass rate"
NHSPE 52.3% 55.1% 59.0% The content assessed on the NHSPE in science is material that should be mastered by Grade 12. By the first administration of this assessment, sophomores have only completed 1.5 semesters of high school standards-based science coursework. In addition, only two years of science is required for graduation, with three years needed for the 21st Century Course of Study. The first-time pass rate on the NHSPE in science has experienced an increase.

Org
aniz
atio
nal S
ectio
n
452014-15 Comprehensive Annual Budget Report |
Academic Achievement Monitoring Report - ContinuedFiscal Years 2011 Through 2013
TopicData
Source 2010-11 2011-12 2012-13 Result Supporting Data/InformationC. Science - Continued
36 "High school Science proficiency Grade 12 pass rate (cumulative Grade 10 - 12)"
NHSPE 90.2% 89.1% 89.3% Final NHSPE science percentages represent the pass rate for all students who met the proficiency requirement in Grades 10, 11 and 12. Improvements from Grades 10 to 12 can be attributed to students being enrolled in more science coursework. In addition, students who struggle with passing the High School Proficiency Exam in Science are provided assistance through coursework and tutoring specifically designed to prepare them for the exam.
37 Percentage of students earning a C or better in Biology, Chemistry, and Physics (regular and honors)
SIS 70.2% 70.0% 67.0% This data is only reflective of second semester final grades. In addition, these percentages do not include students who, while earning a D, still passed the course and earned the mathematics credit.
38 Percentage of test takers earning a 3 or better on Advanced Placement Exams (Science all courses)
College Board
Results
"45% 463 out of 1,028 students"
"38.6% 427 out of 1,106 students"
"44.8% 586 out of 1,309 students"
"Data indicates percentage of students taking an Advanced Placement science exam who received a score of 3, 4, or 5. AP curricula changes frequently and the assessments are then modified to align with the curricula. "
39 Percentage of test takers earning a 3 or better on Advanced Placement Exams in Biology
College Board
Results
"39.0% 195 out of 500
students"
"33.0% 128 out of 388
students"
"42.0% 278 out of 662
students"
40 Percentage of test takers earning a 3 or better on Advanced Placement Exams in Chemistry
College Board
Results
"49.0% 167 out of 341
students"
"40.0% 198 out of 495
students"
"45.0% 179 out of 398
students"
41 Percentage of test takers earning a 3 or better on Advanced Placement Exams in Environmental Science
College Board
Results
"40.0% 24 out of 60
students"
"25.0% 14 out of 56
students"
"39.0% 44 out of 113
students"
42 Percentage of test takers earning a 3 or better on Advanced Placement Exams in Physics B and Physics C-Electricity
College Board
Results
"55.0% 18 out of 33
students"
"49.0% 36 out of 73
students"
"45.0% 20 out of 44
students"
"Data indicates percentage of students taking an Advanced Placement science exam who received a score of 3, 4, or 5. AP curricula changes frequently and the assessments are then modified to align with the curricula. Physics B is an Algebra-based course. Physics C Electricity and Physics C Mechanics are Pre-Calculus and Trigonometry based courses."
43 Percentage of test takers earning a 3 or better on Advanced Placement Exams in Physics C-Mechanics
College Board
Results
"63.0% 59 out of 94
students"
"54.0% 51 out of 94
students"
"71.0% 65 out of 92
students"
D. Social Studies
44 Percentage of students earning a C or better in United States (U.S.) History, U.S. Government, and World History (regular and honors)
SIS 73.8% 75.6% 76.1% The three-year trend demonstrates an increase in the number of students earning a C or better in U.S. History, U.S. Government, and World History. This data reflects second semester final grade reports. This data does not include repeat courses.

46 | Clark County School District
Academic Achievement Monitoring Report - ContinuedFiscal Years 2011 Through 2013
TopicData
Source 2010-11 2011-12 2012-13 Result Supporting Data/InformationD. Social Studies - Continued
45 Percentage of test takers earning a 3 or better on Advanced Placement Exams (Social Studies all courses)
College Board
Results
"39.1% 2,236 out of 5,714 students"
"42.4% 2,584 out of 6,088 students"
"42.6% 3,029 out of 7,106 students"
"Data indicates percentage of students taking an Advanced Placement science exam who received a score of 3, 4, or 5. More students are enrolling in these courses with the encouragement of counselors and teachers. The College Board Plan of Action supports increased numbers of students enrolling in the rigorous AP courses."
46 Percentage of test takers earning a 3 or better on Advanced Placement Exams in Comparative Government and European History
College Board
Results
"57.0% 32 out of 56
students"
"55.0% 12 out of 22
students"
"79.0% 31 out of 39
students"
47 Percentage of test takers earning a 3 or better on Advanced Placement Exams in Human Geography
College Board
Results
"71.0% 39 out of 55 students "
"58.0% 23 out of 40
students"
"41.0% 116 out of 283
students"
48 Percentage of test takers earning a 3 or better on Advanced Placement Exams in Macroeconomics
College Board
Results
"30.0% 18 out of 60
students"
"44.0% 19 out of 43
students"
"36.0% 39 out of 108
students"
49 Percentage of test takers earning a 3 or better on Advanced Placement Exams in Microeconomics
College Board
Results
"26.0% 18 out of 69
students"
"50.0% 17 out of 34
students"
"52.0% 46 out of 88
students"
50 Percentage of test takers earning a 3 or better on Advanced Placement Exams in Psychology
College Board
Results
"55.0% 359 out of 653
students"
"54.0% 366 out of 678
students"
"53.0% 474 out of 878
students"
51 Percentage of test takers earning a 3 or better on Advanced Placement Exams in U.S. Government and Politics
College Board
Results
"42.0% 591 out of 1,407 students"
"39.0% 670 out of 1,718 students"
"41.0% 777 out of 1,895 students"
"Data indicates percentage of students taking an Advanced Placement science exam who received a score of 3, 4, or 5. More students are enrolling in these courses with the encouragement of counselors and teachers. The College Board Plan of Action supports increased numbers of students enrolling in the rigorous AP courses."
52 Percentage of test takers earning a 3 or better on Advanced Placement Exams in U.S. History
College Board
Results
"36.0% 634 out of 1,761 students"
"39.0% 703 out of 1,803 students"
"41.0% 828 out of 2,020 students"
53 Percentage of test takers earning a 3 or better on Advanced Placement Exams in World History
College Board
Results
"33.0% 545 out of 1,653 students"
"44.0% 774 out of 1,750 students"
"40.0% 718 out of 1,795 students"

Org
aniz
atio
nal S
ectio
n
472014-15 Comprehensive Annual Budget Report |
Once a score is calculated, the school receives an overall mark. A star rating is reported for each school based on the total points achieved across the multiple indicators. NSPF rates schools as 5-Star, 4-Star, 3-Star, 2-Star, and 1-Star with five stars representing high performance and one star representing low performance across all indicators. A federal requirement to report additional designations of Reward, Priority, or Focus produces an additional rating for some schools.
Although schools are ranked by performance, the intent is for schools to use NSPF to guide them toward colleagues who are experiencing greater success so effective strategies can be explained and modeled by schools that are excelling. NSPF also enables the District to differentiate support to schools that struggle most.
Nevada School Performance Framework
The Nevada Department of Education (NDE) employs the Nevada School Performance Framework (NSPF), http://nspf.doe.nv.gov/, replacing the now outdated Adequate Yearly Progress (AYP) accountability system that was required by the No Child Left Behind Act (NCLB). NSPF is a new school, district, and State accountability system based on State-wide stakeholders’ values and collaboratively designed with input from Nevada school and national experts in assessment and accountability.
NSPF analyzes and reports school performance based on multiple measures of student achievement, as opposed to the single proficiency measure in AYP. Drawing upon the information in NDE’s longitudinal data system, NSPF produces a more meaningful analysis of school performance, looking at progress in student proficiency, growth, reduction of performance gaps for special populations, and other indicators. Reporting on schools’ needs and successes across a host of meaningful progress indicators enables more effective and efficient alignment of supports and resources within customized school performance plans. NSPF further ensures that rewards are provided to sustain and celebrate high performance when it has been demonstrated.
Weighted most heavily are the indicators that most impact the system’s ability to ensure college and career readiness for students. Academic growth provides information about how much growth occurred in the school and whether or not it was enough to prepare students for college and career readiness. For high schools, readiness elements include a variety of indicators that are relatively direct measures such as high school graduation rates, advanced placement participation, and performance.

48 | Clark County School District
Budget Development Process
Budgeting in the District is on a July 1 through June 30 fiscal year basis and is a year-round process. The cycle begins in the fall of the prior school year and continues until a final budget is filed with the Nevada Department of Education and the Nevada Department of Taxation in the spring of the following year. After the actual enrollment counts are taken in the fall, the District is required to adopt an amended final budget on or before January 1, reflecting any adjustments necessary as a result of the completed count of students.
The process of budget formulation involves a number of participants. Division heads, after reviewing their various budget needs, submit their requests for staffing, supplies, and equipment to the Budget Department. These requests are then summarized by the Budget Department, whose responsibility is to prepare a tentative budget for consideration by the superintendent and approval by the Board.
Development of a budget in which all budget items are fully substantiated involves a series of steps as outlined in the Board-approved budget calendar that follows. The major steps in the development of the budget are summarized briefly below.
• Establishment of the instructional programs to be offered during the 2014-15 year, including all Board actions relevant to the instructional programs within the budget parameters.
• Established personnel and supply formulas were applied in February 2014 for the 2014-15 budget year. These formulas indicate the personnel and supplies required to carry out the educational program as approved by the Board.
• The Budget Department then proceeded with the preparation of the tentative budget, which was presented to the Board for approval on April 10, 2014. The tentative budget was filed with the Nevada Departments of Education and Taxation and also with the Clark County Auditor by April 15, as required by Nevada Revised Statutes (NRS).
• As required by NRS 354.596, a public hearing on the budget was held on the third Wednesday of May (May 21, 2014). The notice of public hearing was published in the legal section of a local newspaper on May 13, 2014, and advised the general public of the time that they could address the Board regarding the budget.
• Additionally, NRS 354.598 requires that adoption of the final budget be accomplished on or before June 8, 2014. It is then filed with the Nevada Department of Education, the Clark County Auditor, and the Nevada Department of Taxation.
January
● Anticipated budget reductions are submitted
● Proposals for formula changes submitted
● Preliminary estimates of District enrollment by school
● Summaries of division allocations reviewed
February
● Review of all work stream allocations with Chief Financial Officer
● Provide full-time equilvalent staffing positions estimates to Human Resources
March
● Tentative Budget prepared (Nevada Department of Taxation Reporting)April
● Tentative Budget presented to Board for approval
● Tentative Budget submitted to Nevada Department of Taxation
May
● Tentative Budget revisions applied and Final Budget prepared.
● Public hearing of the Final Budget and Board adoptionJune
● Final Budget submitted to regulatory agencies prior to June 8th.
● Subsequent fiscal year is opened and first allocations applied
September
● Provide revised full-time equivalent staffings to Human Resources
● Formulate budget adjustments based upon prior year’s ending fund balance and actual student enrollment
July/August
● Publish the Comprehensive Annual Budget Report
● Apply organizational structure modifications
● Ensure control systems user access
● Close prior year activity and conduct prior year-end budget adjustments
October
● Submit the prior year actuals and current year projected expenditures to the Department of Education.
● Staffing costs are recalculated and verified based on changes resulting from enrollment
November
● An Amended Final Budget is prepared based on a September enrollment count day December
● Final budget allocations are posted to schools
● Approval of an Amended Final Budget submitted to regulatory agencies by January 1st
Budget Development Timeline

Org
aniz
atio
nal S
ectio
n
492014-15 Comprehensive Annual Budget Report |
After the Board approved the Final Budget, it became the responsibility of the Budget Department to implement and monitor the budget. A system of budget allotments is established for each departmental unit (reference unit budgets in the General Operating Budget section). Daily review of transaction data is available with user access through network connections, which reflect appropriation levels, encumbrances, and year-to-date expenditures. This reporting system also enables the Budget Department to monitor all of the District’s budgets on a regular basis and provides the necessary controls.
If it becomes necessary during the course of the year to change any of the departmental budgets, transfers are initiated by department heads and approved by the appropriate administrator. Transfers between programs or function classifications require approval of the Board.
Budget Administration - Schools
Based on the budget formulas approved by the Board, the Budget Department determines the appropriations for the following expense objects:
• Athletic Supplies-Boys• Athletic Supplies-Girls• Audio-Visual Supplies• Computer Supplies• Custodial Supplies• Equipment (New/Replacement)• Field Trips• Instructional Supplies• Instructional Supplies-Special Ed.• Library Computer Supplies• Library Books & Magazines• Library Supplies-Other• Library Technical Services• Maintenance and Repair• Medical Supplies• Other Activity Expenses• Postage• Printing Services• Technical Services• Textbooks
An initial allocation of 75% of the estimated total appropriation for each of the above, apportioned to each school, will be developed by the end of June preceding the school year. The estimated total appropriation is determined by budget formula from the projected enrollment.
The Budget Department will notify the principals of their schools’ total appropriations and will place the 75% allocation into each school’s budget. The following allotments are recommended to be spent at the minimum percentage levels shown for each expense object.
GL Accounts Funct. Area Description Percent5641000000 F01001000 Textbooks 75%5642000000 F01002220 Library Books 75%5510000000 F01001000 Field Trips 75%5610000000 F01002220 Library Supplies 50%5610000000 F01001000 Instructional Supplies 50%5610000000 F02501000 Special Ed. Instr. Supplies 100%5681000000 F01001000 Instructional Equipment 50%5610000000 F09201000 Athletic—Boys’ Supplies 75%5610000000 F09201000 Athletic—Girls’ Supplies 75%5610000000 F01002190 Other Activity Supplies 75%5610000000 F01002130 Medical Supplies 50%
The second allocation will be made to each school by the end of October. This remaining allocation, approximately 25% of the total, will be determined by the current budget formula now applied against the actual enrollment at the end of the fourth week of school.
In addition to the regular allotments, elementary schools that experience growth of 10 students or more between the official count date and December 31 shall receive the following allotments for instructional supplies:
New Schools $ 136 per studentEstablished Schools $ 59 per student
At the end of the fiscal year, the ending balance of the school site’s General Fund cost center group as shown on the school’s budget inquiry, will determine the amount of carryover to be allowed to the school. The carryover will be processed in mid-August and will be allocated to the school’s regular instruction cost center under the general supplies ledger account.

50 | Clark County School District
2. Appropriations may be transferred within or among any functions or programs within a fund without an increase in total appropriations. If it becomes necessary during the course of the year to change any of the departmental budgets, transfers are initiated by department heads and approved by the appropriate division head. Transfers between programs or function classifications can be made as necessary.
3. Statutory regulations require budget control to be exercised at the function level within the General Fund and at the fund level for Special Revenue, Debt Service, Capital Projects, Enterprise, Internal Service, and Trust and Agency funds.
4. Generally, budgets for all funds are adopted in accordance with generally accepted accounting principles. Execution of new capital leases are not budgeted as current year expenditures.
This carryover is not allowed to exceed the following amounts:
Elementary Schools $ 75,000 per schoolMiddle Schools $ 125,000 per schoolSenior High Schools $ 200,000 per schoolAlternative Schools $ 75,000 per school
In addition, senior high schools may retain gate receipts to the extent of 50% of the money received for admission to athletic events. Of this, 70% is allocated to student activities and 30% is allocated to athletic expenses. Unused gate receipts are carried over at 100% and are added to the next year’s gate receipt funds.
Nevada Revised Statutes - Budget Requirement Summary
The Nevada Revised Statutes (NRS) require that school districts legally adopt budgets for all funds. The budgets are filed as a matter of public record with the Clark County Clerk and the State Departments of Taxation and Education. District staff uses the following procedures to establish, modify, and control the budgetary data reflected in the financial statements.
1. The statutes provide for the following timetable used in the adoption of budgets for the following fiscal year:• Prior to April 15, the Superintendent of Schools
submits to the Board of School Trustees a tentative budget. If, in any year, the State Legislature creates unanticipated changes impacting District revenues or expenditures (after adoption of the amended final budget), or if considered necessary by the Board, an augmented budget may be filed at any time by a majority vote of the Board. After public notice has been filed, the Board may augment the appropriation at any time by a majority vote of the Board.
• The tentative budget includes proposed expenditures and the means of financing them.
• Before the third Wednesday in May, a minimum of seven days’ notice of public hearing on the final budget is to be published in a local newspaper.
• Prior to June 8, a final budget is adopted by the Board of School Trustees.
• On or before January 1, an amended final budget, reflecting any adjustments necessary as a result of the completed count of students, is adopted by the Board of School Trustees.

District Funds - Summary .................................................................. 53District Funds - Ending Fund Balances.............................................. 54District Funds - Projected Revenues Summary ................................. 55District Funds - Projected Expenditures Summary ............................ 56General Operating Fund - Summary.................................................. 61General Operating Fund - Ending Fund Balance............................... 63General Operating Fund Resources .................................................. 63General Operating Fund Expenditures .............................................. 68Descriptions of Functions................................................................... 72Descriptions of Commitment Items .................................................... 73Division and Departmental Operating Budgets:Board of School Trustees ................................................................. 77Office of the Superintendent ............................................................ 78Community and Government Relations ........................................... 81Instruction Unit ................................................................................. 84Education Services Division ............................................................. 88Educational and Operational Excellence Unit .................................. 92Operational Services Division .......................................................... 94Student Support Services Division ................................................... 98Business and Finance Division ........................................................ 101Human Resources Unit .................................................................... 107Innovative Teaching and Learning Unit ............................................... 110Curriculum and Professional Development Division ........................ 115Vegas PBS ....................................................................................... 118
Other Governmental and Proprietary Funds:Special Revenue Funds ................................................................... 122Debt Service Funds.......................................................................... 126Capital Projects Funds ..................................................................... 130Proprietary Funds............................................................................. 139Enterprise Fund................................................................................ 139Internal Service Funds ..................................................................... 141
Financial
Fina
ncia
l Sec
tionSection
512014-15 Comprehensive Annual Budget Report |

52 | Clark County School District
This page is intentionally left blank

Fina
ncia
l Sec
tion
532014-15 Comprehensive Annual Budget Report |
District Funds - Summary
The presentation of all District funds gives a unique perspective into the cumulative financial position of the school district. The All District Funds - Final Budget Summary illustrates the District-wide budgeted revenues, appropriations, and changes in fund balance for the fiscal year 2014-15. Barring restricted components of the ending fund balance, the District’s budgeted change in fund balance for all funds represents a 27.6% decrease due to necessary draw downs of fund balance designations in the General Operating, Debt Service, and Capital Projects Funds. The percentage decrease illustration details the change from estimated ending fund balances for 2013-14 and budgeted ending fund balances for fiscal 2014-15.
Financial Section
All District Funds - Final Budget SummaryStatement of Revenues, Expenditures, and Changes in Fund BalanceFiscal Year 2014-15
Description
General Operating
Funds
Special Revenue
FundsDebt Service
Funds
Capital Projects Funds
Proprietary Funds1
Total All Funds
Revenues:Local sources $1,339,975,000 $13,545,000 $307,800,000 $118,865,000 $37,690,000 $1,817,875,000 State sources 909,900,000 80,880,000 - - 450,000 991,230,000 Federal sources 4,300,000 244,850,000 - 6,075,000 98,975,000 354,200,000 Total revenues 2,254,175,000 339,275,000 307,800,000 124,940,000 137,115,000 3,163,305,000
Expenditures:Salaries 1,441,006,284 176,480,250 - 9,484,000 31,830,000 1,658,800,534 Employee fringe benefits 586,768,559 61,102,000 - 3,026,000 12,395,000 663,291,559 Purchased services 82,343,402 38,196,000 - 66,535,000 11,660,000 198,734,402 Supplies 152,980,844 57,017,750 - 8,595,000 66,715,000 285,308,594 Property and equipment 35,747,250 6,015,000 - 815,000 100,000 42,677,250 Other expenditures 2,363,661 12,539,000 - 95,000 17,170,000 32,167,661 Depreciation - - - - 2,245,000 2,245,000 Debt service - - 457,200,000 - - 457,200,000 Total expenditures 2,301,210,000 351,350,000 457,200,000 88,550,000 142,115,000 3,340,425,000
Excess (deficiency) of revenues over expenditures (47,035,000) (12,075,000) (149,400,000) 36,390,000 (5,000,000) (177,120,000)
Other sources (uses):Proceeds from insurance 100,000 - - - - 100,000 Sale of medium-term bonds 34,500,000 - - - - 34,500,000 Proceeds of refunding bonds - - 437,590,000 - - 437,590,000 Payment to escrow agent - - (435,185,000) - - (435,185,000)Transfers from other funds - 10,000,000 87,280,000 1,600,000 1,150,000 100,030,000 Transfer to other funds (14,880,000) - - (84,000,000) - (98,880,000)Total other sources (uses) 19,720,000 10,000,000 89,685,000 (82,400,000) 1,150,000 38,155,000
Fund balances, July 1 80,000,000 11,444,573 67,855,693 270,651,871 74,441,903 504,394,040
Fund balances, June 30 $52,685,000 $9,369,573 $8,140,693 $224,641,871 $70,591,903 $365,429,040 Percent increase (decrease) (34.1)% (18.1)% (88.0)% (17.0)% (5.2)% (27.6%)(1) Proprietary funds ending fund balances are reflected as cumulative unrestricted net assets.Source: CCSD Budget Department

54 | Clark County School District
District Funds - Ending Fund Balances
Measuring the fiscal solvency of a governmental entity can be performed using several methods. Analyzing the ending fund balance over multiple years produces a measurement that more likely reflects an entity’s financial condition. Although scrutiny and the interpretation of financial condition may be construed differently for each user of the financial statement, financial condition is relative to local board policies, the economic vitality of the local taxpayer base, and crucial funding support from the Nevada Legislature. The District’s Funds - Summary of Ending Fund Balances illustrates the District’s reserves in conjunction with Board of Trustees policies over multiple fiscal years.
The District effectively employs a “balanced budget” methodology in preparing its annual budget. The District’s definition of a “balanced budget” constitutes the measurement of total appropriations not exceeding total resources, including beginning fund balance. The result of that measurement must achieve a desired ending fund balance that satisfies Board policies and legal requirements.
All District Funds - Final Budget AnalysisFor Fiscal Years 2012-13 Through 2014-15
DescriptionActual
2012-13Estimated 2013-14
Final Budget 2014-15
FY 2013-14 vs. FY 2014-15$ Change % Change
Revenues:Local sources $1,718,096,885 $1,763,423,513 $1,817,875,000 $ 54,451,487 3.1% State sources 856,322,629 971,385,000 991,230,000 19,845,000 2.0 Federal sources 286,416,544 347,715,000 354,200,000 6,485,000 1.9
Total revenues 2,860,836,058 3,082,523,513 3,163,305,000 80,781,487 2.6
Expenditures:Salaries 1,487,351,390 1,600,485,250 1,658,800,534 58,315,284 3.6 Employee fringe benefits 583,287,756 648,206,000 663,291,559 15,085,559 2.3 Purchased services 195,243,891 162,969,000 198,734,402 35,765,402 21.9 Supplies 246,334,521 271,303,750 285,308,594 14,004,844 5.2Property and equipment 13,221,535 48,680,000 42,677,250 (6,002,750) (12.3)Other expenditures 23,624,376 33,441,000 32,167,661 (1,273,339) (3.8)Depreciation 2,007,340 2,245,000 2,245,000 - 0.0 Debt service 500,965,771 497,980,000 457,200,000 (40,780,000) (8.2)
Total expenditures 3,052,036,580 3,265,310,000 3,340,425,000 75,115,000 2.3
Excess (deficiency) of revenues over expenditures (191,200,522) (182,786,487) (177,120,000) 5,666,487 3.1
Other sources (uses):Proceeds from insurance 7,452 100,000 100,000 - - Sale of medium-term bonds - 34,430,000 34,500,000 70,000 0.2 Proceeds of refunding bonds 199,248,293 324,725,000 437,590,000 112,865,000 34.8 Payment to escrow agent (189,574,194) (324,875,000) (435,185,000) (110,310,000) (34.0)Transfers from other funds 119,262,809 109,830,000 100,030,000 (9,800,000) (8.9)Transfers to other funds (118,176,422) (109,510,000) (98,880,000) 10,630,000 9.7
Total other sources 10,767,938 34,700,000 38,155,000 3,455,000 10.0 Fund balances - July 1 832,913,111 652,480,527 504,394,040 (148,086,487) (22.7)
Fund balances - June 30 $ 652,480,527 $ 504,394,040 $ 365,429,040 $(138,965,000) (27.6)%Source: CCSD Budget and Accounting Departments
0
200
400
600
800
1,000
$1,200Fund Balance History
Fiscal Years 2011-15
In m
illio
ns
2011-12 2012-13 2013-14 2014-152010-11
General Operating Fund
Special Revenue Funds
Debt Service Funds
Capital Projects Funds
Proprietary Funds
$1,128
Source: CCSD Budget and Accounting Departments
$365
$833
$652
$504

Fina
ncia
l Sec
tion
552014-15 Comprehensive Annual Budget Report |
Of the $3.2 billion in anticipated revenues, the General Operating Fund will represent 71.3%, Special Revenues 10.7%, Debt Service 9.7%, Capital Projects 4%, and Proprietary Funds 4.3%. Total projected resources for the 2014-15 fiscal year for all funds will be over $4.2 billion with the inclusion of beginning fund balances and other financing sources. Note: Please refer to the General Operating Fund and Other Funds sections for more detailed revenue descriptions and explanations.
The decline in the General Operating Fund balance of over 34% follows a total liquidation of existing fund balance components for future revenue shortfalls along with substantial programmatic reductions to arrive at a “balanced budget” position. During 2014-15, the District has planned spend downs of fund balances due to stagnant (2.7%) increases in local revenue sources. For future years, it is obvious that essential State funding resources must increase to avoid continued deterioration of financial resources.
For the fiscal year 2015 Final Budget, the General Operating Fund comprises 14.4% of the total ending fund balances. This represents a slight decrease from the 15.9% of total fund balances reflected in the 2013-14 estimated fund balance. Following a 15-year capital improvement program, the Capital Projects Funds ending fund balances comprises over 61%.
Bonds issued to fund program facilities created a need for adequate reserves in the Debt Service Fund, which totals 2.2% of all ending fund balances. As the graph on Page 54 reflects, facility construction and its related debt service represent a substantial portion of the District’s ending fund. The reasons detailing the decreases in the ending fund balances of the General Operating Fund and the Special Revenue Funds are described in the General Operating Fund and the Federal Projects Funds sections.
District Funds - Projected Revenues Summary
The District’s sources of revenue for all funds originate from a wide range of categories. The District Funds - Summary of Revenues and Other Sources illustrates the five-year history of total revenues. This history shows a slight one year increase in Debt Service Funds revenues following a welcome turnaround in the trending of taxable assessed valuation of Clark County. The General Operating Fund revenue has increased by 10.9% between fiscal years 2010-11 and 2014-15. Special Revenue Funds anticipate decreases in State categorical program funding. An increase of $54.5 million in local revenue sources and $19.8 million in State revenue sources will increase the District’s “All Funds” total revenues by over $80 million.
All District Funds - Summary of Fund BalancesFor Fiscal Years 2010-11 Through 2014-15
FundsActual
2010-11Actual
2011-12Actual
2012-13Estimated 2013-14
Final Budget 2014-15
2013-14 vs. 2014-15 VarianceAmount Percent
General Operating Fund $ 96,620,752 $ 76,982,721 $ 92,596,487 $ 80,000,000 $ 52,685,000 $ (27,315,000) (34.1)%Special Revenue Funds 14,708,096 12,284,614 13,909,573 11,444,573 9,369,573 (2,075,000) (18.1)%Debt Service Funds 361,212,422 276,954,144 175,795,693 67,855,693 8,140,693 (59,715,000) (88.0)%Capital Projects Funds 580,955,519 392,493,638 292,361,871 270,651,871 224,641,871 (46,010,000) (17.0)%Proprietary Funds1 74,194,941 74,197,994 77,816,903 74,441,903 70,591,903 (3,850,000) (5.2)%Total $1,127,691,730 $832,913,111 $652,480,527 $504,394,040 $365,429,040 $(138,965,000) (27.6)%(1) Proprietary Funds ending fund balances are reflected as cumulative unrestricted net assets.
Source: CCSD Budget and Accounting Departments
All Funds - Revenue SummaryFinal BudgetFiscal Year 2014-15
General Operating 71.3%
Special Revenue10.7%
Capital Projects4.0%
Debt Service9.7%
Proprietary4.3%
Source: CCSD Budget Department

56 | Clark County School District
District Funds - Projected Expenditures Summary
Through the District’s budgeting cycle, cost centers engage in technical analysis to evaluate the specific needs of the District. The allocation of appropriations is carefully designed to meet designated requirements, including personnel, supplies, utilities, transportation, and property. Each of the District’s funds serves a specific purpose to account for and record financial activity relative to the needs of the District. Appropriations within those funds define the constraints of those expenditures in an effort to maintain fiscal accountability and solvency.
As in previous years, the District continues to face many challenges in serving the diverse needs of the students in Clark County. Projected enrollment should increase by more than 3,300 (1.1%) students while expenditures are expected to increase by more than 3.6% in the General Operating Fund. The following summary highlights the District’s major challenges for appropriating budgets for fiscal 2015 and beyond.
Of the 2014-15 Final Budget total appropriated expenditures, the General Operating Fund represents 68.9% of the total. Capital Projects and Debt Service Funds combine to represent 16.3% of total appropriations. Total expenditures will be $3.3 billion in 2014-15, or an increase of 2.3% versus the estimated expenditures for 2013-14.
2014-15 Appropriation Challenges:
• Revenue projections continue to be volatile and subject to uncertainty due to the continuing impacts of the economic downturn experienced at both the State and local levels
• Finding sufficient resources to implement the necessary instructional initiative changes that will provide the structure to improve student achievement and focus on “every student in every classroom, without exceptions, without excuses.”
• Student enrollment will increase by over 3,300 students with no additional classroom space scheduled for construction to house this increase in enrollment. Further unpleasant measures such as expanding year-round school schedules, rezoning attendance boundaries, adding more portable classrooms, or eliminating and/or relocating select programs will be considered for implementation following the absence of voter approval for the District’s proposed 2012 Capital Renovation and Replacement Plan
• Audited ending fund balances – Actual beginning balances are unknown and not available until the issuance of the Comprehensive Annual Financial Report in October of each year
• Recruiting and retaining qualified personnel and maintaining competitive employee compensation salaries and benefits in spite of inevitable program and staffing reductions within a financial resource structure that continues to be unpredictable and unstable
• Maintaining adequate reserves to reduce the impacts from the potential program cuts from a drawdown of assigned and restricted fund balances by $40 million since 2013
• Satisfying the requirement of Regulation 3110 to maintain “an unassigned ending fund balance of not less than 2% of total General Fund revenue for each fiscal year” which has not occurred since 2009
All District Funds - Summary of RevenuesFor Fiscal Years 2010-11 Through 2014-15
FundsActual
2010-11Actual
2011-12Actual
2012-13Estimated 2013-14
Final Budget 2014-15
2013-14 vs. 2014-15 VarianceAmount Percent
General Operating Fund $2,033,081,365 $2,045,513,311 $2,071,034,580 $2,187,718,513 $2,254,175,000 $66,456,487 3.0 % Special Revenue Funds 307,088,071 245,308,859 247,548,886 345,825,000 339,275,000 (6,550,000) (1.9)%Debt Service Funds 352,400,912 319,688,125 298,150,491 292,495,000 307,800,000 15,305,000 5.2 % Capital Projects Funds 113,992,334 114,413,151 115,470,478 120,585,000 124,940,000 4,355,000 3.6 % Proprietary Funds 116,917,122 123,204,842 128,631,623 135,900,000 137,115,000 1,215,000 0.9 % Total $2,923,479,804 $2,848,128,288 $2,860,836,058 $3,082,523,513 $3,163,305,000 $80,781,487 2.6 %
Source: CCSD Budget and Accounting Departments

Fina
ncia
l Sec
tion
572014-15 Comprehensive Annual Budget Report |
General Operating68.9%
Debt Service13.7%
Capital Projects2.6%
Special Revenue10.5%
All Funds - Expenditure Summary Final BudgetFiscal Year 2014-15 Proprietary
4.3%
Source: CCSD Budget Department
All District Funds - Summary of ExpendituresFor Fiscal Years 2010-11 Through 2014-15
FundsActual
2010-11Actual
2011-12Actual
2012-13Estimated 2013-14
Final Budget 2014-15
2013-14 vs. 2014-15 VarianceAmount Percent
General Operating Fund $2,134,662,278 $2,086,954,110 $2,070,611,150 $2,221,300,000 $2,301,210,000 $79,910,000 3.6 %Special Revenue Funds 301,560,974 249,482,921 250,099,921 356,450,000 351,350,000 (5,100,000) (1.4)%Debt Service Funds 563,277,763 496,499,383 500,965,771 497,980,000 457,200,000 (40,780,000) (8.2)%Capital Projects Funds 207,103,769 190,822,052 104,260,637 49,155,000 88,550,000 39,395,000 80.1 %Proprietary Funds1 105,924,230 120,129,852 126,099,101 140,425,000 142,115,000 1,690,000 1.2 %Total $3,312,529,014 $3,143,888,318 $3,052,036,580 $3,265,310,000 $3,340,425,000 $75,115,000 2.3 %(1) Proprietary Funds balances reflect operating and non-operating expenses for presentation purposes.
Source: CCSD Budget and Accounting Departments

58 | Clark County School District
This page is intentionally left blank

Fina
ncia
l Sec
tion
592014-15 Comprehensive Annual Budget Report |
In this sub-section, the General Operating Fund is comprised of the General Fund, Indirect Cost Fund, Class Size Reduction Fund and Special Education Fund. This sub-section details the General Operating Fund revenue and expenditures expectations for the fiscal year 2014-15 through narratives and illustrations respectively.
General Operating Fund ............................................................... 61 General Operating Fund - Summary ........................................... 61 General Operating Fund - Ending Fund Balance ........................ 63 General Operating Fund Resources ........................................... 63 General Operating Fund Expenditures ....................................... 68 Descriptions of Functions ............................................................ 72 Descriptions of Commitment Items ............................................. 73
General Operating Fund

60 | Clark County School District
This page is intentionally left blank

Fina
ncia
l Sec
tion
612014-15 Comprehensive Annual Budget Report |
General Operating Fund - Final Budget AnalysisFiscal Years 2012-13 through 2014-15
DescriptionActual
2012-13Estimated 2013-14
Final Budget2014-15
2013-14 vs. 2014-15 VarianceAmount Percent
Revenues:Local sources $1,268,176,369 $1,305,113,513 $1,339,975,000 $34,861,487 2.7%State sources 802,484,056 882,305,000 909,900,000 27,595,000 3.1Federal sources 374,155 300,000 4,300,000 4,000,000 100.0
Total revenues 2,071,034,580 2,187,718,513 2,254,175,000 66,456,487 3.0
Expenditures:Salaries 1,316,456,707 1,383,645,000 1,441,006,284 57,361,284 4.1Fringe benefits 515,822,901 572,070,000 586,768,559 14,698,559 2.6Purchased services 85,344,022 81,640,000 82,343,402 703,402 0.9Supplies 138,822,960 143,430,000 152,980,844 9,550,844 6.7Property and equipment 12,397,685 37,345,000 35,747,250 (1,597,750) (4.3)Other expenditures 1,766,875 3,170,000 2,363,661 (806,339) (25.4)
Total expenditures 2,070,611,150 2,221,300,000 2,301,210,000 79,910,000 3.6
Excess (deficiency) of revenues over expenditures 423,430 (33,581,487) (47,035,000) (13,453,513) (40.1)Other financing sources (uses):
Proceeds from insurance 7,452 100,000 100,000 - -Sale of medium-term bonds - 34,430,000 34,500,000 70,000 0.2Transfers from other funds 20,000,000 - - - -Transfers to other funds (4,817,116) (13,545,000) (14,880,000) (1,335,000) (9.9)
Total other financing sources (uses) 15,190,336 20,985,000 19,720,000 (1,265,000) (6.0)Opening fund balance - July 11 76,982,721 92,596,487 80,000,000 (12,596,487) (13.6)
Ending fund balance - June 30 $92,596,487 $80,000,000 $52,685,000 $(27,315,000) (34.1)(1) The opening fund balance shown in budget fiscal year 2014-15 reflects the 2013-14 estimated ending fund balance.
Source: CCSD Budget and Accounting Departments
General Operating Fund - Summary
The General Operating Fund consists of six funds: the General, Indirect Cost, Education Foundation, Other Revenues, Class Size Reduction, and Special Education Funds. The General Fund, in this context, is defined as a fund for measuring and recording regular District financial activity that is not designated for any other specific purpose. The funds maintained in the General Fund are typically available for legally authorized purposes. Although the Special Education Fund and Class Size Reduction Funds technically reside as Special Revenue Funds on the financial statements, they are included with the General Fund since 80% of Special Education operating resources are contributed by the General Fund and Class Size Reduction contributes over $28 million to assist in reducing class sizes in grades 4-6. On the District’s government-wide financial statements, the Special Education Fund is deemed to be a Major Special Revenue Fund separate from the General Fund.

62 | Clark County School District
General Operating Fund - Twenty Year HistoryFiscal Years 1995-96 Through 2014-15
Year Expenditure
Appropriations
DollarIncrease
(Decrease)
PercentIncrease
(Decrease)4th Week
EnrollmentBudget
Per Student
Percent Increase
(Decrease)1995-96 $705,347,714 $77,352,383 12.3 % 166,788 $4,229 5.3 %1996-97 773,935,613 68,587,899 9.7 % 179,106 4,321 2.2 %1997-98 849,169,164 75,233,551 9.7 % 190,822 4,450 3.0 %1998-99 931,208,043 82,038,879 9.7 % 203,777 4,570 2.7 %1999-00 1,029,652,551 98,444,508 10.6 % 217,139 4,742 3.8 %2000-01 1,072,657,733 43,005,182 4.2 % 231,125 4,641 (2.1)%2001-02 1,163,403,949 90,746,216 8.5 % 244,684 4,755 2.5 %2002-03 1,249,699,204 86,295,255 7.4 % 255,328 4,894 2.9 %2003-04 1,350,739,123 101,039,919 8.1 % 268,357 5,033 2.8 %2004-05 1,478,079,958 127,340,835 9.4 % 280,796 5,264 4.6 %2005-06 1,663,853,336 185,773,378 12.6 % 291,329 5,711 8.5 %2006-07 1,811,462,847 147,609,511 8.9 % 302,547 5,987 4.8 %2007-08 1,984,894,552 173,431,705 9.6 % 308,745 6,429 7.4 %2008-09 2,033,407,975 48,513,423 2.4 % 311,221 6,534 1.6 %2009-10 2,051,324,159 17,916,184 0.9 % 309,442 6,629 1.5 %2010-11 2,134,662,278 83,338,119 4.1 % 309,899 6,888 3.9 %2011-12 2,086,954,110 (47,708,168) (2.2)% 308,377 6,768 (1.7)%2012-13 2,070,611,150 (16,342,960) (0.8)% 311,218 6,653 (1.7)%2013-141 2,221,300,000 150,688,850 7.3 % 314,598 7,061 6.1 %2014-152 2,301,210,000 79,910,000 3.6 % 317,970 7,237 2.5 %
(1) Estimated total(2) Final Budget
Source: Budget, Accounting, and Demographics and Zoning Departments
0
$0.5
$1.0
$1.5
$2.0
$2.5
2007
-08
2010
-11
2008
-09
2011
-12
2012
-13
2009
-10
1997
-98
1995
-96
1996
-97
2002
-03
2003
-04
2000
-01
2004
-05
2001
-02
1998
-99
1999
-00
2005
-06
2006
-07
2014
-15
$2.30
General Operating Budgeted Appropiations - Twenty Year Graphical HistoryFiscal Years 1995-96 through 2014-15
$0.71
In b
illio
ns
Source: CCSD Budget Department
2013
-14

Fina
ncia
l Sec
tion
632014-15 Comprehensive Annual Budget Report |
General Operating Fund - Ending Fund Balance
The importance of an adequate General Operating Fund balance cannot be overstated. An adequate fund balance provides financial protection to the District to offset lower than budgeted revenues or higher than anticipated operating costs. There are many factors that can cause revenues to decrease and operating costs to increase, many of which are unpredictable. Major reasons for maintaining an ending fund balance include: a reserve for economic uncertainty and to maintain bond credit ratings.
The General Operating Fund’s ending fund balance is anticipated to decrease by over $27 million, or 34%, due largely to reductions of the assigned portions of the balance. The unassigned portion is expected to increase by $6.1 million as the District strives to incrementally restore fund balance to the requirements of District Regulation 3110. The projected increase will move the unassigned portion from 1.25% to 1.5% of total revenues. Regulation 3110 requires that an unassigned ending fund balance of not less than 2% of total General Operating Fund revenues be included in the budget. Unassigned ending fund balance is exclusive of inventories and amounts restricted or assigned for preexisting obligations.
General Operating Fund Resources
The General Operating Fund utilizes many sources of financial support to maintain the operations of a district spanning 8,012 square miles across southern Nevada. The District obtains its revenue from the following sources: State aid, property taxes, local school support taxes, governmental services tax, franchise tax fees, investment income, federal aid, miscellaneous revenues, and ending fund balance from the previous year. Detailed in the General Operating Fund - Estimated Resources illustration are the major sources of revenues.
State Aid
The District will receive over 40% of its total resources from the State for General Operating Fund operations. The following outline explains the main features of the program for distributing State aid to school districts.
General Operating Fund - Ending Fund Balance HistoryFor Fiscal Years 2005-06 Through 2014-15
Total Total PercentageFiscal Operating Ending Fund Balance Components Ending Fund of TotalYear Revenues1 Nonspendable Restricted Assigned Unassigned Balances Revenues2006 $1,737,971,278 $4,633,569 $7,273,437 $95,220,000 $36,437,527 $143,564,533 8.3%2007 1,929,035,417 17,750,339 13,980,824 84,407,371 39,484,749 155,623,283 8.1%2008 2,089,233,421 4,376,483 19,676,999 96,385,635 43,035,412 163,474,529 7.8%2009 2,155,978,473 3,558,623 32,343,951 90,599,713 40,808,506 167,310,793 7.8%2010 2,130,327,694 3,832,495 40,308,480 80,703,202 20,211,517 145,055,694 6.8%2011 2,033,081,365 4,006,893 31,396,735 41,989,300 19,227,824 96,620,752 4.8%2012 2,045,513,311 3,943,290 10,975,344 42,674,151 19,389,936 76,982,721 3.8%2013 2,071,034,580 14,329,960 464,209 58,180,804 19,617,514 92,592,487 4.5%20142 2,187,718,513 5,000,000 315,000 48,860,000 25,825,000 80,000,000 3.7%20153 2,254,175,000 5,000,000 165,000 15,590,000 31,930,000 52,685,000 2.3%
(1) - Total operating revenue excludes the beginning fund balance, transfers into the General Operating Fund, sale of fixed assets, the execution of capital leases, and bond proceeds.
(2) - These estimates were taken from the FY 2013-14 estimated actuals.(3) - These estimates were taken from the FY 2014-15 Final Budget projections.
Source: CCSD Budget and Accounting Departments

64 | Clark County School District
The Nevada Plan for School Finance
The Nevada Legislature has declared that the proper objective of state financial aid to public education is to insure each Nevada child a reasonably equal educational opportunity. Recognizing wide local variations in wealth and costs per pupil, the State supplements local financial ability to whatever extent necessary in each district to provide programs of instruction in both compulsory and elective subjects that offer full opportunity for every Nevada child to receive the benefit of the purposes for which public schools are maintained. The Nevada Revised Statutes (NRS 387.121) set forth that “…the quintessence of the State’s financial obligation for such programs can be expressed in a formula partially on a per pupil basis and partially on a per program basis as: State financial aid to school districts equals the difference between school district basic support guarantee and local available funds produced by mandatory taxes minus all the local funds attributable to pupils who reside in the county but attend a charter school. This formula is designated as the Nevada Plan.”
The amount of funds provided under the Nevada Plan for Clark County students is computed by multiplying the basic support guarantee per pupil of $5,544 by the sum of:
1. Sixth-tenths of the count of pupils enrolled in pre-kindergarten and kindergarten on the last day of the first month of the school year;
2. The count of pupils enrolled in grades 1 – 12 inclusive on the last day of the first school month of the school year.
In addition to the basic support guarantee per pupil, the legislature also establishes funding for State supported special education program units ($42,745 each). Additional special education units, if necessary, may need to be locally supported.
The 1993 Legislature approved NRS 387.047, which requires all school districts in the State to separately account for all funding received for the instruction of, and the provision of, related services to students with disabilities. This revenue is reported to the State in a separate Special Education Fund but is combined with the regular instructional revenue of the General Fund throughout this document.
General Operating Fund - Estimated ResourcesFiscal Year 2014-15
PercentageDescription of BudgetState aid (Distributive School Account) $ 909,900,000 38.4%Local School Support Taxes (LSST) 840,170,000 35.5%Property taxes 415,000,000 17.5%Governmental Services Tax (GST) 48,785,000 2.1%Other county taxes 3,000,000 0.1%Franchise tax fees 600,000 - %Federal aid 4,300,000 0.2%Investment income 1,285,000 0.1%
Miscellaneous income:Tuitions from full day kindergarten 6,500,000 0.3%School project contributions 4,700,000 0.2%E-rate reimbursements 4,450,000 0.2%District project contributions 4,000,000 0.2%School project contributions 3,800,000 0.2%Indirect costs from categorical grants 2,700,000 0.1%Rental of facilities 1,500,000 0.1%Indirect costs from food services fund 1,200,000 0.1%Tuitions from summer school 1,000,000 - %Income from athletics 500,000 - %Tuitions from out-of-state students 200,000 - %Transportation fees 200,000 - %Proceeds from insurance 100,000 - %Other miscellaneous income 385,000 - %
Sale of medium-term bonds 34,500,000 1.5 %
Ending fund balance from prior year:Nonspendable 5,000,000 0.2%Restricted 315,000 - %Assigned 48,860,000 2.1%Unassigned 25,825,000 1.0%
Total estimated resources $2,368,775,000 100.0%Source: CCSD Budget Department
Opening Fund Balance
3.3%
Property Taxes17.5%
State Aid38.4%
Local School Support Taxes
35.5%
Governmental Service Franchise Taxes
2.2% Other Revenues and Sources
1.6%
General Operating Fund ResourcesFiscal Year 2014-15Final Budget
Total resources of $2.4 billion
*County taxes include: Local School Support Taxes (Sales Tax), Property Taxes, Governmental Service Taxes, and Franchise Taxes.
Source: CCSD Budget Department
County local tax resources 55.2%*
Sale of Bonds1.5%

Fina
ncia
l Sec
tion
652014-15 Comprehensive Annual Budget Report |
In determining the amount to be distributed by the State to school districts, the amount of tax proceeds received by schools from a 2.6 cents local school support sales tax plus the amount received from the one-third public schools operating property tax are deducted. Combining State aid, all of the local school support sales taxes, and one-third of the property tax collections, generate 81% of the District’s General Operating Budget. Since this is an enrollment-driven funding formula, it has the effect of cushioning the District somewhat from economic fluctuations. The computation shown below illustrates that, regardless of how much sales tax or public school operating property tax collections are received, the District should anticipate over $1.7 billion, or almost 81% of the operations budget, to be provided through the Nevada Plan.
Computation of estimated State aid to be received by the District for the current year, based upon projected 4th week school enrollments, is as follows:
1. State basic support:For pre-kindergarten and kindergarten students (28,425 x .6 x $5,544) $ 94,552,920For elementary and secondary students (288,889 x $5,544) 1,601,600,616 For special education units (1,936 x $42,745) 82,754,320 For special education students not assigned to a grade level (656 x $5,544) 3,636,864Distributive School Account (DSA) Support Level 1,782,544,720
2. Less: local contribution:Proceeds from 2.6 cents local school support (sales) tax (840,170,000)Proceeds from 1/3 public schools operating property tax (138,333,333)Total Local Contribution (978,503,333)
3. Adjustments to state shareElementary Counselors 50,000 Non-Traditional Student Allocation 208,613Charter School Revenue Adjustment (20,000,000)Total Adjustment to State Share (19,741,387)
4. Class Size Reduction 125,600,000
5. State payments to be received in support of District programs $ 909,900,000
Property Taxes
Almost 18% of the resources for the District’s general operations will be generated from local property tax collections. Property tax collections are based upon the assessed valuations of real and personal property, as provided by the Clark County Assessor, after which reductions are granted for any legislative abatements.
The 2005 Legislature enacted Assembly Bill 489 to provide partial relief abatement from escalating assessments created
by previous escalations in the market values of real property. The cap limits each property’s valuation increase to no more than 3% above that assessed in the prior tax year on all single-family, owner-occupied residences. All other real property categories are limited to a valuation increase of no more than 8% above that assessed in the prior tax year. All new properties, previously not on the tax rolls, are ineligible for relief abatement. It is estimated that this capping will reduce potential 2015 General Operating Fund property tax collections by $36 million.
The total property tax levy, for operating purposes, is 75 cents per $100 of net assessed value. Under Nevada statutes, school districts may not levy more than 50 cents (2/3) per $100 of net assessed value of taxable property for the support of public schools, and not more than 25 cents (1/3) per $100 of net assessed value to complement revenue from State aid funds (see State Aid). The necessary tax rate for repayment of school construction funds and public safety compliance programs (55.34 cents per $100 of assessed value) is levied in addition to the tax rate for operating expenses (NRS 387.195) and is receipted into the Debt Service Fund.
If the public schools operating property tax, one-third is included and usually protected from fluctuation by the guarantee of the State Aid distribution formula. The remaining two-thirds is based upon assessed valuations that are determined prior to the inception of the fiscal year. Actual valuations are not realized until October 2014.
The computation of estimated property tax collections is as follows:
Assessed valuation at the time of Final Budget adoption (35% of market value) as of March 29, 2013 $ 62,905,000,000
Estimated reduction due to legislative tax relief abatements and exemptions (8,370,000,000)
Adjusted Net Valuation 54,535,000,000
Tax rate for general operating purposes per $100 of net assessed valuation 0.75
Subtotal 409,000,000
Add: Net proceeds of mines 20,000
Estimated delinquent property tax collections 5,980,000
Estimated Total Property Tax Collections $ 415,000,000
Source: Clark County Assessor’s Office
Property taxes are received from two types of tax rolls:
1. Secured Roll – Real Property (land and any improvement built thereon) and other personal property (example: house furnishings) secured by the real property. Taxes on the Secured Roll are billed and collected by the County Treasurer.
2. Unsecured Roll – All property not assessed upon the Secured Roll (examples: mobile homes, airplanes, boats, and slide-in campers). Taxes on the Unsecured Roll are billed and collected by the County Assessor.

66 | Clark County School District
Governmental Services Tax
Motor vehicle license fees (Governmental Services Taxes) are collected by the State Department of Motor Vehicles based upon the age of the vehicle and returned to the counties from which they are collected (NRS 482.181). It is estimated that the District will receive $48.8 million during the year. These revenues are volatile due to the instability of new vehicle purchase activity and the increasing age of vehicles currently on the tax rolls.
Franchise Tax
The Franchise Tax is a county tax of 2% levied against the net proceeds of public utilities on that portion of their business operated outside incorporated cities (NRS 709.110). It is estimated that the District will receive $3 million from this source, which has been subject to considerable fluctuation, based upon the profitability of the various utilities. Fortunately, it does not represent a material portion of the District’s revenue base.
Local School Support (Sales) Tax
The 1967 Legislature passed the Local School Support Tax (LSST) law (NRS 374.015). The law imposes, in addition to the sales and use taxes enacted in 1955, a separate tax rate upon the privilege of selling tangible personal property at retail in each county to provide revenues for the school district comprising such county. The current levy rate of 2.60% became effective July 1, 2009 and was continued by the 2013 Legislature to supplement State funding of K-12 public education.
Clark County residents (as well as tourists) will pay a total of 8.1% sales tax on all purchases except on food items for home preparation and prescribed medicines. Revenues generated from the 2.6 cents portion (LSST) of the sales tax are earmarked for funding of the State Aid formula. The estimate of local sales taxes generated for school support for 2015 is $840 million. This amount has been determined from the latest available information on sales tax collections as provided by the Department of Taxation and is subject to fluctuation throughout the year based upon current economic activity.
It is estimated that over 35% of the District’s operational resources for 2015 will be generated from the LSST. The entirety of the sales tax is included in the State Aid formula as previously described. As a result of this feature, any increases or decreases in collections generally do not have a direct impact upon the District’s budget since the enrollment-driven State payments are adjusted inversely with local school support sales tax receipts. However, there have been previous significant fluctuations from preliminary estimates which impacted the State’s capacity to distribute the full per student DSA “guarantees” and resulted in mid-year reductions of anticipated revenues.
General Operating Fund - History Of ResourcesFor Fiscal Years 2005-06 Through 2014-15
County % of State % of Federal % of Other % of Opening % of TotalYear Taxes Total Sources Total Sources Total Sources Total Balances Total Resources
2005-06 $ 1,209,620,212 63.5% $ 509,298,783 26.7% $ 14,655 -% $ 29,593,890 1.6% $ 155,579,223 8.2% $ 1,904,106,763 2006-07 1,274,438,078 61.5 623,907,426 30.1 86,952 - 31,249,572 1.5 143,564,533 6.9 2,073,246,561 2007-08 1,304,601,148 57.9 744,247,587 33.0 547,130 - 49,088,717 2.2 155,623,283 6.9 2,254,107,865 2008-09 1,263,951,844 54.5 781,792,314 33.7 82,265,3772 3.6 28,162,582 1.2 163,474,529 7.0 2,319,646,646 2009-10 1,300,965,604 56.4 802,013,854 34.8 303,570 - 37,174,021 1.6 167,310,793 7.2 2,307,767,842 2010-11 1,206,926,415 54.0 797,169,570 35.6 337,954 - 88,290,574 3.9 145,055,694 6.5 2,237,780,207 2011-12 1,222,078,785 56.4 795,306,492 36.7 839,281 - 51,342,101 2.4 96,620,752 4.5 2,166,187,411 2012-13 1,238,522,974 57.1 802,484,056 37.0 374,155 - 49,660,847 2.3 76,982,721 3.6 2,168,024,753 2013-141 1,274,575,000 55.1 882,305,000 38.1 300,000 - 65,068,513 2.8 92,596,487 4.0 2,314,845,000 2014-151 1,307,555,000 55.2 909,900,000 38.4 4,300,000 0.2 67,020,0003 2.8 80,000,000 3.4 2,368,775,000
1 Projected amounts2 Includes $82,239,829 from the American Recovery and Reinvestment Act3 Includes $34,500,000 in sale of medium-term bonds
Source: CCSD Budget and Accounting Departments

Fina
ncia
l Sec
tion
672014-15 Comprehensive Annual Budget Report |
Sale of Medium-Term Bonds
The District anticipates issuing $34.5 million in medium-term obligation bonds to be repaid within a ten year period. The proceeds will be used to purchase buses for growth, replacement of an ever-aging fleet of vehicles, and to support expanding extracurricular activities.
Ending Fund Balance From Previous Year
Each year, the unused portion of the District’s operating budget reverts into the ending fund balance. This balance is then available as a resource in the subsequent year. The purpose of projecting an ending fund balance is to provide a margin against the effects of economic fluctuations and/or revenue collections, and to enable a smooth continuation of essential programs, even though unforeseen financial circumstances may occur. The ending fund balance for 2013-14 is estimated to be $80 million, of which $5 million is non-spendable for inventories; $315,000 Education Foundation commitments; $48.9 million is assigned for residual categorical program indirect costs, and school carryover of unexpended allocations; and $25.8 million is unassigned.
Investment Income
Investment income is earned by investing District funds until they are needed for payroll or accounts payable purposes. Funds are invested for various lengths of time based upon the need for safety, liquidity, and yield, in that order. It is estimated that the District will earn $1.3 million for general operating purposes from its investment activities.
Federal Aid
Revenues from federal sources for the General Operating Fund are estimated to be $4.3 million of which $4 million will be derived from renewed participation in the reimbursement of administrative expenditures for processing Medicaid services claims. Other federal sources are subject to substantial fluctuation, based upon the dates of payment from the federal government, therefore, a lump sum estimate process is used in lieu of trending or other techniques.
Miscellaneous Revenue Sources
The General Operating Fund serves as the recordkeeping and transactional foundation for District operations. Aside from major revenue sources, such as, State, federal, and major local sources, the miscellaneous sources contains all other minor financial resources within the General Operating Fund. Examples of those resources include: tuition programs, school projects, facility rentals, athletic programs and other minor sources of revenues. Each source is accounted for separately and maintained within the General Operating Fund. Miscellaneous revenues represent approximately 1.3% of the resources for the General Operating Fund.
0
500
1,000
1,500
2,000
$2,500
2013-14 2014-152006-072005-06 2010-112007-08 2008-09 2009-10 2011-12 2012-13
State Sources
County Taxes Federal Sources
Other Sources
Opening Balances
$1,904
$2,369
General Operating Fund - Illustrated History of ResourcesFor Fiscal Years 2005-06 Through 2014-15
In m
illio
ns
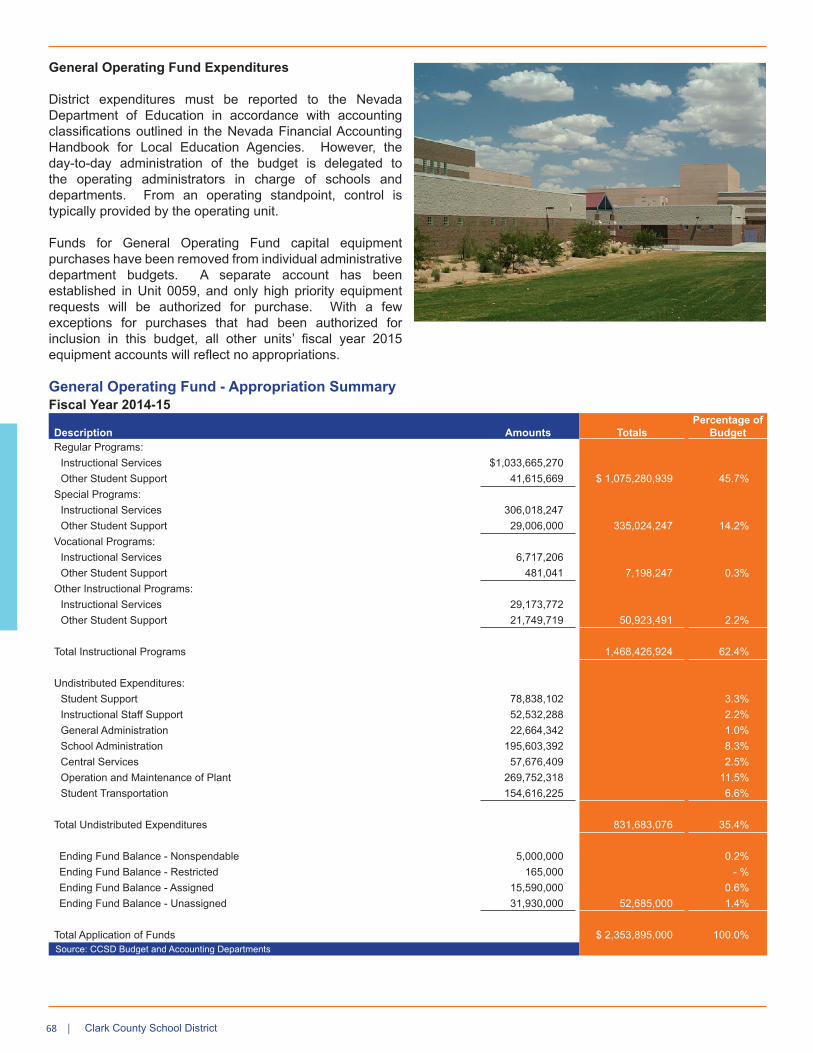
68 | Clark County School District
General Operating Fund Expenditures
District expenditures must be reported to the Nevada Department of Education in accordance with accounting classifications outlined in the Nevada Financial Accounting Handbook for Local Education Agencies. However, the day-to-day administration of the budget is delegated to the operating administrators in charge of schools and departments. From an operating standpoint, control is typically provided by the operating unit.
Funds for General Operating Fund capital equipment purchases have been removed from individual administrative department budgets. A separate account has been established in Unit 0059, and only high priority equipment requests will be authorized for purchase. With a few exceptions for purchases that had been authorized for inclusion in this budget, all other units’ fiscal year 2015 equipment accounts will reflect no appropriations.
General Operating Fund - Appropriation SummaryFiscal Year 2014-15
Description Amounts TotalsPercentage of
BudgetRegular Programs:
Instructional Services $1,033,665,270 Other Student Support 41,615,669 $ 1,075,280,939 45.7%
Special Programs:Instructional Services 306,018,247 Other Student Support 29,006,000 335,024,247 14.2%
Vocational Programs:Instructional Services 6,717,206Other Student Support 481,041 7,198,247 0.3%
Other Instructional Programs:Instructional Services 29,173,772 Other Student Support 21,749,719 50,923,491 2.2%
Total Instructional Programs 1,468,426,924 62.4%
Undistributed Expenditures:Student Support 78,838,102 3.3%Instructional Staff Support 52,532,288 2.2%General Administration 22,664,342 1.0%School Administration 195,603,392 8.3%Central Services 57,676,409 2.5%Operation and Maintenance of Plant 269,752,318 11.5%Student Transportation 154,616,225 6.6%
Total Undistributed Expenditures 831,683,076 35.4%
Ending Fund Balance - Nonspendable 5,000,000 0.2%Ending Fund Balance - Restricted 165,000 - %Ending Fund Balance - Assigned 15,590,000 0.6%Ending Fund Balance - Unassigned 31,930,000 52,685,000 1.4%
Total Application of Funds $ 2,353,895,000 100.0%Source: CCSD Budget and Accounting Departments

Fina
ncia
l Sec
tion
692014-15 Comprehensive Annual Budget Report |
General Operating Fund - Full Time Equivalent EmployeesFiscal Year 2014-15
EmployeesDescription Licensed Support/Police1 Administration Total Percent School Locations:
Instructional Classroom 16342.46 1,638.50 - 17,980.96 66.2 %Media, Counseling, and Health Services 1,362.50 579.99 50.50 1,992.99 7.3 % School Administration - 1,378.72 883.92 2,262.64 8.3 %Custodial and Maintenance - 2,528.90 33.00 2,561.90 9.4 %
Total School Locations 17,704.96 6,126.11 967.42 24,798.49 91.2 %
Classroom Support:Driver and Bus Maintenance Personnel - 1,498.72 8.00 1,506.72 5.5 %
Central Office Locations:Instructional Support and Administration 14.00 154.49 87.50 255.99 0.9 %Maintenance, Personnel, and Business Services - 416.03 112.43 528.46 1.9 %Superintendent and Staff 0.50 81.60 60.10 142.20 0.5 %
Total Central Office Locations 18.50 652.12 260.03 926.65 3.3 %
Grand Total 17,719.46 8,276.95 1,235.45 27,231.86 100.0 %(1) FTE reflects 9-, 10-, 11-month support staff as percentages of full FTE’s. See conversion table in the Information Section.Source: CCSD Budget Departments
General Operating Fund - Major Expenditure AreasFor Fiscal Years 2010-11 Through 2014-15
Actual Actual ActualEstimated
Actual Final Budget PercentageDescription 2010-11 2011-12 2012-13 2013-14 2014-15 Change
Salaries and benefits:Licensed salaries $959,518,796 $922,083,588 $892,183,845 $931,650,000 $968,815,761 4.0 %Licensed benefits 339,097,942 335,619,054 349,344,190 375,350,000 384,287,110 2.4 % Total licensed staff 1,298,616,738 1,257,702,642 1,241,528,035 1,307,000,000 1,353,102,871 3.5 %
Support salaries 318,549,563 331,940,950 309,169,598 326,135,000 341,616,830 4.7 %Support benefits 132,967,636 118,536,055 121,325,691 150,000,000 154,682,027 3.1 %Total support staff 451,517,200 450,477,005 430,495,289 476,135,000 496,298,857 4.2 %
Administrative salaries 102,412,466 102,365,986 104,384,508 115,000,000 119,259,219 3.7 %Administrative benefits 36,308,506 37,931,537 40,967,117 42,000,000 42,901,887 2.1 % Total administrative staff 138,720,972 140,297,523 145,351,624 157,000,000 162,161,106 3.3 %
Police salaries 12,009,089 11,667,097 10,719,320 10,860,000 11,314,474 4.2 %Police benefits 4,906,555 4,741,442 4,185,342 4,720,000 4,897,535 3.8 % Total police staff 16,915,644 16,408,539 14,904,662 15,580,000 16,212,009 4.1 %
Total salaries and benefits 1,905,770,553 1,864,885,709 1,832,279,611 1,955,715,000 2,027,774,843 3.7 %
Purchased services:Instructional materials 67,876,225 55,345,587 60,163,129 56,000,000 53,272,226 (4.9)%Transportation 15,071,642 19,558,789 34,824,480 60,000,000 57,830,704 (3.6)%Utilities, postage, property liability 79,187,681 77,798,990 83,154,100 85,300,000 89,967,937 5.5 %Other expenditures 66,756,177 69,365,034 60,189,830 64,285,000 72,364,290 12.6 %Total expenditures $2,134,662,278 $2,086,954,109 $2,070,611,150 $2,221,300,000 $2,301,210,000 3.6 %
Expenditures per student $7,132 $7,011 $6,900 $7,320 $7,506 2.5 %Source: CCSD Budget and Accounting Departments
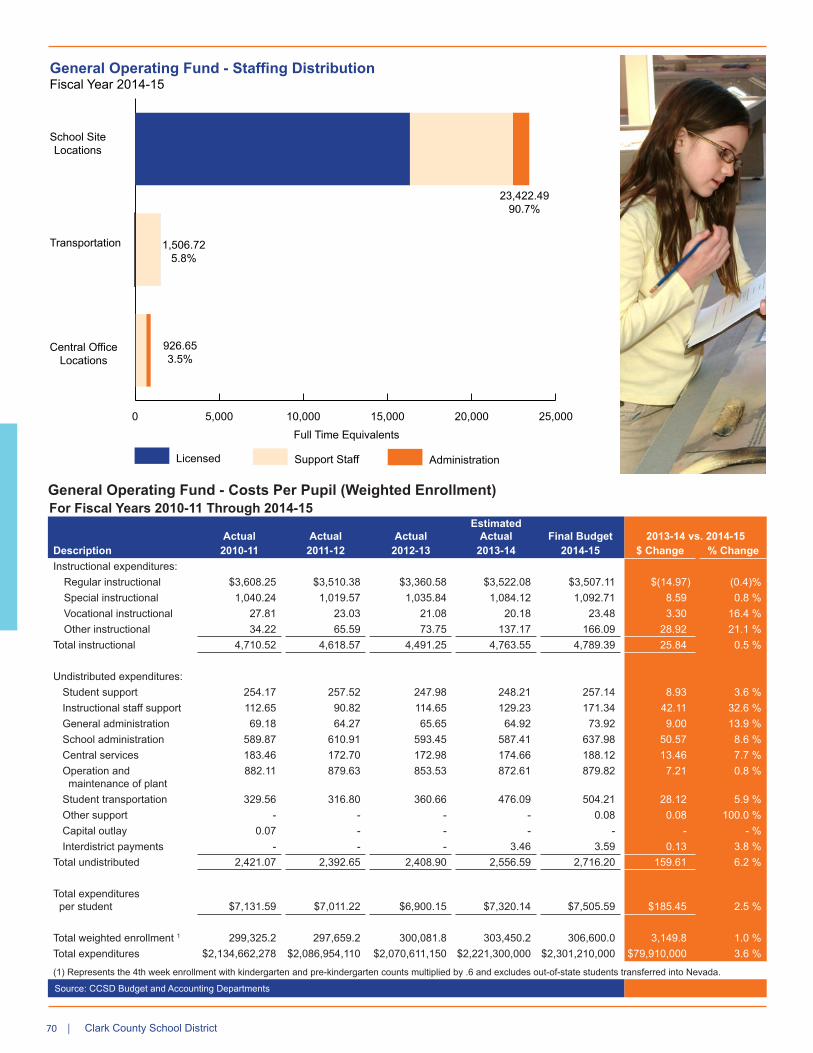
70 | Clark County School District
0 5,000 10,000 15,000 20,000 25,000
School SiteLocations
Transportation
Central OfficeLocations
23,422.4990.7%
1,506.725.8%
926.653.5%
Full Time Equivalents
Licensed Support Staff Administration
General Operating Fund - Staffing DistributionFiscal Year 2014-15
General Operating Fund - Costs Per Pupil (Weighted Enrollment)For Fiscal Years 2010-11 Through 2014-15
Actual Actual ActualEstimated
Actual Final Budget 2013-14 vs. 2014-15Description 2010-11 2011-12 2012-13 2013-14 2014-15 $ Change % ChangeInstructional expenditures:
Regular instructional $3,608.25 $3,510.38 $3,360.58 $3,522.08 $3,507.11 $(14.97) (0.4)%Special instructional 1,040.24 1,019.57 1,035.84 1,084.12 1,092.71 8.59 0.8 % Vocational instructional 27.81 23.03 21.08 20.18 23.48 3.30 16.4 % Other instructional 34.22 65.59 73.75 137.17 166.09 28.92 21.1 %
Total instructional 4,710.52 4,618.57 4,491.25 4,763.55 4,789.39 25.84 0.5 %
Undistributed expenditures:Student support 254.17 257.52 247.98 248.21 257.14 8.93 3.6 % Instructional staff support 112.65 90.82 114.65 129.23 171.34 42.11 32.6 % General administration 69.18 64.27 65.65 64.92 73.92 9.00 13.9 % School administration 589.87 610.91 593.45 587.41 637.98 50.57 8.6 % Central services 183.46 172.70 172.98 174.66 188.12 13.46 7.7 % Operation and maintenance of plant
882.11 879.63 853.53 872.61 879.82 7.21 0.8 %
Student transportation 329.56 316.80 360.66 476.09 504.21 28.12 5.9 % Other support - - - - 0.08 0.08 100.0 % Capital outlay 0.07 - - - - - - % Interdistrict payments - - - 3.46 3.59 0.13 3.8 %
Total undistributed 2,421.07 2,392.65 2,408.90 2,556.59 2,716.20 159.61 6.2 %
Total expenditures per student $7,131.59 $7,011.22 $6,900.15 $7,320.14 $7,505.59 $185.45 2.5 %
Total weighted enrollment 1 299,325.2 297,659.2 300,081.8 303,450.2 306,600.0 3,149.8 1.0 % Total expenditures $2,134,662,278 $2,086,954,110 $2,070,611,150 $2,221,300,000 $2,301,210,000 $79,910,000 3.6 %
(1) Represents the 4th week enrollment with kindergarten and pre-kindergarten counts multiplied by .6 and excludes out-of-state students transferred into Nevada.
Source: CCSD Budget and Accounting Departments

Fina
ncia
l Sec
tion
712014-15 Comprehensive Annual Budget Report |
General Operating Fund - Projected BudgetsFor Fiscal Years 2014-15 Through 2017-18Fund Expenditure Appropriations by Major Object
Description2014-15Budget
2015-16Projected
2016-17Projected
2017-18Projected Growth Rate
Revenues:Property taxes $415,000,000 $450,000,000 $475,000,000 $500,000,000 5.3%Local school support taxes 840,170,000 900,000,000 940,000,000 960,000,000 2.1%Other local revenues 84,805,000 83,300,000 87,800,000 88,000,000 0.2%State sources 909,900,000 925,000,000 940,000,000 955,000,000 1.6%Federal sources 4,300,000 4,315,000 4,500,000 4,800,000 6.7%Total Revenues 2,254,175,000 2,362,615,000 2,447,300,000 2,507,800,000 2.5%
Expenditures:Salaries 1,441,006,284 1,500,000,000 1,550,000,000 1,600,000,000 3.2%Employee benefits 586,768,559 615,000,000 645,000,000 660,000,000 2.3%Purchased services 82,343,402 77,000,000 77,000,000 77,000,000 - %Supplies 152,980,844 155,000,000 160,000,000 160,000,000 - %Property and equipment 35,747,250 2,000,000 2,000,000 2,000,000 - %Other expenditures 2,363,661 1,000,000 1,000,000 1,000,000 - %Total Expenditures 2,301,210,000 2,350,000,000 2,435,000,000 2,500,000,000 2.7%
Excess (Deficiency) of Revenuesover Expenditures (47,035,000) 12,615,000 12,300,000 7,800,000
Other Sources and (Uses):Proceeds from insurance 100,000 100,000 100,000 100,000 Sale of medium-term bonds 34,500,000 - - - Transfers to other funds (14,880,000) (9,900,000) (9,900,000) (9,900,000)Total Other Sources and (Uses) 19,720,000 (9,800,000) (9,800,000) (9,800,000)
Opening Fund Balance - July 1 80,000,000 52,685,000 55,500,000 58,000,000
Ending Fund Balance - June 30 $52,685,000 $55,500,000 $58,000,000 $56,000,000
Fund Balance:Nonspendable $5,000,000 $4,000,000 $3,500,000 $3,000,000 Restricted 165,000 150,000 150,000 150,000 Assigned 15,590,000 13,000,000 10,000,000 7,000,000 Unassigned 31,930,000 38,350,000 44,350,000 45,850,000
Total Fund Balance $52,685,000 $55,500,000 $58,000,000 $56,000,000
Distributive School Account (DSA) funding is a significant component (79.1%) of the General Operating Fund revenues and is mostly determined by the biennial Nevada State Legislature. Key funding elements involve LSST (sales) taxes and property tax collections based upon fluctuating local property valuations. Expenditures for salaries and benefits could fluctuate significantly based upon final agreements from the ongoing negotiations with each of the employee unions.
Future LSST and property tax collection projections are based upon a conservative vision for a local economy that has not reflected a measurable return to pre-2009 levels of growth. Expenditure projections were determined through a conservative historical trending that assumes no cost of living increases to employee salary schedules and contained expenditure appropriations to arrive at a nominal ending fund balance.
Source: Budget Department

72 | Clark County School District
Description of Functions
This dimension is used to describe the functional activity for which a service or material object is acquired. The functions are classified into five areas: Instruction, Support Services, Operation of Non-Instructional Services, Facilities Acquisition and Construction, and Debt Service. Functions are further classified into sub-functions.
Function Description
Instructional Services1000 Instructional Services. This function includes the
activities dealing directly with the interaction between teachers and students. These expenditures can be identified as being directly related to instruction of students in a learning situation. Teacher salaries, teacher assistant salaries, purchased services essential to the subject taught, and equipment, furniture, and supplies directly related to instruction are examples of the expenditures that are included.
Support Services2100 Student Support Services. This function accounts
for activities designed to assess and improve the well-being of students and to supplement the teaching process. The costs necessary to manage and provide guidance, health, psychological, and nursing services, in addition to assessing and testing students with respect to career and educational opportunities, are recorded here. Salaries and benefits of personnel, purchased services, office supplies, and equipment are examples of included cost items.
2200 Instructional Staff Support Services. This function accounts for activities associated with assisting the instructional staff with the content and process of providing learning experiences for students. It includes responsibilities in such areas as curriculum supervision, in-service education for professional personnel, and supplies and equipment to support the instructional program. This function also embraces the preparation, maintenance, and distribution of library and media resources used to support instruction.
The following pages include an explanation for the functions and commitment items found in the General Operating Fund Budget and the General Operating Fund Budget by Operating Unit listed in Division order.
Function DescriptionSupport Services - Continued
2300 General Administration Support Services. This function covers those activities concerned with establishing and administering policy essential for the operations of the entire District. It includes responsibilities in such areas as the Board of School Trustees and the offices of the superintendent and area superintendents. Costs include staff salaries and benefits, purchased services, supplies, and equipment to support general administration.
2400 School Administration Support Services. This function covers those activities which have the purpose of directing, managing, and supervising a school. It includes the principal, assistant principal, dean, and other administrative and clerical staff. Costs necessary to provide personnel, purchased services, supplies and equipment to manage and operate a school are classified in this function.
2500 Central Administration Support Services. This function covers those activities that support administrative and instructional functions, including fiscal services, human resources, planning, and administrative information technology. Costs include staff salaries, purchased services, supplies, and equipment to support these activities.
2600 Operation and Maintenance of Plant Services. This function accounts for those activities concerned with keeping the physical plant open, comfortable, and safe for use, and with keeping the grounds, buildings, and equipment in effective working condition and state of repair. These include the activities of maintaining safety in buildings, on the grounds, and in the vicinity of schools.
2700 Student Transportation Services. This function covers the costs of conveying students to and from school as directed by state and federal law. This includes transportation between home and school as well as trips to school-related activities. Costs related to the operation, service, and maintenance of vehicles used to transport students are classified in this function.
2900 Other Student Support Services. This function covers all other support services not classified elsewhere.

Fina
ncia
l Sec
tion
732014-15 Comprehensive Annual Budget Report |
Description of Functions - ContinuedFunction Description
Operation Of Non-Instructional Services3100 Child Nutrition Services. This function encompasses
those activities which have as their purpose the management of the food services program of the school or school system, and serving of regular and incidental meals, lunches, breakfasts, or snacks in connection with school activities. It includes directing and managing food services, preparing and serving food, operating kitchen equipment, and storage of food and equipment.
Facilities Acquisition And Construction4100 Land Acquisition Services. This function records
activities concerned with initially acquiring and improving land.
4200 Land Improvement Services. This function records activities concerned with making permanent improvements to land, such as grading, fill, and environmental remediation.
4300 Architectural and Engineering Services. This function records activities of architects and engineers related to acquiring and improving sites and improving buildings. Charges are made to this function only for those preliminary activities that may or may not result in additions to the district’s property.
4500 Building Acquisition and Construction Services. This function records activities concerned with buying or constructing buildings.
4600 Site Improvement Services. This function records activities concerned with making non-permanent improvements or enhancements to building sites. These improvements include fencing, walkways, tunnels, and temporary landscaping.
4700 Building Improvement Services. This function records activities concerned with building additions and with installing or extending service systems and other built-in equipment.
4900 Other Facilities Acquisition and Construction Services. This function records activities that cannot be classified above.
Debt Service5000 Debt Service. This function records activities
related to servicing the long-term debt of the District, including payments of principal, interest, and other debt issuance costs.
Description Of Commitment Items (Objects)
This dimension is used to describe the service or commodity obtained as the result of a specific expenditure. There are 11 major categories used by the District to identify objects.
Object Description5116 Personnel Services Salaries - Licensed Staff -
Amounts paid to licensed employees of the District who are considered to be in positions of a permanent nature or hired temporarily, including personnel substituting for those in permanent positions.
5117 Personnel Services Salaries – Support Staff - Amounts paid to support staff employees of the District who are considered to be in positions of a permanent nature or hired temporarily, including personnel substituting for those in permanent positions.
5118 Personnel Services Salaries – Administrative Staff - Amounts paid to the administrative category of employees in the District who are considered to be in positions of a permanent nature or hired temporarily, including personnel substituting for those in permanent positions.
52-- Employee Benefits - Amounts paid by the District on behalf of employees. These amounts are not included in the gross salary but are in excess of that amount. Such payments are fringe benefit payments, and while not paid directly to employees, nevertheless are part of the cost of personnel services. These payments include those to the Public Employees’ Retirement System (PERS), Federal Insurance Contributions Act (FICA), State unemployment insurance, group insurance, workers’ compensation, and Medicare.
5300 Professional and Technical Services - Services which by their nature can be performed only by persons or firms with specialized skills and knowledge. While a product may or may not result from the transaction, the primary reason for the purchase is the service provided. Included are the services of architects, engineers, auditors, dentists, medical doctors, lawyers, consultants, accountants, etc.
5400 Purchased Property Services - Services purchased to operate, repair, maintain, and rent property owned and/or used by the District. These services are performed by persons other than District employees. These include water, sewer, and disposal services.
5500 Other Purchased Services - Amounts paid for services rendered by organizations or personnel not on the payroll of the District other than professional and technical services or property services. These include insurance (other than employee benefits), telephone, advertising, and tuition.

74 | Clark County School District
Description Of Commitment Items (Objects) - Continued
Object Description5600 Supplies - Amounts paid for material items of an
expendable nature that are consumed, worn out, or deteriorated in use, or items that lose their identity through fabrication or incorporation into different or more complex units or substances. These include gas (heat), electricity, gasoline, books, periodicals, and audiovisual materials.
5700 Property/Equipment - Expenditures for the acquisition of fixed assets, including expenditures for land or existing buildings and improvements of grounds, initial equipment, and replacement of equipment.
Object Description5800 Other Expenses - Amounts paid for goods and
services not otherwise classified in preceding categories.
5900 Other Uses of Funds - This series of codes is used to classify transactions which are not properly recorded as expenditures to the District but require budgetary or accounting control. These include redemption of principal on long-term debt or fund transfers.

752014-15 Comprehensive Annual Budget Report |
In this sub-section, operational budgets include financial details of divisions and departments that maintain the operational day-to-day activities in support of the District’s core mission. Each operational budget area includes mission statements, fiscal goals, performance measures, and staffing trends.
Board of School Trustees ..................................................... 77 Office of the Superintendent ................................................. 78 Community and Government Relations ................................ 81 Instruction Unit ...................................................................... 84 Education Services Division ................................................. 88 Educational and Operational Excellence Unit....................... 92 Operational Services Division ............................................... 94 Student Support Services Division ....................................... 98 Business and Finance Division .............................................101 Human Resources Unit.........................................................107 Innovative Teaching and Learning Unit ................................. 110 Curriculum and Professional Development Division ............. 115 Vegas PBS............................................................................ 118
Operating BudgetsDivision and Departmental
Fina
ncia
l Sec
tion

76 | Clark County School District
Budget Unit002 Board of School Trustees
Superintendent
Budget Units Budget Units001 Office of the Superintendent003 Office of the General Counsel 008 Office of Government Affairs005 Development and Innovation 133 Community and Government Relations006 Employee Management Relations 145 School-Community Partnership Program007 Affirmative Action 156 School Police and Security012 Communications Office 575 Emergency Management Services053 Internal Audit 657 Campus Security Systems
Board of School Trustees
Superintendent
Community and Government RelationsDevelopment and Innovation
Communications Office
Employee-Management Relations
School-Community Partnership Program
Office of Government Affairs Affirmative Action
Internal Audit
Emergency Management Services
Office of the General Counsel
School Police and Security
Board of School Trustees
Campus Security Systems

Fina
ncia
l Sec
tion
772014-15 Comprehensive Annual Budget Report |
Vision Statement
All students progress in school and graduate prepared to succeed and contribute in a diverse global society.
Services:
The Board of School Trustees (the Board), Cost Center Group 002, as authorized by Chapter 386 of the Nevada Revised Statues, is comprised of seven members, each elected to four-year terms and representing a different geographic region of Clark County. The Board elects a president, vice president, and clerk annually from among its members and currently schedules two regular meetings per month, as well as special meetings as needed. The Board adopted a governance method that allows the Board to focus its policies on issues that direct the overall goals of the District and the vision of public education in Clark Country.
The Board has set a vision that directs the superintendent to ensure that students will have the knowledge, skills, attitudes, and values necessary to achieve academically, prosper economically, and contribute in a diverse global society. In addition to setting the vision, there is an ongoing, rigorous monitoring system in place and an annual formal evaluation of the superintendent and the District.
Throughout the year, trustees increase their dialogue with the community by conducting Community Linkage meetings to Advisory Committee (PAC), or Community Education Advisory Board (CEAB) meeting that promotes communication between parents, trustees, and the community as a whole.
The Board is dedicated to providing the leadership necessary for students to accomplish their education goals and securing financial resources for the District to ensure student success is an ongoing priority.
The budget includes salaries for staff, regular operational expenses for the Board Office, and compensation.
Board of School Trustees
Board Of School Trustees AllocationsFor Fiscal Years 2012-13 Through 2014-15
2012-13 2013-14 2014-15Actuals Amended Final Budget Final Budget 2013-14 vs. 2014-15
Description Staff Amount Staff Amount Staff Amount Amount Percent
Admin / prof tech 1.00 86,280 1.00 88,531 1.00 91,012 2,481 2.8 %Support staff 4.50 276,886 4.50 314,119 4.50 307,298 (6,821) (2.2)%Benefits 123,988 130,080 132,473 2,393 1.8 %Purchased services 72,822 88,640 88,640 - - %Supplies 27,777 39,900 39,900 - - %Other 28,317 28,560 28,560 - - %
Total 5.50 616,070 5.50 689,830 5.50 687,883 (1,947) (0.3)%Source: CCSD Budget and Accounting Departments

78 | Clark County School District
Communications Office, Cost Center Group 012, facilitates internal and external communication programs for the District. The Office serves students, families, departments, staff, businesses, other local agencies, and the community by overseeing or assisting departments with communication efforts such as special events, informational programs, District-wide newsletters and mailings, fast facts reference materials, District highlights posted online, and media relations with local, State and national print and broadcast outlets.
Development and Innovation Department, Cost Center Group 005, through partnership and collaboration with The Public Education Foundation, provides support through public and private sector funding for projects and initiatives that produce measurable outcomes and improved results that can be identified and documented as best practices. In collaboration with The Public Education Foundation, the Department provides administrators and teachers with the opportunity to test new ideas, forge strategic alliances, and establish pilot programs that encourage the highest standard of performance.
Employee-Management Relations (EMR), Cost Center Group 006, provides courteous, efficient, and effective customer service to schools, departments, employees, and the public in order to support student achievement by assisting administrators in implementing applicable laws, contractual agreements, and District policies, regulations, and procedures as they relate to personnel issues. These procedures support the implementation of the District’s mission to provide students the tools and resources so they will have the knowledge, skills, attitudes, and ethics necessary to succeed academically and practice responsible citizenship.
EMR represents the interests of the District in the interpretation and implementation of the five employee negotiated agreements, as well as the policies, regulations, and procedures of the District.
Services:
Office of the Superintendent, Cost Center 001, the Superintendent is the Chief Executive Officer of the District and is appointed by the Board of School Trustees. In turn, the Deputy Superintendent, Chief Financial Officer, and specific divisions and departments such as the Office of the Chief of Staff, Office of the General Counsel, Diversity and Affirmative Action Office, Chief of School Police, and Community and Government Relations report to and are evaluated by the Superintendent, who is responsible for implementing the Board’s policies and directions. In addition, the Superintendent is the liaison to the Public Education Foundation.
The Office serves all of Clark County, which encompasses an area of 8,012 square miles and includes both metropolitan and rural areas. With more than 317,000 students, about 38,000 full-time, part-time, temporary, and substitute employees, and 356 schools, the District is the fifth-largest school district in the United States.
Office of the General Counsel, Cost Center Group 003, The Office provides advice and representation on all legal matters in both State and federal courts, and before a variety of administrative agencies involving alleged civil rights violations, workers’ compensation claims and appeals, unemployment hearings, disputes before Nevada’s Employee-Management Relations Board, and administrative arbitrations with the various labor organizations which represent District employees. Additionally, the Office provides advice and counsel to staff and administration on a broad variety of issues faced daily by schools and the central office.
When demands for legal services exceed in-house capability, the Office contracts for additional legal services. Purchased services expenditures reflect those amounts reserved for contracted litigation support when it is impractical for in-house counsel to provide representation.
Office of the Superintendent

Fina
ncia
l Sec
tion
792014-15 Comprehensive Annual Budget Report |
Affirmative Action, Cost Center Group 007, is charged with the responsibility of handling complaints and issues related to the enforcement of Title VI and Title VII of the Civil Rights Act of 1964, the Civil Rights Act of 1991, the Americans with Disabilities Act of 1990, and the ADA Amendments Act of 2008, the Age Discrimination Act of 1975, Section 504 of the Rehabilitation Act of 1973, and Title IX of the Education Amendment of 1972. Specifically, the Office investigates complaints and inquiries from District staff and employment applicants who feel discriminated against in the areas of race, color, creed, sex (including harassment), marital status, national or ethnic origin, age (40 and over), and disability. In addition, a number of reports are compiled and issued relative to the age, sex, race, and ethnic composition of the District workforce to include unified administration, licensed personnel, and support staff. The Office also annually prepares and distributes a detailed report on student enrollment by race, sex, and ethnicity. The Office also monitors all District activities relevant to maintaining a workforce that reflects the cultural diversity makeup of the community.
Internal Audit Department, Cost Center Group 053, provides assurances to administration and the Board that the District’s operations and functions are adequately controlled, effective, efficient, and being carried out in accordance with applicable policies, plans, and regulations. The Department makes recommendations for improvement and provides impetus to administration to correct any weaknesses and discrepancies revealed by its examinations.
The Department performs audits in accordance with an audit plan approved by the Chief of Staff, with such plans and general results of audits being periodically reviewed by the Superintendent or his designee, and the audit advisory committee of the Board. The plan includes audits of any District related activities. School audits are performed on a rotation basis, and the Department’s goal is to audit elementary schools every three years, and secondary schools at least every two years.
School Police and Security, Cost Center Group 156, is comprised of the School Police Operations, Administrative Division, and the Security Services Division.
The Operations Division encompasses campus and patrol-based police officers supervised by two police captains, five police lieutenants and 17 police sergeants. Its jurisdiction is divided geographically into eight law enforcement area commands. Two police officers are assigned to most high schools and four patrol officers are assigned to each area command and are primed to respond to the needs of all elementary, middle, and high schools. Additional police officers patrol all properties and buildings 24 hours each day, seven days each week.
The Administrative Division is supervised by a police lieutenant and two police sergeants and encompasses the Training, Detective, and Communications Bureaus as well as the Bureau of Professional Standards. The Training Bureau manages and facilitates “training tracks” focusing on skills specific to the Nevada Commission on Peace Officers’ Standards & Training (POST) and the Department’s organizational structure and needs.

80 | Clark County School District
The Detective Bureau investigates crimes committed on District property. Duties include crime scene investigation, physical surveillance and intelligence gathering. The Bureau interviews victims, witnesses, and suspects; and utilizes photography, video surveillance, and audio/video recording equipment to resolve criminal and non-criminal acts that impact the District. The Bureau works closely with the Office of General Counsel and EMR departments on cases involving District employees.
The Dispatch Center provides public safety dispatch services to the District and local communities. The Center is staffed 24 hours each day, seven days each week with dispatchers trained to handle emergency calls for police, fire, and emergency medical assistance, as well as non-emergency calls and inquiries. The dispatchers utilize a
dispatch program titled Computer Aided Dispatch (CAD). Dispatchers are cross-trained to perform criminal history checks, enter and receive warrant information, monitor all District intrusion, fire, and freezer alarm systems, in addition to monitoring over 12,000 surveillance cameras stationed throughout District properties.
The mission of the Department is to provide a safe, secure, and nurturing learning environment that is conducive to education. This includes the maintenance of law and order with respect for the constitutional rights of all. It supports the implementation of the District’s educational programs and goal of ensuring students are “ready by exit” by providing optimal service to meet the collective needs of students, employees, and the community.
Superintendent’s Office and Other Subordinate Allocations1
For Fiscal Years 2012-13 Through 2014-152012-13 2013-14 2014-15Actuals Amended Final Budget Final Budget 2013-14 vs. 2014-15
Description Staff Amount Staff Amount Staff Amount Amount Percent
Admin / prof tech 49.80 $ 4,890,345 58.00 $ 5,932,232 57.00 $ 5,863,081 $ (69,151) (1.2)%Licensed 2.00 160,074 2.00 153,754 2.00 153,960 206 - %Support staff 230.51 14,310,423 243.87 15,436,807 244.87 15,665,775 228,968 1.5 %Benefits 7,153,829 8,721,828 8,783,672 61,844 0.7 %Purchased services 1,697,215 1,581,404 1,952,404 371,000 23.5 %Supplies 1,028,631 1,133,188 1,163,188 30,000 2.6 %Property 97,165 - - - - %Other 84,522 75,510 101,910 26,400 35.0 %
Total 282.31 $29,422,204 303.87 $33,034,723 303.87 $33,683,990 $ 649,267 2.0 %Source: CCSD Budget and Accounting Departments1 Includes General Counsel, Development and Innovation, Employee-Management Relations, Affirmative Action, Communications Office, Emergency Management, Internal Audit, and School Police.

Fina
ncia
l Sec
tion
812014-15 Comprehensive Annual Budget Report |
Community and Government Relations
Mission Statement
Community and Government Relations supports the academic, social, and personal growth of students through public policy development, resource acquisition, productive relationships, and open communications with our students and their families, our diverse communities, and our education partners.
Services:
The Division is comprised of four offices, each providing a valuable service in support of the District’s mission.
Office of Community and Government Relations, Cost Center Group 133, works with various audiences to garner support for education. The Office interacts with local, State and federal elected officials and associated agencies to ensure the coordination of policies, legislation, and funding in a manner that benefits students, parents, the District, and the general public. The Office also coordinates State-wide activities with various organizations and works with the business community to enlist support of District goals. The office coordinates the District’s public concern process, the School Name Committee, the annual back-to-school kickoff, public input meetings, activities designed to increase community support of student achievement, and other assignments that align to and support the strategic initiatives of the Superintendent and Board of School Trustees.
School-Community Partnership Program, Cost Center Group 145, coordinates efforts of the business community to support, complement, and supplement the curriculum of the District. The office is guided by the Partnership Advisory Council and works with more than 700 business and community agencies that provide partnership experiences and resources for students and teachers through programs, events, and activities that enrich their learning.
Office of Government Affairs, Cost Center Group 008, represents the District in matters concerning the Nevada Legislature, the federal government, the Nevada State Board of Education, the Nevada Department of Education, and local governments. The office coordinates the development of legislative priorities on behalf of the Board of Trustees; strategically promotes the District’s interests during legislative sessions; represents the District at legislative hearings; meets with legislators during the interim to assist with the education-related concerns of their constituents; produces an analysis of education-related legislation; and serves as the District contact on public policy issues.
Office of Parent Services is responsible for developing, coordinating, and implementing internal and external programs focused on increasing parent involvement and student academic achievement. Its purpose is to increase the engagement of parents through identifying, creating, and fostering opportunities for two-way, meaningful communication with parents, students, community partners, and staff. The office manages four family engagement resource centers; supports the districtwide Parent Engagement Forum; provides resources for parents; and supports the Statewide Parent Involvement Council.
Fiscal Year 2013-14 Accomplishments:• Represented the District before the Legislative Committee
on Education, the Task Force on K-12 Funding and its associated Technical Advisory Committee, the Interim Finance Committee, and the Legislative Committee on Health on policies passed in the 2013 session and new laws under consideration by the 2015 Nevada Legislature.
• Actively participated in the development of a new funding formula for public schools; monitored implementation of education reform initiatives (i.e. the Teaching and Learning Council’s development of new evaluations).
• Represented the District before the State Board of Education and related subcommittees during hearings on new regulations.
• Coordinated numerous stay-in-school efforts for the District, including the expansion of the Jobs for America’s Graduates (JAG) in six additional high schools; the recruitment of more than 275 community and school volunteers to participate in the Reclaim Your Future initiative to ensure Seniors and Juniors were on track to graduate; and management of five Family Engagement Resource Centers at high schools across the District with over 15,460 event visitors as of June 2014.
• Increased the number of the Stay-in-School and Reclaim Your Future Mentoring Project participants from 415 for the 2013-2014 school year to 461 for the 2013-14 school year.
• Coordinated the sixth annual Family Enrichment Day in collaboration with UNLV and the Nevada System of Higher Education with nearly 400 families, students, and volunteers participating.

82 | Clark County School District
Fiscal Year 2014-15 Objectives:• Prepare and present information related to a future ballot
question to support the capital needs of the District.• Represent the District during the 78th Legislative Session
and before interim committees of the Legislature on all legislative matters.
• Work with other Nevada counties to effect positive change for public education as outlined in iNVest 2015.
• Work with local governments to effectively support students and schools within the boundaries of each entity, including the equitable use of District facilities.
• Monitor implementation of educational reform initiatives passed by the Legislature and monitor the State Board of Education and related subcommittees for new regulations.
• Increase the number of schools that have a parent organization.
• Increase the number of and participation in organized, effective parent trainings.
• Increase professional development opportunities for principals and staff related to effective family and community engagement.
• Increase the number of participants in the Stay-in-School Mentoring Project by 25 and the number of businesses participating in the Focus School Project by 20.
• Expand opportunities for parent and community participation by coordinating outreach programs including Principal for a Day, Family Enrichment Day, and the Reclaim Your Future initiative.
• Conduct a systemic review and document the protocols followed for policies and procedures within the Division’s scope, particularly those associated with political activity.
Performance Measures 2011-12 2012-13 2013-14Focus Schools with Partners Number of Business Partners
146 252
218 263
232 306
Focus School Students Served 132,447 146,912 209,159Communities in Schools – Students Served 15,958 17,811 27,638School-Community Partnership Volunteers 23,494 26,158 48,966School-Community Partnership (in-kind and volunteer) $20,186,051 $20,093,831 $22,907,813School-Community Partnership Cash Donations $2,737,026 $2,433,310 $2,199,546
Community and Government Relations AllocationsFor Fiscal Years 2012-13 Through 2014-15
2012-13 2013-14 2014-15Actuals Amended Final Budget Final Budget 2013-14 vs. 2014-15
Description Staff Amount Staff Amount Staff Amount Amount Percent
Admin / prof tech 8.00 $ 728,334 8.00 $ 799,378 9.00 $ 884,592 $ 85,214 10.7 %Licensed - 21,135 - 1,966 - 1,966 - - %Support staff 7.67 315,188 8.68 357,670 14.68 652,623 294,953 82.5 %Benefits 372,965 437,057 591,355 154,298 35.3 %Purchased services 207,513 109,977 109,977 - - %Supplies 76,527 9,352 50,352 41,000 100.0 %Other 4,399 906 906 - - %
Total 15.67 $1,726,060 16.68 $1,716,306 23.68 $2,291,771 $575,465 33.5 %Source: CCSD Budget and Accounting Departments

Fina
ncia
l Sec
tion
832014-15 Comprehensive Annual Budget Report |
Instruction Unit
Budget Units Budget Units
105 Chief Student Achievement Officer
582 Autonomous and Innovative SchoolsPerformance Zones 114 Moapa Valley School Farm and Nursery
004 Equity and Diversity Education 122 English Language Learners103 Educational Opportunities 164 Academic Support and Community Support111 Student Activities112 Interscholastic Athletics
Chief Student Achievement Officer
Autonomous and Innovative Schools
Performance Zones Moapa Valley School Farm and Nursery
English Language Learners
Academic Support and Community Service Center
Equity and Diversity Education Interscholastic Athletics
Student Activities
Prime Six Schools
Educational Opportunities

84 | Clark County School District
Instruction Unit
Mission Statement
The Instruction Unit leads and supports the District community to increase student academic achievement and to improve operational effectiveness and efficiency.
Services:
The Unit is responsible for the operation of all schools assigned to the 16 performance zones.
The Cost Center Groups comprising the Unit overview are the following:105 Instruction Unit191 Performance Zone 1172 Performance Zone 2173 Performance Zone 3174 Performance Zone 4185 Performance Zone 5 - ZOOM Schools176 Performance Zone 6177 Performance Zone 7184 Performance Zone 8179 Performance Zone 9150 Performance Zone 10181 Performance Zone 11182 Performance Zone 12183 Performance Zone 13192 Performance Zone 14 - Turnaround Schools107 Performance Zone 15195 Performance Zone 16 - Rural Schools114 Moapa Valley School Farm and Nursery122 English Language Learners582 Autonomous and Innovative Schools
Cost centers comprising the Unit include the operations of the offices of the Chief Student Achievement Officer, the Instruction Unit, the English Language Learners Program, and 16 assistant chiefs who are assigned to supervise the elementary, secondary, and magnet schools along with the career and technical academies located within the District. The budget appropriations include the Chief Student Achievement Officer, 16 assistant chiefs, related staff, services, and supplies.
Catapult Learning - During 2014, Catapult Learning acquired EdisonLearning, Inc. Seven elementary schools are managed by Catapult Learning, Inc. The expenses covered by the partnership contractual agreement reside in Cost Center 100. The seven schools are Cahlan, Crestwood, Elizondo, Lincoln, Lynch, Park, and Ronnow Elementary Schools. The District makes monthly installment payments to Catapult under terms of the agreement which began July 1, 2012 and is scheduled to end on June 30, 2014 unless terminated earlier or otherwise extended. The Catapult Learning Program provides a collaborative teaching method which enables educators an additional 40 minutes per day to prepare lesson plans and review student data.
Moapa Valley School Farm and Nursery Project, Cost Center 114, was established to provide high school students with “hands-on” experiences on a model working farm. The project provides students with development and implementation of planting, harvesting, and watering schedules, as well as a variety of livestock production projects. The project also provides support activities for students affiliated with the high school chapter of the FFA (formerly known as Future Farmers of America). In addition, the farm is responsible for planting and nurturing a variety of trees and shrubs which are then utilized by the Grounds Department to replace or augment the landscaping of existing school sites.
English Language Learners (ELL) program, Cost Center 122, offers dual language programs in which English speakers and learners are grouped in classrooms and learn literacy skills in both English and Spanish. The goal of this program is to assist schools in providing comprehensive services for English language learners including student identification, language assessment, program placement, instructional support, and coordination of related services. Direct services to schools are provided by itinerant specialists. These specialists serve as mentors to classroom teachers and provide onsite training, technical assistance, and language assessments to all ELL students.
Zoom Schools, Cost Center 185, was established through funding from SB 504 to increase student achievement in 14 specific elementary schools and will be expanded to 16 schools in fiscal year 2015. Funding is to provide extended services for students who are economically disadvantaged, from major racial and ethnic groups, with disabilities, limited in English proficiency, and who have a migratory background. The Zoom Reading Center collects, analyzes, and uses data to assist students to read on grade level. Approximately, 50% of all Zoom students had acquired grade level reading skills by the end of the 2014 school year. The Center provides focused instructional practices and literacy strategies for English Language Learner (ELL) students. Teachers work directly with students for language acquisition, language knowledge, and literacy development.

Fina
ncia
l Sec
tion
852014-15 Comprehensive Annual Budget Report |
Educational Opportunities – Cost Center 103This Office supervises and provides educational opportunity support services to students and schools in fulfilling the District’s vision that all students progress in school and graduate prepared to succeed and contribute in a diverse global society.
Prime 6 SchoolsPrime 6 Schools are nine elementaries schools located in the historic west Las Vegas area and receive additional instructional and financial support and services to serve students residing in among the most challenged areas in the District.
Student Activities – Cost Center 111Interscholastic Athletics – Cost Center 112These cost centers provide direction and coordination of information and support related to student activities; opportunities for student interaction with appropriate local, State, and national organizations; high school commencement ceremonies; leadership training opportunities for students and adults; and a variety of athletic programs for students in all middle and high schools. Funding provides fees and travel expenses associated with student organizations; Northwest Accreditation fees for all District schools; payment for all officials, non-District security, athletic trainers, and stand-by medical services; State tournament and meet expenses; program staffing of administrative, licensed, and secretarial support; and Nevada Interscholastic Activities Association dues.
Equity and Diversity Education Department – Cost Center 004This cost center provides services to assist educators in creating culturally supportive learning environments for all students in collaboration with District personnel and community leaders regarding culturally diverse programs and resources. The Center advocates for equity and diverse educational programs for students, parents, and the community. Technical assistance is provided and professional development is designed to focus on diversity as it relates to student achievement.
Academic Support and Community Service Center – Cost Center 164This cost center supports west Las Vegas area schools by providing community based programs to increase the academic achievement of students and educate students and parents on post-graduation options.
Fiscal Year 2013-14 Accomplishments:Implemented a District-wide benchmark assessment system to guide how schools deliver acceleration, intervention, and maintenance services to students:• The Discovery Assessment, Launch Into Teaching!, was
implemented across the District at all levels and was administered multiple times throughout the year and results of these assessments were utilized to guide instruction and to share progress with students in families
Increased school performance as measured by the Nevada School Performance Framework (NSPF):Increased the percentage of students catching up, keeping up, and moving up in each school as measured by School Growth Summaries and Academic Growth Gaps indicators in the SPF:• Elementary catch up went from 39% to 35% and middle
schools catch up went from 22% to 26% in reading• Elementary keep up went from 74% to 73% and middle
schools keep up went from 66% to 75% in reading• Elementary move up went from 40% to 39% and middle
schools move up went from 27% to 29% in readingImproved postsecondary readiness as measured by Other Factors in the NSPF (including graduation rates):• The overall high school graduation rate increased from 61.6%
to 71.5%Improved primary class sizes in all elementary schools• Class size reduction for all kindergarten classrooms from
25:1 to 23:1Improved effective and efficient communication with schools and other departments:• The Instruction Unit published a weekly message to
administrators that included a variety of information from a variety of divisions and departments
• A comprehensive calendar was published and maintained• Meetings with principals were conducted regularly to
communicate information and discuss concerns based on agendas created by both principals and the Instruction Unit
• Instruction Unit developed an online conference “Weekly Updates” to improve lines of communication among central office and school sites

86 | Clark County School District
Instruction Unit AllocationsFor Fiscal Years 2012-13 Through 2014-15
2012-13 2013-14 2014-15Actuals Amended Final Budget Final Budget 2013-14 vs. 2014-15
Description Staff Amount Staff Amount Staff Amount Amount Percent
Admin / prof tech 193.00 $ 18,192,417 266.00 $ 25,862,148 278.00 $ 27,610,843 $ 1,748,695 6.8 %Licensed 2,268.18 119,532,206 3,317.81 166,830,512 3,361.28 178,722,047 11,891,535 7.1 %Support staff 496.27 19,429,977 568.09 21,761,783 558.25 22,243,837 482,054 2.2 %Benefits 60,067,251 86,115,045 90,365,115 4,250,070 4.9 %Purchased services 5,554,300 9,443,531 8,295,531 (1,148,000) (12.2)%Supplies 824,466 5,666,862 5,666,862 - - %Property 12,944 - - - - %Other 198,629 207,674 207,674 - - %
Total 2,957.45 $223,812,190 4,151.90 $315,887,555 4,197.53 $333,111,909 $17,224,354 5.5 %Source: CCSD Budget and Accounting Departments
Fiscal Year 2014-15 Objectives:• Continue to implement a District-wide benchmark
assessment system and use results to guide how schools deliver acceleration, intervention, and maintenance services to students
• Increase overall school performance, as measured by the NSPF
• Increase the percentage of students catching up, keeping up, and moving up in each school as measured by school growth summaries
• Improve school performance in achievement gaps as measured by the Gap Measures indicators in the NSPF
• Improve graduation rates and decrease college remediation rates for those students enrolling in Nevada’s higher education institutions
• Improve effective and efficient communication with schools and other departments
• Improve family engagement and parent communication • Develop a Leadership Development Program with
alignment to UNLV Educational Administration Program• Modify current performance zones for structured leadership
wherein Assistant Chiefs supervise no more than 25 schools

Fina
ncia
l Sec
tion
872014-15 Comprehensive Annual Budget Report |
Education Services Division
Budget Units Budget Units
151 Assistant Superintendent - Education Services128 Education Services 792 South Continuation Junior/Senior High School152 Alternative Programs for Rural Schools 844 Juvenile Court Schools220 Biltmore Continuation Junior/Senior High School 877 Burk Horizon/Southwest Sunset439 Peterson Behavior Junior/Senior High School 878 Global Community High School664 Alternative Education Summer School 880 Washington Continuation Junior High720 Southwest Behavior Junior/Senior High School 888 Cowan Behavior Junior/Senior High School773 Jeffrey Behavior Junior/Senior High School
Assistant Superintendent - Education Services
Education Services
Biltmore ContinuationJunior/Senior High School
Continuation Schools
Peterson Behavior Junior/Senior High School
Behavior Programs, Academic Centers and Credit Retrieval Schools
Burk Horizon/Southwest Sunset
Alternative Programs For Rural Schools
Alternative Education Summer School
Juvenile Court Schools
Washington Continuation Junior High
Southwest Behavior Junior/Senior High School
South Continuation Junior/Senior High School
Jeffrey Behavior Junior/Senior High School
Global Community High School
Cowan Behavior Junior/Senior High School

88 | Clark County School District
Mission
It is the mission of the Education Services Division (ESD) to provide students with the essential skills, attitudes, and integrity necessary to become successful, responsible citizens.
Services:
The Assistant Superintendent of the Education Services Division oversees the Department of Education Options - Correctional, Department of Education Options - East, Department of Education Options - West, Department of Adult Education, Department of Adult English Language Acquisition Services, Department of Pupil Personnel Services, Department of Attendance Enforcement, Office of Instructional Support, Office of Administrative Services, and Institute for Accelerated Studies. The Division provided instruction and related services to approximately 35,000 students during the 2013-14 school year. Many of these students experienced academic and social challenges in comprehensive school environments. The unique needs of these students require ongoing evaluation, development of curriculum, and innovative instructional programs.
The Cost Center Groups comprising the Division overview are the following:
128 Education Services151 Assistant Superintendent,
Pupil Personnel Services, Attendance Enforcement152 Alternative Programs for Rural Schools220 Biltmore Continuation High School437 Morris Behavior Junior/Senior High School439 Peterson Behavior Junior/Senior High School440 Cowan Behavior Junior/Senior High School550 Desert Rose High School609 Adult English Language Acquisition Services615 High Desert State Prison617 Adult Education664 Continuation Summer Schools720 Southwest Behavior Junior/Senior High School773 Jeffrey Behavior Junior/Senior High School792 South Continuation Senior High School815 Morris Sunset East High School832 Florence McClure Women’s Correctional Center838 Southern Desert Correctional Center839 High Desert Correctional Center Youthful Offender Program844 Juvenile Court Schools846 Spring Mountain Junior/Senior High School863 Desert Rose Adult High School877 Burk Horizon High School/Burk Southwest Sunset High School878 Global Community High School at Morris Hall880 Washington Continuation Junior High School888 Cowan Sunset High School
The Division operates five behavior schools for secondary students that provide short term placement for students with chronic and/or less severe behavior problems at their zoned school of enrollment. Students are assigned to the program by the principal of the secondary schools. The programs
are for students in grades 6-12. Students are often assigned to schools for approximately 45 school days from the date of the disciplinary offense. The goal is to assist students in changing their behaviors so that they are prepared to successfully return to their home schools. Students are required to regularly attend school, adopt and maintain a positive attitude, comply with school rules and District policies & regulations, and perform well academically. The program provides a structured learning environment which includes a character education component. Most students exit the program with an improved academic outlook, better attendance, and acquired social skills to avoid conduct which originally precipitated placement in the program.
The Division supports schools in the outlying areas as well. In rural areas, expelled students and those with chronic and/or severe behavior problems are provided alternative services utilizing direct instruction and independent study models that operate outside of the traditional school day.
The Division operates schools that serve students who have committed more serious infractions. The three continuation schools provide educational programs for students who, by action of the Board, have been expelled from the District. Continuation schools educate and prepare students for a successful return to a comprehensive or alternative school setting. Students assigned to a continuation school typically serve a period of one semester to one school year depending on the infraction. Students are provided core academic and elective courses and the curriculum is delivered utilizing direct instruction, independent study, and competency based instruction models.
In addition to the consequence schools, the Division also operates choice schools. Global Community High School at Morris Hall serves students new to the country in grades 9-12 while promoting English proficiency and acceptance of cultural diversity among all students. The school provides a safe, nurturing, and individualized educational environment with smaller class sizes and more individualized attention for each student.
Education Services Division

Fina
ncia
l Sec
tion
892014-15 Comprehensive Annual Budget Report |
One horizon and three sunset high schools provide an alternative education setting for students in grades 9-12 who are at-risk of dropping out of school or who have already dropped out but may have accumulated academic credits towards graduation. Horizon students attend classes during the day while sunset students attend in the afternoon and evening. The small school model contributed to the success of horizon and sunset students. Students are offered a flexible school schedule, while meeting graduation requirements without the distractions that exist on a comprehensive school campus. Sunset high schools offer concurrent enrollment options for students throughout the County.
Detained school-aged students, who are awaiting adjudication, are provided educational services while they are under the jurisdiction of either the Juvenile Detention Center or the Clark County Detention Center (CCDC). These educational programs are an essential component in the overall effort to rehabilitate at-risk, juvenile offenders. Upon release from custody, the student may become eligible for enrollment in a comprehensive school, a virtual type school, or another non-traditional educational program offered through the Division.
The Division also provides service to adjudicated youth and adults who are serving time in one of the correctional facilities. Two youth facilities, Red Rock Academy and Spring Mountain Youth Camp, are provided services. Both facilities serve adjudicated youth who are serving sentences from 12 to 18 months. Students are provided with a standard high school curriculum in an effort to prepare to earn a standard high school diploma. The adult correctional programs provide adult inmate students, located within the State prison system, with instructional programming, both academic and vocational, which leads to the attainment of an adult high school diploma or a Nevada State Certificate of High School Equivalency (HSE). The curriculum follows the adult education open entry/open exit format in all areas required for an adult high school diploma or a HSE certificate. Services are provided at High Desert State Prison Adult High School, High Desert State Prison Youthful Offender Program, Southern Desert Correctional Center Adult High School, and Florence McClure Women’s Correctional Center Adult High School.
The Department of Adult Education provides educational services for individuals 17 years old and older who are seeking either a high school equivalency or a high school diploma. Students entering with the idea of earning a high school equivalency are encouraged and counseled into expanding their career opportunities to include a high school diploma. Programming is provided through direct classroom instruction at approximately 40 sites across the valley as well as through an independent study format. Desert Rose High School is a center-based program location providing the full complement of core academic courses together with career and technical programs in an alternative high school format enabling students to learn a saleable job skill and complete high school diploma requirements. Students can also enroll
in the High School to complete diploma requirements and earn credits in career and technical courses.
The Department of Pupil Personnel Services is responsible for processing all student expulsion recommendations and coordinating due process hearings as prescribed by District, State, and federal regulations. Outcomes may include, but are not limited to: return to a comprehensive school, placement in a behavior school, or placement in a continuation school. The Department processes and evaluates all expulsion referrals, long-term suspension referrals, and other disciplinary placements of students as a result of out-of-district referrals. The Department processed approximately 5,000 recommendations during the 2013-14 school year. The Department also facilitates home school and work exemption requests as prescribed by District policy and Nevada Revised Statutes (NRS).
The Department of Adult English Language Acquisition Services (AELAS) provides non-English speaking adults the workplace literacy, numeracy, and life skills needed to become self-sufficient, productive members of their community. Students can use these skills to enhance employment and career opportunities, become better citizens or obtain citizenship, progress to vocational or academic programs, and function in English at higher cognitive levels. The program also provided resources such as free notary services, domestic violence referrals, high school equivalency referrals, and continuing education referrals.
The Office of Attendance Enforcement assigns attendance officers to serve all schools in the District. Attendance Officers assume a primary responsibility for identifying the cause of student absences and working with schools, parents, and other District and community agencies to resolve attendance issues and ensure that all parties are in compliance with State and federal compulsory attendance statutes and District attendance policies and regulations. The Office provides a District representative in Juvenile Truancy Court. The Office also manages the Student Attendance Review Board (SARB), an attendance program focused on addressing students and their parents after level one strategies have been unsuccessful. The program is a collaboration between the District, the Division of Family Services, the District Attorney’s Office- Juvenile Division, and Juvenile Probation.
The need to provide year-round programming for alternative schools continues to grow for a variety of at-risk students. The need to provide more opportunities for students to fulfill credit requirements, full-time continuation school placements, and necessary intervention programs for detention center programs require a 12 month schedule. The summer programs for continuation schools, detention center programs, and independent study begins approximately one week after the regular school year ends and is in session for six weeks.
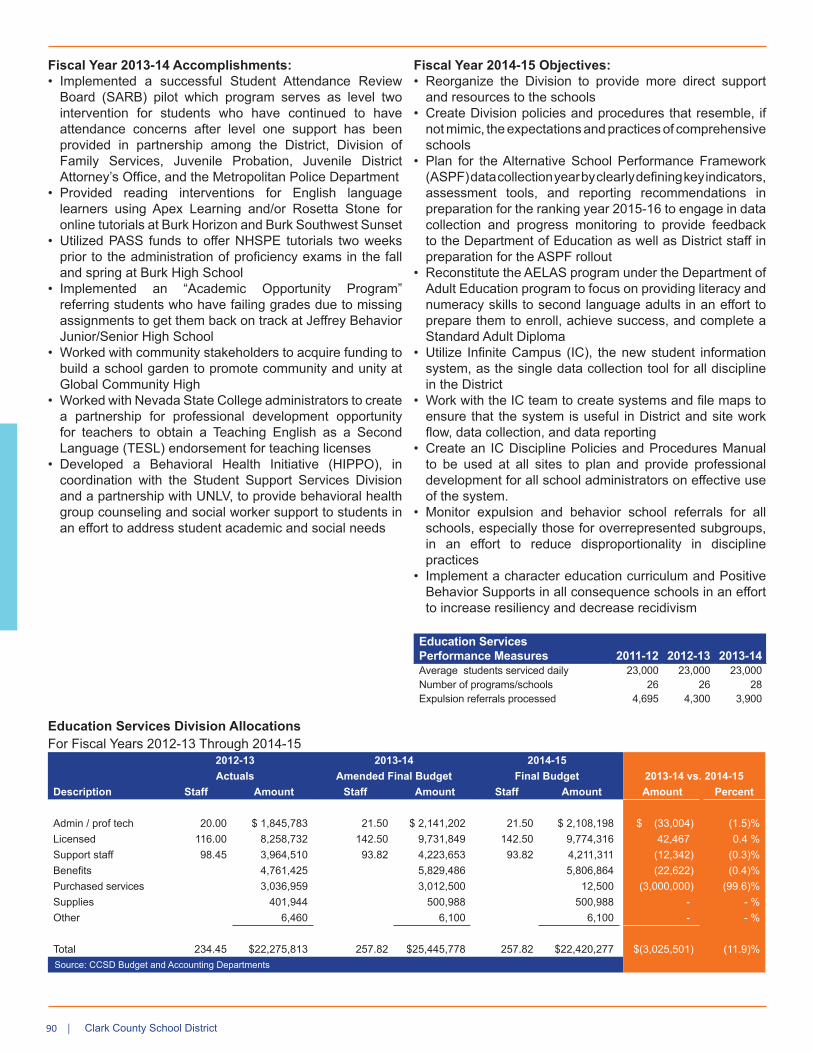
90 | Clark County School District
Education Services Division AllocationsFor Fiscal Years 2012-13 Through 2014-15
2012-13 2013-14 2014-15Actuals Amended Final Budget Final Budget 2013-14 vs. 2014-15
Description Staff Amount Staff Amount Staff Amount Amount Percent
Admin / prof tech 20.00 $ 1,845,783 21.50 $ 2,141,202 21.50 $ 2,108,198 $ (33,004) (1.5)%Licensed 116.00 8,258,732 142.50 9,731,849 142.50 9,774,316 42,467 0.4 %Support staff 98.45 3,964,510 93.82 4,223,653 93.82 4,211,311 (12,342) (0.3)%Benefits 4,761,425 5,829,486 5,806,864 (22,622) (0.4)%Purchased services 3,036,959 3,012,500 12,500 (3,000,000) (99.6)%Supplies 401,944 500,988 500,988 - - %Other 6,460 6,100 6,100 - - %
Total 234.45 $22,275,813 257.82 $25,445,778 257.82 $22,420,277 $(3,025,501) (11.9)%Source: CCSD Budget and Accounting Departments
Fiscal Year 2013-14 Accomplishments:• Implemented a successful Student Attendance Review
Board (SARB) pilot which program serves as level two intervention for students who have continued to have attendance concerns after level one support has been provided in partnership among the District, Division of Family Services, Juvenile Probation, Juvenile District Attorney’s Office, and the Metropolitan Police Department
• Provided reading interventions for English language learners using Apex Learning and/or Rosetta Stone for online tutorials at Burk Horizon and Burk Southwest Sunset
• Utilized PASS funds to offer NHSPE tutorials two weeks prior to the administration of proficiency exams in the fall and spring at Burk High School
• Implemented an “Academic Opportunity Program” referring students who have failing grades due to missing assignments to get them back on track at Jeffrey Behavior Junior/Senior High School
• Worked with community stakeholders to acquire funding to build a school garden to promote community and unity at Global Community High
• Worked with Nevada State College administrators to create a partnership for professional development opportunity for teachers to obtain a Teaching English as a Second Language (TESL) endorsement for teaching licenses
• Developed a Behavioral Health Initiative (HIPPO), in coordination with the Student Support Services Division and a partnership with UNLV, to provide behavioral health group counseling and social worker support to students in an effort to address student academic and social needs
Fiscal Year 2014-15 Objectives:• Reorganize the Division to provide more direct support
and resources to the schools• Create Division policies and procedures that resemble, if
not mimic, the expectations and practices of comprehensive schools
• Plan for the Alternative School Performance Framework (ASPF) data collection year by clearly defining key indicators, assessment tools, and reporting recommendations in preparation for the ranking year 2015-16 to engage in data collection and progress monitoring to provide feedback to the Department of Education as well as District staff in preparation for the ASPF rollout
• Reconstitute the AELAS program under the Department of Adult Education program to focus on providing literacy and numeracy skills to second language adults in an effort to prepare them to enroll, achieve success, and complete a Standard Adult Diploma
• Utilize Infinite Campus (IC), the new student information system, as the single data collection tool for all discipline in the District
• Work with the IC team to create systems and file maps to ensure that the system is useful in District and site work flow, data collection, and data reporting
• Create an IC Discipline Policies and Procedures Manual to be used at all sites to plan and provide professional development for all school administrators on effective use of the system.
• Monitor expulsion and behavior school referrals for all schools, especially those for overrepresented subgroups, in an effort to reduce disproportionality in discipline practices
• Implement a character education curriculum and Positive Behavior Supports in all consequence schools in an effort to increase resiliency and decrease recidivism
Education ServicesPerformance Measures 2011-12 2012-13 2013-14Average students serviced daily 23,000 23,000 23,000Number of programs/schools 26 26 28Expulsion referrals processed 4,695 4,300 3,900

Fina
ncia
l Sec
tion
912014-15 Comprehensive Annual Budget Report |
Educational and Operational Excellence Unit
Budget Units
100 Deputy Superintendent106 Operational Services Division135 Student Support Services Division
Educational and Operational Excellence Unit
Operational Services Division Student Support Services Division

92 | Clark County School District
Grants Development and Administration, Cost Center 137, consists of grant writers, program evaluators, and support staff. Once a grant is awarded, grant writers assume responsibility for project oversight, and adherence to local, State, and national policies, regulations, and laws. Program evaluators conduct evaluation activities throughout the year that include program and participant research, data collection, analysis of process and outcome data. Evaluators monitor aggregated and disaggregated data for analysis to produce local, State and federal reports in compliance with activity monitoring. The Grants Development and Administration Department shares all fiscal and evaluation reports with appropriate District personnel to achieve maximum program efficiency and effectiveness.
Educational and Operational Excellence Unit
Mission
The EOE Unit ensures that every investment of time, money, and people contributes to student success.
Services:
The EOE Unit, comprised of the Office of the Deputy Superintendent, provides leadership and supervision for the Grants Development and Administration (GDA) Department, the Operational Services Division, the Student Services Division, and the Title I Department.
The Cost Center Groups comprising the Unit overview are the following:
100 Deputy Superintendent106 Operational Services DIvision135 Student Support Services Division
Deputy Superintendent, Cost Center 100, oversees the departments of Grants Development and Administration (GDA), Operational Services Division, Student Services Division, and Title I, through which services are provided directly to schools to support student achievement and well-being.
Educational And Operational Excellence Unit AllocationsFor Fiscal Years 2012-13 Through 2014-15
2012-13 2013-14 2014-15Actuals Amended Final Budget Final Budget 2013-14 vs. 2014-15
Description Staff Amount Staff Amount Staff Amount Amount Percent
Admin / prof tech 20.35 $ 1,994,050 2.68 $ 323,676 2.68 $ 293,046 $ (30,630) (9.5)%Licensed 5.00 501,285 2.00 382,349 2.00 155,333 (227,016) (59.4)%Support staff 29.44 1,422,320 10.83 467,537 9.15 406,849 (60,688) (13.0)%Benefits 1,312,491 369,156 327,652 (41,504) (11.2)%Purchased services 3,391,281 214,092 214,092 - - %Supplies 5,475,583 160,707 160,707 - - %Property 12,944 - - - - %Other 2,623 4,000 4,000 - - %
Total 54.79 $14,112,578 15.51 $1,921,517 13.83 $1,561,679 $(359,838) (18.7)%Source: CCSD Budget and Accounting Departments

Fina
ncia
l Sec
tion
932014-15 Comprehensive Annual Budget Report |
Operational Services Division
Budget Units Budget Units
106 Associate Superintendent of Operations
091 Transportation Office 024 Custodial Operations Department092 Vehicle Maintenance 025 Landscaping and Grounds093 Bus Operations021 Energy Conservation 589 Special Projects1
023 Maintenance Department 953 Food Services1
Associate Superintendent of Operations
Transportation Office
Vehicle Maintenance
Landscaping and Grounds
1 Note: Described in Other Governmental and Proprietary Funds Sub-Section
Energy Management
MaintenanceDepartment
Custodial OperationsDepartment
Special Projects1
Food Services1
Bus Operations

94 | Clark County School District
Mission
The Operational Services Division administers a wide scope of functions including, but not limited to, the maintenance, operations, landscape, energy management, transportation, food service, and the educational ombudsman office. The Division’s mission is to deliver quality services without excuses.
Services:
The Division is comprised of approximately 6,200 personnel, 356 programs in 330 facilities on 324 campuses, and 59 administrative sites; spanning a geographic area of 8,012 square miles; and is managed by the Associate Superintendent with the assistance of department heads. Capital funded departments within the Division are not included in this overview. Accordingly, the accomplishments, objectives, and performance measures are General Operating Fund-based only and do not include capital funded activities.
The Cost Center Groups comprising the Division overview are the following:
106 Associate Superintendent of Operations021 Energy Management023 Maintenance Department024 Custodial Operations025 Landscaping and Grounds091 Transportation Department092 Vehicle Maintenance093 Bus Operations
Associate Superintendent of Operations, Cost Center 106, provides supervision on oversight of the Ombudsman’s Office, Energy Management, Maintenance, Operations, Landscaping and Grounds, Transportation, and the Food Service Departments. The Food Service Department, with 2,097 employees, served over 40 million meals for school year 2013-14. The Food Service Warehouse and Delivery Department delivers from 5:00 a.m. until midnight and covers the entire District including 331 facilities. This includes six District charter schools, one State charter school and the Clark County Juvenile Detention Services.
Energy Management, Cost Center 021, operating with the centrally controlled Energy Management Systems (EMS), the Office ensures that prudent air conditioning, heating, and lighting practices are established and maintained at all District facilities. It also promotes usage of the most energy efficient air conditioning, heating systems, electrical power, and lighting systems in new schools, searches for methods to increase energy and water efficiency in existing facilities through mechanical and electrical retrofits, promotes energy and water conservation through behavioral changes in personnel who occupy and operate all facilities, and seeks alternative or renewable energy sources. Commissioning of all modernization and new projects as well as retro-commissioning existing schools to ensure that proper space conditions exist for the learning environment is also conducted.
Maintenance, Cost Center 023, with 450 personnel, accomplishes preventive and routine maintenance and repair of District facilities through equipment repair, general repair, mechanical systems, exterior and structural items, and utility-monitor control. Eight mobile maintenance vans (MMVs) are in operation to assist in maintaining the needs of schools and support facilities. Maintenance responds to approximately 90,000 work orders each year.
Custodial Operations, Cost Center 024, with 1,600 employees, provides District-wide custodial services, recycling, coordination of refuse disposal, pest control treatment, pigeon deterrent, and gym floor refinishing. The building manager/head custodian, custodial leader, or custodian, depending on the type of facility, is at the location while the school is in session and assists the administration in site cleanliness, maintenance, equipment set-ups, work order submission, and ensure playground equipment is operable. It provides support in the area of minor maintenance repairs, furniture adjustment, carpet cleaning, and training.
Operational Services Division

Fina
ncia
l Sec
tion
952014-15 Comprehensive Annual Budget Report |
Fiscal Year 2014-15 Objectives:• Work to minimize interference to teaching and learning• Improve the quality and quality of work performed within
the current budget constraints• Implement effective communication and feedback loops to
improve service• Establish a performance based system of accountability• Continue identifying and prioritizing facility and equipment
repairs• Conduct quarterly inspections of each facility• Increase the quality of each facility• Increase preventive maintenance • Continue commissioning of facilities• Reduce solid waste and increase recycling• Provide timely bus service• Provide quality food within the allocated budget
Landscaping and Grounds, Cost Center 025, with 160 employees maintain grass, plant material, Xeriscape, and the installation and maintenance of irrigation systems to promote a sustainable environment for plants. Support personnel perform turf mowing and other horticultural practices, equipment maintenance and repair, grading and clean-up support, pest control, including computerized water management systems. The Department develops landscape standards for new construction, monitors landscape contractors, assists schools with self-funded projects, and prepares fields for sporting events.
Transportation Department, Cost Centers 091, 092 and 093, operates with 1,884 employees, 1,550 buses, and supports 1,345 other vehicle types. The mission of the Department is to provide safe, efficient, and timely transportation to over 105,000 students to and from school daily, over an area of 8,012 square miles. Transportation is provided to students who live two or more miles (exceptions for hazards) from school and to special education students with unique transportation needs. Transportation is provided during regular school day hours as well as for interscholastic athletics, school activities, and special events. The Department endorses data-driven management concepts and is dedicated to continual improvement to “ensure the success of every student in every classroom, without exceptions, without excuses.”
Fiscal Year 2013-14 Accomplishments:• Continued timely inspection and monitoring of playground
safety surface repairs and installations• Continued review, inspection, investigation, and completion
of corrective actions as required for environmental issues• Continued working with the Technology Department to
implement a District-wide PC power management system• Continued with in-house commissioning of existing schools
to the extent limited staff personnel are able to accommodate• Obtained reservations for available solar PV systems• Continued to look at the ten worst energy performing schools
and corrected deficiencies or operational issues found• Continued establishing a major equipment failure alarming
system for use by EMS and Maintenance• Continued the growth of the “Ambassador Recycling
Program” • Continued quality assurance program of grading custodial
inspection reports on a quarterly basis, provided “Certificates of Excellence” to school staff graded with an “A” rating and alerted Cabinet level staff where schools are failing
• Continued a program of green waste disposal which keeps employees out of disposal transfer facilities, reducing potential injury claims and saving over $50,000 yearly
• Initiated a new service delivery program developed to improve customer service and increase efficiency through the decentralization of maintenance and operations

96 | Clark County School District
Operational ServicesPerformance Measures 2011-12 2012-13 2013-14Buses operated 1,492 1,496 1,550Students eligible for transportation 105,998 114,573 118,877Bus miles driven 21,008,080 21,958,826 22,727,841Number of bus stops 18,361 17,491 25,062 Vehicles/buses maintained 2,755 2,736 2,895Vehicles/buses miles driven 31,086,594 31,867,169 31,959,483Cost Avoidance Savings (electrical) $10,294,0001 $9,908,0001 $9,000,0002
Acres of Improved Ground 5,200 5,200 5,200Number of maintenance work orders 95,984 88,519 87,740Cleaning Square Footage: Schools 34,510,009 34,510,009 34,510,009 Portables 1,387,676 1,387,676 1,518,744 Administrative Sites 1,432,257 1,432,257 1,432,257Recycling Rebates N/A N/A $355,644Schools Receiving Energy Rebates 331 3311 N/A3
Average Energy Rebate $1,539 $1,784 N/A3
1Energy performance measurements previously provided on cost avoidance savings for 2011-12 and 2012-13 were estimates. These revised amounts reflect actual savings.2Cost avoidance savings for 2013-14 is an estimate to date figure, but savings is more difficult after raising the bar.3Schools receiving energy management rebates and average rebate amounts will not be available until October 2014.
Operational Services DivisionFor Fiscal Years 2012-13 Through 2014-15
2012-13 2013-14 2014-15Actuals Amended Final Budget Final Budget 2013-14 vs. 2014-15
Description Staff Amount Staff Amount Staff Amount Amount Percent
Admin / prof tech 27.00 $ 2,597,401 26.00 $ 2,549,825 25.00 $ 2,445,949 $ (103,876) (4.1)%Licensed - - - 20,300 - 20,300 - - %Support staff 3,340.04 147,281,505 3,516.45 156,219,586 3,593.33 159,143,540 2,923,954 1.9 %Benefits 68,082,421 70,403,486 72,657,885 2,254,399 3.2 %Purchased services 23,942,777 25,051,240 25,791,240 740,000 3.0 %Supplies 71,415,350 73,951,096 78,323,688 4,372,592 5.9 %Property 307,555 48,750 48,750 - - %Other 66,745 62,250 38,250 (24,000) (38.6)%
Total 3,367.04 313,693,753 3,542.45 $328,306,533 3,618.33 $338,469,602 $10,163,069 3.1%Source: CCSD Budget and Accounting Departments

Fina
ncia
l Sec
tion
972014-15 Comprehensive Annual Budget Report |
Student Support Services Division
Budget Units Budget Units
135 Assistant Superintendent
044 Licensed Special Education Personnel 663 Special Education Extended School Year130 School Based Special Education Services 842 Homebound Services137 Fiscal Accountability and Data Analysis
Student Services Division
Licensed Special Education Personnel
School Based Special Education Services
Special Education Extended School Year
Homebound Services
Fiscal Accountability and Data Analysis

98 | Clark County School District
School Based Special Education Services, Cost Center Group 130, provides funding for a full continuum of educational services to students with disabilities including students eligible under the Individual Disabilities Educational Act (IDEA). The services range from the inclusive practices to special education schools and out-of-district placement pursuant to the provision of NRS 395. The determination of appropriate special education services and programs and the extent to which the student participates in general education programs are based upon the student’s individual needs as determined by the Individualized Education Program (IEP) process. During 2013-14, the Division provided services to 35,253 students while placing 50.6% of these students in a general education setting. Gifted education programming is also associated with this cost center.
Fiscal Accountability and Data Analysis (FADA), Cost Center Group 137, ensures compliance of the federal grants with OMB Circular A-133. Personnel assume responsibility for maintaining the cash flow for the grants and adherence to local, State, and national policies, regulations and laws. Additionally, personnel develop budgets in accordance with funders’ requirements and the NCES handbook. When grants are awarded, data is compiled and analyzed pertaining to local, State, and federal grants flowing through the District. The Grant Development and Administration (GDA) department and Title 1 are also associated with this cost center.
Special Education Extended School Year (ESY), Cost Center Group 663, services are mandated to assure a Free and Appropriate Public Education (FAPE) as determined by the Individualized Education Program (IEP) for students with disabilities. The number of students identified for and enrolled in the Extended School Year Program for 2013-14 was 5,637. Homebound Instructional Services, Cost Center 842, provides instruction to general and special education students who are too ill or injured to attend school for a minimum of 15 consecutive days as determined by a qualified physician. Homebound employs both full time teachers and teachers who are under contract to teach at a school during the day and elect to teach students after duty hours.
Mission Statement
The Student Services Division (SSD) provides leadership, services, and support to strengthen the capacity of schools, families, and communities to ensure the success of all students through collaboration in the education process.
Services
The Division is responsible for providing services under Special Education, Fiscal Accountability and Data Analysis (FADA), Gifted and Talented Education (GATE) programming, Extended School Year (ESY), and Homebound services.
The Cost Center Groups comprising the Student Support Services Division are the following:135 Assistant Superintendent044 Licensed Special Education Personnel130 School Based Special Education Services137 Fiscal Accountability and Data Analysis (FADA)663 Special Education Extended School Year842 Homebound Services
Assistant Superintendent, Cost Center Group 135, supports and provides opportunities for students with disabilities. The Office of Compliance and Monitoring Department ensures compliance with federal and State mandates concerning students with disabilities and represents the District in matters of due process. Support is also provided regarding Section 504, IDEA, and NRS 388. Additionally, Cost Center 0135 supports bilingual services for special education students and provides funding for professional development activities. The Division assists with the coordination of charter school activities.
Licensed Special Education Personnel, Cost Center Group 044, provides unit allocations to schools for licensed personnel. The special education programs are developed to meet the staffing needs of students with disabilities as well as those who are gifted and talented. Various programs that support the continuum of special education services are funded by this cost center.
Student Support Services Division

Fina
ncia
l Sec
tion
992014-15 Comprehensive Annual Budget Report |
Fiscal Year 2013-14 Accomplishments:• Provided $6 million in funding for early intervention services
such as the Proficiency Academy for Student Success (PASS), UNLV Literacy Centers, and the Summer Bridge program
• Provided professional development regarding advanced differentiation strategies to over 900 elementary and secondary general education teachers
• Received over $4.5 million in Medicaid reimbursements, a 10% increase in revenue over the previous fiscal year
• Identification of students with disabilities requiring special education (11.2%) remained below the overall national rate of 12.9%
• Trained special education teachers on the administration of the Core Phonics survey in which all teachers trained showed evidence of student growth
• Piloted the Gifted and Talented Education (GATE) Accelerated Learning Model in nine elementary schools, providing high level instruction to a broader range of students
• Partnered with the Cleveland Clinic to maintain three model demonstration classrooms at Variety School
• Piloted AIMSweb progress monitoring for special education students at four high schools to provide progress monitoring and track interventions.
• Maintained the percentage of special education students placed in a general education setting at 50%
Fiscal Year 2014-15 Objectives:• Increase the number of schools implementing inclusive
practices, school-wide positive behavioral supports, and ongoing student progress monitoring
• Increase the number of special education students graduating with a regular or advanced diploma, and reduce the number of unsuccessful transfers at assigned high schools to pursue alternative options for special education students who have dropped out of school or failed course coursework by 15%.
• Support District initiatives, such as the expansion of full-day kindergarten programs, School Performance Framework, Common Core State Standards, and the Curriculum Engine
• Provide data-driven, on-going professional development opportunities for support staff, licensed personnel, and administrators
• Evaluate current spending to ensure fiscal compliance, as well as drive educational change
• Support schools for the development, implementation, and measurement of student progress relative to interventions
• Develop partnerships to expand wraparound services and supports offered to students with individualized needs
• Establish partnerships to operate and provide school-based health services to students from low-income families
• Secure additional funding to serve identified program needs of the District
Student Support ServicesPerformance Measures 2011-12 2012-13 2013-14Students receiving special education services 33,129 33,947 35,253Percentage of students in special education 10.7% 10.9% 11.2%Percentage of special education students in general education 52.8% 52.0% 50.6%Students enrolled in special education extended school year (ESY) program 5,029 5,577 5,637Gifted and Talented Education (GATE) students served 5,704 6,089 6,480
Student Support Services Division AllocationsFor Fiscal Years 2012-13 Through 2014-15
2012-13 2013-14 2014-15Actuals Amended Final Budget Final Budget 2013-14 vs. 2014-15
Description Staff Amount Staff Amount Staff Amount Amount Percent
Admin / prof tech 58.15 $5,682,384 60.00 $5,742,017 60.00 $5,710,953 $ (31,064) (0.5)%Licensed 3,173.80 177,001,545 3,505.10 181,918,138 3,644.00 190,402,823 8,484,685 4.7 %Support staff 70.46 5,731,576 83.04 5,557,338 81.72 5,707,486 150,148 2.7 %Benefits 70,553,982 77,174,661 80,272,769 3,098,108 4.0 %Purchased services 8,746,722 5,689,633 5,739,633 50,000 0.9 %Supplies 1,094,981 937,509 1,131,734 194,225 20.7 %Property - 10,000 10,000 - - %Other 21,405 1,072,932 1,122,932 50,000 4.7 %
Total 3,302.41 $268,832,595 3,648.14 $278,102,228 3,785.72 $290,098,330 $11,996,102 4.3 %Source: CCSD Budget and Accounting Departments

100 | Clark County School District
Business And Finance Division
Budget Units Budget Units
050 Chief Financial Officer052 Budget Department 011 Graphic Arts Center060 Accounting Department 070 Purchasing and Warehousing650 Facilities and Bond Fund Management 767 Risk Management636 Real Property Management 020 Capital Program Office593 Demographics, Zoning, and
Geographic Information Systems574 Inspection Services
Chief Financial Officer
Budget Department
Accounting Department
Facilities and Bond Fund Financial Management1
Demographics, Zoning, and Geographic Information Systems
Real Property Management
Graphic Arts Center1
Purchasing And Warehousing
Risk Management1
1 Described in Other Governmental and Proprietary Funds Sub-Section.
Capital Program Office
Inspection Services

Fina
ncia
l Sec
tion
1012014-15 Comprehensive Annual Budget Report |
Business And Finance Division
Services:
The Chief Financial Officer (CFO) is responsible for all financial operations of the District. The financial operations of the District include all bond financing, budgeting, and financial reporting activities. The Division acts as a liaison with State elected and other officials in all matters regarding State-wide school finances, appropriations and tax policy, as well as providing testimony on District finances during sessions of the Nevada Legislature.
The cost centers comprising the Business and Finance Division overview are the following:
050 Chief Financial Officer052 Budget Department060 Accounting Department650 Facilities and Bond Fund Management (Capital Funds)593 Demographics, Zoning, and Geographic Information Systems636 Real Property Management011 Graphic Arts Center (Internal Service Fund)070 Purchasing and Warehousing767 Risk Management (Internal Service Fund)
The Budget Department, Cost Center Group 052, is responsible for the preparation and processing of all transactions related to budget planning as well as the establishment, execution, maintenance, and monitoring of budgetary allotments and outcomes. Based upon direction by the Board, the District’s budget is established through the presentation of a recommended budget by staff, discussion and analysis of the merits of alternatives and options through the Board, and distribution of the approved budget allotments to the operating divisions of the District. The Department provides financial information as requested by the media, legislators, union representatives, other governing bodies, the Board, the Superintendent, and the CFO. The Department’s staff assists schools and departments in working within their individual budgets and developing methods of budgetary allotments for future years.
The Accounting Department, Cost Center Group 060, is organized along six functional lines, which include General Accounting, Accounts Payable, Cash and Investment Management, Accounting Systems, Payroll, and Employee Benefits. These areas perform various duties, including maintaining the District’s accounting software package, monitoring and reconciling the District’s purchasing card program, processing payments to over 13,000 vendors, servicing both the General and Bond Proceed Investment Portfolios, preparing the Comprehensive Annual Financial Report (CAFR), producing and distributing bi-weekly and semi-monthly payrolls for over 38,000 employees, and administering all benefit and related payroll deductions, including tax-deferred 403(b) and 457 plans for District employees.
Fiscal Year 2013-14 Accomplishments:• Provided periodic reports and attended meetings with
individual committee members to provide fiscal reporting of the 1998 Capital Improvement Program (CIP) progress to the Debt Management Commission, the Bond Oversight Committee, the Oversight Panel for School Facilities, and others involved in the District’s issuance of debt
• Earned the Distinguished Budget Presentation Award from the Government Finance Officers Association (GFOA) for the 21st consecutive year
• Earned the Meritorious Budget Award from the Association of School Business Officials (ASBO)
• Earned the Certificate of Achievement for Excellence in Financial Reporting from the GFOA and the Certificate of Excellence award from ASBO for the 2012-13 Comprehensive Annual Financial Report (CAFR)
• Prepared and submitted all Nevada Department of Education as well as other State of Nevada reporting requirements within requested deadlines
Fiscal Year 2014-15 Objectives:• Continue to provide fiscal reporting of school construction
program progress to the Debt Management Commission, the Bond Oversight Committee, the Oversight Panel for School Facilities, and others
• Prepare a 2014-15 Comprehensive Annual Budget Report that meets the GFOA criteria to earn a Distinguished Budget Presentation Award
• Prepare a 2014-15 Comprehensive Annual Financial Report (CAFR) that qualifies for GFOA’s Certificate of Achievement for Excellence in Financial Reporting
• Conduct work sessions to provide budgetary updates and seek input from members of the Board, administration, and community

102 | Clark County School District
Fiscal Year 2014-15 Objectives:• Continue to monitor and evaluate impacts on space at
all elementary schools to accommodate lower student-teacher class-sizes for school year 2014-15
• Continue to develop and maintain a comprehensive database to monitor residential developments and analyze how they impact current and future student enrollments
• Oversee, manage, and promote the open enrollment applicant process
• Continue to build and maintain a comprehensive address validation file for Infinite Campus and provide daily support to schools
• GIS team members to provide support to Local Emergency Planning Commission (LEPC) in helping to create a centralized emergency response data set
Demographics, Zoning, and Geographic Information SystemsPerformance Measures 2011-12 2012-13 2013-14Projected Number of Students 309,480 307,574 312,782Final Number of Students Enrolled 308,377 311,218 314,598Variance From Projection (0.4)% 1.18 % 0.58 %
Purchasing and Warehousing Department, Cost Center Group 070, oversees the functions of District-wide purchasing, warehousing, mail distribution, equipment/furniture standards, graphic arts, design and production, and supply chain management (PWMG).
The Purchasing Department procures equipment, supplies, and services for the District in accordance with the Nevada Revised Statutes (NRS) and District policies. The Department processes over 50,000 purchase orders each year in excess of $500 million. Competitive activities are issued each year for expenditures exceeding $50,000 in accordance with NRS 332. The Department is also responsible for new construction equipment and furniture standards, and placement of all furniture and equipment in new construction projects, portables, additions, and in areas with increased enrollment and new special education classes. The Department manages the supplier outreach program, equipment replacement programs, Connex clean-up program, professional services agreements, consultant contracts, and satellite purchasing operations in the Maintenance, Food Service, and Transportation Departments.
FinancePerformance Measures 2011-12 2012-13 2013-14Fitch Bond Rating1 AA- A AMoody’s Bond Rating1 Aa2 A1 A1Standard and Poor’s Bond Rating1 AA- AA- AA-A/P Invoices Processed 113,526 112,000 115,000Number of Purchasing Card Transactions 125,801 119,062 125,000Amount of Purchasing Card Transactions $35,179,826 $32,576,562 $35,300,000Received GFOA awards for Comprehensive Annual Budget Report and CAFR Yes Yes YesTentative Budget Adopted 4/6/11 4/11/12 4/3/13Final Budget Adopted 5/18/11 5/16/12 5/15/13Amended Final Budget Adopted 12/8/11 12/13/12 12/12/131 The District was the first Nevada school district to be rated in the AA category from all three rating agencies.
The Demographics, Zoning, and Geographic Information Systems (DZG), Cost Center Group 593, consists of three sections that provide student enrollment projections, attendance zone recommendations, building utilization studies, school capacity calculations, and space analysis for educational programs. It evaluates the District’s desegregation plan and recommends boundary adjustments, school choice options and programs to promote student diversity throughout the District; allocates the use of and coordinates the relocation of portable classrooms; manages and operates the geographic information system (GIS) and computerized zoning; evaluates student enrollments and tracks demographic trends; develops maps identifying school locations, attendance zones, future school locations, region and Board of Trustee boundaries; and coordinates student safety routes to and from school. In addition, the staff facilitates the activities of the Attendance Zone Advisory Commission (AZAC).
Fiscal Year 2013-14 Accomplishments:• Developed the concept of 22 Strategic Planning Areas
(SPAs) as the initial step in a long term master plan to monitor enrollment trends, space requirements, and community needs in order to provide targeted planning within each SPA
• Developed recommendations for zone adjustments that provided immediate relief to overcrowded northwest schools
• Analyzed and evaluated school needs to assist in recommending alternative calendars, future building additions, and rezoning options
• Identified schools with available seats to promote and expand CTE classes, open enrollment, and magnet options
• Built detailed GIS data files that include apartment numbers for inclusion in Infinite Campus address validation file that allows for more accurate addressing

Fina
ncia
l Sec
tion
1032014-15 Comprehensive Annual Budget Report |
Fiscal Year 2014-15 Objectives:• Begin transition to 3rd generation FOSS kits• Locate possible alternative locations for FOSS subscription
program operations• Reevaluate staffing levels to better meet customer
requirements• Cross train staff in all facets of warehouse operations• Update department processes and training documents
Warehousing SectionPerformance Measures 2011-12 2012-13 2013-14Number of Pickups and Returns 2,876 1,578 2,281Classes using FOSS Subscription - 1,680 2,176Cost Savings/Avoidance - $255,000 $503,979
The Mail Services Center, Cost Center Group 076, The The Mail Services Center offers intra-district delivery and pickup services to all schools and departments within the District. Eleven delivery trucks service over 500 locations. The Center acts as the centralized liaison between the District and United States Postal Service (USPS), insuring the lowest possible cost on mailings.
Fiscal Year 2013-14 Accomplishments:• Upgraded mail machines to ensure continued on site
capability and long term support• Implemented new metering process for “flats” resulting in a
$.10 per piece cost reduction• Cross trained warehouse and mail services personnel to
further consolidate operations• Completed 100 percent of all scheduled mail routes/stops• Completed Mail Services move to warehouse location
Fiscal Year 2013-14 Accomplishments:• Expanded vendor intake and outreach process• Initiated SAP SRM 7.02 upgrade• Offered eight vendor open houses • Assisted with the creation of District standard lists for
intervention, supplemental, and ELL programs• Completed contracts with wraparound service providers to
standardize pricing and establish expectations• Received NPI’s Achievement in Excellence in Procurement
Award
Fiscal Year 2014-15 Objectives:• Implement performance contracting as a cost effective
energy savings program• Complete SAP SRM 7.02 upgrade and mobility
implementation on time (July 2015) and within budget• Update department processes and training documents• Continue to grow Outreach and Intake efforts• Develop a mechanism for capturing and reporting Emerging
Small Business competitive activity and utilization • Work with Satellite operations to improve efficiencies and
services
Purchasing and Warehousing DepartmentPerformance Measures 2011-12 2012-13 2013-14Dollar Value of Purchase Orders (not including facilities projects) $415 Mil $445 Mil $516 MilNumber of Purchase Orders Processed 42,839 51,868 53,087Suppliers Average Delivery Time 25 Days 28 Days 29 DaysNumber of Bids Processed 74 65 77Number of Active Suppliers 5,664 6,177 6,684Number of On-Line Requisitions 110,753 112,563 117,098Cost Savings/Avoidance $7.8 Mil $8.3 Mil $9.3 Mil
The Warehousing Section, Cost Center Group 074, The Warehousing Section receives, stores, delivers, transfers, and picks up supplies, furniture, equipment, and books throughout the District. The distribution section of the warehouse is comprised of a fleet of seven trucks, including five 2 ½ ton trucks and two tractor trailers. The Department also manages the District’s surplus equipment, FOSS science replenishment program, and recycles computers, printers, plastic, cardboard, toner cartridges, paper, metals, and other items.
Fiscal Year 2013-14 Accomplishments:• Outfitted 80 kindergarten classrooms as a result of the full
day kindergarten initiative • Cross trained warehouse and mail services personnel to
further consolidate operations• Contracted with third party logistics providers to assist with
peak period demand• Competitively bid recycling services to establish lowest
cost providers• Utilized nationwide surplus disposition system

104 | Clark County School District
Fiscal Year 2014-15 Objectives:• Continue functional integration with warehouse• Reevaluate staffing levels to better meet customer
requirements• Continue to improve internal and external communications• Update department processes and training documents• Continue to assist graphic arts and warehouse during peak
times
Mail Services CenterPerformance Measures 2011-12 2012-13 2013-14Number of Mail Stops 482 502 551Pieces of Mail Posted 3,482,240 2,503,326 2,946,503Average Cost of Mail Piece Posted 0.320 0.365 0.365Average Cost of US First Class Rate 0.37 0.38 0.39Mail Services Cost Avoidance $188,000 $205,000 $265,000
Business and Finance Division AllocationsFor Fiscal Years 2012-13 Through 2014-15
2012-13 2013-14 2014-15Actuals Amended Final Budget Final Budget 2013-14 vs. 2014-15
Description Staff Amount Staff Amount Staff Amount Amount Percent
Admin / prof tech 42.75 $ 3,793,267 45.75 $ 4,207,103 45.75 $ 4,241,316 $ 34,213 0.8 %Support staff 139.21 6,949,060 156.54 8,354,690 161.76 8,631,678 276,988 3.3 %Benefits 3,886,294 4,827,851 4,954,514 126,663 2.6 %Purchased services 4,038,002 4,571,788 5,005,688 433,900 9.5 %Supplies 507,006 280,451 285,251 4,800 1.7 %Property 13,836 - - - - %Other 98,483 27,010 75,860 48,850 100.0 %
Total 181.96 $19,285,947 202.29 $22,268,893 207.51 $23,194,307 $925,414 4.2%Source: CCSD Budget and Accounting Departments
Districtwide Expenditures
Services:
This cost center provides for those costs which are not necessarily assigned to individual schools or departments. Projects in this unit are typically to appropriate funds that are distributed Districtwide or to accumulate reserves or deferred appropriations.
The 2014-15 Final Budget development for this unit involves the following areas.
Salary line items include:• Extra duty payments for building rental activities• Salary schedule payments for mid-year reclassifications of
support and administrative staff
Benefits include:• Funding for potential shortfall of retiree health payments
and vacations• Funding for unused sick leave payments• Funding for CCEA career plan benefit payments
Purchased Services include:• $6 million for waste removal services• $5 million for property and liability insurance• Deferred purchased services allocations
Supplies include:• $4 million for technology related upgrades• Deferred instructional supplies• Field trip clearing account. This account reflects a credit
appropriation of $5.5 million. Schools are charged for field trips by the Transportation Department. The offsetting credit is reported in this clearing account.
Property includes:• $34 million for the purchase of replacement and growth
needs of buses• Vehicle needs for the District• Equipment requests from all administrative units Ending fund balance categories include:• $5 million non-spendable for inventories, $15.8 million
assigned for categorical indirect cost reimbursement and school projects, and $31.9 million as an unassigned ending fund balance.

Fina
ncia
l Sec
tion
1052014-15 Comprehensive Annual Budget Report |
Districtwide Expenditures And School AllocationsFor Fiscal Years 2012-13 Through 2014-15
2012-13 2013-14 2014-15Actuals Amended Final Budget Final Budget 2013-14 vs. 2014-15
Description Staff Amount Staff Amount Staff Amount Amount Percent
Admin / prof tech 1.00 $ 322,394 2.00 $ 163,268 2.00 $ 166,772 $3,504 2.1 %Licensed 1.32 2,767,306 - 1,043,020 - 1,130,650 87,630 8.4 %Support staff 14.48 1,401,362 3.91 1,688,562 3.91 1,688,562 - - %Benefits 1,393,157 - 1,860,154 - 5,369,629 3,509,475 100.0 %Purchased services 19,115,554 - 16,123,465 - 15,233,465 (890,000) (5.5)%Supplies 49,820,216 - 52,154,225 - 43,916,594 (8,237,631) (15.8)%Property 10,280,948 - 43,590,485 - 38,678,500 (4,911,985) (11.3)%Other 93,578,596 - 67,394,500 - 73,574,500 6,180,000 9.2 %
Total 16.80 $178,679,533 5.91 $184,017,679 5.91 $179,758,672 $(4,259,007) (2.3)%Source: CCSD Budget and Accounting Departments
School Allocations Districtwide
Services
This cost center reflects amounts for instructional supplies and equipment for all schools in the District. Following approval of the total appropriation levels in this budget for all schools combined, the aggregate amounts are then distributed to schools based upon formulas tied to enrollments. Those formulas are detailed in the Allocation of Personnel and Supplies Section of this document.
Salaries and Benefits include:• Expenditures in school-based staff development programs
Purchased Services include:• Printing/binding services, communication charges, postage
and other miscellaneous service expenditures
Supplies include:• Expenditures for athletic supplies, textbook appropriations
and related expenditures, custodial supplies, special education supplies, and related supplies for various magnet programs
Property includes:• Major, minor, and computer equipment expenditures
associated with instruction and vocational education
Other includes:• Assigned allowances for maximum school carryover (See
Budget Policy/Budget Administration – Schools)

106 | Clark County School District
Human Resources Unit
Budget Units Budget Units
031 Chief Human Resources Officer032 Human Capital Management 042 Elementary Licensed Personnel033 Recruitment and Development 043 Secondary Licensed Personnel040 Administrative Personnel and
School Site Administrators046 School-Based Support Personnel
Chief Human Resources Officer
Elementary Licensed Personnel
Administrative Personnel And School Site Administrators
Secondary Licensed Personnel
Human Capital Management
Recruitment and Development
School-Based Support Personnel

Fina
ncia
l Sec
tion
1072014-15 Comprehensive Annual Budget Report |
Fiscal Year 2013-14 Accomplishments:• Finalized development and implementation of the REACH
pilot program which focused on the following:1. Methods by which a “highly effective” teacher and a
“highly effective” principal can maximize their impact on the most students and/or the teacher quality system at large
2. Professional development and organizational needs required to implement such a program
3. Identification of measurable outcomes in the areas of teacher quality, teacher impact on student achievement, and return on investment for teacher costs
• Implemented new communication and data collection methods for novice teachers which did the following:1. Utilized technology methods to both train and connect
novice teachers with other colleagues and the community in general
2. Identified the reasons behind novice teacher separations, to include information with regard to differential retention—whether or not the principal had encouraged and/or been in support of the separation due to performance reasons
• Implemented technology-based tools to utilize in identifying, recruiting, and assessing leadership and/or teaching potential, to include implementation of the following:1. SearchSoft on-line applicant tracking system2. Internet-based tools for recruitment and identification
of quality applicants, as well as analysis of return on investment for all recruitment efforts
3. A revised selection model for all groups which takes into consideration input from the field and which appropriately weights prioritized criteria
Fiscal Year 2014-15 Objectives:• Develop and implement project plans to accomplish
goals in the below focus areas, which tie directly to the Superintendent’s Pledge of Achievement
• Transactional process improvement for efficiency and accuracy in all areas.
• Recruitment, selection, and placement for all employee groups, to include:1. Increased use of webinars and personalized contact with
students at colleges and universities2. Facilitation of virtual “job fairs” for principals to have face
to face contact with applicants3. Targeted activities focused on increasing the diversity of
staff particularly in the teaching and administration areas• Pipeline expansion and development, to include:
1. Targeted outreach and recruitment of candidates who have Bachelor’s degrees and are seeking teaching careers
2. Use of technology to expand the geographical recruitment areas for Alternative Routes to Licensure candidates
• Induction• Retention to include:
1. Differential retention for highest potential novice teachers2. Expansion of the REACH program into more schools
Human Resources Unit
Mission:
The mission of the Human Resources Unit is to provide excellent service to our constituents, and to implement best practices for recruitment, development, and evaluation which will lead to the improvement of student achievement.
Services:
The Human Resources Unit is responsible for recruiting, hiring, placing, and retaining the District’s licensed staff, support staff, police, and administrative employees, to include the staffing of all elementary, secondary, specialized, and alternative schools in addition to all other departments in the organization. The Unit is organized so that functions are aligned to address customer service and effectiveness in each of the areas of responsibility.
The Cost Centers comprising the Unit overview are the following:
031 Chief Human Resources Officer032 Human Capital Management033 Recruitment and Development040 School Site Administrators042 Elementary Licensed Personnel043 Secondary Licensed Personnel046 School-Based Support Personnel
Cost Centers include the operations of the offices of the Chief Human Resources Officer, Human Capital Management, and Recruitment and Development, and the directors assigned to supervise recruitment and selection, staffing, evaluation, and school support, employee onboarding and development activities, alternative routes to licensure, and substitute services.

108 | Clark County School District
District-Wide Staffing Allocations
The District-wide staffing allocations represent the appropriations for staffing and employee benefits under the control of the Division at the school site level as contrasted with the appropriations assigned for the Division’s administrative operations.
District-wide staffing allocations are maintained in four cost center groups separated by employee groups with exception to the support and school police employee groups which are maintained combined in the support cost center group. Licensed staffing is separated into two cost centers delineating between elementary and secondary education.
Administrative Personnel and School Site Administrators, Cost Center Group 040, provides accounting for site allocations of administrative personnel at the all grade levels that includes principals, vice-principals, deans, and other site administrative personnel.
District-Wide Staffing AllocationsFor Fiscal Years 2012-13 Through 2014-15
2012-13 2013-14 2014-15Actuals Amended Final Budget Final Budget 2013-14 vs. 2014-15
Description Staff Amount Staff Amount Staff Amount Amount Percent
Admin / Prof Tech 643.50 $ 56,730,728 614.00 $ 58,773,215 638.00 $ 60,384,698 $ 1,611,483 2.7 %Licensed 9,105.20 519,730,884 8,995.29 510,547,657 9,116.18 506,727,845 (3,819,812) (0.7)%Support Staff 2,682.46 100,712,287 2,965.95 106,230,807 3,098.96 110,457,341 4,226,534 4.0 %Benefits 264,292,170 273,535,702 274,593,705 1,058,003 0.4 %Purchased services - - 5,150 5,150 100.0 %Supplies - - 1,000 1,000 100.0 %
Total 12,431.16 $941,466,069 12,575.24 $949,087,381 12,853.14 $952,169,739 $ 3,082,358 0.3 %Source: CCSD Budget and Accounting Departments
Elementary Licensed Personnel, Cost Center Group 042, provides accounting for site allocations of licensed personnel at the elementary grade levels that includes teachers, librarians, specialists, and other certified personnel.
Secondary Licensed Personnel, Cost Center Group 043, provides accounting for site allocations of licensed personnel at the secondary grade levels that includes teachers, librarians, and other certified personnel.
School Based Support Personnel, Cost Center Group 046, provides accounting for site allocations of support staff at all grade levels that includes secretaries, office managers, classroom aides, and other support personnel.
The related allocation ratios are detailed in the Informational Section of this document.
Human Resources Administrative Unit AllocationsFor Fiscal Years 2012-13 Through 2014-15
2012-13 2013-14 2014-15Actuals Amended Final Budget Final Budget 2013-14 vs. 2014-15
Description Staff Amount Staff Amount Staff Amount Amount Percent
Admin / Prof Tech 19.00 $ 1,998,845 22.00 $ 2,297,051 22.00 $ 2,249,831 $ (47,220) (2.1)%Licensed 1.00 102,168 1.00 174,029 1.00 174,030 1 - %Support Staff 126.00 6,064,536 140.00 6,723,918 140.00 6,637,588 (86,330) (1.3)%Benefits 2,962,818 3,589,403 3,558,000 (31,403) (0.9)%Purchased Services 1,127,162 1,203,817 1,362,317 158,500 13.2 %Supplies 434,433 340,300 352,300 12,000 3.5 %Other 16,455 80,500 80,500 - - %
Total 146.00 $12,706,417 163.00 $14,409,018 163.00 $14,414,566 $ 5,548 - %Source: CCSD Budget and Accounting Departments

Fina
ncia
l Sec
tion
1092014-15 Comprehensive Annual Budget Report |
Innovative Teaching and Learning Unit
Budget Units Budget Units
056 Chief Innovation and Productivity Officer 063 Technical Resources054 Networking Services 160 Innovative Learning Environments055 Assessment, Accountability, Research,
and School Improvement190 Telecommunications Services
057 User Support and School Technology Deployment Services
009 Employee Business Training
058 Central Information Services 633 Nevada Learning Academy at CCSD
Chief Innovation and Productivity Officer
Networking Services
User Support Services
Central Information Services
Telecommunications Services
Technical Resources Employee Business Training
Nevada Learning Academy at CCSD
Innovative Learning Environments
Assessment, Accountability, Research, and School Improvement

110 | Clark County School District
User Support Services (USS), Cost Center Group 057, integrates technology into schools as well as provides help desk support for all personal computers (PCs) and peripherals, network-related issues, and District-wide software applications. USS is divided into four operational units: the Call Center provides hardware and software support for employees; the Central Desktop Management team monitors the health of the computers and uses remote tools to support and manage District-wide software installations; Field Services provides on-site repair and supports video conferencing activities throughout the District; and School-Based Support Team provides support for all school-based technology, fixed or mobile. USS develops technology tools to provide remote services, reducing travel and paperwork requirements.
Central Information Services (CIS), Cost Center Group 058, provides enterprise applications, supporting systems and database architecture, development, and operations for educational and business functions such as student information system (SIS), universal screeners, web-based curriculum and assessments, credit retrieval, individualized education programs (IEP), payroll, licensed personnel position allocation and control, budget, finance, accounting, and purchasing and warehousing. CIS consists of Central Information, Student and Human Resources Services, and Central Information Business and Finance Services.
Technical Resources, Cost Center Group 063, provides electronic communications, application development services, professional development, training materials, InterActTM, and Internet services (including Internet access, Web development/hosting, and Web content filtering).
Mission
The Innovative Teaching and Learning Unit provide technology-related leadership and support to enhance the District’s ability to meet its goals.
Services:
The Unit provides leadership for the newly created Nevada Learning Academy at CCSD. The Unit also supports the District’s central information systems (e.g., payroll, student accounting, human resources), parent communication system, and professional development tracking system as well as deploys and maintains local area networks (LAN) and wide area networks (WAN) throughout the District. Additionally, it maintains all desktop computers and related equipment; provides technology and business systems training for all employees; and advances blended learning opportunities for all students. Due to budgetary restrictions, the Unit has been compelled to decrease certain services. An increase in service requests response and resolution time has caused a negative impact on schools and departments.
To meet these requirements, the Unit is organized into the following cost center groups:
056 Chief Innovation & Productivity Officer054 Networking Services055 Assessment, Accountability, Research and School Improvement057 User Support and School Technology Deployment Services058 Central Information System009 Employee Business Training063 Technical Resources160 Innovative Learning Environments190 Telecommunication Services633 Nevada Learning Academy at CCSD
Chief Innovation & Productivity Officer, Cost Center Group 056, provides oversight and direction for the proliferation of the online and blended learning models, the deployment of the newly acquired Student Information System (Infinite Campus) and Learning Management System, the design and execution of employee business and technology training, as well as development and implementation of the District’s technology plan and key initiatives.
Networking Services (NS), Cost Center Group 054, provides networking support to the District. NS is comprised of three work units including: Planning Unit provides consulting, detailed layout and inspection for IT elements of school construction activities; Network Unit provides and supports WAN and LAN connectivity; and Server Unit manages school file and print servers.
Innovative Teaching and Learning Unit

Fina
ncia
l Sec
tion
1112014-15 Comprehensive Annual Budget Report |
Telecommunication Services, Cost Center Group 190, provides engineering, installation, and maintenance of telephone communication systems.
Employee Business Training, Cost Center Group 009, provides training and instructional design services to all District employees, schools, and departments. EBT provides essential enterprise application training, including Payroll (OARS), Budget and Procurement (SAP), Student Information Systems (SIS), Human Resources Management Systems (HRMS), and productivity software (Microsoft Office, Adobe Acrobat, InterAct). EBT creates and produces eLearning modules upon demand for all areas of the District. EBT also provides training and support for the District’s Pathlore LMS, which calendars professional development, hosts online professional development, and tracks compliance training in the District.
Nevada Learning Academy at CCSD, Cost Center Group 633, functions as a fully accredited, credit-bearing distance education high school which offers full-time and part-time students instruction in a nontraditional format through Internet-based classes. Students work independently on coursework as part of the District-wide vision to transform instruction through innovative learning environments through online and blended learning, teacher-led, semester-based classes using digital curriculum and electronic textbooks are used, improving effectiveness and efficiency. The Academy supports all schools in implementing choice and innovation in instruction.
Fiscal Year 2013-14 Accomplishments:• Deployment began of a new, large-scale Student
Information System (SIS), Infinite Campus. Schools began development of their FY14-15 master schedules and the Unit provided training for teachers and administrators on the use of the new system using online materials, face-to-face sessions, and open labs.
• Modified the Human Resources Management System (HRMS), under the direction of the Great Teachers Great Leaders project led by the Human Resources Division, to support new teacher recruitment and hiring processes
• Continued implementation of the Oracle Identity Management (IdM) System to enable advanced provisioning of accounts for new employees and integrate authentication for new systems into a single data repository
• Implemented, in conjunction with the Curriculum and Professional Development (CPD) Division, a three-year project to convert all Educational Computing Strategist (ECS) positions to School-based Technicians and Digital Coaches
• Expanded the E3 (Engage, Empower, Explore) project to include four additional Title I middle schools by supplying equipment, infrastructure, and professional development to provide a 1:1 learning environment for a total of nine middle schools and approximately 13,000 students and 500 faculty
• Designed, created, and produced 27 new online eLearning modules (19 specifically released for the Infinite Campus SIS implementation)
• Delivered training to more than 38,000 employees; over 30,000 of which received learning through online delivery
• Upgraded more than 65,000 workstations to Windows 7• Increased Internet bandwidth and capacity to
accommodate online learning and online testing that will begin in the 2014-15 school year
• Provided professional development to over 1,500 teachers and administrators through online and blended learning professional development courses
• Served over 900 full-time and 4,300 part-time students through enrollment at Virtual High School and the Academy for Individualized Study during the 2013-14 school year and over 8,900 students during the 2013 summer term
Fiscal Year 2014-15 Objectives:• Complete implementation of the Student Information
System (SIS) to the Infinite Campus replacement project, and produce a project review document to analyze lessons learned
• Develop and release a Request for Proposal (RFP) to obtain an enterprise Human Capital Management (HCM) system to replace legacy human resource and payroll mainframe systems
• Increase the number of online classes produced next year by 50% and a minimum of 10 new eLearning modules for Infinite Campus
• Recruit, hire, and train 58 qualified school-based computer technicians for Phase 2 of the Technology Integration Support Model
• Expand the E3 (Engage, Empower, Explore) project to include three additional Title I middle schools by supplying equipment, infrastructure, and professional development to provide a 1:1 learning environment

112 | Clark County School District
Fiscal Year 2013-14 Objectives - Continued:• Continue the modernization of systems and infrastructure
supporting enterprise applications and services (e.g., operating systems, databases, storage area networks, backup and recovery services, scheduling and management consoles, security, and operations)
• Virtual High School and the Academy for Individualized Study High School will merge to form the Nevada Learning Academy at CCSD while simultaneously expanding to include grades 6-12, increasing pathways to graduation
• Serve over 1,000 full-time and 4,500 part-time students at the Nevada Learning Academy at CCSD
TechnologyPerformance Measures 2011-12 2012-13 2013-14PC/Network Repair Tickets Generated 32,571 43,707 44,320Business Application Tickets Generated 37,469 37,854 44,984Refreshment Computers 6,327 742 8,235Telephones Supported 33,503 33,825 34,051eLearning Modules 1,048 4,189 30,784Sites with E911 329 331 334Report Cards Printed 657,553 685,342 679,667ParentLink Parent Logins 6,844,831 7,799,710 9,460,120Phone Messages Delivered Via ParentLink 16,800,466 26,171,804 27,793,434InterAct Users (approximately) 45,000 45,000 45,000District Web Site Page Views 28.5 mil 31.4 mil 34.02 milFiltered Internet Pages Served 1.86 bil 1.98 bil 2.22 bilEmail Messages Filtered for SPAM/VIRUS 115 mil 125 mil 208 mil
Accountability and Research, Cost Center Group RD055, focuses on student and school performance measures to transform and report information in meaningful and engaging ways to all stakeholders. The Accountability team also performs certain functions mandated by the legislature including the production and dissemination of the District and school accountability reports, the Nevada School Performance Framework, and other data supported initiatives. The team supports the analysis and reporting of data related to the Nevada Growth Model and State summative testing. The Research team provides policy and professional practice studies. Additionally, the Research team administers District surveys, manages external research activities, and builds research capacity and infrastructure for the District. The Accountability and Research Department assists in ensuring the integrity and validity of data in the student information system. Assessment, Cost Center Group D055, is responsible for administering and reporting results for all testing programs mandated by the State and reporting results for all District-wide testing programs. The Assessment Department also facilitates annual training by the Nevada Department of Education personnel for site administrators and site testing coordinators to ensure test security and appropriate test
preparation and administration; and provides assistance and training to school sites, performance zones, departments, and divisions within the District regarding the proper interpretation and use of assessment data, the early identification of at-risk students and schools, the evaluation of special programs, the creation and implementation of balanced, quality assessment programs, and the use of assessment results to guide instruction. The Department ensures a balanced assessment system in the District including the sharing of best practices through training and system support. The Classroom Assessment for Student Learning initiative is also supported by the Assessment Department with District-wide professional development opportunities for schools and instructional coaches. Systems supported by the Assessment Department also include the Student Information System (SIS), the Discovery Education Assessment System, and the Smarter Balanced Assessment Consortium (SBAC) System. The Department provides oversight for data collection/verification and assistance in the development of District, division, and/or site-based assessments. The Department also created, designed, and continues to provide training for the implementation of the Elementary Standards-Based Report Card and Grading Best Practices. These guides provide all educators with the tools needed to track student mastery levels on the Nevada Academic Content Standards (NVACS) as it pertains to best practices in grading and assessment.
Student Record Services (SRS), Cost Center Group A055, provides ongoing supervision of the District’s enrollment and attendance systems to assure accuracy of enrollment counts, which are required to obtain State funding and federal impact aid. In addition to reporting for financial reasons, SRS provides student-related information for dropout and demographic reports, monitors the enrollment and attendance for non-resident students, and assists school registrars and attendance clerks in managing their site-level student accounting responsibilities. SRS is the central repository for student records and issues transcripts on behalf of students for purposes of college entrance and job applications, and it processes confidential records for those students receiving assistance from the Student Services Division. SRS is responsible for maintaining and processing student records in addition to processing records requests in a timely manner.
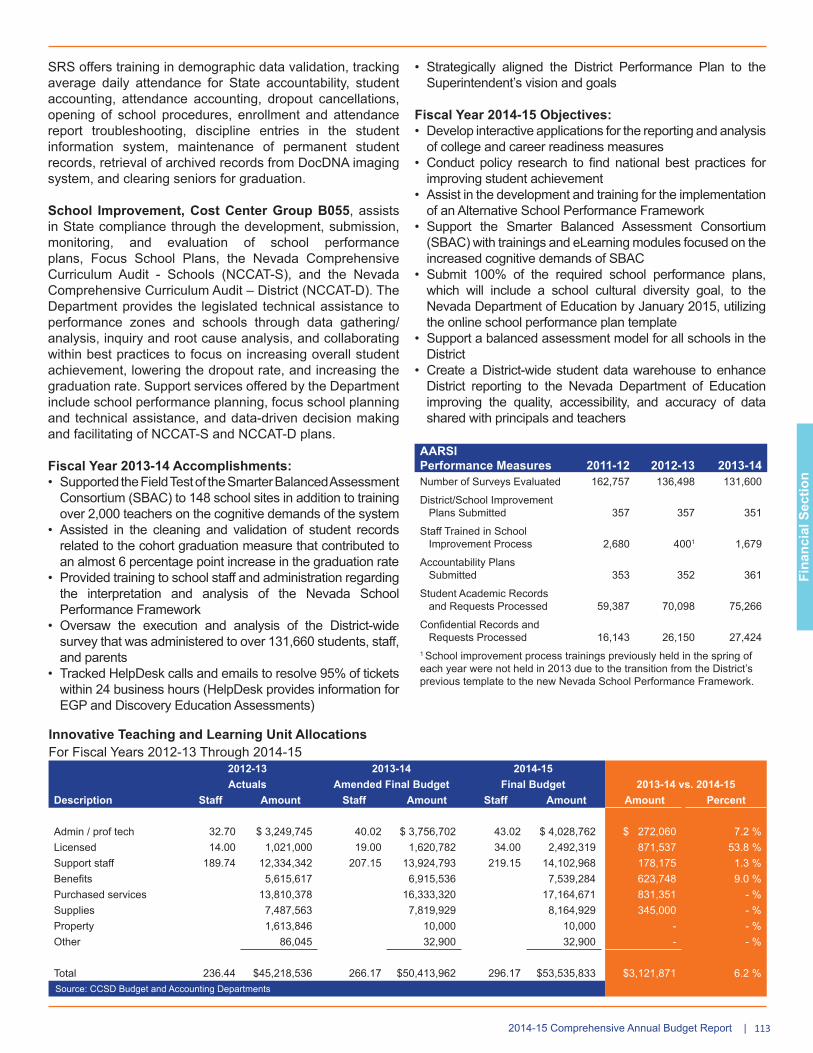
Fina
ncia
l Sec
tion
1132014-15 Comprehensive Annual Budget Report |
Innovative Teaching and Learning Unit AllocationsFor Fiscal Years 2012-13 Through 2014-15
2012-13 2013-14 2014-15Actuals Amended Final Budget Final Budget 2013-14 vs. 2014-15
Description Staff Amount Staff Amount Staff Amount Amount Percent
Admin / prof tech 32.70 $ 3,249,745 40.02 $ 3,756,702 43.02 $ 4,028,762 $ 272,060 7.2 %Licensed 14.00 1,021,000 19.00 1,620,782 34.00 2,492,319 871,537 53.8 %Support staff 189.74 12,334,342 207.15 13,924,793 219.15 14,102,968 178,175 1.3 %Benefits 5,615,617 6,915,536 7,539,284 623,748 9.0 %Purchased services 13,810,378 16,333,320 17,164,671 831,351 - %Supplies 7,487,563 7,819,929 8,164,929 345,000 - %Property 1,613,846 10,000 10,000 - - %Other 86,045 32,900 32,900 - - %
Total 236.44 $45,218,536 266.17 $50,413,962 296.17 $53,535,833 $3,121,871 6.2 %Source: CCSD Budget and Accounting Departments
SRS offers training in demographic data validation, tracking average daily attendance for State accountability, student accounting, attendance accounting, dropout cancellations, opening of school procedures, enrollment and attendance report troubleshooting, discipline entries in the student information system, maintenance of permanent student records, retrieval of archived records from DocDNA imaging system, and clearing seniors for graduation.
School Improvement, Cost Center Group B055, assists in State compliance through the development, submission, monitoring, and evaluation of school performance plans, Focus School Plans, the Nevada Comprehensive Curriculum Audit - Schools (NCCAT-S), and the Nevada Comprehensive Curriculum Audit – District (NCCAT-D). The Department provides the legislated technical assistance to performance zones and schools through data gathering/analysis, inquiry and root cause analysis, and collaborating within best practices to focus on increasing overall student achievement, lowering the dropout rate, and increasing the graduation rate. Support services offered by the Department include school performance planning, focus school planning and technical assistance, and data-driven decision making and facilitating of NCCAT-S and NCCAT-D plans.
Fiscal Year 2013-14 Accomplishments:• Supported the Field Test of the Smarter Balanced Assessment
Consortium (SBAC) to 148 school sites in addition to training over 2,000 teachers on the cognitive demands of the system
• Assisted in the cleaning and validation of student records related to the cohort graduation measure that contributed to an almost 6 percentage point increase in the graduation rate
• Provided training to school staff and administration regarding the interpretation and analysis of the Nevada School Performance Framework
• Oversaw the execution and analysis of the District-wide survey that was administered to over 131,660 students, staff, and parents
• Tracked HelpDesk calls and emails to resolve 95% of tickets within 24 business hours (HelpDesk provides information for EGP and Discovery Education Assessments)
• Strategically aligned the District Performance Plan to the Superintendent’s vision and goals
Fiscal Year 2014-15 Objectives:• Develop interactive applications for the reporting and analysis
of college and career readiness measures• Conduct policy research to find national best practices for
improving student achievement• Assist in the development and training for the implementation
of an Alternative School Performance Framework• Support the Smarter Balanced Assessment Consortium
(SBAC) with trainings and eLearning modules focused on the increased cognitive demands of SBAC
• Submit 100% of the required school performance plans, which will include a school cultural diversity goal, to the Nevada Department of Education by January 2015, utilizing the online school performance plan template
• Support a balanced assessment model for all schools in the District
• Create a District-wide student data warehouse to enhance District reporting to the Nevada Department of Education improving the quality, accessibility, and accuracy of data shared with principals and teachers
AARSIPerformance Measures 2011-12 2012-13 2013-14Number of Surveys Evaluated 162,757 136,498 131,600
District/School Improvement Plans Submitted 357 357 351
Staff Trained in School Improvement Process 2,680 4001 1,679
Accountability Plans Submitted 353 352 361
Student Academic Records and Requests Processed 59,387 70,098 75,266
Confidential Records and Requests Processed 16,143 26,150 27,4241 School improvement process trainings previously held in the spring of each year were not held in 2013 due to the transition from the District’s previous template to the new Nevada School Performance Framework.

114 | Clark County School District
Curriculum and Professional Development Division
Budget Units Budget Units
110 Curriculum and Professional Development 119 Orchestra Program113 Career and Technical Education 662 Secondary Summer School116 Secondary Fine Arts
Curriculum and Professional Development
Career and Technical Education
Secondary Fine Arts Secondary Summer School
Orchestra Program

Fina
ncia
l Sec
tion
1152014-15 Comprehensive Annual Budget Report |
Secondary Fine Arts, Cost Center 116, and the Orchestra Program, Cost Center Group 119, provide a sequential, comprehensive, standards-based curriculum for the music, dance, theater, and visual arts programs in each of the secondary schools and allow for participation in professional development and community outreach opportunities. Through the direction provided by nationally recognized trained and qualified experts and adjudicators, students participating in festivals, honor ensembles, and other organized events are provided with the opportunity to achieve a higher standard of performance. The Orchestra Program also partially funds the year-long, five-tiered Las Vegas Youth Orchestra Program and serves to organize the District’s equivalent credit music and distinguished music scholar programs. Secondary Summer School, Cost Center Group 662, provides support for students to participate in middle school and high school enrichment summer courses, credit retrieval opportunities, and high school tutoring for proficiency to include facilities, personnel, and instructional materials. The Guidance and Counseling Services Department coordinates CPDD summer school programs annually. Together with the summer school coordinator, the Department works with the Assistant Chief Student Achievement Officers in establishing summer school guidelines and identifying summer school sites for the six-week instructional period. Funding for summer school is derived from tuition, which is presently $100 per half-credit.
Curriculum and Professional Development Division
Mission Statement
The Curriculum and Professional Development Division (CPDD) provides leadership and guidance for all stakeholders to increase student achievement through standards-based curricula, professional development, and instructional support.
Services:
The Division is an integral part of the Innovative Teaching and Learning Unit and provides leadership and service in support of the District’s Vision Statement: All students progress in school and graduate prepared to succeed and contribute in a diverse global society. The Division serves 217 elementary schools, 59 middle schools, 49 high schools, 24 alternative schools, 8 special schools, and 7 District-sponsored charter schools located throughout the District.
The Cost Centers comprising the Division are the following:110 Curriculum and Professional Development113 Career and Technical Education116 Secondary Fine Arts119 Orchestra Program662 Secondary Summer School
Curriculum and Professional Development, Cost Center Group 110, reflects the organization of the Division and includes the assistant superintendent; executive director; directors responsible for specific core content areas and programs including mathematics, English language arts, science, and social studies; and curriculum and professional development administrators, project facilitators, and secretarial support necessary for those operations. Additional budget projects also support services including K–12 Library, K–12 Instructional Technology, Elementary Fine Arts, K–12 Foreign Language, K–12 Physical Education, K–12 Health, K–12 Curriculum Engine, K–5 Coaching, and K–12 Guidance and Counseling. Support for secondary education programs, Response to Instruction (RTI), early intervention, and drivers’ education is also reflected in this unit.
Career and Technical Education (CTE), Cost Center Group 113, supports students in developing academic and technical skills necessary to become college and career ready through numerous student leadership activities and work-based learning experiences. CTE staff leads teacher task forces to develop, revise, and align curriculum with Nevada CTE and Nevada Academic Content Standards. Additionally, CTE staff provides professional development for teachers on current technologies and pedagogies.

116 | Clark County School District
Fiscal Year 2013-14 Accomplishments:• Moved forward with the placement of all K–12 curricula into
the Curriculum Engine and use the Engine as a key source for all curriculum documents and resources
• Provided ongoing professional development on the Nevada Academic Content Standards for English language arts and mathematics teachers in grades K-12
• Continued to develop, revise, and refine curricula with Nevada career and technical education Programs of Study and Nevada Academic Content Standards
• Developed professional development, updated resources, provided communications to teachers and administrators, and attended conferences and meetings to prepare for the implementation of the Next Generation Science Standards
• Provided students with support through credit recovery opportunities and through the summer bridge program offered to students transitioning from elementary to middle school and from middle school to high school
• Created a needs-based formula for allocating elementary school counselors to schools
• Conducted the second annual RTI Conference with over 350 participants in grades K-12
• Delivered the Purposeful Planning Summer Literacy Institute for over 500 teachers in grades K-5
• Developed the first annual administrator conference on the Nevada Academic Content Standards and Nevada Educator Performance Framework for over 120 administrators serving grades K-12
Fiscal Year 2014-15 Objectives:• Implement professional development for high school ELA
and mathematics teachers to deepen and expand their content knowledge and to support the implementation of high leverage instructional practices in order to prepare students for success on State End of Course exams
• Implement professional development for elementary teachers to improve science instruction and prepare students and teachers for the Next Generation Science Standards
• Implement professional development for elementary teachers that increases skills in instructional planning aligned to the Nevada Academic Content Standards
• Provide support for summer enrichment, credit recovery, and summer bridge programs to increase the academic achievement of students
• Provide on-site, job-embedded professional development for classroom teachers through instructional coaches
Curriculum and Professional DevelopmentPerformance Measures 2011-12 2012-13 2013-14Professional Development Session – Participants 33,552 48,631 42,120
Students Participating in Fine Arts Festivals 20,269 16,1592 17,469
Ensembles Participating in Fine Arts Festivals 537 4242 457
Students Participating in Orchestra Festivals 7,627 6,1782 6,237
Ensembles Participating in Orchestra Festivals 221 1412 143
Students Enrolled in Secondary Summer School 18,529 14,078 1
1Data Not Available2Decrease in participation attributed to the transfer of responsibility of intermediate festivals to partner organizations
Curriculum And Professional Development Division AllocationsFor Fiscal Years 2012-13 Through 2014-15
2012-13 2013-14 2014-15Actuals Amended Final Budget Final Budget 2013-14 vs. 2014-15
Description Staff Amount Staff Amount Staff Amount Amount Percent
Admin / Prof Tech 19.50 $ 1,964,163 30.50 $ 2,872,942 30.50 $ 2,915,845 $ 42,903 1.5 %Licensed 8.50 1,525,205 26.50 3,873,178 40.50 10,345,172 6,471,994 100.0 %Support Staff 67.20 1,272,498 29.10 1,615,440 29.10 1,757,866 142,426 8.8 %Benefits 1,272,197 2,328,216 3,144,689 816,473 35.1 %Purchased Services 487,077 712,034 1,311,091 599,057 84.1 %Supplies 979,347 3,262,399 4,640,952 1,378,553 42.3 %Property 48,936 - - - - %Other 19,547 12,000 12,000 - - %
Total 95.20 $ 7,568,971 86.10 $14,676,209 100.10 $24,127,615 $9,451,406 64.4 %Source: CCSD Budget and Accounting Departments

Fina
ncia
l Sec
tion
1172014-15 Comprehensive Annual Budget Report |
Vegas PBS
Budget Units
140 Vegas PBS
Vegas PBS
Educational Media
Production
Technical Operations
Programming
Business Management
Development
VolunteerCoordination
Southern Nevada Public Television, Inc.
Promotion
Note: Also described in Other Governmental and Proprietary Funds Sub-Section

118 | Clark County School District
• Coordinating State-wide educational media services targeted to deaf/hard of hearing and blind/ visually impaired students and their families through the Described and Captioned Media Center (DCMC), using television, captioning services, Braille embossing services, a lending library of Braille and audio book companion sets, parental backpacks, curriculum kits for teachers and students, descriptive and captioned DVD and VHS, educational games, study materials and textbooks
• Providing production, duplication, and distribution of administrative training materials, public information, police and human resources updates, student contests, PSA’s, Inside Education, School Matters, and a homework math tutoring program
• Provide, online, broadcast, Stay In School PSAs mentoring, early childhood literacy, ELL, programs and resources through the American Graduate project. The American Graduate project is targeted to raise awareness of the dropout issue while providing resources improving high school graduation rates. Collecting and creating extensive educational program-related and curriculum- based web materials for parents, teachers, and children on VegasPBS.org, VegasPBSParents.org, VegasPBSKids.org, VegasPBSKidsGo.org, and Vegas PBSPlay.org
• Supporting pre-service teachers and Nevada teaching institutions by donating access and providing orientation training for effective use of video on- demand electronic media materials
• Creating video training content to support District initiatives such as police and human resources updates, administrative orientation, and adherence to legal and safety regulations
EMS also provides broadcast delivery of educational video services to public, private, and home-schooled children in Clark, Lincoln, Nye, and White Pine Counties in Nevada, plus portions of San Bernardino County in California, and Mojave County in Arizona.
Vegas PBS
Mission Statement
Vegas PBS uses television and other technology to educate and empower individuals, and to strengthen the effectiveness of partner organizations.
Services:
Vegas PBS consists of several distinct media services managed according to mission, technology, and revenue sources. Functionally these service units are divided into the Educational Media Services (EMS) and Public Service Media (PSM) departments.
EMS is funded primarily by the District with supplemental support from corporate funding, foundation and government grants. All educational media services directly serve classroom teachers, counselors, librarians, or principals, and offer District-approved professional development curriculum. EMS also provides community outreach and works with other community service providers allowing access to educational materials to families throughout the community.
PSM includes public television, educational cable, internet services, programming outreach activities, and emergency communications services funded with non- District revenues received through donations from individuals, corporations, foundations, service fees, tuition, and federal matching grants.
Educational Media Services (EMS)
The Educational Media Services Department consists of many services reaching all areas of the District including:
• Programming six closed-circuit Educational Broadband Services (EBS) channels for schools via curriculum based “themed” channels named Health, Live!, Career, World, NASA TV, and Vegas PBS-10.1
• Acquiring, producing, and indexing over 200,000 curriculum-based educational digital media objects, linking resource databases, and training teachers to effectively use on- demand digital media objects in the classroom
• Collecting, duplicating, and lending physical media materials from the Educational Media Center to schools
• Funding operations of Ready To Learn early childhood literacy workshops, Reading for Smiles oral health workshops, and Keeping Kids Fit child obesity workshops, including workshop facilitators, student books and technology kits
• Marketing and administering the PBS TeacherLine online professional development college credit course offerings and scholarships allowing teachers to expand their technological and instructional capabilities

Fina
ncia
l Sec
tion
1192014-15 Comprehensive Annual Budget Report |
Online Media Services
Vegas Virtual Online was rebranded and re-launched as GOAL (Global Online Advanced Learning) in February 2014, with programs and services aligned to the Governor’s Economic Development Strategy and the name change holds a broader appeal for statewide use. GOAL offers over 4,000 online courses and certification programs as well as 360 program certifications. Rebranding enables the division to work statewide on workforce initiatives. GOAL enrolls over 114,000 individuals annually in programs and services for workforce development and job placement. Major community engagement activities are scheduled by Vegas PBS or its non-profit subsidiary, Southern Nevada Public Television (SNPT), each year around high visibility national PBS television programs. Special emphasis is currently on the child health issues of oral hygiene and obesity. An ongoing program focuses on early childhood literacy by providing over 400 workshops each year for children and parents in Title I neighborhood schools. Special outreach programs with the District support adult literacy, GED courses, and English language proficiency.
Vegas PBS produces many privately funded local programs for KLVX-DT Channel 10/10.1/1010 which are intended to meet community interest and civic needs including:
• Inside Education’s exploration of K-12 school issues for the general public
• Nevada Week In Review’s roundtable discussion of political issues
• Scheduling and operating Cox educational access channels 110 (Rewind) and 111 (Jackpot), for a consortium that includes the District, CSN, and UNLV
• Community Calendar’s public notice on Vegas PBS and Vegas PBS.org including hundreds of community lectures, nonprofit fundraisers, cultural performances, and ethnic celebrations
• Hubert Keller: Secrets of the Chef, Season 4 production in the Vegas PBS studio with national distribution plans for FY15
• artScene, highlighting local artists and performers in a weekly series that includes specials like Broadway in the Hood and Frankie Moreno Songs at Home, with Special Guest Joshua Bell
• Cabaret Jazz: Frank Wildhorn & Friends, an Emmy-nominated collaboration with The Smith Center
• Homework Hotline• School Matters• Varsity Quiz and Jr. Varsity Quiz• CCSD Spelling Bee• Science Quiz Bowl• American Graduate, an initiative to address the dropout
crisis, featuring: Teacher Town Hall, Teachers Making a Difference, Road to Reform, Helping Families Graduate and Helping Native Americans Graduate
• Surviving Sin City Studio Discussion, a follow up to a local documentary on human trafficking, moderated by Nevada Attorney General Catherine Cortez Masto
• Women in Gaming, a two-part panel discussion in partnership with the Mob Museum

120 | Clark County School District
Vegas PBS AllocationsFor Fiscal Years 2012-13 Through 2014-15
2012-13 2013-14 2014-15Actuals Amended Final Budget Final Budget 2013-14 vs. 2014-15
Description Staff Amount Staff Amount Staff Amount Amount Percent
Admin / prof tech 8.00 $776,977 8.00 $806,091 8.00 $804,981 $(1,110) (0.1)%Support staff 21.00 1,143,970 21.25 1,213,808 21.25 1,174,232 (39,576) (3.3)%Benefits 666,612 753,248 743,426 (9,822) (1.3)%Purchased services 189,081 145,643 145,643 - - %Property 60,996 111,299 111,299 - - %Supplies 9,511 - - - - %Other 179,452 182,129 182,129 - - %
Total 29.00 $3,026,599 29.25 $3,212,218 29.25 $3,161,710 $(50,508) (1.6)%Source: CCSD Budget and Accounting Departments
Fiscal Year 2013-14 Accomplishments:
• Provided certification online courses acquired from PBS TeacherLine and GOAL to offer math and science-based courses adhering to District requirements for salary advancement and license renewal
• Continued the Keeping Kids Fit multi-media educational initiative focusing on childhood obesity
• Continue to provide services to employed and unemployed non-English speaking populations
• Continued the partnership with Southern Nevada Health District to provide training to obtain health cards for all of Southern Nevada’s food service industry workers
• Developed and promoted workforce readiness programs to combat unemployment and developed print collateral for marketing and distribution statewide
• Launched sub-branded training portals with other PBS stations
• Expanded cooperative efforts with local, regional, and State agencies for communications interoperability and community resilience through technology and planning
• Maintained a 99.95% reliability for broadcast operations• Assisted in producing District Pathlore training videos• Opened a computerized testing and training lab and
partnered with CCSD Adult Education to be the provider of the computerized High School Equivalency Exam, a requirement for administration of the new exams beginning January 2014
Fiscal Year 2014-15 Objectives:
• Continue to provide classrooms with programs or media objects through broadcast, physical loan, duplication, satellite, or video on demand services
• Continue the Keeping Kids Fit multi-media educational initiative focusing on childhood obesity
• Increase services to non-English speaking and low literacy populations
• Further expand the workforce readiness program and expand services to Veterans and other employers
• Increase assistance to District administration in recording important activities as documentation and for use in the local, State, and national media as needed
• Migrate to production server to assist in preservation and location of digital video
• Institute updated producer workflow to perfect web production
• Institute digital Production Request Forms in an effort to assist in making it easier to request video recording
• Continue to assist in the recording of training opportunities in order to make training available to all pertinent employees

Fina
ncia
l Sec
tion
1212014-15 Comprehensive Annual Budget Report |
Fina
ncia
l Sec
tion
In this sub-section, other governmental and proprietary funds are detailed with narratives of their respective services, goals, achievements, and performance measurements.
Special Revenue Funds........................................................... 122 Federal Projects Funds........................................................ 123 Other Special Revenue Funds............................................. 124
Debt Service Funds ................................................................ 126 Capital Projects Funds ........................................................... 130 Proprietary Funds ................................................................... 139
Food Services Fund............................................................. 139Internal Service Funds ......................................................... 141
Other Governmental andProprietary Funds

122 | Clark County School District
grants is included in the appendix section. The Medicaid programs are for services rendered on behalf of eligible students receiving School-Based Child Health Services that are used to supplement the District’s educational process.
The Federal Projects Funds’ ending fund balance is expected to decrease by almost $2 million due to the planned spend down of reimbursement revenues received in prior years for Medicaid services on behalf of eligible students.
The District maintains one major governmental and five non-major governmental special revenue funds. “Special revenue funds are used to account for and report the proceeds of specific revenue sources that are restricted or committed to expenditure for specified purposes other than debt service or capital projects.” Government Accounting Standards Board, Statement 54, Par. 30
Federal Projects Funds
The Federal Projects Funds are used to account for projects related to federally assisted activities. A detailed listing of
Special Revenue Funds
Grants From Federal SourcesFor the Fiscal Years 2013-14 and 2014-15
Description2013-14
Estimated2014-15Budget
Title I, Part A ClusterP.L. 103-382:
Focus School Improvement - Title I $ 1,325,000 $ 1,325,000 Title I-A Basic 104,465,755 105,665,755 Differentiated Consequences Grant 870,000 870,000
Special Education Cluster (IDEA)P.L. 101-476:
Educate Students with Disabilities 69,942,779 69,942,779 District Improvement Grant Plan 500,000 500,000 Educate the Handicapped: Preschool 2,100,000 2,100,000
Carl D. Perkins Career and Technical Education 4,254,500 4,254,500
Indian Education Act, Title IX-A, P.L. 102-382 172,000 172,000
Direct Grants from the Nevada Department of EducationFIE - Highly Gifted (GATE Title V-D) 287,800 287,800 FIE - English Language Learners (ELL) 10,000 10,000
Direct Grants from the U.S. Department of EducationInvesting in Innovation 1,890,000 1,890,000
Direct Grants from the U.S. Department of InteriorIndian Ed Assistance - J. O'Malley Supplement 10,200 10,200 Lake Mead National Recreation Area 25,000 25,000
Direct Grants from the U.S. Department of JusticeCommunity Oriented Policing Services 205,000 205,000
Nevada Department of Education Pass-Thru ProgramsHigh School Graduation Initiative 1,800,000 1,800,000 Professional Development for Arts Educators 400,000 400,000 Title I-D Neglected & Delinquent Children-Correctional 650,000 650,000 Title I-D Neglected & Delinquent Children 831,500 831,500 Title I NCCAT-D Grant 30,000 30,000 Title III English Language Acquisition 8,645,000 8,645,000 Title II-A Improving Teacher Quality 7,799,500 7,799,500 Education of Homeless Children and Youth 115,650 115,650 21st Century Community Learning Centers 3,481,577 3,481,577 Common Core Summer Institute 130,000 130,000 Refugee School Impact Aid 117,394 117,394 Striving Readers Comprehensive Literacy 15,500,000 15,500,000 Mathematics & Science Partnerships 415,000 415,000

Fina
ncia
l Sec
tion
1232014-15 Comprehensive Annual Budget Report |
Grants From Federal Sources - ContinuedFor the Fiscal Years 2013-14 and 2014-15
Description2013-14
Estimated2014-15Budget
Nevada Department of Education Pass-Thru Programs - ContinuedTitle I 1003(g) School Improvement Plan 7,170,000 7,170,000 Title I 1003(g) School Improvement Plan - Cohort 1 500,000 500,000 GEAR UP 1,240,000 1,240,000 Advanced Placement Fee Payment Program 5,200 5,200
University of Las Vegas NevadaImproving Teacher Quality 105,000 105,000
Nevada Department of TransportationSafe Routes to School 364,145 364,145
Centers for Disease Control and PreventionCommunity Transformation Grant 2,400,000 2,400,000
Community Services Agency
Jobs for America's Graduates 660,000 660,000
PACT Coalitin for Safe and Drug Fee CommunitiesSubstance Abuse Prevention Agency 122,000 122,000
Southern Nevada Workforce Investment BoardYouthbuild Program 160,000 160,000
Southern Nevada Health DistrictARRA-Prevention First 100,000 100,000
Other Federal SourcesMedicaid Reimbursement Programs 4,500,000 4,500,000
Total federal sources appropriations $243,300,000 $244,500,000
Federal Projects Funds - Summary Of Revenues, Expenditures, And Changes In Fund BalanceFor Fiscal Years 2012-13 Through 2014-15
2012-13Actuals
2013-14Estimated Actuals
2014-15Final Budget 2013-14 Vs. 2014-15
Description Staff Amount Staff Amount Staff Amount Amount PercentRevenues and Resources: Federal sources $186,097,701 $243,300,000 $244,500,000 $ 1,200,000 0.5 % Opening fund balance 9,459,799 10,724,831 8,774,831 (1,950,000) (18.2)%Total Resources 195,557,500 254,024,831 253,274,831 (750,000) (0.3)%
Expenditures: Salaries 1,442.32 102,398,637 1,345.00 115,894,250 1,345.00 115,694,250 (200,000) (0.2)% Employee benefits 31,502,407 34,212,000 34,415,000 203,000 0.6 % Purchased services 14,778,172 30,124,000 30,056,000 (68,000) (0.2)% Supplies 30,700,694 50,103,750 51,405,750 1,302,000 2.6 % Property/equipment 596,003 4,405,000 4,360,000 (45,000) (1.0)% Other expenditures 4,856,756 10,511,000 10,519,000 8,000 0.1 %Total Expenditures: 184,832,669 245,250,000 246,450,000 1,200,000 0.5 %
Ending fund balance 10,724,831 8,774,831 6,824,831 (1,950,000) (22.2)%
Total Applications 1,442.32 $195,557,500 1,345.00 $254,024,831 1,345.00 $253,274,831 $ (750,000) (0.3)%Source: CCSD Budget and Accounting Departments

124 | Clark County School District
Other Special Revenue Funds - Budget SummaryFiscal Year 2014-15
2014-15Description Fund Budget
Vegas PBS Services Public and Private 220 $ 11,160,000
State Funded Grant Programs:Adult education-prison program 230 2,750,000 Adult education-regular program 230 9,650,000 Assembly Bill 1 - Incentive grant 279 4,600,000 Educational enhancement programs 279 1,740,000 Educational technology 279 2,830,000 Full day kindergarten program 279 49,716,000 Professional development programs 279 4,894,000 Psychologists/counselors 5% salary increase 279 320,000 Speech pathologist 5% salary increase 279 295,000 Windsong-improve the quality of teaching 279 1,000,000 Windsong-pre kindergarten 279 600,000 Senate Bill SB 504 - Zoom Schools 279 14,950,000 Other 279 395,000
Total State funded grant programs 93,740,000
Total Other Special Revenue Funds $104,900,000
Source: Fiscal Accountability and Data Analysis
Other Special Revenue Funds
The Other Special Revenue Funds are used to account for activities of the District relating to additional educational services provided to the public for student activities, drivers’ education, adult education, telecommunications, special State appropriations, and other revenues from entities and individuals outside the District.
Major programs included are:
Adult High School Diploma – Educational program funding is for out-of-school persons (including prison inmates) 17 years of age and older who seek a high school diploma or General Educational Development (GED) certificate. The Education Services Division administers the Adult Education Program. This program also serves students enrolled in regular day schools who need to make up a number of deficient high school credits.
Nevada Department of Education Special Appropriations – Provides a wide range of special appropriations for enhancing educational programs, including school improvement plans, funding for full day kindergarten programs, zoom schools, operations of professional development centers, providing remedial education programs for schools designated as demonstrating need for improvement, upgrading technology in schools, and implementing other educational support programs.
Vegas PBS – Revenues are generated from public television memberships, corporate program sponsors, contract productions, facility rentals, and the Corporation for Public Broadcasting and includes non-instructional public television expenditures such as general audience programming and capital purchases. These sources provide approximately two-thirds of the operating budget for Vegas PBS, which includes: public television, audio and video services for the District, school cable wiring, educational satellite and cable, and closed circuit wireless services. Certain revenues in this fund are restricted by the donor for specific programming or capital purchases. More detailed operations information on Vegas PBS is included in Unit 140 of the General Operating Fund.
Special Revenue Appropriations – Other governmental entities outside the District for special instructional projects or programs are included.

Fina
ncia
l Sec
tion
1252014-15 Comprehensive Annual Budget Report |
Other Special Revenue Funds - Summary Of Revenues, Expenditures, And Changes In Fund BalanceFor Fiscal Years 2012-13 Through 2014-15
2012-13Actuals
2013-14Estimated Actuals
2014-15Final Budget 2013-14 Vs. 2014-15
Description Staff Amount Staff Amount Staff Amount Amount PercentRevenues and Resources: Local sources $ 8,477,071 $13,545,000 $13,545,000 $ - - % State sources 52,919,035 88,630,000 80,880,000 (7,750,000) (8.7)% Federal sources 55,079 350,000 350,000 - - % Transfers from other funds 4,817,116 8,660,000 10,000,000 1,340,000 15.5 % Opening fund balance 2,824,815 3,184,742 2,669,742 (515,000) (16.2)% Total Resources 69,093,116 114,369,742 107,444,742 (6,925,000) (6.1)%
Expenditures and Uses: Salaries 523.39 30,810,502 1,038.00 60,103,000 1,005.00 60,786,000 683,000 1.1 % Employee benefits 22,440,092 26,407,000 26,687,000 280,000 1.1 % Purchased services 5,595,392 10,595,000 8,140,000 (2,455,000) (23.2)% Supplies 3,267,697 6,100,000 5,612,000 (488,000) (8.0)% Property/equipment 213,209 5,830,000 1,655,000 (4,175,000) (71.6)% Other expenditures 2,940,360 2,165,000 2,020,000 (145,000) (6.7)% Transfers to other funds 641,122 500,000 - (500,000) (100.0)% Total Expenditures and Uses 65,908,374 111,700,000 104,900,000 (6,800,000) (6.1)%
Ending fund balance 3,184,742 2,669,742 2,544,742 (125,000) (4.7)%
Total Applications 523.39 $ 69,093,116 1,038.00 $114,369,742 1,005.00 $107,444,742 $(6,925,000) (6.1)%Source: CCSD Budget and Accounting Departments
Special Revenue Funds - Projected BudgetsFor Fiscal Years 2014-15 Through 2017-18Fund Expenditure Appropriations by Major Object
Description2014-15Budget
2015-16Projected
2016-17Projected
2017-18Projected Growth Rate
Revenues:Local sources $13,545,000 $14,000,000 $14,500,000 $15,000,000 3.4 %State sources 80,880,000 81,000,000 83,500,000 87,000,000 4.2 %Federal sources 244,850,000 245,000,000 247,000,000 248,000,000 0.4 %Total Revenues 339,275,000 340,000,000 345,000,000 350,000,000 1.4 %
Expenditures:Salaries 176,480,250 180,000,000 183,000,000 185,000,000 1.1 %Employee benefits 61,102,000 65,000,000 67,000,000 70,000,000 4.5 %Purchased services 38,196,000 35,000,000 35,000,000 35,000,000 - %Supplies 57,017,750 55,000,000 55,000,000 55,000,000 - %Property and equipment 6,015,000 5,000,000 3,500,000 3,500,000 - %Other expenditures 12,539,000 5,000,000 3,000,000 3,000,000 - %Total Expenditures 351,350,000 345,000,000 346,500,000 351,500,000 1.4 %
Excess (Deficiency) of Revenuesover Expenditures (12,075,000) (5,000,000) (1,500,000) (1,500,000)
Other Sources and (Uses):Transfers from other funds 10,000,000 - - -
Opening fund balance - July 1 11,444,573 9,369,573 4,369,573 2,869,573
Ending Fund Balance - June 30 $9,369,573 $4,369,573 $2,869,573 $1,369,573 Source: Budget Department
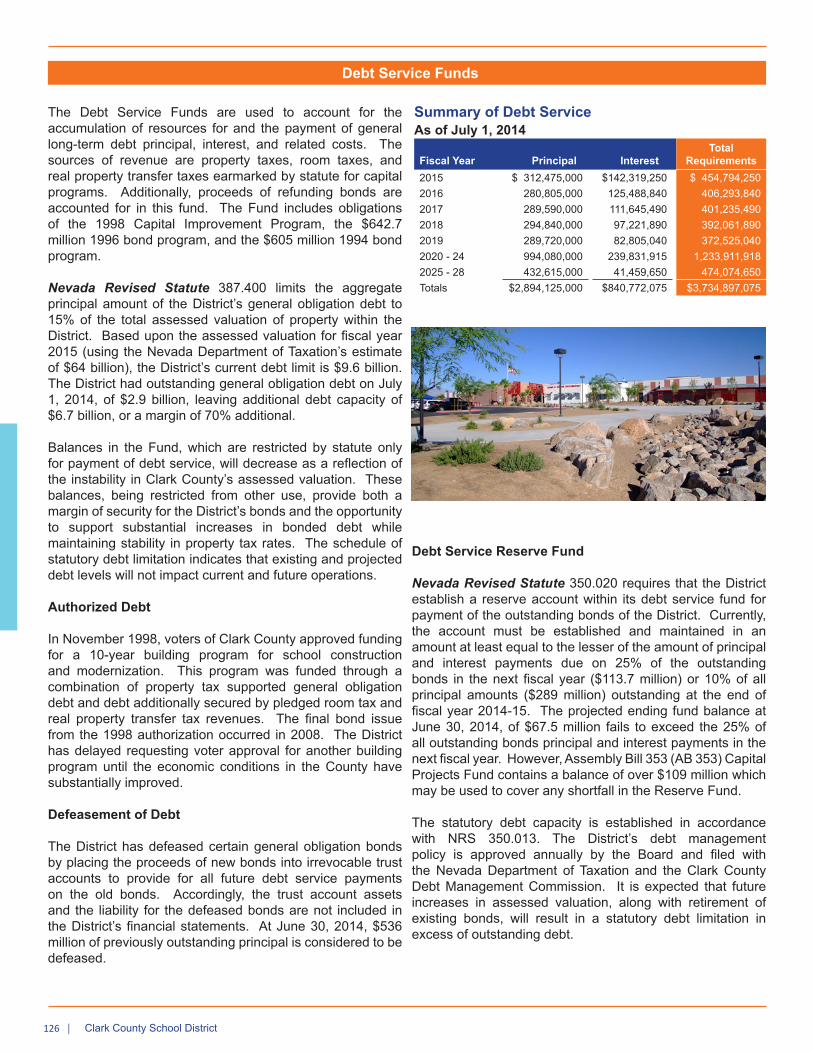
126 | Clark County School District
Debt Service Funds
The Debt Service Funds are used to account for the accumulation of resources for and the payment of general long-term debt principal, interest, and related costs. The sources of revenue are property taxes, room taxes, and real property transfer taxes earmarked by statute for capital programs. Additionally, proceeds of refunding bonds are accounted for in this fund. The Fund includes obligations of the 1998 Capital Improvement Program, the $642.7 million 1996 bond program, and the $605 million 1994 bond program.
Nevada Revised Statute 387.400 limits the aggregate principal amount of the District’s general obligation debt to 15% of the total assessed valuation of property within the District. Based upon the assessed valuation for fiscal year 2015 (using the Nevada Department of Taxation’s estimate of $64 billion), the District’s current debt limit is $9.6 billion. The District had outstanding general obligation debt on July 1, 2014, of $2.9 billion, leaving additional debt capacity of $6.7 billion, or a margin of 70% additional.
Balances in the Fund, which are restricted by statute only for payment of debt service, will decrease as a reflection of the instability in Clark County’s assessed valuation. These balances, being restricted from other use, provide both a margin of security for the District’s bonds and the opportunity to support substantial increases in bonded debt while maintaining stability in property tax rates. The schedule of statutory debt limitation indicates that existing and projected debt levels will not impact current and future operations.
Authorized Debt
In November 1998, voters of Clark County approved funding for a 10-year building program for school construction and modernization. This program was funded through a combination of property tax supported general obligation debt and debt additionally secured by pledged room tax and real property transfer tax revenues. The final bond issue from the 1998 authorization occurred in 2008. The District has delayed requesting voter approval for another building program until the economic conditions in the County have substantially improved.
Defeasement of Debt
The District has defeased certain general obligation bonds by placing the proceeds of new bonds into irrevocable trust accounts to provide for all future debt service payments on the old bonds. Accordingly, the trust account assets and the liability for the defeased bonds are not included in the District’s financial statements. At June 30, 2014, $536 million of previously outstanding principal is considered to be defeased.
Debt Service Reserve Fund
Nevada Revised Statute 350.020 requires that the District establish a reserve account within its debt service fund for payment of the outstanding bonds of the District. Currently, the account must be established and maintained in an amount at least equal to the lesser of the amount of principal and interest payments due on 25% of the outstanding bonds in the next fiscal year ($113.7 million) or 10% of all principal amounts ($289 million) outstanding at the end of fiscal year 2014-15. The projected ending fund balance at June 30, 2014, of $67.5 million fails to exceed the 25% of all outstanding bonds principal and interest payments in the next fiscal year. However, Assembly Bill 353 (AB 353) Capital Projects Fund contains a balance of over $109 million which may be used to cover any shortfall in the Reserve Fund.
The statutory debt capacity is established in accordance with NRS 350.013. The District’s debt management policy is approved annually by the Board and filed with the Nevada Department of Taxation and the Clark County Debt Management Commission. It is expected that future increases in assessed valuation, along with retirement of existing bonds, will result in a statutory debt limitation in excess of outstanding debt.
Summary of Debt ServiceAs of July 1, 2014
Fiscal Year Principal InterestTotal
Requirements2015 $ 312,475,000 $142,319,250 $ 454,794,250 2016 280,805,000 125,488,840 406,293,840 2017 289,590,000 111,645,490 401,235,490 2018 294,840,000 97,221,890 392,061,890 2019 289,720,000 82,805,040 372,525,040 2020 - 24 994,080,000 239,831,915 1,233,911,918 2025 - 28 432,615,000 41,459,650 474,074,650 Totals $2,894,125,000 $840,772,075 $3,734,897,075

Fina
ncia
l Sec
tion
1272014-15 Comprehensive Annual Budget Report |
Debt Service Funds - Statutory Debt LimitationFiscal Years 2014-15
DescriptionAssessed
Valuation Basis
Fiscal year 2014-15 assessed value of all taxable property situated in Clark County (includes $1,347,691,561 assessed valuation for redevelopment agencies) $64,252,633,650
Gross limitation -- 15% of assessed valuation (NRS 387.400) $9,637,895,048
Outstanding bonds of the Debt Service Fund at July 1, 2014 2,894,125,000Excess of limitation at July 1, 2014 $6,743,770,048
Debt Limit Margin 30.03%
Source: CCSD Budget Department
Debt Service Funds - Statutory Debt Additional CapacityFor Fiscal Years 2005-06 Through 2014-15
Fiscal Year Total
Assessed Valuation1 Debt Limit
Outstanding General Obligation Debt
As of July 1 Additional Statutory
Debt Capacity
2005-06 $ 65,582,487,400 $ 9,837,373,110 $ 3,220,455,500 $ 6,616,917,610 2006-07 91,622,434,937 13,743,365,241 3,534,820,500 10,208,544,741 2007-08 109,212,919,843 16,381,937,976 3,915,265,500 12,466,672,476 2008-09 115,790,200,550 17,368,530,083 5,006,995,500 12,361,534,583 2009-10 93,790,791,674 14,068,618,751 4,670,965,000 9,397,653,751 2010-11 65,758,625,871 9,863,793,881 4,110,425,000 5,753,368,881 2011-12 59,054,835,152 8,858,225,273 3,860,905,000 4,997,320,273 2012-13 55,225,712,175 8,283,856,826 3,554,575,000 4,729,281,826 2013-14 56,296,847,888 8,444,527,183 3,223,895,000 5,220,632,183 2014-15 64,252,633,650 9,637,895,048 2,894,125,000 6,743,770,048
(1) Includes redevelopment agenciesSource: CCSD Budget and Accounting Departments
Property Tax Levies (Per $100 Of Adjusted Assessed Valuation)For Fiscal Years 2010-11 Through 2014-15Fiscal Year 2010-11 2011-12 2012-13 2013-14 2014-15
Basic School Levy (General Operations) $0.7500 $0.7500 $0.7500 $0.7500 $0.7500
Debt Service/Special Projects Levy 0.5534 0.5534 0.5534 0.5534 0.5534
Total District Levies $1.3034 $1.3034 $1.3034 $1.3034 $1.3034Source: Clark County Assessor’s Office
0
1.0
2.0
3.0
4.0
$5.0$4.671
$3.555
$3.224
$3.861
$4.110
$2.894
2009 2010 201320122011 2014
Supported Debt And Related Tax LevyAs of June 30, 2014
Debt Levy .5534 .5534.5534.5534.5534 .5534
Source: Clark County Assessor’s Office
(1) Debt includes any special tax overrides for public safety projects and other capital programs (fire safety retrofit/asbestos removal, pay-as-you-go, EPA loan).

128 | Clark County School District
Debt Service Fund - Schedule Of General Obligation Bonds OutstandingAs of July 1, 2014
Issue DateDate of
Final Maturity TermInterest
RateOriginal
IssueBalance
July 1, 2013September 1, 1998 (Refunding May 1996) June 15, 2015 17 Years 4.6977% $ 169,310,000 $ 26,770,000
March 1, 2005A (Refunding April 1999, June 2002) June 15, 2019 14 Years 3.9800 269,600,000 219,025,000
March 1, 2005B (Refunding October 2001) June 15, 2022 17 Years 4.0713 209,995,000 161,795,000
November 15, 2005C1 June 15, 2019 20 Years 4.4161 500,000,000 107,790,000
March 30, 2006A (Refunding March 1996, June 2002) June 15, 2015 9 Years 3.8515 153,925,000 21,170,000
December 19, 2006B June 15, 2026 20 Years 4.1025 450,000,000 335,750,000
December 19, 2006C June 15, 2026 20 Years 4.1125 125,000,000 93,270,000
March 30, 2007A (Refunding November 2003,November 2004, November 2005) June 15, 2025 18 Years 4.1262 473,045,000 343,780,000
December 11, 2007B June 15, 2027 20 Years 4.3246 250,000,000 197,920,000
December 11, 2007C June 15, 2027 20 Years 4.3330 400,000,000 316,675,000
June 3, 2008A June 15, 2028 20 Years 4.1960 675,000,000 444,565,000
July 8, 2010A June 15, 2024 14 Years 0.7497 104,000,000 104,000,000
July 8, 2010D June 15, 2020 10 Years 0.7033 6,245,000 6,245,000
March 3, 2011A (Refunding September 2001C) June 15, 2016 5 Years 2.1065 69,160,000 29,380,000
March 3, 2011B (Refunding September 2001D) June 15, 2019 8 Years 2.9849 29,420,000 29,420,000
October 4, 2012A (Refunding November 2004, November 2005) June 15, 2021 9 Years 1.6657 159,425,000 159,425,000
July 31, 2013A June 15, 2023 10 Years 2.5233 32,855,000 29,015,000
July 31, 2013B (Refunding November 2003, November 2004, November 2005) June 15, 2019 6 Years 1.7281 95,870,000 74,755,000
April 29, 2014A (Refunding March and November 2004) June 15, 2020 6 Years 1.1606 131,175,000 131,175,000
April 29, 2014B (Refunding March 2004) June 15, 2020 6 Years 1.3486 62,200,000 62,200,000
Total Outstanding Bonded Indebtness $2,894,125,000 1 Date of final maturity has been changed from the original final maturity due to refunded debt payments.
Source: CCSD Budget and Accounting Departments

Fina
ncia
l Sec
tion
1292014-15 Comprehensive Annual Budget Report |
Debt Service Funds - Summary Of Revenues, Expenditures, And Changes In Fund BalanceFor Fiscal Years 2012-13 Through 2014-15
Debt Service2012-13Actuals
2013-14Estimated
Actuals2014-15
Final Budget2013-14 vs. 2014-15
Amount PercentRevenues and resources:
Local revenues $298,150,491 $292,495,000 $307,800,000 $ 15,305,000 5.2 %Proceeds of refunding bonds 199,248,293 324,725,000 437,590,000 112,865,000 34.8 %Transfers from other funds 91,982,730 97,695,000 87,280,000 (10,415,000) (10.7)%Opening fund balance 276,954,144 175,795,693 67,855,693 (107,940,000) (61.4)%Total revenues and resources 866,335,658 890,710,693 900,525,693 9,815,000 1.1 %
Expenditures and other uses:Principal 329,110,000 339,665,000 312,475,000 (27,190,000) (8.0)%Interest 171,213,890 157,105,000 142,320,000 (14,785,000) (9.4)%Purchased services 641,881 1,210,000 2,405,000 1,195,000 98.8 %Payments to refund escrow agent 189,574,194 324,875,000 435,185,000 110,310,000 34.0 %Total expenditures and uses 690,539,965 822,855,000 892,385,000 69,530,000 8.4%
Ending fund balance 175,795,693 67,855,693 8,140,693 (59,715,000) (88.0)%
Total applications $866,335,658 $890,710,693 $900,525,693 $ 9,815,000 1.1 %Source: CCSD Budget and Accounting Departments
Debt Service Funds - Projected BudgetsFor Fiscal Years 2014-15 Through 2017-18Fund Expenditure Appropriations by Major Object
Description2014-15Budget
2015-16Projected
2016-17Projected
2017-18Projected Growth Rate
Revenues:Property taxes $ 306,215,000 $ 331,900,000 $ 349,980,000 $ 369,980,000 5.7 %Interest on investments 1,560,000 80,000 - - - %Other local revenues 25,000 20,000 20,000 20,000 - %Total Revenues 307,800,000 332,000,000 350,000,000 370,000,000 5.7 %
Expenditures:Principal 312,475,000 280,805,000 289,590,000 294,840,000 1.8 %Interest 142,320,000 125,495,000 111,645,000 97,225,000 (12.9)%Purchased services 2,405,000 - - - - %Total Expenditures 457,200,000 406,300,000 401,235,000 392,065,000 (2.3)%
Excess (Deficiency) of Revenuesover Expenditures (149,400,000) (74,300,000) (51,235,000) (22,065,000)
Other Sources and (Uses):Proceeds of refunding bonds 437,590,000 - - - Payment to refunding escrow agent (435,185,000) - - - Transfer from other funds 87,280,000 86,845,000 86,855,000 86,600,000 Total Other Sources and (Uses): 89,685,000 86,845,000 86,855,000 86,600,000
Opening Fund Balance - July 1 67,855,693 8,140,693 20,685,693 56,305,693
Ending Fund Balance - June 30 $8,140,693 $20,685,693 $56,305,693 $120,840,693
Source: Budget Department

130 | Clark County School District
The number of schools maintained and the age of the schools places unrelenting demands on the available modernization funds. The CIP provides for the possibility of a full replacement of a building or a wing of a building, replacement and/or major renovation of building components once the useful life has been reached. The plan also addresses major renovations needed for mandated modification and changing educational program needs.
After fulfilling the growth demands of the District, more than one-third of the funding from the CIP has been or will be expended on renovation and modernization projects. Modifications are made at schools to bring their facilities up to date in design and function. Modernization is much more than merely a cosmetic effort. It is essential work intended to extend the life of the facility and provide improved physical facilities essential for student achievement. Almost all projects have to install new security systems, new playground shade structures, access to the wide area network, new computers, and replacement of worn or unsafe furniture.
Capital Projects Funds
The various capital projects funds are used to account for projects related to land and building acquisition, construction, and improvements to schools and other District-owned properties. The District maintains a demand-responsive and dynamic construction program to construct and renovate facilities, and to provide technology and equipment upgrades as necessary to meet the District facilities requirements. This program is described in the Capital Improvement Plan (CIP).
The 1998 Capital Improvement Program – The Capital Improvement Plan (CIP) was a financial plan for the acquisition of land and buildings, construction of new buildings, improvement or replacement of District-owned facilities and infrastructure, and the upgrade of technology. Those capital improvements were projects with long useful lives that acquired buildings and land, provided land improvements, constructed new buildings, and expanded, upgraded, or repaired existing facilities or infrastructure. Capital project expenditures transpired over two or more years and generally required recording the project over multiple fiscal year budgets. Most of the capital projects were funded with bonded debt due to the significant costs involved and the need to spread the acquisition cost of the asset over several years.
Five Year Capital Improvement Plan (CIP)For Fiscal Years 2014-15 Through 2018-19Descriptions FY 2014-15 FY 2015-16 FY 2016-17 FY 2017-18 FY 2018-19
1998 Capital Improvement Program:Land Acquisition $ 3,000,000 $ - $ - $ - $ - New Construction: Other Facilities 10,000,000 15,000,000 - - - Rehab/Modernization 52,000,000 35,000,000 - - - Fund Total 65,000,000 50,000,000 - - -
Governmental Services Tax Fund:Rehab/Modernization 13,700,000 13,700,000 13,700,000 13,700,000 13,700,000 Purchase of Portable Classrooms 2,000,000 2.000,000 2,000,000 2,000,000 2,000,000 Relocation of Portable Classrooms 5,500,000 5,500,000 5,500,000 5,500,000 5,500,000 Fund Total 21,200,000 21,200,000 21,200,000 21,200,000 21,200,000
Building And Sites Fund:Site Improvements 750,000 750,000 750,000 750,000 750,000 Fund Total 750,000 750,000 750,000 750,000 750,000
Capital Replacement Fund:Student Information System 1,600,000 - - - - Fund Total 1,600,000 - - - -
Total All Capital Funds $88,550,000 $71,950,000 $21,950,000 $21,950,000 $21,950,000Source: CCSD Facilities and Bond Financial Management
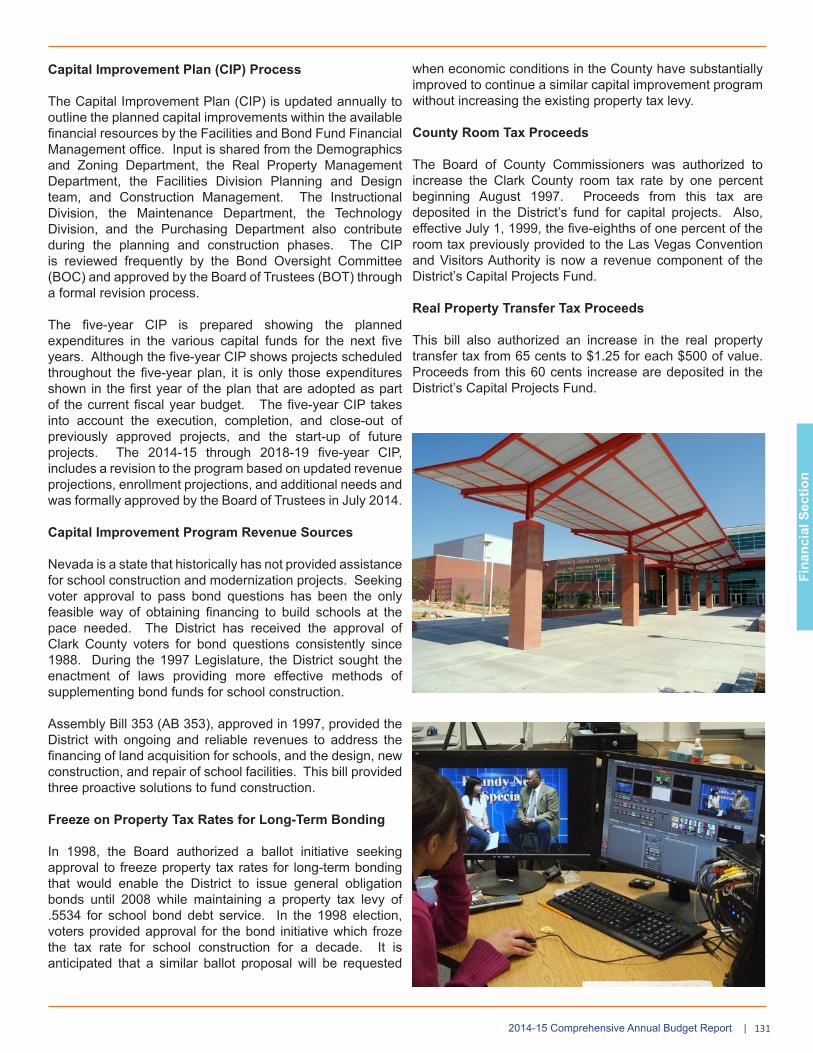
Fina
ncia
l Sec
tion
1312014-15 Comprehensive Annual Budget Report |
when economic conditions in the County have substantially improved to continue a similar capital improvement program without increasing the existing property tax levy.
County Room Tax Proceeds
The Board of County Commissioners was authorized to increase the Clark County room tax rate by one percent beginning August 1997. Proceeds from this tax are deposited in the District’s fund for capital projects. Also, effective July 1, 1999, the five-eighths of one percent of the room tax previously provided to the Las Vegas Convention and Visitors Authority is now a revenue component of the District’s Capital Projects Fund.
Real Property Transfer Tax Proceeds
This bill also authorized an increase in the real property transfer tax from 65 cents to $1.25 for each $500 of value. Proceeds from this 60 cents increase are deposited in the District’s Capital Projects Fund.
Capital Improvement Plan (CIP) Process
The Capital Improvement Plan (CIP) is updated annually to outline the planned capital improvements within the available financial resources by the Facilities and Bond Fund Financial Management office. Input is shared from the Demographics and Zoning Department, the Real Property Management Department, the Facilities Division Planning and Design team, and Construction Management. The Instructional Division, the Maintenance Department, the Technology Division, and the Purchasing Department also contribute during the planning and construction phases. The CIP is reviewed frequently by the Bond Oversight Committee (BOC) and approved by the Board of Trustees (BOT) through a formal revision process.
The five-year CIP is prepared showing the planned expenditures in the various capital funds for the next five years. Although the five-year CIP shows projects scheduled throughout the five-year plan, it is only those expenditures shown in the first year of the plan that are adopted as part of the current fiscal year budget. The five-year CIP takes into account the execution, completion, and close-out of previously approved projects, and the start-up of future projects. The 2014-15 through 2018-19 five-year CIP, includes a revision to the program based on updated revenue projections, enrollment projections, and additional needs and was formally approved by the Board of Trustees in July 2014.
Capital Improvement Program Revenue Sources Nevada is a state that historically has not provided assistance for school construction and modernization projects. Seeking voter approval to pass bond questions has been the only feasible way of obtaining financing to build schools at the pace needed. The District has received the approval of Clark County voters for bond questions consistently since 1988. During the 1997 Legislature, the District sought the enactment of laws providing more effective methods of supplementing bond funds for school construction.
Assembly Bill 353 (AB 353), approved in 1997, provided the District with ongoing and reliable revenues to address the financing of land acquisition for schools, and the design, new construction, and repair of school facilities. This bill provided three proactive solutions to fund construction.
Freeze on Property Tax Rates for Long-Term Bonding
In 1998, the Board authorized a ballot initiative seeking approval to freeze property tax rates for long-term bonding that would enable the District to issue general obligation bonds until 2008 while maintaining a property tax levy of .5534 for school bond debt service. In the 1998 election, voters provided approval for the bond initiative which froze the tax rate for school construction for a decade. It is anticipated that a similar ballot proposal will be requested

132 | Clark County School District
Major Capital Projects Funds
1998 Capital Improvement Program
Legislative Assembly Bill 353 (AB 353) provided the District the opportunity to offer a proactive solution to the voters of Clark County by financing public school construction and renovation as needed without increasing the property tax rate.
Voters authorized the issuance of bonds through June 2008, to be repaid within the existing property tax levy, allowing greater flexibility in responding to the imminent need to provide seats for new students and to repair and renovate
existing school facilities. General obligation bonds issued under AB 353 were approved only after determination by the Board and after receiving approval from the Clark County Oversight Panel for School Facilities and the Debt Management Commission.
In addition to property tax supported bonds, AB 353 provided additional sources of capital funding for the District with approval of the room tax and the real property transfer tax. AB 353 provides safeguards to taxpayers through the tax freeze, more stringent debt reserve requirements, and requiring bond issuance approval by both the Oversight Panel for School Facilities and the Debt Management Commission.
1998 Capital Improvement ProgramBuilding and Modernization Plan
Descriptions Program TotalPercent of
Total ProgramNumber
of Schools
Land Acquisition $ 213,575,000 4.4%
New School ConstructionSpecial/Alternative 35,605,000 0.7% 2Elementary 1,119,390,000 22.8% 61Middle 630,760,000 12.9% 22Senior High 654,620,000 13.4% 11Career and Technical Academy 481,400,000 9.8% 5
Total New School Construction 2,921,775,000 59.6% 101
Replacement SchoolsElementary 181,360,000 3.7% 8Middle 106,470,000 2.2% 2Senior High 77,210,000 1.6% 1Special Schools 49,880,000 1.0% 2
Total Replacement Schools 414,920,000 8.5% 13
Phase ReplacementsElementary 29,510,000 0.6% 3Senior High 100,115,000 2.0% 2Career & Technical Academy 33,700,000 .7% 1
Total Phase Replacements 163,325,000 3.3% 6
Additions to Existing SchoolsElementary 32,980,000 0.7% 4Middle 7,325,000 0.1% 1Senior High 65,775,000 1.3% 10
Total Additions to Existing Schools 106,080,000 2.1% 15
Rehabilitation and ModernizationModernization/Upgrade 785,320,239 16.0% 229Furniture and Equipment Upgrade/Replacement 129,999,400 2.7% 229Technology Upgrades 81,975,361 1.7% 229Portables 21,500,000 0.4%
Total Rehabilitation and Modernization 1,018,795,000 20.8%
Satellite Bus Yards 61,530,000 1.3% 2
Total 1998 Capital Improvement Plan $ 4,900,000,000 100.0%Source: CCSD Facilities and Bond Financial Management

Fina
ncia
l Sec
tion
1332014-15 Comprehensive Annual Budget Report |
The 1998 Capital Improvement Program was approved by the Board on May 28, 1998, and approved by voters in November 1998. The original program totaling $3.526 billion was projected to meet the needs of the District through 2008. The program was allocated for $115 million in land acquisition, $2.526 billion for construction of 88 new schools, $31 million for construction of two new bus yards, and $854 million for modernization of older schools.
The program was last reviewed by the Bond Oversight Committee on April 17, 2014 who is determining whether to prepare a current revision of the program based upon updated revenue projections, enrollment projections, and additional needs. The previous CIP revision approved continuation of the construction of new schools, adjusted the budgets of the career and technical high schools, replacement schools, phased replacement of schools and transportation facilities, and increased funding for modernization of older schools.
New School Completion ScheduleFiscal Years 2001-2015
School Year
Special SchoolAlternative
SchoolElementary
School Middle School
High School Career and Technical Academy
Replacement Schools Total
2000-01 - 4 2 - - 62001-02 - 7 5 1 & 1 AHS 1 RES 152002-03 - 6 2 - 1 RES 92003-04 - 7 3 2 1 RES 132004-05 - 7 3 3 - 132005-06 - 7 3 1 1 RHS 122006-07 1 SS 6 2 1 - 102007-08 - 6 2 1 1 RES & 1 RMS 112008-09 1 AS 4 - 1 & 1 CTA 4 RES & 1 RMS 122009-10 - 3 - 1 & 2 CTA - 62010-11 - 4 - 1 CTA - 52011-12 - - - - 2 RSS 22012-13 - - - - - -2013-14 - - - - - -2014-15 - - - - - -
Totals 2 61 22 16 13 114RES = Replacement Elementary School AHS = Alternative High SchoolRMS = Replacement Middle School CTA = Career and Technical AcademyRHS = Replacement High School RSS = Replacement Special SchoolSource: CCSD Facilities and Bond Financial Management
The current program (scheduled for completion in June 2015 at a total of $4.9 billion) includes:
• Land acquisition funding for future school sites at a cost of $214 million
• Construction of 101 new schools at a cost of $2.92 billion:1. Sixty-one elementary schools, twenty-two middle schools,
eleven high schools2. Four career and technical academy high schools, one
alternative high school3. One special school and one alternative school
• Construction of 13 replacement schools as mandated by Assembly Bills 368, 396, and 499 at a cost of $415 million
• Construction of six phased replacement schools at a cost of $163 million
• Renovation of existing schools, including additions, modernizations, lifecycle replacement and life/safety upgrades at a cost of $1.12 billion
• Construction of two regional bus transportation centers at a cost of $62 million.

134 | Clark County School District
Student Enrollment Projections
The Demographics and Zoning Department utilizes current birth rates and cohort projection techniques, including review of the number of new residents moving into Clark County and the advancement of students through grade levels, to calculate the student enrollment projections. The District has maintained a reliable accuracy rating compared to actual enrollments in previous years’ projections.
Student enrollment has increased by over 37,000 students during the past ten years. The fiscal 2013-14 official student enrollment was 314,598 and is projected to increase to 317,970 during 2014-15. Current projections indicate that school population will increase steadily over the next three years.
Cost of Building New Schools
It is useful to look at several factors when analyzing the cost of building new schools. Although single designs are frequently used for new schools, the specific site adaptations, construction, and equipment needs will vary for each school. A formula is necessary to account for the variables to accommodate escalating prices, in addition to providing a contingency for unforeseen events.
Site development costs can add significantly to the school’s projected cost. Site development costs are those costs related to preparing the site for construction and occupation. Activities may include leveling the site, installing utility services, and building roads and other infrastructure to the school. Costs can range between $3 million and $10.5 million per school for site development.
The figures in this summary reflect the current average “turnkey costs.” The budgets for these costs are developed using the estimated construction cost as a base and adding set percentages for design fees, telecommunications (including the linking of the security, intercom, clock and telephone systems), inspection and administrative costs, contingency costs, and furnishings.
The average turnkey costs of schools by type are:
Elementary School, $27.4 millionMiddle School, $40 million High School, $105.7 million
Career and Technical Academy, $115 million
New School Construction
Since 1990, the District has addressed its rapidly growing student population through the efficient use of prototype designs for new schools. Experienced school design architects have carefully expanded the current prototype. The input of educators has been utilized to incorporate the space design needed for a successful educational program at each site. The designs also incorporated the most economical life cycle cost to operate and maintain the facility. The current prototype design has been repeated for the construction of almost every new school built during the past two decades. This practice has saved significant time and millions in design and construction fees.
Cost Saving Measures
The District views its responsibility to expend scarce capital funding wisely. Management practices and construction protocols are constantly monitored to achieve maximum efficiency. Due to this proactive approach, additional funding was realized to enable the modernization of far more schools than originally projected. Measures that have resulted in significant savings include the packaging of multiple projects for bidding, peer reviews, focusing on energy efficient designs, considerable scrutiny of change orders, and careful monitoring of inspection practices. Value engineering is the process of reviewing the design of a facility before it is advertised for competitive bidding contributes to significant savings being realized and provides guidelines for future construction projects.
Energy Efficiency
The District has accomplished hundreds of major modernizations at existing school sites replacing major mechanical systems in older schools with more energy efficient systems. This has generated significant savings to the General Fund for electricity and water consumption.
The replacement of a chiller at a high school with more energy efficient systems saves approximately $25,000 each year in energy costs. By replacing multiple systems at a high school site by including a new HVAC system, roof, electrical and lighting upgrades, and adding day lighting, results in savings in excess of $100,000 per year in energy consumption costs.
Solar Photovoltaic Systems
The District utilizing ARRA grant funding and cash rebates from NV Energy has installed solar photovoltaic systems at 35 schools and the Vegas PBS building. The systems generate electricity by converting sunlight into electric current at a substantial savings of at least $330,000 annually.

Fina
ncia
l Sec
tion
1352014-15 Comprehensive Annual Budget Report |
Non-Major Capital Projects Funds
Building and Sites (Fund 330)
Proceeds are used for the construction, purchases, or modernization of buildings or sites. Sources of revenue in the fund are receipts from the rental and sales of District property. The dollar amount received each year is not sufficient to respond to the District’s long term capital needs.
Governmental Services Tax (Fund 340)
Proceeds are used for the construction, purchase, or modernization of District-owned facilities in response to any immediate facility needs to accommodate enrollment fluctuations and growth, staff changes and growth, and changes to and/or addition of educational programs. The dollar amount received each year is not sufficient to respond to the District’s long term capital needs.
Capital Projects Funds - Funds SummaryFiscal Year 2014-15
Funds Budget Descriptions Staff Amount
Fund 308 - 1998 Bond ProceedsNew construction other facilities - $ 9,050,000 Rehabilitation of existing schools - 4,500,000 1998 Bond issue administrative support 8.00 2,090,000 Construction management 21.00 4,870,000 Rehabilitation/modernization management/technology 1.00 44,355,000 Land acquisition - 135,000
Total - Fund 308 30.00 65,000,000
Fund 330 - Buildings and SitesOn and off site improvements - 35,000 Site purchases and leases - 375,000 Other expenditures - 340,000
Total - Fund 330 - 750,000
Fund 340 - Governmental Services TaxRefurbish/modernization crew 33.00 2,890,000 Refurbish and modernization projects - 680,000 Asphalt/drain/offsite - 1,000,000 Furniture and equipment - 150,000 Portables and trailers - 8,375,000 Other expenditures 3.00 8,105,000
Total - Fund 340 36.00 21,200,000
Fund 370 - Capital Replacement and MaintenanceStudent information system 4.00 1,600,000
TransfersTransfer to Debt Service Fund - 84,000,000
2014-15 Capital Projects budget 70.00 $172,550,000 Source: CCSD Facilities and Bond Financial Management
Capital Replacement (Fund 370)
Resources in the Fund are transfers from other funds made pursuant to a plan approved by the Board to provide equipment and maintenance for projects ordinarily not undertaken more frequently than once every five years. As the resources are provided from other funds, the dollar amount of the transfers is not sufficient to respond to the District’s long-term capital needs.
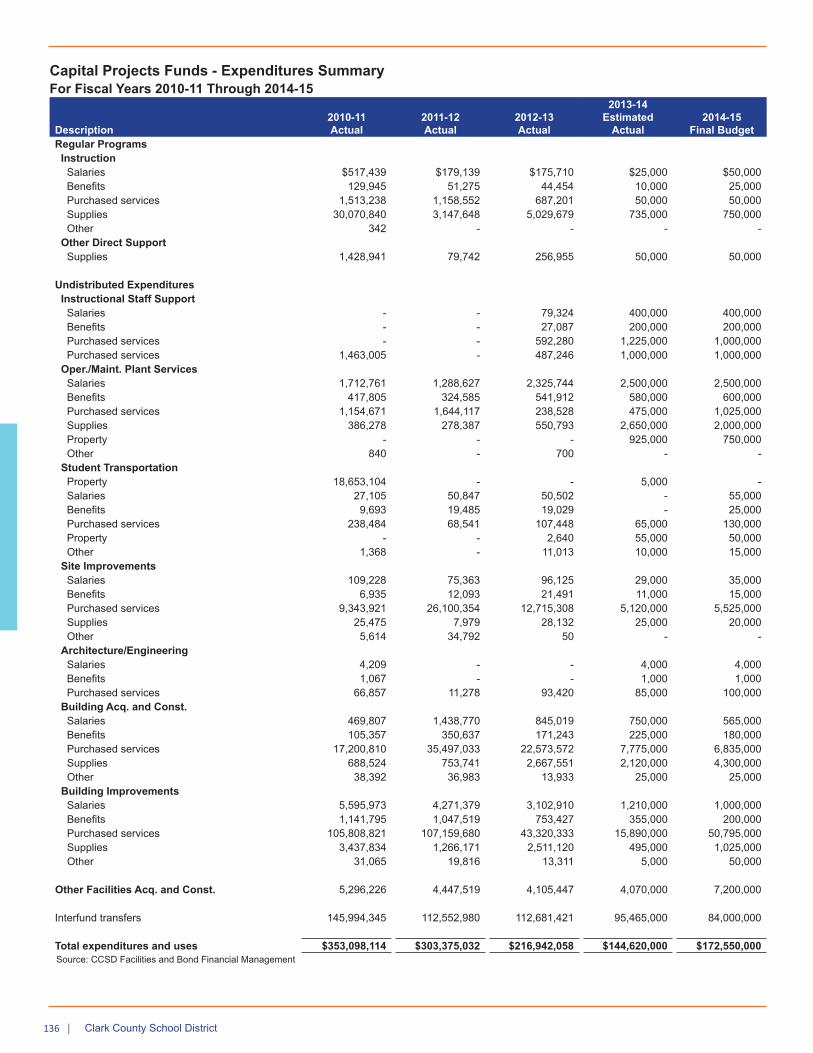
136 | Clark County School District
Capital Projects Funds - Expenditures SummaryFor Fiscal Years 2010-11 Through 2014-15
Description2010-11Actual
2011-12Actual
2012-13Actual
2013-14Estimated
Actual2014-15
Final BudgetRegular Programs
InstructionSalaries $517,439 $179,139 $175,710 $25,000 $50,000 Benefits 129,945 51,275 44,454 10,000 25,000 Purchased services 1,513,238 1,158,552 687,201 50,000 50,000 Supplies 30,070,840 3,147,648 5,029,679 735,000 750,000 Other 342 - - - -
Other Direct SupportSupplies 1,428,941 79,742 256,955 50,000 50,000
Undistributed ExpendituresInstructional Staff Support
Salaries - - 79,324 400,000 400,000 Benefits - - 27,087 200,000 200,000 Purchased services - - 592,280 1,225,000 1,000,000 Purchased services 1,463,005 - 487,246 1,000,000 1,000,000
Oper./Maint. Plant ServicesSalaries 1,712,761 1,288,627 2,325,744 2,500,000 2,500,000 Benefits 417,805 324,585 541,912 580,000 600,000 Purchased services 1,154,671 1,644,117 238,528 475,000 1,025,000 Supplies 386,278 278,387 550,793 2,650,000 2,000,000 Property - - - 925,000 750,000 Other 840 - 700 - -
Student TransportationProperty 18,653,104 - - 5,000 - Salaries 27,105 50,847 50,502 - 55,000 Benefits 9,693 19,485 19,029 - 25,000 Purchased services 238,484 68,541 107,448 65,000 130,000 Property - - 2,640 55,000 50,000 Other 1,368 - 11,013 10,000 15,000
Site ImprovementsSalaries 109,228 75,363 96,125 29,000 35,000 Benefits 6,935 12,093 21,491 11,000 15,000 Purchased services 9,343,921 26,100,354 12,715,308 5,120,000 5,525,000 Supplies 25,475 7,979 28,132 25,000 20,000 Other 5,614 34,792 50 - -
Architecture/EngineeringSalaries 4,209 - - 4,000 4,000 Benefits 1,067 - - 1,000 1,000 Purchased services 66,857 11,278 93,420 85,000 100,000
Building Acq. and Const.Salaries 469,807 1,438,770 845,019 750,000 565,000 Benefits 105,357 350,637 171,243 225,000 180,000 Purchased services 17,200,810 35,497,033 22,573,572 7,775,000 6,835,000 Supplies 688,524 753,741 2,667,551 2,120,000 4,300,000 Other 38,392 36,983 13,933 25,000 25,000
Building ImprovementsSalaries 5,595,973 4,271,379 3,102,910 1,210,000 1,000,000 Benefits 1,141,795 1,047,519 753,427 355,000 200,000 Purchased services 105,808,821 107,159,680 43,320,333 15,890,000 50,795,000 Supplies 3,437,834 1,266,171 2,511,120 495,000 1,025,000 Other 31,065 19,816 13,311 5,000 50,000
Other Facilities Acq. and Const. 5,296,226 4,447,519 4,105,447 4,070,000 7,200,000
Interfund transfers 145,994,345 112,552,980 112,681,421 95,465,000 84,000,000
Total expenditures and uses $353,098,114 $303,375,032 $216,942,058 $144,620,000 $172,550,000 Source: CCSD Facilities and Bond Financial Management

Fina
ncia
l Sec
tion
1372014-15 Comprehensive Annual Budget Report |
Capital Projects Funds - Summary of Revenues, Expenditures, And Changes In Fund BalanceFor Fiscal Years 2012-13 Through 2014-15
2012-13Actuals
2013-14Estimated Actuals
2014-15Final Budget 2013-14 Vs. 2014-15
Description Staff Amount Staff Amount Staff Amount Amount PercentRevenues and resources: Local revenues $109,660,956 $114,820,000 $118,865,000 $4,045,000 3.5 % Federal revenues 5,809,522 5,765,000 6,075,000 310,000 5.4 % Transfers from other funds 1,339,813 2,325,000 1,600,000 (725,000) (31.2)% Opening fund balance 392,493,638 292,361,871 270,651,871 (21,710,000) (7.4)% Total revenues and resources 509,303,929 415,271,871 397,191,871 (18,080,000) (4.4)%
Expenditures and uses: Salaries 112.00 9,253,814 69.00 7,693,000 70.00 9,484,000 1,791,000 23.3 % Employee benefits 2,665,099 2,267,000 3,026,000 759,000 33.5 % Purchased services 80,848,036 31,715,000 66,535,000 34,820,000 100.0 % Supplies 11,435,910 6,435,000 8,595,000 2,160,000 33.6 % Property and equipment 14,638 1,000,000 815,000 (185,000) (18.5)% Other expenditures 43,140 45,000 95,000 50,000 100.0 % Transfers to other funds 112,681,421 95,465,000 84,000,000 (11,465,000) (12.0)% Total expenditures and uses 216,942,058 144,620,000 172,550,000 27,930,000 19.3 %
Ending fund balance 292,361,871 270,651,871 224,641,871 (46,010,000) (17.0)%
Total Applications 112.00 $509,303,929 69.00 $415,271,871 70.00 $397,191,871 $(18,080,000) (4.4)%Source: CCSD Budget and Accounting Departments
Capital Projects Funds - Summary Of Budget CategoriesFor Fiscal Years 2012-13 Through 2014-15
2012-13 2013-14 2014-15General Ledger Accounts Description Staff
Actual Staff
Estimated Actual Staff Final Budget
5118080000 Administrative Specialist 2.00 163,514 - - - - 5118130000 Assistant Directors 1.00 95,701 - - - - 5118170000 Coordinators and Specialists 3.00 245,342 3.00 295,000 3.00 295,000 5118190000 Directors 4.00 311,947 4.00 495,000 4.00 495,000 5118855000 Coordinator I 1.00 50,241 1.00 90,000 1.00 90,000 5118860000 Coordinator II 6.00 446,728 1.00 95,000 1.00 95,000 5118865000 Coordinator III 11.00 1,311,965 6.00 550,000 6.00 550,000 5117010000 Analysts/Planners 2.00 125,112 - - - 55,000 5117030000 Classified - 10,769 - 235,000 - 310,000 5117400000 Data Management Specialist 5.00 344,920 2.00 145,000 2.00 145,000 5117405000 Systems Analysts/Specialists 1.00 95,048 1.00 100,000 1.00 100,000 5117430000 Telecommunications - 43,024 - - - - 5117650000 Secretarial and Clerical 15.00 821,886 10.00 515,000 11.00 565,000 5117725000 Classified Labor 30.00 2,381,070 3.00 2,121,000 3.00 1,729,000 5117800000 Grounds - - - 4,000 - - 5117805000 Maintenance 14.00 1,413,514 33.00 2,640,000 33.00 4,650,000 5117905000 Inspectors 17.00 1,393,031 5.00 405,000 5.00 405,000 5200000000 Employee benefits - 2,665,100 - 2,264,500 - 3,026,000 5300000000 Professional and techincal services - 5,164,193 - 3,395,000 - 10,105,000 5400000000 Property services - 75,627,260 - 28,353,000 - 56,430,000 5500000000 Other purchased services - 56,584 - - - - 5600000000 Supplies - 11,435,910 - 6,435,000 - 8,595,000 5700000000 Property/equipment - 14,637 - 985,000 - 815,000 5800000000 Other expenses - 43,139 - 32,500 - 95,000 5910000000 Interfund transfers - 112,681,421 - 95,465,000 - 84,000,000
Total Capital Budget 112.00 $216,942,058 69.00 $144,620,000 70.00 $172,550,000 Source: CCSD Facilities and Bond Financial Management

138 | Clark County School District
Capital Projects Funds - Projected BudgetsFor Fiscal Years 2014-15 Through 2017-18Fund Expenditure Appropriations by Major Object
Description2014-15Budget
2015-16Projected
2016-17Projected
2017-18Projected Growth Rate
Revenues:Real estate transfer taxes $ 22,175,000 $ 18,250,000 $ 18,500,000 $ 19,000,000 2.7 %Hotel room taxes 72,000,000 66,500,000 66,750,000 67,000,000 0.4 %Governmental services taxes 23,400,000 22,000,000 22,500,000 23,000,000 2.2 %Interest on investments 1,095,000 1,000,000 750,000 500,000 (33.3)%Other local revenues 195,000 50,000 50,000 50,000 - %Federal Revenues 6,075,000 6,075,000 6,070,000 6,070,000 - %Total Revenues 124,940,000 113,875,000 114,620,000 115,620,000 0.9 %
Expenditures:Salaries 9,484,000 3,000,000 3,000,000 3,000,000 - %Employee benefits 3,026,000 1,000,000 1,000,000 1,000,000 - %Purchased services 66,535,000 11,700,000 11,700,000 11,700,000 - %Supplies 8,595,000 5,255,000 5,255,000 5,255,000 - %Property and equipment 815,000 750,000 750,000 750,000 - %Other expenditures 95,000 245,000 245,000 245,000 - %Total Expenditures 88,550,000 21,950,000 21,950,000 21,950,000 - %
Excess (Deficiency) of Revenuesover Expenditures 36,390,000 91,925,000 92,670,000 93,670,000
Other Sources and (Uses):Transfers from other funds 1,600,000 - - - Transfers to other funds (84,000,000) (81,945,000) (81,955,000) (81,700,000)Total Other Sources and (Uses) (82,400,000) (81,945,000) (81,955,000) (81,700,000)
Opening Fund Balance - July 1 270,651,871 224,641,871 234,621,871 245,336,871
Ending Fund Balance - June 30 $224,641,871 $234,621,871 $245,336,871 $257,306,871

Fina
ncia
l Sec
tion
1392014-15 Comprehensive Annual Budget Report |
Proprietary Funds
The Proprietary Funds are comprised of the Food Services Fund (Enterprise Fund) and the Graphic Arts Center and Risk Management Funds (Internal Service Funds).
Enterprise Fund
An enterprise fund may be used to report any activity for which a fee is charged to external users for goods or services.
Food Services Fund
The Food Services Department constantly strives to have one of the most progressive school food programs in the nation. Responding to changing federal regulations and customer preferences is a combination that has worked well over the years. Providing exceptional customer service is of the utmost importance.
Students, administrators, and members of the community are involved in the constant evolution of the program. Department employees take particular pride in their work and maintain a creative approach to the business of providing meals to students.
Strong emphasis is placed on operating in a fiscally responsible manner by each kitchen manager. Food quality and customer service have high priority. The Department recognizes that the most important function is to meet nutritional needs of students.
Meals ServedNational School Lunch/Breakfast Programs Only
Year Breakfast LunchTotal Meals
Served2009-10 6,765,638 24,136,029 30,901,6672010-11 7,651,544 27,244,928 34,896,4722011-12 10,878,516 27,615,003 38,493,5192012-13 11,780,339 27,385,650 39,255,9892013-141 12,226,500 28,208,500 40,435,000
1 Estimated
Mission Statement
We serve nutritious meals with outstanding customer service while maintaining cost effectiveness.
Motto: Food Service - Fuel for student achievement
The Fund is an enterprise fund used to account for food service operations that are financed and operated in a manner similar to private business enterprise, where net income is necessary for sound financial administration. The Department is expected to be self supporting and does not receive funds from the General Fund. The primary sources of revenue are cash sales and USDA subsides.
The Department serves approximately 225,000 breakfasts, lunches, and snacks each day to students of the District.
The Department continues successful business operations through 1) proper staffing, 2) best business practices, and 3) responsible financial decisions. However, we never forget that our main mission is to feed students nutritious meals while maintaining cost effectiveness.
Fiscal Year 2013-14 Accomplishments:• Increased online meal benefit applications by 5 percent.• Awarded the 6 Cent Menu Certification from USDA.• Processed over 212,000 applications for free or reduced
price meals.• Increased the security of the administrative & production
facility.• Served an average of 67,925 breakfasts per day on the
School Breakfast Program (SBP) and served an average of 156,714 lunches per day on the National School Lunch Program (NSLP), (225,000 meals daily).
• Experienced an 11 percent decrease in waste.• Continued to improve food quality through kid tested surveys
and requested newer recipes from food manufacturers that meet USDA changing requirements.
• Began meal service to Quest Academy and the Clark County Juvenile Justice Services increasing total charter services to five schools.
• Decreased department accidents by 12 percent.• Implemented Timekeeper, a timecard system to improve
time card payroll management and absence through electronic reporting processing.
• Continued to operate in a self supporting manner.• Maintained all kitchens at “A” rating on Southern Nevada
Health Inspections with 71% receiving “0” demerits.• Initiated marketing section and hired manager and UNLV
interns.• Increased Central Kitchen production by 31 percent. • Experienced an increase in special meal preparation of 37
percent.

140 | Clark County School District
Fiscal Year 2014-15 Objectives:• Implement project to expand the Central Kitchen and
Warehouse facilities.• Begin contracted food service to Lincoln County School
District at their request.• Implement automated food service personnel system.• Increase the lunch participation rate by 5 percent (71,300
meals).• Increase the breakfast participation rate by 5 percent
(164,550 meals).• Purchase 53 foot emergency meal production & delivery
trailer.• Reestablish catering section.• Continue to upgrade equipment and vehicle/trailer fleet.• Establish guard force for the Tropical facility (Warehouse
storage and Central Kitchen preparation).• Establish real time food service purchasing section to
increase best business practices. • Maintain financial solvency.
The increase in net assets is a result of Food Services being awarded the 6 Cent Menu Certification, for complying with the meal requirements for the National School Lunch Program under the Healthy, Hunger Free Kids Act of 2010. There was also a shift to higher margin free meals from full pay meals reflecting the general economic conditions in the District during fiscal year 2014.
Food Services Fund - Summary of Income, Expenses, And Changes In Net AssetsFor Fiscal Years 2012-13 Through 2014-15
Food Service Description
2012-13 Actuals
Staff Amount
2013-14Estimated Actuals
Staff Budget
2014-15Final Budget
Staff Budget2013-14 vs. 2014-15
$ Change % ChangeOperating Income:
Sales $17,415,957 $19,380,000 $19,540,000 $160,000 0.8 %
Operating Expenses: Salaries 439.87 25,194,870 531.38 29,140,000 513.80 26,295,000 (2,845,000) (9.8)% Employee benefits 9,650,179 11,725,000 10,205,000 (1,520,000) (13.0)% Purchased services 4,612,141 4,320,000 4,325,000 5,000 0.1 % Supplies 61,283,203 64,470,000 65,940,000 1,470,000 2.3 % Depreciation 1,874,252 2,200,000 2,200,000 - - % Other expenses 2,592,253 2,820,000 2,980,000 160,000 5.7 % Total Operating Expenses 105,206,898 114,675,000 111,945,000 (2,730,000) (2.4)%
Operating Loss (87,790,941) (95,295,000) (92,405,000) 2,890,000 3.0 %
Nonoperating Income: Federal subsidies 86,588,858 90,500,000 91,400,000 900,000 1.0 % Commodities received 7,491,229 7,500,000 7,575,000 75,000 1.0 % State subsidies 919,538 450,000 450,000 - - % Investment income 12,335 100,000 135,000 35,000 35.0 % Other income (581,604) - - - - % Total Nonoperating Income 94,430,356 98,550,000 99,560,000 1,010,000 1.0 %
Net Gain (Loss) 6,639,415 3,255,000 7,155,000 3,900,000 (100.0)%Transfers from other funds 1,086,387 1,150,000 1,150,000 - - %Beginning Net Assets 49,777,776 57,503,578 61,908,578 4,405,000 7.7 %
Ending Net Assets 439.87 $57,503,578 531.38 $61,908,578 513.80 $70,213,578 $8,305,000 13.4 % Source: CCSD Budget and Accounting Departments

Fina
ncia
l Sec
tion
1412014-15 Comprehensive Annual Budget Report |
Internal Service Funds
Internal Service Funds are used to account for the financing of goods or services provided by one department or agency of a government to other departments or agencies on a cost-reimbursement basis. Budgeting for Internal Service Funds is designed to accumulate the total cost of operations for providing a particular service. Graphics Production services and Risk Management operations currently provide the activities for this fund.
Graphic Arts Center Fund
Mission
The mission of the Graphic Arts Center is to provide superior services and support for the students and employees of the District with a continuing commitment to improvement and education; to serve as responsible custodians of taxpayer funds ensuring maximum value for each dollar spent; and uphold the highest ethical and legal standards ensuring that all suppliers and customers are treated equally and fairly.
Services
The Center is comprised of several sections including Design, Printing, Copying, and Forms. The Printing and Copying sections utilize large graphic machinery, including high-speed copiers and multi-color presses, to serve the District’s requirements.
Fiscal Year 2013-14 Accomplishments:• Initiated more cost efficient equipment configuration• Developed new product lines• Consolidated operations• Increased usage of online ordering tool• Reduced salary expense to align with lower revenues
Fiscal Year 2014-15 Objectives:• Install more capable, lower cost copy center equipment• Identify new capabilities to generate customer savings • Continue staff development in all areas• Expand online direct-to-print offerings• Continue to monitor income and expenses and adjust as
needed
Performance Measures 2011-12 2012-13 2013-14Copy center income $ 764,607 $ 716,043 $ 657,159Printing income 766,052 657,760 596,526Graphic service income 11,760 20,640 23,640Color copy income 185,927 226,118 191,132Subcontracting income 43,396 104,137 110,170Art and darkroom Income 143,158 115,527 100,741
Total income $1,868,281 $1,853,600 $1,679,368
Salary expenses $1,329,314 $1,125,294 $949,217
Risk Management Fund
Mission Statement
The mission of Risk Management is to effectively protect the District’s human, financial, and physical assets and resources from the consequences of losses.
Services
The Department is responsible for identifying the risk exposures of the District and recommending the most efficient and cost effective methods for handling those exposures. Methods include transferring risk through the purchase of insurance; assisting other departments with loss control; and administering the self-insured claims for property damages, public liability, motor vehicle liability, school board legal liability, workers’ compensation, boiler and machinery, and crime.
The Department continued to provide the following services in accordance with its mission using the most efficient and cost effective methods:
• Providing loss control services for other departments, including risk assessments and safety training
• Administering the self-insured claims for property damages, public liability, motor vehicle liability, school board legal liability, workers’ compensation, boiler and machinery, and crime
• Transferring risk though the purchase of insurance• Collaborating with local, State, and federal agencies to
ensure compliance with all applicable safety and health requirements
Fiscal Year 2013-14 Accomplishments:• Collaborated with the Purchasing Department to request
proposals from prospective suppliers for the workers’ compensation pharmacy benefit management program, managed care organization, and medical bill review services and negotiated the terms of a new agreements
• Reviewed new industrial insurance laws enacted during the 2013 Nevada Legislative Session and made revisions to current procedures; including, but not limited to revising forms and informing employees of changes
• Further developed the safety assessment tracking portion of the RMIS, including a location hierarchy for District sites that is current and all inclusive
• Coordinated the merger of Environmental Services and Risk Management staff and functions to reduce redundancies and capture information more efficiently
• Began work on providing a more effective return-to-work program for employees who have been injured on the job
• Continued the development of the online chemical inventory system to include other areas within schools

142 | Clark County School District
Fiscal Year 2014-15 Objectives:• Convert the self-administered claims management
program to a Third Party Administrator for the processing of all workers compensation and liability claims
• Complete the integration of the environmental duties into the Department’s standardized procedures and become the Risk & Environmental Services Department
• Collaborate with the Purchasing Department to request proposals from prospective suppliers for the insurance broker services and investigate other methods of risk financing
• Integrate historical information from the environmental services unit into RIMS and eliminate numerous paper records
• Work with the new Third Party Administrator and Human Resources to develop a more effective return-to-work program for employees who have been injured on the job
• Launch a District-wide campaign to inform employees of changes to the administration of the workers compensation program
Internal Service Funds - Summary Of Income, Expenses, And Changes In Net AssetsFor Fiscal Years 2012-13 Through 2014-15
Internal Service Description
2012-13Actuals
Staff Amount
2013-14Estimated Actuals Staff Budget
2014-15Final Budget
Staff Budget2013-14 vs. 2014-15
$ Change % ChangeOperating Income: Local sources $16,751,869 $17,830,000 $17,830,000 $ - - %
Operating Expenses: Salaries 53.00 3,236,860 76.25 4,010,000 92.25 5,535,000 1,525,000 38.0 % Employee benefits 1,207,078 1,525,000 2,190,000 665,000 43.6 % Purchased services 4,066,128 4,575,000 7,335,000 2,760,000 60.3% Supplies 824,057 765,000 775,000 10,000 1.3 % Property - 100,000 100,000 - - % Depreciation 133,088 45,000 45,000 - - % Other expenses 11,424,992 14,730,000 14,190,000 (540,000) (3.7)%
Total Operating Expenses 20,892,203 25,750,000 30,170,000 4,420,000 17.2 %
Operating Income (Loss) (4,140,334) (7,920,000) (12,340,000) (4,420,000) (55.8)%
Nonoperating income 33,441 140,000 185,000 45,000 32.1 %
Beginning Net Assets 24,420,218 20,313,325 12,533,325 (7,780,000) (38.3)%
Ending Net Assets 53.00 $20,313,325 76.25 $12,533,325 92.25 $378,325 $(12,155,000) (97.0)%Source: CCSD Budget and Accounting Departments
Performance Measures 2011-12 2012-13 2013-14Number of Claims Property/Liability count 1,535 1,491 1,522 Workers’ Compensation count 1,412 1,455 1,403Total Insurance PremiumsProperty, Liability, and Workers’ Compensation $2,429,456 $2,448,503 $2,471,987Claim Count Ratio Property/Liability per $1,000 Premium 0.63 0.62 0.62 Workers’ Compensation per $100,000 10.86 10.21 10.54Third-Party Recoveries Property/Liability $235,918 $178,533 $219,282 Workers’ Compensation $158,755 $227,396 $187,763Managed Care Savings Workers’ Compensation $1,337,915 $1,978,550 $1,723,007
The decrease of net assets is a result of an anticipated increase in risk assessment services and the purchase and implementation of the student health office software program and related equipment. The Department, in its expanded role, also has added staffing increases for risk control positions, including safety assessments and training, and environmental compliance operations transferred from the General Operating Fund. It is anticipated that insurance premiums will need to be increased during 2014-15.

Allocations and Schedules: Explanation of Budget Allocations .......................................................................147 Full Time Equivalents Calculation .......................................................................147 Annual Teacher Salary Schedule ........................................................................148 Teacher Duty Days ..............................................................................................149 Budget Formulas for Allocating Licensed School Personnel ...............................153 Secondary Magnet School Formula Enhancements ...........................................154 Administrative Titles and Salary Ranges .............................................................155 Administrative Salary Schedules - Monthly Salaries ...........................................158 Professional Technical Salary Schedules - Monthly Salaries ..............................158 Support Staff Personnel Titles and Salary Pay Grades.......................................159 Support Staff Personnel Pay Grades and Hourly Rates .....................................165 Budget Formulas for Allocating Support Staff Personnel ....................................166 Fringe Benefit Rates ...........................................................................................170 Budget Formulas for Allocating School Supplies and Equipment .......................171 Impact of New Schools on the General Operating Fund .....................................173
Statistical Data: Birth History – Clark County ................................................................................176 Projected Enrollment by Grade ...........................................................................176 Summary of District Enrollment ..........................................................................176 District Enrollment - Average Daily Membership .................................................177 Ethnic Distribution by Grade ...............................................................................177 High School Graduates ......................................................................................178 Criterion Referenced Tests ..................................................................................179 Districtwide Survey ..............................................................................................180 State vs. Local Revenues ..................................................................................181 Property Tax Levies and Collections ...................................................................181 History of Assessed Valuation .............................................................................181 History of Local Tax Support Per Pupil ................................................................182 Impact of Tax Rate on Taxpayers ........................................................................182 History of State Aid ..............................................................................................182 Indices of Economic Growth in Clark County ......................................................183 History of Utility Costs .........................................................................................183 General Operating Fund - Projected Budgets .....................................................184 Special Revenue Funds - Projected Budgets .....................................................185 Debt Service Funds - Projected Budgets ............................................................185 Capital Projects Funds - Projected Budgets .......................................................186 Schedule of Staff Positions - General Fund ........................................................187 Schedule of Staff Positions - Other Funds ..........................................................188 Educational Level of Teaching Staff ....................................................................188 History of Teachers’ Salary Schedules ................................................................189 Teacher Salary Schedule – Full-Time Teacher Placement ..................................189 Schedule of General Obligation Bonds Outstanding ...........................................190 Combined Amortization Schedule .......................................................................191 School Locations Within County .........................................................................193 High School Attendance Boundaries ...................................................................194 Middle/Junior High School Attendance Boundaries ............................................195 Elementary School Attendance Boundaries ........................................................196 Assigned Schools for Outlying Communities ......................................................197 Summary of Schools by Age and Size ................................................................198 School Location and Enrollment Information ......................................................199 2014-15 School Calendars ..................................................................................200
Informational
Info
rmat
iona
l Sec
tionSection
1432014-15 Comprehensive Annual Budget Report |

144 | Clark County School District
This page is intentionally left blank

In this sub-section, the District employs budgeting methods based on formulated allocations and bargaining contracts. Those formulated allocations and salary information are presented in this section in coordination with District policy.
Explanation of Budget Allocations .........................................................147Full Time Equivalents Calculation .........................................................147Annual Teacher Salary Schedule ..........................................................148Teacher Duty Days ................................................................................149Budget Formulas for Allocating Licensed School Personnel .................153Secondary Magnet School Formulas Enhancements ...........................154Administrative Titles and Salary Ranges ...............................................155Administrative Salary Schedule Base - Monthly Salaries .....................158Professional Technical Salary Schedule Base - Monthly Salaries ...................................................158Support Staff Personnel Titles and Salary Pay Grades .........................159Support Staff Personnel Pay Grades and Hourly Rates .......................165Budget Formulas for Allocating Support Staff Personnel ......................166Fringe Benefit Rates ..............................................................................170Budget Formulas for Allocating School Supplies and Equipment .......................................................171Impact of New Schools on the General Operating Fund .......................173
Allocations and Schedules
1452014-15 Comprehensive Annual Budget Report |
Info
rmat
iona
l Sec
tion

146 | Clark County School District
This page is intentionally left blank

Info
rmat
iona
l Sec
tion
1472014-15 Comprehensive Annual Budget Report |
Professional Compensation
• Only advanced degrees awarded by an accredited institution recognized by the Commission on Professional Standards in Education in a field pertinent to the position and valid in their entirety for Nevada certification for level and subject taught will be recognized for advancement on the salary schedule.
• The basis of the professional schedule is the Bachelor’s degree or its recognized equivalent. Only units secured after the requirements for the degree have been completed for the degree, except in fields certified in writing by the Human Resources Division of critical need in upper division or graduate courses recognized by the Commission on Professional Standards in Education, will be recognized for placement in Classes B, C, D, E, F, and G. Increment growth units are granted for approved in-service courses or workshops approved by the Division to upgrade or improve the educational program.
• Teachers hired to teach the 2014-15 school year shall receive a maximum of nine years qualifying experience (Step 10) and be placed in the appropriate class column. This provision shall not apply at the option of the District to teachers hired to provide service in the areas of bilingual education and the specialty licensed areas of special education, specifically excluding resource room and GATE.
Explanation of Budget Allocations
The Regulation 3130, Budget Administration, adopted by the Board on June 28, 2001, specifies that:
“Procedures should be developed to ensure that the General Fund resources of the Clark County School District are used to support a basic instructional program consistent with the Global Ends of the Board of School Trustees and to ensure that budget accounts will be properly managed.”
In order to implement this statement, formulas for the allocation of personnel and supplies are used. These formulas cover the major items of salaries and supplies. Positions not covered by formulas are specifically authorized by Board action on the budget.
The District recognizes four employee bargaining groups and determines full-time equivalent positions in respect to correlating employee group contracts. The licensed employee contract specifies a non-conventional full-time equivalent position displayed below:
Nine, ten, and eleven-month support staff employees are reflected as a percentage of full FTEs. The following table can be used to determine full-time equivalents:
Full Time Equivalents Calculation - Non-LicensedFiscal Year 2014-15
Employment Months Hours Per Day Nine Ten Eleven Twelve
1.0 0.09 0.11 0.11 0.131.5 0.14 0.16 0.17 0.192.0 0.19 0.21 0.23 0.252.5 0.23 0.26 0.29 0.313.0 0.28 0.32 0.34 0.383.5 0.33 0.37 0.40 0.444.0 0.37 0.42 0.46 0.504.5 0.42 0.47 0.52 0.565.0 0.46 0.53 0.57 0.635.5 0.51 0.58 0.63 0.696.0 0.56 0.63 0.69 0.756.5 0.60 0.68 0.75 0.817.0 0.65 0.74 0.80 0.887.5 0.70 0.79 0.86 0.948.0 0.74 0.84 0.92 1.00
Informational Section
Full Time Equivalents Calculation - LicensedFiscal Year 2014-5
Employment Days Hours Per Day 184 Days3.59 0.507.18 1.00

148 | Clark County School District
Licensed employees completing the following years of District service will be eligible for longevity compensation for which PERS contributions will be made:
Annual Teacher Salary ScheduleFiscal Year 2014-15
Class A Class B Class C Class D Class E Class F Class G Class H Class IB.A. B.A.+16 B.A.+32 M.A. M.A.+16 M.A.+32 PH D ASC ASC + PH D
1 $34,684 $36,545 $38,409 $40,276 $42,144 $44,508 $46,008 $47,654 $49,154 2 36,134 37,994 39,863 41,726 43,600 46,208 47,708 49,353 50,853 3 37,582 39,452 41,312 43,181 45,046 47,909 49,409 51,054 52,554 4 39,038 40,901 42,763 44,630 46,492 49,604 51,104 52,749 54,249 5 40,482 42,349 44,215 46,082 47,945 51,306 52,806 54,451 55,951 6 43,805 45,677 47,531 49,397 53,006 54,506 56,151 57,651 7 47,118 48,984 50,848 54,706 56,206 57,852 59,352 8 48,567 50,433 52,298 56,405 57,905 59,552 61,052 9 50,020 51,890 53,748 58,103 59,603 61,249 62,749 10 59,911 61,411 63,056 64,556 11 61,501 63,001 64,646 66,146 12 63,550 65,050 66,697 68,197 13 64,822 66,322 67,968 69,468 14 66,119 67,619 69,265 70,765
Class A Bachelor’s degree and valid Nevada certification for the level or subject taught
Class B Bachelor’s degree plus 16 increment growth units and valid Nevada certification for the level or subject taught. Units must be taken after receipt of bachelor’s degree.
Class C Bachelor’s degree plus 32 increment growth units and valid Nevada certification for the level or subject taught
Class D Master’s degree from an accredited institution in a field pertinent to position and valid Nevada certification for level or subject taught
Class E Master’s degree plus 16 increment growth units and valid Nevada certification for level or subject taught, or completion of one Advanced Studies Certification 18-hour program. Units must be taken after receipt of master’s degree.
Class F Master’s degree plus 32 increment units and valid Nevada certification for level or subject taught, or completion of two Advanced Studies Certification 18-hour programs.
Class G Doctorate degree from an accredited institution in a field pertinent to position and valid Nevada certification for level or subject taught.
Class H Advance Studies CertificationClass I Advance Studies Certification plus Doctorate Degree
District Service Amount10-15 $ 75016-20 1,000 21-25 1,50026+ 2,000
Definition Of Classes:Licensed employees completing the following years of district service will be eligible for longevity compensation for which PERS contributions will be made:

Info
rmat
iona
l Sec
tion
1492014-15 Comprehensive Annual Budget Report |
Teacher Duty Days
Teacher Work Year
The work year of the employees covered by the classroom teacher salary schedule (other than new personnel who may be required to attend five additional orientation days) shall consist of not more than 184 school days and shall be distributed according to the calendar determined and officially adopted by the Board.
A. Senior High School - Extended Day Pay
Percent of Class A,
Step 1, Base Salary
Yearly Rates
Number of Positions
Authorized for Schools
Head Football (M) .093 $3,226 1Head Basketball (M) .093 3,226 1Head Baseball (M) .079 2,740 1Head Track (M) .084 2,913 1Head Wrestling (M) .084 2,913 1Head Soccer (M) .079 2,740 1Head Tennis (M) .054 1,873 1Head Golf (M) .056 1,942 1Head Cross Country (M) .068 2,359 1Head Swimming (M) .063 2,185 1Head Volleyball (M) .075 2,601 1Assistant Football (M) .070 2,428 AAAA-6, AAA-
5, AA-4, A-4Assistant Basketball (M) .070 2,428 2Assistant Baseball (M) .061 2,116 2Assistant Track (M) .063 2,185 AAAA-2, AAA-
2, AA-1, A-1Assistant Wrestling (M) .063 2,185 AAAA-2, AAA-
2, AA-1, A-1Assistant Soccer (M) .059 2,046 1Assistant Volleyball (M) .061 2,116 19th Grade Basketball (M) .043 1,491 19th Grade Volleyball (M) .038 1,318 19th Grade Basketball (W) .043 1,491 19th Grade Volleyball (W) .038 1,318 1Head Bowling (M & W) .065 2,254 1Head Basketball (W) .093 3,226 1Head Volleyball (W) .075 2,601 1Head Softball (W) .079 2,740 1Head Track (W) .084 2,913 1Head Soccer (W) .079 2,740 1Head Tennis (W) .054 1,873 1Head Golf (W) .056 1,942 1Head Cross Country (W) .068 2,359 1Head Swimming (W) .063 2,185 1Assistant Basketball (W) .070 2,428 2Assistant Volleyball (W) .061 2,116 2Assistant Softball (W) .061 2,116 2Assistant Track (W) .063 2,185 AAAA-2, AAA-
2, AA-1, A-1Assistant Soccer .059 2,046 1Band1 (Over 500) .097 3,364 1Band1 (Under 500) .082 2,844 1Chorus1 .063 2,185 1Mariachi/Guitar1 (Over 500) .043 1,491 1Mariachi/Guitar1 (Under 500)
.040 1,387 1
Yearbook1 .075 2,601 1Drama/Theatre1 .080 2,775 1Newspaper1 .056 1,942 1Pep Club1 .032 1,110 1Cheerleader1 .058 1,012 1JV/9th Grade Cheerleader1 .043 1,491 1
Hours of Work
Employees on the teachers’ salary schedule shall be required to work at the school premises a regular workday of seven hours and eleven minutes, including the 30-minute duty-free lunch period that is provided.
In addition to their regular teaching contract, teachers have the opportunity to earn extra compensation in the following areas:
A. Senior High School - Extended Day Pay -
Continued
Percent of Class A,
Step 1, Base Salary
Yearly Rates
Number of Positions
Authorized for Schools
Forensics/Speech Club1 .057 $1,977 1Dance/Drill Team1 .047 1,630 1Student Council1 .080 2,775 1Key Club1 .030 1,041 1Human Relations1 .030 1,041 1Varsity Quiz1 .043 1,491 1Athletic Director1 .104 3,607 1Orchestra1 .060 2,081 1Chess Club1 .043 1,491 1FBLA1 .043 1,491 1Science Bowl1 .028 971 1Honor Society1 .030 1,030 1ROTC1 .061 2,095 2DECCA1 .043 1,491 1VICA/Skills of America1 .043 1,491 1FCCLA1 .043 1,491 1HOSA .043 1,491 1
(1) Does not qualify for years of experience
The year of experience stipend for athletics shall be based on the Index, Class A, Step 1 Base Salary as follows:
Teaching Experience
Percent of Class AStep 1 -
Base Salary Yearly Rates1-3 .0039 $1354-6 .0078 2717-9 .0117 406
10-12 .0156 54113 or Over .0195 676

150 | Clark County School District
C. Payment for Directing Intramural Programs
1. Determination of Intramural Allotment to Schools
The amount of funds available to secondary schools for extended day pay to direct intramural programs shall be based on projected student enrollment at the rate of 92¢ per student. Allotments will be based on the actual October 1st enrollment. No secondary school shall receive less than $495.
2. Determination of Payment to Individual Teachers
Extended day pay for directing intramural activities will be based on the number of days per week an activity is supervised throughout the school year according to the following guidelines:
Number of Days Per Week
Directing ActivityNumber of
Weeks Total Amount1 36 $ 2752 36 5493 36 8254 36 1,0995 36 1,374
B. Middle School - Extended Day Pay
Percent of Class A,
Step 1, Base Salary
Yearly Rates
Number of Positions
Authorized for Schools
7th/8th Grade Basketball (M)
.042 $1,457 1
7th/8th Grade Softball (M) .039 1,353 17th/8th Grade Tennis (M & W)
.027 936 1
7th/8th Grade Track (M) .033 1,145 17th/8th Grade Basketball (W)
.042 1,457 1
7th/8th Grade Volleyball (W)
.038 1,318 1
7th/8th Grade Track (W) .033 1,145 17th/8th Grade Softball (W) .039 1,353 1Band1 .063 2,185 1Chorus1 .042 1,457 1Newspaper1 .038 1,318 1Human Relations1 .028 971 1Forensics1 .028 971 1Yearbook1 .028 971 1Orchestra1 .040 1,387 1Cheerleader1 .028 971 1Drama1 .028 971 1Dance/Drill Team1 .028 971 1Chess Club1 .028 971 1Honor Society1 .028 971 1FBLA1 .028 971 1Student Council1 .038 1,318 1Mariachi/Guitar1 .040 1,387 1JV Quiz1 .028 971 1(1) Does not qualify for years of experience
Schools may utilize two volunteer coaches per team per season. The following positions are in addition to any volunteer coaches: statisticians, video personnel, student teachers, and athletic trainers.
D. Extra Pay for Licensed Personnel in Special Categories:
1. Secondary Counselors
Each full-time counselor shall be assigned nine additional days of service at the employee’s daily rate of pay. PERS and other legally required contributions shall be made for these days from the negotiated salary package.
2. Librarians
Librarians shall be assigned additional days of service to be paid at the employee’s daily rate of pay according to the following formula:
Projected Enrollment Additional Days AllottedUnder 500 3.5500 - 999 7.0
1,000 - 1,499 10.51,500 and over 14.0
The additional days may be broken down in additional hours upon agreement between the librarian and the principal according to the following schedule:
3.5 days or 24.5 hours at hourly rate7.0 days or 49.0 hours at hourly rate10.5 days or 73.5 hours at hourly rate14.0 days or 98.0 hours at hourly rate
PERS and other legally required contributions shall be made for these days.
3. Occupational Teachers
Teachers who are full-time teachers of occupational subjects, and who hold occupational licensure with an endorsement in business and industry, and meet the following requirements in the area taught, shall receive $682 in addition to their base contract salary. A trade and technical work experience background, which includes three years of continuous paid experience at the journeyman level in addition to three to five years at the apprentice learning level. This provision applies only to teachers employed as vocational teachers prior to the 1977-78 school year.
4. Teachers Requiring Special Licensing (Psychologist, Speech Therapists, Special Ed. Teachers, and Nurses)
Teachers assigned to these specialist areas who hold proper licensing shall receive $220 in addition to their base contract salary. This provision shall apply only to teachers employed in these positions prior to the 1977-78 school year.

Info
rmat
iona
l Sec
tion
1512014-15 Comprehensive Annual Budget Report |
8. Speech Therapists, Nurses, and Psychologists
Teachers in these specialist areas assigned to year-round schools shall be given one year at a time extended contracts with PERS paid.
E. Extra Pay for Instructional Services
Activity Hourly Rate1. Continuing Education Instruction $222. In-Service Training Instruction 223. Summer School 224. Graduate Incentive Program 225. Other Approved Instructional Services:
a. Homebound Extended Day Teachers 22b. Itinerant Teachers 22c. Committees, Task Forces, PDE Instructors
22
d. Approved Instructional Services (not listed)
22
6. Extra Duty Teaching Assignments:a. Early Bird/Late Bird Teacher’sb. “Behavior School” Instruction Contractc. “Sunset High School” Instruction Hourly Rated. Juvenile Court School Programs of Paye. Purchased Preparation Periodf. Extended School Year, Summer
F. Extra Pay for Ticket Takers and Sellers
Varsity Athletic Contests $10 per hour
5. Teachers Assigned to Remote Areas
Teachers assigned to schools in remote or isolated areas shall receive an incentive allotment of $2,000 in addition to their base contact salary. Following are the areas of the County applicable to remote pay:
Blue Diamond Southern Desert Correctional Center
Sandy Valley
Goodsprings Laughlin SearchlightHigh Desert State
PrisonMoapa Valley Spring Mountain
Indian Springs Mt. Charleston Virgin Valley Effective with the 1992-93 school year, teachers at Blue Diamond will no longer receive remote pay. Those teachers at Blue Diamond prior to the 1992-93 school year shall continue to receive remote pay as long as they are employed at Blue Diamond.
6. Responsible Teachers
A small school with a staff of one to four teachers shall have one teacher designated as the responsible teacher. Responsible teachers shall receive additional pay added to their base contract salary according to the following formula added to their base contract:
Number of TeachersAdditional Pay as a Fraction of Teacher’s
Contract Salary1 1/252 1/203 1/154 1/10
7. School Bankers
Teachers assigned as school bankers to provide banking and accounting services at athletic events at senior high schools shall be compensated at the rate of $10 per hour. The maximum number of assigned hours per event shall be based on student enrollment as indicated below:
Student Enrollment Hours Allocated1,200 or more 4 hours
1,199 – 600 3 hours599 and below 2 hours

152 | Clark County School District
G. Funds for Additional Extended Day Student ActivitiesName of School AmountAdvanced Technologies Academy $2,500Arbor View High School 2,500Basic High School 2,500Bonanza High School 2,500Boulder City High School 1,500Canyon Springs High School 2,500Centennial High School 2,500Chaparral High School 2,500Cheyenne High School 2,500Cimarron-Memorial High School 2,500Clark High School 2,500Coronado High School 2,500Del Sol High School 2,500Desert Oasis High School 2,500Desert Pines High School 2,500Desert Rose High School 1,500Durango High School 2,500East Career and Technical Academy 2,500Eldorado High School 2,500Foothill High School 2,500Green Valley High School 2,500Indian Springs Junior/Senior High School 1,000Las Vegas Academy 1,500Las Vegas High School 2,500Laughlin High School 1,500Legacy High School 2,500Liberty High School 2,500Moapa Valley High School 1,500Mojave High School 2,500Northwest Career and Technical Academy 2,500Palo Verde High School 2,500Rancho High School 2,500Sandy Valley Junior/Senior High School 1,000Shadow Ridge High School 2,500Sierra Vista High School 2,500Silverado High School 2,500Southeast Career and Technical Academy 2,500Southwest Career and Technical Academy 2,500Spring Valley High School 2,500Sunrise Mountain High School 2,500Valley High School 2,500Veteran’s Tribute Career and Technical Academy 2,500Virgin Valley High School 1,500West Career and Technical Academy 2,500West Preparatory Academy 1,500Western High School 2,500Bailey Middle School 1,500Becker Middle School 1,500Bridger Middle School 1,500Brinley Middle School 1,500Brown Middle School 1,500Burkholder Middle School 1,500Cadwallader Middle School 1,500Canarelli Middle School 1,500Cannon Middle School 1,500
Name of School AmountCashman Middle School $1,500Cortney Middle School 1,500Cram Middle School 1,500Escobedo Middle School 1,500Faiss Middle School 1,500Ferttita Middle School 1,500Findlay Middle School 1,500Fremont Middle School 1,500Garrett Middle School 1,500Garside Middle School 1,500Gibson Middle School 1,500Greenspun Middle School 1,500Guinn Middle School 1,500Harney Middle School 1,500Hughes Middle School 1,500Hyde Park Middle School 1,500Johnson Middle School 1,500Johnston Middle School 1,500Keller Middle School 1,500Knudson Middle School 1,500Lawrence Middle School 1,500Leavitt Middle School 1,500Lied Middle School 1,500Lyon Middle School 1,500Mack Middle School 1,500Mannion Middle School 1,500Martin Middle School 1,500Miller Middle School 1,500Molasky Middle School 1,500Monaco Middle School 1,500O’Callaghan Middle School 1,500Orr Middle School 1,500Robison Middle School 1,500Rogich Middle School 1,500Saville Middle School 1,500Sawyer Middle School 1,500Schofield Middle School 1,500Sedway Middle School 1,500Silvestri Middle School 1,500Smith Middle School 1,500Swainston Middle School 1,500Tarkanian Middle School 1,500Von Tobel Middle School 1,500Webb Middle School 1,500White Middle School 1,500Woodbury Middle School 1,500
Total $187,500
Three hundred dollars shall be allocated to each elementary school and Prime Six School, Helen J. Stewart, Variety School, and John F. Miller. Each Community College High School and each alternative campus in the six regions shall be allocated $600 to be used for payment to the licensed personnel supervisor of all extended day student activities.
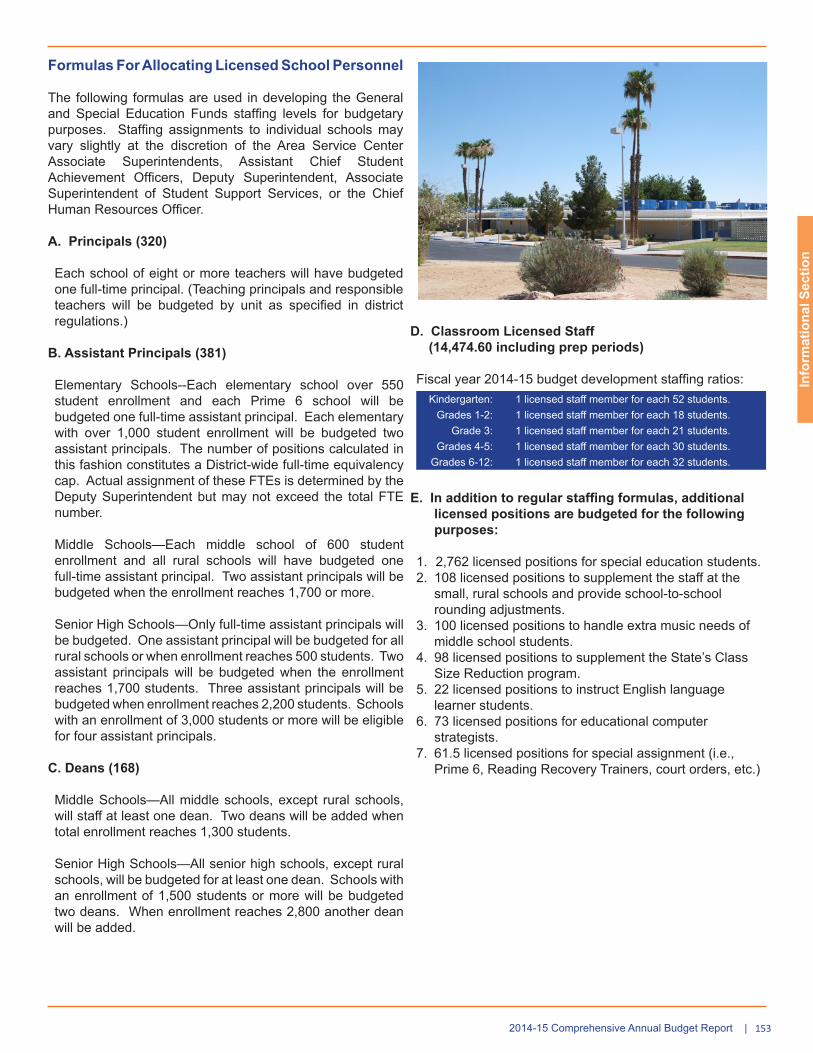
Info
rmat
iona
l Sec
tion
1532014-15 Comprehensive Annual Budget Report |
D. Classroom Licensed Staff (14,474.60 including prep periods)
Fiscal year 2014-15 budget development staffing ratios:Kindergarten: 1 licensed staff member for each 52 students. Grades 1-2: 1 licensed staff member for each 18 students. Grade 3: 1 licensed staff member for each 21 students. Grades 4-5: 1 licensed staff member for each 30 students. Grades 6-12: 1 licensed staff member for each 32 students.
E. In addition to regular staffing formulas, additional licensed positions are budgeted for the following purposes:
1. 2,762 licensed positions for special education students.2. 108 licensed positions to supplement the staff at the
small, rural schools and provide school-to-school rounding adjustments.
3. 100 licensed positions to handle extra music needs of middle school students.
4. 98 licensed positions to supplement the State’s Class Size Reduction program.
5. 22 licensed positions to instruct English language learner students.
6. 73 licensed positions for educational computer strategists.
7. 61.5 licensed positions for special assignment (i.e., Prime 6, Reading Recovery Trainers, court orders, etc.)
Formulas For Allocating Licensed School Personnel
The following formulas are used in developing the General and Special Education Funds staffing levels for budgetary purposes. Staffing assignments to individual schools may vary slightly at the discretion of the Area Service Center Associate Superintendents, Assistant Chief Student Achievement Officers, Deputy Superintendent, Associate Superintendent of Student Support Services, or the Chief Human Resources Officer.
A. Principals (320)
Each school of eight or more teachers will have budgeted one full-time principal. (Teaching principals and responsible teachers will be budgeted by unit as specified in district regulations.)
B. Assistant Principals (381)
Elementary Schools--Each elementary school over 550 student enrollment and each Prime 6 school will be budgeted one full-time assistant principal. Each elementary with over 1,000 student enrollment will be budgeted two assistant principals. The number of positions calculated in this fashion constitutes a District-wide full-time equivalency cap. Actual assignment of these FTEs is determined by the Deputy Superintendent but may not exceed the total FTE number.
Middle Schools—Each middle school of 600 student enrollment and all rural schools will have budgeted one full-time assistant principal. Two assistant principals will be budgeted when the enrollment reaches 1,700 or more.
Senior High Schools—Only full-time assistant principals will be budgeted. One assistant principal will be budgeted for all rural schools or when enrollment reaches 500 students. Two assistant principals will be budgeted when the enrollment reaches 1,700 students. Three assistant principals will be budgeted when enrollment reaches 2,200 students. Schools with an enrollment of 3,000 students or more will be eligible for four assistant principals.
C. Deans (168)
Middle Schools—All middle schools, except rural schools, will staff at least one dean. Two deans will be added when total enrollment reaches 1,300 students.
Senior High Schools—All senior high schools, except rural schools, will be budgeted for at least one dean. Schools with an enrollment of 1,500 students or more will be budgeted two deans. When enrollment reaches 2,800 another dean will be added.

154 | Clark County School District
F. Counselors (623.5)
Elementary Schools—The Board has approved establishing a goal of adding 15 elementary counselors each year until elementary schools have a counselor for every school over 500 enrollment. An increase was not included in this year’s development due to budgetary constraints.
Middle Schools—Counselors are budgeted for each middle school on the basis of one counselor for each 500 students or major fraction thereof based upon the fall enrollment. Evaluation of the number of counselors for middle schools will be made only once each year after the second week of the fall semester.
Senior High Schools—Counselors are budgeted to each senior high school on the basis of one counselor for each 400 students or major fraction thereof based upon the fall enrollment. Evaluation of the number of counselors for senior high schools will be made only once each year after the second week of the fall semester.
G. Library Services (287)
• Elementary schools with enrollment of at least 400 students shall be allocated one licensed staff unit (202).
• Each middle school shall be allocated one licensed staff unit (49).
• Senior High schools shall be allocated extra days of library services based upon the enrollment illustrated to the right (36):
Student Enrollment Days AllocatedUnder 500 students 3.5 days500 to 999 students 7.0 days1,000 to 1,499 students 10.5 days1,500 or more students 14.0 days
H. Homebound Teachers (17)
One teacher is budgeted to assist homebound students at the ratio of one for each 18,450 students or major fraction thereof.
I. Psychologists (174)
One school psychologist is budgeted for each 1,825 students or major fraction thereof.
J. Nurses (173)
One school nurse is budgeted for each 1,825 students or major fraction thereof.
K. Speech/Language Pathologists (332.5)
Speech/language pathologists are to be budgeted based on the prior school year’s ratio of actual student caseloads to actual handicapped enrollment. The resultant ratio (actual) is applied to the current school year’s estimated handicapped enrollments to determine estimated caseloads. The estimated caseloads are then divided by the maximum caseload mandate to determine speech therapist/pathologist requirements.
L. Summary of Pupil/Teacher Ratio Calculations
Regular classroom staffing: (Section D) = 14,474.60 District pupil/teacher ratios: (306,600 ÷ 14,474.60) = 21.18Regular classroom staffing with additional positions: (Sections D and E) = 17,698.67 District pupil/teacher ratio: (306,600 ÷ 17,698.67) = 17.32 District licensed - all positions: (Sections D - K) = 19,305.17District pupil/teacher ratio: (306,600 ÷ 19,305.17) = 15.88
Note: The 2001 Legislature provided funds toward reducing the pupil/teacher ratio in the early elementary grades (1-3). The Class Size Reduction funds and positions for 2014-15 are being channeled through the Special Revenue Funds, and therefore, are not reflected in the above calculations.
Secondary Magnet School Formula Enhancements
As a result of varying length of day and program requirements, magnet schools within the District require additional enhancement appropriations. This necessitates adjustments to classroom staffing, recruiting counselors, and an available pool from which the Deputy Superintendent may draw to provide staffing for necessary school administrative support services.
The current budget for magnet school programs is developed from a student-teacher ratio of 30:1. The Advanced Technologies Academy (ATA) was constructed with classroom sizes of 20 students per classroom. Because of this room configuration, a student-teacher ratio of 20:1 will be retained at ATA. A recruiting counselor is provided for each secondary school that has magnet programs. Senior high school recruiting counselor positions are staffed starting November 1 preceding the start of the magnet school’s initial opening. Middle school recruiting counselors begin at the end of the first semester of the preceding year.

Info
rmat
iona
l Sec
tion
1552014-15 Comprehensive Annual Budget Report |
Administrative Titles And Salary RangesFiscal Year 2014-15Class Title Range Superintendent of Schools XXGeneral Counsel1 51Deputy Superintendent1 50Associate Superintendent/Chief Negotiator 49Chief Human Resources Officer1 49Chief Financial Officer1 49Chief Innovation Officer1 49Chief Student Achievement Officer1 49Chief of Staff and External Relations1 48Associate Superintendent, Community and Government Relations 47Associate Superintendent, Operational Services Division1 47Deputy General Counsel1 47General Manager, Vegas PBS1 47Assistant Chief Student Achievement Officer1 46Academic Manager, Innovative Learning Environments, Technology and Information Systems Services1 46Assistant Superintendent, Assessment, Accountability, Research, and School Improvement1 46Assistant Superintendent, Curriculum and Professional Development1 46Assistant Superintendent, Education Services Division1 46Assistant Superintendent, English Language Learner Program1 46Assistant Superintendent, Facilities Department1 46Assistant Superintendent, Student Services Division1 46Chief of School Police1 46Deputy Chief Financial Officer1 46Deputy Human Resources Officer1 46Senior Assistant General Counsel1 46Assistant General Counsel1 45Director IV, Curriculum and Instruction 45Director IV, Facilities Planning and Design 45Director IV, Human Resources1 45Director IV, Instructional Support 45Director IV, Instructional Support and Student Activities 45Director IV, Support Services 45Director IV, Technology and Information Systems Services 45Principal, Senior High School 44 - 45Director III, Compliance and Monitoring 44Director III, Educational Media Services 44Director III, Engineering, Information Technology, and Emergency Response Systems 44Director III, Food Service 44Director III, Government Affairs 44Director III, Instructional Business Process Expert 44Director III, Operational Services Division 44Director III, Payroll and Employee Benefits 44Director III, Purchasing and Warehousing 44Director III, Quality Assurance 44Director III, Risk Management 44Director III, Special Projects and Renovation Services 44Director III, Transportation 44Director III, Workforce Training and Economic Development, Vegas PBS 44Principal, Career and Technical Academy2 42 - 44Principal, Junior High/Middle School2 41 - 44Director II, Budget 43Director II, Career and Technical Education 43Director II, Central Information Systems 43Director II, Demographics, Zoning, and GIS 43Director II, Distance Education and Virtual High School 43Director II, Diversity and Affirmative Action Programs1 43Director II, Early Childhood 43
Class Title Range Director II, Education Services 43Director II, Employee-Management Relations 43Director II, Employee Onboarding and Development 43Director II, English Language Learner Program 43Director II, Equity and Diversity Education 43Director II, Facilities and Bond Fund Financial Management 43Director II, Guidance and Counseling 43Director II, Internal Audit 43Director II, Instruction Unit Services 43Director II, K -12 Literacy 43Director II, K-12 Math and Instructional Technology 43Director II, K-12 Science, Health, and Foreign Language 43Director II, K-12 Special Education 43Director II, Low Incidence Disabilities 43Director II, Magnet Programs 43Director II, Networking Services 43Director II, Programming, Vegas PBS 43Director II, Real Property Management 43Director II, Related Services 43Director II, School and Department Human Capital Management Support 43Director II, School Safety and Crisis Management 43Director II, Special Education Programs and Projects 43Director II, Special Education Support Services 43Director II, Superintendent's Office1 43Director II, Technical Resources 43Director II, Title I Services 43Director II, User Support Services 43Police Captain 43Principal, Alternative School2 41 - 43Principal, Elementary School 42 - 43Principal, Elementary School2 41 - 43Principal, Special Education School2 43Principal, Boulder City High School2 43Principal, Indian Springs High School2 43Principal, Las Vegas Academy of the Arts2 43Principal, Laughlin High School2 43Principal, Moapa Valley High School2 43Principal, Sandy Valley High School2 43Principal, Virgin Valley High School2 43Deputy Assistant General Counsel1 42Director I, Academic Intervention and Professional Development 42Director I, Accountability and Research 42Director I, Adult Language Acquisition Services 42Director I, Assessment 42Director I, Communications Office 42Director I, Compliance and Building Operations 42Director I, Constituent Services 42Director I, Corporate Communications, Vegas PBS 42Director I, Development and Innovation 42Director I, Development, Vegas PBS 42Director I, Employee Contracts and Separation Compliance 42Director I, English Language Learner Program 42Director I, Environmental Services 42Director I, Fiscal Accountability 42Director I, Food Service 42Director I, Grants Development and Administration 42Director I, Health Services 42Director I, Inspection Services 42Director I, Intergovernmental Affairs 42Director I, Maintenance 42

156 | Clark County School District
Administrative Titles And Salary Ranges - ContinuedFiscal Year 2014-15Class Title Range Director I, Operations 42Director I, Professional Development, Special Education 42Director I, Psychological Services 42Director I, Purchasing and Warehousing 42Director I, Risk Management 42Director I, School and Department Recuritment 42Director I, School-Community Partnership Program 42Director I, Security Systems, School Police Services 42Director I, Speech/Language Therapy Services 42Director I, Student Athletics 42Director I, Superintendent's Office1 42Director I, Title I Services 42Director I, Transportation 42Director I, Vehicle Maintenance 42Director I, Wraparound Services 42Principal, Academy for Individualized Study/Virtual High School 42Principal, Advanced Technologies Academy2 42Principal, Desert Rose Adult High School 42Assistant Principal, Secondary School2 41Coordinator IV, Accounting 41Coordinator IV, Assessment 41Coordinator IV, Assessment and Accountability 41Coordinator IV, Assistive Technology 41Coordinator IV, AVID Program 41Coordinator IV, Board of School Trustees 41Coordinator IV, Budget 41Coordinator IV, Bus Operations 41Coordinator IV, Child Find Project 41Coordinator IV, Claims Management Services 41Coordinator IV, Data Services 41Coordinator IV, Demographics and Zoning 41Coordinator IV, Educational Resources 41Coordinator IV, Employee Business Training 41Coordinator IV, Employee Development 41Coordinator IV, English Language Learner Program 41Coordinator IV, Expulsion Due Process and Trial Enrollments 41Coordinator IV, Facility Requirements 41Coordinator IV, Financial Management, Vegas PBS 41Coordinator IV, Financial Management, Food Service 41Coordinator IV, Gifted and Talented Education 41Coordinator IV, Grants Development and Administration 41Coordinator IV, Guidance and Counseling Services 41Coordinator IV, Health Services 41Coordinator IV, Information Systems Architecture and Special Projects Operations 41Coordinator IV, K-12 Instructional Technology 41Coordinator IV, K-12 Special Education 41Coordinator IV, Literacy Innovative Programs 41Coordinator IV, Low Incidence Disabilities 41Coordinator IV, Mechanical Systems and Equipment 41Coordinator IV, Modernization Services 41Coordinator IV, New Construction 41Coordinator IV, Occupational and Physical Therapy Services 41Coordinator IV, Ombudsman, Operational Services Division 41Coordinator IV, Production Services 41Coordinator IV, Psychological Services 41Coordinator IV, Purchasing and Warehousing 41Coordinator IV, Real Property Management 41Coordinator IV, Risk and Insurance Services 41Coordinator IV, Safe and Respectful Learning Environment 41Coordinator IV, School-Community Partnership Program 41Coordinator IV, Special Education Services 41
Class Title Range Coordinator IV, Speech/Audiology Services 41Coordinator IV, Student Data Services 41Coordinator IV, School Safety and Crisis Management 41Coordinator IV, Telecommunications Services 41Coordinator IV, Title I Services 41Coordinator IV, Unemployement Services Representative 41Police Lieutenant 41Principal, Community College High School2 41Principal, Continuation School2 41Principal, Florence McClure Women's Correctional Center2 41Principal, High Desert State Prison Adult High School2 41Principal, Juvenile Court Schools 41Principal, Southern Desert Correctional Center Adult HS2 41Principal, Spring Mountain School2 41Assistant Principal, Elementary School2 40Assistant Principal, Special Education School2 40Coordinator III, Adult Education 40Coordinator III, Adult Language Acquisition Services 40Coordinator III, Architect 40Coordinator III, Birth to Pre-K Early Childhood, Striving Readers Comprehensive Literacy Program 40Coordinator III, Budget 40Coordinator III, Career and Technical Education 40Coordinator III, Cash and Investment Management 40Coordinator III, Charter School Compliance 40Coordinator III, Compliance and Monitoring 40Coordinator III, Compensation, Contracts, and Employee Records 40Coordinator III, Custodial Supervision 40Coordinator III, Data, Performance Management, and Project Facilitation 40Coordinator III, Data, Performance Management, and Innovative Projects 40Coordinator III, Data Specialist 40Coordinator III, Demographics, Zoning, and Geographic Information System 40Coordinator III, Distance Education 40Coordinator III, Early Childhood Literacy 40Coordinator III, Early Childhood Program 40Coordinator III, Early Childhood Title I Services 40Coordinator III, Early Childhood Transition Specialist 40Coordinator III, Education Services 40Coordinator III, Employee Development 40Coordinator III, Engineering Services 40Coordinator III, Environmental Compliance 40Coordinator III, Equipment Repair 40Coordinator III, Equity and Diversity Education 40Coordinator III, Exterior and Structural Building Repair 40Coordinator III, Facilities and Bond Fund Financial Management 40Coordinator III, Facilities Project Manager 40Coordinator III, Facilities Space Requirements 40Coordinator III, Fine Arts, Elementary 40Coordinator III, Fine Arts, Secondary 40Coordinator III, Fiscal Accountability and Data Analysis 40Coordinator III, Fiscal Accountability and Program Analysis, CPD 40Coordinator III, General Repair 40Coordinator III, Geographic Information System 40Coordinator III, Gift Manager 40Coordinator III, Grant Evaluator 40Coordinator III, Grant Writer 40Coordinator III, Homebound Education Program 40
Info
rmat
iona
l Sec
tion
1572014-15 Comprehensive Annual Budget Report |
Administrative Titles And Salary Ranges - ContinuedFiscal Year 2014-15Class Title Range Coordinator III, Industrial Hygiene 40Coordinator III, Instructional Data Management System 40Coordinator III, Internal Audit 40Coordinator III, Investing In Innovation 40Coordinator III, K-5 Literacy, Striving Readers Comprehensive Literacy Program 40Coordinator III, 6-12 Mathematics 40Coordinator III, K-12 English Language Arts 40Coordinator III, K-12 Foreign Language 40Coordinator III, K-12 Health, Physical Education, and Driver Education 40Coordinator III, K-12 Library Services 40Coordinator III, K-12 Literacy 40Coordinator III, K-12 Science/Health 40Coordinator III, K-12 Social Studies 40Coordinator III, Landscaping and Grounds 40Coordinator III, NCLB and Data Verification 40Coordinator III, Operational Services 40Coordinator III, Program Evaluator, Inclusive Schools Practices/Intervention Programs 40Coordinator III, Public Information and Media Manager 40Coordinator III, Purchasing 40Coordinator III, Ready to Learn, Vegas PBS 40Coordinator III, Research and Evaluation 40Coordinator III, Resource Management 40Coordinator III, Safe and Drug Free Schools 40Coordinator III, Safety 40Coordinator III, School Accounting 40Coordinator III, School Banking 40Coordinator III, School Operations 40Coordinator III, School Police Investigator 40Coordinator III, Secondary Literacy, Striving Readers Comprehensive Literacy Program 40Coordinator III, Special Education Management System 40Coordinator III, Specialized Human Resources Support 40Coordinator III, Statistician, Demographics, Zoning, and GIS 40Coordinator III, Student Activities 40Coordinator III, Student Adjudication 40Coordinator III, Student Attendance Enforcement 40Coordinator III, Substitute Hiring and Smartfind Administration 40Coordinator III, Teacher Induction and Mentoring 40Coordinator III, Technology Integration 40Coordinator III, Technology Program Office 40Coordinator III, Technical Resources 40Coordinator III, Title I Homeless Program 40Coordinator III, Title I Services 40Coordinator III, Turnaround Zone 40Coordinator III, Vegas PBS 40Coordinator III, Vegas PBS Public Information and Media Manager 40Coordinator III, Warehouse/Distribution Center 40Coordinator III, Workforce Training and Economic Development, Vegas PBS 40Coordinator III, Workforce Sales and Veterans Outreach 40Coordinator III, WWW Production Services 40Coordinator III, Administrative Assistant, Bond Administration 40Coordinator III, Administrative Assistant, Community and Government Relations 40Coordinator III, Administrative Assistant, Instruction Unit 40Coordinator III, Administrative Assistant, School Police Services 40Coordinator III, Administrative Assistant, Student Support Services 40
Class Title Range Coordinator III, Administrative Assistant, Technology and Information Systems 40Dean, Secondary3 40Coordinator II, Academic Support and Community Service Center 39Coordinator II, Accounting 39Coordinator II, Adaptive Physical Education 39Coordinator II, Benefits Accounting Supervisor 39Coordinator II, Communities in Schools 39Coordinator II, Dietitian 39Coordinator II, Early Reading First 39Coordinator II, Geographic Information Systems 39Coordinator II, Industrial Hygiene 39Coordinator II, Instructional Web Design 39Coordinator II, Instructional Web Designer/Learning Management System 39Coordinator II, Parent Services 39Coordinator II, Payroll Processing Supervisor 39Coordinator II, Real Property Management 39Coordinator II, Risk Management Accounting 39Coordinator II, School-Community Partnership Program2 39Coordinator II, Senior Accountant, Fiscal Accountability, and Data Analysis 39Coordinator II, Site Development Planner 39Coordinator II, Technical Resources 39Coordinator II, Technology Projects and Training 39Coordinator II, Traffic Safety - Safe Routes to School 39Coordinator II, Web Designer 39Coordinator I, Accounting 38Coordinator I, Grants/Fiscal Accountability 38Coordinator I, Accounting Treasurer 38Coordinator I, Budget 38Coordinator I, Communications Specialist 38Coordinator I, Fleet Manager 38Coordinator I, Public Information Specialist 381“At-Will” Employees--A contract signed by an at-will employee will state that the employee serves in that position at the will of the superintendent and may be returned to a position of no lesser range and step than the last held with the district. At-Will positions will be so designated at the time the position is offered to an employee. At the time of appointment, the Board of School Trustees will designate the range and step of the position.2Incumbents of these classes receive monthly salaries in accordance with this schedule for 11 months per year. Incumbents in all other classes receive monthly salaries in accordance with this schedule for 12 months per year.3Incumbents of this class receive monthly salaries in accordance with this schedule for 10 months per year.

158 | Clark County School District
1 Eligibility for Step G requires that the administrator has been on any Step F for four years, is beginning his/her 18th year in the District during the contracted school year, and the adjusted hire date and the effective date of the administrative appointment is prior to February 1. If the adjusted hire date is February 1 or after, the administrator will be placed on Step G at the beginning of the subsequent year.
Administrative employees holding a doctoral degree from an accredited institution and valid for Nevada certification will receive an additional $1,500 stipend for which Public Employees Retirement System (PERS) contributions will be made.
Administrative employees completing the following years of District service will be eligible for longevity compensation for which PERS contributions will be made:
A principal who is assigned either to a Prime 6 school (before July 1, 2008), a rural high school, or to a double session or flexible double session schedule shall receive an additional stipend of $2,000 for which PERS contributions will be made. A $2,000 stipend will be provided to eligible senior high school deans and assistant principals.
District Service Amount10 Years $1,30015 Years 1,80020 Years 2,30025 Years 2,80030 Years 4,000
Administrative Salary Schedule Base - Monthly SalariesFiscal Year 2014-15
Range A B C D E F G1
52 $10,098 $10,608 $11,140 $11,699 $12,284 $12,897 $13,543 51 9,617 10,098 10,608 11,140 11,699 12,284 12,897 50 9,166 9,617 10,098 10,608 11,140 11,699 12,284 49 8,730 9,166 9,617 10,098 10,608 11,140 11,699 48 8,312 8,730 9,166 9,617 10,098 10,608 11,140 47 7,917 8,312 8,730 9,166 9,617 10,098 10,608 46 7,540 7,917 8,312 8,730 9,166 9,617 10,098 45 7,191 7,540 7,917 8,312 8,730 9,166 9,617 44 6,849 7,191 7,540 7,917 8,312 8,730 9,166 43 6,519 6,849 7,191 7,540 7,917 8,312 8,730 42 6,205 6,519 6,849 7,191 7,540 7,917 8,312 41 5,913 6,205 6,519 6,849 7,191 7,540 7,917 40 5,626 5,913 6,205 6,519 6,849 7,191 7,540 39 5,361 5,626 5,913 6,205 6,519 6,849 7,191 38 5,112 5,361 5,626 5,913 6,205 6,519 6,849 37 4,861 5,112 5,361 5,626 5,913 6,205 6,519 36 4,636 4,861 5,112 5,361 5,626 5,913 6,205
Professional-Technical (PT) Salary Schedule Base - Monthly SalariesFiscal Year 2014-15
Range A B C D E F G1
44 $6,849 $7,191 $7,540 $7,917 $8,312 $8,730 $9,166 43 6,519 6,849 7,191 7,540 7,917 8,312 8,730 42 6,205 6,519 6,849 7,191 7,540 7,917 8,312 41 5,913 6,205 6,519 6,849 7,191 7,540 7,917 40 5,626 5,913 6,205 6,519 6,849 7,191 7,540 39 5,361 5,626 5,913 6,205 6,519 6,849 7,191 38 5,112 5,361 5,626 5,913 6,205 6,519 6,849 37 4,861 5,112 5,361 5,626 5,913 6,205 6,519 36 4,636 4,861 5,112 5,361 5,626 5,913 6,205 35 4,407 4,636 4,861 5,112 5,361 5,626 5,913 34 4,191 4,407 4,636 4,861 5,112 5,361 5,626 33 3,998 4,191 4,407 4,636 4,861 5,112 5,361 32 3,801 3,998 4,191 4,407 4,636 4,861 5,112 31 3,617 3,801 3,998 4,191 4,407 4,636 4,861 30 3,450 3,617 3,801 3,998 4,191 4,407 4,636 29 3,279 3,450 3,617 3,801 3,998 4,191 4,407 28 3,122 3,279 3,450 3,617 3,801 3,998 4,191

Info
rmat
iona
l Sec
tion
1592014-15 Comprehensive Annual Budget Report |
Support Personnel Titles And Salary Pay GradesFiscal Year 2014-15Code Title Grade Min Hr Max Hr2040 Accountant 56 23.57 30.10 2027 Accounts Payable Supervisor 50 17.61 22.46 2016 Accounts Payable Technician 49 16.77 21.38 0200 Administrative Clerk 50 17.61 22.46
1446Administrative Computer Services Specialist 56 23.57 30.10
0320 Administrative School Secretary 50 17.61 22.46 0240 Administrative Secretary I 51 18.48 23.57 0250 Administrative Secretary II 52 19.40 24.77 0251 Administrative Secretary III 54 21.38 27.31 0252 Administrative Secretary IV 57 24.77 31.60 7780 AHERA Compliance Monitor 58 26.01 33.18 1506 Application Administrator I 54 21.38 27.31 1507 Application Administrator II 56 23.57 30.10
1532Applications Developer - COBOL/CICS 59 27.31 34.85
1460Applications Developer II - ABAP/NETWEAVER 63 33.18 42.35
1508 Applications Manager 64 34.85 44.47 7725 Apprentice Drafter 47 15.20 19.40
7730Asbestos Abatement Worker/Insulator 51 18.48 23.57
7705 Asbestos Inspector 56 23.57 30.10 7735 Asbestos Planner/Scheduler 57 24.77 31.60
7410Asphalt, Concrete, and Masonry Supervisor 58 26.01 33.18
2050 Assistant Accountant 50 17.61 22.46 8170 Assistant Custodial Supervisor 53 20.37 26.01
7091Assistant Grounds Equipment Technician 46 14.47 18.48
1060 Assistant Offset Shop Supervisor 54 21.38 27.31
0352Assistant Terminal Agency Coordinator 53 20.37 26.01
1449Assistive Technology Services Specialist 56 23.57 30.10
7420Athletic Equipment and Fencing Supervisor 58 26.01 33.18
4000 Attendance Officer 50 17.61 22.46 7115 Audio Visual Technician 52 19.40 24.77 0140 Autism Intervention Specialist I 45 13.80 17.61 0141 Autism Intervention Specialist II 48 15.96 20.37 5020 Baker 43 12.52 15.96 1550 Basis Administrator I 60 28.68 36.59 0134 Benefits Technician 49 16.77 21.38 4248 Bilingual Translator/Interpreter 51 18.48 23.57 7000 Boiler Equipment Technician 54 21.38 27.31 0170 Braillist 52 19.40 24.77 0176 Broadcast Captionist I 47 15.20 19.40 0177 Broadcast Captionist II 52 19.40 24.77 0178 Broadcast Captionist III 56 23.57 30.10 4100 Budget Assistant 55 22.46 28.68 7120 Building Engineer 52 19.40 24.77 7550 Building Engineer Supervisor 58 26.01 33.18 8166 Building Manager 54 21.38 27.31 6100 Bus Driver 47 15.20 19.40 6105 Bus Driver Trainee 47A 14.90 14.90 6005 Bus Washer 41 11.34 14.47 1511 Business Intelligence (BI) Analyst 63 33.18 42.35 0330 Business Services Specialist 51 18.48 23.57
1540Business Systems Security Specialist 57 24.77 31.60
3081 Buyer I 49 16.77 21.38 3082 Buyer II 52 19.40 24.77
Code Title Grade Min Hr Max Hr3084 Buyer III 54 21.38 27.31 3086 Buyer IV 57 24.77 31.60 7727 CADD Technicial I 55 22.46 28.68 7728 CADD Technicial II 57 24.77 31.60 7729 CADD Technicial III 59 27.31 34.85 4170 Campus Security Monitor 44 13.13 16.77 7060 Carpenter 52 19.40 24.77 7560 Carpenter Supervisor 58 26.01 33.18 7585 Carpet and Flooring Supervisor 58 26.01 33.18 8030 Carpet Cleaning Technician 50 17.61 22.46 8039 Central Kitchen Steward 43 12.52 15.96
4222Certified Occupational Therapy Assistant 50 17.61 22.46
5320 Chief Refrigeration Engineer 59 27.31 34.85 7401 Chiller Technician I 56 23.57 30.10 7402 Chiller Technician II 57 24.77 31.60
7309
Civil and Landscape Quality Assurance Construction Inspector/Manager 58 26.01 33.18
2103 Claims Examiner 52 19.40 24.77 2100 Claims Management Specialist 57 24.77 31.60 2098 Claims Manager 60 28.68 36.59 2102 Claims Technician 48 15.96 20.37 4285 Classification/Compensation Analyst 57 24.77 31.60 0110 Clerk Typist I 40 10.80 13.80 0175 Clerk/Braillist 45 13.80 17.61
7105Clock, Fire Alarm, and Intercom Technician 55 22.46 28.68
7700Code Compliance Inspector/Site Manager 59 27.31 34.85
7209 Commissioning Technician I 59 27.31 34.85 0306 Communications Assistant 49 16.77 21.38
7194Communications Equipment Installer Assistant 51 18.48 23.57
7195Communications Equipment Installer/Repairer 55 22.46 28.68
7198Communications Installation/Repair Supervisor 58 26.01 33.18
1650 Computer Forensic Investigator 62 31.60 40.35 1410 Computer Operator 50 17.61 22.46 1330 Computer Systems Specialist 51 18.48 23.57 1555 Computer Technician I 52 19.40 24.77 1556 Computer Technician II 55 22.46 28.68 7152 Construction Compliance Clerk 48 15.96 20.37 7146 Construction Documents Clerk 48 15.96 20.37 4260 Construction Documents Manager 56 23.57 30.10

160 | Clark County School District
Support Personnel Titles And Salary Pay GradesFiscal Year 2014-15Code Title Grade Min Hr Max Hr7153 Construction Estimator 57 24.77 31.60
7147Construction Site Development Data Specialist 50 17.61 22.46
7645 Construction Supervisor 58 26.01 33.18 7032 Cross Connection Control Specialist 56 23.57 30.10 8100 Custodial Leader 46 14.47 18.48 8160 Custodial Supervisor 54 21.38 27.31 8040 Custodian 43 12.52 15.96 1405 Data Control Manager 58 26.01 33.18 1326 Data Processing Machine Operator 46 14.47 18.48 1515 Database Administrator 63 33.18 42.35 1518 Database Analyst III (Web-Based) 62 31.60 40.35
1519Database Analyst III (Web-Based) - Assessment and Accountability 62 31.60 40.35
1521
Database Analyst III Special Education Management Systems (SEMS) 62 31.60 40.35
1526 Database Services Specialist 56 23.57 30.10 4300 Demographic Specialist 57 24.77 31.60 4150 Dispatcher 47 15.20 19.40 3021 Distribution Specialist I 50 17.61 22.46 3030 District Mail Courier 46 14.47 18.48 4404 Document Control Specialist 54 21.38 27.31 7720 Drafter 55 22.46 28.68 7719 Drafting and Records Manager 58 26.01 33.18 6130 Driver Training Instructor 49 16.77 21.38 7131 Duplicating Equipment Technician 53 20.37 26.01 1505 EDP Operations Manager 62 31.60 40.35 4240 Educational Interpreter I 46 14.47 18.48 4241 Educational Interpreter II 53 20.37 26.01 4242 Educational Interpreter III 54 21.38 27.31 4243 Educational Interpreter IV 55 22.46 28.68
3121Educational Media Center Supervisor 56 23.57 30.10
4231 Educational Transcriber 54 21.38 27.31 7010 Electrician 55 22.46 28.68 7570 Electrician Supervisor 58 26.01 33.18 7575 Electronics Supervisor 58 26.01 33.18 7390 Electronics Technician II 53 20.37 26.01 0143 Elementary School Clerk 46 14.47 18.48
7211Energy Management and Commissioning Supervisor 62 31.60 40.35
7208 Energy Management Supervisor 58 26.01 33.18
7207Energy Management Systems (EMS) Scheduler 50 17.61 22.46
7205 Energy Management Technician I 55 22.46 28.68 7206 Energy Management Technician II 56 23.57 30.10
1444Enterprise Instructional Design Specialist Trainer 57 24.77 31.60
1513Enterprise Systems Integration Specialist 62 31.60 40.35
8315 Equipment Operator Crew Leader 52 19.40 24.77 8300 Equipment Operator/Truck Driver 50 17.61 22.46
8305Equipment Operator/Truck Driver Assistant 48 15.96 20.37
4065Equipment Requisition Funds Analysis/Forms Mgmt Supv 58 26.01 33.18
4090 Equipment Specialist 52 19.40 24.77 0370 Executive Legal Secretary 55 22.46 28.68 7630 Fabrication Supervisor 58 26.01 33.18
3240Facilities and Equipment Safety Inspection Manager 57 24.77 31.60
3200Facilities and Equipment Safety Inspector 52 19.40 24.77
- Continued
Code Title Grade Min Hr Max Hr7204 Facilities Energy Inspector/Analyst 54 21.38 27.31 4402 Facilities Operations Analyst 57 24.77 31.60
7660Facility Data Control and Claims Representative 59 27.31 34.85
7308Facility QA/QC Construction Inspector/Manager 57 24.77 31.60
7655Facility Service Region Representative 59 27.31 34.85
7650 Facility Service Representative 58 26.01 33.18 8260 Farm/Nursery Manager 52 19.40 24.77
0185Federal Programs Teacher/Family Aide 43 12.52 15.96
0270 Federal Projects Clerk 46 14.47 18.48 6180 Field Supervisor 56 23.57 30.10 3120 Film and Video Traffic Supervisor 54 21.38 27.31 4053 Fingerprint Technician 47 15.20 19.40 7260 Fire Equipment Technician 55 22.46 28.68 7329 Fire Equipment Technician Assistant 51 18.48 23.57 7031 Fire Sprinkler Technician 56 23.57 30.10 0090 First Aide/Safety Assistant 43 12.52 15.96 6090 Fleet Maintenance Manager 58 26.01 33.18 8119 Floor Care Supervisor 52 19.40 24.77 8117 Floor Care Technician 48 15.96 20.37 7280 Flooring Technician 52 19.40 24.77 7275 Food Service Equipment Technician 54 21.38 27.31
5116Food Service Facilities, Equipment, and Maintenance Supervisor 65 36.59 46.70
5115Food Service Facility Operations Supervisor 52 19.40 24.77
5305Food Service Maintenance Supervisor 58 26.01 33.18
7276Food Service Maintenance Technician I 50 17.61 22.46
7277Food Service Maintenance Technician II 51 18.48 23.57
5110 Food Service Manager I 50 17.61 22.46 5113 Food Service Manager I Floater 50 17.61 22.46 5120 Food Service Manager II 51 18.48 23.57 5114 Food Service Manager II Floater 51 18.48 23.57 5275 Food Service Personnel Manager 60 28.68 36.59 5270 Food Service Region Supervisor 57 24.77 31.60 5001 Food Service Specialist 43 12.52 15.96 5260 Food Service Supervisor II 55 22.46 28.68
5300Food Service Warehouse Supervisor 55 22.46 28.68
5000 Food Service Worker 41 11.34 14.47 5010 Food Service Worker Floater 41 11.34 14.47 7270 Furniture Repair Technician 51 18.48 23.57 7565 Furniture Repairer Supervisor 58 26.01 33.18 8190 Gardener I 44 13.13 16.77 8200 Gardener II 46 14.47 18.48
4296Geographic Information System (GIS) Analyst 61 30.10 38.41
4297Geographic Information System (GIS) Senior Analyst 63 33.18 42.35
6351Geographic Information System (GIS) Transportation Technician I 55 22.46 28.68
6352Geographic Information System (GIS) Transportation Technician II 58 26.01 33.18
7210 Glazier 52 19.40 24.77 1105 Graphic Artist Assistant 45 13.80 17.61 1110 Graphic Artist I 50 17.61 22.46 1120 Graphic Artist II 55 22.46 28.68 1030 Graphic Artist Supervisor 58 26.01 33.18

Info
rmat
iona
l Sec
tion
1612014-15 Comprehensive Annual Budget Report |
Support Personnel Titles And Salary Pay GradesFiscal Year 2014-15Code Title Grade Min Hr Max Hr1100 Graphics Specialist 54 21.38 27.31
8005Grounds Assistant Supervisor - Equipment Operator 57 24.77 31.60
8010Grounds Assistant Supervisor - Equipment Repair 57 24.77 31.60
7090 Grounds Equipment Technician 50 17.61 22.46 7590 Hardware/Locksmith Supervisor 58 26.01 33.18
7285Hazardous Materials Field Technician 55 22.46 28.68
8110 Head Custodian I 47 15.20 19.40 8120 Head Custodian II 48 15.96 20.37 8130 Head Custodian III 52 19.40 24.77
7540Heating Ventilation and A/C Supervisor 58 26.01 33.18
3090 Heavy Truck Driver 50 17.61 22.46 1478 Help Desk Analyst I 52 19.40 24.77 1479 Help Desk Analyst II 55 22.46 28.68 7040 HVACR Technician I 54 21.38 27.31 7400 HVACR Technician II 56 23.57 30.10
7635Industrial Arts Maintenance Supervisor 58 26.01 33.18
7160Industrial Arts Maintenance Technician 54 21.38 27.31
0195 Infant/Toddler Day Care Aide 44 13.13 16.77 0305 Information Aide 48 15.96 20.37 4405 Information and Records Manager 60 28.68 36.59 1542 Information Control Specialist 51 18.48 23.57 0124 Information Liaison 46 14.47 18.48 0285 Information Processor 45 13.80 17.61
1477Information Systems Help Desk Manager 60 28.68 36.59
1447Information Systems Help Desk Specialist 53 20.37 26.01
7011 Infrared Thermographer (Electrical) 56 23.57 30.10 0165 In-House Suspension Teacher Aide 41 11.34 14.47 0172 Instructional Assistant (Bilingual) 40 10.80 13.80
0192Instructional Assistant (Least Restrictive Environment) 40 10.80 13.80
0179Instructional Assistant (Physical Education) 40 10.80 13.80
0190Instructional Assistant (Teacher Aide) 40 10.80 13.80
7050 Insulator 54 21.38 27.31 2112 Insurance Services Manager 62 31.60 40.35 0133 Intake Clerk 46 14.47 18.48 4245 Interpreter Specialist 59 27.31 34.85 7576 Intrusion Alarm Supervisor 58 26.01 33.18 7100 Intrusion Alarm Technician 54 21.38 27.31 3015 Inventory Control Clerk 47 15.20 19.40 8240 Irrigation Systems Installer/Repairer 50 17.61 22.46 4226 Itinerant Tester 46 14.47 18.48
0150Jobs for America's Graduates (JAG) Multi-year Specialist 49 16.77 21.38
2045 Junior Accountant 54 21.38 27.31 8220 Landscape and Grounds Supervisor 58 26.01 33.18 8230 Landscape Leader 48 15.96 20.37 8235 Landscape Technician 52 19.40 24.77
8000Landscaping and Grounds Assistant Supervisor 57 24.77 31.60
3035 Lead District Mail Courier 49 16.77 21.38 0365 Legal Secretary I 48 15.96 20.37 0360 Legal Secretary II 51 18.48 23.57 0105 Library Aide 40 10.80 13.80 7070 Locksmith 52 19.40 24.77
- Continued
Code Title Grade Min Hr Max Hr7187 Logistics Specialist I 48 15.96 20.37 7188 Logistics Specialist II 52 19.40 24.77 7189 Logistics Specialist III 55 22.46 28.68 7046 Machinist Technician 55 22.46 28.68 3400 Mail Services Manager 54 21.38 27.31
1425Mainframe Operations Scheduling Specialist 55 22.46 28.68
7300 Maintenance Leader 57 24.77 31.60 7315 Maintenance Leader - Carpenter 57 24.77 31.60 7316 Maintenance Leader - Electrical 57 24.77 31.60
7317Maintenance Leader - Electronics Equipment and Systems 57 24.77 31.60
7327Maintenance Leader - Fire Sprinkler Systems 57 24.77 31.60
7319 Maintenance Leader - Flooring 57 24.77 31.60 7320 Maintenance Leader - Glazier 57 24.77 31.60
7322Maintenance Leader - Hardware/Locksmith 57 24.77 31.60
7321 Maintenance Leader - HVACR 57 24.77 31.60
7325Maintenance Leader - Office Machine Repair 57 24.77 31.60
7323 Maintenance Leader - Painter 57 24.77 31.60 7324 Maintenance Leader - Plumber 57 24.77 31.60 7326 Maintenance Leader - Roofer 57 24.77 31.60 7310 Mason 53 20.37 26.01 4796 Master Control Specialist 50 17.61 22.46 1050 Media Specialist 57 24.77 31.60 1445 Microcomputer Support Specialist 52 19.40 24.77 1475 Microcomputer Systems Specialist 55 22.46 28.68 1473 MIS/DP Technology Specialist 58 26.01 33.18 7055 Mobile Crane Operator I 52 19.40 24.77 7056 Mobile Crane Operator II 55 22.46 28.68 7240 Musical Instrument Technician 54 21.38 27.31 1548 Network Design Technician III 58 26.01 33.18 1558 Network Technician I 52 19.40 24.77 1559 Network Technician II 55 22.46 28.68 1560 Network Technician III 58 26.01 33.18 7640 Office Equipment Supervisor 58 26.01 33.18 4200 Office Manager 53 20.37 26.01 0123 Office Specialist II 45 13.80 17.61 0126 Office Specialist II - Bilingual 45 13.80 17.61 0206 Office Supervisor 51 18.48 23.57 1010 Offset Machine Operator 47 15.20 19.40 1025 Offset Machine Operator Leader 51 18.48 23.57 1040 Offset Machine Operator Trainee 41 11.34 14.47 0355 Operations Clerk 46 14.47 18.48 8165 Operations Manager 60 28.68 36.59
2085Organizational Management Business Specialist 57 24.77 31.60
7080 Painter 52 19.40 24.77 7580 Painter Supervisor 58 26.01 33.18 0367 Paralegal 54 21.38 27.31 9961 Para-Professional: Avid Tutor I N/A 12.00 N/A 9962 Para-Professional: Avid Tutor II N/A 15.00 N/A 9963 Para-Professional: Avid Tutor III N/A 18.00 N/A 9964 Para-Professional: Avid Tutor IV N/A 20.00 N/A
9968Para-Professional: Instructional Technology Lab Aide 48 15.96 20.37
9972 Para-Professional: Tutor I N/A 12.00 N/A 9973 Para-Professional: Tutor II N/A 15.00 N/A 9974 Para-Professional: Tutor III N/A 18.00 N/A 9975 Para-Professional: Tutor IV N/A 20.00 N/A 0194 Parent/Guardian Mentor 44 13.13 16.77

162 | Clark County School District
Support Personnel Titles And Salary Pay GradesFiscal Year 2014-15Code Title Grade Min Hr Max Hr2125 Payroll Technician I 46 14.47 18.48 2120 Payroll Technician II 49 16.77 21.38 4283 Personnel Analyst 53 20.37 26.01 0136 Personnel Assistant 47 15.20 19.40 0135 Personnel Clerk 46 14.47 18.48 4252 Personnel Paydata Specialist 49 16.77 21.38 2031 Personnel Paydata Supervisor 54 21.38 27.31 8101 Pest Control Supervisor 50 17.61 22.46 8103 Pest Control Technician 44 13.13 16.77 1150 Photographer/Lithographer 52 19.40 24.77 4221 Physical Therapist Assistant 50 17.61 22.46 7140 Pipefitter 55 22.46 28.68 7706 Plans Examiner 59 27.31 34.85 5315 Plant Manager 61 30.10 38.41 7030 Plumber 54 21.38 27.31
7620Plumber/Pipefitter/Boiler Technician Supervisor 58 26.01 33.18
7709 Preventive Maintenance Manager 58 26.01 33.18 7145 Pricing Clerk 47 15.20 19.40 0181 Principal Operations Support Clerk 46 14.47 18.48 7711 Program Development Specialist 57 24.77 31.60 7155 Project Scheduler 57 24.77 31.60 4225 Psychological Services Assistant 49 16.77 21.38
7712Purchasing Analyst/Contract Specialist 58 26.01 33.18
3025 Purchasing Supervisor 60 28.68 36.59 3027 Purchasing Supervisor II 62 31.60 40.35
7192Radio Communications and Video Equipment Installer 54 21.38 27.31
4290 Real Property & Site Analyst 54 21.38 27.31 4110 Realty Specialist 56 23.57 30.10 0286 Records Processor 46 14.47 18.48 8020 Recycling Specialist 53 20.37 26.01 0145 Registrar I 45 13.80 17.61 0146 Registrar II 46 14.47 18.48 7760 Risk Assesor 54 21.38 27.31 2097 Risk Control/Safety Manager 62 31.60 40.35
2096Risk Management Field Investigation Supervisor 62 31.60 40.35
2109 Risk Services Analyst 54 21.38 27.31 2104 Risk Services Technician 48 15.96 20.37 7220 Roofer 52 19.40 24.77 7500 Roofing Supervisor 58 26.01 33.18 4250 Safety and Health Lab Technician 51 18.48 23.57 4256 Sample Control Clerk 50 17.61 22.46 0100 School Aide 40 10.80 13.80 0099 School Aide - Bilingual 40 10.80 13.80 0307 School Banker 46 14.47 18.48 0310 School Office Manager 50 17.61 22.46 4145 School Police Dispatcher 51 18.48 23.57
4140School Police Dispatcher Supervisor 55 22.46 28.68
4143 School Police Lead Dispatcher 53 20.37 26.01 0144 School/Community Facilitator 40 10.80 13.80 0142 School/Community Liaison 50 17.61 22.46 0220 Secretary II 46 14.47 18.48 0230 Secretary III 48 15.96 20.37 4025 Security Specialist 48 15.96 20.37
1492Security Systems Application Manager 64 34.85 44.47
1493 Security Systems Design Manager 64 34.85 44.47
1496Security Systems Support Technician 58 26.01 33.18
- Continued
Code Title Grade Min Hr Max Hr
7750Senior Asbestos Abatement Inspector 57 24.77 31.60
4010 Senior Attendance Officer 53 20.37 26.01 2099 Senior Claims Examiner 57 24.77 31.60
7710Senior Code Compliance Inspector/Site Manager 60 28.68 36.59
1517 Senior Database Analyst 62 31.60 40.35 0137 Senior Documents Clerk 46 14.47 18.48 0353 Senior Electronics Technician 61 30.10 38.41 8118 Senior Floor Care Technician 50 17.61 22.46 5280 Senior Food Service Supervisor 58 26.01 33.18 5030 Senior Food Service Worker 46 14.47 18.48 5040 Senior Food Service Worker Floater 46 14.47 18.48
1435Senior Information Systems Operator 51 18.48 23.57
0255 Senior Maintenance Clerk 46 14.47 18.48 1020 Senior Offset Machine Operator 49 16.77 21.38 8102 Senior Pest Control Technician 47 15.20 19.40 1472 Senior Programming Analyst 59 27.31 34.85 7154 Senior Project Scheduler 59 27.31 34.85 2101 Senior Risk Control Analyst 58 26.01 33.18 2113 Senior Risk Services Analyst 57 24.77 31.60 1509 Senior Systems Analyst 62 31.60 40.35
4831Senior Telecommunication Specialist 65 36.59 46.70
3050 Senior Truck Driver 51 18.48 23.57 4830 Senior TV Engineer 56 23.57 30.10
6310Senior Vehicle/Heavy Duty Equipment Parts Clerk 52 19.40 24.77
3020 Senior Warehouser 53 20.37 26.01 1541 Server Administrator I 58 26.01 33.18 1545 Server Technician I 52 19.40 24.77 1554 Server Technician II 55 22.46 28.68 1553 Server Technician III 58 26.01 33.18 0161 Sign Language Aide 45 13.80 17.61 7180 Skilled Trades Assistant 50 17.61 22.46
1512Software Quality Assurance Manager 64 34.85 44.47
6110 Special Education Bus Driver 48 15.96 20.37 8115 Special School Head Custodian 47 15.20 19.40 0095 Specialized Health Aide 46 14.47 18.48 0097 Specialized Procedures Nurse 49 16.77 21.38
0160Specialized Programs Teacher Assistant 41 11.34 14.47

Info
rmat
iona
l Sec
tion
1632014-15 Comprehensive Annual Budget Report |
Support Personnel Titles And Salary Pay GradesFiscal Year 2014-15Code Title Grade Min Hr Max Hr
0162Specialized Programs Teacher Assistant II 44 13.13 16.77
0164Specialized Programs Teacher Assistant Training Specialist 51 18.48 23.57
8250 Sprinkler Equipment Supervisor 58 26.01 33.18 8245 Sprinkler Equipment Technician 51 18.48 23.57 8247 Sprinkler Repairer Leader 55 22.46 28.68 4215 Staff Trainer - Human Resources 51 18.48 23.57
4205Staff Training Supervisor - Human Resources 55 22.46 28.68
4070 Standards Specialist 58 26.01 33.18 0265 Statistical Clerk 46 14.47 18.48
1514Student Information Systems Product Specialist 62 31.60 40.35
1448Student Information Systems Specialist 51 18.48 23.57
0280Student Program/Placement Processor 47 15.20 19.40
4220 Student Success Advocate 49 16.77 21.38
4229Student Success Advocate (Bilingual) 49 16.77 21.38
9040 Student Worker I N/A 8.25 N/A 0101 Support Staff Assistant (Steps A-D) 40 10.80 13.80 9080 Support Staff Intern (Steps A-D) 44 13.13 16.77
7336Support Staff Trainer - Maintenance Department 51 18.48 23.57
8035Support Staff Trainer - Operations Department 51 18.48 23.57
4253Support Staff Training Supervisor - Student Support Services 55 22.46 28.68
6410Support Staff Training Supervisor - Transportation 55 22.46 28.68
7335Support Staff Traning Supervisor - Maintenance Department 55 22.46 28.68
8025Support Staff Traning Supervisor - Operations Department 55 22.46 28.68
1467 Systems Administrator 63 33.18 42.35 7200 Systems Control Technician 55 22.46 28.68 1464 Systems Software Analyst 62 31.60 40.35 1495 Technical Support Manager 64 34.85 44.47 1530 Technology Systems Specialist 54 21.38 27.31 0275 Technology Training Specialist 52 19.40 24.77 4791 Telecommunication Specialist I 55 22.46 28.68 4811 Telecommunication Specialist II 59 27.31 34.85 0122 Temporary Clerical Assistant 45-A 13.53 N/A
- Continued
Code Title Grade Min Hr Max Hr8041 Temporary Custodian 43-A 12.27 N/A
6131Temporary Driving Training Instructor 49-A 16.44 N/A
9000 Temporary Food Service Worker FS 10.00 N/A 3091 Temporary Heavy Truck Driver 50-A 17.61 N/A
0102Temporary Transportation Aide-Special Education 41-A 11.12 N/A
3001 Temporary Warehouser I 45-A 13.80 N/A 0351 Terminal Agency Coordinator 56 23.57 30.10 4270 Theater Manager 55 22.46 28.68 6080 Tire Inspector/Repairer 53 20.37 26.01
0168Title I In-House Suspension Teacher Assistant III (S-W) 45 13.80 17.61
0169Title I In-House Suspension Teacher Assistant IV (S-W) 47 15.20 19.40
0201Title I Instructional Assistant III - Bilingual 44 13.13 16.77
0186Title I Instructional Assistant III (Least Restrictive Environment) 44 13.13 16.77
0180Title I Instructional Assistant III (Physical Education) 44 13.13 16.77
0198Title I Instructional Assistant III (S-W) 44 13.13 16.77
0187Title I Instructional Assistant IV (Least Restrictive Environment) 45 13.80 17.61
0184Title I Instructional Assistant IV (Physical Education) 45 13.80 17.61
0199Title I Instructional Assistant IV (S-W) 45 13.80 17.61
0202Title I Insturctional Assistant IV - Bilingual 45 13.80 17.61
0108 Title I Library Assistant III (S-W) 44 13.13 16.77 0109 Title I Library Assistant IV (S-W) 47 15.20 19.40 0182 Title I Sign Language Aide III (S-W) 46 14.47 18.48 0183 Title I Sign Language Aide IV (S-W) 48 15.96 20.37
0158Title I Specialized Programs Teacher Assistant III (S-W) 45 13.80 17.61
0159Title I Specialized Programs Teacher Assistant IV (S-W) 47 15.20 19.40
0203Title I Teacher/Family Assistant III - Bilingual 46 14.47 18.48
0188Title I Teacher/Family Assistant III (S-W) 46 14.47 18.48
0204Title I Teacher/Family Assistant IV - Bilingual 48 15.96 20.37
0189Title I Teacher/Family Assistant IV (S-W) 48 15.96 20.37
7181 Trades Dispatcher/Scheduler 50 17.61 22.46 0358 Transcriber/Recording Secretary 53 20.37 26.01
0104Transportation Aide - Special Education 43 12.52 15.96
6150 Transportation Investigator 52 19.40 24.77 6401 Transportation Operations Assistant 52 19.40 24.77 6400 Transportation Operations Manager 58 26.01 33.18
6330Transportation Operations Supervisor 57 24.77 31.60
6340Transportation Routing and Scheduling Analyst 55 22.46 28.68
6335Transportation Routing and Scheduling Assistant 52 19.40 24.77
0350Transportation Routing and Scheduling Clerk 46 14.47 18.48
6350Transportation Routing and Scheduling Supervisor 58 26.01 33.18
3040 Truck Driver 49 16.77 21.38

164 | Clark County School District
Support Personnel Titles And Salary Pay GradesFiscal Year 2014-15Code Title Grade Min Hr Max Hr4840 TV Assistant 49 16.77 21.38 4810 TV Engineer II 55 22.46 28.68 4880 TV Member Services Manager 59 27.31 34.85 4895 TV News and Production Manager 62 31.60 40.35 4870 TV Operations Manager 59 27.31 34.85 4800 TV Producer-Director I 54 21.38 27.31 4850 TV Producer-Director II 55 22.46 28.68 4765 Underwriting Representative 59 27.31 34.85 1494 User Support Services Manager 64 34.85 44.47 7185 Utility Worker I 45 13.80 17.61 7186 Utility Worker II 46 14.47 18.48 4292 Utilization/Capacity Specialist 57 24.77 31.60
4826Vegas PBS - Assistant to Executive Secretary 45 13.80 17.61
4819Vegas PBS - Assistant to the General Manager 51 18.48 23.57
4822Vegas PBS - Assistant Volunteer Specialist 48 15.96 20.37
4829
Vegas PBS - Executive Assistant/ Recruitment/EEO/Diversity and Compliance Supervisor 57 24.77 31.60
4828 Vegas PBS - Executive Secretary 54 21.38 27.31
3122Vegas PBS - Media/Library Specialist 47 15.20 19.40
4821 Vegas PBS - Membership Specialist 45 13.80 17.61
4833Vegas PBS - Programming and Traffic Assistant 48 15.96 20.37
4824 Vegas PBS - Receptionist 45 13.80 17.61 4823 Vegas PBS - Sales Assistant 48 15.96 20.37 4820 Vegas PBS - Volunteer Specialist 50 17.61 22.46
4832
Vegas PBS - Workforce Training and Economic Dev Receptionist/ Customer Service Support - Bilingual 45 13.80 17.61
4825
Vegas PBS - Workforce Training and Economic Development Assistant 48 15.96 20.37
6030 Vehicle Body Repairer/Painter 53 20.37 26.01 6070 Vehicle Garage Shift Supervisor 56 23.57 30.10 6020 Vehicle Maintenance Technician 54 21.38 27.31
6060Vehicle Maintenance Technician Assistant 49 16.77 21.38
6305 Vehicle Parts Expediter 44 13.13 16.77 6040 Vehicle Radiator Repair Technician 54 21.38 27.31 6000 Vehicle Service Worker 47 15.20 19.40 6010 Vehicle/Garage Attendant 41 11.34 14.47
Remote PayFull-time support employees assigned to remote or isolated areas as of July 31, 2003, shall receive an incentive allotment in addition to their regular salary. Following are the rates:
Calville Bay (Resident Only) $1,200 Mt. Charleston $1,200Goodsprings 1,600 Sandy Valley 1,600Indian Springs 1,200 Searchlight 1,600Laughlin 2,000 Spring Mountain 1,200Moapa Valley 1,200 Virgin Valley 1,200
Employees new to these remote or isolated areas on August 1, 2003, and thereafter shall not receive remote pay.
Effective with the 1991-92 school year, support staff personnel at Blue Diamond will no longer receive remote pay. Support staff employed at Blue Diamond prior to the 1991-92 school year shall continue to receive remote pay in the amount of $1,200 as long as they are employed at Blue Diamond.
Longevity Steps:
District Service Amount25 and 26 years $ 50027 and 28 years 75029+ years 1,000
- Continued
Code Title Grade Min Hr Max Hr
6300Vehicle/Heavy Duty Equipment Parts Clerk 47 15.20 19.40
6325Vehicle/Heavy Duty Equipment Parts Warehouse Supervisor 54 21.38 27.31
0300 Visually Handicapped Aide 46 14.47 18.48 0302 Visually Impaired Assistant I 45 13.80 17.61 0304 Visually Impaired Assistant II 47 15.20 19.40
1546Voice Communication Network Manager 64 34.85 44.47
1547Voice Communication Network Supervisor 61 30.10 38.41
7193Voice Communication Network Technican 56 23.57 30.10
5310 Warehouse/Distribution Supervisor 57 24.77 31.60 3000 Warehouser I 45 13.80 17.61 3010 Warehouser II 47 15.20 19.40 7703 Warranty Program Specialist 58 26.01 33.18 7704 Warranty Program Supervisor 60 28.68 36.59 8246 Water Manager 54 21.38 27.31 7230 Water Treatment Technician 54 21.38 27.31 1543 Web Designer I 57 24.77 31.60 1536 Web Designer II 59 27.31 34.85 1537 Web Designer III 62 31.60 40.35 1535 Web Designer/Programmer 55 22.46 28.68 1544 Web Programmer I 57 24.77 31.60 1538 Web Programmer II 59 27.31 34.85 1539 Web Programmer III 62 31.60 40.35 7250 Welder 55 22.46 28.68
7184Work Management Help Desk Specialist 52 19.40 24.77
0290 Zoning Clerk 45 13.80 17.61

Info
rmat
iona
l Sec
tion
1652014-15 Comprehensive Annual Budget Report |
Support Staff Personnel Pay Grades And Hourly RatesFiscal Year 2014-15
Grade A1 B1 C1 D1 E1 F1 F2 G11 G21 H12 H22 I13
40 $10.80 $11.34 $11.91 $12.52 $13.13 $13.80 $14.14 $14.47 $14.85 $15.20 $15.59 $15.96 41 11.34 11.91 12.52 13.13 13.80 14.47 14.85 15.20 15.59 15.96 16.37 16.77 42 11.91 12.52 13.13 13.80 14.47 15.20 15.59 15.96 16.37 16.77 17.18 17.61 43 12.52 13.13 13.80 14.47 15.20 15.96 16.37 16.77 17.18 17.61 18.04 18.48 44 13.13 13.80 14.47 15.20 15.96 16.77 17.18 17.61 18.04 18.48 18.95 19.40 45 13.80 14.47 15.20 15.96 16.77 17.61 18.04 18.48 18.95 19.40 19.88 20.37 46 14.47 15.20 15.96 16.77 17.61 18.48 18.95 19.40 19.88 20.37 20.88 21.38 47 15.20 15.96 16.77 17.61 18.48 19.40 19.88 20.37 20.88 21.38 21.92 22.46 48 15.96 16.77 17.61 18.48 19.40 20.37 20.88 21.38 21.92 22.46 23.02 23.57 49 16.77 17.61 18.48 19.40 20.37 21.38 21.92 22.46 23.02 23.57 24.17 24.77 50 17.61 18.48 19.40 20.37 21.38 22.46 23.02 23.57 24.17 24.77 25.39 26.01 51 18.48 19.40 20.37 21.38 22.46 23.57 24.17 24.77 25.39 26.01 26.65 27.31 52 19.40 20.37 21.38 22.46 23.57 24.77 25.39 26.01 26.65 27.31 27.99 28.68 53 20.37 21.38 22.46 23.57 24.77 26.01 26.65 27.31 27.99 28.68 29.38 30.10 54 21.38 22.46 23.57 24.77 26.01 27.31 27.99 28.68 29.38 30.10 30.87 31.60 55 22.46 23.57 24.77 26.01 27.31 28.68 29.38 30.10 30.87 31.60 32.41 33.18 56 23.57 24.77 26.01 27.31 28.68 30.10 30.87 31.60 32.41 33.18 34.02 34.85 57 24.77 26.01 27.31 28.68 30.10 31.60 32.41 33.18 34.02 34.85 35.72 36.59 58 26.01 27.31 28.68 30.10 31.60 33.18 34.02 34.85 35.72 36.59 37.51 38.41 59 27.31 28.68 30.10 31.60 33.18 34.85 35.72 36.59 37.51 38.41 39.37 40.35 60 28.68 30.10 31.60 33.18 34.85 36.59 37.51 38.41 39.37 40.35 41.34 42.35 61 30.10 31.60 33.18 34.85 36.59 38.41 39.37 40.35 41.34 42.35 43.42 44.47 62 31.60 33.18 34.85 36.59 38.41 40.35 41.34 42.35 43.42 44.47 45.59 46.70 63 33.18 34.85 36.59 38.41 40.35 42.35 43.42 44.47 45.59 46.70 47.86 49.03 64 34.85 36.59 38.41 40.35 42.35 44.47 45.59 46.70 47.86 49.03 50.27 51.48 65 36.59 38.41 40.35 42.35 44.47 46.70 47.86 49.03 50.27 51.48 52.77 54.05
(1) Longevity Step: Requires ten (10) years of service with the District (employee must be on Step F before advancement to Step G)(2) Longevity Step: Requires fifteen (15) years of service with the District (employee must be on Step G before advancement to Step H) (3) Longevity Step: Requires twenty (20) years of service with the District (employee must be on Step H before advancement to Step I)
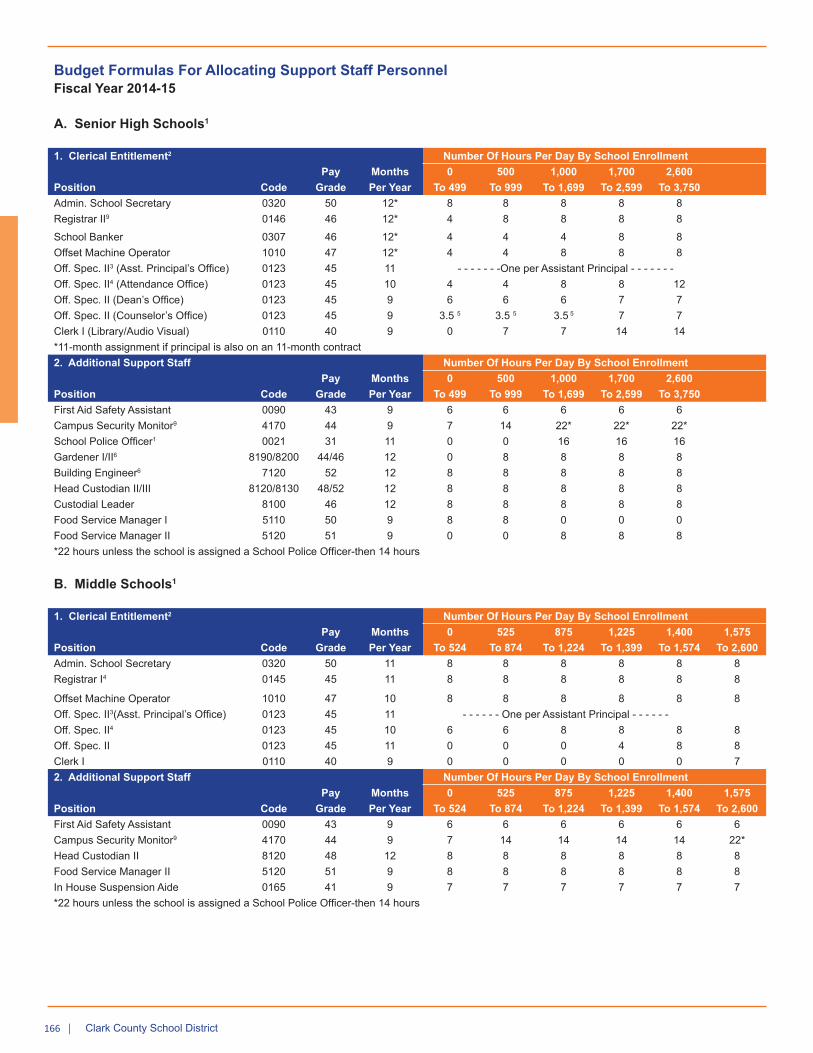
166 | Clark County School District
Budget Formulas For Allocating Support Staff PersonnelFiscal Year 2014-15
A. Senior High Schools1
1. Clerical Entitlement2 Number Of Hours Per Day By School EnrollmentPay Months 0 500 1,000 1,700 2,600
Position Code Grade Per Year To 499 To 999 To 1,699 To 2,599 To 3,750Admin. School Secretary 0320 50 12* 8 8 8 8 8Registrar II9 0146 46 12* 4 8 8 8 8
School Banker 0307 46 12* 4 4 4 8 8Offset Machine Operator 1010 47 12* 4 4 8 8 8Off. Spec. II3 (Asst. Principal’s Office) 0123 45 11 - - - - - - -One per Assistant Principal - - - - - - -Off. Spec. II4 (Attendance Office) 0123 45 10 4 4 8 8 12Off. Spec. II (Dean’s Office) 0123 45 9 6 6 6 7 7Off. Spec. II (Counselor’s Office) 0123 45 9 3.5 5 3.5 5 3.5 5 7 7Clerk I (Library/Audio Visual) 0110 40 9 0 7 7 14 14*11-month assignment if principal is also on an 11-month contract2. Additional Support Staff Number Of Hours Per Day By School Enrollment
Pay Months 0 500 1,000 1,700 2,600Position Code Grade Per Year To 499 To 999 To 1,699 To 2,599 To 3,750First Aid Safety Assistant 0090 43 9 6 6 6 6 6Campus Security Monitor9 4170 44 9 7 14 22* 22* 22*School Police Officer1 0021 31 11 0 0 16 16 16Gardener I/II6 8190/8200 44/46 12 0 8 8 8 8Building Engineer6 7120 52 12 8 8 8 8 8Head Custodian II/III 8120/8130 48/52 12 8 8 8 8 8Custodial Leader 8100 46 12 8 8 8 8 8Food Service Manager I 5110 50 9 8 8 0 0 0Food Service Manager II 5120 51 9 0 0 8 8 8*22 hours unless the school is assigned a School Police Officer-then 14 hours
B. Middle Schools1
1. Clerical Entitlement2 Number Of Hours Per Day By School EnrollmentPay Months 0 525 875 1,225 1,400 1,575
Position Code Grade Per Year To 524 To 874 To 1,224 To 1,399 To 1,574 To 2,600Admin. School Secretary 0320 50 11 8 8 8 8 8 8Registrar I4 0145 45 11 8 8 8 8 8 8
Offset Machine Operator 1010 47 10 8 8 8 8 8 8Off. Spec. II3(Asst. Principal’s Office) 0123 45 11 - - - - - - One per Assistant Principal - - - - - - Off. Spec. II4 0123 45 10 6 6 8 8 8 8Off. Spec. II 0123 45 11 0 0 0 4 8 8Clerk I 0110 40 9 0 0 0 0 0 72. Additional Support Staff Number Of Hours Per Day By School Enrollment
Pay Months 0 525 875 1,225 1,400 1,575Position Code Grade Per Year To 524 To 874 To 1,224 To 1,399 To 1,574 To 2,600First Aid Safety Assistant 0090 43 9 6 6 6 6 6 6Campus Security Monitor9 4170 44 9 7 14 14 14 14 22*Head Custodian II 8120 48 12 8 8 8 8 8 8Food Service Manager II 5120 51 9 8 8 8 8 8 8In House Suspension Aide 0165 41 9 7 7 7 7 7 7*22 hours unless the school is assigned a School Police Officer-then 14 hours

Info
rmat
iona
l Sec
tion
1672014-15 Comprehensive Annual Budget Report |
Budget Formulas For Allocating Support Staff Personnel - ContinuedFiscal Year 2014-15
Auxiliary Entitlement--Approved By Specified Department For Middle And Senior High SchoolsPay Months Number Of Employees
Position Code Grade Per Year Based On Other ContingenciesCustodian 8040 43 12 Custodial hours are assigned by the Operations Department as needed, based on square
footage of school site, number of classrooms, lunch hours, number/size of gymnasiums,etc.Food Service Worker 5000 41 9 Number and hours of food service workers are assigned by the Food Service Department
based on student participation in the food service program at each high school.Instructional Assistant (Fine Arts Programs) 0190 40 9
One six-hour employee is assigned per teacher when enrollment in Fine Arts Programs(art, band, chorus, debate, orchestra, etc.) reaches 240 students.
Instructional Assistant7
(Second Language Programs)
0190 40 9One six-hour employee may be assigned to each teacher in schools where second language programs exist based on available funds. Schools with four or more classes or second language program magnet schools with combination classes are considered first.
Instructional Assistant (In lieu of a Teacher) 0190 40 9
Hours must be approved by Licensed Personnel in lieu of a teacher (middle schools only).
Instructional Asst./Federal 0190/ 40/43 9 One seven-hour employee is assigned to each site where an elementary Title I program exists plus one six-hour employee is assigned to each additional unit pending federal funds and program design (middle schools only).
Programs Teacher/Family Aide (Chapter I Program) 0185Instructional Assistant (Special Ed Resource) 0190 40 9
Instructional assistants are assigned to schools to assist with academic, behavioral, and transition needs of students with disabilities. The number of hours assigned to schools is identified in the Elementary or Secondary Schools Special Education Resource Classroom Unit Allocation Formula.
Specialized Programs Teacher Assistant8
(Special Education) 0160 41 9
One six-hour Specialized Programs Teacher Assistant is assigned per self-contained program specified by the Student Support Services Division.
School Police Officer 0021 31 11 One eight-hour school police officer may be assigned to a middle school based on need as recommended by the Deputy Superintendent of Instruction.
1 Any position authorized above the entitlement listed below will be reviewed annually in April by Human Resources and the Deputy Superintendent of Instruction.
2 Clerical staffing will be adjusted after “Count Day” in September for the balance of the current school year.
3 One eight-hour Office Specialist II will be assigned when the enrollment reaches 500 (600-MS/JHS), two when it reaches 1,300 (1,500-MS/JHS), three when it reaches 1,800, and four when it reaches 2,900 or above. Office Specialist II’s are assigned only when the number of Assistant Principals increases.
4 Office Specialist II positions may be assigned to any of the following: attendance, registrar, dean, and/or counselor’s office.
5 These positions are compensated at 4.1 hours; however, if combined, they may not exceed 7.5 hours per employee.
6 The deployment of these earned positions has, at times, been redirected to other critical maintenance/operations positions as determined by the Associate Superintendent, Facilities Division.
7 When funds are available, a nine-month, seven-hour teacher/family aide (0185) may also be added.
8 SPECIALIZED PROGRAMS TEACHER ASSISTANT (SPECIAL EDUCATION):
Blind, Partially Sighted (Visually Impaired Program) Physical, Multiple Preschool, Diversely Handicapped, and Deaf-Blind Programs
Communicatively Behaviorally Challenged Physically Challenged
Deaf, Hard of Hearing (Hearing Impaired Program) Specialized Emotionally Handicapped
Diagnostic Center Specialized Learning Disabled
Early Childhood Specialized Speech-Language Handicapped
Educable Mentally Challenged, Trainable Trainable and Severely Mentally Challenged
Mentally Challenged Transitional First Grade, Traumatic Brain Injured
9 The Deputy Superintendent of Instruction may authorize an increase in hours assigned to small high schools. A recommendation for such an increase will be made in writing to the appropriate administrator, Human Resources Division.

168 | Clark County School District
Budget Formulas For Allocating Support Staff Personnel - ContinuedFiscal Year 2014-15
C. Elementary Schools1
1. Clerical Entitlement 2 Number Of Hours Per Day By School Enrollment
Pay Months 0 400 1,000 1,400Position Code Grade Per Year To 399 To 999 To 1,399 To 1,799School Office Manager 0310 50 11 8 8 8 8
Elementary School Clerk 0143 46 11 8 8 8 8Office Specialist II 0123 45 11 0 0 8 16First Aid Safety Assistant 0090 43 9 6 6 6 62. Additional Support Staff Number Of Hours Per Day By School
EnrollmentPay Months 4003 600 800 1,000
Position Code Grade Per Year To 599 To 799 To 999 To 1,199School Aide 4 (Office, Playground, Media) 0100 40 9 6 7 8 9Library Aide 5 0105 40 9 4 5 6 7Head Custodian I 8110 47 12 8 8 8 8Food Service Manager I 6 5110 50 9 8 8 8 8
D. Prime 6 Schools1
1. Clerical Entitlement 2 Number Of Hours Per Day By School Enrollment
Pay Months 0 400 1,000 1,400Position Code Grade Per Year To 399 To 999 To 1,399 To 2,499School Office Manager 0310 50 11 8 8 8 8Elementary School Clerk 0143 46 11 8 8 8 8Office Specialist II 0123 45 10 0 0 8 8First Aid Safety Assistant 0090 43 9 7 7 7 7School Community Facilitator 0144 40 9 7 7 7 72. Additional Support Staff Number Of Hours Per Day By School
EnrollmentPay Months 400 3 600 800 1,000
Position Code Grade Per Year To 599 To 799 To 999 To 2,499School Aide4(Office, Playground, Media) 0100 40 9 6 7 8 9Library Aide5 0105 40 9 4 5 6 7Head Custodian I 8110 47 12 8 8 8 8Food Service Manager I 6 5110 50 9 8 8 8 8Campus Security Monitor 4170 44 9 15 15 15 15

Info
rmat
iona
l Sec
tion
1692014-15 Comprehensive Annual Budget Report |
Budget Formulas For Allocating Support Staff Personnel - ContinuedFiscal Year 2014-15
Auxiliary Entitlement--Approved By Specified Department For Elementary SchoolsPay Months Number Of Employees
Position Code Grade Per Year Based On Other ContingenciesCustodian 8040 43 12 Custodial hours are assigned by the Operations Department as needed, based on square
footage of school site, number of classrooms, lunch hours, number/size of gymnasiums, etc.
Senior Food Service Worker 5030 46 9 One five- to six-hour worker is assigned by the Food Service Department if there is no “on-site” food preparation.
Food Service Worker 5000 41 9 Number and hours of food service workers are assigned by the Food Service Department based on student participation in the food service program at each elementary school.
Substitute Food Service Worker
9000/ 9010
$10.00/hr.
9 Number and hours of food service workers are assigned by the Food Service Department based on student participation in the food service program at each elementary school.
Instructional Assistant (PE Program)
0190 40 9 One six-hour employee is assigned to each elementary PE teacher.
Instructional Assistant7 (Second Language Programs)
0190 40 9 One six-hour employee may be assigned to each teacher in schools where second language programs exist based on available funds. Schools with four or more classes or Second Language Programs magnet classes are considered first.
Instructional Assistant8
(In lieu of a Teacher)0190 40 9 Twelve hours may be approved by Licensed Personnel in lieu of one teacher.
Instructional Assistant (Special Ed Resource Room)
0190 40 9 Instructional assistants are assigned to schools to assist with academic, behavioral, and transition needs of students with disabilities. The number of hours assigned to schools is identified in the Elementary or Secondary Schools Special Education Resource Classroom Unit Allocation Formula.
Instructional Assistant (Kindergarten Program)
0190 40 9 One six-hour instructional assistant is assigned for each full-time kindergarten teacher or a three-hour instructional assistant for half-time teacher assignments.
(Prime 6 only) One four-hour instructional assistant is assigned to each half unit of Title I kindergarten. One seven-hour instructional assistant is assigned to each full unit of Title I kindergarten. One seven-hour employee is assigned to each site where a Title I pre-kindergarten program exists.
Instructional Asst./Federal 0190/ 0185
40/43 9 One seven-hour employee is assigned to each site where an elementary Title I program exists plus one six-hour employee is assigned to each additional unit.
Programs Teacher/Family Aide9
(Chapter I Program)Specialized Programs Teacher Assistant10(Special Education)
0160 41 9 One six-hour Specialized Programs Teacher Assistant is assigned per self-contained program specified by the Student Support Services Division.
Attendance Officer 4000 50 9 One eight-hour attendance officer is authorized for each 10,000 students or major fraction thereof. The attendance officer is assigned to serve a specified area of the school district including both elementary and secondary schools.
1 Any position authorized above the entitlement listed below will be reviewed annually in April by Human Resources and the Deputy Superintendent of Instruction.
2 Clerical staffing will be adjusted after “Count Day” in September for the balance of the current year.3 Schools where enrollments are from 0-399 receive entitlement based upon the recommendations of the Deputy Superintendent of Instruction,
Support Staff Personnel, and the specific principal.4 One additional hour of school aide time is added for every 100 students enrolled after the school enrollment reaches 900 students. (1,000=9 hours
school aide time; 1,100=10 hours; 1,200=11 hours; 1,300=12 hours, etc.)5 Library aide hours are based on the projected spring enrollment and will not be adjusted in the fall.6 Elementary schools must have “on-site” food preparation to receive a food service manager.7 When funds are available, a seven-hour teacher/family aide (0185) may also be added.8 When enrollment does not warrant the full twelve hours, a fraction thereof may be approved.9 Chapter I formulas are contingent upon available federal funds and program design which may vary from year to year.

170 | Clark County School District
Budget Formulas For Allocating Certain Support Staff Personnel - ContinuedFiscal Year 2014-15
10 Specialized programs teacher assistant (special education):Blind, Partially Sighted (Visually Impaired Program) Physical, Multiple Preschool, Diversely Handicapped, and Deaf-Blind ProgramsCommunicatively Behaviorally Challenged Physically ChallengedDeaf, Hard of Hearing (Hearing Impaired Program) Specialized Emotionally HandicappedDiagnostic Center Specialized Learning DisabledEarly Childhood Specialized Speech-Language HandicappedEducable Mentally Challenged, Trainable Trainable and Severely Mentally ChallengedMentally Challenged Transitional First Grade
Traumatic Brain Injured
Fringe Benefit RatesFiscal Year 2014-15The following rates are used to compute fringe benefits for all District employees:
Fringe Benefit Rate
Public Employees’ Retirement System (PERS) 25.75%
Police Officers who participate in the PERS— Police/Fire Retirement System 40.50%
Occupational Injury Management (OIM) (Previously SIIS) .58%
Old Age, Survivors, and Disability portion of Federal Insurance Compensation Act (FICA) 6.20%1
State Unemployment Insurance (SUI) .05%
Medicare portion of Federal Insurance Compensation Act (FICA) for employees hired after April 1, 1986 1.45%2
Employee Group Insurance (EGI)
Annual Contribution Per Employee
Licensed $6,620Support 6,320Police 6,320Unified 8,047
1 Computed on first $117,000 for employees not covered under PERS (includes Medicare).2 Effective January 2, 1994, the wage base limit for Medicare tax was eliminated.

Info
rmat
iona
l Sec
tion
1712014-15 Comprehensive Annual Budget Report |
Formulas Allocating School Supplies And EquipmentFiscal Year 2014-15
An initial allocation of 75% of the estimated total appropriation for each school will be developed by July 1. The estimated total appropriation is determined by budget formula from the projected enrollment and the rates below.
The second (and last) allocation will be made to each school during the last week in October. This allocation, approximately 25% of the total, will be determined by the current budget formula now applied against the actual enrollment at the end of the fourth week of school.
Textbooks
Allocations for textbooks are made on two dates a fiscal year. For students enrolled as of September 19, 2014, a textbook allocation rate calculated by pupil is prepared with respects to school grade levels. An additional allocation is provided for pupils enrolled in excess of an enrollment dated December 13, 2013. New school rates apply to newly opened schools for startup expenditures.
Grade LevelDate Enrolled
“as of”Per Pupil
RateNew School
RateElementary September 19, 2014 $ 41.41 $ 74.57
December 13, 2013 33.16Middle September 19, 2014 44.10 89.28
December 13, 2013 45.19Senior High September 19, 2014 46.31 106.94
December 13, 2013 60.63
Instructional Supplies
Allocations for instructional supplies are made on two dates a fiscal year. For students enrolled as of September 19, 2014, an instructional supplies allocation rate calculated by pupil is prepared with respects to school grade levels. An additional allocation is provided for pupils enrolled in excess of an enrollment dated December 13, 2013. New school rates apply to newly opened schools for startup expenditures.
Grade LevelDate Enrolled
“as of”Per Pupil
RateNew School
RateElementary September 19, 2014 $ 13.88 $ 22.79
December 13, 2013 8.91Middle September 19, 2014 15.53 28.70
December 13, 2013 13.17Senior High September 19, 2014 17.27 36.99
December 13, 2013 19.73
An additional lump sums of $6,000 for elementary, $9,500 for middle, and $12,000 senior high schools is allocated for additional startup expenditures.
Small School Formula
Schools with small enrollments shall receive instructional supply funds as per the following schedules. This allocation will be determined by the student enrollment as of September 19, 2014. Elementary Enrollment Formulas Per Student Enrolled
1 – 399 $22.80 per student enrolled400 – 424 $21.02 per student enrolled425 – 449 $19.23 per student enrolled450 – 474 $17.46 per student enrolled475 – 499 $15.68 per student enrolled
Formulas Per Student EnrolledSecondary Enrollment Middle School Senior High
1 – 499 $28.70 $36.98500 – 549 26.04 33.06550 – 599 23.41 29.11600 – 649 20.79 25.15650 – 699 18.16 21.21
Special Growth Formula
All schools that experience growth of 10 or more students between September 19, 2014, and December 31, 2014, receive $136 per student for new schools and $59 per student for established schools.
Special Education Instructional Supplies Existing resource and gifted and talented classes receive $631 per unit; new classes receive $1,048 per unit. Special self-contained classes for the emotionally challenged, learning disabled, autism, early childhood, deaf and hard of hearing, and the mentally challenged classes each receive $1,048. Visually impaired classes receive $1,679. Speech therapy services receive $631.
Instructional Computer Supplies - as of Sept. 19, 2014
Elementary Schools - $0.50 per studentMiddle Schools - $1.13 per studentSenior High Schools - $2.38 per student
New schools shall receive a computer software allocation:
Elementary School $ 7,000Middle School 15,000Senior High School 20,000
Printing Services - as of Sept. 19, 2014
Elementary Schools - $2.50 per studentMiddle Schools - $1.35 per studentSenior High Schools - $1.50 per student

172 | Clark County School District
Audio-Visual Supplies - as of Sept. 19, 2014
Elementary Schools - $.19 per studentMiddle Schools - $0.88 per studentSenior High Schools - $1.13 per student
Technical Services - as of Sept. 19, 2014
Middle Schools - $.45 per studentSenior High Schools - $1.10 per student
Instructional Equipment -as of Sept. 19, 2014
Elementary Schools - $5.71 per studentMiddle Schools - $10.67 per studentSenior High Schools - $14.18 per studentSpecial Education Students - $19.50 per studentSmall Schools - minimum allocation of $1,455
Field Trips - as of Sept. 19, 2014
Elementary Schools - $2.00 per studentRural Elementary Schools - $5.49 per student
Medical Supplies - as of Sept. 19, 2014
All Schools - $.39 per student
Library Books And Magazines - as of Sept. 19, 2014
Elementary Schools - $7.72 per studentMiddle Schools - $5.60 per studentSenior High and Combined Junior-Senior High Schools - $4.65 per studentSmall Schools - minimum allocation of $1,774
Other Library Supplies - as of Sept. 19, 2014
Elementary Schools - $.65 per studentMiddle Schools - $.76 per studentSenior High and Combined Junior-Senior High Schools - $.66 per studentSmall Schools - minimum allocation of $104.
Library Computer Supplies - as of Sept. 19, 2014
Elementary Schools - $.25 per studentMiddle Schools - $.75 per studentSenior High Schools - $1.10 per student
Library Technical Services - as of Sept. 19, 2014
Elementary Schools - $.25 per studentMiddle Schools - $.25 per studentSenior High Schools - $.95 per student
Athletic Supplies
Senior high schools receive the following amounts for boys’ and girls’ athletics. In certain situations, when a school does not participate in a complete sports program, the school’s allocation is thereby reduced accordingly. Class Boys’ Athletics Girls’ AthleticsAAAA Schools $12,001 $6,749AAA Schools 12,001 6,749AA Schools 11,212 4,974A Schools 8,001 2,417
Middle schools receive $876 per school for intramurals.
Other Activity Expenses
Cheerleading ActivitiesSenior high schools receive $67 per school.
Postage - enrolled as of Sept. 19, 2014
Elementary Schools - $1.58 per student Middle Schools - $4.69 per student Senior High and Combined Junior-Senior High Schools - $6.17 per student
Custodial Supplies - enrolled as of Sept. 19, 2014
Elementary Schools - $7.44 per studentMiddle Schools - $6.98 per studentSenior High Schools - $7.53 per studentSpecial Education Students - $24.81 per student
Secondary Magnet Schools
As a result of varying length of day and program requirements, magnet schools within the District require additional enhancement appropriations. Increased allocations for instructional supplies and textbooks are required to accommodate longer instructional days resulting from additional classroom periods.
When magnet school instruction requires students to attend either seven- or eight-period days (rather than the traditional six -period day), textbooks and instructional supply formulas will be increased by the following percentages applied to the number of students enrolled in the magnet program.
Schools with seven-period schedules 16.7% Schools with eight-period schedules 33.3%
The new school growth formula will be applied to the total magnet student enrollment increase in each magnet school. Growth in a magnet program (school within a school) where there is no accompanying growth in the comprehensive school will be calculated at a rate which equates to the percentage of the student day spent in magnet classes for magnet students.

Info
rmat
iona
l Sec
tion
1732014-15 Comprehensive Annual Budget Report |
In the initial year of new designation, magnet schools will receive funds typically provided as new school allocations.
Supplies Middle Schools High SchoolsTextbooks $25,000 plus growth $30,000 plus growthSupplies 9,500 plus growth 12,000 plus growthComputer Software 15,000 plus growth 20,000 plus growth
New magnet programs (school within a school) will receive a percentage of the above allocations calculated by dividing the number of new magnet students by the total school enrollment.
Prior to the initial year of new magnet schools or programs, an equipment needs assessment (including cost analyses and the planning of implementation timelines) will be conducted by the region superintendents. The Budget Department will review this assessment for inclusion in the budget.
Impact Of New Schools On The General Operating Fund
The Nevada Legislature has declared that the proper objective of State financial aid to public education is to ensure each child a “reasonably equal educational opportunity.” Recognizing wide local variations in wealth and costs per pupil, the State supplements local financial ability in each district to provide programs of instruction in both compulsory and elective subjects that offer full opportunity for every child to receive the benefit of the purposes for which public schools are maintained. NRS 387.121 sets forth that “…the quintessence of the State’s financial obligation for such programs can be expressed in a formula partially on a per pupil basis and partially on a per program basis as: State financial aid to school districts equals the difference between the school district basic support guarantee and local available funds produced by mandatory taxes minus all the local funds attributable to pupils who reside in the county but attend a charter school. This formula is designated the Nevada Plan.”
In determining the amount to be distributed by the State to districts, the amount of tax proceeds received by schools from a 2.60¢ local school sales tax plus the amount received from the 1/3 public schools operating property tax are deducted. Combining all of State aid, less the school support sales tax and one-third of the property tax, has the effect of including almost 81% of the District’s operations budget within an enrollment-driven formula, somewhat insulating the District from economic fluctuations. Regardless of how much sales tax or the 1/3 public schools operating property tax is received, the District still expects almost 81% of its budget to be covered by the State’s guarantee.
The District has successfully absorbed the operational support costs incurred from opening the following number of new or remodeled schools during the past decade.
In a year when new schools are opened, the District must address the challenge to provide the additional resources necessary to fund the increased operational costs required to support the new school site. State operational funding is generated based upon a per pupil formula that does not mitigate school districts for the additional cost impacts created when a new facility is opened. The District is, therefore, very reliant upon the local tax base to provide the necessary funding to finance the demands associated with opening new schools.
New School Completion ScheduleFiscal Years 2001-2015
School Year Elementary Middle Schools High SchoolsRemodeled
Schools Special SchoolsTotal New Schools
2000-01 4 2 - - - 62001-02 7 5 2 1 - 152002-03 6 2 - 1 - 92003-04 7 3 2 1 - 132004-05 7 3 3 - - 132005-06 7 3 1 1 - 122006-07 6 2 1 - 1 102007-08 6 2 1 2 - 112008-09 4 - 2 5 1 122009-10 3 - 3 - - 62010-11 4 - 1 - - 52011-12 - - - 2 - 22012-13 - - - - - -2013-14 - - - - - -2014-15 - - - - - -Total 61 22 16 13 2 114
Source: Facilities and Bond Financial Management

174 | Clark County School District
This page is intentionally left blank

The statistical data sub-section provides an analytical perspective of the District in different areas including; county population, tax levies, enrollment, schools, graduation rates, revenues, and expenditures.
Birth History - Clark County ........................................................................................... 176Projected Enrollment by Grade ..................................................................................... 176Summary of District Enrollment ..................................................................................... 176District Enrollment - Average Daily Membership ........................................................... 177Ethnic Distribution by Grade .......................................................................................... 177High School Graduates ................................................................................................. 178Criterion Referenced Tests ............................................................................................ 179Districtwide Survey ........................................................................................................ 180State vs. Local Revenues .............................................................................................. 181Property Tax Levies and Collections ............................................................................. 181History of Assessed Valuation ....................................................................................... 181History of Local Tax Support Per Pupil .......................................................................... 182Impact of Tax Rate on Taxpayers .................................................................................. 182History of State Aid ........................................................................................................ 182Indices of Economic Growth of Clark County ................................................................ 183History of Utility Costs ................................................................................................... 183General Operating Fund - Projected Budgets ............................................................... 184Special Revenue Funds - Projected Budgets ................................................................ 185Debt Service Funds - Projected Budgets ...................................................................... 185Capital Projects Funds - Projected Budgets .................................................................. 186Schedule of Staff Positions - General Fund .................................................................. 187Schedule of Staff Positions - Other Funds .................................................................... 188Educational Level of Teaching Staff .............................................................................. 188History of Teachers’ Salary Schedules .......................................................................... 189Teacher Salary Schedule - Full Time Teacher Placement ............................................. 189Schedule of General Obligation Bands Outstanding ..................................................... 190Combined Amortization Schedules ............................................................................... 191School Locations within County .................................................................................... 193High School Attendance Boundaries ............................................................................. 194Middle/Junior High School Attendance Boundaries ...................................................... 195Elementary School Attendance Boundaries .................................................................. 196Assigned Schools for Outlying Communities ................................................................ 197Summary of Schools by Age and Size .......................................................................... 198School Location and Enrollment Information ................................................................. 1992014-15 School Calendars ............................................................................................ 206
Statistical Data Info
rmat
iona
l Sec
tion
1752014-15 Comprehensive Annual Budget Report |

176 | Clark County School District
Explanation Of Budget Summary And Statistical DataFiscal Year 2014-15
This section contains a statistical summary of significant district data. It provides information relative to the district that should be of interest to the citizens of Clark County. It is organized in sections beginning with demographic data, followed by information on finance, staffing, facilities, school calendar, special programs, and community services.
Summary Of District EnrollmentFor Fiscal Years 2005-06 Through 2017-18
Average Daily Percent Average Daily Percent 4th Week Full Percent Weighted PercentYear Attendance1 Increase Membership2 Increase Enrollment3 Increase Enrollment4 Increase2005-06 271,707 3.71 % 292,016 4.19 % 291,329 3.75 % 281,646.2 3.85 %2006-07 282,452 3.95 % 303,197 3.83 % 302,547 3.85 % 292,489.6 3.85 %2007-08 286,771 1.53 % 306,801 1.19 % 308,745 2.05 % 298,551.6 2.07 %2008-09 290,132 1.17 % 309,410 0.85 % 311,221 0.80 % 300,817.0 0.76 %2009-10 289,698 (0.15)% 307,978 (0.46)% 309,442 (0.57)% 299,058.6 (0.58)%2010-11 289,619 (0.03)% 307,496 (0.16)% 309,899 0.15 % 299,325.2 0.09 %2011-12 290,120 0.17 % 306,956 (0.18)% 308,377 (0.49)% 297,659.2 (0.56)%2012-13 293,062 1.01 % 311,132 1.36 % 311,218 0.92 % 300,081.8 0.81 %2013-14 296,257 1.09 % 314,511 1.09 % 314,598 1.09 % 303,450.2 1.12 %2014-15 (Est) 299,425 1.07 % 317,880 1.07 % 317,970 1.07 % 306,600.0 1.04 %2015-16 (Proj) 300,701 0.43 % 319,235 0.43 % 319,325 0.43 % 307,920.0 0.43 %2016-17 (Proj) 301,453 0.25 % 320,027 0.25 % 320,127 0.25 % 308,690.0 0.25 %2017-18 (Proj) 302,680 0.41 % 321,332 0.41 % 321,432 0.41 % 309,955.0 0.41 %1ADA--Each month of the year, an attendance figure is established based upon the actual attendance of the students at school. ADA is the average of all ten school months.2ADM--Each month of the year, an enrollment figure is established based upon the number of students enrolled in the district. ADM is the average of all ten school months. 34th Week--This is the number of students enrolled on the Friday of the fourth week of school. This enrollment figure is unweighted and includes students from other districts receiving an education in the district as reported on the Amended Final Budget.44th Week Weighted--This is the number of students enrolled on the Friday of the fourth week of school with Kindergarten and Pre-K students counted as .6 per student. The weighted enrollment figure excludes students from other districts receiving an education in the district as reported on the Amended Final Budget.Source: CCSD AARSI
0
5,000
10,000
15,000
20,000
25,000
30,000
UnG PreK K 1st 2nd 3rd 4th 5th 6th 7th 8th 9th 10th 11th 12th
Grades PK - 5Total 149,368
Grades 6 - 8 Total 73,730
Grades 9 - 12Total 94,872
Projected Enrollment by GradeFiscal Year 2014-15
25,491
22,576
Grades
Stud
ents
on
Coun
t Day
All GradesTotal 317,970
Birth History - Clark CountyFor Calendar Years 1994 Through 2013
Year Births1994 16,1091995 16,9081996 17,8251997 18,6181998 20,1711999 21,1222000 22,4572001 23,1102002 23,9572003 24,9132004 26,2992005 28,0752006 30,1362007 31,0772008 29,9722009 29,6972010 27,0872011 26,8642012 26,3232013 25,766
Source: Nevada State Office of Vital Statistics
Future estimates are made using multiple-year cohort survival analysis based upon historical enrollment trending data. Birth data is also projected derived from the Bureau of Labor statistics. Greatest weight is given to the most recent experience and making adjustments for observed changes in neighborhoods and implied estimates of inmigration and outmigration. Recent estimates have been very accurate with an over variance of 1.18% in fiscal 2012-13 and an over variance of 1.66% for fiscal 2013-14.

Info
rmat
iona
l Sec
tion
1772014-15 Comprehensive Annual Budget Report |
Ethnic Distribution By Grade - Projected 4th Week EnrollmentFiscal Year 2014-15
Grade Hispanic Percent Caucasian PercentAfrican/
American Percent Asian Percent Other Percent Total Pre-K 1,444 1.0% 1,317 1.5% 513 1.3% 103 0.5% 276 1.1% 3,653 K 11,549 8.0% 6,541 7.4% 3,115 7.9% 1,236 6.0% 2,065 8.2% 24,506 1 12,559 8.7% 6,806 7.7% 3,154 8.0% 1,319 6.4% 2,317 9.2% 26,155 2 11,837 8.2% 6,630 7.5% 2,997 7.6% 1,277 6.2% 2,166 8.6% 24,907 3 11,404 7.9% 6,453 7.3% 2,957 7.5% 1,401 6.8% 2,065 8.2% 24,280 4 11,260 7.8% 6,365 7.2% 2,799 7.1% 1,484 7.2% 1,914 7.6% 23,821 5 10,971 7.6% 6,541 7.4% 2,957 7.5% 1,545 7.5% 1,939 7.7% 23,954 6 11,260 7.8% 6,453 7.3% 2,997 7.6% 1,648 8.0% 1,813 7.2% 24,171 7 11,260 7.8% 6,806 7.7% 2,997 7.6% 1,772 8.6% 1,763 7.0% 24,598 8 10,971 7.6% 6,806 7.7% 3,115 7.9% 1,731 8.4% 1,712 6.8% 24,336 9 10,538 7.3% 7,072 8.0% 3,075 7.8% 1,793 8.7% 1,838 7.3% 24,316 10 10,394 7.2% 6,983 7.9% 2,957 7.5% 1,772 8.6% 1,788 7.1% 23,894 11 9,383 6.5% 6,895 7.8% 2,918 7.4% 1,793 8.7% 1,813 7.2% 22,802 12 9,239 6.4% 6,453 7.3% 2,799 7.1% 1,710 8.3% 1,712 6.8% 21,914 Ungraded 289 0.2% 190 0.2% 118 0.3% 41 0.2% 25 0.1% 663 Total 144,359 45.4% 88,312 27.8% 39,468 12.4% 20,625 6.5% 25,206 7.9% 317,970 Source: CCSD AARSI
0
260,000
270,000
280,000
290,000
300,000
310,000
320,000
330,000
17-1805-06 06-07 07-08 08-09 09-10 10-11 11-12 12-13 13-14 14-15 15-16 16-17
Estimated
321,332
317,880
292,016
District Enrollment - Average Daily MembershipFor Fiscal Years 2005-06 Through 2017-18
Stu
dent
Enr
ollm
ent
Source: CCSD AARSI
Average Daily MembershipAverage Daily Attendance

178 | Clark County School District
High School GraduatesFor Fiscal Years 2010-11 Through 2012-13
2010-11 2011-12 2012-13School Male Female Total Male Female Total Male Female TotalAcademy For Individualized Study 87 126 213 105 142 247 60 106 166Adult Education Diploma 875 520 1,395 573 564 1,137 704 458 1,162 Advanced Tech Academy 121 66 187 142 73 215 171 110 281Alternative Programs1 38 60 98 32 38 70 55 49 104Arbor View 261 247 508 245 264 509 260 286 546Basic 189 197 386 183 176 359 187 195 382Bonanza 171 178 349 164 173 337 129 162 291Boulder City 71 65 136 71 72 143 80 51 131Canyon Springs 165 197 362 127 183 310 148 201 349Centennial 281 292 573 289 266 555 317 299 616Chaparral 143 164 307 155 174 329 169 191 360Cheyenne 228 206 434 186 145 331 190 194 384Cimarron-Memorial 233 252 485 229 200 429 179 212 391Clark 178 244 422 199 191 390 220 252 472College Of Southern Nevada 57 144 201 47 148 195 64 153 217Coronado 328 310 638 333 330 663 351 308 659Del Sol 175 175 350 158 149 307 147 146 293Desert Oasis 148 168 316 160 180 340 174 208 382Desert Pines 133 146 279 178 163 341 150 163 313Desert Rose 29 23 52 33 31 64 53 40 93Durango 215 201 416 222 204 426 201 176 377East Career And Technical 144 160 304 169 223 392 188 218 406Eldorado 115 106 221 108 120 228 120 123 243Foothill 236 218 454 256 221 477 243 248 491Green Valley 309 325 634 271 293 564 262 293 555Indian Springs 12 8 20 10 8 18 11 4 15Las Vegas 265 257 522 283 244 527 286 295 581Las Vegas Academy 110 246 356 112 268 380 110 254 364Laughlin 19 27 46 23 17 40 28 24 52Legacy 242 239 481 240 243 483 221 228 449Liberty 210 180 390 165 198 363 196 175 371Moapa Valley 73 61 134 62 52 114 64 53 117Mojave 129 143 272 136 128 264 125 168 293Northwest Career And Technical 138 207 345 188 218 406 190 255 445Palo Verde 304 320 624 277 303 580 260 268 528Rancho 265 299 564 231 220 451 268 271 539Sandy Valley 6 5 11 6 10 16 6 12 18Shadow Ridge 216 208 424 225 197 422 248 244 492Sierra Vista 217 224 441 158 174 332 177 213 390Silverado 226 253 479 251 210 461 218 209 427Southeast Career And Technical 184 220 404 150 221 371 154 239 393Southwest Career And Technical2 - - - 136 124 260 114 185 299Spring Valley 224 208 432 215 204 419 160 173 333Sunrise Mountain 122 105 227 110 125 235 178 155 333Valley 185 224 409 155 196 351 177 236 413Veterans Tribute Career And Technical2 - - - 26 39 65 60 79 139Virgin Valley 69 65 134 54 60 114 55 64 119Virtual 16 33 49 12 36 48 24 36 60West Career and Technical3 - - - - - - 102 121 223West Preparatory Academy 20 25 45 24 29 53 29 31 60Western 159 126 285 142 158 300 153 156 309
Total Graduates 8,341 8,473 16,814 8,026 8,405 16,431 8,436 8,990 17,426
(1) Alternative Programs include Burk Horizon, Cowan Sunset, Global Community, and Morris Sunset High Schools(2) Class of 2011-12 first to graduate.(3) Class of 2012-13 first to graduate.Source: CCSD AARSI

Info
rmat
iona
l Sec
tion
1792014-15 Comprehensive Annual Budget Report |
0
10
20
30
40
50
60
70
80
71 7065
59 60
66
Mathematics Reading
% P
rofic
ient
2012 2013 2014
Criterion Referenced TestsGrade 5 Proficiency Rates
Fiscal Years Ending 2012-2014
66 64 62
Science
0
10
20
30
40
50
60
70
80
71 70
6459 6060
Mathematics Reading
% P
rofic
ient
2012 2013 2014
Criterion Referenced TestsGrade 3 Proficiency Rates
Fiscal Years Ending 2012-2014
0
10
20
30
40
50
60
70
80
61
39
48 495352
Mathematics Reading
% P
rofic
ient
2012 2013 2014
Criterion Referenced TestsGrade 8 Proficiency Rates
Fiscal Years Ending 2012-2014
37
49
57
Science

180 | Clark County School District
Districtwide Survey ResultsComparative Percent Positive Responses - Percent Strongly Agree and Agree Responses
Parents Students EmployeesQuestions 2012 2013 2014 2012 2013 2014 2012 2013 2014Safe Environment 96.3 95.1 94.5 85.7 83.3 83.1 92.0 91.2 90.9Clean Environment 95.9 95.1 94.8 67.1 65.2 63.9 86.1 86.5 86.9Adequate Facilities 95.5 93.3 94.3 84.6 84.8 84.6 84.9 83.7 84.2Welcome at School 95.9 N/A N/A 91.2 N/A N/A N/A N/A N/AShared Decision Making 88.7 87.1 87.4 73.5 74.1 72.5 71.0 72.8 71.3Staff Accessibility for Parents 94.2 94.1 93.4 N/A N/A N/A 95.9 96.5 96.8Staff Accessibility for Students N/A N/A N/A 84.6 84.6 83.6 96.8 98.0 98.1Performance Zone Accessibility 92.2 N/A N/A N/A N/A N/A 72.3 71.9 74.9Fair Treatment of Students 95.3 95.4 94.6 66.9 67.2 65.3 89.4 90.6 90.7Special Needs Programs Availability 96.4 95.6 96.2 95.5 95.9 95.7 83.5 84.7 85.0High Academic Expectations 93.3 93.1 92.6 84.5 85.5 84.2 83.6 82.7 84.1Basics- Reading, Writing, Math 98.2 98.0 97.5 97.0 97.4 97.3 89.8 89.4 89.5Learning Other Subjects 98.0 98.0 97.9 94.8 95.7 95.5 90.5 90.6 90.9Academic Progress Communication 94.8 94.3 97.7 79.8 79.5 78.3 95.9 96.6 96.3Attendence and Behavior Communication 96.0 96.0 96.5 76.4 77.1 75.3 92.9 93.6 93.3Transportation Communication 73.7 69.1 72.6 N/A N/A N/A 86.9 88.3 90.3Academic Assistance Opportunities 92.6 91.2 91.4 91.2 91.1 91.6 93.7 94.6 94.6Student Technology Use 95.5 95.4 95.6 83.1 83.3 80.4 88.4 89.4 88.0Student Recognition 92.8 92.4 92.8 74.7 76.4 72.8 86.8 88.9 89.6Extra Curricular Activities 90.9 90.3 91.5 87.9 87.4 86.9 84.8 87.2 89.0Responsible Citizenship 95.0 94.5 92.3 87.1 87.0 82.9 76.6 76.8 75.0Enthusiasm/Excitement for Learning 93.2 93.4 92.5 77.9 77.8 76.4 63.6 64.6 64.3Career Education N/A N/A N/A N/A N/A N/A 77.7 80.0 80.0Dress Code Enforced N/A N/A N/A 80.9 81.9 81.1 N/A N/A N/AFull Day Kindergarten Beneficial 93.9 94.5 94.8 70.5 N/A N/A 91.4 92.2 92.7Recommend School to a Friend 93.4 92.3 92.3 75.7 75.6 74.1 80.5 81.7 81.5Homework Relates to Classwork 97.0 96.0 95.9 91.6 90.7 89.0 N/A N/A N/ACreativity and Innovation 92.9 92.7 92.6 81.5 81.9 81.3 76.1 76.0 77.8Critical Thinking/Problem Solving 94.2 94.2 93.4 88.8 88.4 84.7 79.6 79.6 80.9Leadership Skills 91.0 91.1 90.5 85.7 85.9 84.5 75.5 75.4 76.7Interpersonal Skills 93.1 93.2 92.8 87.5 89.4 89.3 77.8 78.4 80.2Organizational Skills 90.9 90.4 90.7 73.2 73.7 72.3 77.0 77.9 79.1Courtesy and Respect 96.0 96.3 95.8 86.3 87.7 85.8 85.0 87.6 86.6Honesty and Trustworthiness 95.2 95.2 94.8 85.2 86.1 83.6 82.0 83.4 83.2Fosters Kindness and Caring 94.6 94.9 94.6 82.9 83.8 81.5 82.9 85.7 85.6Report Card Helps 93.8 92.3 94.3 92.9 92.8 92.3 N/A N/A N/AParentlink 82.8 71.6 73.4 68.1 66.3 70.3 94.8 96.0 96.1Source: Community and Government Relations

Info
rmat
iona
l Sec
tion
1812014-15 Comprehensive Annual Budget Report |
0
300
600
900
1,200
$1,500
2005-06 2006-07 2007-08 2008-09 2009-10 2010-11 2011-12 2012-13 2013-14 2014-15
509.3
623.9
744.2781.8 802.0 797.1 795.3 802.5
882.3 909.9
1,227.7
1,305.01,344.4
1,291.91,328.0
1,235.6 1,249.4 1,255.01,305.1
1,340.0
(Est.)State Revenues Local Revenues
Source: CCSD Budget and Accounting Departments
State vs. Local Revenues - General Operating Fund1
For Fiscal Years 2005-06 Through 2014-15Local revenues include all county taxes as well as tuitions, investment earnings, and other miscellaneous local revenues. Beginning balances and execution of capital leases are not included.
Property Tax Levies And Collections (Total Clark County)1
For Fiscal Years 2004-05 Through 2013-14Total Delinquent
Percent of Delinquent Collections Outstanding Taxes as %Fiscal Net Secured Current Tax Levy Tax Total Tax as Percent of Delinquent of CurrentYear Roll Tax Levy Collections Collected Collections Collections Current Levy Taxes Levy2
2004-05 $1,449,273,775 $1,439,911,686 99.35% $9,317,091 $1,449,228,777 100.00% $44,998 - %2005-06 1,639,442,707 1,632,191,297 99.56% 7,201,235 1,639,392,532 100.00% 50,175 - %2006-07 1,927,238,513 1,909,964,723 99.10% 17,185,596 1,927,150,319 100.00% 88,194 - %2007-08 2,178,697,776 2,144,481,519 98.43% 34,000,503 2,178,482,022 99.99% 215,754 0.01%2008-09 2,356,051,400 2,310,905,968 98.08% 44,311,647 2,355,217,615 99.96% 833,785 0.04%2009-10 2,265,431,454 2,216,527,326 97.84% 47,395,661 2,263,922,987 99.93% 1,508,467 0.07%2010-11 1,769,816,203 1,736,385,757 98.11% 32,283,846 1,768,669,603 99.94% 1,146,600 0.06%2011-12 1,600,960,187 1,576,935,410 98.50% 21,889,961 1,598,825,371 99.87% 2,134,816 0.13%2012-13 1,460,630,406 1,446,106,236 99.01% 10,199,645 1,456,305,881 99.70% 4,324,525 0.30%2013-14 1,466,654,385 1,452,587,813 99.04% 3 1,452,587,813 99.04% 14,066,572 0.96%
1Represents the real property tax roll levies and collections.2Figured on collections to net levy (actual levy less stricken taxes)3Collections still in progress.Source: Clark County Treasurer’s Office
History of Assessed ValuationFor Fiscal Years 2005-06 Through 2014-15
Fiscal Year
Assessed Valuation1 PercentChange
2005-06 $65,582,487,400 29.1 %2006-07 91,622,434,937 39.7 %2007-08 109,212,919,843 19.2 %2008-09 115,790,200,550 6.0 %2009-10 93,790,791,674 (19.0)%2010-11 65,758,625,871 (29.9)%2011-12 59,055,745,520 (10.2)%2012-13 55,225,712,175 (6.5)%2013-14 56,296,847,888 1.9 %2014-15 64,252,633,650 14.1 %
(1) Includes redevelopment agenciesSource: Clark County Assessor’s Office
Market value is not provided by the Nevada Department of Taxation. Assessed valuation is approximately 35% of market value.

182 | Clark County School District
Impact Of Tax Rate On TaxpayersFor Calendar Years 2010 Through 2014
Year2010 2011 2012 2013 2014
Assessed value of home(1) $100,000 $100,000 $100,000 $100,000 $100,000
Appraisal percent of assessed value(2) 35.0% 35.0% 35.0% 35.0% 35.0%
Taxable value $35,000 $35,000 $35,000 $35,000 $35,000
Total District property tax rate 0.013034 0.013034 0.013034 0.013034 0.013034
District property taxes due $456.19 $456.19 $456.19 $456.19 $456.19
(1) Defined as a single-family, owner-occupied residence(2) The 2005 Legislature enacted legislation to provide partial tax relief abatement from escalating assessments. The cap limits each property’s tax
increase to no more than 3% above the tax in the prior year on all single-family, owner-occupied residence. Thereafter, future tax assessments are based upon prior taxable values and not the property’s actual market value.
Source: Clark County Assessor’s Office
History Of State AidFor Fiscal Years 2005-06 Through 2014-15State aid is designed to provide a minimum acceptable education, irrespective of the wealth of a district. The amount of State aid for 2013-14 is found by multiplying the sum of six-tenths of the kindergarten enrollment and all other grade enrollments by the year’s basic support guarantee. Deducted from the guaranteed amount are the proceeds from the 2.60-percent local school sales tax, the 1/3 public schools operating property tax, and other miscellaneous adjustments to include payment to charter schools.
Year Basic Support
Guarantee
Special Education
Program Units
Special Education
Support Per Unit Total Distributive
Fund RevenueWeighted
EnrollmentState Aid Per
Weighted Enrollment 2005-06 $4,285 1,786.3 $34,433 $509,298,783 281,646.2 $1,808 2006-07 4,489 1,885.4 35,122 623,907,426 292,489.6 2,133 2007-08 4,891 1,945.5 36,541 744,247,587 298,551.6 2,493 2008-09 4,958 2,017.5 38,763 781,792,314 300,817.0 2,599 2009-10 4,962 1,960.7 39,768 802,013,854 299,058.6 2,682 2010-11 5,035 1,948.0 39,768 797,169,570 299,325.2 2,663 2011-12 5,136 1,973.5 39,768 795,306,492 297,659.2 2,672 2012-13 5,257 1,945.8 39,768 802,484,056 300,081.8 2,674 2013-14 (Est.) 5,457 1,936.0 41,608 882,305,000 303,450.2 2,908 2014-15 (Est.) 5,544 1,936.0 42,745 909,900,000 306,600.0 2,968 Source: CCSD Accounting Department
History Of Local Tax Support Per Pupil - General Operating FundFor Fiscal Years 2005-06 Through 2014-15
Local Total Average County Assessed Property School Governmental GST Local Tax
Daily Assessed Value Per Property Tax Per Support LSST Services Per SupportYear Members Valuation2 Pupil Tax Revenue Pupil Tax (LSST) Per Pupil Tax (GST) Pupil Per Pupil
2005-06 292,016 $ 65,582,487,400 $224,585 $426,886,954 $1,462 $722,039,234 $2,473 $60,694,024 $208 $4,143 2006-07 303,197 91,622,434,937 302,188 490,874,071 1,619 719,500,251 2,373 64,063,756 211 4,203 2007-08 306,801 109,212,919,843 355,973 548,305,408 1,787 692,828,832 2,258 63,466,908 207 4,252 2008-09 309,410 115,790,200,550 374,229 593,024,476 1,917 613,140,653 1,982 57,786,715 187 4,086 2009-10 307,978 93,790,791,674 304,537 577,905,383 1,876 658,075,682 2,137 64,984,5393 211 4,224 2010-11 307,496 65,758,625,871 213,852 463,669,889 1,508 692,813,744 2,253 50,442,782 164 3,925 2011-12 306,956 59,055,745,520 192,391 424,822,601 1,384 750,527,063 2,445 46,729,121 152 3,981 2012-13 311,132 55,225,712,175 177,499 397,676,720 1,278 792,018,758 2,546 48,827,496 157 3,981 2013-141 314,511 56,296,847,888 178,998 400,000,000 1,272 825,000,000 2,623 51,575,000 164 4,059 2014-151 317,880 64,252,633,650 202,129 415,000,000 1,306 840,170,000 2,643 52,385,000 165 4,114 1 Estimated2 The assessed value is stored at a rate of 35% of the market value of the properties.3 Includes $12,111,211 from dissolving of the Clark County Redevelopment AgencySource: CCSD Accounting Department

Info
rmat
iona
l Sec
tion
1832014-15 Comprehensive Annual Budget Report |
Indices Of Economic Growth In Clark CountyFor Calendar Years 2011 Through 2013
YearDescription 2011 2012 2013Population (estimated except for census years) 1,966,700 2,008,700 2,062,300Percent increase (decrease) (3.4)% 2.1 % 2.7 %
Newcomer population 59,000 65,000 66,000
Age/percent of total adults population: 18-24 12.1 % 12.2 % 12.3 % 25-34 20.8 % 19.7 % 19.5 % 35-44 19.7 % 19.2 % 18.8 % 45-54 18.0 % 17.8 % 17.7 % 55-64 14.5 % 15.1 % 15.1 % 65+ 14.9 % 16.0 % 16.6 %
Annual median household income $ 54,255 $ 50,962 $ 50,454
Value of residential building permits (in thousands) $ 486,835 $ 737,393 $ 917,961Number of permits 3,872 6,111 7,072
TourismVisitor volume 38,929,000 39,727,000 39,668,000Airline passengers 41,480,000 41,668,000 41,857,000Hotel/motel rooms 150,200 150,500 150,600Hotel/motel occupancy 83.8 % 84.4 % 84.3 %Convention delegates 4,865,300 4,944,000 5,107,000
Taxable sales (in thousands) $ 30,105,400 $ 31,968,800 $ 33,515,000
Source: Las Vegas Perspective, 2014 Edition
History Of Utility CostsFor Fiscal Years 2005-06 Through 2014-15
Total Utility CostYear Heat Telephone Electricity Water Refuse Sewer Utilities Per Student
2005-06 $4,452,436 $5,795,144 $39,087,295 $6,255,589 $4,696,620 $4,635,084 $64,922,168 $230.51 2006-07 4,807,841 5,995,253 43,213,762 7,378,647 5,379,730 4,979,230 71,754,463 245.32 2007-08 5,093,500 6,413,672 45,835,300 7,156,784 6,316,770 5,228,719 76,044,745 254.71 2008-09 4,764,897 6,464,181 44,544,021 10,050,171 5,559,603 5,639,598 77,022,471 256.04 2009-10 4,580,358 6,178,225 48,676,587 9,641,753 5,146,491 5,983,914 80,207,328 268.20 2010-11 4,144,898 6,433,039 46,324,037 10,322,907 4,700,132 6,355,068 78,280,081 261.52 2011-12 3,923,495 5,889,951 43,193,113 11,313,912 5,426,897 6,169,476 75,916,844 255.05 2012-13 3,154,555 5,660,199 41,800,837 13,627,187 5,906,964 6,190,671 76,340,413 254.40 2013-14(Est.) 3,700,000 5,310,000 43,250,000 13,135,000 5,955,000 6,650,000 78,000,000 257.01 2014-15(Est.) 4,845,000 6,500,000 44,000,000 14,635,000 6,000,000 6,400,000 82,380,000 268.69
Source: CCSD Accounting Department
0
20
40
60
80
$100
2005-06 2006-07 2007-08 2008-09 2009-10 2010-11 2011-12 2012-13 2013-14 2014-15
$64.9
$82.4
Heat
Water
Telephone
Refuse
Electricity
Sewer
History of Utility Costs - IllustratedFor Fiscal Years 2005-06 Through 2014-15

184 | Clark County School District
Source: Budget Department
General Operating Fund - Projected BudgetsFor Fiscal Years 2014-15 Through 2017-18Fund Expenditure Appropriations by Major Object
Description2014-15Budget
2015-16Projected
2016-17Projected
2017-18Projected Growth Rate
Revenues:Property taxes $415,000,000 $450,000,000 $475,000,000 $500,000,000 5.3%Local school support taxes 840,170,000 900,000,000 940,000,000 960,000,000 2.1%Other local revenues 84,805,000 83,300,000 87,800,000 88,000,000 0.2%State sources 909,900,000 925,000,000 940,000,000 955,000,000 1.6%Federal sources 4,300,000 4,315,000 4,500,000 4,800,000 6.7%Total Revenues 2,254,175,000 2,362,615,000 2,447,300,000 2,507,800,000 2.5%
Expenditures:Salaries 1,441,006,284 1,500,000,000 1,550,000,000 1,600,000,000 3.2%Employee benefits 586,768,559 615,000,000 645,000,000 660,000,000 2.3%Purchased services 82,343,402 77,000,000 77,000,000 77,000,000 - %Supplies 152,980,844 155,000,000 160,000,000 160,000,000 - %Property and equipment 35,747,250 2,000,000 2,000,000 2,000,000 - %Other expenditures 2,363,661 1,000,000 1,000,000 1,000,000 - %Total Expenditures 2,301,210,000 2,350,000,000 2,435,000,000 2,500,000,000 2.7%
Excess (Deficiency) of Revenuesover Expenditures (47,035,000) 12,615,000 12,300,000 7,800,000
Other Sources and (Uses):Proceeds from insurance 100,000 100,000 100,000 100,000 Sale of medium-term bonds 34,500,000 - - - Transfers to other funds (14,880,000) (9,900,000) (9,900,000) (9,900,000)Total Other Sources and (Uses) 19,720,000 (9,800,000) (9,800,000) (9,800,000)
Opening Fund Balance - July 1 80,000,000 52,685,000 55,500,000 58,000,000
Ending Fund Balance - June 30 $52,685,000 $55,500,000 $58,000,000 $56,000,000
Fund Balance:Nonspendable $5,000,000 $4,000,000 $3,500,000 $3,000,000 Restricted 165,000 150,000 150,000 150,000 Assigned 15,590,000 13,000,000 10,000,000 7,000,000 Unassigned 31,930,000 38,350,000 44,350,000 45,850,000
Total Fund Balance $52,685,000 $55,500,000 $58,000,000 $56,000,000
Distributive School Account (DSA) funding is a significant component (79.1%) of the General Operating Fund revenues and is mostly determined by the biennial Nevada State Legislature. Key funding elements involve LSST (sales) taxes and property tax collections based upon fluctuating local property valuations. Expenditures for salaries and benefits could fluctuate significantly based upon final agreements from the ongoing negotiations with each of the employee unions.
Future LSST and property tax collection projections are based upon a conservative vision for a local economy that has not reflected a measurable return to pre-2009 levels of growth. Expenditure projections were determined through a conservative historical trending that assumes no cost of living increases to employee salary schedules and contained expenditure appropriations to arrive at a nominal ending fund balance.

Info
rmat
iona
l Sec
tion
1852014-15 Comprehensive Annual Budget Report |
Special Revenue Funds - Projected BudgetsFor Fiscal Years 2014-15 Through 2017-18Fund Expenditure Appropriations by Major Object
Description2014-15Budget
2015-16Projected
2016-17Projected
2017-18Projected Growth Rate
Revenues:Local sources $13,545,000 $14,000,000 $14,500,000 $15,000,000 3.4 %State sources 80,880,000 81,000,000 83,500,000 87,000,000 4.2 %Federal sources 244,850,000 245,000,000 247,000,000 248,000,000 0.4 %Total Revenues 339,275,000 340,000,000 345,000,000 350,000,000 1.4 %
Expenditures:Salaries 176,480,250 180,000,000 183,000,000 185,000,000 1.1 %Employee benefits 61,102,000 65,000,000 67,000,000 70,000,000 4.5 %Purchased services 38,196,000 35,000,000 35,000,000 35,000,000 - %Supplies 57,017,750 55,000,000 55,000,000 55,000,000 - %Property and equipment 6,015,000 5,000,000 3,500,000 3,500,000 - %Other expenditures 12,539,000 5,000,000 3,000,000 3,000,000 - %Total Expenditures 351,350,000 345,000,000 346,500,000 351,500,000 1.4 %
Excess (Deficiency) of Revenuesover Expenditures (12,075,000) (5,000,000) (1,500,000) (1,500,000)
Other Sources and (Uses):Transfers from other funds 10,000,000 - - -
Opening fund balance - July 1 11,444,573 9,369,573 4,369,573 2,869,573
Ending Fund Balance - June 30 $9,369,573 $4,369,573 $2,869,573 $1,369,573 Source: Budget Department
Debt Service Funds - Projected BudgetsFor Fiscal Years 2014-15 Through 2017-18Fund Expenditure Appropriations by Major Object
Description2014-15Budget
2015-16Projected
2016-17Projected
2017-18Projected Growth Rate
Revenues:Property taxes $ 306,215,000 $ 331,900,000 $ 349,980,000 $ 369,980,000 5.7 %Interest on investments 1,560,000 80,000 - - - %Other local revenues 25,000 20,000 20,000 20,000 - %Total Revenues 307,800,000 332,000,000 350,000,000 370,000,000 5.7 %
Expenditures:Principal 312,475,000 280,805,000 289,590,000 294,840,000 1.8 %Interest 142,320,000 125,495,000 111,645,000 97,225,000 (12.9)%Purchased services 2,405,000 - - - - %Total Expenditures 457,200,000 406,300,000 401,235,000 392,065,000 (2.3)%
Excess (Deficiency) of Revenuesover Expenditures (149,400,000) (74,300,000) (51,235,000) (22,065,000)
Other Sources and (Uses):Proceeds of refunding bonds 437,590,000 - - - Payment to refunding escrow agent (435,185,000) - - - Transfer from other funds 87,280,000 86,845,000 86,855,000 86,600,000 Total Other Sources and (Uses): 89,685,000 86,845,000 86,855,000 86,600,000
Opening Fund Balance - July 1 67,855,693 8,140,693 20,685,693 56,305,693
Ending Fund Balance - June 30 $8,140,693 $20,685,693 $56,305,693 $120,840,693 Source: Budget Department

186 | Clark County School District
Capital Projects Funds - Projected BudgetsFor Fiscal Years 2014-15 Through 2017-18Fund Expenditure Appropriations by Major Object
Description2014-15Budget
2015-16Projected
2016-17Projected
2017-18Projected Growth Rate
Revenues:Real estate transfer taxes $ 22,175,000 $ 18,250,000 $ 18,500,000 $ 19,000,000 2.7 %Hotel room taxes 72,000,000 66,500,000 66,750,000 67,000,000 0.4 %Governmental services taxes 23,400,000 22,000,000 22,500,000 23,000,000 2.2 %Interest on investments 1,095,000 1,000,000 750,000 500,000 (33.3)%Other local revenues 195,000 50,000 50,000 50,000 - %Federal Revenues 6,075,000 6,075,000 6,070,000 6,070,000 - %Total Revenues 124,940,000 113,875,000 114,620,000 115,620,000 0.9 %
Expenditures:Salaries 9,484,000 3,000,000 3,000,000 3,000,000 - %Employee benefits 3,026,000 1,000,000 1,000,000 1,000,000 - %Purchased services 66,535,000 11,700,000 11,700,000 11,700,000 - %Supplies 8,595,000 5,255,000 5,255,000 5,255,000 - %Property and equipment 815,000 750,000 750,000 750,000 - %Other expenditures 95,000 245,000 245,000 245,000 - %Total Expenditures 88,550,000 21,950,000 21,950,000 21,950,000 - %
Excess (Deficiency) of Revenuesover Expenditures 36,390,000 91,925,000 92,670,000 93,670,000
Other Sources and (Uses):Transfers from other funds 1,600,000 - - - Transfers to other funds (84,000,000) (81,945,000) (81,955,000) (81,700,000)Total Other Sources and (Uses) (82,400,000) (81,945,000) (81,955,000) (81,700,000)
Opening Fund Balance - July 1 270,651,871 224,641,871 234,621,871 245,336,871
Ending Fund Balance - June 30 $224,641,871 $234,621,871 $245,336,871 $257,306,871

Info
rmat
iona
l Sec
tion
1872014-15 Comprehensive Annual Budget Report |
Schedule Of Staff Positions - General Operating FundFor Fiscal Years 2011-12 Through 2014-15
2011-12 2012-13 2013-14 2014-15Description Actual Actual Actual Budget
Instructional staffRegular education Licensed 12,556.81 11,785.80 12,581.60 12,802.96
Non-licensed 353.76 356.19 345.99 345.90Special education Licensed 3,093.60 3,047.10 3,132.10 3,269.00
Non-licensed 1,142.67 1,163.81 1,198.64 1,291.94Vocational education Licensed 59.00 59.00 59.00 59.00English language learners Licensed - - 15.00 22.00
Non-licensed - - 12.49 0.00Alternative education Licensed - - 130.50 151.50
Non-licensed - - 0.66 0.66Co-curricular activities Licensed 36.00 36.00 36.00 38.00
Total, instruction Licensed 15,745.41 14,927.90 15,954.20 16,342.46Non-licensed 1,496.43 1,520.00 1,557.78 1,638.50
Administrative and instructional support staffStudent support Licensed 999.00 999.92 1,013.00 1,019.00
Non-licensed 263.46 269.76 267.70 265.34Instructional staff support Licensed 545.52 556.72 527.50 493.50
Non-licensed 347.78 375.78 425.31 469.14General administration Licensed 51.40 55.40 57.60 60.60
Non-licensed 67.76 68.60 75.60 81.60School administration Licensed 793.00 812.00 850.92 883.92
Non-licensed 1,365.90 1,375.94 1,373.26 1,378.72Central services Licensed 46.10 44.00 42.00 41.00
Non-licensed 444.20 474.63 475.24 489.46
Total, administrative and instructional support staff
Licensed 2,435.02 2,468.04 2,491.02 2,498.02Non-licensed 2,489.10 2,564.71 2,617.11 2,684.26
Operating/maintenance plant services 2,550.42 2,534.31 2,557.64 2,561.90Student transportation 1,200.76 1,344.16 1,434.58 1,506.72
Total, other staff 3,751.18 3,878.47 3,992.22 4,068.62
Total, General Operating Fund 25,917.14 25,359.12 26,612.33 27,231.86
Note: FTEs reflect 9-, 10-, and 11-month support staff as percentages of full FTEs.Source: CCSD Budget and Accounting Departments
The reduction of 558 FTEs from 2011-12 to 2012-13 fiscal years is in response to the level of available funding and reflects the impacts of budgetary reductions of over $63 million.

188 | Clark County School District
Schedule Of Staff Positions - Other FundsFor Fiscal Years 2011-12 Through 2014-15
2011-12 2012-13 2013-14 2014-15Description Actual Actual Actual BudgetInstructional staff
Regular education Licensed 931.50 973.50 1,242.64 1,217.64Non-licensed 169.00 111.00 103.30 89.80
Special education Licensed 32.00 25.00 9.07 9.07Non-licensed 254.00 252.00 201.93 201.93
Vocational education Licensed 1.00 2.00 3.00 3.00Non-licensed 10.00 10.00 8.50 8.50
Adult education Licensed 42.00 52.00 46.00 46.00Athletics Licensed - - 9.00 9.00
Non-licensed - - 5.00 5.00Total, instruction Licensed 1,006.50 1,052.50 1,309.71 1,284.71
Non-licensed 433.00 373.00 318.73 305.23
Administrative and instructional support staffStudent support Licensed 64.00 68.00 89.00 89.00
Non-licensed 42.00 39.00 70.25 70.25Instructional staff support Licensed 78.00 130.00 309.28 313.28
Non-licensed 44.00 49.00 48.66 46.66General administration Licensed 30.00 1.00 0.50 0.50
Non-licensed 15.00 1.00 0.00 - Central services Licensed 58.50 59.50 30.25 29.75
Non-licensed 233.43 257.35 283.81 282.81Total, administrative and instructional support Licensed 230.50 258.50 429.03 432.53
Non-licensed 334.43 346.35 402.72 399.72
Other staffOperating/maintenance plant services Non-licensed 26.90 21.90 6.90 23.90Food service Non-licensed 451.74 492.33 515.38 497.80Community Services Licensed - - 11.00 11.00
Non-licensed - - 4.16 5.16Land and building acquisition and improvement Non-licensed 154.00 110.00 66.00 66.00
Total, other staff Licensed - - 11.00 11.00Non-licensed 632.64 624.23 592.44 592.86
Total, all other funds 2,637.07 2,654.58 3,063.63 3,026.05
Source: CCSD Budget and Accounting Departments
Grand total, all funds 28,554.21 28,013.70 27,214.75 30,257.91
Educational Level Of Teaching StaffFor Fiscal Years 2006-07 Through 2013-14
Education 2006-07 2007-08 2008-09 2009-10 2010-11 2011-12 2012-13 2013-141
Bachelor’s Degree 18.7 % 17.1 % 15.1 % 13.0 % 11.2 % 10.9 % 13.5 % 13.3 %Bachelor’s + 16 Hours 6.7 6.6 6.5 6.0 5.3 4.9 4.7 4.3 Bachelor’s + 32 Hours 12.8 12.8 12.4 12.4 11.0 10.2 9.8 8.7 Master’s Degree 22.7 23.1 22.6 22.4 23.4 23.7 23.8 26.0 Master’s + 16 Hours 6.3 6.4 7.5 6.7 6.7 6.9 6.6 6.2 Master’s + 32 Hours 32.1 33.2 28.8 29.2 29.4 29.0 26.9 27.6 Doctorate2 0.7 0.8 7.1 10.3 13.0 14.4 0.9 1.1 ASC3 - - - - - - 13.6 12.6 ASC + Doctorate3 - - - - - - 0.2 0.2
Total percentage 100% 100% 100% 100% 100% 100% 100% 100%
1 Based upon General Operating Fund licensed positions as of May 2014.2 Between 2008 and 2012, Doctorate degree qualification was superseded with a District sponsored Advance Studies3 Starting July 1, 2012, Doctorate degree qualification was separated from District sponsored Advance Studies Certification qualificationSource: CCSD Human Resources

Info
rmat
iona
l Sec
tion
1892014-15 Comprehensive Annual Budget Report |
History Of Teachers’ Salary SchedulesFor Fiscal Years 2007-08 Through 2014-15
Minimums/ Maximums 2007-08 2008-09 2009-10 2010-11 2011-12 2012-13 2013-14 2014-15
Class A (Bachelor’s) $ 33,734 $35,083 $ 35,083 $ 35,083 $ 34,688 $ 34,688 $ 34,684 $ 34,684 39,372 40,947 40,947 40,947 40,486 40,486 40,482 40,482
Class B (Bachelor’s + 16) 35,542 36,964 36,964 36,964 36,548 36,548 36,545 36,545 42,603 44,307 44,307 44,307 43,809 43,809 43,805 43,805
Class C (Bachelor’s + 32) 37,356 38,850 38,850 38,850 38,413 38,413 38,409 38,409 48,648 50,594 50,594 50,594 50,025 50,025 50,020 50,020
Class D (Master’s) 39,171 40,738 40,738 40,738 40,280 40,280 40,276 40,276 50,466 52,485 52,485 52,485 51,895 51,895 51,890 51,890
Class E (Master’s + 16) 40,988 42,628 42,628 42,628 42,148 42,148 42,144 42,144 52,275 54,366 54,366 54,366 53,754 53,754 53,748 53,748
Class F (Master’s + 32) 43,287 45,018 45,018 45,018 44,512 44,512 44,508 44,508 64,305 66,877 66,877 66,877 66,125 66,125 66,119 66,119
Class G (PH D) 43,787 48,201 48,201 48,201 47,659 46,012 46,008 46,008 64,805 70,060 70,060 70,060 69,272 67,625 67,619 67,619
Class H (ASC) 47,659 47,654 47,65469,272 69,265 69,265
Class I (ASC+PH D) 49,159 49,154 49,15470,772 70,765 70,765
Source: CCSD Human Resources
Teacher Salary Schedule - Full Time Teacher PlacementFiscal Year 2013-14
CLASS A CLASS B CLASS C CLASS D CLASS E CLASS F CLASS G CLASS H CLASS IStep BA/BS BA/BS + 16 BA/BS + 32 MA/MS MA/MS + 16 MA/MS + 32 PH D ASC ASC+PH D
1 659 45 114 244 8 22 7 2 416 111 89 315 33 57 8 3 161 45 60 232 32 44 4 3 4 101 31 47 239 40 56 4 4 1 5 677 105 135 573 121 181 6 36 2 6 315 181 723 189 406 8 135 2 7 71 262 77 198 4 72 2 8 59 210 72 209 4 84 1 9 562 1,135 371 203 3 72 10 304 6 112 11 239 21 110 1 12 249 11 132 1 13 253 13 119 14 1,750 61 1,018 13
Totals 2,014 652 1,318 3,933 943 4,171 160 1,897 23 Note: Based upon General Operating Fund licensed positions as of May 2014Source: CCSD Human Resources

190 | Clark County School District
Debt Service Fund - Schedule Of General Obligation Bonds OutstandingAs of July 1, 2014
Issue DateDate of
Final Maturity TermInterest
RateOriginal
IssueBalance
July 1, 2014September 1, 1998 (Refunding May 1996) June 15, 2015 17 Years 4.6977% $ 169,310,000 $ 26,770,000
March 1, 2005A (Refunding April 1999, June 2002) June 15, 2019 14 Years 3.9800 269,600,000 219,025,000
March 1, 2005B (Refunding October 2001) June 15, 2022 17 Years 4.0713 209,995,000 161,795,000
November 15, 2005C1 June 15, 2019 20 Years 4.4161 500,000,000 107,790,000
March 30, 2006A (Refunding March 1996, June 2002) June 15, 2015 9 Years 3.8515 153,925,000 21,170,000
December 19, 2006B June 15, 2026 20 Years 4.1025 450,000,000 335,750,000
December 19, 2006C June 15, 2026 20 Years 4.1125 125,000,000 93,270,000
March 30, 2007A (Refunding November 2003,November 2004, November 2005) June 15, 2025 18 Years 4.1262 473,045,000 343,780,000
December 11, 2007B June 15, 2027 20 Years 4.3246 250,000,000 197,920,000
December 11, 2007C June 15, 2027 20 Years 4.3330 400,000,000 316,675,000
June 3, 2008A June 15, 2028 20 Years 4.1960 675,000,000 444,565,000
July 8, 2010A June 15, 2024 14 Years 0.7497 104,000,000 104,000,000
July 8, 2010D June 15, 2020 10 Years 0.7033 6,245,000 6,245,000
March 3, 2011A (Refunding September 2001C) June 15, 2016 5 Years 2.1065 69,160,000 29,380,000
March 3, 2011B (Refunding September 2001D) June 15, 2019 8 Years 2.9849 29,420,000 29,420,000
October 4, 2012A (Refunding November 2004, November 2005) June 15, 2021 9 Years 1.6657 159,425,000 159,425,000
July 31, 2013A June 15, 2023 10 Years 2.5233 32,855,000 29,015,000
July 31, 2013B (Refunding November 2003, November 2004, November 2005) June 15, 2019 6 Years 1.7281 95,870,000 74,755,000
April 29, 2014A (Refunding March and November 2004) June 15, 2020 6 Years 1.1606 131,175,000 131,175,000
April 29, 2014B (Refunding March 2004) June 15, 2020 6 Years 1.3486 62,200,000 62,200,000
Total Outstanding Bonded Indebtness $2,894,125,000 1 Date of final maturity has been changed from the original final maturity due to refunded debt payments.
Source: CCSD Budget and Accounting Departments

Info
rmat
iona
l Sec
tion
1912014-15 Comprehensive Annual Budget Report |
Debt Service Fund - Combined Amortization SchedulesAs of July 1, 2014
Fiscal Year
Original Issue Date Principal Interest
Total Payments
2014-15 09-01-98 $26,770,000 $ 1,472,350 $28,242,3502014-15 03-01-05A 26,970,000 11,018,675 37,988,6752014-15 03-01-05B 17,345,000 8,089,750 25,434,7502014-15 11-15-05C 25,010,000 5,389,500 30,399,5002014-15 03-30-06A 21,170,000 1,058,500 22,228,5002014-15 12-01-06B 21,795,000 13,796,900 35,591,9002014-15 12-01-06C 6,055,000 4,239,150 10,294,1502014-15 03-30-07A 24,945,000 16,116,750 41,061,7502014-15 12-01-07B 11,695,000 9,896,000 21,591,0002014-15 12-01-07C 18,715,000 15,833,750 34,548,7502014-15 6-01-08A 22,685,000 22,228,250 44,913,2502014-15 7-08-10A 100,000 5,729,630 5,829,6302014-15 7-08-10D - 344,100 344,1002014-15 3-03-11A 14,285,000 1,469,000 15,754,0002014-15 3-03-11B 8,925,000 1,471,000 10,396,0002014-15 10-4-12A 20,545,000 7,971,250 28,516,2502014-15 7-31-13A 3,840,000 1,040,425 4,880,4252014-15 7-31-13B 21,200,000 3,737,750 24,937,7502014-15 4-29-14A 15,205,000 7,783,556 22,988,5562014-15 4-29-14B 5,220,000 3,632,967 8,853,714Fiscal Year Totals 312,475,000 142,319,253 454,795,000
2015-16 03-01-05A 28,215,000 9,602,750 37,817,7502015-16 03-01-05B 18,050,000 7,222,500 25,272,5002015-16 11-15-05C 26,260,000 4,139,000 30,399,0002015-16 12-01-06B 22,665,000 12,707,150 35,372,1502015-16 12-01-06C 6,295,000 3,936,400 10,231,4002015-16 03-30-07A 25,940,000 15,118,950 41,058,9502015-16 12-01-07B 12,165,000 9,311,250 21,476,2502015-16 12-01-07C 19,465,000 14,898,000 34,363,0002015-16 6-01-08A 23,815,000 21,094,000 44,909,0002015-16 7-08-10A - 5,724,890 5,724,8902015-16 7-08-10D - 344,100 344,1002015-16 3-03-11A 15,095,000 754,750 15,849,7502015-16 3-03-11B 9,370,000 1,024,750 10,394,7502015-16 10-4-12A 26,305,000 6,944,000 33,249,0002015-16 7-31-13A 4,000,000 886,825 4,886,8252015-16 7-31-13B - 2,677,750 2,677,7502015-16 4-29-14A 37,280,000 6,141,425 43,421,4252015-16 4-29-14B 5,885,000 2,960,350 8,845,350Fiscal Year Totals 280,805,000 125,488,840 406,293,840
2016-17 03-01-05A 52,105,000 8,192,000 60,297,0002016-17 03-01-05B 18,805,000 6,320,000 25,125,0002016-17 11-15-05C 27,570,000 2,826,000 30,396,0002016-17 12-01-06B 23,570,000 11,687,225 35,257,2252016-17 12-01-06C 6,550,000 3,621,650 10,171,6502016-17 03-30-07A 26,980,000 14,081,350 41,061,3502016-17 12-01-07B 12,650,000 8,703,000 21,353,0002016-17 12-01-07C 20,245,000 13,924,750 34,169,7502016-17 6-01-08A 25,010,000 19,903,250 44,913,2502016-17 7-08-10A - 5,724,890 5,724,8902016-17 7-08-10D - 344,100 344,1002016-17 3-03-11B - 556,250 556,2502016-17 10-4-12A - 5,628,750 5,628,7502016-17 7-31-13A 4,160,000 726,825 4,886,8252016-17 7-31-13B 24,255,000 2,677,750 26,932,7502016-17 4-29-14A 31,305,000 4,091,025 35,396,0252016-17 4-29-14B 16,385,000 2,636,675 19,021,675Fiscal Year Totals 289,590,000 111,645,490 401,235,490
Fiscal Year
Original Issue Date Principal Interest
Total Payments
2017-18 03-01-05A $54,580,000 $ 5,586,750 60,166,7502017-18 03-01-05B 19,605,000 5,379,750 24,984,7502017-18 11-15-05C 28,950,000 1,447,500 30,397,5002017-18 12-01-06B 24,635,000 10,626,575 35,261,5752017-18 12-01-06C 6,840,000 3,294,150 10,134,1502017-18 03-30-07A 28,190,000 12,867,250 41,057,2502017-18 12-01-07B 13,190,000 8,070,500 21,260,5002017-18 12-01-07C 21,105,000 12,912,500 34,017,5002017-18 6-01-08A 26,260,000 18,652,750 44,912,7502017-18 7-08-10A - 5,724,890 5,724,8902017-18 7-08-10D - 344,100 344,1002017-18 3-03-11B - 556,250 556,2502017-18 10-4-12A 24,870,000 5,628,750 30,498,7502017-18 7-31-13A 4,325,000 560,425 4,885,4252017-18 7-31-13B - 1,465,000 1,465,0002017-18 4-29-14A 24,990,000 2,369,250 27,359,2502017-18 4-29-14B 17,300,000 1,735,500 19,035,500Fiscal Year Totals 294,840,000 97,221,890 392,061,890
2018-19 03-01-05A 57,155,000 2,857,750 60,012,7502018-19 03-01-05B 20,445,000 4,399,500 24,844,5002018-19 12-01-06B 25,740,000 9,394,825 35,134,8252018-19 12-01-06C 7,150,000 2,952,150 10,102,1502018-19 03-30-07A 29,320,000 11,739,650 41,059,6502018-19 12-01-07B 13,750,000 7,411,000 21,161,0002018-19 12-01-07C 22,000,000 11,857,250 33,857,2502018-19 6-01-08A 27,570,000 17,339,750 44,909,7502018-19 7-08-10A - 5,724,890 5,724,8902018-19 7-08-10D - 344,100 344,1002018-19 3-03-11B 11,125,000 556,250 11,681,2502018-19 10-4-12A 26,110,000 4,385,250 30,495,2502018-19 7-31-13A 2,390,000 387,425 2,777,4252018-19 7-31-13B 29,300,000 1,465,000 30,765,0002018-19 4-29-14A 10,925,000 1,119,750 12,044,7502018-19 4-29-14B 6,740,000 870,500 7,610,500Fiscal Year Totals 289,720,000 82,805,040 372,525,040
2019-20 03-01-05B 21,440,000 3,377,250 24,817,2502019-20 12-01-06B 26,900,000 8,107,825 35,007,8252019-20 12-01-06C 7,470,000 2,594,650 10,064,6502019-20 03-30-07A 30,640,000 10,420,250 41,060,2502019-20 12-01-07B 14,335,000 6,723,500 21,058,5002019-20 12-01-07C 22,935,000 10,757,250 33,692,2502019-20 6-01-08A 28,950,000 15,961,250 44,911,2502019-20 7-08-10A 2,755,000 5,724,890 8,479,8902019-20 7-08-10D 6,245,000 344,100 6,589,1002019-20 10-4-12A 30,045,000 3,079,750 33,124,7502019-20 7-31-13A 2,465,000 315,725 2,780,7252019-20 4-29-14A 11,470,000 573,500 12,043,5002019-20 4-29-14B 10,670,000 533,500 11,203,500Fiscal Year Totals 216,320,000 68,513,440 284,833,440

192 | Clark County School District
Debt Service Fund - Combined Amortization SchedulesAs of July 1, 2014
Fiscal Year
Original Issue Date Principal Interest
Total Payments
2020-21 03-01-05B $22,490,000 $ 2,305,250 $24,795,2502020-21 12-01-06B 28,110,000 6,762,825 34,872,8252020-21 12-01-06C 7,810,000 2,221,150 10,031,1502020-21 03-30-07A 32,170,000 8,888,250 41,058,2502020-21 12-01-07B 14,980,000 6,006,750 20,986,7502020-21 12-01-07C 23,970,000 9,610,500 33,580,5002020-21 6-01-08A 30,400,000 14,513,750 44,913,7502020-21 7-08-10A 22,000,000 5,573,090 27,573,0902020-21 10-4-12A 31,550,000 1,577,500 33,127,5002020-21 7-31-13A 2,535,000 241,775 2,776,775Fiscal Year Totals 216,015,000 57,700,840 273,715,840
2021-22 03-01-05B 23,615,000 1,180,750 24,795,7502021-22 12-01-06B 29,515,000 5,357,325 34,872,3252021-22 12-01-06C 8,200,000 1,830,650 10,030,6502021-22 03-30-07A 33,780,000 7,279,750 41,059,7502021-22 12-01-07B 15,655,000 5,257,750 20,912,7502021-22 12-01-07C 25,045,000 8,412,000 33,457,0002021-22 6-01-08A 31,915,000 12,993,750 44,908,7502021-22 7-08-10A 22,000,000 4,360,890 26,360,8902021-22 7-31-13A 2,610,000 165,725 2,775,725Fiscal Year Totals 192,335,000 46,838,590 239,173,590
2022-23 12-01-06B 30,990,000 4,471,875 35,461,8752022-23 12-01-06C 8,610,000 1,420,650 10,030,6502022-23 03-30-07A 35,470,000 5,590,750 41,060,7502022-23 12-01-07B 16,360,000 4,475,000 20,835,0002022-23 12-01-07C 26,175,000 7,159,750 33,334,7502022-23 6-01-08A 33,515,000 11,398,000 44,913,0002022-23 7-08-10A 28,070,000 3,148,690 31,218,6902022-23 7-31-13A 2,690,000 87,425 2,777,425Fiscal Year Totals 181,880,000 37,752,140 219,632,140
2023-24 12-01-06B 32,540,000 3,387,225 35,927,2252023-24 12-01-06C 9,040,000 990,150 10,030,1502023-24 03-30-07A 37,240,000 3,817,250 41,057,2502023-24 12-01-07B 17,095,000 3,657,000 20,752,0002023-24 12-01-07C 27,350,000 5,851,000 33,201,0002023-24 6-01-08A 35,190,000 9,722,250 44,912,2502023-24 7-08-10A 29,075,000 1,602,033 30,677,033Fiscal Year Totals 187,530,000 29,026,908 216,556,908
- Continued
Fiscal Year
Original Issue Date Principal Interest
Total Payments
2024-25 12-01-06B $33,925,000 $ 2,248,325 $36,173,3252024-25 12-01-06C 9,425,000 673,750 10,098,7502024-25 03-30-07A 39,105,000 1,955,250 41,060,2502024-25 12-01-07B 17,865,000 2,802,250 20,667,2502024-25 12-01-07C 28,585,000 4,483,500 33,068,5002024-25 6-01-08A 36,950,000 7,962,750 44,912,750Fiscal Year Totals 165,855,000 20,125,825 185,980,825
2025-26 12-01-06B 35,365,000 1,060,950 36,425,9502025-26 12-01-06C 9,825,000 343,875 10,168,8752025-26 12-01-07B 18,670,000 1,909,000 20,579,0002025-26 12-01-07C 29,870,000 3,054,250 32,924,2502025-26 6-01-08A 38,795,000 6,115,250 44,910,250Fiscal Year Totals 132,525,000 12,483,325 145,008,325
2026-27 12-01-07B 19,510,000 975,500 20,485,5002026-27 12-01-07C 31,215,000 1,560,750 32,775,7502026-27 6-01-08A 40,735,000 4,175,500 44,910,500Fiscal Year Totals 91,460,000 6,711,750 98,171,750
2027-28 6-01-08A 42,775,000 2,138,750 44,913,750Fiscal Year Totals 42,775,000 2,138,750 44,913,750

Info
rmat
iona
l Sec
tion
1932014-15 Comprehensive Annual Budget Report |
Source: CCSD Zoning and Demographics

194 | Clark County School District
Source: CCSD Facilities Department

Info
rmat
iona
l Sec
tion
1952014-15 Comprehensive Annual Budget Report |
Source: CCSD Facilities Department

196 | Clark County School District
Source: CCSD Facilities Department

Info
rmat
iona
l Sec
tion
1972014-15 Comprehensive Annual Budget Report |
Source: CCSD Facilities Department

198 | Clark County School District
Summary Of Schools By Age And Size
Some statistics on the schools of the District are as follows:
1. The average school building in the District is over 20 years old. The oldest school, Goodsprings, is 101 years old.2. The largest and smallest schools by type and enrollment are as follows:
School Type Largest Enrollment Smallest EnrollmentElementary William V. Wright 1,244 Goodsprings 8Secondary Rancho HS 3,219 Indian Springs 114
3. The numbers of schools by enrollment size are as follows:
Enrollment Elementary MiddleSr. High
CombinedSpecial
EducationAlternative Education Total
1 0 0 0 0 10 101 - 99 4 1 1 5 12 23100 - 399 7 1 6 3 3 20400 - 499 14 1 0 0 1 16500 - 599 27 1 1 0 0 29600 - 699 63 0 2 0 0 65700 - 799 44 1 1 0 1 47800 - 899 38 4 0 0 0 42900 - 999 13 3 0 0 0 161,000 - 1,299 7 14 1 0 0 221,300 - 1,599 0 22 3 0 0 251,600 - 2,199 0 8 9 0 0 172,200 - 2,499 0 0 8 0 0 82,500 & Over 0 0 17 0 0 17
Totals 217 56 49 8 26 356
4. The numbers of schools by age are as follows:
Building Year Schools1913 - 1949 8
1950 - 1959 20
1960 - 1969 39
1970 - 1979 31
1980 - 1989 23
1990 - 1999 98
2000 - 2010 119
Non-District 18Total Schools 356
1 Total includes Desert Rose High School whose students are counted as enrolled in their home schools, schools closed for renovation, and alternative education programs which are not included in District enrollments.
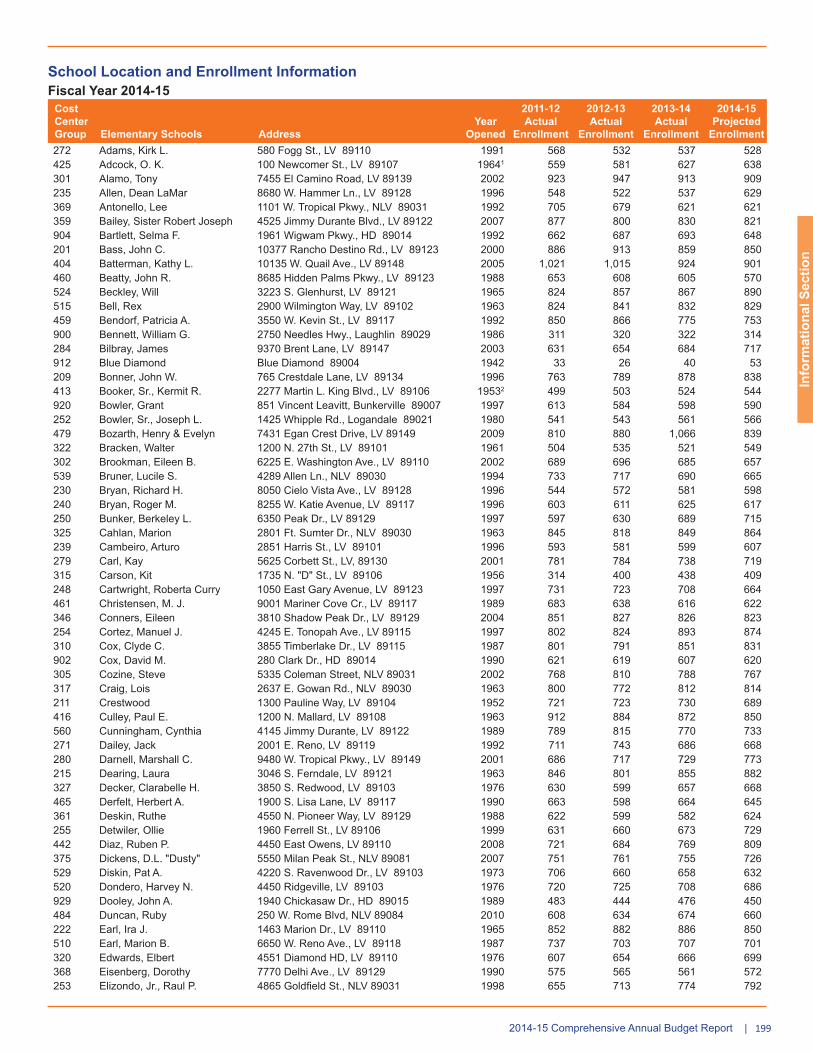
Info
rmat
iona
l Sec
tion
1992014-15 Comprehensive Annual Budget Report |
School Location and Enrollment InformationFiscal Year 2014-15
Cost Center Group Elementary Schools Address
Year Opened
2011-12 Actual
Enrollment
2012-13 Actual
Enrollment
2013-14 Actual
Enrollment
2014-15 Projected
Enrollment272 Adams, Kirk L. 580 Fogg St., LV 89110 1991 568 532 537 528 425 Adcock, O. K. 100 Newcomer St., LV 89107 19641 559 581 627 638 301 Alamo, Tony 7455 El Camino Road, LV 89139 2002 923 947 913 909 235 Allen, Dean LaMar 8680 W. Hammer Ln., LV 89128 1996 548 522 537 629 369 Antonello, Lee 1101 W. Tropical Pkwy., NLV 89031 1992 705 679 621 621 359 Bailey, Sister Robert Joseph 4525 Jimmy Durante Blvd., LV 89122 2007 877 800 830 821 904 Bartlett, Selma F. 1961 Wigwam Pkwy., HD 89014 1992 662 687 693 648 201 Bass, John C. 10377 Rancho Destino Rd., LV 89123 2000 886 913 859 850 404 Batterman, Kathy L. 10135 W. Quail Ave., LV 89148 2005 1,021 1,015 924 901 460 Beatty, John R. 8685 Hidden Palms Pkwy., LV 89123 1988 653 608 605 570 524 Beckley, Will 3223 S. Glenhurst, LV 89121 1965 824 857 867 890 515 Bell, Rex 2900 Wilmington Way, LV 89102 1963 824 841 832 829 459 Bendorf, Patricia A. 3550 W. Kevin St., LV 89117 1992 850 866 775 753 900 Bennett, William G. 2750 Needles Hwy., Laughlin 89029 1986 311 320 322 314 284 Bilbray, James 9370 Brent Lane, LV 89147 2003 631 654 684 717 912 Blue Diamond Blue Diamond 89004 1942 33 26 40 53 209 Bonner, John W. 765 Crestdale Lane, LV 89134 1996 763 789 878 838 413 Booker, Sr., Kermit R. 2277 Martin L. King Blvd., LV 89106 19532 499 503 524 544 920 Bowler, Grant 851 Vincent Leavitt, Bunkerville 89007 1997 613 584 598 590 252 Bowler, Sr., Joseph L. 1425 Whipple Rd., Logandale 89021 1980 541 543 561 566 479 Bozarth, Henry & Evelyn 7431 Egan Crest Drive, LV 89149 2009 810 880 1,066 839 322 Bracken, Walter 1200 N. 27th St., LV 89101 1961 504 535 521 549 302 Brookman, Eileen B. 6225 E. Washington Ave., LV 89110 2002 689 696 685 657 539 Bruner, Lucile S. 4289 Allen Ln., NLV 89030 1994 733 717 690 665 230 Bryan, Richard H. 8050 Cielo Vista Ave., LV 89128 1996 544 572 581 598 240 Bryan, Roger M. 8255 W. Katie Avenue, LV 89117 1996 603 611 625 617 250 Bunker, Berkeley L. 6350 Peak Dr., LV 89129 1997 597 630 689 715 325 Cahlan, Marion 2801 Ft. Sumter Dr., NLV 89030 1963 845 818 849 864 239 Cambeiro, Arturo 2851 Harris St., LV 89101 1996 593 581 599 607 279 Carl, Kay 5625 Corbett St., LV, 89130 2001 781 784 738 719 315 Carson, Kit 1735 N. "D" St., LV 89106 1956 314 400 438 409 248 Cartwright, Roberta Curry 1050 East Gary Avenue, LV 89123 1997 731 723 708 664 461 Christensen, M. J. 9001 Mariner Cove Cr., LV 89117 1989 683 638 616 622 346 Conners, Eileen 3810 Shadow Peak Dr., LV 89129 2004 851 827 826 823 254 Cortez, Manuel J. 4245 E. Tonopah Ave., LV 89115 1997 802 824 893 874 310 Cox, Clyde C. 3855 Timberlake Dr., LV 89115 1987 801 791 851 831 902 Cox, David M. 280 Clark Dr., HD 89014 1990 621 619 607 620 305 Cozine, Steve 5335 Coleman Street, NLV 89031 2002 768 810 788 767 317 Craig, Lois 2637 E. Gowan Rd., NLV 89030 1963 800 772 812 814 211 Crestwood 1300 Pauline Way, LV 89104 1952 721 723 730 689 416 Culley, Paul E. 1200 N. Mallard, LV 89108 1963 912 884 872 850 560 Cunningham, Cynthia 4145 Jimmy Durante, LV 89122 1989 789 815 770 733 271 Dailey, Jack 2001 E. Reno, LV 89119 1992 711 743 686 668 280 Darnell, Marshall C. 9480 W. Tropical Pkwy., LV 89149 2001 686 717 729 773 215 Dearing, Laura 3046 S. Ferndale, LV 89121 1963 846 801 855 882 327 Decker, Clarabelle H. 3850 S. Redwood, LV 89103 1976 630 599 657 668 465 Derfelt, Herbert A. 1900 S. Lisa Lane, LV 89117 1990 663 598 664 645 361 Deskin, Ruthe 4550 N. Pioneer Way, LV 89129 1988 622 599 582 624 255 Detwiler, Ollie 1960 Ferrell St., LV 89106 1999 631 660 673 729 442 Diaz, Ruben P. 4450 East Owens, LV 89110 2008 721 684 769 809 375 Dickens, D.L. "Dusty" 5550 Milan Peak St., NLV 89081 2007 751 761 755 726 529 Diskin, Pat A. 4220 S. Ravenwood Dr., LV 89103 1973 706 660 658 632 520 Dondero, Harvey N. 4450 Ridgeville, LV 89103 1976 720 725 708 686 929 Dooley, John A. 1940 Chickasaw Dr., HD 89015 1989 483 444 476 450 484 Duncan, Ruby 250 W. Rome Blvd, NLV 89084 2010 608 634 674 660 222 Earl, Ira J. 1463 Marion Dr., LV 89110 1965 852 882 886 850 510 Earl, Marion B. 6650 W. Reno Ave., LV 89118 1987 737 703 707 701 320 Edwards, Elbert 4551 Diamond HD, LV 89110 1976 607 654 666 699 368 Eisenberg, Dorothy 7770 Delhi Ave., LV 89129 1990 575 565 561 572 253 Elizondo, Jr., Raul P. 4865 Goldfield St., NLV 89031 1998 655 713 774 792

200 | Clark County School District
School Location and Enrollment Information - ContinuedFiscal Year 2014-15
Cost Center Group Elementary Schools Address
Year Opened
2011-12 Actual
Enrollment
2012-13 Actual
Enrollment
2013-14 Actual
Enrollment
2014-15 Projected
Enrollment525 Ferron, William E. 4200 Mountain Vista, LV 89121 1970 554 571 545 514 659 Fine, Mark L. 6635 W. Cougar Ave, LV 89139 2009 837 903 968 994 410 Fitzgerald, H. P. 2651 N. Revere St., NLV 89030 1993 359 414 426 427 370 Fong, Wing & Lilly 2200 James Bilbray Dr., LV 89108 1991 819 857 835 828 377 Forbuss, Robert L. 8601 S. Grand Canyon Dr., LV 89148 2007 1,102 1,202 1,138 1,146 229 French, Doris 3235 E. Hacienda, LV 89120 1976 463 432 442 441 340 Frias, Charles & Phyllis 5800 Broken Top Ave, LV 89141 2003 790 795 778 764 419 Fyfe, Ruth 4101 W. Bonanza, LV 89107 1963 505 495 512 521 925 Galloway, Fay 701 Tamarack Dr., HD 89015 1978 688 633 647 672 257 Garehime, Edith 3850 Campbell Rd., LV 89129 1998 650 657 655 615 306 Gehring, Roger D. 1155 E. Richmar Ave., LV 89123 2002 706 643 656 643 422 Gibson, James 271 Leisure Circle, HD 89014 1990 563 528 540 541 427 Gilbert, C. V. T. 2101 W. Cartier, NLV 89030 1965 472 474 470 468 348 Givens, Linda Rankin 655 Park Vista Dr., LV 89138 2004 1,117 1,139 1,103 1,109 237 Goldfarb, Daniel 1651 Orchard Valley Dr., LV 89122 1997 746 729 763 753
914 Goodsprings 385 W. San Pedro Ave, Goodsprings 89019 1913 13 13 11 8
330 Goolsby, Judy & John L. 11175 W. Desert Inn Rd., LV 89135 2004 813 791 824 801 408 Goynes, Theron & Naomi 3409 Deer Springs Way, North LV 89084 2005 903 894 931 872 224 Gragson, Oran K. 555 N. Honolulu, LV 89110 1978 820 855 825 787 429 Gray, R. Guild 2825 S. Torrey Pines, LV 89102 1979 544 528 505 502 412 Griffith, E. W. 324 Essex Dr., LV 89107 1962 571 637 612 600 247 Guy, Addeliar D., III 4029 La Madre Way, NLV 89031 1996 599 633 636 608 522 Hancock, Doris 1661 Lindell Rd., LV 89102 1964 447 456 504 512 527 Harmon, Harley 5351 S. Hillsboro, LV 89120 1972 708 757 766 787 528 Harris, George E. 3620 S. Sandhill, LV 89121 1973 619 620 695 681 350 Hayden, Don E. 150 W. Rome Blvd, NLV 89086 2006 575 632 691 709 542 Hayes, Keith C. & Karen W. 9620 W. Twain Ave., LV 89147 1999 641 682 770 773 318 Heard, Lomie G. 42 Baer Dr., NAFB, LV 89115 1948 758 677 615 621 282 Heckethorn, Howard E. 5150 Whispering Sands Dr., LV 89131 2001 656 691 694 666 270 Herr, Helen 6475 Eagle Creek Lane, LV 89115 1991 623 671 695 684 312 Herron, Fay 2421 N. Kenneth, NLV 89030 1963 910 911 880 878 213 Hewetson, Halle 701 N. 20th St., LV 89101 1959 938 918 955 957 406 Hickey, Liliam Lujan 2450 N. Hollywood Blvd., LV 89156 2005 718 716 761 760 463 Hill, Charlotte 7440 Bates St., LV 89123 1990 598 619 689 674 910 Hinman, Edna F. 450 Merlayne Dr., HD 89015 1987 576 604 652 655 411 Hoggard, Mabel 950 N. Tonopah Dr., LV 89106 1952 471 471 462 447 338 Hollingsworth, Howard E. 1776 East Ogden Ave, LV 89101 2003 681 652 678 677 342 Hummel, John R. 9800 Placid St., LV 89123 2004 793 836 775 757 915 Indian Springs 400 Sky Road, Indian Springs 89018 1980 89 99 107 109 303 Iverson, Mervin 1575 S. Hollywood Blvd., LV 89142 2002 825 845 816 837 464 Jacobson, Walter 8400 Boseck Dr., LV 89128 1990 576 628 640 608 407 Jeffers, Jay W. 2320 N. Clifford St., LV 89115 2005 887 862 839 879 561 Jydstrup, Helen 5150 Dunesville St., LV 89128 1991 612 596 630 665 371 Kahre, Marc 7887 W. Gowen Rd., LV 89129 1991 525 501 482 466 372 Katz, Edythe & Lloyd 1800 Rock Springs Dr., LV 89128 1991 675 686 697 641 658 Keller, Charlotte & Jerry 5445 Cedar Ave., LV 89110 2009 765 761 734 774 521 Kelly, Matt 1900 N. "J" St., LV 89016 1960 270 302 294 335 543 Kesterson, Lorna J. 231 Bailey Island Dr., HD 89014 1999 661 657 635 598 420 Kim, Frank 7600 Peace Way, LV 89117 1988 551 552 591 558 212 King, Jr., Martin Luther 2260 Betty Lane, LV 89115 1988 498 481 483 487 901 King, Martha P. 888 Adams, BC 89005 1991 444 411 420 414 516 Lake, Robert E. 2904 Meteoro St., LV 89109 1962 925 890 974 918 256 Lamping, Frank 2551 Summit Grove Dr., HD 89012 1997 762 773 759 704 316 Lincoln 3010 Berg, NLV 89030 1955 686 665 744 741 223 Long, Walter V. 2000 S. Walnut, LV 89104 1977 762 784 846 853 430 Lowman, Mary & Zel 4225 N. Lamont, NLV 89115 1993 788 733 740 739 367 Lummis, William 9000 Hillpointe Rd., LV 89128 1993 557 529 529 527 227 Lundy, Earl B. Mt. Charleston 89101 1965 27 30 30 29 365 Lunt, Robert 2701 Harris St., LV 89101 1990 671 638 614 576
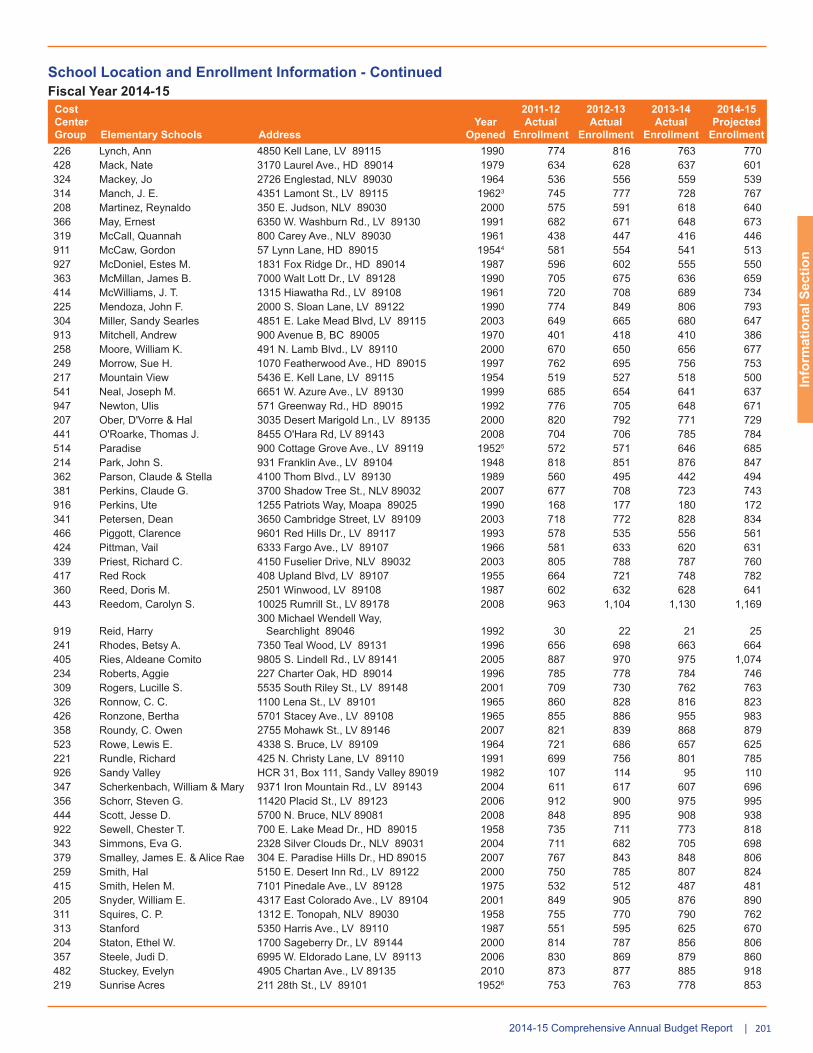
Info
rmat
iona
l Sec
tion
2012014-15 Comprehensive Annual Budget Report |
School Location and Enrollment Information - ContinuedFiscal Year 2014-15
Cost Center Group Elementary Schools Address
Year Opened
2011-12 Actual
Enrollment
2012-13 Actual
Enrollment
2013-14 Actual
Enrollment
2014-15 Projected
Enrollment226 Lynch, Ann 4850 Kell Lane, LV 89115 1990 774 816 763 770 428 Mack, Nate 3170 Laurel Ave., HD 89014 1979 634 628 637 601 324 Mackey, Jo 2726 Englestad, NLV 89030 1964 536 556 559 539 314 Manch, J. E. 4351 Lamont St., LV 89115 19623 745 777 728 767 208 Martinez, Reynaldo 350 E. Judson, NLV 89030 2000 575 591 618 640 366 May, Ernest 6350 W. Washburn Rd., LV 89130 1991 682 671 648 673 319 McCall, Quannah 800 Carey Ave., NLV 89030 1961 438 447 416 446 911 McCaw, Gordon 57 Lynn Lane, HD 89015 19544 581 554 541 513 927 McDoniel, Estes M. 1831 Fox Ridge Dr., HD 89014 1987 596 602 555 550 363 McMillan, James B. 7000 Walt Lott Dr., LV 89128 1990 705 675 636 659 414 McWilliams, J. T. 1315 Hiawatha Rd., LV 89108 1961 720 708 689 734 225 Mendoza, John F. 2000 S. Sloan Lane, LV 89122 1990 774 849 806 793 304 Miller, Sandy Searles 4851 E. Lake Mead Blvd, LV 89115 2003 649 665 680 647 913 Mitchell, Andrew 900 Avenue B, BC 89005 1970 401 418 410 386 258 Moore, William K. 491 N. Lamb Blvd., LV 89110 2000 670 650 656 677 249 Morrow, Sue H. 1070 Featherwood Ave., HD 89015 1997 762 695 756 753 217 Mountain View 5436 E. Kell Lane, LV 89115 1954 519 527 518 500 541 Neal, Joseph M. 6651 W. Azure Ave., LV 89130 1999 685 654 641 637 947 Newton, Ulis 571 Greenway Rd., HD 89015 1992 776 705 648 671 207 Ober, D'Vorre & Hal 3035 Desert Marigold Ln., LV 89135 2000 820 792 771 729 441 O'Roarke, Thomas J. 8455 O'Hara Rd, LV 89143 2008 704 706 785 784 514 Paradise 900 Cottage Grove Ave., LV 89119 19525 572 571 646 685 214 Park, John S. 931 Franklin Ave., LV 89104 1948 818 851 876 847 362 Parson, Claude & Stella 4100 Thom Blvd., LV 89130 1989 560 495 442 494 381 Perkins, Claude G. 3700 Shadow Tree St., NLV 89032 2007 677 708 723 743 916 Perkins, Ute 1255 Patriots Way, Moapa 89025 1990 168 177 180 172 341 Petersen, Dean 3650 Cambridge Street, LV 89109 2003 718 772 828 834 466 Piggott, Clarence 9601 Red Hills Dr., LV 89117 1993 578 535 556 561 424 Pittman, Vail 6333 Fargo Ave., LV 89107 1966 581 633 620 631 339 Priest, Richard C. 4150 Fuselier Drive, NLV 89032 2003 805 788 787 760 417 Red Rock 408 Upland Blvd, LV 89107 1955 664 721 748 782 360 Reed, Doris M. 2501 Winwood, LV 89108 1987 602 632 628 641 443 Reedom, Carolyn S. 10025 Rumrill St., LV 89178 2008 963 1,104 1,130 1,169
919 Reid, Harry 300 Michael Wendell Way, Searchlight 89046 1992 30 22 21 25
241 Rhodes, Betsy A. 7350 Teal Wood, LV 89131 1996 656 698 663 664 405 Ries, Aldeane Comito 9805 S. Lindell Rd., LV 89141 2005 887 970 975 1,074 234 Roberts, Aggie 227 Charter Oak, HD 89014 1996 785 778 784 746 309 Rogers, Lucille S. 5535 South Riley St., LV 89148 2001 709 730 762 763 326 Ronnow, C. C. 1100 Lena St., LV 89101 1965 860 828 816 823 426 Ronzone, Bertha 5701 Stacey Ave., LV 89108 1965 855 886 955 983 358 Roundy, C. Owen 2755 Mohawk St., LV 89146 2007 821 839 868 879 523 Rowe, Lewis E. 4338 S. Bruce, LV 89109 1964 721 686 657 625 221 Rundle, Richard 425 N. Christy Lane, LV 89110 1991 699 756 801 785 926 Sandy Valley HCR 31, Box 111, Sandy Valley 89019 1982 107 114 95 110 347 Scherkenbach, William & Mary 9371 Iron Mountain Rd., LV 89143 2004 611 617 607 696 356 Schorr, Steven G. 11420 Placid St., LV 89123 2006 912 900 975 995 444 Scott, Jesse D. 5700 N. Bruce, NLV 89081 2008 848 895 908 938 922 Sewell, Chester T. 700 E. Lake Mead Dr., HD 89015 1958 735 711 773 818 343 Simmons, Eva G. 2328 Silver Clouds Dr., NLV 89031 2004 711 682 705 698 379 Smalley, James E. & Alice Rae 304 E. Paradise Hills Dr., HD 89015 2007 767 843 848 806 259 Smith, Hal 5150 E. Desert Inn Rd., LV 89122 2000 750 785 807 824 415 Smith, Helen M. 7101 Pinedale Ave., LV 89128 1975 532 512 487 481 205 Snyder, William E. 4317 East Colorado Ave., LV 89104 2001 849 905 876 890 311 Squires, C. P. 1312 E. Tonopah, NLV 89030 1958 755 770 790 762 313 Stanford 5350 Harris Ave., LV 89110 1987 551 595 625 670 204 Staton, Ethel W. 1700 Sageberry Dr., LV 89144 2000 814 787 856 806 357 Steele, Judi D. 6995 W. Eldorado Lane, LV 89113 2006 830 869 879 860 482 Stuckey, Evelyn 4905 Chartan Ave., LV 89135 2010 873 877 885 918 219 Sunrise Acres 211 28th St., LV 89101 19526 753 763 778 853

202 | Clark County School District
School Location and Enrollment Information - ContinuedFiscal Year 2014-15
Cost Center Group Elementary Schools Address
Year Opened
2011-12 Actual
Enrollment
2012-13 Actual
Enrollment
2013-14 Actual
Enrollment
2014-15 Projected
Enrollment344 Tanaka, Wayne N. 9135 W. Maule Ave., LV 89148 2004 992 977 1,022 1,003 203 Tarr, Sheila R. 9400 Gilmore Ave., LV 89129 2000 639 647 644 627 345 Tartan, John 3030 E. Tropical Pkway, North LV 89031 2005 670 677 625 637 328 Tate, Myrtle 2450 N. Lincoln, LV 89115 1971 571 652 705 731 393 Taylor, Glen C. 2655 Siena Heights Dr, HD 89052 2003 882 900 897 868 918 Taylor, Robert L. 400 McNeil Dr., HD 89015 19547 594 517 521 543 403 Thiriot, Joseph E. 5700 W. Harmon Ave., LV 89103 2005 644 653 660 685 517 Thomas, Ruby S. 1560 E. Cherokee, LV 89109 1963 777 765 721 750 349 Thompson, Sandra Lee 7351 N. Campbell Rd., LV 89149 2006 714 709 747 749 903 Thorpe, Jim 1650 Patrick Lane, HD 89014 1992 821 792 791 792 329 Tobler, R. E. 6510 W. Buckskin, LV 89108 1982 503 512 556 569 519 Tomiyasu, Bill Y. 5445 S. Annie Oakley, LV 89120 1974 539 493 554 548 921 Treem, Harriet 1698 Patrick Lane, HD 89014 1990 799 803 797 814 481 Triggs, Vincent L. 4470 E. Rome Blvd., NLV 89084 2010 774 824 816 818 421 Twin Lakes 3300 Riverside Dr., LV 89108 1954 721 692 682 669 281 Twitchell, Neil C. 2060 Desert Shadow Trail, HD 89012 2001 927 974 963 982 512 Ullom, J. M. 4869 E. Sun Valley Dr., LV 89121 1962 645 677 684 762 238 Vanderburg, John 2040 Desert Shadow Trail, HD 89012 1997 795 806 878 896 518 Vegas Verdes 4000 El Parque Ave., LV 89102 1959 541 492 485 493 923 Virgin Valley 200 Woodbury Lane, Mesquite 89027 19808 651 658 657 676 285 Walker, J. Marlan 850 Scholar Street, HD 89015 2002 893 736 659 635 483 Wallin, Shirley & Bill 2333 Canyon Retreat Dr., HD 89044 2010 802 877 994 1,044 526 Ward, Gene 1555 E. Hacienda, LV 89119 1971 665 634 684 700 355 Ward, Kitty McDonough 5555 Horse Dr., LV 89131 2006 913 893 850 805 418 Warren, Rose 6451 Brandywine Way, LV 89107 1961 638 679 675 657 423 Wasden, Howard 2831 Palomino Lane, LV 89107 1955 629 550 634 654 283 Watson, Fredric W. 5845 North Commerce St., NLV 89031 2001 688 694 701 684 228 Wengert, Cyril 2001 Winterwood Blvd., LV 89122 1971 648 603 596 574 384 West Elementary Academy 2050 Sapphire Stone, LV 89106 1996 444 442 455 455 924 Whitney 5005 Keenan, LV 89122 1991 600 563 573 556 373 Wiener, Jr., Louis 450 E. Eldorado Ln., LV 89123 1993 630 608 707 681 233 Wilhelm, Elizabeth 609 W. Alexander Rd., NLV 89030 1996 539 554 572 602 321 Williams, Tom 3000 E. Tonopah, NLV 89030 19579 926 930 951 959 513 Williams, Wendell P. 1030 "J" St., LV 89106 195310 338 333 326 346 236 Wolfe, Eva 4027 W. Washburn Rd., NLV 89031 1996 629 643 617 620 202 Wolff, Elise L. 1001 Seven Hills Dr., HD 89052 2000 936 962 940 957 364 Woolley, Gwendolyn 3955 Timberlake Dr., LV 89115 1990 707 727 748 787 354 Wright, William V. 8425 Bob Fisk Ave., LV 89124 2006 1,124 1,188 1,211 1,244 462 Wynn, Elaine 5655 Edna Ave., LV 89102 1990 813 828 865 915
Total projected enrollment elementary schools 146,523 147,373 149,353 149,378
1 Replaced with a new building in 2002.2 Replaced with a new building in 2007.3 Replaced with a new building in 2009.4 Replaced with a new building in 2008.5 Replaced with a new site and building on the UNLV campus in 1998.6 Replaced with a new building in 2001.7 Replaced with a new building in 2008.8 Replaced with a new building in 2003.9 Replaced with a new building in 2008.10 Replaced with a new building in 2002.

Info
rmat
iona
l Sec
tion
2032014-15 Comprehensive Annual Budget Report |
School Location and Enrollment Information - ContinuedFiscal Year 2014-15
Cost Center Group Middle Schools Address
Year Opened
2011-12 Actual
Enrollment
2012-13 Actual
Enrollment
2013-14 Actual
Enrollment
2014-15 Projected
Enrollment547 Bailey, Dr. William H. 2500 N. Hollywood Blvd., LV 89156 2005 1,250 1,205 1,168 1,223 374 Becker, Ernest 9151 Pinewood Hills Dr., LV 89128 1993 1,406 1,310 1,327 1,314 332 Bridger, Jim 2505 N. Bruce, NLV 89030 1959 1,431 1,369 1,364 1,382 433 Brinley, J. Harold 2480 Maverick, LV 89108 1966 862 926 911 963 934 Brown, Mahlon B. 307 N. Cannes St., HD 89015 1982 849 842 902 1,019 931 Burkholder, Lyal 355 W. Van Wagenen, HD 89015 195211 802 757 757 716 337 Cadwallader, Ralph 7775 Elkhorn Road, LV 89131 2003 1,511 1,500 1,519 1,569 399 Canarelli, Lawrence & Heidi 7808 S. Torrey Pines Dr, LV 89139 2003 1,766 1,838 1,853 1,821 537 Cannon, Helen C. 5850 Euclid Ave., LV 89120 1976 908 891 873 881 533 Cashman, James 4622 W. Desert Inn Rd., LV 89102 1965 1,479 1,510 1,580 1,577 540 Cortney, Francis H. 5301 E. Hacienda, LV 89122 1997 1,219 1,227 1,266 1,243 275 Cram, Brian & Teri 1900 W. Deer Springs Way, NLV 89033 2001 1,493 1,551 1,604 1,619 376 Escobedo, Edmundo "Eddie" 9501 Echelon Point Dr., LV 89149 2007 1,163 1,142 1,205 1,246 378 Faiss, Wilbur & Theresa 9525 W. Maule Ave., LV 89004 2007 1,343 1,443 1,419 1,500 308 Fertitta, Victoria 9905 W. Mesa Vista Ave., LV 89148 2002 1,430 1,475 1,496 1,567 400 Findlay, Clifford O. 333 W. Tropical Pkwy., NLV 89031 2004 1,493 1,500 1,483 1,491 231 Fremont, John C. 1100 E. St. Louis, LV 89104 1955 941 902 866 881 933 Garrett, Elton & Madeline 1200 Ave. G, BC 89005 1978 495 476 478 480 431 Garside, Frank F. 300 S. Torrey Pines, LV 89107 1962 1,114 1,206 1,210 1,207 432 Gibson, Robert O. 3900 W. Washington, LV 89107 1962 1,109 1,227 1,233 1,257 937 Greenspun, Barbara & Hank 140 N. Valley Verde, HD 89014 1991 1,310 1,370 1,433 1,457 434 Guinn, Kenny C. 4150 S. Torrey Pines, LV 89103 1978 797 800 846 828 307 Harney, Kathleen & Tim 1625 S. Los Feliz Street, LV 89142 2002 1,815 1,875 1,833 1,808 611 Hughes, Charles Arthur 750 Hafen Lane, Mesquite 89027 2003 588 562 552 546 531 Hyde Park 900 Hinson St., LV 89107 1956 1,707 1,688 1,706 1,713 780 Indian Springs 400 Sky Road, Indian Springs 89018 1980 70 57 44 35 435 Johnson, Walter 7701 Ducharme Ave., LV 89128 1991 1,190 1,156 1,153 1,145 469 Johnston, Carroll M. 5855 Lawrence St., NLV 89081 2006 1,389 1,380 1,374 1,447 243 Keller, Duane D. 301 Fogg Street, LV 89110 1996 1,192 1,325 1,261 1,242 532 Knudson, K. O. 2400 Atlantic St., LV 89104 1961 1,259 1,245 1,309 1,371 544 Lawrence, Clifford J. 4410 S. Juliano St., LV 89117 1998 1,446 1,472 1,465 1,490 274 Leavitt, Justice Myron E. 4701 Quadrel St., LV 89129 2001 1,529 1,496 1,547 1,499 244 Lied 5350 W. Tropical Pkwy., LV 89130 1996 1,342 1,242 1,246 1,174 939 Lyon, W. Mack 179 S. Anderson, Overton 89040 1950 414 387 372 374 546 Mack, Jerome D. 4250 Karen Ave., LV 89121 2005 1,331 1,303 1,361 1,357 401 Mannion, Jack & Terry 155 E. Paradise Hills Dr., HD 89015 2004 1,783 1,693 1,587 1,500 232 Martin, Roy W. 2800 E. Stewart, LV 89101 195812 1,397 1,400 1,501 1,536 269 Miller, Bob 2400 Cozy Hills Circle, HD 89052 2000 1,726 1,688 1,661 1,568 530 Molasky, Irwin & Susan 7801 W. Gilmore Ave., LV 89129 1997 1,396 1,346 1,271 1,186 276 Monaco, Mario & JoAnne 1870 N. Lamont St., LV 89115 2001 1,215 1,315 1,291 1,370 335 O'Callaghan, Mike 1450 Radwick Dr., LV 89110 1991 1,458 1,313 1,369 1,318 534 Orr, William E. 1562 Katie Dr., LV 89121 1965 932 884 895 923 334 Robison, Dell H. 825 Marion Dr., LV 89110 1973 1,143 1,129 1,133 1,230 273 Rogich, Sig 235 N. Pavilion Ctr. Dr., LV 89144 2000 1,696 1,813 1,833 1,844 402 Saville, Anthony 8101 N. Torrey Pines Dr., LV 89131 2004 1,540 1,522 1,509 1,523 538 Sawyer, Grant 5450 Redwood St., LV 89118 1993 1,274 1,349 1,254 1,290 277 Schofield, Jack Lund 8625 Spencer St., LV 89123 2001 1,306 1,283 1,319 1,320 545 Sedway, Marvin M. 3465 Englestad St., NLV 89032 2001 1,371 1,453 1,474 1,513 536 Silvestri, Charles A. 1055 Silverado Ranch Blvd., LV 89123 1997 1,556 1,639 1,628 1,734 331 Smith, J. D. 1301 E. Tonopah, NLV 89030 1952 893 946 931 952 336 Swainston, Theron L. 3500 W. Gilmore Ave., NLV 89030 1992 1,202 1,170 1,144 1,213 470 Tarkanian, Lois & Jerry 5800 W. Pyle Ave., LV 89141 2006 1,310 1,470 1,625 1,790 333 Von Tobel, Ed 2436 N. Pecos, LV 89115 1965 1,168 1,151 1,140 1,149 300 Webb, Del E. 2200 Reunion Dr., HD 89052 2005 1,820 1,818 1,845 1,862 938 White, Thurman 1661 Galleria Dr., HD 89014 1992 1,429 1,411 1,355 1,397 535 Woodbury, C. W. 3875 E. Harmon Ave., LV 89121 1972 872 896 903 889
Total projected enrollment middle schools 69,930 70,344 70,684 71,549
11 Replaced with a new building in 2007.12 Replaced with a new building in 2008.

204 | Clark County School District
School Location and Enrollment Information - ContinuedFiscal Year 2014-15
Cost Center Group Senior High Schools Address
Year Opened
2011-12 Actual
Enrollment
2012-13 Actual
Enrollment
2013-14 Actual
Enrollment
2014-15 Projected
Enrollment
436Advanced Technologies Academy 2501 Vegas Dr., LV 89106 1994 1,086 1,134 1,090 1,092
579 Arbor View 7500 Whispering Sands Dr., NLV 89131 2005 2,691 2,793 2,847 2,923 951 Basic 400 Palo Verde, HD 89015 1971 2,389 2,286 2,251 2,303 452 Bonanza 6665 W. Del Rey Ave., LV 89102 1974 1,987 2,025 1,994 2,043 941 Boulder City 1101 Fifth Ave., BC 89005 1948 664 651 640 646 578 Canyon Springs 350 E. Alexander Road, NLV 89032 2004 2,601 2,574 2,705 2,734 563 Centennial 10200 Centennial Pkwy., LV 89129 1999 2,996 2,950 3,028 3,053 554 Chaparral 3850 Annie Oakley, LV 89121 1971 2,301 2,292 2,204 2,261 454 Cheyenne 3200 W. Alexander Rd., NLV 89030 1991 2,188 2,214 2,161 2,155 453 Cimarron-Memorial 2301 N. Tenaya Way, LV 89128 1991 2,525 2,525 2,312 2,422 551 Clark, Ed W. 4291 W. Pennwood, LV 89102 1964 2,886 2,993 3,013 3,048 569 Community College--East 3200 E. Cheyenne Ave., NLV 89030 - 99 101 112 100 571 Community College--South 700 College Dr., HD 89015 - 101 106 101 100 570 Community College--West 6375 W. Charleston Blvd., LV 89102 - 200 201 207 200 573 Coronado 1001 Coronado Center Dr., HD 89052 2001 3,047 3,040 3,122 3,184 577 Del Sol 3100 E. Patrick Lane, LV 89120 2004 1,994 1,881 1,878 1,877 445 Desert Oasis 6600 W. Erie Ave, LV 89141 2008 2,056 2,232 2,351 2,532 562 Desert Pines 3800 Harris Ave., LV 89110 1999 2,231 2,217 2,215 2,264 550 Desert Rose 444 W. Brooks Ave., NLV 89030 1981 215 358 364 365 555 Durango 7100 W. Dewey Dr., LV 89113 1993 2,208 2,248 2,349 2,414
409East Career and Technical Academy 6705 Vegas Valley, LV 89142 2008 1,813 1,786 1,789 1,818
352 Eldorado 1139 N. Linn Lane, LV 89110 1972 1,697 1,758 1,940 2,051 572 Foothill 800 College Dr., HD 89015 1998 2,639 2,666 2,766 2,788 945 Green Valley 460 Arroyo Grande, HD 89014 1991 2,809 2,968 3,034 3,024 932 Indian Springs 400 Sky Road, Indian Springs 89018 1952 85 80 81 79 251 Las Vegas 6500 E. Sahara, LV 89122 1993 2,865 2,977 3,005 3,098 353 Las Vegas Academy 315 S. 7th St., LV 89101 1930 1,696 1,705 1,703 1,672 946 Laughlin 1900 Cougar Dr., Laughlin 89029 1991 424 392 365 352 556 Legacy 150 W. Deer Springs, NLV 89084 2006 2,902 2,794 2,826 2,880 565 Liberty 11050 Bermuda Road, LV 89123 2003 2,153 2,358 2,499 2,618 942 Moapa Valley 2400 St. Joseph St., Logandale 89021 1993 551 562 539 540 245 Mojave 5302 Goldfield St., NLV 89031 1996 2,055 2,140 2,195 2,277
548Northwest Career and Technical Academy 8200 W. Tropical Parkway, LV 89149 2007 1,953 1,923 1,869 1,888
246 Palo Verde 333 Pavilion Court Dr., LV 89144 1996 2,718 2,778 2,886 2,933 351 Rancho 1900 E. Owens, NLV 89030 195413 2,944 3,094 3,166 3,219 935 Sandy Valley HCR 31 Box 111, Sandy Valley 89019 1982 157 157 130 129 576 Shadow Ridge 5050 Brent Lane, LV 89143 2003 2,286 2,453 2,520 2,648 564 Sierra Vista 8100 W. Robindale Rd., LV 89123 2001 2,115 2,226 2,317 2,424 940 Silverado 1650 Silver Hawk, LV 89123 1994 2,328 2,223 2,203 2,256
870Southeast Career and Technical Academy 5710 Mountain Vista, LV 89120 1965 1,747 1,726 1,696 1,736
448Southwest Career and Technical Academy 7050 W. Shelbourne Ave., LV 89113 2009 1,442 1,498 1,499 1,428
502 Spring Valley 3750 S. Buffalo Dr., LV 89147 2004 2,127 1,961 1,887 1,948 446 Sunrise Mountain 2575 N. Los Feliz St., LV 89142 2009 2,494 2,526 2,515 2,556 552 Valley 2839 S. Burnham, LV 89109 1964 2,894 2,887 2,861 2,857
449Veterans Tribute Career and Technical Academy 2531 Vegas Dr., LV 89106 2009 700 719 737 756
944 Virgin Valley 820 Valley View Dr., Mesquite 89027 1991 696 697 683 685
447West Career and Technical Academy 11945 W. Charleston Blvd., LV 89135 2010 1,013 1,311 1,368 1,370
242 West Secondary Academy 2050 Sapphire Stone, LV 89106 1996 1,320 1,328 1,301 1,440 451 Western 4601 W. Bonanza Rd., LV 89107 1960 2,144 2,258 2,513 2,629
Total projected enrollment senior high schools 89,232 90,772 91,837 93,815
(13) Replaced with a new building in 2006.

Info
rmat
iona
l Sec
tion
2052014-15 Comprehensive Annual Budget Report |
School Location and Enrollment Information - ContinuedFiscal Year 2014-15
Cost Center Group Special Schools Address
Year Opened
2011-12 Actual
Enrollment
2012-13 Actual
Enrollment
2013-14 Actual
Enrollment
2014-15 Projected
Enrollment
790 Desert Willow Elementary6171 Charleston Blvd., Bldg #17, LV 89158 - 1 - - -
791 Desert Willow Secondary6171 Charleston Blvd., Bldg #17, LV 89158 - 31 26 38 40
216 Early Childhood 2701 E. St Louis Ave., LV 89104 - 136 100 148 560 848 Miley Achievement Elementary 245 N. Pecos Rd., LV 89101 197614 26 24 21 27 847 Miley Achievement Secondary 245 N. Pecos Rd., LV 89101 197614 76 72 73 65 511 Miller, John F. 1905 Atlantic St., LV 89104 1959 124 112 110 122
549Northwest Career and Technical Academy Elem 8200 W. Tropical Parkway, LV 89149 2007 25 25 23 25
811 Stewart, Helen J. 2375 E. Viking, LV 89109 1972 99 101 105 105
841 Summit6171 Charleston Blvd., Bldg #17, LV 89158 - 11 14 11 8
812/826 Variety 2601 Sunrise Ave., LV 89101 1952 132 126 118 128 Total projected enrollment special schools 661 600 647 1,080
(14) Replaced with a new site and building in 2006.
Cost Center Group Alternative Schools Address
Year Opened
2011-12 Actual
Enrollment
2012-13 Actual
Enrollment
2013-14 Actual
Enrollment
2014-15 Projected
Enrollment617 Adult Education 2701 E. St Louis Ave., LV 89104 - - - - - 863 Desert Rose Adult HS 444 W. Brooks Ave., NLV 89030 - - - - -
839High Desert State Prison Youthful Offender Prgm
22010 Cold Creek Rd., Indian Springs, NV - - - - -
615High Desert State Prison Adult HS
22010 Cold Creek Rd., Indian Springs, NV - - - - -
838Indian Springs Boot Camp Adult HS PO Box 208, Indian Springs, NV 89070 - - - - -
838Indian Springs Conservation Camp Adult HS PO Box 208, Indian Springs, NV 89070 - - - - -
832 Jean Conservation Camp HS 4370 Smiley Rd., NLV 89115 - - - - -
832McClure Women's Correctional Center 4370 Smiley Rd., NLV 89115 - - - - -
744 Red Rock Academy 5730 Range Rd., LV 89115 - - - - -
838Southern Desert Correctional Center Adult HS PO Box 208, Indian Springs, NV 89070 - - - - -
879Academy for Individualized Study (Defunct) 4601 W. Bonanza, LV 89107 - 266 428 590 -
220 Biltmore Continuation HS 801 Veteran's Memorial Dr., LV 89101 1942 188 157 92 97
877Burk Horizon/Southwest Sunset HS 4560 W. Harmon, LV 89103 2003 200 212 225 225
837 Clark County Detention Center 601 N Pecos, LV 89101 - 38 33 27 21 440 Cowan Behavioral Jr/Sr HS 5300 E. Russell Rd., LV 89122 1999 67 57 51 60 888 Cowan Sunset Southeast HS 5300 E. Russell Rd., LV 89122 1965 91 89 81 81
878Global Community HS @Morris Hall 3801 E. Washington Ave., LV 89110 1993 170 251 197 184
773 Jeffrey Behavior Jr/Sr HS 602 W. Brooks Ave., NLV 89030 1999 126 102 61 91 844 Juvenile Detention Center 601 N. Pecos, LV 89101 - 117 83 70 77 437 Morris Behavior Jr/Sr HS 3801 E. Washington Ave., LV 89110 1993 93 77 66 74 815 Morris Sunset East HS 3801 E. Washington Ave., LV 89110 1993 78 63 61 61 439 Peterson Behavior Jr/Sr HS 10250 W. Centennial Pkwy., LV 89149 2000 147 68 41 58 792 South Continuation Jr/Sr HS 5970 Mountain Vista, LV 89120 - 73 98 102 104 720 Southwest Behavior Jr/Sr HS 6480 Fairbanks Rd., LV 89103 - 78 68 68 62 846 Spring Mountain Jr/Sr HS SR 89038 Box 252, LV 89115 - 100 101 91 92
880Washington Continuation Jr HS 1901 N. White St., NLV 89030 1932 51 70 77 70
633Nevada Learning Academy at CCSD 3050 E. Flamingo, LV 89132 2009 148 172 177 791 Total projected enrollment alternative schools/programs 2,031 2,129 2,077 2,148
Total projected District enrollment 308,377 311,218 314,598 317,970

206 | Clark County School District
2014-15 School Calendar
Holidays And Staff Development DaysJuly 4, 2014 (Friday) ............................................................................ Independence Day – No SchoolSeptember 1, 2014 (Monday) .............................................................. Labor Day - No SchoolSeptember 2, 2014 (Tuesday) ............................................................. Staff Development Day - No SchoolOctober 31, 2014 (Friday) ................................................................... Nevada Day Observed - No SchoolNovember 3-4, 2014 (Monday-Tuesday) ............................................. Staff Development Day - No SchoolNovember 9, 2014 (Monday) ............................................................... Non-Assigned Day - No SchoolNovember 10, 2014 (Tuesday) ............................................................ Veterans Day - No SchoolNovember 27-28, 2014 (Thursday and Friday) .................................. Thanksgiving Break - No SchoolDecember 19, 2014 (Friday) end of day ............................................. Winter Break (Dec. 22-Jan. 2)January 19, 2015 (Monday) ................................................................. Martin Luther King, Jr.’s Birthday Observed - No School February 13, 2015 (Friday) .................................................................. Staff Development Day - No SchoolFebruary 16, 2015 (Monday) ............................................................... Presidents’ Day Observed - No SchoolMarch 27 (Friday) end of day .............................................................. Spring Break (March 30 - April 3)May 25, 2015 (Monday) ....................................................................... Memorial Day - No School
Total Number of Legal Holidays ................................10Total Number of Local Recess Days .........................18(Local recess days other than legal holidays are Spring Break (5), Thanksgiving Friday (1), Winter Break (8), and Staff Development Days (4))
Quarterly Schedule
End of 1st Quarter End of 2nd Quarter End of 3rd Quarter End of 4th Quarter Total Days Taught for the
YearDateDays
Taught Date Days
Taught DateDays
Taught DateDays
Taught9 Month 10/24/2014 44 1/16/2015 45 3/27/2015 48 6/04/2015 43 180
Report Card PeriodLength Of Student Day1
Kindergarten 150 Minutes 1Length of student day refers to actual instructional Full Day Kindergarten 300 Minutes activity, exclusive of lunch period and recess time, Grades 1 - 12 341 Minutes but including passing time. Source: CCSD Instruction Unit

Info
rmat
iona
l Sec
tion
2072014-15 Comprehensive Annual Budget Report |
Appendix
Advanced Placement Program - Test Fee Payment ProgramThis program funds a portion of the International Baccalaureate exam fees for eligible students, based on their household socioeconomic status.
American Recovery and Reinvestment Act (ARRA) - Title I School Improvement Grant (SIG) Sec 1003(g) Cohort 1American Recovery and Reinvestment Act (ARRA) - Title I School Improvement Grant (SIG) Sec 1003(g) Cohort 1 of the Elementary and Secondary Education Act to support school improvement activities in persistently lowest-achieving schools that have been identified as In Needs of Improvement, in corrective action, or restructuring under Title I. The Department of Education appropriated federal flow-through, formula-based funding for this grant under the Consolidation Appropriations Act of 2010, and funding from the ARRA Fiscal Year 2009 Title I appropriation. The District has elected to serve two schools under this SIG Cohort I grant - Kit Carson Elementary and Rancho High Schools by implementing intervention strategies to improve academic achievement.
American Recovery and Reinvestment Act (ARRA) - Title I School Improvement Grant (SIG) Sec 1003(g) Cohort 2American Recovery and Reinvestment Act (ARRA) - Title I School Improvement Grant (SIG) Sec 1003(g) Cohort 2 of the Elementary and Secondary Education Act to support school improvement activities in persistently lowest-achieving schools that have been identified as In Needs of Improvement, in corrective action, or restructuring under Title I. The Department of Education appropriated federal flow-through, formula-based funding for this grant under the Consolidation Appropriations Act of 2010, and carryover funding from the ARRA Fiscal Year 2009 Title I appropriation. The District has elected to serve four schools under this SIG Cohort 2 grant - Doris Hancock Elementary, Chaparral High, Mojave High, and Western High Schools by implementing intervention strategies to improve academic achievement.
AT&T FoundationFunds support student transportation for the Investing in Innovation Fund (i3) Pathways to Science, Technology, Engineering, and Mathematics (STEM) Initiative (PSI) program. Funding has been allocated to provide bus passes for high school students to travel to STEM summer internships and job shadowing programs and to provide transportation to STEM field trips for students throughout the calendar year. The Pathways to STEM Initiative (PSI) serve approximately 5,600 students and will target four middle schools and two high schools that are feeder-aligned and have high percentages of students underrepresented in STEM. Schools selected for services are: Garside Middle, Gibson Middle, Findlay Middle, Johnston Middle, Mojave High, and Western High Schools. Students will have access to project-based STEM coursework that uses technology and equipment embedded into the classroom curriculum; create
extra-curricular opportunities for students to explore STEM concepts; and prepare educators to deliver the coursework, with emphasis on the needs of students with learning disabilities and English language learners in a project-based environment.
Bulletproof Vest PartnershipFunding made available by the Department of Justice to assist with the purchase of bulletproof vests to enhance law enforcement officer safety as part of the Bulletproof Vest Partnership grant. The School District Police Department will advance the safety of its officers in and around schools throughout the District by purchasing bulletproof vests through this grant program.
Career and Technical Education (CTE) - AllocationState funds made available to school districts to support Career and Technical Education (CTE) programs are directly allocated to school districts based on each high school’s duplicated enrollment in six approved CTE program areas. Funds are to be used for maintenance, improvement, and support of CTE programs based on the Nevada Program Quality Criteria as outlined in the Skills for Employment and Lifelong Learning Initiative. The six program areas include: Agriculture and Natural Resources Sciences; Business and Marketing Education; Education, Hospitality and Human Services; Health Science and Public Safety Education; Information and Media Technologies Education; and Skilled and Technical Sciences Education.
Career and Technical Education (CTE) - CompetitiveA percentage of Career and Technical Education (CTE) state funds are made available for competitive grant applications to drive change at the school or district level through the development and expansion of high school CTE programs. Competitive funds will be awarded to school districts that focus efforts to improve and develop CTE programs based on three funding purposes: 1) develop and strengthen program(s) to meet State standards and to align course sequences with the 2013-14 State CTE course catalog; 2) align programs and course sequences to the economic development priorities in the new state plan for economic development; 3) implement the new State standards for Employability Skills for Career Readiness.
Carl D. Perkins Career and Technical Education (CTE) - Act Reserve GrantCompetitive funding is made available through the Carl D. Perkins Career and Technical Education (CTE) Improvement act of 2006 for program development in key areas based on two funding purposes: 1) support the development of new programs based on State, regional or local economic and workforce development needs; 2) projects that support innovation in the delivery of existing programs based on State, regional or local economic and workforce development needs.
208 | Clark County School District
Carl D. Perkins Career and Technical Education (CTE) - Base GrantThe Carl D. Perkins Career and Technical Education (CTE) Act of 2006 provides formula funding for CTE programs that are of sufficient size, scope and quality to be effective. CTE programs include a sequence of courses that provide individuals with the academic and technical knowledge and skills to prepare for further education and for careers in current and emerging employment sectors that may or may not require a bachelors, masters, or doctoral degree. Such programs must include competency based and applied learning that contribute to the student’s development of academic knowledge and technical and occupational specific skills. Funds are provided to serve secondary students enrolled in a sequence of courses in a career cluster within a program area. The approved program areas include Agriculture and Natural Resources, Business and Marketing, Education, Hospitality, and Human Services, Health Science and Public Safety, Information and Media Technology, and Skilled and Technical Sciences. Funding is also provided for professional development, support for curriculum enhancement, work based learning, and program improvement.
Carl D. Perkins Career and Technical Education (CTE) - CorrectionsCarl D. Perkins Career and Technical Education (CTE) Improvement Act of 2006 provides funding to state or county youth correctional facilities charged with the responsibility for court-adjudicated youth, ages 14 through 17, and only those facilities which serve youth on a long-term placements (i.e., four months or longer) and offer occupational education programs.
Class Size Reduction - KindergartenDuring the 77th Nevada Legislature in 2013, kindergarten class size reduction was approved for the first time through the passage of Senate Bill 522 and Assembly Bill 2. State general funds were appropriated for the 2013-14 school year, to reduce the kindergarten class size to a ratio of 21 (no more than 25) students to one teacher in one-third of the full-day kindergarten classrooms and in all half-day kindergarten classrooms. The program resources will be allocated to schools based on need throughout the program year. Implementation will occur in collaboration with facilities and personnel availability. It is anticipated that this grant will provide funding for approximately 166 teachers.
Class Size Reduction - PortablesThe Nevada State Legislature has made funds available to provide facilities to support the implementation of Kindergarten Class Size Reduction in the District through the 2013-14 school year. These facilities will be placed according to need for projected classroom additions at schools where additional teachers are required to implement the Kindergarten Class Size Reduction. Funding is requested for the module units, delivery, set-up, siting, connectivity, finishing, permit fees, and furniture. According to the funding legislation, indirect costs are not allowable for this project.
College Board Confucius Institutes and ClassroomsThe Confucius Institute and Confucius Classroom Program supports the sustainable development of the K-12 Chinese language teaching programs in the District. The program is guided by the belief that exposure to multilingual and multicultural education is vital to student academic and career success in the 21st century world.
Community Oriented Policing Services (COPS)Funding has been provided for the Datacasting 2.0 Project by the Department of Justice to assist with the development of school safety resources as part of the Community Oriented Policing Services (COPS) - Secure Our Schools (SOS) program. The School District Police Department will partner with Vegas Public Broadcasting and the CCSD Crisis Response Team to advance the safety of schools and coordination of response to incidents throughout the District by enhancing the existing datacasting technology, expanding the service to all responders, and providing training. The goal for this project is to leverage the already successful datacast program to the next logical step by incorporating greater bandwidth, interactivity, and an expanded feature set to provide more flexible and thorough response on the part of school police and crisis responders. These enhancements will impact the community by providing greater student safety through greater situational awareness, more incident prevention, and the ability to share information and react to changing circumstances more rapidly.
Community Oriented Policing Services (COPS) - Secure Our Schools (SOS)The goal of the School District Police Department Datacasting 2.0 Expansion Project is to further the work being done to increase safety in schools by the original Datacast 2.0 Project by equipping nine more schools with the Milestone video management software that will allow school-based security cameras to be accessed by the laptop computers that have been installed in police vehicles.
Community Transformation Grant (CTG) - Center For Disease Control (CDC) - Prevention and Public Health Funds (PPHF)The goal of this project is to increase implementation of effective moderate to vigorous physical activity and continue nutrition and tobacco-use prevention efforts to improve outcome measures in the District’s students and employees, as established by the Affordable Care Act of 2010. This will be accomplished through coordinated school health policies, programs, and practices creating a healthy school/community environment that minimizes chronic diseases.
Confucius Program - Asia SocietyThe Hanban-Asia Society Confucius Classrooms Network provides support for Chinese language programs in four key areas: curriculum and instruction, partnerships, integration and culture, and leadership. The following components will be implemented at the schools to be served: 1) each school will establish a partnership with a school in China to enhance language and cultural learning; 2) students will have ongoing

Info
rmat
iona
l Sec
tion
2092014-15 Comprehensive Annual Budget Report |
communication, classroom observations, and activities with students and teachers in China; 3) new local partnerships will improve diversification of activities in the classroom to promote language immersion and cultural knowledge; 4) schools will also develop partnerships with other regional and national Confucius Classrooms Network schools to share best practices and resources; 5) integration and culture will be promoted through improved teacher collaborations among the schools served to share best practices and resources, to improve teaching strategies, and to plan cultural events; 6) one teacher from each of the served schools will attend the National Chinese Language Conference organized by the Hanban-Asia Society and the College Board.
Department of the Interior, National Park Service, Lake Mead National Recreation Area (LAKE)The objective of this cooperative agreement between the Department of the Interior, National Park Service, Lake Mead National Recreation Area (LAKE) and the District is to establish CCSD as an equal partner to provide transportation to the students from the schools to the LAKE and back. Examples of this transportation agreement that may be facilitated but are not limited to resource education and stewardship activities including interpretive and educational outreach, transportation of students to the park for field experiences and educational experiences, cultural, natural and scientific resource restoration and protection strategies, projects and services. These include but are not limited to wildlife habitat restoration, service learning and science and social science education programs, etc. These activities will encourage people to develop their own reasons for valuing LAKE and the water quality of Lake Mead.
Differentiated Consequences GrantFunding from the U. S. Department of Education through the Nevada Department of Education is provided for Title I schools designated as In Need of Improvement - Year 4 or beyond. These funds will include updating the Nevada Comprehensive Curriculum Audit Tool for Schools, providing targeted technical assistance, conducting professional development, assisting school support teams, and/or resource acquisition.
Full Day Kindergarten - PortablesThe Nevada State Legislature has made funds available to provide facilities to support Full Day Kindergarten Expansion in the District through the 2013-14 school year. These facilities will be placed according to need and projected classroom additions at schools where additional teachers are required to implement Full Day Kindergarten in additional schools. Funding is requested for the module units, delivery, set-up, siting, connectivity, finishing, permit fees, and furniture. According to the funding legislation, indirect costs are not allowable for this project.
Full-Day KindergartenThe 77th Nevada Legislature provided funding for the continuation and expansion of the Full-Day Kindergarten Program. School eligibility is determined by the Department
of Education and is driven by a school’s free and reduced lunch data for the opportunity to provide full-day kindergarten for their students. Grant funds authorized through this bill have been awarded to the District to fund positions for Full-Day Kindergarten Program teachers.
Fund for the Improvement of Education (FIE) - English Language Learners (ELL)Fund for the Improvement of Education (FIE) - English Language Learners (ELL) funds are used for the expansion of instructional support for ELL. ELL students in the District are assured equitable access to an educational experience designed to enable them to develop academic skills and concepts at the same level as other students in the District, while acquiring English language proficiency as rapidly as possible. Funds are used to compensate existing teachers for prep buy-outs, before and after school tutoring, summer school, and/or intersessions for the purpose of providing supplemental services for ELL students in K-12 schools with the most need. Teachers assisted an estimated 1,200 ELL students with learning English, attaining standards in all content areas, and credit retrieval.
Fund for the Improvement of Education (FIE) - Highly GiftedThe Fund for the Improvement of Education (FIE) - Highly Gifted project provides designated students with an appropriate learning environment that is challenging and meaningful. The program increases the enrollment of highly gifted students in accelerated classes, particularly in grades 6-12. Professional development is provided for teachers, counselors, and administrators, training them to better address the academic, social, and emotional needs of highly gifted students. Mentors will be assigned to every participating student. These licensed teachers interact with students and their families, helping to locate accelerated classes and/or additional academic opportunities, assisting with the enrollment process, and engaging in problem-solving to address any issues that may arise. Parent support groups and workshops empower families to support highly gifted students so they can reach their maximum potential.
GEAR UPThe goals of GEAR UP grant are to: 1) increase the number of low-income students who are prepared to enter and succeed in postsecondary education; 2) increase GEAR UP students’ and families’ knowledge of post-secondary education options, preparation, and financing; 3) increase recruitment and enrollment of GEAR UP students in post-secondary education; and 4) raise the expectations of GEAR UP middle school personnel to create a college-going culture that provides all students with the tools necessary to apply for and succeed in post-secondary education and future careers. The following middle schools will be served including Harney, Mack, and Woodbury. High schools receiving these middle school students within this program include Basic, Chaparral, Del Sol, Desert Pines, East Career and Technical Academy, Las Vegas, Southeast Career and Technical Academy, and Valley.

210 | Clark County School District
Gifted & Talented Discretionary UnitsThe District’s Gifted and Talented Education (GATE) program emphasizes the development of critical thinking and problem solving skills through the implementation of curricula that focus on technology integration. Embedded technologies such as simulations and virtual science labs are promoted by both the Department of Education and the National Science Foundation as instructional tools that promote linkages between Science, Technology, Engineering, and Mathematics (STEM) education research and instructional practice. These tools further promote scientific inquiry as supported by the National Committee on Science Education Standards and Assessment.
Through the GATE State Discretionary Unit Grant, the program will acquire 70 tablet computer units, accompanying software applications, and virtual microscopes for instructional use with gifted students throughout the District. These instructional resources will make possible in-depth instruction on the structure and function of individual cells, organs, and systems; students will view and manipulate three-dimensional images, performing virtual dissections. This cutting edge technology prepares students to compete in the global technology economy of the future while allowing them to build deeper interest in scientific technology and strengthen research and problem solving skills.
Google K-12 Talent Academy-Pilot ProgramGoogle K-12 Talent Academy-Pilot Program is an eight month pilot leadership development program aimed at sharing best practices in talent management or strategic human capital management between educational institutions and corporate sectors to help improve schools as a workplace.
High School Graduation Initiative ProgramThis federal program supports effective, sustainable, and coordinated dropout prevention and re-entry programs in high schools with annual dropout rates that exceed the state average dropout rate. Eight high schools and the largest feeder middle school were selected for this program. Those schools are: Canyon Springs HS/Sedway MS, Chaparral HS/Mack MS, Cheyenne HS/Swainston MS, Del Sol HS/Cannon MS, Eldorado HS/O’Callaghan MS, Mojave HS/Findlay MS, Valley HS/Fremont MS, and Western HS/Gibson MS. The components for this dropout prevention and intervention program include: a social worker to be assigned to each targeted school to determine students at-risk for dropping out of school; the provision of social services and counseling; and referrals to community partners for wraparound services. Social workers will assist youth who have already dropped out of school to re-enter and complete their secondary education. Parent education and support will be provided. Educational support services will be offered to students, such as tutoring and referrals to various academic and credit-retrieval programs. The Truancy Diversion Program is also an important component, designed to support students as they work to improve attendance and grades. Truancy court sessions will be held once a week at the school sites with both students and parents, where the presiding judge evaluates
attendance records, teacher reports, and weekly grades. Social workers will assess students, coordinate activities and wraparound services that support student attendance and achievement at school, and will report weekly to the presiding judge. The Clark County 8th Judicial District Court is an important partner in this program.
Individuals with Disabilities Education Act (IDEA) - District Improvement Grant (DIG)The Individuals with Disabilities Education Act (IDEA) - District Improvement Grant (DIG) is a project that seeks to ensure Districtwide systems for the assessment of student performance and growth. Specifically, this grant provides training and technical support for implementation of the AIMSweb Data Management System as a data-based instructional planning tool to benchmark and progress monitor student performance on general outcome measures for grades K-8.
Individuals with Disabilities Education Act (IDEA) Special Project - Special Education District Improvement Grant (SPDIG)The District faces tremendous challenges in recruiting and retaining sufficient highly qualified special education teachers to provide services for students with disabilities. The research helps us to understand that on-going high-quality professional development is one of the most influential factors in determining whether a special education teacher will be retained to remain in his or her teaching position. Specifically, the District has found that explicit professional development on the Individualized Education Plan (IEP) process is beneficial to special educators and to the families of students with disabilities. This type of training empowers new and experienced special educators alike to successfully assume professional responsibilities of drafting IEPs and then planning and delivering appropriate instruction aligned to each student’s IEP. In order to accomplish the District’s goals to retain more special education teachers and better meet the professional development needs of current special education teachers, this grant funded program will provide high-quality trainings on issues and topics specific to the educational needs of students with disabilities, including the provisions of conducting successful IEP meetings.
Investing in Innovation (I3) Fund -Science, Technology, Engineering, and Mathematics (STEM)The Pathways to Science, Technology, Engineering, and Mathematics (STEM) Initiative (PSI) serve approximately 5,600 students and will target four middle schools and two high schools that are feeder-aligned and have high percentages of students underrepresented in STEM. Schools selected for services are: Garside Middle, Gibson Middle, Findlay Middle, and Johnston Middle Schools as well as Mojave High and Western High Schools. Students will have access to project-based STEM coursework that uses technology and equipment embedded into the classroom curriculum; create extra-curricular opportunities for students to explore STEM concepts; and prepare educators to deliver the coursework, with emphasis on the needs of students

Info
rmat
iona
l Sec
tion
2112014-15 Comprehensive Annual Budget Report |
with learning disabilities and English language learners in a project-based environment. The PSI model allows students to discover, explore and pursue STEM by providing various levels of involvement. PSI will also provide students an opportunity to participate in various project activities. PSI activities include weekly sessions with STEM professionals, STEM Club, and STEM summer camp.
Jobs for America’s Graduates (JAG)This partnership between Community Services Agency, the District, and Jobs for America’s Graduates (JAG) aims to successfully implement and sustain the JAG multi-year dropout prevention program in the following ten high schools: Basic, Bonanza, Cheyenne, Cimarron-Memorial, Del Sol, Desert Pines, Legacy, Mojave, Spring Valley, and Valley. The mission is to ensure that at-risk high school students remain in school, attain employability skills through classroom and work-based learning experiences during high school, graduate, and receive 12 months of follow-up services by the JAG Specialists.
Johnson/O’Malley Grant (JOM)The purpose of the Johnson O’Malley (JOM) grant is to provide academic, college, career, and cultural programs that meet the needs of American Indian/Alaska Native students. The following activities will be conducted during the project period: 1) eligible American Indian/Alaska Native students throughout the District will continue to be identified and tracked for attendance and academic achievement; 2) college, career, and cultural awareness activities will be implemented for eligible American Indian/Alaska Native students that enhance and support academic achievement; 3) fees for uniforms, classes, labs, and credit retrieval for qualifying students will be provided; 4) parent events will be implemented; and 5) the Indian Education Parent Committee will continue to plan, monitor, and participate in program activities. Measurable objectives are: 1) JOM students’ average daily attendance will show a one percent increase above the 2010-11 academic year, and for each successive school year through 2013-14; 2) the percentage of JOM students participating in tutoring programs will show an increase of two percent over the previous year, beginning with the 2010-11 academic year; and 3) eighty percent of student participants in cultural events will report on surveys that the event reinforced their cultural identity.
Local Plan - Individuals with Disabilities Education Act (IDEA)Funding is provided through the Individuals with Disabilities Education Act, Part B, Public Law 101-476, to assist school districts in the initiation, expansion, and improvement of programs for the education of students with disabilities. Students with educational, physical, mental, emotional, and/or social disabilities are provided programs and services to afford them an opportunity to maximize their potential. In accordance with federal regulations pertaining to the education of students with disabilities, populations of unserved and underserved children are identified.
Math and Science Partnership (MSP) - Project: Venture Into Scientific Inquiry Organized around Nevada Standards (VISIONS)Math and Science Partnership (MSP) - Project: Venture Into Scientific Inquiry Organized around Nevada Standards (VISIONS) is a professional development project that will increase science and mathematics achievement for elementary students in the District. Partners in the project are the District and the University of Nevada, Las Vegas (UNLV) Center for Mathematics and Science Education (CSME). Research-based professional development will increase teacher content knowledge and instill inquiry-based pedagogical practices that aid science and mathematics instruction through reflective processes. In addition, collaboration between elementary and high school science teachers will be established to deliver a consistent curriculum aligned to state standards. Project VISIONS will: 1) develop high school and elementary teams that will provide ongoing professional development in science content knowledge and the Full Option Science System (FOSS) Districtwide; 2) increase science and mathematical content knowledge of elementary school teachers and improve the effectiveness of classroom instruction, thus resulting in increased student achievement in science and mathematics; and 3) target schools that are in need of improvement as specified by No Child Left Behind legislation and have a high percentage of teachers who do not have highly qualified status.
Mathematics and Science Partnership Program (MSP)The Mathematics and Science Partnership grant - Strategies to Achieve Results and the Common Core State Standards for Mathematics (STARs and the CCSS-M) is a collaboration between the District and the University of Nevada, Las Vegas (UNLV) Center for Mathematics and Science Education (CSME). STARs and the CCSS-M will provide professional development to elementary teachers in Clark County public, private, and charter schools. Seventy teachers will be selected to participate in an online learning community to facilitate discussions regarding implementation of new content and instructional strategies; promote increased knowledge, skills and practice; and reflect upon challenges and successes related to curriculum and mathematical content during the 2013-14 school year.
McKinney-Vento Education for Homeless Children and YouthThrough the McKinney-Vento Homeless Assistance Act of 1987, amended by the No Child Left Behind Act of 2001, funds are made available through the Nevada Department of Education to support programs that facilitate the academic success of students who are homeless, guaranteeing access to all appropriate educational opportunities and services. The District’s McKinney-Vento grant program contains three main components: A Place Called Homeless Outreach Program for Education (HOPE) Rooms, Middle and High School Mentor Program, and ParentLink Training for Parents. Through these projects, the Title I HOPE office will continue to improve and extend the connection between homeless students and the

212 | Clark County School District
services they need to stay in school and succeed. The goals of the McKinney-Vento projects are aligned with A Look Ahead which aims to raise the bar to focus on preparing students so they are ready by exit. A Place Called HOPE provides resources such as food, clothing, hygiene items, and academic support to high school students in need. Licensed teachers will act as mentors. The Middle and High School Mentor Program provides opportunities for students to improve and strengthen their skills both academically and socially. Students meet weekly with an identified teacher to develop and monitor achievement toward goals in areas including academics and life and social skills. ParentLink Training for Parents will provide training for parents of students experiencing homelessness to understand and utilize the District’s online student grade and attendance tracking system.
Nevada Collaborative Teaching Improvement Program (NeCoTIP) - BaileyThe District’s Curriculum and Professional Development (CPD) Department staff members were invited to work in partnership with University of Nevada, Las Vegas on a project entitled Biology and English Language Arts: Interdisciplinary Partnerships for Achievement (BELA IPA). This project will provide assistance in designing and conducting the professional development activities of the BELA IPA project, ensuring alignment with District standards of professional development and the relevant Common Core State Standards (CCSS) in English Language Arts, including the CCSS for Literacy in History/Social Studies, Science, and technical subjects. This subaward will be used to pay for substitute teachers and extra duty pay for teachers to participate in professional development and extra duty pay for teachers to staff a writing center at Bonanza High School. Funds will also be used to purchase instructional materials including a non-fiction science content book for each grade nine student at Bonanza High School.
Nevada Collaborative Teaching Improvement Program (NeCoTIP) - Dr. Giorgis - Children’s Literature, Mathematics and Science (CLaMS)The intent of the Children’s Literature, Mathematics and Science (CLaMS): Creative Connections Across Content Areas, is to examine, explore, and enhance instructional strategies that will entice children to make mathematical and science related connections to literature through oral and written means. A summer institute and professional development will enable 40 teachers in teams of 2-5 in the District to have the opportunity to further their math and science content knowledge and instructional strategies in reading and writing. These professional development activities will be conducted jointly by University of Nevada, Las Vegas (UNLV) and College of Southern Nevada (CSN) professors and involve CCSD teacher leaders. Participants will address the Common Core State Standards and Nevada State Standards related to science, mathematics and literacy in order to further the goals and objectives of their respective schools. Using technology such as Flip video cameras and
podcasts, teachers will be able to investigate the process by which children solve mathematical problems, respond to science content in literature, and generate connections both mathematical and science related to the literature that they are reading. Using the six traits of writing, teachers will further engage children in written responses that will reveal the connections they are making with science, mathematics, and literacy. Through this proposed project, reading, writing along with scientific and mathematical thinking will significantly impact instructional practice and student learning.
Nevada Collaborative Teaching Improvement Program (NeCoTIP) - Dr. Higgins - Project GrowThe purpose of Project Grow is to provide professional development to 18 teachers at three high schools in the District (Cheyenne HS, Liberty HS, and Mojave HS) to unwrap biology content standards, create standards-based assessments, and plan instructional adaptations based on student assessment scores. The District has two primary roles in Project Grow; 1) formatively evaluating the materials created by project staff and; 2) providing opportunities for teachers to attend professional development activities during the summers of 2012 and 2013 and during the 2012-13 school year.
Nevada Collaborative Teaching Improvement Program (NeCOTIP) - Entry to Transformation (E2T): Implementing Blended Learning in MathematicsThe K-12 Mathematics and Instructional Technology Department, Curriculum and Professional Development Division partnered with the University of Nevada Las Vegas (UNLV) Colleges of Education and Sciences and the Sierra Nevada College of Education for professional development activities funded by a Nevada Collaborative Teacher Improvement Program (NeCoTIP) grant. This grant funds after-school professional development activities for 60 middle school teachers. University and college personnel provide assistance in developing and integrating activities at the District’s Engage, Empower, Explore (E3) Project schools as well as other sites. The goal of this grant is to provide the professional development and support needed for developing lessons, activities, and assessments to address middle school mathematics content aligned with the Common Core State Standards for Mathematics (CCSS-M). To maximize impact, the project leadership team helps teachers develop lessons with varying levels of required technology. This allows middle school mathematics teachers across the District, as well as within the E3 Project, to implement blended learning for their students.
Nevada Collaborative Teaching Improvement Program (NeCOTIP) - Nevada Partnership for Effective Mathematics and Science Teaching and Learning (N-PEMSTL)CPD Division staff members are working in partnership with University of Nevada, Las Vegas (UNLV) on the Nevada Partnership for Effective Mathematics and Science Teaching and Learning (N-PEMSTL) project to increase grades 3-5 teachers’ mathematics and science knowledge. The goals

Info
rmat
iona
l Sec
tion
2132014-15 Comprehensive Annual Budget Report |
of this project are to: 1) increase teachers’ understanding of Science, Technology, Engineering, and Mathematics (STEM) integration, and 2) to increase teachers’ capacity in the effective alignment of instructional materials to the Nevada Academic Content Standards in Mathematics and Science. A summer professional development, school-year follow up, and professional learning communities will be used to accomplish the goals of the project. Up to 40 teachers are invited to participate in the project. Most participants in this project were included in the 2013-14 N-PEMSTL project; however, some turnover is expected and openings will be communicated to teachers in schools whose data indicate the need for additional support. UNLV is the applicant and the District will act as the local school district partner. The subaward will be used to pay for extra-duty pay for teachers to assist with the development of professional development and for teachers to attend professional development.
Nevada Commission on Educational Technology (NCET) - State Educational Technology Implementation Funds (SETF)-ConsortiumNevada Commission on Educational Technology (NCET) - State Educational Technology Implementation Funds (SETF)-Consortium provides high-quality online professional development (PD) to support the implementation of the Common Core State Standards (CCSS), leading to improved student achievement. This PD is a combination of modules developed by the District, commercially available packages, and technology lesson plans. The Bringing Learning and Standards Together (BLAST) project provides online PD modules tied to CCSS and rich in classroom examples and technology integration. These are available to individual teachers, groups of teachers (such as a grade level), or whole schools. They are also available for use by other Nevada districts. As part of this effort to provide quality online PD, Public Broadcasting Service Teacher Line classes will also be used to support rollout of the CCSS.
Nevada Comprehensive Curriculum Audit Tool for Districts (NCCAT-D)The Nevada Comprehensive Curriculum Audit Tool for Districts (NCCAT-D) will be utilized to conduct the needs assessment to determine a district’s capacity to meet the needs of its struggling schools. The purpose of the NCCAT-D is to guide the analysis of data for prioritizing needs, identify strengths and areas of concern, and convey a transparent evaluation process to all stakeholders.
Nevada Growth Model/Washoe Teacher Incentive FundDuring the 2009 Legislative Session, Assembly Bill 14 was enacted which required the Nevada Department of Education to develop and implement a growth model. The Nevada Growth Model is a tool for using performance data to more accurately assess and report on annual academic progress. It is used to identify schools that obtain high growth as well as those achieving typical growth and those achieving low-growth. This helps the District in its effort to close achievement gaps. When fully implemented, the Nevada Growth Model
will include a parent-friendly component that is both simple and informative, and will allow users to see how their child, their child’s classroom, and their child’s school compare to other similar populations.
Nevada Homeland SecurityThe Homeland Security Grant will provide funds to update the School District Police Department dispatch communications system to increase the local and regional interoperability of its system through the Southern Nevada Area Communications Council System (SNAAC).
Nevada Library Books PurchaseThese funds purchase library books for all District schools with libraries and/or media centers. The amount of funds available for each of the eligible schools is determined by a per pupil allocation. Funds awarded above and beyond the formulated amount are based on school need with special consideration given to libraries at schools serving high numbers of disadvantaged students and/or English Language Learners. Schools changing the grade levels that will be served in the upcoming school year are also given special consideration for extra funding. School librarians, in cooperation with their administrators, determine school library book needs and order accordingly. These expenditures are at the discretion of the District Library Services Coordinator based on his review of current statistical reports of school library collections, current demographics and knowledge of changes within student populations to be served at each school.
Nevada State Pre-Kindergarten ProgramThe Clark County School District Nevada State Pre-Kindergarten Education Program, formerly the Early Childhood Education Comprehensive Plan has been providing families of at-risk children with high quality pre-kindergarten education opportunities since 2001. The mission of this highly successful program is to continue to increase developmental preschool education opportunities for children with disabilities, children from low-income families, and children from bilingual families or families who are non-English proficient. During the 2013-14 school year, this program will collaborate with Early Childhood Special Education, Title III, and Title I to provide services at these elementaries: Bracken, Bunker, Cunningham, Dondero, Harris, Lake, McCaw, McWilliams, Rundle.
Prevention Advocacy Choices Teamwork (PACT) - Quannah McCallQuannah McCall Elementary receives funding to implement evidence-based services aligned with one or more of three established coalition priorities. The priorities include: 1) developing a strong organizational infrastructure; 2) building strong community ties; and 3) prevent early onset of childhood and underage drinking/drug use. The program initiatives include after-school positive action tutoring, parenting wisely classes, summer school, and Saturday family and community activities. Through this initiative the program will

214 | Clark County School District
impacts approximately 490 students and their families. The program objectives for this grant are to increase: 1) student achievement; 2) student social skills; 3) parental awareness with positive action and parenting wisely; and 4) parent and community involvement.
Prevention Advocacy Choices Teamwork (PACT) - Safe and Drug FreeThe District’s Safe and Drug Free Schools program seeks to pilot the Reconnecting Youth program at various high schools during the 2013-14 school year as a means of reintroducing a prevention element into its programming. Reconnecting Youth is classified as an evidence-based prevention program that is intended for high-risk youth and is effective with multicultural groups from diverse racial/ethnic populations as well as monocultural groups. Reconnecting Youth program was adapted in the early 1990’s to address youth at suicide-risk as well as those at risk for potential dropout and drug involvement. Efficacy tests showed that Reconnecting Youth worked to decrease suicide-risk factors, drug involvement, and poor school performance. This program has been adapted by others for use in alternative high schools, juvenile correction programs, group homes, and middle schools.Program goals: 1) increased school achievement (including school bonding, attendance, GPA and credits earned); 2) decreased drug involvement (including increased drug use control and decreased adverse drug-use consequences); and 3) decreased emotional distress (including decreased suicidal behaviors and related risk factors: depression, hopelessness, anger-control problems, stress; and increased protective factors: self-esteem, personal control, and social support from peers, family, and school).
Professional Development for Arts Educators (PDAE) ProgramThe Professional Developments for Arts Educators (PDAE) grant is designed to raise student achievement in eight at risk K-12 schools in the District through integrated instructional strategies “in” and “through” the arts. The purpose of the PDAE program is to strengthen standards based on integrated instruction through intensive professional development that makes connections between the Nevada Standards for music and visual arts and the Common Core State Standards for mathematics and English language arts.
Project Focusing on Crosscutting Concepts to Understand Science (FOCCUS) - Math and Science PartnershipThe goals for Project Focusing on Crosscutting Concepts to Understand Science (FOCCUS) are: 1) increase teacher knowledge of science content, practices, and crosscutting concepts as they are represented in the science Nevada Academic Content Standards (NVACS); 2) develop teacher ability to integrate crosscutting concepts represented in the science NVACS into content-focused instruction; 3) increase academic achievement of students taught by FOCCUS participants; and 4) develop an online science educator network.
Project FOCCUS will provide participants with a 3-phase professional development cycle: 1) the summer science institute, 2) implementation and reflection, and 3) the Engineering Content Connections Institute. Phase 1 content will be delivered through a blended-learning approach mixing online with face-to-face sessions. K-12 participant cohorts will work through activities based on crosscutting concepts articulated in the science NVACS. Phase 2 will focus on the direct classroom implementation of the participant-developed content knowledge of topics represented in the science NVACS. In the final element of Phase 2, participants will reflect on their experiences using student assessment data and evaluate the effectiveness of their lessons. Phase 3 will concentrate on developing a deeper understanding of the content needed to support engineering and how elements and practices of engineering can be best translated into classroom practices that are supported by the science NVACS.
Project FOCCUS will be evaluated utilizing pre and post-tests of teacher content knowledge; analysis of lesson plans and classroom observations; student achievement data; and evaluation of the online science educator network based on shared lessons, communications among teacher participants, and teacher interview data. A rigorous evaluation will measure the effectiveness of the project through science proficiency data of students who have received instruction from teachers successfully completing the training. Follow-up sessions, self-reflection exercises, and formal observations will be used to track changes in pedagogy as teachers are encouraged to adopt a more student-centered approach to instruction.
Refugee School Impact AidThe Department of Health and Human Services Office of Refugee Resettlement provides funding to assist refugee students in the transition to American culture. The District, Catholic Charities of Southern Nevada, and the Ethiopian Community Development Council (ECDC) partnered to provide academic and enrichment services for elementary and secondary refugee students. This grant will support refugee students through the provision of before- and after-school tutoring, school supplies, backpacks, books and supplemental classroom materials, translation of school forms, interpreters for registration and parent conferences, clothing, personal hygiene items, physical education uniforms, and field trips to cultural and educational places of interest in the community. Del Sol High, Global Community High, Valley High, Orr Middle, and Ruby Thomas Elementary Schools are the targeted sites for comprehensive school-based programs as they have the highest populations of refugee students to be served. However, refugee students are attending many other schools districtwide. Therefore, refugee students attending other schools throughout the district will also be supported through this funding.

Info
rmat
iona
l Sec
tion
2152014-15 Comprehensive Annual Budget Report |
Safe Routes To School (SRTS) CoordinatorSafe Routes to School (SRTS) funds are used to support development and implementation of programs that examine conditions around schools and conduct projects and activities that improve safety and reduce traffic and air pollution in the vicinity of schools. This project funds a safety coordinator position to oversee/ensure implementation of SRTS initiatives.
Silver State Kindergarten Inventory of Development Statewide (KIDS)The District currently has more than 500 teachers utilizing Teaching Strategies GOLD™ (TSG™) as the authentic assessment for preschoolers in both general education and special education. These funds be utilized to purchase iPads to pilot a new method of data collection by teachers to drive and inform instruction. This new method of implementing the assessment will significantly reduce the time it takes teachers to input data as the device can be with them while they are teaching children and data can be collected “on the spot.” It is imperative that teachers monitor progress and growth to ensure readiness for kindergarten, both for general education preschoolers and preschoolers with disabilities. The result of implementing this technology will be an increase in instructional time for students of these teachers.
Special Education Early ChildhoodThe aim of this program is to address the needs of children with disabilities before they are eligible to enter first grade. The funding also enables the District to implement a continuum of placement options that address the least restrictive education environment. Specified goals and objectives for the proposed program are to: 1) enable young children with disabilities to begin schooling as early as possible to mitigate the effects of their disabilities, as required by federal law; 2) provide a systematic structure for parent training, identification of eligible students, and implementation of specific early childhood special education curriculum; 3) provide staff training in special education procedures and instructional techniques; and 4) develop and implement a plan for dissemination of information to the public regarding early childhood education.
Special Olympics NevadaThis project will foster the development of a comprehensive Special Olympics program that services special education students with developmental disabilities. The primary objectives of this grant are: 1) to continue to foster the development of a comprehensive Special Olympics program that services Special Education Students with developmental disabilities with a cognitive delay during the school day; and 2) to provide transportation and teacher support to students who participate in the Special Olympics program.Striving Readers Comprehensive Literacy (SRCL) ProgramThe Striving Readers Comprehensive Literacy (SRCL) Program serves children from birth through grade twelve. The overall goal of the SRCL Program is to improve literacy and college and career readiness for all students, and to ensure all students are ready by exit to be successful in
higher education and their chosen career pathways. Phase II SRCL schools are targeted in this project period; schools were selected based upon academic need. All schools are aligned by feeder patterns to promote vertical alignment, coordination of programs, and structured transition activities. The following goals have been developed for the SRCL Program: 1) through high-quality, job-embedded professional development, teachers will understand and apply elements of effective literacy instruction and intentional use of instructional materials that are aligned to the CCSS so that every student knows how to use reading, writing, listening, viewing, speaking, presenting, and critical thinking skills from birth through grade 12; 2) implement interventions to ensure that all students (including students who are experiencing difficulties and students who are progressing ahead of their peers) are identified and served appropriately; and 3) establish Data Based Decision-Making (DBDM) Literacy Teams at schools that are aligned with a Response to Intervention/Instruction framework and maintain a purposeful, respectful environment in which data can be collected, analyzed, and used to continually improve literacy achievement.
All proposed SRCL activities align with the Nevada State and District literacy plans. Program activities are designed to ensure that the above-stated goals are achieved and include the following: Striving Readers literacy coaches will be placed at each of the targeted school sites to increase capacity through coaching, mentoring, and training; DBDM literacy teams at the Local Education Agency (LEA) and site levels will assist in reviewing student data, will support teachers in making evidenced-based instructional decisions, and will provide ongoing progress monitoring. High quality, job embedded professional development and summer academies will be provided to all teachers and administrators at targeted school sites; assessments and intervention programs and materials will be provided to supplement instruction at the schools sites; summer school support will be provided to students in need of additional academic support at the secondary level; and partnerships with community-based organizations and institutions of higher education will implement birth through grade 12 literacy programs with students and families, including: the University of Nevada Cooperative Extension, local daycare centers, Vegas Public Broadcasting Service, and local libraries.
Summer School Diversion Program - Justice Assistance Grant (JAG)The District is a subrecipient of funding from the Bureau of Justice Assistance through Clark County, Nevada for participation in the Edward Byrne Memorial Justice Assistance Grant (JAG 2010). CCSD assists credit deficient high school students with the costs of attending summer school and to receiving high school accreditation.
Technical Assistance GrantFunding has been allocated to support Title I schools identified as Priority schools under Nevada’s Elementary and Secondary Education Act (ESEA) Flexibility Waiver, but were not awarded School Improvement funds for fiscal year 2013-

216 | Clark County School District
14. These funds are allocated from the Nevada Department of Education administrative School Improvement Grant (SIG) to provide technical assistance support to Del Sol and Valley High Schools during the current school year to strengthen the capacity to successfully implement each school’s Priority school plan.
Title I - Focus School ImprovementSchool improvement funds will be used to provide support for interventions in order to decrease the achievement gap while increasing student achievement. This program will serve the following 13 schools: Craig, Diaz, Fitzgerald, Imagine 100, Kelly, Lowman, Petersen, Paradise, Reed, Roundy, Squires, and Tom Williams Elementaries along with the West Secondary Preparatory Academy for a minimum three-year period. The interventions to be implemented will enable the District to address the needs of these Title I schools through schoolwide support and school networking activities while meeting the unique needs of each Focus school.
Title I Part D Neglected or DelinquentThe Title I, Part D Neglected and Delinquent grant funds the Youthful Offender Program (YOP). The YOP is an adult high school program in the District. Located in High Desert State Prison (HDSP), the program serves approximately 890 inmates ages 16-26 who have been adjudicated by the court system. The YOP offers general academic classes such as English, math science, language, social studies, special education, General Equivalency Diploma (GED) preparation, and computers. Career and technical classes including automotive, culinary, heating ventilation and air conditioning , and industrial technology are conducted in vocational classrooms. There is also a construction strand that is offered which includes electrical, hydraulics, machinery, tools, green technology inclusive of Leadership in Energy and Environmental Design (LEED) certification. The instructional program at HDSP is unique in that students placed are ready to be integrated back into society at the conclusion of their prison term. Those who develop their talents in the areas of communication, computational trade, and social skills are successful.
Title I School Improvement Grant (SIG) Sec 1003(g) Cohort 3Title I School Improvement Grant (SIG) Sec 1003(g) Cohort 3 federal flow-through funding, formula-based grant of the Elementary and Secondary Education Act (ESEA) focus is to implement intervention strategies to improve the academic achievement of persistently low achieving schools that have been identified as In Needs of Improvement, in corrective action, or restructuring. The District has elected to implement the Transformation Model as an intervention strategy at Canyon Springs High School.
Title I School Improvement Section 1003(g)-Priority Schools - Cohort 4The Priority School Improvement Grant Under Title I, Sections 1003(g) and 1003(a) of the Elementary and Secondary Education Act (ESEA) will provide support through school improvement activities in persistently low-achieving schools
by implementing one of four Department of Education school intervention models. The project goals for Desert Pines High School are to increase the number of students successfully participating in advanced coursework and to ensure all students experience success in school and are ready by exit.
Title IIA Teacher and Principal Training and RecruitingIn accordance with educational needs and priorities, consistent with the improvement of instruction through teacher and administrative training, the District will provide professional development opportunities through the following projects: Curriculum and Professional Development Support; English Language Arts; Mathematics; Science and Health; Assessment, Accountability, Research, and School Improvement; Equity and Diversity Education; Gifted and Talented Education; Middle School Initiatives, and Leadership/New Teacher Induction. The District will also utilize a portion of this funding to continue recruitment efforts of Highly Qualified Teachers (HQT) and to provide program services including grant planning, monitoring, evaluation, and administrative guidance. Additionally, these funds based on a per pupil formula will be used to provide for equitable participation of eligible private school teachers and administrators in professional development opportunities.
Title III English Language LearnersThis grant is used to assist all second language learners in becoming proficient in English. Students at all grade levels are served. Professional development, dual immersion, elementary education, secondary education, program services, and parent involvement are the six projects.
Title IV-21st Century Community Learning Center (CCLC)The 21st Century Community Learning Center (CCLC) programs provide academic and enrichment activities, before and after school, designed to help children in high-need schools succeed academically while enhancing their physical, cultural, social, and economic lives. The programs are guided by four stated goals: 1) improve student academic success; 2) provide enrichment opportunities, including civics education, and Science, Technology, Engineering, and Mathematics (STEM) activities; 3) facilitate family and community engagement by providing support for literacy and related educational services to families of program youth; and 4) promote student health and fitness, including participation in activities that support drug and alcohol prevention. The programs must operate 12 hours per week, for a minimum of 120 days, and serve at least 100 regular attendees who participate 30 or more days in the program.
Title VII-Indian EducationThis program provides educational opportunities for American Indian or Alaska Native students. The program is developed in partnership with the Clark County Indian Education Parent Committee. The following activities will be conducted during the school year: 1) identify American Indian and Alaska Native students throughout the county; 2) identify students from elementary, middle, and high schools who are determined to

Info
rmat
iona
l Sec
tion
2172014-15 Comprehensive Annual Budget Report |
be in need of tutorial services in accordance with established selection criteria; 3) provide after-school tutoring in reading, mathematics, and science for an estimated 75 students from approximately 50 schools Districtwide; 4) schedule cultural awareness activities districtwide for American Indian and Alaska Native students that enhance and support academic achievement; 5) provide a college tour for qualifying students; and 6) provide opportunities for parents and guardians to participate in the project through the Clark County Indian Education Parent Committee.
United Way Of Southern Nevada (Family Engagement for High School Success)The focus of the Family Engagement for High School Success Initiative is to increase Nevada’s high school graduation rate and levels of college and career readiness. The funds are for the purpose of promoting family engagement through support of resource centers at five identified high schools. Clark, Eldorado, Silverado, Sunrise Mountain, and Western will each receive funding to continue implementation of a parent resource center for families allowing for an increase in engagement with school activities. Topics to be addressed through center resources involve four key areas: 1) technology and information for communication; 2) relationships and self-advocacy; 3) parental roles in promoting high school success; and 4) family economic and financial burdens.
Windsong - Pre-KindergartenThe Windsong Trust provided additional funds to the District for the 2013-14 school year, to take the following actions to continue it’s Early Childhood Education Initiative: 1) sustain five Windsong sponsored pre-kindergarten general-education classrooms; and 2) expand the partnership with Teach For America to provide corps members and/or alumni as Early Childhood Education lead classroom teachers. In addition to increasing the capacity of the Early Childhood Education Initiative, the District is focused on enhancing programmatic support for Early Childhood Education teachers.
The Windsong Trust is also supporting the District’s expanded recruitment efforts due to an increase in the number of teachers originally anticipated to be hired for the 2013-14 school year. The funding is being utilized to purchase additional advertising, produce recruitment materials, provide incentives to principals and teachers for reaching staffing and recruitment targets, and to hire and train expert teachers who will assist with screening teacher applications.
Windsong - The New Teacher Project (TNTP)The Windsong Trust provided a grant to the District to contract with The New Teacher Project (TNTP) to assist with the development and implementation of sustainable systems for educator excellence. TNTP staff facilitate strategic design and stakeholder engagement sessions; assist District staff in designing high-impact, tailored solutions based on research and best practices; support and coach staff in setting goals and creating accountability mechanisms; and support staff to create, implement, monitor, and improve project plans.
The focus is on assisting District leaders in developing both people and processes, so as to assist the District in building the capacity for lasting change and continuous improvement. TNTP staff work with the District’s Human Resources Division to understand its current situation and human capital challenges and to develop appropriate, effective, and sustainable mechanisms for change. In designing solutions, TNTP will bring to bear extensive knowledge and experience in human capital reform from working with states and school districts around the country. In addition, TNTP works with client teams to establish specific and measurable outcome goals and metrics for each phase and aspect of the engagement. TNTP assist the District specifically in the areas of recruitment and selection of high quality teachers and leaders, timely vacancy identification and early hiring, so that all schools are 100 percent staffed with high quality educators by school opening. Additionally, TNTP works with the District’s academic and administrative leaders and stakeholders to design and implement high quality educator evaluation systems focused on student learning. Finally, TNTP supports the District’s academic leaders in designing effective training and professional development for principals in human capital and performance management.
Youthbuild Program - Desert Rose High SchoolThe Youthbuild Program at Desert Rose High School provides students with basic skills in reading, writing, English, and math. The program also assists students with General Equivalency Diploma (GED) preparation and career and technical education curriculum. Students who are attending Desert Rose and are participants in the Youthbuild Program attend on-campus academic and career and technical education classes and participate in special projects. The program provides instruction, materials, basic infrastructure for academic, career and technical programs, and classroom work areas. All career and technical programs meet State and District standards and provide a combination of classroom instruction and hands-on experiences.
Zoom SchoolsZoom School funding is to provide extended services for elementary students and was approved initially by the 77th Nevada Legislature in 2013 through the passage of Senate Bill 504. The Legislature appropriated money from the State general fund to provide additional funds for expanded school-wide services in certain elementary schools during the 2013-14 and 2014-15 school years. These funds will be utilized to offer the following services free of charge to families of identified schools: 1) pre-kindergarten children; 2) full-day kindergarten to students; 3) a reading skills center; and 4) a Summer or Intersession Academy.
Fourteen elementary schools have been identified as follows: Cambeiro, Cortez, Craig, Detwiler, Diaz, Herron, Lunt, Martinez, Paradise, Petersen, Ronzone, Tate, Warren, and Tom Williams.
Source: CCSD Grants Development and Administration

218 | Clark County School District
Abbreviations and Acronyms
AARSI Assessment, Accountability, Research, and School Improvement
AB Assembly BillADA Americans with Disabilities ActADA Average Daily AttendanceADM Average Daily MembershipADOPP Alternative Drop Out Prevention ProgramAIS Academy for Individualized StudyAP Advanced PlacementAPEDP Alternative Program of Education
for Disruptive PupilsARL Alternative Route to LicensureARRA American Recovery and Reinvestment ActASBO Association of School Business Officials
InternationalASCD Association for Supervision and Curriculum
DevelopmentASK Assessing Science KnowledgeATA Advanced Technologies AcademyATTC Area Technical Trade CenterAVID Advancement via Individualized Determination
ProgramAYP Adequate Yearly ProgressAZAC Attendance Zone Advisory Commission
BLAST Bringing Learning and Standards TogetherBoard Board of School TrusteesBOC Bond Oversight Committee
CAFR Comprehensive Annual Financial ReportCALEA Commission on Accreditation for
Law Enforcement AgenciesCASA Center for Accelerating Student AchievementCCASA-PE
Clark County Association of School Administrators and Professional-technical Employees
CCSS-M Common Core State Standards for MathematicsCCDC Clark County Detention CenterCCEA Clark County Education AssociationCCLC 21st Century Community Learning CenterCCP Continuum of Care Program-In Custody ProgramCCPEF Clark County Public Education FoundationCCSD Clark County School DistrictCCSS Common Core State StandardsCDC Center for Disease ControlCDM Central Desktop ManagementCEE Commission on Educational ExcellenceCIP Capital Improvement PlanCIS Central Information ServicesCISN Communities In Schools of NevadaCMMS Computerized Maintenance Management SystemCMP Captioned Media ProgramCOPS Community Oriented Policing ServicesCPCU (American Institute) Chartered
Property Casualty UnderwritersCPD Curriculum and Professional Development
CSN College of Southern NevadaCPSI Canadian Playground and Safety InstituteCREW College Readiness Educational WorkshopCRT Criterion Referenced TestCSR Class Size Reduction CSRP Comprehensive School Reform ProjectCTE Career and Technical EducationCTG Community Transformation GrantCTSOs Career and Technical Student Organizations
DBDM Data Based Decision MakingDCMC Described and Captioned Media CenterDECA Distributive Education Clubs of AmericaDHS Department of Homeland SecurityDIBELS Dynamic Indicators of Basic Early Literacy SkillsDistrict Clark County School DistrictDMC Clark County Debt Management CommissionDSA Distributive School Allocation
E3 Engage, Empower, Explore ProjectEBS Educational Broadband ServiceECECP Early Childhood Education Comprehensive PlanECS Educational Computing StrategistsEDE Equity and Diversity EducationEEOC Equal Employment Opportunity CommissionsEETT Enhancing Education Through Technology EGI Employee Group InsuranceELL English Language LearnersEMC Educational Media CenterEMR Employee - Management RelationsEMS Educational Media ServicesEOC Emergency Operations CenterERP Enterprise Resource PlanningES Elementary SchoolESD Education Services DivisionESEA Elementary and Secondary Education ActESEA Education Support Employees AssociationESL English as a Second Language
FADA Fiscal Accountability and Data AnalysisFAPE Free Appropriate Public EducationFASA First Aid Safety AssistantFASTT Fluency and Automaticity through Systematic
Teaching and TechnologyFBLA Future Business Leaders of AmericaFCCLA Family, Community, and
Career Leaders of AmericaFERPA Family Educational Rights and Privacy ActFFA Future Farmers of AmericaFICA Federal Insurance Contributions ActFIE Fund for the Improvement of EducationFLI Family Leadership InitiativeFOCCUS Focusing on Crosscutting Concepts to Understand
Science

Info
rmat
iona
l Sec
tion
2192014-15 Comprehensive Annual Budget Report |
FOSS Full Option Science SystemFSR Facility Service RepresentativeFTE Full Time EquivalentFY Fiscal Year
GAAP Generally Accepted Accounting PrinciplesGASB Governmental Accounting Standards BoardGATE Gifted and Talented Education ProgramGDA Grants Development and AdministrationGEARUP Gaining Early Awareness and
Readiness for Undergraduate ProgramsGED General Educational Development TestGFOA Governmental Finance Officers AssociationGIS Geographic Information SystemsGREAT Gang Resistance Education and TrainingGST Governmental Services Tax
HH Deaf/Hard of HearingHOPE Homeless Outreach Program for EducationHR Human ResourcesHS High SchoolHQT Highly Qualified Teacher
IDEA Individuals with Disabilities Education ActIDMS Integrated Data Management SystemIEP Individualized Education ProgramIMPACCT Intermediate Placement and
Correctional Court Tactics ProgramIMPROVE Improving Methods, Procedures, Results, and
Outcomes ProjectINOI In Needs of ImprovementiSAT Improving Science Achievement
with Instructional Technology
JAG Jobs for America’s GraduatesJAG Justice Assistance GrantJOM Johnson O’Malley Act
KIDS Kindergarten Inventory of Development Statewide
LAN Local Area NetworkLAS Language Assessment ScalesLEA Local Education AgencyLEED Leadership in Energy and Environmental DesignLEP Limited English ProficientLEPC Local Emergency Planning CommissionLSST Local School Support Taxes (Sales)
MADEIT Multidisciplinary Adaptive and Dynamic Evaluation Instrument for Teaching
MASE Mathematics and Science EnhancementMDT Mobile Data TerminalMIEP Mathematics Early Intervention ProjectMIST Mathematics Integrated with
Science using TechnologyMPS Management Process SystemMS Middle School
MOE Maintenance of EffortMSP Mathematics and Science Partnership
NAC Nevada Administrative CodeNACS Nevada Academic Content StandardsNCCAT-S Nevada Comprehensive Curriculum
Audit Tool for SchoolsNCET Nevada Commission on Educational TechnologyNCLB No Child Left Behind ActNDE Nevada Department of EducationNeCoTIP Nevada Collaborative Teacher Improvement
ProgramNERC Nevada Equal Rights CommissionNIAA Nevada Interscholastic Activities AssociationNGA National Governors AssociationNHSPE Nevada High School Proficiency ExamN-PEMSTL Nevada Partnership for Effective
Mathematics and Science Teaching and LearningNPI National Purchasing InstituteNRS Nevada Revised StatutesNS Network ServicesNSC Nevada State CollegeNSF National Science FoundationNSHE Nevada System of Higher EducationNSPF Nevada School Performance Framework
OIM Occupational Injury ManagementOM Organizational Management
PACE Preschool Achievement Centers of ExcellencePACT Prevention Advocacy Choices TeamworkPASS Promoting Academic Success in StudentsPAYBAC Professionals and Youth Building a CommittmentPBS Public Broadcasting ServicePC Personal ComputerPD Professional DevelopmentPDAE Professional Development for Arts EducationPDSMT- SLIP
Professional Development of Science and Mathematics Teachers through Systematic Integration of Literacy Practices
PERS Public Employees’ Retirement SystemPL Public LawP-L Property-LiabilityPLC Professional Learning CommunityPSI Pathway to STEM InitiativePSM Public Service MediaPTFP Public Telecommunications Facilities Program
RAVE Recognizing a Valued EmployeeREMS Readiness and Emergency
Management for SchoolsRES Replacement Elementary SchoolRFP Request for ProposalRHS Replacement High SchoolRMIS Risk Management Information SystemRMS Replacement Middle SchoolRPC Request for Parent Conference

220 | Clark County School District
RSI Research and School ImprovementRSIA Refugee School Impact Aid GrantRTI Response to Instruction
SAGE Student Achievement Gap EliminationSAIN System for Acountability Information in NevadaSAP System Applications and Products -
Enterprise Resource PlanningSAPTA Substance Abuse Prevention and
Treatment AgencySASI Schools Administrative
Student Information SoftwareSBAC Smarter Balanced Assessment ConsortiumSBHC School Based Health CenterSBP School Breakfast ProgramSEMS Special Education Management SystemSETF State Educational Technology
Implementation FundsSIG School Improvement GrantSIP School Improvement PlansSMART Statewide Management of
Automated Records TransferSMMEP Secondary Mariachi Music Education ProgramSNEC Sewell Neighborhood Education CenterSNST School Nurse Strike TeamsSOP Standard Operating ProceduresSOS Secure Our SchoolsSPA Strategic Planning AreaSPDIG Special Education District Improvement GrantSPF School Performance FrameworkSPTA Specialized Programs Teacher AssistantSRCL Striving Readers Comprehensive LiteracySRLE Safe and Respectful Learning EnvironmentSRTS Safe Routes to SchoolSS Special School
This glossary contains definitions of selected terms used in this document and additional terms and interpretative data as necessary for common understanding concerning financial accounting procedures of the District. Several terms which are not primarily financial accounting terms have been included because of their significance for the budgeting process. The glossary is arranged alphabetically with appropriate cross-referencing where necessary.
Accounting System - The recording and reporting of activities and events affecting the funding of an administrative unit and its programs. Specifically, it describes: (1) what accounting records are to be maintained, how they will be maintained, and the procedures, methods, and forms to be used; (2) data recording, classifying, and summarizing activities or events; (3) analyzing and interpreting recorded data; and (4) preparing and initiating reports and statements which reflect conditions as of a given date, the results of operations for a specific period, and the evaluation of status and results of operation in terms of established objectives.
Glossary of Terms
Accrual Basis - The basis of accounting under which revenues are recorded, when levies are made, and expenditures are recorded as soon as they result in liabilities, regardless of when the revenue is actually received or the payment is actually made. See also REVENUE and EXPENDITURES.
Accrue - To record revenues when earned or when levies are made and to record expenditures as soon as they result in liabilities, regardless of when the revenue is actually received or payment is made. Sometimes the term is used in a restricted sense to denote the recording of revenues earned but not yet due, such as accrued interest on investments, and the recording of expenditures which result in liabilities that are payable in another accounting period, such as accrued interest on bonds. See also ACCRUAL BASIS.
Administration - Those activities which have as their purpose the general regulation, direction, and control of the affairs of the local education agency.
SSSD Student Support Services DivisionSTAR ON Schools Targeting Alternate Reform On-SiteSTEM Science, Technology, Engineering, and MathematicsSTEP Success through English ProgramSWOT Students Working Over-TimeSUI State Unemployment Insurance
TAG Targeted Assistance GrantTAH Teaching American HistoryTBD To Be DeterminedTF Transportation FacilityTISS Technology and Information
Systems Services DivisionTNTP The New Teacher Project
UASI Urban Areas Security InitiativeUNLV University of Nevada, Las VegasUNR University of Nevada, RenoUSS User Support Services
VHS Vocational High School
VISIONS Venture Into Scientific Inquiry Organized around Nevada Standards
VoIP Voice over IP (Internet Protocol)VTC Video Conference Support
WAN Wide Area NetworkWIA Workforce Investment ActWiFi Wireless FidelityWIDA World-Class Instructional Design and Assessment
YOP Youthful Offender Program

Info
rmat
iona
l Sec
tion
2212014-15 Comprehensive Annual Budget Report |
Ad Valorem Taxes - Taxes levied on the assessed valuation (35% of the taxable value less exemptions) of secured (real property – land and improvements thereon, and other personal property – house furnishings) and unsecured properties (personal – mobile homes, airplanes, boats, and slide-in-campers). See ASSESSED VALUATION.
Appropriation - An authorization granted by a legislative body to make expenditures and to incur obligations for specific purposes. Note: An appropriation is usually limited in amount and as to the time when it may be expended.
Appropriation Account - A budgetary account set up to record specific authorizations to spend. The account is credited with an original and any supplemental appropriations and is charged with expenditures and encumbrances.
Assessed Valuation - A valuation set upon real estate or other property by a government as a basis for levying taxes – 35% of market value.
Autism - Autism means a developmental disability significantly affecting verbal and nonverbal communication and social interaction, generally evident before age 3, that adversely affects a child’s educational performance. The term does not apply if a child’s educational performance is adversely affected primarily because the child has an emotional disturbance. Other characteristics often associated with autism are engagement in repetitive activities and stereotyped movements, resistance to environmental change or change in daily routines, and unusual responses to sensory experiences.
Average Daily Attendance (ADA) -Average daily attendance for each school is the aggregate days attendance of that school divided by the number of days school was actually in session. Only days in which the pupils were under the guidance and direction of teachers in the teaching process are to be considered as days in session.
Average Daily Membership (ADM) - Each month of the school year, an attendance figure is established based upon the number of students enrolled in the District. ADM is the average of all nine months that school is held.
Balance Sheet - A summarized statement, as of a given date, of the financial position of a local education agency per fund and/or all funds combined showing assets, liabilities, reserves, and fund balance.
Board of School Trustees - The elected or appointed body which has been created according to Nevada State law and vested with the responsibilities for educational activities in a given geographical area.
Bond - A written promise, generally under seal, to pay a specified sum of money, called the face value, at a fixed time in the future, called the date of maturity, and carrying interest at a fixed rate, usually payable periodically. The difference between a note and a bond is that the latter usually runs for a longer period of time and requires a greater legal formality.
Bonded Debt - The part of the District’s debt which is covered by outstanding bonds and sometimes referred to as “Funded Debt.”
Bonds Payable - The face value of bonds issued and unpaid.
Budget - A plan of financial operation embodying an estimate of proposed expenditures for a given period or purpose and the proposed means of financing them. The budget usually consists of three parts. The first part contains a message from the budget-making authority together with a summary of the proposed expenditures and the means of financing them. The second part is composed of drafts of the appropriations, revenues, and borrowing measures necessary to put the budget into effect. The third part consists of schedules supporting the summary. These schedules show in detail the proposed expenditures and means of financing them, together with information as to past years’ actual revenues and expenditures and other data used in making the estimates.
Budget, Amended Final - The finalized budget that has been adopted by the Board reflecting changes to the Final Budget previously approved and filed prior to January 1 with the Nevada Department of Taxation.
Budget Calendar - The schedule of key dates used in the preparation and adoption of the Final Budget.
Budget Document - The instrument used as a comprehensive financial plan of operations by the Board and administration.
Budget, Final - The budget that has been adopted by the Board and approved by the Nevada Department of Taxation prior to commencement of the new fiscal year.
Budget Overview - The opening section of the budget which provides the Board and public with a general summary of the most important aspects of the proposed budget and recommendations from the Superintendent.
Budget, Tentative - The budget that is initially prepared, published, and recorded by the District for the new fiscal year prior to its approval by the Nevada Department of Taxation.
Budgetary Control - The control or management of the business affairs of the District in accordance with an approved budget with a responsibility to contain expenditures within the authorized amounts.
Buildings - A fixed asset account which reflects the acquisition value of permanent structures used to house persons and property owned by the local education agency. If buildings are purchased or constructed, this account includes the purchase or contract price of all permanent buildings and fixtures attached to and forming a permanent part of such buildings. If buildings are acquired by gift, the account reflects their appraised value at time of acquisition.
Capital Budget - A plan of proposed capital outlays and the means of financing them, and is usually a part of the current budget. If a Capital Program is in operation, it will be the first year thereof. A Capital Program is sometimes referred to as a Capital Budget. See also CAPITAL PROGRAM.
Capital Outlays - Expenditures which result in the acquisition of or addition to fixed assets.
Capital Expenditure - Represents an outlay from resources used exclusively for acquiring and improving district sites or the constructing and equipping of new district facilities that will have an anticipated useful life of more than one year.

222 | Clark County School District
Capital Program - A plan for capital expenditures to be incurred each year over a fixed period of years to meet capital needs arising from the long-term work program or otherwise. It sets forth each project or other contemplated expenditure in which the local education agency is to have a part and specifies the full resources estimated to be available to finance the projected expenditures.
Cash Accounting - A basis of accounting in which transactions are recorded when cash is either received or expended.
Chart of Accounts - A list of accounts systematically arranged, applicable to a specific concern, giving account names and numbers, if any. A chart of accounts, accompanied by descriptions of their use and the general operation of the books of account, becomes a classification or manual of accounts.
Coding - A system of numbering or otherwise designating, accounts, entries, invoices, vouchers, etc., in such a manner that the symbol used quickly reveals certain required information.
Contract Services - Labor, material, and other costs for services rendered by personnel who are not on the payroll of the District.
Cost Per Pupil - Financial data (either budget or expenditures) for a given period of time divided by a pupil unit of measure (average daily membership, average daily attendance, etc.).
Debt - An obligation resulting from the borrowing of money or from the purchase of goods and services. Debts of local education agencies include bonds, warrants, notes, etc.
Debt Limit - The maximum amount of gross or net debt which is legally permitted.
Debt Service Fund - A fund established to account for the accumulation of resources for, and the payment of, long-term debt principal and interest.
Deaf-blindness - Deaf-blindness means concomitant hearing and visual impairments, the combination of which causes such severe communication and other developmental and educational needs that they cannot be accommodated in special education programs.
Delinquent Taxes - Taxes that remain unpaid on or after the date on which a penalty for non-payment is attached.
Disabled Student - A student that meets federal guidelines as mentally challenged, hearing impaired, speech or language impaired, seriously emotionally handicapped, physically challenged, autistic, traumatic brain injured, multiply handicapped, learning disabled, developmentally delayed, or visually handicapped.
Disbursement - Payments made for goods and services.
Donations (Private Source) - Money received from a philanthropic foundation, private individuals, or private organizations for which no repayment or special service to the contractor is expected. Separate accounts may be maintained.
Edison Schools - The seven schools in the District which are currently managed by Edison Schools Inc., the nation’s largest private manager of public schools.
Elementary Schools - A school classified as elementary by state and local statutes or practice and typically composed of kindergarten through grades five or six.
Emotional Disturbance - This term means a condition that can exhibit one or more of the following characteristics over a long period of time and to a marked degree that adversely affects a child’s educational performance:
• An inability to learn that cannot be explained by intellectual, sensory, or health factors
• An inability to build or maintain satisfactory interpersonal relationships with peers and teachers
• Inappropriate types of behavior or feelings under normal circumstances
• A general pervasive mood of unhappiness or depression
• A tendency to develop physical symptoms or fears associated with personal or school problems
Employee Fringe Benefits - Amounts paid by the District on behalf of employees. These amounts are not included in the gross salary, but are over and above. Such payments are, in a sense, overhead payments. They are fringe benefit payments, and while not paid directly to employees, are part of the cost of salaries and benefits. Examples are: (a) group health or life insurance, (b) contribution to employee retirement, (c) medicare, (d) Workers’ Compensation, and (e) unemployment insurance.
Encumbrances - Purchase orders, contracts, and/or other commitments which are chargeable to an appropriation and for which a part of the appropriation is reserved. Encumbrances cease to exist when paid (as in accounts payable) or when the actual liability is established, or when canceled.
Encumbrance Accounting - A system or procedure which involves giving recognition in the accounting budgetary expenditure control records for the issuance of purchase orders, statements, or other commitments chargeable to an appropriation in advance of any liability or payment.
Enterprise Resource Planning (ERP) - Enterprise Resource Planning is an integrated system of software applications that rely on a database supporting financial and non-financial areas of an organization through “best business practices” and process reengineering.
Equipment - Those moveable items used for school operations that are of a non-expendable and mechanical nature and perform a specific operation. Typewriters, projectors, computers, lathes, machinery, vehicles, etc. are classified as equipment. (Heating and air conditioning systems, lighting fixtures and similar items permanently fixed to or within a building are considered part of the building.)
Estimated Revenues -When the accounts are kept on an accrual basis, this term designates the amount of revenues estimated to accrue during a given period, regardless of whether or not it is all to be collected during the period.
Expenditures - This includes total charges incurred, whether paid or unpaid, for current expense, capital outlay, and debt service.

Info
rmat
iona
l Sec
tion
2232014-15 Comprehensive Annual Budget Report |
Federal Revenues - Revenues provided by the federal government. Expenditures made using these revenues are identifiable as federally-supported expenditures.
Fiscal Period - Any period at the end of which a local education agency determines its financial position and the results of its operations. The period may be a month, a quarter, or a year, depending upon the scope of operations and requirements for managerial control and reporting.
Fiscal Year - A twelve-month period of time to which the annual budget applies and at the end of which a local education agency determines its financial position and the results of its operations. The District’s fiscal year runs from July 1 through June 30.
Fixed Assets - Land, buildings, machinery, furniture, and other equipment which the District intends to hold or continue in use over a long period of time. “Fixed” denotes probability or intent to continue use or possession and does not indicate immobility of an asset.
Full Time Equivalent-Employee (FTE) - The amount of employed time required in a part-time position expressed in proportion to that required in a full-time position, with 1.000 representing one full-time position. It is derived by dividing the amount of employed time in the part-time position by the amount of employed time required in a corresponding full-time position.
Function - As applied to expenditures, this term references the accumulation of costs associated with a type of service or activity such as Instruction, School Administration, Plant Maintenance, and Operation. The District adheres to Nevada Revised Statutes for the coding of all expenditures. This coding is consistent nationally and enables comparisons of expenditure categories of districts throughout the nation. The following functions are grouped by category as reflected in the Nevada School Accountability Reports.
Fund - A fiscal and accounting entity which is comprised of a self-balancing set of accounts which reflect all assets, liabilities, equity, revenues and expenditures (or expenses) necessary to disclose financial position and the results of operations. Funds are established as individual entities in order to segregate financial records for purposes of legal compliance, different natures of the activities performed, measurement of different objectives, and to facilitate management control.
Fund Balance - The excess of assets of a fund over its liabilities and reserves. During the fiscal year prior to closing, it represents the excess of the fund’s assets and estimated revenues for the period over its liabilities, reserves, and appropriations for the period.
Fund, Capital Projects - Used to account for all resources used for acquiring capital sites, buildings, and equipment as specified by the related bond issue. Capital project funds are designated to account for acquisition or construction of capital outlay assets which are not acquired directly by the general fund, special revenue funds, or enterprise funds. Capital project funds have been developed to account for the proceeds of a specific bond issue and revenue from other possible sources which are designated for capital outlay (i.e.) for land, buildings, and equipment.
Fund, Debt Service - Used to finance and account for payment of principal and interest on all long-term general obligation debts. Debt service funds are used to accumulate resources over the outstanding life of the bond issue in an amount equal to the maturity value. Cash of the debt service may be invested in income-producing securities which are converted back into cash at the maturity date for use in retiring bonds.
Fund, District Projects - A fund used to account for the proceeds of specific revenue sources (other than special assessments, expendable trusts, or for major capital projects) that are legally restricted to expenditures for specific purposes.
Fund, Enterprise - Used to finance and account for the acquisition, operations, and maintenance of District facilities and services which are entirely or predominantly self-supportive by user charges. Budgetary accounts and formal budgetary accounting are recommended for Enterprise Funds. The accounting consists primarily of proper recording of receipts and disbursements. The District uses its Food Services Fund in this manner.
Fund, Expendable Trust - Used to account for assets held in trust by the District for individuals, government entities, or nonpublic organizations. A Trust Fund is usually in existence over a longer period of time than an Agency Fund. Primarily, Agency Funds function as a clearing mechanism for cash resources collected by the District held for a short period, and then disbursed to authorized recipients.
Fund, Federal Projects - Used to account for federally assisted grant programs that supplement the District in areas of special needs, basic skills, students at risk, staff development, and other innovative activities.
Fund, General - The fund used to finance the ordinary operations of the District. It is available for a legally authorized purpose and consists of funds not specifically designated for some other particular purpose.
Fund, Internal Service - A fund established to finance and account for services and commodities furnished by a designated department or agency to other departments or agencies within a single government unit. Amounts expended by the fund are restored thereto either from operations or by a transfer from other funds to keep intact the original fund’s capital. Graphic Production and Risk Management are included in this fund.
Fund, Proprietary - Operations that focus on the determination of operating income, changes in net assets, financial position, and cash flows. There are two different types of proprietary funds: enterprise funds and internal service funds.
Fund, Special Revenue - For accountability purposes, this fund is split between Federal Projects and District Projects. For further definition, see these funds also included in the glossary.
Governmental Accounting Standards Board (GASB) - The ultimate authoritative accounting and financial reporting standard-setting body for state and local governments.

224 | Clark County School District
Gifted and Talented (GATE) - Students with superior academic achievement may be identified as gifted and talented and may participate in designated programs for gifted students. The identification of gifted and talented students begins at grade 2 through grade 6.
Grant - Contributions of either funds or material goods given by a contributing unit (public or private) to another receiving unit and for which the contributing unit expects no repayment. Grants may be for specific or general purposes.
Hearing Impairment - Hearing impairment means impairment in hearing, whether permanent or fluctuating, that adversely affects a child’s educational performance but that is not included under the definition of deafness.
High School - Schools classified as high school by state and local statutes and typically composed of grades nine through twelve.
Instruction - Direct interaction between students and classroom teachers, paraprofessionals, and/or related staff involving teaching students in a teaching/learning environment in a systematic program designed to assist students in acquiring competency in knowledge, skills, and understanding.
Instructional Materials-Supplies - An object of expenditure related to amounts paid for the acquisition of devices, content materials, methods or experiences used for teaching and learning purposes. These include printed and non-printed sensory materials.
Inter-Fund Transfers - Amounts transferred from one fund to another fund.
Invoice - An itemized statement of merchandise shipped or sent to a purchaser, consignee, etc., with the quantity, value or prices, and charges annexed.
Line-Item Budget - A detailed expense or expenditure budget generally classified by object designation with each organizational unit.
Kindergarten - A group or class that is organized to provide educational experience for children for the year immediately preceding the first grade and conducted during the regular school year.
Land - A fixed asset account which reflects the acquisition value of sites owned by the District. If land is purchased, this account includes the purchase price and other associated improvement costs which are incurred to put the land in condition for its intended use. If land is acquired by gift, the account reflects its appraised value at time of acquisition.
Long-Term Debt - Debt with a maturity of more than one year after the date of issuance.
Maintenance of Plant (Plant Repairs; Repair and Replacement of Equipment) - Those activities which are concerned with keeping the grounds, buildings, and equipment at their original condition of completeness or efficiency, either through repairs or by replacements of property (anything less than replacement of a total building).
Medicaid Administrative Claiming - Medicaid Administrative Claiming is a federal program that reimburses districts for employees’ time to promote the availability of Medicaid-covered health services and to improve students’ access to those services.
Mental Retardation - Mental retardation means significantly subaverage general intellectual functioning and existing behavior manifested during the developmental period, which adversely affects a child’s educational performance.
Middle School - Schools classified as middle school by state and local statutes or practices and composed of grades six through eight.
Modified Accrual Basis of Accounting - Basis of accounting whereby revenues are recorded when they are measurable and available and expenditures are recorded when the corresponding liability is incurred. This is the basis of accounting used in the fund financial statements of the Comprehensive Annual Financial Report (CAFR).
Multiple Disabilities - Multiple disabilities means concomitant impairments (such as mental retardation-blindness, mental retardation-orthopedic impairment, etc.), the combination of which causes such severe educational needs that they cannot be accommodated in special education programs solely for one of the impairments. The term does not include deaf-blindness.
Object - An accounting term used to describe the service or commodity obtained as a result of a specific expenditure or to describe a specific revenue source.
Orthopedic Impairment - Orthopedic impairment means a severe orthopedic impairment that adversely affects a child’s educational performance. The term includes impairments caused by congenital anomaly, impairments caused by disease, and impairments from other causes.
Other Health Impairment -Other health impairment means having limited strength, vitality or alertness, including a heightened alertness to environmental stimuli, that results in limited alertness with respect to the educational environment, that is due to chronic or acute health problems such as asthma, attention deficit disorder or attention deficit hyperactivity disorder, diabetes, epilepsy, a heart condition, hemophilia, lead poisoning, leukemia, nephritis, rheumatic fever, and sickle cell anemia; and adversely affects a child’s educational performance.
Payroll Costs - All costs covered under the following objects of expenditure: Licensed Salaries, Unified Salaries, Support Staff Salaries, Police Salaries, and Employee Benefits.
Per Pupil Allocation - An allocation to each school for supplies and equipment initially based on the pupil enrollment on the last day of the first school month.
Per Pupil Expenditure - An accepted and commonly used norm to initially compare expenditures between school districts, as well as at state and national levels of spending.

Info
rmat
iona
l Sec
tion
2252014-15 Comprehensive Annual Budget Report |
Personnel, Administrative (Unified) - Personnel on the payroll who are primarily engaged in activities which have as their purpose the general regulation, direction, and control of the affairs of the District that are systemwide and not confined to one school, subject, or narrow phase of school activity; for example, the Superintendent of Schools.
Personnel, Licensed - Those who are certified by the Nevada Department of Education and render services dealing directly with the instruction and delivery of certain services to pupils. (Some examples are teachers, librarians, nurses, and psychologists.)
Personnel, Support Staff - Non-administrative positions hired to support school and central office functions. (Some examples are teacher aides, clerical positions, custodians, food service worker and assistant accountants.)
Program - The definition of an effort to accomplish a specific objective or objectives consistent with funds or resources available. Budgets and actual revenue and expenditure records may be maintained per program.
District programs are as follows: 0100 Regular Instruction-Elementary/Secondary 0200 Special Education 0270 Gifted and Talented Programs 0300 Vocational and Technical 0400 Other Instructional-Elementary/Secondary 0420 English Language Learners 0430 Alternative Education 0440 Summer School 0600 Adult/Continuing Education 0800 Community Services 0910 Co-Curricular Activities 0920 Athletics 1000 Undistributed Expenditures
Property Insurance - Expenditures for all forms of insurance covering the loss of, or damage to, the property of the District from fire, theft, storm, or any other cause. Costs for appraisals of property for insurance purposes are also recorded here.
Pupil Transportation Services - Consists of those activities involved with the conveyance of pupils to and from student activities, as provided by state law. Includes trips between home and school or trips to school activities. This service area is applicable to both schools and the District.
Purchase Order - Document which authorized the delivery of specified merchandise or the rendering of certain services and the making of a charge for them.
Purchased Services - Personal services rendered by personnel who are not on the payroll of the District and other services which may be purchased.
R*STARS - Acronym for Relational Standard Accounting and Reporting System which was the District’s financial accounting software package and is now replaced with the Enterprise Resource Planning software applications.
Reimbursement - Cash or other assets received as a repayment of the cost of work or services performed, or of other expenditures made for or on behalf of another governmental unit or department, or for an individual, firm, or corporation.
Rentals - Expenditures for the lease or rental of land, buildings, and equipment for the temporary or long-range use of the District.
Reserve - An account used to indicate that a portion of fund balance is restricted for a specific purpose.
Reserve For Encumbrances - A reserve representing the designations of a portion of a fund balance to provide for unliquidated encumbrances. Separate accounts may be maintained for current and prior-year encumbrances.
Revenues - Additions to the assets of a fund during a fiscal period that are available to finance the fund’s expenditures during the fiscal year.
Salaries - Total expenditures for hourly, daily, and monthly salaries including overtime pay and sick pay.
Sale of Assets - The receipts from the sale of scrap materials as well as worn-out or obsolete equipment that has been declared surplus to the needs of the District.
School - A division of the school system consisting of a group of pupils, one or more teachers giving instruction of a defined type, housed in a school plant of one or more buildings.
School Plant - The site, buildings, and equipment constituting the physical facilities used by a single school or by two or more schools sharing the use of common facilities.
School Site - The land and all improvements to the site, other than structures, such as grading, drainage, drives, parking areas, walks, planting, play courts, and playfields.
Source of Funds - This dimension identifies the expenditure with the source of revenue, (i.e.) local, state, federal, and others.
Special Education - Consists of direct instructional activities designed to deal with some of the following pupil exceptionalities: learning disabled, physically challenged, hearing impaired, and gifted and talented.
Specific Learning Disability - The term means a disorder in one or more of the basic psychological processes involved in understanding or in using language, spoken or written, that may manifest itself in an imperfect ability to listen, think, speak, read, write, spell, or to do mathematical calculations, including conditions such as perceptual disabilities, brain injury, minimal brain dysfunction, dyslexia, and developmental aphasia.
Speech or Language Impairment - This term means a communication disorder, such as stuttering, impaired articulation, language impairment, or voice impairment, that adversely affects a child’s educational performance.

226 | Clark County School District
Supplies - Expenditures for material items of an expendable nature that are consumed, worn-out, or deteriorated by use or items that lose their identity through fabrication or incorporation into different or more complex units or substances.
Taxes - Compulsory charges levied by a governmental unit for the purpose of financing services performed for the common benefit.
Teacher Allocation - The teachers are allocated to the schools on the basis of the last day of the first school month’s enrollment.
Traumatic Brain Injury - This is an acquired injury to the brain caused by an external physical force, resulting in total or partial functional disability or psychosocial impairment, or both, that adversely affects a child’s educational performance. The term applies to open or closed head injuries resulting in impairments in one or more areas, such as cognition; language; memory; attention; reasoning; abstract thinking; judgment; problem-solving; sensory, perceptual, and motor abilities; psychosocial behavior; physical functions; information processing; and speech. The term does not apply to brain injures that are congenital or degenerative, or to brain injuries induced by birth trauma.
Travel - An object of expenditure associated with carrying staff personnel from place to place and the furnishing of accommodations incidental to travel. Also included are per diem allowances, mileage allowances for use of privately owned vehicles, and other expenditures necessitated by travel.
Tuition Expended - Expenditures to reimburse other educational agencies for services rendered to students residing in the legal boundaries described for the paying local education agencies, both within and outside of the state of the paying local education agency.
Tuition Received - Money received from pupils, their parents, governmental agencies, or others for education provided in the schools of the District.
Visual Impairment Including Blindness - This means impairment in vision that, even with correction, adversely affects a child’s educational performance. The term includes both partial sight and blindness.
Vocational Program - A school which is separately organized for the primary purpose of offering education and training in one or more semi-skilled, skilled, or technical occupations.
Weighted Enrollment - Used to determine the total basic support provided to the District from the state. To obtain a weighted enrollment, pre-kindergarten and kindergarten students are included as six-tenths of a student rather than a whole student. Also, students from other states enrolled in Nevada are deducted from the enrollment numbers.


Superintendent of SchoolsPat Skorkowski
5100 West Sahara AvenueLas Vegas, NV 89146
Telephone (702) 799-5000
www.ccsd.net
Board of School Trustees
PresidentErin E. Cranor
Vice PresidentDr. Linda Young
ClerkPatrice Tew
MembersStavan Corbett
Carolyn EdwardsChris Garvey
Deanna L. Wright


![[5]S4 Clark olmec](https://static.fdokumen.com/doc/165x107/631a7d74bb40f9952b020797/5s4-clark-olmec.jpg)