
Runoff modeling of the wadi systems for estimating flash flood and groundwater recharge potential in...
17
ORIGINAL PAPER Runoff modeling of the wadi systems for estimating flash flood and groundwater recharge potential in Southern Sinai, Egypt Alaa A. Masoud Received: 31 March 2009 / Accepted: 3 September 2009 / Published online: 25 September 2009 # Saudi Society for Geosciences 2009 Abstract Evaluating the likelihood of a flash flood as well as flood water resource is vital for establishing properly sustainable developments in arid environments. However, the high degree of spatial and temporal variability in hydrometeorological processes and the general lack of suitable data limit these efforts. In the present work, a runoff model, adopting the simple Soil Conservation Service method, was built for 13 ungauged catchments in Southern Sinai, Egypt. Runoff modeling was conducted as a function of the descriptive parameters of the catchments, and the maximum average rainfall occurred in 1 day in the period 1960–1990, designed according to a storm event recorded at the outlet of one of the studied catchments on the 2nd of November 1994. The catchments’ descriptive parameters were extracted from available remote sensing data and field investigations. Land covers including road networks and 83 rock-soil types were also extracted from the maximum likelihood classification of the Landsat-7 ETM+ imagery. The catchments were then subdivided into 103 smaller subcatchments, which were then placed into different terrain types according to hydrologically relevant surface characteristics. Hydrologic characteristics and soil type(s) in the subcatchments were estimated during on-site visits. Morphometric parameters of the wadi catchments and the channel networks were derived from the analysis of the SRTM3 digital elevation model (DEM). Hydrographs were drawn and routed to the main catchment outlets based on appropriate wadi dimensions and roughness using the Muskingum’s method. The runoff and infiltration volumes were quantified. The resulting models have been used to investigate the relative potential for flooding and the groundwater recharge in the catchments. Further, in order to determine specific sites with a high potential for flood risk and groundwater recharge, decision-ruled integrated analysis of the generated GIS layers describing relative stream power and wetness indices were applied. Due to the lack of flow data, the results of the hydrological models were validated against the DEM-derived relative stream power and the wetness indices as well as against field checks and available reports as an alternative. The results of this study could help to prioritize areas where flood control measures should be directed, as well as effectively augment management plans for the appropriate development of water resources. Keywords SCS runoff modeling . Relative stream power . Wadi systems . Southern Sinai Peninsula . Egypt Introduction In arid regions the world over, flash floods are a major cause of loss in infrastructure, property, and human life. Despite this, under ideal circumstances, flood water could be used to constitute a considerable amount of a region’s water resources, and also be utilized to fulfill part of the increasing water demand in areas prone to flooding that are currently experiencing high population growth and eco- nomic development. This is especially true in the case of the wadi systems in the Southern Sinai Peninsula of Egypt, where flash floods have become an unfortunate annual occurrence. Due to the difficulties in acquiring runoff data and the extensive spatial and temporal variability of the rainfall, there is a general lack of hydrometeorological data that makes runoff less predictable and rainfall–runoff A. A. Masoud (*) Geology Department, Faculty of Science, Tanta University, Tanta 31527, Egypt e-mail: [email protected] Arab J Geosci (2011) 4:785–801 DOI 10.1007/s12517-009-0090-9
-
Upload
independent -
Category
Documents
-
view
5 -
download
0
Transcript of Runoff modeling of the wadi systems for estimating flash flood and groundwater recharge potential in...

ORIGINAL PAPER
Runoff modeling of the wadi systems for estimating flashflood and groundwater recharge potential in SouthernSinai, Egypt
Alaa A. Masoud
Received: 31 March 2009 /Accepted: 3 September 2009 /Published online: 25 September 2009# Saudi Society for Geosciences 2009
Abstract Evaluating the likelihood of a flash flood as wellas flood water resource is vital for establishing properlysustainable developments in arid environments. However,the high degree of spatial and temporal variability inhydrometeorological processes and the general lack ofsuitable data limit these efforts. In the present work, arunoff model, adopting the simple Soil ConservationService method, was built for 13 ungauged catchments inSouthern Sinai, Egypt. Runoff modeling was conducted asa function of the descriptive parameters of the catchments,and the maximum average rainfall occurred in 1 day in theperiod 1960–1990, designed according to a storm eventrecorded at the outlet of one of the studied catchments onthe 2nd of November 1994. The catchments’ descriptiveparameters were extracted from available remote sensingdata and field investigations. Land covers including roadnetworks and 83 rock-soil types were also extracted fromthe maximum likelihood classification of the Landsat-7ETM+ imagery. The catchments were then subdivided into103 smaller subcatchments, which were then placed intodifferent terrain types according to hydrologically relevantsurface characteristics. Hydrologic characteristics and soiltype(s) in the subcatchments were estimated during on-sitevisits. Morphometric parameters of the wadi catchmentsand the channel networks were derived from the analysis ofthe SRTM3 digital elevation model (DEM). Hydrographswere drawn and routed to the main catchment outlets basedon appropriate wadi dimensions and roughness using theMuskingum’s method. The runoff and infiltration volumeswere quantified. The resulting models have been used to
investigate the relative potential for flooding and thegroundwater recharge in the catchments. Further, in orderto determine specific sites with a high potential for floodrisk and groundwater recharge, decision-ruled integratedanalysis of the generated GIS layers describing relativestream power and wetness indices were applied. Due to thelack of flow data, the results of the hydrological modelswere validated against the DEM-derived relative streampower and the wetness indices as well as against fieldchecks and available reports as an alternative. The results ofthis study could help to prioritize areas where flood controlmeasures should be directed, as well as effectively augmentmanagement plans for the appropriate development ofwater resources.
Keywords SCS runoff modeling . Relative stream power .
Wadi systems . Southern Sinai Peninsula . Egypt
Introduction
In arid regions the world over, flash floods are a majorcause of loss in infrastructure, property, and human life.Despite this, under ideal circumstances, flood water couldbe used to constitute a considerable amount of a region’swater resources, and also be utilized to fulfill part of theincreasing water demand in areas prone to flooding that arecurrently experiencing high population growth and eco-nomic development. This is especially true in the case ofthe wadi systems in the Southern Sinai Peninsula of Egypt,where flash floods have become an unfortunate annualoccurrence. Due to the difficulties in acquiring runoff dataand the extensive spatial and temporal variability of therainfall, there is a general lack of hydrometeorological datathat makes runoff less predictable and rainfall–runoff
A. A. Masoud (*)Geology Department, Faculty of Science, Tanta University,Tanta 31527, Egypte-mail: [email protected]
Arab J Geosci (2011) 4:785–801DOI 10.1007/s12517-009-0090-9

processes more difficult to analyze. In addition to the harshclimate, the wadi reaches are located far away fromsettlements, becoming muddy and inaccessible after flood-ing due to the absence of vegetation. Also, flood watercarries a large amount of sediments, which typicallydamage measuring devices. However, this water is essentialto communities and sustains tourism-based enterprises inthe area. Despite this, very little attention has been directedat understanding the dynamics of the runoff processcharacteristic of such wadi systems. In the absence of flowdata, runoff modeling could be a promising approach toenhance the livability of the area and any surroundinglandscape with similar physiographic conditions (Foody etal. 2004; Gheith and Sultan 2002).
For the purpose of predicting hydrologic responses inungauged catchments in arid areas, the Soil ConservationService curve number models (SCS 1972) are widely used.These models require a reduced number of terrain param-eters that are extractable from Geographic InformationSystem (GIS) layers, which can then be verified during on-site visits. Such models rely greatly on expert knowledge torelate observable physical catchment descriptions to thedynamic hydrologic response during a storm event (Seftonand Howarth 1998; Littlewood 2002; Kokkonen et al.2003). SCS models are considered to serve as well as, oreven better than, more complex models in terms ofpredicting rainfall–runoff in gauged and ungauged catch-ments (e.g., Michaud and Sorooshian 1994; Wagener et al.2004). In the US, SCS models were widely applied onmany ephemeral catchments (Hickok et al. 1959; Gray1961; Headman 1970). Murphey et al. (1977) drawrelationships between hydrograph time to peak, duration,mean peak discharge, volume, peak–volume ratio, andbasin parameters such as area, shape, slope, drainagedensity, and basin relief, as well as a combination of theseparameters. The structure of the hydrologic response isfound to be intimately linked to the geomorphologicparameters of the catchment (Valdes et al. 1979; Sharmaand Murthy 1995). The input parameters and the models ofthe ungauged catchments are commonly derived fromextrapolation of (or interpolation between) verified dataand models of the nearby gauged catchments, where thedegree of hydrological similarity between catchmentsdictates the degree of similarity between their input dataand the built models. Model calibration and validation isanother difficult and a crucial issue, and these should betailored to the objectives of the study and for the types ofapplications for which it is intended (Schlesinger et al.1979; Klemeš 1986; Beven 1996; Refsgaard 1997; Duan etal. 2003; Ajami et al. 2004; Moussa et al. 2007). In theEastern Desert of Egypt, the synthetic SCS runoff modelwas successfully applied on unguaged catchments forestimating wadi runoff and groundwater recharge (Gheith
and Sultan 2002), as well as for predicting locationssensitive to flash flooding (Foody et al. 2004). Gheith andSultan (2002) extrapolated the spatially distributed precip-itation with respect to topographic elevation from weatherstations located on the Nile Valley and the coast of the Gulfof Suez and the Red Sea. Due to the absence of realdischarge data, Gheith and Sultan (2002) based their modelvalidation on field observations. Foody et al. (2004)assumed a rainfall event of 30 mm/h with a duration of2 h to build their models and used the road damageobservations to validate their models.
In the present research, hydrologic responses of the 13largest ungauged catchments in the Southern Sinai Penin-sula were predicted using the SCS models. The primeobjective is to highlight the maximum possible flash floodand groundwater recharge potentials of the catchments, aswell as demarcate flood risk-prone sections of roadnetworks and sites with possibly high groundwater rechargepotential integrating several GIS layers. Since the aim is toassess the relative potential of the catchments to flood risksand groundwater recharge and since model parameters werederived either directly from field data or indirectly throughexperiences from values in similar catchments, the inter-preted results of the final models were only validatedagainst topographic indices derived from the DEM as wellas against field observations and the available flash floodreports as an alternative.
Study area
The study area spans across 21,400 km2 of the SouthernSinai Peninsula (Fig. 1). Its climate, physiography, geo-morphology, and lithostructural characteristics are stronglyinterrelated and have a great bearing on the catchmentdrainage and groundwater potential. The landscape is anatural desert with scant natural vegetation located in theMediterranean arid zone. The coldest month is Decemberwith occasional freezing (low temperatures of −4°C) inJanuary at the summit of Saint Catherine Mountain(2,641 m asl). The period between June and August is thewarmest of the year, with temperatures as high as 45°C.The temperature is affected by the altitude and proximity tothe sea. Rainfall is highly irregular (both in time and space)and rain storms are more likely to occur as infrequent (e.g.,every other year) large events or as rare (every 5–60 years)extreme events. The terrain is characterized by a highvariability of relief, with ridges and mountain rangesadjacent to lowlands, a significant factor in the generationof overland flow. The lack of vegetation cover over thewadi beds results in no protection from raindrop impact, sothe overland flow, concentrated by the topography, eitherconverges downstream in a complex network of deeply cut
786 Arab J Geosci (2011) 4:785–801

wadis to the Gulfs of Aqaba and Suez, or permeates the soiland recharges the subsurface aquifers. Flash floods in thisarea often produce much erosion and sedimentation thatcause damaging effects on the road networks and structuresin local major cities, which are built on the outlets of themajor hydrographic catchments. These floods often hampersupporting several cities (e.g., Nuwibie, Dahab, Sharm El-Sheikh) and many coastal resorts with drinking water andfood, resulting in a multitude of environmental and econom-ic consequences, in addition to the loss of life and property.
Geologically, the area is an uplifted horst bordered bythe graben system of the Gulfs of Aqaba and Suez, and is apart of the Precambrian Arabian-Nubian Massif thatextends across southern Sinai, the Eastern Desert of Egypt,Sudan, and western Saudi Arabia. Different rock units withdistinct hydrogeological properties range from the Precam-brian basement (34.36% coverage) to the Phanerozoicsedimentary succession (Fig. 2). The sedimentary succes-sion includes a wide range of geologic ages. It is divided bySaid (1962) into three divisions: (1) the lower clastic
N
462000 492000 522000 552000 582000 612000 642000 672000
Quaternary wadi deposits
Clastic sedimentary rocks
Carbonate rocks
Basement igneous and metamorphic rocks
Catchment boundary and wadi networks
El-Tor
Sharm El-Sheikh
Nuweiba
Dahab
Taba
Saint Catherine
Abu Rudeis
Ras Sudr
Abu Zenima
Hammam Fara’un
Western Desert
Eastern Desert
Mediterranean Sea
Cairo Sinai
Saudi Arabia
Jordan
Qena Safaga
Red Sea
Sudan
Libya
River Nile
200 km
36° E 33° E 30° E 27° E 24° E
30° N
28° N
26° N
22° N
39° E
24° N
Study Area
3060
000
3090
000
3120
000
3150
000
3180
000
3210
000
3240
000
462000 492000 522000 552000 582000 612000
3060000 3090000
31200003150000
31800003210000
3240000
642000 672000
N
S
EW
Fig. 1 Location and physiographic features of the study area
Arab J Geosci (2011) 4:785–801 787

division, which overlies the Precambrian igneous andmetamorphic rocks and extends to the Lower CretaceousNubian Sandstone (15.79% coverage); (2) the middlecalcareous division, which ranges in age from Cenomanianto Eocene and covers about 24.32% (fractured limestone,chalky limestone, chalk, shale, marl, and dolomite); and (3)the upper clastic division of the Neogene to Holocene agecomposes about 25.52% of the area and is distributed in thewadi floors, catchment outlets, and sedimentary plainsincluding the Sudr and Qaa Plains. Groundwater exists ina variety of water-bearing formations, including fracturedcrystalline basement rock, Nubian sandstone, fractured andkarstified Carbonate, and in several types of youngerdeposits, such as alluvial deposits and eolian sand (Damesand Moore 1985).
The catchments involved in this study were namedaccording to the main wadi flowing from the catchmentdivide downstream to the outlet, except for the catchmentof Ras Nusrani, which was named after a granite mountainin the region.
Materials and methods
Because runoff modeling is meant to be used on ungaugedcatchments, the only data available for modeling were thoseof the precipitation, topography, landcover information, andwadi hydrogeometric/roughness characteristics that weremeasured from the thematic data and verified during on-sitevisits. Precipitation information was derived from scannedisohyet map showing the spatial distribution of the averagemaximum daily rainfall. The SRTM3 DEM of the 3-arcsecond grid spacing (90 m) was used to represent the
topography. Land cover data composed mostly of thebedrock lithology and soil cover were extracted from fourLandsat-7 ETM+ with world reference system (WRS)information and acquisition dates, as shown on Table 1.The available geological maps (scale 1:250,000, sheets No.1, 2, and 3) of the Geological Map of Sinai (1994) werescanned at 254 dpi and utilized in training/verificationclasses derived from the image data. The GRASS GISpackage (GRASS Development Team 2006) was used forthe integrated analysis of the produced catchment GISlayers. Field investigations were carried out to validate andupdate the derived GIS layers used to build the hydro-graphs. A windows-based software was developed usingVisual Basic to automate the process for calculating excessrunoff and the unit hydrograph (UH), convolute the UHfor the whole catchment, and route the flow of flood wavesto the catchment outlet. The software is available for free atthe author’s website (http://alaamasoud.tripod.com). For thesake of visual clarity, intermediate results are shown forthe catchment of Wadi Watir with final results shown forthe whole studied catchments. The methodology adopted isrepresented by a flow chart shown on Fig. 3 and describedin detail in the following sections.
Fig. 2 Photograph showingwadi floor deposits, Carbonifer-ous sandstones (front), and thebasement rocks caped by Paleo-zoic sandstone (back)
Table 1 Landsat-7 ETM+ images used for lithologic classification
WRS-2 path/row Date, year-month-day
174/040 2000-09-10
174/041 2000-09-10
175/039 2000-12-22
175/040 2000-12-22
788 Arab J Geosci (2011) 4:785–801

Hydrological analysis of DEM
The Shuttle Radar Topography Mission (SRTM) 90 mDEM data (Farr and Kobrick 2000) was available for thearea. Seven 1-degree coverage DEM tiles were patchedtogether and processed prior to all subsequent analysis. Flatareas and depressions like pits and sinks in DEM interruptflow paths and alter drainage directions. These problematicareas were modified in a way to permit continuous flowfrom the ridges down to the outlets using Jenson andDomingue’s (1988) algorithm for enforcing flow on flatareas, and the impact reduction approach (IRA) of Lindsayand Creed (2005) was used to circumvent the depressionsin DEM.
The shape of the catchments and their channelsdetermine how water is transmitted through the catchment.Catchment area, length, shape, elongation, and relief, aswell as channel length, frequency, and bifurcation influencethe amount of water yielded, affecting the rate of waterdischarge. Flow routing algorithms are commonly used toderive such various terrain attributes. Many flow routingalgorithms are available, including D8, FD8 (Freeman1991; Quinn et al. 1991), D-infinity (Tarboton 1997), andthe Quinn et al. (1995) modification of FD8. Thesealgorithms differ in how to model flow direction anddivergence, and thus handle stream networks and thespecific catchment area differently. In this study, eachtechnique was applied and tested. The simplest D8 methodperformed satisfactorily and was used accordingly. Delin-eation of the subcatchments and the wadi networks, as wellas their geomorphologic and morphometric characteristicswere carried out using hydrologic modules in the GRASSGIS package (GRASS Development Team 2006). WadiWatir has 32 of the 103 delineated subcatchments from thewhole study area, with sizes ranging from 2 to 372 km2.Delineated subcatchments for Wadi Watir with their
channel networks are shown on Fig. 4. Geomorphologic/morphometric characteristics of the main catchments andtheir channel networks are shown on Table 2. Thesecharacteristics included the catchment area, length (L),length from the catchment oulet to its centroid (Lc), divideaverage relief, maximum wetness index (WI), main channellength, total channel length, main channel slope inpercentage, and stream orders.
Landcovers and soil hydraulic properties
Landcover classes were derived from a supervised maxi-mum likelihood classification of the Landsat-7 ETM+ data,using training classes derived from the geological maps.Reasonable results were obtained from the classificationmethod where the kappa coefficients of Congalton (1991)showed an average commission of 90% for the 83 types ofrock and soil identified throughout the whole area. Out-croppings of different rock-soil types at Wadi Watir areshown on Fig. 5. To define different hydrological groupspredominant on the subcatchments, measurements ofsteady-state infiltration rates were carried out in severaltest sites in the wadi floor along the water courses. This wasperformed through in-situ rainfall simulation at a 1 m2 scaleunder 40 mm h−1 rainfall intensity for 1 h. The observedcapacities ranged from 6.7 to 12.9 cm h−1 in all test sites.Similar values have been reported in the eastern desert ofEgypt in Foody et al. (2004).
Derivation of precipitation
In the present research, the only available precipitationrecords for the area were in the form of isohyet mapsdescribing the average maximum rainfall (millimeter)recorded in 1 day. These data were generated from thehistorical precipitation archives (1960–1990) by the Egyp-
Landsat-7 ETM+Geologic Maps
SRTM 90 m DEM Precipitation data
Landcover & Road network
Wadi network/catchment delineationContributing area calculation Catchment morphologic and wadinetwork morphometric analysis
Av.Maximum rainfall in one day (mm)
Classification Hydrological Analysis
Synthetic UH and hydrograph generation (SCS)Hydrograph routing (Muskingum)
Rainfall and infiltration volume estimationEvaluation of the potential from the flash flood
on the road network and the groundwater recharge potential
Fig. 3 Flow chart of the adop-ted methodology
Arab J Geosci (2011) 4:785–801 789

tian Meteorological Authority in 1996. These maps weredigitized and converted into a GIS layer; the inter-isohyetarea was interpolated using an algorithm that approximatesthe surface iteratively through potential mechanical energyminimization until a rendering of the final surface could beproduced using the least mean-squared error optimizationtechnique. More details on the surfaces generated with thistechnique are described in Masoud (2003). Rainfall recordsfor 2 November 1994 were only available for the El-Torstation, which is located 2 m above the mean sea level atthe outlet of the Wadi Al-Awaj catchment. However, suchrecords do not represent the actual rainfall throughout thebasin due to orographic effects where strong precipitationgradients are accentuated with elevation of the nearbymountain ranges. To overcome this problem, and to predictthe amount of rainfall over the whole catchment, a pixel-based correlation analysis was performed comparing eleva-tion data of the DEM and the average maximum rainfall(millimeter) in 1 day. A correlation coefficient of 0.9 wasachieved. This method was then applied to the ungauged
catchments and rainfall amounts were estimated for thesubcatchments. The estimated rainfall amounts for thesubcatchments were then designed based on the 2 Novem-ber 1994 storm. The precipitation over the catchment of W.Al-Awaj where El-Tor station is located on its outlet wasestimated at 51.3 mm that is in accordance with the value of60 mm reported in Gheith and Sultan 2002, on the Red Seamountains proximal to El-Tor station during the 1994 stormevent. Thus, the precipitation estimates over the studiedcatchments are reasonable.
Developing the soil conservation service model
The Soil Conservation Service (SCS 1972) method wasoriginally designed for small humid agricultural catchmentsin the USA, and has since been adapted to measureinfiltration losses in arid areas of Saudi Arabia and theUSA (Graf 1988; Walters 1990) with similar climatic andphysiographic conditions. This method can be appliedequally well to larger catchments, taking into account the
3197
000
601000 616000 646000 631000 661000
3212
000
3227
000
3242
000
3257
000
601000 616000 631000 646000 661000 3197000
3212000 3227000
3242000 3257000
6th order streams
4th order streams
5th order streams
2nd order streams
3rd order streams
N
S
W E
Fig. 4 W. Watir subcatchmentboundaries with wadi networkstrahler orders draped overDEM. First order streams arenot shown for the sake of visualclarity
790 Arab J Geosci (2011) 4:785–801

Table 2 Characteristics of the main catchments and their channel networks
Catchment Area(km2)
L(km)
Lc
(km)Divide averagerelief (m)
Max. wetnessindex
Main channellength (km)
Total channellength (km)
Totalchannel no.
Main channelslope (%)
Streamorders
W. Watir 3,459 76 28.5 1036 29.2 110.5 5,070 2,450 5.05 6
W. Dahab 2,069 57 37.4 1,272 28.9 99.1 2,951 1,386 9.53 6
W. Kid 1,038 50 38.5 1,119 28.3 74.0 1,265 605 7.42 6
Ras Nusrani 365 36 23.4 773 27.2 53.7 546 272 5.41 5
W. Al-Awaj 1,950 57 22.5 922 28.6 83.0 1,250 1,290 1.46 7
W. Feiran 1,783 81 52.2 1,059 28.8 143.2 2,702 1,307 3.79 6
W. Sidri 1,062 79 39.2 885 28.2 106.7 1,622 769 4.12 5
W. Samra 714 55 35.1 504 27.9 80.4 1,184 551 4.56 5
W. Tayyibah 358 33 19.8 530 27.2 54.5 518 252 3.42 5
W.Gharandal 862 54 36.5 625 28.0 91.2 1,400 697 3.2 5
W. Wardan 119 59 29.6 508 28.4 85.3 2,048 1,002 3.66 6
W. Sudr 595 54 34.3 424 27.7 81.5 1,022 475 3.07 6
W. Lahata 190 32 16.0 341 26.3 44.4 292 120 5.01 5
3197
000
3212
000
3227
000
3242
000
3257
000
601000 616000 631000 646000 661000
601000 616000 631000 646000 661000
3197000 3212000
3227000 3242000
3257000
Qw Qfg Qh Tmqb Temk Teleg Tpes Ksd Kdu Kmt Kwt Kv Kjll Kml Jrq
nq ar
ckg gmg gd md
N
EW
S
Fig. 5 Different rock-soil typesof W. Watir catchment withcodes shown on Table 3
Arab J Geosci (2011) 4:785–801 791

geographical variations of rainfall from storms, as well asrock-soil-cover complexes, by working with small hydro-logic units of the catchments. Runoff modeling in aridenvironments counts for the separation of the Hortonianoverland flow (runoff or infiltration excess) and the infiltra-tion losses in the dry wadis. Runoff occurs when the stormintensity exceeds the infiltration capacity of the wadi soil(e.g., Yair and Lavee 1985; El-Hames and Richards 1994).Primarily based on empirical equations, unit hydrographscan be synthesized for ungauged catchments by relating theunit hydrograph’s shape to catchment characteristics such asbasin length and area (Yen and Lee 1997). The SCS runoffcurve number method is used to abstract the total rainfallhyetograph into the effective rainfall hyetograph, and tomodel the hydrographs at each subcatchment outlet, relatinghydrograph characteristics (lag time, peak discharge, basetime, etc.) to catchment parameters (area, length, hydrologiccharacteristics, soil cover types, etc).
Given the hyperarid conditions, paucity of vegetation,and rugged topography of the region, only abstractions dueto infiltration are considered. The SCS method estimatesprecipitation excess as a function of the cumulativeprecipitation, rock-soil cover, land use, and antecedentmoisture, using the following equation:
Q ¼ P � 0:2Sð Þ2P þ 0:8 Sð Þ and F ¼ P � Q ð1Þ
where F is the total infiltration depth (millimeter) and Srepresents the soil retention parameter (millimeter). Foreach time step, the overall sum of rainfall P was calculated,and Q and F curves were deduced for each subcatchment.These curves are standardized through the dimensionlesscurve number CN, which is defined between 30 and 100. Sis estimated as:
S ¼ 254100
CN� 1
� �ð2Þ
The initial abstraction is related to S according todifferent regions, and is commonly defined as 0.2 S in aridcatchments. CN is a hydrologic rock-soil-cover coefficientshowing the runoff potential on the catchment as repre-sented by a combination of hydrologic soil groups and thesoil Antecedent Moisture Condition (AMC) for the 5 dayspreceding a given storm event. The Antecedent MoistureCondition I (AMC-I) with the lowest runoff potential wasproposed for the studied catchments, taking into consider-ation that both rainfall is rare throughout the year and soilwould have been dry before any storm event. Various rockand soil types were assigned an appropriate CN based ontheir physical and hydrological characteristics as verified inthe field. These types fall into four main general groups:hard rock cover comprised of igneous and metamorphic
bedrock, clastic sandstones, calcareous carbonate rocks, andthe Quaternary alluvial deposits as shown in Fig. 1. Differenthydrologic groups in the subcatchment are tabulated as apercentage of the total subcatchment area with itscorresponding CN. A weighted average CN is thengenerated. As a first step, the SCS method was applied toseparate precipitation from the excess runoff and initialloss. The achieved results are shown for W. Watir in Fig. 6.The excess runoff was then used to draw the UH for thesubcatchments.
The most significant parameters that shape the UH arethe peak discharge (qu) and lag time (Tlag ). The UH peakdischarge qu resulting from incremental excess precipitationof 1 mm occurring over the drainage area in a specifiedtime is a function of the lag time (Tlag ), drainage area, anda peak factor C given by the equation:
qu ¼ C A
Tlagð3Þ
where qu is the unit peak discharge (m3/s/km2/mm) ofrunoff; A is the catchment area in km2; C is the peak ratefactor (that has been known to vary from about 0.258 insteep terrain to 0.129 in very flat areas); and Tlag is the lagtime to peak runoff (hours), estimated as the time differencebetween the center of mass of the effective rainfallhyetograph and the center of mass of the direct runoffhydrograph. The lag time is related to the catchment length,average slope, and Manning roughness coefficient (n) asfollows:
Tlag ¼ 24nLLcaffiffiffi
Sp
� �0:38
ð4Þ
where L is the length of the longest water course in miles; Lcais the length along the longest water course to the subbasin
Time Step (minutes)
Hei
ght (
mm
)
10
25
20
15
10
5
0 30 50 70 90 110 130 150 170 190
Fig. 6 Rainfall and excess runoff depths for W. Watir
792 Arab J Geosci (2011) 4:785–801

centroid in miles; and S is the overall slope of the longestwater course in feet per mile. The Manning coefficient, n, isthe average value estimated for the wadi networks in thesubcatchments. “Roughness values” set at 0.05 for moun-tainous areas, 0.03 for foothills, and 0.015 for valleys havebeen adopted here for the landform classes extracted fromthe DEM based on slope classification. The UH was drawnfor a time interval of 10 min convoluted to calculate a floodhydrograph at each subcatchment outlet for the stormduration (Chow et al. 1988). Peak discharge of the catchmenthydrograph, qp was then computed using Eq. 5 below:
qp ¼ qu A Q ð5Þ
where Q is the depth of the direct runoff in millimeters.Hydrographs corresponding to each subcatchment were
combined and propagated according to Muskingum’smethod (Cunge 1969). This flow routing method has awave celerity parameter K (meters per second) along thesubcatchment that reaches downstream, as well as adimensionless parameter X ranging from 0 to 1 describingthe relative importance of the effects of inflow rates ondefining the amount of stored water in the reach. Estimatesfor the wadi dimensions, such as hydraulic radius and thewadi slope, were extracted from the DEM and verifiedduring a site visit. Appropriate values of K and X wereselected for different wadi reaches in each subcatchment.The final flood outflows at each catchment outlet werethen quantified. As the catchments are all ungauged,and also due to the absence of flow records, no modelparameter calibration test was performed since allparameters were derived either directly from field dataor indirectly through experiences from values in similarcatchments.
Groundwater recharge and flash flood potentials
Groundwater recharge from infiltration losses
Estimating transmission losses in arid environments isdifficult because of the variability of surficial geomorphiccharacteristics and infiltration capacities of soils and near-surface low-permeability geologic layers (e.g., calcrete).Losses occur as flow infiltrates channel bed, banks, andfloodplains. Transmission losses in ephemeral channels arenonlinear functions of discharge and time (Lane 1972), andvary spatially along the channel reach and with soilantecedent moisture conditions (Sharma and Murthy1994). Without the proper management of this waterresource, the excess precipitation can be quickly lost tothe high evaporative environment or lost from the water-shed via runoff.
In general, as soil on the wadis is dry preceding winterstorms with negligible evaporation, the alluvium underlyingthe wadi beds are assumed to effectively transmit infiltra-tion losses down to the subsurface alluvial aquifers. Wadibed infiltration also has an important effect on floodpropagation as the flood waves travel downstream to thecatchment outlet. Hence, wadi bed infiltration may be thepredominant process underlying groundwater recharge.Quantification of the infiltration loss is thus important.Sorman and Abdulrazzak (1993) estimate that on average,75% of bed infiltration reaches the water table, according toan experimental reach in Wadi Tabalah, located in south-western Saudi Arabia. In the present work, depths ofinfiltration losses are estimated by subtracting the directrunoff from the precipitation of each subcatchment. Theinfiltrated volume is then quantified, taking into account theaerial extent of each subcatchment.
Locating sites with possibly high flash floodand groundwater potentials
In order to demarcate sites with the highest potential forflood risk on road networks, as well as those that may beused for artificially recharging groundwater, a DEM-basedrelative stream power (RSP) index and WI were derived.These indices were assumed to affect soil characteristics,distribution and abundance of soil water, susceptibility oflandscapes to erosion by water, and the distribution andabundance of flora and fauna (Moore et al. 1991; Wilsonand Gallant 2000). Moore et al. (1993) state that suchterrain attributes significantly correlate with the measuredsoil properties.
RSP is the time rate of energy expenditure and has beenused extensively in studies of erosion, sediment transport,and geomorphology as a measure of the potential erosivepower of the overland flows (Moore et al. 1991; Moore etal. 1993). It is usually computed as:
RSP ¼ rgq tan b ð6Þ
where ρg is the unit weight of water, q is the discharge perunit width, and β is the slope gradient (in degrees). Sinceρg is constant and the discharge (q) is often assumed to beproportional to specific catchment area (As), the index (As
tan β) is, therefore, a measure of the stream power. RSPpredicts net erosion in areas of profile convexity andtangential concavity (flow acceleration and convergencezones) and net deposition in areas of profile concavity(zones of decreasing flow velocity). As the gradient ofspecific catchment areas increases, the amount of watercontributed by the upslope areas and the velocity of waterflow increase, hence stream power index and erosion riskincrease.
Arab J Geosci (2011) 4:785–801 793

The WI is also based on the idea that the area of the localslope and upslope affect soil moisture conditions. Wetnessindex is computed as:
WI ¼ lnAs
tan b
� �ð7Þ
The higher the value of WI, the higher the possibility ofa land unit remaining wet after a flood. This is one possiblemeasure that can be recommended for use in order torecharge groundwater.
Pixels located within a 200-m buffer zone from the roadnetworks that have the maximum logarithm of RSP (6–8)values are proposed to have the highest potential for floodrisks. Also, sites with the highest (26.5–29.5 WI) valueslocated within a 300-m buffer zone from the faults arerecommended sites for recharging groundwater aquifers.The logarithm of the RSP is further classified into twoclasses, from 0–4 and 4–8, and their areal extents areestimated for each catchment. The area coverage of the twoclasses have been correlated with the UH peak discharge,hydrograph peak discharge, and runoff volume.
10 20 40 50 70 90 120 140
Dis
char
ge R
ate
(m3 /
s)
60 80 100 110 130 30
Time Step (hours)
W. Watir
W. Dahab
W. Kid
W. Al-Awaj
W. Feiran
W. Wardan
W. Sudr
W. Samra
Ras Nusrani
W. TayyibahW. Lahata
W. Sidri
W. Gharandal
Fig. 8 Hydrographs of the stud-ied catchments
10 20 30 40 50 60 70 80 90 100 110 120 130 140 150 160
Time Step (hours)
Dis
char
ge R
ate
(m3/
s)
W. Watir
W. Dahab
W. Kid
W. Al-Awaj
W. Feiran
W. Wardan
W. Sidri
W. Gharandal
W. Tayyibah
W. Lahata
W. Sudr
Ras Nusrani
W. Samra
Fig. 7 Unit hydrographs of thestudied catchments
794 Arab J Geosci (2011) 4:785–801
Results
The predicted unit hydrographs and catchments hydrographsare shown on Figs. 7 and 8, respectively. The lag time andpredicted peak discharge rates, along with the volumes ofrainfall, runoff, and abstraction losses are summarized inTable 4. The shape of the UH and hydrographs had relativelysymmetrical rising and falling limbs. The UH and hydro-graphs showed steep rising and falling limbs for the W. Watir
and W. Dahab catchments, and a slight increase for the restof the catchments. The predicted UH and hydrograph peakdischarges of the W. Watir were 33.75 (m3/s/km2/mm) and793 m3/s, respectively. W. Dahab catchment showed 24.97(m3/s/km2/mm) and 993 m3/s for the UH and hydrographpeak discharge rates, respectively. For the remaining catch-ments, the UH varied from 3.36 to 15 (m3/s/km2/mm), andthe peak discharges of the hydrographs ranged from 56 to532 m3/s. In terms of catchments peak discharge rates, the
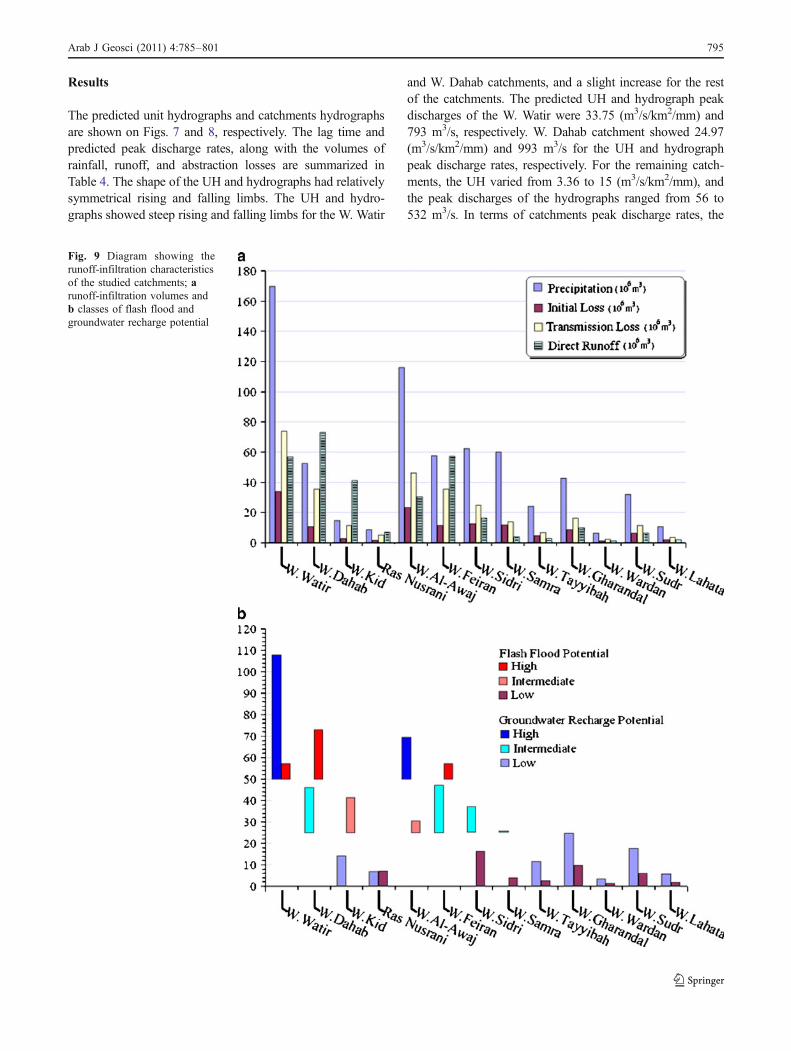
Fig. 9 Diagram showing therunoff-infiltration characteristicsof the studied catchments; arunoff-infiltration volumes andb classes of flash flood andgroundwater recharge potential
Arab J Geosci (2011) 4:785–801 795

W. Dahab catchment had the highest rate followed by the W.Watir, W. Kid, W. Feiran, and W. Al-Awaj catchments, withrates in total ranging from 993 to 356 m3/s. The remainingcatchments showed relatively low rates in a range between201 (W. Wardan catchment) and 56 (W. Lahata catchment)m3/s. Transformation of the UH to the catchments hydro-graph showed linearity for the studied catchments, with theexceptions of the W. Dahab and W. Fieran catchments. Thiscomes from the higher contribution of the topography(divide average relief) and hence the precipitation.
Catchments were then classified according to their directrunoff and infiltration volumes. Infiltration volumes wereestimated by summing the initial and transmission losses.Three main classes were assigned to figure out thepotentiality: high (>50×106 m3), intermediate (25×106 m3
–50×106 m3), and low (1.28×10⁶ m3 –25×106 m3). Therunoff-infiltration volumes as well as the classes of the flashflood and groundwater potential are shown on Fig. 9.Among the catchments predicted to have high flash floodpotential, the catchment of W. Dahab showed the highest
rank followed by the W. Fieran and W. Watir catchments.W. Kid and W. Al-Awaj had an intermediate potential. Thecatchments of W. Sidri, W. Gharandal, Ras Nusrani, W.Sudr, W. Samra, W. Tayyibah, W. Lahata, and W. Wardanshowed low potential. Among the catchments that had highgroundwater recharge potential, W. Watir had the highestpotential followed by W. Al-Awaj. The catchments of W.Feiran, W. Dahab, W. Sidri, and W. Samra had intermediategroundwater potential. W. Gharandal, W. Sudr, W. Kid, W.Tayyibah, Ras Nusrani, W. Lahata, and W. Wardan fellwithin the low potential class. The catchments have beenlisted according to their estimated runoff and infiltrationvolumes in a descending order from highest to lowestwithin each class. Górski and Ghodeif (2000) stated that therecharge rate (32,000 m3/day) of the Quaternary aquiferunderlying the Qaa Plain where W. Al-Awaj flows exceedsthe discharge (26,000 m3/day) and the static water levelshowed no distinct change since 1972. Thus, W. Watircould be promising for groundwater exploration as it haseven higher potential than W. Al-Awaj.
3197
000
3212
000
3227
000
3242
000
3257
000
601000 616000 631000 646000 661000
601000 616000 631000 646000 661000
3197000 3212000
3227000 3242000
3257000
Sites with possibly high potential for groundwater recharging
Sites with high possibility of flash flood risks on the 1st class roads.
Faults
Sites with high possibility of flash flood risks on the 2nd class roads.
Basement rocks
Clastic sedimentary rocks
Carbonate rocks
Quaternary wadi deposits
N
S
EW
Fig. 10 Located sites for possi-ble high flash flood risks andgroundwater recharging in WadiWatir displayed over theregional geology draped overDEM
796 Arab J Geosci (2011) 4:785–801

The present rainfall–runoff model showed a rainfallvolume sum of 725.5×10⁶ m3. The distribution of the totalrainfall over the three components was: runoff volume of307.8×106 m3 (43.4%), initial loss of 131.5×10⁶ m3
(18.1%), and 286×106 m3 (39.4%) transmission loss. Theestimated recharge volume proposed to recharge theshallow groundwater aquifers underlying the studied catch-ments counted for about 57.5% of the total rainfall thatcorresponds well with that of the JICA (1999). Accordingto JICA (1999), an estimated recharge resulting fromindividual large storm expected every 60 years (76 mm)over the mountainous St. Catherine area was 135.4×10⁶ m3(50% of the total precipitation). Infiltration lossesare found to be more effective than runoff flows incatchments with dominant wadi bed coverage havingrelatively low CN. While for the catchments with highvalues of the CN with hard rock cover is dominating, therunoff flow is larger than the infiltration abstraction.
Located sites for possible high flash flood risks andgroundwater recharging are shown on Fig. 10 for Wadi
Watir and on Fig. 11 for the whole studied catchments.Field visits to most of the sites confirmed the validityof the adopted methodology. There were many sectionsof the road network that were washed out duringprevious flood occurrences. Also, there were abandonedand remnants of the hydraulic structures built for flood-spreading found on some of the subcatchment piedmontareas and foothills. About 50% of the sites demarcatedto likely have high potential for groundwater rechargingthere found wells dug for domestic use by the localBeduin in particular in W. Feiran, W. Sidr, St. Catherinearea, and Sudr and Qaa Plains where shallow Quater-nary aquifer underlie the terrain.
Model evaluation
Evaluation of the modeling results relies on the availabilityof proper reference data. There is a worldwide lack ofpublished reports addressing the rainfall and water balance
672000
672000
3060
000
3090
000
3120
000
3150
000
3180
000
3210
000
3240
000
462000 492000 522000 552000 582000 612000
462000 492000 522000 552000 582000 612000
3060000 3090000
3120000 3150000
31800003210000
3240000
642000
642000
Sites with possibly high potential for groundwater recharging
Sites with high possibility of flash flood risks on the 1st class roads. Sites with high possibility of flash flood risks on the 2nd class roads.
N
W E
S
Fig. 11 Located sites for possi-ble high potential for flash floodrisks on the road networks andgroundwater recharging in thestudied catchments
Arab J Geosci (2011) 4:785–801 797

estimates; in particular, for ungauged catchments of the aridregions. Luckily, Milewski et al. (2009) estimated theaverage annual (1998–2007) rainfall, initial abstraction,runoff, and the transmission losses for three out of thestudied catchments: W. Watir, W. Dahab, and W. Al-Awajcatchments. These estimates are based on calibration of the3-hourly precipitation from the Tropical Rainfall MeasuringMission data for W. Girafi catchment in Sinai using streamflow data collected at the outlet of the catchment in Israel.
Rainfall estimates from the present study for the catchmentsof W. Watir, W. Dahab, and W. Al-Awaj showed values of164.9×106 m3, 118.8×10⁶ m3, and 100×106 m3, respec-tively. These estimates agree well with those reported inMilewski et al. (2009), where these catchments showedaverage annual (1998–2007) of 192.7×10⁶ m3, 110.6×10⁶ m3, and 74.2×10⁶ m3, respectively.
Results from the present study indicated an averagerunoff of 42.15% and average transmission loss of 40.27%
Geologic age Code Description
Holocene Qw Wadi deposits
Pleistocene Qfg Fanglomerates
Pleistocene Qh Alluvial Hamadah deposits
Miocene Tmqb Fossiliferous limestone
Middle Eocene Temk Limestone with banks of Nummulites
Late Eocene Teleg Chalky limestone with flint/chert bands and nodules
Paleocene Tpes Shales with soft marl
Cretaceous (Maast.-Camp.) Ksd Limestone with marl and clay beds in the lower part
Cretaceous (Campanian) Kdu Alternates of chert-capped clastics and carbonates
Cretaceous (Turonian) Kwt Limestone with shale intercalations
Cretaceous Kv Basaltic dykes
Cretaceous (Cenomanian) Kjll Marl capped with limestone
Cretaceous (Albian–Aptian) Kml Sandstone with kaolinitic pockets
Mesozoic (Jurassic) Jrq Sandstone
Paleozoic (Cambrian) €nq Quartzitic sand and sandstone
€ar Ferruginous sandstone with sandy clay bands
Late Proterozoic ckg Granites
gmg Monzonites
gd Diorite and granodiorite
md Metadiorite with mafic xenoliths
Table 3 Rock-soil classes of W.Watir catchment
Table 4 The curve number, UH, hydrograph, and rainfall–runoff characteristics of the studied catchments
Catchment CN Tlag(h)
UH PeakDischarge (m3/s)
Catchment peakdischarge (m3/s)
P(mm)
Q(mm)
Ia(mm)
Rainfall(106m3)
Runoff(106m3)
Initial loss(106m3)
Transmissionloss (106m3)
W. Watir 83.8 21.22 33.75 793 47.68 16.48 9.82 164.93 57.01 33.96 73.94
W. Dahab 90.9 17.14 24.97 993 57.45 35.24 5.08 118.86 72.92 10.52 35.41
W. Kid 94.8 17.07 12.56 532 53.44 39.72 2.78 55.47 41.23 2.89 11.34
Ras Nusrani 91.3 14.11 5.35 125 38.24 19.36 4.84 13.96 7.06 1.76 5.12
W. Al-Awaj 81.0 26.96 15 356 51.3 15.67 11.91 100.04 30.56 23.23 46.23
W. Feiran 88.7 31.78 11.62 437 58.41 32.00 6.47 104.15 57.05 11.54 35.54
W. Sidri 81.2 24.68 8.9 199 50.28 15.24 11.76 53.40 16.18 12.49 24.71
W. Samra 75.1 20.45 7.21 100 41.52 5.59 16.84 29.65 3.99 12.02 13.62
W. Tayyibah 79.0 15.85 4.67 70 40.07 7.50 13.50 14.35 2.68 4.83 6.82
W. Gharandal 83.7 24.93 7.16 125 40.07 11.43 9.89 34.54 9.85 8.52 16.15
W. Wardan 83.1 21.32 11.55 201 39.99 10.81 10.33 4.76 1.28 1.23 2.24
W. Sudr 82.6 23.71 5.2 89 39.95 10.33 10.70 23.77 6.15 6.37 11.25
W. Lahata 81.9 11.71 3.36 56 40.02 9.76 11.22 7.60 1.85 2.13 3.61
798 Arab J Geosci (2011) 4:785–801

for the above-mentioned catchments. These results corre-spond well with the reported and inferred average trans-mission losses in several similar arid catchments that werefound to exceed 40% from the total rainfall. Milewski et al.(2009) reported an average annual runoff of 6.1% andaverage annual recharge through transmission losses of23.9% for these catchments. WRRI/JICA (1999) showed anaverage of 14% runoff and 54% transmission losses fromthe total rainfall for the Sinai Peninsula. Morin et al. (2009)indicated an average annual recharge (1960-2005) of42.67% from the ephemeral arid Kuiseb River segmentsin Namibia. In this river, inferred transmission losses fromsimulated discharges averaged 56.72% (Table 3 in Lange2005). Miller et al. (2005) reported approximately 40%
transmission losses throughout an experimental channelin Nevada desert. Costelloe et al (2003) reportedtransmission losses ranging between 70% and 98%.Telvari et al. (1998) stated that approximately two thirdsof overland flow is transmitted downstream once thealluvial storage is satisfied. From this review, it seems thatthe modeling results of Milewski et al. (2009), despitecalibrated, is underestimated. Underestimation of resultscan be proofed from the comparison of the calibratedmodel variables for the wadi Asyuti and Hammamatcatchments located in the Eastern Desert of Egypt shownon Table 1 in Gheith and Sultan (2002) and on Table 4 inMilewski et al. (2009). Generalization of calibratedparameters can never suite all catchments due to the
UH
Pea
k D
isch
arge
(m
3 /s)
Hyd
rogr
aph
Peak
Dis
char
ge (
m3 /s
)R
unof
f v
olum
e (1
06 m3 )
Fig. 12 Diagrams showing correlation coefficient and R2 between thecoverage of the log RSP (km2) from 0–4 (left ) and 4–8 (right), andthe runoff characteristics including the UH peak discharge (m3/s),
hydrograph peak discharge (m3/s), and the runoff volume (106 m3) ofthe studied catchments
Arab J Geosci (2011) 4:785–801 799

variability of the surficial geomorphic characteristics andinfiltration capacities.
In order to overcome this problem, an alternativeapproach that can relate catchment responses to itscharacteristics is advisable in minimizing modeling param-eter uncertainty (Wheater 2005). For this, various catch-ment characteristics were correlated with the modelparameters. The areal extent of the RSP achieved the bestcorrelation. Figure 12 clarifies the correlation between theareal coverage of the two classes derived from the RSPwith the UH peak discharge (correlation coefficient >0.96and R2>0.91), hydrograph peak discharge (correlationcoefficient >0.87 and R2>0.76), and the runoff volume(correlation coefficient >0.87 and R2>0.75). This correla-tion establishes the validity of this single parameter topredict the runoff potential of the catchments. This could bea promising alternative to validate the runoff models whenreference discharge data are unavailable.
Conclusions
The methodology adopted and the developed runoffmodels, despite being simply limited by the lack of properhydrometeorological data, represent a crucial premise forbetter understanding the hydrological phenomena in thewadi systems of the arid desert environments where suchstudies are rare. The predicted hydrographs, the runoff-infiltration volume estimates, and the sites demarcated topossibly have high potential for the flash flood, and thegroundwater recharge could improve the solutions for theflood risk mitigation and the availability of water fromthe wadi systems. Despite the lack of discharge data, thesecondary topographic indices coupled with the fieldobservations were useful in validating the resulted models.Construction of runoff controlling systems in the proposedareas could lessen the flood vulnerability and save andmake use of a considerable amount of water to meet part ofthe ever growing water needs in these harsh environments.A master planning of the entire catchments not only withrespect to the flood risk and water use, but as much so fortourism, wadi habitats, and more is direly needed. New andadvanced methodologies and data acquisition techniquesare essential to predict the hydrologic and other relevantenvironmental data about the ungauged catchments. So,there is an urgent need for research in this direction tofacilitate appropriate policy measures.
Acknowledgments I am grateful to the anonymous reviewers fortheir constructive comments on the article. I would like to acknowl-edge the help of the jeep driver, Mr. Mahmoud Temraz, during thefield campaigns. I am also thankful to the staff at the Governorate ofSouthern Sinai and the Scientific Research Academy in Cairo for theirhelp in securing flash flood reports available for the study area.
References
Ajami NK, Gupta H, Wagener T, Sorooshian S (2004) Calibration of asemi-distributed hydrologic model for streamflow estimationalong a river system. J Hydrol 298:112–135
Beven KJ (1996) Response to comments on ‘A discussion ofdistributed hydrological modelling’ by J.C. Refsgaard et al.1996. In: Abbott MB, Refsgaard JC (eds) Distributed hydrolog-ical modelling. Kluwer Academic, Dordrecht, pp 289–295
Chow VT, Maidment DR, Mays LW (1988) Applied hydrology.McGraw-Hill, New York, p 572
Congalton RG (1991) A review of assessing the accuracy ofclassifications of remotely sensed data. Remote Sens Environ37(1):35–46
Costelloe JF, Grayson RB, Argent RM, McMahon TA (2003) Modellingthe flow regime of an arid zone floodplain river, Diamantina River,Australia. Environ Model Softw 18(8):693–703
Cunge JA (1969) On the subject of a flood propagation computationmethod (Muskingum method). J Hydraul Res 7(2):205–230
Dames and Moore (1985) Sinai development Report, phase 1, finalreport 5, water supplies and costs. Submitted to the AdvisoryCommittee for Reconstruction Ministry of Development, Cairo
Duan Q, Gupta HV, Sorooshian S, Rousseau AN, Turcotte R (2003)Calibration of watershed models. Water Science and Application.American Geophysical Union, Washington, p 345
Egyptian Meteorological Authority (1996) Climatic Atlas of Egypt.Ministry of Transport and Communications, Cairo
El-Hames AS, Richards KS (1994) Progress in arid-lands rainfall-runoff modeling. Prog Phys Geogr 18(3):343–365
Farr TG, Kobrick M (2000) Shuttle radar topography missionproduces a wealth of data, Eos Transactions. American Geo-physical Union 81(48):583–585
Foody GM, Ghoneim EM, Arnell NW (2004) Predicting locationssensitive to flash flooding in an arid environment. J Hydrol 292(1–4):48–58
Freeman TG (1991) Calculating catchment area with divergent flowbased on a regular grid. Comput Geosci 17(3):413–422
Geological Map of Sinai, Arab Republic of Egypt (1994) (Sheet No.1, 2 and 3), Scale 1:250 000.
Gheith H, Sultan M (2002) Construction of a hydrology model forestimating wadi runoff and groundwater recharge in the EasternDesert, Egypt. J Hydrol 263:36–55
Górski J, Ghodeif K (2000) Salinization of Shallow Water Aquifer inEl-Qaa Coastal Plain, Sinai, Egypt. In: Sadurski, A. (ed.)Proceedings of SWIM 16, Międzyzdroje-Wolin Island, Poland,12–15 June, Nicholas Copernicus University vol. 80, pp 63–72
Graf WL (1988) Definition of flood plains along arid-region rivers. In:Baker VR, Kochel RC, Patton PC (eds) Flood geomorphology.Wiley, New York, pp 231–242
GRASS Development Team (2006) Geographic Resources AnalysisSupport System (GRASS) Software. ITC-irst, Trento, Italy. http://grass.itc.it.
Gray DM (1961) Synthetic unit hydrographs for small watersheds. JHydraul Div ASCE 87(4):33–54
Headman FR (1970) Mean annual runoff as related to channelgeometry of selected streams on California. USGS-WSP, 1999-E, p 17
Hickok RB, Keppel RV, Rafferty BR (1959) Hydrograph synthesis forsmall arid land watersheds. Agric Eng 40(10):608–611
Jenson SK, Domingue JO (1988) Extracting topographic structurefrom digital elevation data for geographic information systemanalysis. Photogramm Eng Remote Sensing 54(11):1593–1600
JICA - Japan International Cooperation Agency, 1999. South SinaiGroundwater Resources Study Report, Pacific ConsultantsInternational and Sanyu Consultants Inc., Tokyo
800 Arab J Geosci (2011) 4:785–801

Klemeš V (1986) Operational testing of hydrologic simulation models.J Hydrol Sci 31:13–23
Kokkonen TS, Jakeman AJ, Young PC, Koivusalo HJ (2003)Predicting daily flows in ungauged catchments: model regional-ization from catchment descriptors at the Coweeta HydrologicLaboratory, North Carolina. Hydrol Process 17:2219–2238
Lane LJ (1972) A proposed model for flood routing in abstractingephemeral channels. Hydrol Water Resour Ariz Southwest 2(2):439–453
Lange J (2005) Dynamics of transmission losses in a large arid streamchannel. J Hydrol 306(1–4):112–126
Lindsay JB, Creed IF (2005) Removal of artifact depressions fromdigital elevation models: towards a minimum impact approach.Hydrol Process 19(6):3113–3126
Littlewood IG (2002) Improved unit hydrograph characterization ofthe daily flow regime (including low flows) for the River Teifi,Wales: towards better rainfall–streamflow models for regional-ization. Hydrol Earth Syst Sci 6(5):899–911
Masoud A (2003) An integrated remote sensing and GIS approach forflash flood potential, mitigation, and floodwater resource man-agement: development and application on Safaga area, Egypt. Ph.D. Dissertation, Osaka City University, Japan, p 288
Michaud J, Sorooshian S (1994) Comparison of simple versuscomplex distributed runoff models on a midsized semiaridwatershed. Water Resour Res 30(3):593–605
Milewski A, Sultan M, Eugene Y, Abdeldayem A, Abdel Gelil K(2009) A remote sensing solution for estimating runoff andrecharge in arid environments. J Hydrol 373:1–14
Miller JJ, Mizell SA, French RH, Meadows DG, Young MH(2005) Channel Transmission Loss Studies During EphemeralFlow Events: ER-5-3 Channel and Cambric Ditch, NevadaTest Site, Nye County, Nevada, Technical Report, DOE/NV/13609 - 42, Desert Research Institute, Nevada System ofHigher Education, p 66
Moore ID, Gessler PE, Nielsen GA, Peterson GA (1993) Soilattribute prediction using terrain analysis. Soil Sci Soc Am J57(2):443–452
Moore ID, Grayson RB, Ladson AR (1991) Digital terrain modeling: areview of hydrological, geomorphological and biological appli-cations. Hydrol Process 5(1):3–30
Morin E, Grodek T, Dahan O, Benito G, Kulls C, Jacoby Y, VanLangenhove G, Seely M, Enzel Y (2009) Flood routing andalluvial aquifer recharge along the ephemeral arid Kuiseb River,Namibia. J Hydrol 368(1-4):262–275
Moussa R, Chahinian N, Bocquillon C (2007) Distributedhydrological modeling of a Mediterranean mountainouscatchment – model construction and multi-site validation. JHydrol 337:35–51
Murphey JB, Wallace DE, Lane LJ (1977) Geomorphic parameterspredict hydrograph characteristics in the southwest. Water ResourBull 13(1):25–38
Quinn P, Beven K, Chevallier P, Planchon O (1991) The prediction ofhillslope flow paths for distributed hydrological modeling usingdigital terrain models. Hydrol Process 5:59–80
Quinn P, Beven K, Lamb R (1995) The ln(a/tan beta) index: how tocalculate it and how to use it within the TOPMODEL framework.Hydrol Process 9(2):161–182
Refsgaard JC (1997) Parametrisation, calibration, and validation ofdistributed hydrological models. J Hydrol 198:69–97
Said R (1962) The geology of Egypt. Elsevier, New York 377Soil Conservation Service (SCS) (1972) Estimation of direct runoff
from storm rainfall, National Engineering Handbook. Section 4-Hydrology, 10.1–10.24
Sharma KD, Murthy JSR (1994) Estimating transmission losses in anarid region. J Arid Environ 26(3):209–219
Sharma KD, Murthy JSR (1995) Hydrologic routing of flow in aridephemeral channels. J Hydraul Eng ASCE 121(6):466–471
Sefton CEM, Howarth SM (1998) Relationships between dynamicresponse characteristics and physical descriptors of catchments inEngland and Wales. J Hydrol 211:1–16
Sorman AU, Abdulrazzak MJ (1993) Infiltration-recharge throughwadi beds in arid regions. Hydrol Sci J 38(3):173–186
Schlesinger S, Crosbie RE, Gagné RE, Innis GS, Lalwani CS, Loch J,Sylvester J, Wright RD, Kheir N, Bartos D (1979) Terminologyfor model credibility. SCS Technical Committee on ModelCredibility. Simulation 32(3):103–104
Tarboton DG (1997) A new method for the determination of flowdirections and contributing areas in grid digital elevation models.Water Resour Res 33(2):309–319
Telvari A, Cordery I, Pilgrim DH (1998) Relations betweentransmission losses and bed alluvium in an Australian arid zonestream. In: Wheater H, Kirby C (eds) Hydrology in a ChangingEnvironment, vol. II. Wiley, pp 361–36
Valdes JB, Fiallo Y, Rodriguez-Iturbe I (1979) A rainfall–runoffanalysis of the geomorphologic IUH. Water Resour Res 15(6):1421–1434
Wagener T, Wheater H, Gupta HV (2004) Rainfall–runoff modeling ingauged and ungauged catchments. Imperial College Press,London 306
Walters MO (1990) Transmission losses in arid region. J Hydraul Eng116(1):129–138
Wheater HS (2005) Modeling Hydrological Processes in Arid and SemiArid Areas,. Proceedings of the GWADI International ModelingWorkshop, Roorkee, India, p 39 http://www.geadi.org/shortcourses
Wilson JP, Gallant JC (2000) Secondary topographic attributes. In:Wilson JP, Gallant JC (eds) Terrain analysis: principles andapplications. Wiley, New York, pp 87–132
Yair A, Lavee H (1985) Runoff generation in arid and semiarid zones.In: Anderson MG, Burt TP (eds) Hydrological forecasting.Wiley, New York, pp 183–220 Chap.8
Yen BC, Lee KT (1997) Unit hydrograph derivation for ungaugedcatchments by stream-order laws. J Hydraul Eng 2(1):1–9
Arab J Geosci (2011) 4:785–801 801