Runoff characteristic in flood and dry seasons based on wavelet analysis in the source regions of...
12
J. Geogr. Sci. 2012, 22(2): 261-272 DOI: 10.1007/s11442-012-0925-2 © 2012 Science Press Springer-Verlag Received: 2011-05-10 Accepted: 2011-10-12 Foundation: National Key Project of Scientific and Technical Supporting Programs, No.2009BAC61B01 Author: Bing Longfei (1979–), Ph.D, specialized in regional water and heat balance. E-mail: [email protected] * Corresponding author: Shao Quanqin, Professor, specialized in GIS and ecosystem informatics. E-mail: [email protected] www.geogsci.com springerlink.com/content/1009-637X Runoff characteristics in flood and dry seasons based on wavelet analysis in the source regions of the Yangtze and Yellow rivers BING Longfei 1,2 , * SHAO Quanqin 1 , LIU Jiyuan 1 1. Institute of Geographic Sciences and Natural Resources Research, CAS, Beijing 100101, China; 2. Graduate University of Chinese Academy of Sciences, Beijing 100049, China Abstract: By decomposing and reconstructing the runoff information from 1965 to 2007 of the hydrologic stations of Tuotuo River and Zhimenda in the source region of the Yangtze River, and Jimai and Tangnaihai in the source region of the Yellow River with db3 wavelet, runoff of different hydrologic stations tends to be declining in the seasons of spring flood, summer flood and dry ones except for that in Tuotuo River. The declining flood/dry seasons series was summer > spring > dry; while runoff of Tuotuo River was always increasing in different stages from 1965 to 2007 with a higher increase rate in summer flood seasons than that in spring ones. Complex Morlet wavelet was selected to detect runoff periodicity of the four hydrologic stations mentioned above. Over all seasons the periodicity was 11–12 years in the source region of the Yellow River. For the source region of the Yangtze River the periodicity was 4–6 years in the spring flood seasons and 13–14 years in the summer flood seasons. The differ- ences of variations of flow periodicity between the upper catchment areas of the Yellow River and the Yangtze River and between seasons were considered in relation to glacial melt and annual snowfall and rainfall as providers of water for runoff. Keywords: wavelet analysis; periodicity; runoff; flood seasons; dry seasons 1 Introduction The headwaters of the three rivers regions are the source of the Yangtze, the Yellow (Huanghe) and the Lancang rivers, which contain many rivers, lakes, swamps, snow moun- tains and glaciers and constitute the highest and largest wetlands in the world and have many different types of wetlands. They are commonly known as the source of the great rivers, or as China water tower and function as an ecological screen for the middle and lower reaches of the rivers and their surrounding areas. It is of key importance to the sustainable regional development of the total catchment area begun by its headwaters. Consequently, research on the hydrological characteristics of the concerned regions is of great importance in managing water resource reserves with the increasing demands for water from the Yellow, Yangtze and
-
Upload
independent -
Category
Documents
-
view
0 -
download
0
Transcript of Runoff characteristic in flood and dry seasons based on wavelet analysis in the source regions of...
J. Geogr. Sci. 2012, 22(2): 261-272 DOI: 10.1007/s11442-012-0925-2
© 2012 Science Press Springer-Verlag
Received: 2011-05-10 Accepted: 2011-10-12 Foundation: National Key Project of Scientific and Technical Supporting Programs, No.2009BAC61B01 Author: Bing Longfei (1979–), Ph.D, specialized in regional water and heat balance. E-mail: [email protected] *Corresponding author: Shao Quanqin, Professor, specialized in GIS and ecosystem informatics. E-mail: [email protected]
www.geogsci.com springerlink.com/content/1009-637X
Runoff characteristics in flood and dry seasons based on wavelet analysis in the source regions of the Yangtze and Yellow rivers
BING Longfei1,2, *SHAO Quanqin1, LIU Jiyuan1 1. Institute of Geographic Sciences and Natural Resources Research, CAS, Beijing 100101, China; 2. Graduate University of Chinese Academy of Sciences, Beijing 100049, China
Abstract: By decomposing and reconstructing the runoff information from 1965 to 2007 of the hydrologic stations of Tuotuo River and Zhimenda in the source region of the Yangtze River, and Jimai and Tangnaihai in the source region of the Yellow River with db3 wavelet, runoff of different hydrologic stations tends to be declining in the seasons of spring flood, summer flood and dry ones except for that in Tuotuo River. The declining flood/dry seasons series was summer > spring > dry; while runoff of Tuotuo River was always increasing in different stages from 1965 to 2007 with a higher increase rate in summer flood seasons than that in spring ones. Complex Morlet wavelet was selected to detect runoff periodicity of the four hydrologic stations mentioned above. Over all seasons the periodicity was 11–12 years in the source region of the Yellow River. For the source region of the Yangtze River the periodicity was 4–6 years in the spring flood seasons and 13–14 years in the summer flood seasons. The differ-ences of variations of flow periodicity between the upper catchment areas of the Yellow River and the Yangtze River and between seasons were considered in relation to glacial melt and annual snowfall and rainfall as providers of water for runoff.
Keywords: wavelet analysis; periodicity; runoff; flood seasons; dry seasons
1 Introduction The headwaters of the three rivers regions are the source of the Yangtze, the Yellow (Huanghe) and the Lancang rivers, which contain many rivers, lakes, swamps, snow moun-tains and glaciers and constitute the highest and largest wetlands in the world and have many different types of wetlands. They are commonly known as the source of the great rivers, or as China water tower and function as an ecological screen for the middle and lower reaches of the rivers and their surrounding areas. It is of key importance to the sustainable regional development of the total catchment area begun by its headwaters. Consequently, research on the hydrological characteristics of the concerned regions is of great importance in managing water resource reserves with the increasing demands for water from the Yellow, Yangtze and

262 Journal of Geographical Sciences
Lancang-Mekong Rivers and indicates changes of climate both in temperature and the amount and pattern of precipitation in China as well as Indochina.
Flow information is usually from measurement made by hydrologic stations with finite water resource gauges. Wavelet analysis can make full use of existing information. The method of wavelet analysis has been developed by several important studies, starting with the work by Haar’s in the early 20th century. A notable contribution to wavelet theory was Zweig’s discovery of the continuous wavelet transform in 1975 (originally called the co-chlear transform and discovered while studying the reaction of the ear to sound) (Zweig, 2007). Since then, wavelet analysis quickly became a focus of attention both in China and other countries (Ashley and Lange, 2007; Kumar and Foufoula-Georgiou, 1993; Wang et al., 2002; Liu and Fu, 2008; Wang and Meng, 2008; Yuan et al., 2007; Adam et al., 2010; Xu et al., 2011). Most studies of hydrological fluctuation in source regions centered on separate watersheds or basin segments/patches (Xue et al., 2002; Shi et al., 2007). Several studies have focused on climate element changes in the source regions of the Yangtze and Yellow rivers or some hydrological element – for only one season or just a whole year (Wang, 2006; Liang et al., 2007; Wang, 2009; Wang et al., 2010; Liang et al., 2010).
The origin of water differs in different flood/dry seasons and in different basins of the source regions. There are relatively few studies that account for these differences in China and elsewhere. Rising temperature has changed the characteristics of glaciers and permafrost in the source regions of the Yangtze and Yellow rivers in recent years (Yang et al., 2007). As well, grassland degradation has changed evapotranspiration in the regions in recent years (Ma et al., 2010). Comprehensive analysis of annual runoff variations may mask some of the seasonal information. Yang et al. (2005) researched the runoff characteristics of the source regions of the Yangtze and Yellow rivers by wavelet analysis, and focused on runoff periodic character, but did not involve any flood or dry season’s information. This paper analyzed runoff characteristics in different flood and dry seasons of the Yangtze and Yellow rivers, and discussed its relatively long-term trend and periodicity.
2 Theory of wavelet analysis
Development of wavelet analysis is a very important milestone in the history of Fourier analysis, otherwise known as mathematical “microscope”. There are mainly two types of basic application of time series to water resource research: (1) singularity detection, such as periodic fluctuations of runoff series; and (2) quantitative description of process information (Wang et al., 2002) , such as long-term trend of runoff changes.
Trend analysis mainly focuses on the increasing or decreasing variation of hydrologic time series, which is needed for water resource development and control. Trends in a sense can be seen as periodicity. But it is much longer than the longest periodic component. The trend is the slowest part of the signal. If the signal itself includes sharp changes, then suc-cessive approximations look less and less similar to the original signal. In wavelet decom-position and reconstruction low frequency stands for the runoff information trend, while higher one indicates runoff periodicity. The higher one decreases with further wavelet de-composition. When going on with next level decomposition, the higher frequency compo-nent is removed. Then the left is the long-term trend for hydrologic time series.
Hydrologic measurement is generally discrete. By multi-resolution wavelet analysis

BING Longfei et al.: Runoff characteristics in flood and dry seasons based on wavelet analysis in the source regions 263
method (MRA), it can be divided into low and high frequency components. As described above, the hydrologic trend is determined by the low frequency one, while the high one of the hydrological series implies periodic information.
The wavelet coefficient Wf, which reflects the signal in time and frequency domain, is de-rived by wavelet transform at different scales. It is usually difficult to choose a proper wavelet function for wavelet transform. There are usually two methods to select an appro-priate wavelet function: one is through experience and repeated trials to select the appropri-ate wavelet function; the other is to select a shape similar wavelet to the signal to be ana-lyzed (Liu et al., 2009).
For most functions or signals f (x), the wavelet transform is:
( , ) ( , )1( , ) ( ) ( ) ( )f a b a bR R
x bW a b f x x dx f x dxaa
ψ ψ −⎛ ⎞= = ⎜ ⎟⎝ ⎠∫ ∫ (1)
where Ψ is the mother wavelet, Wf (a, b) is the wavelet transform coefficient, a is the scale factor and b is the center of time.
There are different types of wavelet families whose qualities vary according to several criteria. Daubechies wavelets (dbN families, N is the wavelet order. some authors use 2N instead of N) are similar to the variation of hydrological characteristics; there also exists simple relationship between Morlet wavelet and hydrologic periodicity. So these two types of wavelet are chosen as mother wavelet in this paper.
2.1 dbN wavelet family
The French scholar Ingrid Daubechies did intensive research on wavelet transform with in-teger power of scale of two (i.e., 2i, i ∈ Z +). The Daubechies wavelet transforms are de-fined in the same way as the Haar wavelet. There is a scaling function, which generates an orthogonal multiresolution analysis for every different wavelet type of this class. Daubechies orthogonal wavelets D2-D20 are widely used. Db1 is known as Harr wavelet. It is called compactly supported orthonormal wavelets in time domain and frequency domain–thus making discrete wavelet analysis practicable, which means a limited ψ(t) length and the higher order origin moment ( ) 0,pt t dt p NΨ = ∈∫ , and exists N order zero of ˆ ( )wΨ when
ω = 0. Most dbN wavelets are not symmetrical. For some, the asymmetry is very pro-nounced. The wavelets of this family do not have an explicit expression except for db1-Harr wavelet.
2.2 Morlet wavelet
The Morlet wavelet is defined as ( )2 2( ) cos 5xx Ce x−Ψ = . It was originally formulated by
Goupillaud et al. (1984). Conceptually related to windowed-Fourier analysis, the Morlet wavelet is a locally periodic wavetrain. It is obtained by taking a complex sine wave, and by localizing it with a Gaussian (bell-shaped) envelope. The wavelet transform has a real and an imaginary part, and the norm is the magnitude of this transform, which is related to local energy.
Wavelet coefficients obtained by wavelet transform reflect the response of time scale to signal. If you want a better understanding of what time scale can best reflect the periodic

264 Journal of Geographical Sciences
regularity of input signal, the wavelet variance is necessary. The extent of variance at corre-sponding time scale is adopted to represent the energy intensity of runoff series. The wavelet variance is defined as follows:
2
1
1( ) ( , )n
jj
V a W a xn =
= ∑ (2)
where V (a) is wavelet variance with scale of a and at the time of xj, n is the length of time series, so the wavelet variance can be expressed as the average of sums of square of wavelet coefficients at scale of a (Bradshaw and Spies, 1992).
The departure of measured hydrological flow data from four hydrological stations in the source regions of the Yangtze and Yellow rivers was calculated to eliminate seasonal variations. The departure of hydrological data was used to perform wavelet transform. After several trials, we chose wavelet decomposition and reconstruction of runoff data (departure) under level five and level six to detect its long-term trend. We ignored that for the Tuotuo River station due to incomplete data.
3 Study area and data used
3.1 Study area
The Three Rivers Headwaters Region (TRHR) (Figure 1), the confluence of the source re-gions of the Yangtze, Yellow and Lancang rivers, is located in southern Qinghai Province, or the hinterland of the northern Qinghai-Tibet Plateau, which borders Tibet, Sichuan and Gansu provinces. The topography is descending from west to east in the region. The western part of the region is mostly plateau with undulating topography of low mountains, hills and open valleys. The main topography of the eastern part is high mountains and canyons. The altitude of the region ranges from 3450 to 6621 m a.s.l. with the alteration of a series of high mountains, valleys and basins.
The regional climate has Qiangtang semiarid and Nagqu-Guoluo sub-humid areas be-longing to the Qinghai-Tibet Plateau sub-arctic climate divisions. It is a typical plateau con-tinental climate, with alternating hot and cold seasons, distinct wet and dry seasons, small maximum and minimum temperature differences, large diurnal temperature ranges, long sunshine duration and strong solar radiation.
The main soil types are alpine cold desert soil, alpine meadow soil, alpine steppe soil, mountain meadow soil, gray cinnamonic soil, chestnut soil, swamp soil and aeolian soils. Alpine meadow soil is of the most abundant soil type, and occurs between 3500 and 4800 m a.s.l. Swamp soil is also very common, and most wet grassland soil belongs to this type. Gray cinnamonic soil mainly occurs in areas where trees and shrubs grow. The soil is shal-low, usually 30–50 cm deep, with more gravels and thin humus.
The approximate 180 rivers and significant streams in the TRHR can be divided into oceanic and inland waterways. The Yangtze River rises in the Geladandong snow-covered mountain in the north of the Tanggula Mountains and has an average annual runoff from the TRHR of about 177×108 m3. The Yellow River rises in the north of Bayan Har Mountains, and has an average annual runoff from the TRHR catchment of about 107×108 m3. Rain and snow melt water are the main water sources of the Yangtze and Yellow rivers.

BING Longfei et al.: Runoff characteristics in flood and dry seasons based on wavelet analysis in the source regions 265
Figure 1 Three Rivers Headwaters Region, Qinghai, China and location of rivers and hydrological stations involved in the runoff study
3.2 Data used
We use hydrological monitored runoff data from the Jimai and Tangnaihai hydrologic sta-tions in the source region of the Yellow River from 1965 to 2007, and from the Tuotuo River and Zhimenda hydrologic stations in the source region of the Yangtze River from 1965 to 2007. As the runoff data for the Tuotuo River was not continuous, only the runoff in spring and summer flood seasons for this catchment was discussed in this paper.
Runoff, precipitation and other environmental factors changed significantly in different flood or dry seasons in the source regions of the Yangtze and Yellow rivers. We divided the whole year into three periods (hydro-stages) for different basins (Table 1). The monitored runoff data was averaged in each hydrological stage.
Table 1 Definition of flood/dry seasons in the source regions of the Yangtze and Yellow rivers
Rivers Hydro-stage Time period Spring flood seasons Late March to early June
Summer flood seasons Mid-June to late October Source region of the Yellow RiverDry seasons Early December to early March
Spring flood seasons Mid-April to early June Summer flood seasons Mid-June to late September Source region of the Yangtze River
Dry seasons Early December to late March
4 Result and discussion
4.1 The basic statistical characteristics of runoff in the source regions of the Yangtze and Yellow rivers
The average flows for the Tangnaihai and Jimai hydrological stations in the source region of the Yellow River were 633.3 m3 s−1 and 127.2 m3 s−1 annually and 1103.7 m3 s−1 and 229.1 m3 s−1 in the summer flood seasons respectively. The maximum annual average flows were 1

266 Journal of Geographical Sciences
039.6 m3 s−1 for Tangnaihai and 261.9 m3 s−1 for Jimai, while the minimum flows were 329.1 m3 s−1 and 60.8 m3 s−1 for the stations respectively. The maximum flows in summer flood seasons were 1956.6 m3 s−1 and 513.5 m3 s−1, and the minimum flows were 527.8 m3 s−1 and 94.9 m3 s−1 respectively at these two hydrologic stations. The annual average flow at Jimai was about 20% of that at Tangnaihai. The Tangnaihai hydrologic station is located in the lower reaches of the source region of the Yellow River, and the volume of runoff changed more than that of Jimai but with relatively smaller variation.
The average flows in the summer flood seasons were 895.1 m3 s−1 at Zhimenda and 73.3 m3 s−1 at Tuotuo River in the source region of the Yangtze River. The maximum flows in summer flood seasons were 1652.4 m3 s−1 at Zhimenda and 175.5 m3 s−1 at Tuotuo River, and the minimum flows were 447.2 m3 s−1 at Zhimenda and 21.3 m3 s−1 at Tuotuo River. The annual average flow at the Tuotuo River hydrologic station was about 20% of that at Zhi-menda.
4.2 Basic character of Runoff in the source regions of the Yangtze and Yellow rivers
The monitored runoff data from four hydrological stations were used to perform wavelet transformation by mother wavelet of db3; wavelet decomposition produces a family of hier-archically organized decompositions. Among the decompositions, high frequency is re-moved, leaving the lowest one, to reflect the trend of runoff during the past 43 years. 1) The runoff trend in different flood/dry seasons in the source region of the Yellow River Runoff decreased at both the Jimai and Tangnaihai stations in the source region of the Yel-low River in the past 43 years from 1965 to 2007 (Figures 2a and 2b). Turning point of
Figure 2 Low frequency reconstruction of runoff departures in different hydrologic stations and in flood/dry seasons in the source regions of the Yangtze and Yellow rivers, Qinghai, China

BING Longfei et al.: Runoff characteristics in flood and dry seasons based on wavelet analysis in the source regions 267
flow appeared to be in 1968 and 2000. Flow decreased more quickly from 1968 to 2000 than before 1968. Flow in spring flood and dry seasons in the source region of the Yellow River decreased more slowly than the summer flows. By comparison there was little change of flow in dry seasons over the 43 years. 2) The runoff trend in different flood/dry seasons in the source region of the Yangtze River
Flows at the Tuotuo River station in the source region of the Yangtze River increased during the 43 years from 1965 to 2007, and the rate of this change was faster for the summer flood seasons than the spring flood seasons (Figure 2d). The pattern of flow change with years at Zhimenda (Figure 2c) was similar to that of the Yellow River hydrological stations (Figures 2a and 2b), the decrease in rates for the spring and summer flood seasons being similar. However, changes of flows with years in summer flood seasons remained larger than that in spring flood seasons in this region (Figure 2c). In dry seasons, as for the Yellow River stations, the change of flows over the 43 years in the Yangtze River source was negligible.
4.3 Periodic features of discharge series
Continuous wavelet transform (CWT) by the Morlet procedure was performed on the flow departures of the four hydrologic stations in the source regions of the Yangtze and Yellow rivers in flood and dry seasons. The real part of Morlet complex wavelet transform coeffi-cients were shown in Figures 3 and 4.
Figure 3 Real distribution of Morlet wavelet coefficient about runoff at the (a) Tangnaihai and (b) Jimai hydro-logical stations in the source region of the Yellow River, Qinghai, China
1) Periodic features of discharge series in the source region of the Yellow RiverThe fre-quency energy was concentrated on the time scales of 5–15 and 20–25 years in

268 Journal of Geographical Sciences
spring flood seasons, 10–15 years and 5 years in summer flood seasons and 10–15 years and 20–25 years in dry seasons according to monitored data at Tangnaihai hydrological station in the source region of the Yellow River (Figure 3a).
The fluctuation energy of flow at Jimai centered on the time scales of 5–15 years and 20–25 years in spring flood seasons, 10–15 years and 5 years in summer flood seasons (Fig-ure 3b). This was similar to the corresponding seasons at Tangnaihai. In dry seasons the pat-tern at Jimai was also similar to that at Tangnaihai, with energy peaks centered on 10–15 years, 5 years and 20–25 years. 2) Periodic features of discharge series in the source region of the Yangtze River
The fluctuation energy for the Zhimenda hydrological station centered on the time scales of 5–10 years, 15–35 years and 20–25 years in spring flood seasons, 5–15 years and 25–35 years in summer flood seasons and 5–15 years and about 30 years in dry seasons (Figure 4a).
The fluctuation energy for the Tuotuo River station centered on the time scales of 5–10 years and 15–35 years in spring flood seasons, while 6–30 years had relatively broad distri-bution of fluctuation energy in summer flood seasons (Figure 4d). Further information about the exact location of maximum energy should be explored by wavelet variance analysis.
4.4 Wavelet variance of discharge series
The maximum of wavelet coefficients calculated by formula were plotted in Figure 5 and listed in Table 2. The highest coefficient occurred at year eight at Tangnaihai in spring flood seasons, i.e., the major periodicity was 8 years in spring flood seasons at Tangnaihai; other
Figure 4 Real distribution of Morlet waveletcoefficient about runoff at the (a) Zhimendaand (b) Tuotuo River hydrological stations inthe source region of the Yangtze River, Qing-hai, China

BING Longfei et al.: Runoff characteristics in flood and dry seasons based on wavelet analysis in the source regions 269
Table 2 Periodicity in years of wavelet variance in different flood/dry seasons in the source regions of the Yangtze and Yellow rivers, Qinghai, China
Tangnaihai Jimai Zhimenda Tuotuo River
Spring flood seasons 8, 11, 22 12, 8, 6, 23 6, 12, 25 4, 6, 19, 30
Summer flood seasons 12 12, 7 13, 34, 9 25, 14
Dry seasons 12 12 13, 34
relatively large variances occurred at 11 and 22 years, indicating the existence of sub-periodicities of 11 and 22 years in spring flood seasons. The major periodicity was 12 years in both summer flood and dry seasons at Tangnaihai.
The major periodicity was 12 years and the minor ones were 8, 6 and 23 years in spring flood seasons at Jimai, whereas in summer flood seasons the major periodicity was 12 years and the minor one was 7 years. In dry seasons the major periodicity was 12 years (Table 2).
From the above it was indicated that there was a 12-year major periodicity (Figure 5 and Table 2) when there were major periodic variances of flow in flood and dry seasons in the source region of the Yellow River. Although the major periodicity at Tangnaihai was 8 years in spring flood seasons, the wave energy with its minor periodicity of 11 years was also strong; so we could say that the periodicity was 11–12 years in the source region of the Yellow River, indicating that the source of water supply was very stable. The contributing fac- tors of ecosystem water requirements, evapotranspiration, seasonal precipitation and tem-perature change altered the instantaneous flow, whereas the cyclic character changed little. This means that there was no regular disturbance on the runoff flow in the source region of the Yellow River.
There was a major periodicity of about 6 years and two minor periodicities of 12 and 25 years at Zhimenda in the source region of the Yangtze River in spring flood seasons. In summer flood seasons the major periodicity was 13 years, while the minor ones were 34 and 9 years. In dry seasons the major and minor periodicities were 13 years and 34 years respec-tively. Only the cyclic character in spring and summer flood seasons was considered in this paper for the Tuotuo River, where the major periodicity was 4 years and the minor ones were 6, 19 and 30 years in spring flood seasons. For the Tuotuo River the major periodicity in summer flood seasons was 25 years and the minor one of 14 years (Figure 5 and Table 2).
There was a major periodicity of 13 years and a minor periodicity of 34 years both in summer flood and dry seasons in the upper stream of Zhimenda in the source region of the Yangtze River. Although the major periodicity was 6 years, the fluctuation energy of a 12-year minor periodicity was also very strong (Figures 4 and 5); so it could be concluded that the flow fluctuation periodicity was 12–13 years in the upper stream of Zhimenda.
It could be concluded from above that the periodicity for Tuotuo River in the source re-gion of the Yangtze River was disorder, but it did not affect the flow fluctuation further up-per stream of Zhimenda essentially. There was a 4–6 year periodicity in spring flood seasons and a 13–14 year periodicity in summer flood seasons in the source region of the Yangtze River (Table 2). The main precipitation in spring flood seasons was in the form of snow for the upper stream of Tuotuo River and Zhimenda, and this caused no great flow fluctuation. The periodicity of flow fluctuation was larger in summer flood seasons due to more precipi-tation as rainfall and higher temperatures. In the upper stream of Tutouo River, the flow was mainly from glacial melt, so the periodicity was even larger and was attributed to slowly increasing temperature.

270 Journal of Geographical Sciences
Figu
re 5
W
avel
et v
aria
nce
in d
iffer
ent f
lood
/dry
seas
ons f
or fo
ur h
ydro
logi
cal s
tatio
ns in
the
sour
ce re
gion
s of
the
Yang
tze
and
Yello
w ri
vers
, Qin
ghai
, Chi
na
BING Longfei et al.: Runoff characteristics in flood and dry seasons based on wavelet analysis in the source regions 271
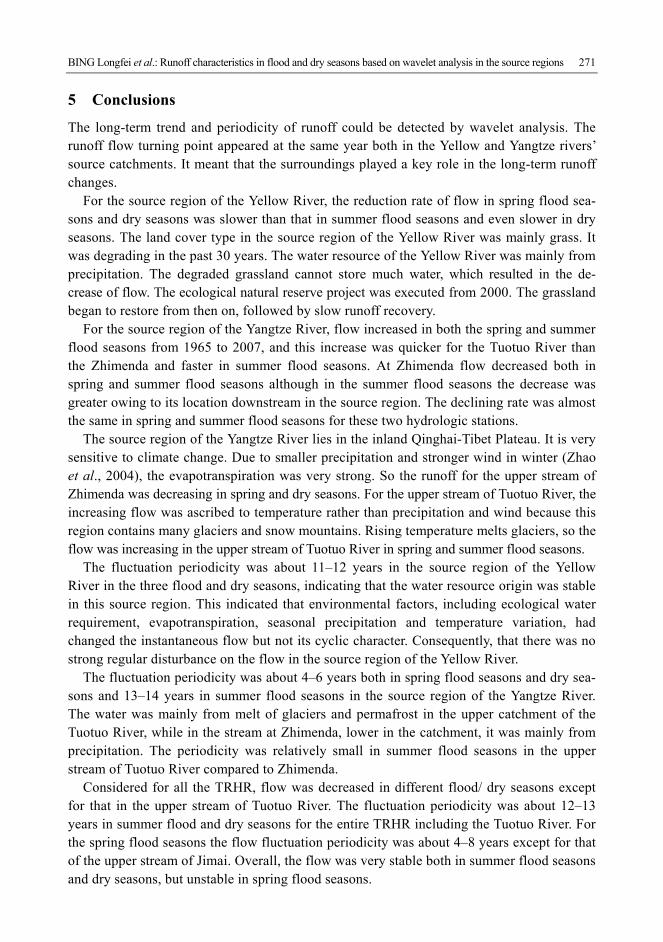
5 Conclusions
The long-term trend and periodicity of runoff could be detected by wavelet analysis. The runoff flow turning point appeared at the same year both in the Yellow and Yangtze rivers’ source catchments. It meant that the surroundings played a key role in the long-term runoff changes.
For the source region of the Yellow River, the reduction rate of flow in spring flood sea-sons and dry seasons was slower than that in summer flood seasons and even slower in dry seasons. The land cover type in the source region of the Yellow River was mainly grass. It was degrading in the past 30 years. The water resource of the Yellow River was mainly from precipitation. The degraded grassland cannot store much water, which resulted in the de-crease of flow. The ecological natural reserve project was executed from 2000. The grassland began to restore from then on, followed by slow runoff recovery.
For the source region of the Yangtze River, flow increased in both the spring and summer flood seasons from 1965 to 2007, and this increase was quicker for the Tuotuo River than the Zhimenda and faster in summer flood seasons. At Zhimenda flow decreased both in spring and summer flood seasons although in the summer flood seasons the decrease was greater owing to its location downstream in the source region. The declining rate was almost the same in spring and summer flood seasons for these two hydrologic stations.
The source region of the Yangtze River lies in the inland Qinghai-Tibet Plateau. It is very sensitive to climate change. Due to smaller precipitation and stronger wind in winter (Zhao et al., 2004), the evapotranspiration was very strong. So the runoff for the upper stream of Zhimenda was decreasing in spring and dry seasons. For the upper stream of Tuotuo River, the increasing flow was ascribed to temperature rather than precipitation and wind because this region contains many glaciers and snow mountains. Rising temperature melts glaciers, so the flow was increasing in the upper stream of Tuotuo River in spring and summer flood seasons.
The fluctuation periodicity was about 11–12 years in the source region of the Yellow River in the three flood and dry seasons, indicating that the water resource origin was stable in this source region. This indicated that environmental factors, including ecological water requirement, evapotranspiration, seasonal precipitation and temperature variation, had changed the instantaneous flow but not its cyclic character. Consequently, that there was no strong regular disturbance on the flow in the source region of the Yellow River.
The fluctuation periodicity was about 4–6 years both in spring flood seasons and dry sea-sons and 13–14 years in summer flood seasons in the source region of the Yangtze River. The water was mainly from melt of glaciers and permafrost in the upper catchment of the Tuotuo River, while in the stream at Zhimenda, lower in the catchment, it was mainly from precipitation. The periodicity was relatively small in summer flood seasons in the upper stream of Tuotuo River compared to Zhimenda.
Considered for all the TRHR, flow was decreased in different flood/ dry seasons except for that in the upper stream of Tuotuo River. The fluctuation periodicity was about 12–13 years in summer flood and dry seasons for the entire TRHR including the Tuotuo River. For the spring flood seasons the flow fluctuation periodicity was about 4–8 years except for that of the upper stream of Jimai. Overall, the flow was very stable both in summer flood seasons and dry seasons, but unstable in spring flood seasons.

272 Journal of Geographical Sciences
References
Adam Z, Abbas M, Li Y, 2010. Critical routes identification method using wavelet filtering. In: 13th International IEEE Conference on Intelligent Transportation Systems. Funchal, Madeira Island, Portugal: IEEE.
Ashley E, Lange Ian A, 2007. Using wavelet analysis to detect changes in water temperature regimes at multiple scales: Effects of multi-purpose dams in the Willamette River Basin. River Research and Applications, 23(4): 351–359.
Bradshaw G A, Spies Thomas A, 1992. Characterizing canopy gap structure in forests using wavelet analysis. Journal of Ecology, 80(2): 205–215.
Goupillaud P, Grossmann A, Morlet J, 1984. Cycle-octave and related transforms in seismic signal analysis. Geoexploration, 23(1): 85–102.
Kumar Praveen, Foufoula-Georgiou Efi, 1993. A multicomponent decomposition of spatial rainfall fields: 1. Segre-gation of large- and small-scale features using wavelet transforms. Water Resources Research, 29(8): 2515–2532.
Liang S, Ge S, Wan L et al., 2010. Can climate change cause the Yellow River to dry up? Water Resources Re-search, 46(W02505): 8pp.
Liang Sihai, Wan Li, Hu Fusheng et al., 2007. Periodic regularity of the runoff in the source region of the Yellow River based on wavelet analysis. Journal of Nanjing University (Natural Sciences), 43(3): 300–308. (in Chinese)
Liu Dong, Fu Qiang, 2008. Variation trend analysis of annual precipitation series based on wavelet transform in well- irrigation area of low-lying wetland in Sanjiang Plain. Scientia Geographica Sinica, 28(3): 380–384. (in Chinese)
Liu Jian, Zhang Qi, Xu Chongyu et al., 2009. Characteristics of runoff variation of Poyang Lake watershed in the past 50 years. Tropical Geography, 29(3): 213–224. (in Chinese)
Ma Xieyao, Fukushima Yoshihiro, Yasunari Tetsuzo et al., 2010. Examination of the water budget in upstream and midstream regions of the Yellow River, China. Hydrological Processes, 24(5): 618–630.
Shi Xinghe, Qin Ningsheng, Xu Weijun et al., 2007. The variations characteristic of the runoff in the source re-gions of the Yangtze River from 1956 to 2004. Journal of Mountain Science, 25(5): 513–523. (in Chinese)
Wang Jun, Meng Jijun, 2008. Characteristics and tendencies of annual runoff variations in the Heihe River Basin during the past 60 years. Scientia Geographica Sinica, 28(1): 83–88. (in Chinese)
Wang Junde, 2006. Study on water cycle of typical grassland in source region of Yellow River [D]. Lanzhou: Lanzhou University.
Wang Suhui, Jia Shaofeng, Lü Aifeng, 2010. Period analysis and trend forecasting of annual runoff of Sanjian-gyuan based on wavelet transform. Journal of Capital Normal University (Natural Science Edition), 31(5): 51–57. (in Chinese)
Wang Suping, 2009. Trend of potential evapotranspiration and its main impact factors in the source regions of Yangtze and Yellow rivers. Journal of Desert Research, 29(5): 960–965. (in Chinese)
Wang Wensheng, Ding Jing, Xiang Honglian, 2002. Application and prospect of wavelet analysis in hydrology. Advances in Water Science, 13(4): 515–520. (in Chinese)
Xu Jianhua, Chen Yaning, Lu Feng et al., 2011. The nonlinear trend of runoff and its response to climate change in the Aksu River, western China. International Journal of Climatology, 31(5): 687–695.
Xue Xiaojie, Jiang Xiaohui, Huang Qiang et al., 2002. The application of wavelet analysis in hydrological se-quence trend analysis. Journal of Applied Sciences, 20(4): 426–428. (in Chinese)
Yang Jianping, Ding Yongjian, Chen Rensheng, 2005. Analysis on periodic variations of annual hydrologic and meteorological series in source regions of Yangtze and Yellow rivers. Journal of Desert Research, 25(3): 351–355. (in Chinese)
Yang Jianping, Ding Yongjian, Chen Rensheng, 2007. Climatic causes of ecological and environmental variations in the source regions of the Yangtze and Yellow rivers of China. Environmental Geology, 53(1): 113–121.
Yuan Shujie, Miao Qilong, Gu Xiaoping et al., 2007. Analysis on the spring drought in the karst region of Yun-nan and Guizhou Plateau in China. Scientia Geographica Sinica, 27(6): 796–800. (in Chinese)
Zweig George, 2007. Biography on Scienceworld.wolfram.com. [http://scienceworld.wolfram.com/biography/ Zweig.html].