201308-Expression of mycosporine-like amino acids biosynthetic genes-kais

Mar. Drugs 2015, 13, 1410-1431; doi:10.3390/md13031410
marine drugs
ISSN 1660-3397
www.mdpi.com/journal/marinedrugs
Communication
Solvent Separating Secondary Metabolites Directly from
Biosynthetic Tissue for Surface-Assisted Laser Desorption
Ionisation Mass Spectrometry
David Rudd 1, Kirsten Benkendorff 2,* and Nicolas H. Voelcker 3
1 Biological Sciences, Faculty of Science and Engineering, Flinders University of South Australia,
PO Box 2100, Adelaide, SA 5001, Australia; E-Mail: [email protected] 2 Marine Ecology Research Centre, School of Environment, Science and Engineering,
Southern Cross University, PO Box 157, Lismore, NSW 2480, Australia 3 Australian Research Council Centre of Excellence in Convergent Bio-Nano Science and
Technology, Mawson Institute, University of South Australia, GPO Box 2471, Adelaide,
South Australia 5001, Australia; E-Mail: [email protected]
* Author to whom correspondence should be addressed; E-Mail: [email protected];
Tel.: +61-2-662-03755; Fax: +61-2-662-12669.
Academic Editor: Sylvia Urban
Received: 30 November 2014 / Accepted: 2 March 2015 / Published: 16 March 2015
Abstract: Marine bioactive metabolites are often heterogeneously expressed in tissues
both spatially and over time. Therefore, traditional solvent extraction methods benefit from
an understanding of the in situ sites of biosynthesis and storage to deal with heterogeneity
and maximize yield. Recently, surface-assisted mass spectrometry (MS) methods namely
nanostructure-assisted laser desorption ionisation (NALDI) and desorption ionisation on porous
silicon (DIOS) surfaces have been developed to enable the direct detection of low molecular
weight metabolites. Since direct tissue NALDI-MS or DIOS-MS produce complex spectra
due to the wide variety of other metabolites and fragments present in the low mass range,
we report here the use of “on surface” solvent separation directly from mollusc tissue onto
nanostructured surfaces for MS analysis, as a mechanism for simplifying data annotation
and detecting possible artefacts from compound delocalization during the preparative steps.
Water, ethanol, chloroform and hexane selectively extracted a range of choline esters,
brominated indoles and lipids from Dicathais orbita hypobranchial tissue imprints. These
compounds could be quantified on the nanostructured surfaces by comparison to standard
OPEN ACCESS
Mar. Drugs 2015, 13 1411
curves generated from the pure compounds. Surface-assisted MS could have broad utility
for detecting a broad range of secondary metabolites in complex marine tissue samples.
Keywords: secondary metabolites; solvent separation; surface-assisted mass spectrometry;
brominated indoles; choline esters; Dicathais orbita; hypobranchial gland
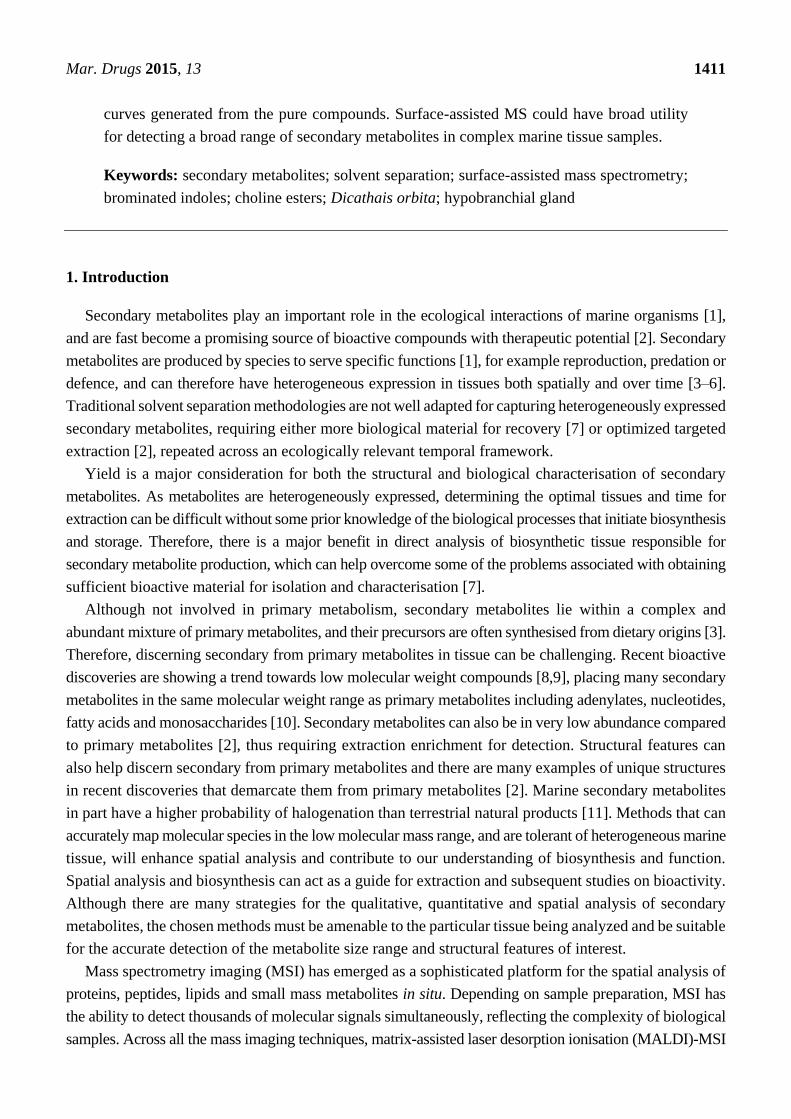
1. Introduction
Secondary metabolites play an important role in the ecological interactions of marine organisms [1],
and are fast become a promising source of bioactive compounds with therapeutic potential [2]. Secondary
metabolites are produced by species to serve specific functions [1], for example reproduction, predation or
defence, and can therefore have heterogeneous expression in tissues both spatially and over time [3–6].
Traditional solvent separation methodologies are not well adapted for capturing heterogeneously expressed
secondary metabolites, requiring either more biological material for recovery [7] or optimized targeted
extraction [2], repeated across an ecologically relevant temporal framework.
Yield is a major consideration for both the structural and biological characterisation of secondary
metabolites. As metabolites are heterogeneously expressed, determining the optimal tissues and time for
extraction can be difficult without some prior knowledge of the biological processes that initiate biosynthesis
and storage. Therefore, there is a major benefit in direct analysis of biosynthetic tissue responsible for
secondary metabolite production, which can help overcome some of the problems associated with obtaining
sufficient bioactive material for isolation and characterisation [7].
Although not involved in primary metabolism, secondary metabolites lie within a complex and
abundant mixture of primary metabolites, and their precursors are often synthesised from dietary origins [3].
Therefore, discerning secondary from primary metabolites in tissue can be challenging. Recent bioactive
discoveries are showing a trend towards low molecular weight compounds [8,9], placing many secondary
metabolites in the same molecular weight range as primary metabolites including adenylates, nucleotides,
fatty acids and monosaccharides [10]. Secondary metabolites can also be in very low abundance compared
to primary metabolites [2], thus requiring extraction enrichment for detection. Structural features can
also help discern secondary from primary metabolites and there are many examples of unique structures
in recent discoveries that demarcate them from primary metabolites [2]. Marine secondary metabolites
in part have a higher probability of halogenation than terrestrial natural products [11]. Methods that can
accurately map molecular species in the low molecular mass range, and are tolerant of heterogeneous marine
tissue, will enhance spatial analysis and contribute to our understanding of biosynthesis and function.
Spatial analysis and biosynthesis can act as a guide for extraction and subsequent studies on bioactivity.
Although there are many strategies for the qualitative, quantitative and spatial analysis of secondary
metabolites, the chosen methods must be amenable to the particular tissue being analyzed and be suitable
for the accurate detection of the metabolite size range and structural features of interest.
Mass spectrometry imaging (MSI) has emerged as a sophisticated platform for the spatial analysis of
proteins, peptides, lipids and small mass metabolites in situ. Depending on sample preparation, MSI has
the ability to detect thousands of molecular signals simultaneously, reflecting the complexity of biological
samples. Across all the mass imaging techniques, matrix-assisted laser desorption ionisation (MALDI)-MSI

Mar. Drugs 2015, 13 1412
is the most frequently utilised [12] of the laser desorption ionisation (LDI) methods. Unfortunately,
MALDI-MSI has limitations in the low mass range, due to interference from spectra generated by the
applied matrix [13]. The use of matrix in the analysis of low molecular weight metabolites complicates
data and further challenges the identification of secondary metabolites. MSI also generates considerable
spectral data requiring molecular identification, which is a major hurdle in MSI workflows [12], often
complicated by matrix ion signals.
New technologies using surface-assisted LDI methodologies [14] have been developed as an alternative
to the use of matrices. Nanostructured surfaces have emerged that enhance the detection of small molecules,
with an emphasis on increased sensitivity, minimal background signal and simplified sample preparation [15].
Ionization techniques from nanostructured surfaces, such as, nanostructure-assisted laser desorption
ionization (NALDI) [14] and desorption ionization on silicon (DIOS) [16–18] offer improved mass
analysis in the low molecular weight range. Nanostructured surfaces eliminate the need for a matrix as the
physical properties of the surface allow effective absorption of the UV laser light, thereby transferring
energy to the analyte of interest [16,17]. The properties of the nanostructured surfaces also has a considerable
advantage for some tissue types, specifically mucus rich biosynthetic tissues [19]. Functionalization of
the DIOS surface attract small molecule metabolites through hydrophobic effects or specific molecular
recognition [20,21], which allows other contaminants, like salts and mucus aggregate clumps, to wash
away from the area of LDI-MS analysis [19]. NALDI bears some of the same attractive properties as DIOS
surfaces, but requires less laser energy for ionization, greatly limiting fragmentation [22]. Nanostructured
surfaces provide a matrix-free strategy within the LDI suite of methods when generating spectra, as an
alternative to using other direct methods for non-matrix analysis, e.g., ambient methods like direct
electrospray ionization mass spectrometry (ESI-MS) in the form of liquid surface extraction analysis
(LESA®), desorption electrospray ionization (DESI) and nano-desorption electrospray ionization
(nanoDESI) [23].
Recently, we applied NALDI-MSI and DIOS-MSI to detect the spatial distribution of mollusc secondary
metabolites via a tissue imprinting approach [19]. This approach allowed us to map the distribution of Tyrian
purple and its precursors, but the elucidation of some spatially interesting spectra became challenging
due to the complexity of spectral signals from the imprinted heterogeneous tissue samples. Spectral data
from fragments of larger more labile molecules can be found within the low mass region, making
identification of known secondary metabolites difficult and the interpretation of unknown or unexpected
secondary metabolites complex. In order to improve secondary metabolite detection and elucidation, a
simple chromatographic separation scheme was devised to selectively extract metabolites directly from
the tissue on to the nanostructured surface for analysis. Direct separation onto the nanostructured surfaces
can be done from frozen sections and under nitrogen gas (Figure 1), reducing enzymatic changes and
atmospheric oxidative degradation, while maintaining the benefits of the nanostructured surfaces. Since
LDI-MS analysis is also conducted in a high vacuum environment without light, oxidative and photo
catalytic degradation affecting less stable secondary metabolites is reduced. The solvent wash area
adjacent to the tissue (Figure 2) can subsequently be used to concentrate particular subsets of compounds
according to their solubility, thus facilitating identification based on simpler spectra and structural features,
e.g. polarity, halogenation. Furthermore, this technique can enable quantification of natural products
from tissue imprints by generating standard concentration curves from the purified compounds on the
adjacent nanostructured surfaces for comparison of the LDI-MS signal intensity.

Mar. Drugs 2015, 13 1413
Figure 1. Concept of “on-surface” solvent separation to concentrate secondary metabolites
of various polarity from tissue imprints of the biosynthetic regions of D. orbita, onto
nanostructure-assisted laser desorption ionisation (NALDI) and desorption ionisation on porous
silicon (DIOS) surfaces for Mass spectrometry imaging (MSI).
Figure 2. MSI detection region after EtOH separation of secondary metabolites on a DIOS
surface. 15 μm thick tissue sections were imprinted onto the nanostructured surface then washed
by gently pipetting solvent over the imprint area, onto a clean section of the surface (-----),
where the solvent was then allowed to evaporate before LDI-MS; (a) scan of tissue on DIOS;
(b) MSI of murexine 224 m/z; (c) MSI of tyrindoxyl sulfate 340 m/z; (d) MSI of tyrindoleninone
256 m/z; (e) MSI of Tyrian purple 421 m/z and (f) example an histological tissue section of
the hypobranchial region stained with haematoxylin and eosin.

Mar. Drugs 2015, 13 1414
Tyrian purple, brominated indole precursors and choline esters have previously been detected in the
hypobranchial gland, reproductive structures and egg capsules [5,19,24] of muricid molluscs. The choline
esters have potent neuromuscular blocking activity [25,26] and have been implied to aid predation,
whilst the brominated indoles are suggested to provide antimicrobial defence in the egg capsules [26,27].
In additional to their ecological value, the choline esters have undergone human clinical trials for pain
management [25], whereas the brominated indoles, tyrindoleninone and 6-bromoisatin, have shown
promise as anti-cancer compounds, inducing an apoptotic response in a range of cell lines and in vivo
models [28–31]. Understanding the distribution of these two classes of secondary metabolites, and the
optimization of rapid detection methods, will not only contribute to the ongoing ecological research into
their functional ecology, but could also facilitate biodistributional studies in future in vivo animal models
for development of muricid hypobranchial gland extracts as natural medicines [32].
Here we describe the use of “on-surface” solvent separation of secondary metabolites from tissue imprints
of the biosynthetic regions of a marine mollusc (Figure 1). This process allowed solvent extraction of subsets
of secondary metabolites, according to polarity, directly from hypobranchial tissue onto nanostructured
surfaces for immediate LDI-MS to gain qualitative and relative quantitative data that is compatible with
LDI-imaging data [19]. Water (H2O), ethanol (EtOH), chloroform (CHCl3) and n-hexane were independently
applied to tissue, to cover a typical solvent profile able to capture hydrophilic to lipophilic low molecular
weight secondary metabolites (Figure 1). The identification of particular secondary metabolites that were
either retained in the tissue imprints, or washed onto the nanostructured surfaces after solvent separation
(Figure 2), was confirmed by standard extraction methods and solvation characteristics, e.g., LogP.
Relative quantification of secondary metabolites on the nanostructured surfaces was determined against
available standards for 6-bromoisatin, tyrindoleninone and Tyrian purple. Nanostructured surfaces
provide an excellent platform for spatial analysis of secondary metabolites [33] using LDI and simple
chromatographic manipulations can greatly simplify annotation and de-replication efforts [34]. Direct
solvent extraction onto nanostructured surfaces from biosynthetic hypobranchial tissue regions allows
rapid and simplified quantitative and qualitative analysis of both brominated indoles and choline esters
in the absence of spectra that would otherwise suppress detection.
2. Results and Discussion
On surface solvent extraction from biosynthetic regions of marine mollusc tissue (Figure 1) was
effective in detecting spectral signals associated with secondary metabolites on both NALDI and DIOS
substrates (Table 1). This approach not only simplified identification (Figure 3) and but also allowed
specific metabolite fragments to be co-detected in the absence of complicated spectral patterns associated
with primary metabolites and lipid fragments (e.g., murexine, Figure 3). Known metabolites had comparable
masses for both NALDI-MS and DIOS-MS, but varied in +H additions compared to LC-MS (Figure 3).
Using matrix free LDI-MS, the metabolites were all detected using positive ionization in reflectron mode.
High resolution for detected compounds could effectively discern isotopic patterns for identification of
bromine. Only two known precursor brominated indoles were not detected using nanostructured surfaces;
tyrindoxyl and tyriverdin remained elusive, most likely due to rapid oxidation [32,35].

Mar. Drugs 2015, 13 1415
Table 1. NALDI-MS and DIOS-MS detected secondary metabolites from the nanostructured surfaces adjacent to the hypobranchial gland after
solvent separation. + Indicates detection within combined spectra.
Compound Class/Compound Formula MW Detected in Solvent Wash LDI-MS Major Ions m/z Major Ions m/z
Water Ethanol Chloroform Hexane [M] NALDI DIOS RT (min) LC-MS
Brominated indoles
Tyrindoxyl sulfate C9H7BrNO4S2
− 337.196 + + [M + H]+ 337, 339 337, 339 6.52 336, 338
[M + 4H]+ 341, 343 341, 343
Tyrindoxyl C9H8BrNOS 258.140
Tyrindoleninone C9H6BrNOS 256.124 + + [M]+ 256, 258 256, 258 10.96 256, 258
Tyrindolinone C10H10BrNOS2 304.234 + + [M]+ 304, 306 -
6-Bromoisatin C8H4BrNO2 226.029 + + [M]+ 224, 226 224, 226 6.35 224, 226
Tyriverdin C18H14Br2N2O2S2 514.264 11.67 511, 513, 515
Tyrian purple (6,6′-Dibromoindigo) C16H8Br2N2O2 420.060 + [M + 2H]+ 419, 421, 423 419, 421, 423 14.34 417, 419, 421
6,6′-Dibromoindirubin C16H8Br2N2O2 420.060 + [M + 2H]+ 419, 421, 423 419, 421, 423
Choline esters
Choline C5H14NO+ 104.173 + + + [M]+ 104 104
Murexine C11H18N3O2+ 224.284 + + [M]+ 224 224 1.83 224

Mar. Drugs 2015, 13 1416
Figure 3. Mass spectra from solvent wash area directly adjacent to hypobranchial tissue.
Secondary metabolites on either NALDI or DIOS substrates with adjacent LC-MS/MS of
medial hypobranchial extract. Metabolites include (a) tyrindoxyl sulfate; (b) murexine;
(c) tyrindoleninone; (d) 6-bromoisatin; (e) Tyrian purple 6,6′-dibromoindigo (may include
isomer 6,6′-dibromoindirubin) and (f) tyrindolinone.

Mar. Drugs 2015, 13 1417
Permutational multivariate analysis (PERMANOVA) revealed that the overall composition of secondary
metabolites (Figure 4) varied according to both the type of nanosurface (Pseudo F = 5.5, p = 0.004) and
the solvent used for on-surface separation (Pseudo-F = 23.5, p = 0.001) and there was a significant interaction
between these factors (Pseudo F = 4.7, p = 0.001). Pair-wise tests revealed that there was no significant
difference in the secondary metabolite composition detected by DIOS and NALDI after separation in
water (p = 0.97) or chloroform (p = 0.27), however, the type of nanosurface did influence the compound
composition after separation in ethanol (p = 0.006) and hexane (p = 0.0008) (Figure 4). Irrespective of
whether DIOS or NADLI was used, the composition of compounds detected was significantly different
between every pair of solvents (p < 0.05). Principal coordinate ordination with trajectory overlay based on
Pearson correlation (Figure 4) confirms that differences between solvents are driven by polarity, with a
strong correspondence between the polarity of the solvent and the hydrophobicity of the compounds
(Log P, Table 2). These results imply that the type of nanosurface used for MSI and any solvent used
for washing the surface after tissue imprinting should be optimised according to the polarity of the
secondary metabolites of interest.
Figure 4. Principal coordinate analysis based on the normalised relative intensities of secondary
metabolites detected after solvent separation on NALDI (open symbols) and DIOS (filled
symbols) surfaces, grouped according to the type of solvent used (n = 3). Trajectory overlay
is based on Pearson correlations (r > 0.3).

Mar. Drugs 2015, 13 1418
Table 2. Mean ion intensity (n = 3) for secondary metabolites in the solvent wash area after separation from the hypobranchial gland tissue imprints
on NALDI and DIOS nanostructured surfaces with corresponding LogP values (calculated using chemo-informatics software ChemBioDraw
Ultra 13.0). Significant differences in the ion intensity for each compound were tested using univariate two factor PERMANOVA, followed by
pairwise-tests.
Compound Log P NALDI DIOS
Water Ethanol Chloroform Hexane Water Ethanol Chloroform Hexane
Choline −4.236 78,500 (±49,374) a 25,067 (±16,050) b N.D. 19,500 (±7378) 79,000 (±46,776) a 19,500 (±7378) b N.D. 6264 (±2139) c
Murexine −3.373 33,000 (±3812) a 5320 (±1959) b N.D. N.D. 33,067 (±3782) a 1450 (±704) b N.D. N.D.
Tyrindoxyl sulfate ** −0.346 2625 (±711) a 22,133 (±2108) b N.D. N.D. 1809 (±135) a,c 5651 (±3922) c N.D. N.D.
6-Bromoisatin * 1.615 N.D. 360 (±213) a 1775 (±725) b N.D. N.D. 656 (±646) a 3678 (±485) c N.D.
Tyrindoleninone * 2.889 N.D. 2506 (±1736) a 2945 (±1277) a N.D. N.D. 7957 (±2704) b 2581 (±1311) a,b N.D.
Tyrindolinone 2.999 N.D. 424 (±107) 958 (±233) N.D. N.D. N.D. 373 (±647) N.D.
Tyrian purple
(6,6′-Dibromoindigo 4.47 N.D. N.D. 6447 (±2093) N.D. N.D. N.D. 10848 (±4118) N.D.
6,6′-Dibromoindirubin)
Cholesterol 7.11 4722 (±755) N.D. N.D. N.D. N.D. N.D. N.D. N.D.
Different letters a, b & c indicate significant differences between each nanosurface and solvent combination (p < 0.05); Overall differences between the ion intensity on NALDI and DIOS are also
indicated for each compound as p ≤ 0.05 (*) and p ≤ 0.01 (**); N.D. = not detected.
Mar. Drugs 2015, 13 1419
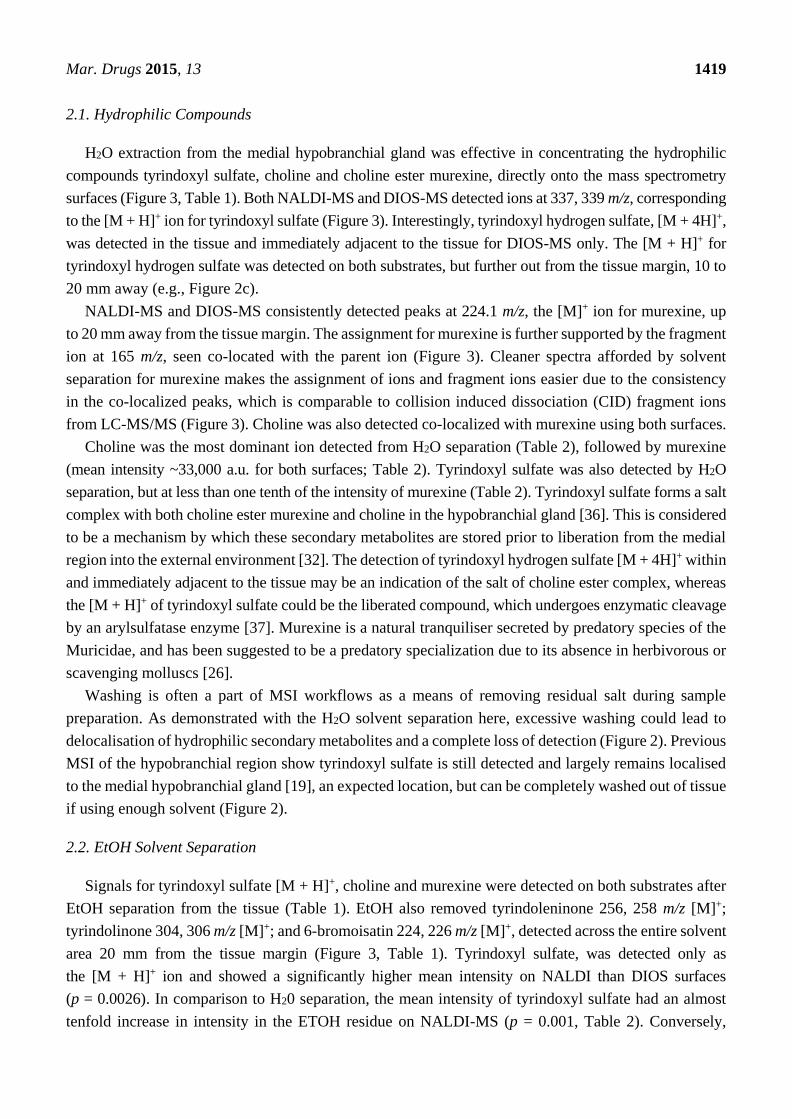
2.1. Hydrophilic Compounds
H2O extraction from the medial hypobranchial gland was effective in concentrating the hydrophilic
compounds tyrindoxyl sulfate, choline and choline ester murexine, directly onto the mass spectrometry
surfaces (Figure 3, Table 1). Both NALDI-MS and DIOS-MS detected ions at 337, 339 m/z, corresponding
to the [M + H]+ ion for tyrindoxyl sulfate (Figure 3). Interestingly, tyrindoxyl hydrogen sulfate, [M + 4H]+,
was detected in the tissue and immediately adjacent to the tissue for DIOS-MS only. The [M + H]+ for
tyrindoxyl hydrogen sulfate was detected on both substrates, but further out from the tissue margin, 10 to
20 mm away (e.g., Figure 2c).
NALDI-MS and DIOS-MS consistently detected peaks at 224.1 m/z, the [M]+ ion for murexine, up
to 20 mm away from the tissue margin. The assignment for murexine is further supported by the fragment
ion at 165 m/z, seen co-located with the parent ion (Figure 3). Cleaner spectra afforded by solvent
separation for murexine makes the assignment of ions and fragment ions easier due to the consistency
in the co-localized peaks, which is comparable to collision induced dissociation (CID) fragment ions
from LC-MS/MS (Figure 3). Choline was also detected co-localized with murexine using both surfaces.
Choline was the most dominant ion detected from H2O separation (Table 2), followed by murexine
(mean intensity ~33,000 a.u. for both surfaces; Table 2). Tyrindoxyl sulfate was also detected by H2O
separation, but at less than one tenth of the intensity of murexine (Table 2). Tyrindoxyl sulfate forms a salt
complex with both choline ester murexine and choline in the hypobranchial gland [36]. This is considered
to be a mechanism by which these secondary metabolites are stored prior to liberation from the medial
region into the external environment [32]. The detection of tyrindoxyl hydrogen sulfate [M + 4H]+ within
and immediately adjacent to the tissue may be an indication of the salt of choline ester complex, whereas
the [M + H]+ of tyrindoxyl sulfate could be the liberated compound, which undergoes enzymatic cleavage
by an arylsulfatase enzyme [37]. Murexine is a natural tranquiliser secreted by predatory species of the
Muricidae, and has been suggested to be a predatory specialization due to its absence in herbivorous or
scavenging molluscs [26].
Washing is often a part of MSI workflows as a means of removing residual salt during sample
preparation. As demonstrated with the H2O solvent separation here, excessive washing could lead to
delocalisation of hydrophilic secondary metabolites and a complete loss of detection (Figure 2). Previous
MSI of the hypobranchial region show tyrindoxyl sulfate is still detected and largely remains localised
to the medial hypobranchial gland [19], an expected location, but can be completely washed out of tissue
if using enough solvent (Figure 2).
2.2. EtOH Solvent Separation
Signals for tyrindoxyl sulfate [M + H]+, choline and murexine were detected on both substrates after
EtOH separation from the tissue (Table 1). EtOH also removed tyrindoleninone 256, 258 m/z [M]+;
tyrindolinone 304, 306 m/z [M]+; and 6-bromoisatin 224, 226 m/z [M]+, detected across the entire solvent
area 20 mm from the tissue margin (Figure 3, Table 1). Tyrindoxyl sulfate, was detected only as
the [M + H]+ ion and showed a significantly higher mean intensity on NALDI than DIOS surfaces
(p = 0.0026). In comparison to H20 separation, the mean intensity of tyrindoxyl sulfate had an almost
tenfold increase in intensity in the ETOH residue on NALDI-MS (p = 0.001, Table 2). Conversely,

Mar. Drugs 2015, 13 1420
on-surface detection of murexine after EtOH separation resulted in a significant six times reduction in
mean intensity, compared to H2O separation from both NALDI and DIOS surfaces (p = 0.007, Table 2).
Choline intensity was also significantly reduced after EtOH separation (p = 0.04, Table 2). Of the
solvents tested, H2O is ideal for the extraction of the cationic murexine and choline, whilst EtOH
extraction maximizes recovery of the counter ion tyrindoxyl sulfate.
Tyrindoleninone was detected at a significantly higher intensity on DIOS-MS compared to NALDI-MS
and DIOS after EtOH separation (p = 0.045, Table 2), whereas tyrindolinone was only detected on
NALDI-MS at a low intensity (Table 2). Tyrindoleninone, tyrindolinone and 6-bromoisatin are intermediate
indoles which form after the enzymatic cleavage of tyrindoxyl sulfate [35] by an arylsulfatase enzyme [37].
Intermediate brominated indoles are formed by oxidative and photolytic degradation, which leads to
variability in their relative quantities in tissue samples. This variability can be minimized across samples
by careful handling, particularly by minimizing exposure to light and oxygen. The major point at which
samples are most exposed to light and oxygen during on-surface solvent separation is during the placement
of sections onto the nanostructured surface. Degradation was further reduced using a gentle stream of
nitrogen gas when handling. Outside of sample placement, degradation can be minimized as tissue can be
sectioned frozen (held at −80 °C and brought down to −20 °C in the cryostat during cutting), and LDI-MS
is done in a high vacuum with no light. Therefore, LDI-MS detection should be done immediately after
solvent separation to prevent on-surface degradation of precursors that have separated from the tissue.
The differences in measured intensity of some secondary metabolites between the two surfaces could
be attributed to the differences in the surface chemistry. NALDI plates are surface coated with a layer
of inorganic nanostructures to absorb laser energy (Bruker Daltronics), whilst the pSi are functionalised
with silanes (F5PhPr) and the etched porosity provides laser energy absorption preventing excessive
fragmentation from the laser shot [20]. In this case, the use of ethanol solvent separation shows NALDI
to desorb and ionise hydrophilic compounds better then DIOS. This indicates that DIOS may be more
hydrophobic than NALDI surfaces. The advantage of DIOS, over NALDI, is that DIOS can be treated
with different silanes [20], which can change the hydrophobicity of the surface to target specific classes
of secondary metabolites.
2.3. CHCl3 Solvent Separation
Both NALDI-MS and DIOS-MS failed to detect the more hydrophilic compounds after CHCl3
separation, as anticipated (Table 2). Tyrindoleninone, tyrindolinone and 6-bromoisatin were detected on
both substrates across the solvent area. CHCl3 also effectively extracted Tyrian purple with detected spectra
showing a triplet cluster centred at 421 m/z [M + 2H]+ (Figure 4e) on both NALDI and DIOS substrates.
CHCl3 has been the solvent of choice when extracting brominated indoles from fresh macerated
hypobranchial glands [28–30] and NALDI-MS and DIOS-MS detected all expected metabolites except
tyrindoxyl and tyriverdin [35]. Tyrindoxyl is an unstable intermediate created by enzymatic cleavage of
tyrindoxyl sulfate with an arylsulfatase enzyme [35], which is also expressed in the medial hypobranchial
gland [37]. The absence of tyrindoxyl from LDI analysis could be due to the unstable nature of the
compound. The absence of tyriverdin from both substrates, indicated by the lack of the parent ion
calculated as a triplet ion cluster centred on 514 m/z, may be due to the high instability of this compound,
as previously reported from mass spectrometry analyses [5]. Triplet ion clusters, characteristic of

Mar. Drugs 2015, 13 1421
di-brominated compounds, were detected with centre peaks at 483 and 438 m/z, which may be fragment
ions of tyriverdin.
6-Bromoisatin was detected at significantly higher intensities on DIOS-MS compared to NALDI-MS
(p = 0.0157) and showed a significant five-fold increase after CHCl3 separation in comparison to EtOH
(p = 0.0005, Table 2). Tyrian purple was only detected in CHCl3 separations and the mean LDI-MS detection
was not significantly different on DIOS compared to NALDI surfaces (p = 0.17, Table 2). Therefore,
despite the fact that a greater diversity of compounds were detected after EtOH separation, CHCl3 increases
the detection of some brominated indoles. This could be a result of higher LogP and solvation characteristics
that are more suited to CHCl3 extraction. Alternatively, as 6-bromisatin and 6,6-dibromoindigo are both
end-products in a series of oxidative and photolytic reactions, solubility of intermediate precursors in
CHCl3 may facilitate increase degradation.
2.4. Lipophilic Separation Using n-Hexane
After hexane solvent separation LDI-MS detected a consistent signal at 104 m/z, which is the [M]+
ion for choline (Tables 1 and 3). Choline has been detected in D. orbita from the medial hypobranchial
gland [26] co-localized with choline esters, the natural tranquilizers found in many members of the
Muricidae [26]. Choline is also known to be associated with tyrindoxyl sulfate, acting as a counter ion
prior to secretion from the tissue [26,36]. The mean intensity of choline was significantly lower after
hexane separation in comparison to water (p = 0.0172) and ethanol (p = 0.0121), as would be expected
from its high polarity (Table 2). However, other consistent peaks detected in hexane samples include
184 m/z, corresponding to phosphocholine headgroup (Table 3), which is a characteristic fragment ion
of phosphatidylcholine lipid groups [38]. The 184 m/z ion has been detected during secondary ion mass
spectrometry imaging of Aplysia californica neurons [38], where it is a fragment from the lipid component
of the neural cell membrane.
Table 3. Primary metabolites and associated lipophilic ions detected after hexane separation
originating from either free fatty acids or phospholipid origin. References indicate previous
detection in molluscan tissues.
m/z Formula [M] Lipid Match Reference
86.119
104.136 C5H14NO Choline [36]
184.101 C5H15NPO4 [M + H]+ Phosphocholine headgroup [38]
198.114
228.277 C14H36O2 [M]+ Myristic acid [39,40]
256.309 C16H32O2 [M]+ Palmitic acid [39,40]
368.448 C27H44 [M − OH]+ Cholesterol [39,41]
Consistent ions at 256 m/z (Table 3) are most likely generated by the saturated fatty acid, palmitic
acid [M]+. This is a dominant saturated fatty acid found in the adult tissues of many gastropod species [42]
and the benthic encapsulated embryos of gastropods molluscs, including D. orbita [39]. Myristic acid,
another saturated fatty acid detected in gastropod tissues [42] and gelatinous spawn [39], was assigned
based on peaks detected at 228 m/z. Fatty acids and choline may also originate from phospholipid
Mar. Drugs 2015, 13 1422
fragments, like the 184 m/z ion, which can be generated from post source decay [43]. The other remaining
consistent peak in the hexane separation on NALDI is likely to be cholesterol, detected as the [M − OH]+
at 368.4 m/z (Tables 2 and 3). Cholesterol is known to be a major sterol found in molluscan tissue [40] and
the dominant sterol in benthic spawn [39]. Cholesterol can often be found largely intact using mass
spectrometry analysis, usually in the [M + H − OH]+ form, and has been detected in Aplysia neurons [38].
Cholesterol, fatty acids, and lipids more generally, provide a considerable proportion of the fuel
reserves within the muscles and organs of adult molluscs [39,41]. Cholesterol is also known to be a major
component of the cell membrane, where it interacts with sphingolipids to order the membrane structure,
influencing membrane permeability and fluidity [44]. As lipids contribute to fuel reserves in molluscs,
lipid-rich tissues or organs adjacent to secretory or storage regions may be an indication of biosynthetic sites
where secondary metabolites are constructed prior to storage and deployment. Alternatively, lipid-rich
regions in adult females may be sites where fatty acids, cholesterol or specialised lipid structures are
incorporated into egg capsules or spawning material. The lipid content of mollusc egg masses have shown
antimicrobial activity, which would aid in the viability of benthic egg masses during development [39].
Simplified spatial analysis of maternal derived lipid classes would be an excellent tool for assessing
resource partitioning within the field of chemical ecology.
2.5. Quantification of Secondary Metabolites Using Nanostructured LDI-MS
Quantification using mass spectrometry intensity data requires the adjacent use of known standards or
purified compound to establish the level of comparative ion intensity. Available standards applied adjacent
to the solvent area allowed the quantification of the highest intensity detected for tyrindoleninone,
6-bromoisatin and Tyrian purple (Table 2) compared to linear concentration curves (Figure 5). Not all
metabolites behave in the same fashion during mass spectrometry ionisation/vaporisation or subsequent
time-of-flight analysis (TOF) [45]. When using reflectron mode for LDI-MS, which has suitable resolving
power in the low molecular mass range, the pulsed laser extraction delay is optimised to allow plume
formation and equivalent ion velocities entering into the TOF tube [46]. Lower delayed extraction times
create a window for ion selection which produces a bias towards the low molecular mass range [45],
reducing resolution and peak intensity for larger compounds. Therefore LDI mass window settings must
remain constant during acquisition and intensity values cannot be extrapolated outside of the parameters
for each acquisition.
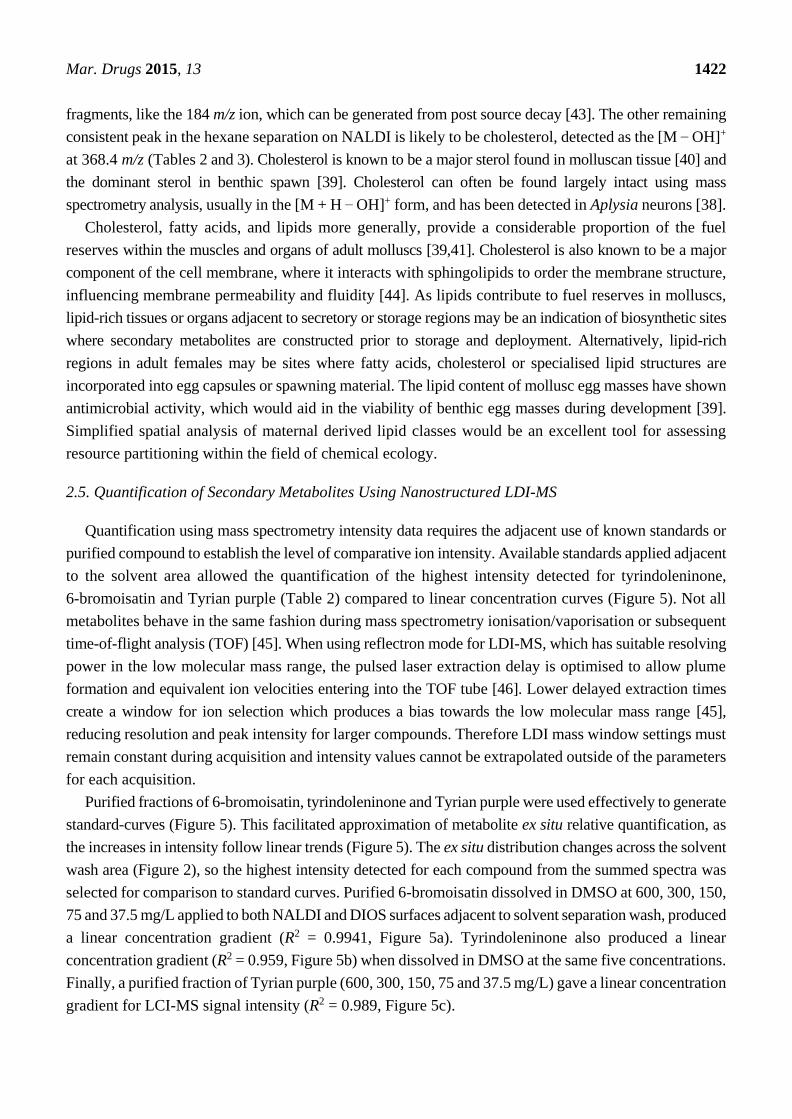
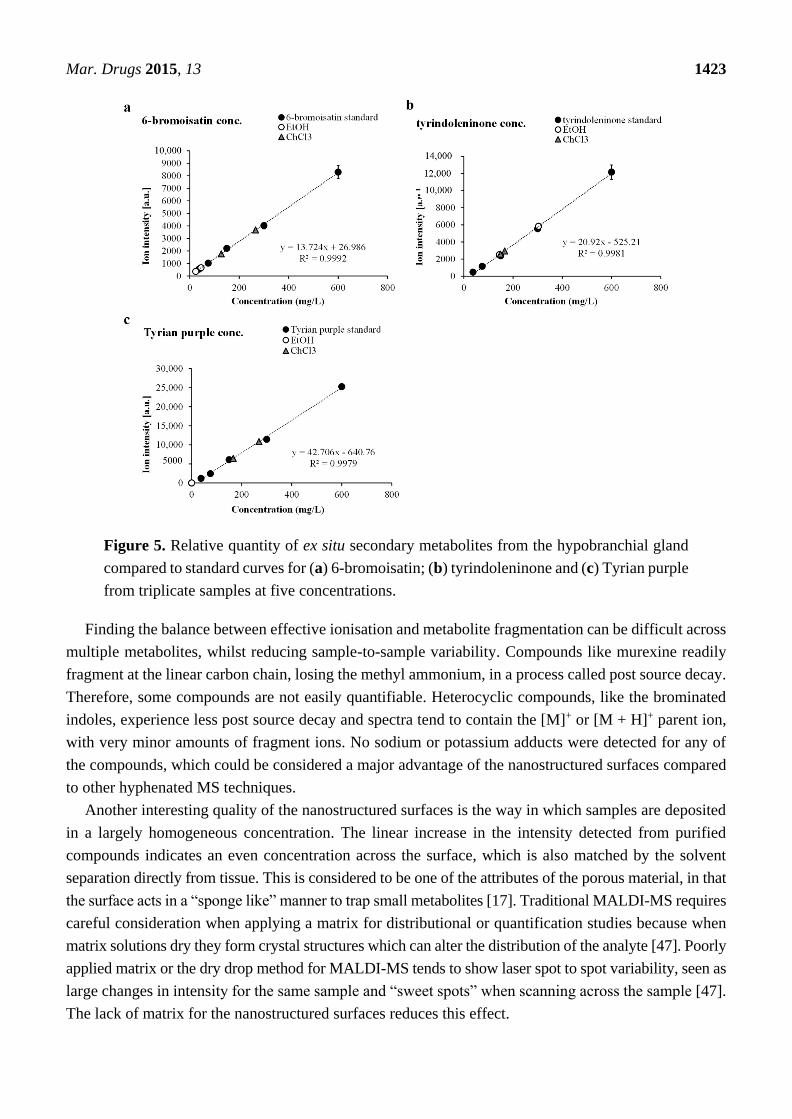
Purified fractions of 6-bromoisatin, tyrindoleninone and Tyrian purple were used effectively to generate
standard-curves (Figure 5). This facilitated approximation of metabolite ex situ relative quantification, as
the increases in intensity follow linear trends (Figure 5). The ex situ distribution changes across the solvent
wash area (Figure 2), so the highest intensity detected for each compound from the summed spectra was
selected for comparison to standard curves. Purified 6-bromoisatin dissolved in DMSO at 600, 300, 150,
75 and 37.5 mg/L applied to both NALDI and DIOS surfaces adjacent to solvent separation wash, produced
a linear concentration gradient (R2 = 0.9941, Figure 5a). Tyrindoleninone also produced a linear
concentration gradient (R2 = 0.959, Figure 5b) when dissolved in DMSO at the same five concentrations.
Finally, a purified fraction of Tyrian purple (600, 300, 150, 75 and 37.5 mg/L) gave a linear concentration
gradient for LCI-MS signal intensity (R2 = 0.989, Figure 5c).
Mar. Drugs 2015, 13 1423
Figure 5. Relative quantity of ex situ secondary metabolites from the hypobranchial gland
compared to standard curves for (a) 6-bromoisatin; (b) tyrindoleninone and (c) Tyrian purple
from triplicate samples at five concentrations.
Finding the balance between effective ionisation and metabolite fragmentation can be difficult across
multiple metabolites, whilst reducing sample-to-sample variability. Compounds like murexine readily
fragment at the linear carbon chain, losing the methyl ammonium, in a process called post source decay.
Therefore, some compounds are not easily quantifiable. Heterocyclic compounds, like the brominated
indoles, experience less post source decay and spectra tend to contain the [M]+ or [M + H]+ parent ion,
with very minor amounts of fragment ions. No sodium or potassium adducts were detected for any of
the compounds, which could be considered a major advantage of the nanostructured surfaces compared
to other hyphenated MS techniques.
Another interesting quality of the nanostructured surfaces is the way in which samples are deposited
in a largely homogeneous concentration. The linear increase in the intensity detected from purified
compounds indicates an even concentration across the surface, which is also matched by the solvent
separation directly from tissue. This is considered to be one of the attributes of the porous material, in that
the surface acts in a “sponge like” manner to trap small metabolites [17]. Traditional MALDI-MS requires
careful consideration when applying a matrix for distributional or quantification studies because when
matrix solutions dry they form crystal structures which can alter the distribution of the analyte [47]. Poorly
applied matrix or the dry drop method for MALDI-MS tends to show laser spot to spot variability, seen as
large changes in intensity for the same sample and “sweet spots” when scanning across the sample [47].
The lack of matrix for the nanostructured surfaces reduces this effect.

Mar. Drugs 2015, 13 1424
3. Experimental Section
3.1. Tissue Preparation for Extraction and Solvent Separation on MSI Substrates
Adult D. orbita samples were collected off rocky intertidal coastlines on southern metropolitan rocky
reefs in South Australia using an Exemption Permit to the South Australian Fisheries Management Act
2007 section 70 (Permit No. 9902638). The selected adult specimens were prepared by cracking open the
shell with a vice at the junction between the primary body whorl and spire and the soft body was removed
by cutting the columnar muscle. The soft tissue was then rinsed in MilliQ water to reduce residual salt.
Males were identified by the presence of a penis above the tentacles [48] and the absence of egg capsule
glands and ovaries. The male hypobranchial glands were removed by incision along the connective
mantle tissue between the ctenidium and the branchial hypobranchial and the posterior prostate and
digestive gland. The hypobranchial gland and prostate gland were left connected [5] and placed in 5 mL
polypropylene sample tubes (Sarstedt, Nümbrecht, Germany) and snap frozen in liquid nitrogen. Frozen
tissue samples were protected from light and stored at −80 °C until required.
3.2. Extraction of Secondary Metabolites for LC-MS
3.2.1. Extraction and Chemical Analysis of Brominated Indoles
Solvents were purchased from Sigma-Aldrich (CHROMASOLV®, HPLC grade, Castle Hill, NSW,
Australia). Eight fresh hypobranchial glands (6.58 g) were solvent extracted as previously described [49]
to obtain brominated indoles. Briefly, secondary metabolites were extracted from glandular tissue in an
equal portion of chloroform and methanol (1:1 v/v, Sigma) and continuously stirred overnight. After
vacuum filtering (Whatman filter paper 1), the polar and lipophilic fractions were separated using 20 mL
MilliQ water. The chloroform fraction contained the intermediate precursor brominated indoles and
Tyrian purple, whilst the methanol fraction contained the hydrophilic, tyrindoxyl sulfate. Each fraction was
evaporated to dryness on a Rotavapor® R-114 (BÜCHI Labortechnik AG, Flawil, Switzerland), weighed and
re-dissolved in 1 mL of acetonitrile within amber vials for LC-MS analysis.
Brominated indoles in hypobranchial extracts were analyzed by high performance liquid chromatography
(HPLC; Waters 2695, Waters Alliance®, Rydalmere, NSW, Australia) coupled to a mass spectrometer
(MS; Micromass Quatro micro™ tandem quadrupole MS System, Waters, Milford, MA, USA). HPLC
separation was performed on a reverse-phase hydrophobic column (Synergi™, Hydro-RP, 4 μm C18
phase, 80 Å, 250 mm × 4.6 mm i.d., Phenomenex, Lane Cove, NSW, Australia) using a gradient of
acetonitrile (ACN) in water with 0.1% formic acid detecting extract components with parallel UV/Vis
diode-array at 300 and 600 nm [30]. The gradient was applied at a 1 mL/min flow rate starting with 30%
ACN for 1 min, 60% for 3 min, and 100% for 15 min before returning to 30% for 15 min. ESI-MS
detected brominated indoles at a flow rate of 300 μL/min, in full scan mode, and recorded using the
MassLynx 4.1 data system (Waters Alliance). Retention times were standardized using 4 μM synthetic
5-bromoisatin (Sigma-Aldrich, technical grade) in acetonitrile. The identification of brominated indoles
was based on peak retention time, expected calculated mass and isotopic clusters for the mono- and
di-brominated compounds within mass spectra [30].

Mar. Drugs 2015, 13 1425
3.2.2. Extraction and Chemical Analysis of Choline Ester Murexine
Murexine was extracted from 1.3 g of hypobranchial tissue in three times 30 mL volumes of acetone
and pooled. The extract was vacuum filtered through a PTFE membrane filter (pore size 0.2 μm),
evaporated to dryness, and washed three times with 10 mL of diethyl ether to remove fats. Total extract
was then taken up in 5 mL of ACN for LC-MS.
Murexine was detected by ultra-performance liquid chromatography (UPLC)-MS. Separation was
provided by an Acquity UPLC® system (Waters Alliance), using a 10 μL injection volume, on a
reverse-phase column (Atlantis T3, 3 μm C18, 3 × 100 mm i.d., Waters Alliance) with a mobile phase
of 0.5% formic acid (A) and acetonitrile (B) at a flow rate of 0.5 mL/min (gradient of solvent: 0–10 min,
98% A and 2% B), with parallel UV/Vis PDA detection. ESI-MS detected the murexine structure on the
Micromass Quatro micro™ tandem quadrupole mass spectrometer and data was acquired using MassLynx
4.1 data system (Waters Alliance). To see the structural features of murexine in ESI, a scan at 20 V was
compared to a collision induced dissociation (CID) scan at 35 V cone voltage (positive ion electrospray,
80 to 500 m/z mass range) for comparison to post source fragmentation that occurs in both NALDI
and DIOS-MS.
3.3. NALDI and DIOS Surface Fabrication, Oxidation and Functionalization
NALDI substrates were obtained from Bruker Daltronics. DIOS surfaces were fabricated according
to [19]. Briefly, monocrystalline (0.008–0.02 Ωcm) antimony doped n-type Si (100) wafers (Silicon Quest
International, CA, USA) were cut, methanol sonicated for cleaning and dried prior to substrate fabrication
by light-assisted anodic etching [19,50]. Silicon substrates were secured using a custom built Teflon cell
in contact with a gold foil anode (Space Products International, CA, USA) and a platinum wire cathode
(0.5 mm, 99.9%; Aldrich, WA, USA), shaped into a ring. Etching was achieved through the addition of
an electrolyte solution 1:1 hydrofluoric acid (HF):EtOH. The submerged pSi surfaces were illuminated
using a fiber optic light source passing through a set of two aspheric lenses, f = 80 mm (OptoSigma,
CA, USA) for collimation. A 20 mA constant current was applied across the Teflon cell for 2 min via a
2425 current source meter (Keithley, Cleveland, Ohio, OH, USA), operated via a meter program
constructed in LabView 6.1. Fabricated pSi were washed with methanol prior to being dried under
nitrogen gas.
Freshly etched pSi were oxidized using ozone at a flow rate of 3.25 g/h (Ozone-Generator 500, Fischer,
Germany). After oxidation, pSi were subjected to a second pore broadening etch with 5% HF/H2O for 30 s
and re-ozone oxidised. The hydroxyl-terminated pSi surfaces were then silanized using 80 μL of neat silane
(F5PhPr) for 15 min at 90 °C. Silanized pSi were washed with methanol, dried under nitrogen gas and
stored in a desiccator until required.
3.4. Tissue Sectioning, Deposition and Solvent Separation on NALDI and DIOS Surfaces
Tissue selection was based on the imaging results generated for NALDI and DIOS-MSI of 15 μm
sections of the medial hypobranchial gland from adult male D. orbita [19], Figure 1. Fresh frozen glands
were mounted and prepared for sectioning according to Ronci et al. [19]. Glands were transversely
cryo-sectioned until the medial region was exposed. The mounted frozen gland was then rotated to section

Mar. Drugs 2015, 13 1426
only the medial tissue region of the hypobranchial gland, allowing only that single region to be collected
for depositing onto NALDI and DIOS-MS substrates. Thin 15 μm thick sections were placed on either
a NALDI or DIOS surface. Three replicate tissues sections (n = 3) were cut for each solvent separation
for both NALDI and DIOS surfaces (total n = 24). Secondary metabolites were separated out of each tissue
section by washing across the tissue onto a clean section of the nanostructured surface adjacent to the
tissue, Figure 4, using either 200 μL of H2O, EtOH, CHCl3 or n-hexane for both NALDI and DIOS surfaces.
Solvent was applied by gentle pipetting. The solvent was then allowed to evaporate from the surface in
a fumehood under a stream of N2 gas at room temperature before MS.
3.5. NALDI and DIOS-MS Acquisition
NALDI surfaces, post solvent separation, were mounted into a specialized steel adapter target, whilst
DIOS surfaces were mounted onto a customized MTP 384 ground steel target plate (Bruker-Daltronics
GmbH, Bremen, Germany), secured with conductive carbon tape, and loaded into an Autoflex III
TOF/TOF mass spectrometer (Bruker-Daltronics) equipped with a SmartBeam 200 Hz laser. Quadratic
external calibration of the TOF tube was performed before each new surface acquisition using
α-cyano-4-hydroxycinnamic acid (CHCA) adducts together with bradykinin (1–7) and angiotensin II,
spotted on a free area of the surface. Monoisotopic peaks for the calibration range included: K+ 38.9637,
CHCA [M + H − H2O]+ 172.0399, CHCA [M + H]+ 190.0504, CHCA [M + Na]+ 212.0324,
CHCA [2M + H − CO2]+ 335.1032, CHCA [2M + H]+ 379.0930, bradykinin Fragment 1–7 [M + H]+
757.3991 and angiotensin II [M + H]+ 1046.5418. Surface calibration was determined based on the
brominated indole standards used to generate standard curves.
Samples were run in reflectron positive mode in the 20–1000 Da range, with a medium laser focus,
corresponding to a 50 μm diameter. Electronic gain was set to regular. Laser intensity was maintained at
42%, with a 20 ns pulse delay to allow plume formation for low mass molecules. Ion and detector settings
were: ion source 1–19.00 kV, ion source 2–16.80 kV, lens–8.25 kV, reflector 1–21.00 kV, reflector
2–9.40 kV. Data sets were further processed by baseline subtraction (1) and normalized noise threshold
settings (0.5).
Spectra were acquired up to 20 mm from the margin of the tissue section to evaluate any effect on
concentration distribution. At each sampling point a summed spectra was acquired by five 200 pulsed laser
shots (1000 shots). Each different surface had a standard reference for purified 6-bromoisatin at 600,
300, 150, 75 and 37.5 mg/L; purified tyrindoleninone at 600, 300, 150, 75 and 37.5 mg/L; and purified
Tyrian purple, 6,6′-dibromoindigo at 600, 300, 150, 75 and 37.5 mg/L, all using serial dilution in triplicate.
3.6. Mass Spectrometry Imaging
Imprinted pSi chips were mounted onto a customised MTP 384 ground steel target plate
(Bruker-Daltronics GmbH, Bremen, Germany), secured with conductive carbon tape, and loaded into an
Autoflex III TOF/TOF mass spectrometer (Bruker-Daltronics) equipped with a SmartBeam 200 Hz laser.
NALDI plates were mounted onto the NALDI adaptor target and loaded into the Autoflex III. Scanned
tissue images, on pSi or NALDI substrates prior to solvent separation, were loaded into FlexImaging 2.1
(build 25) and aligned with the steel target plate containing the pSi or NALDI sample based on three
teach points. The imaging area was selected based on the tissue area plus the 20 mm solvent wash area

Mar. Drugs 2015, 13 1427
adjacent to the tissue. FlexImaging 2.1 distribution maps were used to control FlexControl 3.3 (build 85)
during image acquisition. Samples were run in reflectron positive mode in the 20–1000 Da range, with
a spatial resolution of 150 μm and medium laser focus, corresponding to a 50 μm diameter. Colour maps
for secondary metabolites were based on the corresponding m/z which was evaluated using spot spectra
analysed in FlexAnalysis 3.3 (build 65).
3.7. Statistical Analyses
Statistical analyses were undertaken using Primer V6 + PERMANOVA add-on. For all analyses,
Euclidean distance similarity matrices were generated from the normalised relative intensity values and
9999 permutations were run. A two factor multivariate analysis was used to compare the overall composition
of compounds detected on DIOS and NALDI, as well as between the different solvent separations.
Two factor univariate PERMANOVs were also used for each individual compound. In cases where a
significant interaction was detected between factors, pairwise tests on were run grouped according to the
nanostructure, as well as the solvent. Monte Carlo tests were used to establish significance in the cases
where ≤10 unique permutations were possible. The multivariate data was also graphically represented
using a principle coordinate ordination with vector overlay based on Pearson correlation r > 0.3.
4. Conclusions
Nanostructured surfaces for use in LDI-MS analysis broaden the qualitative, quantitative and spatial
MS analysis of low molecular weight compounds. They are ideal for small molecular weight primary and
secondary metabolites because they are not masked or impeded by matrix ions. Nanostructure-assisted
LDI-MS provides an effective platform for the spatial analysis of heterogeneous tissue, requiring minimal
samples sizes (effective for 4 μm thick samples) and detecting metabolites across multiple structural classes
over a wide polarity range. Simple chromatographic separations on NALDI and DIOS surfaces after tissue
imprinting can effectively simplify the efforts for annotating LDI spectra. The NALDI and DIOS surfaces
also show promise for quantifying known metabolites in tissue samples. The simplified analytical technique
combined with the broad utility of the surfaces are a good reason for their adoption in chemical ecology,
marine natural products, metabolomics and any field concerned with characterizing metabolites.
Acknowledgments
We would like to thank the Flinders Analytical department, especially Daniel Jardine and Jason Young,
for assistance with the Bruker AutoFlex III operation and maintenance. Special thanks are extended to Taryn
Guinan for the supply of DIOS chips. This paper forms part of the PhD thesis for David Rudd which was
financially supported by an Australian Postgraduate Award and Philanthropic funding awarded to
Kirsten Benkendorff.
Author Contributions
David Rudd conceived and designed the study with guidance from Kirsten Benkendorff. David Rudd
conducted the data collection and analysis. David Rudd, Nicolas H. Voelcker and Kirsten Benkendorff
prepared the manuscript.

Mar. Drugs 2015, 13 1428
Conflicts of Interest
The authors declare no conflict of interest.
References
1. Hay, M.E. Marine chemical ecology: Chemical signals and cues structure marine populations,
communities, and ecosystems. Annu. Rev. Mar. Sci. 2009, 1, 193–212.
2. Gerwick, W.H.; Moore, B.S. Lessons from the past and charting the future of marine natural products
drug discovery and chemical biology. Chem. Biol. 2012, 19, 85–98.
3. Garson, M.J. The biosynthesis of marine natural products. Chem. Rev. 1993, 93, 1699–1733.
4. Yarnold, J.E.; Hamilton, B.R.; Welsh, D.T.; Pool, G.F.; Venter, D.J.; Carroll, A.R. High resolution
spatial mapping of brominated pyrrole-2-aminoimidazole alkaloids distributions in the marine sponge
Stylissa flabellata via MALDI-mass spectrometry imaging. Mol. BioSyst. 2012, 8, 2249–2259.
5. Westley, C.; Benkendorff, K. Sex-specific tyrian purple genesis: Precursor and pigment distribution
in the reproductive system of the marine mollusc, Dicathais orbita. J. Chem. Ecol. 2008, 34, 44–56.
6. Capon, R.J. Marine natural products chemistry: Past, present, and future. Aust. J. Chem. 2010, 63,
851–854.
7. Mendola, D. Aquaculture of three phyla of marine invertebrates to yield bioactive metabolites:
Process developments and economics. Biomol. Eng. 2003, 20, 441–458.
8. Dias, D.A.; Urban, S.; Roessner, U. A historical overview of natural products in drug discovery.
Metabolites 2012, 2, 303–336.
9. Camp, D.; Davis, R.A.; Campitelli, M.; Ebdon, J.; Quinn, R.J. Drug-like properties: Guiding
principles for the design of natural product libraries. J. Nat. Prod. 2011, 75, 72–81.
10. Fujimura, Y.; Miura, D. MALDI mass spectrometry imaging for visualizing in situ metabolism of
endogenous metabolites and dietary phytochemicals. Metabolites 2014, 4, 319–346.
11. Pauletti, P.M.; Cintra, L.S.; Braguine, C.G.; Filho, A.A.; Silva, M.L.A.; Cunha, W.R.;
Januário, A.H. Halogenated indole alkaloids from marine invertebrates. Mar. Drugs 2010, 8,
1526–1549.
12. Bouslimani, A.; Sanchez, L.M.; Garg, N.; Dorrestein, P.C. Mass spectrometry of natural products:
Current, emerging and future technologies. Nat. Prod. Rep. 2014, 31, 718–729.
13. Bergman, N.; Shevchenko, D.; Bergquist, J. Approaches for the analysis of low molecular weight
compounds with laser desorption/ionization techniques and mass spectrometry. Anal. Bioanal. Chem.
2014, 406, 49–61.
14. Calavia, R.; Annanouch, F.E.; Correig, X.; Yanes, O. Nanostructure initiator mass spectrometry for
tissue imaging in metabolomics: Future prospects and perspectives. J. Proteomics 2012, 75, 5061–5068.
15. Greving, M.P.; Patti, G.J.; Siuzdak, G. Nanostructure-initiator mass spectrometry metabolite analysis
and imaging. Anal. Chem. 2010, 83, 2–7.
16. Lewis, W.G.; Shen, Z.; Finn, M.G.; Siuzdak, G. Desorption/ionization on silicon (DIOS) mass
spectrometry: Background and applications. Int. J. Mass Spectrom. 2003, 226, 107–116.
17. Liu, Q.; Guo, Z.; He, L. Mass spectrometry imaging of small molecules using desorption/ionization
on silicon. Anal. Chem. 2007, 79, 3535–3541.

Mar. Drugs 2015, 13 1429
18. Guinan, T.; Kirkbride, P.; Pigou, P.E.; Ronci, M.; Kobus, H.; Voelcker, N.H. Surface-assisted laser
desorption ionisation mass spectrometry techniques for application in forensics. Mass Spectrom. Rev.
2014, in press.
19. Ronci, M.; Rudd, D.; Guinan, T.; Benkendorff, K.; Voelcker, N.H. Mass spectrometry imaging on
porous silicon: Investigating the distribution of bioactives in the marine mollusc tissues. Anal. Chem.
2012, 84, 8996–9001.
20. Trauger, S.A.; Go, E.P.; Shen, Z.; Apon, J.V.; Compton, B.J.; Bouvier, E.S.; Finn, M.G.;
Siuzdak, G. High sensitivity and analyte capture with desorption/ionization mass spectrometry on
silylated porous silicon. Anal. Chem. 2004, 76, 4484–4489.
21. Lowe, R.D.; Szili, E.J.; Kirkbride, P.; Thissen, H.; Siuzdak, G.; Voelcker, N.H. Combined
immunocapture and laser desorption/ionization mass spectrometry on porous silicon. Anal. Chem.
2010, 82, 4201–4208.
22. Abel, E.L. Behavioral effects of isatin on open field activity and immobility in the forced swim test
in rats. Physiol. Behav. 1995, 57, 611–613.
23. Ellis, S.R.; Brown, S.H.; In Het Panhuis, M.; Blanksby, S.J.; Mitchell, T.W. Surface analysis of
lipids by mass spectrometry: More than just imaging. Prog. Lipid Res. 2013, 52, 329–353.
24. Benkendorff, K.; Bremner, J.B.; Davis, A.R. Tyrian purple precursors in the egg masses of the
Australian muricid, Dicathais orbita: A possible defensive role. J. Chem. Ecol. 2000, 26, 1037–1050.
25. Erspamer, V.; Glasser, A. The pharmacological actions of murexine (urocanylcholine).
Br. J. Pharmacol. Chemother. 1957, 12, 176–184.
26. Roseghini, M.; Severini, C.; Erspamer, G.F.; Erspamer, V. Choline esters and biogenic amines in
the hypobranchial gland of 55 molluscan species of the neogastropod Muricoidea superfamily.
Toxicon 1996, 34, 33–55.
27. Westley, C.B.; Vine, K.L.; Benkendorff, K. A proposed functional role for indole derivatives in
reproduction and defense of the Muricidae (Neogastropoda:Mollusca). In Indirubin, the Red Shade
of Indigo, Meijer, L., Guyard, N., Skaltsounis, L., Eisenbrand, G., Eds.; Life in Progress, Station
Biologique de Roscoff, Brittany, France, 2006; pp. 31–44.
28. Westley, C.B.; McIver, C.M.; Abbott, C.A.; le Leu, R.K.; Benkendorff, K. Enhanced acute apoptotic
response to azoxymethane-induced DNA damage in the rodent colonic epithelium by tyrian purple
precursors a potential colorectal cancer chemopreventative. Cancer Biol. Ther. 2010, 9, 371–379.
29. Edwards, V.; Benkendorff, K.; Young, F. Marine compounds selectively induce apoptosis in
female reproductive cancer cells but not in primary-derived human reproductive granulosa cells.
Mar. Drugs 2012, 10, 64–83.
30. Esmaeelian, B.; Benkendorff, K.; Johnston, M.R.; Abbott, C.A. Purified brominated indole
derivatives from Dicathais orbita induce apoptosis and cell cycle arrest in colorectal cancer cell lines.
Mar. Drugs 2013, 11, 3802–3822.
31. Esmaeelian, B.; Abbott, C.; le Leu, R.; Benkendorff, K. 6-bromoisatin found in muricid mollusc
extracts inhibits colon cancer cell proliferation and induces apoptosis, preventing early stage tumor
formation in a colorectal cancer rodent model. Mar. Drugs 2014, 12, 17–35.
32. Benkendorff, K. Natural product research in the Australian marine invertebrate Dicathais orbita.
Mar. Drugs 2013, 11, 1370–1398.

Mar. Drugs 2015, 13 1430
33. Esquenazi, E.; Yang, Y.L.; Watrous, J.; Gerwick, W.H.; Dorrestein, P.C. Imaging mass spectrometry
of natural products. Nat. Prod. Rep. 2009, 26, 1521–1534.
34. Škrášková, K.; Heeren, R.M.A. A review of complementary separation methods and matrix assisted
laser desorption ionization-mass spectrometry imaging: Lowering sample complexity. J. Chromatogr. A
2013, 1319, 1–13.
35. Cooksey, C.J. Tyrian purple: 6,6′-Dibromoindigo and related compounds. Molecules 2001, 6, 736–769.
36. Baker, J.T.; Duke, C.C. Isolation of choline and choline ester salts of tyrindoxyl sulfate from marine
mollusks Dicathais orbita and Mancinella keineri. Tetrahedron Lett. 1976, 15, 1233–1234.
37. Laffy, P.W.; Benkendorff, K.; Abbott, C.A. Suppressive subtractive hybridisation transcriptomics
provides a novel insight into the functional role of the hypobranchial gland in a marine mollusc.
Comp. Biochem. Phys. D Genomics Proteomics 2013, 8, 111–122.
38. Passarelli, M.K.; Ewing, A.G.; Winograd, N. Single-cell lipidomics: Characterizing and imaging
lipids on the surface of individual Aplysia californica neurons with cluster secondary ion mass
spectrometry. Anal. Chem. 2013, 85, 2231–2238.
39. Benkendorff, K.; Davis, A.R.; Rogers, C.N.; Bremner, J.B. Free fatty acids and sterols in the benthic
spawn of aquatic molluscs, and their associated antimicrobial properties. J. Exp. Mar. Biol. Ecol.
2005, 316, 29–44.
40. Idler, D.R.; Wiseman, P. Sterols of molluscs. Int. J. Biochem. 1971, 2, 516–528.
41. Jarzebski, A.; Wenne, R.; Habermehl, G. Anatomical distribution of lipids and sterols in
Macoma balthica (L.). Comp. Biochem. Physiol. B Biochem. Mol. Biol. 1986, 85, 135–137.
42. Bergmann, W. Comparative biochemical studies on the lipids of marine invertebrates, with special
reference to the sterols. J. Mar. Res. 1949, 8, 137–176.
43. Kruse, R.A.; Rubakhin, S.S.; Romanova, E.V.; Bohn, P.W.; Sweedler, J.V. Direct assay of Aplysia
tissues and cells with laser desorption/ionization mass spectrometry on porous silicon.
J. Mass Spectrom. 2001, 36, 1317–1322.
44. Munro, S. Lipid rafts: Elusive or illusive? Cell 2003, 115, 377–388.
45. Hortin, G.L. The MALDI-TOF mass spectrometric view of the plasma proteome and peptidome.
Clin. Chem. 2006, 52, 1223–1237.
46. Brown, R.S.; Lennon, J.J. Mass resolution improvement by incorporation of pulsed ion extraction
in a matrix-assisted laser desorption/ionization linear time-of-flight mass spectrometer. Anal. Chem.
1995, 67, 1998–2003.
47. Nishikaze, T.; Okumura, H.; Jinmei, H.; Amano, J. Correlation between sweet spots of glycopeptides
and polymorphism of the matrix crystal in MALDI samples. Mass Spectrom. 2012, 1,
doi:10.5702/massspectrometry.A0006.
48. Noble, W.J.; Cocks, R.R.; Harris, J.O.; Benkendorff, K. Application of anaesthetics for sex
identification and bioactive compound recovery from wild Dicathais orbita. J. Exp. Mar. Biol. Ecol.
2009, 380, 53–60.
49. Rudd, D.; Benkendorff, K. Supercritical CO2 extraction of bioactive tyrian purple precursors from
the hypobranchial gland of a marine gastropod. J. Supercrit. Fluids 2014, 94, 1–7.

Mar. Drugs 2015, 13 1431
50. Guinan, T.; Ronci, M.; Kobus, H.; Voelcker, N.H. Rapid detection of illicit drugs in neat saliva using
desorption/ionization on porous silicon. Talanta 2012, 99, 791–798.
© 2015 by the authors; licensee MDPI, Basel, Switzerland. This article is an open access article
distributed under the terms and conditions of the Creative Commons Attribution license
(http://creativecommons.org/licenses/by/4.0/).
Copyright © 2022 FDOKUMEN