российская академия наук - Институт геофизики УрО РАН
309
. . , 41- . . 27 - 31 2014 . 2014
-
Upload
khangminh22 -
Category
Documents
-
view
2 -
download
0
Transcript of российская академия наук - Институт геофизики УрО РАН

.
.
,
41- . . 27 - 31 2014 .
2014

.
.
,
41- . . 27 - 31 2014 .
2014
, : 410- . . -
, 27 - 31 2014 . : . 2014. 308 .
41- -. . « -
, ».
. , ,
. .
, -.
, -, -
. 41- . . « -
, -» -
( 13-05-06202).
: . – – . - . - ., .
. – ., .
© , 2013
: . – , , .- . ,
: . – , .- . ,
. – .- . , . , . – , .- . , , . – .- . , ,
. – , .- . , ,
. – .- . , , . – , ,
. – . , .- . , , ,
. – .- . ., . . – .- . , . . . – . , . . – .- . , . .
. – .- . , .– .- . ,
: . - .- ., ,
: . - .- ., , . - .- ., ,
. - ., , . - ., , . - ,
. - , . - , . - ,
. - ,
:
. , 100, 620016 : (343) 267 88 89, 267 88 66
: (343) 267 88 72 E-mail: [email protected]
: . – . – . - . . - .
. – .

41- . . , 2014 .
4
519.6+550.8
. 1,2, . 1, . 2
[email protected], [email protected], [email protected] 1 . . , ,
2 . . , ,
.
. , Intel NVIDIA
Tesla. Abstract. For solving structural inverse magnetometry problem of finding the interface between layers with constant magnetizations for lower half-space multilayer model, the linearized gradient methods with variable weight factors are proposed. Efficient algorithms based on the gradient methods were developed and implemented on a multicore Intel processor and NVIDIA Tesla graphic processor.
,
, . ,
( 1,..., ),lJ l L ,lS L .
. ( , )l lz z x y , lJ ,
l lz H , .
,lim ( , ) 0.l lx y
z x y H
( , )l lz z x y , ,
3/2 3/22 2 2 2 2 21
( ', ')( ) ( , ,0),( ) ( ) ( , ) ( ) ( )
L
ll l l
z x y HA z J dx dy z x yx x y y z x y x x y y H
(1)
( , )z x y , 1
( , )L
ll
z x y z .
(6) n M N , ( , )z x y , ( )B z
( , )F x y M N ,
1( , ) ( , ),..., ( , )Lz x y z x y z x y L M N , ( )k TA z 2 2L M N
[ ] .n nA z F (2) , . ( , )z x y
( , )l lz z x y .
(2) i ,
41- . . , 2014 .
5
( 1,..., )iz i L M N ( . [1]): • ( )
2
12
( )( ), ( ) ( ) ( ( ) );
( ) ( )
kk k k k k T ki i i ik k
S zz z S z S z A z A z F
A z S z (3)
• ( )
2
12
( )( ),
( )
kk k ki i i ik
A z Fz z S z
S z (4)
iz i - ( , );z x y k . i ( 1,..., )iz i L M N
( ( 1,..., )lS l L ), ( , )z x y
[2]. i :
1 2 1 2 1 2[ , ,... ] ( , ,..., ,..., ) ( , ,..., ),L M N L M N L M NF F F F f f f f
, 1, 0 1,ma
]x
[0, ,ii
ii
i
ff
(5)
( 1,..., )lF l L , lH ( 1,..., )lS l L ,
.
0 ( 1,..., )l lz H l L . (3) (4)
( ) /A z F F , 1
.L
ll
F F
« » « » , 1S
2S ,S 100 100 2. z S
: 6 6 6 6
2 2
/10 3.5 /10 2.5 /10 5.5 /10 4.51
/ 25 2.2 / 25 1.752
( , ) 5 2e 3e ;
( , ) 20 10e .
x y x y
x y
z x y
z x y
1 5H
2 20H . 1 2 0.4J J . 1.0x y .
(1) ( , )F x y 10000 1 2( , ) ( , ), ( , )z x y z x y z x y 20000 .
: 1)
i , (5) 1.25, 0.3 ; 2) , [2],
0.1.
41- . . , 2014 .
6
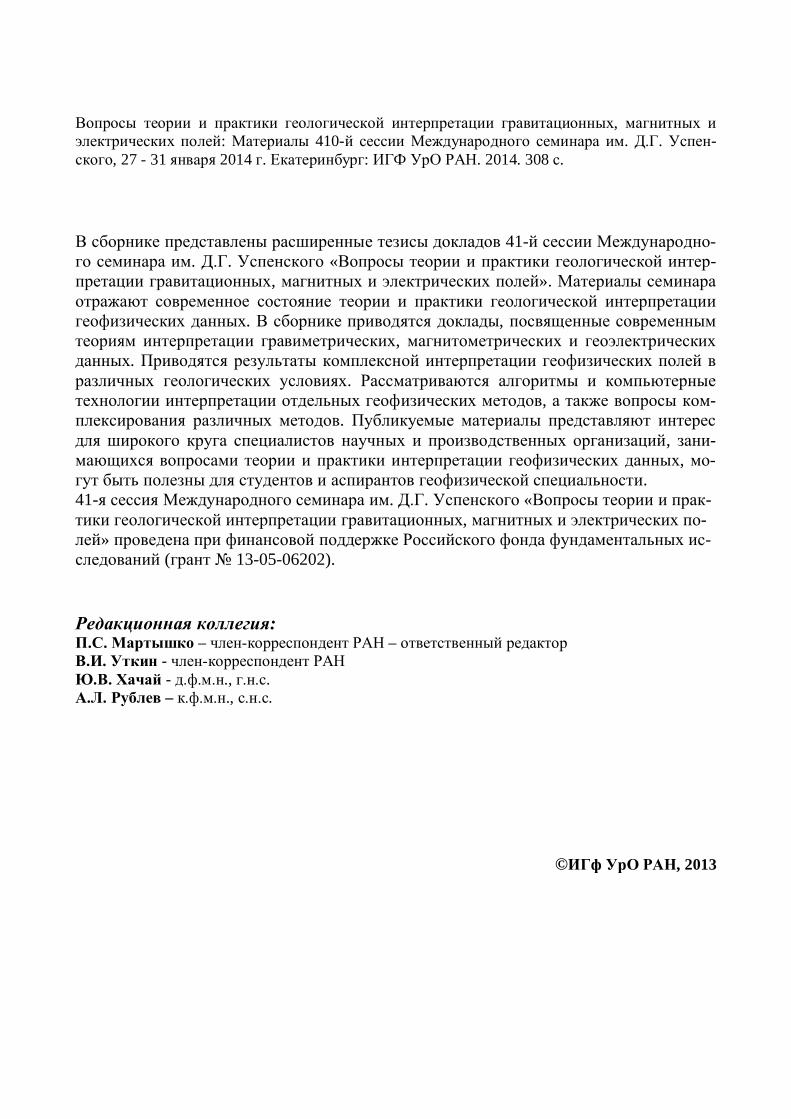
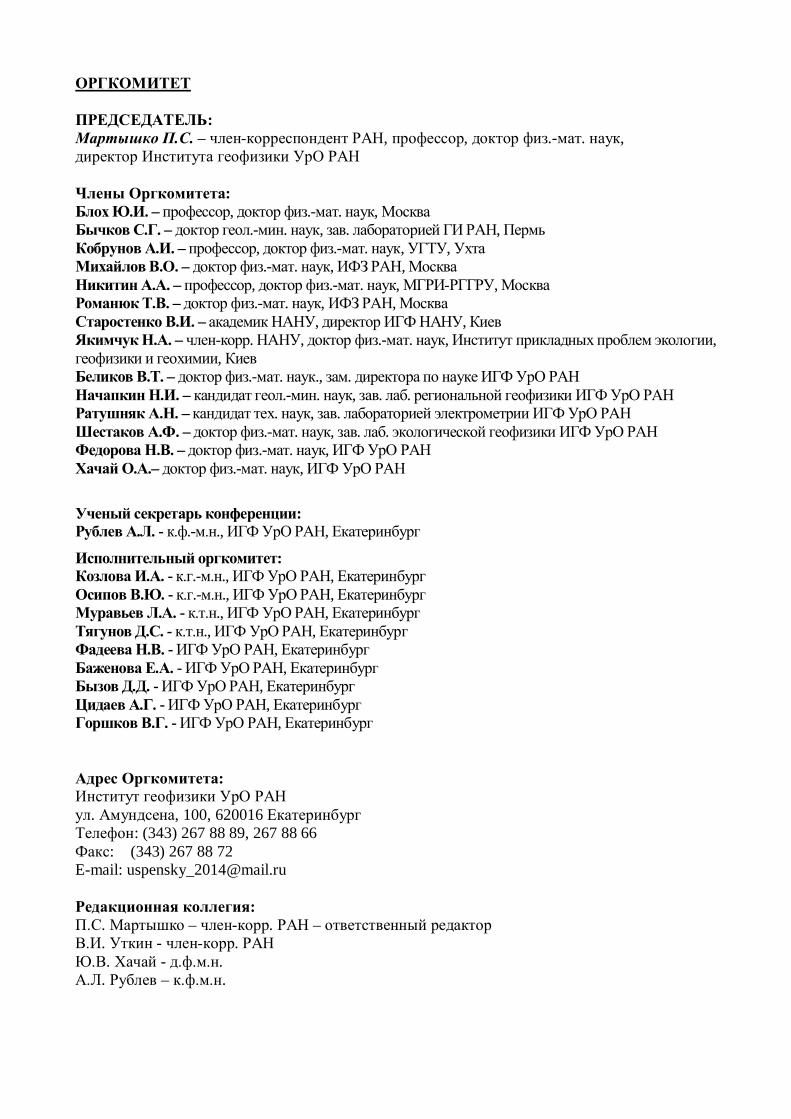
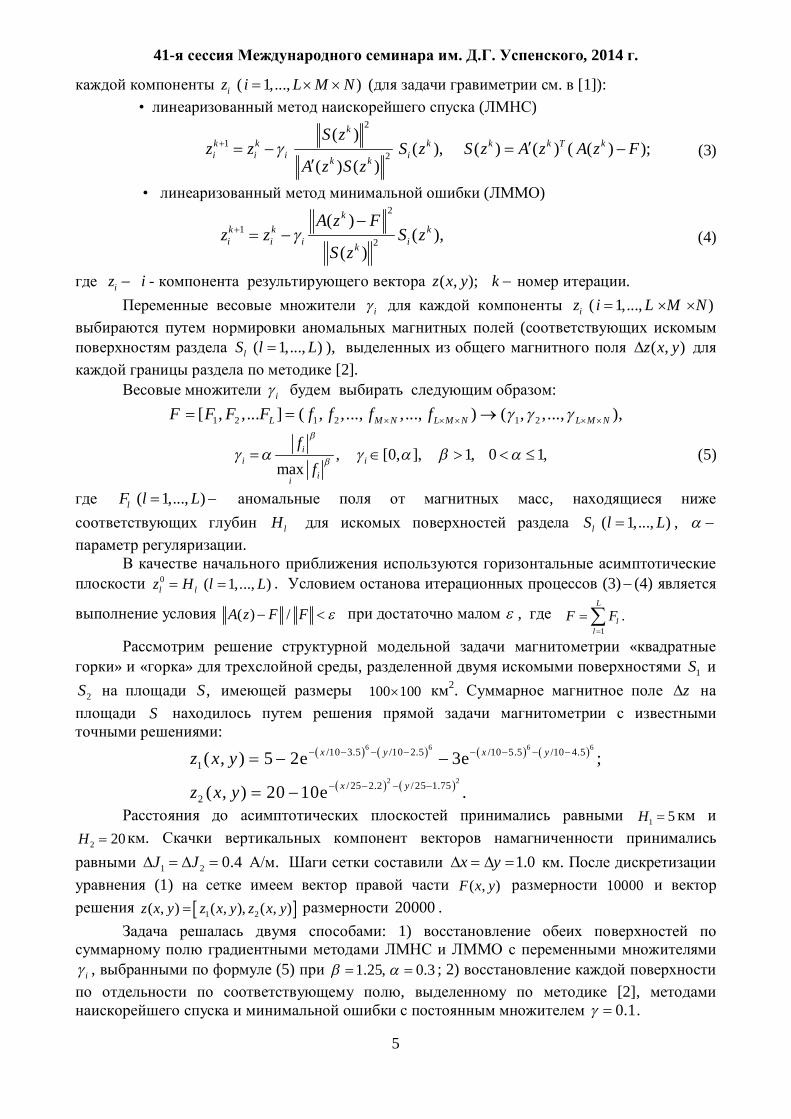
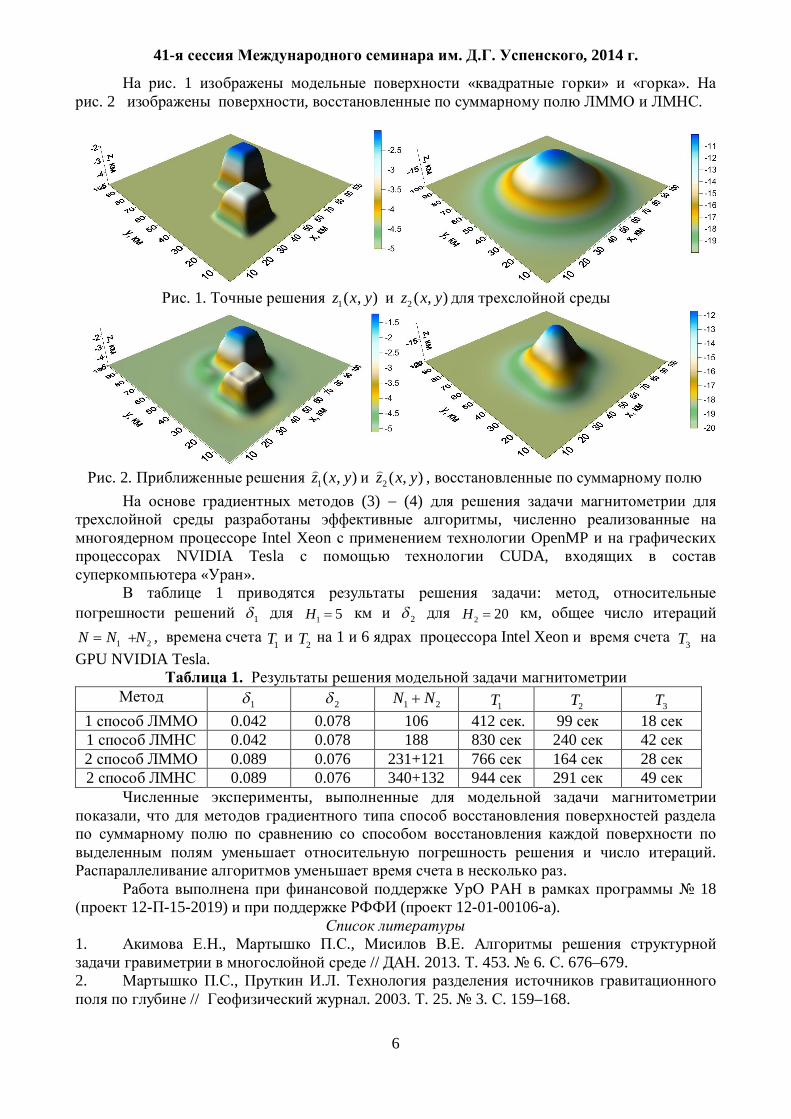
. 1 « » « ». . 2 , .
. 1. 1( , )z x y 2 ( , )z x y
. 2. 1( , )z x y 2 ( , )z x y , (3) (4)
, Intel Xeon OpenMP
NVIDIA Tesla CUDA, « ». 1 : ,
1 1 5H 2 2 20H ,
1 2N N N , 1T 2T 1 6 Intel Xeon 3T GPU NVIDIA Tesla.
1. 1 2 1 2N N 1T 2T
3T 1 0.042 0.078 106 412 . 99 18 1 0.042 0.078 188 830 240 42 2 0.089 0.076 231+121 766 164 28 2 0.089 0.076 340+132 944 291 49
, ,
.
. 18
12- -15-2019) ( 12-01-00106- ).
1. ., ., . // . 2013. . 453. 6. . 676–679.
2. ., . // . 2003. . 25. 3. . 159–168.

41- . . , 2014 .
7
550.832.79
. , . , . , .
[email protected], [email protected] , . , , " ", . ,
Abstract. Analytical solutions of electrodynamic problems related to small class [2],
allowing us to find solutions analytically. One such problem is the direct problem in environments with axial symmetry. The relevance of such problems occurs both when used in the development of downhole tools to solve specific geologic problems and data interpretation of well logging.
, ( ., , [1]). ,
. ,
, , , .
[2], .
.
, .
. ,
. r , z , ( z ), ,
: ex
r zH H E Jz r
(1) exrr r rE i H i B
z (4)
exrr r rH E J
z (2) 1 1 1 1 1( ( ( ))) ( )ex
z zzz zz
H rE Bi r r i
(5)
exr zE E i H i B
z r (3) 1 1 1( ( )) ex
z zzz zz
E rH Jr r
(6)
( rH , zH , H ) - , ( rE , zE , E ) - ( ex
rJ , exzB , exB ) -
; ( rr , zz , ) - ( rr , zz , ) -
.
n
))(1(1 rHrrr
Er zz
z :

41- . . , 2014 .
8
10 00
22
10 0
1 1 1 1 1( ) ( ) ( ) ( ) ( 1) ( ) ( )
1 1 1( ) ( ) ( ) ( 1) ( ) ( )
n n n nzz zz zz
n n nzz zz
H H J r rdr H H J r r H n J r rJ rr r r r r
nH r J r dr H n J r rJ r drr r
nJ - n .
, 12n [3] , ,
. , , .
0
1 )()(~)( drJHrHH .
01 )()1(1 rdrrJH
rH
rr zz
0 001
0
2
011 )(~)()()1()(~)()(1 dHrdrrJrJ
rdHrdrrJrJ
zzzz
,
,
1 12( ) ( ) ( )n n n
nJ r J r J rr
.
N ( 1N - ), ,
N
i
r
ri
zz
N
i
r
ri
zzzz
i
i
i
i
rdrrJrJrdrrJrJrdrrJrJ1
111
110
11
11
)()(1)()(1)()(1
N
iiiii
zzzz
rrJrJrdrrJrJr 1
010
01 )()()1()()()1( , izz
izz
izz
1111 .
, , :
exrr
N
i
r
r
irr JdErdrrJrJH
z
i
i
~)(~)()(~
0 111
1
1
1
21 1 1 0
1 10 0
1 1 010
1 1( ) ( ) ( ) ( ) ( ) ( ) ( )
1( ) ( ) ( ) ( )
i
i
i
i s
rN N
r i i ii ii izz zzr
rNi ex e
zi zzr R
E J r J r rdr H d J r J r r H dz
i J r J r rdr H d J J r rdr i B ,x
41- . . , 2014 .
9
1
1 1
1 1 1 0 1 1 1 1 0 1 1 0 1 02 2
2 2 2 2 2 21 1 1 1 1 1 0 1 1 0 1 1
( ) ( )
' ( ) ( ' ) ( ' ) ( ) ' ( ) ( ' ) ( ' ) ( ) , ''
( ) 2 ( ) ( ) ( ) ( ) 2
i
i
r
r
i i i i i i i i i i i i
i i i i i i i i i i
J r J r rdr
r J r J r r J r J r r J r J r r J r J r
r J r r J r J r r J r r J r r J 2 21 0 0( ) ( ) ( ) , '
2i i i ir J r r J r
. ,
:
exrr
Nrrr
N
i
r
r
Nrr
irr JEdErdrrJrJH
z
i
i
~)(~)(~)()()(~
0
1
111
1
1
1
12
1 110
1 0 1 11 10 0
2
1 1( ) ( ) ( ) ( )
1( ) ( ) ( ) ( ) ( ) ( ) ( ) ( )
1(
i
i
i
i
rN
r i Ni zz zz r
rN Ni N
i i iii izz r
Nzz
E J r J r rdr H dz
J r J r r H d i J r J r rdr H d
i 01) ( ) ( )
s
N ex exz
zzR
H J J r rdr i B
, ,
12
21
[0],
[0]ext extL
ALz
X X Y X Y
rE
HX ,
[0] [0][0]
extext r
ext extz
JY
J B.
, rE ,
( ,
). z
1 2
0H ,02212
1112 HH
zL
zL
, , – – .
, .
1. ., ., ., ., . , ,
. - , (3-4), , 2004 - .8-23. 2. ., . . -
.: , 1988 . - 344 . 3. ., . . - .: , 1970. - 720 .
41- . . , 2014 .
10
550.8.053
.
[email protected] « », . ,
GEONOM techniques were applied to the interpretation of detailed gravity over the
Shershnevskoye oil deposit area in order to confirm their capability and utility in a complex geological setting. The application was in fact successful, with the extraction of significant information pertaining both to the structure of the salt strata as well delineation of the Upper Devonian oil-bearing reefs.
[2].
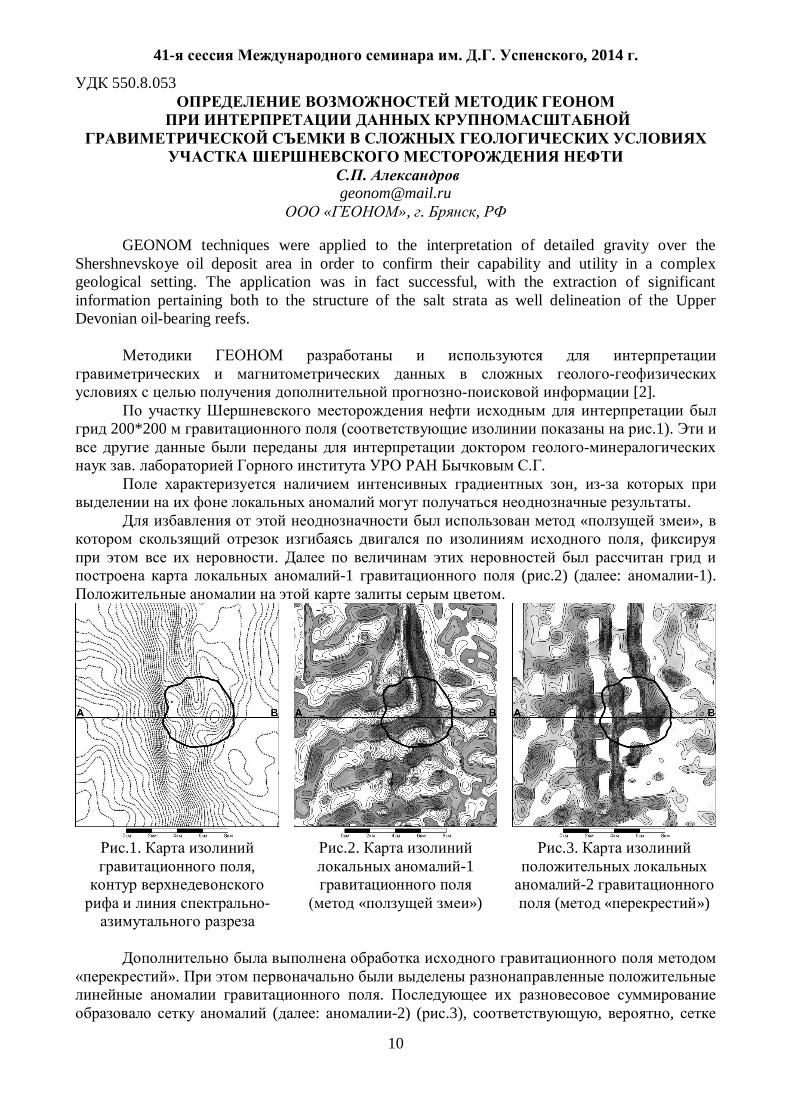
200*200 ( .1).
. .
, .
« », ,
. -1 ( .2) ( : -1).
.
.1.
, -
.2.
-1
« »)
.3.
-2
( « »)
». .
( : -2) ( .3), , ,
41- . . , 2014 .
11
. .2, ,
, .3. ,
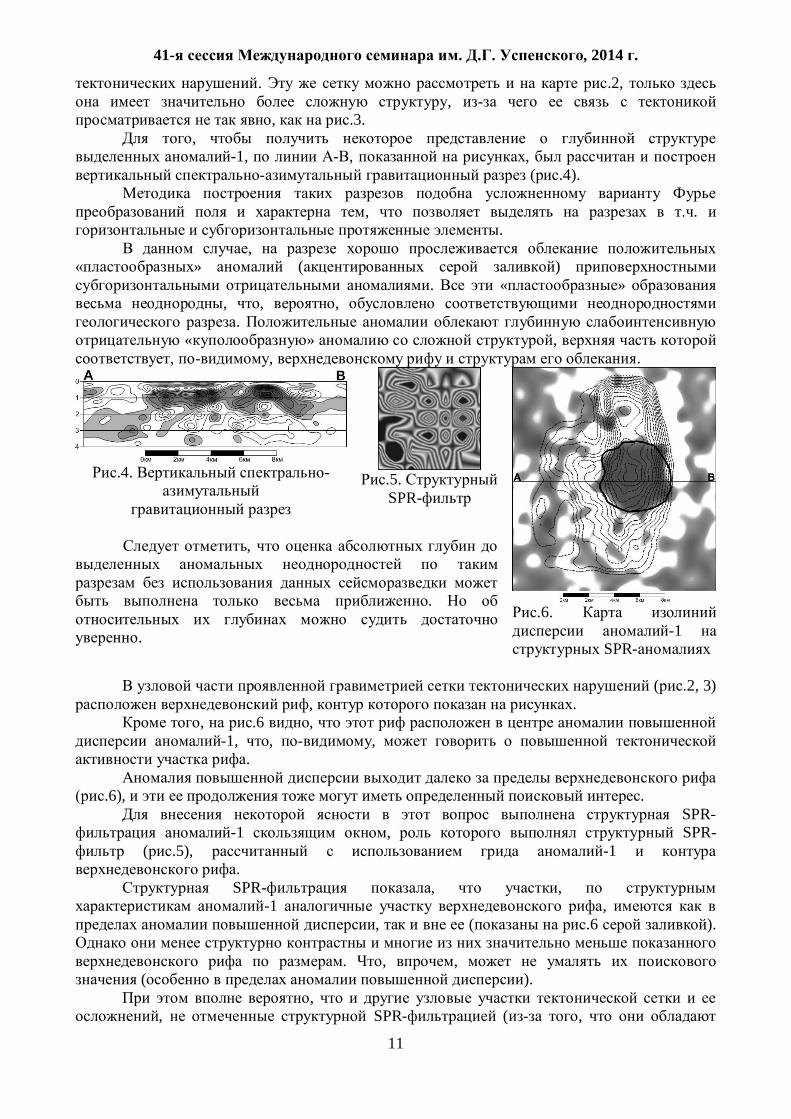
-1, , , ( .4).
, .
. ,
» ( ) . « »
, , , .
« » , , , .
.4. -
.5. SPR-
.6.
-1 SPR-
,
.
.
( .2, 3) , .
, .6 , -1, , ,
.
.6), . SPR-
-1 , SPR- ( .5), -1
. SPR- , ,
-1 , , ( .6 ).
. , ,
( ). ,
, SPR- ( ,

41- . . , 2014 .
12
-1 ) ( .2, 3), .
-1 , , ,
-1 ( .7), . , ,
-1 ( .8, 9), , [1].
, ( .2, 3),
, , .
.7.
-1
.8.
-1
.9.
-1
,
, , ,
-1, . , , .
,
,
, ,
, .
1. .
, " ", 2005, 1, URL: http://www.ogbus.ru/authors/ Bychkov/ Bychkov_1.pdf
2. Yudakhin F.N., Alexandrov S.P., Gubaydullin M.G. «GEONOM» technologies: new trend in geological prognostication. // Annales Geophysical. European Geophysical Society. XXII General Assembly. – Vienna, Austria, 21-25 April, 1997, p.54.

41- . . , 2014 .
13
550.83 (26)
.
[email protected] Petroleum Geo-Services (PGS) ;
. , , The development of the market of geophysical services on the Russian shelf is discussed in
the report. Particular attention is given to conducting comprehensive marine geophysical surveys. .
, .
, , .
,
, . ,
.
. ( )
,
.
. , ,
.
, ,
. ,
. . . ,
. , ,
. ( ) , .
. , , ,
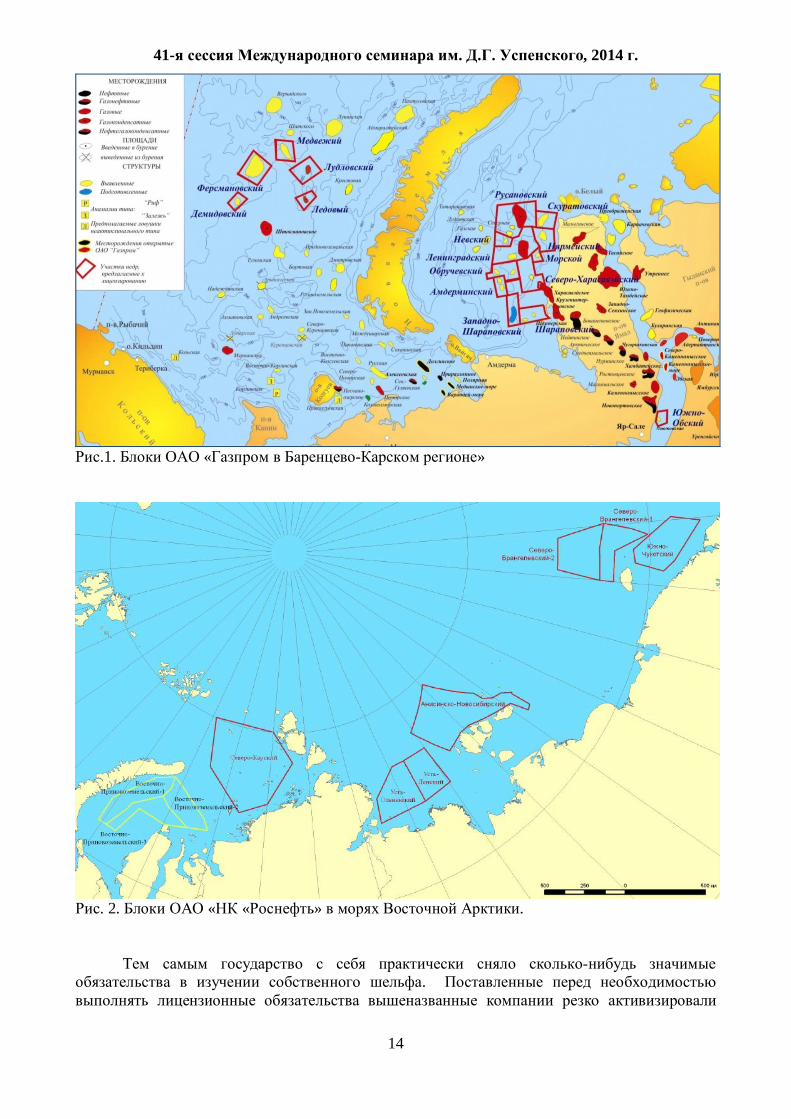
– « » « « » .
, ,
( . 1,2)
41- . . , 2014 .
14
.1. « »
. 2. « « » .
.
41- . . , 2014 .
15
, .
. , 150 2D
3D. . ,
. ,
. .
. , 2-3
« » ION, PGS . ,
,
. . , ,
. , .
,
. : 2D, 3D 4D,
, , .
1. . . . ., , 2008, 386 .
2. Yu. P. Ampilov. From Seismic Interpretation to Modelling and Assesment of Oil&Gas Fields. EAGE Publications, The Netherlands, 2010, 276 pages. 3. . . ? - Oil & Gas Journal Russia, 2011, .46-51. (www.ampilov.ru)
41- . . , 2014 .
16
550.837
. , . , . , . [email protected]
, , . Abstract. Experimental estimation of data quality of multifrequency electromagnetic sounding
by harmonics of square wave sounding signal by broadband measurement system is obtained. Data, acquired in silent environment and with presence heavy industrial noises are compared.
. , , ( )
. ,
. ,
, , ,
.
. [1],
,
. -
( ) -02 -11, [2].
, , .
50 100 10 2 250 2 . — 125 . ,
( ) .
200 — 122,0703 125 .
1000 2. -02 .
20,13 . 24 (838656 ). — 24 ,
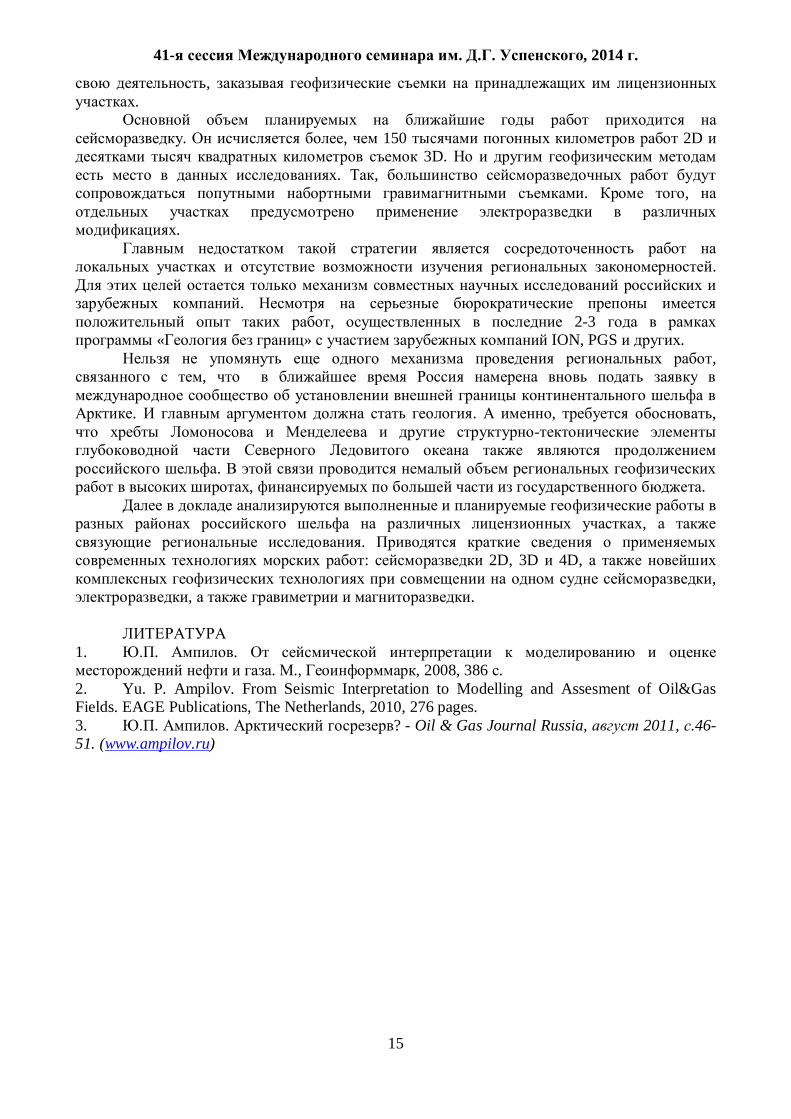
— 10 . . 1. .
, , . -
, ,
100 .
41- . . , 2014 .
17
) ) . 1.
(Hr): ) — ( 50 ); ) — .
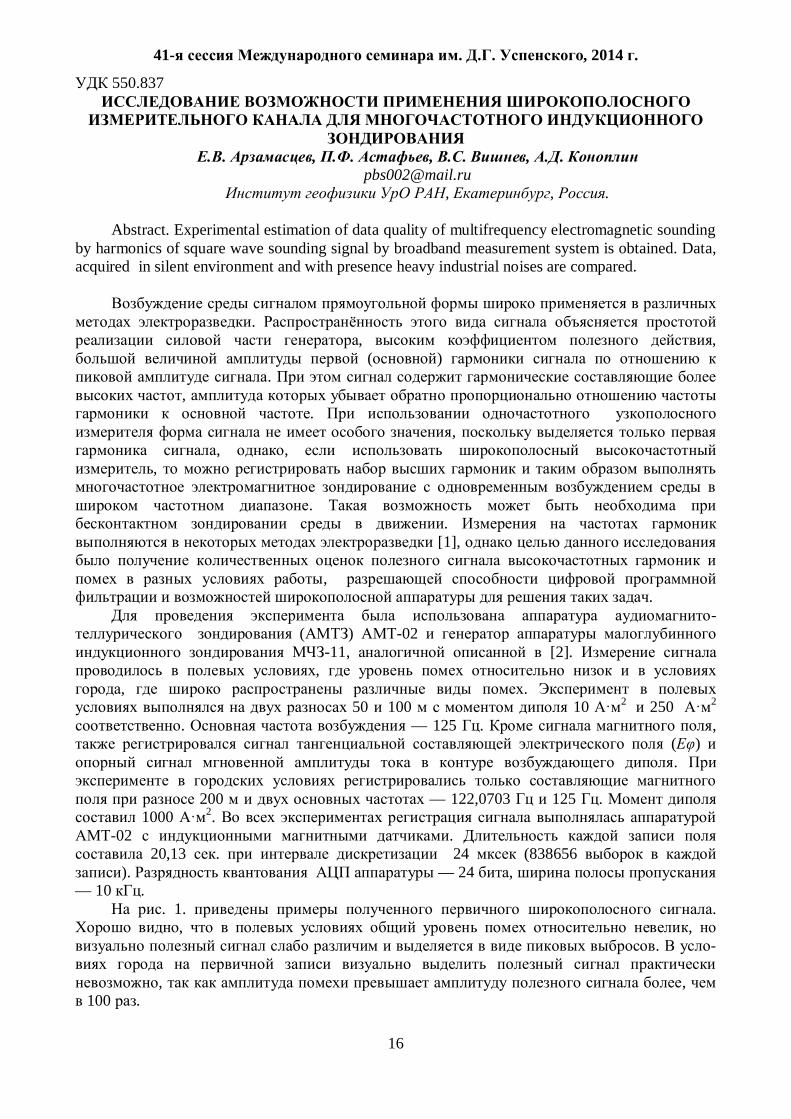
838656
) . 0,0496 , — 0,185 .
. . 2 . , ,
, , .
( 1 13).
) ) . 2 Hr:
) — ( 50 ); ) — . 125 .
, (50 ).
0 0.02 0.04 0.06 0.08 0.1 0.12 0.14 0.16T, s
-3000
-2000
-1000
0
1000
2000
B, p
T
0 0.02 0.04 0.06 0.08 0.1 0.12 0.14 0.16T, s
-40
-20
0
20
40
B, p
T
0 400 800 1200 1600F, Hz
0.001
0.01
0.1
1
10
B, p
T
0 100 200 300 400F, Hz
0.001
0.01
0.1
1
10
100
1000
B, p
T
41- . . , 2014 .
18
.2 ) 1 3 125 50 , .
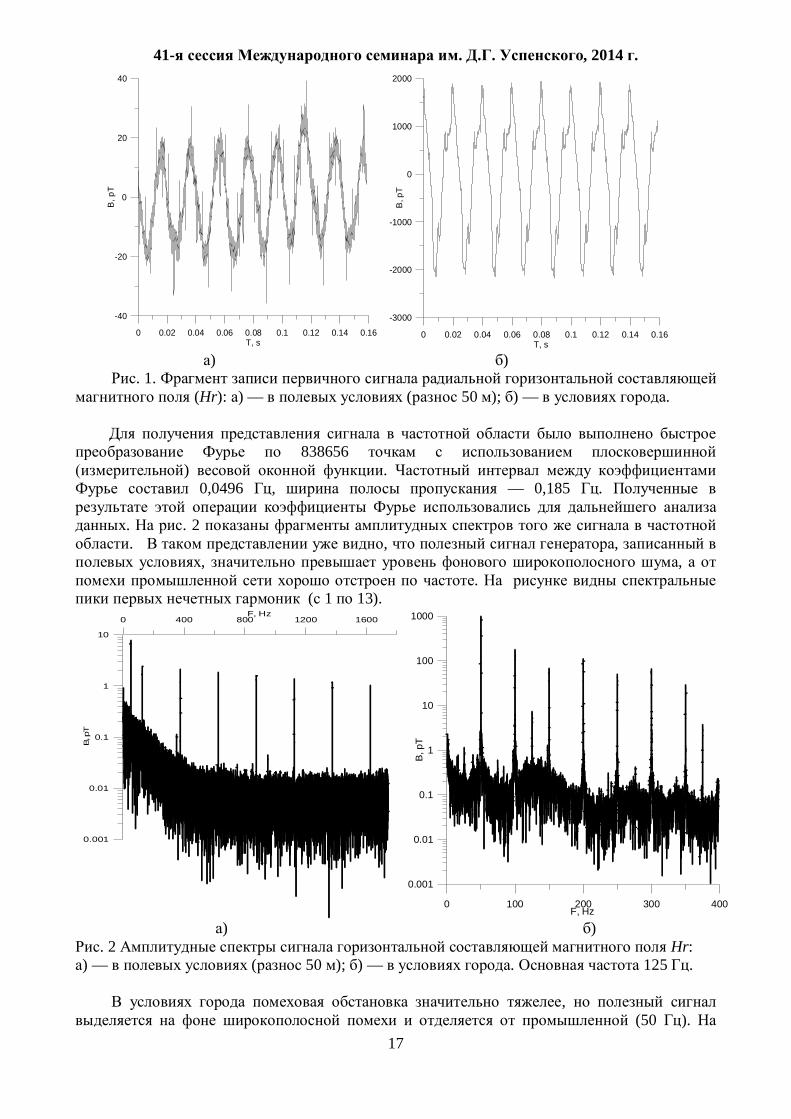
. 3. 875 (7 125 , ).
: —
; —
( . 3);
( ); , —
(Hz/Hr, Hz/H , /Hr) ;
Hz/Hr .
, ,
.
12- -5-1045 12- -5-1020.
.
1. ., . GPS- . // . 3, 2013 .,
. 133-137. 2. ., .
–8. // : 1, 2011 ., .4-8.
873 874 875 876 877F, Hz
0
0.5
1
1.5
2
2.5
B, p
T
HzHrHf
41- . . , 2014 .
19
«GrAnM» .
,
.
«GrAnM», 2D (
) , . [3,4]
«GrAnM» , , , ,
, .
,
. , ,
.
( ) .
, , , ,
,
. ,
y, xz
z ) .
zV
z = 0 z = -h.
( ), 4 .
« » z = 0 z = -h 32 , 200 , , ( ), 161
. , , [3,4].
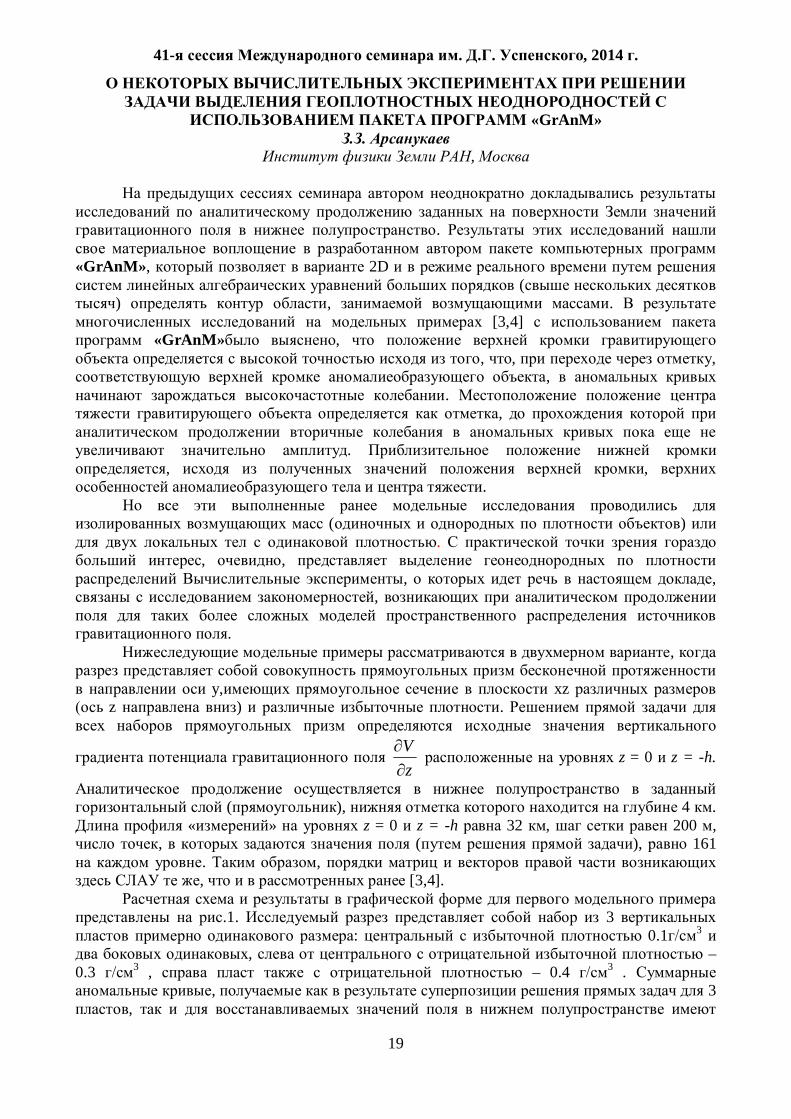
.1. 3
: 0.1 3 , –
0.3 3 , – 0.4 3 . , 3
,
41- . . , 2014 .
20
, ( ) ( ). ,
. ,
, .
. , )
. , , ,
.
. 1. ,
, : - 1 (5 ); – 2 (10 ); – 4 (20 ); – 6.4 (32 ); – 8.8 (44 ); – 4 .

41- . . , 2014 .
21
. 2. ,
, : - 1 (5
); – 2 (10 ); – 4 (20 ); – 6.0 (30 ); – 4 .
). , x
41- . . , 2014 .
22
x , .
. 2.
0.1 3 ,
( (- 0.3 3) (- 0.4 3) ). 1 2 ( , )
( ) , .
( , ),
( ). ,
, . ,
, x.
, , ,
, . , , ,
, , ,
. , , «GrAnM»
.
. 1. . ., . . . .:
, 1965. . 495 2. . ., . .
) // , : 28- . . .
, , 28 – 2 2002 . . . II .: , 2002. . 73-77
3. . . « .
» 2009 1. 13. 47-57. 4. .
GrAnM. 37- . . « 6.
, ». 25-29 2010 . . ,2010.- .29 -34.
5. . C# 3.0: . 4- . — .: « », 2009.

41- . . , 2014 .
23
,
. " "
Abstract. Modern requirements for seismic data processing and interpretation has fallen outside of structural imaging, characterization of improved reservoir saturation properties. Services players are facing a challenge related to lithology, reservoir qualities (permeability and porosity), saturation type, oil-and-gas thickness prediction. This means the necessity of rather exact solutions- not qualitative-based approach to section parameter determination. The absence of low-frequency components of the signal as a result of inversion made it impossible to obtain a reliable estimate of elastic impedance absolute values. And as a consequence – inability to obtain absolute values of predicted parameters (such as shale volume, porosity, permeability, etc.). The main problem is that a low-frequency component (in an explicit form) in the signal obtained from seismic sensors is either not available (hardware filtering in seismic module) or excluded from the spectrum during processing. As part of the interpretation study of physical sense of wavefield special attributes our experts have directed attention to an interesting fact: in the points of some wells the integral of waveform envelope after total filtering (by complex combined filter) almost completely coincides with acoustic impedance curve on the basis of production logging data (after applying low frequency filter). Further studies have showed that the observed effect is due to the nonlinearity of geological environment. Thus, it was recognized that in a special case the nature of nonlinearity is equivalent to amplitude modulator ( ). And a signal envelope (Gilbert transform, for example) is nothing but signal detector. Thus, the calculation of the signal envelope after total filtering makes it possible to obtain the missing part of low frequency range of spectrum. Keywords. seismic, non-linearity, low-frequency, inversion, absolute values.
, . ,
, , , .
, .
( .1) , ( ) ,
, ( :
, , .).
.1. ( -
, - ). Rebecca Buxton Latimer (2000 ., Leading Edge).
41- . . , 2014 .
24
, ,
( )
.
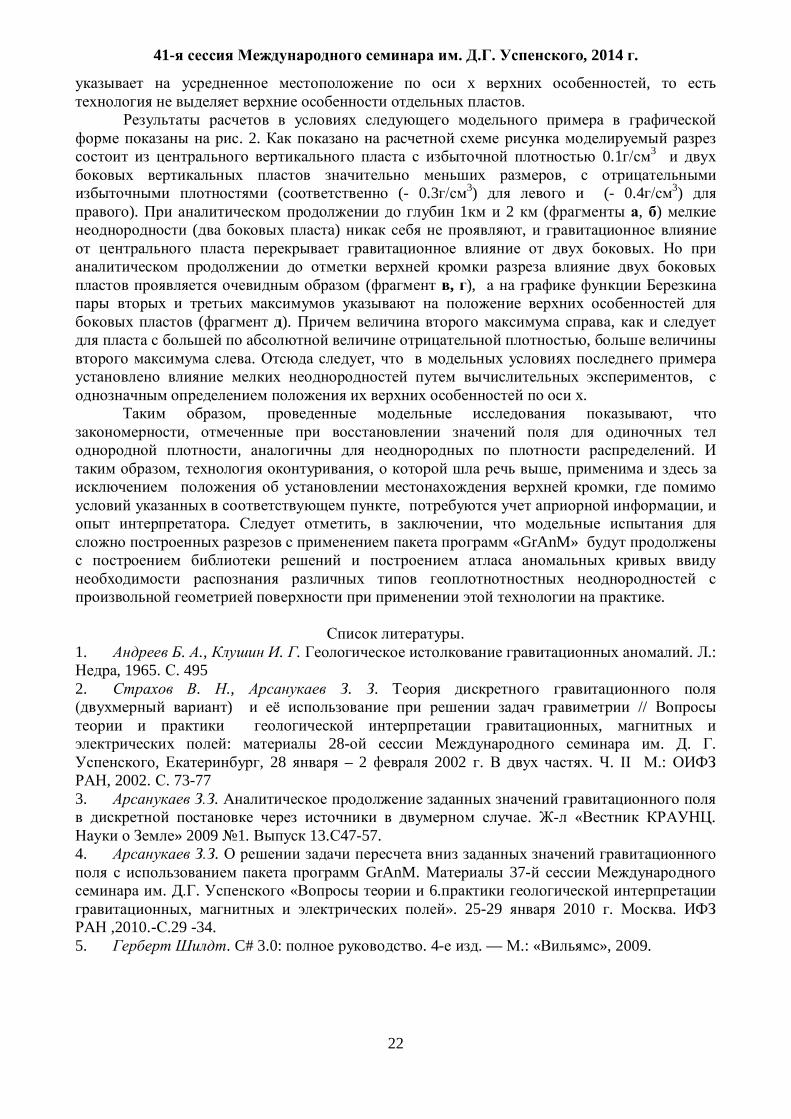
, "GeoStreamer" .2). ,
,
.
.2. (PGS).
, ,
. ,
. , ( )
, 0 3-4 . , ,
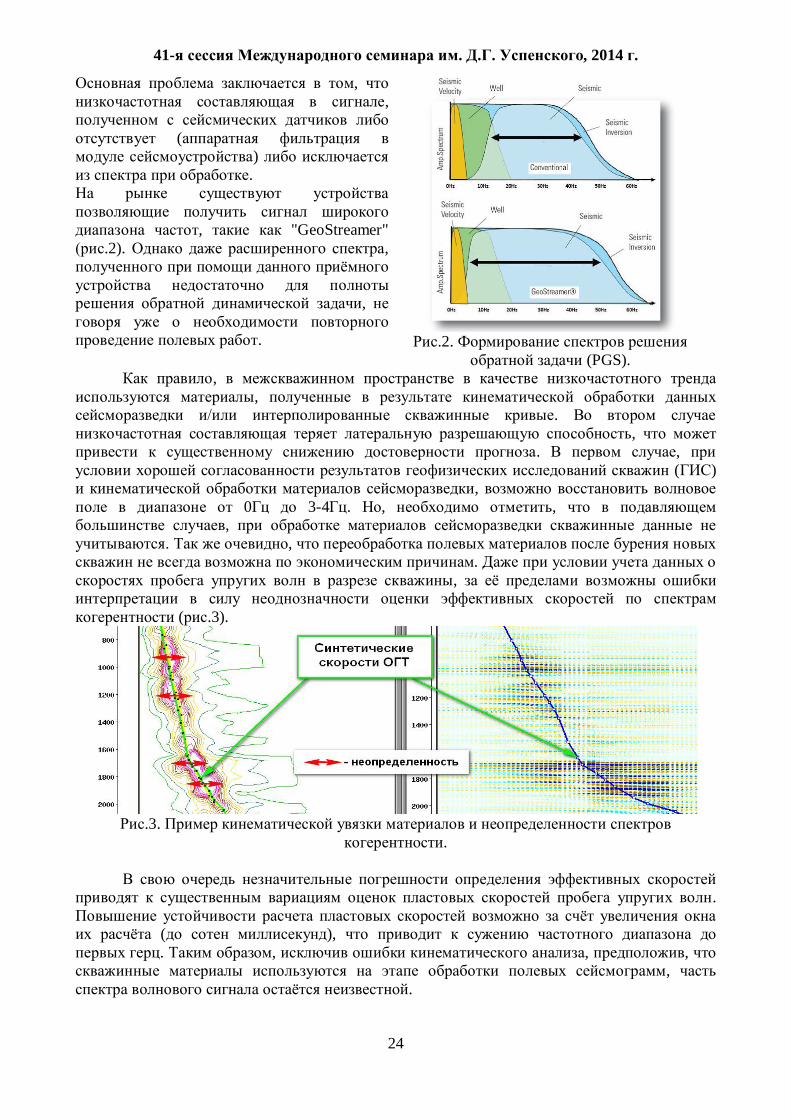
, . ,
. ,
( .3).
.3.
.
.
( ), . , , ,
, .

41- . . , 2014 .
25
,
: , ,
( ). ,
.4).
, , ,
). - ,
.
.4. .
, , .
" ",
, . .5 ( ) ,
( ).
.5.
, ( 13 ).
, .
. .6 ,
(" ").
41- . . , 2014 .
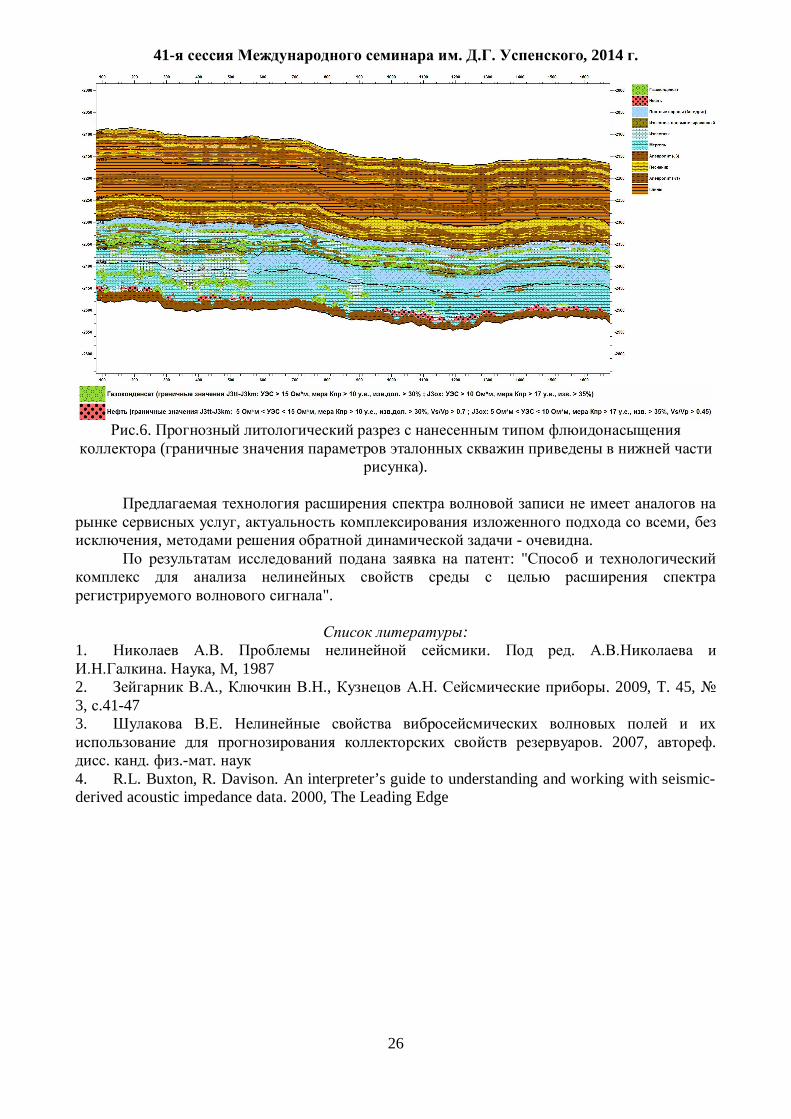
26
.6.
( ).
, , , - .
: "
".
: 1. . . .
. , , 1987 2. ., ., . . 2009, . 45, 3, .41-47 3. .
. 2007, . . . .- .
4. R.L. Buxton, R. Davison. An interpreter’s guide to understanding and working with seismic-derived acoustic impedance data. 2000, The Leading Edge

41- . . , 2014 .
27
550.8.05
.
[email protected] « « », ,
An algorithm for pattern recognition with training on standards for small amounts of the
learning sample, based on the theory of combinatorics.
. ,
,
. « « »
[1], , .
( , ),
, . ,
, , – .
( , , ),
.
, 10 , 4 , 4-
, ), , .
, . ,
, , 40, 10-20 ,
. ,
. .
1. , ( ) . ,
) , ( ) , ,
. 2.
, , .
3. .
:
41- . . , 2014 .
28
BBBBBB jjji pjipp,cov ,
Bip , B jp - i- j- , BB jip -
i- j- .
, , .
, .
4. .
, . . ,
( 1:50 000) .
:
1. . . // . .
. 1990, 1.
41- . . , 2014 .
29
550.831.016 -
. , . , .
[email protected] « « », ,
Estimates of the approximation error in relief correction for airborne and ground gravity.
The error value is 12 mGal for ground data and 2 mGal for airborne data if error of approximation 400 m.
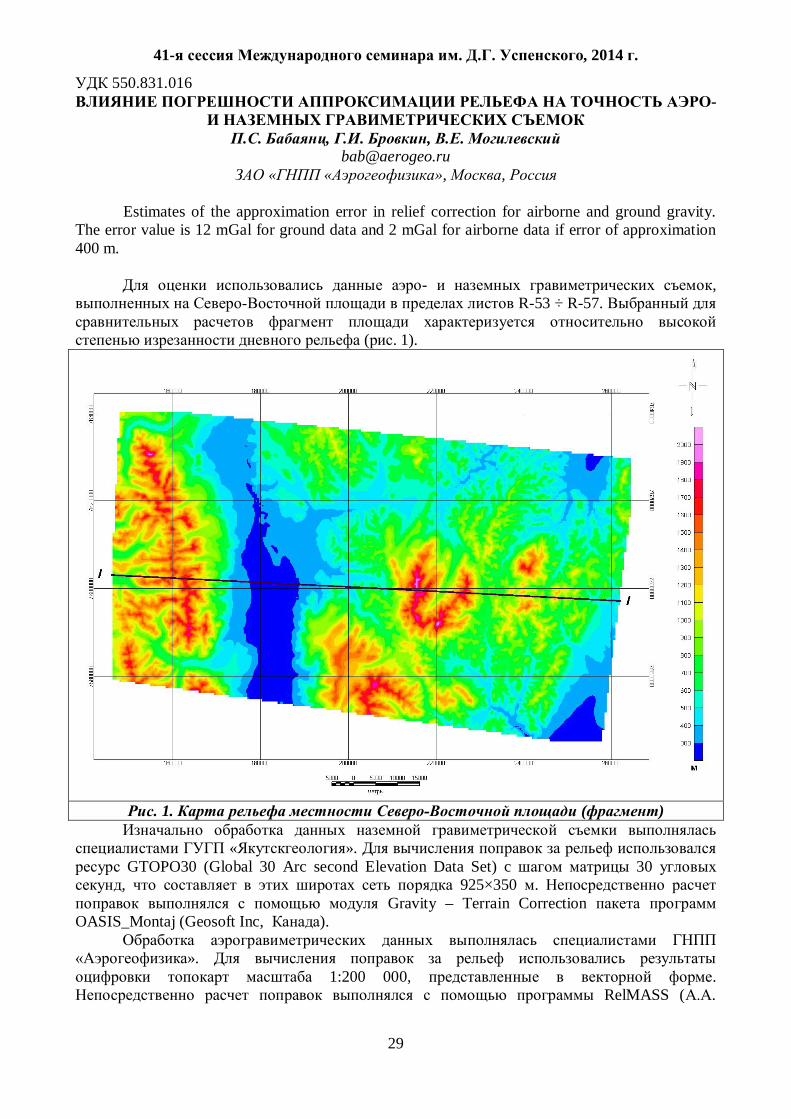
- ,
R-53 ÷ R-57.
( . 1).
. 1. ( )
« ».
GTOPO30 (Global 30 Arc second Elevation Data Set) c 30 , 925×350 .
Gravity – Terrain Correction OASIS_Montaj (Geosoft Inc, ).
».
1:200 000, . RelMASS ( .
41- . . , 2014 .
30
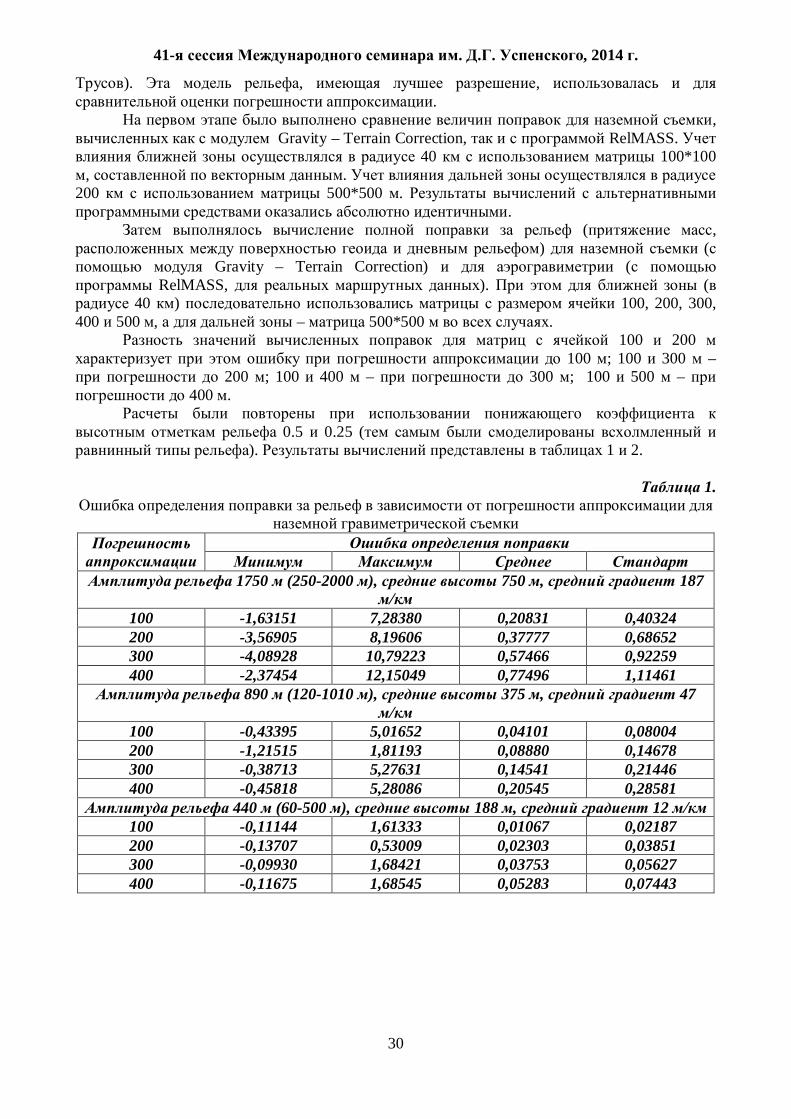
). , , .
, Gravity – Terrain Correction, RelMASS.
40 100*100 , .
200 500*500 . .
( , ) (
Gravity – Terrain Correction) ( RelMASS, ). (
40 ) 100, 200, 300, 400 500 , – 500*500 .
100 200 100 ; 100 300 –
200 ; 100 400 – 300 ; 100 500 – 400 .
0.5 0.25 (
). 1 2.
1.
1750 (250-2000 ), 750 , 187
100 -1,63151 7,28380 0,20831 0,40324 200 -3,56905 8,19606 0,37777 0,68652 300 -4,08928 10,79223 0,57466 0,92259 400 -2,37454 12,15049 0,77496 1,11461
890 (120-1010 ), 375 , 47
100 -0,43395 5,01652 0,04101 0,08004 200 -1,21515 1,81193 0,08880 0,14678 300 -0,38713 5,27631 0,14541 0,21446 400 -0,45818 5,28086 0,20545 0,28581
440 (60-500 ), 188 , 12 100 -0,11144 1,61333 0,01067 0,02187 200 -0,13707 0,53009 0,02303 0,03851 300 -0,09930 1,68421 0,03753 0,05627 400 -0,11675 1,68545 0,05283 0,07443
41- . . , 2014 .
31
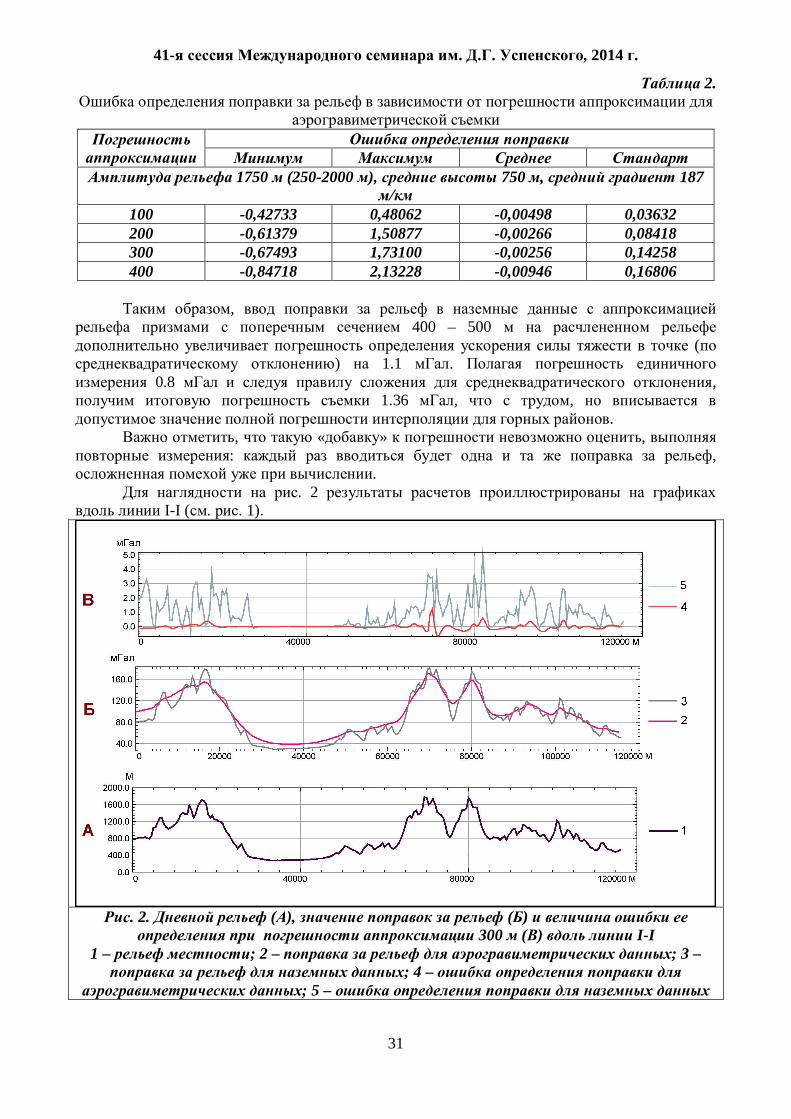
2.
1750 (250-2000 ), 750 , 187
100 -0,42733 0,48062 -0,00498 0,03632 200 -0,61379 1,50877 -0,00266 0,08418 300 -0,67493 1,73100 -0,00256 0,14258 400 -0,84718 2,13228 -0,00946 0,16806
,
400 – 500 (
) 1.1 . 0.8 ,
1.36 , , .
, « » , : ,
. . 2
I-I ( . . 1).
. 2. ( ), ( )
300 ( ) I-I 1 – ; 2 – ; 3 –
; 4 – ; 5 –
41- . . , 2014 .
32
550.8.05
, .
[email protected] « « », ,
Potential field gradient-component transformations and derivative computations are
necessary for many techniques of data enhancement, direct interpretation, and inversion. We propose new technique to perform 2D and 3D gradient potential field derivative computations using hyper-plane approximation.
, .
, , ( , ),
. , ,
.
, 1000 , ,
– .
, , ,
. , ,
( ),
. ,
. , ,
. .
41- . . , 2014 .
33
550.831.017
. 1, . 2 [email protected]
1 – , . 2 –
, . ,
In the article we present results of the first experience of synthesis of renewed deterministic models of interpretation and simplest statistical methods for the definition of positions and depths of recommended boreholes with the object of development of gravity sources. In the suggested algorithm we use ideas of the guaranteed approach and constructions of generalized assembly algorithms for finding of single interpretative variants in the presence of different prior information.
KEY WORDS: gravitational exploration, interpretation, assembly method, algorithm, detecting function
[1],
.
D – , G –
tg~ ttXg )( . , g
, rS R 3 )(Xr ,
rSX , r n,...,2,1 . : )(XP , DX , , , X ,
. TT – D ,
N T ,
rS . D
xihxx , xNi ,...,2,1 ; yjhyy , yNj ,...,2,1 ; zkhzz , zNk ,...,2,1 , T
– kjiT ,, . Q* , G , [2].
F , T :
**,,,, /)( LLTF kjikji , (1)
*L – , *Q , *,, kjiL –
*Q , sjiT ,, , ks ( .
, kjiT ,, ). F , , ls )()( ,,,, ljisji TFTF , . ,
41- . . , 2014 .
34
, , .
)(XP , kjiTX ,, ,
)( ,, kjiTF . N D
** , , *L . , *Q ,
, * *r ,
G , .
( ), ,
[3].
: – S 25,0 3 ; g
txt 05,0 , 36,...,2,1t , . : 02,0)( 1 05,0)( 2 .
F : 1). , g ; 2).
, , .
50 . , ( . 1).
« » 284, « » 425,
( 2) « » 199, « » 319. –
.
. ,
. , .
F
, ,
.

41- . . , 2014 .
35
. 1. F,
: « » ( ) « » ( ) ; « » ( ) « » ( )
( 12-05-00414- )
( 12- -5-1012).
1. ., ., .
( ) // , 2009. 3. .
30–36. 2. ., ., .
// . . 2009. . 31. 5. . 128 – 140.
3. ., . // . 2012. 5. . 85-
101.
41- . . , 2014 .
36
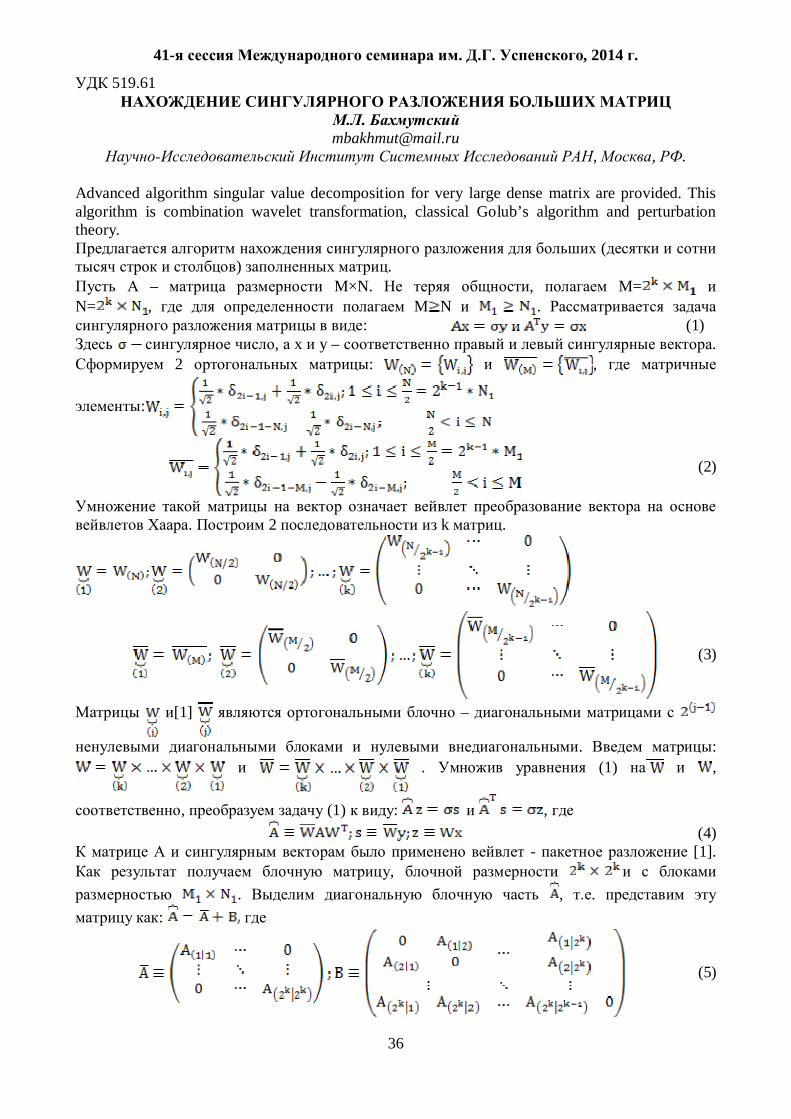
519.61
, , . Advanced algorithm singular value decomposition for very large dense matrix are provided. This algorithm is combination wavelet transformation, classical Golub’s algorithm and perturbation theory.
( ) .
– M×N. , M= N= , M N .
: (1) , x y – .
2 : ,
:
(2)
. 2 k .
(3)
[1] –
. : . (1) ,
, (1) : , (4)
- [1]. ,
. , . :
(5)
41- . . , 2014 .
37
- , , , , B –
. (6)
(7)
[2]. (6) :
(8)
(7).
(9) (9), . (6),
. (4) : ,
(10)
(10) [3]. (10) n- :
,
: (11)
. :
, (12)
, .
, . , . ,
(12), . , (12) . .
– , .
1. . , . , . , , -,2002 .
2. , , . ., », 1976 .
3. . , . , , .2, ., , 1963 .

41- . . , 2014 .
38
550.3:061.2/.4
.
Replacement of layers with rhythmically changing thin different interlayers on
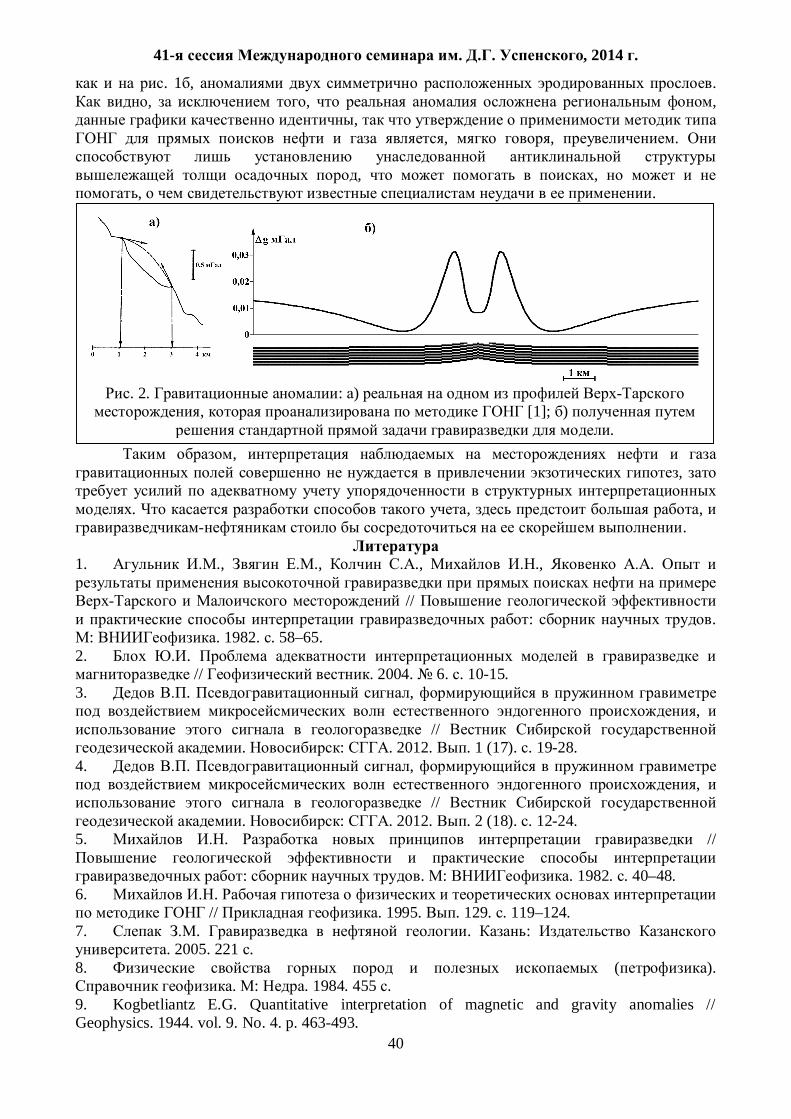
homogeneous layers can qualitatively alter the anomalous fields and lead to misinterpretation. 10 ,
, [2].
, . ,
, , .
, , . «
», « » -
, . . [8]. , .
2,35 3, – 2,50 3, .
,
, . ,
.
, , , .
, .
, ,
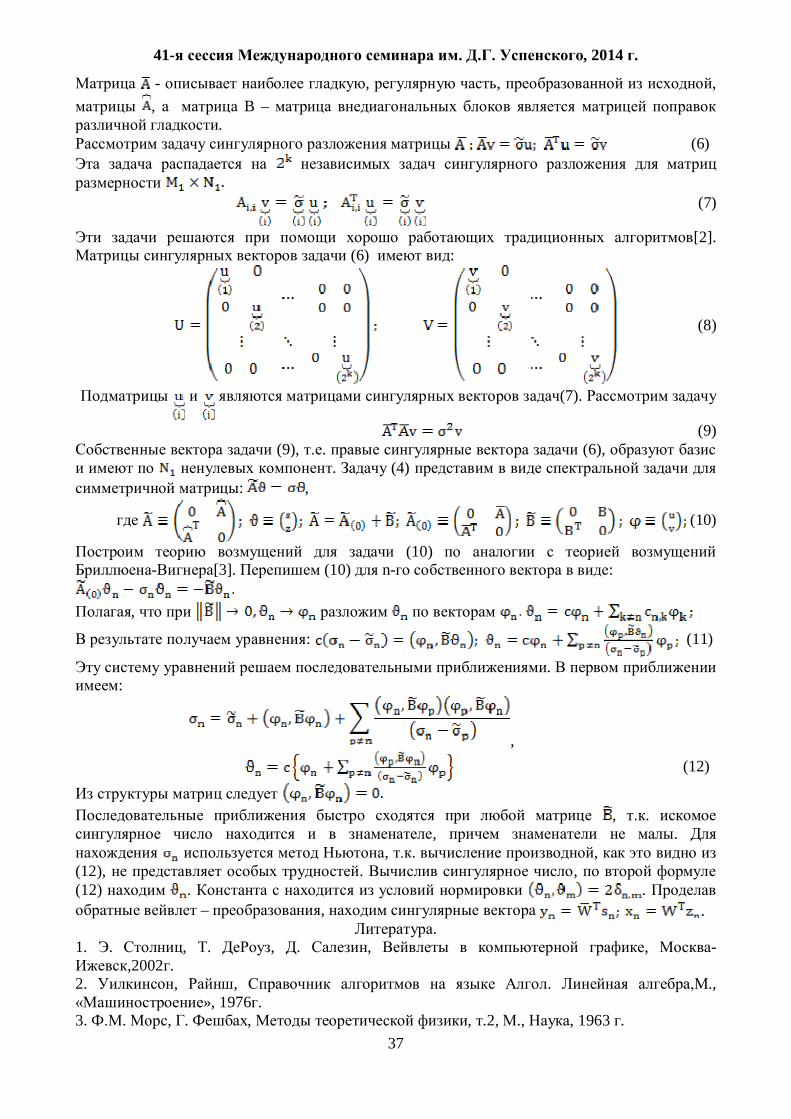
. . . 1 ,
, . , ,
g, , . 1944 . [9], ,
: . , ,
. , , ,
. . 1 ,
200 , 200 (30 ). , -
0,15 3. , 0,1 ,

41- . . , 2014 .
39
, , 0,02 , ,
5 .
, ,
.
,
, .
, ,
,
. ,
, . . [7],
, . .
( ) [1, 5, 6].
,
. , , , , ,
. , , .
. . , , , , -
[3, 4]. , ,
. 0,1 – .
. . 2 – [1] . ,
. . [4], . . 2
30
, . ,
. 1.
: ) , ,
; ) : 1 –
, 2 – , 3 –
.
41- . . , 2014 .
40
. 1 , . , , ,
, , , .
, ,
, .
,
,
. , , .
1. ., ., ., ., .
//
: . : . 1982. . 58–65.
2. . // . 2004. 6. . 10-15.
3. . , ,
// . : . 2012. . 1 (17). . 19-28.
4. . , ,
// . : . 2012. . 2 (18). . 12-24.
5. . //
: . : . 1982. . 40–48. 6. .
// . 1995. . 129. . 119–124. 7. . . :
. 2005. 221 . 8. ( ).
. : . 1984. 455 . 9. Kogbetliantz E.G. Quantitative interpretation of magnetic and gravity anomalies // Geophysics. 1944. vol. 9. No. 4. p. 463-493.
. 2. : )
, [1]; ) .
41- . . , 2014 .
41
050
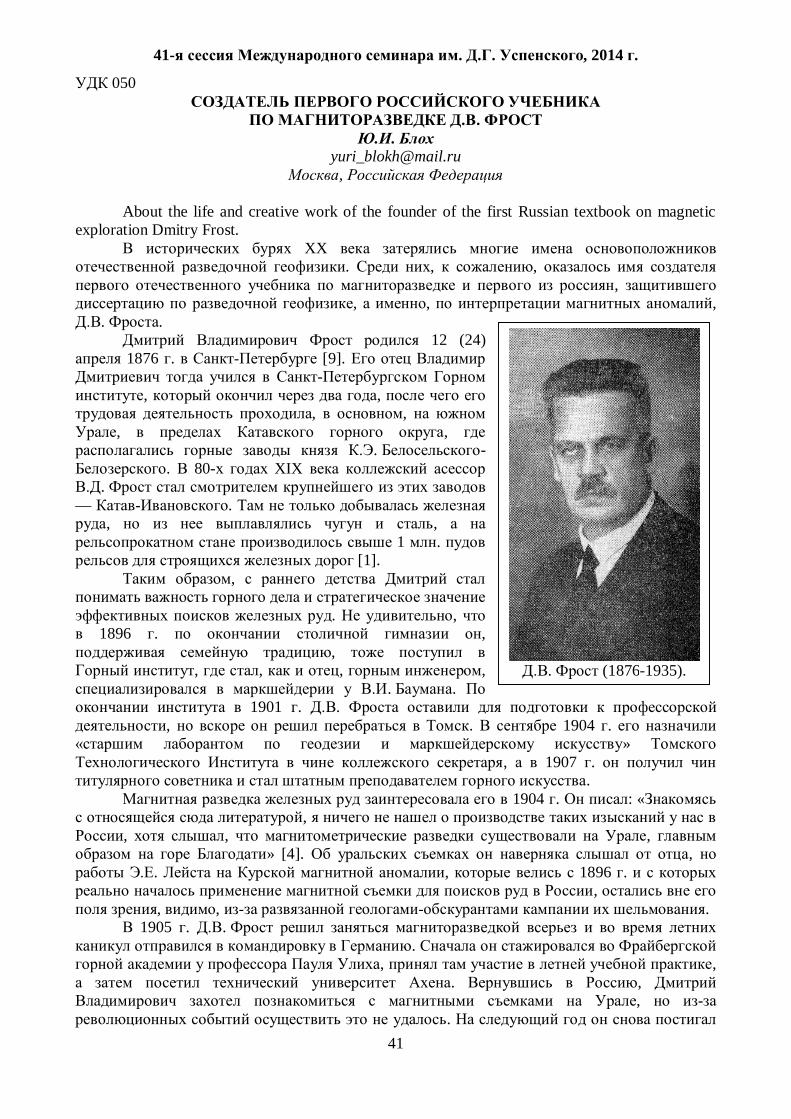
. .
About the life and creative work of the founder of the first Russian textbook on magnetic
exploration Dmitry Frost. XX
. , , ,
, , , . .
12 (24) 1876 . [9].
, ,
, , , ,
. -. 80- XIX
. — .
, , 1 .
[1]. ,
. ,
1896 . , ,
, , , , . .
1901 . . , . 1904 .
» , 1907 .
. 1904 . : «
, , , ,
» [4]. , . , 1896 .
, , , .
1905 . . .
, , . ,
, .
. (1876-1935).
41- . . , 2014 .
42
, — .
1907 . , . , ,
. , , « , 3-4
, , . ,
» [4]. , 1898 .,
, . . , . .
, , , 1899 .
, — . , , , ,
, . , . ,
. 1907/1908
[5], , , . 1908 . . ,
, . ,
. . 1909 . ,
. 1910 . « »,
« . , » [6]. 19 , , ,
. 5 , .
. ,
. , , , . , . . , . (
), 1909 . [3], .
», 7 1912 .
, , ,
, . [7], 20 1913 . -
, . 1914 .
. , .
, .

41- . . , 2014 .
43
: 1916 . , , 1918 .
. , . 1920 .
, « », ,
— . , ,
. 1920 . . — , 1921 .
— , , . ,
, .
1932 . , , «
» [8]. . . ,
. . . ,
. , .
. , , , ,
. : «
, , ». , « » — 24 25 1935 .
. , . , : « .
— , , ; , —
» [2].
1. . // . 2008. 3. . 27-33.
2. . † . // . . 1935. 1 (33). . 1-2. 3. . // :
. 1909. 61 . 4. . 1907 //
. 1909. . 13. 1. 13 . 5. . . :
. 1908. 112 . 6. . . . 1910. 114 . 7. . . :
». 1912. 130 . 8. . //
. 1932. . 6. C. 87-134. 9. Brglez A., Seljak M. Ruski profesorji na Univerzi v Ljubljani. Ljubljana: Institute for Civilization and Culture. 2007. 96 p.
41- . . , 2014 .
44
550.83:551.214(265.53):681.3
. )
. 1, . 2, . 3, . 3, . 4, . 5
1 ; 2 . . , . ;3 , . ; 4 ,
. ; 5 « », . The paper provides results from application of designed modern computer techniques for
interpretation of materials from complex geophysical investigation of submarine volcano which are located west of the south-western coast of Simushir Island in the Kurile island arc.
1980 . 17 « » 1983 .
~ 20 . .
, « » 6.13
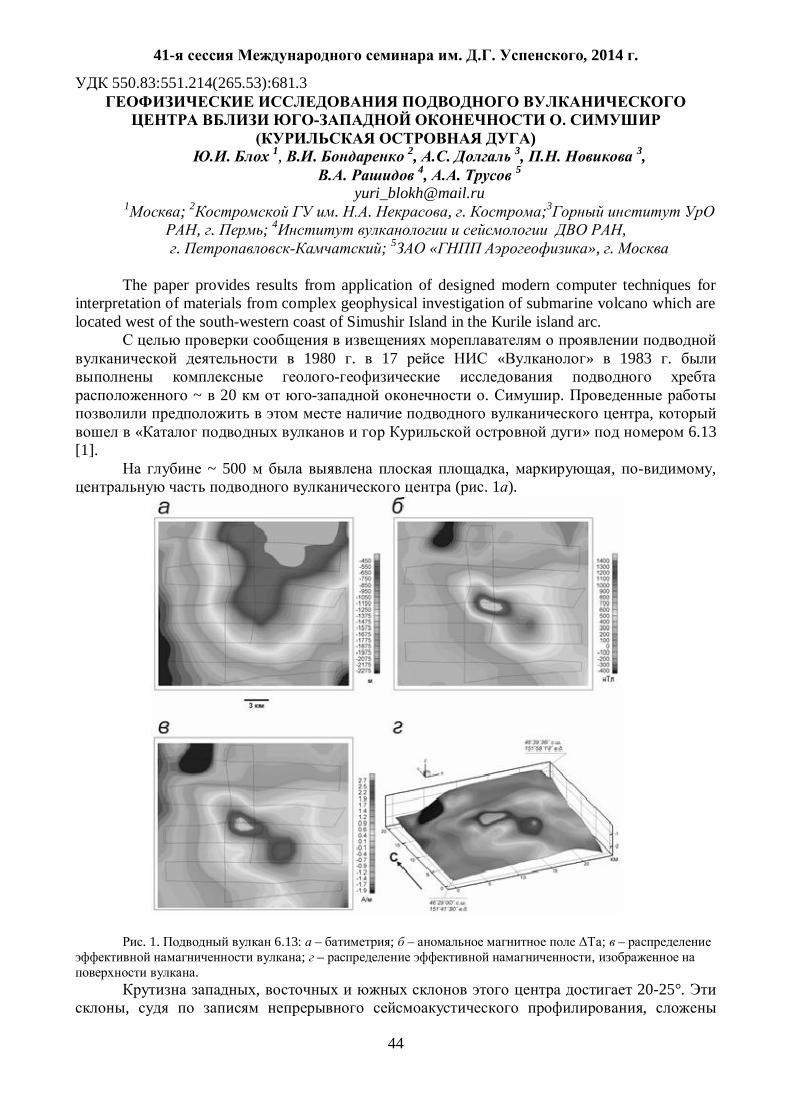
[1]. ~ 500 , , ,
( . 1 ).
. 1. 6.13: – ; – ; – ; – ,
. , 20-25°.
, ,
41- . . , 2014 .
45
. ( 250-300 ) .
, 1800 . 1 ).
~ 2000 , – 25×20 . 100 3 [1].
,
[1].
,
, [2-4]. ,
, , , 12.41 8.50 .
( ). , 6.13
Jn,
æ, 10-3
1 10 4.18-12.41 5.47-14.70
2 5 0.11-8.50 21.7-136.36
3 6 0.50-1.36 3.01-6.29
4 3 0.003-0.004 5.26-5.66
5 6 2.8-3.41 1.74-10.01
6 1 0.74 5.6
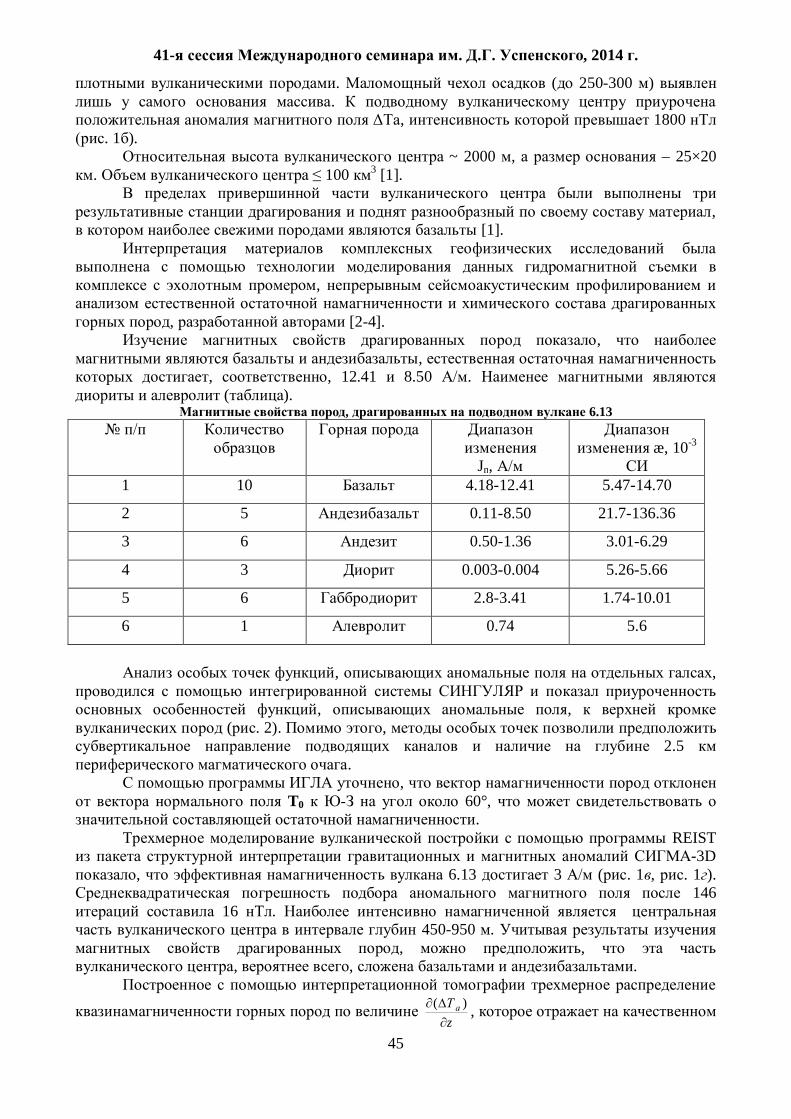
, ,
, ,
( . 2). , 2.5
. ,
T0 60°, .
REIST -3D
, 6.13 3 ( . 1 , . 1 ). 146
16 . 450-950 .
, , , , .
z
)( ,
41- . . , 2014 .
46
, ,
.
. 2. , ,
T , .
,
. ,
. , ,
. 2D-
, 2.5
4 ( 8º).
( 12-05-00156- , 12-05-00414- 12-05-31138- ).
1. /
. . .: , 1992. 528 . 2. ., ., ., ., ., .
6.1 ( ) // . 2012. 2. . 58-66.
3. ., ., ., ., ., .
( ) // . 2012. 4. . 8-17. 4. ., ., ., ., ., .
2.7 2.8 ( ) // . . 2013. 1. . 21. . 77-85.
41- . . , 2014 .
47
550.838
. , .
[email protected] « », . ,
Abstract
The results of geophysical surveys on three gold deposits in the Amur region. Prepositional scheme of complex interpretation of the magnetic and electrical data.
. (
). , ,
, , , .
, .
, – , – – ( )
, . .
. :
1. , (
). , .
2. , , ,
( ).
. 3. ( , J, ,
).
. 4. .
. , .
, , .
, ,
. 5. .
41- . . , 2014 .
48
,
( , /J). : , ,
, . ( . 2002 .). ,
.
, .
, [1, 2].
, , .
, , J.
, ., ,
, ), , , , , ., .
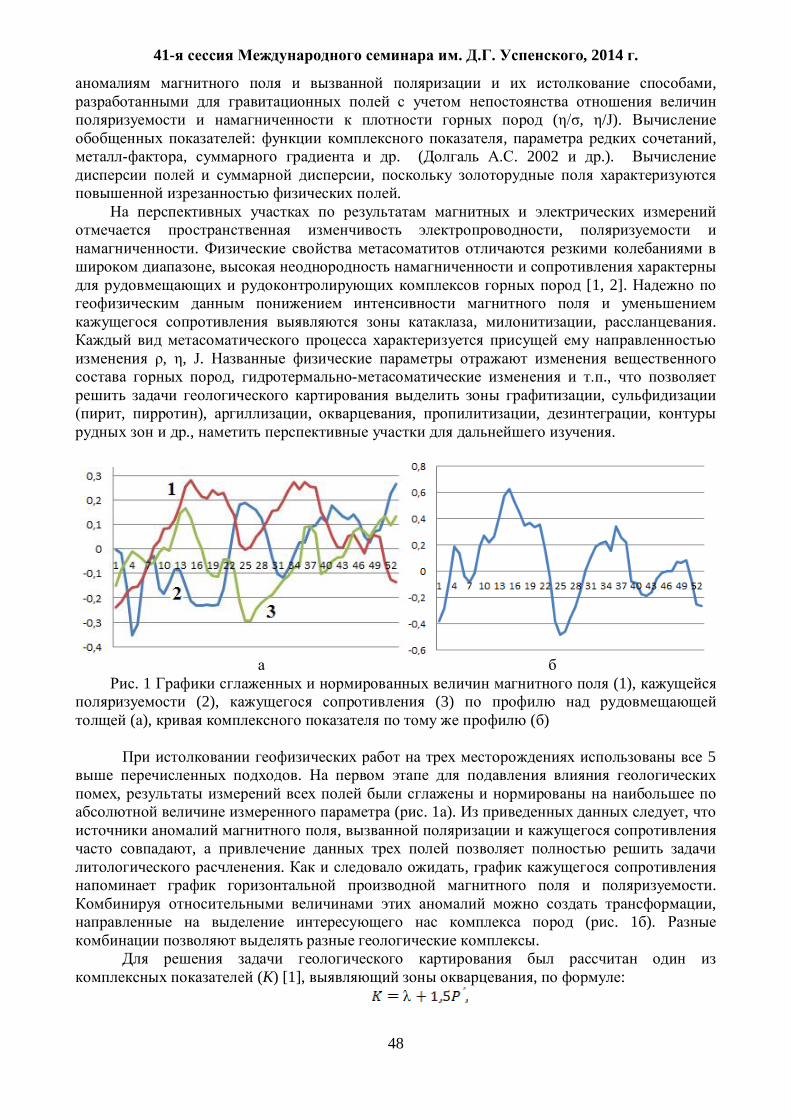
. 1 (1), (2), (3)
( ), ( )
5 .
, ( . 1 ). ,
, ,
. , . ,
( . 1 ). .
(K) [1], , :
41- . . , 2014 .
49
K – , – ( . .), - .
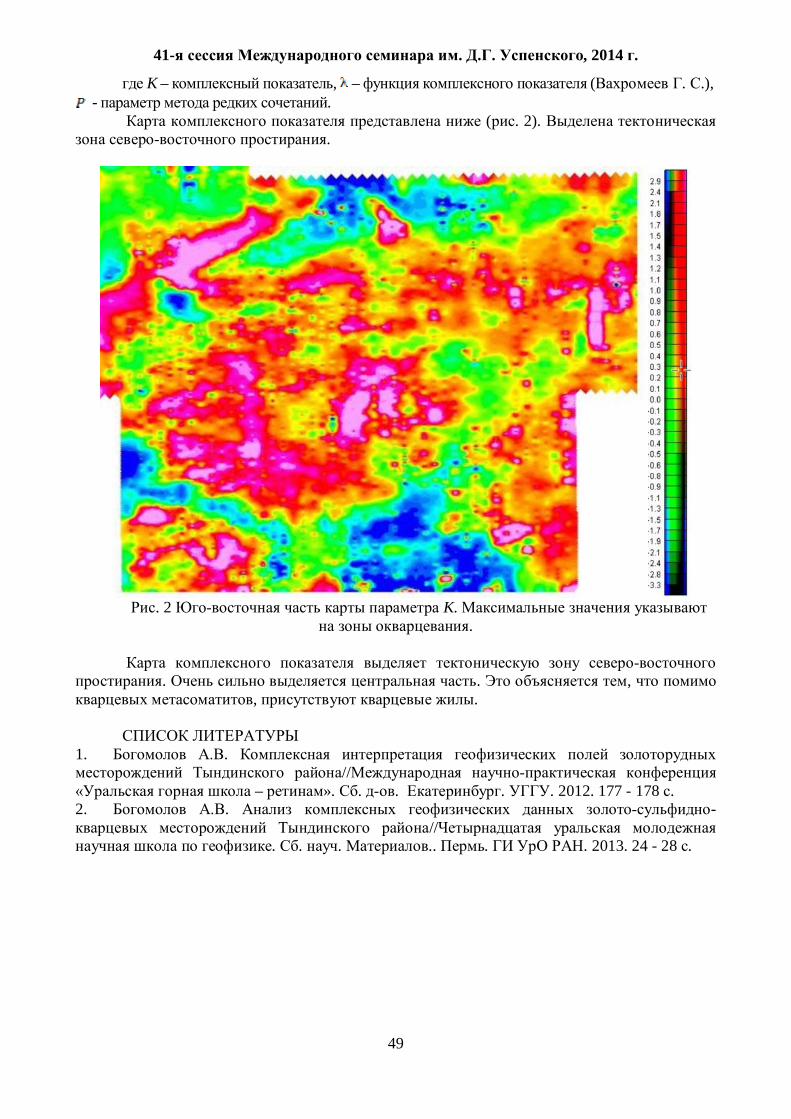
( . 2). .
. 2 K.
.
. . ,
, .
1. .
// – ». . . . . 2012. 177 - 178 .
2. . -//
. . . .. . . 2013. 24 - 28 .

41- . . , 2014 .
50
550.831
. , . [email protected], [email protected]
, ,
An approximate method for the continuation of potential fields is devised in the report. The method is based on the optimal algorithms for the approximation of the classes of functions
),(, MQr and ),(, MBr [1,2]. Recall that the class of functions ),(, MQr includes solutions of elliptic equations and potential fields created by different gravitating masses [3]. On several model examples the following advantages of the proposed method over the standard method (that is built on uniform mesh) are demonstrated: 1) the precision is one order higher; 2) the difference scheme keeps the stability while the difference scheme on uniform mesh loses the stability; 3) approximately two times smaller number of operations in comparison with standard method. . zxOx 21 ,
z . 3R],0[ HG , 2RG ),,( 21 zxxU ,
.0U (1) G .),(),,()0,,( 212121 GxxxxfxxU (2) ),,( 21 zxxU . . .
[4] (1) (2)
.),(),,(),,(21211
0
21 Gxxxxfz
zxxu
z (3)
),,( 21 zxxU .
(1) (2). xh ,1x 2x , )(khz –
z . )(khz , ,,...,1 Mk k . , )(khz . [3] ,
, , ),,(, MDBr D , .
D ,k ,1,...,1 Mk k
,1,..,2,1,2),(2 1 MkDxd MkMk
0 Mxd 2),(0 . D –
D . ,2)( 1 Mkz kh Mk ,...,2,1 .
),,( 21 zxxU : Mz 2 . ,
),( 21 xxf .0z
41- . . , 2014 .
51
[5]. [5].
],0;,;,[ Hbaba . ,,, kjiijk dccv
,N
abiaci ,,...,1,0 Ni ,MkHdk ,,...,1,0 Mk .
2NM
(2) : ),( 0ijvf ),( 1ijvf .,...,1,0,, Nji
),( ijkvU ,,...,1,,, kNkkji .1,...,3,2 Mk
),( ijkvU ,,...,1,0, Nji .,...,3,2 Mk .
. .
zh 2 , . . 0z
.]1,1[\R, 0,]1,1[, 11, 2
221
221
82
8121
xxxxxxxxf
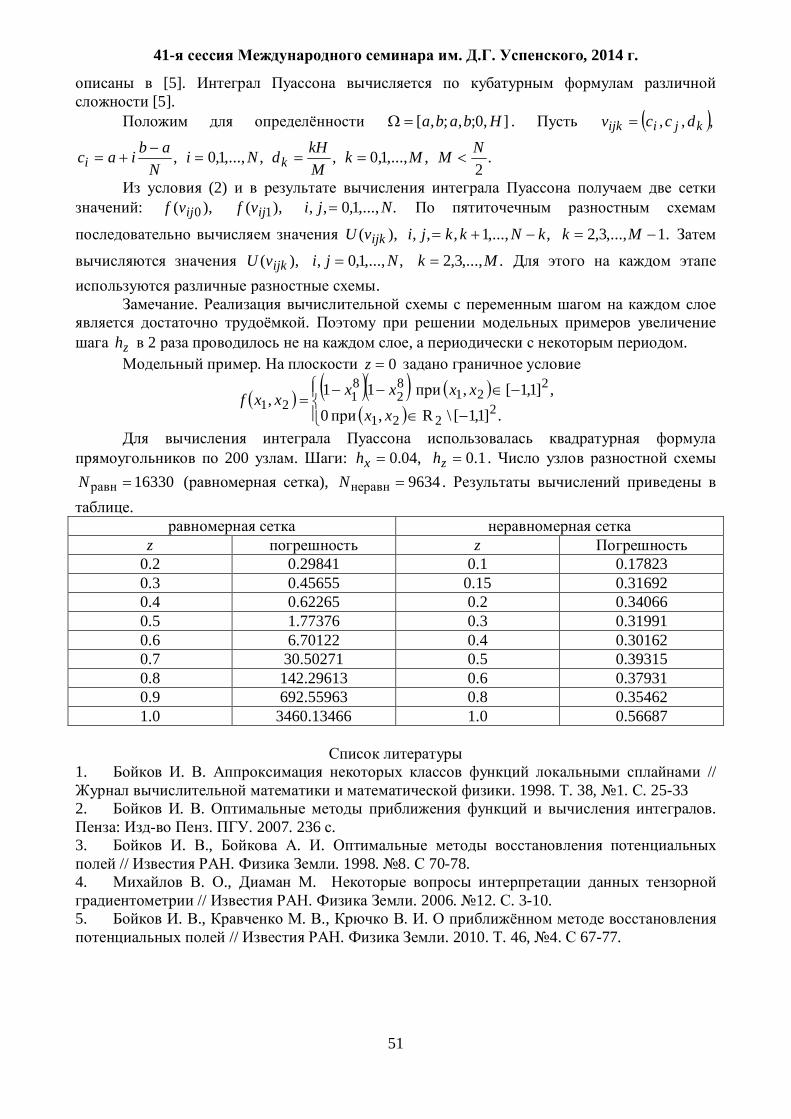
200 . : ,04.0xh 1.0zh .
16330N ( ), 9634N . .
z z
0.2 0.29841 0.1 0.17823 0.3 0.45655 0.15 0.31692 0.4 0.62265 0.2 0.34066 0.5 1.77376 0.3 0.31991 0.6 6.70122 0.4 0.30162 0.7 30.50271 0.5 0.39315 0.8 142.29613 0.6 0.37931 0.9 692.55963 0.8 0.35462 1.0 3460.13466 1.0 0.56687
1. . . // . 1998. . 38, 1. . 25-33
2. . . . : . . 2007. 236 .
3. . ., . . // . . 1998. 8. 70-78.
4. . ., . // . . 2006. 12. . 3-10.
5. . ., . ., . . // . . 2010. . 46, 4. 67-77.
41- . . , 2014 .
52
556.338
.
[email protected] « », . ,
In the exploration of hydrocarbons shale formations is recommended assessment of the
natural protection of the subsoil, the identification of pollution of geological environment on the geophysical data.
.
. [1],
, .
, : , , ,
, , , – .
, ,
.
, : ; ;
. ,
. : ; ; ;
; ( http://www.pro-gas.org).
.
, , .
) ( , ,
) . , ,
, , , . [2],
( 10 ) « » .
,
, , . [3,4]
( ,
41- . . , 2014 .
53
), « », « » . [3,5,6]
. ,
( , )
, ( , ,
), ( . ., 2006; . , 1980-2013; [3]).
, , .
( , ) ( . , . , . , 1977; . ., 2005)
: - , ; - g,
, , ;
- , , .
. ( )
, .
, – . ( )
, .
[3] , « » , , , ,
.
1. ., ., . – . //
: . – : « » ,2013. - .28-32.
2. ., ., . . // 111
« - », (20-24 ,2013 ., )– ,2013. - . 139-140. 3. ., ., . :
. – : , 1996. – 316 . 4. ., ., .
// . . . – 2011. - 2.- .6-9.
5. ., ., ., . //
– .: . – 2011. - 8. – .40-46. 6. ., ., ., ., .
// – .: . – 2012. - 2. – .22–
27.

41- . . , 2014 .
54
.
. . ,
SUMMARY. Analysis of the anomalous magnetic field allowed to divide the original field into components and create a model of magnetically active layer which consists from three structural layers of different genesis. The lower part of the structural floor caused by disorders in the crystalline basement, and can be formed by the deep faults of itself in the basement, and also by the ledges projections of the crystalline basement, developed along the faults lines. The average structural level generated by two large systems of dikes: Snopinskoy and Ust - Vyisky included in Mezenskaya trap province. The age of those dike systems determinates as the interval from the top of Upper Carbon till the lower parts of the Kazan stage of the Upper Permian, for Snopinskoy system, and from the Riphean till Late Carbone for Ust - Vyisky. The upper structural level formed by the strong magnetic sources of anomalies, located in the upper part of the sedimentary cover . Generation of this horizon connected with the latest phase of magmatism, that established the upper level of Mezenskogo trap field, which age determinates as the Late Permian or possibly Early Triassic [VA Bush , 2009].
1:50000, « »
2001-2002 . , .
«Magdepth3D», . . - .
[ ., 2012]. ,
. , ,
2.5D [Cooper, 1997], . ,
, , [ ., 2006].
[ ., 2006].
.
, ,
. .
. , 5-7 , 10-12
, ,
. ,
. [ ., 2006, 2012].
41- . . , 2014 .
55
2-4 , 5-7 , 1 4 .
, : ,
. - [ , 2009].
0.3 - 1.0 1.0 - 2.0 , 0.7 1.0 ,
: 1.5 20 . ,
, . ,
, , ,
, , [ , 2009]. 11-05-00280
., ., . . .-.: , 2006. 319
. // , 3. 2006. . 23-28
., ., ., . ( « » 1:1500000) / .: . 2012. 104 .
. / ftp://[email protected]/New_airborne_methods_and_technologies. 2009.1.pdf
., ., ., .
.// . 3. 2012. . 60-71 G.R.J. Cooper Forward modelling of magnetic data, Comput geosci-computers & geosci, vol. 23, no. 10, pp. 1125-1129, 1997

41- . . , 2014 .
56
. 1, . 1, . 2
[email protected] 1 . . , .
2 “ ”
SUMMARY. Area of negative polarity was distinguished and contoured on base of magnetic field analysis. This area is confined to subsided part of the Vityaz Ridge and corresponds to area of crust extension and destruction. Inverse problem solutions lead to conclusion that extension and destruction of the crust was accompanied by intrusion of magmatic matter during inversed polarity epoch. Presence of local positive magnetization anomalies in this area may be explained by superimposed volcanic activity associated with subsequent stage of magmatism related to positive polarity epoch.
Basing on magnetic field character and bedrock dating we suppose that extension zone in the fore-arc area was formed in Late Oligocene. This period approximately corresponds to the beginning of Kurile Basin opening and volcanic arc forming.
,
. , 2.5D
,
. , 37-
41 - “ ” , : , , ,
[ ., ., 2011].
.
, . , K-Ar , 27.51.6 . ,
, ,
(24.32-25.75 ) [ . ., 1985].
, ,
, , ,
, .
, ,
. , – ( , 1976).
, ,
, (32-15 . ) [Kimura and Tamaki, 1985; . 1996; Hayashi, 1997].
41- . . , 2014 .
57
,
. , ,
, .
11-05-00280.
1. . , . . 2011. .51. 2 .329-343.
2. . . . ., “ ”, 1976, 239 . 3. . . 1996. . .
. ., . ., . ., , , , 256 – 305.
4. ., . . , , , 1985
5. Kimura G., Tamaki K. Collision, rotation, and back-arc spreading in the region of the Okhotsk and Japan Seas. Tectonics. 1986, 5 (3), 386–401. 6. Hayashi T. The Study of Thermal Structure and Tectonic History of the Derugin Basin, Sea of Okhotsk. Master’s Thesis, Earthquake Research Institute, University of Tokyo, 1997, 135 p.
41- . . , 2014 .
58
552.1:551.14(477)
,
. , . [email protected]
, , The results petrophysical modeling by basis on the comparison ofexperimental data of
elastic waves speed changes in rocks and their density at the different conditions of experimtnts with materials of the deep seismicsounding andgravimetry are examintd. The prognosis geological cut of the area of the Earth's crust of the central part of the Ukrainian shield along the DSS profile is built.
,
, .
,
, , [1, 2].
, ,
, , , .
,
, - ( ) ) ) [3, 4].
(75-80% ).
. .
( ) (
).
. 2
, .
2 , , .
, ,
. ,
. ,
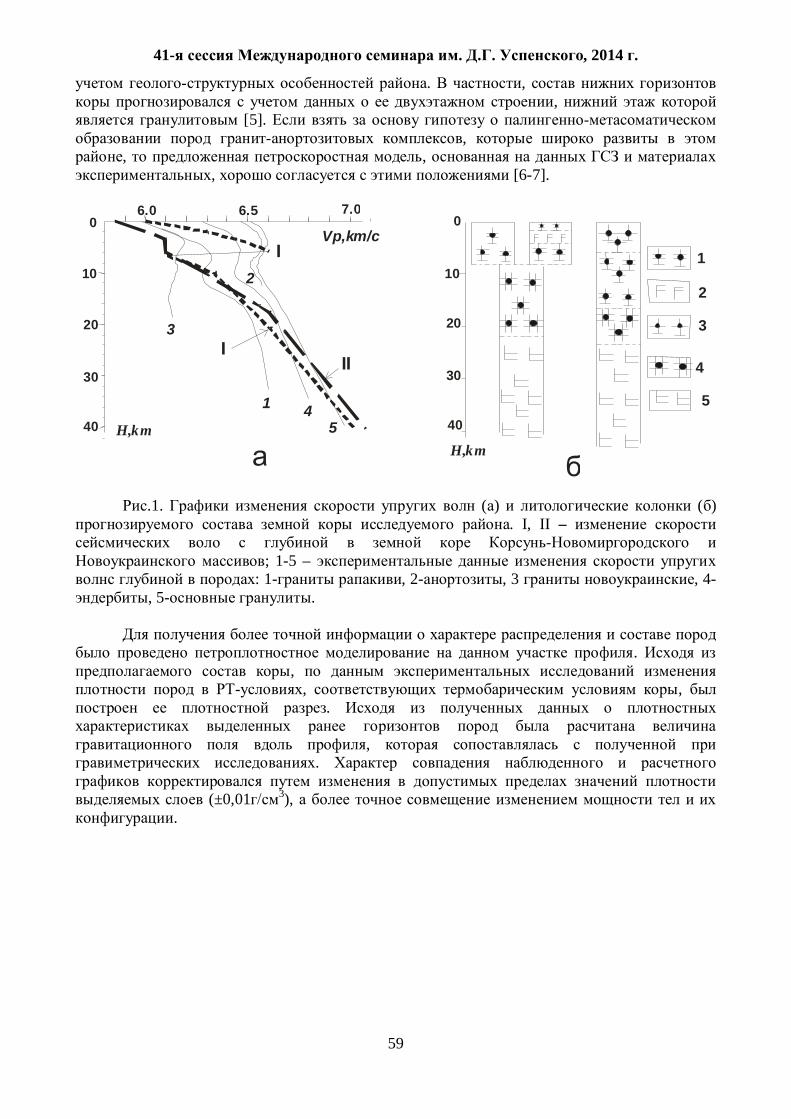
. 1). ,
41- . . , 2014 .
59
. , ,
[5]. ,
, , , [6-7].
I
III
1
2
3
45
6.0 6.5 7.000
10 10
20 20
3030
40 40
H,kmH,km
Vp,km/c1
2
3
4
5
.1. ( ) ( ) . I, II –
; 1-5 –
: 1- , 2- , 3 , 4-, 5- .
. ,
, , .
,
.
(±0,01 3), .
41- . . , 2014 .
60
10
20
30
40
20
10
30
40
50100150200
1 0
2 0
3 0
0
- 1 0
- 2 0
- 3 0
g .
g .
2.62
2.83
2.94
2.64
2.692.68
2.662.75
2.68
2.842.83
2.84
2.97 2.97
2.99
2.66
1 2 3 4 5 6
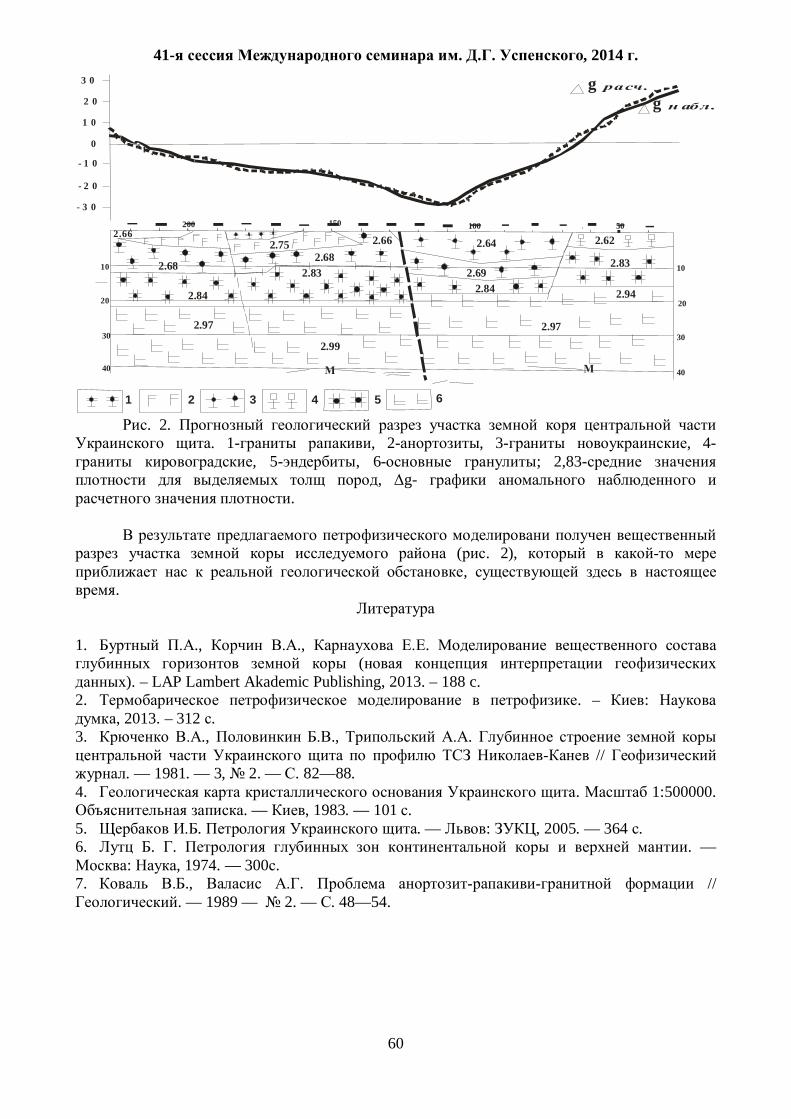
. 2. . 1- , 2- , 3- , 4-
, 5- , 6- ; 2,83- , g-
.
( . 2),
, .
1. ., ., . (
). – LAP Lambert Akademic Publishing, 2013. – 188 c. 2. . – :
, 2013. – 312 . 3. ., ., .
// . — 1981. — 3, 2. — . 82—88.
4. . 1:500000. . — , 1983. — 101 .
5. . . — : , 2005. — 364 . 6. . . . —
: , 1974. — 300 . 7. ., . //
. — 1989 — 2. — . 48—54.
41- . . , 2014 .
61
550.834 ,
.
[email protected] . . , ,
In the report processes of relaxation, aftereffect and absorption are considered that are
formed in electric fields as a result of change in their parameters. Analytical expressions are obtained for the functions of relaxation and aftereffect of strengthening and induction of electric fields.
, . ,
. , .
, , . ,
. ,
.
– , , , . : , , ,
. , , . , ,
. , .
[1], E D
: PD QE0 , (1)
P a Dii
i
m
0 Q b Di
i
i
n
0 – ( )
, , D t/ , 0 – , P Q a b0 0 1.
, E D
, (1) : DQ iP i
E E0 ,
~1 2 0i ei , ~
0 12
12
, E D , ( )
E .
.
E0 , . (1) :
D a D a D Emm
11
0 0... , (2)
41- . . , 2014 .
62
(
E0 ) : D E c ti ii
m
0 01
exp / , (3)
ci – , , i i1 / –
E0 , i , (1): 1 01a am
m . (3)
E0 ,
D E bii
n
0 0 01
t 0 D E0 0 t .
t t1 E0 , . :
D c ti ii
m ~ exp / ,1
~ci , , t t t1 , D D t1 t 0 D 0 t .
D0 , (1) :
E b E b E Dnn
11
0 0... / , (4) (
D0 ) :
E D d ti ii
n
0 01
/ exp / , (5)
di – , , i i1 / –
D0 , i , (4): 1 01a an
n . t t1 D0 ,
.
: E d ti ii
m ~ exp / ,1
(6)
~ci , , t t t1 , D D t1 1 t 0 D 0 t .
D E0 E
D0 , (3, 5), , , ,
. , , (1)
. [2]. .
1. . . : , 1962. – 824 . 2. . .// .
. – 2009. – 11. . 98-103.

41- . . , 2014 .
63
550.831
, ,
Errors of formulas used in gravity anomalies calculation and stereotypes of reduction, repeating in modern textbooks on gravity survey are considered. The modern treatment of Bouguer anomalies is offered.
, , , (
) ( ), , , ,
. , [1, 2, 3, 4] ,
( ). [5, 6, 7] , [8, 9]
» , .
, , .
( , ),
[10], , . .
, , » [11] « » [12]
( , [10], , ).
, , 1970-1980 . [13, 14, 15, 16]
. , , 200 [11].
166,735 [16, 17], 2 [18].
,
. ,
, .
.
, , ,
. ,
[17]. .
, , , 1735–1743 . [19, 20].
41- . . , 2014 .
64
. ,
« , » 1863 . [21].
( ) 1915-1916 . [20] 1919 . [22].
. « »
reductio) , , . , « » « »
( ) ( ). .
[22], [10]
, .
. ,
, ( ., ). GPS
.
. ,
, , [19, 23]. ,
,
. ,
, ,
, [9, 22].
. ( )
. .
, , , ,
. ,
[24]. , ,
: – . , [12],
, .
, , ( ) , ,
. ,

41- . . , 2014 .
65
, , , . ,
. , . [13]. , , ,
. ,
. , ( ) , .
( 11-05-96013).
1. ., . . - : « », 2001. - 162 . 2. . : . - , 2000. - 446 . 3. . . - : , 2009. - 26 . 4. ., . . - , , 2010. – 400 . 5. ., ., . . - .: Norma, 1998. - 304 . 6. . . : , 2012. – 216 . 7. .I., ., . . . - :
, 2006. - 446 . 8. . . - , 2013. - 299 . 9. ., ., . .
. - : , 2004, 232 . 10. . . - , . , 1966. - 326 . 11. . - ., , 1980. - 79 . 12. : . / . . , . . -
.: , 1990. - 607 . 13. .
. - .: , 1974. - 90 . 14. ., .
. – , , 1981. – 174 . 15. . ,
, / , 1980, 12. - . 75-89. 16. LaFehr T.R. An exact solution for the gravity curvature (Bullard B) correction / Geophysics, vol.56, No.8, 1991, p.1179-1184 17. Hinze W.J., Aiken C., Brozena J. et al. New standards for reducing gravity data: The North American gravity database / Geophysics, 2005, V. 70, N. 4. – P. J25-J32. 18. . . - .: , 1975. – 432 . 19. / . . - .: , 2010. - 572 . 20. Li X., Götze H.-J. Tutorial Ellipsoid, geoid, gravity, geodesy, and geophysics / Geophysics, Vol. 66, N 6. P. 1660-1668. 21. . //
. - .: , 1940, 3. 11 . 22. . . - .: , 1964. 672 . 23. . . - ., , 1983. - 352 . 24. .
, . - : , 2006. - 206 .

41- . . , 2014 .
66
550.831
. , . , .
It is shown that abilities of gravitational exploration are at present contrary to existing directions for these works. We suggest new procedures of the reduction of gravity data which allows for modern data about the Earth’s figure.
.
, . ,
. ( g ) [1]:
g = g - 0 + g – g + g , (1) g – ; 0 –
, (1901-1909 .); g = 0.3086 – ( ); g = 0,0419 –
; g – . , ,
, , , , .
, (1), ,
. 28.12.2012 . 1463 «
1990 » ( -90.11), , ,
, , .
, [2, 3].
1. ,
[4]: 0 = e (1 + sin2 - 1 sin22 ), (2)
= ( p - e)/ e, 1 = 2/8 + /4, = (a – b)/a, p e – , a b –
, – . [1]:
0 = 978030 (1 + 0.005302 sin2 – 0.000007 sin22 ). (3) (2) -90.11, :
0 = 978032.84 (1 + 0.0053024 sin2 – 0.0000058 sin22 ). (4) , (3) (4),
, , .
, , 0.04 1 ( . 100 )
.

41- . . , 2014 .
67
.
2.
90.11 04711160870.H.e.g .
, .
3. .
. .
[4, 5] :
gh = (k1 + k2sin2 )h + k3h2. (5) (5) -90.11,
gh = – (0.3087727654 – 0.0004308698sin2 )h + 7.21252×10⁻⁸h2. (6) ,
0.05 100 0.5 1000 , . 4. ,
2.30, 2.67 3
. [6], [7], [8]. T.R.LaFehr [9]
g . = 2 f ( H - R), - , .
S = 166.735 , , S = 200 = 2.67 3
( .).
.
5. ,
.
[10].
41- . . , 2014 .
68
( ), , :
g (H) = g (h) - g (h-H) H < h, g (H) = g (H-h) - g (h) H > h, g (H) = g (H+h) - g (h) H < 0,
(7)
H - , h - , .
, « » , .
, , ,
. (13) , « » [11], ,
, . .
, .
, , ,
, , , [2, 3].
( 11-05-96013).
1. : . / . . , . . - .: , 1990. - 607 . 2. , ., .
/ . . , , 2013 . – . 44-46.
3. ., . / . . «
» – , , 2012. – . 51-54. 4. . . .: , 1975. – 432 . 5. Li X., Gotze H.-J. Tutorial. Ellipsoid, geoid, gravity, geodesy, and geophysics / Geophysics, 2001, v. 66, n. 6. - P. 1660-1668. 6. .
/ . , . .: , 1974. - 90 . 7. . , ,
/ , 1980, 12. - . 75-89. 8. ., .
. – , , 1981. – 174 . 9. LaFehr T.R. An exact solution for the gravity curvature (Bullard B) correction / Geophysics, vol.56, No.8, 1991. - P.1179-1184/ 10. . . - .: , 1956. - 336 . 11. ., ., . –
/ . « , », ,
, 2004, .25-26.
41- . . , 2014 .
69
550.837 TESZ
: 3D . 1, . 1, . 2, . 1, . 1
[email protected] 1 , , ,
2 , , The simultaneous MT/MV soundings in and around the TESZ area were recently extended
to the Kaliningrad region. We discuss methods to estimate MT/MV data in noisy environment, present extended arrays of these data and first results of their 3D interpretation.
2002 . TESZ EUROPROBE EMTESZ-Pomerania [1]
(TESZ) [2].
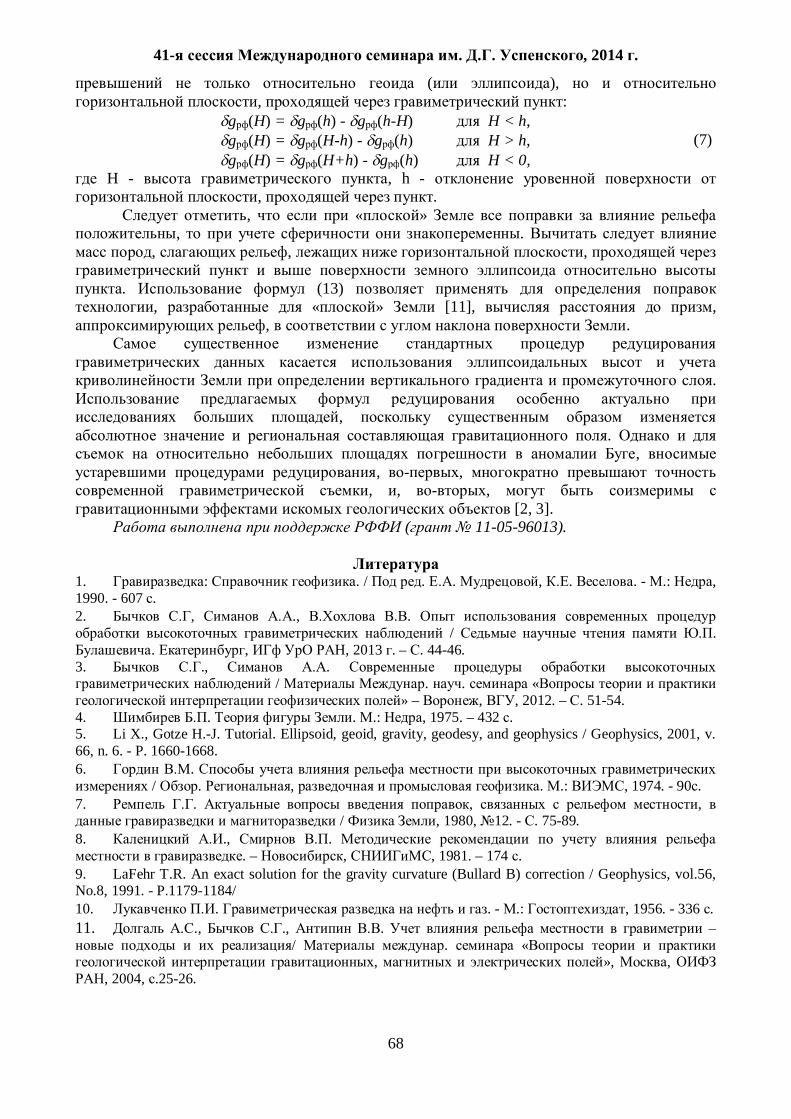
, , , ~500 ( . 1),
TESZ , .
200 8-25 . [3-4].
. >5 . [5-6].
. 1. EMTESZ-Pomerania - : - , - , - ,
- ; - ; - ; – [7].
. 2011-12 . (KLD)
HLP ( . 1), [7-9]. 2013 . - 8 ,

41- . . , 2014 .
70
KLD ( . 1). KLD, HLP BEL.
-RRMC [10, 11]. , ,
( , 3-4 ), .
. 2. EMTESZ-Pomerania: -
( MB [10] . . P8 ( . 1);
, 90°, ; 1024 ); – ( ., 512 ); –
( 64 , , lg- ); -
( , lg- ) -3D [12] 2048 .
41- . . , 2014 .
71
EMTESZ-Pomerania [3, 12] .,
( . 2 ) -3D [12] , ( . 2 ).
( . ), -
[1]. , ESZ, 3D
, . . -
. , -3D ( . 2 ), .
, [7].
2014 . .
. , ., EMTESZ-Pomerania.
11-05-00644 , 13-05-91330_ 13-05_12094_ . EMTESZ-Pomerania, . , . , . , .
. .
1. Brasse H., Cerv V., Ernst T., …, Varentsov Iv.M. Probing the electrical conductivity structure of the Trans-European Suture Zone // Eos Trans. AGU. 2006. V. 87(29). P. 281-287. 2. . ( .). , ,
: 1:4000000. .: . 2006. 3. Varentsov Iv.M., Sokolova E.Yu., Martanus E.R., EMTESZ-Pomerania WG. Array view on EM transfer functions in the EMTESZ-Pomerania project // Study of geological structures containing well-conductive complexes in Poland. Publ. Inst. Geoph. Pol. Acad. Sci. C-95(386). 2005. P. 107-121. 4. Ernst T., Brasse H., Cerv V., ..., Varentsov Iv.M. EM images of the deep structure of the Trans-European Suture Zone beneath Polish Pomerania // Geophys. Res. Let. 2008. V. 35. L15307. 5. Hoffmann N., Jodicke H., Gerling P. The distribution of Pre-Westphalian rocks in the N. German Basin - Evidence from MT and geochemical data // Geologie en Mijnbouw. 2001. V. 80. P. 71-84. 6. Hoffmann N., Hengesbach L., Friedrichs B., Brink H.-J. The contribution of magnetotellurics to an improved understanding of the geological evolution of the North German Basin – review and new results // Z. dt. Ges. Geowiss. 2008. V. 159(4). P. 591–606. 7. ., ., . . i ii // .
. . . . 1990. 6. 8. Fainberg E.B., Andrieux P., Astapenko V.N. et al. Deep EM soundings in Belarus: Europrobe crustal soundings // Izvestya, Phys. Solid Earth. V. 34(6). 1998. P. 486-495. 9. . //
. 2012. 10. Varentsov Iv.M. Arrays of simultaneous EM soundings: design, data processing and analysis // EM sounding of the Earth’s interior (Methods in geochemistry and geophysics, 40). Elsevier. 2007. P. 263-277. 11. . PRC_MTMV
// VI . : . 2013. 4 .
12. ., ., ., EMTESZ-Pomerania. TESZ: 3D // . : .
2013. 4 .
41- . . , 2014 .
72
. , . , .
[email protected] , , .
The article outlines the rationale for the use of high-precision gravity prospecting for
underground gas storage monitoring (UGS). The article proposes a technique of UGS monitoring which is based on modeling of complex geological environment using geological-geophysical data. The software used is PlayGround, EvDynInversion and GeoVIP processor developed in the mathematical modeling laboratory of Ukhta State Technical University. The solution of inverse problems of gravity prospecting involves the use of dynamic evolutionary principles of optimality.
, ( )
. , [1].
,
.
[2].
– , .
, . ,
, , , ,
( , [3, 4]). ,
. ,
, .
, . , .
, . , –
. , . ,
. , .
, , :
», Shlumberge, STATOIL, « » ( ). ,
, . ( ), . ,
[5].

41- . . , 2014 .
73
.- . .
. , .
,
, .
PlayGround, EvDynInversion GeoVIP [6].
. ,
[7]. ,
.
, . 1. .
: , , .
2. . ,
. 3. . PlayGround
( ), .
4. . EvDynInversion : –
, – , .
5. GeoVIP .
6. GeoVIP. 7. EvDynInversion. 8.
. 9. .
2-3 . 10. .
EvDynInversion. 11. , 8 10.
-, ,
.
, .
, .
.
41- . . , 2014 .
74
1. . .
. . … . . . – ., 2004. – 44 . 2. . .
. . … . .- . . – ., 2007. – 50 . 3. . .
. . … . . . – , 2007. – 35 .
4. . . ( ). . … .
.- . . – ., 2010. – 24 . 5. . .
. . / , . 2008, 286 . 6. . ., . ., . . // -
/ : 39-
. . . ( , 30 – 2 2012 ). – . 152–155. 7. . ., . .
. / : (3-4 ) , ,
2012.– . 81-86.
41- . . , 2014 .
75
550.837
. , . , .
[email protected] . . , ,
Abstract. The technical approaches, allowing to allocate the same source structure signals
caused by traction network pulse currents of the electrified railway are considered. The formula converting these signals into values of the apparent resistance is presented. Examples of profile distributions of this parameter in some sections of electrical survey are given.
( ), , – ,
( ). ,
, « » . , , ,
[1]. ,
( ) , ( ), ,
, , .
. ,
) ,
, , [2].
1. [3], , ,
, , .
, ( ). , ,
, , .
. ,
, , ( ) ,
, ( , , ) . , , ,
, , .
, , .
, , , ,
.
[2].

41- . . , 2014 .
76
. , (Hj)
), , (Ei),
Hj, ( ).
, , :
j
i
i
j
HE
PG
, i = x, y; j = y, x, (1)
Ei – x y , ; Hj –
y, x z , ) ; ij PG / – ,
[2]. 2.
( ) .
, ,
. , , , , ,
, , , .) .
. 3. ,
, . 1. , :
1). , , ( . , , . , ).
, , -
, ,
2). p /)/()( yxxy HEPGx p
|| /)/()( xyyx HEPGx ,
pp' /)/()( yx
xy HEPGx pp'|| /)/()( xy
yx HEPGx ( x – , y – , – , –
) . ' , , x ,
S (S– ), || '|| ,
. ' , || '|| – .
' ( . )
(z). , : 1 = 1 – 3 , h1 = 0,5 – 1,0 , 2 = 1000 – 3000 , h2 = ,
. ( . ), (

41- . . , 2014 .
77
– ), (Sl), , , 300–500 .
. 1. , – || ; , – ' '|| ; , – ; , – ; –
' . – : 1 – 1=3 , h1=0,5 , 2=3000 , h2=2,0 , 3=30 , h3= ; 2 –
1=3 , h1=0,5 , 2=3000 , h2= ; 3 – 1=3 , h1=0,5 , 2=1000 , h2=2,0 , 3=30 , h3= ; 4 – 1=3 , h1=1,0 , 2=1000 , h2=2,0 , 3=100 , h3= ; 5 – 1=1 ,
h1=0,5 , 2=3000 , h2=2,0 , 3= , h3= ; 6 – 1=1 , h1=1,0 , 2=3000 , h2= ; – ( –
). ,
. ( , ) ,
, .
( 12- -5-1020).
1. ., . // .
1973. 86. . 69-76. 2. .
// . 2012. 2. . 14-30. 3. . . . - .: , 1965. 464 .
41- . . , 2014 .
78
[550.83:550.814:551.2:552.3:553.4](571.61/62)
( ) .
[email protected] . . , ,
Geological-geophysical criteria are considered and a possibility of using airborne
geophysical surveying data is discussed for prediction and study of major deposits. A comparative role of the gravity, aero magnetometry and aero gamma spectrometry data involved in the comprehensive study is evaluated.
, ., , , , ; ( )
, – , .
, ; .
; ,
, , . ,
– , . ,
80- ,
, , , , , .
,
. , , ,
, . ,
[1]. . [2], ( )
. : , , 125-150 ,
, 30-60 , , – 10 .
, , [1]. –
; .
, ( ) [1, 3].
225-250 ± 100 ; - 45±15 ,
[2]. , ( ,
) ( ),
41- . . , 2014 .
79
. ,
, . , .
[4]. ,
, , - ();
( , , ). , (
) , .
, .
. ;
, . , –
, , , ( ), ( ); , ,
. (
, , ), . ,
( .1). – ;
, ( ). , ,
; -. , – . ,
( ). : – , ,
[1]. , ,
. ;
, . ,
, , , .
.1 -,
. , – ,
, ( , ). ,
, . , . 1,
, , -1000000.
41- . . , 2014 .
80
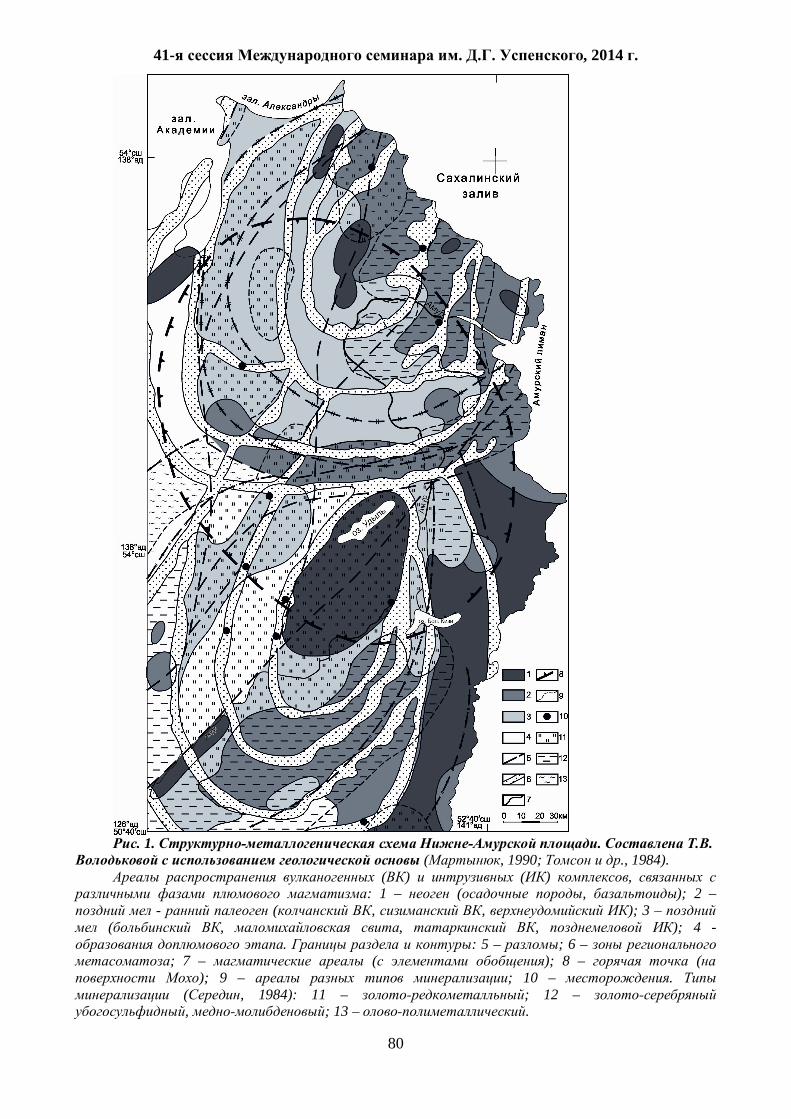
. 1. . .
( , 1990; ., 1984). ( ) ( ) ,
: 1 – ( , ); 2 – - ( , , ); 3 –
( , , , ); 4 - . : 5 – ; 6 –
; 7 – ( ); 8 – ( ); 9 – ; 10 – .
( , 1984): 11 – ; 12 – , ; 13 – .
41- . . , 2014 .
81
, ; ,
. , , . , -
, .
, – ( , ).
1. / . . . , . , . . : , 2010. 332 .
2. . . . .- . .
., 2003. 364 . 3. ., .
// . . 2010. . 28. 1. . 86-98. 4. . . .:
, 1999. 263 .
41- . . , 2014 .
82
550.831.015.072
( ) . , . [email protected]
, ,
The problems of the construction for 3-D density model of the granite massif with using the gravity field data have been discussed. The resulting model shown the main features of the volumetric construction of the massif which elongated down to the depth about 7,5 km.
.
, .
.
( 2,70 3) , . ,
. . , 35 2,
. 9 14
. (PR1b),
[3], [4]. 50 2.
, , [ ., 1977]. 2022 3 [2].
(PR1vc), ,
. 2–3 6–8
. .
- 2,63 3 [1].
. Mathcad.
, 1000 1000 , – 500 .
,
, . .
, ,
.
, , ,
.

41- . . , 2014 .
83
) . 500
, , .
, , . « »
[5]. ( . 1),
7500 , . , ,
.
. 1.
,
. ( 11-05-00110- ).
1. . ) / . // – 1997. – 11. – . 58-68.
2. . : - / .
, . , . . // . – 2009. – 6. – . 3–16.
3. . / . . // . – 1997. – 3. – . 21-31.
4. / .- . . . – :
« », 2012. – 330 . 5. . /
., . // – 2003. – . 25. – 3. – . 159-169.
41- . . , 2014 .
84
550.361
,
. . , . ,
Abstract. The analysis of geodynamic environment and heat flow data is performed in the
study region where three large lirthospheric plates including the Eurasian, North America and Pacific plates, and a number of microplates, such as the Okhotsk, Beringia and Amur plates, are converging. In areas of plate interaction, heat flow values appreciably exceed background values. This implies that in Northeast Asia areas of lithospheric plate interaction exhibit high seismicity as well as increased heat flow values.
: , , –
, , . , ,
. , , ( ),
, . .
( 1). . 1 1973 2010 , 3-7
).
, , , ,
–. , ( , , , ). –
,
8 . . , .
. . 600 , 6.0–7.0
[1]. ,
. . [2]]
, .
, , –.
, [3]. ,
: , , [4].
41- . . , 2014 .
85
, ,
.
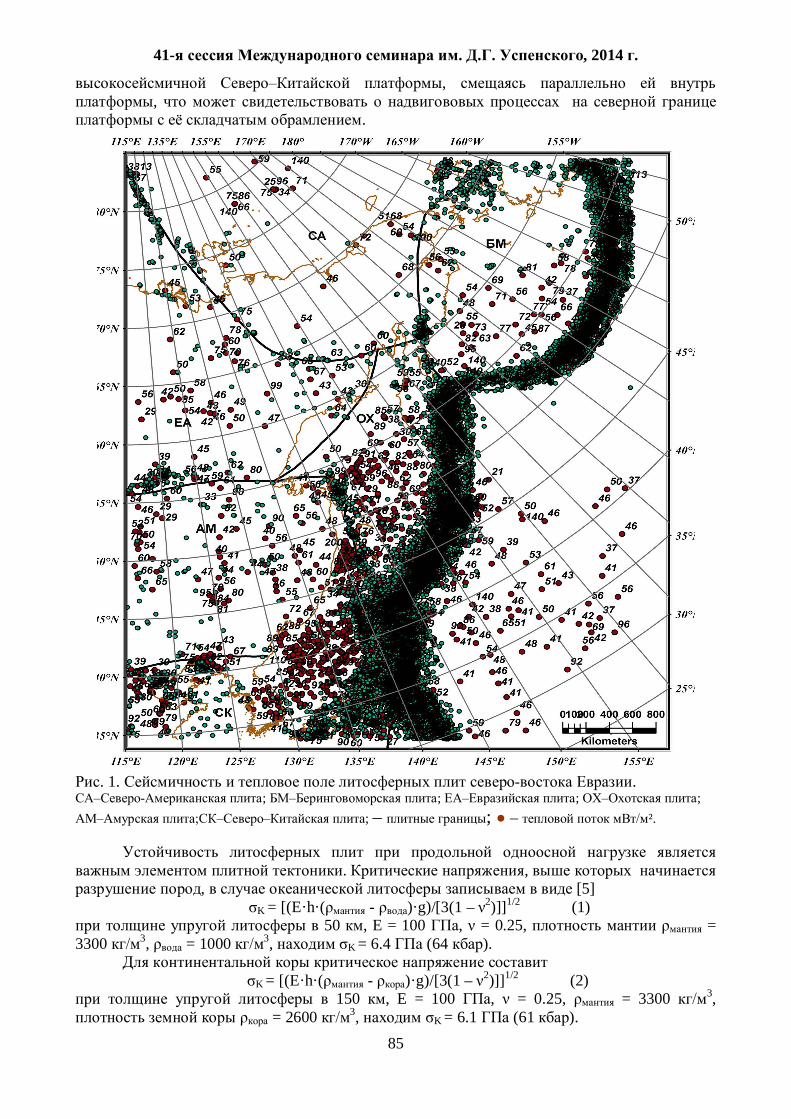
. 1. .
; ; ; ; ; – ; – ².
. , , [5]
K = [(E·h·( - )·g)/[3(1 – 2)]]1/2 (1) 50 , E = 100 , = 0.25, =
3300 3, = 1000 3, K = 6.4 (64 ).
K = [(E·h·( - )·g)/[3(1 – 2)]]1/2 (2) 150 , E = 100 , = 0.25, = 3300 3,
= 2600 3, K = 6.1 (61 ).
41- . . , 2014 .
86
, , . “ ” – .
. –
50–70 2, 90–200 2 , , – 80–90 2,
, – 50–53 2. (80-100 ²)
, . 93 2. ,
100–150 2 , 100 2.
85 2. , , (87 100 2)
, (60 2).
. ( ,
, ) (100-150 2). - (60-70 2).
(70-80 ²). . .
“ ’ , .
. .
GPS , ( 5 ).
, , 3-4
. , , , , 40 .
7.
. ,
. :
1. ., ., ., ., ., ., ., ., .
GPS , // , 2012, . 53 (4) , . 489–507.
2. ., ., . . ., , 1990, . 1, 327 .
3. ., ., ., ., ., . //
, 2007, . 26, 2 . 3–17. 4. Zhai Yusheng, Deng Jun, Tang Zhoung et al. Metallogenic systems on the paleocontinental margin of the North China craton // Acta Geologica Sinica , 2004, V. 78, 2. p. 592–603. 5. ., . :
. ., , 1985, 1, 376 .
41- . . , 2014 .
87
550.8.053
. 1, . 2, . 3, . 3 [email protected]
1 , , , 2 « », , ,
3 « », , In this work we aim at determining appropriate set of parameters for three-dimensional inversion of potential fields data using models which contain structures and contrasts typical for real-world data collected in areas of interest. Employing a comprehensive series of tests and different noise models enables us to carry out systematic resolution and sensitivity analyses and helpreduce ambiguity when working with real data inversion.
.
, .
, ,
. ,
,
- . ,
,
, (
). .
, ,
, ,
. GelioSMI [1, 2] ,
. ,
« , .
[3]. -
41- . . , 2014 .
88
( ) , ,
.
,
.
, , , ,
. , ,
, ,
. , ,
[4].
, , ,
, , .
( ), ,
, .
, , ,
.
,
, .
. ,
, , , , , .
, ( ) ( )
.

41- . . , 2014 .
89
) )
1. .
GelioSMI // . - 2012. - 3. – .20-27.
2. ., ., ., .
«GelioSMI» // 40- . . .: , 2013. . 115–120.
3. Hubert M., Rousseeuw P.J., Van Aelst S. High-Breakdown Robust Multivariate Methods //Statistical Science, - 2008. -Vol. 23. - No. 1.- p. 92–119. 4. Martin Cuma M., Wilson G.A. and Zhdanov M. Large-scale 3D inversion of potential field data // Geophysical Prospecting. - 2012. - Vol.60. - Issue 6. - p. 1186–1199.
41- . . , 2014 .
90
. , .
In the analysis of known experimental data is constructed trend of the secular variation of
temperatures in the Meso-Cenozoic of the Center and South of Western Siberia. Calculated effect of temperature on the surface of the earth realization generation potential oil-source rock of Bazhenov formation.
,
, , , .
. [1], ( ),
(J3tt). – -
« »
, , , .
« » ( ):
. (1974), ; . (1985),
; . (1977), ;
. . (2011) ; ,
, . (1990); . (1939),
, , ± 0,5 .
3-
: 1- – ; 2- – « » ,
( ); 3- – « » ,
[2 .].
183 -
.
[3].
41- . . , 2014 .
91
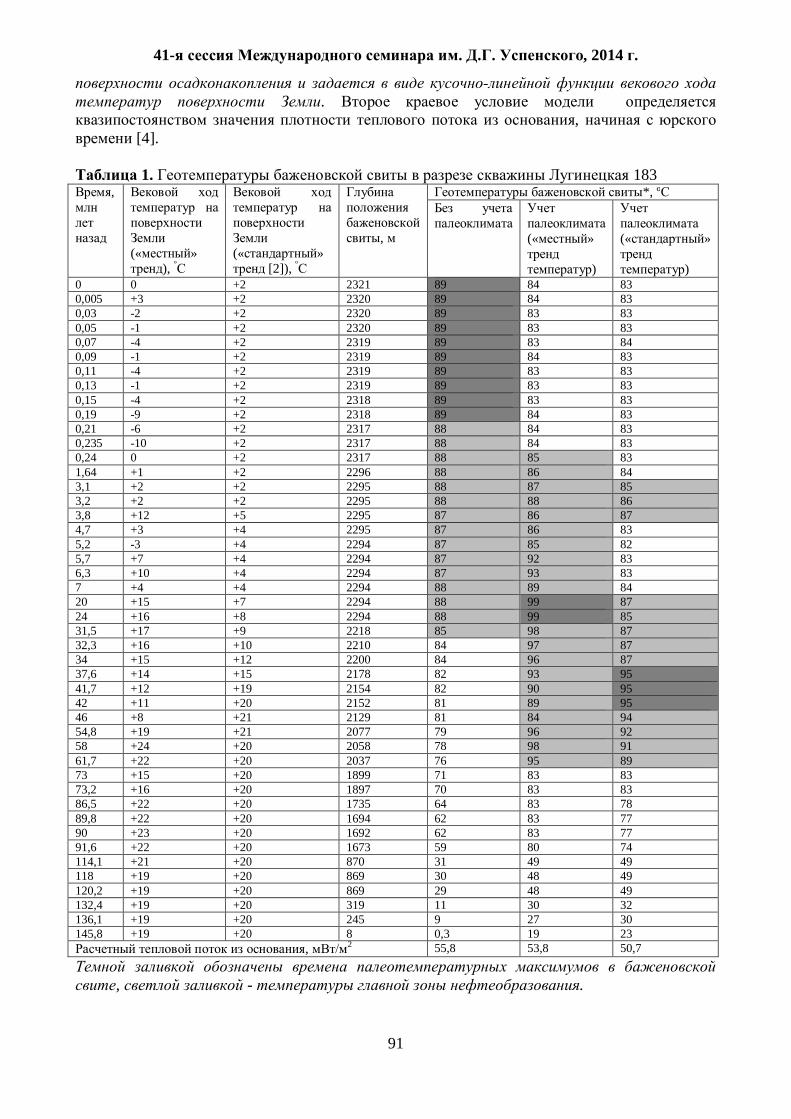
.
, [4].
1. 183
,
(« » ), º
(« » [2]), º
,
*, º
(« »
)
(« »
) 0 0 +2 2321 89 84 83 0,005 +3 +2 2320 89 84 83 0,03 -2 +2 2320 89 83 83 0,05 -1 +2 2320 89 83 83 0,07 -4 +2 2319 89 83 84 0,09 -1 +2 2319 89 84 83 0,11 -4 +2 2319 89 83 83 0,13 -1 +2 2319 89 83 83 0,15 -4 +2 2318 89 83 83 0,19 -9 +2 2318 89 84 83 0,21 -6 +2 2317 88 84 83 0,235 -10 +2 2317 88 84 83 0,24 0 +2 2317 88 85 83 1,64 +1 +2 2296 88 86 84 3,1 +2 +2 2295 88 87 85 3,2 +2 +2 2295 88 88 86 3,8 +12 +5 2295 87 86 87 4,7 +3 +4 2295 87 86 83 5,2 -3 +4 2294 87 85 82 5,7 +7 +4 2294 87 92 83 6,3 +10 +4 2294 87 93 83 7 +4 +4 2294 88 89 84 20 +15 +7 2294 88 99 87 24 +16 +8 2294 88 99 85 31,5 +17 +9 2218 85 98 87 32,3 +16 +10 2210 84 97 87 34 +15 +12 2200 84 96 87 37,6 +14 +15 2178 82 93 95 41,7 +12 +19 2154 82 90 95 42 +11 +20 2152 81 89 95 46 +8 +21 2129 81 84 94 54,8 +19 +21 2077 79 96 92 58 +24 +20 2058 78 98 91 61,7 +22 +20 2037 76 95 89 73 +15 +20 1899 71 83 83 73,2 +16 +20 1897 70 83 83 86,5 +22 +20 1735 64 83 78 89,8 +22 +20 1694 62 83 77 90 +23 +20 1692 62 83 77 91,6 +22 +20 1673 59 80 74 114,1 +21 +20 870 31 49 49 118 +19 +20 869 30 48 49 120,2 +19 +20 869 29 48 49 132,4 +19 +20 319 11 30 32 136,1 +19 +20 245 9 27 30 145,8 +19 +20 8 0,3 19 23
, 2 55,8 53,8 50,7
, - .

41- . . , 2014 .
92
.
, . . .
– ( ) .
46 ( . 1).
, .
85 , .
3-
[5] ( . 2).
2.
n/n
, .
,
, ,
,
1 28 25 31,5–0,03 31,5 89 2
(« »
)
67 22 61,7–0,24 61,5 99
3 (« »
)
49 15 61,7–20,0; 3,8–3,1
42,4 95
. 2 , « »
( 30%) ,
» .
: 1. ., ., ., .
( ) // . – 2013. – . 322. – 1. – . 45-50.
2. . . – .: , 2007. – 456 . 3. .
. – : , 2010. – 172 . 44.. ., .
. – .: , 1986. – 222 . 5. ., ., . -
// . – 2013. – 2. – . 36–40.
41- . . , 2014 .
93
550.83
( )
. 1,2 [email protected]
1 ( , ) 2 ( , )
The paper presents the results of field work have made in two areas by technology of
electromagnetic sounding and induced polarization (EMSIP) with using hardware-software electroprospecting complex "Mars". The first plot has been worked out on the bank of. Baikal in Priolhonja site where was carried near surface survey. The second site is located 40 km. from Mirny on tuff tube Buardahskaya. The tube is overburdened by Jurassic sediments capacity of about one hundred meters.
- « »,
( ) [1]. . , ,
. 40 . . ( ), ,
.
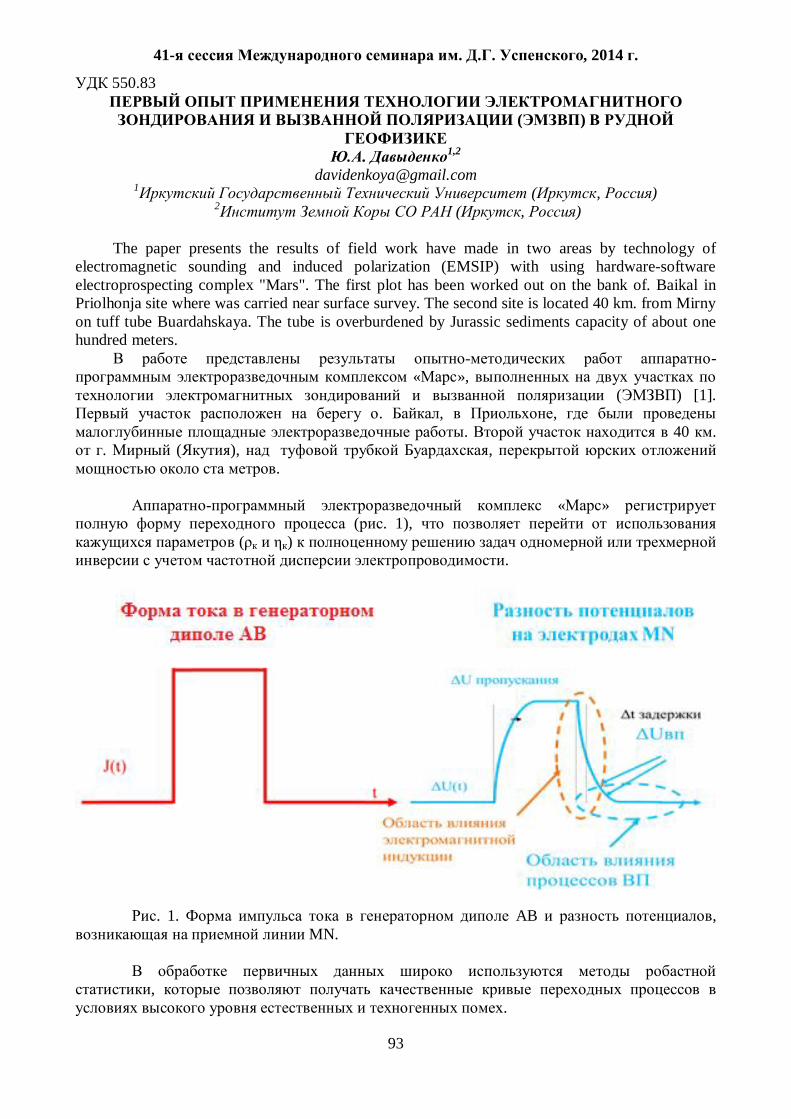
« » ( . 1),
( ) .
. 1. AB ,
MN.
,
.
41- . . , 2014 .
94
« » 8- ( 100 ), ( 100 ). 18- 100
. USB-
. 3- ( ) 60 .
280 . ( , ). « -
2», 1,8 . , « - ». ( 1500 2) [2].
9 ( 200 ), . 2-
. 10
x10 ; 0.5 450 ; 125 .
, , , Mars 1D
[3,4]. 20 .
, .
. 1100 *1100 23 , 50 .
MN 50 , . ,
. -
, , . ,
[1]. ,
. ,
.
. GelioSMIx64 [1], .- ., .
PhD A. . . 550
, , MN AB. 128
128 128 .
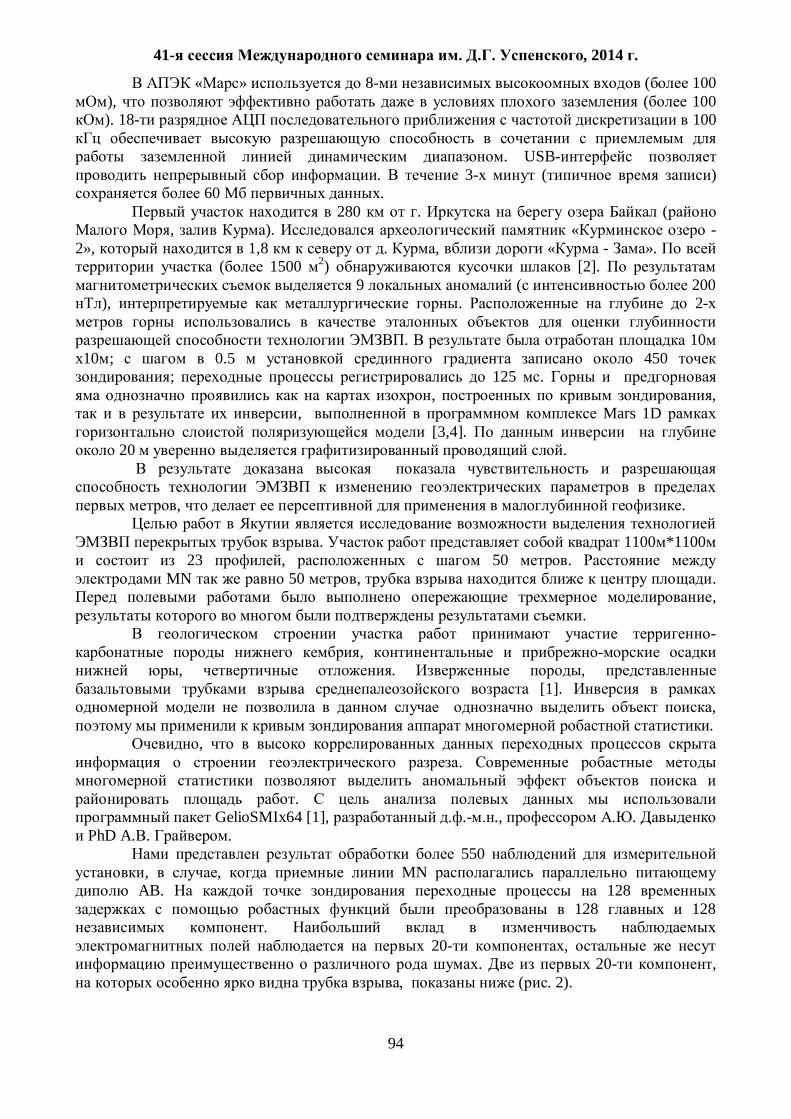
20- , . 20- ,
, ( . 2).
41- . . , 2014 .
95
0.6
-0.7
-0.7
0.3
0.3
0.3
0.3
0.3
. 2.
, .
, .
, .
1. ., ., ., ., ., ., .
// , , 2013. . 200.
. 28-33. 2. ., .
// .- : , 2004. . 2. - . 167–187. 3. Cole K.S., Cole R.H. Dispersion and absorbtion in dielecrtrics // J. Chem. Phys. – 1941. –v.6. – P. 341-353. 4. Lee T. Transient response of a polarizable ground // Geophysics. – 1981. – Vol. 46. - N 7. – p. 1037–1041 5. Pelton W.H., Ward S.H., Hallof P.G., Sill W.R., Nelson P.H. Mineral discrimination and removal of inductive coupling with multifrequency IP // Geophysics. – Vol. 43. – NO 3. – 1978. – P. 588-609
41- . . , 2014 .
96
550.837
. , . , .
. . , . ,
. , .
. Abstract. The results of methodical works of the induction electrical researches on Verhnesysert dams are presented. The description of a technique of works is given and examples of geoelectric crossections.
1849 , .
. 350 , 15 .
, ( 3).
( ). : ( ),
( ) , ( ).
. , ,
[1]. ,
. , .
: ( « », ) 160 -8 (
, ) [2] 10,2 . ,
. c ( )
, .
( ), P = |k|·r < 10 [3]. 10 .
(Hz, Hr, H ) ,
, r. : 5, 10, 15, 20, 30 40 ; -8: 30, 40, 60 80 .
, , ,
. ,
. -8 30 40 .

41- . . , 2014 .
97
( ) | z|/| r| [3, 4].
S = r/ : = ( – )/( ·ln(f /f ))
: – ; – ;
f = 160 , f = 10,2 – . 30 40
( . 1 ). S ( .1 ),
: h = r/4 [5].
, .
: 12– 14 19– 22 ( .1 , ).
12– 14 . 13 15, 14 , .
10 , . ,
. , .
, . ,
, 5–15% . 19– 22
.
, 19, 30 .
( . 19 . 1 ). S .
, , .
( . 1 ) .
0,2–0,3 . . 1– 2 21– 22 ( . .1 ),
, . 1– 2 ,
. 21– 22
, . , .
, 6, 30 ( . 1 . 1 ).
, r = 40 ,
.
41- . . , 2014 .
98
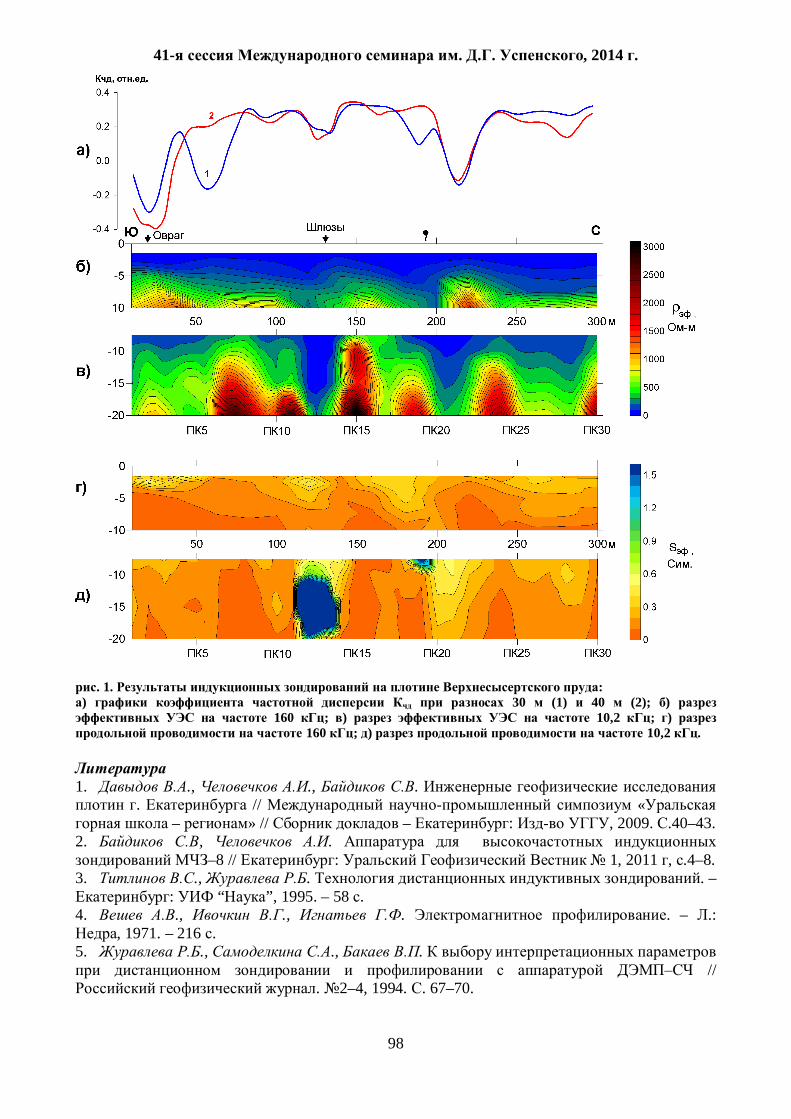
. 1. : ) 30 (1) 40 (2); )
160 ; ) 10,2 ; ) 160 ; ) 10,2 .
1. ., ., . . // «
– » // – : , 2009. .40–43. 2. , .
–8 // : 1, 2011 , .4–8. 3. ., . . –
: “ ”, 1995. – 58 . 4. ., ., . . – .:
, 1971. – 216 . 5. ., ., .
// . 2–4, 1994. . 67–70.
41- . . , 2014 .
99
550.837
)
» « »
This paper considers complex of geophysical methods used for forecasting and
investigations paleovalleys hydrogenic uranium mineralization ( for example Amalat plateau of basalts) in eastern Siberia .Localization and tracking of uranium-bearing structures, identifying of systems paleovalleys beneath the veils of neogene basalts and purposeful founding of wells are exiled in to reduce the cost and improve the methods. The results of geophysical methods with drilling results are compared.
, (
) .
, , .
( ): 1. : , ,
, æ = 0.4 100 . , =
100 10000 . 2. : , , 0
, - æ 1 . , - 100 . 3. , ,
, 200 .
æ = 2 300 = 100 2000 , .
4. 10 .
,
. -
: 1.
. 2. . 3. , ,
. 4. ,
. 5.
.

41- . . , 2014 .
100
, (
), , , ,
200 , . ,
, ( - )
.
, ( .1).
. 1. , ,
, , 1 - ; 2 - ; 3 - .
41- . . , 2014 .
101
,
, ,
. ,
, ,
.
.
1. . , . , . . «
, , – ». “ ” 2013. –
170 . 2.
. , 1982. – 179 .
3. . , . . . : « » , 1979. – 350 .

41- . . , 2014 .
102
550.834.3 (571.1)
. , . , .
. . ( ), . , Abstract. The position of the granite massifs Zauralue of Permian age in the scheme of
tectonic regionalization of the upper part lithosphere Ural folded system (UFS) is discussed. It is established, that they placed in segments UFS with opposite directions of displacement.
[2].
. , MZ-KZ 0.5
– 3.5 . [3]
, .
, ,
. .
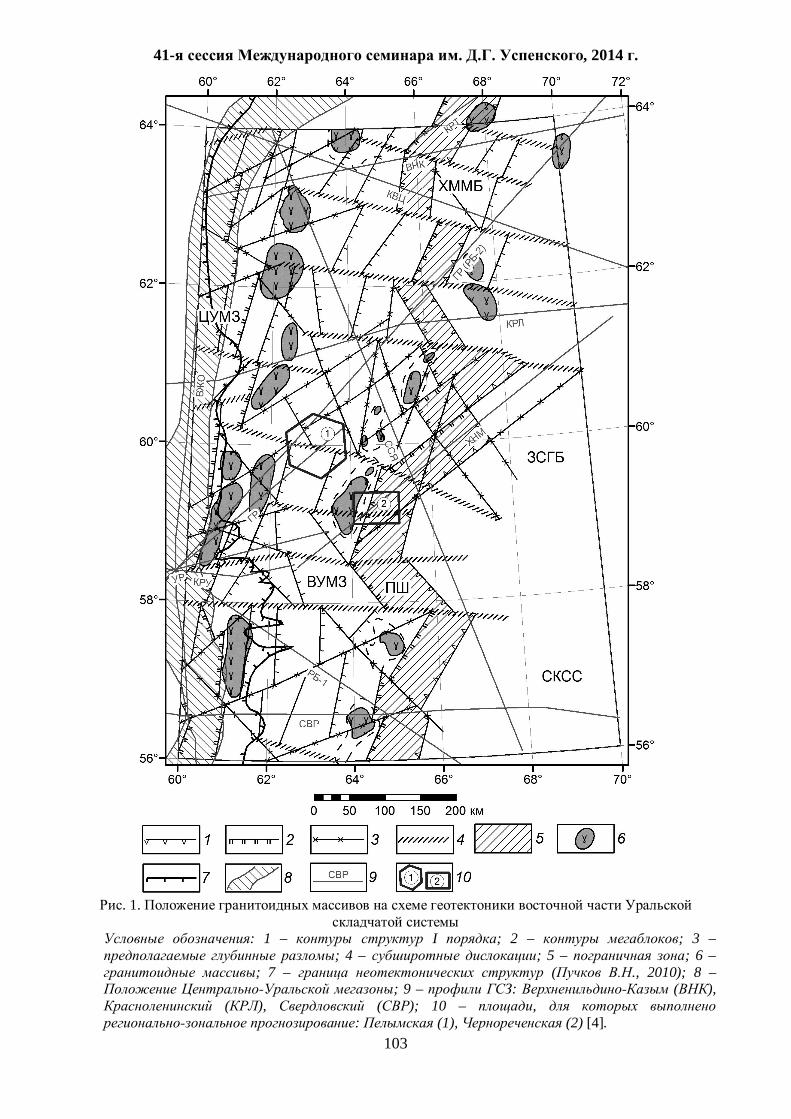
, 64°-56° .
, 7 . :
, – . .
1:2500 000 [2]. ,
( ) ( ). ( ) .
[5], .
. ,
, ,
[1]. , ( . 1).
,
( ) 150-200
64°-68° . : 58°-58° 30', 60°,
62° 64° .
41- . . , 2014 .
103
. 1.
: 1 – I ; 2 – ; 3 –
; 4 – ; 5 – ; 6 – ; 7 – ( ., 2010); 8 –
; 9 – : ( ), ( ), ( ); 10 – ,
: (1), (2) [4].
41- . . , 2014 .
104
.
:
insiti. - .
, [2], ,
; MZ-KZ
.
.
58° 64° . . , ,
, , ,
, . ,
. . )
, -. « »
, .
1. ., ., . .
. . , , 1974. 10. . 148-153.
2. ., ., ., .
. , 2013. 1. . 43-58. 3. ., ., ., .
. , 2013. 1. . 33-41.
4. . .
. 25.00.10 – « ,
». // : « », 2010. 18 .
5. . ( , , ). : , 2010. 280 .
41- . . , 2014 .
105
550.831
2D . , .
[email protected] « », . ,
Abstract. The article shows the role of gravity and magnetic exploration methods in the study of ore-bearing bodies. In the article the possibility of local forecasting copper-nickel mineralization based on spatial and statistical analysis of potential fields is given and 2D gravity magnetic modelling.
,
– [4]. ,
, ( )
.
– 2D , - –
, .
, 100 100 , 1:50
000–1:25 000 . 1500 2. , ,
. -3D, OASIS Montaj, GM-SYS.
, – - (2.86 – 3.03
3) ( 16 ) , g ( T)a
. : ; - ,
; , . [2].
: ;
; ; Q ( . );
( . ); 2D- .
.
[3]. ( ) .
1- Vzz

41- . . , 2014 .
106
g Z, Q ( .1).
1
5,
, ,
Q, , 1
. , , ,
. 5,
.
. .
, . . , ,
. " " -
. , , ,
. .
" " , , .
" " .
, , .
-1 -3 -.
. .
41- . . , 2014 .
107
" " ,
.
, , -2 -4.
.
.
-1 -2 . ,
.
, . , ,
. , , .
. 1987 . . , "
, ".
, . , , .
,
. , , " " , ,
, , . .
, 100% ,
, .
, ( )
, - .
1. : ( . , . 2-
, . . .: , 1990. 607 . 2. .
. , « », 2002 . 188 . 3. . . .: , 2004. 74 . 4.
. / , , . .: , 2003. 272 .
41- . . , 2014 .
108
553.823 –
. ,
[email protected]; [email protected] , ,
Petrographic and tectonic factors of the secondary porosity formation in the crystalline
basement at White Tiger oilfield are confirmed by results of interpretation well log data.
. 1990 , – 4740 .
, : (
), ( ), ( ), ( ), ( ) ( ).
, -. 4 – ,
, . , .
. – , , ,
. , ,
, – ,
, – , ( . 1). ,
245+7 . ( ) 89+3 . ( ).
, , .
[1].
( )
:
1)
, ; 2)
; 3) –
.
) , .

41- . . , 2014 .
109
. 1.
[2] « » ( ) ,
, , ( ) . ,
.
1,38 %. , ,
, . , ,
1,06 %.
. 0,89 % 0,58
%, . , ,
.
( )
. .
41- . . , 2014 .
110
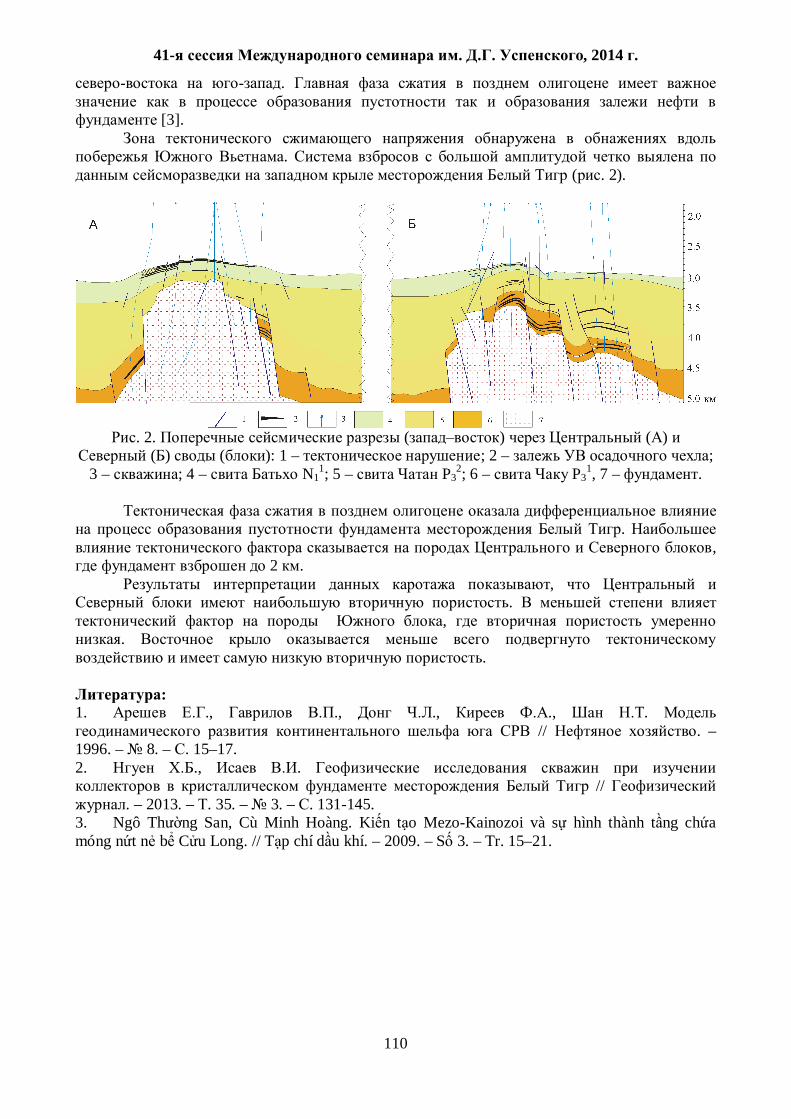
.
[3].
. ( . 2).
. 2. ( ) ( )
( ) ( ): 1 – ; 2 – ; 3 – ; 4 – N1
1; 5 – P32; 6 – P3
1, 7 – .
.
, 2 .
, .
, .
.
: 1. ., ., ., ., .
// . – 1996. – 8. – . 15–17. 2. ., .
// . – 2013. – . 35. – 3. – . 131-145.
3. Ngô Th ng San, Cù Minh Hoàng. Ki n t o Mezo-Kainozoi và s hình thành t ng ch a móng n t n b C u Long. // T p chí d u khí. – 2009. – S 3. – Tr. 15–21.
41- . . , 2014 .
111
550.837.211(571.61)
( )
, , .
Abstract Based on results of magnetotelluric soundings (MTS) carried out in the northwestern part of
the Middle Amur Sedimentary Basin across its extent, the geoelectrical sections were constructed down to a depth of 5 km that exhibit a complicated structure of the basin. MT results were compared to those obtained by other geophysical methods and a good consistency of the results was obtained. Thrust fault structures with related zones of abnormally low conductivity were detected that may be promising for exploration of oil-and-gas deposits.
( )
[6] [1].
, .
( ).
[5].
.
. 24- MTU-5A Phoenix ( ).
, - . 5 .
– 60 ( .1, ) – , 34 ( .1, ). ,
, , ,
, [2]. – ( .1, )
, .
.
. . , 2 .
-. ,
, .
1 , , . -
,
41- . . , 2014 .
112
. ,
2 , .
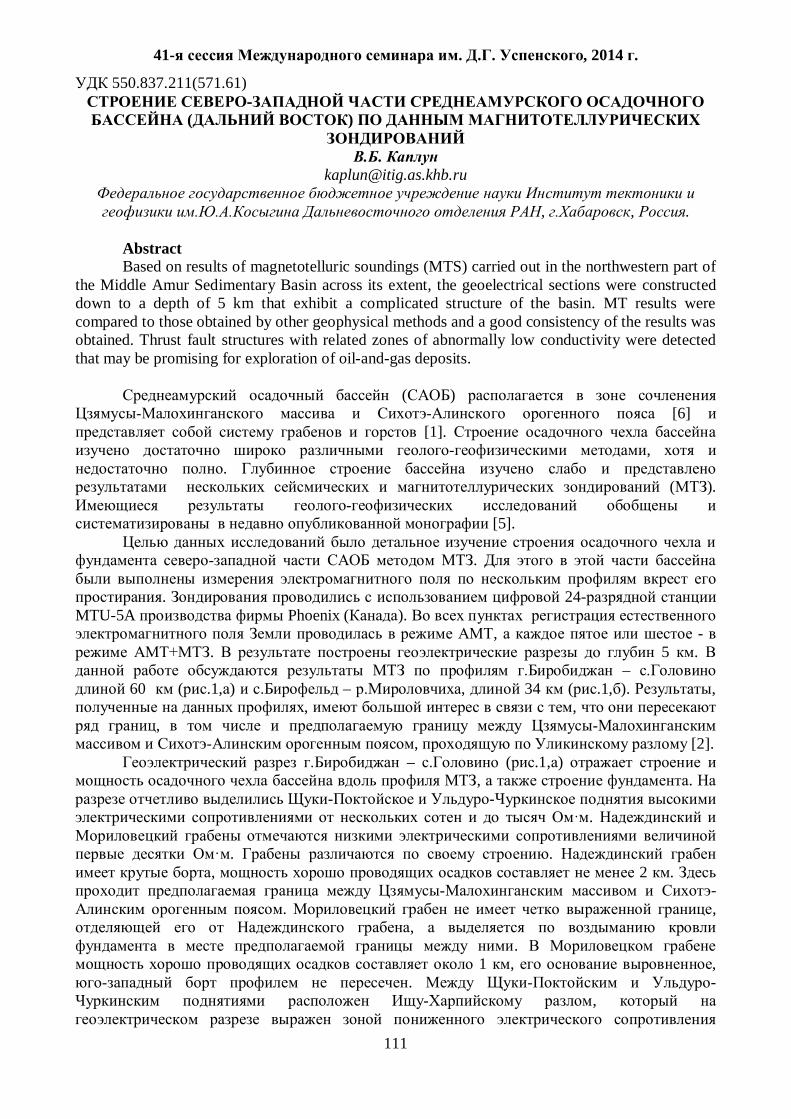
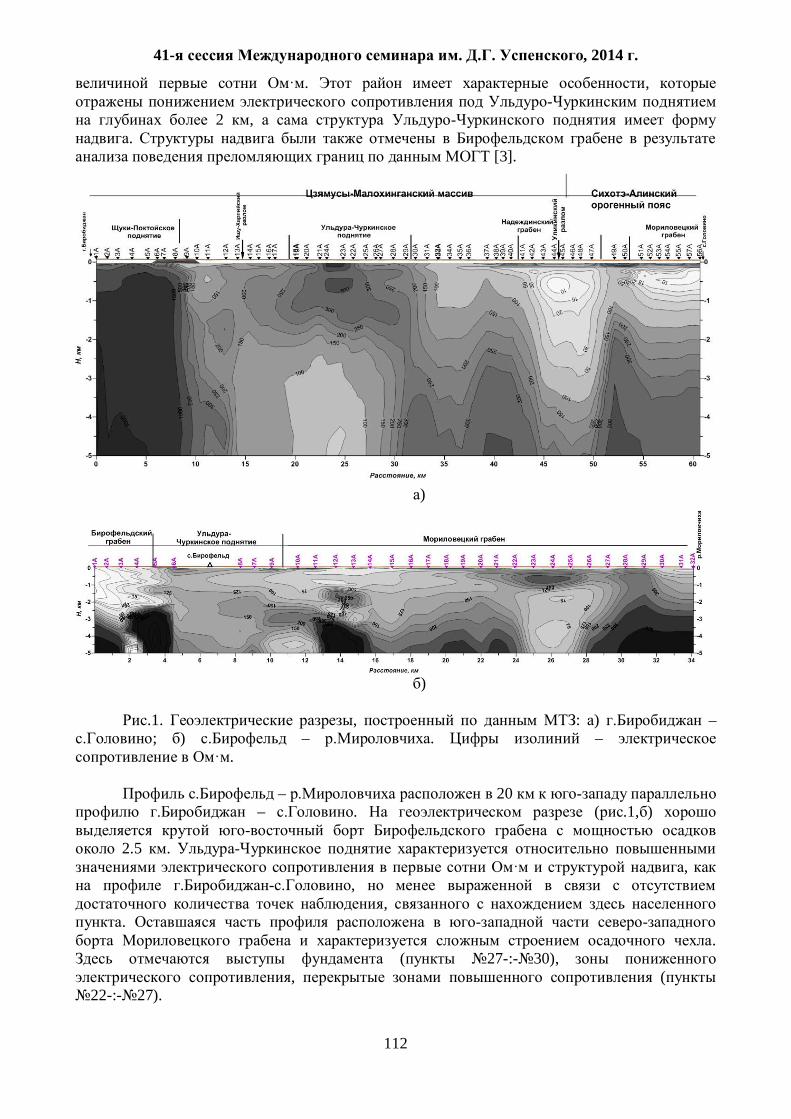
[3].
)
)
.1. , : ) – ; ) – . –
.
– 20 – . ( .1, )
2.5 .
, ,
, .
. ( 27-:- 30),
, ( 22-:- 27).
41- . . , 2014 .
113
. [4],
, ,
, [5, 6].
, , [7, 8]. ,
– . -
.
, .
, . , , ,
. ,
, . , , , .
,
, . 12-I-0- -11 «
( )».
1. . . – .: , 1971. 160 .
2. . 1 : 1 000 000. -53 / , . . , « ». 2008 .
3. ., ., . // . 1999. 50-
« ». .29 -32. 4. .
// . . 2009. .28. 2. .86-98.
5. : , , / . . . – : , 2009.
– 424 . ( « » / . . . ; .3). 6. , ,
. 1:1500000. – ; : , 2005. – 264 .
7. Liu Cai, Zhang Xing-Zhou, Liu Yang, Yang Bao-Jun, Feng Xuan, Wang Dian, Liu Dian-Mi. Geoelectrical evidence for characteristics of lithospheric structure beneath the Yuejinshan collage zone and its vicinity in Northeast Asia // Chinese Journal of Geophysics. Vol.52. No.2 2009. pp.403-412. ( .). 8. Liu Guo-Xing, Zhang Xing-Zhou, Yang Bao-Jun, Weng Ai-Hua, Tang Jun-Hui, Li Xue-Sen. Electrical structures of the lithosphere along the Jiamusi massif and its eastern edge // Chinese Journal of Geophysics. 2006. Vol.49. No.2. P.598-603. ( .)
41- . . , 2014 .
114
. . , , .
. ,
. ,
. ,
: – , .
, ,
. .
[1, 2, 3].
, . ,
, . ,
. .
, , (4, 5, 6). .
. D,
. , , ,
Mmmm k,...,, 21m , M – . m M.
n ),...,,( 21 ngggg .
. « »
)(mp . m ,
, [7]: )()()( mLmpkm ,
k – , p(m) – , )(mL – ,
. )(mp ,
, . ,
, , )(mp [8].

41- . . , 2014 .
115
,
(PDF), . ,
. ,
PDF ,
, , .
, .
.
X – )(mM )( mdp obs –
( , ).
: –
)(mM – PDF
)( mdp obs .
, ))(),(()( 21 mFmFmF ,
obsDT
obs
DLobs dmgCdmg
CmdpmF )()(
21exp
)2(
1)()( 1
21
21 ,
[7], , , .
)()(2 mmF M ,
. 2L
, . LR kR
LR . .
( Ljf j ,...,1, 1L ) x y –
. x y,
1. x y , , )()( yfxf jj Lj ,...,2,1
2. x y, , , , )()( yfxf jj Lj ,...,3,1 .
41- . . , 2014 .
116
, , , kRx*
))(),...,(),(()( 21 xfxfxfxf L , , kRx ,
Lixfxf ii ,...,2,1)()(
)()( xfxf jj , Lj ,...,3,1
: , . , -
, .
: PDF , ,
, .
» - : .
1. Kozlovskaya E. An algorithm of geophysical data inversion based on non-probalistic presentation of a priory information and definition of Pareto-optimality // Inverse problem, v. 16. – 2000. –pp.839-861. 2. Sambridge M. Geophysical inversion with a neighbourhood algorithm – . Searching a parameter space // Geophysical journal international. – 1999. – 138, 2. – P. 479-494 3. Tarantola, Albert. Inverse problem theory and methods for model parameter estimation // (Society for Industrial and Applied Mathematics), SIAM, 2005 , 342 p. 4. ., .
: . : , 2000. 352 . 5. Zadeh L.A. Fuzzy Sets as a Basis for a Theory of Possibility // Fuzzy Sets and Systems. -1978. - Vol. 1, No. 1. – P. 3—28. 6. Zimmermann Hans-Jürgen. Fuzzy set theory—and its applications (4th ed.). Dordrecht: Kluwer. 2001, 544 P. 7. Tarantola A., Valette.B. Generalized non linear inverse problem using the least squares criterion // Rev. Geophys. Space. –1982. – V. 20. – P. 219-232 8. Mosegaard K., Tarantola A. Monte Carlo sampling of solutions to inverse problems// 1995. – J.Geoph.Research. V. 100, N. B7. pp. 12,431 – 12,447
41- . . , 2014 .
117
. , .
. .
( ) ,
( ).
, ,
.
). [1-3].
. -, - [4, 5].
, .
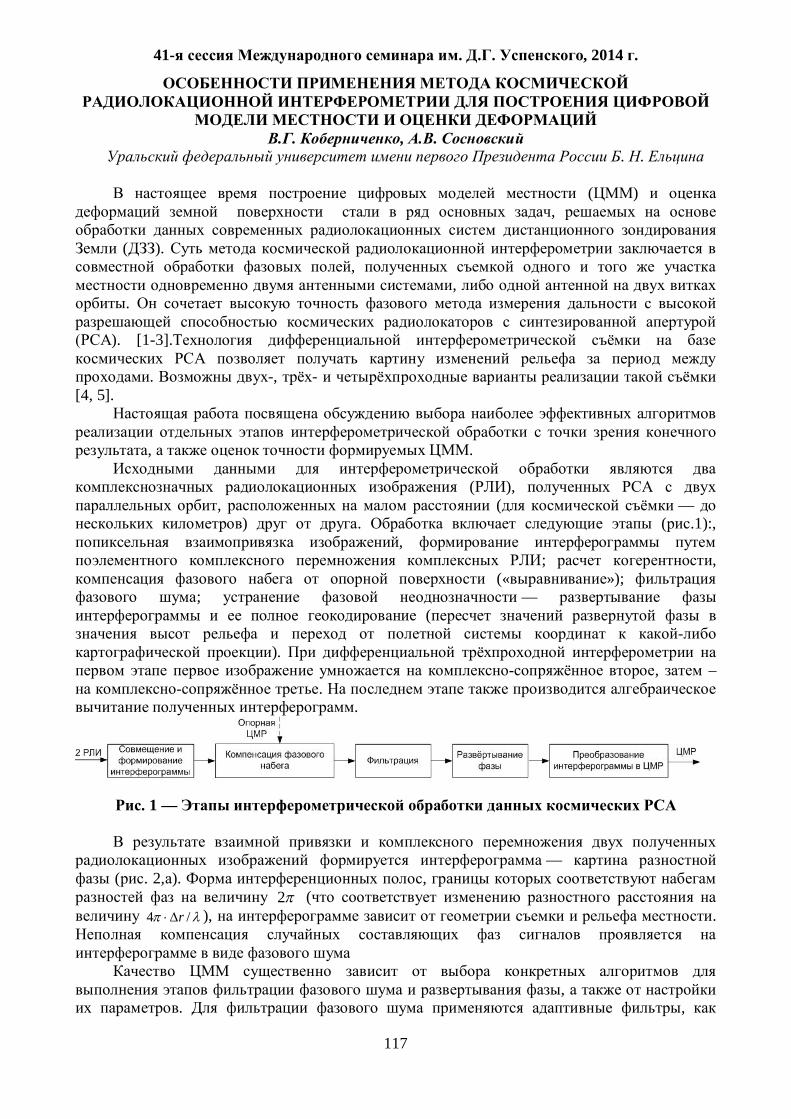
( ), , ( —
) . ( .1):, ,
; , (« »);
; — (
).
, – .
.
. 1 —
— ( . 2, ). ,
2 ( /4 r ), .
,
. ,

41- . . , 2014 .
118
, . ,
. [6].
, . [7], ,
, .
, .
(GPS- ) , .
, ,
. :
1 4/ [8].
, , ( , ),
( , , ), ( ,
, , ).
. , PALSAR ALOS ( – 2009 ),
« » ».
. 2 — : — , —
, — , —
41- . . , 2014 .
119
SARscape :
(boxcar), (Adaptive window) , :
(MCF) « » (Growing Region). 7
, . .
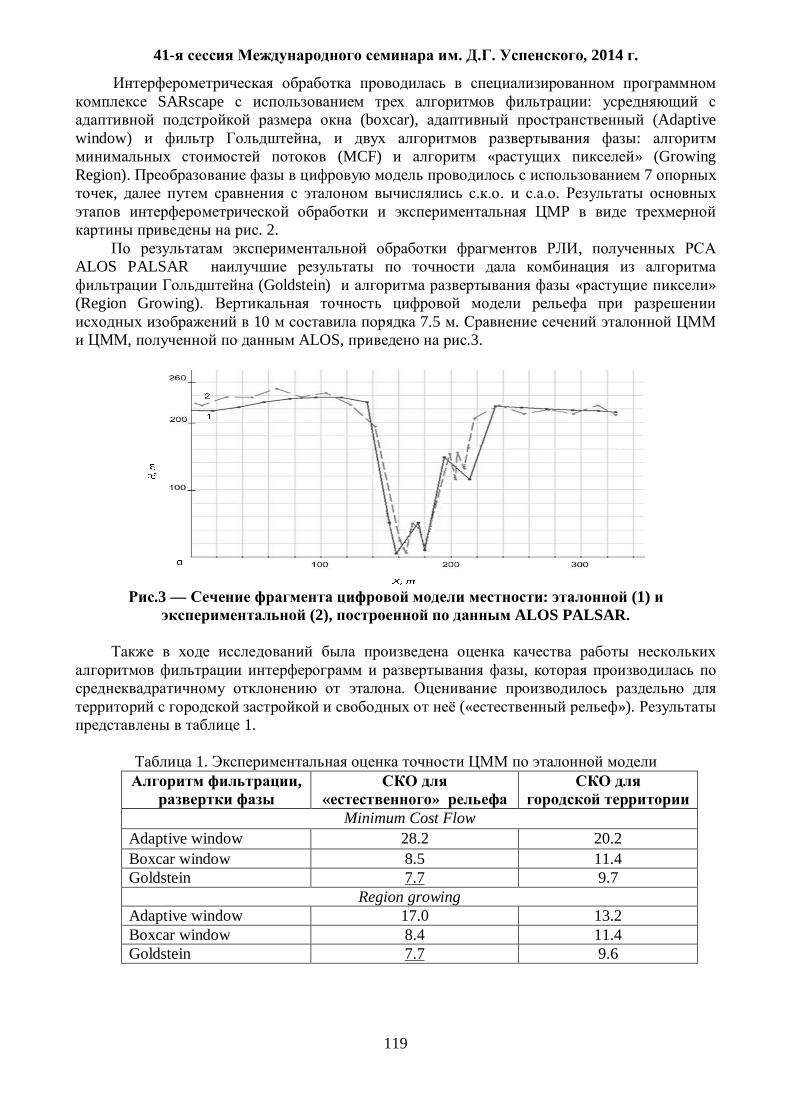
. 2. ,
ALOS PALSAR (Goldstein) « »
(Region Growing). 10 7.5 .
, ALOS, .3.
.3 — : (1)
(2), ALOS PALSAR.
,
. (« »).
1.
1. ,
»
Minimum Cost Flow
Adaptive window 28.2 20.2 Boxcar window 8.5 11.4 Goldstein 7.7 9.7
Region growing Adaptive window 17.0 13.2 Boxcar window 8.4 11.4 Goldstein 7.7 9.6
41- . . , 2014 .
120
, ,
. . 7.7 .
, ,
.
1. , .
// . 1996, N 1, . 75-90. 2. I.R. Joughin, F. K. Li, S.N. Madsen, E. Rodrigues, R.M. Goldstein. Synthetic Aperture Radar Interferometry. IEEE Proc., vol. 88, 3, 2000. 3. R.F. Hanssen. Radar interferometry. Data interpretation and error analysis. Kluwer academic publishers, 2002 4. . , , . , . .
/ . . . . – .: , 2010.- 680 . 5. . .
9. SARscape// , 2010, 3, .44-55. 6. . , . .
// . 2010. . 13. 3. . 98-106.
7. . , . . , //
. 2012. .9. 2. . 122-129. 8. J. Yu, L. Ge, S. Jung, Jeakee Lee. Accuracy comparison of differential interferometric synthetic aperture radar using LiDAR digital elevation model. IEEE, 2007.

41- . . , 2014 .
121
550.383 Z- IGRF
1980-2005 .
Z-component of Earth's magnetic field in the geocentric coordinate system the one most clearly and fully reflecting the global properties of the field. It has maximum in the polar regions, minimum in the equatorial parts of the sphere and goes to negative in the southern hemisphere. Lines of force of the magnetic induction (B) near the equator directed to the north pole, and in the center of the sphere - to the south pole. Z- ( )
. , .
(B) , – .
1633
. . : , , .
5 . .
45 [1], 170 .
6.3% )
( 0.2º ). [2] ( ),
1992 . .
, , , IGRF [3] WMM [4], ,
. [5] (
» ). , [6] [7] .
, Z-
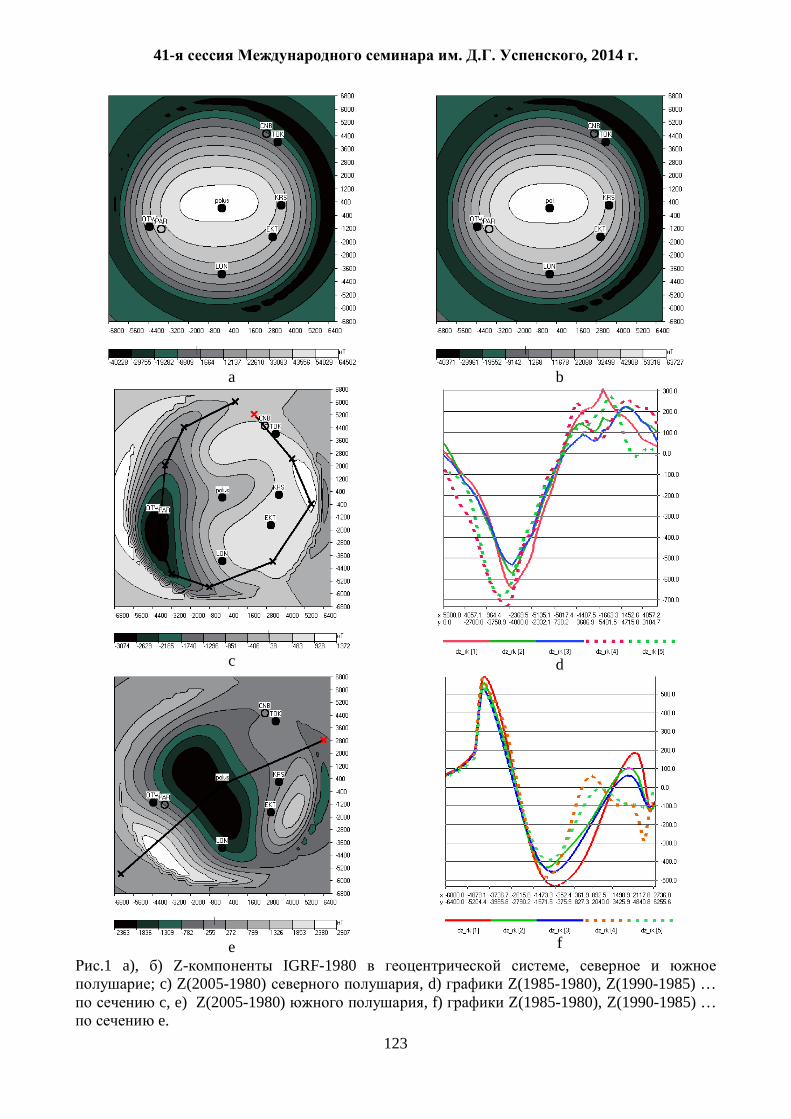
. .1 Z- IGRF-80 1
, – IGRF-2005. . : TOK – , KRS – , EKT –
, LON – , OTV – . : CNB – ( ), PAR – (
). , .
270-90 . .1 Z2005-Z1980. , 3070 ( OTV, ) 1370 .
.
41- . . , 2014 .
122
, , . 5
Z1=Z85 Z80, Z2=Z90 Z85, . , . 500-600
100-200 . .
. , .
2360 2800 . .
450 500 . Z (2000 1995) Z (2005
2000). .
, . .
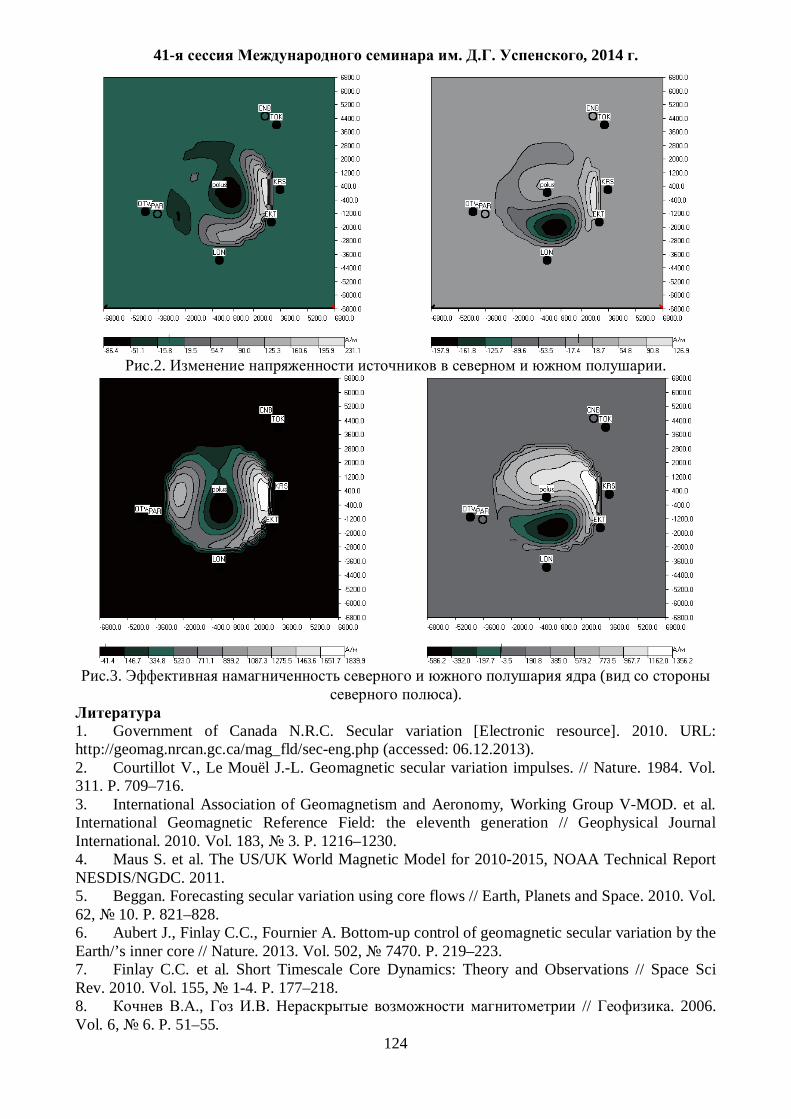
ADM-3D-earth [8], , .2. ,
( . 3, ). , 230 ( 12% 0.5%
), , . ,
, , . , ,
. .
. , .
.
, , .
100 . 25 3000 , - 2400 .
41- . . , 2014 .
123
a
b
c
d
e
f
.1 a), ) Z- IGRF-1980 , ; c) Z(2005-1980) , d) Z(1985-1980), Z(1990-1985) … c, e) Z(2005-1980) , f) Z(1985-1980), Z(1990-1985) … e.
41- . . , 2014 .
124
.2. .
.3. (
).
1. Government of Canada N.R.C. Secular variation [Electronic resource]. 2010. URL: http://geomag.nrcan.gc.ca/mag_fld/sec-eng.php (accessed: 06.12.2013). 2. Courtillot V., Le Mouël J.-L. Geomagnetic secular variation impulses. // Nature. 1984. Vol. 311. P. 709–716. 3. International Association of Geomagnetism and Aeronomy, Working Group V-MOD. et al. International Geomagnetic Reference Field: the eleventh generation // Geophysical Journal International. 2010. Vol. 183, 3. P. 1216–1230. 4. Maus S. et al. The US/UK World Magnetic Model for 2010-2015, NOAA Technical Report NESDIS/NGDC. 2011. 5. Beggan. Forecasting secular variation using core flows // Earth, Planets and Space. 2010. Vol. 62, 10. P. 821–828. 6. Aubert J., Finlay C.C., Fournier A. Bottom-up control of geomagnetic secular variation by the Earth/’s inner core // Nature. 2013. Vol. 502, 7470. P. 219–223. 7. Finlay C.C. et al. Short Timescale Core Dynamics: Theory and Observations // Space Sci Rev. 2010. Vol. 155, 1-4. P. 177–218. 8. ., . // . 2006. Vol. 6, 6. P. 51–55.

41- . . , 2014 .
125
550.834.5
. , . , .
We compare two options for calculating static corrections and velocity: a standard version with support of well data (option 1) and calculation of the near-surface model and statics from the detailed gravimetric observations (option 2).
: ( 1)
( 2). -
. : 392, 382, 349 .
( .1 .2). ( .1),
1). II . .2 , 2,
. . , ,
. . ? ( .3).
1. ( « »).
100 +50 . 70 0.
10 . 500 300 . ( .4).
, 100 .
[1]. , .3 .
, II. 3D , .
? , « » .
, . .
, . ,
. , . , .
, .
. , . , ,
, .
4 : , ,
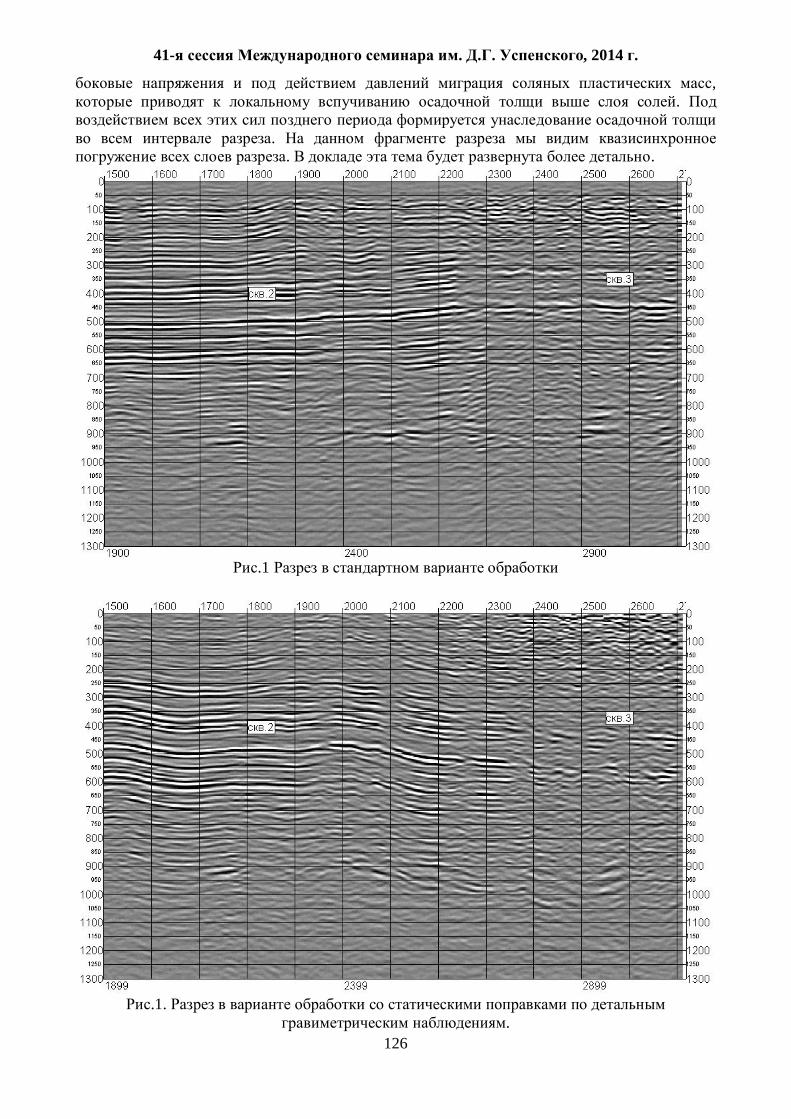
41- . . , 2014 .
126
, .
.
. .
.1
.1.
.
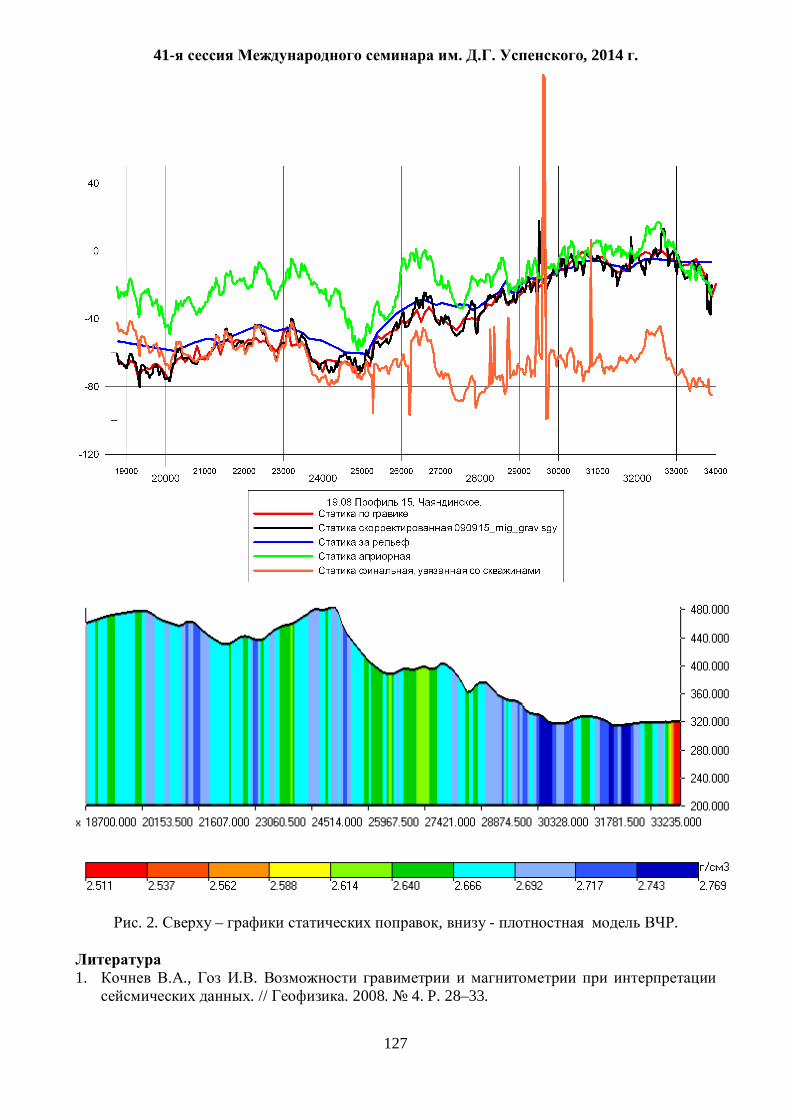
41- . . , 2014 .
127
. 2. – , - .
1. ., .
. // . 2008. 4. P. 28–33.
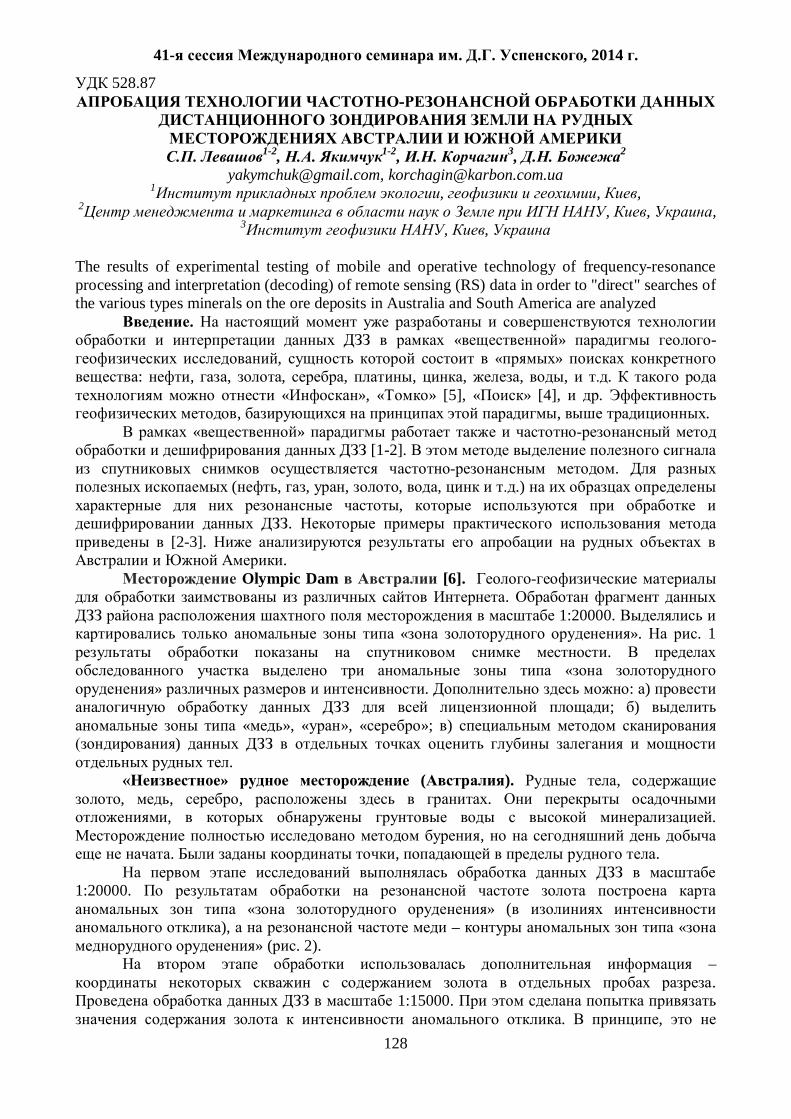
41- . . , 2014 .
128
528.87
. 1-2, . 1-2, . 3, . 2
[email protected], [email protected] 1 , , ,
2 , , , 3 , ,
The results of experimental testing of mobile and operative technology of frequency-resonance processing and interpretation (decoding) of remote sensing (RS) data in order to "direct" searches of the various types minerals on the ore deposits in Australia and South America are analyzed
. « » -
, « » : , , , , , , , , .
« », « » [5], « » [4], . , , .
« » [1-2].
. ( , , , , , .)
, .
[2-3]. .
Olympic Dam [6]. .
1:20000. « ». . 1
. «
» . : ) ; )
« », « », « »; ) )
. » ( ). ,
, , , . , .
, . , .
1:20000.
« » ( ), – «
» ( . 2). –
. 1:15000.
. ,

41- . . , 2014 .
129
. – . .
, , – .
. , .
(EM, IP, SAM) ,
, , ,
( . 2), . ,
TMI (Total Magnetic Intensity) SAM (Sub-Audio Magnetics). ,
( 1:15000).
. 1. « »
Olympic Dam ( )
. 1 –
.
. 2. « » «
» » . 1 –
; 2 –
; 3 – . .
75 2 1:30000. «
» « » ( . 3) «
» « ». (Cu-2, Cu-3)
« ». ,
« » .
– 1:19000.
( . 4). ,
« »: Cu+Mo-9, Cu+Mo-10, Cu+Mo-11, Cu+Mo-12.
.
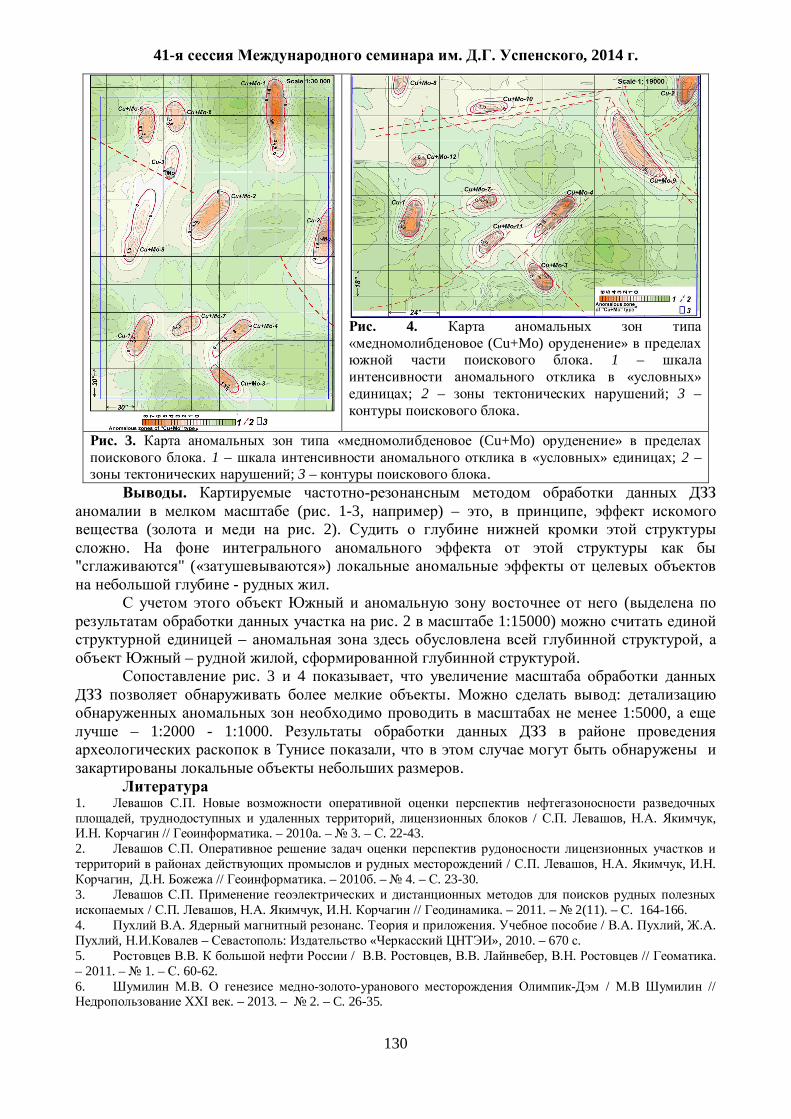
41- . . , 2014 .
130
. 4.
(Cu+Mo) » . 1 –
« » ; 2 – ; 3 –
.
. 3. « (Cu+Mo) » . 1 – « » ; 2 –
; 3 – . .
( . 1-3, ) – , , ( . 2).
. " (« »)
- . (
. 2 1:15000) – ,
– , . . 3 4 ,
. : 1:5000,
– 1:2000 - 1:1000. ,
.
1. . , , / . , . ,
. // . – 2010 . – 3. – . 22-43. 2. .
/ . , . , . , . // . – 2010 . – 4. – . 23-30.
3. . / . , . , . // . – 2011. – 2(11). – . 164-166.
4. . . . / . , . , – : « », 2010. – 670 .
5. . / . , . , . // . – 2011. – 1. – . 60-62. 6. . / //
I . – 2013. – 2. – C. 26-35.
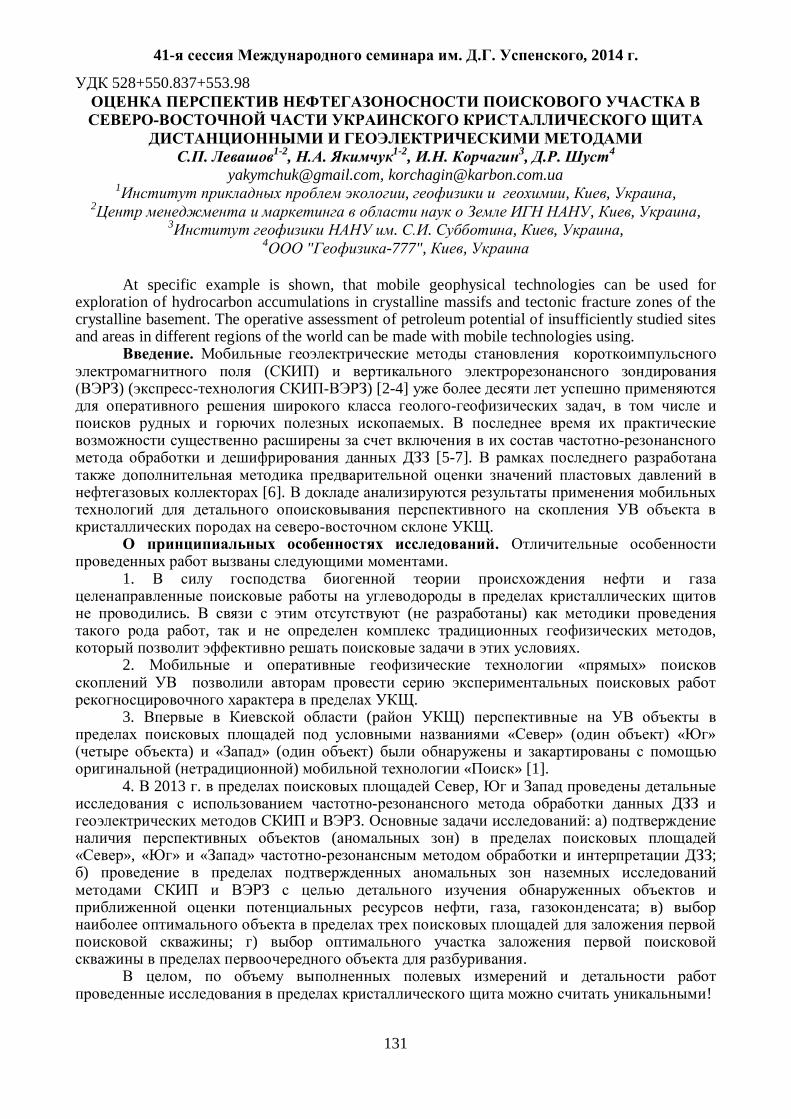
41- . . , 2014 .
131
528+550.837+553.98
. 1-2, . 1-2, . 3, . 4
[email protected], [email protected] 1 , , , ,
2 , , , 3 . . , , ,
4 " -777", ,
At specific example is shown, that mobile geophysical technologies can be used for exploration of hydrocarbon accumulations in crystalline massifs and tectonic fracture zones of the crystalline basement. The operative assessment of petroleum potential of insufficiently studied sites and areas in different regions of the world can be made with mobile technologies using.
. ( )
) ( ) [2-4] ,
.
[5-7].
[6].
. .
. 1.
. ( )
, , .
2. « »
. 3. ( )
« » ( ) « » ) « » ( )
( ) « » [1]. 4. 2013 . ,
. : )
( ) », « » « » ;
)
, , ; )
; ) .
, !

41- . . , 2014 .
132
. .
. ,
, »
( . 1).
. 2. " "
" ( ). 1 – " ", ; 2 –
( – , – ); 3
– ; 4 – ; 5 – ; 6 –
; 7 – .
. 1. " " « » ( -
). 1 –
, ; 2 – ; 3 – ; 4 – .
. .
24 2. - . « »
6 2. , « » ( . 2).
. .
. 2. : ( ), .
– = 515-580 . .
( ) « , , , ». 900 1300 .
, . 1600-3100
« ». « », .
3100-3200 , . ,
, . .
, , ( . 3).
41- . . , 2014 .
133
. 3.
" " ).
2 ( ). )
; ) . 1
– " "; 2 – " "; 3 – " "; 4 – " "; 5 – ?
); 6 – ; 7 – ; 8 –
.
« », » « » ,
. : ) –
= 0.1; ) – Pr = 200.0; ) – Gt = 0.9. :
– 133.6 . , – 53.6 . , – 7.509 . 3. . « »
( , ) . ,
. ,
( ) . ,
) 1500 .
1. ., ., ., .
« » // . 2010. 4. . 46-51.
2. ., ., ., ., . //
. 2011. 11. . 18-21. 3. ., ., ., ., .
// , . 2006. 2. . 58-63.
4. ., ., ., . :
// . 2008. 2. . 112-117. 5. ., ., .
, , // . , 2010. 3. . 22-43.
6. ., ., . : //
. , 2011. 2. . 19-35. 7. ., ., .
// . , 2011. 3. . 5-25.
41- . . , 2014 .
134
500.837.211:553.98
. , . [email protected], [email protected]
, , ; « », ,
Gathering, analysis and re-interpretation of archival materials of electrical prospecting (TEM, MTS and MT), gravity-magnetic data, including data of aerogravity-magnetic and spectrometer prospecting of a scale 1 : 50 000 were made for the total area of 90 000 km ² within Nepsko-Botyobinskaya anteclise. Generalization of seismic common depth point method data was executed as well. Processing of the raw logging data (lateral LLD, acoustic ASL and gamma-ray GR) in 113 wells, stratigraphic subdivision and seismic boundaries linking, borehole sections construction along profiles, analysis and processing of test results with the integrated oil-and-gas parameters in two groups of productive horizons B and C (313 wells) obtaining were also carried out.
In the area there are more than 25 licensed sites of various oil-and-gas companies and 20 oil-and-gas fields, in most of which hydrocarbons are extracted.
As a result of obtained data re-interpretation, construction of consolidated maps of the geophysical parameters (such as the depth of the roof of the terrigenous Vendian (KV), the base of Vendian - the roof of the folded basement, the roof of the high resistance crystalline basement, maps of thickness of the terrigenous Vendian and conductivity of conductive Riphean formations, conductivity and resistivity of individual horizons, maps of anomalies of gravity and magnetic field and their derivatives as well as maps of various types of faults – grid 500 x 500 m) was made. A comprehensive interpretation of all the data with the purpose of oil-and-gas presence prediction in the studied area is performed. Both the traditional multifactor structural-facies approach and formalized estimates based on 50 different parameters with training on a variety of standards (groups of fields) were used for the problem solution.
90 000 ² , ,
, , 1:50000,
. , , (113 ), ,
,
(313 ). 20 ,
, 25 .
, , ,
, 1:50000. ,
, , , .
: ( ), –
( ), ( ), ,
41- . . , 2014 .
135
, , .
( ) ( , ),
R =30 ( 60 ). :
( ); , , ( ).
( ) .
. g 15 20 . , ,
, , .
. ,
, .
. . ,
. , , ,
. ,
. , , ,
.
( ). . .
.
.
.
, .
« » .
, . , , , .
. ( ) :
, . ,
.
, .
Surfer Version 8 (Golden Software, 1993-2002)

41- . . , 2014 .
136
(Gaussian low-pass). .
30. . 1 .
. .
(R =50) .
.1. ( )
( ) ( ).
« ». ( , ).
53 , .
, – 450 . . .
. :
( ). .
), ( ).
. , , .
. .
, .
, , , – ( ) . . ,
.
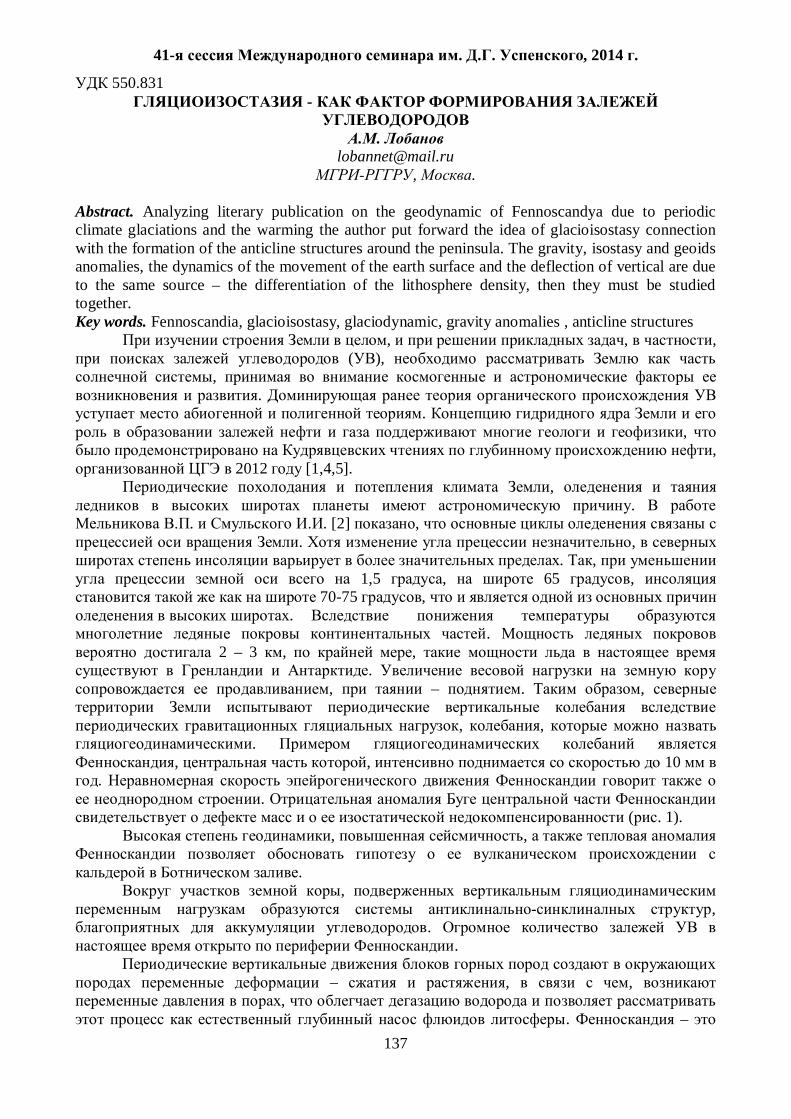
41- . . , 2014 .
137
550.831 -
.
Abstract. Analyzing literary publication on the geodynamic of Fennoscandya due to periodic climate glaciations and the warming the author put forward the idea of glacioisostasy connection with the formation of the anticline structures around the peninsula. The gravity, isostasy and geoids anomalies, the dynamics of the movement of the earth surface and the deflection of vertical are due to the same source – the differentiation of the lithosphere density, then they must be studied together. Key words. Fennoscandia, glacioisostasy, glaciodynamic, gravity anomalies , anticline structures
, , , ( ),
, .
. ,
, 2012 [1,4,5].
, .
. . [2] , . ,
. , 1,5 , 65 ,
70-75 , .
. 2 – 3 , ,
. , – . ,
, ,
. , , 10
. .
( . 1). , ,
.
, ,
. .
– , ,
, . –
41- . . , 2014 .
138
, .
. , , . [3], . , ,
. , ,
( , , , .), ,
. ,
.
. 1.
:
-
, ; -
. - , , ,
– ,
. .
1. . . ., , 2005, 242 . 2. ., . 2009.
: . .- ; « », 192 .
3. . . , , 2006, 2007. 4. 1- . . http://jurnal.deepoil.ru/. 5. . ,
. . . . , 2011, 10-32.
41- . . , 2014 .
139
550.831
.
E-mail: [email protected] , .
Abstract. The author evaluates the gravimetric monitoring work on the field Zapoliarnoye. The problem is complex, the results are not quit certain. In order to improve the results the author proposes to increase the number of measures outside the field contour and to apply the method of randomization interferences. ( )
[1,2,5].
( ) .
[5].
[1], « ».
, -
. :
. 200 , 1500 .
, Proudhoe Bay, 150 . 300 , . 2 1 . – 1 5-7 .
3), , ,
.
, , .
, .
1 – 3 5 – 10
. , ,
,
. , [1], : , :
? ,
? , ?
. , ,
41- . . , 2014 .
140
, ( ) ,
10 30 %, , , , ,
. , ( )
. . ,
, . 6.4 [1] 2,5 .
: : ,
, ; : ,
, .
, .
, ,
( 10 – 15 ) .
.
( , , .), ,
[4]. 5 – 9 10 – 15 .
, , , Scintrex,
.
( , La Cost & Romberg, Worden). , ( ,
) (
[3]), .
, .
. .
1. ., . . . . , , . – .; «
», 2012. – 374 .; . 2. ., ., ., .
// . - 2. – .: , 2002. – . 17-23. 3. . , .
, 1, 2012. 4. .
. . . 64, ., , 1974 . 5. Hare J.L., Ferguson J.F., Brady J.L. 4D microgravity method for waterflood surveillance: Part 4. – Modeling and interpretation of early epoch 4D gravity survey at Prudhoe Bay, Alaska// Ibed., 2008.
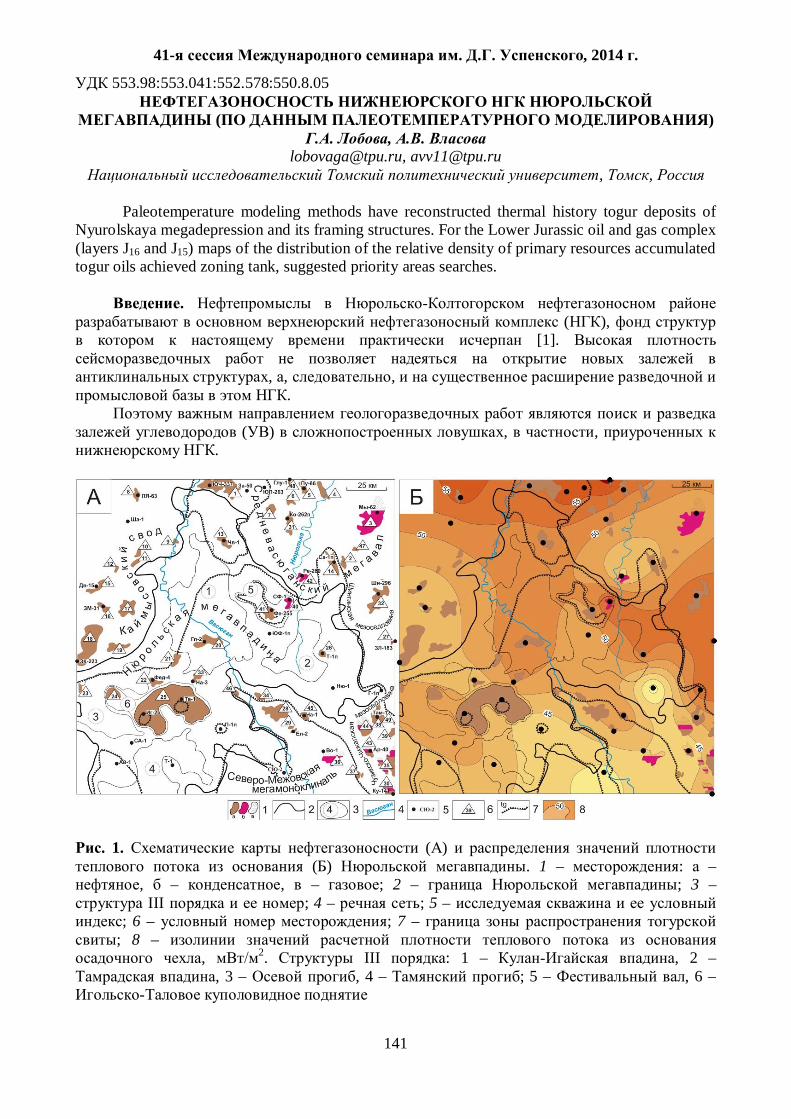
41- . . , 2014 .
141
553.98:553.041:552.578:550.8.05
( ) . , .
[email protected], [email protected] , ,
Paleotemperature modeling methods have reconstructed thermal history togur deposits of
Nyurolskaya megadepression and its framing structures. For the Lower Jurassic oil and gas complex (layers J16 and J15) maps of the distribution of the relative density of primary resources accumulated togur oils achieved zoning tank, suggested priority areas searches.
. ( ),
[1].
, , , .
( ) , ,
.
. 1. ( ) ( ) . 1 – : –
, – , – ; 2 – ; 3 – III ; 4 – ; 5 –
; 6 – ; 7 – ; 8 –
, 2. III : 1 – , 2 – , 3 – , 4 – ; 5 – , 6 –
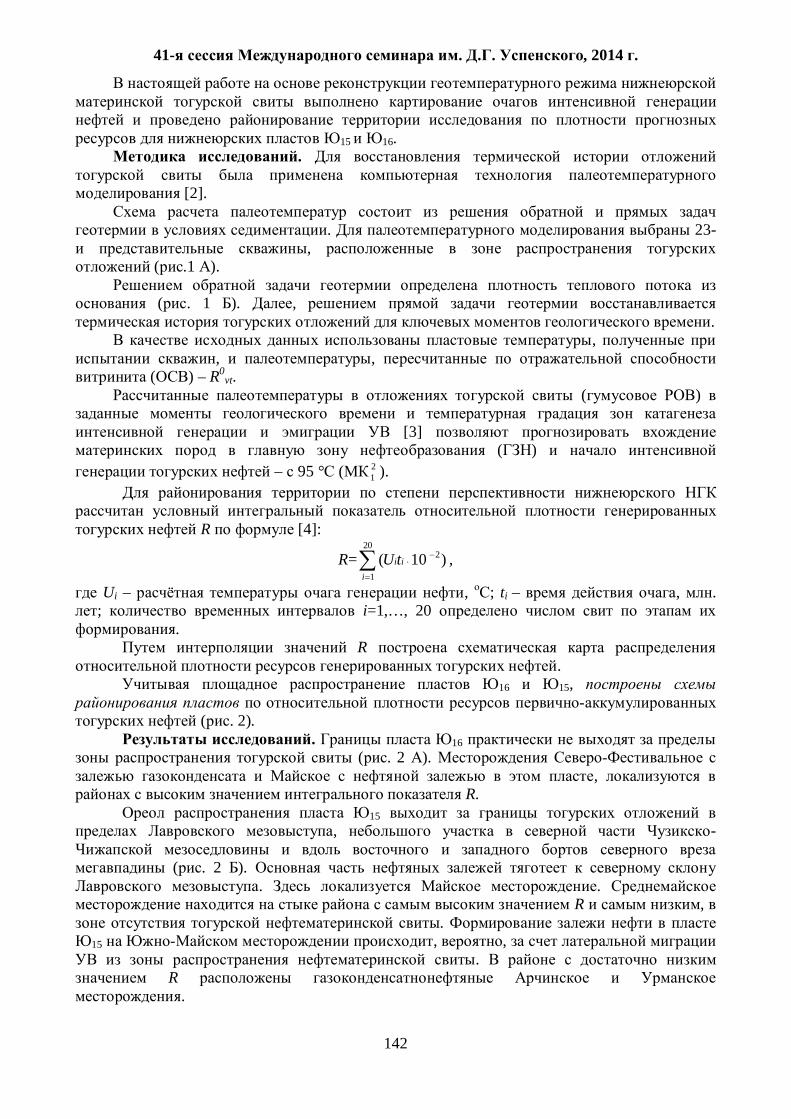
41- . . , 2014 .
142
15 16. .
[2].
. 23-
, ( .1 ).
( . 1 ). ,
. ,
, , ( ) – R0
vt. ( )
[3]
( ) – 95 ° ( 2
1 ).
R [4]:
R=20
1
2)10(i
iitU ,
Ui – , ; ti – , . ; i=1,…, 20
. R
. 16 15,
( . 2).
. 16 ( . 2 ).
, R.
15 , -
( . 2 ).
. . R ,
. 15 , ,
. R
.
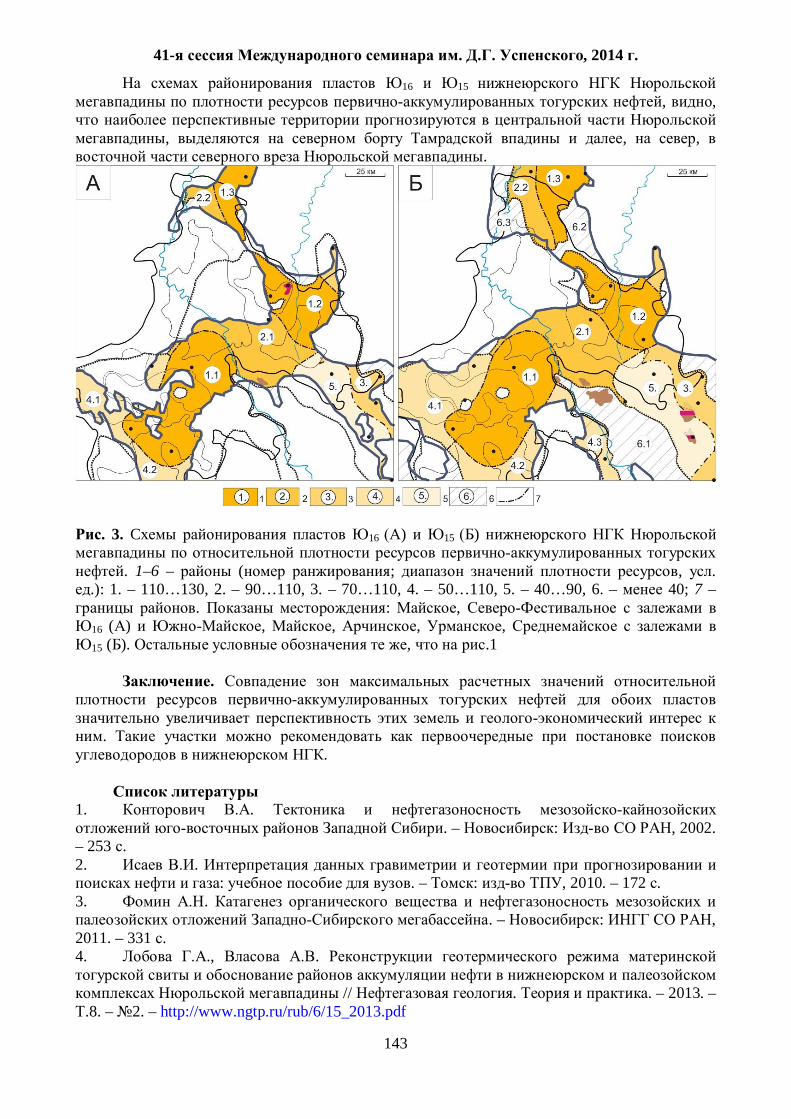
41- . . , 2014 .
143
16 15 , ,
, , ,
.
. 3. C 16 ) 15 )
. 1–6 – ( ; , . .): 1. – 110…130, 2. – 90…110, 3. – 70…110, 4. – 50…110, 5. – 40…90, 6. – 40; 7 –
. : , 16 ( ) , , , , 15 ( ). , .1
.
. .
1. . . – : , 2002.
– 253 . 2. .
: . – : , 2010. – 172 . 3. .
. – : , 2011. – 331 . 4. ., .
// . . – 2013. –
.8. – 2. – http://www.ngtp.ru/rub/6/15_2013.pdf
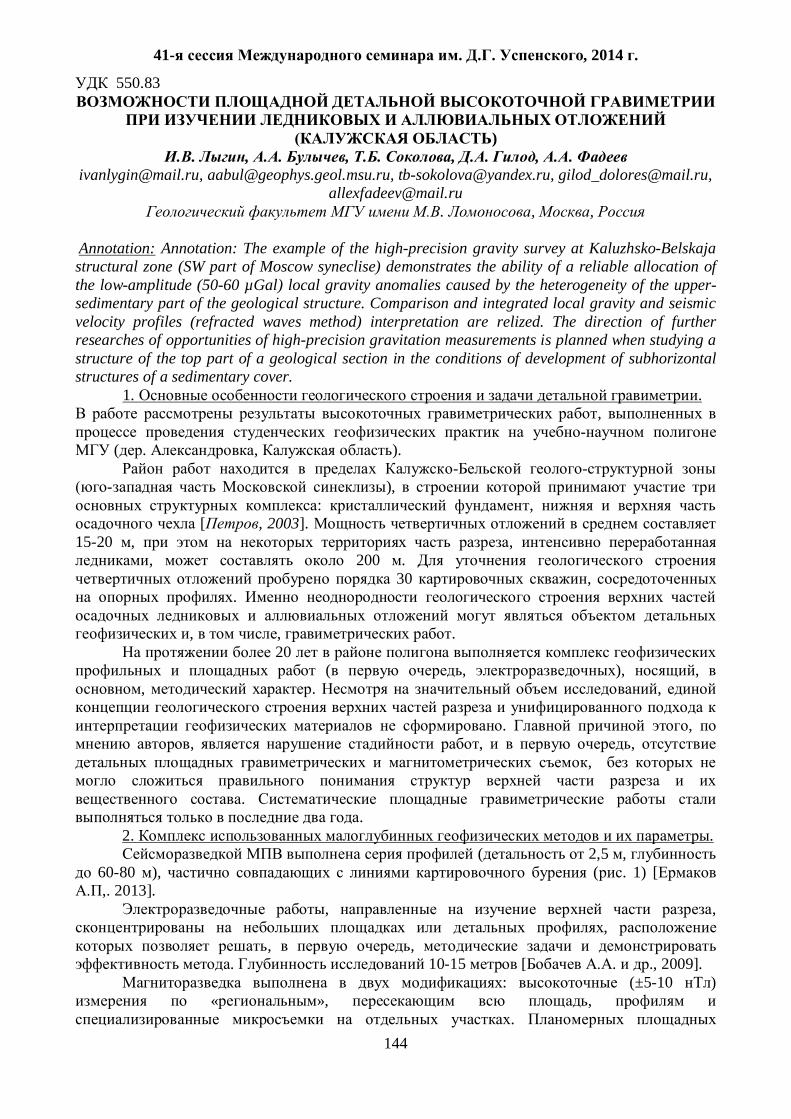
41- . . , 2014 .
144
550.83
)
. , . , . , . , . [email protected], [email protected], [email protected], [email protected],
[email protected] . , ,
Annotation: Annotation: The example of the high-precision gravity survey at Kaluzhsko-Belskaja structural zone (SW part of Moscow syneclise) demonstrates the ability of a reliable allocation of the low-amplitude (50-60 µGal) local gravity anomalies caused by the heterogeneity of the upper-sedimentary part of the geological structure. Comparison and integrated local gravity and seismic velocity profiles (refracted waves method) interpretation are relized. The direction of further researches of opportunities of high-precision gravitation measurements is planned when studying a structure of the top part of a geological section in the conditions of development of subhorizontal structures of a sedimentary cover.
1. . ,
( . , ).
),
: , [ , 2003].
15-20 , , , 200 .
30 , .
, , .
20 ( , ), ,
, . ,
. , , , ,
,
. .
2. . ( 2,5 ,
60-80 ), ( . 1) [ ,. 2013].
, , ,
, , . 10-15 [ . ., 2009].
: (±5-10 ) « », ,
.
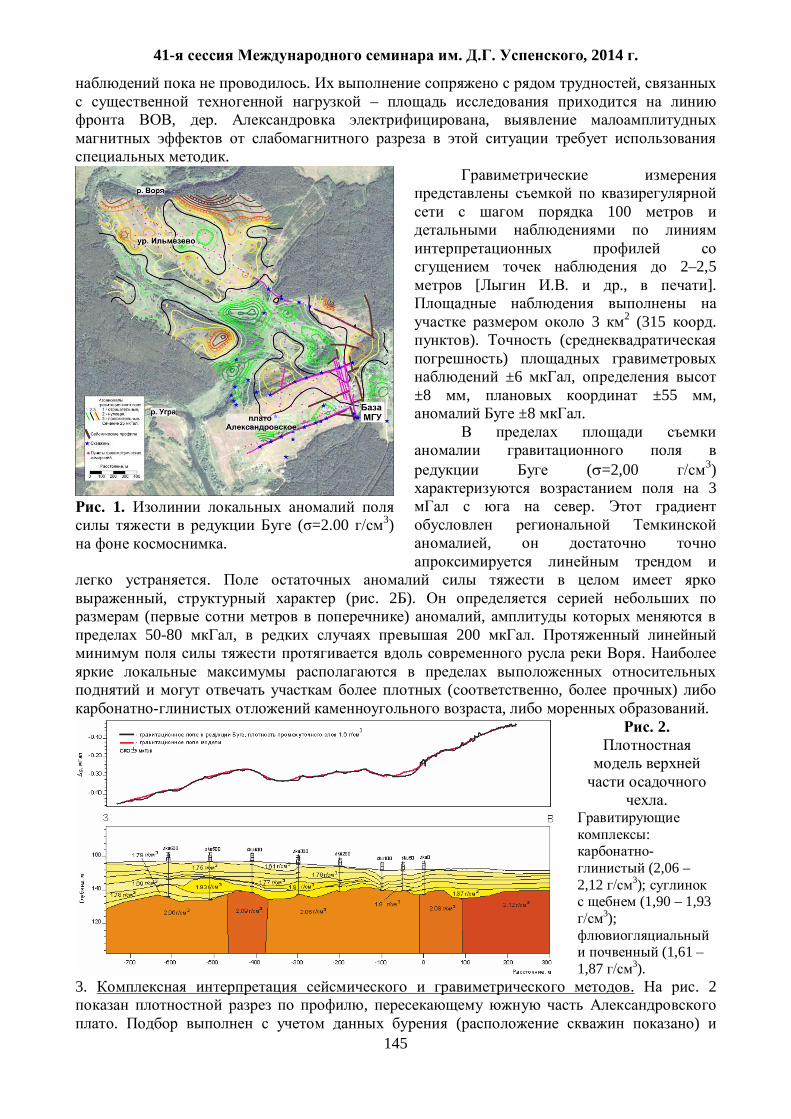
41- . . , 2014 .
145
. , –
, . ,
.
100
2–2,5 [ . ., ].
3 2 (315 .
). ( )
±6 , ±8 , ±55 ,
±8 .
( =2,00 3) 3
.
,
. , ( . 2 ).
( ) , 50-80 , 200 .
.
( , ) , .
. 2.
.
: -
(2,06 – 2,12 3);
(1,90 – 1,93 3);
(1,61 –
1,87 3). 3. . . 2
, . ( )
. 1.
( =2.00 3) .
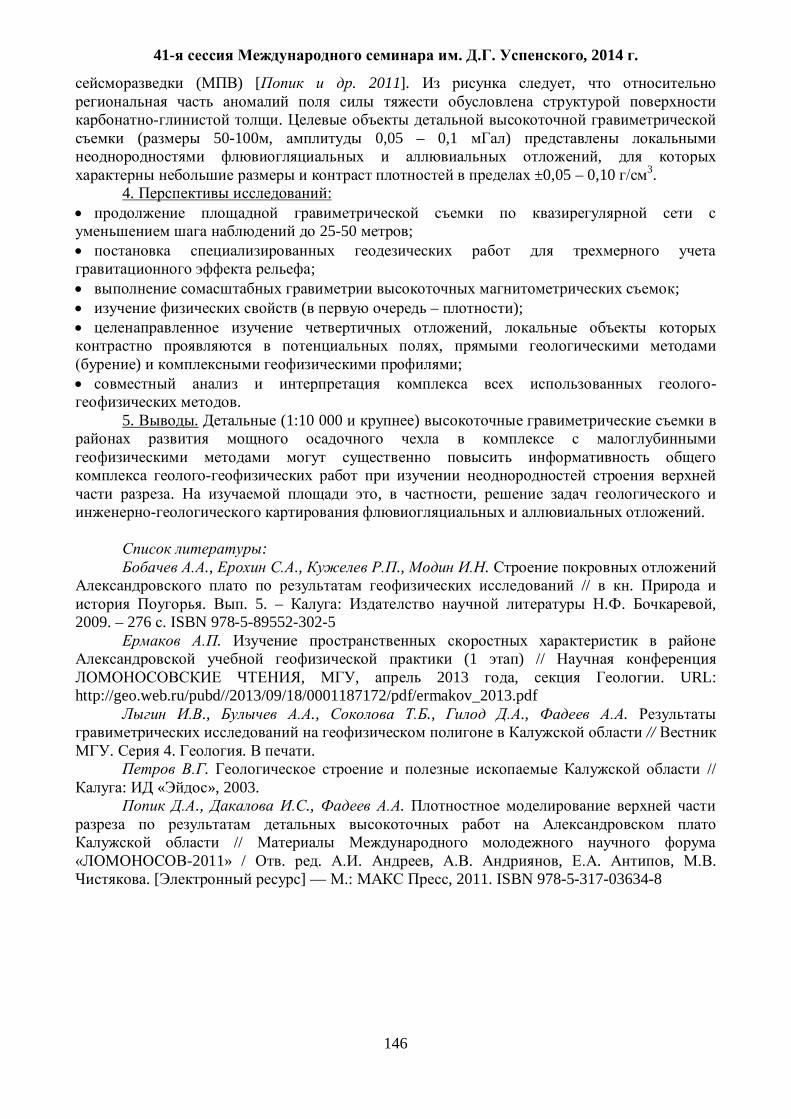
41- . . , 2014 .
146
( ) [ . 2011]. ,
. ( 50-100 , 0,05 – 0,1 )
, ±0,05 – 0,10 3.
4. :
25-50 ;
; ; ( – ); ,
, ) ;
-.
5. . (1:10 000 )
. , , .
:
., ., ., . // .
. . 5. – : . , 2009. – 276 . ISBN 978-5-89552-302-5
. (1 ) //
, , 2013 , . URL: http://geo.web.ru/pubd//2013/09/18/0001187172/pdf/ermakov_2013.pdf
., ., ., ., . //
. 4. . . . //
: « », 2003. ., ., .
//
-2011» / . . . , . , . , . . [ ] — .: , 2011. ISBN 978-5-317-03634-8
41- . . , 2014 .
147
550.83
. , . , .
[email protected]; [email protected] . , ,
Annotation: Gravity survey of 1:100 000 scale is analyzed during the complex geophysical study of the
salt layer structure in Southern Volga region. Joint analysis of vintage and modern surveys proves high representativeness and informative value of high precision gravity surveys.
. 40 , 1500 1 1 .
±10 µ , ±5 .
.
. 1. 1: 200 000 1:100 000 : a. 0.9 .
. b.
.
c. , , , , .
d. » , , , ,
, . 2. ( . 2). a.
, « » ( ).
b.
, , .
c. 1:200 000 ,
.
d. ,
Coscad 3Dt .
, .
g,

41- . . , 2014 .
148
, .
e. , ,
, .
.
. 1. .
: A – , B – ; – ; D –
)

41- . . , 2014 .
149
. 2.
. 3.
1:100 000
. .
:
1. , , 1975 . 2. . ,
, 1989 .

41- . . , 2014 .
150
550.8.056 3D . , . , . , .
[email protected] . . , . ,
Abstract. The article describes basic elements of our developed software and grid technique
algorithms for 3D density model constructing upper lithosphere. Technique is based on joint 2D seismic and 3D gravity data inversion. Using described methods 3D geological and geophysical models of Timan-Pechora plate junction area were constructed.
. ( , )
. ,
.
[1]. - [2].
, .
., . . ,
( .1), . , ,
.
, [3].
. 1. , ,
g. : 1) -2, 2) , 3) ,
4) , 5) -1, 6) .
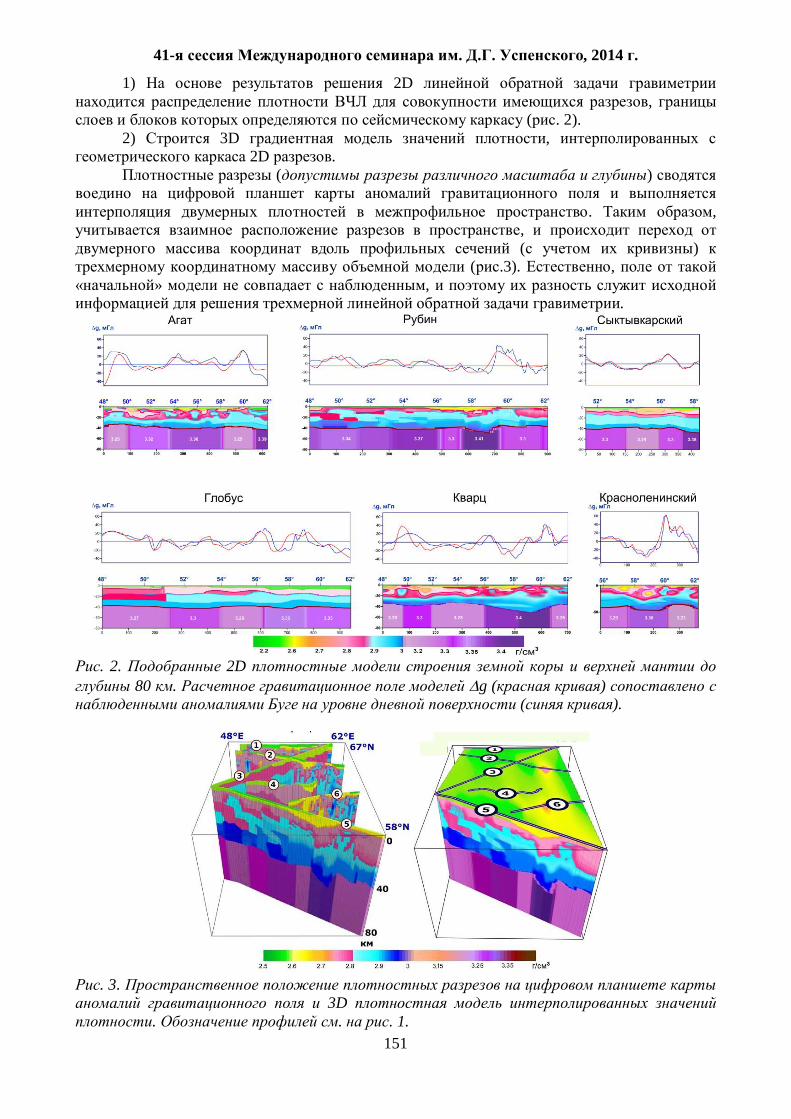
41- . . , 2014 .
151
1) 2D ,
( . 2). 2) 3D ,
2D . ( )
. ,
, ( )
( .3). , » ,
.
. 2. 2D 80 . g ( )
( ).
. 3.
3D . . . 1.
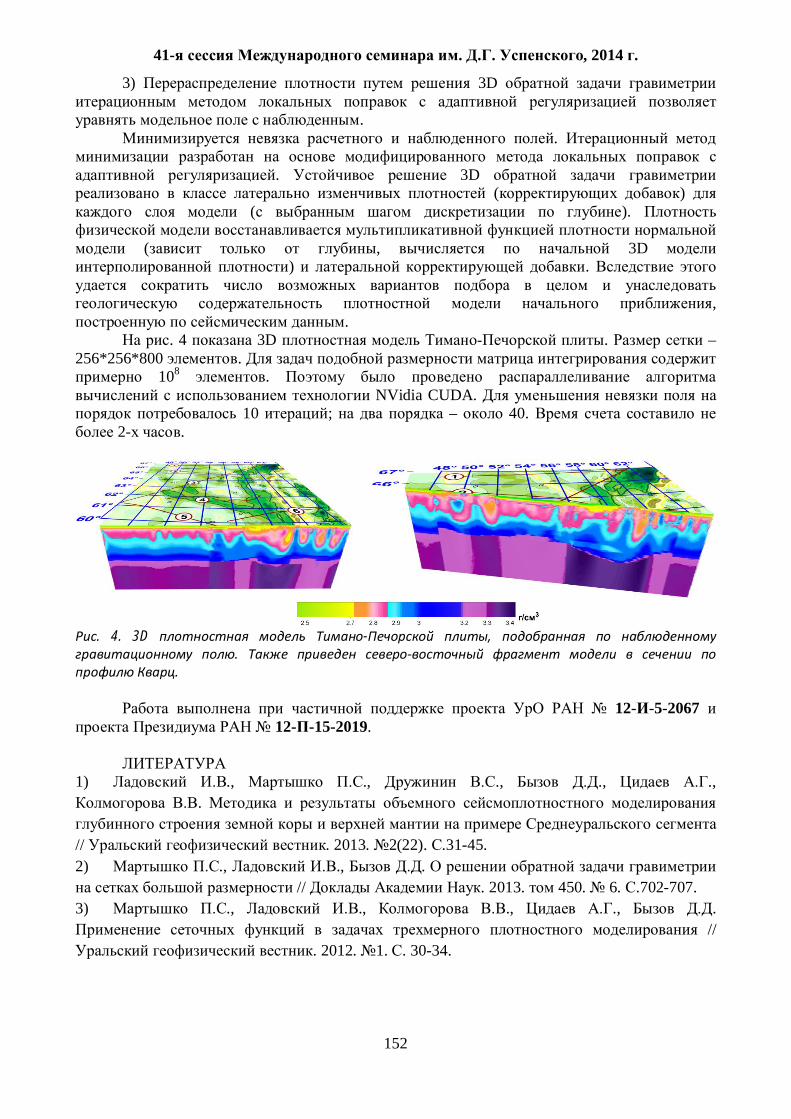
41- . . , 2014 .
152
3) 3D
. .
. 3D
( ) ( ).
( , 3D
) . ,
. . 4 3D . –
256*256*800 . 108 .
NVidia CUDA. 10 ; – 40.
2- .
. 4. 3D - ,
. .
12- -5-2067
12- -15-2019.
1) ., ., ., ., .,
.
// . 2013. 2(22). .31-45. 2) ., ., .
// . 2013. 450. 6. .702-707. 3) ., ., ., ., .
// . 2012. 1. . 30-34.
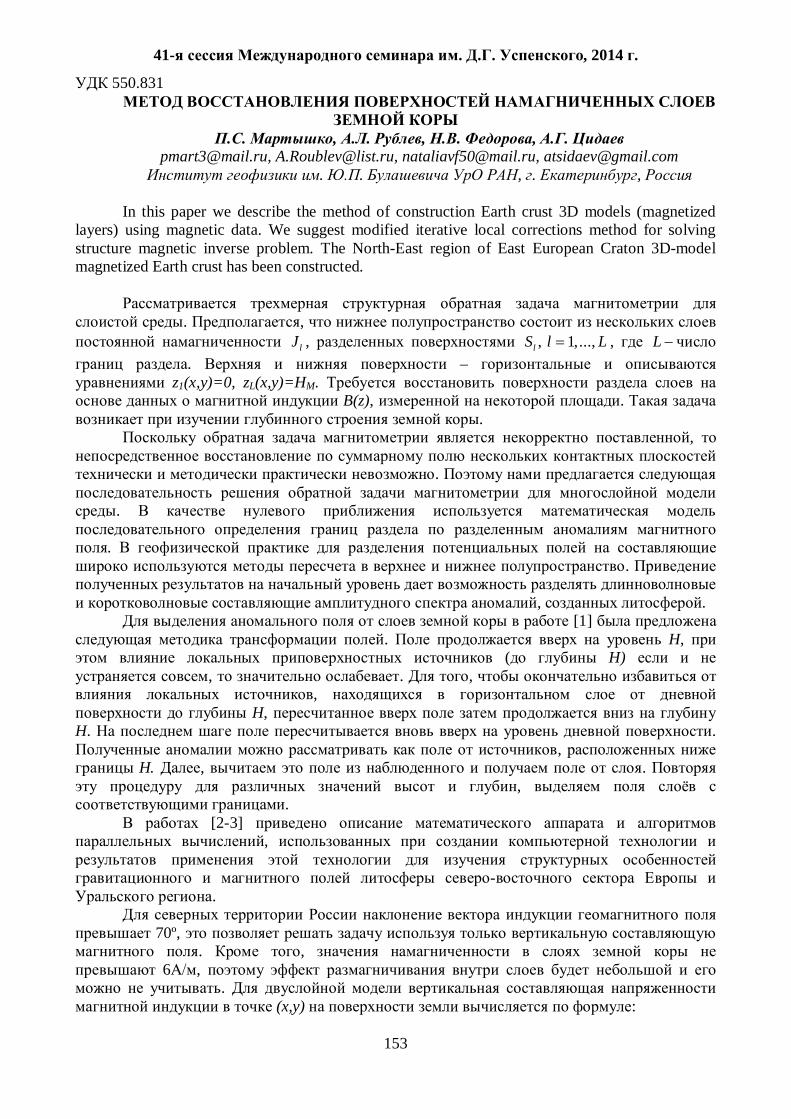
41- . . , 2014 .
153
550.831
. , . , . , .
[email protected], [email protected], [email protected], [email protected] . . , . ,
In this paper we describe the method of construction Earth crust 3D models (magnetized
layers) using magnetic data. We suggest modified iterative local corrections method for solving structure magnetic inverse problem. The North-East region of East European Craton 3D-model magnetized Earth crust has been constructed.
. , lJ , , 1,...,lS l L , L
. – z1(x,y)=0, zL(x,y)=HM.
B(z), . .
,
.
.
. .
, .
[1] . H,
( H) , . ,
, H,
H. . ,
H. , . ,
. [2-3]
,
.
70º, . ,
6 , .
(x,y) :
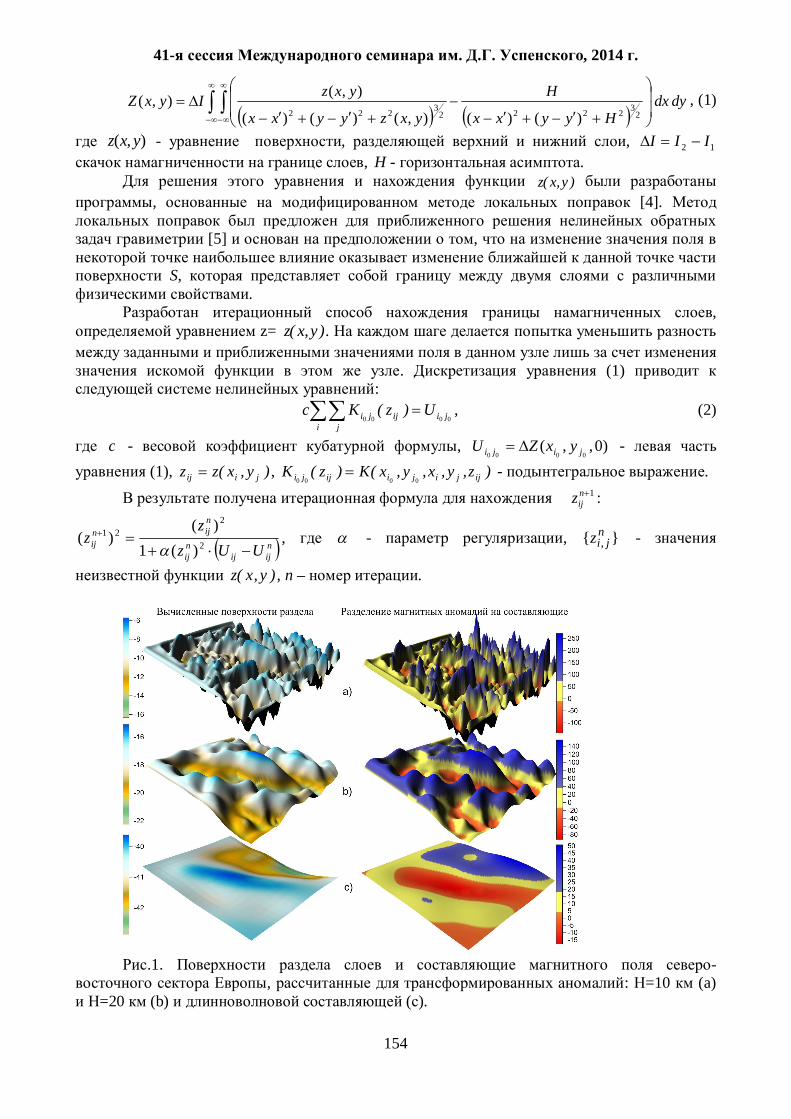
41- . . , 2014 .
154
dydxHyyxx
H
yxzyyxx
yxzIyxZ2
322223222 )()(),()()(
),(),( , (1)
),( yxz - , , 12 III , H - .
)y,x(z , [4].
[5] ,
S,
. ,
z= )y,x(z .
. (1) :
0000 jiiji j
ji U)z(Kc , (2)
c - , )0,,(0000 jiji yxZU -
(1), )y,x(zz jiij , )z,y,x,y,x(K)z(K ijjijiijji 0000 - .
1nijz :
nijij
nij
nijn
ij UUzz
z 2
221
)(1)(
)( , - , }{ ,n
jiz -
)y,x(z , n – .
.1. -
, : =10 (a) =20 (b) ( ).
41- . . , 2014 .
155
.
800 965 . .1.
Voxler », ( . 2).
. 2. .
, . (
) . .
18 ( 12- -15-2019).
12- -5-2067.
. 1. ., .
// , 2003. . 25, 3, . 30-34. 2. ., , .
// , 2012, 446, 2, . 201–203
3. ., ., . . //
, : 40- . . . . .:
. 2013. .223-226. 4. ., ., .
// , 2010, 4. . 3-8. 5. .
// . . . 1986. 1. .67-77.
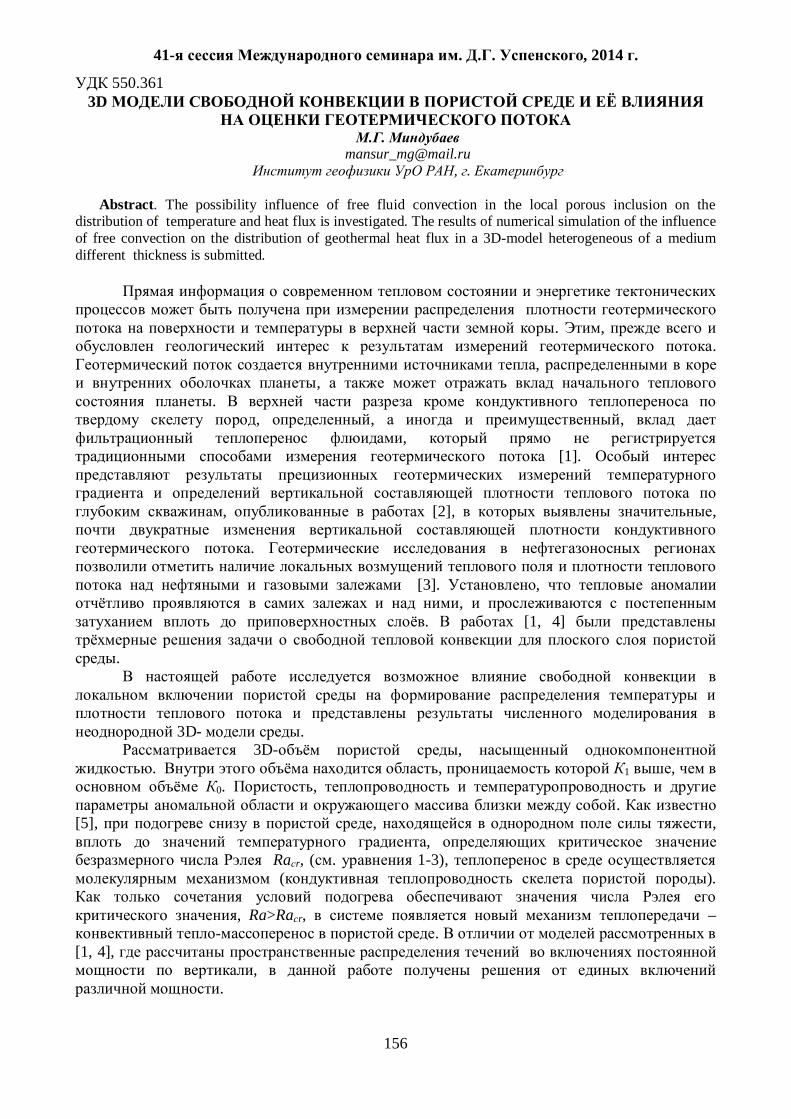
41- . . , 2014 .
156
550.361 3D
.
Abstract. The possibility influence of free fluid convection in the local porous inclusion on the
distribution of temperature and heat flux is investigated. The results of numerical simulation of the influence of free convection on the distribution of geothermal heat flux in a 3D-model heterogeneous of a medium different thickness is submitted.
. , .
, ,
. , , ,
, [1].
, [2], ,
.
[3]. ,
,
. [1, 4]
.
3D- . 3D-
,
. , 1 , 0. ,
. [5], , ,
, Ra r, ( . 1-3),
( ).
, Ra>Ra r, – .
[1, 4], ,
.
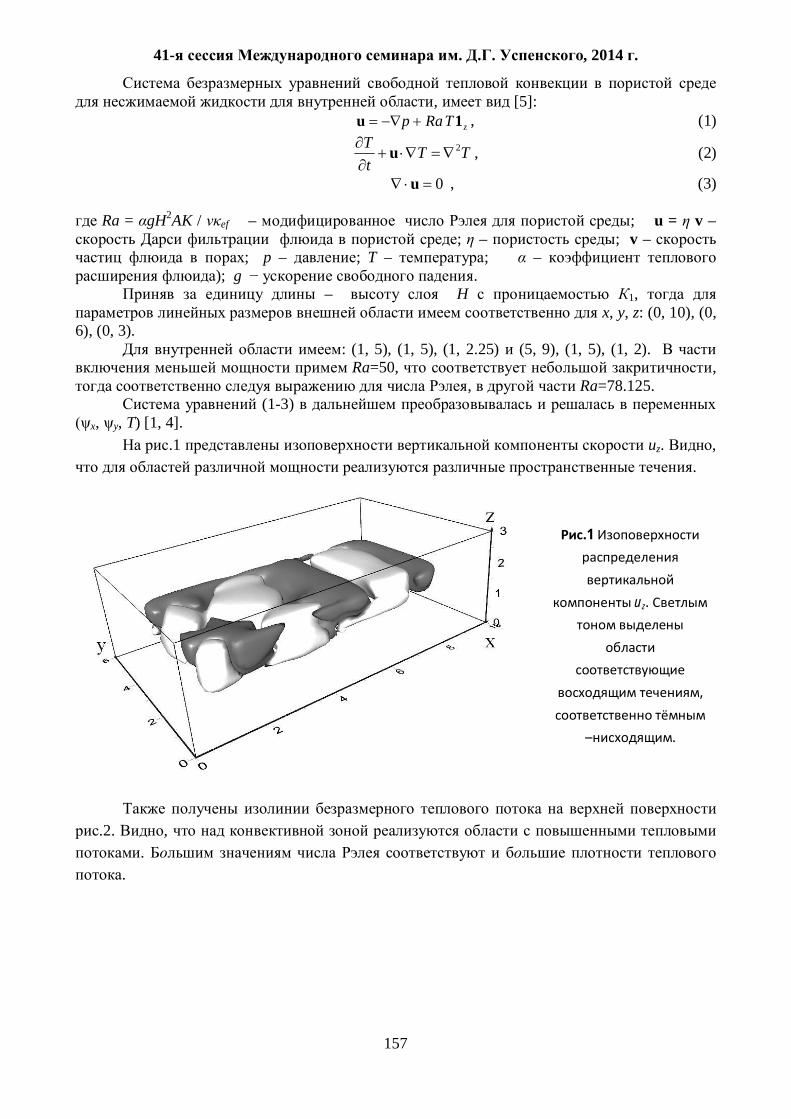
41- . . , 2014 .
157
, [5]:
zTRap 1u , (1)
TTtT 2u , (2)
0u , (3)
Ra = gH2AK / ef
–
;
u = v – ; – ; v –
; p – ; T – ; – ); g .
– H 1, x, y, z: (0, 10), (0,
6), (0, 3). : (1, 5), (1, 5), (1, 2.25) (5, 9), (1, 5), (1, 2). Ra=50, ,
, Ra=78.125. (1-3)
x, y, T) [1, 4]. .1 uz. ,
.
.1
uz.
,
.
.2. , .
.
41- . . , 2014 .
158
.2.
q' = qcon/qdif , qcon
qdif
.
, – .
, 3D ,
, . ,
, .
1. ., . 3D-
.// . . 2013. 4(13). .6-11.
2. Popov V.A., Pimenov V.P., Pevzner L.A., Romushkevich R.A., Popov E.Y. Geothermal characteristics of the Vorotilovo deep borehole drilled into the Puchezh-Katunk impact structure.// Tectonophysics. 1998.V.291. N.1-4. P. 205-223. 3. ., ., .
.// . 2000. . 2. .56-58. 4. . 3D .// .
. . . . .2011. .254-256. ISBN 7-7691-1623-4.
5. . ., . . . .: . 1972. 392 .
41- . . , 2014 .
159
550.831
. , .
[email protected] , , 50086, , . , 54.
Iterative methods of the solution of the return linear problems of a gravimetry and magnetometry on the basis of analogs of filters of Wiener-Kalman for two interpretative models using division of the card of a field on two massifs of even and odd profiles are improved. The new iterative formulas providing steady and geologically the substantial decision, unlike known methods, from any entry conditions without the preliminary beginning of the decision are offered by other methods. It gives two close decisions, independent of solutions of the return task other methods. Examples of practical realization of a method for a magnetometry in the ore area on the Ukrainian board are given.
( ) ( ) ( )
( ) ( ) – ( ) ( )
( )[1]. , ,
. [1], 2 , ,
, . , [1] , ,
. [1].
( ),
. ,
, i,n,k (k – ; n – ; i=1,M; M –
) n+1- . , i,n,1J i,n,2J
, [1], ( ) 131211 W,W,W 232221 W,W,W ,
: i,1n,1J = i,n,1J + 11W i,n,2J + 12W i,n,1B , i,1n,2J = i,n,2J + 21W i,n,1J + 22W i,n,2B (1)
: i,1n,1J = i,n,1J + 11W i,n,2B + 12W i,n,1B , i,1n,2J = i,n,2J + 21W i,n,1B + 22W i,n,2B ; (2)
=n,i,kB ,//b( jikij, );r n,j,k (3) ;Z)J,b(r j,kn,i,kijn,j,k - (4)
;b;bi
ijjj
iji (5)
ijb – (j=1,N; N – );
j,kZ – k , ;
n,j,kr – , , .
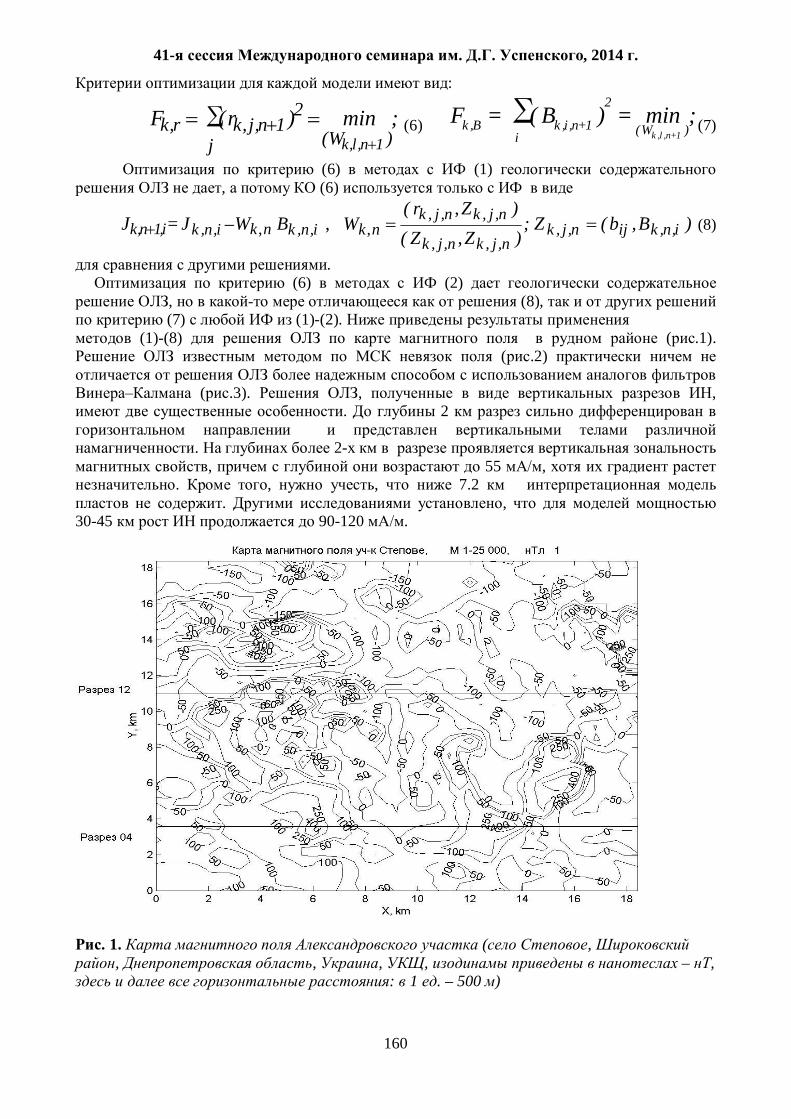
41- . . , 2014 .
160
:
;min)r(F)W(
2
j1n,j,kr,k
1n,l,k (6) ;min)B(F
)W(
2
i1n,i,kB,k
1n,l,k +== + (7)
(6) (1) , (6)
i,1n,kJ = i,n,kJ – nkW , i,n,kB , ;)ZZ()Zr(
Wn,j,kn,j,k
n,j,kn,j,knk ,
,, )B,b(Z i,n,kijn,j,k (8)
. (6) (2)
, (8), (7) (1)-(2).
(1)-(8) ( .1). ( .2)
( .3). , ,
. 2
. 2- , 55 ,
. , , 7.2 . ,
30-45 90-120 .
. 1. ( ,
, , , , – , : 1 . – 500 )
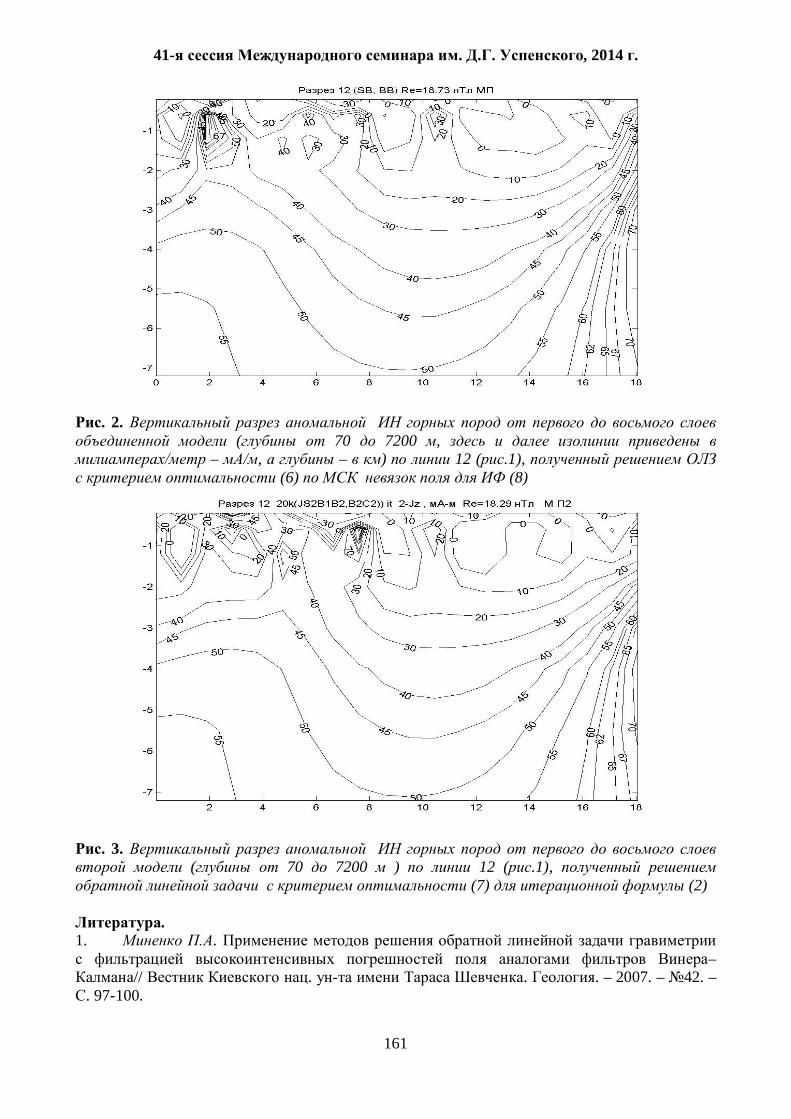
41- . . , 2014 .
161
. 2.
( 70 7200 , – , – ) 12 ( .1),
(6) (8)
. 3.
( 70 7200 ) 12 ( .1), (7) (2)
.
1. . –
// . . . – 2007. – 42. – . 97-100.
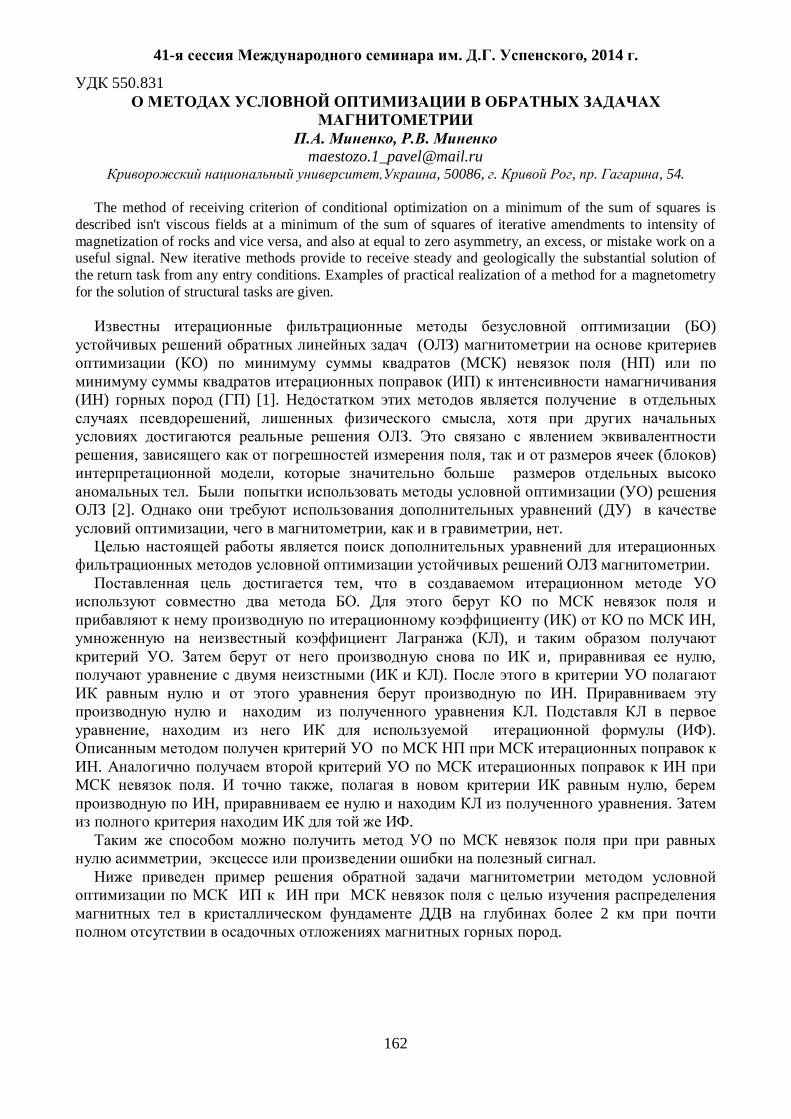
41- . . , 2014 .
162
550.831
. , .
[email protected] , 50086, . , . , 54.
The method of receiving criterion of conditional optimization on a minimum of the sum of squares is
described isn't viscous fields at a minimum of the sum of squares of iterative amendments to intensity of magnetization of rocks and vice versa, and also at equal to zero asymmetry, an excess, or mistake work on a useful signal. New iterative methods provide to receive steady and geologically the substantial solution of the return task from any entry conditions. Examples of practical realization of a method for a magnetometry for the solution of structural tasks are given.
( )
( ) ( ) ( ) ( )
( ) ) ( ) [1].
, , .
, , ( ) ,
. ( ) [2]. ( )
, , , .
. , .
( ) , ( ),
. , , ( ).
. .
, ( ).
. . , , , .
.
, .
2
.

41- . . , 2014 .
163
.1. ( 0.7 : – , Y – , Z – )
800 ( , , – , – )
.2. ( ) 3-
4.2 5.2 ( – )
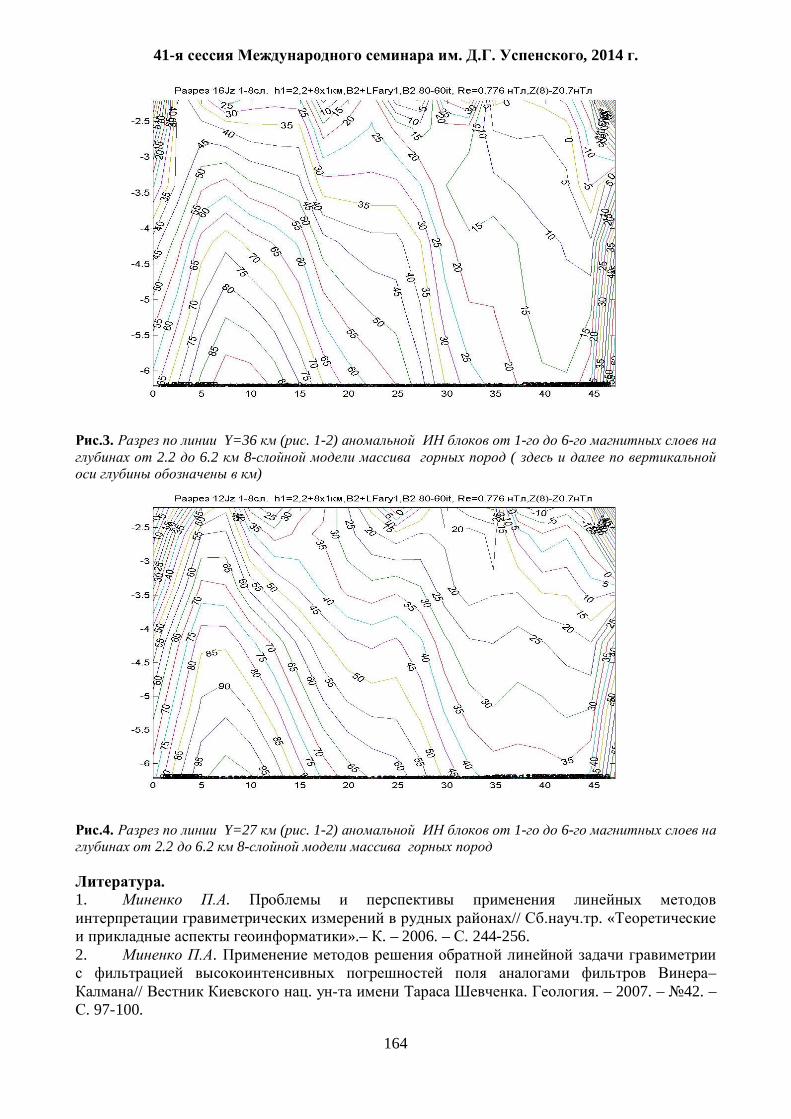
41- . . , 2014 .
164
.3. Y=36 ( . 1-2) 1- 6- 2.2 6.2 8- (
)
.4. Y=27 ( . 1-2) 1- 6- 2.2 6.2 8-
.
1. . // . «
».– . – 2006. – . 244-256. 2. .
–// . . . – 2007. – 42. –
. 97-100.
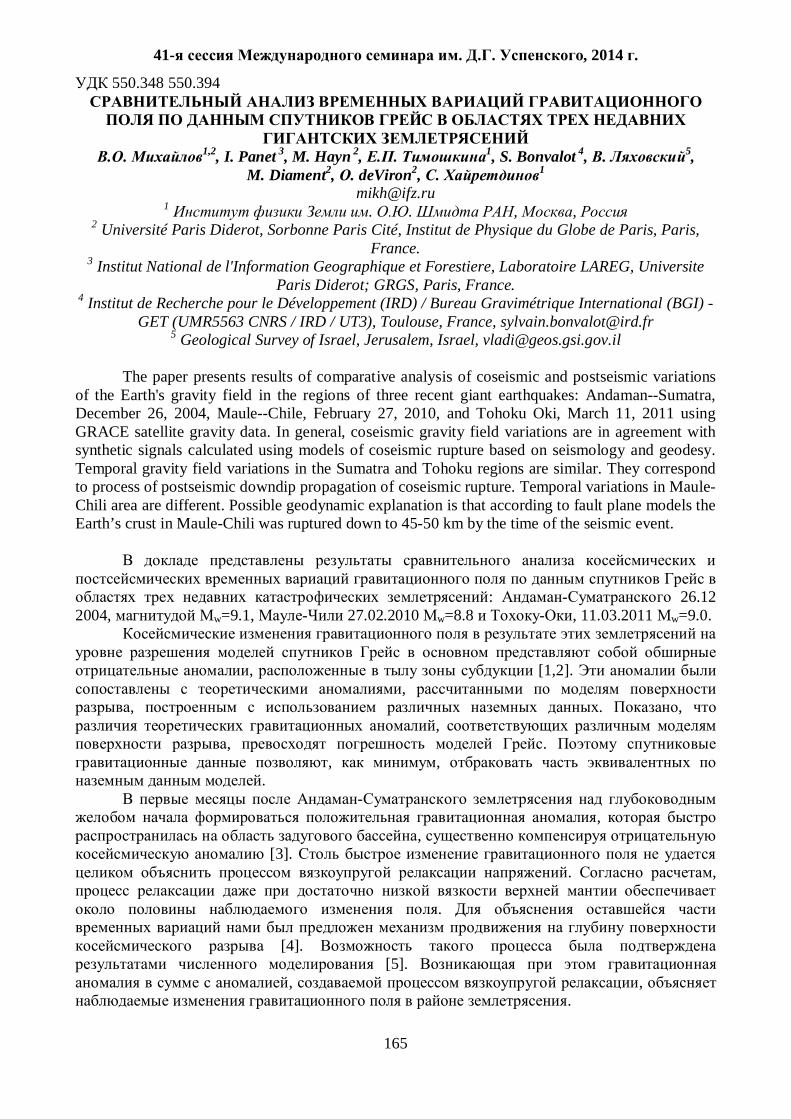
41- . . , 2014 .
165
550.348 550.394
. 1,2, I. Panet 3, M. Hayn 2, . 1, S. Bonvalot 4, . 5, M. Diament2, . deViron2, . 1
[email protected] 1 . . , ,
2 Université Paris Diderot, Sorbonne Paris Cité, Institut de Physique du Globe de Paris, Paris, France.
3 Institut National de l'Information Geographique et Forestiere, Laboratoire LAREG, Universite Paris Diderot; GRGS, Paris, France.
4 Institut de Recherche pour le Développement (IRD) / Bureau Gravimétrique International (BGI) - GET (UMR5563 CNRS / IRD / UT3), Toulouse, France, [email protected]
5 Geological Survey of Israel, Jerusalem, Israel, [email protected] The paper presents results of comparative analysis of coseismic and postseismic variations
of the Earth's gravity field in the regions of three recent giant earthquakes: Andaman--Sumatra, December 26, 2004, Maule--Chile, February 27, 2010, and Tohoku Oki, March 11, 2011 using GRACE satellite gravity data. In general, coseismic gravity field variations are in agreement with synthetic signals calculated using models of coseismic rupture based on seismology and geodesy. Temporal gravity field variations in the Sumatra and Tohoku regions are similar. They correspond to process of postseismic downdip propagation of coseismic rupture. Temporal variations in Maule-Chili area are different. Possible geodynamic explanation is that according to fault plane models the Earth’s crust in Maule-Chili was ruptured down to 45-50 km by the time of the seismic event.
: 26.12 2004, w=9.1, 27.02.2010 w=8.8 , 11.03.2011 w=9.0.
, [1,2]. ,
, . , ,
, . , ,
.
, ,
[3]. . ,
.
[4].
[5]. , ,
.
41- . . , 2014 .
166
.
. 1. , 60
. . 1
, 2011 , . . , , ,
, . ,
.
. 1 . ( ), 2011 .
11.03. 2011 1200 ( ) 1000 .
, . .2.
60- , .
, , ,
, , , .
, .
1 , .
, ,
. 1 .
, .

41- . . , 2014 .
167
. 2. ( )
, 27.02.2010, 1200 ( ) 1000 .
,
, .
, , .
( 12-05-00276). CNRS- 12-
05-91051- .
1. ., ., ., .,
// . . « ».
2005. 3. C. 18-32 2. Mikhailov V., Tikhotsky S., Diament M., Panet I., Ballu V. Can tectonic processes be recovered from new gravity satellite data?// Earth and Plan. Sci. Lett. 2004. v. 228. N3-4. p. 281-297 3. Panet I., Mikhailov V., Diament M., Pollitz F., King G., de Viron O., Holschneider M., Biancale R., Lemoine J.-M. Co-seismic and post-seismic signatures of the Sumatra December 2004 and March 2005 earthquakes in GRACE satellite gravity// Geoph. J. Int. 2007. DOI: 10.1111/j.1365-246X.2007.03525.x 4. Panet I., Pollitz F., Mikhailov V., Diament M., Banerjee P., Grijalva K. Upper mantle rheology from GRACE and GPS post-seismic deformations after the 2004 Sumatra-Andaman earthquake// G3 (Geochemistry, Geophysics, Geosystems). 2010. v. 11. Q06008. doi:10.1029/2009GC002905 5. Mikhailov V., Lyakhovsky V., Panet I., van Dinther Y., Diament M., Gerya, T., Timoshkina E. Numerical modelling of post-seismic rupture propagation after the Sumatra 26.12. 2004 earthquake constrained by GRACE gravity data// Geoph. J. Int. 2013. doi: 10.1093/gji/ggt145
41- . . , 2014 .
168
550.8.05(470.324)
, ,
Abstract. The article considers the results of the identification of the analysis conducted, with the aim of establishing the approximation dependences for petrophysical parameters core samples of crystalline rocks of the Voronezh crystalline massif. The task was solved using the method of the group account of arguments. The result was the construction of a structurally parametric equations (models) for rocks of different structural-material complexes. The obtained relations necessary for construction of the initial approximation of the generalized structural petrophysical model region.
( ) ,
[2].
ArcView 3.2. ,
, 90000
4400 [4,7].
.
, , , .
[6]. ,
. (K1tm)
2 . , ,
, , -.
. :
[1,5]. ,
, 15000 , 4000 . 12
, .
.
41- . . , 2014 .
169
5,00
5,50
6,00
6,50
7,00
1 3 5 7 9 11 1315 17 19 2123 25 27 29 3133 35 37 39 41 43 45 47 49
5,00
5,50
6,00
6,50
7,00
1 3 5 7 9 11 13 15 17 19 2123 25 2729 31 33 35 37 39 41 43 45 47 49
5,50
6,00
6,50
7,00
7,50
8,00
1 3 5 7 9 11 13 15 17 19 21 23 25 27 29 31 33 35 37 39 4143 45 47 491 2
v*10 3
.1
: 1 - ; 2- ; – ; –
; – .
1 .
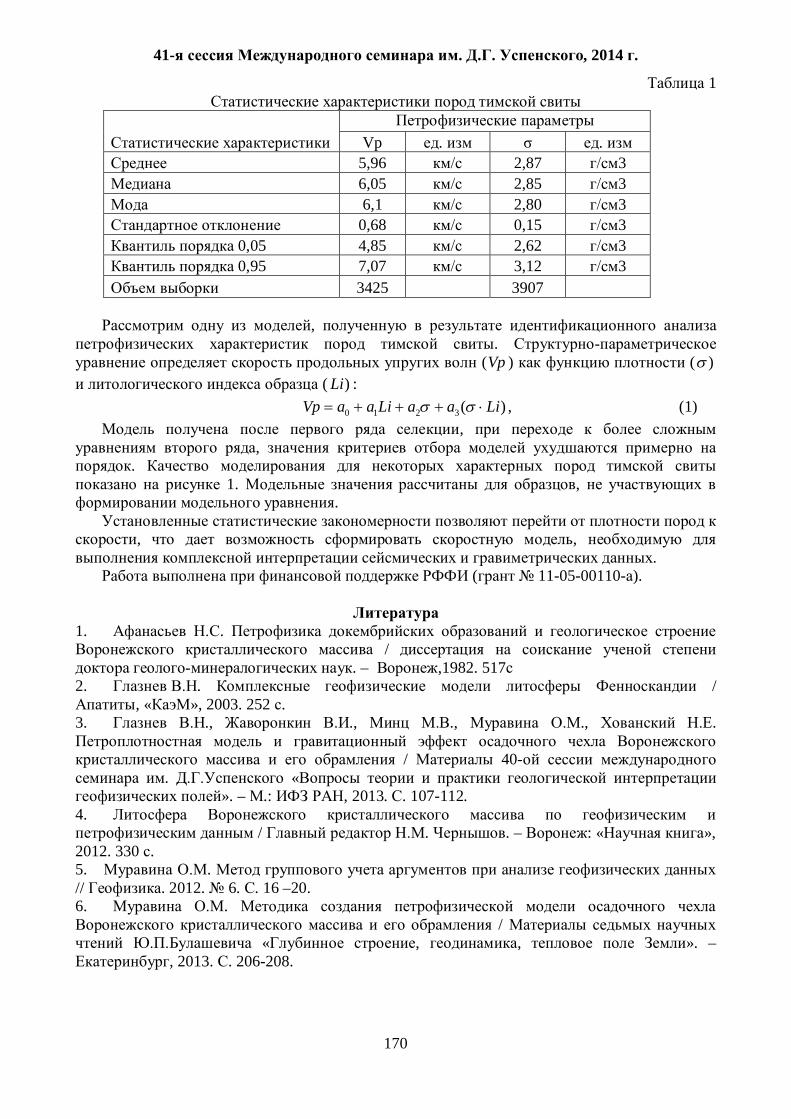
41- . . , 2014 .
170
1
Vp . . 5,96 2,87 3 6,05 2,85 3
6,1 2,80 3 0,68 0,15 3
0,05 4,85 2,62 3 0,95 7,07 3,12 3
3425 3907
, .
(Vp ) ( ) ( )Li :
)(3210 LiaaLiaaVp , (1) ,
, .
1. , .
, ,
. ( 11-05-00110- ).
1. . /
. – ,1982. 517 2. . /
, « », 2003. 252 . 3. ., ., ., ., .
/ 40-
. « ». – .: , 2013. . 107-112.
4. / . . – : « »,
2012. 330 . 5. . // . 2012. 6. . 16 –20. 6. .
/ « , , ». –
, 2013. . 206-208.
41- . . , 2014 .
171
550.8.05(470.324)
. , . , .
Abstract. The article deals with the issues of Petrophysical data on crystalline rocks of the Voronezh Crystalline Massif. The spatial and geological features of the main unit were investigated with statistical methods. It is shown that for construction a model of the Earth's upper crust in the region, the density model of the crystalline basement of the Voronezh crystalline massif, should take into account.
( )
[2, 5]. ,
. 4400
, . - ArcView 3.2.
, ,
, .
. 90000 ,
. ,
. ,
, [8].
, .
. ,
, , , [3, 7].
, .
, 4-6 .
,
[1]. , . ., 1985),
: 1,5 3-4 .
, ; [7];
( . ., 1999) -
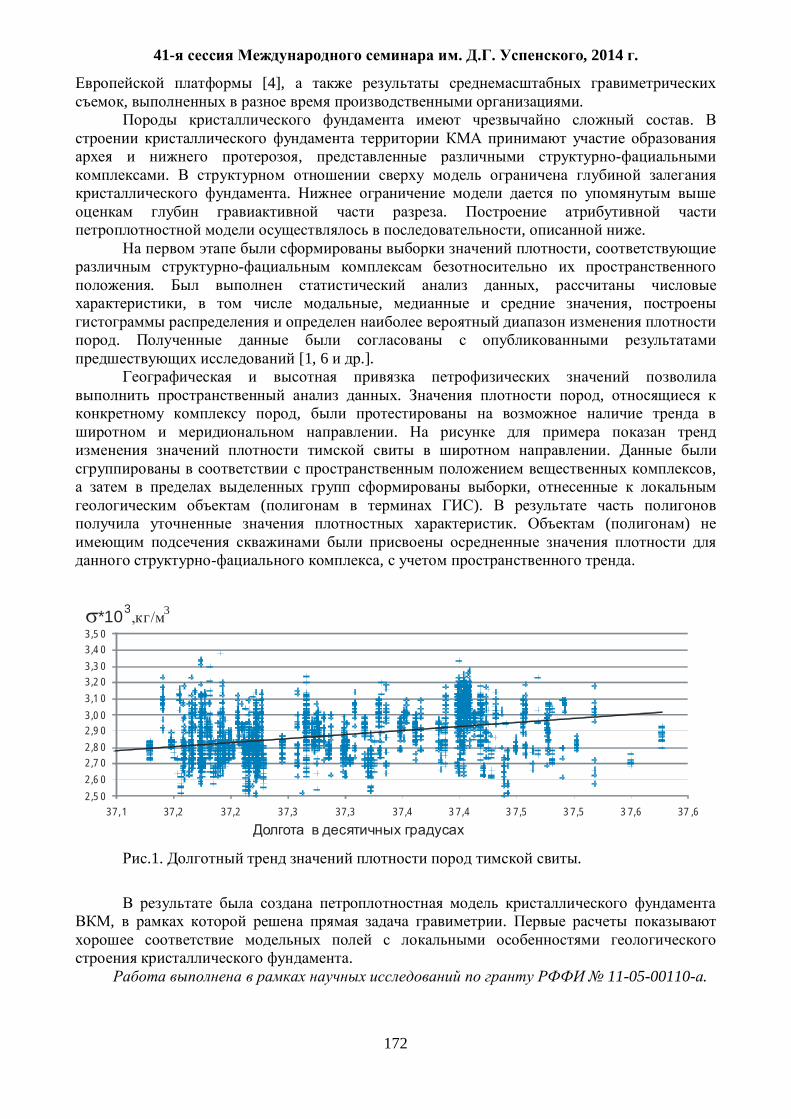
41- . . , 2014 .
172
[4], , .
.
, .
. .
, . ,
. ,
, , ,
. [1, 6 .].
. ,
, .
. ,
, ( ).
. ( )
, .
2,5 02,6 02,7 02,8 02,9 03,0 03,1 03,2 03,3 03,4 03,5 0
37,1 37,2 37,2 37,3 37,3 37,4 3 7,4 3 7,5 3 7,5 3 7,6 37 ,6
3*103
.1. .
, .
. 11-05-00110- .

41- . . , 2014 .
173
1. . // . –
: , 1985. – . 34-42. 2. . . -
, , 2003. 252 . 3. ., ., ., ., .
/ . 40- . . .
« ». – .: , 2013. . 107-112.
4. ). 1 : 2500000 / . . . – .: . ,
1996. 5. . /
.: , 2008. 288 . 6.
/ . . . . – : , 2012. – 330 . 7. .
/ . VII . « , , ». –
, 2013. . 206-208. 8. http://icgem.gfz-potsdam.de/ICGEM/
41- . . , 2014 .
174
. )
( . ) – ,
, [3].
. ,
,
.
, . , .
, ,
, . , ,
. , ,
, ,
. ,
, , , .
, ,
. , ,
.
.
. ,
[1].
, ,
( ) ) ( .1),
[4]. ,
. , .
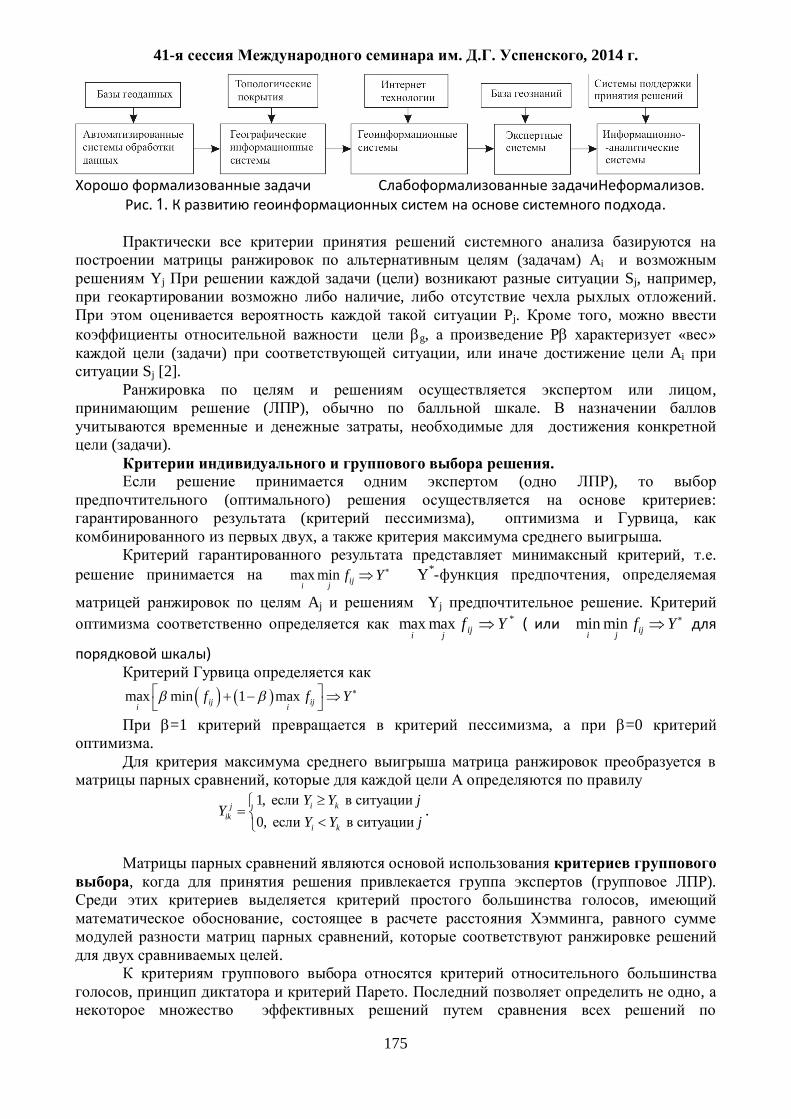
41- . . , 2014 .
175
.
. 1. .
( ) i
Yj ( ) Sj, , , .
Pj. , g, P « »
( ) , Ai Sj [2].
, ( ), .
, ( ).
. ( ),
( ) : ( ), ,
, . , .
max min ijjif Y Y* ,
Aj Yj . *maxmax Yf ijji
( min min iji jf Y
)
max min 1 maxij iji if f Y
=1 , =0 .
,
1, 0,
i kjik
i k
Y Y jY
Y Y j.
, ( ). ,
, , ,
.
, . ,
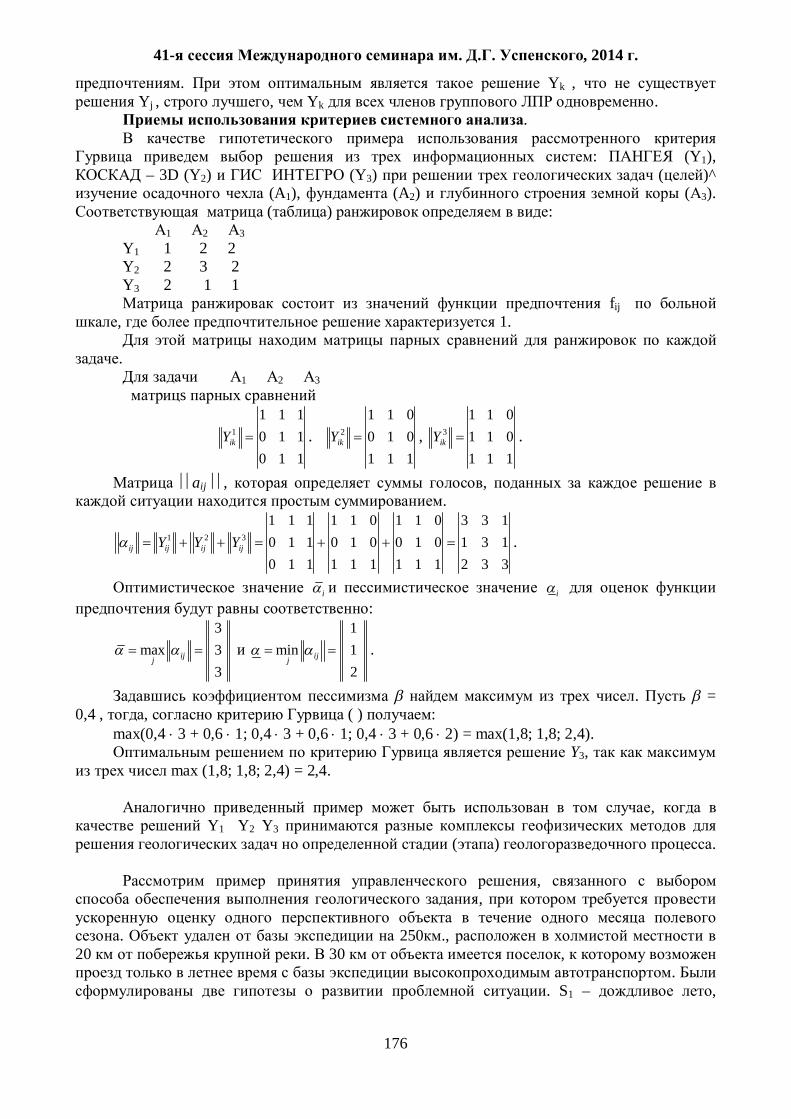
41- . . , 2014 .
176
. Yk , Yj , , Yk .
.
: (Y1), – 3D (Y2) (Y3) ( )^
(A1), (A2) ( 3). ( ) :
1 2 3 Y1 1 2 2 Y2 2 3 2 Y3 2 1 1
fij , 1.
.
1 2 3 s
1
1 1 10 1 10 1 1
ikY . 2
1 1 00 1 01 1 1
ikY , 3
1 1 01 1 01 1 1
ikY .
aij , , .
1 2 3
1 1 1 1 1 0 1 1 0 3 3 10 1 1 0 1 0 0 1 0 1 3 10 1 1 1 1 1 1 1 1 2 3 3
ij ij ij ijY Y Y .
i i :
3 max 3
3ijj
1
min 1 2
ijj.
. = 0,4 , , ( ) :
max(0,4 3 + 0,6 1; 0,4 3 + 0,6 1; 0,4 3 + 0,6 2) = max(1,8; 1,8; 2,4). Y3,
max (1,8; 1,8; 2,4) = 2,4.
, Y1 Y2 Y3
( ) .
, ,
. 250 .,
20 . 30 , .
. S1 – ,
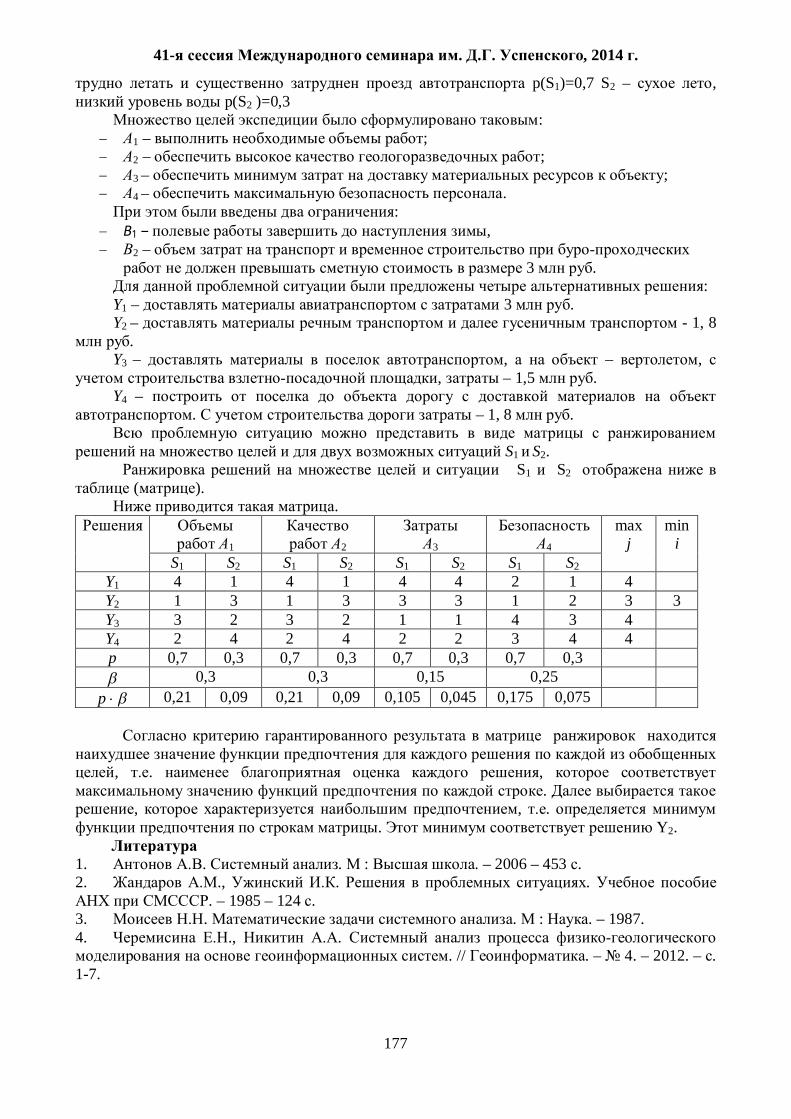
41- . . , 2014 .
177
p(S1)=0,7 S2 – , p(S2 )=0,3
: 1 – ; 2 – ; 3 – ; 4 – .
: 1 – , 2 –
3 . :
Y1 – 3 . Y2 – - 1, 8
. Y3 – , – ,
, – 1,5 . Y4 –
. – 1, 8 .
S1 S2. S1 S2
( ). .
1
2
3
4
max j
min i
S1 S2 S1 S2 S1 S2 S1 S2 Y1 4 1 4 1 4 4 2 1 4 Y2 1 3 1 3 3 3 1 2 3 3 Y3 3 2 3 2 1 1 4 3 4 Y4 2 4 2 4 2 2 3 4 4 p 0,7 0,3 0,7 0,3 0,7 0,3 0,7 0,3
0,3 0,3 0,15 0,25 p 0,21 0,09 0,21 0,09 0,105 0,045 0,175 0,075
, . ,
. , , .
. Y2.
1. . . : . – 2006 – 453 . 2. ., . .
. – 1985 – 124 . 3. . . : . – 1987. 4. ., .
. // . – 4. – 2012. – . 1-7.
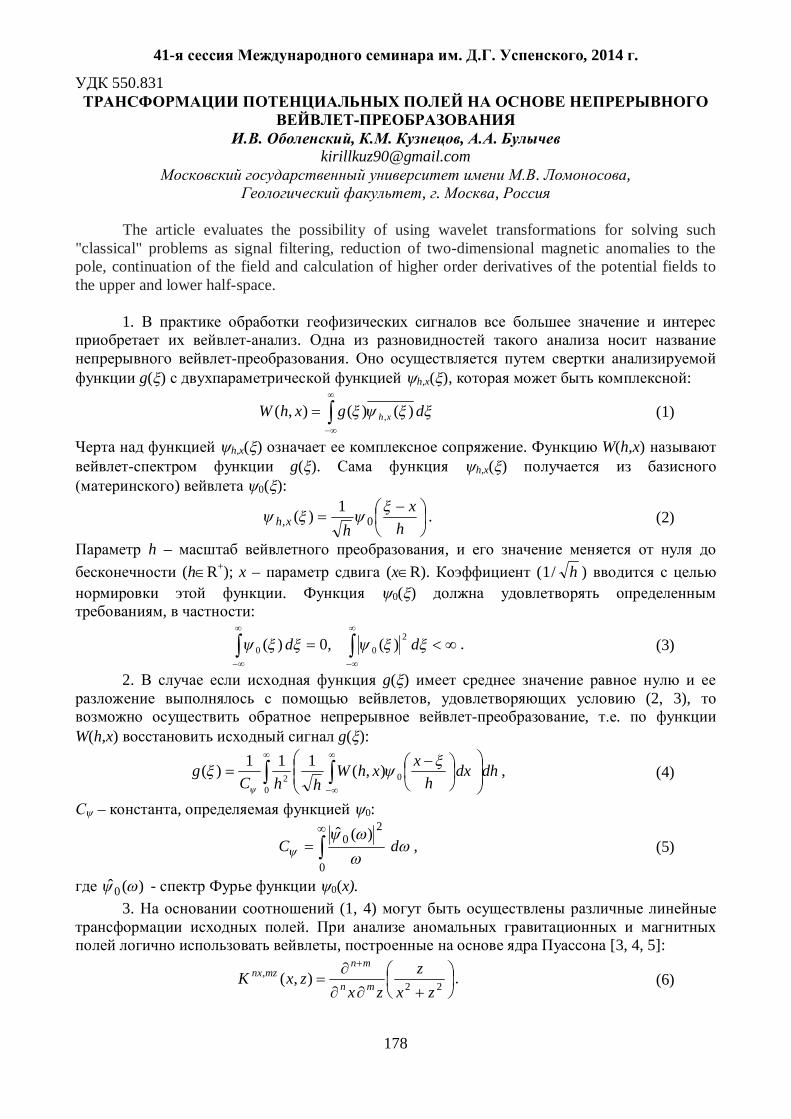
41- . . , 2014 .
178
550.831
. , . , .
, . ,
The article evaluates the possibility of using wavelet transformations for solving such "classical" problems as signal filtering, reduction of two-dimensional magnetic anomalies to the pole, continuation of the field and calculation of higher order derivatives of the potential fields to the upper and lower half-space.
1. .
. g( ) h,x( ), :
dgxhW xh )()(),( , (1)
h,x( ) . W(h,x) g( ). h,x( )
) 0( ):
hx
hxh 0,1)( . (2)
h – , (h R+); x – (x R). ( h/1 )
. 0( ) , :
dd 200 )(,0)( . (3)
2. g( ) , (2, 3),
, . W(h,x) g( ):
002 ),(111)( dhdx
hxxhW
hhCg , (4)
– , 0:
0
20 )(ˆ
dC , (5)
)(ˆ0 - 0(x). 3. (1, 4)
. , [3, 4, 5]:
22, ),(
zxz
zxzxK mn
mnmznx . (6)
41- . . , 2014 .
179
4. (4) W(h,x) g( ),
“ ” , , ,
. 4.1. g(x) .
, . [1], (6) n=0 m=1 , (x,h)
:
),(1),(1),( 22 hxWh
hG
hxG
hx . (7)
, g(x) ,
, . [3, 4].
4.2. g(x) Z(x), W(x,h)
I(x,h) , Z(x):
),(2
1),( xhWhC
hxI . (8)
4.3. C . ,
(6) (5), (N = m+n):
NNNNC 2
22
2)!12(
21
222
212
21 . (9)
5. . Z(x) , oX,
, – . Z(x) 1- :
)(cos)(sin)( ,,,x
xhz
xhxh , (10)
)(,z
xh )(,x
xh - , . W(x,h)
, Z(x). W(x,h) (4) )(,
zxh ,
)(,x
xh , Z (x), X (x). 6. . W(h,x)
(4) g( ), , W(h,x)
. , [2].
7. . .
.
41- . . , 2014 .
180
8. . ,
W(h,x) (x,h) , .
(x,h) ( ) .
, , Vz, ,
Vzzz. 1- .
1. ., . . // .
. . 1981. 10. .25–44. 2. ., .
( ). . « ». 2010. 114 . 3. ., .
. // . 2011. 3. . 48-56. 4. ., . -
. // . 2011. .12. 3. . 5-21.
5. ., . “ ” : . // . . . 2005. 4.
.88–96.

41- . . , 2014 .
181
550.837
. , . , .
. , . ,
Abstract: A neural network algorithm for solving the inverse problem has been tested on numerous examples of two-dimensional model. Algorithm testing was performed on the field data on geoelectric field work method of magnetotelluric sounding in the Krasnodar region on the north-south profile Novorossiysk-Slavyansk Elizavetovca (regional profile 3 Kuban) in the area of the West Kuban marginal basin (according to I.S.Feldman).
( . . 1), ,
: , .
. 1. ( . , 1989).
- ; - , 1989 ; - , 1977 ; -
, 1995. : A- - ; – ; – ; - -
; –

41- . . , 2014 .
182
: 1) ), 2) ,
, 3) (
) . 3 -
[1-2]. [3]
. 1
K .
1K .
,
, . , 1
K , ,
.
11-07-00662, 13-05-
01135. -6000IM .
1. ., ., . //
40- . . . , , 28 – 1 2013. . 376-379. 2. ., ., ., .
// . , , 2013. 4. C. 46-52.
3. . . . … . .- . . : ,
2013. 155 .

41- . . , 2014 .
183
550.8.05(571.1)
. , .
[email protected] « », . ,
Abstract. The paper describes the methodology and some results of the quantitative
analysis of the manifestations of the structural-tectonic cover of the West Siberian geosyneclise in geopotential fields.
-
, , , -
[1],
. .
( . , 1964) , -1500
( ) « » ( – ). :
1. ( 2 ) ,
. 2.
, « », « » « » [2]. 3. , 1,
: , . “COSCAD 3Dt”
[3]. ( ) 7, 13, 25, 51, 75, 101 201.
, , 100 .
. ,
, .
. -1500 « », -3000
, , -4500 « ».
,
: « », « », « » « » . « »
) ) .
.
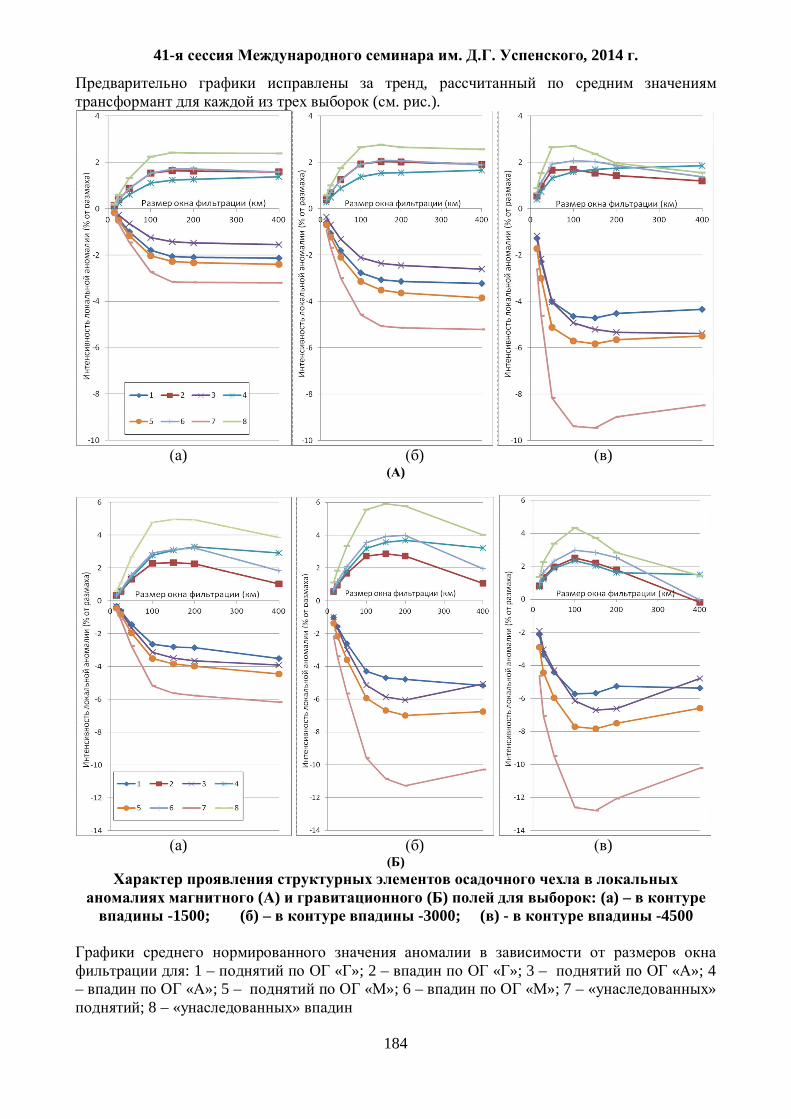
41- . . , 2014 .
184
, ( . .).
) ) )
)
) ) )
)
( ) ( ) : ( ) – -1500; ( ) – -3000; ( ) - -4500
: 1 – « »; 2 – « »; 3 – « »; 4 – « »; 5 – « »; 6 – « »; 7 – « »
; 8 – « »
41- . . , 2014 .
185
: 1.
: ;
2. ( ) 1.5 – 2
, ; 3. 1.5 – 3 ,
, ; 4. (
) , .
, – ;
5. « » ;
, ,
. , -1500
. « 1»,
, 3 : , .
.
. ,
, , ,
, -2,5 – -3%.
-4% -2,3%.
) , : -7% -2,7% .
.
1. . .
// , 1964 ., 9 2. . ( . ) « ,
, », 2007
3. http://www.coscad3d.com/
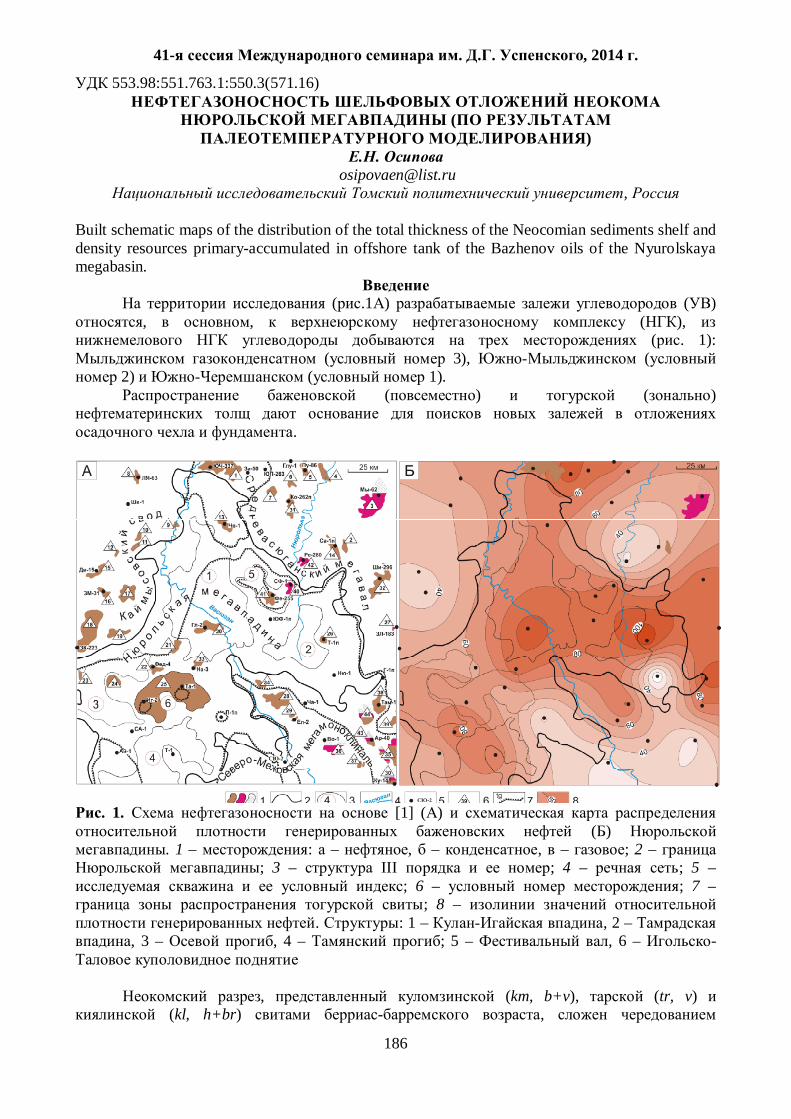
41- . . , 2014 .
186
553.98:551.763.1:550.3(571.16)
( )
, Built schematic maps of the distribution of the total thickness of the Neocomian sediments shelf and density resources primary-accumulated in offshore tank of the Bazhenov oils of the Nyurolskaya megabasin.
( .1 ) ( )
, , ( ), ( . 1):
( 3), ( 2) ( 1).
( ) ( )
.
. 1. [1] ( )
( ) . 1 – : – , – , – ; 2 –
; 3 – III ; 4 – ; 5 – ; 6 – ; 7 –
; 8 – . : 1 – , 2 –
, 3 – , 4 – ; 5 – , 6 – -
, (km, b+v), (tr, v)
(kl, h+br) ,
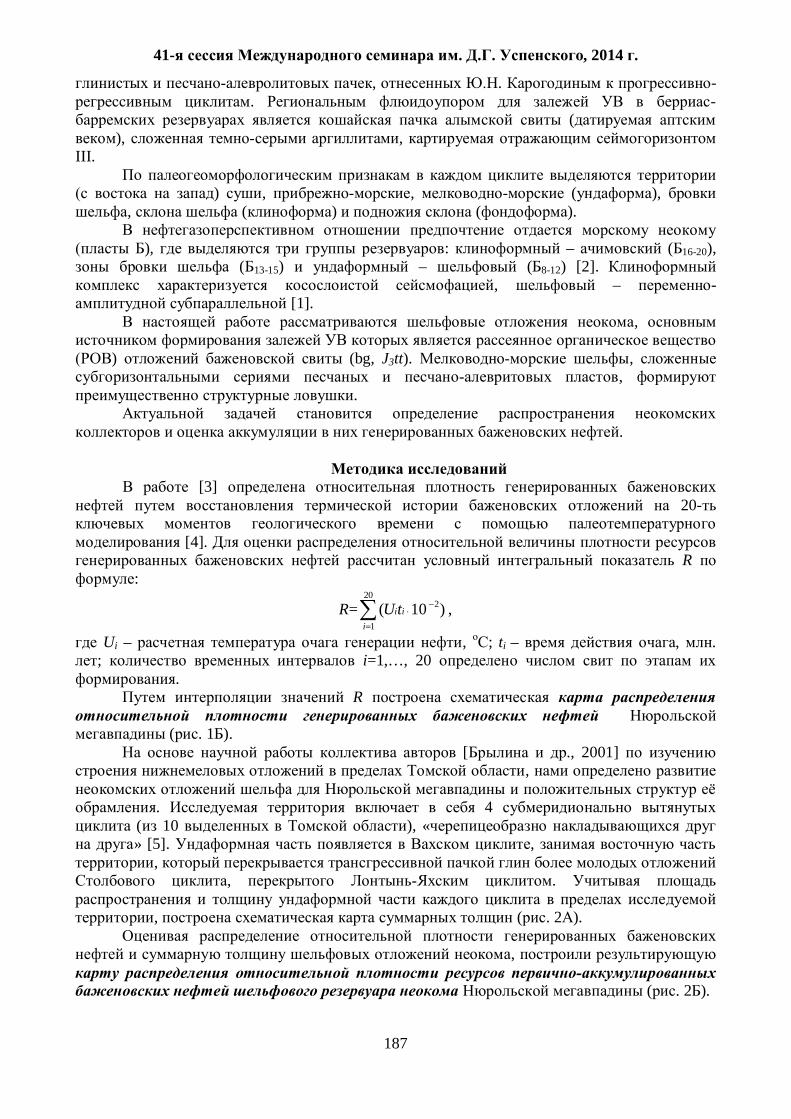
41- . . , 2014 .
187
, . -. -
( ), ,
III.
) , , ( ), , ( ) ( ).
), : – ( 16-20),
( 13-15) – ( 8-12) [2]. , – -
[1]. ,
) (bg, J3tt). ,
, .
.
[3] 20-
[4].
R :
R=20
1
2)10(i
iitU ,
Ui – , ; ti – , . ; i=1,…, 20
. R
( . 1 ).
[ ., 2001] ,
. 4
( 10 ), « » [5]. ,
, , .
, ( . 2 ).
,
( . 2 ).
41- . . , 2014 .
188
. 2.
( ) ( ) ; 1 – , , 2 –
( .). . , . 1
: , ,
.
1. .
. – : , 2002. – 253 . 2. ., ., .
( ). - : , 2006. – 291 .
3. . ) // ,
, , . . . . – : , 2013.
– . 214-216. 4. .
. – : , 2010. – 172 . 5. ., ., ., .
( ) // , . 1. – :
», 2000. – . 231-233.
41- . . , 2014 .
189
550.830
. 1,2, . 1, . 1,2, . 1,2
[email protected] 1 , 2 «
», . , Wide set of geophysical surveys was provided within Obolon area and joint geophysical
data interpretation was held using Technology of Integral Geological and Geophysical Data Interpretation for Oil and Gas Exploration and Production. As a result the deep subsurface structure of the area was studied in detail. Areas of enhanced reservoirs were mapped in basement and sedimentary rocks which were used together with geochemical survey to locate probable hydrocarbon deposits.
– – ,
, , , , . ,
, , .
. , [1] 50 % ,
. .
, .
[2].
, .
«
» [3]. ,
,
, 3D , , ,
. 3D
. ,
, ,
, ,
.

41- . . , 2014 .
190
1 –
-
- 3D
-
- ,
- , 3D
- ( ),
-
, , :
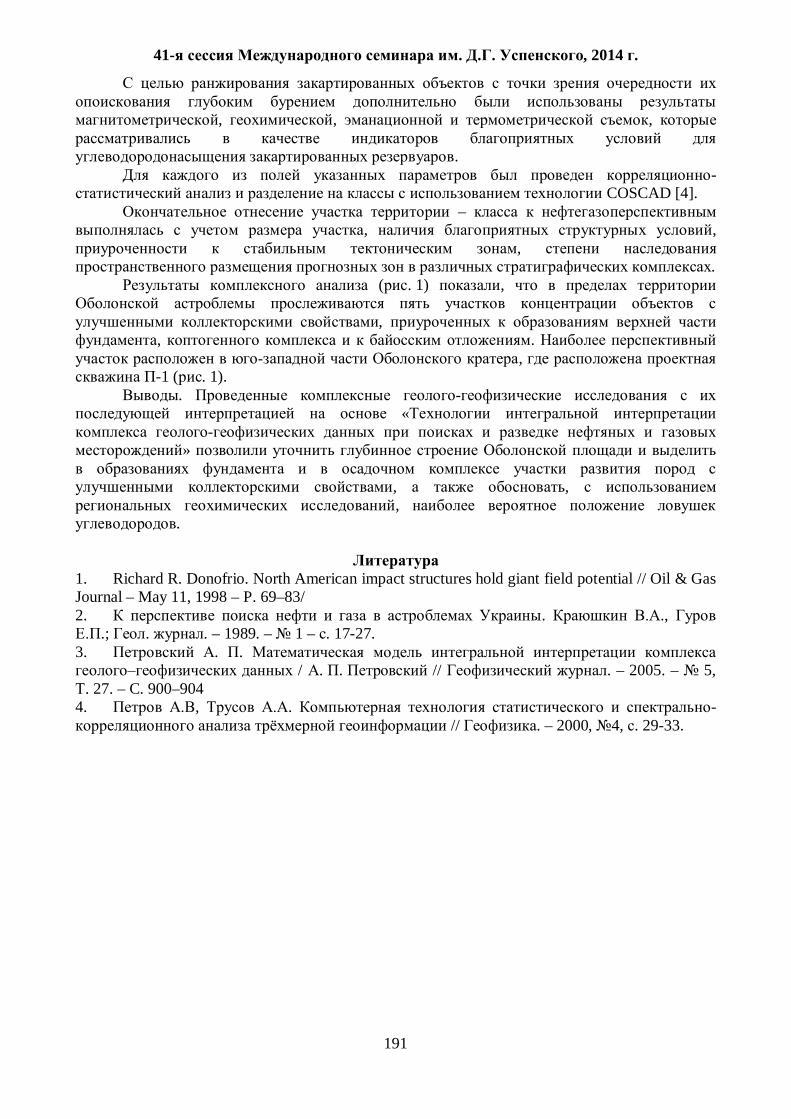
41- . . , 2014 .
191
, , ,
. -
COSCAD [4]. –
, , ,
. ( . 1) ,
,
, . ,
-1 ( . 1). .
«
»
, , ,
.
1. Richard R. Donofrio. North American impact structures hold giant field potential // Oil & Gas Journal – May 11, 1998 – P. 69–83/ 2. . .,
.; . . – 1989. – 1 – . 17-27. 3. . .
/ . . // . – 2005. – 5, . 27. – C. 900–904
4. , . - // . – 2000, 4, . 29-33.

41- . . , 2014 .
192
550 (831.23 + 838 + 837,8) -
. 1, . 2, . 1
[email protected], [email protected] 1 - , 2 - « », ,
. 1960-1980 , . , .
, . , . , . , .
. ,
, ,
, .
.
, , ,
.
( ) . ( ) ,
, .
,
, , , .
[1,2,3,4]. .
, .
, ( , )
, .
, .
6-10 . , 1 8-10 .
. . ,
.
, , .
41- . . , 2014 .
193
,
. , ,
, . ,
, 2,0-2,2 3.
, , .
. ,
, ( . 1).
( . 1 ).
, ( . 1 ).
, ( . ). , ,
, .
, , . , ,
. , ,
.
2D 3D [1,2,3,4].
, , , .
.
. .
, .
,
, . ,
.
, .
,
,
.

41- . . , 2014 .
194
. 1. : – ; – ; –
.
1. ., ., ., ., .
// : . – 3. – :
, 2002. – 167 . 2. ., ., ., .
// . 2005. – 12. – .57-62.
3. ., . //
: , , // . , 2013. – .85-87.

41- . . , 2014 .
195
551.24
. , .
[email protected] , , ,
Abstract
A map of the Moho izoglubin eastern part of the Kyrgyz Tien Shan scale 1:1 000 000, based on data interpretation of gravity ( g field in the Bouguer reduction. It is shown that the surface of the eastern part of the Moho Kyrgyz Tien Shan tectonic forms a deep trough type extensive syncline, bounded on all sides of ledges, which geographically confined pockets of strong earthquakes occurred.
, ,
, .
, , , ,
. ,
1-3 . , ,
. , , -
.
, ( g) .
) 4,5 . , ,
, .
,
. . , , ,
1, 6 . . 1. . 1 ,
. ( . 1)
1:000 000, 40,0 -43,50 N, = 75,0 -81,0 1: 1 000 000 ( . 2). ( .
2) , (
20 , -67 ) , . 12 ./
1.5 ./ . .
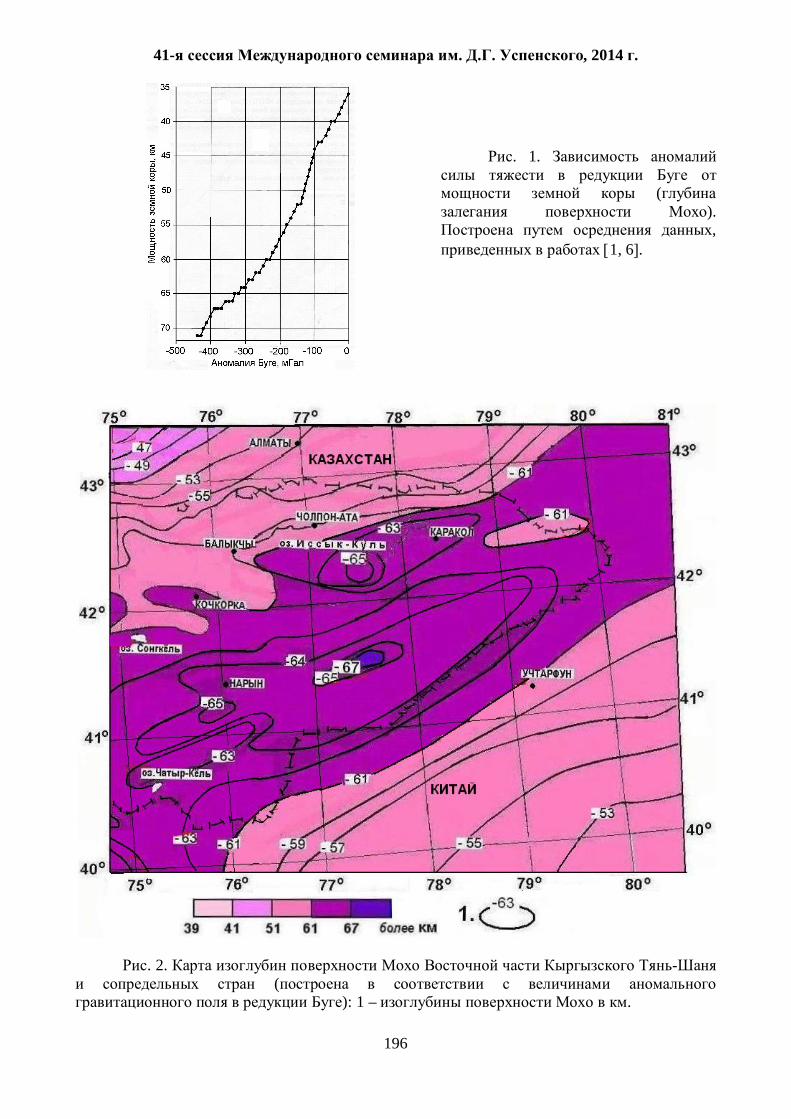
41- . . , 2014 .
196
. 1.
(
). ,
1, 6 .
. 2. (
): 1 – .
41- . . , 2014 .
197
, . ,
, , . ,
, , ,
41,330-42,670 N, 76,000-80,000 , , ,
.
1. . C
. .: . 1981. 432 . 2. . ., ., . .
. . / . . .: . 1977. . 37-54.
3. . . : . 1989. 174 .
4. . . .: . 1975. 216 . 5. / . . .: . 1957. 164 . 6. . . . 1967. 672 .
41- . . , 2014 .
198
550.3:552.08:552.4
. , .
[email protected], [email protected]
, ,
Physical properties of polymetamorphic rocks in the north of the Urals have been studied and analyzed. Certain regularities of distribution of density and magnetic susceptibility of rocks in the sections of similar polymetamorphic assemblages have been revealed. In the result of petrophysical investigations, aimed to find additional diagnostic characters in the polymetamorphic rocks in the north of the Urals, three different types of petrophysical sections have been revealed – strongly, medium and weakly differentiated. These types of sections differ from each other vertically and laterally by the petrophysical properties of rocks.
, ,
, . , (
) .
, [7, 8].
, , .
, , , .
, ,
. :
2.68–3.26 3 2.92 3 ; 2.64–3.15 3 2.87 3 ; 2.67–2.90 3 2.82 3 -
. : 2.62–2.68 3 2.64 3 ; 2.62–2.81 3
2.69 3 ; 2.61–2.79 2 2.7 3.
2.82-2.92 3 ,
2.64-2.79 3. . , ,
, æ .
.
.
) 2.97 3, ( ) – 2.83 3.
2.61 3.
41- . . , 2014 .
199
24×10-6 , 140 ×10-6 .
, .
( ,
) ( ) , . :
. ,
. : 3.32
3 , 2.99 3 , 2.94 3 , ; ;
; 2.73 3 ; 2.72 3 .
. ,
107 450×10-6 . 107×10-6 .
. æ
796×10-6 , – 320×10-6 .
. ,
, , . ,
, , , . .
. “ ”, – “ ” [4].
: – 3.14 3 æ – 2476×10-6 ; – 3.03 3 æ – 43×10-6 ; – 2.79 3 ; – 2.65 3 æ
– 3×10⁻⁶ ; – 2.85 3 æ – 5×10⁻⁶ ; – 2.7 3 æ – 16×10-6 .
, ( )
( ) . [7]
, : . ( ) . ( ).
. . . -
, ,
. 2.99 3
2.87 3 . .
41- . . , 2014 .
200
50×10-6 . (26–31×10-6 ) .
, . . . [6] -
, -,
( ). (
) .
.
3.12 3 2.97 3
. ,
2535×10-6–3825×10-6 . .
: -, - . ,
( ).
. ,
. -
( ). ,
, , .
, , ,
( ) .
- ( ).
– 2.94–3.12 3. .
. , ( , 7.0 . %)
. ,
, ,
.
41- . . , 2014 .
201
1. ., . .
. : , 1983. 301 .
2. . ., . . : , 2008. 114 .
3. ., . . .: , 1994. 112 .
4. . . , 1984. . 21–42.
5. ( ) . . : . . … . .- . . , 1997. 16 .
6. ( ) / . . , . . , . . . .: , 1977.
218 . 7. . . . .: , 1994. 112 . 8. ., . .
: , 2002. 168 . 9. ( , ). , 1993.
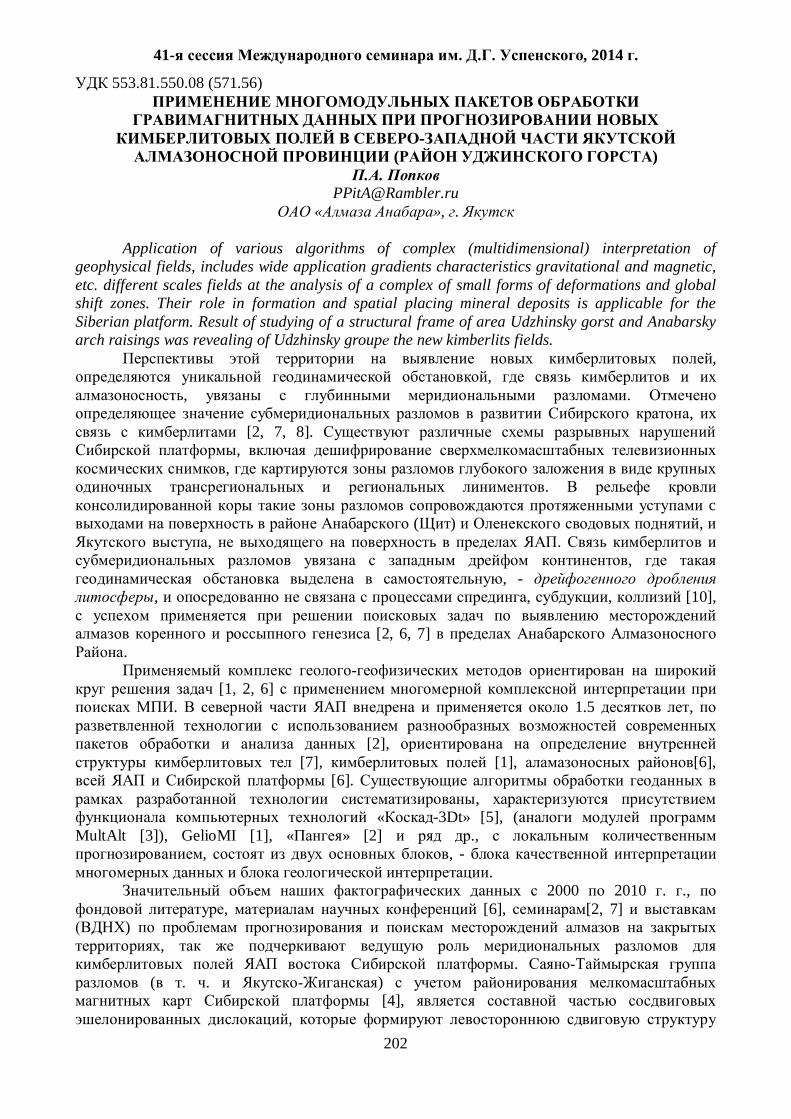
41- . . , 2014 .
202
553.81.550.08 (571.56)
( ) .
[email protected] « », .
Application of various algorithms of complex (multidimensional) interpretation of
geophysical fields, includes wide application gradients characteristics gravitational and magnetic, etc. different scales fields at the analysis of a complex of small forms of deformations and global shift zones. Their role in formation and spatial placing mineral deposits is applicable for the Siberian platform. Result of studying of a structural frame of area Udzhinsky gorst and Anabarsky arch raisings was revealing of Udzhinsky group the new kimberlits fields.
, ,
, . ,
[2, 7, 8]. ,
, .
c ( ) ,
, . ,
, - , , , [10],
[2, 6, 7]
.
[1, 2, 6] . 1.5 ,
[2],
[7], [1], [6], [6].
, « -3Dt» [5], (
MultAlt [3]), GelioMI [1], « » [2] ., , , -
. 2000 2010 . .,
, [6], [2, 7] )
, .
( . . ) [4],
,
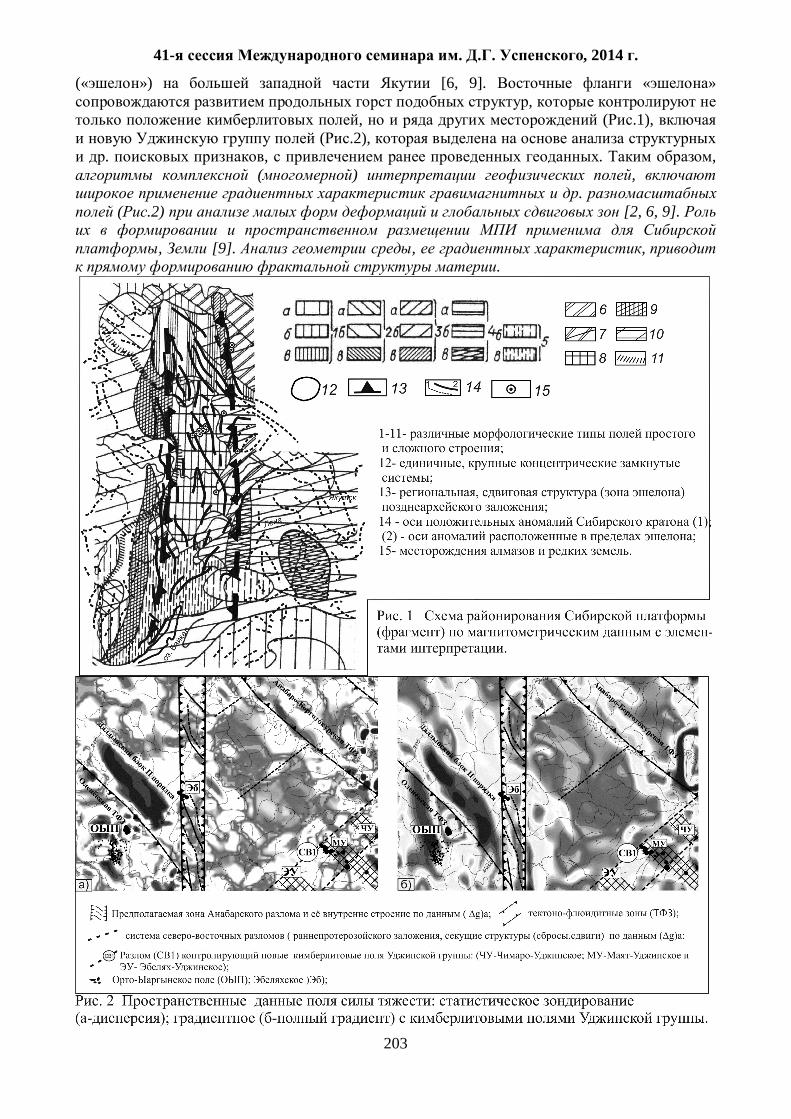
41- . . , 2014 .
203
(« ») [6, 9]. « » ,
, ( .1), ( .2),
. , . , ( ) ,
. ( .2) [2, 6, 9].
, [9]. , ,
.
41- . . , 2014 .
204
, ( )
, , .
. , -10,
25, , ,
, . - ( . 2) ,
, , , . ,
, .
1. ., . ., .
GelioSMI ( ) // 38- . .
.- : . - 2011. – . 88-91. 2. ., ., . -
// 38-
. . . - : . - 2011. – . 114-117. 3. . //
, « ». - . - 2011.- .164. 4. ., ., .
, 1:10000000. .: , 1978. 5. ., . -
// . – 2000. - 4. - . 29-33. 6. ., .
-.
// , 40- « ». –
: .- 2008. - . 387-396. 7. ., .
. // 40- . .
.- : . - 2013. – . 274-278. 8. , ., . : , .
« », ( ) . .: , 2006.-212 . 9. . .
. . « ». , 1980, 144 10. . . .
, ( ). : « ». 2008. 352 .
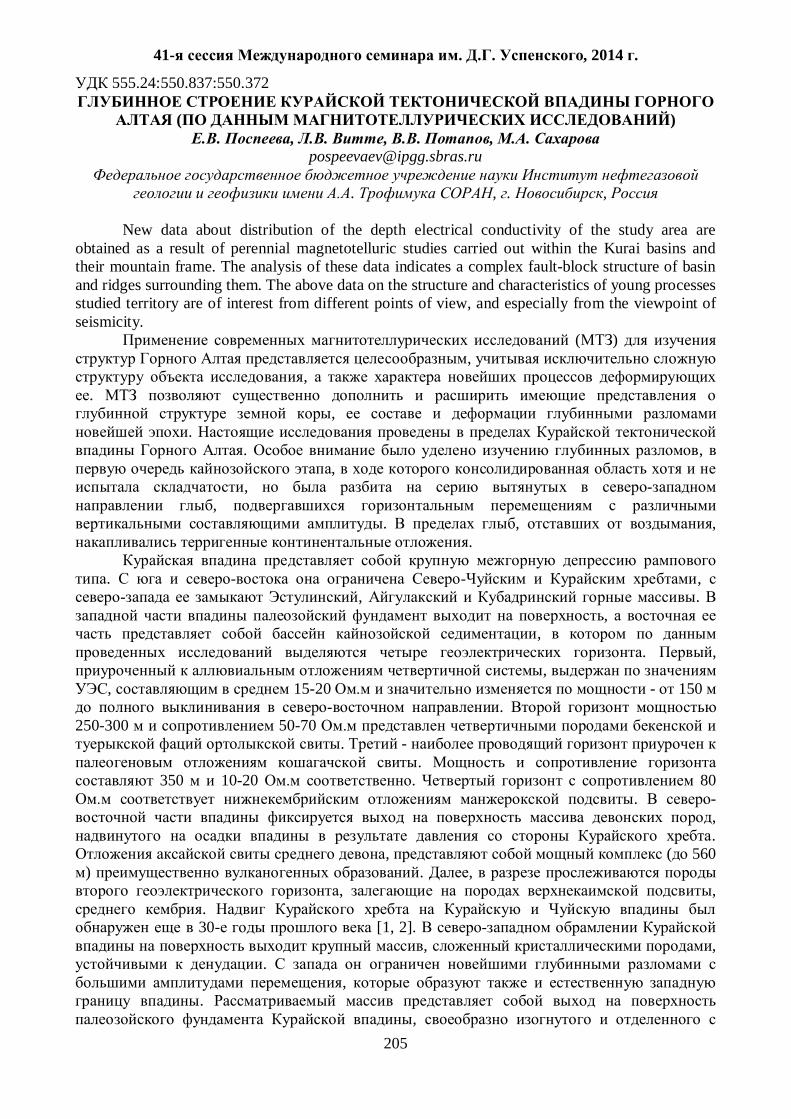
41- . . , 2014 .
205
555.24:550.837:550.372
( ) . , . , . , .
. , . , New data about distribution of the depth electrical conductivity of the study area are
obtained as a result of perennial magnetotelluric studies carried out within the Kurai basins and their mountain frame. The analysis of these data indicates a complex fault-block structure of basin and ridges surrounding them. The above data on the structure and characteristics of young processes studied territory are of interest from different points of view, and especially from the viewpoint of seismicity.
( ) ,
, .
, .
. , ,
, ,
. , , .
. ,
, . ,
, . ,
, , 15-20 - 150
. 250-300 50-70
. - .
350 10-20 . 80 . -
, .
, ( 560 ) . ,
, , .
30- [1, 2]. , ,
. ,
. ,

41- . . , 2014 .
206
.
( 1500 ), ( .1).
1: .
. .
, .
[3]. « » « » . « »
; « » , -
. ,
» ( .2).
. 2: 10 : 1 - , 2 – .
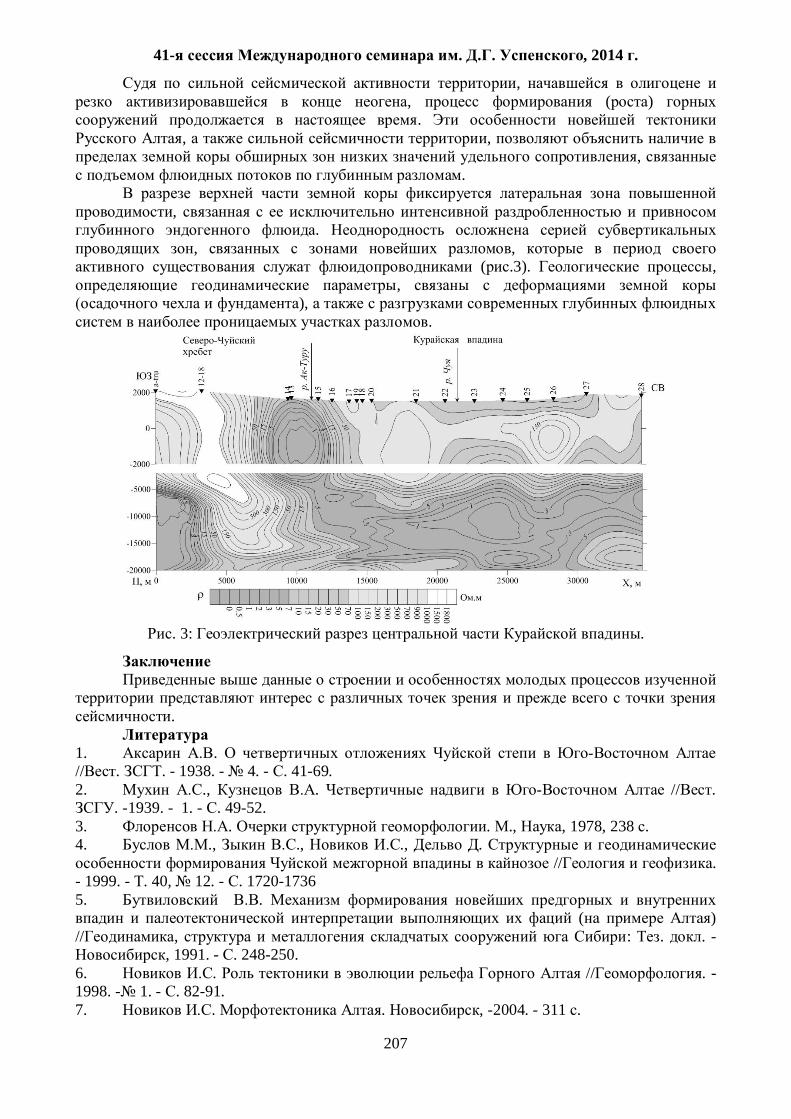
41- . . , 2014 .
207
, , ( )
. , ,
, .
,
. , ,
( .3). , ,
), .
. 3: .
.
1. . // . . - 1938. - 4. - . 41-69. 2. ., . // .
. -1939. - 1. - . 49-52. 3. . . ., , 1978, 238 . 4. ., ., ., .
// . - 1999. - . 40, 12. - . 1720-1736 5. .
( ) // , : . . -
, 1991. - . 248-250. 6. . // . - 1998. - 1. - . 82-91. 7. . . , -2004. - 311 .
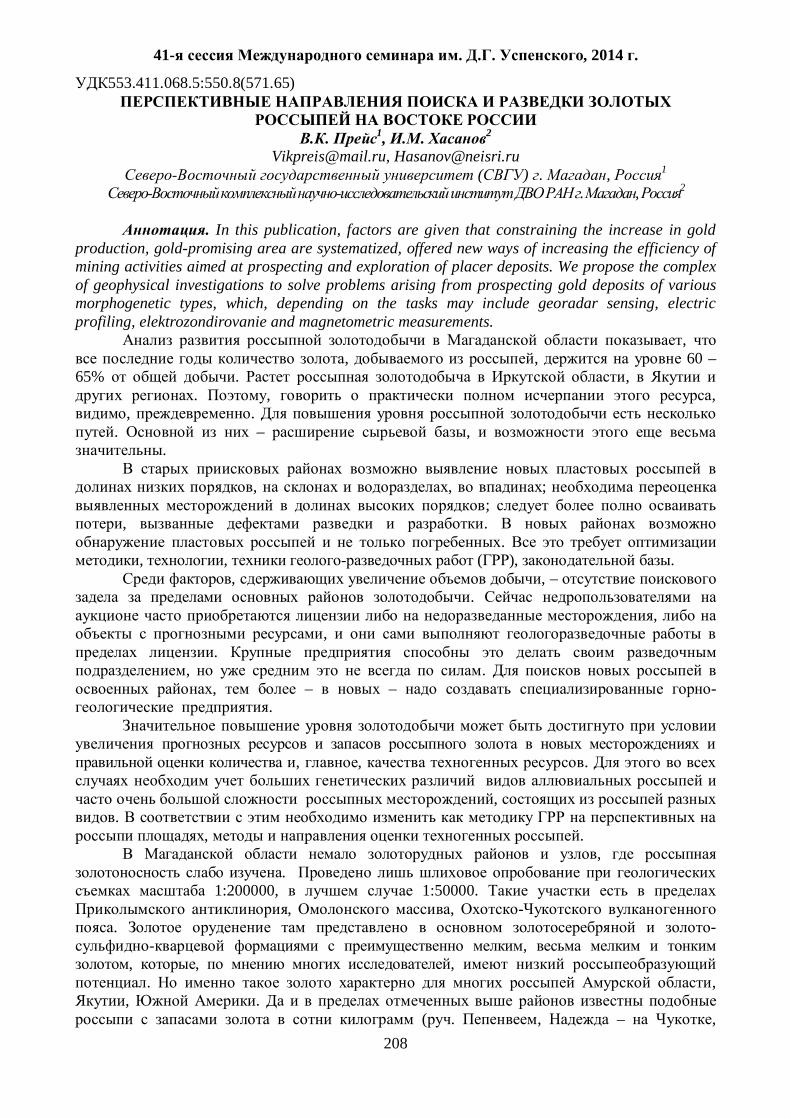
41- . . , 2014 .
208
553.411.068.5:550.8(571.65)
. 1, . 2
[email protected], [email protected] ( ) . , 1
. , 2
. In this publication, factors are given that constraining the increase in gold production, gold-promising area are systematized, offered new ways of increasing the efficiency of mining activities aimed at prospecting and exploration of placer deposits. We propose the complex of geophysical investigations to solve problems arising from prospecting gold deposits of various morphogenetic types, which, depending on the tasks may include georadar sensing, electric profiling, elektrozondirovanie and magnetometric measurements.
, , , 60 –
65% . , . , ,
, . . – ,
.
, , ; ;
, . .
, , ( ), . , , –
. ,
, .
, . , – – -
.
, , .
, .
, . ,
. 1:200000, 1:50000.
, , . -
, , , ,
. , , .
( . , – ,

41- . . , 2014 .
209
– , – ). ( ) :
1) ;
2) , ;
3) , , .
30 .
. .
2: – 500 ,
– 3 000 .
, . ,
. , ( )
.
, – . , .
, . .
,
. .
.
: - ,
; - ,
; - ,
, « » ; - ; - , , ,
; - .
,
, , [1].
,
.

41- . . , 2014 .
210
, ,
. .
,
, , .
« ».
( ): , ., .
( ) .
, ( , , ,
) . -
( ) ( , ) , ,
.
.
MMPOS-2. 170 300 .
, : 170 300 , .
,
,
( . 1). .
. 1 – 2 ( ).
30 , . ,
. , , . -
. ,
( , ) .
, . .
.
, .

41- . . , 2014 .
211
,
, .
.1. ( , ).
12-II- -08-025 2012-
2014 . « , , »,
01201365820 .
1. . / . , . // . . . .
. . . – : , 2013. – . 310-311.

41- . . , 2014 .
212
550.8
. 1, 2, . 1
1 , , , 2 , ,
A number of failures on mines of the Verkhnekamsky potassium deposit, which include
the flooding of the mines, led to a fresh look at the problem of geophysical safety of a Deposit development. The method of ground-underground gravimetry for the detection of weak points of the protective layer over the mines are developed, examples of its application are presented. It is shown that the modern methods of processing and interpretation of ground-underground gravity data significantly increase the information value of geophysical research and allow to successfully identify zones of increased danger of the development of productive layers.
) 1986 . , .
( ) , .
. –
, , ,
. , ( ).
, , ,
. – .
– , , .
– , : .
,
( ) , , ,
, , . 1950-1970 [1], .
g
- , – VECTOR.
( ) , , , .
( ) ( ) [2].
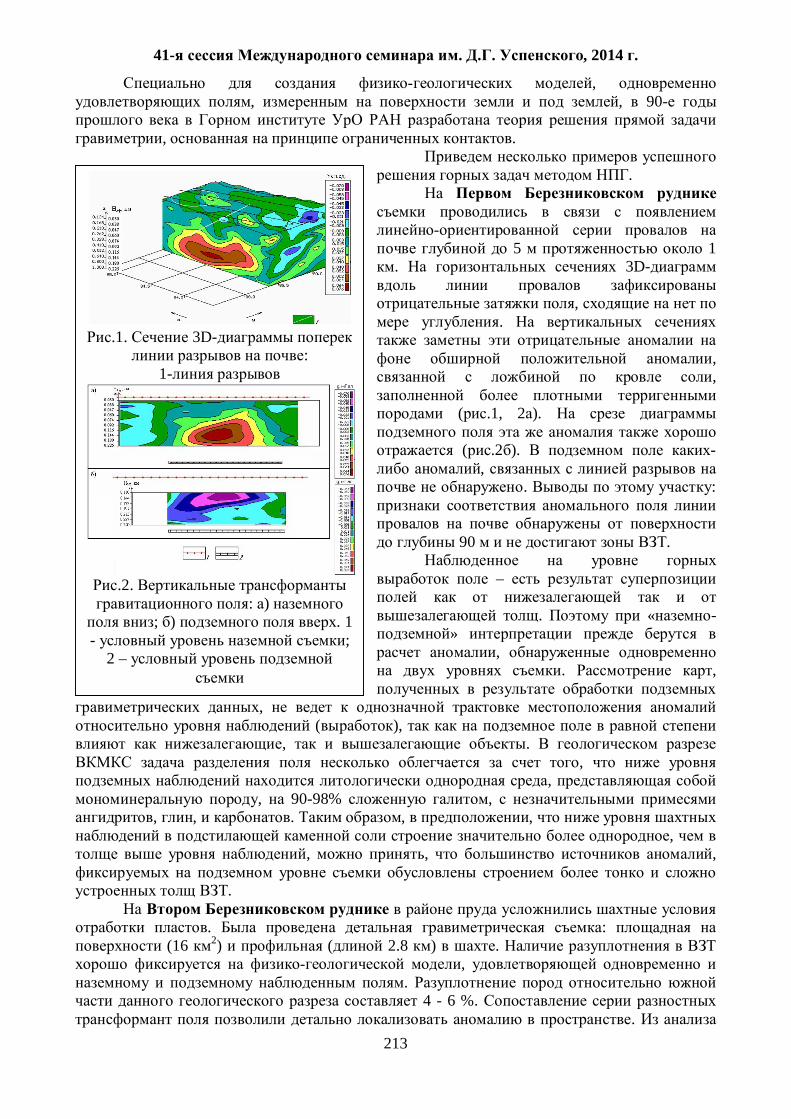
41- . . , 2014 .
213
, , , 90-
, .
.
5 1 . 3D-
,
. , ,
( .1, 2 ).
( .2 ). -,
. :
90 .
–
. « -»
, . ,
,
( ), , .
, ,
, 90-98% , , , . , ,
, , , ,
.
. :
(16 2) ( 2.8 ) . ,
. 4 - 6 %.
.
.1. 3D-
: 1-
.2.
: ) ; ) . 1
- ; 2 –
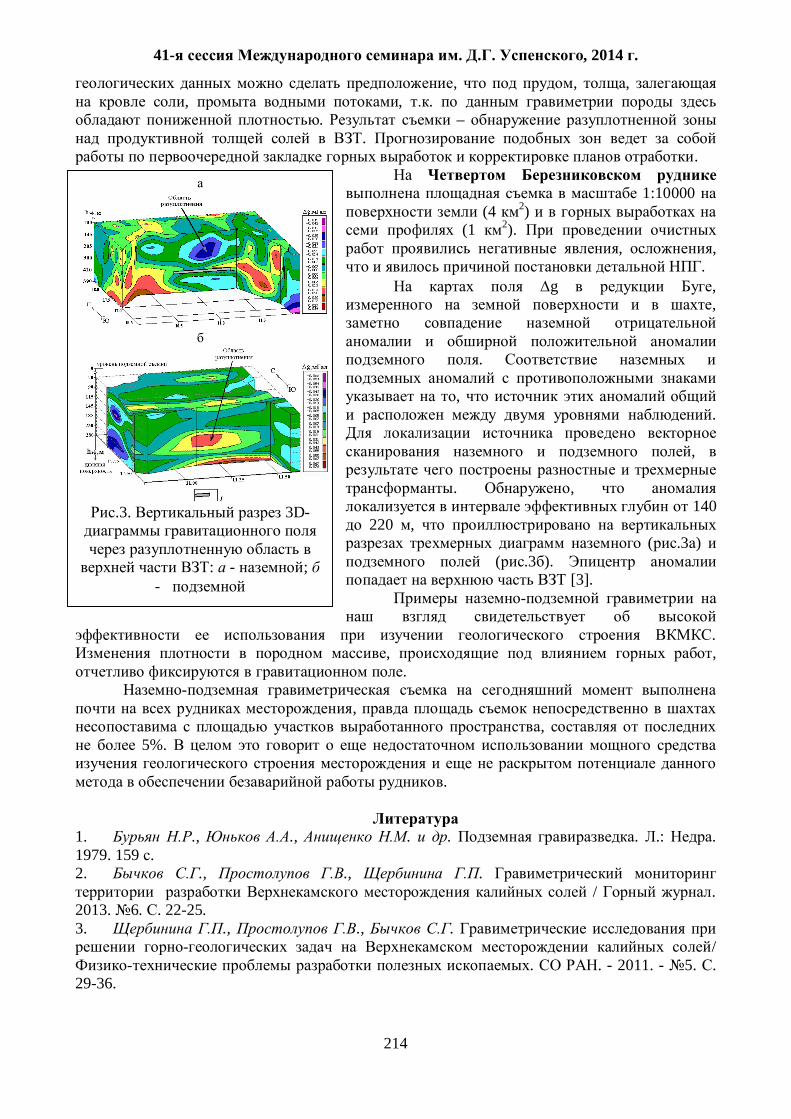
41- . . , 2014 .
214
, , , , , .
. – .
.
1:10000 (4 2)
(1 2). , ,
. g ,
,
.
, .
,
. , 140
220 , ( .3 )
( .3 ). [3].
. , ,
.
, ,
5%.
.
1. ., ., . . . .: . 1979. 159 . 2. ., ., .
/ . 2013. 6. . 22-25. 3. ., ., .
/ . . - 2011. - 5. .
29-36.
.3. 3D-
: - ; -

41- . . , 2014 .
215
550.8.013 :
,
, ,
The problem of the reminder integral is considered. This question comes from differences between the theoretical and the practical problem definition on the approximation of geopotential fields by harmonic potential functions.
1967 [1], 1960- ,
. ,
[2], , [3].
T ,
: « ( )
, S g ? ,
, , S ( , S)
?» , ,
. , ,
. S , U, ,
S. , .
. S, ,
S . ,
, , . [1] ,
, , , , .
, .
, , , , , . ,
, [5]. ,
, , .
[6].
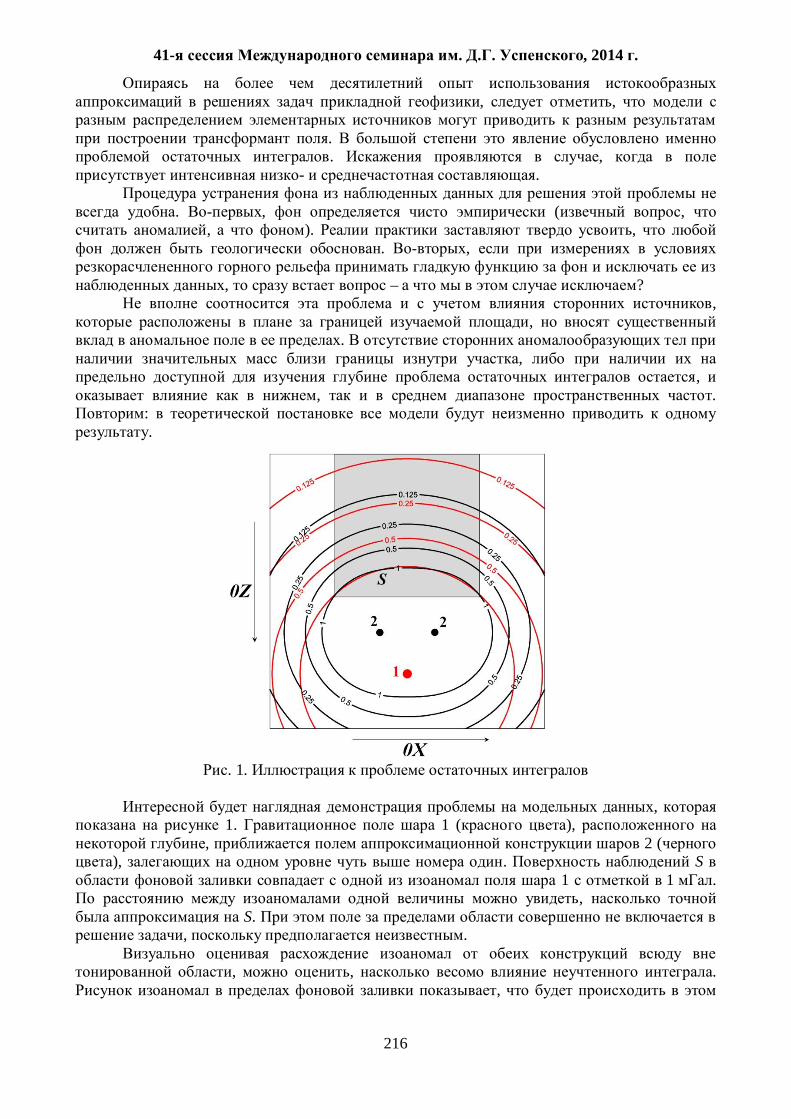
41- . . , 2014 .
216
, ,
. . ,
- .
. , ( , , ). ,
. ,
, – ? ,
, .
, ,
, . : .
. 1.
,
1. 1 ( ), , 2 (
), . S 1 1 .
, S.
, .
, , . ,
41- . . , 2014 .
217
.
, ,
.
, . ,
( ) , ,
. , ,
, ,
.
. , , .
(
) ,
.
. .
, 12- -5-1012.
: 1. .
. – .: , 1990. - 301 . 2. .
. – .: , 1987. 336 . 3. . . // .
. – 1945. – . 42. 4. .
. // . . . . . – 1948. - 3. 5. .
. – : , 1975. – 94 . 6. . . – :
, 2010. – 463 .
41- . . , 2014 .
218
550.8.013 :
“ ” . , . , .
, , We will present at the conference the results of hypothesis checking about the construction of the analytical approximation of the geopotential fields by the random throw of the point mass in 3D grid equivalent model. The algorithm needed for that is described below.
.
(1967) ( (1968)).
[1].
: ( ) ,
, . , ,
, . ,
. [1]: « ,
, . ,
– S', S S' .
– , .
». ,
, [1]. ,
.
. .
, 1976
[1]. ( )
,
, .
, , [2].
. . , , ,
, .
41- . . , 2014 .
219
, ,
, [3].
- . , .
, .
. N , .
. ,
, . S .
S : . - , n .
, . .
.
n j ,
, –
, . ,
. n
, , .
. , -
. , , ,
, , .
, , S
, . ,
.
: , ,
, ,
, . ,
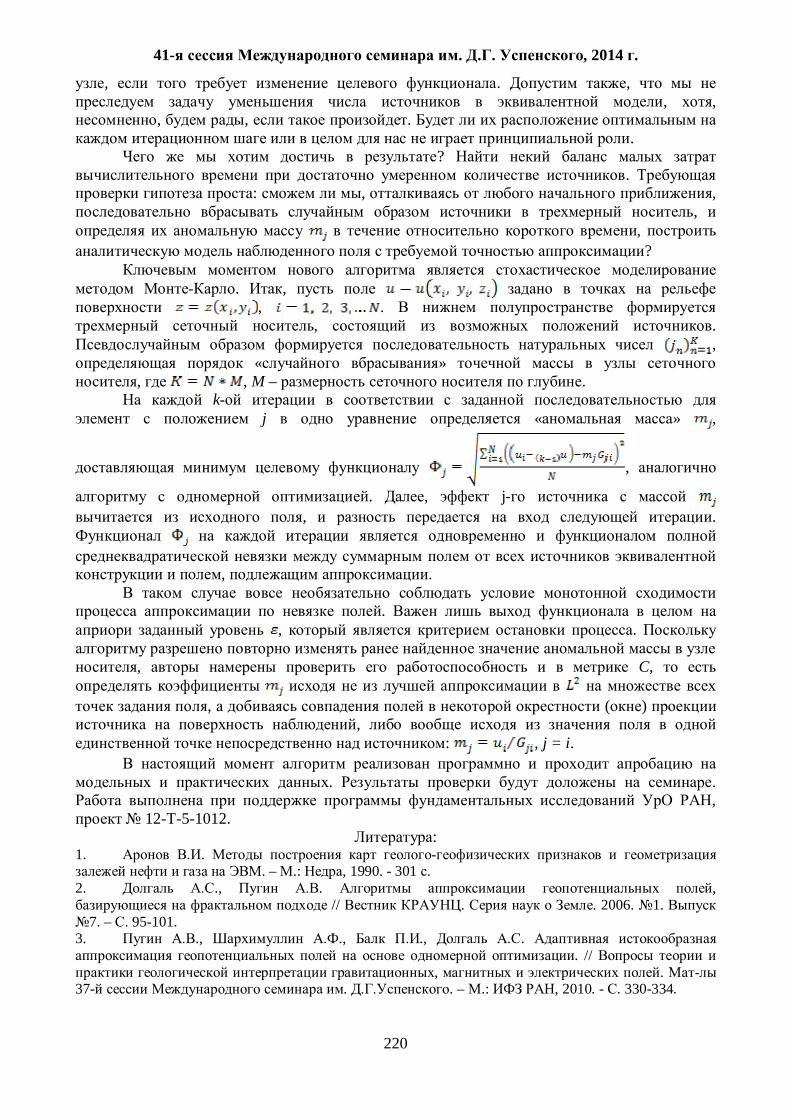
41- . . , 2014 .
220
, . , , ,
, , . .
? .
: , , ,
, ?
. ,
, . , .
, « »
, , M – . k
j « » ,
,
. , j- , .
, .
. , .
, C,
, ( )
, : , j = i.
. .
, 12- -5-1012.
: 1. .
. – .: , 1990. - 301 . 2. ., . ,
// . . 2006. 1. 7. – . 95-101.
3. ., ., ., . . //
, . 37- . . – .: , 2010. - . 330-334.
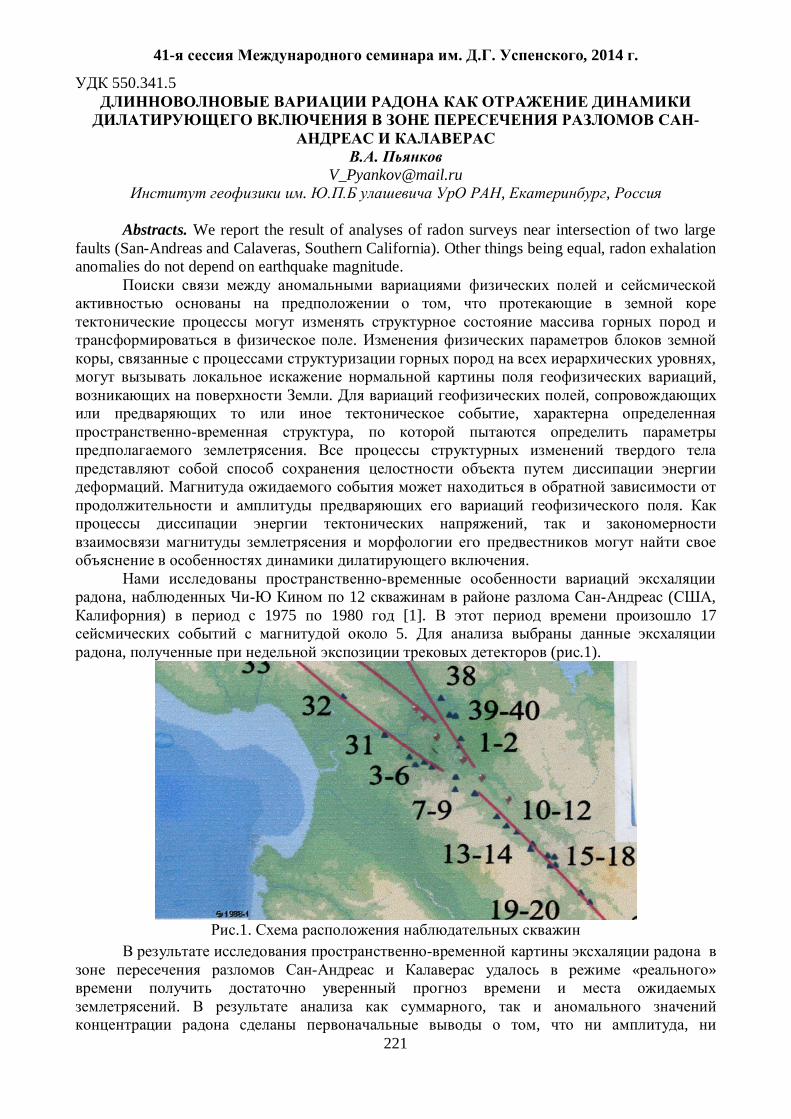
41- . . , 2014 .
221
550.341.5 -
.
[email protected] . , ,
Abstracts. We report the result of analyses of radon surveys near intersection of two large
faults (San-Andreas and Calaveras, Southern California). Other things being equal, radon exhalation anomalies do not depend on earthquake magnitude.
,
.
, , ,
. , ,
, .
.
. ,
.
, 12 ( ,
) 1975 1980 [1]. 17 5.
, ( .1).
.1.
« »
. ,
, ,
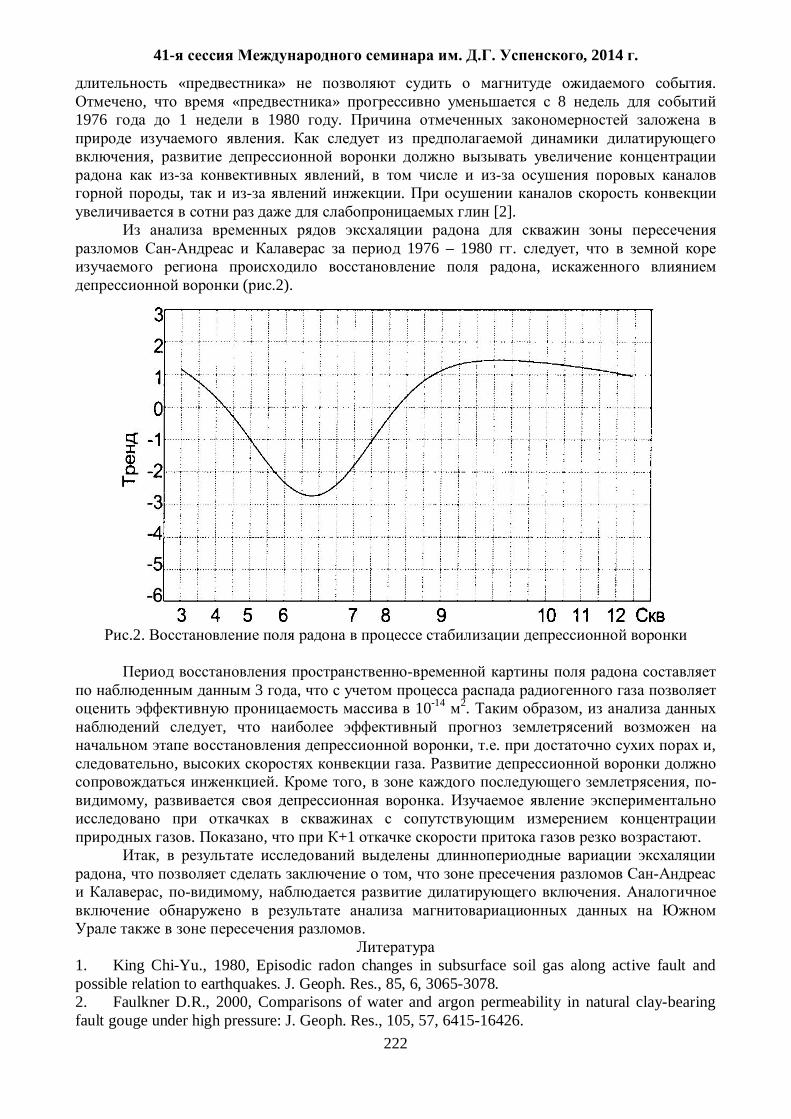
41- . . , 2014 .
222
« » . , « » 8
1976 1 1980 . .
, ,
, . [2].
1976 – 1980 . ,
, ( .2).
.2.
3 , 10-14 2. ,
, , . ,
, . . , , -
, .
. , +1 . ,
, , , , .
.
1. King Chi-Yu., 1980, Episodic radon changes in subsurface soil gas along active fault and possible relation to earthquakes. J. Geoph. Res., 85, 6, 3065-3078. 2. Faulkner D.R., 2000, Comparisons of water and argon permeability in natural clay-bearing fault gouge under high pressure: J. Geoph. Res., 105, 57, 6415-16426.
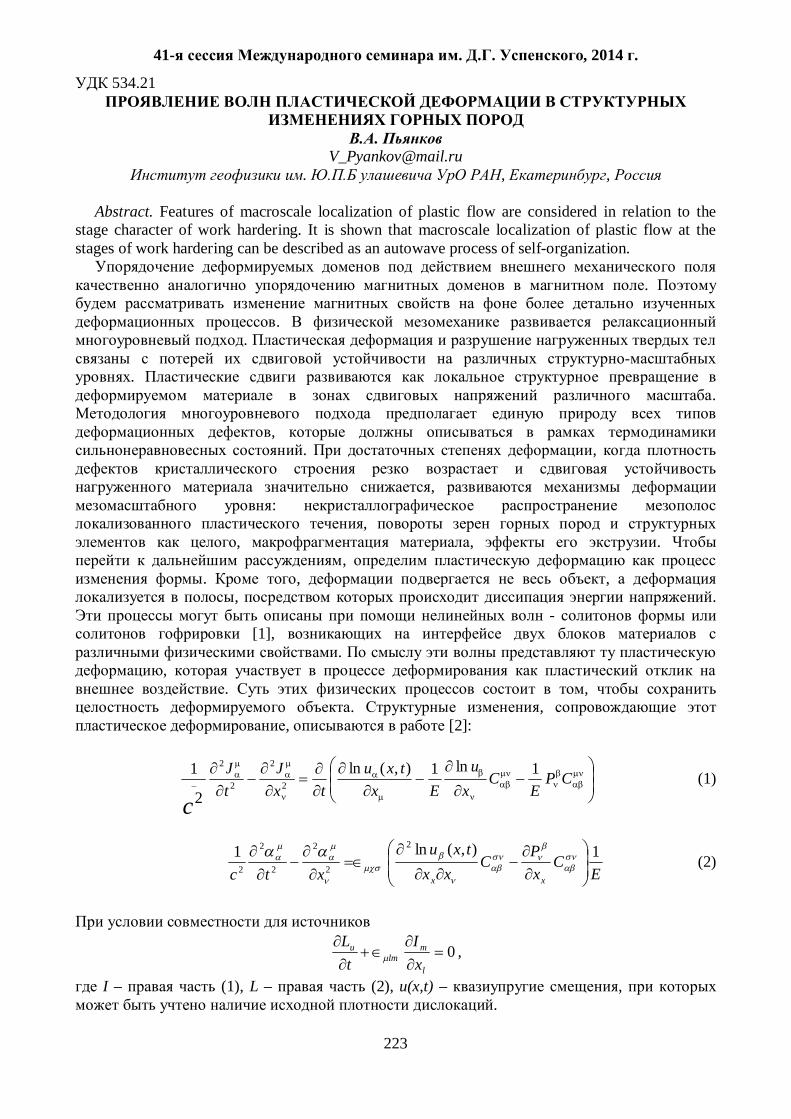
41- . . , 2014 .
223
534.21
.
[email protected] . , ,
Abstract. Features of macroscale localization of plastic flow are considered in relation to the stage character of work hardering. It is shown that macroscale localization of plastic flow at the stages of work hardering can be described as an autowave process of self-organization.
.
. .
.
.
, . ,
,
: ,
, , . ,
. , , , .
- [1],
. ,
. , . ,
, [2]:
CPE
Cx
uEx
txutx
JtJ
c
1ln1),(ln
2
12
2
2
2
(1)
EC
xPC
xxtxu
xtc xx
1),(ln1 2
2
2
2
2
2 (2)
0l
mlm
u
xI
tL
,
I – (1), L – (2), u(x,t) – , .
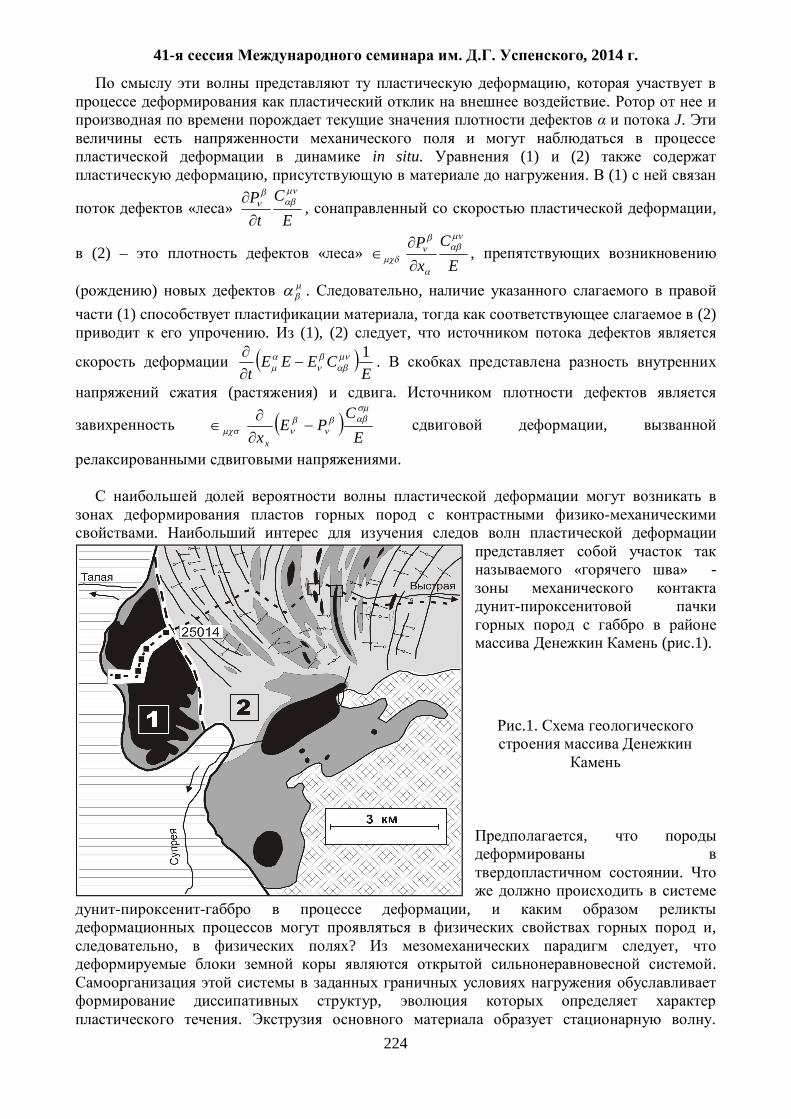
41- . . , 2014 .
224
, .
J.
in situ. (1) (2) , . (1)
« » E
Ct
P, ,
(2) – « » E
CxP
,
) . , (1) , (2)
. (1), (2) ,
E
CEEEt
1 .
( ) .
E
CPE
x x
,
.
.
« » -
( .1).
.1.
,
.
, ,
, ? , .
, . .
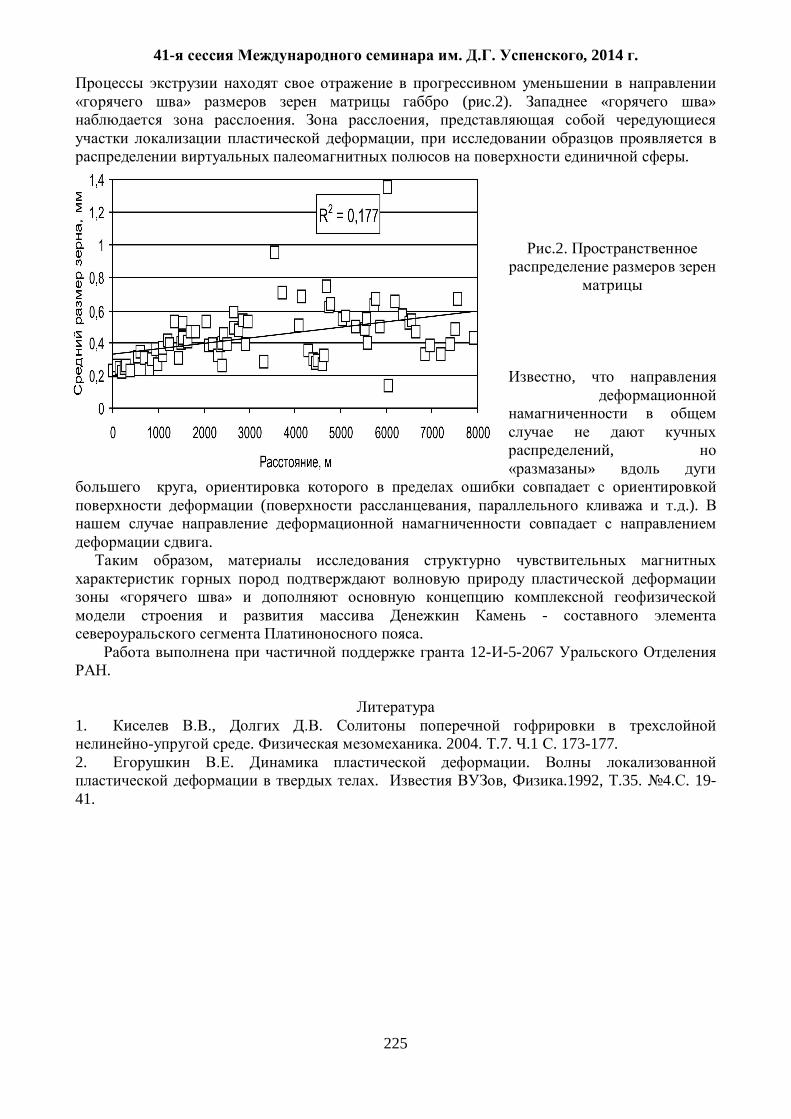
41- . . , 2014 .
225
» ( .2). « »
. , ,
.
.2.
,
, »
, ( , .).
.
,
« » -
. 12- -5-2067
.
1. ., .
. . 2004. .7. .1 . 173-177. 2. . .
. , .1992, .35. 4. . 19-41.
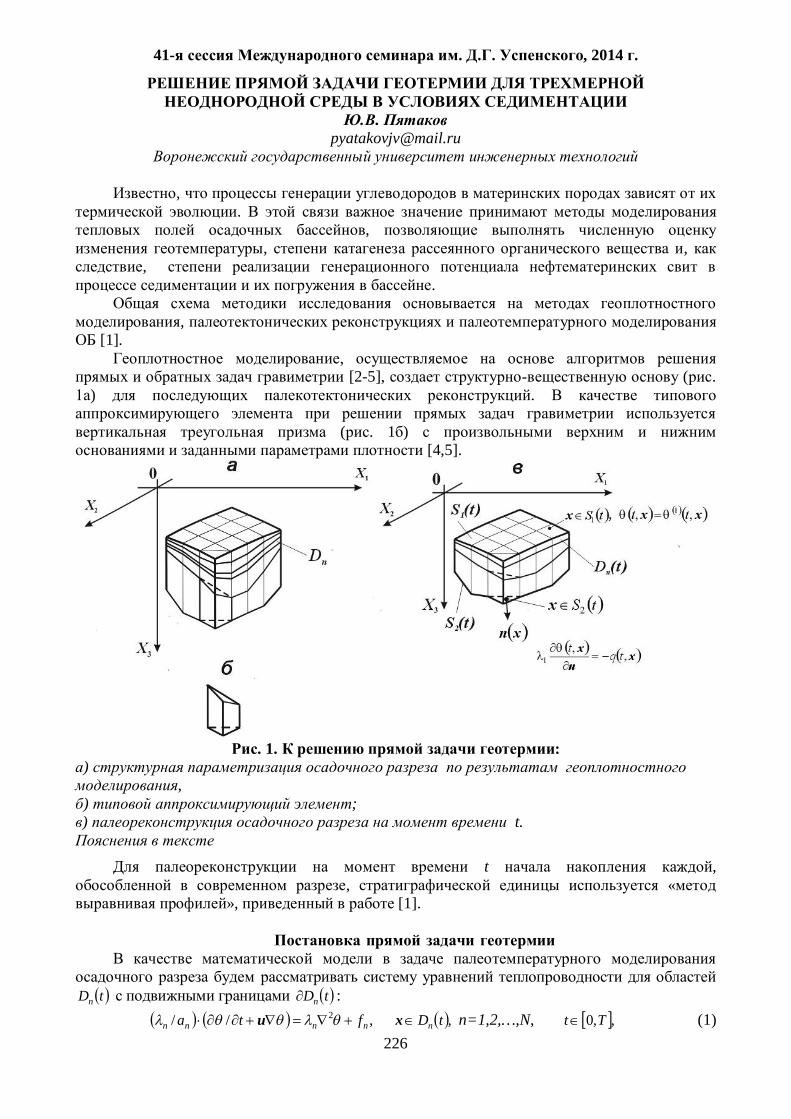
41- . . , 2014 .
226
, .
, , ,
, .
,
[1]. , [2-5], ( .
) .
( . 1 ) [4,5].
. 1. :
) ,
) ; ) t.
t ,
, « », [1].
tDn tDn : ,// 2
nnnn fta u ,tDnx n=1,2,…,N, ,,0 Tt (1)
41- . . , 2014 .
227
x,t - x t ; x,tff nn - n ; na n - ,
; xuu ,t - ); tDn -
n ( ) t ( . . 1 ). . 1 . 1
. – , N - .
. tS1 - t ( . . 1 ). tS1
, [5]:
xx ,, 1 tt , tS1x . (2) tStDtS 12 \ x,tq :
xnx ,/,1 tqt , tS2x ; (3)
tD - UN
nn tDtD
1 t; xnn -
( tD ) tS2 ( . . 1 ). tDn tDn 1
: xx
xxxx,lim,lim tt , (4)
0/,lim/,lim 1 nxnxxxxx
tt nn , (5)
tDnx , tDn 1x ; xnn xnn - , tDn tDn 1 tSnx ; tDtDtS nnn 1 , n=1, 2 , … , N-1.
x,t , (1)-(5).
tS1 , tS2 , tSn , , xn ,
: tS1 tS2 xn tD , tSn ,
xn tDn 1 . x,t , (1)-(5)
:
xxux ,,,,,,0
tFVddtaGtt
Di
i
, tDx , ,,0 Tt (6)
xxxxx ,,,,, 4321 tFtFtFtFtF ,
N
i
t
Diini VddtaGfatF
i1 01 ,,,/, xx , ,tDnx (7)
t
DSddtaGtF
022 ,,,,, xnux , tDx (8)
41- . . , 2014 .
228
t
Sn
t
Sn SddqtaGaSddqtaGatF
0
111
0223
12
/,,,/,,,, xxx
1
1 011 /,,,,,
N
i
t
Sniiiii
i
SddqtaGataGa xx , ,tDnx (9)
,4 xtF SdtaGat
Sn
0
1111
1
,/,,/ nx SdtaGat
Sn
0
2222
2
,/,,/ nx
SddtaGataGa niiii
N
i
t
Siii
i
nxnx /,/,,/,, 111
1
1 0, tDnx . (10)
(7)–(10) n/,, iiq - Sd iS ( iS ) ; , ,1q -
tS1 ; ,1 , ,2 - tS1 tS2 , ;
,i - iS ; x (7)-(9) – x ( t ), x
; xtaG ,, - .
(6) (2)–(5) x,t , x,tqi , x,1 tq .
1. ., .
// . – 2004. – . 26. – 2. – .46–61.
2. . . – : , 1978. – 227 .
3. ., ., . // « » - 1993.- .15. - 1. - . 62-71
4. ., . // . – 2012. – . 320. – 1. – . 105–110.
5. ., . //
. – 2013. – . 35. – 2. – . 78–97.
41- . . , 2014 .
229
551.24.035 3-D -
. 1([email protected]), . 2([email protected]), . -
2 ([email protected]), . 1 ([email protected]) 1 – . , ,
2 – , , Abstract Results of 3-D modeling by finite-element method of the stress-strain state (SSS) of the lithosphere of the San-Andreas fault system region are presented. Elastic and elastic-plastic (Mizes and Drukker-Prager criteria) rheologies were tested, the reliable details of SSS were revealed. An optimal in sense of the level of tangential stresses max model of the lithosphere was constructed. In the latter, middle/lower continental crust and lithospheric mantle are approximated by elastic-plastic media with Drukker-Prager criteria. Calculated max are corresponding to real levels of deviatoric stresses within the lithosphere when model is loaded by weigh and movements of asthenosphere and Pacific plate.
[3,4]. 3-D ,
( , ). - .
, 3 - , 5 - . (20 25) .
1 . . 3D ,
, , -
. : - , – , -
. (
) ,
, . ,
. .
, , ; .
60000
, 40000 – , 10000 [8].
, , [1,6].
( ) .
, .
. ( , )
, -. [2] [6].
41- . . , 2014 .
230
( ) 200-4000
[2,5,7], ( , , .).
) , [8],
. 700 1000 , .
10 . 0.24 0.3-0.4 ,
0.3, , 0.35- 0.4 0.45 . – 0.35, –
0.4, – 0.45.
max : – 1000 ,
– 500 , – 100 , .
, . ,
( ) .
=10 =20 , .
, : =20 10 ,
=10 50 , =100 . -
. :
, . 100 ,
. 1.
(80 ). :
( -80 ) ( +70 )
. .
2. ( ) , , ,
, , , ,
.
3. , , ,
, max , max,
41- . . , 2014 .
231
. max, .
4. , , , ,
- max,
.
. 5. max
: ( , – )
max , ( , – ) –
max 100 10 .
. – max,
. 6.
, ,
=20-50 =20 –26 ( ).
7. ( ), , -
5-25 ( ) max ( ), ( ) max ,
, , . (25-45 )
) max , max , –
. , - ( ).
11-05-00387- . 1. ., .
. .: . 2009. 208 . 2. ., . . .: . 1971. 256 . 3. ., ., ., ., .
. 1. //
, . . 2013 . .88. . 1. . 3-19. 4. ., ., ., ., .
. 2.
// , . . 2013 . .88. . 2. . 3-17. 5. . . ( .) .: . 1969. 544 . 6. . . .: . 1975. 262 . 7. . . .: . 1983. 240 . 8. Jeppson T.N., Bradbury K.K., Evans J.P. Geophysical properties within the San Andreas Fault Zone at the San Andreas Fault Observatory at Depth and their relationships to rock properties and fault zone structure // J. Geophys. Res. 2010. Vol. 115. B12423.

41- . . , 2014 .
232
. , ,
18 . ,
, 1:10 000.
, ( ) 100 20 ,
( .1).
, -
, -,
, .
.
.
,
.
,
. , , .
.
, ,
.
, , .
. ( 5%)
10% .
2. , , .
, ,
.

41- . . , 2014 .
233
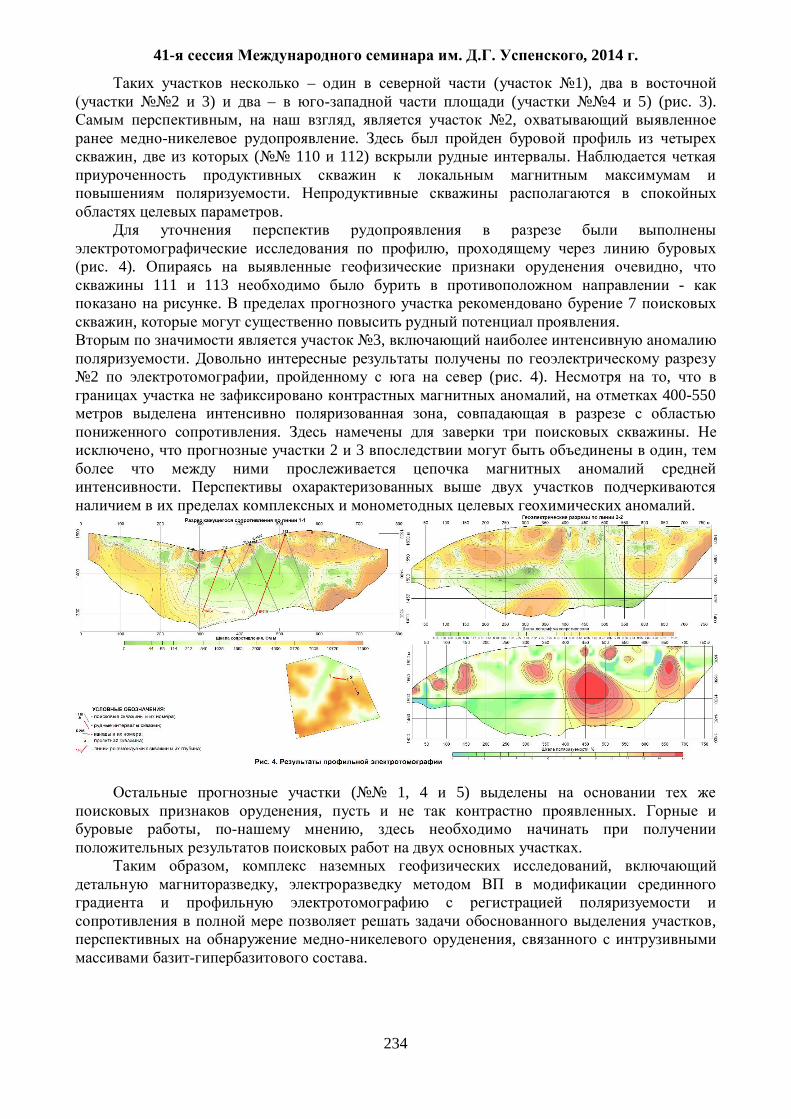
41- . . , 2014 .
234
– ( 1), 2 3) – ( 4 5) ( . 3).
, , 2, .
, ( 110 112) .
. .
,
. 4). , 111 113 -
. 7 , .
3, .
2 , ( . 4). , , 400-550
, . .
, 2 3 ,
. .
( 1, 4 5) , .
, , .
, , ,
,
, .
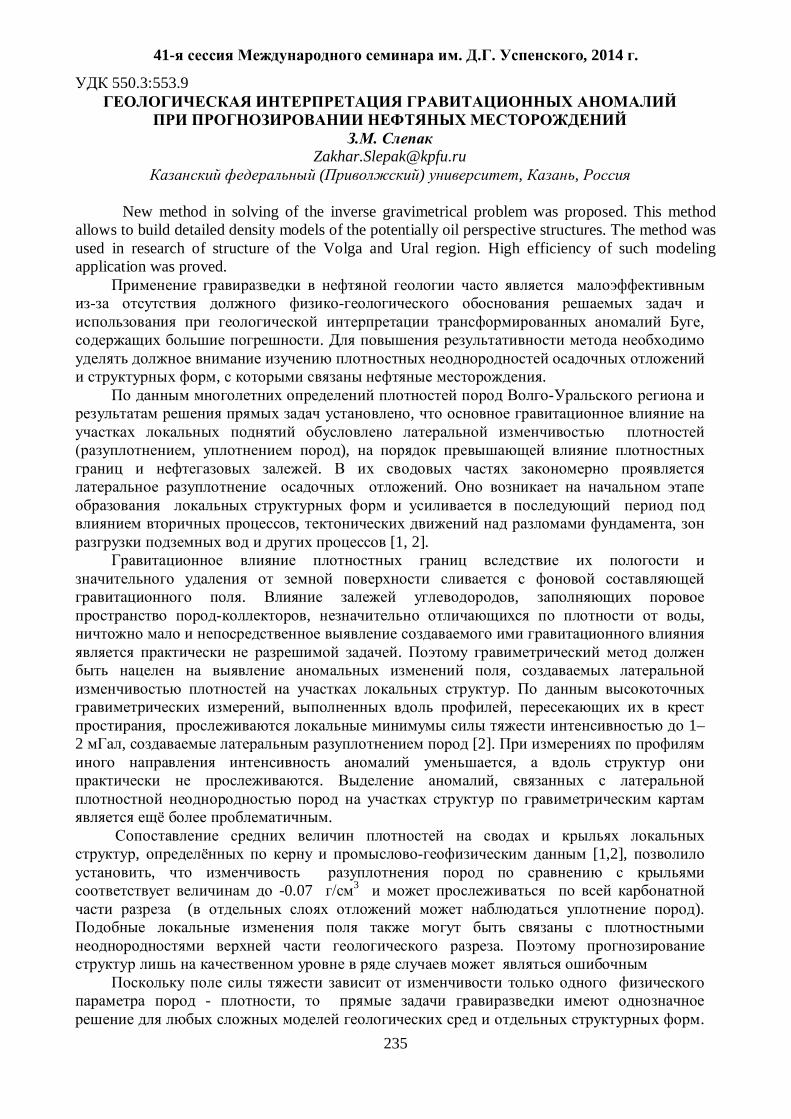
41- . . , 2014 .
235
550.3:553.9
.
[email protected] ( ) , ,
New method in solving of the inverse gravimetrical problem was proposed. This method
allows to build detailed density models of the potentially oil perspective structures. The method was used in research of structure of the Volga and Ural region. High efficiency of such modeling application was proved.
, .
, .
,
, ),
. .
, ,
[1, 2].
. , , ,
.
, .
, , , 1–
2 , [2]. ,
. ,
.
, [1,2], ,
-0.07 3 ( ).
.
- , .
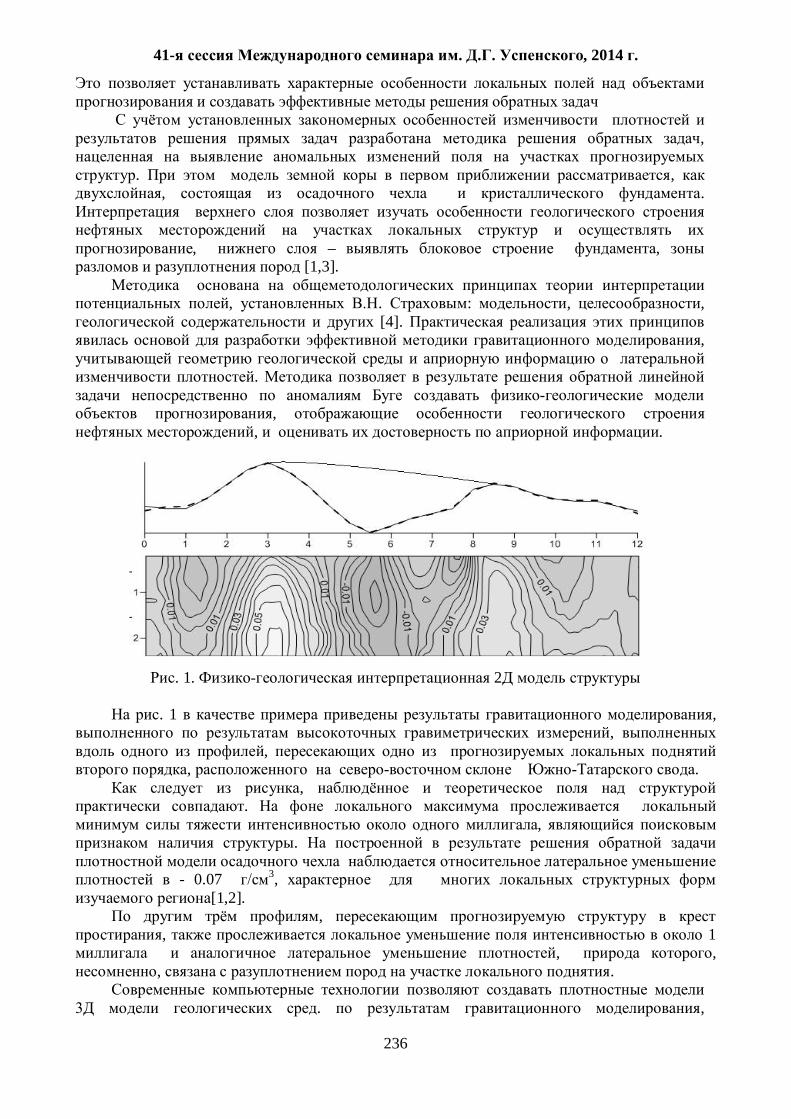
41- . . , 2014 .
236
,
. , , .
, – , [1,3].
, . : , ,
[4]. ,
.
,
, .
. 1. 2
. 1 ,
, ,
, . ,
. ,
.
- 0.07 3, [1,2].
, , 1
, , , .
. ,
41- . . , 2014 .
237
. , , ,
. , ,
, 3 .
( .2).
.2. 3
, ,
. ,
.
-,
.
3 . , ,
[1,2],
.
1. . . .: ,1989. 200 .
2. . , . 2005 .
3. ., ., . . .:
. , 1981. -, . 40-44.
4. . XXI . .I // , 3, 1995, . 9-18.
5. . XXI . .II // , 4, 1995, .10-20.
41- . . , 2014 .
238
550.531+538
. , .
Annotation. A method for the solution of inverse geophysical problems of finding the shape of anomalous body by analyzing the dispersionless Toda hierarchy chain is considered. The search for the unknown geometrical parameters is reduced to the solution of the system of differential equations, which is an analogue of dynamical systems.
[1,2] ,
, .
.
. ,
) ( ) , :
.pkgradv p . k — .
, , « ». , , , .
, , , .
, . , .
.
— . , ,
. , , (
) — , .
, , , ,
[3,4]. , .
3R , , .
( ) .
, ( ), . [1]
( ). — z:
RzzCDzzDD 21212 ,;];,[ .
41- . . , 2014 .
239
, —
. , ( , ).
. ,
, .
. ; ,
, .
— . , , ,
.
. . , ,
, [5]. ,
, — , , .
, .
( , ) ,
, ).
.
.
. 1. .
// « ». 38- . . , 24-28 2011 , . 270-271.
2. . // «
». 39- . . ,30 - 02 2012 , . 259-260.
3. A.Zabrodin. Laplace growth problems, conformal maps and intergrable hierarhies November 12, 1999. 4. Wiegmann P.B., Zabrodin A., Conformal maps and integrable hierarchies, Comm. Math. Phys. 213 (2000), 523-538. 5. . . . . . 1985. 224 .

41- . . , 2014 .
240
550.838
. , . [email protected]
, . ,
Integrated approach of the section’s upper part investigation at engineering-geological exploration on the basis of micromagnetometry application is proposed. It consist the measurement both the magnetic induction together with the soil layer’s magnetic susceptibility and its contribution calculation.
, , . . ,
( . , . ) ( . ) [1].
. ,
, , ,
, .
. ,
( 10 10 20 20 2)
10-5 . [2]:
Ta = 2 pJ = 2 pæT, (1)
Ta – ; J –
; IcosAsinIsinp 222 – ,
I ( = 1); æ – ; –
. (1)
æ .
( ) Ta Ba
( ,TB 0 0 – ).
,
. ,
41- . . , 2014 .
241
.
1. ., ., ., .
// VII « , »:
. : , 2013. . 343–345. 2. : / . . , .
. 2- ., . . .: , 1990. 470 .

41- . . , 2014 .
242
551.14:550.83(571.56)
( ) . , .
[email protected] , . ,
There was worked out the typical geology-geophysical model of the gold-ore deposit, which
localized in the mobility block of the upper part of Earth’s crust. Ore-contained block is controlling by ancient age’s deep fault of oldest age, in zone of which was formed an consedimentation trough.
: [1, 2] [3-5].
.
( . 1),
,
.
. 1.
: 1, 2 –
: 1 – ( – ), 2 – ( –
, – , – ); 3 – ; 4 –
; 5 – ( – , –
, – )
, ,
,
, . ,
.
[5].
.
, , , ,
.

41- . . , 2014 .
243
(10 12 ) .
.
2 ( . 2).
, [5].
. 2.
: 1, 2 – : 1 – ( –
), 2 – ( – , – ); 3 – ; 4
– ; 5 – 1
,
: 1) –
, ; 2) -
– , ; 3) –
, ; 4) –
5 15 , 2 ; 5)
– , , .
1. ., ., . // , 2002. 4. C. 3-7.
2. ., ., . – . .: , 2001. 230 .
3. ., ., . . . .: , 2000. 270 .
4. . // , 1970. .12. 3. . 96-
102. 5. ., .
. : , 2005. 174 .

41- . . , 2014 .
244
551.243.+551.2
.
[email protected] , , ,
Abstract
The results of the analysis of geomagnetic observations in the Northern Tien Shan. The characteristic changes in the geomagnetic field associated with the preparation of strong and destructive earthquakes.
: 1885 ., 1887 .,
1889 ., 1911 ., 1938 ., 1970 ., - 1978 ., 1990 ., C 1992 . 2013 .,
8 9-10 . ,
– , , ,
– , , , , , , – , , .
( )
. - .
, – , – .
: , ;
. , , ,
" -4" - , , , .
" -4" 2-3 , .
,
. ( ) ,
, . - , 20 ( ,
=7,5, 1992) [1-5].
, 48 1460 . , ,
, . , .
Z 50 300 , - 14 (
– 1978 .) [3], 130 135 ( – 1974 .) [4,5]. Z
13 .
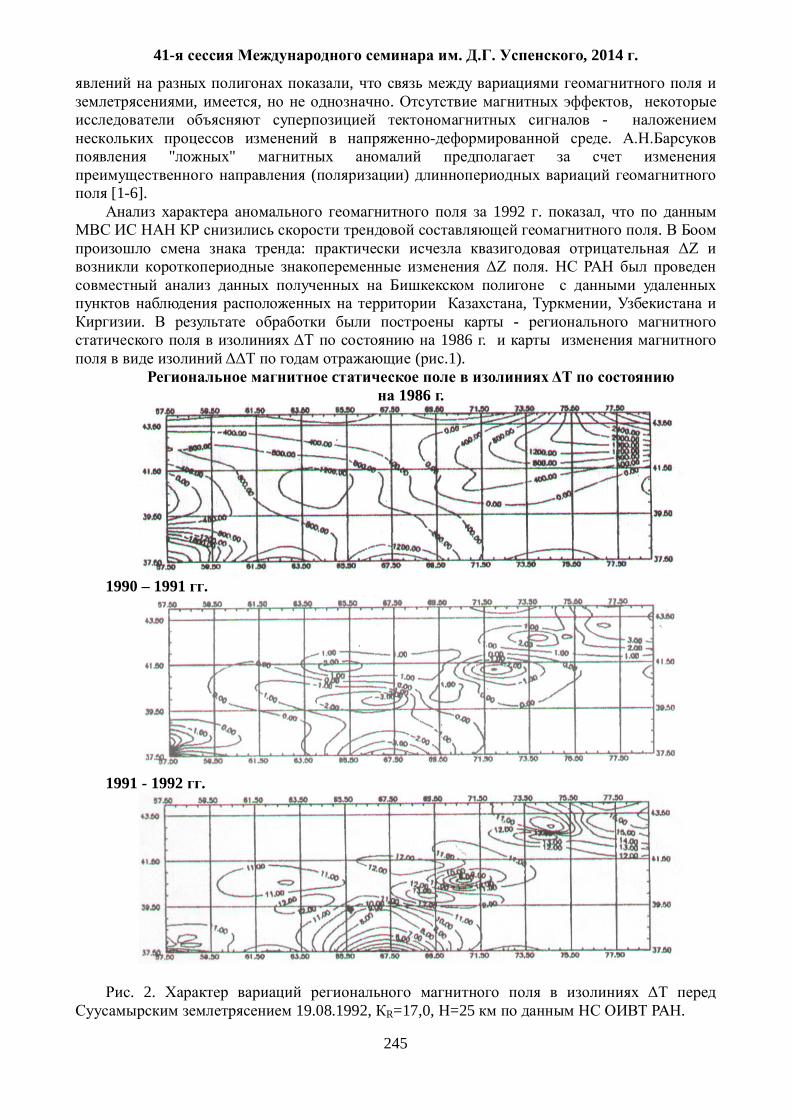
41- . . , 2014 .
245
, , , . ,
- .
" " ( )
[1-6]. 1992 . ,
. :
.
, , . -
1986 . ( .1).
c 1986 .
1990 – 1991 .
1991 - 1992 .
. 2. 19.08.1992, R=17,0, =25 .
41- . . , 2014 .
246
.2.
1986 .,
– 3 10 . , ,
. 11 ,
, 1992 . , 1992 . ,
. 19.08.92 . ( =17) +2 -13 , 5-
7 +3 +6 +2 -4 .
1. . . : ,1989.204 .
. . // . . . 1985, 11. .80-82.
2. ., ., ., . . : , 1989. 208 .
3. ., // . . . . -88.
: , 1988. . 46-47. 4. ., .
// . 5-14
1989. : , 1989. . 82-83. 5. .
// . . . . : , 2000. .
32-36.

41- . . , 2014 .
247
550.83
GEOMODEL .
[email protected] “ ”, . ,
The article considers software package that has being developed in PLC "Irkutskgeofizika"
and designed for primary processing, accelerated forward mapping and automatic interpretation of transient electromagnetic method data. Some of the results obtained by using the program in practice are shown.
“ ” GeoModel.
, .
, ,
, . ,
, ,
, .
. 1.
. 1. GeoModel.
, . GeoModel
, , ,
,

41- . . , 2014 .
248
. ,
[1].
[2],
. 2).
. 2.
.
, , , ,
, .
, ,
20-30 ( . 3).
.

41- . . , 2014 .
249
. 3. ,
.
. ,
“ ” [3], .
GeoModel
.
( . 4).
. 4.
.
1. Niels B. Christensen. A generic 1-D imaging method for transient electromagnetic data // Geophysics. Vol. 67, No. 2 (March-April 2002). P. 438-447. 2. . .
// . 2013. 10 (81). . 124-128.
3. Steven C. Constable, Robert L. Parker, Catherine G. Constable. Occam’s inversion: A practical algorithm for generating smooth models from electromagnetic sounding data // Geophysics. Vol. 52, No. 3 (March 1987). P. 289-300.

41- . . , 2014 .
250
. . , . .
[email protected], [email protected] , . ,
In this work was considered the location which covered by permafrost. This site called
Sandibinskoe deposit. Such geophysical method as vertical electrical sounding was used there to explore electric properties of frozen rocks. By received data was constructed graphic of low temperature and electrical resistivity. Then this graphic was compared with the same graphic from reference book.
, , ,
. . — ,
( ) .
,
.
11 . 2,
65% ( .1).
.
.
,
( ) .
, ( ). ,
, , . :
;
, ;
, ( ), .
. 1.

41- . . , 2014 .
251
, . . .
, ,
106 • . ,
, ( ), ,
.
, , ,
, [1].
, , .
, .
, 0 -4° .
, .
, .
, ( ), .
. ( .3).
, » [2]
, [3]. .
0 -2° . , t = - 4°C
, t = - 2° . , ,
, . , 0,1 - 0,083
. . ,
.
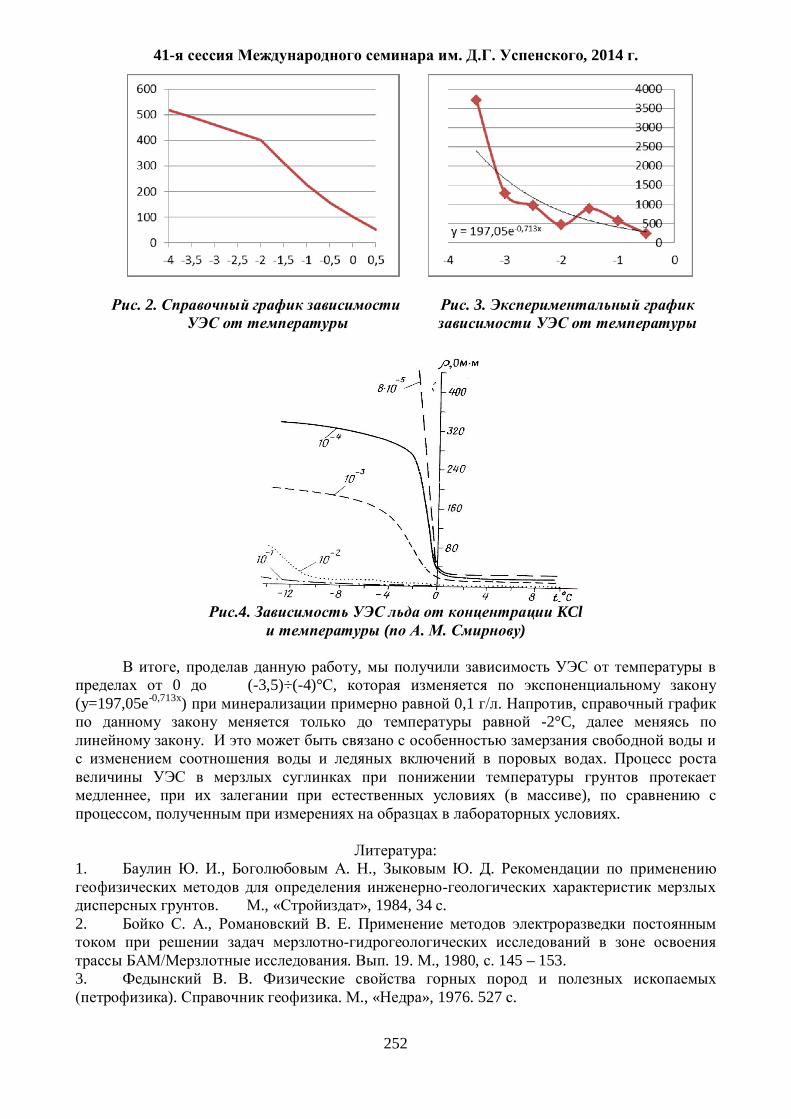
41- . . , 2014 .
252
. 2. . 3.
.4. KCl
( . . )
, , 0 (-3,5)÷(-4)° ,
(y=197,05e-0,713x) 0,1 . , -2°C,
. .
, ( ), , .
:
1. . ., . ., . .
. ., « », 1984, 34 . 2. . ., . .
. . 19. ., 1980, . 145 – 153.
3. . . ). . ., « », 1976. 527 .
41- . . , 2014 .
253
550.83:550.814
. , . [email protected]
« « », , The bottom of the magnetized crust determined from the spectral analysis of magnetic
anomaly is interpreted as a level of the Curie point isotherm. A spectral analysis technique was used to estimate the depth of the magnetic anomalies sources (Curie point depth analysis) of the Northeast area of Russia.
, . , ,
, , , . , ,
. , ( ) 580°C.
, , ,
.
, , .
« », 1) Zt
; 2) Zo ; 3)
: Zb = 2*Zo - Zt.
, , « » .
( R-53, R-54, R-55, R-56, R-57, 511 125 2), ,
.
41- . . , 2014 .
254
550.831.23
SCINTREX . , . , .
[email protected], [email protected], [email protected] .
, , ,
The modern technical equipment allows us to locate the low amplitude gravity anomalies
(from the first gal). It is complicated by noise of diverse origin and requests both the high accuracy equipment and a special methodology. This work describes some characteristics of methods of the gravimeters’ field-work preparation, the analytical phase and data processing aiming to define a source of micro-anomalies.
. Scintrex CG-5 Autograv,
1 , ±5 . , -
, , , : , , ,
.
1. .
Scintrex CG-5 Autograv 2006 . [1] 20 .
, .
( ) ( . 1). (
, , 3, – 1).
« » 5 12 , . ,
, , , . , , ( 10 ) 3.
, , 2 3 –
30-50 5-10 . , .

41- . . , 2014 .
255
. 1. (25 -26 2013 ).
, 21 – 23 , 7.3 25
2013 . ,
. 6 .
, . . ,
, .
2. .
, : ( , ),
( ), ( ), ( ) ( ).
.2.
. . 4
) , , ,
±5 , ±2 . , ,
. , . ,
.
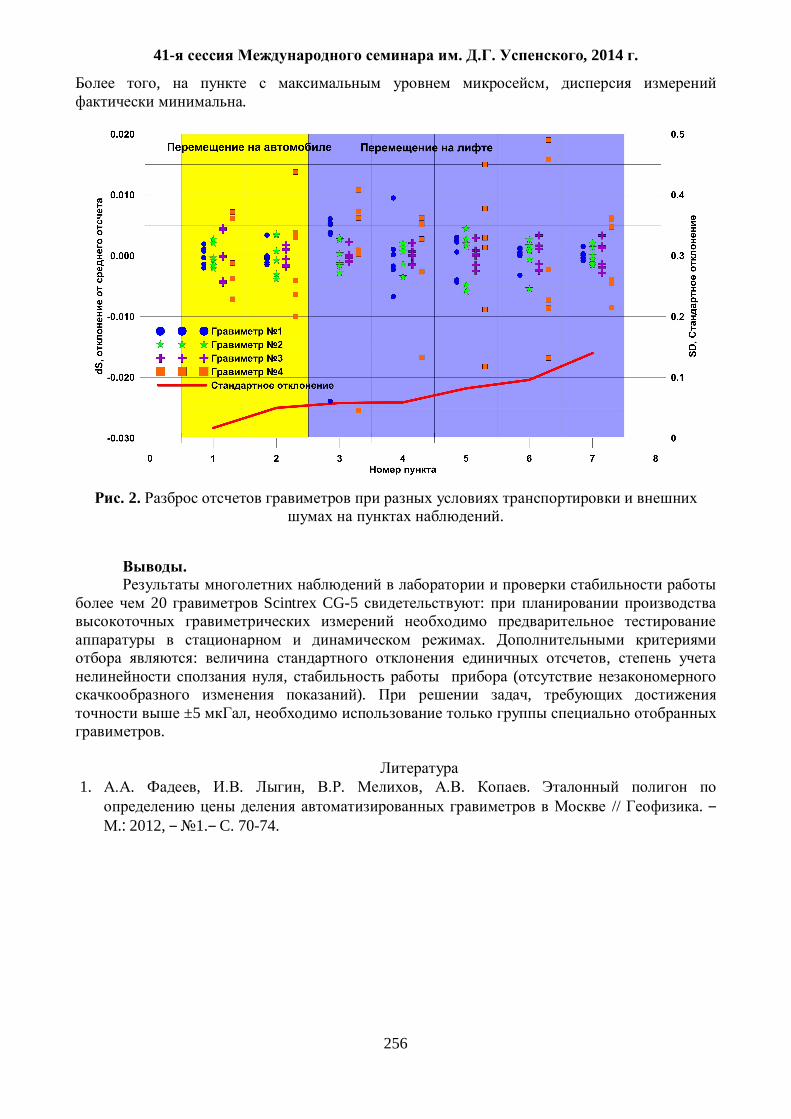
41- . . , 2014 .
256
, , .
.
20 Scintrex CG-5 :
.
: , , (
). , ±5 ,
.
1. . , . , . , . .
// . .: 2012, 1. C. 70-74.
. 2. .
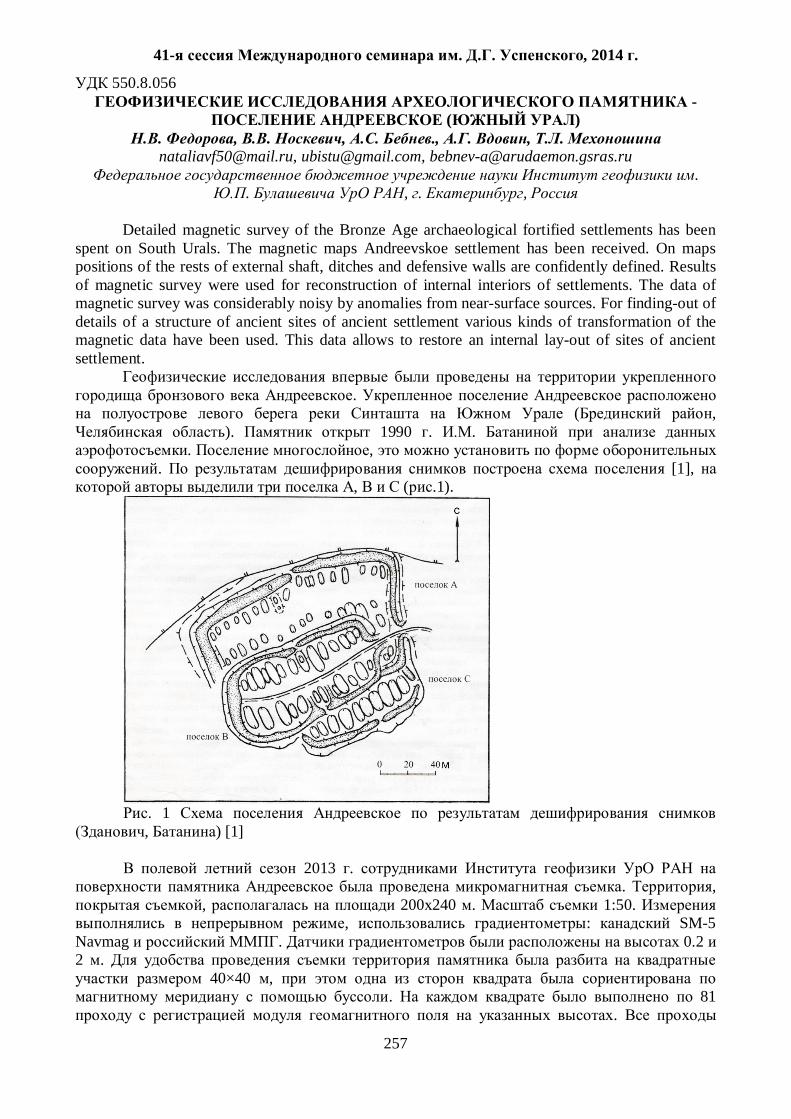
41- . . , 2014 .
257
550.8.056 -
( ) . , . , . ., . , . [email protected], [email protected], [email protected]
. . , . ,
Detailed magnetic survey of the Bronze Age archaeological fortified settlements has been
spent on South Urals. The magnetic maps Andreevskoe settlement has been received. On maps positions of the rests of external shaft, ditches and defensive walls are confidently defined. Results of magnetic survey were used for reconstruction of internal interiors of settlements. The data of magnetic survey was considerably noisy by anomalies from near-surface sources. For finding-out of details of a structure of ancient sites of ancient settlement various kinds of transformation of the magnetic data have been used. This data allows to restore an internal lay-out of sites of ancient settlement.
.
( , ). 1990 . .
. , . [1],
, ( .1).
. 1 , ) [1]
2013 .
. , , 200 240 . 1:50.
, : SM-5 Navmag . 0.2 2 .
40×40 , . 81
.
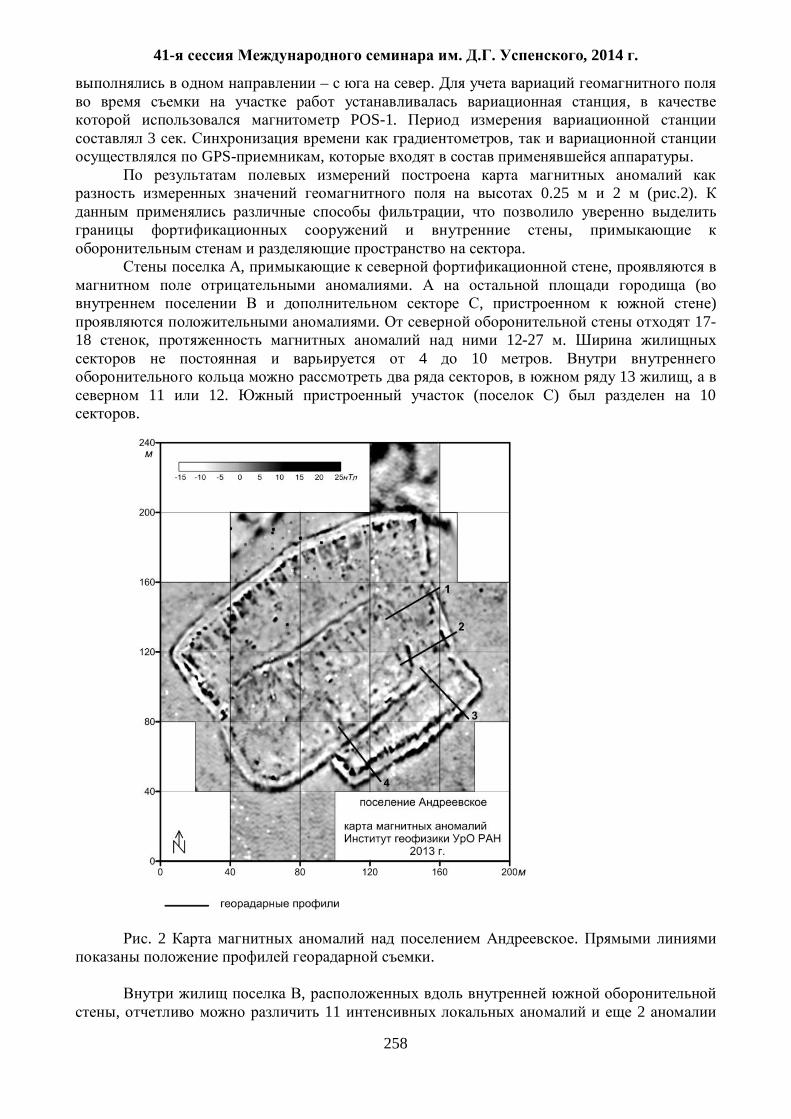
41- . . , 2014 .
258
– . ,
POS-1. 3 . ,
GPS- , .
0.25 2 ( .2). ,
, .
, , . (
, ) . 17-
18 , 12-27 . 4 10 .
, 13 , 11 12. ( ) 10 .
. 2 .
.
, , 11 2

41- . . , 2014 .
259
.
[2-3]. ( ), ,
( ) , .
, ,
: .
, , , ,
.
4 , . .2.
. 3 3.
3 , . ,
( .3) , , 10 ,
. 30 . ( 21-24) 0.5-0.8 .
( 12- -456-2024 " :
").
1. ., . – « » .
: , 2007. 260 . 2. ., ., ., .
// , 2012. 4. . 60-69. 3. ., .
( ) // , 2012. 1. . 52-59.
41- . . , 2014 .
260
550.837
. , . , . , .
. . , . ,
Abstract. Results of the investigation of condition of the soil hydraulic engineering construction by electrical and seismic soundings are considered.
( ), ,
, , . , ,
, .
, .
. , : ;
. ,
, [1].
, .
, ( ) ( MAN)
( ) . ( .),
. . , , 700
. ( .1 ). .
20 ( 0 – 64). -MAX, - .
[2, 3]. ,
IPI2win, . U/I
MN/2. MASW (
) 24- « -24 », [4]. 2 .
.
( .1 ). . : Vp = 200–250 , Vs = 120–160 .
. Vp= 300–500 Vs = 150–200 ,
. . Vp = 1500-2000
, .
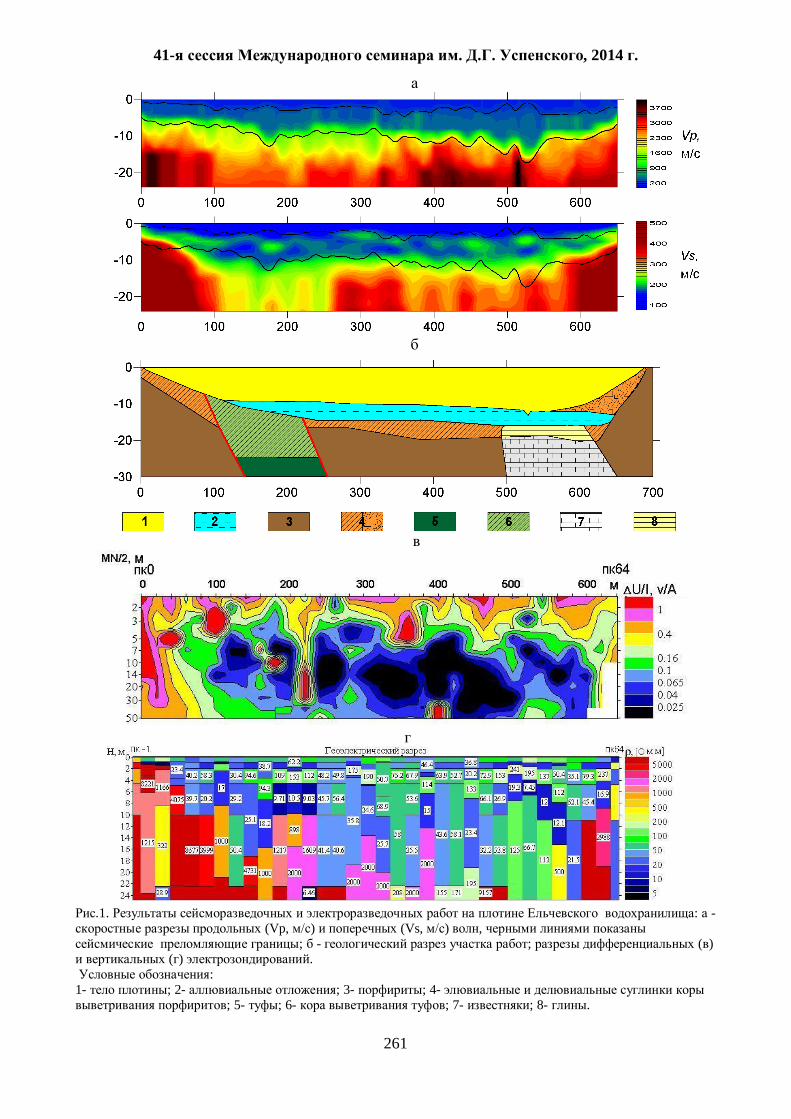
41- . . , 2014 .
261
.1. : -
(Vp, ) (Vs, ) , ; - ; ( )
( ) . :
1- ; 2- ; 3- ; 4- ; 5- ; 6- ; 7- ; 8- .

41- . . , 2014 .
262
530, 170, 500 , , . Vp = 2000–4000 , Vs =
400–800 . , Vs,
( . 1 ). , ,
.1. ) U/I, . ,
, , ( 160-180, 220-240, 280-
300, 380-400 .). . , ,
. ( .1. ) ( 2 )
, , , .
, .
. : 80 – 220 480 – 560, . ,
.
. , .
( 13-5-004- ).
1. ., ., ., ., . //
. . . . : , 2000. . 84–98. 2. ., . . 2332690
2006140014/28 13.11.2006, 27.08.2008 . 24 3. ., .
// . 2009. 1. . 65–69.
4. ., . « » // . 2005. 5. . 162-163.

41- . . , 2014 .
263
552.08.53 (550.834)
. , . [email protected]
), . ,
As a result of geophysical studies, the images of gold-ore deposits which are located bothe within the influence of deep faults and sub-vertical zones of high conductivity (Type I – deposit Natalka, Degdekan, Igumenovskoe ), and outside these areas (Type II – Butarnoe, Doroznoe, Svetloe) are developed. Based on findings, the geophysical criteria of mentioned deposits were formed. The complex analysis of deposits’ geophysical characteristics disclosed that the type I and type II deposits differ vastly in geophysical criteria, though they refer to the same mineralization type (gold-quartz).
( 25 )
[1]. ,
, , ,
, , , . ,
.
,
[2].
– . ,
, [2].
,
. , ,
.
, ( ) –
, – .
( ), ( ), ( ), -
( ) ).
, , - I ) : 1. . , ,
, , ,
41- . . , 2014 .
264
. – ,
[3]. , (
), ( 5% ) , .
2. , -.
. 3.
. 4. ,
.
5. ( ) ( ) ,
- ) ,
. 6. ( )
, ),
. ( ) ,
. 7. , )
. 8.
. .
, .
. ( ) ( - 6,4 ,
- 7,2 , - 9 ). II , ( ,
, ) : 1.
, ,
- . (
?), , .
2. : -
, - ,
-
;
41- . . , 2014 .
265
- ( )
- .
. 3.
, .
.
.
, ,
. ( .1 .)
. ,
, .
.
4. ( ) . , 5,
6 0,3-19 24-176 . 1
. , , ( ,
), . 1 1
. ,
« » – -
« » . , .
12-II- -08-025 2012-2014 . «
, , » .
1. . ., . .
, //
. – 2006. 4, .2-11. 2. . ., .
// . . . –
2011. – . 153, . 3. – . 230-246. 3. ., ., ., .
// . 2008. 4.- . 16-30.
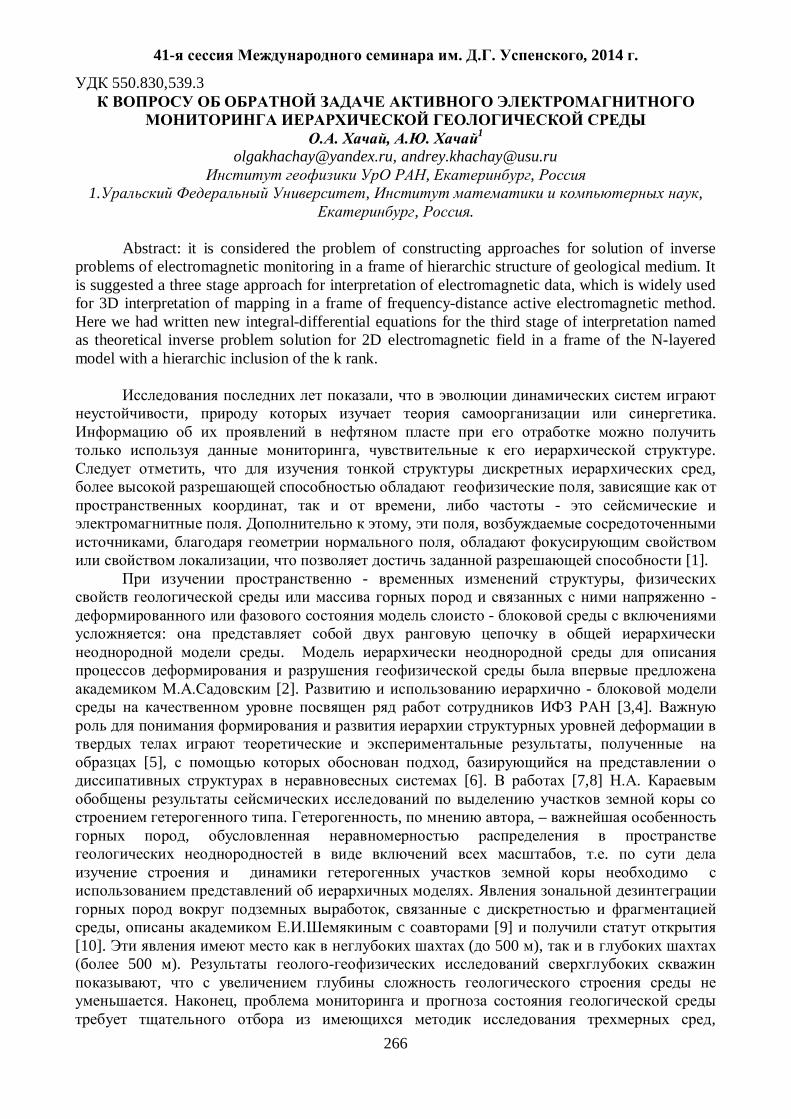
41- . . , 2014 .
266
550.830,539.3
. , . 1
[email protected], [email protected] , ,
1. , , , .
Abstract: it is considered the problem of constructing approaches for solution of inverse
problems of electromagnetic monitoring in a frame of hierarchic structure of geological medium. It is suggested a three stage approach for interpretation of electromagnetic data, which is widely used for 3D interpretation of mapping in a frame of frequency-distance active electromagnetic method. Here we had written new integral-differential equations for the third stage of interpretation named as theoretical inverse problem solution for 2D electromagnetic field in a frame of the N-layered model with a hierarchic inclusion of the k rank.
, , .
, .
, , ,
, , - . , ,
, , , [1].
- , -
- :
.
[2]. - [3,4].
,
[5], , [6]. [7,8] .
. , , –
, , .
.
, , c c [9]
[10]. ( 500 ), 500 ).
, . ,
,
41- . . , 2014 .
267
- ( ) . [11] 3D
N , J .
,
. ,
, [1]. [12]
. , ,
. , -
. , .
.
: ,
n- . , , [13,14],
) k- ,
n- .
kki
kak
ak
kki
kk
k
i
kak
kki
kDk
kk
dlMMGb
MMGbn
MUn
MUb
nMMG
bb
nMMG
MUMUMU
))),()1(),()1)(()()(
(
)),(
)(),(
))(()((()(2
00
)1()1(
00)1()1(0
)1(
(1)
( 1) ( 1)( ) ( ) ( )k i kU M U M U M , ( 1) ( )kkU M - ( 1)k
xE ( 1)k
xH k- kk DM , U(M) xE xH , ( 1) ( )i kU M xE xH k=1, k>1- xE
xH , [11] , n-
. ),( okak MMG - k-
, ),( ok MMG - n- [13-14], aki bbb ,, , i- k, [12].
ak , . -
(1) )(r , k- , , (1),
, k- , .
41- . . , 2014 .
268
1. . ./
., .// : . 2003.c. 288. 2. , . /
. , . , . – .: , 1987. 98 c. 3. /
– .: , 1989. – 173 . 4. , . / . ,
. , . // . .: ,1989. . 14-18.
5. , . / . , . , . – : , 1985. – 226 c.
6. , . / . , . – .: 1979. – 300 .
7. , . / . , . – .: . 2000. – 468 .
8. , . / . //
. 2000. . 30-32. 9. , .
/ . , . , . , . . // . 1986. . 289. 5. . 830-832.
10. , . 400. / . , . , . . //
. 1992. 1. 11. .
/ . , . // , C « ». 2013. .2, 2, . 48 55.
12. . / . //
. : . 1994. – 314 c. 13. .
./ . // . , .1989, 10, .50-58.
14. . . . // . , .1990, 2, 55-59.

41- . . , 2014 .
269
550.837
. , . [email protected]
, ,
Methods Electrometry is widely used to study the composition of soils and their filtration properties. The article includes the study of possibilities of use when interpreting the statistical characteristics of the parameters observed in electric fields.
-
( ) ( ) . ( ,
, , , , ).,
, .
» 1, 2],
U 3, 4]. ,
,
. , .
( .1 ).
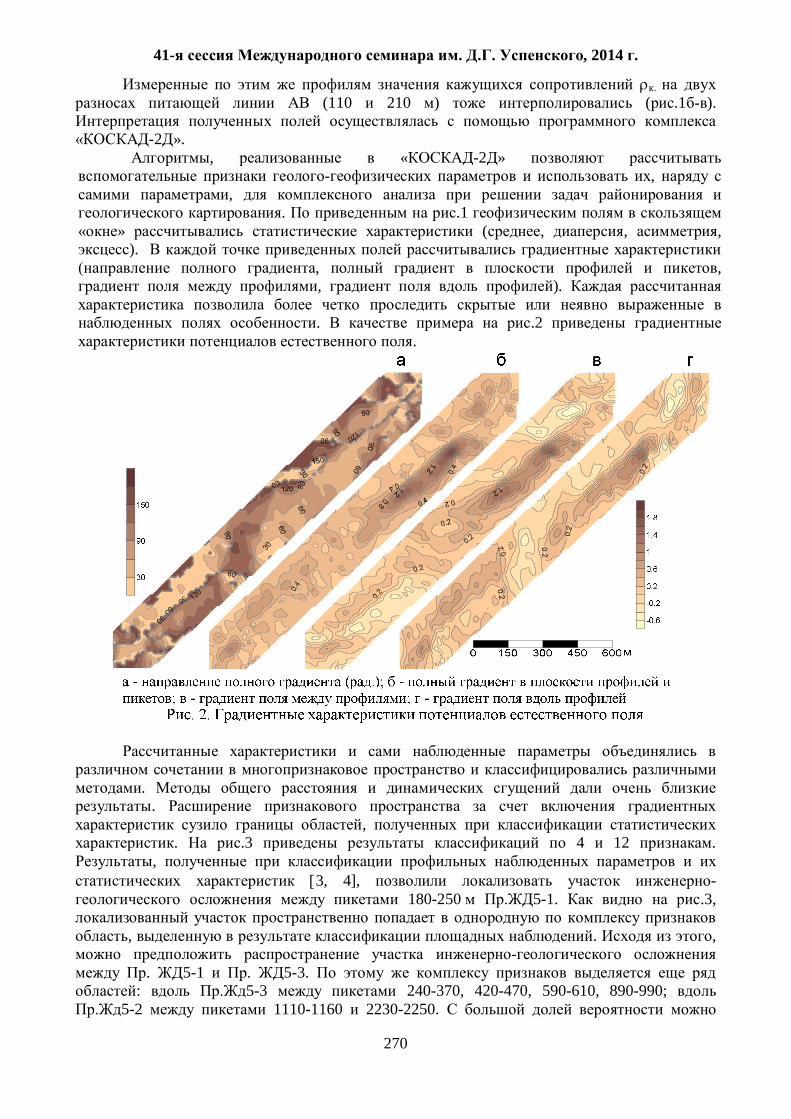
41- . . , 2014 .
270
. (110 210 ) ( .1 ).
-2 ».
, « -2 » ,
, . .1
» ( , , , ).
, , , ).
. .2
.
. .
, . .3 4 12 .
, 3, 4], -
180-250 5-1. .3,
, . ,
. 5-1 . 5-3. : 5-3 240-370, 420-470, 590-610, 890-990;
5-2 1110-1160 2230-2250.

41- . . , 2014 .
271
, .
(U ).
.
, .
:
1. . / ., . // ,
: 33- . . , : , 2006. . 272-275
2. « 3D». . 3. .
// . : . . . . . 2013. . 213-215
4. ., . , . //
, , , . . . . : , 2013.
327-328 (8-13 )
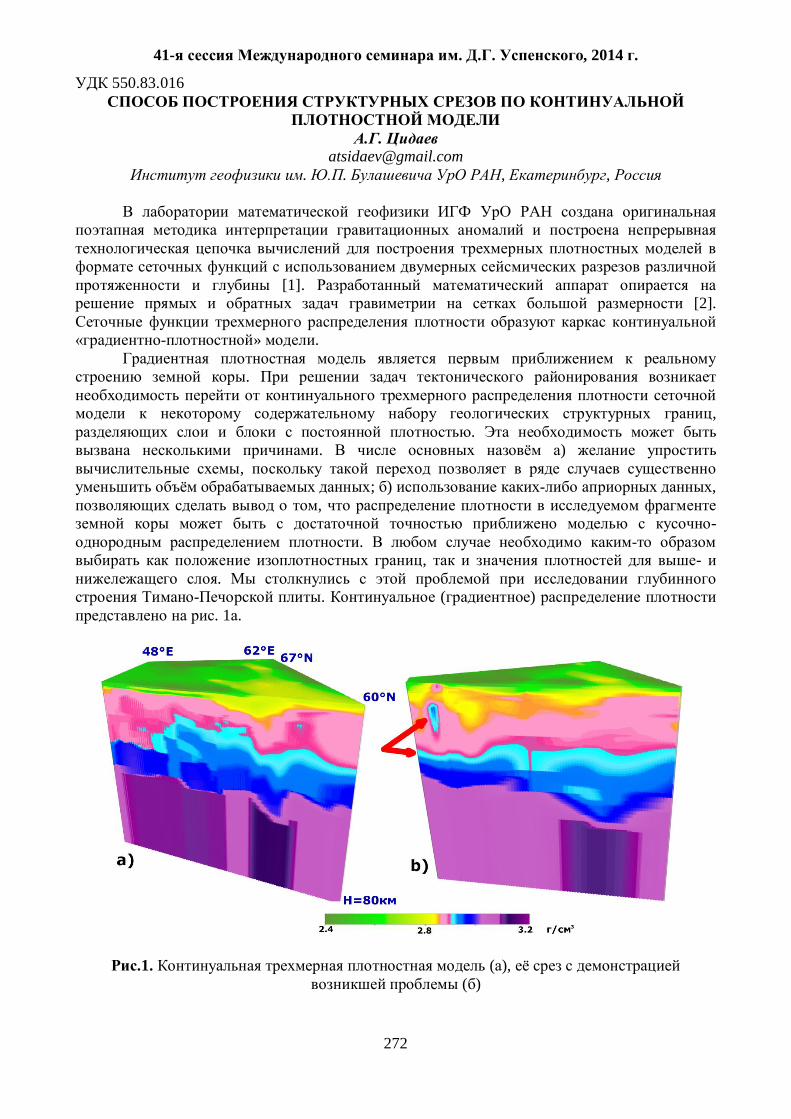
41- . . , 2014 .
272
550.83.016
.
[email protected] . . , ,
[1]. [2].
» .
.
,
. . )
, ; ) ,
, -
. , -
. . ( )
. 1 .
.1. ( ), ( )
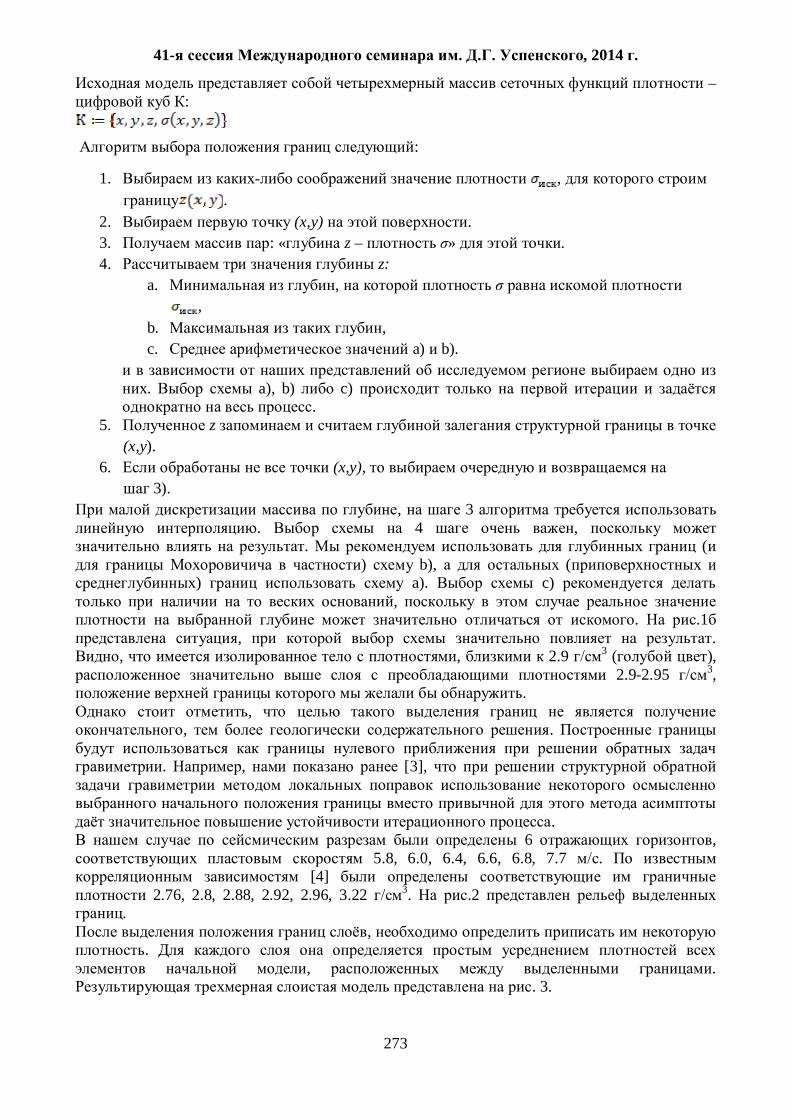
41- . . , 2014 .
273
– :
:
1. , .
2. (x,y) . 3. : « z – » . 4. z:
a. , ,
b. , c. a) b).
. a), b) c)
. 5. z
(x,y). 6. (x,y),
3). , 3
. 4 , . (
) b), ( ) a). c)
, . .1
, . , , 2.9 3 ( ),
2.9-2.95 3, .
, , .
. , [3],
. 6 ,
5.8, 6.0, 6.4, 6.6, 6.8, 7.7 . [4]
2.76, 2.8, 2.88, 2.92, 2.96, 3.22 3. .2 .
, .
, . . 3.

41- . . , 2014 .
274
. 2. : a) 2.76, b) 2.8, c) 2.88, d) 2.92, e) 2.96, f) 3.22 3
. 3. .
12- -5-2067 12- -15-2019.
1) ., ., ., ., .,
.
// . 2013. 2(22). . 31-45. 2) ., ., .
// . 2013. 450. 6. .702-707. 3) ., ., .
// . 2010. 11. . 23-35.
4) ., ., ., ., . //
. 2012. 1. . 30-34.

41- . . , 2014 .
275
550.831: 550.838
. 1, . 2, . 2, . 2, . 2, . 2
[email protected] 1 , . , ; 2
, . , According to the gravimetry and the magnetometry the folded structure of the sedimentary
cover and the basement of the North and the Middle Urals are discussed.
( ), ( ),
), , .
[1] 3D- 5,5-7,5 .
« » . ,
, , , , , , , . I-I ( ) 1 16. 1–8 ,
2- 8- , [2].
. , 2,
( « » ) [3].
, . 3
( ). .
. 4
( ). 4 5
( ) ( ) . 5, 6 7
( , , ). , 6 7
. ,
. ,
.
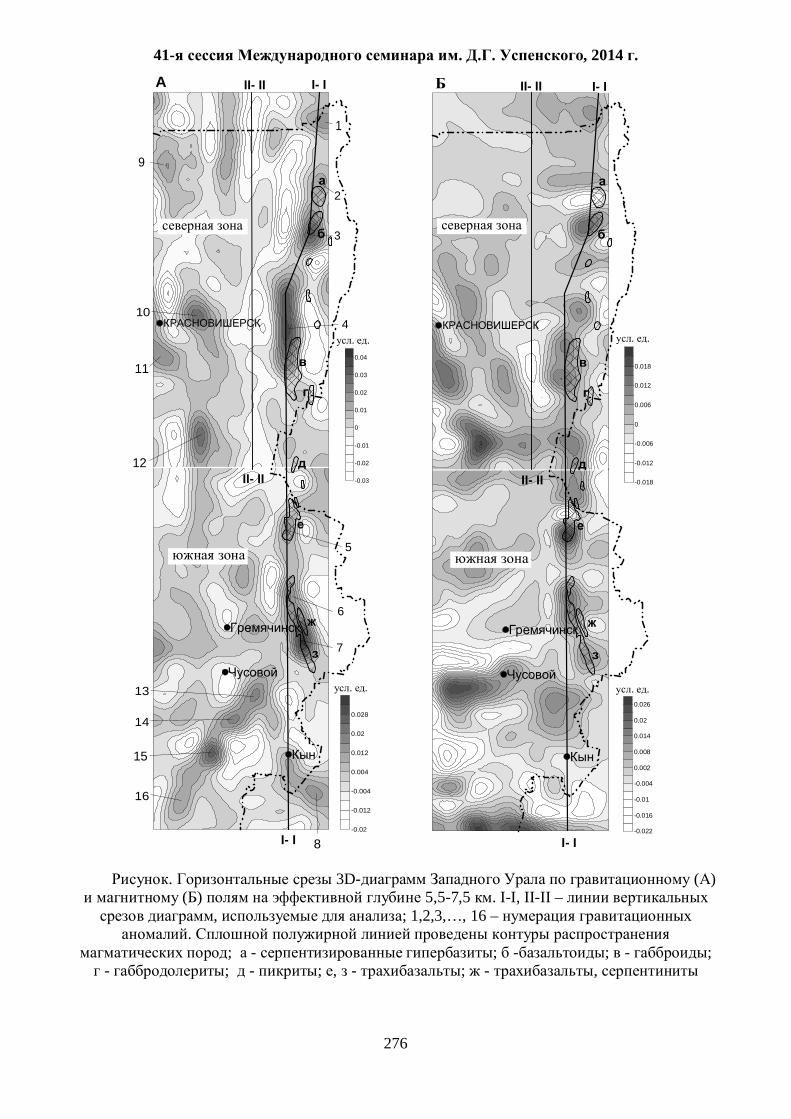
41- . . , 2014 .
276
50 100 -0.018
-0.012
-0.006
0
0.006
0.012
0.018
50 100 -0.03
-0.02
-0.01
0
0.01
0.02
0.03
0.04
-0.02
-0.012
-0.004
0.004
0.012
0.02
0.028
-0.022
-0.016
-0.01
-0.004
0.002
0.008
0.014
0.02
0.026
I- I I- I
9
2
3
4
5
6
7
8
16
15
14
13
12
11
10
1
II- II
II- II
II- II
II- II
A
. . . .
. .. .
I- I I- I
. 3D- ( ) ( ) 5,5-7,5 . I-I, II-II –
, ; 1,2,3,…, 16 – .
; - ; - ; - ; - ; - ; , - ; - ,

41- . . , 2014 .
277
, , – , , , , , .
J2b-bt. , . ,
. [4]
. [5]
.
( 58 30' – 61 00' . 52 00' – 56 00' .) ( 56 00' – 62 00' .
56 30' – 60 00' .) .
. , , , .
.
. , , .
, . - ( )
, –
, , .
.
1. ., ., ., ., .
// , 2011, 6. . 134-140.
2. ., ., . //
, : 32- . . . . . : 2005. . 55-
56. 3. ., ., ., ., .
// : . .
: . , 2011. . 32-35. 4. . . .:
», 1998. 412 . 5. . .
. : , 2000. 474 .

41- . . , 2014 .
278
: 550.831:550.838
« » . , . [email protected]
, ,
Some novel methods of gravimetry and magnetometry data processing in the “Vector”-system are reviewed.
,
) . ,
, , , . , , , .
, « »
. .
, », .
[1, 2, 3]. ,
. [4]. . (
) [5]. « »
( ). .
1. Vzx Vzy.
( . , 1988; . , 1963). – ,
, .
.
, ,
, . .
– – Sinc- ( .
, 1993).
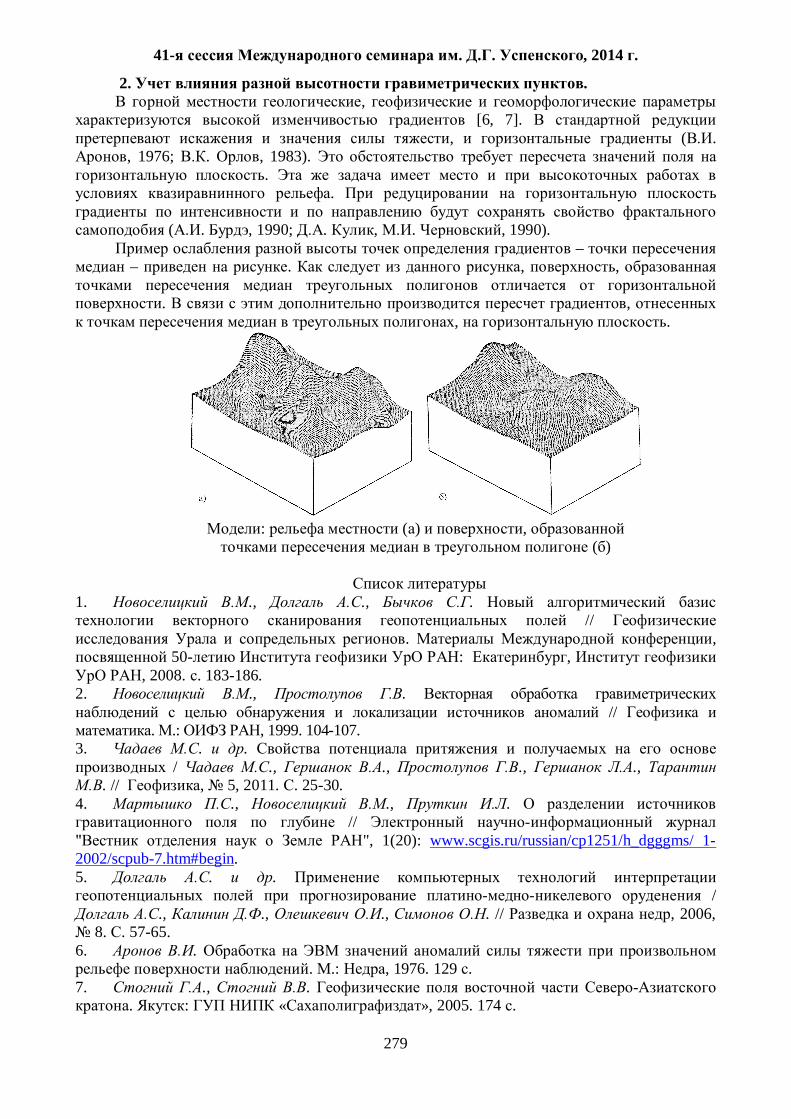
41- . . , 2014 .
279
2. . ,
[6, 7]. , ( .
, 1976; . , 1983). .
.
( . , 1990; . , . , 1990). –
– . , ,
. , , .
: ( ) ,
( )
1. ., ., .
// . ,
50- : , , 2008. . 183-186.
2. ., . //
. .: , 1999. 104-107. 3. . .
/ ., ., ., ., . // , 5, 2011. . 25-30.
4. ., ., . //
", 1(20): www.scgis.ru/russian/cp1251/h_dgggms/ 1-2002/scpub-7.htm#begin. 5. . .
/ ., ., ., . // , 2006,
8. . 57-65. 6. .
. .: , 1976. 129 . 7. ., .
. : « », 2005. 174 .
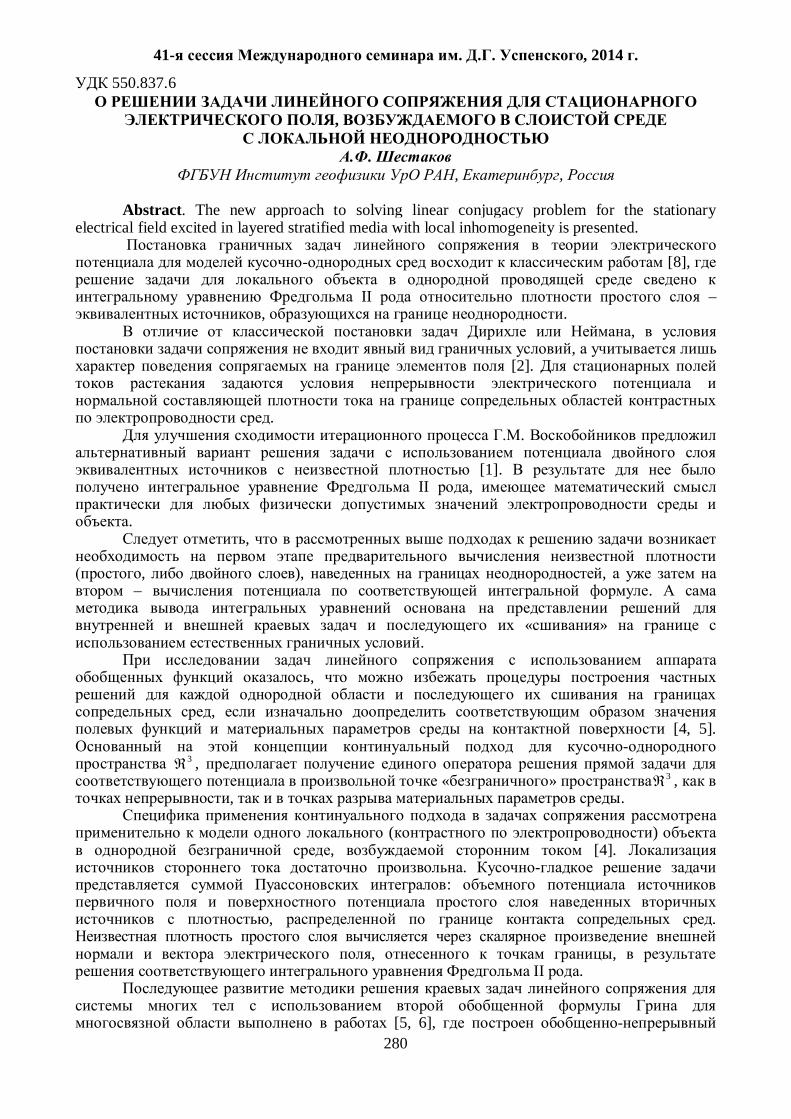
41- . . , 2014 .
280
550.837.6
,
. , ,
Abstract. The new approach to solving linear conjugacy problem for the stationary
electrical field excited in layered stratified media with local inhomogeneity is presented.
[8],
II – , .
, ,
[2].
. .
[1].
II ,
. ,
, ), ,
– .
« » .
,
,
[4, 5].
3 , « » 3 ,
, .
( ) , [4].
. :
, .
, ,
II .
[5, 6],

41- . . , 2014 .
281
, , ,
, .
, ,
.
, .
, .
II , .
, , 3 Di c
Si i (i = 0,…, K-1) , Dk c k Sk .
, E, UE ,
[8]: 0JEdiv JdivUdiv , (1)
J – . , [9],
( q) : q = ),(
iii MMIdiv J , (2)
Ii – , i , Mi – , – .
(1), (x) .
32 ,0 RxxxqU
xxU . (3)
(1) (3) (x) I . , ( ) ,
( S ) (3) .
[4-6] , (3)
.
(x) 3 ( i).
[6], Ri Di ,
R* , , Dk
R*.

41- . . , 2014 .
282
1/ x :
K
ii
iikx 1 1
1111 , , 0 ,0 ,0 ,2/1,0 ,1
Sii
Sii
Sii
i
RrRrRr
(4)
),(SiRr Si R* },,{r .
(3) , [5], 3 :
0)(1
0
2
xxqRrSU
K
iSii i
(5)
[2],
. iS ; i
iS :
iiiii S
i
S
i
ii
ii
S
i
i
ii
S
i
S
iii N
UNU
NU
NU
NUS 1
1
1
1
11 . (6)
, , ,
(5),
, .
|| MMMM xxr (5) (6) 1xW M « »
0CxMi , iS :
1
0
1
0 1
1 )(411
41
iMiM
K
i S MP
P
S
Pi
i
iiC
MCV c
cM xxW
rdS
NxUdV
rxxqxU
i iC
, (7)
iS iD , ,
[5-6]. (7),
)( MxU , , iD xM
. , :
1
01
1)()(4
1 K
iP
S MPSPii
iMa dS
rNxUxU
i i
, iM Dx . (8)
,
,

41- . . , 2014 .
283
[2]. , ( ),
xM iS .
. ( 3210
3 DDDD ) = 3, :
3D 2S 2D 1D 1S 0S .
(
) :
MS MPSS MPSS MPS
M xWdSrN
UdSrN
UdSrN
UxU2 11 10 0
14
14
14 1
32
1
21
1
10
(9) 0S 1S
(9) II , .
, (9), 2D ,
2S . K = 2 ( ), ,
0S , , (9)
. [7].
– S0 .
1. .
// . . . 1973. 9. . 63–75. 2. ., . . , « », 2000. – 400 . 3. ., . . ,
», 1959. – 472 . 4. ., .
// , : 34- . .
. . . – .: , 2007. .160–164. 5. ., .
// . . – : , 2009. . 280-285.
6. ., . // « ». 2009.
2. C. 46-56. 7. . . – :
, 1996. – 144 . 8. ., . .
– , « », 1937. – 998 . 9. : . 1. .: , 1989. – 440 .

41- . . , 2014 .
284
550.837 3D
. , , .
[email protected], [email protected]
), ,
This paper presents a new approximate-iteration neural network method of 3D inversion, allowing to solve 3D inverse geoelectrics problems on rectangular grids of optimal dimension. The total number of unknown parameters of the environment is about ~ n103. The principle of constructing the inverse problem grids of optimal dimension is based on the calculated values of the modulus of continuity of the inverse operator. An example of 3D inversion of simulated areal data, corresponding essentially three-dimensional environments are presented.
I 1( ,..., )Ns s s [1]:
, ,N M
NA s e s S R e R (1)
NA – , 1( , , )Me e e – , , S – NR .
( ) (1) ( ) 1, , Me e [3]:
1 1
L M
n nl lm ml m
s v g w e , 1, , ,n N (2)
g – , , ( ) 1/ (1 )xg x e , L – ,
, { }nlV v , { }lmW w – . ,
.
[2].
) 3D , 3D
~ n103 .
1,..., Ns s .
(2) 1 2...S S S ,
, .
, (1) [3]. (1)

41- . . , 2014 .
285
, [2]. . 3D
, . 11-07-00662 13-05-01135.
-6000IM .
1. . . . , ,2012. 2. ., .
// . – 2009. – 12. – .22–38. 3. .
// , 2013. 3. . 49-56.
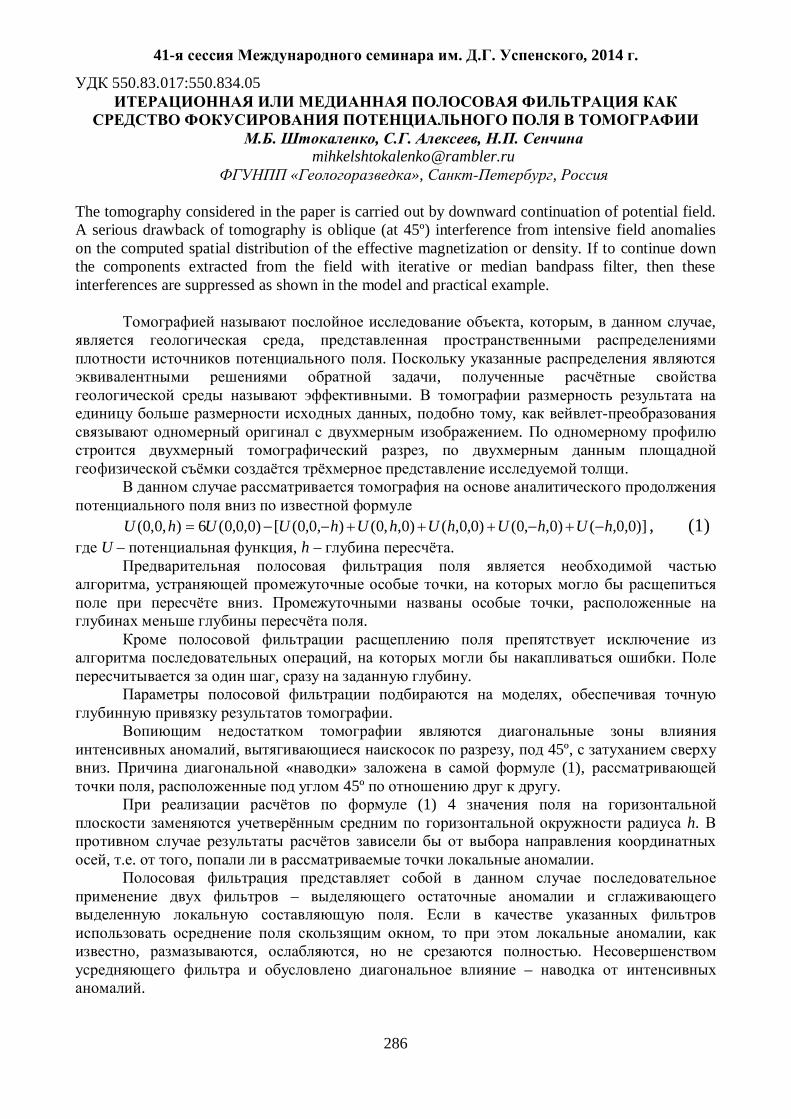
41- . . , 2014 .
286
550.83.017:550.834.05
. , . , .
[email protected] « », ,
The tomography considered in the paper is carried out by downward continuation of potential field. A serious drawback of tomography is oblique (at 45º) interference from intensive field anomalies on the computed spatial distribution of the effective magnetization or density. If to continue down the components extracted from the field with iterative or median bandpass filter, then these interferences are suppressed as shown in the model and practical example.
, , ,
, .
, . , ,
. ,
.
)]0,0,()0,,0()0,0,()0,,0(),0,0([)0,0,0(6),0,0( hUhUhUhUhUUhU , (1)
U – , h – .
, , . ,
.
, . , .
, .
, , 45º,
. « » (1), , 45º .
(1) 4 h.
, . , .
–
. , ,
, , , . –
.
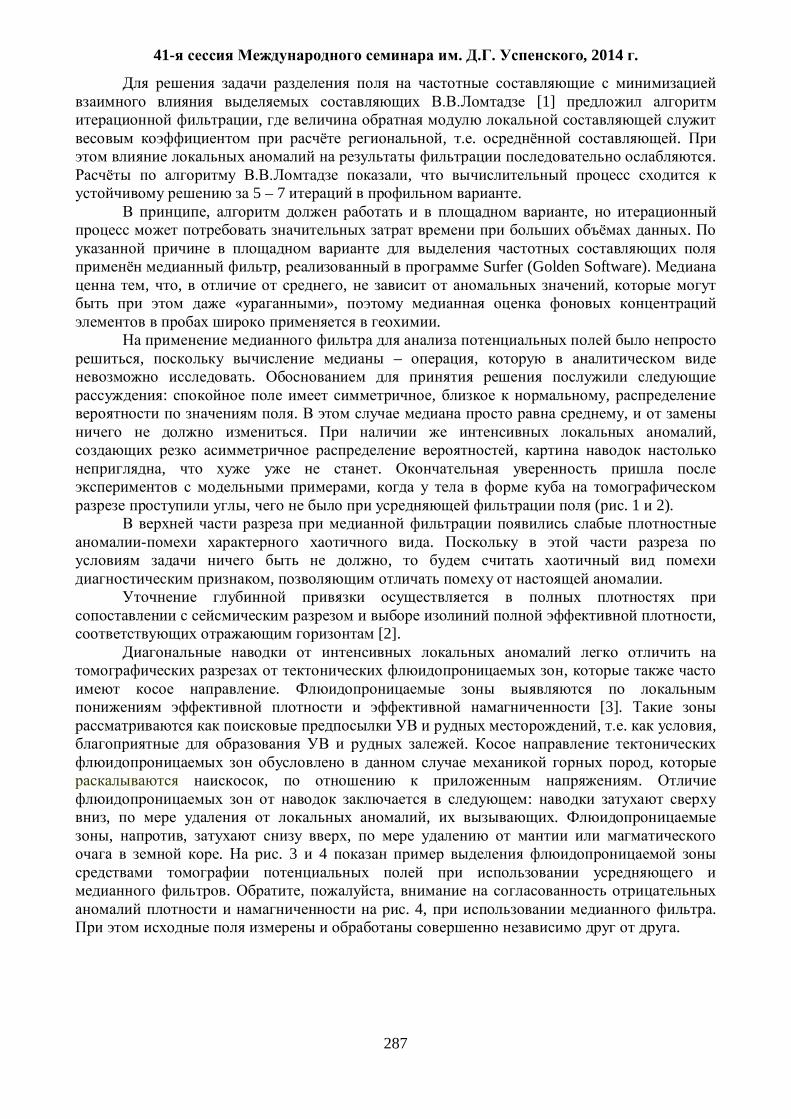
41- . . , 2014 .
287
[1]
, , . .
. ,
5 – 7 . , ,
.
, Surfer (Golden Software). , , , ,
« », .
, – ,
. : , ,
. , . ,
, , .
, , ( . 1 2).
.
, , .
,
[2].
, .
[3]. , . ,
. ,
, . :
, , . , , ,
. . 3 4
. , , . 4, .
.
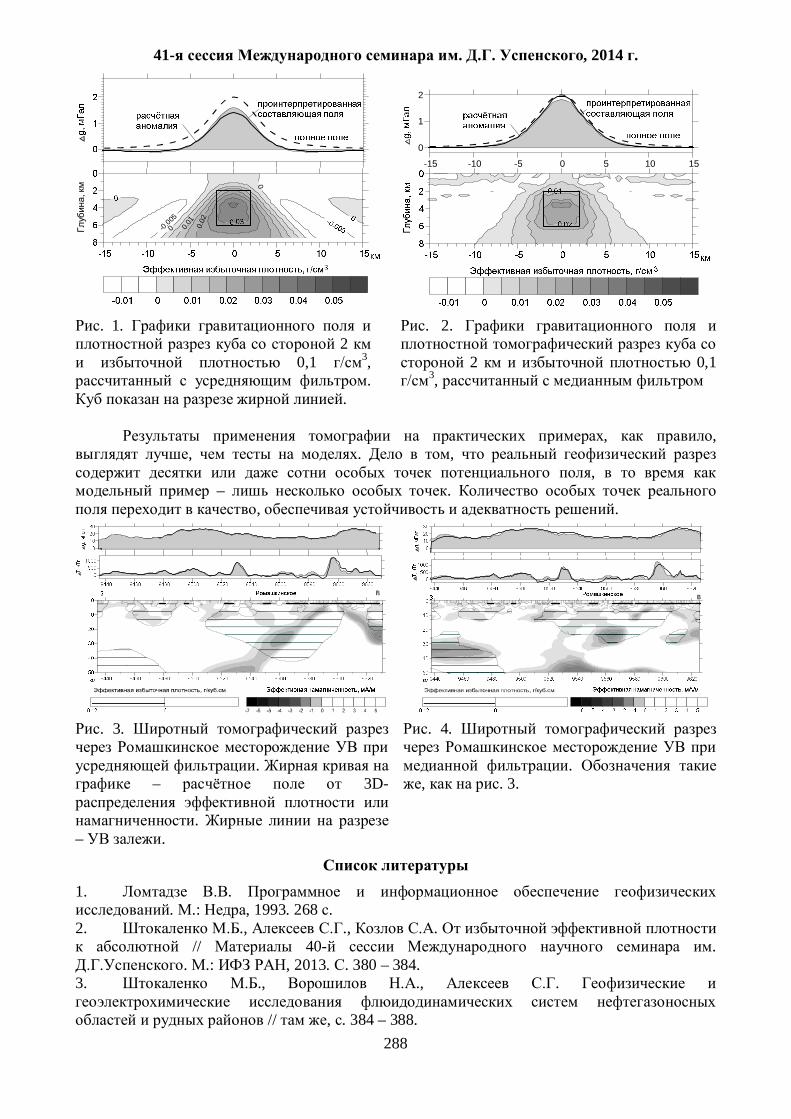
41- . . , 2014 .
288
-0.005
0
0 0.01
0.0
2
,
-15 -10 -5 0 5 10 15
0
1
2
. 1.
2 0,1 3,
. .
. 2.
2 0,1 3,
, ,
, . , ,
– . , .
. 3.
.
– 3D-
. – .
. 4.
. , . 3.
1. .
. .: , 1993. 268 . 2. ., ., .
// 40- . . .: , 2013. . 380 – 384.
3. ., ., .
// , . 384 – 388.
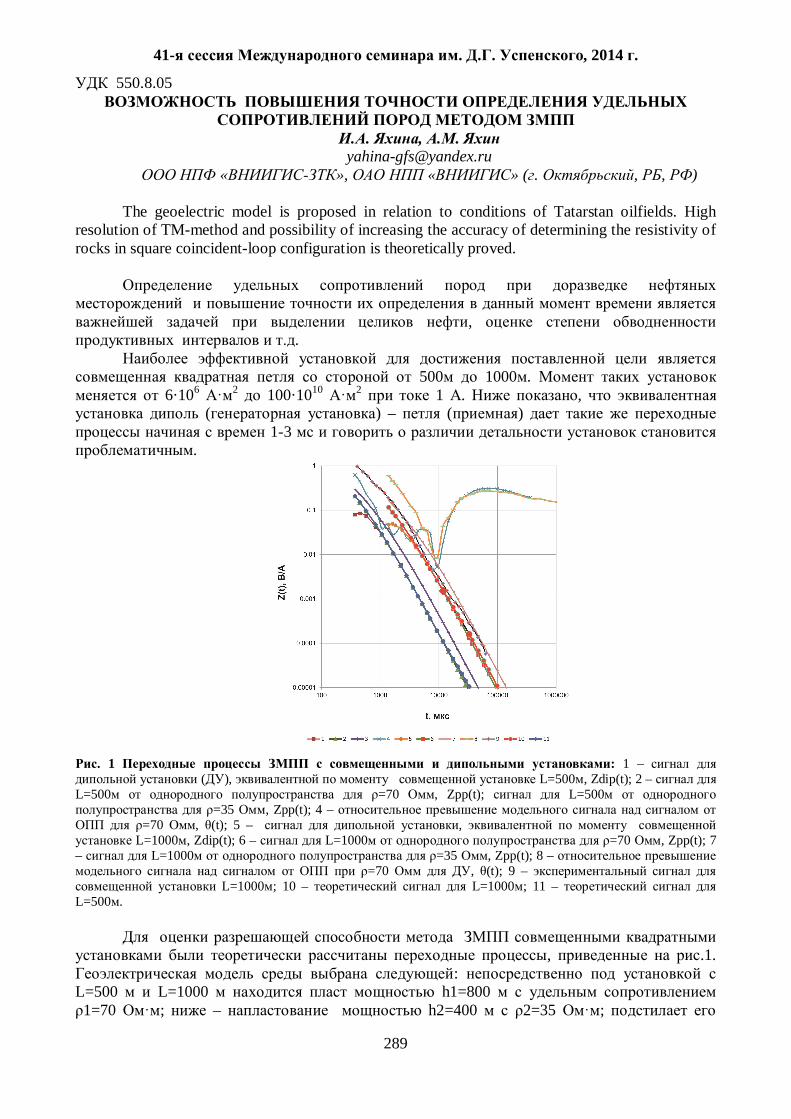
41- . . , 2014 .
289
550.8.05
. , .
[email protected] « », « » ( . , , )
The geoelectric model is proposed in relation to conditions of Tatarstan oilfields. High
resolution of TM-method and possibility of increasing the accuracy of determining the resistivity of rocks in square coincident-loop configuration is theoretically proved.
,
.
500 1000 . 6·106 2 100·1010 2 1 . ,
( ) – ( ) 1-3
.
. 1 : 1 –
( ), L=500 , Zdip(t); 2 – L=500 =70 , Zpp(t); L=500
=35 , Zpp(t); 4 – =70 , (t); 5 – ,
L=1000 , Zdip(t); 6 – L=1000 =70 , Zpp(t); 7 – L=1000 =35 , Zpp(t); 8 –
=70 , (t); 9 – L=1000 ; 10 – L=1000 ; 11 –
L=500 .
, .1.
: L=500 L=1000 h1=800 1=70 ; – h2=400 2=35 ;
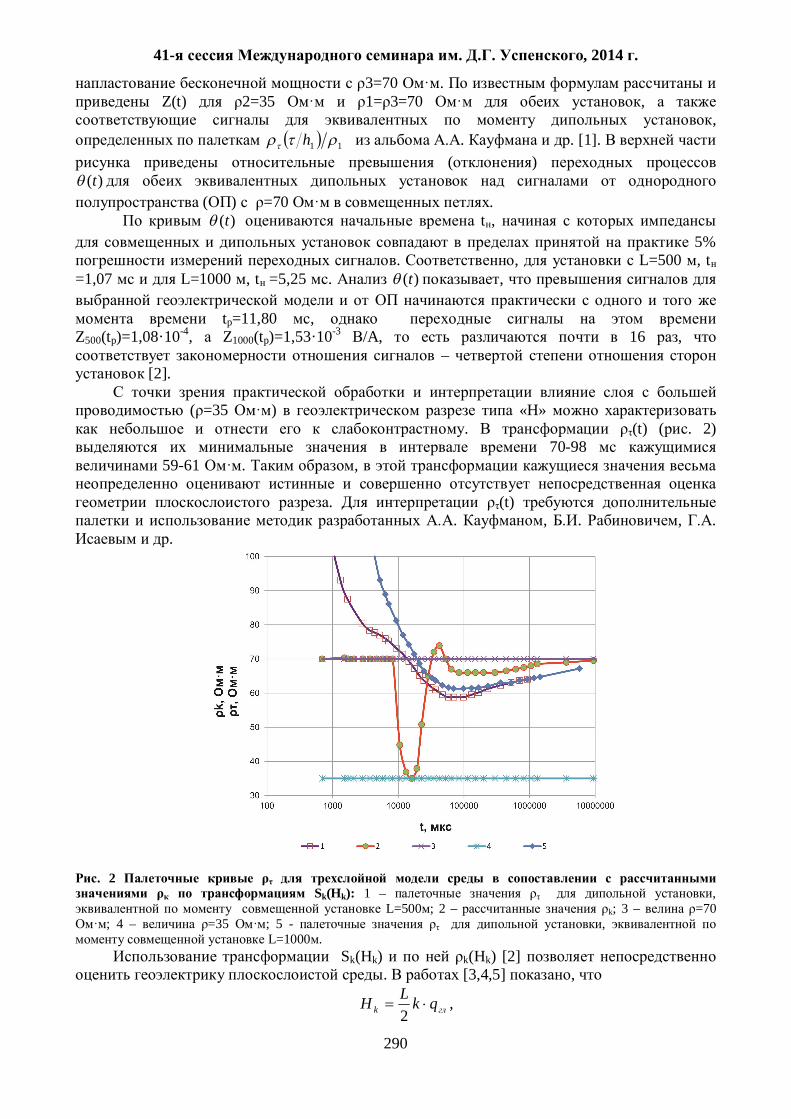
41- . . , 2014 .
290
3=70 . Z(t) 2=35 1= 3=70 ,
, 11h . . [1].
( ) )(t
( ) =70 . )(t t ,
5% . , L=500 , t
=1,07 L=1000 , t =5,25 . )(t ,
tp=11,80 , Z500(tp)=1,08·10-4, Z1000(tp)=1,53·10-3 /A, 16 ,
– [2].
( =35 ) «H»
. (t) ( . 2) 70-98
59-61 . ,
. (t) . , . , .
.
. 2 Sk(Hk): 1 – ,
L=500 ; 2 – k; 3 – =70 ; 4 – =35 ; 5 - ,
L=1000 . Sk(Hk) k(Hk) [2]
. [3,4,5] ,
k qkLH2
,
41- . . , 2014 .
291
k – , Sk(t) « »; q - ( . 0.67, 0.75),
k [4]. )(tn )(t [4]
Sk(t), Hk(t) , , k(H), . (t) k(t) . 2.
k(t) 70 . k(tmin)=35 tmin=16,08 .
tmax=42,80 k=74 k(t) 66 1=70
. Sk(Hk), h1 – 796 (t1=11,79 ),
1200 (t2=32,74 ).
. .
, ( ) ).
. [6]. )(tn , )(t ,
)( kk HS [5]. [4,5]
.
1.
: . 3 / . , . , . , . , . . . – , , 1970. – 105 .
2. . [ ] / . . – .: , 1985. – 192 .
3. . [ ] / . , . //
: XXIII . – : , 2009. – . 306-308.
4. . ( ) [ ] / . // . . « ». – 2011. – 3.
– C. 70-75. 5. .
( ) [ ] / . , . , .
// , : 40- .
. , .: . 2013. – . 396-400. 6.
[ ] / . , . , . , . , . //
: . – : « », 2008. – . 524-528.
41- . . , 2014 .
292
550.838
. , . , . , . , . ,
. . , . , Abstract. The new borehole equipment MESH-42 and MESHK-42 for simultaneous and
continuous measurements of geoacoustic emission in three frequency bands (100÷500 500÷5000 and 2500÷5000 Hz), electromagnetic radiation at three frequencies (40, 80 and 120 kHz) and the geomagnetic field (Z) or the magnetic susceptibility of rocks (æ) in wells to a depth of 5 km has developed in the Institute of Geophysics UB RAS
, ,
. , ( )
), , ,
. ,
, .
-42 -42, 5
(100÷500, 500÷5000 2500÷5000 ), (40, 80 120 ) . (Z)
(æ). , , .
.
» 2009 2010 . 24-28 2010 : 1) 120 05.0 25 , ; 2)
70 06.0 25 . , , ,
25.09.2010 23.53 81 .
. , ,
, . ,
, ,
. 12– -5-1044.

41- . . , 2014 .
293
550.832:681.5.03
., .
[email protected], [email protected] , . ,
The article is devoted to the development of scientific principles, methods and techniques of automated control of the primary data recorded in geophysical research in the wells. The decision on the termination of logging on certain well connected with the expert expressed the certainty of receiving the results of qualitative research. The author argues the need for automated detection of errors and quality control of the recorded data during or immediately upon completion of studies. A brief analysis of the symptoms of insecurity fragments record. An algorithm is proposed and discussed in detail the solution of mathematics assess the quality of data recording geophysical well with the use of iterative methods for modeling incomplete data using low-dimensional manifolds. Provides examples demonstrating the high efficiency of the iterative methods for modeling incomplete data using low-dimensional manifolds in the problem of filling the gaps of geophysical studies and the results of numerical experiments on solving the problem of data quality control electric logging.
( ) [1].
, , .
, . ,
, .
( ) , .
,
. : 1. ,
, , , , , .;
2. , , .
, , ;
3. , . ,
. , ,
,
.
[2], , . .
41- . . , 2014 .
294
, . ,
, .
[3]. , ,
– .
. ,
. , ,
. , , ,
, , .
.
,
, .
.
, .
( ) -, .
, , .
,
. ( – )
. :
1. ( ); 2. ( ); 3. .
— .
.
[4]. ,
: 1. ; 2. , ,
;

41- . . , 2014 .
295
3. , ( ,
, ).
: 1. ; 2. , ; 3. ( ) ; 4. ; 5. .
( . 1).
» . , « »
: 1. ; 2. ; 3. ; 4. .
.
, , .
. 1. .
1. 54362-2011 . . 2. ., .
. . . . . 1964. 7. . 87-94. 3. . . .:
, 1979. 4. .
. . 2000.

41- . . , 2014 .
296
« » . , .
« ». ,
.
15 2013 9 .21 . ,
, . .
1 . 2.3
. .
. « ,
, , .
, , 0,5—1 , .
.1).
,
G859 «Geometrix» [1]. GPS, 5 .
. ,
. ,
. . .2. ,
( . 6)
err=0.8 )
. (60.32072380E, 54.95965160N) .
( .3-7).
« »
. , .

41- . . , 2014 .
297
. 1. .
. , ., 21.02.2013.
.2. « »
20.02.2013). .
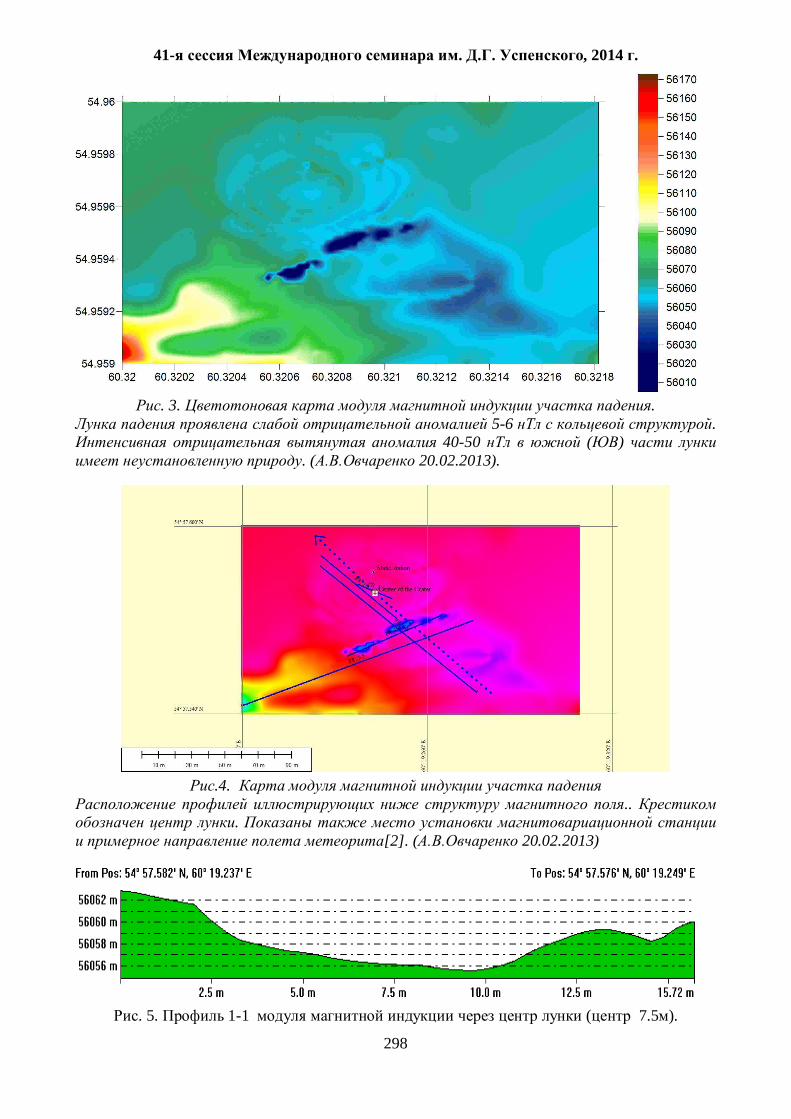
41- . . , 2014 .
298
. 3. .
5-6 . 40-50 ( )
. ( 20.02.2013).
.4.
.. .
[2]. ( 20.02.2013)
. 5. 1-1 ( 7.5 ).
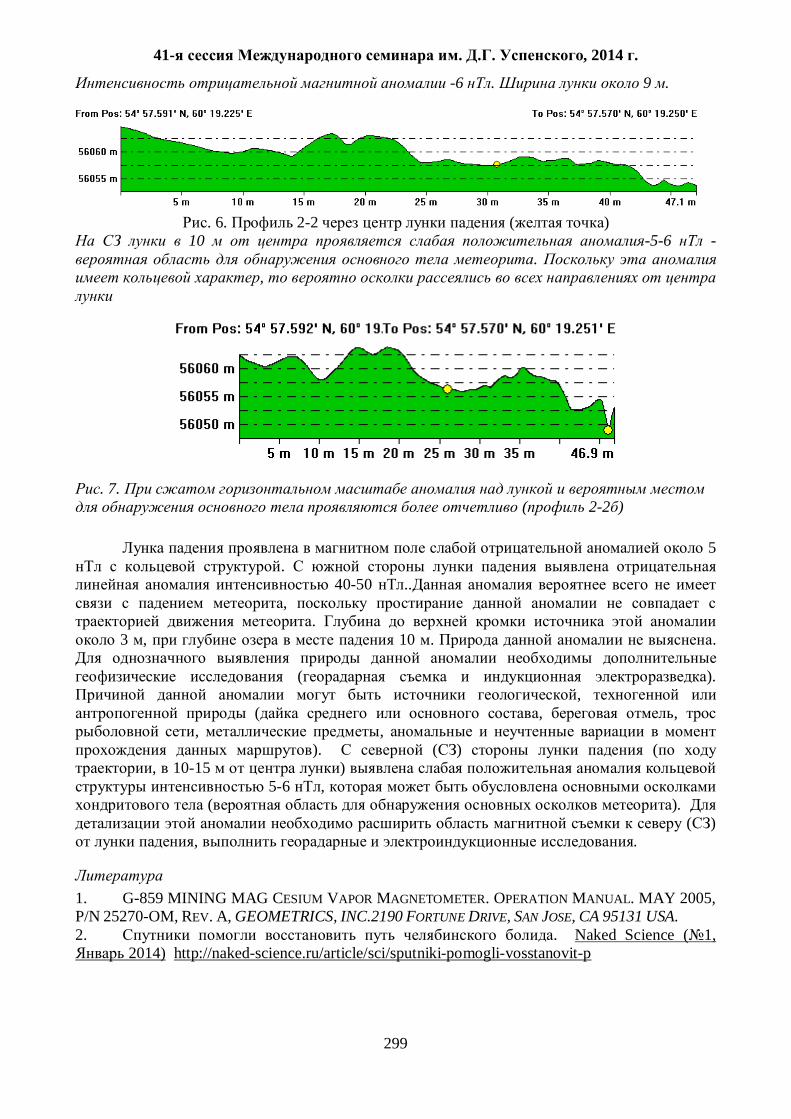
41- . . , 2014 .
299
-6 . 9 .
. 6. 2-2 ( )
10 -5-6 - .
,
. 7. ( 2-2 )
5
. 40-50 ..
, .
3 , 10 . .
( ). ,
( , , , ,
). ( ) ( , 10-15 )
5-6 , ( ).
( ) , .
1. G-859 MINING MAG CESIUM VAPOR MAGNETOMETER. OPERATION MANUAL. MAY 2005, P/N 25270-OM, REV. A, GEOMETRICS, INC.2190 FORTUNE DRIVE, SAN JOSE, CA 95131 USA. 2. . Naked Science ( 1,
2014) http://naked-science.ru/article/sci/sputniki-pomogli-vosstanovit-p

41- . . , 2014 .
300
550.35
. , . , . * [email protected]
,
, 1947 1964 .
.
, 1947 1964 0215 ( . ), -
. . ,
. -
, , ,
. , ,
. .
, , , , .
, , , .
235 238,
Se83 Eu156 [1]
50 . ,
, ,
/2 30 GPS, .
. 070203 080504.
, , , 6 .
. 5 5 .
68-01. NaJ/Tl. .
( ) ».
( ) .
3-3*105
2.

41- . . , 2014 .
301
13
13
13
1 414
14
14
15
1 5
15
15
16 16
16
16
16
1717
17
17
1818
1818
18
19
1 9
19
1920
20
20
21
21
21
21
22
22
23
2320 40 60 80 100 120 140
20
40
60
80
100
120
1112131415161718192021222324252627
. 1.
- 11-13 . , , : ,
, , 137. - ,
. ( ).
, . 1 (21- 23)
, K40 ( 1.46 ).
240 2 , ,
. : [2]
,
Rn + 4,6 Tn 100 3,
0,2 .
.

41- . . , 2014 .
302
20
40
020406080100120140160180200220
2. 2
50 :
Kr85 (10.27 . =1.25 *10-3 ), Sr90 –Y90 (28 , 64.3 . =1.57* 10-1 ) Cs137 (39 . =8.46*10-2 ) Ba137m (2.57 ) Sm151 (80 . =4.81*10-3 )
, ,
.
.
1. . U235 U238 Pu239 . 1964 . 68 .
2. . –99/2009. – .: , 1999. 115 .
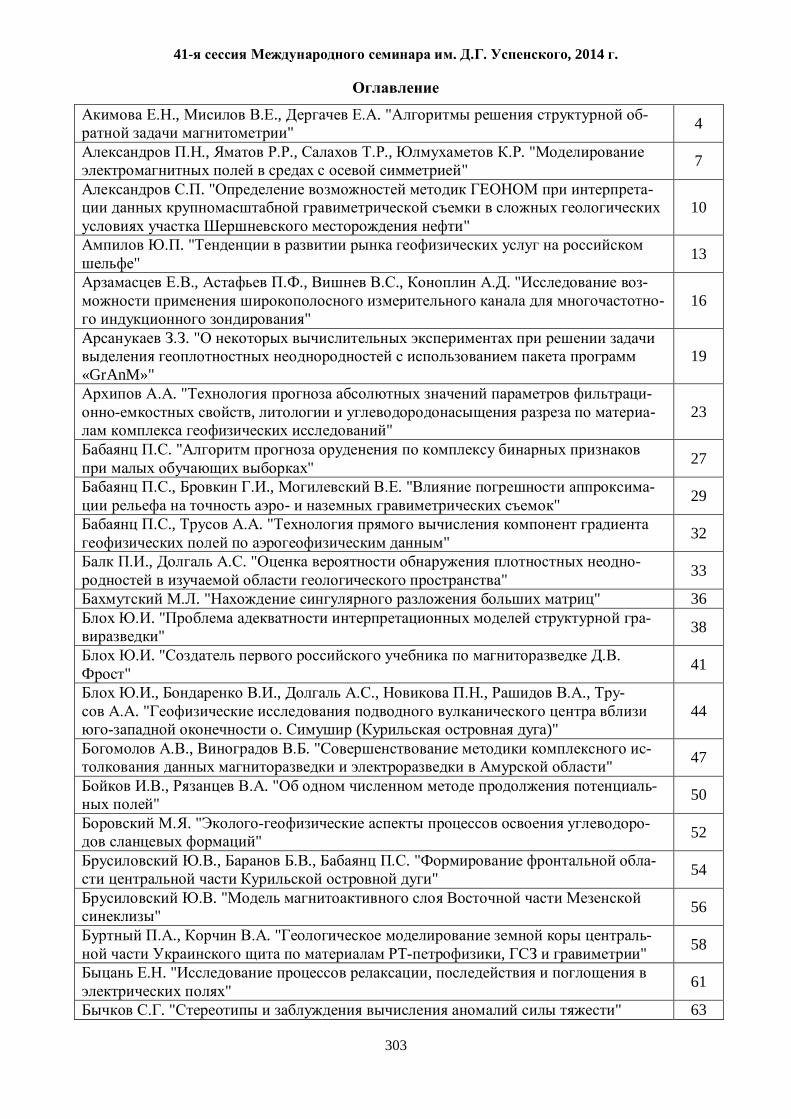
41- . . , 2014 .
303
., ., . " -" 4
., ., ., . " " 7
. " -
" 10
. " " 13
., ., ., . " --
" 16
. "
«GrAnM»" 19
. " -, -
" 23
. " " 27
., ., . " -- " 29
., . " " 32
., . " -" 33
. " " 36 . " -" 38
. " . " 41
., ., ., ., ., -. "
. ( )" 44
., . " -" 47
., . " -" 50
. " -" 52
., ., . " -" 54
. " " 56
., . " -, " 58
. " , " 61
. " " 63
41- . . , 2014 .
304
., ., . - 66
., ., ., ., . " TESZ : -
3D " 69
., ., . " -" 72
., ., . " " 75
. " )" 78
., . " ( )" 82
. " , " 84
., ., ., . " -
" 87
., . " -
" 90
. " - ( ) " 93
., ., . " -" 96
. " - (
)" 99
., ., . " " 102
., . " - 2D -
" 105
., . " – - " 108
. " - ( ) " 111
. " " 114
., . "
" 117
. " Z- IGRF 1980-2005 " 121
., ., . " -" 125
., ., ., . "
" 128
41- . . , 2014 .
305
., ., ., . " --
" 131
., . " --
" 134
. " – -" 137
. " -" 139
., . " - ( )" 141
., ., ., ., . " -
( )" 144
., ., . " " 147
., ., ., . " 3D " 150
., ., ., . " " 153
. "3D " 156
., . " -" 159
., . " " 162
., Panet I., Hayn M., ., Bonvalot S., ., Dia-ment M., deViron ., . "
-"
165
. " " 168
., ., . " -" 171
. " " 174
., ., . " " 178
., ., . " " 181
., . " -" 183
. " - ( )" 186
., ., ., . "
" 189
., ., . " -" 192
41- . . , 2014 .
306
., . " -" 195
., . " -" 198
. "
( )" 202
., ., ., . " - (
)" 205
., . " " 208
., . " -
" 212
., ., . " -: " " " 215
. " : -, " 218
. " -" 221
. " -" 223
. " " 226
., ., ., . "3-D --
" 229
. " -" 232
. " -" 235
., . " " 238
., . " -" 240
., . " - ( )" 242
. " " 244 . "
GeoModel" 247
., . " " 250 ., . " -
" 253
., ., . " - Scintrex" 254
., ., ., ., . " - - ( -
)" 257
41- . . , 2014 .
307
., ., ., . " -
" 260
. . " -
" 263
., . " -" 266
., . " " 269
. " " 272
., ., ., ., ., -. " -
"
275
., . " - « »" 278
. " -, " 280
., ., . "A 3D " 284
., ., . " -" 286
., . " " 289
., ., ., ., ., -. " -
" 292
., . " " 293
., . " « -»" 296
., ., . " -" 299
,
41- . .
. .
8 (14) 01.09.2014 . 60x84 1/8
. . . 16.5, .- . . 16.5 100 . 87
620016 , . , 100
« », 620000, . , . , 83