Rose−Hudgins: Bank Management and Financial Services, Seventh Edition II. Financial Statements and...
42
Rose-Hudgins: Bank Management and Financial Services, Seventh Edition II. Financial Statements and Financial Firm Performance 6. Measuring and Evaluating the Performance of Banks and Their Principal Competitors © The McGraw-Hill Companies, 2008 CHAPTER SIX Measuring and Evaluating the Performance of Banks and Their Principal Competitors Key Topics in This Chapter • Stock Values and Profitability Ratios • Measuring Credit, Liquidity, and Other Risks • Measuring Operating Efficiency • Performance of Competing Financial Firms • Size and Location Effects • The UBPR and Comparing Performance 6–1 Introduction Humorist and poet Ogden Nash once wrote, “Bankers are just like anybody else, except richer.” It turns out that statement may or may not be true; a lot depends upon how suc- cessful bankers and other financial-service managers are as performers in the financial marketplace. Indeed, in today’s world, bankers and their competitors are under great pres- sure to perform well all the time. What do we mean by the word perform when it comes to financial firms? In this case performance refers to how adequately a financial firm meets the needs of its stockholders (owners), employees, depositors and other creditors, and borrowing customers. At the same time, financial firms must find a way to keep government regulators satisfied that their operating policies, loans, and investments are sound, protecting the public interest. The success or lack of success of these institutions in meeting the expectations of others is usually revealed by a careful study of their financial statements. Why are financial statements under such heavy scrutiny today? One key reason is that banks and other financial institutions now depend heavily upon the open market to raise the funds they need, selling stocks, bonds, and short-term IOUs (including deposits). Entry into the open market to raise money means that a financial firm’s financial statements will 163
-
Upload
independent -
Category
Documents
-
view
3 -
download
0
Transcript of Rose−Hudgins: Bank Management and Financial Services, Seventh Edition II. Financial Statements and...
Rose−Hudgins: Bank Management and Financial Services, Seventh Edition
II. Financial Statements and Financial Firm Performance
6. Measuring and Evaluating the Performance of Banks and Their Principal Competitors
© The McGraw−Hill Companies, 2008
C H A P T E R S I X
Measuring andEvaluating thePerformance of Banksand Their PrincipalCompetitorsKey Topics in This Chapter
• Stock Values and Profitability Ratios
• Measuring Credit, Liquidity, and Other Risks
• Measuring Operating Efficiency
• Performance of Competing Financial Firms
• Size and Location Effects
• The UBPR and Comparing Performance
6–1 IntroductionHumorist and poet Ogden Nash once wrote, “Bankers are just like anybody else, exceptricher.” It turns out that statement may or may not be true; a lot depends upon how suc-cessful bankers and other financial-service managers are as performers in the financialmarketplace. Indeed, in today’s world, bankers and their competitors are under great pres-sure to perform well all the time.
What do we mean by the word perform when it comes to financial firms? In this caseperformance refers to how adequately a financial firm meets the needs of its stockholders(owners), employees, depositors and other creditors, and borrowing customers. At thesame time, financial firms must find a way to keep government regulators satisfied thattheir operating policies, loans, and investments are sound, protecting the public interest.The success or lack of success of these institutions in meeting the expectations of others isusually revealed by a careful study of their financial statements.
Why are financial statements under such heavy scrutiny today? One key reason is thatbanks and other financial institutions now depend heavily upon the open market to raisethe funds they need, selling stocks, bonds, and short-term IOUs (including deposits). Entryinto the open market to raise money means that a financial firm’s financial statements will
163
Rose−Hudgins: Bank Management and Financial Services, Seventh Edition
II. Financial Statements and Financial Firm Performance
6. Measuring and Evaluating the Performance of Banks and Their Principal Competitors
© The McGraw−Hill Companies, 2008
be gone over “with a fine tooth comb” by stock and bond market investors, credit ratingagencies (such as Moody’s and Standard & Poor’s), regulators, and scores of other peopleand institutions.
This development has placed the management of banks and many of their competitorsunder great pressure to set and meet the institution’s performance goals or suffer seriousfinancial and reputational losses. In 2002 J. P. Morgan Chase, the second largest bankingcompany in the United States, became a prominent example. The firm’s credit ratingcame under review and, for a time, it faced rising borrowing costs as major depositors andother creditors reacted negatively to the bank’s potential loan losses and the adverse pub-licity from its alleged involvement with Enron Corporation and other troubled companies.Subsequently, J. P. Morgan Chase’s position strengthened and improved.
At the same time, as we saw in Chapters 1–4, competition for traditional loan and depositcustomers has increased dramatically. Credit unions, money market funds, insurance com-panies, brokerage firms and security dealers, and even chain stores are fighting for a biggerslice of nearly every credit or deposit market. Bankers have been called upon to continuallyreevaluate their loan and deposit policies, review their plans for growth and expansion, andassess their returns and risk exposure in light of this new competitive environment.
In this chapter we take a detailed look at the most widely used indicators of the quality andquantity of bank performance and at some performance indicators used to measure banking’sprincipal competitors. The chapter centers on the most important dimensions of perfor-mance—profitability and risk. After all, financial institutions are simply businesses organized tomaximize the value of the shareholders’ wealth invested in the firm at an acceptable level ofrisk. The objectives of maximum (or at least satisfactory) profitability with a level of riskacceptable to the institution’s owners is not easy to achieve, as recent institutional failuresaround the globe suggest. Aggressive pursuit of such an objective requires a financial firm tobe continually on the lookout for new opportunities for revenue growth, greater efficiency,and more effective planning and control. The pages that follow examine the most importantmeasures of return and risk for banks and some of their toughest competitors.
6–2 Evaluating PerformanceHow can we use financial statements, particularly the Report of Condition (balance sheet)and Report of Income (income statement), to evaluate how well a financial firm is per-forming? What do we look at to help decide if a financial institution is facing serious prob-lems that its management should deal with?
Determining Long-Range ObjectivesThe first step in analyzing financial statements is to decide what objectives the bank orother financial firm is seeking. Performance must be directed toward specific objectives. Afair evaluation of any financial firm’s performance should start by evaluating whether ithas been able to achieve the objectives its management and stockholders have chosen.
Certainly many financial institutions have their own unique objectives. Some wish togrow faster and achieve some long-range growth objective. Others seem to prefer the quietlife, minimizing risk and conveying the image of a sound institution, but with modestrewards for their shareholders.
Maximizing the Value of the Firm: A Key Objective for Nearly All Financial-Service InstitutionsWhile all of the foregoing goals have something to recommend them, increasingly finan-cial-service corporations are finding they must pay close attention to the value of their
164 Part Two Financial Statements and Financial Firm Performance

Rose−Hudgins: Bank Management and Financial Services, Seventh Edition
II. Financial Statements and Financial Firm Performance
6. Measuring and Evaluating the Performance of Banks and Their Principal Competitors
© The McGraw−Hill Companies, 2008
stock. Indeed, the basic principles of financial management, as that science is practicedtoday, suggest strongly that attempting to maximize a corporation’s stock value is the keyobjective that should have priority over all others. If the stock fails to rise in value com-mensurate with stockholder expectations, current investors may seek to unload theirshares and the financial institution will have difficulty raising new capital to support itsfuture growth. Clearly, then, management should pursue the objective of maximizing thevalue of the financial firm’s stock.
What will cause a financial firm’s stock to rise in value? Each institution’s stock price isa function of the
(6–1)
where E(Dt) represents stockholder dividends expected to be paid in future periods, dis-counted by a minimum acceptable rate of return (r) tied to the financial firm’s perceivedlevel of risk. The minimum acceptable rate of return, r, is sometimes referred to as an insti-tution’s cost of capital and has two main components: (1) the risk-free rate of interest (oftenproxied by the current yield on government bonds) and (2) the equity risk premium(which is designed to compensate an investor for accepting the risk of investing in a finan-cial firm’s stock rather than in risk-free securities).
The value of the financial firm’s stock will tend to rise in any of the following situations:
1. The value of the stream of future stockholder dividends is expected to increase, due per-haps to recent growth in some of the markets served or perhaps because of profitableacquisitions the organization has made.
2. The financial organization’s perceived level of risk falls, due perhaps to an increase inequity capital, a decrease in its loan losses, or the perception of investors that the institu-tion is less risky overall (perhaps because it has further diversified its service offerings andexpanded the number of markets it serves) and, therefore, has a lower equity risk premium.
3. Market interest rates decrease, reducing shareholders’ acceptable rates of return via therisk-free rate of interest component of all market interest rates.
4. Expected dividend increases are combined with declining risk, as perceived by investors.Research evidence over the years has found the stock values of financial institutions to
be especially sensitive to changes in market interest rates, currency exchange rates, andthe strength or weakness of the economy that each serves. Clearly, management can workto achieve policies that increase future earnings, reduce risk, or pursue a combination ofboth actions in order to raise its company’s stock price.
The formula for the determinants of a financial firm’s stock price presented in Equation(6–1) assumes that the stock may pay dividends of varying amounts over time. However, ifthe dividends paid to stockholders are expected to grow at a constant rate over time, perhapsreflecting steady growth in earnings, the stock price equation can be greatly simplified intothe form
Po � D1/(r � g) (6–2)
where D1 is the expected dividend on stock in period 1, r is the rate of discountreflecting the perceived level of risk attached to investing in the stock, g is the
Value ofstock1Po 2
�
Expected stream of futurestockholder dividends
Discount factor 1based onthe minimum required marketrate of return on equity capital
given each financial firm'sperceived level of risk 2
� aq
t�0
E1Dt 211 � r 2 t
Chapter 6 Measuring and Evaluating the Performance of Banks and Their Principal Competitors 165
Key URLsThe mostcomprehensive sites onthe World Wide Webfor the financialstatements of individualbanks and for theindustry as a whole arewww2.fdic.gov/sdiand www.ffiec.gov/nicpubweb/nicweb/nichome.aspx.

Rose−Hudgins: Bank Management and Financial Services, Seventh Edition
II. Financial Statements and Financial Firm Performance
6. Measuring and Evaluating the Performance of Banks and Their Principal Competitors
© The McGraw−Hill Companies, 2008
expected constant growth rate at which stock dividends will grow each year, and rmust be greater than g.
For example, suppose that a bank is expected to pay a dividend of $5 per share in period 1,dividends are expected to grow 6 percent a year thereafter, and the appropriate discount rateto reflect shareholder risk is 10 percent. Then the bank’s stock price must be valued at
Po � $5/(0.10 � 0.06) � $125 per share
The two stock-price formulas discussed above assume the financial firm will pay div-idends indefinitely into the future. Most capital-market investors have a limited timehorizon, however, and plan to sell the stock at the end of their planned investmenthorizon. In this case the current value of a financial corporation’s stock is determinedfrom
(6–3)
where we assume the investor will hold the stock for n periods, receiving the stream of div-idends D1 D2, ..., Dn, and sell the stock for price Pn at the end of the planned investmenthorizon. For example, suppose investors expect a bank to pay a $5 dividend at the end ofperiod 1, $10 at the end of period 2, and then plan to sell the stock for a price of $150 pershare. If the relevant discount rate to capture risk is 10 percent, the current value of thebank’s stock should approach:
Po �$5
11 � 0.10 2 1 �$10
11 � 0.10 2 2 �$150
11 � 0.10 2 2 � $136.78 per share1
Po �D1
11 � r 2 1 �D2
11 � r 2 2 � p �Dn
11 � r 2n �Pn
11 � r 2n
166 Part Two Financial Statements and Financial Firm Performance
1A financial calculator can be used to help solve the above equation for stock price per share where N = 2, I/Y = 10, PV = (?),Pmt = 5, FV = 155.
Profitability Ratios: A Surrogate for Stock ValuesWhile the behavior of a stock’s price is, in theory, the best indicator of a financial firm’sperformance because it reflects the market’s evaluation of that firm, this indicator is oftennot available for smaller banks and other relatively small financial-service corporationsbecause the stock issued by smaller institutions is frequently not actively traded in inter-national or national markets. This fact forces the financial analyst to fall back on surro-gates for market-value indicators in the form of various profitability ratios.
Concept Check
6–1. Why should banks and other corporate financialfirms be concerned about their level of profitabilityand exposure to risk?
6–2. What individuals or groups are likely to be interestedin these dimensions of performance for a financialinstitution?
6–3. What factors influence the stock price of a financial-service corporation?
6–4. Suppose that a bank is expected to pay an annualdividend of $4 per share on its stock in the currentperiod and dividends are expected to grow 5 percenta year every year, and the minimum required returnto equity capital based on the bank’s perceived levelof risk is 10 percent. Can you estimate the currentvalue of the bank’s stock?

Rose−Hudgins: Bank Management and Financial Services, Seventh Edition
II. Financial Statements and Financial Firm Performance
6. Measuring and Evaluating the Performance of Banks and Their Principal Competitors
© The McGraw−Hill Companies, 2008
Key Profitability RatiosAmong the most important ratio measures of profitability used today are the following:
(6–4)
(6–5)
(6–6)
(6–7)
(6–8)
(6–9)
Like all financial ratios, each of these profitability measures often varies substantially overtime and from market to market.
Interpreting Profitability RatiosEach of the foregoing ratios looks at a slightly different aspect of profitability. Thus, returnon assets (ROA) is primarily an indicator of managerial efficiency; it indicates how capablemanagement has been in converting assets into net earnings. Return on equity (ROE), onthe other hand, is a measure of the rate of return flowing to shareholders. It approximates the
Earnings per shareof stock 1EPS 2 �
Net incomeCommon equity shares outstanding
Net operating margin �
a Total operating revenues� Total operating expenses
bTotal assets
Net noninterestmargin
�
a Noninterest revenues� Noninterest expenses
bTotal assets2
Net interest margin �
a Interest income� Interest expense
bTotal assets2
Return on assets1ROA 2 �
Net incomeTotal assets
Return on equity capital1ROE 2 �Net income
Total equity capital
Chapter 6 Measuring and Evaluating the Performance of Banks and Their Principal Competitors 167
FINANCIAL FIRMS IMPROVE PERFORMANCE BY OUTSOURCINGFinancial firms utilize information handled by computers fornearly every service they offer. As electronic data processingof financial information becomes more and more integral to thefunctions of financial-service firms, their managers can realizecost advantages from outsourcing—transferring tasks frominside the financial firm itself to outside firms specializing ininformation technology, known as vendors. Often the vendorsare centered in distant locations, such as China, India, andCosta Rica.
Institutions like Wachovia Bank, Bank of America, and Germany’s Deutsche Bank have become leaders in the adoptionof outsourcing designed to reduce the cost of operations. By out-sourcing computer facilities and people, these leading financial-service firms hope to save money and time while improvingoverall accuracy. Savings on personnel and equipment are obvi-ous benefits, but outsourcing also improves efficiency by elimi-nating “dead time” when a financial firm’s computer equipmentand staff are not being fully utilized. Through outsourcing, finan-cial institutions are basically “renting” the facilities and employ-ees of the vendor on an “as needed” basis.
E - B A N K I N G A N D E - C O M M E R C E
FactoidContrary to popularopinion, the largestbanks in the industryare not always the mostprofitable. The same istrue for the smallestbanks. The highestROAs and ROEs oftenlie among medium-sizeinstitutions.
2Many authorities prefer to use total earning assets in the denominator of the net interest margin and noninterest margin.Earning assets are those generating interest or fee income, principally loans and security investments. The reasoning is thatnet interest income as well as net noninterest income should be compared, not to all assets, but rather to those assets thataccount for the majority of all income.

Rose−Hudgins: Bank Management and Financial Services, Seventh Edition
II. Financial Statements and Financial Firm Performance
6. Measuring and Evaluating the Performance of Banks and Their Principal Competitors
© The McGraw−Hill Companies, 2008
net benefit that the stockholders have received from investing their capital in the finan-cial firm (i.e., placing their funds at risk in the hope of earning a suitable profit).
The net operating margin, net interest margin, and net noninterest margin are efficiencymeasures as well as profitability measures, indicating how well management and staff havebeen able to keep the growth of revenues (which come primarily from loans, investments,and service fees) ahead of rising costs (principally the interest on deposits and other borrow-ings and employee salaries and benefits). The net interest margin measures how large aspread between interest revenues and interest costs management has been able to achieve byclose control over earning assets and pursuit of the cheapest sources of funding. The net non-interest margin, in contrast, measures the amount of noninterest revenues stemming fromservice fees the financial firm has been able to collect relative to the amount of noninterestcosts incurred (including salaries and wages, repair and maintenance of facilities, and loan-loss expenses). Typically, the net noninterest margin is negative: Noninterest costs generallyoutstrip fee income, though fee income has been rising rapidly in recent years as a percent-age of all revenues.
Another traditional measure of earnings efficiency is the earnings spread, or simply thespread, calculated as follows:
(6–10)
The spread measures the effectiveness of a financial firm’s intermediation function in bor-rowing and lending money and also the intensity of competition in the firm’s marketarea. Greater competition tends to squeeze the difference between average asset yieldsand average liability costs. If other factors are held constant, the spread will decline ascompetition increases, forcing management to try to find other ways (such as generatingfee income from new services) to make up for an eroding earnings spread.
Earningsspread
�Total interest incomeTotal earning assets
�Total interest expenseTotal interest-bearing
liabilities
168 Part Two Financial Statements and Financial Firm Performance
Concept Check
6–5. What is return on equity capital and what aspectof performance is it supposed to measure? Canyou see how this performance measure might beuseful to the managers of financial firms?
6–6. Suppose a bank reports that its net income for thecurrent year is $51 million, its assets total $1,144million, and its liabilities amount to $926 million.What is its return on equity capital? Is the ROE youhave calculated good or bad? What information doyou need to answer this last question?
6–7. What is the return on assets (ROA), and why is itimportant? Might the ROA measure be important tobanking’s key competitors?
6–8. A bank estimates that its total revenues will amountto $155 million and its total expenses (includingtaxes) will equal $107 million this year. Its liabilitiestotal $4,960 million while its equity capital amounts
to $52 million. What is the bank’s return on assets?Is this ROA high or low? How could you find out?
6–9. Why do the managers of financial firms often payclose attention today to the net interest margin andnoninterest margin? To the earnings spread?
6–10. Suppose a banker tells you that his bank in the yearjust completed had total interest expenses on allborrowings of $12 million and noninterest expensesof $5 million, while interest income from earningassets totaled $16 million and noninterest revenuestotaled $2 million. Suppose further that assetsamounted to $480 million, of which earning assetsrepresented 85 percent of that total while totalinterest-bearing liabilities amounted to 75 percent oftotal assets. See if you can determine this bank’s netinterest and noninterest margins and its earningsbase and earnings spread for the most recent year.

Rose−Hudgins: Bank Management and Financial Services, Seventh Edition
II. Financial Statements and Financial Firm Performance
6. Measuring and Evaluating the Performance of Banks and Their Principal Competitors
© The McGraw−Hill Companies, 2008
Useful Profitability Formulas for Banks and Other Financial-Service CompaniesIn analyzing how well any given financial-service firm is performing, it is often useful tobreak down some of these profitability ratios into their key components. For example, it iseasy to see that ROE and ROA, two of the most popular profitability measures in usetoday, are closely related. Both use the same numerator: net income. Therefore, these twoprofit indicators can be linked directly:
(6–11)
Or, in other words:
(6–12)
But we note that net income is equal to total revenues minus operating expenses and taxes.Therefore,
(6–13)
The relationships in Equations (6–12) and (6–13) remind us that the return to a financialfirm’s shareholders is highly sensitive to how its assets are financed—whether more debtor more owners’ capital is used. Even a financial institution with a low ROA can achievea relatively high ROE through heavy use of debt (leverage) and minimal use of owners’capital.
In fact, the ROE–ROA relationship illustrates quite clearly the fundamental trade-offthe managers of financial-service firms face between risk and return. For example, a bankwhose ROA is projected to be 1 percent this year will need $10 in assets for each $1 incapital to achieve a 10 percent ROE. That is, following Equation (6–11):
If, however, the bank’s ROA is expected to fall to 0.5 percent, a 10 percent ROE is attain-able only if each $1 of capital supports $20 in assets. In other words:
Indeed, we could construct a risk-return trade-off table like the one following that willtell us how much leverage (debt relative to equity) must be used to achieve a financialinstitution’s desired rate of return to its stockholders. For example, the trade-off table onpage 170 indicates that a financial firm with a 5-to-1 assets-to-capital ratio can expect (a) a2.5 percent ROE if ROA is 0.5 percent and (b) a 10 percent ROE if ROA is 2 percent. Incontrast, with a 20 to 1 assets-to-capital ratio a financial firm can achieve a 10 percentROE simply by earning a modest 0.5 percent ROA.
Clearly, as earnings efficiency represented by ROA declines, the firm must take onmore risk in the form of higher leverage to have any chance of achieving its desired rate ofreturn to its shareholders (ROE).
ROE �0.005 � $20 � 100
$1� 10 percent
�0.01 � $10 � 100
$1� 10 percent
ROE � ROA �Total assets
Total equity capital
ROE �
Total revenues � Total operatingexpenses � Taxes
Total assets�
Total assetsTotal equity capital
Net incomeTotal equity capital
�Net incomeTotal assets
�Total assets
Total equity capital
ROE � ROA �Total assets
Total equity capital
Chapter 6 Measuring and Evaluating the Performance of Banks and Their Principal Competitors 169
FactoidWho must declare thata bank operating in theUnited States hasfailed? Who usually sellsor liquidates the failedinstitution? Answer: Afailure declaration mustcome from the agencyissuing the bank’scharter; the seller orliquidator is normallythe FDIC.

Rose−Hudgins: Bank Management and Financial Services, Seventh Edition
II. Financial Statements and Financial Firm Performance
6. Measuring and Evaluating the Performance of Banks and Their Principal Competitors
© The McGraw−Hill Companies, 2008
Breaking Down Equity Returns for Closer AnalysisAnother highly useful profitability formula focusing upon ROE is this one:
(6–14)
or
ROE � Net profit margin � Asset utilization ratio � Equity multiplier
where:
(6–15)
(6–16)
(6–17)
Each component of this simple equation is a telltale indicator of a different aspect of afinancial firm’s operations. (See Exhibit 6–1.)
For example:
The net profit margin effectiveness of expensemanagement (cost control) andservice pricing policies.
The degree of asset portfolio management policies, utilization (AU) especially the mix and yield on
assets.The equity multiplier leverage or financing policies: the
sources chosen to fund the (EM)financial institution (debt or equity).
If any of these ratios begins to decline, management needs to pay close attention and assessthe reasons behind that change. For example, of these three financial ratios the equity multi-plier (EM), or assets to equity ratio, is normally the largest, averaging about 15X or larger formost banks. Bigger banks often operate with multipliers of 20X or more. The multiplier is a
reflects›
reflects›
reflects›
The equitymultiplier 1EM 2 �
Total assetsTotal equity capital
The degree ofasset utilization 1AU 2 �
Total operating revenuesTotal assets
The netprofit margin 1NPM 2 �
Net incomeTotal operating revenues
�Total assets
Total equity capital
ROE �Net income
Total operating revenue�
Total operating revenueTotal assets
170 Part Two Financial Statements and Financial Firm Performance
ROE with an ROA of:
Ratio of Total Assets to Total Equity Capital Accounts 0.5% 1.0% 1.5% 2.0%
5:1 2.5% 5.0% 7.5% 10.0%10:1 5.0 10.0 15.0 20.015:1 7.5 15.0 22.5 30.020:1 10.0 20.0 30.0 40.0
Risk-Return Trade-Offs for Return on Assets (ROA) and Return on Equity (ROE)
(NPM)

Rose−Hudgins: Bank Management and Financial Services, Seventh Edition
II. Financial Statements and Financial Firm Performance
6. Measuring and Evaluating the Performance of Banks and Their Principal Competitors
© The McGraw−Hill Companies, 2008
direct measure of financial leverage—how many dollars of assets must be supported by eachdollar of equity (owners’) capital and how much of the financial firm’s resources, therefore,must rest on debt. Because equity must absorb losses on assets, the larger the multiplier, themore exposed to failure risk the financial institution is. However, the larger the multiplier, thegreater the potential for high returns for the stockholders.
The net profit margin (NPM), or the ratio of net income to total revenues, is also sub-ject to some degree of management control and direction. It reminds us that financial-service corporations can increase their earnings and the returns to their stockholders bysuccessfully controlling expenses and maximizing revenues. Similarly, by carefully allo-cating assets to the highest-yielding loans and investments while avoiding excessive risk,management can raise the average yield on assets (AU, or asset utilization).
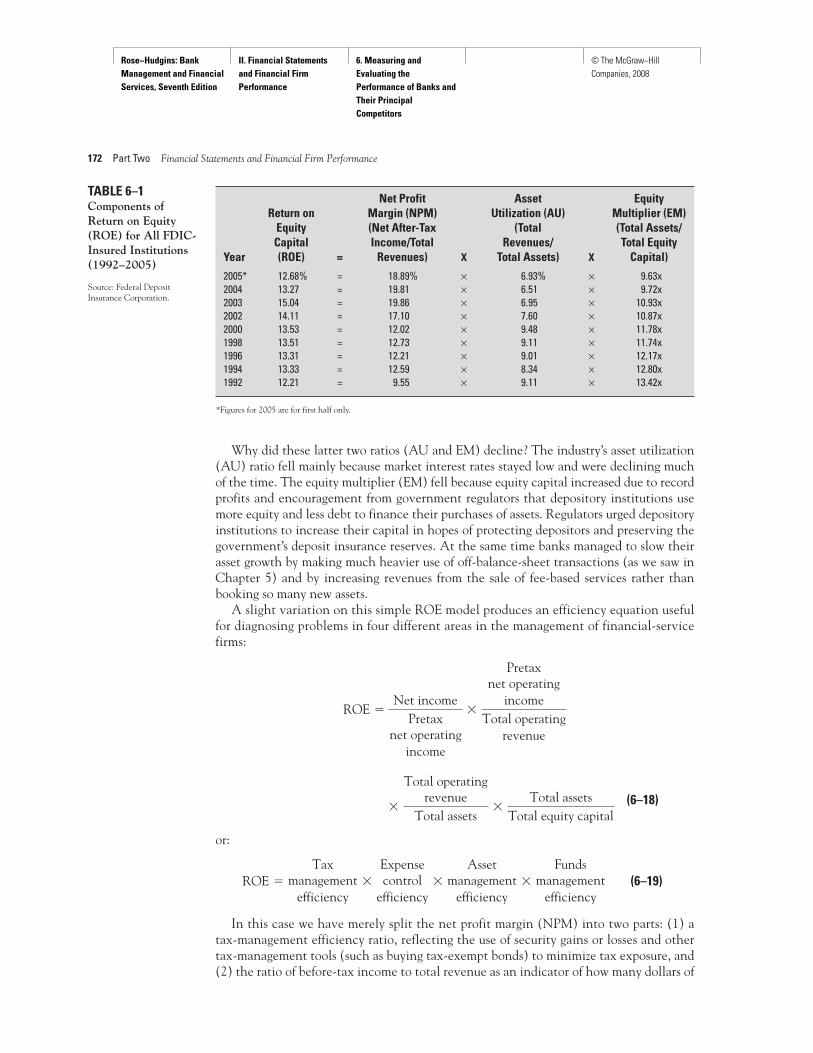
An interesting case in point is the recent track record of average ROE for all FDIC-insured depository institutions between 1992 and 2005, shown in Table 6–1. Carefulperusal of the figures in this table reveals very attractive ROEs for FDIC-insured deposi-tory institutions covering more than a decade. The lowest earnings over this period fordepository institutions, as measured by ROE, were a very acceptable 12.21 percent in1992. The average ROE for the industry gradually increased over the years, reaching 15.04percent in 2003 before falling back slightly.
What created such healthy ROEs between 1992 and 2005? Table 6–1 shows clearly thatthe primary cause was the industry’s net profit margin (NPM), which surged upward (par-ticularly noninterest revenues or fee income). Operating revenues expanded significantlyfaster than operating expenses. The industry’s expanding net profit margin more than off-set decreases in its asset utilization (AU) ratio and equity multiplier (EM).
Chapter 6 Measuring and Evaluating the Performance of Banks and Their Principal Competitors 171
Rate of returnearned on thestockholders’investment(ROE or net
income/equitycapital)
Equity multiplier (EM)or the employment offinancial leverage to
raise net earningsfor the stockholders
(total assets/equity capital)
Return on assets(ROA) as a measureof overall operating
efficiency (ROAor net
income/total assets)
Net profitmargin (net
income/operatingrevenues)
(NPM)
Management decisionsregarding capital structure:
What sources offunding shouldbe used?
What dividendsshould be paidto stockholders?
Management decisionsregarding:
The mix of fundsraised and invested
How big the institutionshould be
Control of operatingexpenses
The pricing ofservices
How to minimize thefinancial firm’s tax liability
Assetutilization(AU) as ameasureof asset
managementefficiency(operating
revenue/totalassets)
EXHIBIT 6–1 Elements that Determine the Rate of Return Earned on the Stockholders’ Investment (ROE) in a Financial Firm
FactoidIn the years since WorldWar II the number ofU.S. banks failingannually has averagedless than 1 or 2 percentof the industrypopulation.
Rose−Hudgins: Bank Management and Financial Services, Seventh Edition
II. Financial Statements and Financial Firm Performance
6. Measuring and Evaluating the Performance of Banks and Their Principal Competitors
© The McGraw−Hill Companies, 2008
Why did these latter two ratios (AU and EM) decline? The industry’s asset utilization(AU) ratio fell mainly because market interest rates stayed low and were declining muchof the time. The equity multiplier (EM) fell because equity capital increased due to recordprofits and encouragement from government regulators that depository institutions usemore equity and less debt to finance their purchases of assets. Regulators urged depositoryinstitutions to increase their capital in hopes of protecting depositors and preserving thegovernment’s deposit insurance reserves. At the same time banks managed to slow theirasset growth by making much heavier use of off-balance-sheet transactions (as we saw inChapter 5) and by increasing revenues from the sale of fee-based services rather thanbooking so many new assets.
A slight variation on this simple ROE model produces an efficiency equation usefulfor diagnosing problems in four different areas in the management of financial-servicefirms:
(6–18)
or:
(6–19)
In this case we have merely split the net profit margin (NPM) into two parts: (1) atax-management efficiency ratio, reflecting the use of security gains or losses and othertax-management tools (such as buying tax-exempt bonds) to minimize tax exposure, and(2) the ratio of before-tax income to total revenue as an indicator of how many dollars of
ROE �
Taxmanagement
efficiency�
Expensecontrol
efficiency�
Assetmanagement
efficiency�
Fundsmanagement
efficiency
�
Total operatingrevenue
Total assets�
Total assetsTotal equity capital
ROE �Net income
Pretaxnet operating
income
�
Pretaxnet operating
incomeTotal operating
revenue
172 Part Two Financial Statements and Financial Firm Performance
Net Profit Asset Equity Return on Margin (NPM) Utilization (AU) Multiplier (EM)
Equity (Net After-Tax (Total (Total Assets/Capital Income/Total Revenues/ Total Equity
Year (ROE) = Revenues) X Total Assets) X Capital)
2005* 12.68% = 18.89% × 6.93% × 9.63x2004 13.27 = 19.81 × 6.51 × 9.72x2003 15.04 = 19.86 × 6.95 × 10.93x2002 14.11 = 17.10 × 7.60 × 10.87x2000 13.53 = 12.02 × 9.48 × 11.78x1998 13.51 = 12.73 × 9.11 × 11.74x1996 13.31 = 12.21 × 9.01 × 12.17x1994 13.33 = 12.59 × 8.34 × 12.80x1992 12.21 = 9.55 × 9.11 × 13.42x
TABLE 6–1Components ofReturn on Equity(ROE) for All FDIC-Insured Institutions(1992–2005)
Source: Federal DepositInsurance Corporation.
*Figures for 2005 are for first half only.
Rose−Hudgins: Bank Management and Financial Services, Seventh Edition
II. Financial Statements and Financial Firm Performance
6. Measuring and Evaluating the Performance of Banks and Their Principal Competitors
© The McGraw−Hill Companies, 2008
revenue survive after operating expenses are removed—a measure of operating efficiencyand expense control. For example, suppose a bank’s Report of Condition and Report ofIncome show the following figures:
Net income � $1.0 million
Pretax net operating income � $1.3 million
Total operating revenue � $39.3 million
Total assets � $122.0 million
Total equity capital � $7.3 million
Its ROE must be
Clearly, when any one of these four ratios begins to drop, management needs toreevaluate the financial firm’s efficiency in that area. In the banking example shownabove, if the ratio of net income to pretax net operating income falls from 0.769 to0.610 next year, management will want to look closely at how well the bank’s tax expo-sure is being monitored and controlled. If pretax net operating income to operatingrevenue drops from 0.033 to 0.025 in the coming year, the bank’s effectiveness in con-trolling operating expenses needs to be reviewed. And if the ratio of operating revenuesto assets plummets from 0.322 to 0.270, a careful reexamination of asset portfolio poli-cies is warranted to see if the decline in asset yields is due to factors within manage-ment’s control.
ROE � 0.769 � 0.033 � 0.322 � 16.71 � 0.137, or 13.7 percent
ROE �$1.0 mil$1.3 mil
�$1.3 mil$39.3 mil
�$39.3 mil$122.0 mil
�$122.0 mil$7.3 mil
Chapter 6 Measuring and Evaluating the Performance of Banks and Their Principal Competitors 173
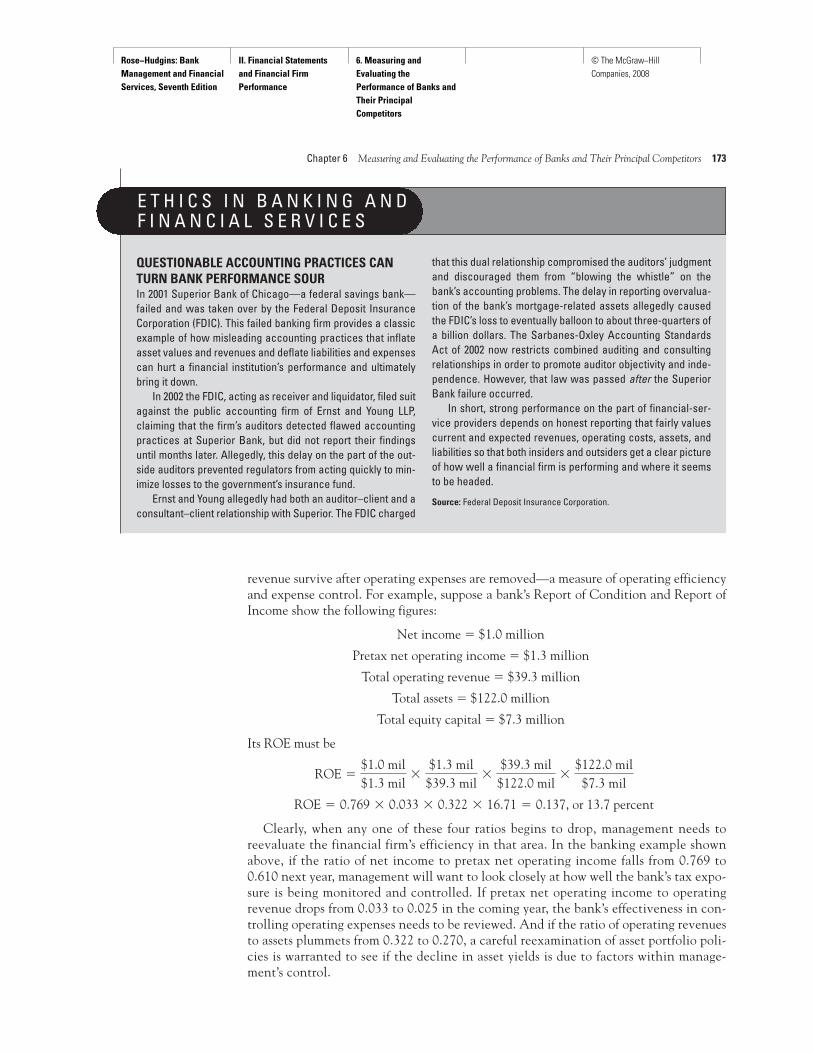
QUESTIONABLE ACCOUNTING PRACTICES CANTURN BANK PERFORMANCE SOURIn 2001 Superior Bank of Chicago—a federal savings bank—failed and was taken over by the Federal Deposit InsuranceCorporation (FDIC). This failed banking firm provides a classicexample of how misleading accounting practices that inflateasset values and revenues and deflate liabilities and expensescan hurt a financial institution’s performance and ultimatelybring it down.
In 2002 the FDIC, acting as receiver and liquidator, filed suitagainst the public accounting firm of Ernst and Young LLP,claiming that the firm’s auditors detected flawed accountingpractices at Superior Bank, but did not report their findingsuntil months later. Allegedly, this delay on the part of the out-side auditors prevented regulators from acting quickly to min-imize losses to the government’s insurance fund.
Ernst and Young allegedly had both an auditor–client and aconsultant–client relationship with Superior. The FDIC charged
that this dual relationship compromised the auditors’ judgmentand discouraged them from “blowing the whistle” on thebank’s accounting problems. The delay in reporting overvalua-tion of the bank’s mortgage-related assets allegedly causedthe FDIC’s loss to eventually balloon to about three-quarters ofa billion dollars. The Sarbanes-Oxley Accounting StandardsAct of 2002 now restricts combined auditing and consultingrelationships in order to promote auditor objectivity and inde-pendence. However, that law was passed after the SuperiorBank failure occurred.
In short, strong performance on the part of financial-ser-vice providers depends on honest reporting that fairly valuescurrent and expected revenues, operating costs, assets, andliabilities so that both insiders and outsiders get a clear pictureof how well a financial firm is performing and where it seemsto be headed.
Source: Federal Deposit Insurance Corporation.
E T H I C S I N B A N K I N G A N DF I N A N C I A L S E R V I C E S

Rose−Hudgins: Bank Management and Financial Services, Seventh Edition
II. Financial Statements and Financial Firm Performance
6. Measuring and Evaluating the Performance of Banks and Their Principal Competitors
© The McGraw−Hill Companies, 2008
Breakdown Analysis of the Return on AssetsWe can also divide a financial firm’s return on assets (ROA) into its component parts, asshown in Table 6–2. Actually, ROA is based on three simple component ratios:
Components of ROA
(6–20)
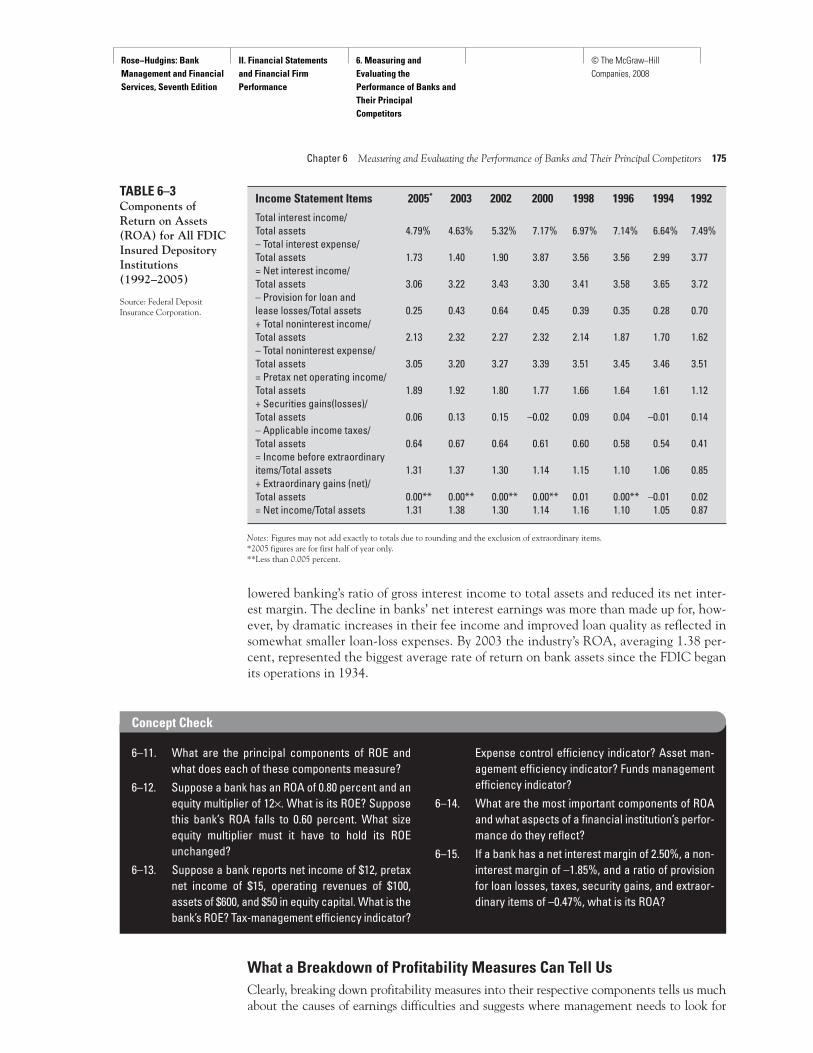
Such a breakdown of the components of return on assets (ROA) can be very helpful inexplaining some of the recent changes that financial-service providers have experiencedin their financial position. For example, as shown in Table 6–3, the average ROA for allFDIC-insured institutions between 1992 and 2005 rose from 0.87 percent in 1992 to ahigh of 1.38 percent in 2003 before leveling out in 2004 and 2005.
Why did ROA for 1992–2003 keep getting better and better? Better control overexpenses, led by advances in automation and mergers that eliminated many overlappingfacilities, along with an expanding economy, which propelled upward the public’sdemand for financial services, resulted in a rapid expansion of fee (noninterest) incomeand loan revenues. All this occurred in the face of falling market interest rates, which
Return on assets 1ROA, 2or the ability of
management to generate incomefrom assets 2
�
EQUALSNet incomeTotal assets
Special transactionsaffecting its net
income�
LESSProvision for loan losses; securities gains 1or losses 2
� taxes � extraordinary net gains
Total assets
Net noninterest margin �
PLUS1Noninterest income 2
� Noninterest expense 2Total assets
Net interest margin �1Interest income � Interest expense 2
Total assets
174 Part Two Financial Statements and Financial Firm Performance
Gross interest income ÷ Total assets Income from holding assets– Interest expense ÷ Total assets Supply cost of funds for holding assets= Net interest margin ÷ Total assets Return earned because the lending
institution’s credit quality is better than itscustomers’ credit quality
+ Noninterest income ÷ Total assets Income from handling customer transactions– Noninterest expenses ÷ Total assets Cost of operations– Provision for loan losses ÷ Total assets Accrual expense= Pretax net operating income ÷ Total assets Return on assets before taxes– Income taxes ÷ Total assets* The financial firm’s share of the cost of
government services= Income before extraordinary items ÷ Total assets Net income from recurring sources of revenue+ Extraordinary net gains ÷ Total assets Nonrecurring sources of income or loss= Net income ÷ Total assets (or ROA) Earnings left over for the stockholders after
all costs are metddd
ddddd
dddTABLE 6–2
Calculation Returnon Assets (ROA)
*Both income and taxes applicable to income need to be adjusted for any tax-exempt earnings received. One can restate such income on afully tax-equivalent basis by multiplying the amount of tax-exempt income by the expression 1 ÷ (1 – t) where t is the firm’s tax bracket rate.
Rose−Hudgins: Bank Management and Financial Services, Seventh Edition
II. Financial Statements and Financial Firm Performance
6. Measuring and Evaluating the Performance of Banks and Their Principal Competitors
© The McGraw−Hill Companies, 2008
lowered banking’s ratio of gross interest income to total assets and reduced its net inter-est margin. The decline in banks’ net interest earnings was more than made up for, how-ever, by dramatic increases in their fee income and improved loan quality as reflected insomewhat smaller loan-loss expenses. By 2003 the industry’s ROA, averaging 1.38 per-cent, represented the biggest average rate of return on bank assets since the FDIC beganits operations in 1934.
Chapter 6 Measuring and Evaluating the Performance of Banks and Their Principal Competitors 175
Income Statement Items 2005* 2003 2002 2000 1998 1996 1994 1992
Total interest income/Total assets 4.79% 4.63% 5.32% 7.17% 6.97% 7.14% 6.64% 7.49%– Total interest expense/Total assets 1.73 1.40 1.90 3.87 3.56 3.56 2.99 3.77= Net interest income/ Total assets 3.06 3.22 3.43 3.30 3.41 3.58 3.65 3.72– Provision for loan and lease losses/Total assets 0.25 0.43 0.64 0.45 0.39 0.35 0.28 0.70+ Total noninterest income/Total assets 2.13 2.32 2.27 2.32 2.14 1.87 1.70 1.62– Total noninterest expense/Total assets 3.05 3.20 3.27 3.39 3.51 3.45 3.46 3.51= Pretax net operating income/Total assets 1.89 1.92 1.80 1.77 1.66 1.64 1.61 1.12+ Securities gains(losses)/Total assets 0.06 0.13 0.15 –0.02 0.09 0.04 –0.01 0.14– Applicable income taxes/Total assets 0.64 0.67 0.64 0.61 0.60 0.58 0.54 0.41= Income before extraordinaryitems/Total assets 1.31 1.37 1.30 1.14 1.15 1.10 1.06 0.85+ Extraordinary gains (net)/Total assets 0.00** 0.00** 0.00** 0.00** 0.01 0.00** –0.01 0.02= Net income/Total assets 1.31 1.38 1.30 1.14 1.16 1.10 1.05 0.87
TABLE 6–3Components ofReturn on Assets(ROA) for All FDICInsured DepositoryInstitutions(1992–2005)
Source: Federal DepositInsurance Corporation.
Concept Check
6–11. What are the principal components of ROE andwhat does each of these components measure?
6–12. Suppose a bank has an ROA of 0.80 percent and anequity multiplier of 12×. What is its ROE? Supposethis bank’s ROA falls to 0.60 percent. What sizeequity multiplier must it have to hold its ROEunchanged?
6–13. Suppose a bank reports net income of $12, pretaxnet income of $15, operating revenues of $100,assets of $600, and $50 in equity capital. What is thebank’s ROE? Tax-management efficiency indicator?
Expense control efficiency indicator? Asset man-agement efficiency indicator? Funds managementefficiency indicator?
6–14. What are the most important components of ROAand what aspects of a financial institution’s perfor-mance do they reflect?
6–15. If a bank has a net interest margin of 2.50%, a non-interest margin of –1.85%, and a ratio of provisionfor loan losses, taxes, security gains, and extraor-dinary items of –0.47%, what is its ROA?
Notes: Figures may not add exactly to totals due to rounding and the exclusion of extraordinary items.*2005 figures are for first half of year only.**Less than 0.005 percent.
What a Breakdown of Profitability Measures Can Tell UsClearly, breaking down profitability measures into their respective components tells us muchabout the causes of earnings difficulties and suggests where management needs to look for
Rose−Hudgins: Bank Management and Financial Services, Seventh Edition
II. Financial Statements and Financial Firm Performance
6. Measuring and Evaluating the Performance of Banks and Their Principal Competitors
© The McGraw−Hill Companies, 2008
possible cures for any earnings problems that surface. The foregoing analysis reminds us thatachieving superior profitability for a financial institution depends upon several crucial factors:
1. Careful use of financial leverage (or the proportion of assets financed by debt asopposed to equity capital).
2. Careful use of operating leverage from fixed assets (or the proportion of fixed-costinputs used to boost operating earnings as output grows).
3. Careful control of operating expenses so that more dollars of sales revenue become netincome.
4. Careful management of the asset portfolio to meet liquidity needs while seeking thehighest returns from any assets acquired.
5. Careful control of exposure to risk so that losses don’t overwhelm income and equitycapital.
Measuring Risk in Banking and Financial Services3
Risk to the manager of a financial institution or to a regulator supervising a financial institu-tion means the perceived uncertainty associated with a particular event. For example, willthe customer renew his or her loan? Will deposits and other sources of funds grow nextmonth? Will the financial firm’s stock price rise and its earnings increase? Are interest ratesgoing to rise or fall next week, and will a financial institution lose income or value if they do?
Bankers, for example are usually interested in achieving high stock values and highprofitability, but none can fail to pay attention to the risks they are accepting to achievethese goals. Earnings may decline unexpectedly due to factors inside or outside the finan-cial firm, such as changes in economic conditions, competition, or laws and regulations.For example, recent increases in competition have tended to narrow the spread betweenearnings on assets and the cost of raising funds. Thus, stockholders always face the possi-bility of a decline in their earnings per share of stock, which could cause the bank’s stockprice to fall, eroding its resources for future growth.
Among the more popular measures of overall risk for a financial firm are the following:
• Standard deviation (σ) or variance (σ 2) of stock prices.• Standard deviation or variance of net income.• Standard deviation or variance of return on equity (ROE) and return on assets (ROA).
The higher the standard deviation or variance of the above measures, the greater theoverall risk. Risk can be broken down into a number of components and even referencedusing different terms as illustrated by the different risk matrices used currently by U.S. fed-eral regulatory agencies and summarized below.
176 Part Two Financial Statements and Financial Firm Performance
FactoidWhich banks in theindustry tend to havethe biggest net interestmargins between theirinterest income fromloans and securities andthe interest cost ofborrowed funds?Answer: The smallestbanks usually do.
National Credit Federal Reserve System Comptroller of the Currency Union Administration
Credit Credit CreditLiquidity Liquidity LiquidityMarket Interest Rate Interest RateOperational Transaction TransactionalLegal Compliance ComplianceReputation Reputation Reputation
Strategic Strategic
Risk Matrices Used by Selected U.S. Regulatory Agencies
3This section is based, in part, on Peter S. Rose’s article in the Canadian Banker [3] and is used with permission.

Rose−Hudgins: Bank Management and Financial Services, Seventh Edition
II. Financial Statements and Financial Firm Performance
6. Measuring and Evaluating the Performance of Banks and Their Principal Competitors
© The McGraw−Hill Companies, 2008
Each of these forms of risk can threaten a financial firm’s day-to-day performance andits solvency and long-run survival. Let’s examine now several of the most important typesof risk encountered daily by financial institutions.
Credit RiskThe probability that some of a financial institution’s assets, especially its loans, will declinein value and perhaps become worthless is known as credit risk. Because financial firmstend to hold little owners’ capital relative to the aggregate value of their assets, only asmall percentage of total loans needs to turn bad to push them to the brink of failure. Thefollowing are four of the most widely used indicators of credit risk:
• The ratio of nonperforming assets to total loans and leases.• The ratio of net charge-offs of loans to total loans and leases.• The ratio of the annual provision for loan losses to total loans and leases or to equity
capital.• The ratio of allowance for loan losses to total loans and leases or to equity capital.• The ratio of nonperforming assets to equity capital.
Nonperforming assets are income-generating assets, including loans, that are past due for90 days or more. Charge-offs, on the other hand, are loans that have been declared worth-less and written off the lender’s books. If some of these loans ultimately generate income,the amounts recovered are deducted from gross charge-offs to yield net charge-offs. Asthese ratios rise, exposure to credit risk grows, and failure of a lending institution may be
Insights and Issues
HOW TOP-EARNING BANKS GET THAT WAYA number of research studies have examined top-earning firms inthe banking industry in an effort to answer a simple question:What distinguishes a bank with above-average profitability frombanks that are only average performers? How did top-earningbanks get that way?
Bank size is clearly one factor. The top-earning banks in theindustry, at least as measured by their ROA and ROE, are oftenmedium-size or larger institutions that seem to benefit from loweroverall operating costs and greater operating efficiency.
Expense control stands out as the most important discrimina-tor between top performers and the also-rans. For example, high-profit banks manage their operating expenses better, generallyposting lower average interest costs, and especially lower per-sonnel expenses and overhead. Their ratios of operating expensesto operating revenues tend to be significantly below the expense-to-revenue ratios of low-profit institutions.
The deposit structure also appears to influence profit perfor-mance. Top-earning banks often hold more demand deposits thanother banks; these checkable deposits pay little or no interest andcarry customer service fees that bring in more revenues. Relat-edly, many highly profitable banks hold a large volume of coredeposits—smaller denomination deposits from individuals andsmall businesses that pay low interest rates and are more loyal tothe bank than larger deposit accounts.
Employee productivity tends to be higher among top earners.For example, banks with the best profits seem to generate andmanage more assets and income per employee and pay theirmore productive employees higher salaries.
Leverage (lower equity capital and greater use of debt) alsoemerges as a profit motivator. Top-earning banks, for example,generally economize on using high-cost owners’ capital and relyon the earnings-leveraging effects of cheaper debt.
The expansion of fee income has become a key element instrategies to increase profits in recent years. Government deregula-tion has put added pressure on financial institutions to charge feesfor many formerly “free” services and develop new fee-generatingservices.
Growth in assets, deposits, and loans seems to play a rolebecause top-earning banks seem to grow faster than average, pos-sibly reflecting the presence of more aggressive management orgreater customer acceptance of their services. However, growthshould not become a substitute for profits. Top-earning banks seemto recognize that growth can be overdone, resulting in uncontrolledexpansion that increases operating expenses faster than revenues.Moderate growth is usually a better route to high profits.
For further information on the characteristics of high-profitbanks see especially Elizabeth C. Klee and Fabio M. Natalucci,“Profits and Balance Sheet Developments at U.S. CommercialBanks in 2004,” Federal Reserve Bulletin, Spring 2005, pp. 143–74.

Rose−Hudgins: Bank Management and Financial Services, Seventh Edition
II. Financial Statements and Financial Firm Performance
6. Measuring and Evaluating the Performance of Banks and Their Principal Competitors
© The McGraw−Hill Companies, 2008
just around the corner. The final two credit risk indicator ratios reveal the extent towhich a lender is preparing for loan losses by building up its loan-loss reserves (theallowance for loan losses) through annual charges against current income (the provisionfor loan losses).
Another popular and long-standing credit risk measure is:
• The ratio of total loans to total deposits.
As this ratio grows, examiners representing the regulatory community may become moreconcerned because loans are usually among the riskiest of all assets for depository institu-tions, and, therefore, deposits must be carefully protected. A rise in bad loans or decliningmarket values of otherwise good loans relative to the amount of deposits creates greaterdepositor risk.
Liquidity RiskFinancial-service managers are also concerned about the danger of not having sufficientcash and borrowing capacity to meet customer withdrawals, loan demand, and other cashneeds. Faced with liquidity risk a financial institution may be forced to borrow emergencyfunds at excessive cost to cover its immediate cash needs, reducing its earnings. Very fewfinancial firms ever actually run out of cash because of the ease with which liquid fundscan be borrowed from other institutions. In fact, so rare is such an event that when a smallMontana bank in the early 1980s had to refuse to cash checks for a few hours due to a tem-porary “cash-out,” there was a federal investigation of the incident!
Somewhat more common is a shortage of liquidity due to unexpectedly heavy depositwithdrawals, which forces a depository institution to borrow funds at an elevated interestrate, higher than the interest rates other institutions are paying for similar borrowings. Forexample, significant decline in its liquidity position often forces a bank to pay higher inter-est rates to attract negotiable money market CDs, which are sold in million-dollar unitsand therefore are largely unprotected by deposit insurance. One useful measure of liquid-ity risk exposure is the ratio of
• Purchased funds (including Eurodollars, federal funds, security RPs, large CDs, andcommercial paper) to total assets.
Heavier use of purchased funds increases the chances of a liquidity crunch in the eventdeposit withdrawals rise or loan quality declines. Other indicators of exposure to liquidityrisk include the ratios of
• Cash and due from balances held at other depository institutions to total assets.• Cash assets and government securities to total assets.
Cash assets include vault cash held on the financial firm’s premises, deposits held withthe central bank in the region, deposits held with other depository institutions to com-pensate them for clearing checks and other interbank services, and cash items in theprocess of collection (mainly uncollected checks). Standard remedies for reducing a finan-cial institution’s exposure to liquidity risk include increasing the proportion of funds com-mitted to cash and readily marketable assets, such as government securities, or usinglonger-term liabilities to fund the institution’s operations.
Market RiskIn market-oriented economies, where most of the world’s leading financial institutionsoffer their services today, the market values of assets, liabilities, and net worth of financial-service providers are constantly in a state of flux due to uncertainties concerning marketrates or prices. Market risk is composed of both price risk and interest rate risk.
178 Part Two Financial Statements and Financial Firm Performance

Rose−Hudgins: Bank Management and Financial Services, Seventh Edition
II. Financial Statements and Financial Firm Performance
6. Measuring and Evaluating the Performance of Banks and Their Principal Competitors
© The McGraw−Hill Companies, 2008
Price RiskEspecially sensitive to these market-value movements are bond portfolios and stockhold-ers’ equity (net worth), which can dive suddenly as market prices move against a finan-cial firm. Among the most important indicators of price risk in financial institutions’management are
• The ratio of book-value assets to the estimated market value of those same assets.• The ratio of book-value equity capital to the market value of equity capital.• The market value of bonds and other fixed-income assets held relative to their value as
recorded on a financial institution’s books.• The market value of common and preferred stock per share, reflecting investor per-
ceptions of a financial institution’s risk exposure and earnings potential.
Interest Rate RiskMovements in market interest rates can also have potent effects on the margin of revenuesover costs for both banks and their competitors. For example, rising interest rates canlower the margin of profit if the structure of a financial institution’s assets and liabilities issuch that interest expenses on borrowed money increase more rapidly than interest rev-enues on loans and security investments.
The impact of changing interest rates on a financial institution’s margin of profit iscalled interest rate risk. Among the most widely used measures of interest-rate risk expo-sure are these:
• The ratio of interest-sensitive assets to interest-sensitive liabilities: when interest-sensi-tive assets exceed interest-sensitive liabilities in a particular maturity range, a financialfirm is vulnerable to losses from falling interest rates. In contrast, when rate-sensitiveliabilities exceed rate-sensitive assets, losses are likely to be incurred if market interestrates rise.
• For a depository institution, the ratio of uninsured deposits to total deposits, whereuninsured deposits are usually government and corporate deposits that exceed theamount covered by insurance and are usually so highly sensitive to changing interestrates that they will be withdrawn if yields offered by competitors rise even slightlyhigher.
With more volatile market interest rates in recent years, bankers and their competitorshave developed several new ways to defend their earnings margins against interest-ratechanges, including interest-rate swaps, options, and financial futures contracts. We willexamine these and other risk-management tools in Chapters 7, 8, and 9.
Operational (Transactional) RiskOperational risk refers to uncertainty regarding a financial firm’s earnings due to failures incomputer systems, errors, misconduct by employees, floods, lightning strikes, and similarevents. The broad group of actions included in this risk definition often decrease earningsdue to unexpected operating expenses. Some analysts say that operational risk is the risk ofloss due to anything other than credit or market risk. Others say it includes legal and com-pliance risk, but not reputation or strategic risk. The consolidation and convergence of finan-cial firms and the complexity of today’s financial-services technology has made operationalrisk a broad risk category that needs to be addressed by both managers of financial firmsand government regulators.
As technology has improved, computer hardware and software systems have becomeessential to the daily operations of most financial firms. If computer systems involve apatchwork of old programs, requiring employee intervention to reconcile and create
Chapter 6 Measuring and Evaluating the Performance of Banks and Their Principal Competitors 179
Rose−Hudgins: Bank Management and Financial Services, Seventh Edition
II. Financial Statements and Financial Firm Performance
6. Measuring and Evaluating the Performance of Banks and Their Principal Competitors
© The McGraw−Hill Companies, 2008
reports, then operational risk may be high. While the failure of a new computer systemmay be less likely, heavy reliance by the institution’s personnel and customers on such sys-tems creates vulnerability for any financial firm.
Today, acts of terrorism such as 9/11 and natural disasters such as hurricanes, earth-quakes, and tsunamis can lead to great loss for any financial firm. These natural and not-so-natural disasters may close financial institutions for extended periods and interrupttheir service to customers. Foregone income from such disasters is unpredictable, resultingin unexpected operating expenses and greater variability in earnings.
Financial fraud provides the plots for great movies, such as Rogue Trader, The Bank, andBoiler Room, and the basis for many “60 Minutes” episodes. It’s about money, stealing, andthe ultimate failure of some at-risk institutions. A financial firm’s owners, employees, cus-tomers, or outsiders may violate the law and perpetrate fraud, forgery, theft, misrepresenta-tion, or other illegal acts, sometimes leading to devastating losses to otherwise well-managedfinancial institutions.
Legal and Compliance RisksLegal risk creates variability in earnings resulting from actions taken by our legal system.Unenforceable contracts, lawsuits, or adverse judgments may reduce a financial firm’s rev-enues and increase its expenses. Lawyers are never cheap and fines can be expensive! In abroader sense compliance risk reaches beyond violations of the legal system and includesviolations of rules and regulations. For example, if a depository institution fails to holdadequate capital, costly corrective actions must be taken to avoid its closure. These cor-rective actions are laid out in capital adequacy regulations and are examined in moredetail in Chapter 15.
Reputation RiskNegative publicity, whether true or not, can affect a financial firm’s earnings by dissuadingcustomers from using the services of the institution, just as positive publicity may serve topromote a financial firm’s services and products. Reputation risk is the uncertainty associ-ated with public opinion. The very nature of a financial firm’s business requires maintain-ing the confidence of its customers and creditors.
Strategic RiskVariations in earnings due to adverse business decisions, improper implementation of deci-sions, or lack of responsiveness to industry changes are parts of what is called strategicrisk. This risk category can be characterized as the human element in making bad long-range management decisions that reflect poor timing, lack of foresight, lack of persistence,and lack of determination to be successful.
Capital RiskThe impact of all the risks examined above can affect a financial firm’s long-run survival,often referred to as its capital risk. Because variability in capital stems from other types ofrisk it is often not considered separately by government regulatory agencies. However, risksto the capital that underlies every financial firm captures the all-important risk of insol-vency or ultimate failure.
For example, if a bank takes on an excessive number of bad loans or if a large portion ofits security portfolio declines in market value, generating serious capital losses when sold,then its equity capital account, which is designed to absorb such losses, may be over-whelmed. If investors and depositors become aware of the problem and begin to withdrawtheir funds, regulators may have no choice but to declare the institution insolvent andclose its doors.
180 Part Two Financial Statements and Financial Firm Performance
Key URLsMany of the types ofrisk discussed in thissection have beendeveloped and refinedby the Bank forInternationalSettlements atwww.bis.org and by arelated entity, the BaselCommittee onInternational CapitalStandards, atwww.bis.org/publ/bcbs/107.htm, which isexplored in detail inChapter 15.
Rose−Hudgins: Bank Management and Financial Services, Seventh Edition
II. Financial Statements and Financial Firm Performance
6. Measuring and Evaluating the Performance of Banks and Their Principal Competitors
© The McGraw−Hill Companies, 2008
The failure of a financial-service corporation may leave its stockholders with none ofthe capital they committed to the institution. Moreover, in the case of depository institu-tions, depositors not covered by insurance also risk losing a substantial portion of theirfunds. For this reason, the prices and yields on capital stock and on large uninsureddeposits can serve as an early warning sign of solvency problems. When investors believethat a financial firm has an increased chance of failing, the market value of its capital stockusually begins to fall and it must post higher interest rates on its borrowings in order toattract needed funds. Economists call this phenomenon market discipline: interest rates andsecurity prices in the financial marketplace move against the troubled firm, forcing it tomake crucial adjustments in policies and performance in order to calm investors’ worstfears. This suggests that capital risk can be measured approximately by such factors as
• The interest rate spread between market yields on debt issues (such as capital notes andCDs issued by depository institutions) and the market yields on government securities ofthe same maturity. An increase in that spread indicates that investors in the market ex-pect increased risk of loss from purchasing and holding a financial institution’s debt.
• The ratio of stock price per share to annual earnings per share. This ratio often falls ifinvestors come to believe that a financial firm is undercapitalized relative to the risks ithas taken on.
• The ratio of equity capital (net worth) to total assets, where a decline in equity fundingrelative to assets may indicate increased risk exposure for shareholders and debtholders.
• The ratio of purchased funds to total liabilities. Purchased funds usually include unin-sured deposits and borrowings in the money market from banks, nonbank corporations,and governmental units that fall due within one year.
• The ratio of equity capital to risk assets, reflecting how well the current level of a fi-nancial institution’s capital covers potential losses from those assets most likely to de-cline in value.
Risk assets consist mainly of loans and securities and exclude cash, plant and equipment,and miscellaneous assets. Some authorities also exclude holdings of short-term governmentsecurities from risk assets because the market values of these securities tend to be stable andthere is always a ready resale market for them. Concern in the regulatory community over therisk exposure of depository institutions has resulted in heavy pressure on their management toincrease capital. As we saw earlier in this chapter, capital, at least in the banking industry, hasmoved significantly higher relative to the industry’s assets and liabilities in recent years.
Chapter 6 Measuring and Evaluating the Performance of Banks and Their Principal Competitors 181
FilmtoidWhat 2000 film starsPaul Newman as anincarcerated bankrobber who had stolenmillions from the banksto which he sold andinstalled securitysystems and thenreturned to rob them?Answer: Where theMoney Is.
Concept Check
6–16. To what different kinds of risk are banks and theirfinancial-service competitors subjected today?
6–17. What items on a bank’s balance sheet and incomestatement can be used to measure its risk expo-sure? To what other financial institutions do theserisk measures seem to apply?
6–18. A bank reports that the total amount of its netloans and leases outstanding is $936 million, itsassets total $1,324 million, its equity capitalamounts to $110 million, and it holds $1,150 millionin deposits, all expressed in book value. The esti-
mated market values of the bank’s total assets andequity capital are $1,443 million and $130 million,respectively. The bank’s stock is currently valuedat $60 per share with annual per-share earnings of$2.50. Uninsured deposits amount to $243 millionand money-market borrowings total $132 million,while nonperforming loans currently amount to $43million and the bank just charged off $21 million inloans. Calculate as many of the risk measures asyou can from the foregoing data.

Rose−Hudgins: Bank Management and Financial Services, Seventh Edition
II. Financial Statements and Financial Firm Performance
6. Measuring and Evaluating the Performance of Banks and Their Principal Competitors
© The McGraw−Hill Companies, 2008
Other Goals in Banking and Financial-Services ManagementIn an effort to maximize profitability and the value of the shareholders’ investment in a finan-cial institution, many financial firms recognize the need for greater efficiency in their opera-tions. This usually means reducing operating expenses and increasing the productivity of theiremployees through the use of automated equipment and improved employee training. Thegovernment deregulation movement has forced depository institutions, for example, to payhigher interest costs for their funds and encouraged management to reduce noninterest costs,especially employee salaries and benefits and overhead costs. Among the most revealing mea-sures of operating efficiency and employee productivity for a financial institution are its
(6–21)
Not all financial firms pursue high profitability, maximum stock values, increasedgrowth, or greater efficiency as key goals, however. There is considerable evidence thatsome institutions prefer greater market power in the markets they serve, not only because itgives them increased control over prices and customer relationships, but also because afinancial-service provider with greater market influence can enjoy a more “quiet life,” orface less risk of losing earnings or market share. Several recent studies have found, for exam-ple, that some banks in this situation display expense preference behavior: They spendmore on salaries and wages of management and staff, enjoy more fringe benefits, or buildlarger and more sumptuous offices. Unfortunately for the stockholders of these institutions,a preference for expenses sacrifices profits and limits potential gains in stock values.
6–3 Performance Indicators among Banking’s Key CompetitorsMany of the performance indicators discussed in the foregoing sections apply equally wellfor measuring the performance of both banks and their nonbank competitors. This is espe-cially true of those nonbank financial institutions that are private, profit-making corpora-tions, including stockholder-owned thrift institutions, insurance companies, finance andcredit-card companies, security broker and dealer firms, and mutual funds.
Among the key bank performance indicators that often are equally applicable to pri-vately owned, profit-making nonbank financial firms are these:
Prices on common and preferred stock Return on equity capital (ROE)Return on assets (ROA) Net operating marginNet interest margin Equity multiplierAsset utilization ratio Cash accounts to total assetsNonperforming assets to equity capital ratio Interest-sensitive assets to interest-
sensitive liabilitiesBook-value assets to market-value assets Interest-rate spread between yields onEquity capital to risk-exposed assets the financial firm’s debt and market Earnings per share of stock yields on government securities
Some performance indicators are unique to each nonbank financial-service industry. Forexample, among insurance companies, key performance measures include the growth of netpremiums written (a measure of total sales) and the size of life and pension reserves (their
Employee productivity ratio �Net operating income
Number of full-time-equivalent employees
Operating efficiency ratio �Total operating expensesTotal operating revenues
182 Part Two Financial Statements and Financial Firm Performance
Key URLsPerformance data onbanking’s closestcompetitors—nonbankdepositoryinstitutions—can mosteasily be found at suchWeb sites aswww.ots.treas.gov,www.fdic.gov, andwww.ncua.gov.
FactoidWhich banks tend to bemost efficient incontrolling costs andrevenues? Answer:Usually medium-sizeand larger institutions(over $100 million inassets).
FactoidIn recent years FDIC-insured savingsassociations (savingsand loans and savingsbanks) have had lowerassets and equity returnsthan insuredcommercial banks, butnot by much. Forexample, for all of 2004commercial banksreported an averageROA of 1.31 percentversus 1.17 percent forsavings associations andan average ROE of13.80 percent versus10.87 percent forsavings associations.Why do you think thesedifferences exist?

Rose−Hudgins: Bank Management and Financial Services, Seventh Edition
II. Financial Statements and Financial Firm Performance
6. Measuring and Evaluating the Performance of Banks and Their Principal Competitors
© The McGraw−Hill Companies, 2008
chief liabilities) relative to total assets. Insurers also pay close attention to an efficiencymeasure—the combined ratio of claims paid out plus operating expenses relative to premi-ums earned from policyholders.
Among mutual funds, key performance markers include the growth of net sales (i.e.,gross sales of shares less share redemptions by the public), service fees relative to aver-age assets, and the rate of return on funds invested. In contrast, finance and credit-cardcompanies often pay close attention to the growth of their outstanding debt and theirgross receivables (a measure of total loans extended to customers). Finally, among com-peting depository institutions, such as credit unions and mutual savings associations,key performance measures include total loans to members relative to capital reserves (a measure of risk), home mortgage loans to total assets (a rapidly growing credit ser-vice), and the number of actual members (customers) relative to potential members(customers).
No financial institution can safely ignore its level of performance today relative to itspast performance and relative to its competitors. Even if some financial-service institu-tions don’t seem to care about their performance, both the public and the regulatory com-munity clearly do.
6–4 The Impact of Size on PerformanceWhen the performance of one financial firm is compared to that of another, size—oftenmeasured by total assets or, in the case of a depository institution, total deposits—becomesa critical factor. Most of the performance ratios presented in this chapter are highly sensi-tive to the size group in which a financial institution finds itself.
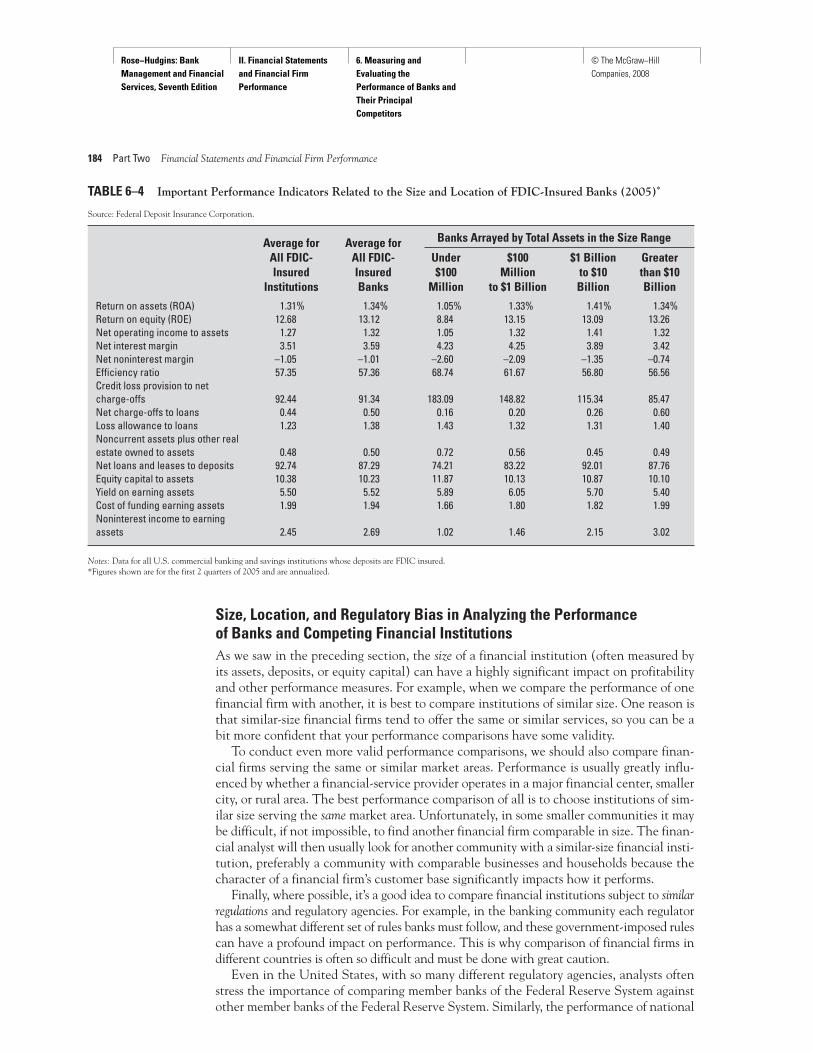
Thus, “size bias” is especially evident in the banking industry. For example, as Table 6–4shows, key earnings and risk measures change dramatically as we move from the smallestbanks (those in the table with assets of less than $100 million) to the largest banking firms(with assets exceeding $10 billion). For example, the most profitable banks in terms ofROA were banks with more than $1 billion in assets and less than $10 billion in assets,while the largest equity returns (ROE) were obtained by the very largest banks with morethan $10 billion in assets in 2005.
On the other hand, middle-size and large banks with assets ranging from $100 mil-lion to $10 billion in total assets often display the most favorable net operating marginsand the best operating efficiency (often with the lowest operating-expense-to-revenueratio). Similarly, the largest banks generally report the highest (least negative) nonin-terest margins because they charge fees for so many of their services. Smaller and medium-size banks frequently display larger net interest margins and, therefore,greater spreads between interest revenue and interest costs because most of theirdeposits are small-denomination accounts with lower average interest costs. Moreover,a larger proportion of small and medium-size banks’ loans tend to be higher-interestconsumer loans.
In terms of balance-sheet ratios, many of which reflect the various kinds of risk expo-sure banks face, the smallest banks usually report higher ratios of equity capital to assets.Some bank analysts argue that larger banks can get by with lower capital-to-asset cushionsbecause they are more diversified across many different markets and have more risk-hedg-ing tools at their disposal. Smaller banks appear to be more liquid, as reflected in theirlower ratios of net loans to deposits, because loans are often among a bank’s least liquidassets. The biggest banks also appear to carry greater credit risk as revealed by their higherloan-loss (net charge-offs to total loans and leases) ratios.
Chapter 6 Measuring and Evaluating the Performance of Banks and Their Principal Competitors 183
Rose−Hudgins: Bank Management and Financial Services, Seventh Edition
II. Financial Statements and Financial Firm Performance
6. Measuring and Evaluating the Performance of Banks and Their Principal Competitors
© The McGraw−Hill Companies, 2008
Size, Location, and Regulatory Bias in Analyzing the Performance of Banks and Competing Financial InstitutionsAs we saw in the preceding section, the size of a financial institution (often measured byits assets, deposits, or equity capital) can have a highly significant impact on profitabilityand other performance measures. For example, when we compare the performance of onefinancial firm with another, it is best to compare institutions of similar size. One reason isthat similar-size financial firms tend to offer the same or similar services, so you can be abit more confident that your performance comparisons have some validity.
To conduct even more valid performance comparisons, we should also compare finan-cial firms serving the same or similar market areas. Performance is usually greatly influ-enced by whether a financial-service provider operates in a major financial center, smallercity, or rural area. The best performance comparison of all is to choose institutions of sim-ilar size serving the same market area. Unfortunately, in some smaller communities it maybe difficult, if not impossible, to find another financial firm comparable in size. The finan-cial analyst will then usually look for another community with a similar-size financial insti-tution, preferably a community with comparable businesses and households because thecharacter of a financial firm’s customer base significantly impacts how it performs.
Finally, where possible, it’s a good idea to compare financial institutions subject to similarregulations and regulatory agencies. For example, in the banking community each regulatorhas a somewhat different set of rules banks must follow, and these government-imposed rulescan have a profound impact on performance. This is why comparison of financial firms indifferent countries is often so difficult and must be done with great caution.
Even in the United States, with so many different regulatory agencies, analysts oftenstress the importance of comparing member banks of the Federal Reserve System againstother member banks of the Federal Reserve System. Similarly, the performance of national
184 Part Two Financial Statements and Financial Firm Performance
Average for Average for Banks Arrayed by Total Assets in the Size Range
All FDIC- All FDIC- Under $100 $1 Billion GreaterInsured Insured $100 Million to $10 than $10
Institutions Banks Million to $1 Billion Billion Billion
Return on assets (ROA) 1.31% 1.34% 1.05% 1.33% 1.41% 1.34%Return on equity (ROE) 12.68 13.12 8.84 13.15 13.09 13.26Net operating income to assets 1.27 1.32 1.05 1.32 1.41 1.32Net interest margin 3.51 3.59 4.23 4.25 3.89 3.42Net noninterest margin –1.05 –1.01 –2.60 –2.09 –1.35 –0.74Efficiency ratio 57.35 57.36 68.74 61.67 56.80 56.56Credit loss provision to net charge-offs 92.44 91.34 183.09 148.82 115.34 85.47Net charge-offs to loans 0.44 0.50 0.16 0.20 0.26 0.60Loss allowance to loans 1.23 1.38 1.43 1.32 1.31 1.40Noncurrent assets plus other real estate owned to assets 0.48 0.50 0.72 0.56 0.45 0.49Net loans and leases to deposits 92.74 87.29 74.21 83.22 92.01 87.76Equity capital to assets 10.38 10.23 11.87 10.13 10.87 10.10Yield on earning assets 5.50 5.52 5.89 6.05 5.70 5.40Cost of funding earning assets 1.99 1.94 1.66 1.80 1.82 1.99Noninterest income to earning assets 2.45 2.69 1.02 1.46 2.15 3.02
TABLE 6–4 Important Performance Indicators Related to the Size and Location of FDIC-Insured Banks (2005)*
Source: Federal Deposit Insurance Corporation.
Notes: Data for all U.S. commercial banking and savings institutions whose deposits are FDIC insured.*Figures shown are for the first 2 quarters of 2005 and are annualized.

Rose−Hudgins: Bank Management and Financial Services, Seventh Edition
II. Financial Statements and Financial Firm Performance
6. Measuring and Evaluating the Performance of Banks and Their Principal Competitors
© The McGraw−Hill Companies, 2008
banks, where possible, should be compared against that of other national banks, and state-chartered institutions should be compared against other state-licensed institutions. If afinancial firm is an affiliate of a holding company, it can be revealing to compare its per-formance with other holding company affiliates rather than with independently ownedinstitutions. There is an old saying about avoiding comparing apples and oranges because oftheir obvious differences; the same is true in the financial-services field. No two financialfirms are ever exactly alike in size, location, service menu, or customer base. The perfor-mance analyst must make his or her best effort to find the most comparable institutions—and then proceed with caution.
Using Financial Ratios and Other Analytical Tools to Track Bank Performance—The UBPRCompared to other financial institutions, more information is available about banks thanany other type of financial firm. Through the cooperative effort of four federal bankingagencies—the Federal Reserve System, the Federal Deposit Insurance Corporation, theOffice of Thrift Supervision, and the Office of the Comptroller of the Currency—the Uni-form Bank Performance Report (UBPR) provides key information for financial analysts.The UBPR, which is sent quarterly to all federally supervised banks, reports each bank’sassets, liabilities, capital, revenues, and expenses.
Supplementary items in the UBPR include breakdowns of loan and lease commitments,analysis of problem loans and loan losses, and a profile of each bank’s exposure to risk andits sources of capital. Bankers can also obtain peer group reports, which allow them to com-pare their bank with other institutions of comparable size; average reports, which providemean ratio values for each peer group; and state reports, which permit comparisonsbetween an individual bank and the combined financial statements of all banks in a givenstate. An important added feature is that a banker can acquire the UBPR report for any
Insights and Issues
CREDIT RATINGS BY THOMSON’S BANKWATCH, INC.One of the most widely respected private institutions that rates thecredit quality of financial institutions is Thomson’s BankWatch,Inc. Thomson’s rates both short-term debt and long-term obliga-tions (debt and preferred stock), assessing the likelihood thatthe institutions issuing these obligations may not be able to pay.
BankWatch’s credit ratings are among the most widely followedrisk indicators anywhere, particularly by large depositors andthose who purchase the stock and capital notes of financialfirms.
Examples of Thomson’s BankWatch ratings of credit worthi-ness include these:
Short-Term Ratings Long-Term Ratings
TBW-1: Very high likelihood of timely repayment of principal AAA: Extremely high capacity to repay.and interest. AA: Strong ability to repay.TBW-2: Strong likelihood of timely repayment of principal A: Relatively strong ability to repay.and interest. BBB: Lowest investment grade rating with an acceptable capacity TBW-3: Adequate capacity to service principal to repay.and interest in a timely way. BB: Likelihood of default just above investment grade with some TBW-4: Noninvestment grade and speculative in nature. significant uncertainties affecting the capacity to repay.. B: Higher degree of uncertainty and greater likelihood of default
than for higher-rated issuesCCC: High likelihood of default.CC: Subordinated to CCC obligations with less risk protection.D: Defaulted obligation.
Note: The long-term credit ratings may be marked with a + or a – depending upon whether the rated institution appears to lie nearer the top or nearer thebottom of each rating category.
Key URLsIf you wanted tocompare the overallprofitability of theinsurance industry tothat of the bankingindustry, where wouldyou look? The datasupplied by theAmerican Council ofLife Insurance atwww.acli.org and bythe InsuranceInformation Institute atwww.iii.org would behelpful.
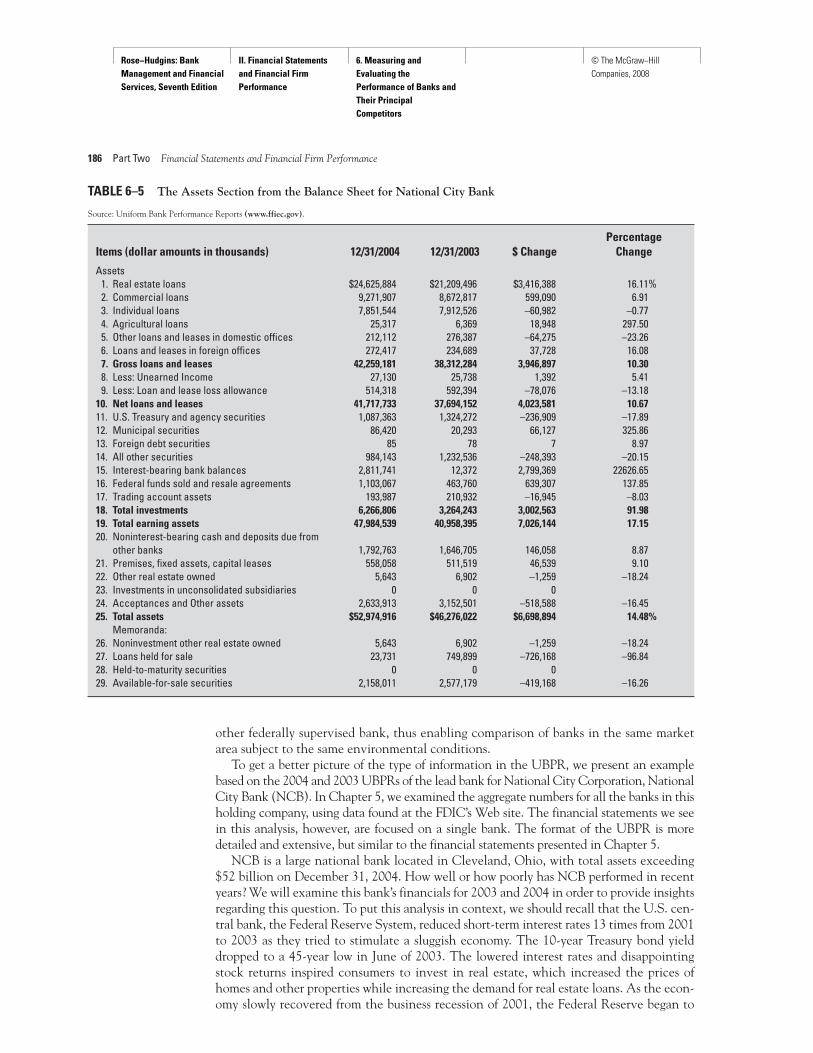
Rose−Hudgins: Bank Management and Financial Services, Seventh Edition
II. Financial Statements and Financial Firm Performance
6. Measuring and Evaluating the Performance of Banks and Their Principal Competitors
© The McGraw−Hill Companies, 2008
other federally supervised bank, thus enabling comparison of banks in the same marketarea subject to the same environmental conditions.
To get a better picture of the type of information in the UBPR, we present an examplebased on the 2004 and 2003 UBPRs of the lead bank for National City Corporation, NationalCity Bank (NCB). In Chapter 5, we examined the aggregate numbers for all the banks in thisholding company, using data found at the FDIC’s Web site. The financial statements we seein this analysis, however, are focused on a single bank. The format of the UBPR is moredetailed and extensive, but similar to the financial statements presented in Chapter 5.
NCB is a large national bank located in Cleveland, Ohio, with total assets exceeding$52 billion on December 31, 2004. How well or how poorly has NCB performed in recentyears? We will examine this bank’s financials for 2003 and 2004 in order to provide insightsregarding this question. To put this analysis in context, we should recall that the U.S. cen-tral bank, the Federal Reserve System, reduced short-term interest rates 13 times from 2001to 2003 as they tried to stimulate a sluggish economy. The 10-year Treasury bond yielddropped to a 45-year low in June of 2003. The lowered interest rates and disappointingstock returns inspired consumers to invest in real estate, which increased the prices ofhomes and other properties while increasing the demand for real estate loans. As the econ-omy slowly recovered from the business recession of 2001, the Federal Reserve began to
186 Part Two Financial Statements and Financial Firm Performance
PercentageItems (dollar amounts in thousands) 12/31/2004 12/31/2003 $ Change Change
Assets1. Real estate loans $24,625,884 $21,209,496 $3,416,388 16.11%2. Commercial loans 9,271,907 8,672,817 599,090 6.913. Individual loans 7,851,544 7,912,526 –60,982 –0.774. Agricultural loans 25,317 6,369 18,948 297.505. Other loans and leases in domestic offices 212,112 276,387 –64,275 –23.266. Loans and leases in foreign offices 272,417 234,689 37,728 16.087. Gross loans and leases 42,259,181 38,312,284 3,946,897 10.308. Less: Unearned Income 27,130 25,738 1,392 5.419. Less: Loan and lease loss allowance 514,318 592,394 –78,076 –13.18
10. Net loans and leases 41,717,733 37,694,152 4,023,581 10.6711. U.S. Treasury and agency securities 1,087,363 1,324,272 –236,909 –17.8912. Municipal securities 86,420 20,293 66,127 325.8613. Foreign debt securities 85 78 7 8.9714. All other securities 984,143 1,232,536 –248,393 –20.1515. Interest-bearing bank balances 2,811,741 12,372 2,799,369 22626.6516. Federal funds sold and resale agreements 1,103,067 463,760 639,307 137.8517. Trading account assets 193,987 210,932 –16,945 –8.0318. Total investments 6,266,806 3,264,243 3,002,563 91.9819. Total earning assets 47,984,539 40,958,395 7,026,144 17.1520. Noninterest-bearing cash and deposits due from
other banks 1,792,763 1,646,705 146,058 8.8721. Premises, fixed assets, capital leases 558,058 511,519 46,539 9.1022. Other real estate owned 5,643 6,902 –1,259 –18.2423. Investments in unconsolidated subsidiaries 0 0 024. Acceptances and Other assets 2,633,913 3,152,501 –518,588 –16.4525. Total assets $52,974,916 $46,276,022 $6,698,894 14.48%
Memoranda:26. Noninvestment other real estate owned 5,643 6,902 –1,259 –18.2427. Loans held for sale 23,731 749,899 –726,168 –96.8428. Held-to-maturity securities 0 0 029. Available-for-sale securities 2,158,011 2,577,179 –419,168 –16.26
TABLE 6–5 The Assets Section from the Balance Sheet for National City Bank
Source: Uniform Bank Performance Reports (www.ffiec.gov).

Rose−Hudgins: Bank Management and Financial Services, Seventh Edition
II. Financial Statements and Financial Firm Performance
6. Measuring and Evaluating the Performance of Banks and Their Principal Competitors
© The McGraw−Hill Companies, 2008
slowly increase interest rates in 2004. In a period characterized by low, but volatile interestrates, investors and lenders talked about whether a real estate bubble was about to burst!
Tables 6–5 through 6–9, taken from UBPR reports for 2004 and 2003, are used to assessthe performance of NCB. Tables 6–5 and 6–6 indicate the principal assets, liabilities, andcapital items held by this bank and show how these items and their components haveincreased or decreased in volume since the same time a year earlier. In terms of growth,NCB’s assets increased by more than $6.6 billion for an annual growth rate close to 14.5percent (Table 6–5, line 25). If we examine the asset items having the largest dollarincreases, we find that net loans and leases (item 10) increased by $4.02 billion (10.67 per-cent) and total investments (item 18) increased by $3 billion (91.98 percent). The sourcesof funds supporting this growth included a $3.21 billion rise (13.01 percent) in totaldeposits (Table 6–6, item 9) and a dramatic $4.88 billion increase (169.73 percent) inother borrowings with maturities greater than one year (item 14).
Table 6–5 indicates that NCB focuses on traditional banking services with $41.7 bil-lion in net loans and leases (item 10). In 2004 NCB increased its real estate loans (item1) by 16.11 percent or $3.4 billion, while the balances in most other loan categories(items 2–5) increased or decreased by smaller dollar amounts. Essentially, NCB providedwhat customers wanted—financing for housing at a time when prices in the stock marketwere declining and securities (i.e., government and private bonds) were offering histori-cally low returns. The increased proportion of real estate loans would most likely increasethe average maturity of the bank’s loan portfolio and also increase its interest-rate riskexposure, a concept introduced earlier in this chapter and discussed in detail in PartThree of this book.
NCB’s deposit growth and its growth in nondeposit liabilities more than covered thegrowth in its loan portfolio. In Table 6–6 we see that deposits in foreign offices (item 8)increased significantly, up more than 53 percent, while core deposits (item 6) increased amere 2.87 percent. Core deposits are the sum of items 1–5 in Table 6–6, representing sta-ble funds that are less likely to be removed from the bank. Core deposits also tend to be
Chapter 6 Measuring and Evaluating the Performance of Banks and Their Principal Competitors 187
PercentageItems (dollar amounts in thousands) 12/31/2004 12/31/2003 $ Change Change
Liabilities and Capital1. Demand deposits $3,873,889 $4,348,224 –$474,335 –10.91%2. All NOW and ATS accounts 270,253 189,433 80,820 42.663. Money market deposit accounts 9,087,746 8,219,768 867,978 10.564. Other savings deposits 4,611,592 4,652,219 –40,627 –0.875. Time deposits under $100,000 2,797,895 2,655,344 142,551 5.376. Core deposits 20,641,375 20,064,988 576,387 2.877. Time deposits of $100,000 or more 1,934,527 1,149,764 784,763 68.258. Deposits in foreign offices 5,343,291 3,490,673 1,852,618 53.079. Total deposits 27,919,193 24,705,425 3,213,768 13.01
10. Federal funds purchased and REPOs 2,820,675 4,139,388 –1,318,713 –31.8611. FHL borrowing with maturities less than 1 year 245,006 22 244,984 1113563.6412. FHL borrowing with maturities greater than 1 year 1,281,709 1,122,701 159,008 14.1613. Other borrowings with maturities less than 1 year 6,274,512 6,888,395 –613,883 –8.9114. Other borrowings with maturities greater than 1 year 7,761,259 2,881,257 4,880,002 169.3715. Acceptances and other liabilities 1,475,244 2,201,346 –726,102 –32.9816. Total liabilities (including mortgages) 47,777,598 41,938,534 5,839,064 13.9217. Subordinated notes and debentures 1,413,606 1,434,585 –20,979 –1.4618. All common and preferred capital 3,783,712 2,902,903 880,809 30.3419. Total liabilities and capital 52,974,916 46,276,022 6,698,894 14.48
TABLE 6–6 The Liabilities and Capital Section from the Balance Sheet for National City Bank
Source: Uniform Bank Performance Reports (www.ffiec.gov).
Rose−Hudgins: Bank Management and Financial Services, Seventh Edition
II. Financial Statements and Financial Firm Performance
6. Measuring and Evaluating the Performance of Banks and Their Principal Competitors
© The McGraw−Hill Companies, 2008
188 Part Two Financial Statements and Financial Firm Performance
among the least expensive sources of funds. Overall, total deposits (item 9) increased by13.01 percent or $3.2 billion. As interest rates began to rise, NCB increased its borrowingswith maturities greater than one year (item 14) which soared upward by nearly $5 billion.As market interest rates increased the growth in core deposits subsided and NCB appar-ently worked to lock in longer-term nondeposit borrowings.
NCB reported substantial growth in security investments, driven by a sharp advance(137.85 percent) in Federal funds sold and resale agreements (Table 6–5, item 16) and avery large gain in interest-bearing bank balances (item 15). NCB apparently increased theliquidity of its investment portfolio by changing its composition while nearly doubling theoverall size of that portfolio. Liquidity choices on the asset side of the balance sheetteamed up with increases in long-term nondeposit borrowings as sources of bank funds tohelp this large banking firm get ready for rising market interest rates.
Table 6–7 shows the composition of assets and liabilities held by NCB, using averagesacross the four quarters of the year, and presents analogous information for a peer group ofbanks. The peer group used for NCB consists of all national banks with average assets inexcess of $3 billion, including the largest 170 banks in 2004 and biggest 163 banks in2003. The changes in assets and liabilities that we discussed in Tables 6–5 and 6–6 arebased on year-end numbers whereas the percentages in Table 6–7 represent averages thattend to reduce the effects of seasonality and window dressing. From this point on, our dis-cussion will focus on average data for NCB and its peers.
For NCB we see relatively small changes in asset composition in Table 6–7. Net loansand leases as a percentage of average assets (line 4) increased from 78.41 percent at theend of 2003 to 81.34 percent as 2004 ended—a 3.74 percent increase in net loans andleases relative to average assets. However, in both years larger percentages of assets wereaccounted for by loans at NCB than was true for its peer group who reported ratios of netloans and leases to average assets of only 58.47 percent in 2003 and 58.91 percent in 2004.Because loans often represent the highest-yielding assets a bank can hold, NCB’s higherloan-asset ratio would be expected to produce relatively higher earnings than the averageearnings for the peer group.
NCB has slightly decreased its holdings of liquid assets (short-term securities and cashassets). If we sum the percentages for items 5, 6, 7, 9, and 11 in Table 6–7, we find thatinterest-bearing liquid assets and cash assets accounted for 13.25 percent of assets in 2003and 11.61 percent of assets in 2004. In contrast, the peer group has about twice the por-tion of liquid assets relative to total assets. In 2003 and 2004, liquid assets accounted for28.11 percent and 27.17 percent of assets at peer institutions. Could NCB’s managementbe accepting greater liquidity risk (i.e., the possibility of a cash-out) than is warranted?Banks, like other firms, want to have enough liquid assets to meet their needs withoutoppressing profitability with excessive funds invested in relatively low-yielding instru-ments. Their needs for funds are usually derived from their customers’ needs for fundswhere the customer draws down loan commitments (off-balance-sheet items that becomeon-balance-sheet assets) or withdraws deposits.
On the sources of funds side, we note from Table 6–7 that NCB holds a significantlysmaller proportion of core deposits (item 22) than the peer group of banks. Core deposits,as reported in the UBPR, include demand deposits, negotiable order of withdrawal(NOW) accounts, regular savings deposits, money market deposits, and time deposits ofless than $100,000. The difference is derived for the most part from money market depositaccounts (MMDAs) (in item 19). The cost of MMDAs is comparable to the cost of manynondeposit sources of funds. Given that their checkable deposits are comparable—NCBhas 8.48 percent (sum of items 17 and 18) and the peer group reports 8.56 percent—thelower proportion of core deposits does not necessarily indicate excessive funding costs.

Rose−Hudgins: Bank Management and Financial Services, Seventh Edition
II. Financial Statements and Financial Firm Performance
6. Measuring and Evaluating the Performance of Banks and Their Principal Competitors
© The McGraw−Hill Companies, 2008
When we look at nondeposit liabilities, we see that total other borrowings are significantlyhigher for NCB than for the peer group. To some extent, NCB has substituted nondepositborrowings for money market deposits compared to its peers.
Turning to NCB’s statement of earnings and expenses (Table 6–8), we must recall thechanging interest rate environment from the beginning of 2003 to the conclusion of2004. Interest rates hit bottom in 2003 and then began to rise slowly. The federal fundsrate dropped below 1 percent in December 2003 and then climbed to 2.28 percent byyear-end 2004. The 30-year home mortgage interest rate dropped to a low of 5.23 percentin June 2003, rose to a high of 6.29 percent in June 2004, and ended that year at 5.71percent. While total interest income (item 16) increased by 11.56 percent—a favorableresult—total interest expenses also increased. In an ideal world we would like income to
Chapter 6 Measuring and Evaluating the Performance of Banks and Their Principal Competitors 189
NCB Peer NCB Peer 12/31/04 12/31/04 12/31/03 12/31/03
Assets: Percentage of average assets1. Total loans 82.50% 58.22% 79.65% 57.68%2. Lease financing receivables 0.01 1.03 0.02 1.193. Less: Loan and lease loss allowance 1.17 0.80 1.26 0.864. Net loans and leases 81.34 58.91 78.41 58.475. Interest-bearing bank balances 1.18 0.76 0.03 0.876. Federal funds sold and resale agreements 1.85 2.37 2.19 2.617. Trading account assets 0.53 0.34 0.63 0.398. Held-to-maturity securities 0.00 2.01 0.00* 1.459. Available-for-sale securities 4.62 21.02 6.55 21.11
10. Total earning assets 89.52 90.08 87.81 89.8411. Noninterest-bearing cash and deposits due from other banks 3.43 2.68 3.85 3.1312. Premises, fixed assets, capital leases 1.06 1.09 1.03 1.0813. Other real estate owned 0.01 0.05 0.02 0.0514. Acceptances and other assets 5.98 5.82 7.29 5.4915. Subtotal 10.48 9.92 12.19 10.1616. Total assets 100.00 100.00 100.00 100.00Liabilities17. Demand deposits 8.05 6.65 9.28 6.5918. All NOW and ATS accounts 0.43 1.91 0.42 1.8119. Money market deposit accounts 17.91 24.34 19.34 22.0020. Other savings deposits 9.38 8.42 9.83 8.7321. Time deposits under $100,000 5.30 8.36 6.40 9.5922. Core deposits 41.07 54.67 45.27 53.9323. Time deposits of $100,000 or more 2.80 8.99 3.95 9.0224. Deposits in foreign offices 9.86 1.94 4.75 2.0425. Total deposits 53.73 68.35 53.97 67.8226. Federal funds purchased and REPOs 8.12 8.00 10.83 8.1627. Total federal home loan borrowings 2.62 4.63 2.34 4.8128. Total other borrowings 21.97 2.64 17.77 2.8429. Memo:Short-term noncore funding 22.47 22.84 26.39 22.8530. Acceptances and other liabilities 4.03 2.10 5.46 2.4631. Total liabilities (including mortgages) 90.46 89.83 90.36 90.2432. Subordinated notes and debentures 2.90 0.62 3.14 0.7133. All common and preferred capital 6.64 9.39 6.50 8.9334. Total liabilities and capital 99.99 100.00 99.99 100.00
TABLE 6–7 Percentage Composition of Assets and Liabilities for National City Bank and Its Peer Group (all figures are percentages of average total assets)
Source: Uniform Bank Performance Reports (www.ffiec.gov).
* Figure is less than 0.05 percent.

Rose−Hudgins: Bank Management and Financial Services, Seventh Edition
II. Financial Statements and Financial Firm Performance
6. Measuring and Evaluating the Performance of Banks and Their Principal Competitors
© The McGraw−Hill Companies, 2008
go up and expenses to go down. This ideal situation is similar to the famous directive toinvestors to “Buy Low and Sell High”—simplistic in theory but hard to apply, especiallywhen we are talking about interest income and expenses and both items are correlatedwith market interest rates. (We will soon be exploring the effects of these correlations inChapter 7.) Most interest income items (items 1 through 15 in Table 6–8) increased and,while the signs were mixed for individual interest expense items (items 17–23), the over-all effect was an increase in NCB’s total interest expenses (item 24).
190 Part Two Financial Statements and Financial Firm Performance
Items (dollar amounts in thousands) 12/31/2004 12/31/2003 Percentage Change
1. Interest and fees on loans $2,170,542 $1,927,084 12.63%2. Income from lease financing 102 86 18.603. Tax-exempt 2,071 1,998 3.654. Estimated tax benefit 976 909 7.375. Income on loans and leases (tax-equivalent basis) 2,171,620 1,928,079 12.636. Income from U.S. Treasury and agency securities 2,333 7,812 –70.147. Mortgage-backed securities (MBS) income 73,379 69,222 6.018. Estimated tax benefit 13 11 18.189. Income from all other securities 35,919 50,196 –28.44
10. Tax-exempt securities income 27 25 8.0011. Investment income (tax-equivalent basis) 111,644 127,241 –12.2612. Interest on due from other banks 4,968 493 907.7113. Interest on federal funds sold and resales 19,225 15,239 26.1614. Trading account income 5,393 1,688 219.4915. Other interest income 4,310 4,351 –0.9416. Total interest income (tax-equivalent basis) 2,317,160 2,077,091 11.5617. Interest on deposits in foreign offices 88,743 33,449 165.3118. Interest on time deposits over $100,000 36,021 43,248 –16.7119. Interest on all other deposits 156,541 188,654 –17.0220. Interest on federal funds purchased & repurchase agreements 61,140 64,926 –5.8321. Interest on trading liabilities and other borrowings 208,472 162,851 28.0122. Interest on mortgages and leases for other property & equipment 0 0 0.0023. Interest on subordinated notes and debentures 34,627 25,019 38.4024. Total interest expense 585,544 518,147 13.0125. Net interest income (tax-equivalent basis) 1,731,616 1,558,944 11.0826. Noninterest income 802,999 783,373 2.5127. Adjusted operating income (tax-equivalent basis) 2,534,615 2,342,317 8.2128. Noninterest expense 1,243,716 1,160,735 7.1529. Provision: Loan and lease losses 147,147 422,562 –65.1830. Pretax operating income (tax-equivalent basis) 1,143,752 759,020 50.6931. Realized gains/losses on held-to-maturity securities 0 0 0.0032. Realized gains/losses on available-for-sale securities 5,992 3,639 64.6633. Pretax net operating income (tax-equivalent basis) 1,149,744 762,659 50.7534. Applicable income taxes 421,806 208,817 102.0035. Current tax equivalent adjustments 989 920 7.5036. Other tax-equivalent adjustments 0 0 0.0037. Applicable income taxes (tax-equivalent basis) 422,795 209,737 101.5838. Net operating income 726,949 552,922 31.4739. Net extraordinary items 0 0 0.0040. Net income 726,949 552,922 31.4741. Cash dividends declared 150,000 300,000 –50.0042. Retained earnings (addition to) 576,949 252,922 128.11
TABLE 6–8 National City Bank Income Statement (Revenues and Expenses)
Source: Uniform Bank Performance Reports (www.ffiec.gov).

Rose−Hudgins: Bank Management and Financial Services, Seventh Edition
II. Financial Statements and Financial Firm Performance
6. Measuring and Evaluating the Performance of Banks and Their Principal Competitors
© The McGraw−Hill Companies, 2008
NCB’s net interest income (item 25) increased by 11.08 percent during the year. Whennet interest income is measured relative to average total assets, the net interest margin(NIM) increases slightly as illustrated by the following:
As Table 6–9 illustrates, NCB’s 3.61 percent net interest margin (NIM) is above the aver-age for its peer group of banks, which reported net interest margins of only 3.23 percent inboth 2003 and 2004. Certainly staying in front of one’s peers is positive. Management shouldbe happy that the NIM gap between NCB and its peer group is expanding, indicating relativeimprovement in NCB’s spread between all its interest revenues and all its interest expenses.
NCB’s net operating margin (line 10 in Table 6–9)—the gap between its total operatingrevenues and total operating expenses—has changed as follows:
Once again, NCB’s net operating margin is above that of its peer group, 1.51 percentversus 1.31 percent in 2004 and that is “good.” The margin between NCB and its peers has
2004$726,949
$48,025,306� 1.51%
2003
$552,922
$44,445,794� 1.24%
Net operating incomeAverage assets
� Net operating margin5
2004$1,731,616$48,025,306
� 3.61%
2003
$1,558,944$44,445,794
� 3.51%
Interest incomefrom loans and
security investments�
Interest expense onborrowed funds
Average assets� Net interest margin4
Chapter 6 Measuring and Evaluating the Performance of Banks and Their Principal Competitors 191
4The numbers in the numerator are taken from Table 6–8, items 16 and 24. The denominator is average assets based onquarterly totals for 2004 of $48,025,306 thousand and for 2003 of $44,445,794 thousand.5The numerator is based on item 38 in Table 6–8 and the denominator is average assets as provided in footnote 4.
FactoidBeginning in 1997federal law allowedbanks and othercorporate financialinstitutions that qualifyto become Subchapter Scorporations, which aretreated like partnershipsfor federal tax purposes.This generally meansthey are exempt fromincome taxes as acorporation, but theirshareholders usually paytaxes on their share ofearnings paid out by thebank or other financialfirm. For the financialinstitution withSubchapter S status,reported taxes tend tofall and earnings tend torise, while stockholdersmay pay more inpersonal income taxes(though the SubchapterS firm may pay itsshareholders more individends to help offsethigher personal taxes).
NCB Peer Group NCB Peer Group 2004 2004 2003 2003
1. Total interest income (tax-equivalent basis) 4.82% 4.46% 4.67% 4.57%2. Less: Interest expense 1.22 1.20 1.17 1.293. Equals: Net interest income (tax-equivalent basis) 3.61 3.23 3.51 3.234. Plus: Noninterest income 1.67 1.73 1.76 1.835. Minus: Noninterest expense 2.59 2.89 2.61 2.956. Minus: Provision for loan and lease losses 0.31 0.14 0.95 0.277. Equals: Pretax operating income
(tax-equivalent basis) 2.38 1.97 1.71 1.898. Plus: realized gains/losses on securities 0.01 0.02 0.01 0.059. Equals: Pretax net operating income
(tax-equivalent basis) 2.39 2.00 1.72 1.9510. Net operating income 1.51 1.31 1.24 1.2811. Adjusted net operating income 1.43 1.29 1.37 1.2912. Net income adjusted for Subchapter S status 1.31 1.2813. Net income 1.51 1.31 1.24 1.28
TABLE 6–9Relative IncomeStatement and MarginAnalysis for NationalCity Bank and ItsPeer Group (allfigures arepercentages of averagetotal assets)
Source: Uniform BankPerformance Reports(www.ffiec.gov).

Rose−Hudgins: Bank Management and Financial Services, Seventh Edition
II. Financial Statements and Financial Firm Performance
6. Measuring and Evaluating the Performance of Banks and Their Principal Competitors
© The McGraw−Hill Companies, 2008
increased significantly: while NCB’s net operating margin rose by a whopping 21.77 per-cent, the peer group’s comparable ratio increased by only 2.34 percent. By this measureNCB outshines its peer group of banking firms.
However, NCB’s stockholders will probably be most concerned about the earnings pershare (EPS) of stock that they hold. National City Corporation (the bank holding com-pany) had 605,996,120 shares outstanding in 2003 and 646,749,650 shares of stock in2004 (according to its annual report submitted to the SEC and accessible using the studentversion of S&P’s Market Insights and the associated Edgar link). Using this data we cancalculate the EPS on a bank basis (using net income from NCB). Its EPS changed as fol-lows between year-end 2003 and 2004:
The bank experienced a significant jump in stockholders’ earnings per share. Remem-ber this calculation is based on the net income for the lead bank divided by the number ofshares of National City Corporation, the bank holding company. Hence, caution in inter-preting these results is important. Keeping this in mind, management would certainly liketo see this trend continue.
As we move further down the income and expense statement in Table 6–8 we see that,while net interest income increased by 11.08 percent in 2004, net income (item 40)increased by a remarkable 31.47 percent! This was due to a small 2.51 percent increase innoninterest income (item 26), a 64.66 percent increase in realized gains on available-for-sale securities (item 32), and a 65.18 percent decrease in the provision for loan and leaselosses (item 29). With a bank that focuses substantially on lending like NCB, changes inthe Report of Income’s provision for loan and lease losses (item 29) and the related loanand lease allowance for losses account (item 9 in Table 6–5) contained in the Report ofCondition may provide some insights into the quality of the bank’s loan portfolio. (Note:If you are a bit confused about what these accounts represent, please review the discussionin Chapter 5.)
NCB’s loan-loss provision expense of $147,147 thousand was just over a third of theloss provision for the previous year. The loan-loss allowance account decreased 13.18 per-cent to $514,318 thousand. This tells us that the annual loan-loss expense was less thanthe actual volume of net charge-offs, resulting in a smaller allowance account on NCB’sReport of Condition. According to Table 6–7 the loan and lease loss allowance to averageassets (item 3) went from 1.26 percent in 2003 to 1.17 percent in 2004. Managementappears to be cashing in on the low loan losses that were characteristic of this time period.
How did NCB do relative to its peer group with regard to income and expenses? Table6–9 provides a glimpse of an answer for this question. NCB improved its performance in2004. It outperformed its peer group on interest income (item 1) and noninterest expense(item 5) in both 2003 and 2004. Outperformed means NCB’s interest income was higheras a percentage of its average assets and its noninterest expenses were lower as a percent-age of its average assets than comparable banks. The lower noninterest expense indicatesthat management has succeeded in controlling overhead costs relative to its peer group.Overall, the successes regarding interest income and noninterest expenses illustrated inthe upper portion of Table 6–9 led to both higher net operating income (item 10) andhigher net income (item 13) relative to average total assets for NCB versus its peer groupof banks in 2004.
2004$726,949,000646,749,650
� $1.12 per share
2003
$552,922,000605,996,120
� $0.91 per share
EPS �Net income
Common equity shares outstanding
192 Part Two Financial Statements and Financial Firm Performance

Rose−Hudgins: Bank Management and Financial Services, Seventh Edition
II. Financial Statements and Financial Firm Performance
6. Measuring and Evaluating the Performance of Banks and Their Principal Competitors
© The McGraw−Hill Companies, 2008
NCB looks good relative to its peers and the profitability ratios are getting better.ROA increased by 21.77 percent. We can explore NCB’s earnings further using Equa-tions (6–11), (6–14), and (6–18) discussed earlier in this chapter. Equation (6–11) pro-vides the following breakdown using quarterly average figures for Report of Conditionitems:
NCB’s ROE in 2004:6
ROE � 0.0151 × 15.06� 0.2280 or 22.80%
NCB’s ROE in 2003:6
ROE � 0.0124 × 15.38� 0.1914 or 19.14%
Clearly, NCB’s ROE increased because its ROA—a measure of managerial efficiency—improved. At the same time NCB’s use of leverage (i.e., the proportion of its assets sup-ported by debt) decreased. Management and the board of directors expanded the amountof equity capital through increased profits and reductions in stock dividend payments. Thedollar amount of dividends declared in 2004 was half the 2003 dividend declaration andthis tended to lower the equity multiplier.
We can expand this analysis a bit further using Equation (6–14) for ROE:
NCB’s ROE in 2004:7
NCB’s ROE in 2003.7
What factors in these earnings relationships caused NCB’s return to its stockholders(ROE) to rise? The key factors were: (1) NCB’s rising net profit margin, which increased by20.54 percent, and (2) the nearly 1 percent rise in NCB’s asset utilization ratio (operating
� 0.1914 or 19.14%
� 0.1933 � 0.0644 � 15.38
ROE �$552,922
$2,860,464�
$2,860,464$44,445,794
�$44,445,794$2,888,977
� 0.2280 or 22.80%
� 0.2330 � 0.0650 � 15.06
ROE �$726,949
$3,120,159�
$3,120,159$48,025,306
�$48,025,306$3,188,880
�Average assets
Average equity capital
ROE �Net income
Total operating revenue�
Total operating revenueAverage assets
ROE � ROA �Average assets
Average equity capital
Chapter 6 Measuring and Evaluating the Performance of Banks and Their Principal Competitors 193
6ROA is item 13 from Table 6–9 and for balance sheet items we use average assets as reported in the UBPR and deriveaverage equity capital from item 33 in Table 6–7. For 2004 average equity capital equaled 6.64 percent of average assetswhere average assets were $48,025,306.7Total operating revenue is item 16 plus item 26 from Table 6–8.
Rose−Hudgins: Bank Management and Financial Services, Seventh Edition
II. Financial Statements and Financial Firm Performance
6. Measuring and Evaluating the Performance of Banks and Their Principal Competitors
© The McGraw−Hill Companies, 2008
Summary The principal focus of this chapter has been on how well banks and other financial firmsperform in serving their customers and in providing acceptable returns to their owners. Wehave also noted that many of the measures of financial-firm performance provide keyinsights regarding the interindustry competition today between banks, thrift institutions,security brokers and dealers, mutual funds, finance companies, and insurance firms.Increasingly, bankers and their competitors are being forced to assess their performanceover time, analyze the reasons for any performance problems that appear, and find ways tostrengthen their performance in the future.
ww
w.m
hhe.com/rose7e
194 Part Two Financial Statements and Financial Firm Perfromance
revenues to average assets). These positive effects were mitigated to some extent by the 2.08percent decline in the equity multiplier from 15.38 times to 15.06 times.
Analysis of ROE using Equation (6–18) emphasizes NCB’s record of expense control asillustrated by its rising net profit margin and improved asset management efficiency. Therelevant equation is:
NCB’s ROE in 2004:8
NCB’s ROE in 2003:8
A glance at the breakdown of ROE above shows a decline in tax-management efficiencywith net income to pretax operating income decreasing from 72.50 percent in 2003 to 63.23percent in 2004. For every dollar of pretax operating income NCB paid out about 27 centsin taxes in 2003, which rose further to nearly 37 cents in 2004. On a brighter note, however,the measure of expense-control efficiency (pretax net operating income to total operatingrevenue) advanced by more than 38 percent, pointing to improved expense control.
In conclusion, we have utilized the tools developed in this chapter and NCB’s UBPR toget a better picture of the operations and management of this bank. NCB appears to bemore focused on the traditional business of lending than is the average large bank today.Its operations have generated higher revenues and lower expenses than its peers and thisperformance superiority generally broadened between 2003 and 2004.
� 0.1914 or 19.14%
� 0.7250 � 0.2666 � 0.0644 � 15.38
ROE �$552,922$762,659
�$762,659
$2,860,464�
$2,860,464$44,445,794
�$44,445,794$2,888,977
� 0.2280 or 22.80%
� 0.6323 � 0.3685 � 0.0650 � 15.06
ROE �$726,949
$1,149,744�
$1,149,744$3,120,159
�$3,120,159$48,025,306
�$48,025,306$3,188,880
�Total operating revenues
Average assets�
Average assetsAverage equity capital
ROE �Net income
Pretax net operating income�
Pretax net operating incomeTotal operating revenues
8Pretax net operating income is item 33 from Table 6–8.

Rose−Hudgins: Bank Management and Financial Services, Seventh Edition
II. Financial Statements and Financial Firm Performance
6. Measuring and Evaluating the Performance of Banks and Their Principal Competitors
© The McGraw−Hill Companies, 2008
1. An investor holds the stock of First National Bank of Imoh and expects to receive adividend of $12 per share at the end of the year. Stock analysts have recently predictedthat the bank’s dividends will grow at approximately 3 percent a year indefinitely intothe future. If this is true, and if the appropriate risk-adjusted cost of capital (discountrate) for the bank is 15 percent, what should be the current price per share of Imoh’sstock?
2. Suppose that stockbrokers have projected that Poquoson Bank and Trust Company willpay a dividend of $3 per share on its common stock at the end of the year; a dividendof $4.50 per share is expected for the next year, and $6 per share in the following year.The risk-adjusted cost of capital for banks in Poquoson’s risk class is 17 percent. If aninvestor holding Poquoson’s stock plans to hold that stock for only three years andhopes to sell it at a price of $55 per share, what should the value of the bank’s stock bein today’s market?
3. Depositors Savings Association has a ratio of equity capital to total assets of 7.5 per-cent. In contrast, Newton Savings reports an equity-capital-to-asset ratio of 6 percent.
Chapter 6 Measuring and Evaluating the Performance of Banks and Their Principal Competitors 195
ww
w.m
hhe.com/rose7e
Among the key points made in the chapter are these:
• The two key dimensions of performance among financial-service firms are profitabilityand risk. Satisfactory profits and adequate risk controls preserve capital, providing abasis for a financial firm’s survival and future growth.
• For the largest profit-oriented financial institutions the market value of their stock(equities) is usually the best overall indicator of profitability and risk exposure.
• For smaller financial firms whose stock is not actively traded every day a number of keyprofitability ratios (such as return on assets, return on equity capital, net interest margin,noninterest margin, and earnings spread) become important performance measures andsignificant managerial targets.
• Pursuit of profitability must always be tempered with concern for risk exposure, includ-ing the management and control of credit or default risk, liquidity or cash-out risk, mar-ket risk to the value of assets and liabilities held, interest-rate risk, operational risk,legal and compliance risks, reputation risk, strategic risk, and capital risk. The latter riskmeasure focuses upon the probability of ultimate failure if a financial firm is undercap-italized relative to the risks it faces.
• Increasingly financial-service firms are adding operating efficiency to their list of perfor-mance criteria, focusing upon measures of expense control and the productivity ofemployees in managing assets, revenues, and income.
• The chapter concludes with a discussion of the Uniform Bank Performance Report(UBPR) available from the Federal Financial Institutions Examination Council. Thisfinancial report on individual FDIC-insured commercial and savings banks has becomeone of the most widely used performance summaries available to bankers, regulators,customers, and the general public.
Key Terms profitability, 167ROA, 167ROE, 167efficiency, 168net interest margin, 168net noninterest, margin, 168
net profit margin, 170asset utilization, 170equity multiplier, 170credit risk, 177liquidity risk, 178market risk, 178interest rate risk, 179
operational risk, 179legal risk, 180compliance risk, 180reputation risk, 180strategic risk, 180capital risk, 180UBPR, 185
Problemsand Projects
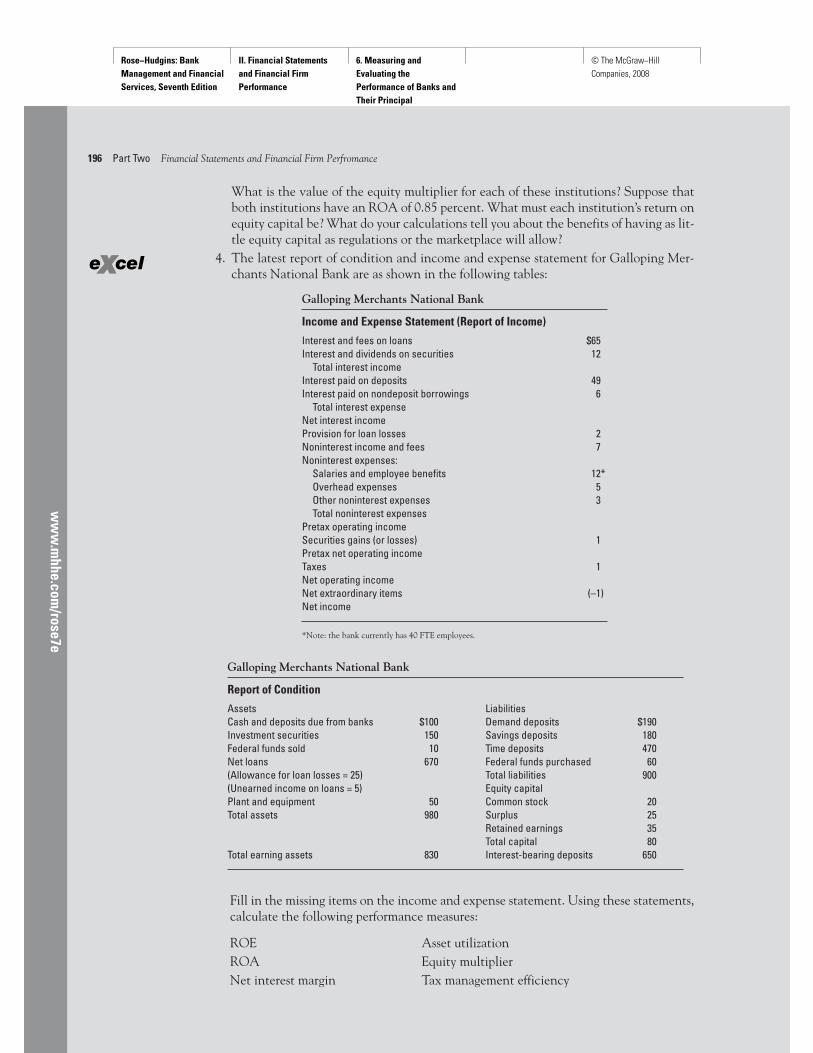
Rose−Hudgins: Bank Management and Financial Services, Seventh Edition
II. Financial Statements and Financial Firm Performance
6. Measuring and Evaluating the Performance of Banks and Their Principal Competitors
© The McGraw−Hill Companies, 2008
ww
w.m
hhe.com/rose7e
196 Part Two Financial Statements and Financial Firm Perfromance
What is the value of the equity multiplier for each of these institutions? Suppose thatboth institutions have an ROA of 0.85 percent. What must each institution’s return onequity capital be? What do your calculations tell you about the benefits of having as lit-tle equity capital as regulations or the marketplace will allow?
4. The latest report of condition and income and expense statement for Galloping Mer-chants National Bank are as shown in the following tables:
Galloping Merchants National Bank
Income and Expense Statement (Report of Income)
Interest and fees on loans $65Interest and dividends on securities 12
Total interest incomeInterest paid on deposits 49Interest paid on nondeposit borrowings 6
Total interest expenseNet interest incomeProvision for loan losses 2Noninterest income and fees 7Noninterest expenses:
Salaries and employee benefits 12*Overhead expenses 5Other noninterest expenses 3Total noninterest expenses
Pretax operating incomeSecurities gains (or losses) 1Pretax net operating incomeTaxes 1Net operating incomeNet extraordinary items (–1)Net income
*Note: the bank currently has 40 FTE employees.
Galloping Merchants National Bank
Report of Condition
Assets LiabilitiesCash and deposits due from banks $100 Demand deposits $190Investment securities 150 Savings deposits 180Federal funds sold 10 Time deposits 470Net loans 670 Federal funds purchased 60(Allowance for loan losses = 25) Total liabilities 900(Unearned income on loans = 5) Equity capitalPlant and equipment 50 Common stock 20Total assets 980 Surplus 25
Retained earnings 35Total capital 80
Total earning assets 830 Interest-bearing deposits 650
Fill in the missing items on the income and expense statement. Using these statements,calculate the following performance measures:
ROE Asset utilizationROA Equity multiplierNet interest margin Tax management efficiency

Rose−Hudgins: Bank Management and Financial Services, Seventh Edition
II. Financial Statements and Financial Firm Performance
6. Measuring and Evaluating the Performance of Banks and Their Principal Competitors
© The McGraw−Hill Companies, 2008
Please calculate:
ROE _____ROA _____Net interest margin _____Earnings per share _____Net noninterest margin _____Net operating margin _____
Alternative scenarios:a. Suppose interest income, interest expenses, noninterest income, and noninterest
expenses each increase by 5 percent while all other revenue and expense itemsshown in the preceding table remain unchanged. What will happen to Shallow’sROE, ROA, and earnings per share?
b. On the other hand, suppose Shallow’s interest income and expenses as well as itsnoninterest income and expenses decline by 5 percent, again with all other factorsheld constant. How would the bank’s ROE, ROA, and per-share earnings change?
6. Blue and White National Bank holds total assets of $1.69 billion and equity capital of$139 million and has just posted an ROA of 1.10 percent. What is the bank’s ROE?
Alternative scenarios:a. Suppose Blue and White Bank finds its ROA climbing by 50 percent, with assets
and equity capital unchanged. What will happen to its ROE? Why?b. On the other hand, suppose the bank’s ROA drops by 50 percent. If total assets and
equity capital hold their present positions, what change will occur in ROE?c. If ROA at Blue and White National remains fixed at 0.0076 but both total assets
and equity double, how does ROE change? Why?d. How would a decline in total assets and equity by half (with ROA still at 0.0076)
affect the bank’s ROE?
Chapter 6 Measuring and Evaluating the Performance of Banks and Their Principal Competitors 197
ww
w.m
hhe.com/rose7e
Net noninterest margin Expense control efficiencyNet operating margin Asset management efficiencyEarnings spread Funds management efficiencyNet profit margin Operating efficiency ratio
What strengths and weaknesses are you able to detect in Galloping Merchants’ perfor-mance?
5. The following information is for Shallow National Bank:
Interest income $ 2,100.00Interest expense 1,400.00Total assets 30,000.00Security losses or gains 21.00Earning assets 25,000.00Total liabilities 27,000.00Taxes paid 16.00Shares of comon stock outstanding 5,000Noninterest income $ 700.00Noninterest expense 900.00Provision for loan losses 100.00

Rose−Hudgins: Bank Management and Financial Services, Seventh Edition
II. Financial Statements and Financial Firm Performance
6. Measuring and Evaluating the Performance of Banks and Their Principal Competitors
© The McGraw−Hill Companies, 2008
ww
w.m
hhe.com/rose7e
198 Part Two Financial Statements and Financial Firm Perfromance
7. Monarch State Bank reports total operating revenues of $135 million, with total oper-ating expenses of $121 million, and owes taxes of $2 million. It has total assets of$1.00 billion and total liabilities of $900 million. What is the bank’s ROE?
Alternative scenarios:
a. How will the ROE for Monarch State Bank change if total operating expenses,taxes, and total operating revenues each grow by 10 percent while assets and liabil-ities remain fixed?
b. Suppose Monarch State’s total assets and total liabilities increase by 10 percent, butits revenues and expenses (including taxes) are unchanged. How will the bank’sROE change?
c. Can you determine what will happen to ROE if both operating revenues andexpenses (including taxes) decline by 10 percent, with the bank’s total assets andliabilities held constant?
d. What does ROE become if Monarch State’s assets and liabilities decrease by 10percent, while its operating revenues, taxes, and operating expenses do notchange?
8. Suppose a stockholder-owned thrift institution is projected to achieve a 1.25 per-cent ROA during the coming year. What must its ratio of total assets to equity cap-ital be if it is to achieve its target ROE of 12 percent? If ROA unexpectedly falls to0.75 percent, what assets-to-capital ratio must it then have to reach a 12 percentROE?
9. Saylor County National Bank presents us with these figures for the year just con-cluded. Please determine the net profit margin, equity multiplier, asset utilizationratio, and ROE.
Net income $ 18.00Total operating revenues 125.00Total assets 1,500.00Total equity capital accounts 155.00
10. Lochiel Commonwealth Bank and Trust Company has experienced the followingtrends over the past five years (all figures in millions of dollars):
Net Income Total Operating Total Equity Year After-Tax Revenues Total Assets Capital
1 $2.70 $26.50 $293.00 $18.002 3.50 30.10 382.00 20.003 4.10 39.80 474.00 22.004 4.80 47.50 508.00 25.005 5.70 55.90 599.00 28.00
Determine the figures for ROE, profit margin, asset utilization, and equity multiplierfor this bank. Are any adverse trends evident? Where would you recommend thatmanagement look to deal with the bank’s emerging problem(s)?
11. Wilmington Hills State Bank has just submitted its Report of Condition and Report ofIncome to its principal supervisory agency. The bank reported net income before taxesand securities transactions of $27 million and taxes of $6 million. If its total operating
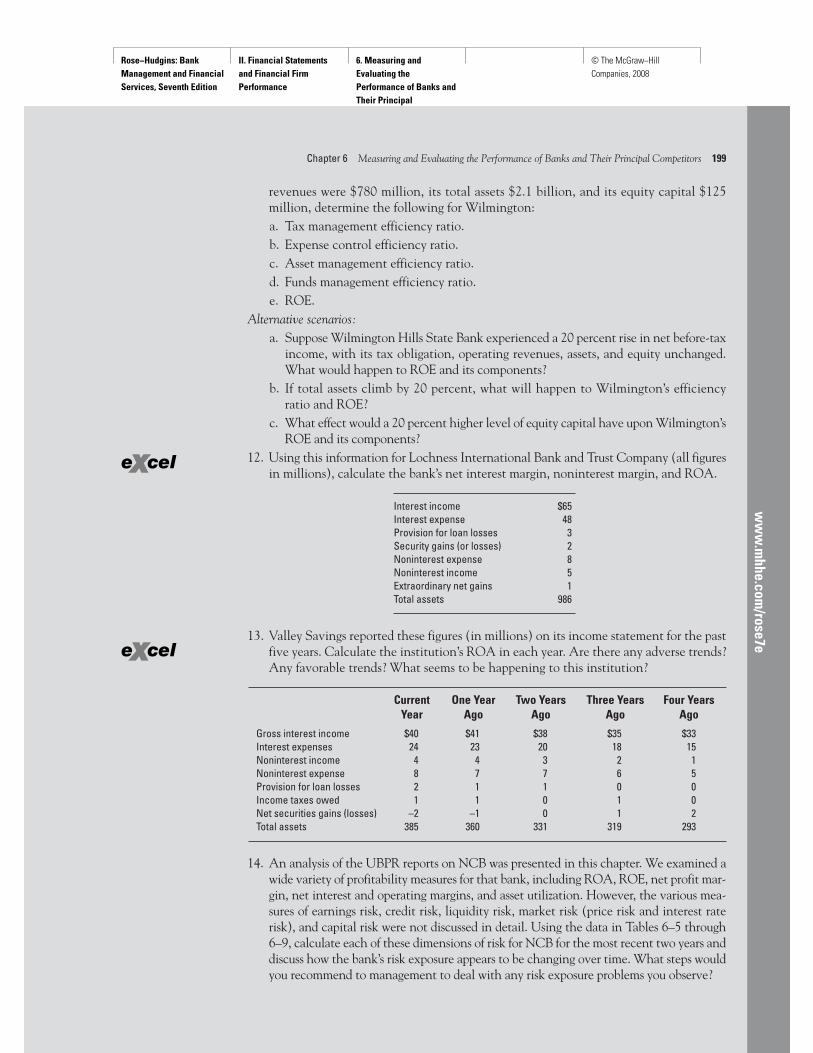
Rose−Hudgins: Bank Management and Financial Services, Seventh Edition
II. Financial Statements and Financial Firm Performance
6. Measuring and Evaluating the Performance of Banks and Their Principal Competitors
© The McGraw−Hill Companies, 2008
13. Valley Savings reported these figures (in millions) on its income statement for the pastfive years. Calculate the institution’s ROA in each year. Are there any adverse trends?Any favorable trends? What seems to be happening to this institution?
Chapter 6 Measuring and Evaluating the Performance of Banks and Their Principal Competitors 199
ww
w.m
hhe.com/rose7e
revenues were $780 million, its total assets $2.1 billion, and its equity capital $125million, determine the following for Wilmington:a. Tax management efficiency ratio.b. Expense control efficiency ratio.c. Asset management efficiency ratio.d. Funds management efficiency ratio.e. ROE.
Alternative scenarios:a. Suppose Wilmington Hills State Bank experienced a 20 percent rise in net before-tax
income, with its tax obligation, operating revenues, assets, and equity unchanged.What would happen to ROE and its components?
b. If total assets climb by 20 percent, what will happen to Wilmington’s efficiencyratio and ROE?
c. What effect would a 20 percent higher level of equity capital have upon Wilmington’sROE and its components?
12. Using this information for Lochness International Bank and Trust Company (all figuresin millions), calculate the bank’s net interest margin, noninterest margin, and ROA.
Interest income $65Interest expense 48Provision for loan losses 3Security gains (or losses) 2Noninterest expense 8Noninterest income 5Extraordinary net gains 1Total assets 986
Current One Year Two Years Three Years Four Years Year Ago Ago Ago Ago
Gross interest income $40 $41 $38 $35 $33Interest expenses 24 23 20 18 15Noninterest income 4 4 3 2 1Noninterest expense 8 7 7 6 5Provision for loan losses 2 1 1 0 0Income taxes owed 1 1 0 1 0Net securities gains (losses) –2 –1 0 1 2Total assets 385 360 331 319 293
14. An analysis of the UBPR reports on NCB was presented in this chapter. We examined awide variety of profitability measures for that bank, including ROA, ROE, net profit mar-gin, net interest and operating margins, and asset utilization. However, the various mea-sures of earnings risk, credit risk, liquidity risk, market risk (price risk and interest raterisk), and capital risk were not discussed in detail. Using the data in Tables 6–5 through6–9, calculate each of these dimensions of risk for NCB for the most recent two years anddiscuss how the bank’s risk exposure appears to be changing over time. What steps wouldyou recommend to management to deal with any risk exposure problems you observe?

Rose−Hudgins: Bank Management and Financial Services, Seventh Edition
II. Financial Statements and Financial Firm Performance
6. Measuring and Evaluating the Performance of Banks and Their Principal Competitors
© The McGraw−Hill Companies, 2008
ww
w.m
hhe.com/rose7e
200 Part Two Financial Statements and Financial Firm Perfromance
Internet Exercises1. You have been asked to compare the growth rate in assets and deposits of several banks
that are regarded as takeover targets for your growth-oriented company. These banksinclude:Amsouth Bank (www.amsouth.com)BB&T (www.bbt.com)SunTrust Banks (www.suntrust.com)Using the above company Web sites and other appropriate sites, determine which ofthese banks seems to be growing faster and why. Which would you recommend as a pos-sible takeover target and why?
2. A guest speaker visiting your class contends that Bank of America is one of the mostprofitable banks of its size in the United States. Your instructor says that’s really nottrue; it tends to be a middle-of-the-road performer. Check these claims out on the Web(for example, at www.bankofamerica.com and www.fdic.gov). Who is right and whatmakes you think so?
3. The Uniform Bank Performance Reports (UBPRs) provide detailed financial perfor-mance data on all federally supervised U.S. banks. Using the Web site of the FederalFinancial Institutions Examination Council (at www.ffiec.gov), see if you can deter-mine what happened to the earnings and credit risk exposure of Wachovia Corp.(www.wachovia.com) and Wells Fargo Bank (www.wellsfargo.com) in the mostrecent year for which data is available.
S&P Market Insight Challenge (www.mhhe.com/edumarketinsight)1. You can depend on S&P Industry Surveys concluding with sections on “How to Ana-
lyze a Company” and a “Comparative Company Analysis.” To access these surveys usethe Industry tab, and the drop-down menu supplies several subfinancial-service indus-try selections, such as Asset Management & Custody Banks, Consumer Finance, Diver-sified Banks, Diversified Capital Markets, Insurance Brokers, Investment Banking andBrokerage, Life & Health Insurance, Multiline Insurance, Property & Casualty Insur-ance, Regional Banks, and Thrifts & Mortgage Finance. Once an industry has beenselected you will find downloadable S&P Industry Surveys, covering such key financial-services sectors as Banking, Investment Services, Financial Services Diversified, Insur-ance: Property and Casualty, Insurance: Life and Health, and Savings and Loans. Pleasedownload S&P Industry Surveys for two of these financial sectors and review the Howto Analyze and Comparative Company Analysis write-ups on each. In each category offinancial firms found in the Comparative Company Analysis, identify the firm with thehighest return on equity capital (ROE). How do the ROEs compare across categoriesand subindustries? Are there any other performance measures that could be comparedacross financial-service sectors?
2. Today banks, securities firms, insurance companies, and finance/credit-card businesses arebattling for many of the same customers and for many of the same sources of capital to sup-port their growth and expansion. As a result there is keen interest today in the compara-tive financial performance of firms in these four competing industries. Using S&P’s MarketInsight, Educational Version, see if you can determine which of these financial-serviceindustries are outperforming the others in terms of returns on equity capital and risk exposure. You may find it useful to select certain firms from the Market Insight file to com-pare performances across these industries. For example, you can compare the financialstatements of such companies as MetLife Insurance Inc. (MET), Capital One FinancialGroup (COF), Goldman Sachs Group (GS), and FleetBoston Financial Corp. (FBF).

Rose−Hudgins: Bank Management and Financial Services, Seventh Edition
II. Financial Statements and Financial Firm Performance
6. Measuring and Evaluating the Performance of Banks and Their Principal Competitors
© The McGraw−Hill Companies, 2008
Chapter 6 Measuring and Evaluating the Performance of Banks and Their Principal Competitors 201
EVALUATION OF YOUR BANK’S PROFITABILITY
Part One: A Performance Comparison to PeersIn Chapter 6 we focus on the evaluation of financial statements.Key profitability ratios are introduced and ROE and ROA are bro-ken down into component ratios to aid interpretation. We usedthe UBPR for National City Bank, the lead bank of National CityCorporation, to illustrate trends (comparison of December 2004with December 2003 bank data) and for comparative analysis(comparison of bank data with peer group data). You will be eval-uating your BHC by (1) calculating percentage changes usingyour dollar data and interpreting this information; (2) comparingyour BHC with the group of peer banks using the percentages-to-total assets data; and (3) utilizing the profitability ratios discussedin this chapter to evaluate management’s performance.A. Open your Excel Workbook and go to the spreadsheet con-
taining dollar amounts for Year-to-Year Comparisons. Deleteany numbers in columns D and E. Refer to Tables 6–5, 6–6,and 6–8 as examples for what you are about to do. Calculatethe dollar changes in Column D and the Percentage Changes
in Column E for each item. Write one paragraph discussingthe percentage changes in Total Assets, Total Liabilities, andTotal Equity Capital.
B. The spreadsheet containing items expressed as percentagesof assets developed for Comparisons with the Peer Group inChapter 5’s Real Numbers for Real Banks assignment is verysimilar to the data provided for NCB in Tables 6–7 and 6–9.a. Write one paragraph comparing the asset composition
for your BHC with that of the peer group.b. Write one paragraph comparing the sources of funds
composition for your BHC with that of the peer group.c. Write one paragraph comparing the components of
income and expenses for your BHC with that of thepeer group.
Part Two: A Breakdown of ReturnsA. Open the Year-to-Year Comparisons spreadsheet. Immedi-
ately below the income and expense data, add the rowsillustrated below:
B. Calculate the ratios for the most recent year in Column Band then for the prior year in column C using the formulafunctions in Excel and the data in Rows 1 through 52 to cre-ate the entries. For example, the formula for ROE entered incell B54 would be: “=B52/B26”.
C. In rows 54 through 58, calculate the key profitability ratiosfrom Equations (6–4) through (6–8) in the chapter. Write oneparagraph comparing profitability across years.
D. Rows 59 through 62 provide the framework for a break-down of equity returns using Equations (6–14) through(6–17) in this chapter. Write one paragraph discussing the
change in ROE using this breakdown. Incorporate the basicequation and interpret the information for your bank.
E. Rows 63 through 65 call for a breakdown of the net profitmargin, as illustrated by Equation (6–18). Write one para-graph discussing the components of the net profit marginfor your bank and the implications of the changes occur-ring across the years.
F. Rows 66 through 69 provide the framework for a break-down of ROA (Equation [6–20] in this chapter). Write oneparagraph discussing the change in ROA and its compo-nents for your bank.
Assignment for Chapter 6R E A L N U M B E R SF O R R E A L B A N K S
ww
w.m
hhe.com/rose7e

Rose−Hudgins: Bank Management and Financial Services, Seventh Edition
II. Financial Statements and Financial Firm Performance
6. Measuring and Evaluating the Performance of Banks and Their Principal Competitors
© The McGraw−Hill Companies, 2008
ww
w.m
hhe.com/rose7e
202 Part Two Financial Statements and Financial Firm Perfromance
For an explanation of measuring and evaluating risk in banking and financial services, see the fol-lowing studies:
1. Gilbert, R. Alton, Andrew P. Meyer, and Mark D. Vaughn. “How Healthy Is the Bank-ing System? Funneling Financial Data into Failure Probability.” Regional Economist,Federal Reserve Bank of St. Louis, April 2001, pp. 12–13.
2. Kristad, Jeffrey, and Pat Donnelly. “An Examiner’s View of Operational Risk.” BankNews, July 31, 2001, pp. 25–27.
3. Rose, Peter S. “Risk—Taking the Temperature and Finding a Cure.” The CanadianBanker, November/December, 1987, pp. 54–63.
4. Wright, David M., and James Houpt. “An Analysis of Commercial Bank Exposure toInterest Rate Risk.” Federal Reserve Bulletin, February 1996, pp. 116–28.
For information on how to read bank financial statements and make comparisons among differentinstitutions, see the following:
5. Federal Financial Institutions Examination Council. A User’s Guide for the UniformBank Performance Report. Washington, D.C., 2002.
6. Gilbert, R. Alton, and Gregory E. Sierra. “The Financial Condition of U.S. Banks: HowDifferent Are Community Banks?” Review, Federal Reserve Bank of St. Louis, Janu-ary/February 2003, pp. 43–56.
7. Gunther, Jeffrey W., and Robert R. Moore. “Financial Statements and Reality: Do Trou-bled Banks Tell All?” Economic and Financial Review, Federal Reserve Bank of Dallas,Third Quarter 2000, pp. 30–35.
8. Klee, Elizabeth C., and Fabio M. Natalucci. “Profits and Balance Sheet Developmentsat U.S. Commercial Banks in 2004.” Federal Reserve Bulletin, Spring 2005, pp. 143–74.
9. Wetmore, Jill L., and John R. Brick. “The Basis Risk Component of Commercial BankStock Returns.” Journal of Economics and Business 50 (1998), pp. 67–76.
SelectedReferences

Rose−Hudgins: Bank Management and Financial Services, Seventh Edition
II. Financial Statements and Financial Firm Performance
6. Measuring and Evaluating the Performance of Banks and Their Principal Competitors
© The McGraw−Hill Companies, 2008
Chapter 6 Measuring and Evaluating the Performance of Banks and Their Principal Competitors 203
Appendix
Improving the Performance of Financial Firms through Knowledge:Sources of Information on the Financial-Services IndustryChapter 6 focused on how to measure the performance ofbanks and some of their closest competitors in today’sfinancial marketplace. However, mere measurement ofthe dimensions of performance is not enough. Managersmust have the tools and the knowledge necessary toimprove performance over time. The chapters that followthis one will provide many of the tools needed for suc-cessful management of a financial institution, but man-agers will always need more information than textbookscan provide. Their problems and solutions may be highlytechnical and will shift over time, often at a faster pacethan the one at which textbooks are written. The samedifficulty confronts regulators and customers. They mustoften reach far afield to gather vital information in orderto evaluate their financial-service providers and get thebest service from them.
Where do the managers of financial institutions find theinformation they need? One good source is the professionalschools in many regions of the nation. Among the mostpopular of these is the Stonier Graduate School of Bankingsponsored by the American Bankers Association. Otherprofessional schools are often devoted to specific problemareas, such as marketing, consumer lending, and commerciallending. Each offers educational materials and often supplieshomework problems to solve.
Beyond the professional schools, selected industry tradeassociations annually publish a prodigious volume of writtenstudies and management guidelines for wrestling withimportant performance problems, such as developing andpromoting new services, working out problem assets, design-ing a financial plan, and so on. Among the most populartrade associations publishing problem-solving informationin the financial-services field are:
• The American Bankers Association at www.aba.com.• Bank Administration Institute at www.bai.org.• Risk Management Association (RMA), Association of
Risk Management and Lending Professionals at www.rmahq.org.
• America’s Community Bankers at www.acbankers.org.• Credit Union National Association (CUNA) at www.
cuna.org.• American Council of Life Insurance (ACLI) at www.
acli.org.• Investment Company Institute (ICI) at www.ici.org.
• Insurance Information Institute (III) at www.iii.org.
In addition to the material provided by these and numerousother trade associations, dozens of journals and books arereleased each year by book publishing houses, magazine pub-lishers, and government agencies. Among the most impor-tant of these recurring sources are the following:
General Information on Banking and CompetingFinancial-Service Industries• ABA Banking Journal (published by the American Bankers
Association at www.banking.com).• Risk Management and Lending Professionals Journal (pub-
lished by the Risk Management Association at www.rmahq.org).
• The Canadian Banker (published by the Canadian BankersAssociation at www.cba.ca).
• ABA Bank Marketing Magazine at www.aba.com/Mar-ketingNetwork.
Sources of Data on Individual Banks and Competing Financial Firms• Uniform Bank Performance Reports (UBPR) (published
quarterly by the Federal Financial Institutions Examina-tion Council at www.fiec.gov).
• Historical Bank Condition and Income Reports (avail-able from the National Technical Information Service atwww.ntis.org).
• American Banker Online (banking industry newspaperpublished by the American Bankers Association atwww.americanbanker.com).
• The Wall Street Journal (published by Dow Jones & Co.,Inc., and online at www.wsj.com).
Economic and Financial Trends Affecting Bankingand the Financial Services Sector• Survey of Current Business (published by the U.S. Depart-
ment of Commerce at www.bea.gov/bea/pubs.htm).• Federal Reserve Bulletin (published by the Board of Gov-
ernors of the Federal Reserve System and available atwww.federalreserve.gov/pubs/bulletin).
• National Economic Trends and Monetary Trends (all pub-lished by the Federal Reserve Bank of St. Louis atwww.stls.frb.org).

Rose−Hudgins: Bank Management and Financial Services, Seventh Edition
II. Financial Statements and Financial Firm Performance
6. Measuring and Evaluating the Performance of Banks and Their Principal Competitors
© The McGraw−Hill Companies, 2008
204 Part Two Financial Statements and Financial Firm Performance
Books and Journals Focusing on Laws andRegulations and International DevelopmentsAffecting Banks and Other Financial-ServiceProviders• International Economic Conditions (published by the Federal
Reserve Bank of St. Louis at www.stls.frb.org).• The Economist (London) (available by subscription;
information may be found at www.economist.com).
Key Regulatory Agencies• Office of the Comptroller of the Currency (OCC) at
www.occ.treas.gov.• Board of Governors of the Federal Reserve System at
www.federalreserve.gov.• Federal Deposit Insurance Corporation (FDIC) at www.
fdic.gov.• Office of Thrift Supervision at www.ots.treas.gov.
Basic Education in Banking and Financial Servicesfor Both Bankers and Their Customers• Consumer Action at www.consumeraction.org.
• Federal Reserve System at www.federalreserve.gov.• Federal Reserve Bank of Minneapolis at www.min-
neapolisfed.org.
Industry DirectoriesDirectories for many industries give lists of businesses in anindustry by name, city, state, and country of location. Someof the more complete directories provide essential avenuesof contact for directory users, such as the names of key offi-cers within a firm and the company’s mailing address, tele-phone number, and e-mail address. More detailed directorieshave abbreviated financial statements of the firms listed andmay even have a historical sketch about each firm. Onecommon use of these directories is to pursue possibleemployment opportunities. Among the better-known indus-try directories are these:
• The Bankers Almanac at www.bankersalmanac.com.• Investment Bankers Directory at www.chicagobusiness.com.• International Insurance Directory (also described at www.
insurance-network.com).• Directory of Savings and Loans at www.abbycon.com/
financial.