Adenosine: A mediator of the sleep-inducing effects of prolonged wakefulness
Upload
independentCategory
view
2download
0
Sheikh et al. BMC Public Health 2014, 14:1172http://www.biomedcentral.com/1471-2458/14/1172
RESEARCH ARTICLE Open Access
Role of respondents’ education as a mediator andmoderator in the association between childhoodsocio-economic status and later health andwellbeingMashhood Ahmed Sheikh*, Birgit Abelsen and Jan Abel Olsen
Abstract
Background: Most research assessing the effect of childhood socioeconomic status (CSES) on health in adulthoodhas focused on cause-specific mortality. Low CSES is associated with mortality from coronary heart disease, lungcancer, and respiratory diseases in adulthood. But little evidence is available on the unique effect of differentindicators of CSES on subjective measures of health and wellbeing in adulthood.
Methods: Cross-sectional data from the last wave of The Tromsø Study (n = 12,984) was used to assess the uniqueeffect of three indicators of CSES (childhood financial conditions, mothers’ education and fathers’ education) on arange of subjective health measures: EQ-5D health dimensions, self-rated health, age-comparative self-rated health,as well as subjective wellbeing. Data was analyzed with the Paramed command in Stata. Log-linear regression wasused for the subjective measures of health and wellbeing to estimate the natural direct effects (NDE’s), naturalindirect effects (NIE’s), controlled direct effects (CDE’s) and marginal total effects (MTE’s) as risk ratios (RRs).
Results: Low childhood financial conditions were associated with lower health and wellbeing in adulthood,independently of respondents’ education. Among men, Low childhood financial conditions increased the risk (NDE)of being unhealthy on the composite EQ-5D by 22% (RR 1.22, 95% 1.14-1.31) and on subjective wellbeing by 24%(RR 1.24, 95% 1.18-1.30), while for women the risk increased by 16% (RR 1.16, 95% 1.10-1.23) and 26% (RR 1.26, 95%1.19-1.33), respectively. Among men, the NDE of low mothers’ education on age-comparative self-rated healthincreased by 9% (RR 1.09, 95% 1.01-1.16), while the NIE increased the risk by 3% (RR 1.03, 95% 1.01-1.04). The NDEof low mothers’ education increased the risk on anxiety/depression among women by 38% (RR 1.38, 95% 1.13-1.69),whereas the NIE increased the risk by 5% (RR 1.05, 95% 1.02-1.08).
Conclusions: Childhood financial conditions have a unique direct effect on a wide range of health and wellbeingmeasures. These findings apply to both men and women. Generally, parental education has an indirect effect onlater health, but mothers’ education may also have a long-term direct effect on later health.
Keywords: Norway, Childhood socioeconomic conditions, EQ-5D, Self-rated health, Wellbeing, Mediation, Effectdecomposition
* Correspondence: [email protected] of Community Medicine, University of Tromsø, NO 9037 Tromsø,Norway
© 2014 Sheikh et al.; licensee BioMed Central Ltd. This is an Open Access article distributed under the terms of the CreativeCommons Attribution License (http://creativecommons.org/licenses/by/4.0), which permits unrestricted use, distribution, andreproduction in any medium, provided the original work is properly credited. The Creative Commons Public DomainDedication waiver (http://creativecommons.org/publicdomain/zero/1.0/) applies to the data made available in this article,unless otherwise stated.
Sheikh et al. BMC Public Health 2014, 14:1172 Page 2 of 15http://www.biomedcentral.com/1471-2458/14/1172
BackgroundThe commonly used indicators of childhood socio-economic status (CSES) can be categorized into twogroups: indicators of social background (e.g. mothers’/fathers’ education), and indicators of economic back-ground (e.g. mothers’/fathers’ income, home ownership,housing characteristics, etc.) [1-3]. Galobardes et al. [4,5]reviewed 40 studies assessing the association betweenCSES and mortality, and showed that low CSES was asso-ciated with mortality from coronary heart disease, lungcancer, stomach cancer and respiratory diseases inadulthood [4]. Several studies exploring the associationbetween CSES and health in adulthood [4-6] have analyzedwhether SES in adulthood (ASES) has a mediating role,i.e. CSES effects ASES, which in turn has an effect onhealth in adulthood (conceptualized as the indirecteffect), or whether the CSES has an independent effecton health in adulthood, i.e. not mediated by ASES (concep-tualized as the direct effect). One review showed a generaleffect of CSES on health in adulthood, but the estimateswere attenuated after adjusting for ASES, indicating that adirect effect does exist between CSES and later health, butthat some of this effect may be mediated by ASES [4].There are caveats. Most studies included in the afore-
mentioned reviews used indicators of economic back-ground to assess CSES, and therefore very little evidenceis available about the effect of the indicators of social back-ground on health and wellbeing in adulthood [7-11]. HighCSES may provide the opportunity to flourish later in life,not only through higher education and income, but alsobetter health. A higher social background in terms of highparental education is likely to inspire children to pursuehigher education. However, it is uncertain whether socialbackground alone (i.e. independent of the economic con-ditions) has a long-term effect on later health and well-being. Previous research has indicated that the causalmechanisms of economic and social background on healthlater in life are likely to be different [3,7]. In the HelsinkiHealth Study, Mäkinen et al. [7] studied the effect ofmothers’/fathers’ education and self-reported economic dif-ficulties experienced before 16 years of age on self-reportedadult physical and mental functioning. They found no dir-ect effect of mothers’ and fathers’ education on adult phys-ical or mental functioning, but they found a direct effect ofeconomic difficulties in childhood on both adult mentaland physical functioning [7]. Other studies have indicatedthat different indicators of social background in childhoodhave different effects on later health [2,8]. Mothers’ educa-tion is more important than fathers’ education for health inadulthood, and this effect is mediated by the respondent’seducation, i.e. high mothers’ and fathers’ education is asso-ciated with high respondents’ education, which in turn isassociated with better health [2,8]. This is in contrast tomost previous studies [4,5,12], in which evidence of a direct
effect of CSES on health in adulthood was found using in-dicators of economic background to assess CSES.Most previous studies included only one indicator of
CSES [13], so the unique effects of social and economicindicators of CSES on health in adulthood could not beanalyzed or compared [14]. Since indicators of CSESmay be correlated, it is not clear whether different socialand economic indicators of CSES have an independenteffect on health in adulthood [1,14].While many studies have analyzed the effect of CSES
on cause-specific mortality and cardiovascular disease[4,5,15,16], little evidence is available about the effect ofCSES on subjective measures of health and wellbeing inadulthood, like self-rated health [6,11,17-20], wellbeing[21], and psychosocial functioning [16,17]. Some studieshave assessed the predictive effect of CSES on functionallimitation [20,22], allostatic load [23] and psychosocialfunctioning [2,10,16,17,21,22,24-28], but the results werenot consistent. Moreover, previous studies have shown thatself-rated health is an unreliable measure of health [29,30].Therefore, it is important to analyze and report differentmeasures of health to assess the sensitivity of the estimates.The aim of this paper is to estimate and compare the
direct and indirect influence (mediated by respondents’education) of three indicators of CSES: childhood financialconditions, mothers’ education, and fathers’ education, on:i) the health dimensions included in the EQ-5D; ii) self-rated health; iii) age-comparative self-rated health, and;iv) subjective wellbeing.
MethodsStudy populationThe Tromsø Study is a prospective cohort study of thepopulation residing in the municipality of Tromsø. Withmore than 70,000 inhabitants, Tromsø is the largest city inNorthern Norway. It is situated at 69°N, approximately400 km north of the Arctic Circle. Between 1974 and 2007/2008, six waves of the Tromsø Study were conducted(referred to as Tromsø I-VI). The current paper is based ondata from the latest wave: 19,762 subjects were invited andsent a study questionnaire by post; 12,984 (65.7%) returnedthe questionnaire (6,054 men and 6,930 women, born be-tween 1920 and 1977). The sample of 19,762 was selectedby inviting total birth cohorts born in 1920–1947 (aged 60–87), 40% of the total birth cohorts born in 1948–1954 (aged53–59), 1955–1959 (aged 48–52), and 1960–1964 (aged43–47), total birth cohorts born in 1965–1967 (aged 40–42) and 10% of the total birth cohort born in 1968–1977(aged 30–39) [31]. The study design and characteristics ofthe study sample have been described previously [31].
Measures of subjective health and wellbeingSubjective health was assessed in the study questionnaireby the EQ-5D, self-rated health, and age-comparative
Sheikh et al. BMC Public Health 2014, 14:1172 Page 3 of 15http://www.biomedcentral.com/1471-2458/14/1172
self-rated health. The EQ-5D measures five health dimen-sions: mobility, self-care, usual activities, pain/discomfort,and anxiety/depression [32]. Each health dimension wasseparated into three levels: level one was described as ‘noproblems’, level two as ‘some problems’ and level three asbeing ‘unable’ or having ‘extreme problems’. A compositeEQ-5D binary variable was constructed by classifying re-spondents ticking level one for all five health dimensionsas healthy, and the remaining as unhealthy. Respondentswith missing values for any of the five health dimensionswere excluded. Separate binary variables were constructedfor each of the five health dimensions in the same manneras for the composite variable, i.e. by comparing respon-dents with ‘no problems’ to those with ‘some’ or ‘extreme’problems.Self-rated health was measured by the question “How
do you in general consider your own health to be?”Possible responses were: very good, good, neither goodnor bad, bad, and very bad. Those ticking very good orgood were classified as healthy, and the remaining as un-healthy. Age-comparative self-rated health was measuredwith the question “How do you consider your health com-pared to that of others your age?” Possible responses were:much better, somewhat better, about the same, a littleworse, and much worse. Those ticking the first two levelswere classified as relatively healthy, and the remaining asrelatively unhealthy.Subjective wellbeing was measured by the first three
items from the satisfaction with life scale [33]. These were“In most ways my life is close to my ideal”, “The condi-tions of my life are excellent”, and “I am satisfied with mylife”, each measured on a 7-point scale from completelydisagree (1) to completely agree (7). Those who reported 6or 7 for all three items were considered to have high sub-jective wellbeing, and the remaining as having low subject-ive wellbeing.
Indicators of CSESRecall of CSES is expected to be fairly accurate [34]. Thepresent analysis used self-rated childhood financial con-dition as the indicator of economic background, and wasmeasured by the question, “How was your family’s finan-cial situation when you were a child?” on a 4-point scale.Those who answered very good or good were consideredto have a high childhood financial conditions, whilethose who answered difficult or very difficult were con-sidered to have low childhood financial conditions.Mothers’/fathers’ education was used as an indicator of
social background, and were measured separately on a5-level scale: primary and secondary school or similar(i.e. 7–10 years of schooling), vocational school, highschool, college or university (less than 4 years), and collegeor university (4 years or more). If the first level was ticked,the respondent was classified as having low mothers’/
fathers’ education, and the remaining as having highmothers’/fathers’ education.
Indicator of ASESEducation of the respondents and their spouses, weremeasured by the same 5-level scale used for mothers’/fathers’ education. Those who replied positively to the firstthree levels (i.e. no college or university) were classified ashaving low education and the remaining as having higheducation. This classification differs from that of mothers’/fathers’ education due to a sharp increase in the duration ofeducation across generations in Norway (Table 1).
Statistical analysisDescriptive statistics were used to analyze the distribu-tion of respondents by socio-demographic characteris-tics. Similarly, the distribution of respondents accordingto measures of subjective health and wellbeing and CSESwas analyzed by cross tabulation and descriptive statis-tics. Stata ver. 13 was used for all statistical analysis.Our aim was to estimate the natural direct effects
(NDEs), controlled direct effects (CDEs) and natural in-direct effects (NIEs) of self-rated childhood financialconditions, mothers’ education and fathers’ education onmeasures of subjective health and wellbeing after con-trolling for potential confounders. The assumed asso-ciation between the variables is presented using a DirectedAcyclic Graph [35,36] (Figure 1). The direction of thearrows represents the direction of the effect. We hypo-thesized that the three indicators of CSES under investiga-tion have a direct, as well as an indirect effect on healthand wellbeing in adulthood.Using the approach by Baron and Kenny [37], we
assessed the associations between CSES and respondents’education; respondents’ education and health and well-being; and CSES and health and wellbeing with linear re-gression and logistic regression models. The associationbetween the indicators of CSES and subjective mea-sures of health and wellbeing were statistically signi-ficant (p < 0.05), except the association between fathers’education and subjective wellbeing. To assess the role ofrespondents’ education as a moderator, we further testedthe interaction between each CSES indicator and res-pondents’ education, to see if the effect of CSES indicatorson health and wellbeing in adulthood was homogenousacross different levels of respondents’ education. We ob-served a statistically significant (p < 0.05) interaction be-tween childhood financial conditions and respondents’education, regressed on EQ-5D and subjective wellbeing.However, we did not observe a statistically significantinteraction between childhood financial conditions and re-spondents’ education, regressed on self-rated health andage-comparative self-rated health.
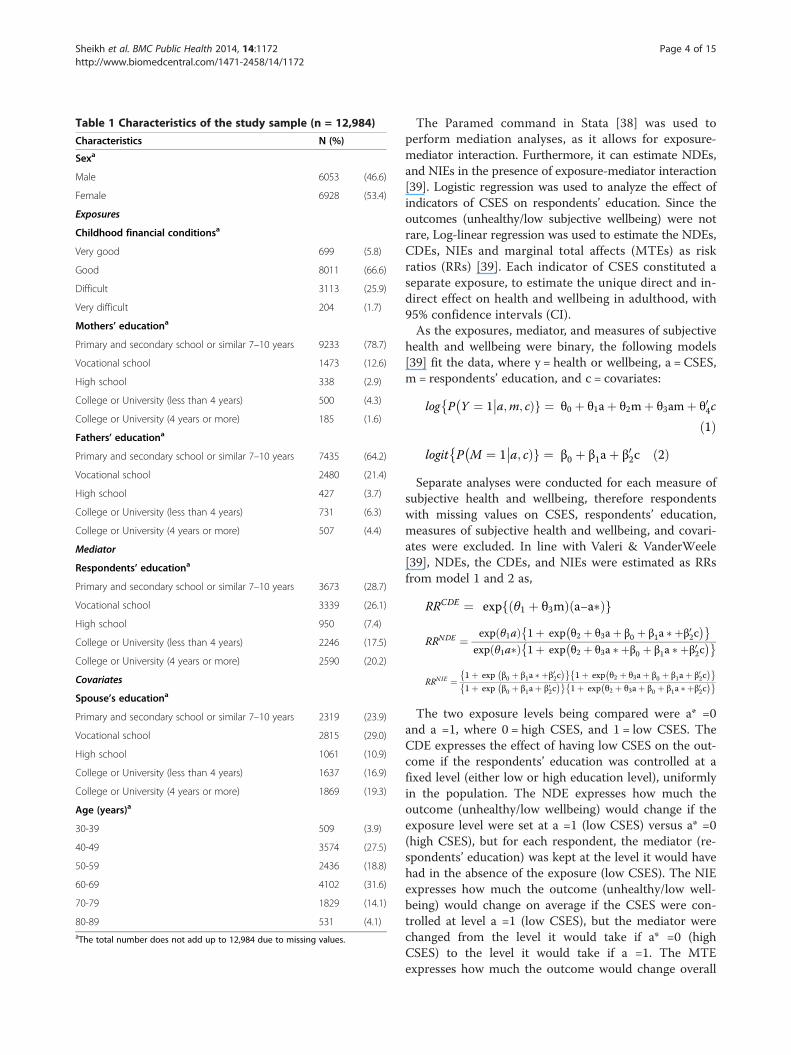
Table 1 Characteristics of the study sample (n = 12,984)
Characteristics N (%)
Sexa
Male 6053 (46.6)
Female 6928 (53.4)
Exposures
Childhood financial conditionsa
Very good 699 (5.8)
Good 8011 (66.6)
Difficult 3113 (25.9)
Very difficult 204 (1.7)
Mothers’ educationa
Primary and secondary school or similar 7–10 years 9233 (78.7)
Vocational school 1473 (12.6)
High school 338 (2.9)
College or University (less than 4 years) 500 (4.3)
College or University (4 years or more) 185 (1.6)
Fathers’ educationa
Primary and secondary school or similar 7–10 years 7435 (64.2)
Vocational school 2480 (21.4)
High school 427 (3.7)
College or University (less than 4 years) 731 (6.3)
College or University (4 years or more) 507 (4.4)
Mediator
Respondents’ educationa
Primary and secondary school or similar 7–10 years 3673 (28.7)
Vocational school 3339 (26.1)
High school 950 (7.4)
College or University (less than 4 years) 2246 (17.5)
College or University (4 years or more) 2590 (20.2)
Covariates
Spouse’s educationa
Primary and secondary school or similar 7–10 years 2319 (23.9)
Vocational school 2815 (29.0)
High school 1061 (10.9)
College or University (less than 4 years) 1637 (16.9)
College or University (4 years or more) 1869 (19.3)
Age (years)a
30-39 509 (3.9)
40-49 3574 (27.5)
50-59 2436 (18.8)
60-69 4102 (31.6)
70-79 1829 (14.1)
80-89 531 (4.1)aThe total number does not add up to 12,984 due to missing values.
Sheikh et al. BMC Public Health 2014, 14:1172 Page 4 of 15http://www.biomedcentral.com/1471-2458/14/1172
The Paramed command in Stata [38] was used toperform mediation analyses, as it allows for exposure-mediator interaction. Furthermore, it can estimate NDEs,and NIEs in the presence of exposure-mediator interaction[39]. Logistic regression was used to analyze the effect ofindicators of CSES on respondents’ education. Since theoutcomes (unhealthy/low subjective wellbeing) were notrare, Log-linear regression was used to estimate the NDEs,CDEs, NIEs and marginal total affects (MTEs) as riskratios (RRs) [39]. Each indicator of CSES constituted aseparate exposure, to estimate the unique direct and in-direct effect on health and wellbeing in adulthood, with95% confidence intervals (CI).As the exposures, mediator, and measures of subjective
health and wellbeing were binary, the following models[39] fit the data, where y = health or wellbeing, a = CSES,m = respondents’ education, and c = covariates:
log P Y ¼ 1 a;m; cÞg ¼ θ0 þ θ1aþ θ2mþ θ3amþ θ04c����
ð1Þlogit P M ¼ 1 a; cÞg ¼ β0 þ β1aþ β02c
���� ð2ÞSeparate analyses were conducted for each measure of
subjective health and wellbeing, therefore respondentswith missing values on CSES, respondents’ education,measures of subjective health and wellbeing, and covari-ates were excluded. In line with Valeri & VanderWeele[39], NDEs, the CDEs, and NIEs were estimated as RRsfrom model 1 and 2 as,
RRCDE ¼ exp θ1 þ θ3mð Þ a−a�ð Þf g
RRNDE ¼ exp θ1að Þ 1þ exp θ2 þ θ3aþ β0 þ β1a � þβ02c� �� �
exp θ1a�ð Þ 1þ exp θ2 þ θ3a � þβ0 þ β1a � þβ02c� �� �
RRNIE ¼ 1þ exp β0 þ β1a � þβ02c� �� �
1þ exp θ2 þ θ3aþ β0 þ β1aþ β02c� �� �
1þ exp β0 þ β1aþ β02c� �� �
1þ exp θ2 þ θ3aþ β0 þ β1a � þβ02c� �� �
The two exposure levels being compared were a* =0and a =1, where 0 = high CSES, and 1 = low CSES. TheCDE expresses the effect of having low CSES on the out-come if the respondents’ education was controlled at afixed level (either low or high education level), uniformlyin the population. The NDE expresses how much theoutcome (unhealthy/low wellbeing) would change if theexposure level were set at a =1 (low CSES) versus a* =0(high CSES), but for each respondent, the mediator (re-spondents’ education) was kept at the level it would havehad in the absence of the exposure (low CSES). The NIEexpresses how much the outcome (unhealthy/low well-being) would change on average if the CSES were con-trolled at level a =1 (low CSES), but the mediator werechanged from the level it would take if a* =0 (highCSES) to the level it would take if a =1. The MTEexpresses how much the outcome would change overall
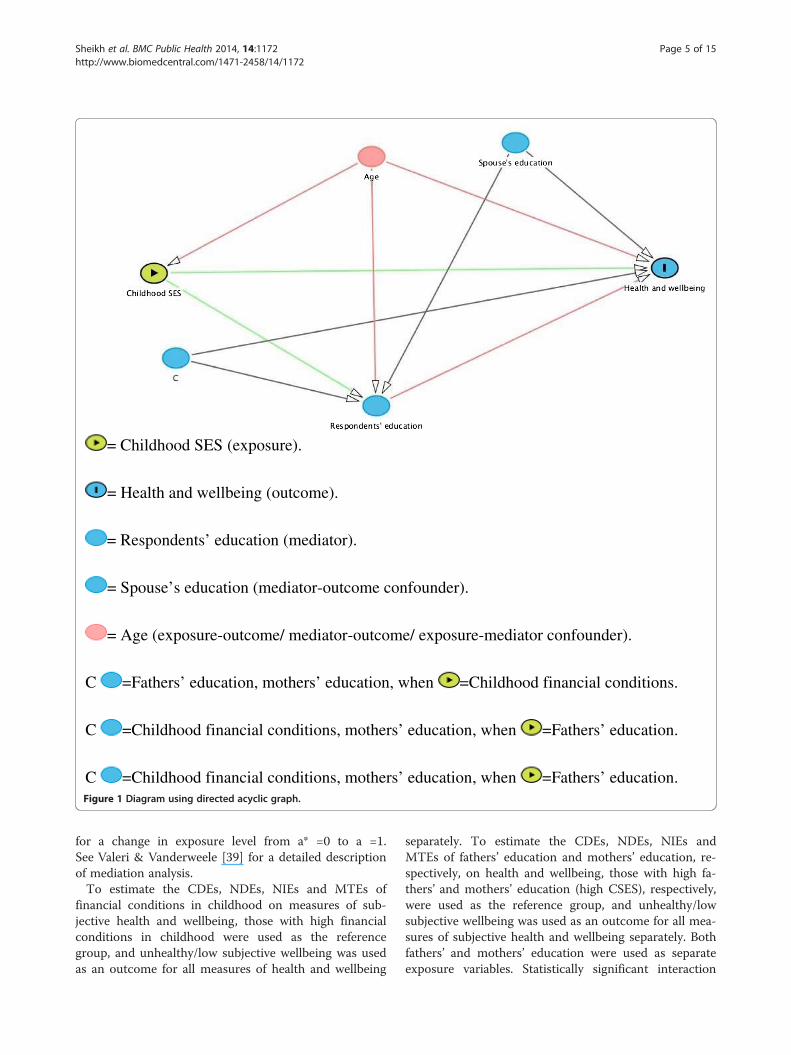
= Childhood SES (exposure).
= Health and wellbeing (outcome).
= Respondents’ education (mediator).
= Spouse’s education (mediator-outcome confounder).
= Age (exposure-outcome/ mediator-outcome/ exposure-mediator confounder).
C =Fathers’ education, mothers’ education, when =Childhood financial conditions.
C =Childhood financial conditions, mothers’ education, when =Fathers’ education.
C =Childhood financial conditions, mothers’ education, when =Fathers’ education.Figure 1 Diagram using directed acyclic graph.
Sheikh et al. BMC Public Health 2014, 14:1172 Page 5 of 15http://www.biomedcentral.com/1471-2458/14/1172
for a change in exposure level from a* =0 to a =1.See Valeri & Vanderweele [39] for a detailed descriptionof mediation analysis.To estimate the CDEs, NDEs, NIEs and MTEs of
financial conditions in childhood on measures of sub-jective health and wellbeing, those with high financialconditions in childhood were used as the referencegroup, and unhealthy/low subjective wellbeing was usedas an outcome for all measures of health and wellbeing
separately. To estimate the CDEs, NDEs, NIEs andMTEs of fathers’ education and mothers’ education, re-spectively, on health and wellbeing, those with high fa-thers’ and mothers’ education (high CSES), respectively,were used as the reference group, and unhealthy/lowsubjective wellbeing was used as an outcome for all mea-sures of subjective health and wellbeing separately. Bothfathers’ and mothers’ education were used as separateexposure variables. Statistically significant interaction
Sheikh et al. BMC Public Health 2014, 14:1172 Page 6 of 15http://www.biomedcentral.com/1471-2458/14/1172
(p < 0.05) was observed between the indicators of CSESand gender, regressed on the measures of subjectivehealth and wellbeing, therefore the estimates are pre-sented separately for men and women.Previous studies have shown that parental education
may only have an indirect effect on health in adulthoodmediated by ASES [8-11]. Since some of the effect ofparental education may be mediated by childhood finan-cial conditions [40], we assessed whether this indicatorwas a mediator between mothers’/fathers’ education andrespondents’ education, but the NIEs were RR ≈ 1.00(null effect). Similarly, we assessed whether childhood fi-nancial conditions was a mediator between mothers’/fa-thers’ education and health and wellbeing in adulthood,and the NIEs (RR) were close to 1.00. Therefore, weruled out the possibility that childhood financial condi-tions is a mediator-outcome confounder affected bymothers’/fathers’ education. Spouse’s education was as-sociated with the three indicators of CSES and respon-dents’ education (data not shown). However, in order tobias the estimates, spouse’s education would have to bea mediator between CSES and health and wellbeing, sowe assessed whether spouse’s education was indeed amediator between these variables. Resultant the NIEswere RR ≈ 1.00; therefore, we ruled out the possibilitythat spouse’s education was a mediator-outcome con-founder affected by CSES.
ConfoundersThe identification of confounders was based on a prioriknowledge of the association between the variablesunder study [41]. The diagram is illustrated in Figure 1,to distinguish: i) exposure-outcome confounders (variablesthat potentially confound the association between CSESand health and wellbeing in adulthood); ii) exposure-mediator confounders (variables that potentially confoundthe association between CSES and respondents’ educa-tion), and; iii) mediator-outcome confounders (variablesthat potentially confound the association between re-spondents’ education and health and wellbeing inadulthood). Age was considered a potential exposure-outcome confounder, mediator-outcome confounder,as well as an exposure-mediator confounder in all ana-lyses. When childhood financial conditions was used asan exposure, fathers’ education, mothers’ education andspouse’s education were included in the model as potentialmediator-outcome confounders. When mothers’ andfathers’ education were used as an exposure, childhoodfinancial conditions and spouse’s education were includedin the model as potential mediator-outcome confounders.Similarly, mothers’ education was included in the modelswhen fathers’ education was used as an exposure, andfathers’ education was included in the model whenmothers’ education was used as an exposure. Some of the
models did not converge when age was used as a linearvariable, therefore 5-year age groups were used in theanalysis.
Ethics approvalThe Tromsø Study has been approved by the RegionalCommittee for Medical and Health Research Ethics, theData Inspectorate and the Norwegian Directorate ofHealth.
ResultsThe characteristics of the study sample are presented inTable 1. Half the sample (49.7%) were aged 60 years andabove. Good or very good childhood financial conditionswere reported among 72.4% of the respondents. Therewas a notable generational change in education. Collegeor university education among parents was reported foronly 5.9% of respondents’ mothers and 10.7% of res-pondents’ fathers, but for 37.7% of the respondents(Table 1).The distribution of healthy respondents within each
exposure and mediator category is presented in Table 2.The distribution of healthy respondents among thosewith low and high childhood financial conditions indi-cates that absolute differences were most apparent inself-rated health, subjective wellbeing, and the compositeEQ-5D measure.Table 3 presents the NDEs, NIEs, and MTEs of child-
hood financial conditions on measures of subjectivehealth and wellbeing separately for men and women.There was a null indirect association (NIE ≅ 1.00) ofchildhood financial conditions on measures of subjectivehealth and wellbeing. The MTE is a product of the NDEand the NIE, so if the NIE ≅ 1.00, the NDE ≅MTE.Consequently, the NDE and the MTE are similar inTable 3. Low childhood financial conditions led to ahigher risk of being classified as unhealthy on all mea-sures of subjective health and wellbeing, independent ofrespondents’ education. Among the five EQ-5D healthdimensions, the absolute differences in four dimensionswere small (Table 2), although the relative differences,expressed by RRs, were high (Table 3), e.g. self-care hada RRMTE of 1.89 (95% CI: 1.11-3.23) for men, and 1.90(95% CI: 1.22-2.96) for women. The dimension pain/dis-comfort showed the largest absolute difference inTable 2, but relatively low RRs in Table 3. RRs were notthe same for men and women. Among men, childhoodfinancial situation had a stronger effect on the compositeEQ-5D measure (RRMTE 1.22, 95% CI: 1.14-1.31), pain/discomfort dimensions (RRMTE 1.21, 95% CI: 1.11-1.31),anxiety/depression dimension (RRMTE 1.88, 95% CI:1.57-2.25) and age-comparative self-rated health (RRMTE
1.09, 95% CI: 1.04-1.15), but among women, childhoodfinancial situation had a stronger effect on the self-care
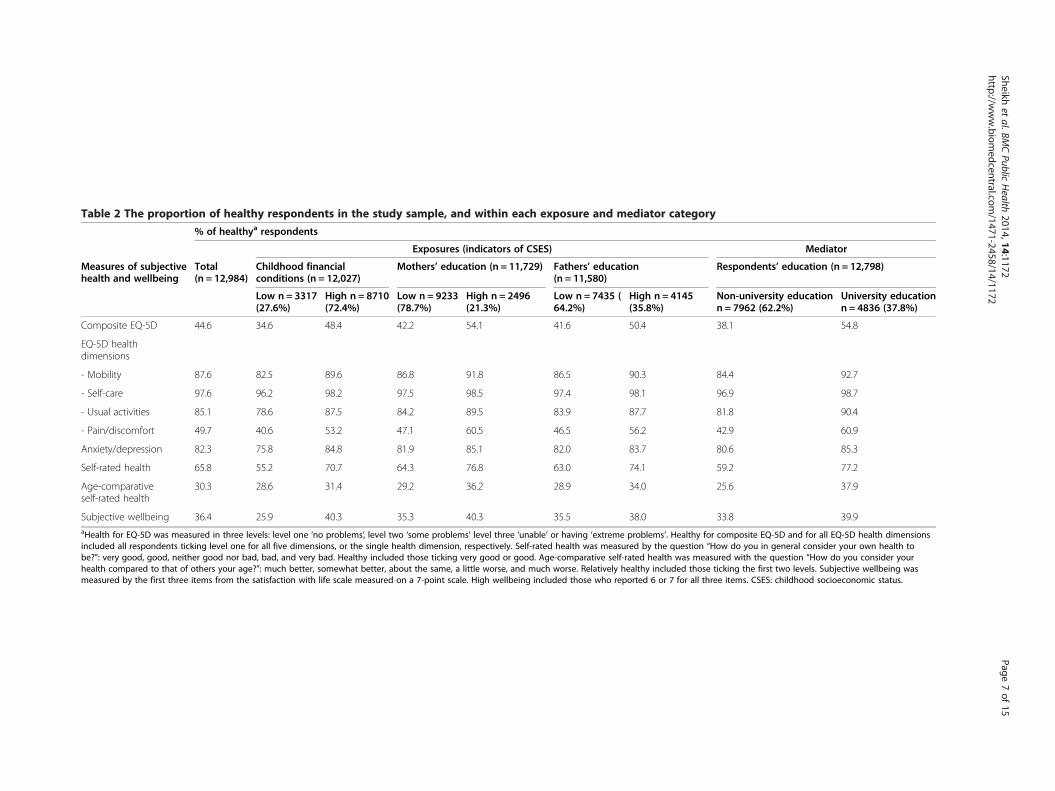
Table 2 The proportion of healthy respondents in the study sample, and within each exposure and mediator category
% of healthya respondents
Exposures (indicators of CSES) Mediator
Measures of subjectivehealth and wellbeing
Total(n = 12,984)
Childhood financialconditions (n = 12,027)
Mothers’ education (n = 11,729) Fathers’ education(n = 11,580)
Respondents’ education (n = 12,798)
Low n = 3317(27.6%)
High n = 8710(72.4%)
Low n = 9233(78.7%)
High n = 2496(21.3%)
Low n = 7435 (64.2%)
High n = 4145(35.8%)
Non-university educationn = 7962 (62.2%)
University educationn = 4836 (37.8%)
Composite EQ-5D 44.6 34.6 48.4 42.2 54.1 41.6 50.4 38.1 54.8
EQ-5D healthdimensions
- Mobility 87.6 82.5 89.6 86.8 91.8 86.5 90.3 84.4 92.7
- Self-care 97.6 96.2 98.2 97.5 98.5 97.4 98.1 96.9 98.7
- Usual activities 85.1 78.6 87.5 84.2 89.5 83.9 87.7 81.8 90.4
- Pain/discomfort 49.7 40.6 53.2 47.1 60.5 46.5 56.2 42.9 60.9
Anxiety/depression 82.3 75.8 84.8 81.9 85.1 82.0 83.7 80.6 85.3
Self-rated health 65.8 55.2 70.7 64.3 76.8 63.0 74.1 59.2 77.2
Age-comparativeself-rated health
30.3 28.6 31.4 29.2 36.2 28.9 34.0 25.6 37.9
Subjective wellbeing 36.4 25.9 40.3 35.3 40.3 35.5 38.0 33.8 39.9aHealth for EQ-5D was measured in three levels: level one ‘no problems’, level two ‘some problems’ level three ‘unable’ or having ‘extreme problems’. Healthy for composite EQ-5D and for all EQ-5D health dimensionsincluded all respondents ticking level one for all five dimensions, or the single health dimension, respectively. Self-rated health was measured by the question “How do you in general consider your own health tobe?”: very good, good, neither good nor bad, bad, and very bad. Healthy included those ticking very good or good. Age-comparative self-rated health was measured with the question “How do you consider yourhealth compared to that of others your age?”: much better, somewhat better, about the same, a little worse, and much worse. Relatively healthy included those ticking the first two levels. Subjective wellbeing wasmeasured by the first three items from the satisfaction with life scale measured on a 7-point scale. High wellbeing included those who reported 6 or 7 for all three items. CSES: childhood socioeconomic status.
Sheikhet
al.BMCPublic
Health
2014,14:1172Page
7of
15http://w
ww.biom
edcentral.com/1471-2458/14/1172
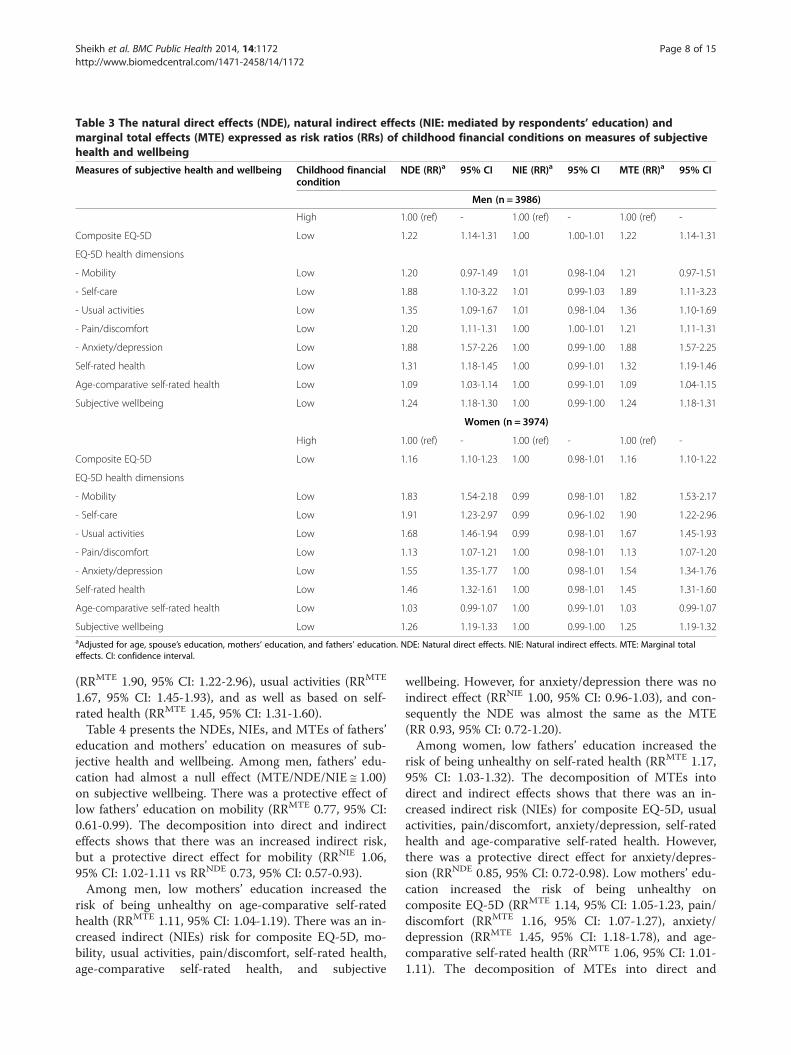
Table 3 The natural direct effects (NDE), natural indirect effects (NIE: mediated by respondents’ education) andmarginal total effects (MTE) expressed as risk ratios (RRs) of childhood financial conditions on measures of subjectivehealth and wellbeing
Measures of subjective health and wellbeing Childhood financialcondition
NDE (RR)a 95% CI NIE (RR)a 95% CI MTE (RR)a 95% CI
Men (n = 3986)
High 1.00 (ref) - 1.00 (ref) - 1.00 (ref) -
Composite EQ-5D Low 1.22 1.14-1.31 1.00 1.00-1.01 1.22 1.14-1.31
EQ-5D health dimensions
- Mobility Low 1.20 0.97-1.49 1.01 0.98-1.04 1.21 0.97-1.51
- Self-care Low 1.88 1.10-3.22 1.01 0.99-1.03 1.89 1.11-3.23
- Usual activities Low 1.35 1.09-1.67 1.01 0.98-1.04 1.36 1.10-1.69
- Pain/discomfort Low 1.20 1.11-1.31 1.00 1.00-1.01 1.21 1.11-1.31
- Anxiety/depression Low 1.88 1.57-2.26 1.00 0.99-1.00 1.88 1.57-2.25
Self-rated health Low 1.31 1.18-1.45 1.00 0.99-1.01 1.32 1.19-1.46
Age-comparative self-rated health Low 1.09 1.03-1.14 1.00 0.99-1.01 1.09 1.04-1.15
Subjective wellbeing Low 1.24 1.18-1.30 1.00 0.99-1.00 1.24 1.18-1.31
Women (n = 3974)
High 1.00 (ref) - 1.00 (ref) - 1.00 (ref) -
Composite EQ-5D Low 1.16 1.10-1.23 1.00 0.98-1.01 1.16 1.10-1.22
EQ-5D health dimensions
- Mobility Low 1.83 1.54-2.18 0.99 0.98-1.01 1.82 1.53-2.17
- Self-care Low 1.91 1.23-2.97 0.99 0.96-1.02 1.90 1.22-2.96
- Usual activities Low 1.68 1.46-1.94 0.99 0.98-1.01 1.67 1.45-1.93
- Pain/discomfort Low 1.13 1.07-1.21 1.00 0.98-1.01 1.13 1.07-1.20
- Anxiety/depression Low 1.55 1.35-1.77 1.00 0.98-1.01 1.54 1.34-1.76
Self-rated health Low 1.46 1.32-1.61 1.00 0.98-1.01 1.45 1.31-1.60
Age-comparative self-rated health Low 1.03 0.99-1.07 1.00 0.99-1.01 1.03 0.99-1.07
Subjective wellbeing Low 1.26 1.19-1.33 1.00 0.99-1.00 1.25 1.19-1.32aAdjusted for age, spouse’s education, mothers’ education, and fathers’ education. NDE: Natural direct effects. NIE: Natural indirect effects. MTE: Marginal totaleffects. CI: confidence interval.
Sheikh et al. BMC Public Health 2014, 14:1172 Page 8 of 15http://www.biomedcentral.com/1471-2458/14/1172
(RRMTE 1.90, 95% CI: 1.22-2.96), usual activities (RRMTE
1.67, 95% CI: 1.45-1.93), and as well as based on self-rated health (RRMTE 1.45, 95% CI: 1.31-1.60).Table 4 presents the NDEs, NIEs, and MTEs of fathers’
education and mothers’ education on measures of sub-jective health and wellbeing. Among men, fathers’ edu-cation had almost a null effect (MTE/NDE/NIE ≅ 1.00)on subjective wellbeing. There was a protective effect oflow fathers’ education on mobility (RRMTE 0.77, 95% CI:0.61-0.99). The decomposition into direct and indirecteffects shows that there was an increased indirect risk,but a protective direct effect for mobility (RRNIE 1.06,95% CI: 1.02-1.11 vs RRNDE 0.73, 95% CI: 0.57-0.93).Among men, low mothers’ education increased the
risk of being unhealthy on age-comparative self-ratedhealth (RRMTE 1.11, 95% CI: 1.04-1.19). There was an in-creased indirect (NIEs) risk for composite EQ-5D, mo-bility, usual activities, pain/discomfort, self-rated health,age-comparative self-rated health, and subjective
wellbeing. However, for anxiety/depression there was noindirect effect (RRNIE 1.00, 95% CI: 0.96-1.03), and con-sequently the NDE was almost the same as the MTE(RR 0.93, 95% CI: 0.72-1.20).Among women, low fathers’ education increased the
risk of being unhealthy on self-rated health (RRMTE 1.17,95% CI: 1.03-1.32). The decomposition of MTEs intodirect and indirect effects shows that there was an in-creased indirect risk (NIEs) for composite EQ-5D, usualactivities, pain/discomfort, anxiety/depression, self-ratedhealth and age-comparative self-rated health. However,there was a protective direct effect for anxiety/depres-sion (RRNDE 0.85, 95% CI: 0.72-0.98). Low mothers’ edu-cation increased the risk of being unhealthy oncomposite EQ-5D (RRMTE 1.14, 95% CI: 1.05-1.23, pain/discomfort (RRMTE 1.16, 95% CI: 1.07-1.27), anxiety/depression (RRMTE 1.45, 95% CI: 1.18-1.78), and age-comparative self-rated health (RRMTE 1.06, 95% CI: 1.01-1.11). The decomposition of MTEs into direct and
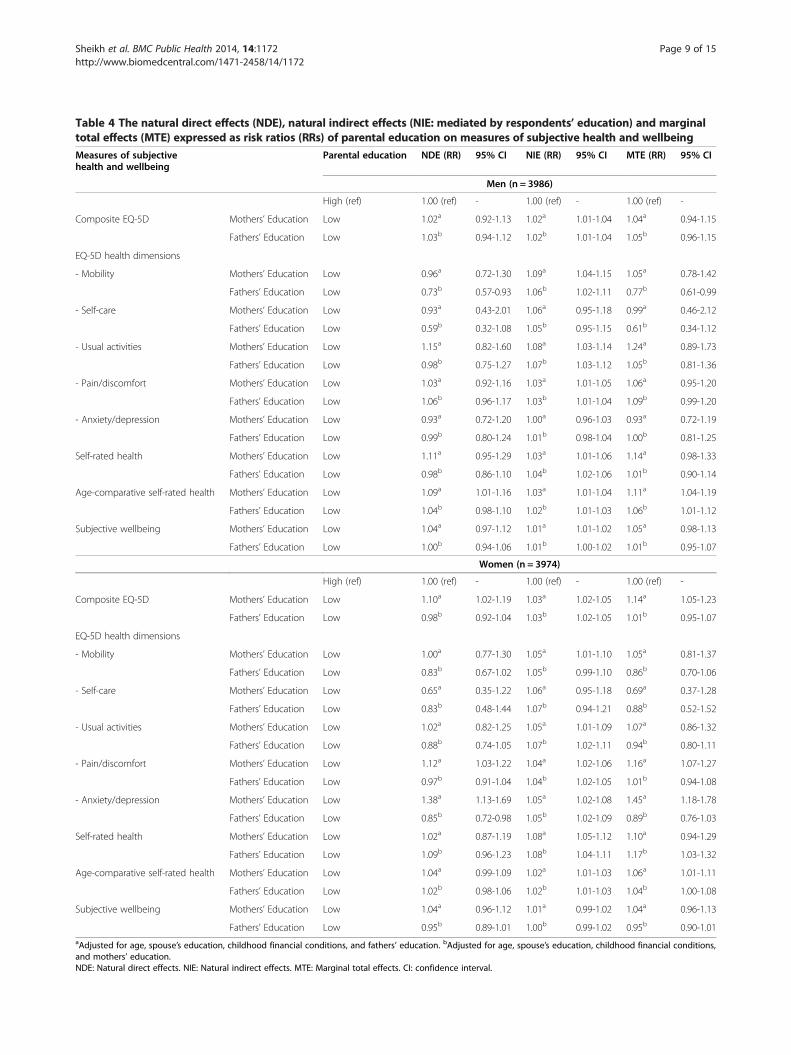
Table 4 The natural direct effects (NDE), natural indirect effects (NIE: mediated by respondents’ education) and marginaltotal effects (MTE) expressed as risk ratios (RRs) of parental education on measures of subjective health and wellbeingMeasures of subjectivehealth and wellbeing
Parental education NDE (RR) 95% CI NIE (RR) 95% CI MTE (RR) 95% CI
Men (n = 3986)
High (ref) 1.00 (ref) - 1.00 (ref) - 1.00 (ref) -
Composite EQ-5D Mothers’ Education Low 1.02a 0.92-1.13 1.02a 1.01-1.04 1.04a 0.94-1.15
Fathers’ Education Low 1.03b 0.94-1.12 1.02b 1.01-1.04 1.05b 0.96-1.15
EQ-5D health dimensions
- Mobility Mothers’ Education Low 0.96a 0.72-1.30 1.09a 1.04-1.15 1.05a 0.78-1.42
Fathers’ Education Low 0.73b 0.57-0.93 1.06b 1.02-1.11 0.77b 0.61-0.99
- Self-care Mothers’ Education Low 0.93a 0.43-2.01 1.06a 0.95-1.18 0.99a 0.46-2.12
Fathers’ Education Low 0.59b 0.32-1.08 1.05b 0.95-1.15 0.61b 0.34-1.12
- Usual activities Mothers’ Education Low 1.15a 0.82-1.60 1.08a 1.03-1.14 1.24a 0.89-1.73
Fathers’ Education Low 0.98b 0.75-1.27 1.07b 1.03-1.12 1.05b 0.81-1.36
- Pain/discomfort Mothers’ Education Low 1.03a 0.92-1.16 1.03a 1.01-1.05 1.06a 0.95-1.20
Fathers’ Education Low 1.06b 0.96-1.17 1.03b 1.01-1.04 1.09b 0.99-1.20
- Anxiety/depression Mothers’ Education Low 0.93a 0.72-1.20 1.00a 0.96-1.03 0.93a 0.72-1.19
Fathers’ Education Low 0.99b 0.80-1.24 1.01b 0.98-1.04 1.00b 0.81-1.25
Self-rated health Mothers’ Education Low 1.11a 0.95-1.29 1.03a 1.01-1.06 1.14a 0.98-1.33
Fathers’ Education Low 0.98b 0.86-1.10 1.04b 1.02-1.06 1.01b 0.90-1.14
Age-comparative self-rated health Mothers’ Education Low 1.09a 1.01-1.16 1.03a 1.01-1.04 1.11a 1.04-1.19
Fathers’ Education Low 1.04b 0.98-1.10 1.02b 1.01-1.03 1.06b 1.01-1.12
Subjective wellbeing Mothers’ Education Low 1.04a 0.97-1.12 1.01a 1.01-1.02 1.05a 0.98-1.13
Fathers’ Education Low 1.00b 0.94-1.06 1.01b 1.00-1.02 1.01b 0.95-1.07
Women (n = 3974)
High (ref) 1.00 (ref) - 1.00 (ref) - 1.00 (ref) -
Composite EQ-5D Mothers’ Education Low 1.10a 1.02-1.19 1.03a 1.02-1.05 1.14a 1.05-1.23
Fathers’ Education Low 0.98b 0.92-1.04 1.03b 1.02-1.05 1.01b 0.95-1.07
EQ-5D health dimensions
- Mobility Mothers’ Education Low 1.00a 0.77-1.30 1.05a 1.01-1.10 1.05a 0.81-1.37
Fathers’ Education Low 0.83b 0.67-1.02 1.05b 0.99-1.10 0.86b 0.70-1.06
- Self-care Mothers’ Education Low 0.65a 0.35-1.22 1.06a 0.95-1.18 0.69a 0.37-1.28
Fathers’ Education Low 0.83b 0.48-1.44 1.07b 0.94-1.21 0.88b 0.52-1.52
- Usual activities Mothers’ Education Low 1.02a 0.82-1.25 1.05a 1.01-1.09 1.07a 0.86-1.32
Fathers’ Education Low 0.88b 0.74-1.05 1.07b 1.02-1.11 0.94b 0.80-1.11
- Pain/discomfort Mothers’ Education Low 1.12a 1.03-1.22 1.04a 1.02-1.06 1.16a 1.07-1.27
Fathers’ Education Low 0.97b 0.91-1.04 1.04b 1.02-1.05 1.01b 0.94-1.08
- Anxiety/depression Mothers’ Education Low 1.38a 1.13-1.69 1.05a 1.02-1.08 1.45a 1.18-1.78
Fathers’ Education Low 0.85b 0.72-0.98 1.05b 1.02-1.09 0.89b 0.76-1.03
Self-rated health Mothers’ Education Low 1.02a 0.87-1.19 1.08a 1.05-1.12 1.10a 0.94-1.29
Fathers’ Education Low 1.09b 0.96-1.23 1.08b 1.04-1.11 1.17b 1.03-1.32
Age-comparative self-rated health Mothers’ Education Low 1.04a 0.99-1.09 1.02a 1.01-1.03 1.06a 1.01-1.11
Fathers’ Education Low 1.02b 0.98-1.06 1.02b 1.01-1.03 1.04b 1.00-1.08
Subjective wellbeing Mothers’ Education Low 1.04a 0.96-1.12 1.01a 0.99-1.02 1.04a 0.96-1.13
Fathers’ Education Low 0.95b 0.89-1.01 1.00b 0.99-1.02 0.95b 0.90-1.01aAdjusted for age, spouse’s education, childhood financial conditions, and fathers’ education. bAdjusted for age, spouse’s education, childhood financial conditions,and mothers’ education.NDE: Natural direct effects. NIE: Natural indirect effects. MTE: Marginal total effects. CI: confidence interval.
Sheikh et al. BMC Public Health 2014, 14:1172 Page 9 of 15http://www.biomedcentral.com/1471-2458/14/1172
Sheikh et al. BMC Public Health 2014, 14:1172 Page 10 of 15http://www.biomedcentral.com/1471-2458/14/1172
indirect effects shows that there was an increased indir-ect risk (NIEs) for composite EQ-5D, mobility, usualactivities, pain/discomfort, anxiety/depression, self-rated health, and age-comparative self-rated health.However, there was an increased direct risk (NDEs)for composite EQ-5D, pain/discomfort, and anxiety/depression.Table 5 presents the CDEs of childhood financial con-
ditions, fathers’ education, and mothers’ education onhealth and wellbeing measures controlled separately atboth levels of respondent’s education. Among both menand women, having low childhood financial conditionsincreased the risk of being unhealthy on almost allhealth and wellbeing measures, regardless of the level ofrespondents’ education.Among men, there was an increased CDEHigh respondents’
education of low mothers’ education on self-rated health, age-comparative self-rated health, and subjective wellbeing(Table 5). However, there was a protective direct effect(CDELow respondents’ education) of low fathers’ education onmobility (RRCDE 0.67, 95% CI: 0.51-0.89) and self-care(RRCDE 0.45, 95% CI: 0.23-0.88).Among women, there was an increased CDE of low
mothers’ education on anxiety/depression, regardless ofthe level of the respondents’ education controlled. Therewas an increased CDEHigh respondents’ education of lowmothers’ education on composite EQ-5D (RRCDE 1.20,95% CI: 1.07-1.34), pain/discomfort (RRCDE 1.21, 95% CI:1.07-1.37), and age-comparative self-rated health (RRCDE
1.08, 95% CI: 1.01-1.17). However, there was a protectivedirect effect (CDELow respondents’ education) of low fathers’education on composite EQ-5D (RRCDE 0.93, 95% CI:0.87-0.99), mobility (RRCDE 0.73, 95% CI: 0.58-0.93), andpain/discomfort (RRCDE 0.91, 95% CI: 0.84-0.98) (Table 5).
DiscussionWe estimated the effects of childhood financial conditions,fathers’ education, and mothers’ education on severalmeasures of health and wellbeing. These total effects arefurther decomposed into direct and indirect effects, whichallowed us to analyze the mediating role of respondents’education. As all the three exposures were adjusted forone another, our results aim to present the unique effectof each indicator of CSES, and not the cumulative effect ofCSES on health and wellbeing in adulthood.Our results show that childhood financial conditions
have a strong direct effect on health and wellbeing inadulthood, independent of respondents’ education, whilegenerally speaking parental education has an indirect ef-fect on health and wellbeing in adulthood, mediated byrespondents’ education. This indicates that effect ofchildhood financial conditions on health and wellbeingin adulthood is long-term, and that there may be otherpathways from childhood financial conditions to health
and wellbeing besides respondents’ education. However,the effect of parental education on later health and well-being was not independent of respondents’ education.Childhood financial conditions reflect only economic
conditions, and educated parents are not necessarilywealthy during the early childhood of their offspring. Asubstantial proportion of parents may have completedtheir education after their child had grown up. The differ-ence between the effects of childhood financial conditionsand parental education may highlight this difference. Forchildren, the strongest contribution of parental educationmay be the inspiration, motivation, and guidance inachieving higher education. However, the potential mech-anisms of childhood financial conditions that lead tohealth and wellbeing in adulthood may be the better livingconditions, and availability of resources from an early age.Our study confirms that the effect of parental educa-
tion on health in adulthood is mediated by ASES. How-ever, there are some indications that mothers’ educationhas both a direct (i.e. independent of respondents’ edu-cation) and an indirect effect on health in adulthood.Low mothers’ education led to an increased risk (NDE)in women for being unhealthy on the composite EQ-5D,pain/discomfort, and the anxiety/depression dimension.While among men, having low mothers’ education in-creased the direct risk (NDE) of being unhealthy on age-comparative self-rated health.Some limitations should be considered when interpret-
ing the results of this study. The estimation of NDEs, NIEs, and the causal interpretation require that there be no un-measured exposure-mediator confounders, and that nomediator-outcome confounder be effected by the exposure[42]. Both of these assumptions seem unrealistic given thelimited set of covariates we included in the models. For in-stance, the CSES is likely to affect the health of the re-spondent in childhood, which in turn is likely to affectboth ASES and health in adulthood. Similarly, parentalhealth is likely to affect both CSES, and respondents’ edu-cation. Therefore, CDEs are also reported. However, for acausal interpretation of the CDEs, there must be no un-measured exposure-outcome confounder, and no unmeas-ured mediator-outcome confounder [42]. Some of thepotential mediator-outcome confounders that are missingin the analysis are ‘health of the respondent in childhood’and neighborhood. Similarly, parental mental and physicalhealth are potential exposure-outcome confounders miss-ing in the analysis. In the absence of these confounders,the causal interpretation of estimates is not realistic.Many of the previous studies [4,5,7,9,11,12,19] have
assessed the mediating role of ASES in the associationbetween CSES and later health and wellbeing by differ-ence method approach. In this method, the outcome isregressed on the exposure, conditional on the covariates,and then the assumed mediator is added to the model to
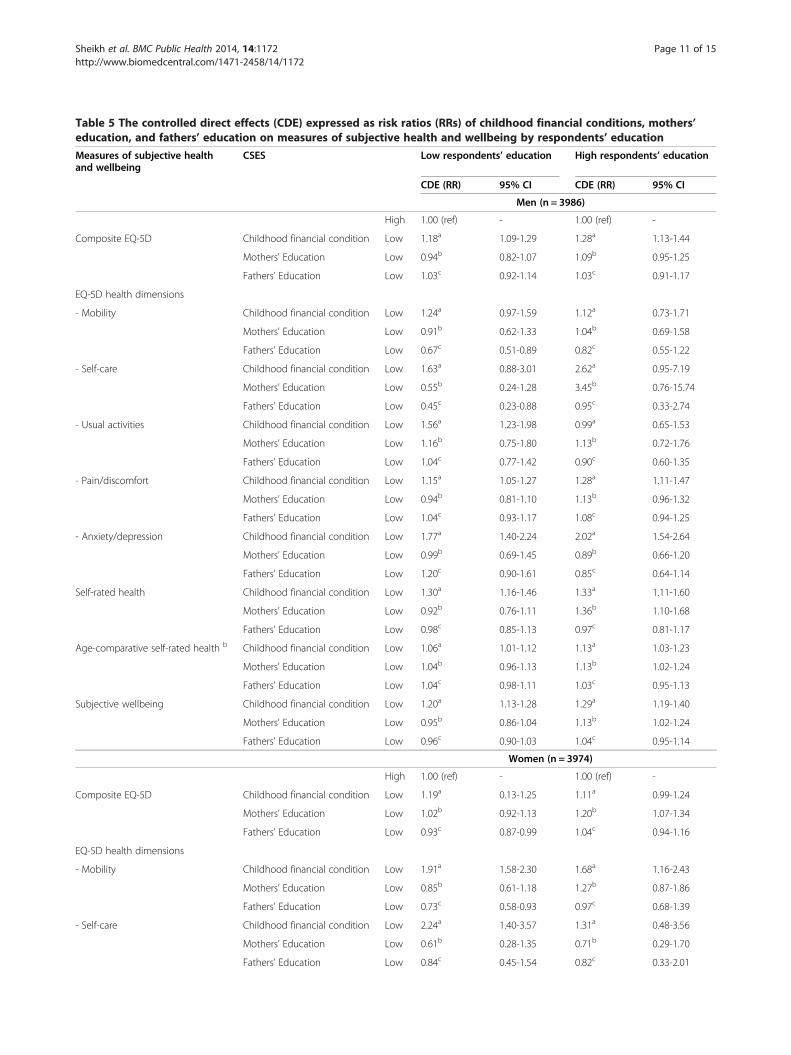
Table 5 The controlled direct effects (CDE) expressed as risk ratios (RRs) of childhood financial conditions, mothers’education, and fathers’ education on measures of subjective health and wellbeing by respondents’ education
Measures of subjective healthand wellbeing
CSES Low respondents’ education High respondents’ education
CDE (RR) 95% CI CDE (RR) 95% CI
Men (n = 3986)
High 1.00 (ref) - 1.00 (ref) -
Composite EQ-5D Childhood financial condition Low 1.18a 1.09-1.29 1.28a 1.13-1.44
Mothers’ Education Low 0.94b 0.82-1.07 1.09b 0.95-1.25
Fathers’ Education Low 1.03c 0.92-1.14 1.03c 0.91-1.17
EQ-5D health dimensions
- Mobility Childhood financial condition Low 1.24a 0.97-1.59 1.12a 0.73-1.71
Mothers’ Education Low 0.91b 0.62-1.33 1.04b 0.69-1.58
Fathers’ Education Low 0.67c 0.51-0.89 0.82c 0.55-1.22
- Self-care Childhood financial condition Low 1.63a 0.88-3.01 2.62a 0.95-7.19
Mothers’ Education Low 0.55b 0.24-1.28 3.45b 0.76-15.74
Fathers’ Education Low 0.45c 0.23-0.88 0.95c 0.33-2.74
- Usual activities Childhood financial condition Low 1.56a 1.23-1.98 0.99a 0.65-1.53
Mothers’ Education Low 1.16b 0.75-1.80 1.13b 0.72-1.76
Fathers’ Education Low 1.04c 0.77-1.42 0.90c 0.60-1.35
- Pain/discomfort Childhood financial condition Low 1.15a 1.05-1.27 1.28a 1.11-1.47
Mothers’ Education Low 0.94b 0.81-1.10 1.13b 0.96-1.32
Fathers’ Education Low 1.04c 0.93-1.17 1.08c 0.94-1.25
- Anxiety/depression Childhood financial condition Low 1.77a 1.40-2.24 2.02a 1.54-2.64
Mothers’ Education Low 0.99b 0.69-1.45 0.89b 0.66-1.20
Fathers’ Education Low 1.20c 0.90-1.61 0.85c 0.64-1.14
Self-rated health Childhood financial condition Low 1.30a 1.16-1.46 1.33a 1.11-1.60
Mothers’ Education Low 0.92b 0.76-1.11 1.36b 1.10-1.68
Fathers’ Education Low 0.98c 0.85-1.13 0.97c 0.81-1.17
Age-comparative self-rated health b Childhood financial condition Low 1.06a 1.01-1.12 1.13a 1.03-1.23
Mothers’ Education Low 1.04b 0.96-1.13 1.13b 1.02-1.24
Fathers’ Education Low 1.04c 0.98-1.11 1.03c 0.95-1.13
Subjective wellbeing Childhood financial condition Low 1.20a 1.13-1.28 1.29a 1.19-1.40
Mothers’ Education Low 0.95b 0.86-1.04 1.13b 1.02-1.24
Fathers’ Education Low 0.96c 0.90-1.03 1.04c 0.95-1.14
Women (n = 3974)
High 1.00 (ref) - 1.00 (ref) -
Composite EQ-5D Childhood financial condition Low 1.19a 0.13-1.25 1.11a 0.99-1.24
Mothers’ Education Low 1.02b 0.92-1.13 1.20b 1.07-1.34
Fathers’ Education Low 0.93c 0.87-0.99 1.04c 0.94-1.16
EQ-5D health dimensions
- Mobility Childhood financial condition Low 1.91a 1.58-2.30 1.68a 1.16-2.43
Mothers’ Education Low 0.85b 0.61-1.18 1.27b 0.87-1.86
Fathers’ Education Low 0.73c 0.58-0.93 0.97c 0.68-1.39
- Self-care Childhood financial condition Low 2.24a 1.40-3.57 1.31a 0.48-3.56
Mothers’ Education Low 0.61b 0.28-1.35 0.71b 0.29-1.70
Fathers’ Education Low 0.84c 0.45-1.54 0.82c 0.33-2.01
Sheikh et al. BMC Public Health 2014, 14:1172 Page 11 of 15http://www.biomedcentral.com/1471-2458/14/1172
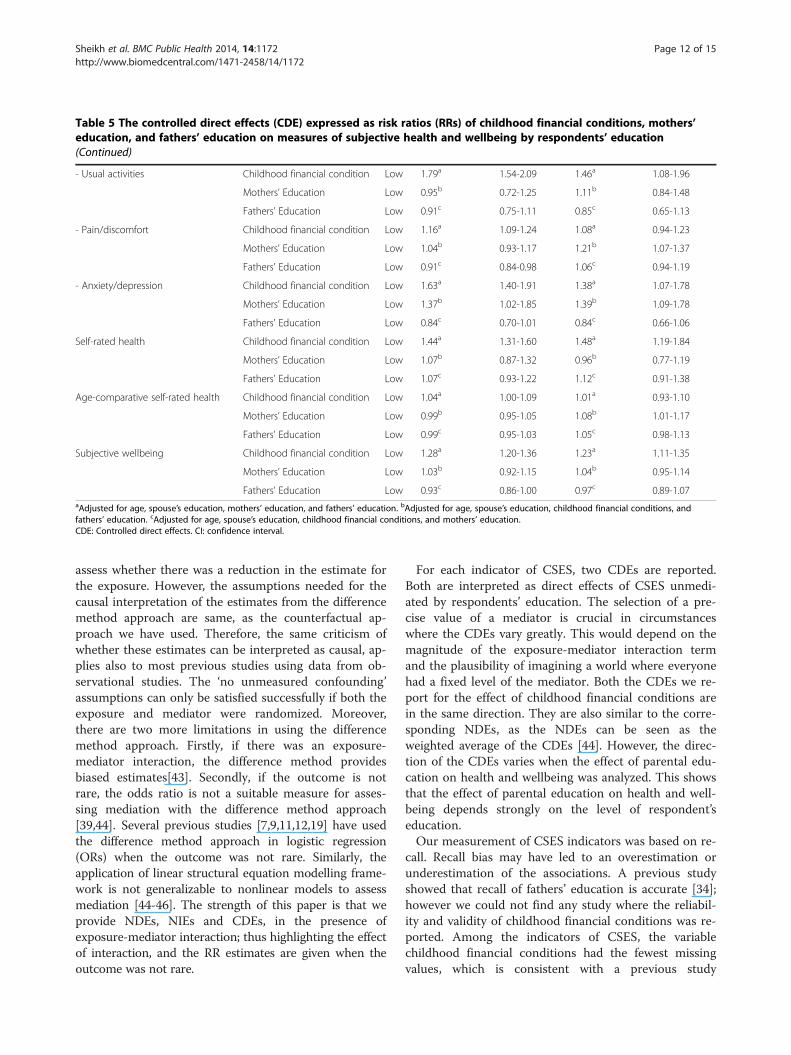
Table 5 The controlled direct effects (CDE) expressed as risk ratios (RRs) of childhood financial conditions, mothers’education, and fathers’ education on measures of subjective health and wellbeing by respondents’ education(Continued)
- Usual activities Childhood financial condition Low 1.79a 1.54-2.09 1.46a 1.08-1.96
Mothers’ Education Low 0.95b 0.72-1.25 1.11b 0.84-1.48
Fathers’ Education Low 0.91c 0.75-1.11 0.85c 0.65-1.13
- Pain/discomfort Childhood financial condition Low 1.16a 1.09-1.24 1.08a 0.94-1.23
Mothers’ Education Low 1.04b 0.93-1.17 1.21b 1.07-1.37
Fathers’ Education Low 0.91c 0.84-0.98 1.06c 0.94-1.19
- Anxiety/depression Childhood financial condition Low 1.63a 1.40-1.91 1.38a 1.07-1.78
Mothers’ Education Low 1.37b 1.02-1.85 1.39b 1.09-1.78
Fathers’ Education Low 0.84c 0.70-1.01 0.84c 0.66-1.06
Self-rated health Childhood financial condition Low 1.44a 1.31-1.60 1.48a 1.19-1.84
Mothers’ Education Low 1.07b 0.87-1.32 0.96b 0.77-1.19
Fathers’ Education Low 1.07c 0.93-1.22 1.12c 0.91-1.38
Age-comparative self-rated health Childhood financial condition Low 1.04a 1.00-1.09 1.01a 0.93-1.10
Mothers’ Education Low 0.99b 0.95-1.05 1.08b 1.01-1.17
Fathers’ Education Low 0.99c 0.95-1.03 1.05c 0.98-1.13
Subjective wellbeing Childhood financial condition Low 1.28a 1.20-1.36 1.23a 1.11-1.35
Mothers’ Education Low 1.03b 0.92-1.15 1.04b 0.95-1.14
Fathers’ Education Low 0.93c 0.86-1.00 0.97c 0.89-1.07aAdjusted for age, spouse’s education, mothers’ education, and fathers’ education. bAdjusted for age, spouse’s education, childhood financial conditions, andfathers’ education. cAdjusted for age, spouse’s education, childhood financial conditions, and mothers’ education.CDE: Controlled direct effects. CI: confidence interval.
Sheikh et al. BMC Public Health 2014, 14:1172 Page 12 of 15http://www.biomedcentral.com/1471-2458/14/1172
assess whether there was a reduction in the estimate forthe exposure. However, the assumptions needed for thecausal interpretation of the estimates from the differencemethod approach are same, as the counterfactual ap-proach we have used. Therefore, the same criticism ofwhether these estimates can be interpreted as causal, ap-plies also to most previous studies using data from ob-servational studies. The ‘no unmeasured confounding’assumptions can only be satisfied successfully if both theexposure and mediator were randomized. Moreover,there are two more limitations in using the differencemethod approach. Firstly, if there was an exposure-mediator interaction, the difference method providesbiased estimates[43]. Secondly, if the outcome is notrare, the odds ratio is not a suitable measure for asses-sing mediation with the difference method approach[39,44]. Several previous studies [7,9,11,12,19] have usedthe difference method approach in logistic regression(ORs) when the outcome was not rare. Similarly, theapplication of linear structural equation modelling frame-work is not generalizable to nonlinear models to assessmediation [44-46]. The strength of this paper is that weprovide NDEs, NIEs and CDEs, in the presence ofexposure-mediator interaction; thus highlighting the effectof interaction, and the RR estimates are given when theoutcome was not rare.
For each indicator of CSES, two CDEs are reported.Both are interpreted as direct effects of CSES unmedi-ated by respondents’ education. The selection of a pre-cise value of a mediator is crucial in circumstanceswhere the CDEs vary greatly. This would depend on themagnitude of the exposure-mediator interaction termand the plausibility of imagining a world where everyonehad a fixed level of the mediator. Both the CDEs we re-port for the effect of childhood financial conditions arein the same direction. They are also similar to the corre-sponding NDEs, as the NDEs can be seen as theweighted average of the CDEs [44]. However, the direc-tion of the CDEs varies when the effect of parental edu-cation on health and wellbeing was analyzed. This showsthat the effect of parental education on health and well-being depends strongly on the level of respondent’seducation.Our measurement of CSES indicators was based on re-
call. Recall bias may have led to an overestimation orunderestimation of the associations. A previous studyshowed that recall of fathers’ education is accurate [34];however we could not find any study where the reliabil-ity and validity of childhood financial conditions was re-ported. Among the indicators of CSES, the variablechildhood financial conditions had the fewest missingvalues, which is consistent with a previous study
Sheikh et al. BMC Public Health 2014, 14:1172 Page 13 of 15http://www.biomedcentral.com/1471-2458/14/1172
assessing the pattern of missing data across various indi-cators of CSES [47]. This may indicate that, apart fromthe possibility of recall bias, the respondents may notknow the highest education level of their parents. Recallof CSES indicators may be effected by “an inability to re-member, refusal to answer, embarrassment in answeringor lack of information about early-life circumstances”[47]. There is ample evidence that state of mind effectscertain aspects of memory [48], and therefore the possi-bility of recall bias cannot be ruled out.The classification we used for education may not apply
accurately to respondents of different age groups. Forexample, respondents with an education of college/uni-versity less than 4 years may have been consideredhighly educated in the 1960s, but not in the 1990s. Weacknowledge that our assumption of temporality be-tween the CSES, respondents’ education, and subjectivehealth and wellbeing in adulthood is based on a concep-tual model. Since the data is cross-sectional in nature,this may present a possible bias in our study. For ex-ample, among the youngest respondents (aged 30–35years), the assumed temporality between their educationand their health may not be precise, as some may still bestudying part-time.Respondents with missing values on any of the vari-
ables in the statistical models were excluded from theanalysis. We assessed whether no response (missing) onthe CSES indicators was related to health and wellbeingindicators, and the analysis showed that a greater pro-portion of those who did not provide a response onCSES indicators had low education, and were relativelyunhealthy (particularly in relation to parental education)(data not shown). We also assessed whether no response(missing) on the health and wellbeing indicators was re-lated to CSES indicators, but the pattern was same. Agreater proportion of those who do not respond tohealth and wellbeing questions have low CSES (data notshown). This may indicate that those who do notcomplete the questionnaire are likely to be the most dis-advantaged. However, if we had the data on all respon-dents, it is likely that the estimates (NDEs/CDEs) wouldshow an even larger effect of childhood financial condi-tions on health and wellbeing, in the same direction asshown. Similarly, it seems plausible that we would ob-serve a clear association between low parental educationand being unhealthy/low wellbeing if we had the data onall respondents. Since the missing data is not random, itis likely that imputation will introduce more uncertainty,and bias in our results. Therefore, we chose to analyzethe collected data only.We estimated the CIs for NDEs, NIEs and MTEs in all
analysis with bootstrapping, but there were no meaning-ful differences in the CIs even with large number of rep-lications. Therefore we did not use bootstrapping in the
analysis. Some studies [49,50] have reported the ‘propor-tion mediated’ [39,46], ‘% excess risk explained’ [51], or aconceptually similar measure to distinguish the propor-tion or percentage of the indirect effect from total ef-fects. We did not report the ‘proportion mediated’, asmany of the NIEs were not statistically significant, andbecause the direction of NDEs and NIEs was not thesame for many measures of health and wellbeing whenmothers’ education and fathers’ education were used asan exposure.Previous research on the interaction between CSES
and ASES, and its effect on health in adulthood is notconsistent [7,16,21,49,52]. We have presented CDEs tohighlight the influence of exposure-mediator interaction,and the role of respondents’ education as a moderator inour data. The potential weakness is that respondents’education is merged into two groups, and there may beheterogeneity within each group. We did not assess themediating role of other adult SES indicators. The meth-odological challenge in assessing the mediating role ofincome or occupation is that respondents’ education islikely to be a mediator-outcome confounder affected bythe CSES.It is generally assumed that self-rated health is insensi-
tive to the wording used in the question [53]. Our re-sults suggest that self-rated health and age-comparativeself-rated health do not measure subjective health in asimilar manner. This is probably because the compari-son group was not determined in the question on non-comparative self-rated health. The respondents may havecompared their health with others of same sex, or theirhealth at other times, and their response could havebeen influenced by the expectations others have of theirhealth [54]. Some research [55] suggests that the agree-ment between the non-comparative self-rated health andage-comparative self-rated health may be excellent insome age groups. However, we observed that the NDEsand NIEs of CSES for both self-rated health measureswere not similar across age groups (data not shown).One plausible explanation for the difference may be thatfor age-comparative self-rated health, the respondentscompared their health to peers who likely have similarsocio-economic status. As the health profile is moresimilar among people from the same socio-economicgroups, the respondents may not compare with thehealth status in the wider population outside of theirown reference group.Although the previous research exploring the causal
mechanisms of the effect of parental education and in-come on adult health is not consistent, Deaton [40]summarized some of the previous research and proposedthat the effect of parental education on adult health islikely to be mediated by both parents’ income, and re-spondents’ education. Our data from Norway suggests
Sheikh et al. BMC Public Health 2014, 14:1172 Page 14 of 15http://www.biomedcentral.com/1471-2458/14/1172
that the effect of parental education on adult health ismediated by respondents’ education. Similarly, Deaton[40] proposed that the effect of parents’ income on adulthealth is likely to mediate through respondents’ educa-tion, but our data shows that the effect of childhood fi-nancial conditions is not mediated by respondents’education. This may be due to the egalitarian nature ofNorwegian society.Previous studies have shown that among different
measures of ASES, education is a main mediator be-tween CSES and later health [17,56]. Our findings sug-gest that the mediating role of respondents’ education isdifferent according to the indicators of CSES used in theanalysis. In contrast to most previous studies, whereboth a direct and indirect effect (mediated by ASES) ofCSES were observed [4,6,12], our study showed no evi-dence of a mediating effect for respondents’ educationwhen childhood financial conditions was used as an ex-posure. However, we observed little evidence of either adirect or an indirect effect of parental education onsome health measures. Many studies [2,8-11,21] have in-dicated that most of the effect of parental education onhealth and wellbeing in adulthood is mediated by adultSES. Our findings support this.One interesting finding from previous studies is that
mothers’ education is more important than the fathers’education on adult health [2]. This probably reflects theless dominant role of fathers in child rearing, and lookingafter children’s health [2,57]. It is uncertain whether thistrend will continue. Longitudinal studies assessing theeffect of parental education on later health in differentgenerations are needed to explore this further.Several studies have assessed the effect of CSES on indi-
cators of psychological symptoms, but yielded inconsistentresults [10,16,21,22,24,26,27,58]. Most studies have foundevidence of a direct effect [1,7,16,21,22,24], while othershave found evidence of an indirect effect [10,26]. We havefound evidence of a direct effect of childhood financialconditions and mothers’ education on anxiety/depression,as well as an indirect effect of mothers’ education on anx-iety/depression among women.
ConclusionsOur findings suggest that childhood financial conditionshave a unique direct effect on a wide range of healthand wellbeing measures. These findings apply to bothmen and women. Generally, parental education has anindirect effect on later health, but mothers’ educationmay also have a long-term direct effect on later health.Consistent with previous research on the effects of CSESon cause specific mortality and morbidity, our resultssuggest that, in addition to effecting adult SES, manyaspects of subjective health and wellbeing may also havesocio-economic roots in childhood.
Competing interestsThe authors declare that they have no competing interests.
Authors’ contributionsThis work was completed as part of MAS’s PhD, supervised by BA, and JAO.MAS wrote the first draft of the manuscript and BA and JAO criticallycommented it. All authors have approved the final version of themanuscript.
AcknowledgementsThis research is funded by the University of Tromsø, Norway. We are gratefulto anonymous reviewers for the detailed comments on an earlier version ofthe paper, and Tyler VanderWeele, Richard Emsley and Linda Valeri for fruitfuldiscussions on the methodology applied.
Received: 26 February 2014 Accepted: 22 October 2014Published: 18 November 2014
References1. Gilman SE: Childhood socioeconomic status, life course pathways and
adult mental health. Int J Epidemiol 2002, 31(2):403–404.2. Groot W, Maassen van den brink H: The effects of education on health. In
Human capital: advances in theory and evidence. Edited by Hartog J, Maassenvan den brink H. Cambridge: Cambridge University Press; 2007:65–80.
3. Lundberg O: The impact of childhood living conditions on illness andmortality in adulthood. Soc Sci Med 1993, 36(8):1047–1052.
4. Galobardes B, Lynch JW, Davey Smith G: Childhood socioeconomiccircumstances and cause-specific mortality in adulthood: systematicreview and interpretation. Epidemiol Rev 2004, 26:7–21.
5. Galobardes B, Lynch JW, Smith GD: Is the association between childhoodsocioeconomic circumstances and cause-specific mortality established? Updateof a systematic review. J Epidemiol Community Health 2008, 62(5):387–390.
6. Peck MN: The importance of childhood socio-economic group for adulthealth. Soc Sci Med 1994, 39(4):553–562.
7. Mäkinen T, Laaksonen M, Lahelma E, Rahkonen O: Associations ofchildhood circumstances with physical and mental functioning inadulthood. Soc Sci Med 2006, 62(8):1831–1839.
8. Leigh JP: Parents’ schooling and the correlation between education andfrailty. Econ Educ Rev 1998, 17(3):349–358.
9. Lipowicz A, Koziel S, Hulanicka B, Kowalisko A: Socioeconomic statusduring childhood and health status in adulthood: The Wroclaw GrowthS. J Biosoc Sci 2007, 39(04):481–491.
10. Harper S, Lynch J, Hsu WL, Everson SA, Hillemeier MM, Raghunathan TE,Salonen JT, Kaplan GA: Life course socioeconomic conditions and adultpsychosocial functioning. Int J Epidemiol 2002, 31(2):395–403.
11. Laaksonen M, Rahkonen O, Martikainen P, Lahelma E: Socioeconomic positionand self-rated health: the contribution of childhood socioeconomiccircumstances, adult socioeconomic status, and material resources.Am J Public Health 2005, 95(8):1403–1409.
12. Lindstrom M, Hansen K, Rosvall M: Economic stress in childhood andadulthood, and self-rated health: a population based study concerningrisk accumulation, critical period and social mobility. BMC Public Health2012, 12(1):761.
13. Niedzwiedz C, Katikireddi S, Pell J, Mitchell R: Life course socio-economicposition and quality of life in adulthood: a systematic review of lifecourse models. BMC Public Health 2012, 12(1):628.
14. McLaughlin KA, Breslau J, Green JG, Lakoma MD, Sampson NA, Zaslavsky AM,Kessler RC: Childhood socio-economic status and the onset, persistence,and severity of DSM-IV mental disorders in a US national sample. Soc SciMed 2011, 73(7):1088–1096.
15. Arnesen E, Forsdahl A: The Tromso heart study: coronary risk factors andtheir association with living conditions during childhood. J EpidemiolCommunity Health 1985, 39(3):210–214.
16. Power C, Atherton K, Strachan DP, Shepherd P, Fuller E, Davis A, Gibb I,Kumari M, Lowe G, Macfarlane GJ, Rahi J, Rodgers B, Stansfeld S: Life-courseinfluences on health in British adults: effects of socio-economic positionin childhood and adulthood. Int J Epidemiol 2007, 36(3):532–539.
17. Mckenzie S, Carter K, Blakely T, Ivory V: Effects of childhood socioeconomicposition on subjective health and health behaviours in adulthood: howmuch is mediated by adult socioeconomic position? BMC Public Health2011, 11(1):269.
Sheikh et al. BMC Public Health 2014, 14:1172 Page 15 of 15http://www.biomedcentral.com/1471-2458/14/1172
18. Case A, Fertig A, Paxson C: The lasting impact of childhood health andcircumstance. J Health Econ 2005, 24(2):365–389.
19. Hyde M, Jakub H, Melchior M, Van Oort F, Weyers S: Comparison of theeffects of low childhood socioeconomic position and low adulthoodsocioeconomic position on self rated health in four European studies.J Epidemiol Community Health 2006, 60(10):882–886.
20. Moody-Ayers S, Lindquist K, Sen S, Covinsky KE: Childhood social andeconomic well-being and health in older age. Am J Epidemiol 2007,166(9):1059–1067.
21. Reynolds JR, Ross CE: Social stratification and health: Education’s benefitbeyond economic status and social origins. Soc Probl 1998, 45(2):221–247.
22. Luo Y, Waite LJ: The impact of childhood and adult SES on physical,mental, and cognitive well-being in later life. J Gerontol B Psychol Sci SocSci 2005, 60(2):93–101.
23. Robertson T, Popham F, Benzeval M: Socioeconomic position across thelifecourse & allostatic load: data from the west of Scotland twenty-07cohort study. BMC Public Health 2014, 14(1):184.
24. Park A, Fuhrer R, Quesnel-Vallée A: Parents’ education and the risk ofmajor depression in early adulthood. Soc Psychiatry Psychiatr Epidemiol2013, 48(11):1829–1839.
25. Elovainio M, Pulkki-Raback L, Jokela M, Kivimaki M, Hintsanen M, Hintsa T,Viikari J, Raitakari OT, Keltikangas-Jarvinen L: Socioeconomic status and thedevelopment of depressive symptoms from childhood to adulthood: alongitudinal analysis across 27 years of follow-up in the Young Finnsstudy. Soc Sci Med 2012, 74(6):923–929.
26. Gibb SJ, Fergusson DM, Horwood LJ: Childhood family income and lifeoutcomes in adulthood: findings from a 30-year longitudinal study inNew Zealand. Soc Sci Med 2012, 74(12):1979–1986.
27. Sadowski H, Ugarte B, Kolvin I, Kaplan C, Barnes J: Early life family disadvantagesand major depression in adulthood. Br J Psychiatry 1999, 174:112–120.
28. Slopen N, Williams DR, Seedat S, Moomal H, Herman A, Stein DJ:Adversities in childhood and adult psychopathology in the south africastress and health study: associations with first-onset DSM-IV disorders.Soc Sci Med 2010, 71(10):1847–1854.
29. Zajacova A, Dowd JB: Reliability of self-rated health in US adults. Am JEpidemiol 2011, 174(8):977–983.
30. Crossley TF, Kennedy S: The reliability of self-assessed health status.J Health Econ 2002, 21(4):643–658.
31. Jacobsen BK, Eggen AE, Mathiesen EB, Wilsgaard T, Njølstad I: Cohortprofile: the Tromsø study. Int J Epidemiol 2012, 41(4):961–967.
32. The EuroQol Group: EuroQol–a new facility for the measurement of health-related quality of life. The EuroQol group. Health Policy 1990, 16(3):199–208.
33. Diener E, Emmons RA, Larsen RJ, Griffin S: The satisfaction with life scale.J Pers Assess 1985, 49:71–75.
34. Krieger N, Okamoto A, Selby JV: Adult female twins’ recall of childhoodsocial class and father’s education: a validation study for public healthresearch. Am J Epidemiol 1998, 147(7):704–708.
35. Textor J, Hardt J, Knüppel S: DAGitty: a graphical tool for analyzing causaldiagrams. Epidemiology 2011, 22(5):745.
36. Pearl J: Causality: models, reasoning and inference. Cambridge: CambridgeUniversity Press; 2000.
37. Baron RM, Kenny DA: The moderator-mediator variable distinction insocial psychological research: conceptual, strategic, and statisticalconsiderations. J Pers Soc Psychol 1986, 51(6):1173–1182.
38. PARAMED: Stata module to perform causal mediation analysis usingparametric regression models. In [https://ideas.repec.org/c/boc/bocode/s457581.html]
39. Valeri L, Vanderweele TJ: Mediation analysis allowing for exposure-mediator interactions and causal interpretation: Theoretical assumptionsand implementation with SAS and SPSS macros. Psychol Methods 2013,18(2):137–150.
40. Deaton A: What does the empirical evidence tell us about the injusticeof health inequalities? In Inequalities in health: concepts measures, andethics. Edited by Eyal N, Hurst SA, Norheim OF, Wikler D. New York: OxfordUniversity Press; 2013:263–281.
41. Hernán MA, Hernández-Diaz S, Werler MM, Mitchell AA: Causal knowledgeas a prerequisite for confounding evaluation: an application to birthdefects epidemiology. Am J Epidemiol 2002, 155(2):176–184.
42. VanderWeele TJ, Vansteelandt S: Conceptual issues concerning mediation,interventions and composition. Stat Interface 2009, 2:457–468.
43. VanderWeele TJ, Vansteelandt S: Odds ratios for mediation analysis for adichotomous outcome. Am J Epidemiol 2010, 172(12):1339–1348.
44. Pearl J: The causal mediation formula–a guide to the assessment ofpathways and mechanisms. Prev Sci 2012, 13(4):426–436.
45. Hicks R, Tingley D: Causal mediation analysis. Stata J 2011, 11(4):605–619.46. Imai K, Keele L, Tingley D: A general approach to causal mediation
analysis. Psychol Methods 2010, 15(4):309–334.47. Chittleborough CR, Baum F, Taylor AW, Hiller JE: Missing data on
retrospective recall of early-life socio-economic position in surveillancesystems: an additional disadvantage? Public health 2008, 122(11):1152–1166.
48. Gilbert D: Stumbling on happiness. New York: Alfred A. Knopf/Vintage; 2006.49. Van de Mheen H, Stronks K, Looman C, Mackenbach J: Does childhood
socioeconomic status influence adult health through behaviouralfactors? Int J Epidemiol 1998, 27(3):431–437.
50. Kamphuis C, Turrell G, Giskes K, Mackenbach J, van Lenthe F:Socioeconomic inequalities in cardiovascular mortality and the role ofchildhood socioeconomic conditions and adulthood risk factors: aprospective cohort study with 17-years of follow up. BMC Public Health2012, 12(1):1045.
51. Kaufman JS, Maclehose RF, Kaufman S: A further critique of the analyticstrategy of adjusting for covariates to identify biologic mediation.Epidemiol Perspect Innov 2004, 1(1):4.
52. Nandi A, Glymour MM, Kawachi I, VanderWeele TJ: Using marginalstructural models to estimate the direct effect of adverse childhoodsocial conditions on onset of heart disease, diabetes, and stroke.Epidemiology 2012, 23(2):223–232.
53. Idler EL, Benyamini Y: Self-rated health and mortality: a review of twenty-sevencommunity studies. J Health Soc Behav 1997, 38(1):21–37.
54. Fienberg SE, Loftus EF, Tanur JM: Cognitive aspects of health surveymethodology: an overview. Milbank Mem Fund Q Health Soc 1985, 63(3):547–564.
55. Baron-Epel O, Kaplan G: General subjective health status or age-relatedsubjective health status: does it make a difference? Soc Sci Med 2001,53(10):1373–1381.
56. Lawlor DA, Sterne JA, Tynelius P, Davey Smith G, Rasmussen F: Associationof childhood socioeconomic position with cause-specific mortality in aprospective record linkage study of 1,839,384 individuals. Am J Epidemiol2006, 164(9):907–915.
57. Vosko LF: Managing the margins: gender, citizenship, and the internationalregulation of precarious employment. Oxford: Oxford University Press; 2009.
58. Rodgers B: Adult affective disorder and early environment. Br J Psychiatry1990, 157(4):539–550.
doi:10.1186/1471-2458-14-1172Cite this article as: Sheikh et al.: Role of respondents’ education as amediator and moderator in the association between childhoodsocio-economic status and later health and wellbeing. BMC Public Health2014 14:1172.
Submit your next manuscript to BioMed Centraland take full advantage of:
• Convenient online submission
• Thorough peer review
• No space constraints or color figure charges
• Immediate publication on acceptance
• Inclusion in PubMed, CAS, Scopus and Google Scholar
• Research which is freely available for redistribution
Submit your manuscript at www.biomedcentral.com/submit
Copyright © 2022 FDOKUMEN