Competing allosteric mechanisms modulate substrate binding in a dimeric enzyme
Upload
independentCategory
view
1download
0
(This is a sample cover image for this issue. The actual cover is not yet available at this time.)
This article appeared in a journal published by Elsevier. The attachedcopy is furnished to the author for internal non-commercial researchand education use, including for instruction at the authors institution
and sharing with colleagues.
Other uses, including reproduction and distribution, or selling orlicensing copies, or posting to personal, institutional or third party
websites are prohibited.
In most cases authors are permitted to post their version of thearticle (e.g. in Word or Tex form) to their personal website orinstitutional repository. Authors requiring further information
regarding Elsevier’s archiving and manuscript policies areencouraged to visit:
http://www.elsevier.com/copyright

Author's personal copy
Role of pH on dimeric interactions for DENV envelope protein: An insight frommolecular dynamics study
Kshatresh Dutta Dubey, Amit Kumar Chaubey, Rajendra Prasad Ojha ⁎Department of Physics, DDU Gorakhpur University, Gorakhpur, U.P., 273009 India
a b s t r a c ta r t i c l e i n f o
Article history:Received 24 June 2011Received in revised form 18 August 2011Accepted 20 September 2011Available online 06 October 2011
Keywords:Envelope proteinMM-PB (GB)/SAHydrogen bondingSalt-bridgepH variation
The entry of dengue viruses is mediated by pH triggering in the host cells. Here we have studied the DENV Eprotein stability and binding of its units at low and normal pH using MD and MM-PB/SA method for the firsttime. To investigate the role of pH in dissociation of dimeric protein, we have performed a concise study ofhydrogen bonding and other interactions between units of dimer at low and normal pH. The GeneralizedBorn calculation connotes that dimeric unit was relatively less stable and less proned for dimerisation atlow pH. Our results provide a theoretical verification for previous assumptions of pH triggering mechanismof dengue envelope protein. During the pH alteration, we found a large decrement in salt bridges whichwere observed at normal pH. We also compared the flexibility of each unit and found that they exhibit differ-ent fluctuations during molecular dynamics simulations.
© 2011 Elsevier B.V. All rights reserved.
1. Introduction
Dengue is a mosquito borne viral disease that has become a majorpublic health concern worldwide in recent years. Annually, millionsof cases are found each and every year worldwide [1–3]. The dengueviral genome is a single stranded positive RNA. The genome of RNAencodes a single poly protein that is co- and post-translationallyprocessed by both viral and cellular protein into three structuraland seven nonstructural proteins. More details about the structuralfeatures of these proteins are stated elsewhere [4–7].
Dengue Infection is mediated by fusion of viral membrane and hostmembrane. The fusion process is initiated by envelope protein E in apH dependent manner. During the change of pH, dramatic changes inconformation of E protein take place [8]. Therefore understanding themechanism of conformational changes in the E protein is important fordevelopment of the antiviral drugs. The crystal structure of dengue Evirus in pre- and post fusion is already known [9–11]. Outer surface ofthe mature flavivirus particles contains 180 subunits of compactly orga-nized icosahedral array of homodimeric E protein in an antiparallel ori-entation. Each unit of dimer contains three structurally differentdomains containing 394 amino acids. Domain I consists of 8 stranded βbarrel from residues 1–52, 133–193 and 281–296. Domain II is arrangedin an elongated form and contains residues 53–132 and 194–280. It alsocontains a fusion loop (residues 100–110) that mediates the fusion
mechanism. In addition, domain II comprises a hairpin like structure(residues 268–280) between domain I and domain II. This hairpin hasbeen anticipated as a key structural element for initiating the low-pHconformational change that leads to formation of fusion-competent tri-mer. Domain III is an Ig like structure and contains residues 297–394.This domain shows the largest conformational changes during the tran-sition from dimer to trimer due to low pH [12]. The DENV envelope pro-tein clusters into trimers when they undergo their conformationalchanges induced by low pH (4.5 to 6.5) [8,12,10,13]. During pH change,dimer dissociates into monomers, allowing the individual subunits toswing outward. The fusion loop that was buried into the surface at nor-mal pH is now exposed and enters into target membrane facilitatingthe reclustering of subunits into trimeric form. The formation of trimeris not a straightforward procedure, but, initially forms an intermediateextended trimer, which further proceeds the structural rearrangementby rotation of domain III around segment that links it to domain I, andby zipping it up to the clustered domain II [14].
Since the dimeric form of the envelop protein plays a crucialrole in entry of dengue virus, conformational study of E protein ina dimeric form may be helpful in rational drug design projects. Al-though experimental study of structure of E virus has establishedmany milestones in targeting of dengue virus, many structuralfunctions cannot be explored with the help of these techniques. Ex-perimental techniques do not provide lucid information about thedynamic behavior of biomolecular systems. For such studies werely on the molecular dynamics simulation methods. Recently, amolecular dynamics simulation is performed for the monomer ofdengue E virus in normal and low pH conditions where hypothesisof an intermediate stage is validated [15]. However, envelope
Biochimica et Biophysica Acta 1814 (2011) 1796–1801
⁎ Corresponding author. Tel.: +91 551 2202167; fax: +91 551 2340459.E-mail address: [email protected] (R.P. Ojha).
1570-9639/$ – see front matter © 2011 Elsevier B.V. All rights reserved.doi:10.1016/j.bbapap.2011.09.012
Contents lists available at SciVerse ScienceDirect
Biochimica et Biophysica Acta
j ourna l homepage: www.e lsev ie r .com/ locate /bbapap
Author's personal copy
protein exhibits a dimeric form, thus MD study in low and normalpH of dimeric E protein may be more fruitful relative to the mono-meric simulations.
In this article we have investigated the interactions between bothunits and some conformational behaviors of dengue E protein in di-meric form starting with a co-crystallized structure at the normalpH (pH≈7) conditions. We have used standard molecular dynamicssimulation as well as MM-PB/SA method to investigate the interac-tions between units of E protein at low pH and normal pH. We haveperformed this study for giant dimeric complex using computationaltechniques for the first time. Although some other MD simulationshave been performed previously [16–19], they don't explain bindingof dimeric units with respect to each other and the effect of pH on sta-bility of the complex in different conditions.
2. Material and methods
The starting structure of the DENV2 E protein, prior to fusion, istaken from protein data bank PDB id 1OAN [9]. In crystallographicstructure, some of the heavy atoms were missing, which wereadded by Leap module of Amber package. The crystallographic struc-ture contains some carbohydrate moieties like Glycan, Manose andFucose. Partial atomic charges of these molecules were calculatedusing restrained electrostatic potential (RESP) procedure [20–24].Ab initio calculations of these molecules were carried out usingGaussian 03 program at HF/6–31 G* level of theory. Crystallographicstructure was initially a dimer, and we have performed all calcula-tions in dimeric form as well. The parameters for sugar moleculeswere prepared by antechamber module of Amber 10 package which
were incorporated in Amber library during parameterization of thecomplex by leap module [25]. After system preparation and prior toMD simulation, the structure was minimized to remove the stericclashes. The system was then gently annealed from 10 K to 300 Kover a period of 200 ps with continuously decreasing restraints andthen maintained in isothermal–isobaric ensemble (NPT) with a targettemperature of 300 K and target pressure of 1 bar using Langevinthermostat [26] and Barendsen barostat [27] with collision frequencyof 2 ps and pressure relaxation time of 1 ps. The bonds involving hy-drogen atoms were constrained using SHAKE [28]. After getting thesystem at target temperature and pressure of 300 K and 1 bar, simu-lation was continued up to 1.5 ns for equilibration with identical pa-rameters. Furthermore, molecular dynamical production phase wasinitiated for analysis and continued for another 8 ns with time stepof 0.002 ps and maintained in isothermal and isobaric ensemble(NPT) at target temperature of 300 K and target pressure of 1 barusing same Langevin thermostat and Barendsen barostat as duringthe equilibration process. All simulations were carried out in implicitsolvent using Generalized Born methods. For low pH simulation, weprotonated all Histidine and Glutamate to acidify the complex at 5pH. We modified all HIE (Histidine protonation state at normal pHaccording to AMBER library) to HIP and GLU were modified to GLH.The protonation of all acidic residues like Histidine, Glutamate andAspartate lowers pH≈3. Therefore, we left Aspartate unchanged toget pH in the range of 4–5. During the system preparation, 2 Na+were added as counterions for simulation at low and normal pH.We applied identical parameters during simulations at normal andlow pH. The snapshots were collected at 10 ps intervals for both sim-ulations. We used VMD 1.6.8 [29] to investigate hydrogen bonding
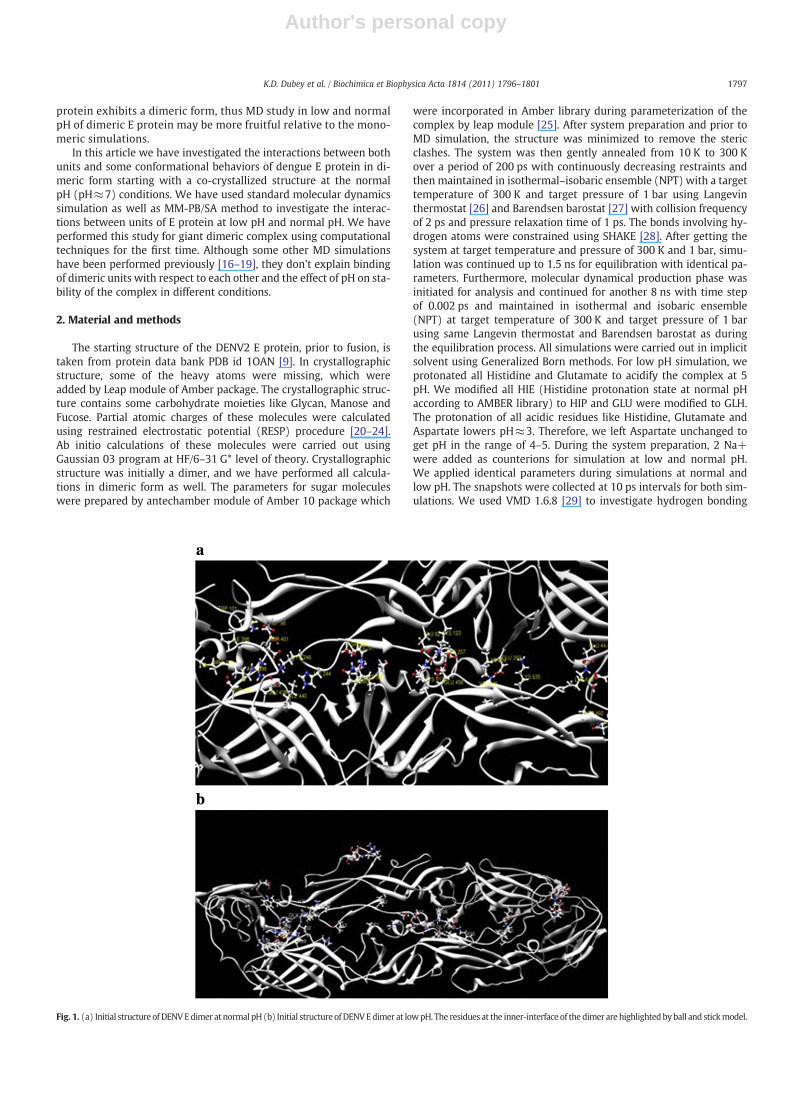
Fig. 1. (a) Initial structure of DENVEdimer at normal pH (b) Initial structure ofDENVEdimer at lowpH. The residues at the inner-interface of the dimer are highlightedbyball and stickmodel.
1797K.D. Dubey et al. / Biochimica et Biophysica Acta 1814 (2011) 1796–1801
Author's personal copy
between units of dimer. The analyses of trajectories were done byPTRAJ module of Amber10. We used Chimera-1.5 [30] for visualiza-tion of structures.
The binding energies of the complex at normal and low pH werecalculated by MM-PB/GBSA method [31]. The principles of thesemethods are well established and have been discussed by many sci-entists [32,33]. Prior to the MM-PB/SA analysis, all ions were strippedfrom the trajectories. More details on this method can be found in ourearlier publications [34–37]. During MMPBSA calculation, snapshotswere generated for trajectories of 2–7 ns. The first monomer wastreated as ligand and the other as receptor.
3. Results
The initial structures of dimer at low and normal pH are shown inFig. 1. We see that domain II and domain III are conjoining parts of thedimer. Residues 706–713 of domain III of the second unit (312–320for first unit) and residues 99–106 of domain II of the first unit(494–501 of second unit) are in good contact. Moreover, residues250–271 of the first unit and residues 644–662 of the second unitalso create contacts between monomeric units. These interactionsprovide stability to the complex in dimeric form.
3.1. MD at normal pH
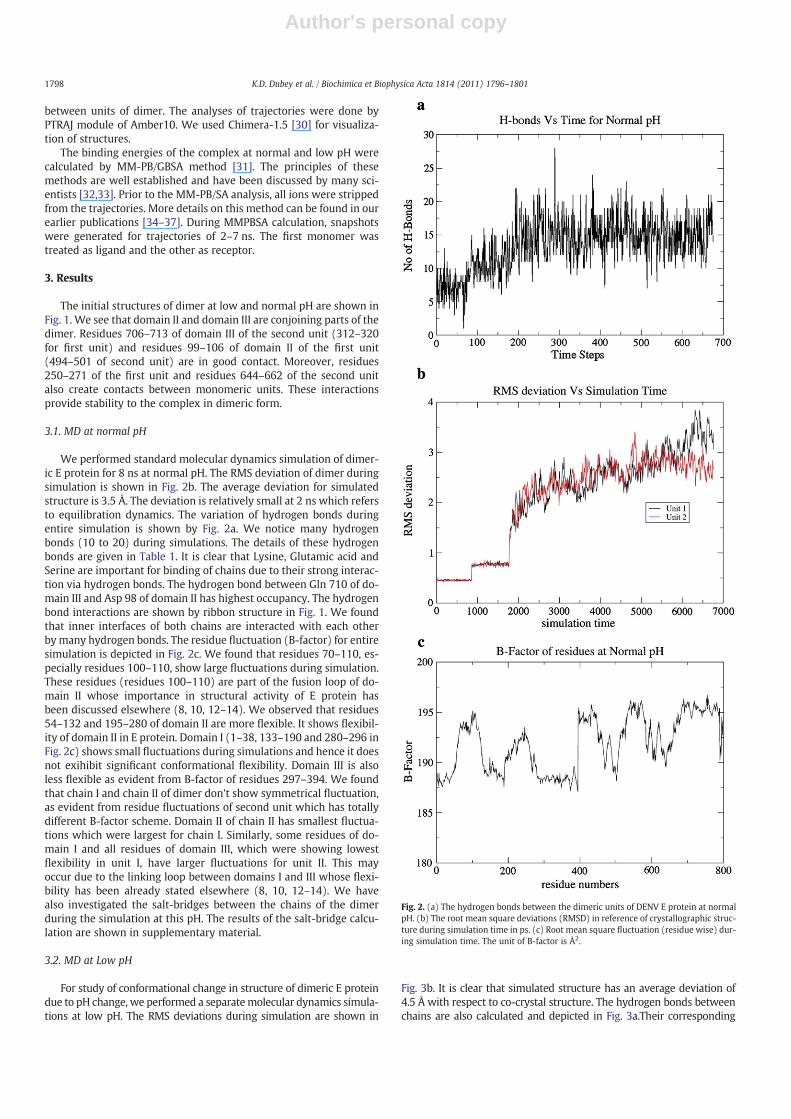
We performed standard molecular dynamics simulation of dimer-ic E protein for 8 ns at normal pH. The RMS deviation of dimer duringsimulation is shown in Fig. 2b. The average deviation for simulatedstructure is 3.5 Å. The deviation is relatively small at 2 ns which refersto equilibration dynamics. The variation of hydrogen bonds duringentire simulation is shown by Fig. 2a. We notice many hydrogenbonds (10 to 20) during simulations. The details of these hydrogenbonds are given in Table 1. It is clear that Lysine, Glutamic acid andSerine are important for binding of chains due to their strong interac-tion via hydrogen bonds. The hydrogen bond between Gln 710 of do-main III and Asp 98 of domain II has highest occupancy. The hydrogenbond interactions are shown by ribbon structure in Fig. 1. We foundthat inner interfaces of both chains are interacted with each otherby many hydrogen bonds. The residue fluctuation (B-factor) for entiresimulation is depicted in Fig. 2c. We found that residues 70–110, es-pecially residues 100–110, show large fluctuations during simulation.These residues (residues 100–110) are part of the fusion loop of do-main II whose importance in structural activity of E protein hasbeen discussed elsewhere (8, 10, 12–14). We observed that residues54–132 and 195–280 of domain II are more flexible. It shows flexibil-ity of domain II in E protein. Domain I (1–38, 133–190 and 280–296 inFig. 2c) shows small fluctuations during simulations and hence it doesnot exihibit significant conformational flexibility. Domain III is alsoless flexible as evident from B-factor of residues 297–394. We foundthat chain I and chain II of dimer don't show symmetrical fluctuation,as evident from residue fluctuations of second unit which has totallydifferent B-factor scheme. Domain II of chain II has smallest fluctua-tions which were largest for chain I. Similarly, some residues of do-main I and all residues of domain III, which were showing lowestflexibility in unit I, have larger fluctuations for unit II. This mayoccur due to the linking loop between domains I and III whose flexi-bility has been already stated elsewhere (8, 10, 12–14). We havealso investigated the salt-bridges between the chains of the dimerduring the simulation at this pH. The results of the salt-bridge calcu-lation are shown in supplementary material.
3.2. MD at Low pH
For study of conformational change in structure of dimeric E proteindue to pH change, we performed a separatemolecular dynamics simula-tions at low pH. The RMS deviations during simulation are shown in
Fig. 3b. It is clear that simulated structure has an average deviation of4.5 Å with respect to co-crystal structure. The hydrogen bonds betweenchains are also calculated and depicted in Fig. 3a.Their corresponding
Fig. 2. (a) The hydrogen bonds between the dimeric units of DENV E protein at normalpH. (b) The root mean square deviations (RMSD) in reference of crystallographic struc-ture during simulation time in ps. (c) Root mean square fluctuation (residue wise) dur-ing simulation time. The unit of B-factor is Å2.
1798 K.D. Dubey et al. / Biochimica et Biophysica Acta 1814 (2011) 1796–1801

Author's personal copy
details are given in Table 2. We perceive that there are no hydrogenbondswith occupancy greater than 25%. Furthermore, the number of hy-drogen bonds is extremely small (4 to5 hydrogen bonds) which denotesweak interactions between units of a dimer at low pH. Ser 7, His 158, Leu253 and Gln 256 of the first unit form hydrogen bonds with longer resi-dent times (occupancy≈20%). The residue fluctuation at low pH isdepicted in Fig. 3c. It is clear that B-factor (residuewise) of entire systemlies between 225 and 260 Å2. We notice that all domains of dimer haveconsiderably high fluctuations. Domain II of first unit has largest residuefluctuations during simulations. We again notice asymmetrical fluctua-tions in both units of a dimer. In the second unit (residues 394–788)the B-factor scheme is entirely different from the first unit. In the secondunit,fluctuations of domain I increase abruptly relative to domain I of thefirst unit. Similarly, residuefluctuations of domain III are also different. Inthe second unit, domain III has highest fluctuations among other do-mains. Residues 200–240 of domain II show lowest fluctuations, whichwere relatively high in unit I.
3.3. MM-PBSA results
We have applied MM-PB/GBSA method to calculate the stability ofdimer at normal and low pH as well as to calculate binding energy of itsunits. Table 3 shows the stability of dimer at normal and lowpH. The elec-trostatic energy of dimer at normal pH is −18878.43 kcal/mol and40402.01 kcal/mol at low pH condition. We see that Eele is negative atnormal pH while positive at low pH. The negative value of electrostaticenergy indicates that formation of a dimer is electrostatically favored.The high positive value of electrostatic energy talks against complex for-mation at low pH. The van derWaals energy in both complexes is almostof the same order. Therefore, the van der Waals energy has not been af-fected substantially. The solvation energy of dimer in normal pH is−7315.21 kcal/mol while it is −62450.29 kcal/mol for low pH condi-tions. These data show a strong interaction between the solvent and thedimer at lowpH; as a result dimer gets highly solvent exposed. In such cir-cumstances, the interactions within the dimerweaken due to presence ofsolvent molecules. Similar results are observed for GBSA analysis, wherevalue of Esol is−7866.01 kcal/mol and−63461.73 kcal/mol, respectively.Total binding energy of dimer at normal pH is −16716.6 kcal/mol and−12197.6 kcal/mol at low pH; energy value is more negative at normalpH conditions while relatively less negative for low pH. High negativityat normal pH denotes higher stability of dimer at normal pH.
We have applied MM-PB/GB-SA method for calculation of bind-ing free energy at low pH as well as at normal pH. From Table 4, wesee that ΔG for all terms, except for van der Waals and nonpolarcontributions, at normal pH are extremely positive. The positivefree energy does not favor binding between units. On the otherhand, we see that ΔGbind at low pH is 5204.22 kcal/mol in PBSA
Table 1Table shows the number of hydrogen bonds formed during the entire simulation atnormal pH. The percentage occupancy is calculated for the entire simulation of 9 ns.The hydrogen bonds are calculated using the ptraj module of Amber 10.
Donor Acceptor Occupancy
LYS246 -Side GLU438 -Side 32.54%SER255 -Main GLU651 -Side 41.42%SER7 -Main ASP492 -Side 40.24%SER401 -Main ASP98 -Side 19.97%LYS241 -Side GLU663 -Side 37.28%SER649 -Main GLU257 -Side 28.70%LYS640 -Side GLU44 -Side 29.73%GLN710 -Side ASP98 -Side 56.66%GLN316 -Side ASP492 -Side 43.34%GLN665 -Side ASP249 -Side 25.44%LYS123 -Side GLU456 -Side 33.43%LYS517 -Side GLU62 -Side 38.17%LYS640 -Side ASP154 -Side 40.68%LYS246 -Side ASP548 -Side 39.20%LYS635 -Side GLU269 -Main 21.89%LYS204 -Side THR633 -Side 28.11%HIE244 -Side ILE440 -Main 27.96%LYS598 -Side ASP249 -Side 29.29%LYS241 -Side THR659 -Main 27.37%SER255 -Side GLU651 -Side 26.48%
Fig. 3. (a) The hydrogen bonds between the dimeric units of DENV E protein at low pH.(b) The root mean square deviations (RMSD) in reference of crystallographic structureduring simulation time in ps. (c) Root mean square fluctuation (residue wise) duringsimulation time. The unit of B-factor is Å2.
1799K.D. Dubey et al. / Biochimica et Biophysica Acta 1814 (2011) 1796–1801

Author's personal copy
and 5035.78 kcal in GBSA methods which is relatively more posi-tive than ΔGbind at normal pH (3786.63 kcal/mol for PBSA and4615.26 kcal/mol for GBSA). These data show that binding ofchains at low pH is not energetically more favored than at normalpH conditions. Again we notice a large difference in ΔGpol terms be-tween normal and low pH.
4. Discussion
We see that structure of E protein at low pH has higher RMS devia-tions relative to normal pH. Therefore, due to a change in pH, a conforma-tional change in a complex takes place that destabilizes the dimer andcauses dissociation of dimeric units. The hydrogen bond pattern connotesthat there are many hydrogen bonds between the chains of a dimer atnormal pH. These hydrogen bonds play a paramount role for the stabiliza-tion of dimeric system. Most hydrogen bonds are formed by Lysine resi-dues whose role in the salt bridge formation is well known [35]. Due tothe decrease in pH, hydrogen-bond forming residues get protonatedand result in weak hydrogen bonding, as in our results.
At normal pH, a number of salt-bridges are observed while there wasno salt bridge formed at low pH conditions, as evident from Table 2. Dueto diminution in pH, the acidic residues get protonated which eradicatesany possibility of a salt-bridge. Furthermore, we also notice that bothchains of dimer exhibit asymmetrical motion or fluctuations during MDsimulation which are not observed anywhere in experimental studies.Therefore, monomeric study of the complex is not fruitful. During MDsimulations, we see that fluctuation of all domains of chain I is differentfrom chain II. The flexibility of residues increases due to the lowering ofpH. At low pH, domains I and II becomemore dynamic relative to normalpH. Every part of the dimer exhibits higher fluctuations. Therefore, due toincrease offluctuation due to change in pH, occupancy of hydrogen bondsdecreases and hence there are weak interactions between the chainswhich destabilize the dimer.
We see that stability of the dimer at normal pH is greater than at lowpH. At normal pH, the structure is tightly bound due to electrostatic inter-actions and hence there is lower probability of solvent interactions. Dueto lack of solvent interactions, the dimer is stable at normal pH. When
the pH of the system decreases, hydrogen bonding pattern gets eliminatedwhich destabilizes the system. We see that solvation energy increasesabruptly at low pH. Through the increase of solvation energy the complexgets solvent exposed and interacts strongly with the solvent, lowering theinter-chain interactions. This causes breaking of dimer into intermediatemonomer which is more solvent exposed than the monomer at normalpH. The binding free energy shows unfavorable interactions betweenchains of dimer at normal pH, and even more unfavorable at low pH.Then the question arises— if there is no favorable binding free energy be-tween both chains then what makes the dimer stable at normal pH? Theanswer to the preceding question is clear from the electrostatic interactionscaused by hydrogen bonding and salt bridges between chains. This is theonly factor responsible for cohesionof chains at normal pH.Due tounfavor-able binding energy, these chains have a strong tendency of dissociationand whenever they get a favorable condition, they dissociate into mono-mer. Low pH represents a condition which is favorable for dissociation.
Since domain rearrangement for themajority of proteins occurs at themillisecond time span, we can only provide a predictive approach forrearrangement of dimeric unit of E protein by a nanosecond simulation.Here, we propose that envelope protein initially exists in the dimericform innormal pH. There aremanyhydrogenbondmediated electrostaticinteractions, which give stability to the dimeric unit at normal pH. Fur-thermore, due to decrease of pH, amino acids like Aspartate and Histidineget protonated which results in weak interactions between units ofdimer. Our assumption is theoretically supported by binding free energycalculations at low pH and normal pH. Our study provides a theoreticalevidence for the conformational change during pH triggering in hostcell.We also notice that each unit of dimer shows different conformation-al behavior, therefore, the dimeric study of the E protein will be morefruitful.
Acknowledgement
Part of the computational work was performed at Super-computingfacility for bio-informatics and computational biology, IIT Delhi, theirhelp is gratefully acknowledged. A special thank to Prof. B. Jayaram, coor-dinator of SCFbio, IITD, who facilitated the supercomputer access at IITD.KDD acknowledges CSIR for senior research fellowship.
Appendix A. Supplementary data
Supplementary data to this article can be found online at doi:10.1016/j.bbapap.2011.09.012.
References
[1] L.J. Dean, E. Harris, B. Wills, A. Balmaseda, S.N., et al., WHO classification and casedefinitions: time for a reassessment, Lancet 368 (2006) 170–173.
Table 2Table shows the number of hydrogen bonds formed during the entire simulation at lowpH. The percentage occupancy is calculated for the entire simulation of 9 ns.
Donor Acceptor Occupancy
HIP158 -Side 0FA793 -Side 23.94%HIP655 -Side GLN256 -Side 20.45%GLH663 -Side LEU253 -Main 21.97%ASH492 -Main SER7 -Side 19.39%
Table 3Stability of dimer at normal and low pH. All energy contributions are in kcal/mol.
Normal pH Low pH
Contributions Mean Stand dev Mean Stand dev
EELE −18878.43 455.32 40402.01 865.89EVDW −3538.38 29.56 −3649.50 37.84EINT 13015.42 55.61 13500.18 40.49EGAS −9401.39 451.02 50252.69 852.08EPBSUR 102.26 134.15 277.82 5.14EPBCAL −7417.47 429.25 −62728.11 815.93EPBSOL −7315.21 448.49 −62450.29 811.77EPBELE −26295.90 76.07 −22326.09 84.16EPBTOT −16716.60 168.89 −12197.60 68.84EGBSUR 102.26 134.15 277.82 5.14EGB −7968.27 385.83 −63739.55 842.81EGBSOL −7866.01 405.79 −63461.73 838.59EGBELE −26846.70 78.31 −23337.53 43.62EGBTOT −17267.40 166.29 −13209.04 29.47
Table 4Binding free energy of units of dimer. All free energy contributions are in kcal/mol.
For normal pH For low pH
Contributions Mean STD Mean STD
ΔGELE 2602.79 69.35 26027.97 207.91ΔGVDW −216.81 13.39 −211.08 26.52ΔGINT 318.91 9.05 330.25 18.39ΔEGAS 2704.89 79.29 26147.14 210.91ΔGPBSUR −34.23 2.26 −30.86 2.40ΔGPBCAL 1115.97 83.27 −20912.06 224.53ΔGPBSOL 1081.75 81.57 −20942.92 223.35ΔGPBELE 3718.76 29.95 5115.90 31.44ΔGPBTOT 3786.63 26.58 5204.22 45.87ΔGGBSUR −34.23 2.26 −30.86 2.40ΔGGBCAL 1944.60 210.57 −21080.50 222.84ΔGGBSOL 1910.37 208.73 −21111.36 221.64ΔGGBTOT 4615.26 152.49 5035.78 32.49
1800 K.D. Dubey et al. / Biochimica et Biophysica Acta 1814 (2011) 1796–1801

Author's personal copy
[2] J.S. Mackenzie, D.J. Gubler, L.R. Peterson, Emerging flaviviruses: the spread andresurgence of Japanese encephelitis, West Nile and dengue viruses, Nat. Med.10 (2004) S98–S109.
[3] G.N.Malavige, N.S. Fernando, D.J. Fernando, S.L. Seneviratne, Dengue viral infections,Postgrad. Med. J. 80 (2004) 588–601.
[4] T.S. Jarderzky, R.A. Lamb, Virology: a class act, Nature 427 (2004) 307–308.[5] J.J. Skehel, D.C. Wiley, Receptor binding and membrane fusion in virus entry: the
influenza hemagglutinin, Annu. Rev. Biochem. 59 (2000) 531–569.[6] L.J. Earp, S.E. Delos, H.E. Park, J.M.White, Themanymechanisms of viral membrane fu-
sion proteins, in: M. Marsh (Ed.), Membrane Trafficking in Viral Replication. CurrentTopics in Microbiology and Immunology, Springer Verlag, New York, 2005, pp. 25–66.
[7] S. Mukhopadhyay, R.J. Kuhn, M.G. Rossmann, A structural perspective of the flavi-virus membrane fusion, Nat. Rev. Microbiol. 3 (2005) 13–22.
[8] S. Bressanelli, K. Stiasny, S.L. Allison, E.A. Stura, S. Duquerroy, J. Lescar, F.X. Heinz,F.A. Rey, Structure of a flavivirus envelope glycoprotein in its low-pH inducedmembrane fusion conformation, EMBO J. 23 (2004) 728–738.
[9] Y. Modis, S. Ogata, D. Clements, S.C. Harrison, A ligand binding pocket in the den-gue envelope protein, Proc. Natl. Acad. Sci. 100 (2003) 6986–6991.
[10] Y. Modis, S. Ogata, D. Clements, S.C. Harrison, Structure of the dengue virus enve-lope protein after membrane fusion, Nature 427 (2004) 313–319.
[11] V. Nayak,M. Dessau, K. Kucera, K. Anthony,M. Ledizet, Y.Modis, Crystal structure of den-gue virus type 1 envelope protein in the post fusion conformation and its implication inthe post fusion conformation, J. Virol. 83 (2009) 4338–4344.
[12] M. Liao, M. Kielian, Domain III from class II fusion proteins functions as a dominantnegative inhibitor of virus membrane fusion, J. Cell Biol. 171 (2005) 111–120.
[13] K. Satisny, F.X.Heinz, Flavivirusmembrane fusion, J. Gen. Virol. 87 (2006) 2755–2766.[14] S.C. Harrison, Viral membrane fusion, Nat. Struct. Mol. Biol. 15 (2008) 690–698.[15] M.K. Prakash, A. Barducci, M. Parrinello, Probing the mechanism of pH-induced
large scale conformational change in the dengue virus envelope protein using at-omistic simulations, Biophys. J. 99 (2010) 588–594.
[16] B. Strockbine, R.C. Rizzo, Binding of antifusion peptides with HIVgp41 from mo-lecular dynamics simulations: quantitative correlation with experiment, Proteins67 (2007) 630–642.
[17] M. Kalyankar, S. Srivastava, A. Saran, E. Coutinho, Conformational study of frag-ments of envelope protein (gp 120:254–274 and gp 41:519–541) of HIV-1 byNMR and MD simulations, J. Pept. Sci. 10 (2004) 363–380.
[18] A. Taylor, M.S.P. Sansom, Studies on viral fusion peptides: the distribution of lipophilicand electrostatic potential over the peptide determines the angle of insertion intomembrane, Eur. Biophys. J. 39 (2010) 1537–1545.
[19] D.S. Mueller, T. Kampamann, R. Yennamalli, P.R. Young, B. Kobe, A.E. Mark, Histidine pro-tonation and the activation of viral fusion proteins, Biochem. Soc. Trans. 36 (2008) 43–45.
[20] W.D. Cornell, P. Cieplak, C.I. Baylyl, I.R. Gould, J.K.M. Merz, D.M. Fergusen, D.C.Spellmeyer, T. Fox, J.W. Caldwell, P.A. Kollman, A second generation force fieldfor the simulation of proteins, nucleic acids and organic molecules, J. Am. Chem.Soc. 117 (1995) 5179–5197.
[21] C.I. Bayly, P. Cieplak, W. Cornell, P.A. Kollman, A well behaved electrostatic potentialbased method using charge restraints for deriving atomic charges: the RESP model, J.Phys. Chem. 97 (1993) 10269–10280.
[22] W.D. Cornell, P. Cieplak, C.I. Bayly, P.A. Kollman, Application of RESP charges tocalculate conformational energies, hydrogen bond energies, and free energies ofsolvation, J. Am. Chem. Soc. 115 (1993) 9620–9631.
[23] U. Bren, M. Hodosock, J. Koller, Development and validation of empirical forcefield parameters for Netropsin, J. Chem. Inf. Model. 45 (2005) 1546–1552.
[24] T. Udommaneethanakit, T. Rungrotmongkol, U. Bren, V. Frecer, S. Miertus, Dynamicbehavior of avian influenza A Virus neuraminidase subtype H5N1 in complex withoseltamivir, zanamivir, peramivir, and their phosphonate analogues, J. Chem. Inf.Model. 49 (2009) 2323–2332.
[25] D.A. Case, T.E. Cheatham, T. Daren, H. Gohlke, R. Luo, K.M. Merz, A. Onufriev, C.Simmerling, B. Wang, R.J. Woods, The amber biomolecular simulation programs,J. Comput. Chem. 26 (2005) 1668–1688.
[26] A. Izaguirre, D.P. Catarello, J.M. Wozanaik, R.D. Skeel, Langevin stabilization ofmolecular dynamics, J. Chem. Phys. 114 (2001) 2090–2098.
[27] H.J.C. Berendsen, J.P.M. Postama, W.F. van-Gunsteren, A. DiNola, J.R. Haak, Moleculardynamics with coupling to an external bath, J. Chem. Phys. 81 (1984) 3684–3690.
[28] J.P. Ryckaert, G. Cicotti, H.J.C. Barendsen, Numerical integration of the Cartesianequation of motion of a system with constraints: molecular dynamics of n-alkanes,J. Comput. Phys. 23 (1977) 327–341.
[29] W. Humphrey, A. Dalke, K. Schulten, VMD — virtual molecular dynamics, J. Mol.Graph. Model. 14 (1996) 33–38.
[30] E.F. Pettersen, T.D. Goddard, C.C. Haung, G.S. Couch, D.M. Greenblatt, E.C. Meng,T.E. Ferrin, UCSF chimera — a visualization system for exploratory research andanalysis, J. Comput. Chem. 25 (2004) 1605–1612.
[31] H. Gohlke, D.A. Case, Converging free energy estimates: MM-PB(GB)SA studies onthe protein-protein complex ras-raf, J. Comput. Chem. 25 (2003) 238–250.
[32] U. Bren, V. Martinek, J. Florian, Decomposition of the salvation free energies ofdeoxyribonucleoside triphosphate using the free energy perturbation method, J.Phys. Chem. B 110 (2006) 12782–12788.
[33] M. Bren, J. Florian, J. Mavri, U. Bren, Do all pieces make a whole? Thiele cumulantsand the free energy decompositions, Theor. Chem. Acc. 117 (2007) 535–540.
[34] K.D. Dubey, R.P. Ojha, Binding free energy calculation with QM/MM hybrid methodfor Abl kinase inhibitor, J. Biol. Phys. 37 (2011) 69–78.
[35] K.D. Dubey, R.P. Ojha, Conformational flexibility, binding energy, role of salt bridgeand alanine-mutagenesis for c-Abl kinase complex, J. Mol. Model. (2011), doi:10.1007/s00894-011-1199-9.
[36] C. Balasubriamanian, R.P. Ojha, S. Maiti, Hydration pattern of A4T4 and T4A4DNA: a molecular dynamics study, Biochem. Biophys. Res. Commun. 355 (2007)1081–1086.
[37] C. Balasubriamanian, R.P. Ojha, S. Maiti, A. Desideri, Sampling the structure ofnanocanonocal lin-4:lin-14 microRNA:mRNA complex by molecular dynamicssimulations, J. Phys. Chem. B 114 (2010) 16443–16449.
1801K.D. Dubey et al. / Biochimica et Biophysica Acta 1814 (2011) 1796–1801
Copyright © 2022 FDOKUMEN