Role of PDZK1 Protein in Apical Membrane Expression of Renal Sodium-coupled Phosphate Transporters
11
Role of PDZK1 Protein in Apical Membrane Expression of Renal Sodium-coupled Phosphate Transporters * □ S Received for publication, November 2, 2010, and in revised form, February 17, 2011 Published, JBC Papers in Press, March 9, 2011, DOI 10.1074/jbc.M110.199752 Hector Giral ‡1 , Luca Lanzano §1 , Yupanqui Caldas ‡ , Judith Blaine ‡ , Jill W. Verlander ¶ , Tim Lei , Enrico Gratton § , and Moshe Levi ‡2 From the ‡ Department of Medicine, University of Colorado, Aurora, Colorado 80045, the § Laboratory for Fluorescence Dynamics, University of California, Irvine, California 92697, the ¶ Department of Medicine, Division of Nephrology, Hypertension, and Transplantation, University of Florida, Gainesville, Florida 32610, and the Department of Electrical Engineering, University of Colorado Denver, Denver, Colorado 80202 The sodium-dependent phosphate (Na/P i ) transporters NaPi-2a and NaPi-2c play a major role in the renal reabsorption of P i . The functional need for several transporters accomplish- ing the same role is still not clear. However, the fact that these transporters show differential regulation under dietary and hormonal stimuli suggests different roles in P i reabsorption. The pathways controlling this differential regulation are still unknown, but one of the candidates involved is the NHERF fam- ily of scaffolding PDZ proteins. We propose that differences in the molecular interaction with PDZ proteins are related with the differential adaptation of Na/P i transporters. Pdzk1 / mice adapted to chronic low P i diets showed an increased expression of NaPi-2a protein in the apical membrane of proximal tubules but impaired up-regulation of NaPi-2c. These results suggest an important role for PDZK1 in the stabilization of NaPi-2c in the apical membrane. We studied the specific protein-protein inter- actions of Na/P i transporters with NHERF-1 and PDZK1 by FRET. FRET measurements showed a much stronger interac- tion of NHERF-1 with NaPi-2a than with NaPi-2c. However, both Na/P i transporters showed similar FRET efficiencies with PDZK1. Interestingly, in cells adapted to low P i concentrations, there were increases in NaPi-2c/PDZK1 and NaPi-2a/NHERF-1 interactions. The differential affinity of the Na/P i transporters for NHERF-1 and PDZK1 proteins could partially explain their differential regulation and/or stability in the apical membrane. In this regard, direct interaction between NaPi-2c and PDZK1 seems to play an important role in the physiological regulation of NaPi-2c. The type II sodium-coupled phosphate (Na/P i ) 3 transporters are the molecules responsible for tubular reabsorption of P i and are the target of hormonal and nonhormonal mechanisms that control phosphate homeostasis. NaPi-2a (NaPiIIa) is responsi- ble for 70% of the P i reabsorbed in the adult kidney of mice, whereas NaPi-2c (NaPiIIc) handles the remaining 30% (1, 2). A low dietary P i intake induces an increase of P i reabsorption in the proximal tubule mediated by augmented apical expression of NaPi-2a and NaPi-2c transporters and consequent increased P i uptake (3– 6). Despite sharing a very similar molecular structure, NaPi-2a and NaPi-2c exhibit an increasing list of physiological differ- ences. For example, whereas NaPi-2a is electrogenic, NaPi-2c is electroneutral (4, 7). In addition, both transporters participate in the renal adaptation to changes in dietary P i with different characteristics. In response to a high P i intake, NaPi-2a abun- dance decreases quickly (less than 1 h), internalization takes place in a microtubule-independent way, and molecules are tar- geted to the lysosomes via endosomes (8, 9). In contrast, under a high P i intake, NaPi-2c abundance decreases slowly (4 h), molecules are internalized through a microtubule-dependent pathway, and rather than being degraded, they are accumulated in a subapical compartment (10). Similar differences have been also reported for the response of NaPi-2a and NaPi-2c to PTH (11). Some of these differences may be explained by the type and number of proteins with which the transporters interact. For example, it is well known that NaPi-2a is integrated in a series of macromolecular complexes whose architecture is based on PDZ (PSD-95, discs-large, and ZO-1) protein interactions (12– 19). NaPi-2a participates in this complex by means of a class I PDZ-binding site located at its C terminus, comprising its last three amino acids (TRL). Using two-hybrid systems and co-immunoprecipitation, it has been previously determined that NaPi-2c interacts with the PDZ protein sodium-hydrogen exchange-regulating factor 1 (NHERF-1) and 3 (NHERF-3 or PDZK1) (15). These interac- tions were surprising because NaPi-2c does not have a proto- typical PDZ binding motif in the C terminus (QQL). NaPi-2c/ PDZK1 interaction was stronger than NaPi-2c/NHERF-1 interaction by two-hybrid system assays, but co-immunopre- cipitation was more robust for NHERF-1 than for PDZK1. Moreover, it was proposed than NaPi-2c interaction was medi- ated through the C-terminal end of the transporter for PDZK1 but not for NHERF-1. NaPi-2c mutants missing the C terminus were still able to interact with NHERF-1, so an unknown inter- nal motif of NaPi-2c was proposed to interact with the first PDZ * This work was supported, in whole or in part, by National Institutes of Health Grants R01 DK066029 (M. L., Y. C., L. L., H. G., and E. G.), P41-RRO3155 (to E. G. and L. L.), P50-GM076516 (to E. G. and L. L.), and K08 DK080989 (to J. B.). □ S The on-line version of this article (available at http://www.jbc.org) contains supplemental Figs. S1–S8. 1 Both authors contributed equally to this work. 2 To whom correspondence should be addressed: University of Colorado Denver, 12700 East 19th Ave., Research 2, Rm. 7002, Aurora, CO 80045. Tel.: 303-724-4825; Fax: 303-724-4868; E-mail: [email protected]. 3 The abbreviations used are: Na/P i , sodium-dependent phosphate; NHERF, sodium-hydrogen exchange-regulating factor; BBM, brush border mem- brane; PTH, parathyroid hormone; OK, opossum kidney; FLIM, fluorescence lifetime imaging; Cer, Cerulean. THE JOURNAL OF BIOLOGICAL CHEMISTRY VOL. 286, NO. 17, pp. 15032–15042, April 29, 2011 © 2011 by The American Society for Biochemistry and Molecular Biology, Inc. Printed in the U.S.A. 15032 JOURNAL OF BIOLOGICAL CHEMISTRY VOLUME 286 • NUMBER 17 • APRIL 29, 2011 at Univ of California - Irvine, on August 5, 2011 www.jbc.org Downloaded from http://www.jbc.org/content/suppl/2011/03/09/M110.199752.DC1.html Supplemental Material can be found at:
Transcript of Role of PDZK1 Protein in Apical Membrane Expression of Renal Sodium-coupled Phosphate Transporters

Role of PDZK1 Protein in Apical Membrane Expression ofRenal Sodium-coupled Phosphate Transporters*□S
Received for publication, November 2, 2010, and in revised form, February 17, 2011 Published, JBC Papers in Press, March 9, 2011, DOI 10.1074/jbc.M110.199752
Hector Giral‡1, Luca Lanzano§1, Yupanqui Caldas‡, Judith Blaine‡, Jill W. Verlander¶, Tim Lei�, Enrico Gratton§,and Moshe Levi‡2
From the ‡Department of Medicine, University of Colorado, Aurora, Colorado 80045, the §Laboratory for Fluorescence Dynamics,University of California, Irvine, California 92697, the ¶Department of Medicine, Division of Nephrology, Hypertension, andTransplantation, University of Florida, Gainesville, Florida 32610, and the �Department of Electrical Engineering, University ofColorado Denver, Denver, Colorado 80202
The sodium-dependent phosphate (Na/Pi) transportersNaPi-2a andNaPi-2c play amajor role in the renal reabsorptionof Pi. The functional need for several transporters accomplish-ing the same role is still not clear. However, the fact that thesetransporters show differential regulation under dietary andhormonal stimuli suggests different roles in Pi reabsorption.The pathways controlling this differential regulation are stillunknown, but one of the candidates involved is theNHERF fam-ily of scaffolding PDZ proteins. We propose that differences inthemolecular interactionwithPDZproteins are relatedwith thedifferential adaptation of Na/Pi transporters. Pdzk1�/� miceadapted to chronic low Pi diets showed an increased expressionof NaPi-2a protein in the apical membrane of proximal tubulesbut impaired up-regulation of NaPi-2c. These results suggest animportant role for PDZK1 in the stabilization of NaPi-2c in theapicalmembrane.We studied the specific protein-protein inter-actions of Na/Pi transporters with NHERF-1 and PDZK1 byFRET. FRET measurements showed a much stronger interac-tion of NHERF-1 with NaPi-2a than with NaPi-2c. However,both Na/Pi transporters showed similar FRET efficiencies withPDZK1. Interestingly, in cells adapted to low Pi concentrations,there were increases inNaPi-2c/PDZK1 andNaPi-2a/NHERF-1interactions. The differential affinity of the Na/Pi transportersfor NHERF-1 and PDZK1 proteins could partially explain theirdifferential regulation and/or stability in the apical membrane.In this regard, direct interaction between NaPi-2c and PDZK1seems to play an important role in the physiological regulationof NaPi-2c.
The type II sodium-coupled phosphate (Na/Pi)3 transportersare themolecules responsible for tubular reabsorption of Pi andare the target of hormonal and nonhormonal mechanisms that
control phosphate homeostasis. NaPi-2a (NaPiIIa) is responsi-ble for �70% of the Pi reabsorbed in the adult kidney of mice,whereas NaPi-2c (NaPiIIc) handles the remaining 30% (1, 2). Alow dietary Pi intake induces an increase of Pi reabsorption inthe proximal tubule mediated by augmented apical expressionof NaPi-2a andNaPi-2c transporters and consequent increasedPi uptake (3–6).
Despite sharing a very similar molecular structure, NaPi-2aand NaPi-2c exhibit an increasing list of physiological differ-ences. For example, whereasNaPi-2a is electrogenic, NaPi-2c iselectroneutral (4, 7). In addition, both transporters participatein the renal adaptation to changes in dietary Pi with differentcharacteristics. In response to a high Pi intake, NaPi-2a abun-dance decreases quickly (less than 1 h), internalization takesplace in amicrotubule-independentway, andmolecules are tar-geted to the lysosomes via endosomes (8, 9). In contrast, undera high Pi intake, NaPi-2c abundance decreases slowly (4 h),molecules are internalized through a microtubule-dependentpathway, and rather than being degraded, they are accumulatedin a subapical compartment (10). Similar differences have beenalso reported for the response of NaPi-2a and NaPi-2c to PTH(11).Some of these differences may be explained by the type and
number of proteins with which the transporters interact. Forexample, it is well known thatNaPi-2a is integrated in a series ofmacromolecular complexes whose architecture is based onPDZ (PSD-95, discs-large, and ZO-1) protein interactions (12–19). NaPi-2a participates in this complex by means of a class IPDZ-binding site located at its C terminus, comprising its lastthree amino acids (TRL).Using two-hybrid systems and co-immunoprecipitation, it
has been previously determined that NaPi-2c interacts with thePDZ protein sodium-hydrogen exchange-regulating factor 1(NHERF-1) and 3 (NHERF-3 or PDZK1) (15). These interac-tions were surprising because NaPi-2c does not have a proto-typical PDZ binding motif in the C terminus (QQL). NaPi-2c/PDZK1 interaction was stronger than NaPi-2c/NHERF-1interaction by two-hybrid system assays, but co-immunopre-cipitation was more robust for NHERF-1 than for PDZK1.Moreover, it was proposed than NaPi-2c interaction was medi-ated through the C-terminal end of the transporter for PDZK1but not for NHERF-1. NaPi-2cmutantsmissing the C terminuswere still able to interact with NHERF-1, so an unknown inter-nalmotif ofNaPi-2cwas proposed to interactwith the first PDZ
* This work was supported, in whole or in part, by National Institutes of HealthGrants R01 DK066029 (M. L., Y. C., L. L., H. G., and E. G.), P41-RRO3155 (to E. G.and L. L.), P50-GM076516 (to E. G. and L. L.), and K08 DK080989 (to J. B.).
□S The on-line version of this article (available at http://www.jbc.org) containssupplemental Figs. S1–S8.
1 Both authors contributed equally to this work.2 To whom correspondence should be addressed: University of Colorado
Denver, 12700 East 19th Ave., Research 2, Rm. 7002, Aurora, CO 80045. Tel.:303-724-4825; Fax: 303-724-4868; E-mail: [email protected].
3 The abbreviations used are: Na/Pi, sodium-dependent phosphate; NHERF,sodium-hydrogen exchange-regulating factor; BBM, brush border mem-brane; PTH, parathyroid hormone; OK, opossum kidney; FLIM, fluorescencelifetime imaging; Cer, Cerulean.
THE JOURNAL OF BIOLOGICAL CHEMISTRY VOL. 286, NO. 17, pp. 15032–15042, April 29, 2011© 2011 by The American Society for Biochemistry and Molecular Biology, Inc. Printed in the U.S.A.
15032 JOURNAL OF BIOLOGICAL CHEMISTRY VOLUME 286 • NUMBER 17 • APRIL 29, 2011
at Univ of C
alifornia - Irvine, on August 5, 2011
ww
w.jbc.org
Dow
nloaded from
http://www.jbc.org/content/suppl/2011/03/09/M110.199752.DC1.html Supplemental Material can be found at:

motif of NHERF-1. Both confocal and total internal reflectionmicroscopy showed that NaPi-2c colocalized with PDZK1 andNHERF-1 in the apical microvilli.The depletion of PDZK1 expression in the knock-out mouse
model (Pdzk1�/� mice) does not induce major changes in theexpression and regulation of NaPi-2a in the proximal tubule inresponse to acute or chronic alterations in dietary Pi (20). How-ever, there was a slight reduction in NaPi-2a apical membraneprotein expression when mice were fed a high phosphate diet,presumably inducing a higher phosphate excretion rate in thiscondition.The functional significance of theNaPi-2c and PDZK1 inter-
actions, however, remains unknown. The purpose of the pres-ent study was to determine whether the absence of PDZK1modulates NaPi-2c trafficking and apical membrane expres-sion and also to determine whether these effects are specific forthe NaPi-2c transporter. In an attempt to determine the role ofPDZ proteins in the differential regulation of the Na/Pi trans-porters, we studied the Pdzk1�/� mouse model under chronicdietary Pi conditions.
EXPERIMENTAL PROCEDURES
Animal Procedures—The experiments were performed inPdzk1�/� (PDZK1/NHERF-3 KO), and corresponding age andsex-matched wild type control mice were obtained from Jack-son Laboratories (Bar Harbor,ME). This knock-out animal wasgenerated by the laboratory of David Silver (21) in a way similarto the KO described before by Kocher et al. (22). Expression ofPDZK1 protein was tested by Western blot (with a polyclonalrabbit anti-PDZK1 kindly provided by David Silver), confirm-ing complete abolition in the Pdzk1�/� (supplemental Fig. S1).The animals were maintained on a 12-h light/12-h dark cycle.The mice were acclimated on regular chow diet, and they werethen fed ad libitum a high Pi (1.5% Pi) or a low Pi (0.1% Pi) diet(Harlan Teklad, Wisconsin) for 7 days. We studied 24 mice foreach experimental group including female andmale animals forbiochemical studies in three independent experiments. For invivo perfusion fixation, we used n � 10 mice for immunohisto-chemistry and immunofluorescence microscopy studies, all ofthem fed a low Pi diet. The animal studies were approved by theAnimal Care and Use Committee at the University of ColoradoDenver.Brush Border Membrane (BBM) Isolation—The mice were
anesthetized via an intraperitoneal injection of 50 mg/kgpentobarbital sodium (Pentothal; Abbott Laboratories). Afterclamping of the renal vessels, blood was drawn for biochemicalanalysis, and the kidneys were removed for BBM isolation.Kidney slices from two mice were combined in 7.5 ml of
isolation buffer consisting of 15 mM Tris�HCl, pH 7.4, 300 mM
mannitol, 5 mM EGTA, and one Roche Complete inhibitor tab-let/250ml of buffer. The kidney slices were homogenized usinga Potter-Elvejham homogenizer with 8–10 rapid strokes. Analiquot of the total homogenate fraction was taken apart forfurther analysis. BBM was prepared by a double Mg2� precipi-tation. For the firstMg2� precipitation,MgCl2was added to thehomogenate (final concentration, 15mM), and the solution wasshaken every 5 min on ice for 20 min before centrifugation at2,500� g for 15min. The pellet obtained in this step was resus-
pended and stored for analysis as Non-BBM fraction. This frac-tion shows enrichment in all the other cellular membranesapart from the apical plasmamembrane, including Golgi appa-ratus, endosomes, and other trafficking compartments. Thesupernatant was subjected to a secondMg2� precipitation, andfrom the resulting supernatant, the BBMwas recovered by cen-trifugation at 38,000 � g for 40 min.Western Blot Analysis—BBM proteins (20 or 30 �g), total
membranes (60 �g), and non-BBM (40 �g) fractions were sep-arated in 7.5% SDS-PAGE gels and transferred onto nitrocellu-losemembranes. Themembraneswere blockedwith 5%milk inPBS with 0.1% Tween 20 (PBST) before incubation with pri-mary antibodies overnight at 4 °C. Polyclonal rabbit anti-NaPi-2a (23) and polyclonal rabbit anti-NaPi-2c produced byDavids Biotechnology were used at 1:5000 dilution. The speci-ficity of the anti-NaPi-2c antibody was tested by blocking pep-tide assay (supplemental Fig. S2). Commercialmousemonoclo-nal antibodyAC-15was used at 1:10,000 dilution (Sigma). Afterthree washes with PBST, the membranes were incubated withHRP-linked secondary antibodies diluted 1:5,000 for 1 h fol-lowed for several washes with PBST. The membranes wereincubatedwith SuperSignalWest PicoChemiluminescent Sub-strate (Pierce) following the manufacturer’s instructions. Theimages were acquired and analyzed by densitometry using aBiospectrum 500 imaging system (UVP).RNA Isolation and Real TimeQuantitative PCR—Total RNA
was isolated after homogenization of kidney slices using theQiagen RNeasy mini kit. cDNA was synthesized using iScriptcDNA Synthesis (Bio-Rad), and themRNA level was quantifiedusing a Bio-Rad iCyCler real time PCR machine. NaPi-2a- andNaPi-2c-specific primerswere used to quantify theNa/Pi trans-porters as described before (23). Cyclophilin A was used as aninternal control, and the amount of RNA was calculated by thecomparative threshold cycle method as recommended by themanufacturer. All of the data were calculated from duplicatereactions.Immunofluorescence Microscopy—Mice anesthetized with
isoflurane inhalent were perfused in vivo with PBS for 30 s fol-lowed by 2% paraformaldehyde-lysine-periodate for 8 minthrough cardiac puncture under controlled pressure condi-tions. Kidney samples were immersed in paraformaldehyde-lysine-periodate at 4 °C for 2 h and then rinsed with serial dilu-tions of sucrose (5, 10, and 25%) solutions. Kidney slices wereembedded in optimum cutting temperature solution and fro-zen in liquid nitrogen. Sections 5 �m thick were cut on a Leicacryostat and stored at �20 °C until ready to use. The sectionswere blocked for 30 min with PBS containing 0.1% TritonX-100 and 10% goat serum. Primary antibodies were incubatedwith the same solution overnight at 4 °C. Polyclonal rabbit anti-NaPi-2a and anti-NaPi-2c were used at 1:500 and 1:100, respec-tively. The specificity of the signal obtained with anti-NaPi-2cwas tested by peptide blocking assay (supplemental Fig. S2).After three washes with PBS-TritonX-100, secondary antibodyAlexa-Fluor 568was incubated for 1 h togetherwith phalloidin-Alexa 488 to stain actin filaments. Imaging was performed on aZeiss 510 LSM laser scanning confocal microscope (Carl ZeissMicroimaging, Thornwood, NY).
PDZK1 Regulation of NaPi-2c Transporter
APRIL 29, 2011 • VOLUME 286 • NUMBER 17 JOURNAL OF BIOLOGICAL CHEMISTRY 15033
at Univ of C
alifornia - Irvine, on August 5, 2011
ww
w.jbc.org
Dow
nloaded from
Immunohistochemistry—Slices of kidney, perfusion-fixed asdescribed above, were immersed in paraformaldehyde-lysine-periodate at 4 °C overnight, then rinsed in PBS, dehydrated in agraded series of ethanols, and infiltrated and embedded in pol-yester wax (polyethylene glycol 400 distearate (Polysciences,Warrington, PA), 10% cetyl alcohol).Sections 3 �m thick were dewaxed in a graded series of etha-
nols, rinsed in PBS, and incubated in Trilogy antigen retrievalsolution (Cell Marque, Sacramento, CA) for 1 h at 95 °C. Thesections were washed in PBS, treated with 3% H2O2 and then5% normal goat serum in PBS, and incubated with the anti-NaPi-2c primary antibody diluted 1:2000 or 1:4000 or theNaPi-2a primary antibody diluted 1:4000 in PBS overnightat 4 °C. The samples were washed, exposed to anti-rabbitpolymer-linked peroxidase-conjugated secondary antibody(MACH2 rabbit, Biocare Medical, Concord, CA), washed,reacted with diaminobenzidine (Vector Laboratories, Burlin-game, CA) for 5 min, washed in distilled water, dehydrated ingraded ethanols followed by xylene, and mounted on glassslides with Eukitt mounting medium (Hawthorne, NY). Thesections were photographed using a Nikon LaboPhot-2 micro-scope equipped with a Nikon DS-5 M digital color camera andNIS Elements software (Nikon USA, Melville, NY).PlasmaandUrineAnalysis—Blood sampleswere collected in
heparin containing tubes during sacrifice. Spot urine was col-lected in animals adapted toPi diets for 1week. Plasmaobtainedafter centrifugation andurine sampleswere analyzed for Pi con-centrations by using the commercial kit Stanbio Liqui-UV(Stanbio, Boerne, TX). Creatinine concentration in urine wasdetermined using A QuantiChrom creatinine assay (BioAssaySystems, Hayward, CA). FGF-23 (C-terminal) and intact PTHwere determined with specific ELISA kits from Immunotopics(San Clemente, CA). Eight or nine animals/group were used inthese assays.Cell Culture and Transfection—Opossum kidney (OK) cells
(OKP clone (24)) were grown in DMEM/F-12 supplementedwith 10% fetal bovine serum, penicillin, streptomycin, andL-glutamine in 37 °CCO2 controlled 95%humidified incubator,as reported (25, 26). Transfections were achieved with Lipo-fectamine 2000 (Invitrogen) and cells at 90% confluency, fol-lowing themanufacturer’s instructions. OK cells expressing thefluorescent fusion proteinswere grown on poly-L-lysine-coatedeight-well Lab-Tek chambered coverglass (Nunc). To test thechronic adaptive response of OK cells to varying Pi content inthe medium, transfected cells were incubated for 24 h beforethe measurement in a medium containing a concentration of 1mM Pi (normal), 0.1 mM Pi (low), and 2 mM Pi (high), respec-tively. The measurements were performed 24–48 h aftertransfection.Microscope Setup—A Zeiss LSM 510 confocal microscope
(Jena, Germany), equipped with a Confocor 3 unit and theMETA detector was used for the images. Fluorescence lifetimeimaging (FLIM) was performed using a FLIMBox imaging sys-tem coupled to the microscope. The FLIMBox is a digital fre-quency domain setup capable of multi-harmonic analysiswhose details can be found elsewhere (27). A diode laser pulsedat a repetition rate of 20MHzwas used for the excitation at 445nm of the Cerulean (Cer) constructs with minimal YFP cross-
excitation. Emission intensity from Cerulean was collected inthe spectral window 470–495 nm. A solution of fluorescein atPH9 was used as a reference standard to calibrate the instru-mental response.Images were obtained in the 256 � 256 format (size variable
in the range 15–25�mdepending on the cell), with a pixel dwelltime of 12.5 �s and averaging over 20 frames. Fluorescentintensity was monitored during the acquisition to avoid arti-facts because of photobleaching (27). FLIMBox images contain-ing lifetime and intensity informationwere acquired using Sim-FCS software, whereas standard intensity images were saved inthe LSM format through the Zeiss LSM 510 software.Processing of FLIM-FRETData—All of the FLIM imageswere
analyzed in SimFCS using the so-called phasor approach (28–31), aimed to quantify FRET through the measurement of thelifetime of the donor (32, 33). The phasor represents the fluo-rescence decay in a Fourier transformed space. In our digitalfrequency domain approach, the modulation and phase mea-sured at each pixel of an image are used directly to determine thecoordinates of the phasor in this two-dimensional space. In thisexperiment, we analyzed the second harmonic component ofthe data, which corresponds to a frequency of 40 MHz. In fre-quency modulation technique, the optimal frequency for mea-suring a lifetime � is given approximately by 1/2�� (28). If wetake into account the range of lifetimes measured in our exper-iments (� � 3 ns for Cerulean (34) and � � 4 ns for the fluores-cein standard), the frequency of the second harmonic is closerto the optimal value.The phasor associated to a cell imaged with FLIMwas deter-
mined as the average phasor of the pixels corresponding to thecell image. The phasor of the autofluorescence was determinedby imaging nontransfected cells. The autofluorescence signalwas always less than 0.5% of the signal coming from transfectedcells. The phasor of the unquenched donor was determined byimaging cells transfected only with Cer-NaPi-2a (for the inter-action of NaPi-2a with NHERF-1 and PDZK-1) or Cer-NaPi-2c(for the interaction of NaPi-2c with NHERF-1 and PDZK-1).For each experiment, we collected multiple images of singlecells (from four to seven images) focusing at the level of theapicalmembrane. For each cell, we extracted the coordinates ofthe corresponding average phasor. The average of the phasorsof all the cells was assigned to the average position of theunquenched donor (Dunq). The same protocol was used tomeasure the phasor of cells co-transfected with both donor(Cer-NaPi-2a or Cer-NaPi-2c) and acceptor species (EYFP-NHERF-1 or EYFP-PDZK1) and incubated in media with dif-ferent Pi content.FRET Analysis in the Phasor Plot—The quantification of
FRET in the phasor plot is achieved by analyzing the phasorshift occurring between the two species of the donor and donorin the presence of the acceptor. Following the methoddescribed in Ref. 30, the phasors of the autofluorescence (af)and of the unquenched donor (Dunq) have been determined ineach experiment so that a trajectory of variable efficiency(0–100%) could be calculated (see supplemental Fig. S5). Apoint along this trajectory corresponds to a pure species ofdonor quenched (Dq) with FRET efficiency E.
PDZK1 Regulation of NaPi-2c Transporter
15034 JOURNAL OF BIOLOGICAL CHEMISTRY VOLUME 286 • NUMBER 17 • APRIL 29, 2011
at Univ of C
alifornia - Irvine, on August 5, 2011
ww
w.jbc.org
Dow
nloaded from

More generally, and especially in the case of intermolecularFRET (35), a pixel may contain a mixture of quenched andunquenched donors with fractions fq and funq, respectively. Inthis case, the phasor is a normalized linear combination of thephasors of Dq and Dunq (funqDunq � fqDq) and is located alongthe segment connecting them, at a distance from Dunq propor-tional to the fraction of interacting donors, fq (supplementalFig. S5).The efficiency trajectory was calculated for each experiment
based on the average position of the donor only (Dunq) and theautofluorescence in the phasor plot. As amatter of fact, the exper-imentalpositionsof thephasorsof thedonor-acceptor samplesdidnot lie along the efficiency trajectory. Indeed they were betterdescribed by a linear combination of quenched and unquencheddonor species. The quenched donor (Dq) position has been deter-mined as the intersection between a linear fit of the data and theefficiency trajectory, in awayanalogous to thatdescribed inRef. 31for a mixture of single exponential components. The position ofDq yields the value of efficiency E associated with the FRET inter-action. The fraction of interacting donors (fq) was then calculateddirectly fromthepositionof thedatapoints along the lineconnect-ingDunq andDq (supplemental Fig. S6).Statistical Analysis—The results are presented as the
means � S.E. for at least three independent experiments. Thedata were analyzed by analysis of variance and Student-New-man-Keul’s tests formultiple comparisons or by Student’s t testfor unpaired data between two groups. Statistical significance
was accepted at the p � 0.05 level. The symbols used in thegraphs are ns for not significant, * for p � 0.05, ** for p � 0.01,and *** for p � 0.001.
RESULTS
NaPi-2c Adaptation to a Low Pi Diet Is Impaired in PDZK1Knock-outMice—Renal BrushBorderMembraneVesicleswereisolated from wild type and Pdzk1�/� mice adapted to chroniclow (0.1%) and high (1.5%) Pi diets. Western blot analysisshowed that apical brush border membrane protein expressionofNaPi-2awas up-regulated under lowPi diets both inwild typeand Pdzk1�/� mice (Fig. 1). Pdzk1�/� mice demonstrated asignificantly impaired up-regulation of NaPi-2c protein levelscompared with the wild type animal under the same conditions(Fig. 1).Becausewe initially performed this study in female animals—
because of availability in our colony—wewanted to be sure thatthe described effects were not sex-dependent. We thereforerepeated the same experiments in male wild type control andPdzk1�/� mice. The same impaired up-regulation of NaPi-2coccurred in male Pdzk1�/� animals when compared with wildtype animals fed low Pi diets, whereas NaPi-2a up-regulationwas intact and normal (supplemental Fig. S3). These resultssuggested a differential involvement of PDZK1 in the adapta-tion of NaPi-2a versus NaPi-2c to low Pi diet.
There were no significant differences and notably noincreases in NaPi-2a or NaPi-2c mRNA abundance in adapta-
FIGURE 1. Brush Border Membrane Vesicles protein expression in WT and Pdzk1�/� female mice in response to chronic adaptation to high (1.5%) andlow (0.1%) Pi diets. NaPi-2a protein expression in BBM in Pdzk1�/� mice adapt normally to low Pi diets in a similar way as wild type animals. However, NaPi-2cshows impaired up-regulation to low Pi diet in Pdzk1�/� model.
FIGURE 2. mRNA expression of NaPi-2a and NaPi-2c. Kidney mRNA samples of wild type and Pdzk1�/� animals fed high and low Pi diets chronically wereanalyzed. Expression of NaPi-2a mRNA was unaffected in the Pdzk1�/� mice, whereas NaPi-2c mRNA expression undergoes a significant increase under low Pidiet treatments.
PDZK1 Regulation of NaPi-2c Transporter
APRIL 29, 2011 • VOLUME 286 • NUMBER 17 JOURNAL OF BIOLOGICAL CHEMISTRY 15035
at Univ of C
alifornia - Irvine, on August 5, 2011
ww
w.jbc.org
Dow
nloaded from
tion to low Pi diets in the wild type mice (Fig. 2). Nevertheless,the impaired regulation of NaPi-2c in the PDZK1 KO seems tobe independent of transcription because NaPi-2c mRNAexpression was significantly increased in the low Pi conditionin the Pdzk1�/� animals. We consider that increased mRNAexpression is a compensatory mechanism triggered by thereduced apical expression of the transporter. Exclusion of tran-scriptional regulation as a mechanism for the impaired regula-tion of NaPi-2c suggests that post-translational mechanismsare involved.To study how the depletion of PDZK1 was affecting the
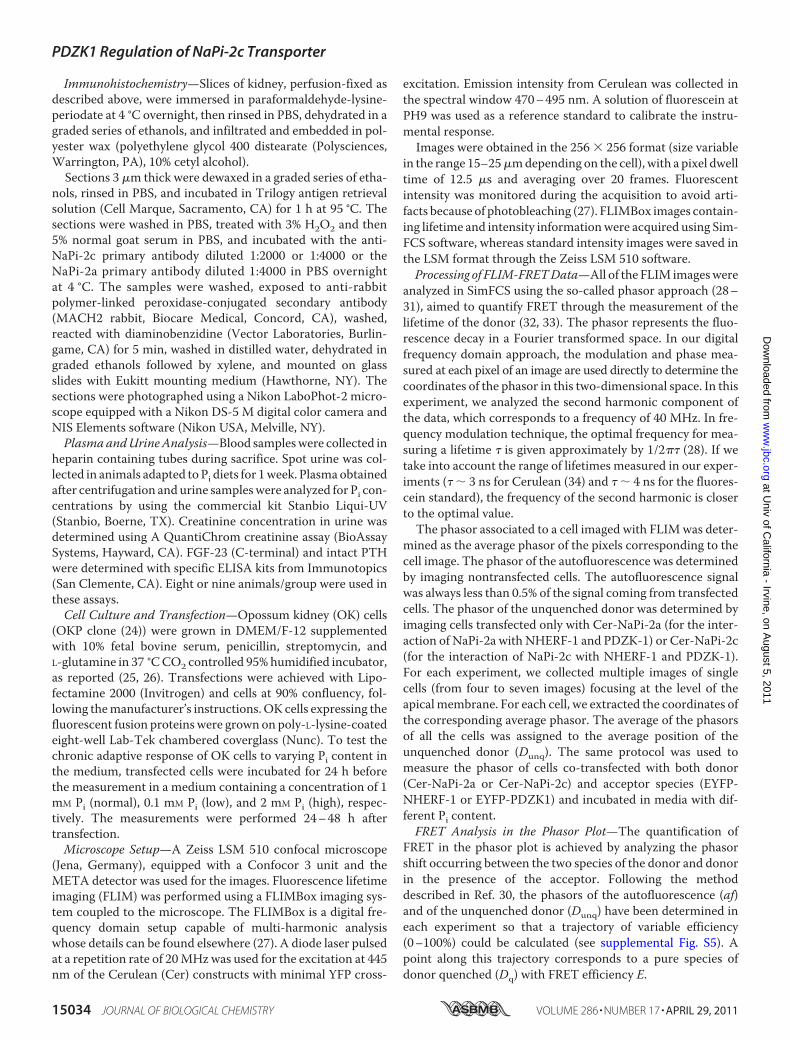
expression of NaPi-2c in the BBM, we tested the expression ofNaPi-2c protein in homogenates. Totalmembrane renal homo-genates, prepared as described under “Experimental Proce-dures,” were analyzed byWestern blot. In wild type animals fedlow Pi diets, both NaPi-2a and NaPi-2c undergo an increase inthe total protein expression (Fig. 3A).Pdzk1�/�mice are able toadapt properly in the case of NaPi-2a but show a significantlydeficient up-regulation of NaPi-2c.We also used the first Mg precipitation fraction of the BBM
isolation or non-BBM fraction to test the expression of theNa/Pi transporters. Therewere nomajor differences inNaPi-2aexpression betweenWT and Pdzk1�/� mice, although a signif-icant increase was observed in the KO mice under low Pi dietwhen compared with the wild type mice. NaPi-2c expressionwas clearly reduced also in this fraction in the KO animalsadapted to low Pi diets (Fig. 3B).In mice fed a low Pi diet, immunofluorescence and immuno-
histochemistry studies demonstrated significant differences inthe effect of PDZK1 knock-out on the localization of NaPi-2c
protein. NaPi-2a immunolabel was present in proximal tubulesthroughout the renal cortex, primarily in the brush border, andthere were no differences between WT and Pdzk1�/� mice(data not shown). Immunostaining was more intense in convo-luted proximal tubules in the cortical labyrinth than in straightproximal tubules in the medullary rays. These results were inaccordance with the previous study by Capuano et al. (20).In contrast, the distribution of NaPi-2c immunoreactivity
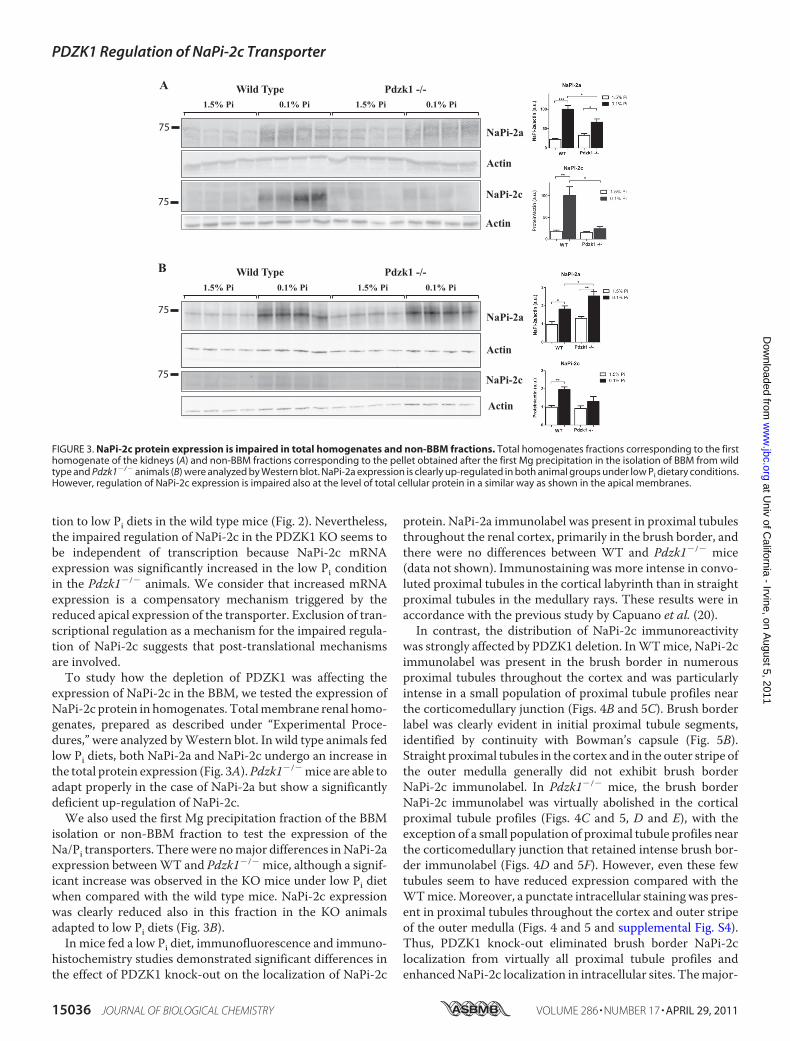
was strongly affected by PDZK1 deletion. InWTmice, NaPi-2cimmunolabel was present in the brush border in numerousproximal tubules throughout the cortex and was particularlyintense in a small population of proximal tubule profiles nearthe corticomedullary junction (Figs. 4B and 5C). Brush borderlabel was clearly evident in initial proximal tubule segments,identified by continuity with Bowman’s capsule (Fig. 5B).Straight proximal tubules in the cortex and in the outer stripe ofthe outer medulla generally did not exhibit brush borderNaPi-2c immunolabel. In Pdzk1�/� mice, the brush borderNaPi-2c immunolabel was virtually abolished in the corticalproximal tubule profiles (Figs. 4C and 5, D and E), with theexception of a small population of proximal tubule profiles nearthe corticomedullary junction that retained intense brush bor-der immunolabel (Figs. 4D and 5F). However, even these fewtubules seem to have reduced expression compared with theWTmice.Moreover, a punctate intracellular stainingwas pres-ent in proximal tubules throughout the cortex and outer stripeof the outer medulla (Figs. 4 and 5 and supplemental Fig. S4).Thus, PDZK1 knock-out eliminated brush border NaPi-2clocalization from virtually all proximal tubule profiles andenhancedNaPi-2c localization in intracellular sites. Themajor-
FIGURE 3. NaPi-2c protein expression is impaired in total homogenates and non-BBM fractions. Total homogenates fractions corresponding to the firsthomogenate of the kidneys (A) and non-BBM fractions corresponding to the pellet obtained after the first Mg precipitation in the isolation of BBM from wildtype and Pdzk1�/� animals (B) were analyzed by Western blot. NaPi-2a expression is clearly up-regulated in both animal groups under low Pi dietary conditions.However, regulation of NaPi-2c expression is impaired also at the level of total cellular protein in a similar way as shown in the apical membranes.
PDZK1 Regulation of NaPi-2c Transporter
15036 JOURNAL OF BIOLOGICAL CHEMISTRY VOLUME 286 • NUMBER 17 • APRIL 29, 2011
at Univ of C
alifornia - Irvine, on August 5, 2011
ww
w.jbc.org
Dow
nloaded from
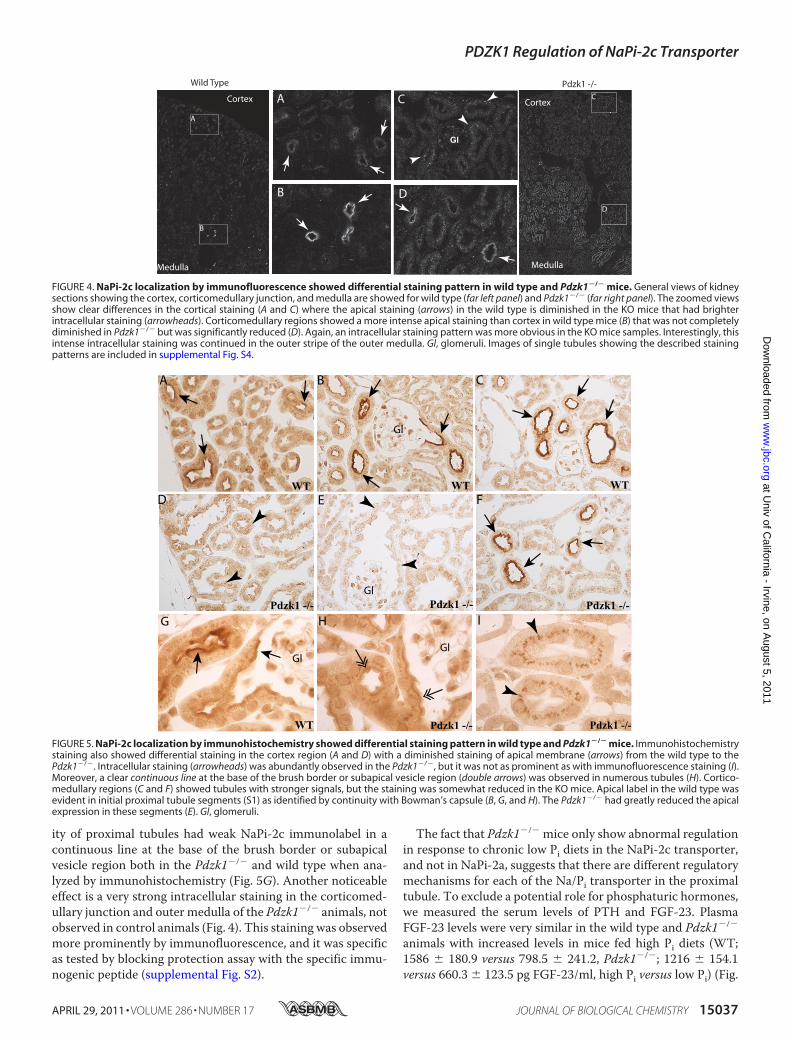
ity of proximal tubules had weak NaPi-2c immunolabel in acontinuous line at the base of the brush border or subapicalvesicle region both in the Pdzk1�/� and wild type when ana-lyzed by immunohistochemistry (Fig. 5G). Another noticeableeffect is a very strong intracellular staining in the corticomed-ullary junction and outer medulla of the Pdzk1�/� animals, notobserved in control animals (Fig. 4). This staining was observedmore prominently by immunofluorescence, and it was specificas tested by blocking protection assay with the specific immu-nogenic peptide (supplemental Fig. S2).
The fact that Pdzk1�/� mice only show abnormal regulationin response to chronic low Pi diets in the NaPi-2c transporter,and not in NaPi-2a, suggests that there are different regulatorymechanisms for each of the Na/Pi transporter in the proximaltubule. To exclude a potential role for phosphaturic hormones,we measured the serum levels of PTH and FGF-23. PlasmaFGF-23 levels were very similar in the wild type and Pdzk1�/�
animals with increased levels in mice fed high Pi diets (WT;1586 � 180.9 versus 798.5 � 241.2, Pdzk1�/�; 1216 � 154.1versus 660.3 � 123.5 pg FGF-23/ml, high Pi versus low Pi) (Fig.
FIGURE 4. NaPi-2c localization by immunofluorescence showed differential staining pattern in wild type and Pdzk1�/� mice. General views of kidneysections showing the cortex, corticomedullary junction, and medulla are showed for wild type (far left panel) and Pdzk1�/� (far right panel). The zoomed viewsshow clear differences in the cortical staining (A and C) where the apical staining (arrows) in the wild type is diminished in the KO mice that had brighterintracellular staining (arrowheads). Corticomedullary regions showed a more intense apical staining than cortex in wild type mice (B) that was not completelydiminished in Pdzk1�/� but was significantly reduced (D). Again, an intracellular staining pattern was more obvious in the KO mice samples. Interestingly, thisintense intracellular staining was continued in the outer stripe of the outer medulla. Gl, glomeruli. Images of single tubules showing the described stainingpatterns are included in supplemental Fig. S4.
FIGURE 5. NaPi-2c localization by immunohistochemistry showed differential staining pattern in wild type and Pdzk1�/� mice. Immunohistochemistrystaining also showed differential staining in the cortex region (A and D) with a diminished staining of apical membrane (arrows) from the wild type to thePdzk1�/�. Intracellular staining (arrowheads) was abundantly observed in the Pdzk1�/�, but it was not as prominent as with immunofluorescence staining (I).Moreover, a clear continuous line at the base of the brush border or subapical vesicle region (double arrows) was observed in numerous tubules (H). Cortico-medullary regions (C and F) showed tubules with stronger signals, but the staining was somewhat reduced in the KO mice. Apical label in the wild type wasevident in initial proximal tubule segments (S1) as identified by continuity with Bowman’s capsule (B, G, and H). The Pdzk1�/� had greatly reduced the apicalexpression in these segments (E). Gl, glomeruli.
PDZK1 Regulation of NaPi-2c Transporter
APRIL 29, 2011 • VOLUME 286 • NUMBER 17 JOURNAL OF BIOLOGICAL CHEMISTRY 15037
at Univ of C
alifornia - Irvine, on August 5, 2011
ww
w.jbc.org
Dow
nloaded from

6C). However, plasma PTH levels showed significant differ-ences between wild type and Pdzk1�/� animals (Fig. 6B).Pdzk1�/� animals fed high Pi diets have lower PTH levels thanwild type animals (WT, 243.7 � 35.1 versus Pdzk1�/�, 107.3 �35.8 pg of PTH/ml; p � 0.0164). Animals fed low Pi dietsshowed similar differences, which, however, were not statisti-cally significant (WT, 104.7 � 38.15 versus Pdzk1�/�, 45.48 �17.17 pg of PTH/ml; p � not significant).NaPi-2c and NaPi-2a Interactions with PDZK1 and
NHERF-1 Measured by FLIM-FRET—The pronounced lack ofregulation of NaPi-2c observed in the PDZK1 null mice sug-gests a more important role of PDZK1 for NaPi-2c thanNaPi-2a function. Differences in the affinity or specificity of theinteractions with PDZ proteins could explain the oppositeeffects observed in this KO model. We investigated these dif-ferences through the measurement of the proximity of fluores-cent protein-labeled Na/Pi transporters and PDZ proteinsexpressed in living OK cells by FRET.When FRET occurs (generally if the two fluorophores are
within 10 nm), the fluorescence intensity of the acceptor mayincrease at the expenses of the intensity of the donor. Theoccurrence of FRET also induces a reduction in the excitedstate lifetime of the donor. Because themeasure of lifetime doesnot depend in general on the concentration of the fluorophoresin the sample, it often provides several advantages with respectto intensity-based methods for the measurement of FRET.Methods formeasuring fluorescence lifetime are generally clas-sified as time or frequency domain methods (36). Here we useda digital frequency domain setup, the FLIMBox (27), coupled toa confocal laser scanning microscope, to perform FLIM.The analysis of lifetime data appears to be complex and
somewhat misleading, especially when the decay of theobserved species is characterized by the sum of two or moreexponentials (as is the case of fluorescent proteins). To addressthis issue, we analyzed and interpreted FLIM data using theconcept of the phasor (28–31). Single-exponential and multi-exponential decays correspond to well defined single phasors,the analysis of which does not require fitting data to exponen-tial components. The FRET process induces a reduction in thelifetime of the donor, and in the phasor space it corresponds toa shifting of the phasor of the donor. Generally, in the case ofintermolecular FRET, the observed shift depends on the effi-ciency of the interaction and the fraction of molecules under-going FRET.
Previous studies have shown interaction of bothNaPi-2a andNaPi-2c with PDZK1 andNHERF-1 by using biochemical tech-niques (15). Here we used the FLIM-FRET approach to studythe putative differential affinity interactions of the Na/Pitransporters.Figs. 7 and 8 show representative images of OK cells trans-
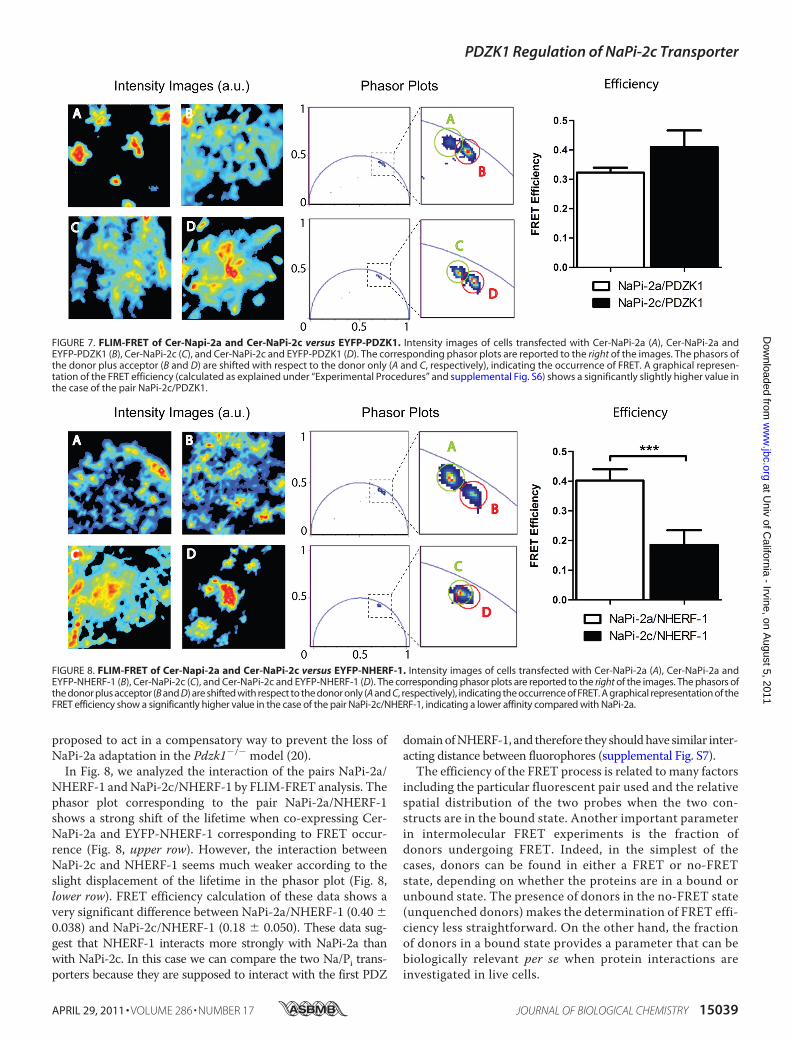
fected with donor only and with donor plus acceptor species,for different pairs of NaPi-PDZ proteins. The correspondingphasor plot is reported to the right side of the images containingthe points associated with the pixels of the two images. Becauseof noise, experimental data are scattered around the averageposition of the phasor. In the zoomed region are highlightedthe two clusters corresponding to the two cells. The phasorof the cell co-transfected with donor and acceptor species isshifted toward the direction of lower lifetimes showing theoccurrence of FRET.Intensity images and the corresponding phasor plots of
transfected cells to study the interactions of the pairs NaPi-2a/PDZK1 and NaPi-2c/PDZK1 are shown in Fig. 7. FRET isobserved between NaPi-2a and PDZK1 as shown by the shift ofthe lifetime when comparing Cer-NaPi-2a (donor) with Cer-NaPi-2a/EYFP-PDZK1 (donor/acceptor) in the phasor plot(Fig. 7,upper row). The pairNaPi-2c/PDZK1 also showedFREToccurrence with a similar shift in the phasor plot (Fig. 7, lowerrow). The FRET efficiency was quantified for each pair of pro-teins following the procedure described under “ExperimentalProcedures.” FRET efficiency of NaPi-2c/PDZK1 (0.41 �0.0017) is significantly higher than NaPi-2a/PDZK1 efficiency(0.32� 0.0005). However, we have to be cautious when consid-ering that NaPi-2c has a stronger interaction with PDZK1 thanNaPi-2a. In this case, the two transporters interact with differ-ent PDZ domains of PDZK1, and most likely they will be atdifferent distances, one of the factors that most drasticallychange FRET efficiency (supplemental Fig. S7). Both transport-ers showed robust interaction with PDZK1 in accordance withprevious studies that used diverse biochemical techniques(12–15).Because the lack of regulation by low Pi diet of NaPi-2c in the
Pdzk1�/� mice cannot be explained by differential affinityinteractions with PDZK1, we decided to test another PDZ pro-tein. NHERF-1 has been shown to play an important role in theregulation of NaPi-2a (37–40). The interaction of NHERF-1with both NaPi-2a and NaPi-2c was determined by using dif-ferent biochemical techniques (12, 13, 15). NHERF-1 has been
FIGURE 6. Plasma levels of PTH show significant changes between wild type and Pdzk1�/� mice. Phosphate, PTH, and FGF-23 hormone levels werequantified in plasma samples of wild type and Pdzk1�/� animals fed high and low Pi diets. Pi and FGF-23 did not show significant differences between wild typeand KO mice. However, PTH levels were significantly reduced in the KO mice in both dietary conditions. ns, not significant.
PDZK1 Regulation of NaPi-2c Transporter
15038 JOURNAL OF BIOLOGICAL CHEMISTRY VOLUME 286 • NUMBER 17 • APRIL 29, 2011
at Univ of C
alifornia - Irvine, on August 5, 2011
ww
w.jbc.org
Dow
nloaded from
proposed to act in a compensatory way to prevent the loss ofNaPi-2a adaptation in the Pdzk1�/� model (20).
In Fig. 8, we analyzed the interaction of the pairs NaPi-2a/NHERF-1 andNaPi-2c/NHERF-1 by FLIM-FRET analysis. Thephasor plot corresponding to the pair NaPi-2a/NHERF-1shows a strong shift of the lifetime when co-expressing Cer-NaPi-2a and EYFP-NHERF-1 corresponding to FRET occur-rence (Fig. 8, upper row). However, the interaction betweenNaPi-2c and NHERF-1 seems much weaker according to theslight displacement of the lifetime in the phasor plot (Fig. 8,lower row). FRET efficiency calculation of these data shows avery significant difference between NaPi-2a/NHERF-1 (0.40 �0.038) and NaPi-2c/NHERF-1 (0.18 � 0.050). These data sug-gest that NHERF-1 interacts more strongly with NaPi-2a thanwith NaPi-2c. In this case we can compare the two Na/Pi trans-porters because they are supposed to interact with the first PDZ
domainofNHERF-1, and therefore they shouldhave similar inter-acting distance between fluorophores (supplemental Fig. S7).The efficiency of the FRET process is related to many factors
including the particular fluorescent pair used and the relativespatial distribution of the two probes when the two con-structs are in the bound state. Another important parameterin intermolecular FRET experiments is the fraction ofdonors undergoing FRET. Indeed, in the simplest of thecases, donors can be found in either a FRET or no-FRETstate, depending on whether the proteins are in a bound orunbound state. The presence of donors in the no-FRET state(unquenched donors) makes the determination of FRET effi-ciency less straightforward. On the other hand, the fractionof donors in a bound state provides a parameter that can bebiologically relevant per se when protein interactions areinvestigated in live cells.
FIGURE 7. FLIM-FRET of Cer-Napi-2a and Cer-NaPi-2c versus EYFP-PDZK1. Intensity images of cells transfected with Cer-NaPi-2a (A), Cer-NaPi-2a andEYFP-PDZK1 (B), Cer-NaPi-2c (C), and Cer-NaPi-2c and EYFP-PDZK1 (D). The corresponding phasor plots are reported to the right of the images. The phasors ofthe donor plus acceptor (B and D) are shifted with respect to the donor only (A and C, respectively), indicating the occurrence of FRET. A graphical represen-tation of the FRET efficiency (calculated as explained under “Experimental Procedures” and supplemental Fig. S6) shows a significantly slightly higher value inthe case of the pair NaPi-2c/PDZK1.
FIGURE 8. FLIM-FRET of Cer-Napi-2a and Cer-NaPi-2c versus EYFP-NHERF-1. Intensity images of cells transfected with Cer-NaPi-2a (A), Cer-NaPi-2a andEYFP-NHERF-1 (B), Cer-NaPi-2c (C), and Cer-NaPi-2c and EYFP-NHERF-1 (D). The corresponding phasor plots are reported to the right of the images. The phasors ofthe donor plus acceptor (B and D) are shifted with respect to the donor only (A and C, respectively), indicating the occurrence of FRET. A graphical representation of theFRET efficiency show a significantly higher value in the case of the pair NaPi-2c/NHERF-1, indicating a lower affinity compared with NaPi-2a.
PDZK1 Regulation of NaPi-2c Transporter
APRIL 29, 2011 • VOLUME 286 • NUMBER 17 JOURNAL OF BIOLOGICAL CHEMISTRY 15039
at Univ of C
alifornia - Irvine, on August 5, 2011
ww
w.jbc.org
Dow
nloaded from

We followed this approach to study the behavior of the inter-actions between Na/Pi transporters and PDZ proteins underdifferent Pi concentrations. The FRET efficiency measuredfrom cells adapted to different contents of Pi (2, 1, and 0.1 mM)in the extracellularmediumdid not change significantly for anyof the Na/Pi-PDZ protein pairs under study. Instead, a signifi-cant variation was observed in some cases in the fraction ofinteracting donors. In response to low Pi (0.1 mM) concentra-tions, a significant increase in the fraction of interacting donorsfor NaPi-2c/PDZK1 but not for NaPi-2a/PDZK1 was observed(Fig. 9, upper panels). On the other hand, for the interactionwith NHERF-1 under low Pi, we observed an opposite behaviorwith a significant increase in the fraction of interacting donorsfor NaPi-2a/NHERF-1 but not for NaPi-2c/NHERF-1 (Fig. 9,lower panels).In our opinion, these findings highlight the importance of the
specific interactions NaPi-2a/NHERF-1 and NaPi-2c/PDZK1during the response to a dietary change of Pi. When cells areadapted to a reduced concentration of Pi, increased fractions ofNaPi-2a andNaPi-2c are found in a bound state with NHERF-1and PDZK1, respectively. These results supporting a moreimportant role for PDZK1 in the adaptation to lowPi ofNaPi-2care in agreement with the results obtained with the Pdzk1�/�
model. The low affinity interactions showed between NaPi-2cand NHERF-1 would agree also with the lack of compensatorymechanism in the adaptation in the Pdzk1�/� model, in con-trast to the effects on NaPi-2a.
DISCUSSION
The scaffolding-like PDZ proteins have been involved in theregulation of numerous receptor and transporter proteins (41–46). In the case of the renal Na/Pi transporters, NaPi-2a interact
with and are susceptible to be regulated by several PDZproteinsincluding the NHERF family members (NHERF-1, 2, 3, and 4)(12–17), Shank2E (19, 47), and CAL (18). The best studied ofthese proteins until now are themembers of theNHERF family,NHERF-1 and PDZK1 (NHERF-3). Although both PDZ pro-teins have been proved to interact with NaPi-2a and NaPi-2c inin vitro assays, a functional relationship with these proteins isstill missing. Here we aim to understand the physiological rel-evance of these interactions using the PDZK1-deficient mice asa model to study the putative differential regulation of the twoNa/Pi co-transporters.Our study showed a significantly impaired up-regulation of
NaPi-2c protein levels in the apical membrane of Pdzk1�/�
mice comparedwith thewild type animal fed low Pi diets. How-ever, NaPi-2a adaptation to the same conditions was intact.Capuano et al. (20) were able to show a slightly decreasedexpression of NaPi-2a in the Pdzk1�/� under high Pi diet; how-ever, we did not see any significant differences. Moreover, wecould not find significant differences in urine Pi excretionbetween wild type and Pdzk1�/� animals fed high Pi diets (sup-plemental Fig. S7), whereas the study by Capuano et al.reported an increased phosphaturia in the KO animals. Thesediscrepancies could be due to the fact that we used a higherconcentration in the high Pi diets: 1.2% Pi in their study versus1.5% Pi in ours. The higher dietary Pi could cause minimalNaPi-2a transporter expression and exacerbated phosphaturiain the wild type, and we would miss the reported effects. Thedeficient adaptation of the NaPi-2c protein levels suggests amore important role for the PDZK1 protein that is not requiredor can be compensated by other PDZ proteins in the case of theNaPi-2a adaptation. The impaired adaptation of NaPi-2c in the
FIGURE 9. Fraction of interacting donors at different Pi content for the different NaPi/PDZ pairs as obtained from the phasor analysis of FRET data. Asignificant increase of interacting donors was observed for the pair NaPi-2c/PDZK1 at low Pi concentrations (0.1%) in the medium, whereas the pair NaPi-2c/NHERF-1 was not affected. A similar increase of interacting donors was shown for the pair NaPi-2a/NHERF-1 with no changes for NaPi-2a/PDZK1. These resultshighlight the importance of the interaction NaPi-2c/PDZK1 in the adaptive response to low Pi concentrations.
PDZK1 Regulation of NaPi-2c Transporter
15040 JOURNAL OF BIOLOGICAL CHEMISTRY VOLUME 286 • NUMBER 17 • APRIL 29, 2011
at Univ of C
alifornia - Irvine, on August 5, 2011
ww
w.jbc.org
Dow
nloaded from
Pdzk1�/� seems to be independent of transcriptional regula-tion because higher NaPi-2c mRNA expression does not corre-late with the lower apical protein levels observed under low Piconditions. We consider this effect as an attempt to compen-sate the deficient apical expression of NaPi-2c in the Pdzk1�/�
model.Total membrane renal homogenates in wild type animals fed
low Pi diets show an increased expression of both NaPi-2a andNaPi-2c, suggesting an increased rate of de novo protein syn-thesis and/or reduced degradation rate. Pdzk1�/� mice show asignificantly deficient up-regulation of NaPi-2c also in totalmembranes and non-BBM fractions. These results were con-firmed by immunofluorescence and immunohistochemistrystaining of the transporter, showing a clear reduction ofNaPi-2c in the apical membrane in the KOmice. In the corticaltubules, NaPi-2c disappeared completely from the microvilli,whereas juxtamedullary tubules still showed apical staining,although clearly reduced versus the wild type. It remains to bedetermined whether this behavior implies differences in theregulation of NaPi-2c between cortical and juxtamedullarytubules. Subapical staining of NaPi-2c was prominentlyobserved in the Pdzk1�/� animal. This kind of subcellular loca-tion has been observed 4 h after switching to a high Pi diet whenNaPi-2c is translocated from themicrovilli to a subapical region(10). This finding suggest that in the Pdzk1�/� mice, NaPi-2c isable to traffic to the membrane, but it cannot be efficientlyretained in the microvilli.Based on the preliminary electrolyte analysis of thePdzk1�/�
versus wild type animal (22), Capuano et al. (20) proposed thatit was very unlikely that PDZK1deficiencywould cause changesin the levels of the phosphaturic hormones. Indeed, the resultsof our analysis show that the blunted regulation of NaPi-2c isnot induced by phosphaturic hormonal changes. However,PTH levels were reduced in Pdzk1�/� animals, although thesedifferences are unlikely to be related to the reduced adaptationof NaPi-2c because increased PTH signaling in fact inducesendocytosis and decreased BBM expression of both Na/Pitransporters. It would bemore plausible to think that decreasedPTH levels, which would promote brush border localization ofboth NaPi-2c and NaPi-2a, are trying to compensate for thereduced stability of NaPi-2c and probably NaPi-2a in the brushborder. Plasma Pi levels were higher in animals under high Pidiets without differences between wild type and Pdzk1�/� ani-mals as reported before (20, 22).However, the most intriguing question presented by this
study is whyNaPi-2a is able to fully adapt to lowPi conditions inthe absence of PDZK1, whereas NaPi-2c is not. Compensatorymechanismsmediated presumably byNHERF-1 have been sug-gested to explain that Pdzk1�/� is able to adapt NaPi-2a underchronic and acute dietary changes (20). However, the discrep-ancies between NaPi-2a and NaPi-2c were not expected,because both Na/Pi transporters have been shown to interactwith PDZK1 and NHERF-1 (15). Study of the interactionsbetweenNa/Pi transporters and PDZK1 andNHERF-1 by usingthe FLIM-FRET technique resulted in differential FRET effi-ciency between both transporters. Although for PDZK1 inter-actions both NaPi-2a and 2c showed strong FRET occurrence,the interactions with NHERF-1 showed a much stronger inter-
action for NaPi-2a. It is important to be careful interpretingthe results from FRETmeasurements because factors such as thedistance between both fluorophores can influence greatly thevalues of efficiency. Because this distance is specific for eachpair of proteins, it is not always suitable to compare affinities ofinteraction between different pairs. In our case of study, wecould compare FRET efficiency interactions of the pairs NaPi-2a/NHERF-1 and NaPi-2c/NHERF-1 because both transport-ers have presumably a similar structure, and both interact withthe first PDZ domain of NHERF-1. However, NaPi-2a interactswith the PDZ3 of PDZK1, whereas NaPi-2c interacts withPDZ2, suggesting greater differences in the distances betweenthe fluorophores even without knowing exactly the foldingstructure of PDZK1 (supplemental Fig. S8). Our results implydifferences in the affinity interaction of NHERF-1withNaPi-2aand 2c that could explain why NaPi-2c is not able to adapt tolow Pi diets in the Pdzk1�/�. The previous study that identifiedthese interactions suggested already that the interaction NaPi-2c/NHERF-1 differs in nature from the interaction NaPi-2c/PDZK1. These results were supported by the finding that underlower concentrations of Pi in the medium, the number of inter-acting proteins was increased for the pair NaPi-2c/PDZK1 butnot for NaPi-2c/NHERF-1 pair.Our results suggest that PDZK1 plays a role in the stabiliza-
tion/retention of NaPi-2c in the microvilli more than in thetrafficking of the transporter to the apical membrane. Previousstudies have suggested a similar role for PDZK1 in the stabili-zation ofNaPi-2a, whereasNHERF-1 could bemore involved inthe trafficking or insertion on the membrane (20).In summary, Pdzk1�/� mice showed an impaired adaptation
of NaPi-2c to chronic low Pi diets that differs from the behaviorof NaPi-2a. That impaired adaptation is characterized byreduced apical and total NaPi-2c protein expression and byincreased intracellular staining in the Pdzk1�/� model. Analy-sis by FLIM-FRET showed that the interaction between NaPi-2a/NHERF-1 is much stronger than the pair NaPi-2c/NH-ERF-1.We suggest thatNaPi-2c under physiological conditionshas to compete with other proteins that interact with greateraffinity with NHERF-1, reducing its chances of interaction.This fact would be an important difference in the regulation ofNaPi-2a and NaPi-2c, and it would explain the lack of compen-satory effect for NaPi-2c in the Pdzk1�/�. PDZK1 protein playsan important role in the adaptation of NaPi-2c to low Piconditions.
Acknowledgment—We thank Dr. David Silver for the generous gift ofsupplying the anti-PDZK1 antibody and for making the Pdzk1�/�
mouse model commercially available.
REFERENCES1. Beck, L., Karaplis, A. C., Amizuka, N., Hewson, A. S., Ozawa, H., and
Tenenhouse, H. S. (1998) Proc. Natl. Acad. Sci. U.S.A. 95, 5372–53772. Hoag, H.M., Martel, J., Gauthier, C., and Tenenhouse, H. S. (1999) J. Clin.
Invest. 104, 679–6863. Murer, H., Forster, I., and Biber, J. (2004) Pflugers Arch. 447, 763–7674. Segawa, H., Kaneko, I., Takahashi, A., Kuwahata, M., Ito, M., Ohkido, I.,
Tatsumi, S., and Miyamoto, K. (2002) J. Biol. Chem. 277, 19665–196725. Levi, M., Kempson, S. A., Lotscher, M., Biber, J., and Murer, H. (1996) J.
PDZK1 Regulation of NaPi-2c Transporter
APRIL 29, 2011 • VOLUME 286 • NUMBER 17 JOURNAL OF BIOLOGICAL CHEMISTRY 15041
at Univ of C
alifornia - Irvine, on August 5, 2011
ww
w.jbc.org
Dow
nloaded from

Membr. Biol. 154, 1–96. Miyamoto, K., Ito, M., Tatsumi, S., Kuwahata, M., and Segawa, H. (2007)
Am. J. Nephrol. 27, 503–5157. Forster, I. C., Kohler, K., Biber, J., andMurer, H. (2002) Prog. Biophys.Mol.
Biol. 80, 69–1088. Lotscher, M., Kaissling, B., Biber, J., Murer, H., and Levi, M. (1997) J. Clin.
Invest. 99, 1302–13129. Levi, M., Lotscher, M., Sorribas, V., Custer, M., Arar, M., Kaissling, B.,
Murer, H., and Biber, J. (1994) Am. J. Physiol. 267, F900–F90810. Segawa, H., Yamanaka, S., Ito, M., Kuwahata, M., Shono, M., Yamamoto,
T., andMiyamoto, K. (2005)Am. J. Physiol. Renal Physiol. 288, F587–F59611. Segawa, H., Yamanaka, S., Onitsuka, A., Tomoe, Y., Kuwahata,M., Ito,M.,
Taketani, Y., and Miyamoto, K. (2007) Am. J. Physiol. Renal Physiol. 292,F395–F403
12. Gisler, S. M., Stagljar, I., Traebert, M., Bacic, D., Biber, J., and Murer, H.(2001) J. Biol. Chem. 276, 9206–9213
13. Hernando, N., Deliot, N., Gisler, S. M., Lederer, E., Weinman, E. J., Biber,J., and Murer, H. (2002) Proc. Natl. Acad. Sci. U.S.A. 99, 11957–11962
14. Gisler, S. M., Pribanic, S., Bacic, D., Forrer, P., Gantenbein, A., Sabourin,L. A., Tsuji, A., Zhao, Z. S., Manser, E., Biber, J., and Murer, H. (2003)Kidney Int. 64, 1733–1745
15. Villa-Bellosta, R., Barac-Nieto, M., Breusegem, S. Y., Barry, N. P., Levi, M.,and Sorribas, V. (2008) Kidney Int. 73, 456–464
16. Hernando, N., Gisler, S. M., Pribanic, S., Deliot, N., Capuano, P., Wagner,C. A., Moe, O. W., Biber, J., and Murer, H. (2005) J. Physiol. 567, 21–26
17. Wade, J. B., Liu, J., Coleman, R. A., Cunningham, R., Steplock, D. A.,Lee-Kwon, W., Pallone, T. L., Shenolikar, S., and Weinman, E. J. (2003)Am. J. Physiol. 285, C1494–C1503
18. Lanaspa,M. A., Giral, H., Breusegem, S. Y., Halaihel, N., Baile, G., Catalan,J., Carrodeguas, J. A., Barry, N. P., Levi, M., and Sorribas, V. (2007) Am. J.Physiol. Renal Physiol. 292, F230–F242
19. McWilliams, R. R., Breusegem, S. Y., Brodsky, K. F., Kim, E., Levi, M., andDoctor, R. B. (2005) Am. J. Physiol. 289, C1042–C1051
20. Capuano, P., Bacic, D., Stange, G., Hernando, N., Kaissling, B., Pal, R.,Kocher, O., Biber, J., Wagner, C. A., and Murer, H. (2005) Pflugers Arch.449, 392–402
21. Lan, D., and Silver, D. L. (2005) J. Biol. Chem. 280, 23390–2339622. Kocher, O., Pal, R., Roberts, M., Cirovic, C., and Gilchrist, A. (2003)Mol.
Cell Biol. 23, 1175–118023. Breusegem, S. Y., Takahashi, H., Giral-Arnal, H., Wang, X., Jiang, T., Ver-
lander, J. W., Wilson, P., Miyazaki-Anzai, S., Sutherland, E., Caldas, Y.,Blaine, J. T., Segawa, H., Miyamoto, K., Barry, N. P., and Levi, M. (2009)Am. J. Physiol. Renal Physiol. 297, F350–F361
24. Cole, J. A., Forte, L. R., Krause, W. J., and Thorne, P. K. (1989) Am. J.Physiol. 256, F672–F679
25. Blaine, J., Okamura, K., Giral, H., Breusegem, S., Caldas, Y., Millard, A.,
Barry, N., and Levi, M. (2009) Am. J. Physiol. Cell Physiol. 297,C1339–C1346
26. Breusegem, S. Y., Halaihel, N., Inoue, M., Zajicek, H., Lederer, E., Barry,N. P., Sorribas, V., and Levi, M. (2005) Am. J. Physiol. Renal Physiol. 289,F154–F165
27. Colyer, R. A., Lee, C., and Gratton, E. (2008) Microsc. Res. Tech. 71,201–213
28. Redford, G. I., and Clegg, R. M. (2005) J. Fluoresc. 15, 805–81529. Gratton, E., Jameson, D. M., and Hall, R. D. (1984) Annu. Rev. Biophys.
Bioeng. 13, 105–12430. Digman, M. A., Caiolfa, V. R., Zamai, M., and Gratton, E. (2008) Biophys.
J. 94, L14–1631. Clayton, A. H., Hanley, Q. S., and Verveer, P. J. (2004) J. Microsc. 213, 1–532. Verveer, P. J., Wouters, F. S., Reynolds, A. R., and Bastiaens, P. I. (2000)
Science 290, 1567–157033. Caiolfa, V. R., Zamai, M., Malengo, G., Andolfo, A., Madsen, C. D., Sutin,
J., Digman, M. A., Gratton, E., Blasi, F., and Sidenius, N. (2007) J. Cell Biol.179, 1067–1082
34. Rizzo, M. A., Springer, G. H., Granada, B., and Piston, D. W. (2004) Nat.Biotechnol. 22, 445–449
35. Truong, K., and Ikura, M. (2001) Curr. Opin. Struct. Biol. 11, 573–57836. Suhling, K., French, P. M., and Phillips, D. (2005) Photochem. Photobiol.
Sci. 4, 13–2237. Shenolikar, S., Voltz, J.W.,Minkoff, C.M.,Wade, J. B., andWeinman, E. J.
(2002) Proc. Natl. Acad. Sci. U.S.A. 99, 11470–1147538. Cunningham, R., E, X., Steplock, D., Shenolikar, S., and Weinman, E. J.
(2005) Am. J. Physiol. Renal Physiol. 289, F933–F93839. Weinman, E. J., Boddeti, A., Cunningham, R., Akom,M.,Wang, F.,Wang,
Y., Liu, J., Steplock, D., Shenolikar, S., andWade, J. B. (2003)Am. J. Physiol.Renal Physiol. 285, F1225–F1232
40. Cunningham, R., Steplock, D., E, X., Biswas, R. S.,Wang, F., Shenolikar, S.,and Weinman, E. J. (2006) Am. J. Physiol. Renal Physiol. 291, F896–F901
41. Seidler, U., Singh, A., Chen, M., Cinar, A., Bachmann, O., Zheng, W.,Wang, J., Yeruva, S., and Riederer, B. (2009) Exp. Physiol. 94, 175–179
42. Weinman, E. J., Hall, R. A., Friedman, P. A., Liu-Chen, L. Y., and Sheno-likar, S. (2006) Annu. Rev. Physiol. 68, 491–505
43. Kato, Y.,Watanabe, C., andTsuji, A. (2006)Eur. J. Pharm. Sci. 27, 487–50044. Yesilaltay, A., Kocher, O., Rigotti, A., and Krieger, M. (2005) Curr. Opin.
Lipidol. 16, 147–15245. Weinman, E. J., Cunningham, R., and Shenolikar, S. (2005) Pflugers Arch.
450, 137–14446. Shenolikar, S., Voltz, J. W., Cunningham, R., and Weinman, E. J. (2004)
Physiology 19, 362–36947. Dobrinskikh, E., Giral, H., Caldas, Y. A., Levi, M., and Doctor, R. B. (2010)
Am. J. Physiol. 299, C1324–C1334
PDZK1 Regulation of NaPi-2c Transporter
15042 JOURNAL OF BIOLOGICAL CHEMISTRY VOLUME 286 • NUMBER 17 • APRIL 29, 2011
at Univ of C
alifornia - Irvine, on August 5, 2011
ww
w.jbc.org
Dow
nloaded from