Role of mysid seasonal migrations in the organic matter transfer in the Curonian Lagoon,...
10
Role of mysid seasonal migrations in the organic matter transfer in the Curonian Lagoon, south-eastern Baltic Sea J urat _ e Lesutien _ e a, * , Elena Gorokhova b , Zita R. Gasi unait _ e a , Art uras Razinkovas a a Coastal Research and Planning Institute, Klaip _ eda University, LT-92294 Klaip _ eda, Lithuania b Department of Systems Ecology, Stockholm University, SE 10691 Stockholm, Sweden article info Article history: Received 4 May 2008 Accepted 4 August 2008 Available online 12 August 2008 Keywords: nitrogen and carbon isotopes growth and tissue turnover detritus food chain habitat coupling Lithuania south-eastern Baltic Sea Curonian Lagoon abstract We investigated population dynamics, growth and feeding of an omnivorous mysid, Paramysis lacustris, performing seasonal horizontal migrations in the Curonian Lagoon. In autumn, increased predation pressure and deteriorated feeding conditions, due to zooplankton and phytoplankton decline in the open water, forces mysids to migrate to the shoreline, where large amounts of decaying submersed vegetation occur at the end of plant growth season. Using stable isotope analysis and mixing models, we evaluated relative importance of decaying submersed macrophytes, lagoon phytoplankton and mesozooplankton in the diet of mysids during this period. In September–November, mysids actively grew and produced three cohorts. Specific growth rates of adults (10.9 1.9 mm) and subadults (6 0.5 mm) were 3 and 9% DW d 1 , respectively, resulting in population somatic production of 36 g DW m 2 . Both d 15 N and d 13 C of mysids varied in concert with those in suspended and bottom particulate organic matter (POM) and meso- zooplankton. The mixing models estimated that 45% of mysid diets were composed of bottom POM originated from the decaying macrophyte Potamogeton perfoliatus, 45% by suspended POM largely consisting of phytoplankton, while mesozooplankton contributed less than 10% of the diet. This diet composition differs from that in summer, when mysids rely mostly on zooplankton and phytoplankton. Therefore, mysid horizontal migrations and their ability to efficiently utilize littoral detritus improve the efficiency of macrophyte detritus transfer up the food chain and inshore/offshore habitat coupling in the Curonian Lagoon. Ó 2008 Elsevier Ltd. All rights reserved. 1. Introduction Organic matter synthesized by primary producers often reaches consumers via the detrital food chain, especially in coastal ecosystems with high macrophyte production and riverine inputs of terrestrial organic matter (Michener and Schell, 1994; Bode et al., 2006). Then, organic matter consumed and assimilated in the nearshore areas can be transported to the offshore food webs by nekton species, such as fishes (Darnaude, 2005), shrimps (Fry and Ewel, 2003) and mysids (Morgan and Threlkeld, 1982; Webb and Wooldridge, 1990). In coastal and estuarine ecosystems, mysids contribute considerably to secondary production (Fockedey and Mees, 1999) and are an important food source for demersal fish (Hostens and Mees, 1999) as well as for juveniles of predatory fish (Lo zys, 2003). They are opportunistic omnivores, feeding on the most abundant food sources (Fockedey and Mees, 1999; Viherluoto et al., 2000), or selective feeders (Viherluoto and Viitasalo, 2001), with seasonal and ontogenetic diet changes (Branstrator et al., 2000; Viherluoto et al., 2000). The Ponto-Caspian mysid Paramysis lacustris was introduced into reservoirs of the Baltic Sea basin, including the Curonian Lagoon, to increase the utilization efficiency of primary production and enrich food resources for fish (Arbac ˇiauskas, 2002). It was considered a herbivore and detritivore (Komarova, 1991). However, our recent study based on stable isotope analysis of the pelagic food web suggests that during summer, mesozooplankton is the main component of the mysid diet in this area (Lesutien _ e et al., 2007). Interestingly, towards the autumn, the difference in d 15 N between mysid stomach contents and ambient mesozooplankton increases significantly, indicating a diet shift to another food source. This shift coincides with seasonal migrations of the mysids and concomitant changes in the littoral macrophytes. In our field studies and excursions on the lagoon shore, we frequently observe large swarms of Paramysis lacustris in the littoral zone (at <1 m depth) during the fall. The swarming usually occurs from September to the beginning of the winter. During this period, mysids grow and mature until ice cover appears; afterward they migrate to deeper water for overwintering (pers. observations). The * Corresponding author. E-mail address: [email protected] (J. Lesutien _ e). Contents lists available at ScienceDirect Estuarine, Coastal and Shelf Science journal homepage: www.elsevier.com/locate/ecss 0272-7714/$ – see front matter Ó 2008 Elsevier Ltd. All rights reserved. doi:10.1016/j.ecss.2008.08.001 Estuarine, Coastal and Shelf Science 80 (2008) 225–234
Transcript of Role of mysid seasonal migrations in the organic matter transfer in the Curonian Lagoon,...
lable at ScienceDirect
Estuarine, Coastal and Shelf Science 80 (2008) 225–234
Contents lists avai
Estuarine, Coastal and Shelf Science
journal homepage: www.elsevier .com/locate/ecss
Role of mysid seasonal migrations in the organic matter transfer in theCuronian Lagoon, south-eastern Baltic Sea
J�urat _e Lesutien _e a,*, Elena Gorokhova b, Zita R. Gasi�unait _e a, Art�uras Razinkovas a
a Coastal Research and Planning Institute, Klaip _eda University, LT-92294 Klaip _eda, Lithuaniab Department of Systems Ecology, Stockholm University, SE 10691 Stockholm, Sweden
a r t i c l e i n f o
Article history:Received 4 May 2008Accepted 4 August 2008Available online 12 August 2008
Keywords:nitrogen and carbon isotopesgrowth and tissue turnoverdetritus food chainhabitat couplingLithuaniasouth-eastern Baltic SeaCuronian Lagoon
* Corresponding author.E-mail address: [email protected] (J. Lesutien _e).
0272-7714/$ – see front matter � 2008 Elsevier Ltd.doi:10.1016/j.ecss.2008.08.001
a b s t r a c t
We investigated population dynamics, growth and feeding of an omnivorous mysid, Paramysis lacustris,performing seasonal horizontal migrations in the Curonian Lagoon. In autumn, increased predationpressure and deteriorated feeding conditions, due to zooplankton and phytoplankton decline in the openwater, forces mysids to migrate to the shoreline, where large amounts of decaying submersed vegetationoccur at the end of plant growth season. Using stable isotope analysis and mixing models, we evaluatedrelative importance of decaying submersed macrophytes, lagoon phytoplankton and mesozooplankton inthe diet of mysids during this period. In September–November, mysids actively grew and produced threecohorts. Specific growth rates of adults (10.9� 1.9 mm) and subadults (6� 0.5 mm) were 3 and 9% DW d�1,respectively, resulting in population somatic production of 36 g DW m�2. Both d15N and d13C of mysidsvaried in concert with those in suspended and bottom particulate organic matter (POM) and meso-zooplankton. The mixing models estimated that 45% of mysid diets were composed of bottom POMoriginated from the decaying macrophyte Potamogeton perfoliatus, 45% by suspended POM largelyconsisting of phytoplankton, while mesozooplankton contributed less than 10% of the diet. This dietcomposition differs from that in summer, when mysids rely mostly on zooplankton and phytoplankton.Therefore, mysid horizontal migrations and their ability to efficiently utilize littoral detritus improve theefficiency of macrophyte detritus transfer up the food chain and inshore/offshore habitat coupling in theCuronian Lagoon.
� 2008 Elsevier Ltd. All rights reserved.
1. Introduction
Organic matter synthesized by primary producers often reachesconsumers via the detrital food chain, especially in coastalecosystems with high macrophyte production and riverine inputsof terrestrial organic matter (Michener and Schell, 1994; Bode et al.,2006). Then, organic matter consumed and assimilated in thenearshore areas can be transported to the offshore food webs bynekton species, such as fishes (Darnaude, 2005), shrimps (Fry andEwel, 2003) and mysids (Morgan and Threlkeld, 1982; Webb andWooldridge, 1990). In coastal and estuarine ecosystems, mysidscontribute considerably to secondary production (Fockedey andMees, 1999) and are an important food source for demersal fish(Hostens and Mees, 1999) as well as for juveniles of predatory fish(Lo�zys, 2003). They are opportunistic omnivores, feeding on themost abundant food sources (Fockedey and Mees, 1999; Viherluotoet al., 2000), or selective feeders (Viherluoto and Viitasalo, 2001),
All rights reserved.
with seasonal and ontogenetic diet changes (Branstrator et al.,2000; Viherluoto et al., 2000).
The Ponto-Caspian mysid Paramysis lacustris was introducedinto reservoirs of the Baltic Sea basin, including the CuronianLagoon, to increase the utilization efficiency of primary productionand enrich food resources for fish (Arbaciauskas, 2002). It wasconsidered a herbivore and detritivore (Komarova, 1991). However,our recent study based on stable isotope analysis of the pelagic foodweb suggests that during summer, mesozooplankton is the maincomponent of the mysid diet in this area (Lesutien _e et al., 2007).Interestingly, towards the autumn, the difference in d15N betweenmysid stomach contents and ambient mesozooplankton increasessignificantly, indicating a diet shift to another food source. This shiftcoincides with seasonal migrations of the mysids and concomitantchanges in the littoral macrophytes.
In our field studies and excursions on the lagoon shore, wefrequently observe large swarms of Paramysis lacustris in the littoralzone (at <1 m depth) during the fall. The swarming usually occursfrom September to the beginning of the winter. During this period,mysids grow and mature until ice cover appears; afterward theymigrate to deeper water for overwintering (pers. observations). The
Fig. 1. Map of the sampling stations in the littoral (open triangle) and offshore (filledtriangle) of the Curonian Lagoon and River Nemunas (circle). The distance between thelittoral and offshore stations is w1 km.
J. Lesutien _e et al. / Estuarine, Coastal and Shelf Science 80 (2008) 225–234226
littoral areas of the Curonian Lagoon have a typical mosaic coverageof submersed macrophytes, Potamogeton perfoliatus and Potamo-geton pectinatus, that often approaches 100% (Plokstien _e, 2002). Thebreakdown of macrophytes occurs from the end of August to mid-September (pers. observations), and the decaying littoral vegetationcould be fueling population production of many detritus feeders.The plant detritus could be a particularly important alternative foodsource for mysids during the period of their swarming in the littoral,while the abundance of other food sources such as zooplankton andphytoplankton decreases substantially (Gasi�unait _e et al., 2008).
The aim of this study was to investigate the food sources of mysidshoals in the littoral zone during autumn. We hypothesized thatlittoral particulate detritus, which becomes a rich pool of organicmatter at the end of the plant growth season, could play animportant role in Paramysis lacustris feeding. As microscopic anal-ysis of mysid gut contents is rather difficult, because mysidsmacerate their food (Grossnickle, 1982), we used stable C and Nisotope analysis (SIA) that can provide information on the relativecontribution of different food sources to the consumer diet (Mich-ener and Schell, 1994). This approach has been successfully appliedto evaluate feeding of mysids (Toda and Wada,1990; Gorokhova andHansson, 1999; Branstrator et al., 2000), including P. lacustris(Lesutien _e et al., 2007). However, when interpreting isotopicsignatures, one should estimate equilibrium time, i.e. the periodover which consumer tissues integrate the temporal variation of thediet isotopic composition (Post, 2002; Sweeting et al., 2005). Therates at which mysids, as well as any other animal species, come intoequilibrium with their food isotopic values depend on specificgrowth rates and tissue turnover rates (Gorokhova and Hansson,1999; Johansson et al., 2001; Sweeting et al., 2005). Therefore, toconsider the time lag over which the stable isotope ratios of food arereflected in the tissues of mysid P. lacustris, we assessed mysidgrowth dynamics during the study. Finally, as phytoplankton,macrophytes and riverine organic matter often have distinct d13Cvalues, their relative contributions to the particulate organic matter(POM) could be estimated using a mixing model (Michener andSchell, 1994; Cloern et al., 2002; Bode et al., 2006). Therefore, usingd13C and d15N signatures of the potential sources, we estimated theorigin of littoral particulate detritus.
2. Materials and methods
2.1. Study site
Our study was performed in the central part of the CuronianLagoon, which is essentially a freshwater system greatly influencedby the Nemunas River inflow (see Gasi�unait _e et al., 2008 for generaldescription of environmental characteristics, phytoplankton,zooplankton and fish communities of the Curonian Lagoon). Mysidswere collected at two stations (Fig. 1), an offshore station at 2.5 mdepth and a littoral station at 0.8 m depth. Submersed vegetationdominated by Potamogeton perfoliatus and Potamogeton pectinatuscovered 75–100% of the littoral in the study area during the vege-tation season. Riverine POM was collected at a site located 14 kmupstream from the River Nemunas delta (Fig. 1). In 2006, accordingto the Lithuanian Hydrometeorological Service, the averagemonthly river discharge increased almost twofold from 265 m3 s�1
in August to 524 m3 s�1 in September and remained relativelyconstant (418–482 m3 s�1) in October and November. Averagewater temperature during August–November was 3 �C higher in2006 than in 2004.
2.2. Sampling of mysids, zooplankton and phytoplankton
Mysids were collected with an epibenthic sledge (opening20� 60 cm, mesh size – 500 mm) in June–October, 2004 (weekly
sampling), and in July–November, 2006 (only the littoral station,with 1–3 wk between the sampling occasions). The trawling areawas 45 m2 in the open-water station but was limited to 15 m2 in thelittoral because of the submersed vegetation clogging the net.Samples were collected in triplicate and preserved with 4% form-aldehyde. In each replicate, all specimens were identified andcounted. The body length (BL, mm) was measured from the tip ofthe rostrum to the end of the telson. If available, 100 individualswere measured under dissecting microscope with 0.1 mm preci-sion; otherwise, all individuals were measured.
Phytoplankton and zooplankton for the abundance analysis (onesample per sample occasion for each type of plankton) werecollected at the littoral station in August–November, 2006, witha 3 wk sampling interval, using a 10-L water bottle. For zooplanktoncommunity analysis, 30 L of water was filtered through a 70-mm netand the zooplankton was preserved with 4% formaldehyde. Meso-zooplankton (>200 mm) was identified to species or genus,measured and counted under a dissecting microscope. Thebiomass, expressed as dry weight (DW mg L�1), was calculatedusing length measurements and allometric regressions (Rumohret al., 1987; Jorgensen et al., 1995). For phytoplankton communityanalysis, 300 ml of water were fixed with acid Lugol solution.Phytoplankton taxonomic composition (identified to species orgenus level, picoplankton not included) and abundance were esti-mated using an inverted microscope (300� and 600�) according toHELCOM recommendations (HELCOM, 1988). Biovolume wascalculated for two phytoplankton cell/filament length groups, <70and >70 mm (HELCOM, 1988).
2.3. Sampling for SIA and sample preparation
In 2006, mysids and their potential food sources (i.e.,zooplankton, detritus, submersed vegetation and POM) were
J. Lesutien _e et al. / Estuarine, Coastal and Shelf Science 80 (2008) 225–234 227
sampled for SIA on four occasions: August 30, September 19,October 10 and November 9 (Table 1). Riverine POM (RPOM) wascollected on August 30 and October 10 (Fig. 1). All samples weretransported to the laboratory in coolers for sorting and samplepreparation (Table 1). To assess ontogenetic differences in feeding,two size groups of mysids were considered: subadults (BL 5–7 mm)and adults (BL >7 mm). Decomposing and fresh leaves of Potamo-geton perfoliatus were collected manually. They were cleaned withtap water, washed with 1 M HCl to remove carbonates, and rinsedwith distilled water (Cloern et al., 2002). Samples for POM andmesozooplankton were taken using a 10-L water bottle and trans-ported to the laboratory in 3–5 L, acid pre-washed, plastic vessels.All POM samples were taken in calm weather to avoid re-suspensionof bottom sediments, except for November 9, when strong windscaused substantial mixing. Therefore, suspended POM onNovember 9 was treated as the bottom POM in the data analysis. Weseparated suspended POM (SPOM) into <70 mm and 100–200 mmfractions. The 100–200 mm fraction of SPOM, largely composed bydiazotrophic cyanobacterial colonies, was analyzed separately toidentify influence of d15N depleted nitrogen due to atmosphericnitrogen fixation (Lesutien _e et al., 2007). If analyzed in bulk, thiscyanobacterial nitrogen could complicate interpretation of theorigin and composition of SPOM as well as its contribution tomysid diet. Bottom POM (BPOM) was carefully sucked from thesediment surface of approximately 0.1 m2 with a syringe andtransferred to glass vessels; 0.5 L of the suspension was collectedfor each replicate. Samples were sedimented for 2 h in 4–6 �C toretard bacterial activity and allow sand particles to settle down.The suspension was carefully transferred to a Petri dish and thelarge pieces of plants as well as benthos (small amphipods,oligochaetes, nematodes and harpacticoids) were removed withforceps under the dissecting microscope. The remaining suspen-sion was concentrated on glass fiber filters, dried for 48 h at 60 �Cand weighed. From each filter, three subsamples were prepared bycutting a 4, 5, 6, 7 or 8 mm diameter circles (depending on thequantity of the sample material on the filter) using a set ofpunches, then the circles were packed into the tin capsules,weighed and used as analytical replicates. For each filter, 10–20%of the filtering area were analyzed.
Table 1Sampling dates, number of replicates (n) and sample preparation procedures for SIA
Sample type Sampling dates and nuof replicates (n)
Submersed macrophytes Aug 30 (5)Suspended POM Lagoon POM <70 mm Aug 30(3), Sept 19(3), O
Riverine POM Aug 30(5), Oct 10(5)Lagoon POM100-200 mm
Aug 30(3), Oct 10(3)
Detritus or bottom finesuspended POM (BPOM)
Aug 30(4), Sept 19(5),Oct 10(5)
Mesozooplankton Aug 30(3), Sept 19(3),Oct 10(2)
Mysids Subadults Aug 30(5), Sept 19(3), O
Adults Aug 30(5), Sept 19(3), O10(5), Nov 9(4)
2.4. Stable isotope analysis
Ratios of 13C/12C and 15N/14N as well as %C and %N in the sampleswere determined using continuous-flow isotope mass spectrometryprovided in Automated NC Analysis (ANCA) SL 20-20, PDZ Europa atthe Stable Isotope Facility, UC Davis, USA. The standard referencematerials were Vienna PDB and atmospheric N2. Isotope ratios wereexpressed as parts per thousands (&) differences from the standardreference material (Peterson and Fry, 1987). Repeated analyses ofhomogeneous material yielded standard deviations of <0.05%.
2.5. Growth analysis, mixing model calculations and statistics
For cohort analysis, length–frequency histograms of mysidssampled on different occasions were analyzed by the Rmix package– the version of MIX (Macdonald and Green, 1988) for the R envi-ronment (Du, pers. communications). A gamma distribution wasassumed for the distribution. The goodness-of-fit Chi-square testindicated how well the mixture distribution fit the histogramoverall. In case of extensive overlap of distribution components, thetest is not very sensitive (Macdonald and Green, 1988). In suchcases, we relied on visual examination of the distribution curve fitto the histogram. The mean BL for each mysid cohort on consequentsampling dates was estimated and used for the growth-ratecalculation. The results of cohort analysis from 2004 to 2006 werepooled for growth-rate analysis. Specific growth rate (SGR,%DW d�1) of mysids was calculated as SGR¼ 100� (ln Wt� ln W0)/t,where ln Wt and ln W0 are the natural logs of two subsequentindividual weights and t is the time (days) between the dates. Theweight estimates (DW, mg) were based on length measurements (BL,mm) and allometric regression W¼ 0.004� BL2.73, R2¼ 0.985, n¼ 88(Lesutien _e, unpublished data). The relationship between SGRand mysid BL was estimated by nonlinear regression using theGauss–Newton method to determine best fit. As the calculation oftotal mysid population production was hampered by abundantchanges due to migration, we calculated the somatic production ofthe Paramysis lacustris population. Somatic production (Ps, mgDW m�2) was computed for each of the six sampling intervals fromAugust 30 to November 30, 2006 and then for the entire period as
mber Sample preparation
Dead foliage and green leaves of Potamogeton perfoliatusct 10(3), Nov 9(5) Water sample (300–1200 mL) filtered through
70 mm net and concentrated onto GFF
Water sample filtered through 200 mm, collected on100 mm net, cleaned frommesozooplankton and debris,and transferred to GFFSediment sucked from a surfacewith a syringe, cleaned from coarseplant debris and zoobenthos,and transferred to GFFCollected on 200 mm net, cleanedfrom phytoplankton,using dissecting microscope,forceps and pipette,concentrated onto GFF
ct 10(3) Paramysis lacustris dried for 48 h at 60 �C; abdominaltissues pulverized and weighted into the tin capsules.Each replicate sample contained up tosix pooled specimens,if available, to reduce the individual variation
ct
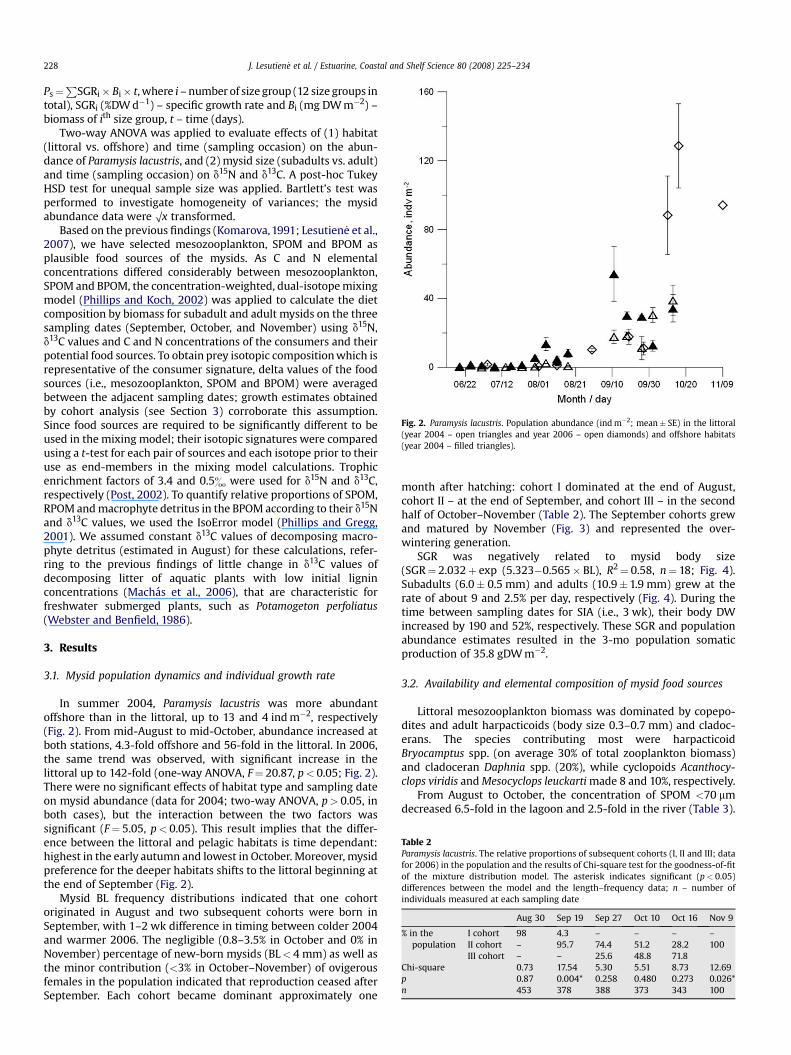
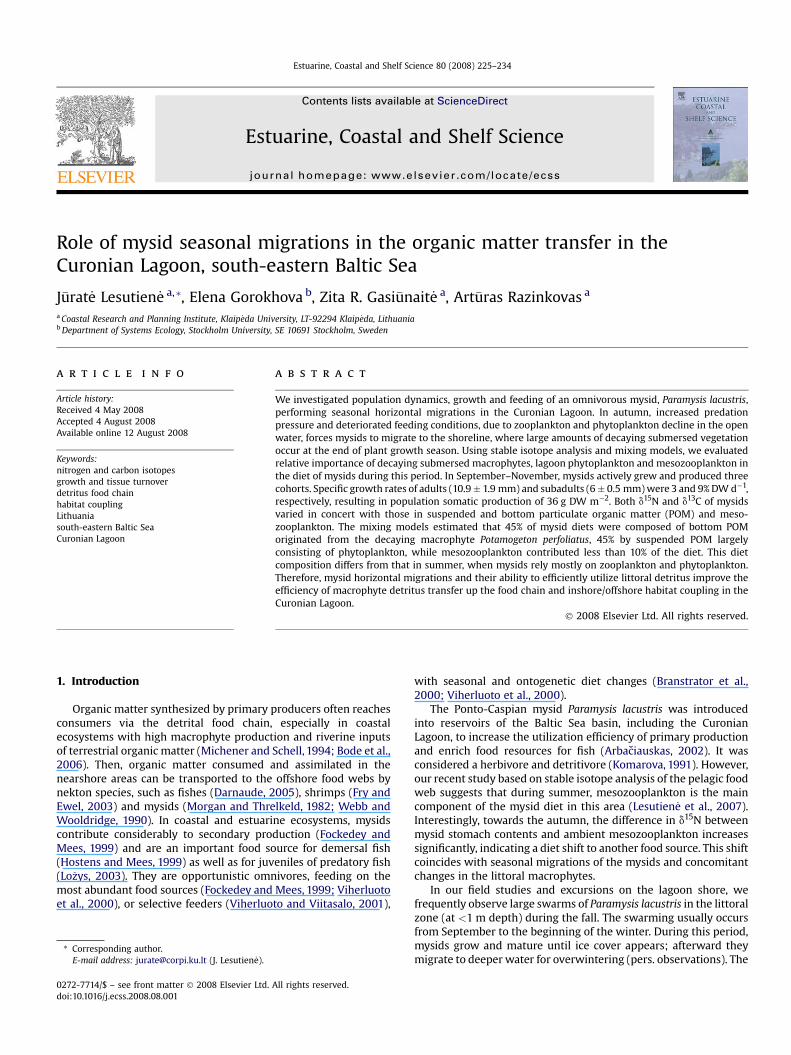
Fig. 2. Paramysis lacustris. Population abundance (ind m�2; mean� SE) in the littoral(year 2004 – open triangles and year 2006 – open diamonds) and offshore habitats(year 2004 – filled triangles).
Table 2Paramysis lacustris. The relative proportions of subsequent cohorts (I, II and III; datafor 2006) in the population and the results of Chi-square test for the goodness-of-fitof the mixture distribution model. The asterisk indicates significant (p< 0.05)differences between the model and the length–frequency data; n – number ofindividuals measured at each sampling date
Aug 30 Sep 19 Sep 27 Oct 10 Oct 16 Nov 9
% in thepopulation
I cohort 98 4.3 – – – –II cohort – 95.7 74.4 51.2 28.2 100III cohort – – 25.6 48.8 71.8
Chi-square 0.73 17.54 5.30 5.51 8.73 12.69p 0.87 0.004* 0.258 0.480 0.273 0.026*n 453 378 388 373 343 100
J. Lesutien _e et al. / Estuarine, Coastal and Shelf Science 80 (2008) 225–234228
Ps¼P
SGRi� Bi� t, where i – number of size group (12 size groups intotal), SGRi (%DW d�1) – specific growth rate and Bi (mg DW m�2) –biomass of ith size group, t – time (days).
Two-way ANOVA was applied to evaluate effects of (1) habitat(littoral vs. offshore) and time (sampling occasion) on the abun-dance of Paramysis lacustris, and (2) mysid size (subadults vs. adult)and time (sampling occasion) on d15N and d13C. A post-hoc TukeyHSD test for unequal sample size was applied. Bartlett’s test wasperformed to investigate homogeneity of variances; the mysidabundance data were Ox transformed.
Based on the previous findings (Komarova, 1991; Lesutien _e et al.,2007), we have selected mesozooplankton, SPOM and BPOM asplausible food sources of the mysids. As C and N elementalconcentrations differed considerably between mesozooplankton,SPOM and BPOM, the concentration-weighted, dual-isotope mixingmodel (Phillips and Koch, 2002) was applied to calculate the dietcomposition by biomass for subadult and adult mysids on the threesampling dates (September, October, and November) using d15N,d13C values and C and N concentrations of the consumers and theirpotential food sources. To obtain prey isotopic composition which isrepresentative of the consumer signature, delta values of the foodsources (i.e., mesozooplankton, SPOM and BPOM) were averagedbetween the adjacent sampling dates; growth estimates obtainedby cohort analysis (see Section 3) corroborate this assumption.Since food sources are required to be significantly different to beused in the mixing model; their isotopic signatures were comparedusing a t-test for each pair of sources and each isotope prior to theiruse as end-members in the mixing model calculations. Trophicenrichment factors of 3.4 and 0.5& were used for d15N and d13C,respectively (Post, 2002). To quantify relative proportions of SPOM,RPOM and macrophyte detritus in the BPOM according to their d15Nand d13C values, we used the IsoError model (Phillips and Gregg,2001). We assumed constant d13C values of decomposing macro-phyte detritus (estimated in August) for these calculations, refer-ring to the previous findings of little change in d13C values ofdecomposing litter of aquatic plants with low initial ligninconcentrations (Machas et al., 2006), that are characteristic forfreshwater submerged plants, such as Potamogeton perfoliatus(Webster and Benfield, 1986).
3. Results
3.1. Mysid population dynamics and individual growth rate
In summer 2004, Paramysis lacustris was more abundantoffshore than in the littoral, up to 13 and 4 ind m�2, respectively(Fig. 2). From mid-August to mid-October, abundance increased atboth stations, 4.3-fold offshore and 56-fold in the littoral. In 2006,the same trend was observed, with significant increase in thelittoral up to 142-fold (one-way ANOVA, F¼ 20.87, p< 0.05; Fig. 2).There were no significant effects of habitat type and sampling dateon mysid abundance (data for 2004; two-way ANOVA, p> 0.05, inboth cases), but the interaction between the two factors wassignificant (F¼ 5.05, p< 0.05). This result implies that the differ-ence between the littoral and pelagic habitats is time dependant:highest in the early autumn and lowest in October. Moreover, mysidpreference for the deeper habitats shifts to the littoral beginning atthe end of September (Fig. 2).
Mysid BL frequency distributions indicated that one cohortoriginated in August and two subsequent cohorts were born inSeptember, with 1–2 wk difference in timing between colder 2004and warmer 2006. The negligible (0.8–3.5% in October and 0% inNovember) percentage of new-born mysids (BL< 4 mm) as well asthe minor contribution (<3% in October–November) of ovigerousfemales in the population indicated that reproduction ceased afterSeptember. Each cohort became dominant approximately one
month after hatching: cohort I dominated at the end of August,cohort II – at the end of September, and cohort III – in the secondhalf of October–November (Table 2). The September cohorts grewand matured by November (Fig. 3) and represented the over-wintering generation.
SGR was negatively related to mysid body size(SGR¼ 2.032þ exp (5.323�0.565� BL), R2¼ 0.58, n¼ 18; Fig. 4).Subadults (6.0� 0.5 mm) and adults (10.9�1.9 mm) grew at therate of about 9 and 2.5% per day, respectively (Fig. 4). During thetime between sampling dates for SIA (i.e., 3 wk), their body DWincreased by 190 and 52%, respectively. These SGR and populationabundance estimates resulted in the 3-mo population somaticproduction of 35.8 gDW m�2.
3.2. Availability and elemental composition of mysid food sources
Littoral mesozooplankton biomass was dominated by copepo-dites and adult harpacticoids (body size 0.3–0.7 mm) and cladoc-erans. The species contributing most were harpacticoidBryocamptus spp. (on average 30% of total zooplankton biomass)and cladoceran Daphnia spp. (20%), while cyclopoids Acanthocy-clops viridis and Mesocyclops leuckarti made 8 and 10%, respectively.
From August to October, the concentration of SPOM <70 mmdecreased 6.5-fold in the lagoon and 2.5-fold in the river (Table 3).
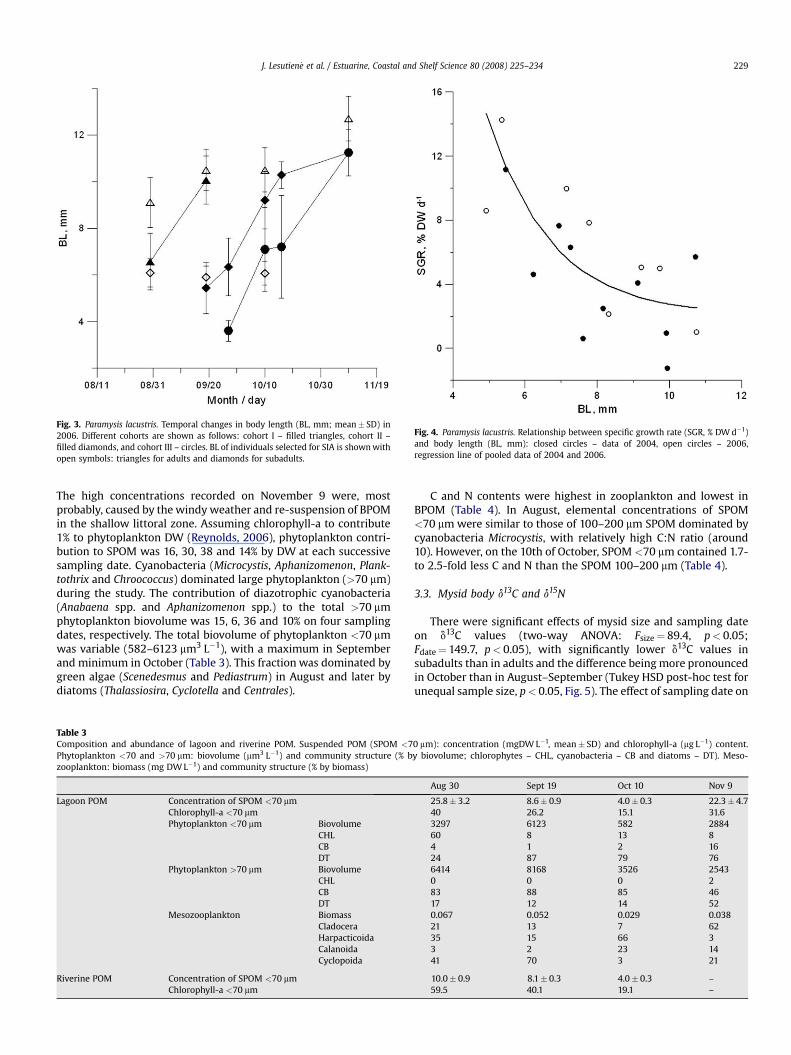
Fig. 3. Paramysis lacustris. Temporal changes in body length (BL, mm; mean� SD) in2006. Different cohorts are shown as follows: cohort I – filled triangles, cohort II –filled diamonds, and cohort III – circles. BL of individuals selected for SIA is shown withopen symbols: triangles for adults and diamonds for subadults.
Fig. 4. Paramysis lacustris. Relationship between specific growth rate (SGR, % DW d�1)and body length (BL, mm): closed circles – data of 2004, open circles – 2006,regression line of pooled data of 2004 and 2006.
J. Lesutien _e et al. / Estuarine, Coastal and Shelf Science 80 (2008) 225–234 229
The high concentrations recorded on November 9 were, mostprobably, caused by the windy weather and re-suspension of BPOMin the shallow littoral zone. Assuming chlorophyll-a to contribute1% to phytoplankton DW (Reynolds, 2006), phytoplankton contri-bution to SPOM was 16, 30, 38 and 14% by DW at each successivesampling date. Cyanobacteria (Microcystis, Aphanizomenon, Plank-tothrix and Chroococcus) dominated large phytoplankton (>70 mm)during the study. The contribution of diazotrophic cyanobacteria(Anabaena spp. and Aphanizomenon spp.) to the total >70 mmphytoplankton biovolume was 15, 6, 36 and 10% on four samplingdates, respectively. The total biovolume of phytoplankton <70 mmwas variable (582–6123 mm3 L�1), with a maximum in Septemberand minimum in October (Table 3). This fraction was dominated bygreen algae (Scenedesmus and Pediastrum) in August and later bydiatoms (Thalassiosira, Cyclotella and Centrales).
Table 3Composition and abundance of lagoon and riverine POM. Suspended POM (SPOM <7Phytoplankton <70 and >70 mm: biovolume (mm3 L�1) and community structure (% bzooplankton: biomass (mg DW L�1) and community structure (% by biomass)
Lagoon POM Concentration of SPOM <70 mmChlorophyll-a <70 mmPhytoplankton <70 mm Biovolume
CHLCBDT
Phytoplankton >70 mm BiovolumeCHLCBDT
Mesozooplankton BiomassCladoceraHarpacticoidaCalanoidaCyclopoida
Riverine POM Concentration of SPOM <70 mmChlorophyll-a <70 mm
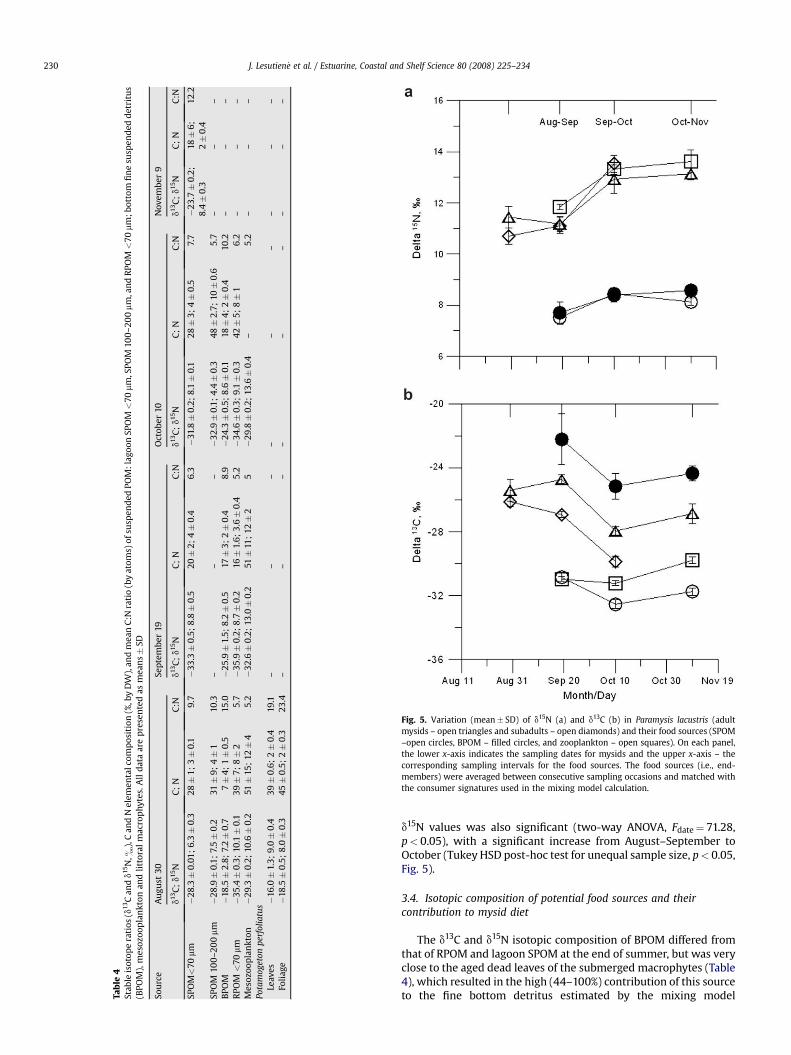
C and N contents were highest in zooplankton and lowest inBPOM (Table 4). In August, elemental concentrations of SPOM<70 mm were similar to those of 100–200 mm SPOM dominated bycyanobacteria Microcystis, with relatively high C:N ratio (around10). However, on the 10th of October, SPOM <70 mm contained 1.7-to 2.5-fold less C and N than the SPOM 100–200 mm (Table 4).
3.3. Mysid body d13C and d15N
There were significant effects of mysid size and sampling dateon d13C values (two-way ANOVA: Fsize¼ 89.4, p< 0.05;Fdate¼ 149.7, p< 0.05), with significantly lower d13C values insubadults than in adults and the difference being more pronouncedin October than in August–September (Tukey HSD post-hoc test forunequal sample size, p< 0.05, Fig. 5). The effect of sampling date on
0 mm): concentration (mgDW L�1, mean� SD) and chlorophyll-a (mg L�1) content.y biovolume; chlorophytes – CHL, cyanobacteria – CB and diatoms – DT). Meso-
Aug 30 Sept 19 Oct 10 Nov 9
25.8� 3.2 8.6� 0.9 4.0� 0.3 22.3� 4.740 26.2 15.1 31.63297 6123 582 288460 8 13 84 1 2 1624 87 79 766414 8168 3526 25430 0 0 283 88 85 4617 12 14 520.067 0.052 0.029 0.03821 13 7 6235 15 66 33 2 23 1441 70 3 21
10.0� 0.9 8.1� 0.3 4.0� 0.3 –59.5 40.1 19.1 –
Tab
le4
Stab
leis
otop
era
tios
(d13
Can
dd15
N,&
),C
and
Nel
emen
talc
omp
osit
ion
(%,b
yD
W),
and
mea
nC
:Nra
tio
(by
atom
s)of
susp
end
edPO
M:l
agoo
nSP
OM<
70m
m,S
POM
100
–2
00
mm
,an
dR
POM<
70m
m;b
otto
mfi
ne
susp
end
edd
etri
tus
(BPO
M),
mes
ozoo
pla
nkt
onan
dli
ttor
alm
acro
ph
ytes
.All
dat
aar
ep
rese
nte
das
mea
ns�
SD
Sou
rce
Au
gust
30
Sep
tem
ber
19O
ctob
er10
Nov
emb
er9
d13C
;d15
NC
;N
C:N
d13C
;d15
NC
;N
C:N
d13C
;d15
NC
;N
C:N
d13C
;d15
NC
;N
C:N
SPO
M<
70m
m�
28
.3�
0.0
1;
6.3�
0.3
28�
1;
3�
0.1
9.7
�33
.3�
0.5
;8
.8�
0.5
20�
2;
4�
0.4
6.3
�31
.8�
0.2
;8
.1�
0.1
28�
3;
4�
0.5
7.7
�2
3.7�
0.2
;8.
4�
0.3
18�
6;
2�
0.4
12.2
SPO
M10
0–
20
0m
m�
28
.9�
0.1
;7.
5�
0.2
31�
9;
4�
110
.3–
––
�3
2.9�
0.1
;4
.4�
0.3
48�
2.7
;10�
0.6
5.7
––
–B
POM
�18
.5�
2.8
;7.
2�
0.7
7�
4;
1�
0.5
15.0
�2
5.9�
1.5
;8
.2�
0.5
17�
3;
2�
0.4
8.9
�24
.3�
0.5
;8
.6�
0.1
18�
4;
2�
0.4
10.2
––
–R
POM<
70m
m�
35.4�
0.3
;10
.1�
0.1
39�
7;
8�
25
.7�
35.9�
0.2
;8
.7�
0.2
16�
1.6
;3
.6�
0.4
5.2
�3
4.6�
0.3
;9
.1�
0.3
42�
5;
8�
16
.2–
––
Mes
ozoo
pla
nkt
on�
29
.3�
0.2
;10
.6�
0.2
51�
15;
12�
45
.2�
32
.6�
0.2
;13
.0�
0.2
51�
11;
12�
25
�2
9.8�
0.2
;13
.6�
0.4
–5
.2–
––
Pota
mog
eton
perf
olia
tus
Leav
es�
16.0�
1.3
;9
.0�
0.4
39�
0.6
;2�
0.4
19.1
––
––
––
––
–Fo
liag
e�
18.5�
0.5
;8
.0�
0.3
45�
0.5
;2�
0.3
23
.4–
––
––
––
––
Fig. 5. Variation (mean� SD) of d15N (a) and d13C (b) in Paramysis lacustris (adultmysids – open triangles and subadults – open diamonds) and their food sources (SPOM–open circles, BPOM – filled circles, and zooplankton – open squares). On each panel,the lower x-axis indicates the sampling dates for mysids and the upper x-axis – thecorresponding sampling intervals for the food sources. The food sources (i.e., end-members) were averaged between consecutive sampling occasions and matched withthe consumer signatures used in the mixing model calculation.
J. Lesutien _e et al. / Estuarine, Coastal and Shelf Science 80 (2008) 225–234230
d15N values was also significant (two-way ANOVA, Fdate¼ 71.28,p< 0.05), with a significant increase from August–September toOctober (Tukey HSD post-hoc test for unequal sample size, p< 0.05,Fig. 5).
3.4. Isotopic composition of potential food sources and theircontribution to mysid diet
The d13C and d15N isotopic composition of BPOM differed fromthat of RPOM and lagoon SPOM at the end of summer, but was veryclose to the aged dead leaves of the submerged macrophytes (Table4), which resulted in the high (44–100%) contribution of this sourceto the fine bottom detritus estimated by the mixing model
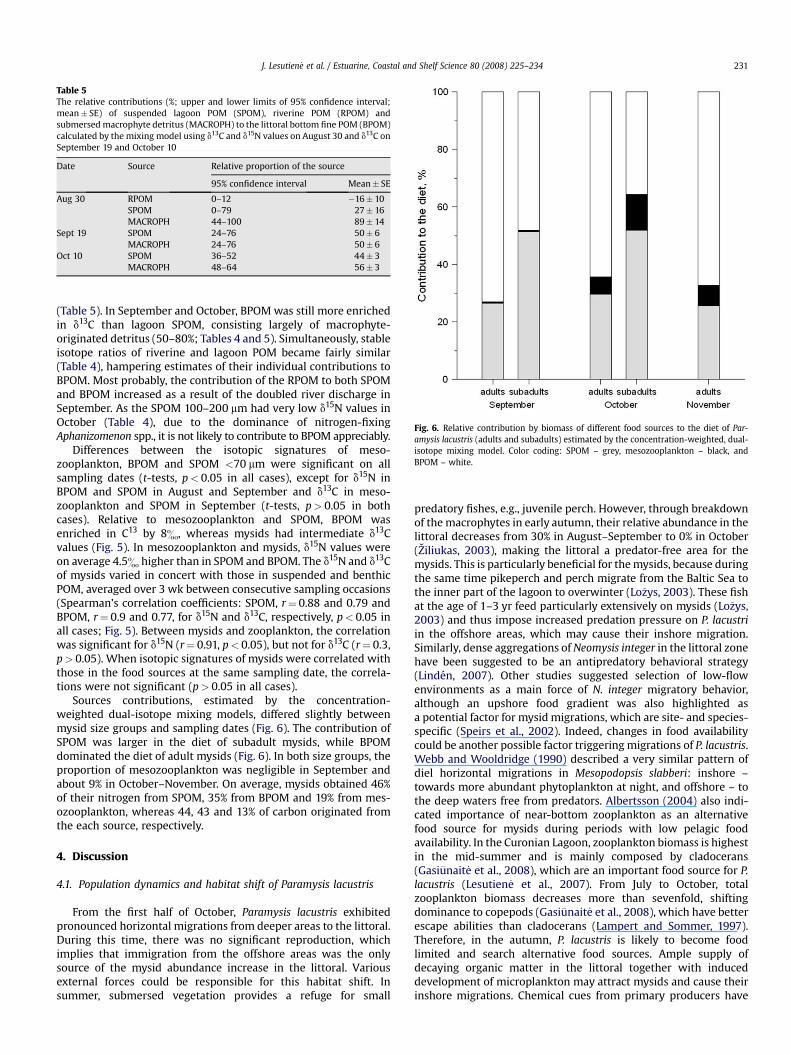
Table 5The relative contributions (%; upper and lower limits of 95% confidence interval;mean� SE) of suspended lagoon POM (SPOM), riverine POM (RPOM) andsubmersed macrophyte detritus (MACROPH) to the littoral bottom fine POM (BPOM)calculated by the mixing model using d13C and d15N values on August 30 and d13C onSeptember 19 and October 10
Date Source Relative proportion of the source
95% confidence interval Mean� SE
Aug 30 RPOM 0–12 �16� 10SPOM 0–79 27� 16MACROPH 44–100 89� 14
Sept 19 SPOM 24–76 50� 6MACROPH 24–76 50� 6
Oct 10 SPOM 36–52 44� 3MACROPH 48–64 56� 3
Fig. 6. Relative contribution by biomass of different food sources to the diet of Par-amysis lacustris (adults and subadults) estimated by the concentration-weighted, dual-isotope mixing model. Color coding: SPOM – grey, mesozooplankton – black, andBPOM – white.
J. Lesutien _e et al. / Estuarine, Coastal and Shelf Science 80 (2008) 225–234 231
(Table 5). In September and October, BPOM was still more enrichedin d13C than lagoon SPOM, consisting largely of macrophyte-originated detritus (50–80%; Tables 4 and 5). Simultaneously, stableisotope ratios of riverine and lagoon POM became fairly similar(Table 4), hampering estimates of their individual contributions toBPOM. Most probably, the contribution of the RPOM to both SPOMand BPOM increased as a result of the doubled river discharge inSeptember. As the SPOM 100–200 mm had very low d15N values inOctober (Table 4), due to the dominance of nitrogen-fixingAphanizomenon spp., it is not likely to contribute to BPOM appreciably.
Differences between the isotopic signatures of meso-zooplankton, BPOM and SPOM <70 mm were significant on allsampling dates (t-tests, p< 0.05 in all cases), except for d15N inBPOM and SPOM in August and September and d13C in meso-zooplankton and SPOM in September (t-tests, p> 0.05 in bothcases). Relative to mesozooplankton and SPOM, BPOM wasenriched in C13 by 8&, whereas mysids had intermediate d13Cvalues (Fig. 5). In mesozooplankton and mysids, d15N values wereon average 4.5& higher than in SPOM and BPOM. The d15N and d13Cof mysids varied in concert with those in suspended and benthicPOM, averaged over 3 wk between consecutive sampling occasions(Spearman’s correlation coefficients: SPOM, r¼ 0.88 and 0.79 andBPOM, r¼ 0.9 and 0.77, for d15N and d13C, respectively, p< 0.05 inall cases; Fig. 5). Between mysids and zooplankton, the correlationwas significant for d15N (r¼ 0.91, p< 0.05), but not for d13C (r¼ 0.3,p> 0.05). When isotopic signatures of mysids were correlated withthose in the food sources at the same sampling date, the correla-tions were not significant (p> 0.05 in all cases).
Sources contributions, estimated by the concentration-weighted dual-isotope mixing models, differed slightly betweenmysid size groups and sampling dates (Fig. 6). The contribution ofSPOM was larger in the diet of subadult mysids, while BPOMdominated the diet of adult mysids (Fig. 6). In both size groups, theproportion of mesozooplankton was negligible in September andabout 9% in October–November. On average, mysids obtained 46%of their nitrogen from SPOM, 35% from BPOM and 19% from mes-ozooplankton, whereas 44, 43 and 13% of carbon originated fromthe each source, respectively.
4. Discussion
4.1. Population dynamics and habitat shift of Paramysis lacustris
From the first half of October, Paramysis lacustris exhibitedpronounced horizontal migrations from deeper areas to the littoral.During this time, there was no significant reproduction, whichimplies that immigration from the offshore areas was the onlysource of the mysid abundance increase in the littoral. Variousexternal forces could be responsible for this habitat shift. Insummer, submersed vegetation provides a refuge for small
predatory fishes, e.g., juvenile perch. However, through breakdownof the macrophytes in early autumn, their relative abundance in thelittoral decreases from 30% in August–September to 0% in October(Ziliukas, 2003), making the littoral a predator-free area for themysids. This is particularly beneficial for the mysids, because duringthe same time pikeperch and perch migrate from the Baltic Sea tothe inner part of the lagoon to overwinter (Lo�zys, 2003). These fishat the age of 1–3 yr feed particularly extensively on mysids (Lo�zys,2003) and thus impose increased predation pressure on P. lacustriin the offshore areas, which may cause their inshore migration.Similarly, dense aggregations of Neomysis integer in the littoral zonehave been suggested to be an antipredatory behavioral strategy(Linden, 2007). Other studies suggested selection of low-flowenvironments as a main force of N. integer migratory behavior,although an upshore food gradient was also highlighted asa potential factor for mysid migrations, which are site- and species-specific (Speirs et al., 2002). Indeed, changes in food availabilitycould be another possible factor triggering migrations of P. lacustris.Webb and Wooldridge (1990) described a very similar pattern ofdiel horizontal migrations in Mesopodopsis slabberi: inshore –towards more abundant phytoplankton at night, and offshore – tothe deep waters free from predators. Albertsson (2004) also indi-cated importance of near-bottom zooplankton as an alternativefood source for mysids during periods with low pelagic foodavailability. In the Curonian Lagoon, zooplankton biomass is highestin the mid-summer and is mainly composed by cladocerans(Gasi�unait _e et al., 2008), which are an important food source for P.lacustris (Lesutien _e et al., 2007). From July to October, totalzooplankton biomass decreases more than sevenfold, shiftingdominance to copepods (Gasi�unait _e et al., 2008), which have betterescape abilities than cladocerans (Lampert and Sommer, 1997).Therefore, in the autumn, P. lacustris is likely to become foodlimited and search alternative food sources. Ample supply ofdecaying organic matter in the littoral together with induceddevelopment of microplankton may attract mysids and cause theirinshore migrations. Chemical cues from primary producers have
J. Lesutien _e et al. / Estuarine, Coastal and Shelf Science 80 (2008) 225–234232
been implicated in regulating migrations in other zooplanktonspecies (Van Donk, 2007).
4.2. Growth rate and tissue turnover – implications for SIA
During August–September, three cohorts were produced withinan approximately one-month interval (Fig. 3, Table 2). The samplingfrequency (i.e., 3 wk) allowed us to use mysids of the same age(subadults) from each cohort for SIA (Fig. 3), thus eliminatingpossible ontogenetic differences in isotopic signatures. According tothe growth curve (Fig. 3), it takes at least 20 d for a juvenile mysid togrow from 2–3 mm (i.e., when they leave the marsupium and startfeeding; Komarova, 1991) to 6 mm (i.e., subadults). Therefore,isotopic signatures of mysids are representative of their feedingenvironment during this period. In line with this interpretation, themysid d15N and d13C values strongly correlated with those of theirpotential food sources averaged over the preceding 3 wk (Fig. 5). Bycontrast, Toda and Wada (1990) found an immediate response ofd15N in mysid Neomysis intermedia to that of its food sources. Thisspecies, however, grows more rapidly than P. lacustris, witha generation time of about one month in N. intermedia, while P.lacustris in the Curonian Lagoon spans 50 d (Razinkovas, pers.communication). In the slow growing Mysis mixta, it takes 6–8 wkand more than 3 mo for d15N and d13C, respectively, to come toequilibrium with a new diet (Gorokhova and Hansson, 1999). Therapid growth of juvenile P. lacustris with a biomass increase ofabout 200% between the sampling dates (Fig. 4), indicates a hightissue turnover rate. This result implies that more frequentsampling of the food sources would be necessary to evaluate thediet of juveniles more precisely. The use of three-week averagingwhen comparing adult mysids to their food sources is morereasonable, as they perform slower, asymptotic growth (Fig. 2)and increase in weight by 50% during that period (Fig. 4).Complete turnover of N was assumed for Mysis relicta, whosegrowth resulted in a 33% increase in new tissues during 3 mo,whereas C had zero turnover (Johansson et al., 2001). Our resultsdo not indicate that changes in diet are more rapidly reflected ind15N than in d13C, probably due to our relatively low samplingfrequency for fast growing P. lacustris.
4.3. The origin and composition of the littoral POM
The littoral BPOM was largely composed of macrophyte detritus(Table 5), particularly on August 30 during the breakdown of thesubmersed vegetation. SPOM <70 mm had a significant contribu-tion of phytoplankton (on average 28% in August–October) asindicated by the chlorophyll-a content data and the proximity ofthe SPOM <70 mm C:N ratio to the Redfield ratio (6.3–9.7; Table 4).The more similar isotopic composition of SPOM and RPOM inSeptember–October compared to August (i.e., depleted d13C andenriched d15N; Table 4) was most probably related to the increase inproportion of riverine suspended matter due to high river runoff.Riverine SPOM from the other lowland rivers discharging to thesouth-eastern part of the Baltic Sea has characteristically depletedd13C and enriched d15N values, as it contains riverine phyto-plankton, terrigeneous vegetation and POM from industrial anddomestic waters (Maksymowska et al., 2000). Corresponding to thetemporal pattern of SPOM, the isotopic composition of the primaryconsumers, mesozooplankton and mysids shifted to be moredepleted in 13C and enriched 15N (Fig. 5). This shift indicates moreintense use of terrestrial POM after the increased river discharge inthe early autumn. However 13C-depletion in dissolved inorganiccarbon pool caused by the microbial respiration of the allochto-nous organic matter could also contribute to the decrease ofautochtonous phytoplankton d13C (Bouillon et al., 2000), makingthe two sources of POM isotopically indistinguishable. Despite
these processes, the relative contribution of the RPOM toa fraction of the SPOM in the lagoon should increase towardsautumn while the intensity of local phytoplankton productiondecreases.
Contribution of diazotrophic bacteria to the total biovolume of<70 mm phytoplankton was negligible and has no remarkableeffect on the d15N values of SPOM <70 mm, zooplankton normysids (Table 4) during the study period. The highest contributionof 36% was observed in the >70 mm fraction of phytoplankton inOctober but was not reflected in the d15N values of consumers(Table 4, Fig. 5). In 2004, the opposite pattern in mysid andzooplankton 15N dynamics was observed (Lesutien _e et al., 2007),which was most probably related to the different timing of thecyanobacteria mass development. Indeed, in summer 2004, thelargest peak of the cyanobacteria appeared in the first half ofSeptember and was followed by a decrease in mysid andzooplankton 15N (Lesutien _e et al., 2007). The situation wasdifferent in 2006. According to our unpublished data, the lowest15N of SPOM <70 mm of 2&, indicating large contribution ofnitrogen-fixing cyanobacteria, was observed between June 20 andJuly 10 and than increased gradually to 8& in October (Table 4).Following the same trend, mysid and zooplankton 15N increased(Fig. 5.), thus confirming a close coupling between SPOM andthese grazers as well as importance of diazotrophic cyanobacteriafor higher trophic levels.
4.4. Diet composition of Paramysis lacustris
On average, BPOM contributed 42–68% to the diet of Paramysislacustris, which implies great capacity of this omnivore to consumevascular plant detritus (Fig. 6). Similarly, macrophytal detritus ofa seagrass was a main food source for Neomysis americana from theNorth American estuaries during the winter months, whenphytoplankton production is low (Zagursky and Feller, 1985).Estuarine amorphous detritus, containing 3–5% of plant material,was very abundant in the stomachs of Neomysis integer in Europeanestuaries (Fockedey and Mees, 1999). Consumption and reminer-alization of detritus as an important trophic role of mysids werealso reported from coral reef lagoons (Carleton and McKinnon,2007). However, caution should be taken while quantifying thetrophic link macrophytes–detritus–mysids, because it is importantto know what fraction of detritus vs. associated microbes is actuallyassimilated (Moore et al., 2004).
As macrophyte detritus is usually low in organic N content(Webster and Benfield, 1986), mysids are not likely to meet theirnutritional requirements by feeding only on this material, even ifthe ingestion rates are very high (Zagursky and Feller, 1985).According to the mixing models, mesozooplankton-derivednitrogen accounts for about 20% of mysid assimilated nitrogen,although by biomass zooplankton contributed <13% to mysid diet.Contrary to our previous observations (Lesutien _e et al., 2007), therewas no indication of ontogenetic diet shift to greater carnivory inlarger mysids. However, the earlier observed ontogenetic diet shiftoccurred in summer, when mysids were exposed to a severalhundred times higher mesozooplankton biomass dominated bylarge slow-moving cladocerans. In autumn (this study), biomass ofthe littoral mesozooplankton is low and composed mainly of small-bodied planktonic and benthic copepods, mostly by cyclopoids(Table 3) with fast escape responses (Lampert and Sommer, 1997).During this time, the zooplankton contribution to mysid diet wasvery low (<1%), increasing to 9% in October–November (Fig. 6); thisincrease is most likely related to the increase of slower prey (i.e.,cladocerans and harpacticoids) contribution to the meso-zooplankton biomass. Benthic harpacticoids of the genus Bryo-camptus, which dominated the littoral mesozooplankton, areeuryphagous particle collectors from underwater surfaces
J. Lesutien _e et al. / Estuarine, Coastal and Shelf Science 80 (2008) 225–234 233
(Monakov, 1998). It is very likely, that their increase was related tothe increased concentration of particulate detritus in the littoralafter the breakdown of the submersed macrophytes. Together,decaying plant material and thriving detritivores can built anupshore food gradient and influence mysid aggregations, similar tothe proposed migration mechanism of Neomysis integer (Speirset al., 2002) and Mesopodopsis slabberi (Webb and Wooldridge,1990).
5. Conclusions
It is likely that both predator avoidance and changes in foodsupply drive autumn swarming of Paramysis lacustris in the littoralof the Curonian Lagoon. The use of littoral particulate organicmatter, detritus from the decaying macrophytes, and meiobenthosas food sources by mysids improves their nutritional conditionsduring this period. It also has at least two important ecologicalimplications. First, it increases organic matter transfer efficiency inthe macrophyte detritus food chain during the period when otherimportant littoral consumers, such as amphipods, are scarce (pers.observations). Second, mysid horizontal migrations increaseinshore–offshore habitat coupling: when these shallow waters areabout to freeze, mysids move back to the deeper areas of the lagoonand become available for the fish that migrate there to overwinter(Lo�zys, 2003). Thus, mysids would contribute to the fish survivalduring the winter, when other zooplankton food is scarce. Calcu-lated P. lacustris somatic production during the study period was36 g DW m�2. Assuming a 40% capture efficiency of the epibenthicsledge (Lesutien _e, unpublished) and a 10% gross growth efficiencyfor an omnivorous shrimp (Morgan, 1980), cumulative consump-tion could be as high as 900 g DW m�2. This is a substantial quantityof the organic material, mainly originating from the submersedvegetation, that is remineralized by mysids and becomes availableto the higher trophic levels in the offshore habitats.
Acknowledgements
We thank E. Griniene, R. Pilkaityte, A. Saskov and A. Kubilius(CORPI, Klaipeda University) for field and laboratory assistance, A.Sjosten (Systems Ecology, Stockholm University) for his kindpermission to use laboratory facilities, and Dr. David Harris(University of California at Davis, Stable Isotope Facility) for stableisotope analyses. Mobility grant provided to J. Lesutien _e by NordicMarine Academy is particularly appreciated. This research wassupported by EU funded projects (FW6 505446 MARBEF, MarineBiodiversity and Ecosystem Functioning, and EU FW 6 506675ALARM, Assessing Large Scale Risks for Biodiversity with testedMethods) and by The Swedish Research Council for Environment,Agricultural Sciences and Spatial Planning (FORMAS).
References
Albertsson, J., 2004. Trophic interactions involving mysid shrimps (Mysidacea) inthe near-bottom habitat in the Baltic Sea. Aquatic Ecology 38, 457–469.
Arbaciauskas, K., 2002. Ponto-Caspian Amphipods and Mysids in the Inland Watersof Lithuania: History of Introduction, Current Distribution and Relations withNative Malacostracans. In: Leppakoski, E., Gollasch, S., Olenin, S. (Eds.), InvasiveAquatic Species of Europe – Distribution, Impacts and Management. KluwerAcademic Publishers, pp. 104–115.
Bode, A., Alvarez-Ossorio, M.T., Varela, M., 2006. Phytoplankton and macrophytecontributions to littoral food webs in the Galician upwelling estimated fromstable isotopes. Marine Ecology Progress Series 318, 89–102.
Bouillon, S., Chandra Mohan, P., Sreenivas, N., Dehairs, F., 2000. Sources of sus-pended organic matter and selective feeding by zooplankton in an estuarinemangrove ecosystem as traced by stable isotopes. Marine Ecology ProgressSeries 208, 79–92.
Branstrator, D.K., Cabana, G., Mazumder, A., Rasmussen, J.B., 2000. Measuring life-history omnivory in the opossum shrimp, Mysis relicta, with stable nitrogenisotopes. Limnology and Oceanography 45, 463–467.
Carleton, J.H., McKinnon, A.D., 2007. Resident mysids: secondary production,consumption, and trophic role in a coral reef lagoon. Marine Ecology ProgressSeries 336, 89–98.
Cloern, J.E., Canuel, E.A., Harris, D., 2002. Stable carbon and nitrogen isotopecomposition of aquatic and terrestrial plants of the San Francisco Bay estuarinesystem. Limnology and Oceanography 47, 713–729.
Darnaude, A.M., 2005. Fish ecology and terrestrial carbon use in coastalareas: implications for marine fish production. Journal of Animal Ecology 74,864–876.
Fockedey, N., Mees, J., 1999. Feeding of the hyperbenthic mysid Neomysis integer inthe maximum turbidity zone of the Elbe, Westerschelde and Gironde estuaries.Journal of Marine Systems 22, 207–228.
Fry, B., Ewel, K.C., 2003. Using stable isotopes in mangrove fisheries research –a review and outlook. Isotopes in Environmental and Health Studies 39, 191–196.
Gasi�unait _e, Z.R., Daunys, D., Olenin, S., Razinkovas, A., 2008. The Curonian Lagoon.In: Schiewer, U. (Ed.), Ecology of the Baltic Coastal Waters. Ecological Studies,vol. 197. Springer-Verlag, Berlin Heidelberg, pp. 197–215.
Gorokhova, E., Hansson, S., 1999. An experimental study on variations in stablecarbon and nitrogen isotope fractionation during growth of Mysis mixta andNeomysis integer. Canadian Journal of Fisheries and Aquatic Sciences 56,2203–2210.
Grossnickle, N.E., 1982. Feeding habits of Mysis relicta – an overview. Hydrobiologia93, 101–107.
HELCOM, 1988. Guidelines for the Baltic monitoring programme for the third stage.No. 27D. Baltic Sea environment proceedings, 23–86.
Hostens, K., Mees, J., 1999. The mysid-feeding guild of demersal fishes in thebrackish zone of the Westershelde estuary. Journal of Fish Biology 55, 704–719.
Johansson, O.E., Leggett, M.F., Rudstam, L.G., Servos, M.R., Mohammadian, M.L.,Gal, G., Dermott, R.M., Hesslein, R.H., 2001. Diet of Mysis relicta in Lake Ontarioas revealed by stable isotope and gut content analysis. Canadian Journal ofFisheries and Aquatic Sciences 58, 1975–1986.
Jorgensen, S.E., Nielsen, S.N., Jorgensen, L.A., 1995. Handbook of Ecological Param-eters and Ecotoxicology. Elsevier, Amsterdam-London-New York-Tokyo, p. 1264.
Komarova, T.I., 1991. Higher Crustaceous. Mysidae (Mysidacea). Fauna of theUkraine. Naukova Dumka Publishing, Kiev, p. 104 (in Russian).
Lampert, W., Sommer, U., 1997. Limnoecology: the Ecology of Lakes and Streams.Oxford University Press, New York Oxford, p. 382.
Lesutien _e, J., Gorokhova, E., Gasi�unait _e, Z.R., Razinkovas, A., 2007. Isotopic evidencefor zooplankton as an important food source for the mysid Paramysis lacustris inthe Curonian lagon, the South-Eastern Baltic Sea. Estuarine, Coastal and ShelfScience 73, 73–80.
Linden, E., 2007. The more the merrier: swarming as an antipredator strategy in themysid Neomysis integer. Aquatic Ecology 41, 299–307.
Lo�zys, L., 2003. Seasonal migrations of pikeperch (Sander lucioperca L.) from theCuronian lagoon to the Baltic Sea and advantages of the phenomenon. ActaZoologica Lituanica 13, 188–194.
Macdonald, P.D.M., Green, P.E.J., 1988. User’s Guide to Program MIX: An InteractiveProgram for Fitting Mixtures of Distributions. Guenther Printing, Ontario,Canada, p. 75.
Machas, R., Santos, R., Peterson, B., 2006. Elemental and stable isotope compositionof Zostera noltii (Horneman) leaves during the early phases of decay ina temperate mesotidal lagoon. Estuarine, Coastal and Shelf Science 66, 21–29.
Maksymowska, D., Richard, P., Piekarek-Jankowska, H., Riera, P., 2000. Chemical andisotopic composition of the organic matter sources in the Gulf of Gdansk(Southern Baltic Sea). Estuarine, Coastal and Shelf Science 51, 585–598.
Michener, R.H., Schell, D.M., 1994. Stable Isotope Ratios as Tracers in Marine AquaticFood Webs. In: Lajhta, K., Michener, R. (Eds.), Stable Isotopes in Ecology and Envi-ronmental Science. Blackwell Scientific Publications, Oxford-Vienna, pp. 138–157.
Monakov, A.V., 1998. Feeding of Freshwater Invertebrates. Russian Academy ofSciences. A.N. Severtsov Institute of Ecological and Evolutionary Problems,Moscow, p. 319 (in Russian).
Moore, J.C., Berlow, E.L., Coleman, D.C., de Ruiter, P.C., Dong, Q., Hastings, A.,Johnson, N.C., McCann, K.S., Melville, K., Morin, P.J., Nadelhoffer, K.,Rosemond, A.D., Post, D.M., Sabo, J.L., Scow, K.M., Vanni, M.J., Wall, D.H., 2004.Detritus, trophic dynamics and biodiversity. Ecology Letters 7, 584–600.
Morgan, M.D., 1980. Grazing and predation of the grass shrimp Palaemonetes pugio.Limnology and Oceanography 25, 896–902.
Morgan, M.D., Threlkeld, S.T., 1982. Size dependant horizontal migration of Mysisrelicta. Hydrobiologia 93, 63–68.
Peterson, B.J., Fry, B., 1987. Stable isotopes in ecosystem studies. Annual Review ofEcological Systems 18, 293–320.
Phillips, D.L., Gregg, J.W., 2001. Uncertainty in source partitioning using stableisotopes. Oecologia 127, 171–179.
Phillips, D.L., Koch, P.L., 2002. Incorporating concentration dependence in stableisotope mixing models. Oecologia 130, 114–125.
Plokstien _e, D., 2002. Development and changes of the vegetation of the Kursiumarios lagoon. Sea and Environment 2, 33–41. in Lithuanian.
Post, D., 2002. Using stable isotopes to estimate trophic position: models, methods,and assumptions. Ecology 83, 703–718.
Reynolds, C.S., 2006. The Ecology of Phytoplankton. Cambridge University Press,New York, p. 535.
Rumohr, H., Brey, T., Ankar, S., 1987. A compilation of biometrics conversion factorsfor benthic invertebrates of the Baltic Sea. The Baltic Marine Biologists Publi-cation No. 9.
Speirs, D., Lawrie, S., Raffaelli, D., Gurney, W., Emes, C., 2002. Why do shallow-water predators migrate? Strategic models and empirical evidence from an

J. Lesutien _e et al. / Estuarine, Coastal and Shelf Science 80 (2008) 225–234234
estuarine mysid. Journal of Experimental Marine Biology and Ecology 280, 13–31.
Sweeting, C.J., Jennings, S., Polunin, N.V.C., 2005. Variance in isotopic signatures asa descriptor of tissue turnover and degree of omnivory. Functional Ecology 19,777–784.
Toda, H., Wada, E., 1990. Use of 15N/14N rations to evaluate the food source of themysid, Neomysis intermedia Czerniawsky, in a eutrophic lake in Japan. Hydro-biologia 194, 85–90.
Van Donk, E., 2007. Chemical information transfer in freshwater plankton.Ecological Informatics 2, 112–120.
Viherluoto, M., Kuosa, H., Flinkman, J., Viitasalo, M., 2000. Food utilisation of pelagicmysids, Mysis mixta and M. relicta, during their growing season in the northernBaltic Sea. Marine Biology 136, 553–559.
Viherluoto, M., Viitasalo, M., 2001. Temporal variability in functional responses andprey selectivity of the pelagic mysid, Mysis mixta, in natural prey assemblages.Marine Biology 138, 575–583.
Webb, P., Wooldridge, T.H., 1990. Diel horizontal migration of Mesopodopsis slabberi(Crustacea: Mysidacea) in Algoa Bay, southern Africa. Marine Ecology ProgressSeries 62, 73–77.
Webster, J.R., Benfield, E.F., 1986. Vascular plant breakdown in freshwater ecosys-tems. Annual Review of Ecology and Systematics 17, 567–594.
Zagursky, G., Feller, R.J., 1985. Macrophyte detritus in the winter diet of the estu-arine mysid, Neomysis americana. Estuaries 8, 355–362.
Ziliukas, V., 2003. Assessment of the dynamics of main ecological parameters of thefish fry community in the coastal zone of the Curonian Lagoon near Vent _e cape.Acta Zoologica Lithuanica 13, 167–175.