Robust Corporate Social Responsibility investment screening
11
Analysis Robust Corporate Social Responsibility investment screening Filip Van den Bossche ⁎, Nicky Rogge, Kurt Devooght, Tom Van Puyenbroeck Hogeschool-Universiteit Brussel (HUBrussel), Centre for Economics & Management (CEM), Stormstraat 2, 1000 Brussels, Belgium Katholieke Universiteit Leuven (KULeuven), Faculty of Business and Economics, Naamsestraat 69, 3000 Leuven, Belgium abstract article info Article history: Received 5 March 2009 Received in revised form 23 December 2009 Accepted 23 December 2009 Available online 27 January 2010 Keywords: Corporate Social Responsibility Asset selection Composite indicators Robustness analysis Although a priori company screening is a constitutive feature of Socially Responsible Investment (SRI) funds, it is not easy to substantiate that such screening effectively differentiates between companies on the basis of their Corporate Social Responsibility (CSR) calibre. Fundamentally, this is because CSR comprises several dimensions for which an undisputed aggregative model is lacking. We assess the robustness of companies' CSR rankings with respect to several modelling assumptions. We then build on Gini's transvariation concept to select/reject specific companies in the SRI eligible universe of assets. We illustrate our approach with some specific screening issues as confronted by the ethical advisory committee of a large Belgian bank. © 2010 Elsevier B.V. All rights reserved. 1. Introduction In the slipstream of the growing attention for Corporate Social Responsibility (CSR), the measurement of the CSR performance of companies has become a booming business. Governments, non- governmental organisations, academics and not at least the companies themselves gather interest in quantitative indicators that measure companies' corporate governance and environmental, social and economic performance. The growing industry of Ethical Investment or Socially Responsible Investment (SRI) also requires detailed CSR related information to identify companies deemed acceptable for investment. Although SRI is often associated with investment in small enterprises with socially highly relevant projects (e.g. green economy), the financial markets are entered by a growing number of SRI funds composed out of mainstream publicly listed companies with an acceptable corporate social performance record. In the latter case, SRI boils down to an application of CSR criteria to investment decisions, which makes it obvious that an adequate assessment of CSR is crucial for SRI funds. Their defining quality is the presence of so-called investment screens that are used to select or exclude assets on the basis of some form of CSR assessment prior to the actual investment decision (e.g. Renneboog et al., 2008). In point of fact, this intrinsic two-stage nature of SRI (first screening, then investing) is often mirrored by the organizational set-up of SRI funds. Some CSR specialists (in-house research teams or independent rating agencies) are responsible for creating a so-called “eligible universe” of companies. Regular asset managers subsequently select assets from this universe, basing themselves on standard financial and economic investment criteria. The problem addressed in this paper is cast against this realistic division-of-labor background. 1 Taking it that the existence of an “eligible universe” is the foundational core of SRI funds, the important issue addressed in this paper is to what extent the inclusion/exclusion of specific assets can be substantiated. It should be clear from the outset that we do not aim at providing some (seemingly) clear-cut intrinsic CSR criterion to deal with this issue. Such an approach seems ill-suited, as the essential difficulty when deciding whether or not an asset will be included in the SRI universe is that the underlying selection standard, CSR, is a complex multidimensional phenomenon. The assessment of a company's CSR calibre is accordingly intricate. This factual statement helps to explain why CSR ratings have been critically appraised as requiring “methodologically demanding judgments that are not always based on neutral criteria”, even as being “mostly characterised by rather subjective selection processes” (Steurer et al., 2008). In fact, we take it that such subjectivity is in the end inescapable, given the underlying ontological problem of adequately gauging the dense concept of CSR. Our methodology therefore builds on the intellectual position that it is effectively impossible to justify any exact CSR ranking of companies given the many modelling assumptions that such an exact ranking requires. Yet we show the merits of quantifying the rankings' sensitivity to these assumptions, paving the way for an investigation of their robustness to changing modelling assumptions. Ecological Economics 69 (2010) 1159–1169 Abbreviations: CSR, Corporate Social Responsibility; SRI, Socially Responsible Investment; EIRiS, Ethical Investment Research Services. ⁎ Corresponding author. Tel.: +32 2 608 14 17; fax: +32 2 217 64 64. E-mail addresses: fi[email protected] (F. Van den Bossche), [email protected] (N. Rogge), [email protected] (K. Devooght), [email protected] (T. Van Puyenbroeck). 1 See e.g. Hallerbach et al. (2004) for an alternative, integrated approach. 0921-8009/$ – see front matter © 2010 Elsevier B.V. All rights reserved. doi:10.1016/j.ecolecon.2009.12.012 Contents lists available at ScienceDirect Ecological Economics journal homepage: www.elsevier.com/locate/ecolecon
-
Upload
independent -
Category
Documents
-
view
0 -
download
0
Transcript of Robust Corporate Social Responsibility investment screening
Ecological Economics 69 (2010) 1159–1169
Contents lists available at ScienceDirect
Ecological Economics
j ourna l homepage: www.e lsev ie r.com/ locate /eco lecon
Analysis
Robust Corporate Social Responsibility investment screening
Filip Van den Bossche ⁎, Nicky Rogge, Kurt Devooght, Tom Van PuyenbroeckHogeschool-Universiteit Brussel (HUBrussel), Centre for Economics & Management (CEM), Stormstraat 2, 1000 Brussels, BelgiumKatholieke Universiteit Leuven (KULeuven), Faculty of Business and Economics, Naamsestraat 69, 3000 Leuven, Belgium
Abbreviations: CSR, Corporate Social ResponsibiliInvestment; EIRiS, Ethical Investment Research Services⁎ Corresponding author. Tel.: +32 2 608 14 17; fax: +
E-mail addresses: [email protected]@hubrussel.be (N. Rogge), [email protected]@hubrussel.be (T. Van Puyenbroec
0921-8009/$ – see front matter © 2010 Elsevier B.V. Aldoi:10.1016/j.ecolecon.2009.12.012
a b s t r a c t
a r t i c l e i n f oArticle history:Received 5 March 2009Received in revised form 23 December 2009Accepted 23 December 2009Available online 27 January 2010
Keywords:Corporate Social ResponsibilityAsset selectionComposite indicatorsRobustness analysis
Although a priori company screening is a constitutive feature of Socially Responsible Investment (SRI) funds,it is not easy to substantiate that such screening effectively differentiates between companies on the basis oftheir Corporate Social Responsibility (CSR) calibre. Fundamentally, this is because CSR comprises severaldimensions for which an undisputed aggregative model is lacking. We assess the robustness of companies'CSR rankings with respect to several modelling assumptions. We then build on Gini's transvariation conceptto select/reject specific companies in the SRI eligible universe of assets. We illustrate our approach with somespecific screening issues as confronted by the ethical advisory committee of a large Belgian bank.
ty; SRI, Socially Responsible.32 2 217 64 64.(F. Van den Bossche),ubrussel.be (K. Devooght),k). 1 See e.g. Hallerba
l rights reserved.
© 2010 Elsevier B.V. All rights reserved.
1. Introduction
In the slipstream of the growing attention for Corporate SocialResponsibility (CSR), the measurement of the CSR performance ofcompanies has become a booming business. Governments, non-governmental organisations, academics and not at least the companiesthemselves gather interest in quantitative indicators that measurecompanies' corporate governance and environmental, social andeconomic performance. The growing industry of Ethical Investment orSocially Responsible Investment (SRI) also requires detailed CSR relatedinformation to identify companies deemed acceptable for investment.Although SRI is often associated with investment in small enterpriseswith socially highly relevant projects (e.g. green economy), thefinancialmarkets are entered by a growing number of SRI funds composed out ofmainstream publicly listed companies with an acceptable corporatesocial performance record. In the latter case, SRI boils down to anapplication of CSR criteria to investment decisions, which makes itobvious that anadequate assessmentof CSR is crucial for SRI funds. Theirdefining quality is the presence of so-called investment screens that areused to select or exclude assets on the basis of some form of CSRassessment prior to the actual investment decision (e.g. Rennebooget al., 2008). In point of fact, this intrinsic two-stage nature of SRI(first screening, then investing) is often mirrored by the organizationalset-up of SRI funds. Some CSR specialists (in-house research teams or
independent rating agencies) are responsible for creating a so-called“eligible universe” of companies. Regular asset managers subsequentlyselect assets from this universe, basing themselves on standardfinancialand economic investment criteria. The problem addressed in this paperis cast against this realistic division-of-labor background.1 Taking itthat the existence of an “eligible universe” is the foundational core of SRIfunds, the important issue addressed in this paper is to what extent theinclusion/exclusion of specific assets can be substantiated.
It should be clear from the outset that we do not aim at providingsome (seemingly) clear-cut intrinsic CSR criterion to deal with thisissue. Such an approach seems ill-suited, as the essential difficultywhen deciding whether or not an asset will be included in the SRIuniverse is that the underlying selection standard, CSR, is a complexmultidimensional phenomenon. The assessment of a company'sCSR calibre is accordingly intricate. This factual statement helps toexplain why CSR ratings have been critically appraised as requiring“methodologically demanding judgments that are not always basedon neutral criteria”, even as being “mostly characterised by rathersubjective selection processes” (Steurer et al., 2008). In fact, we take itthat such subjectivity is in the end inescapable, given the underlyingontological problem of adequately gauging the dense concept ofCSR. Our methodology therefore builds on the intellectual positionthat it is effectively impossible to justify any exact CSR ranking ofcompanies given the many modelling assumptions that such an exactranking requires. Yet we show the merits of quantifying the rankings'sensitivity to these assumptions, paving the way for an investigationof their robustness to changing modelling assumptions.
ch et al. (2004) for an alternative, integrated approach.
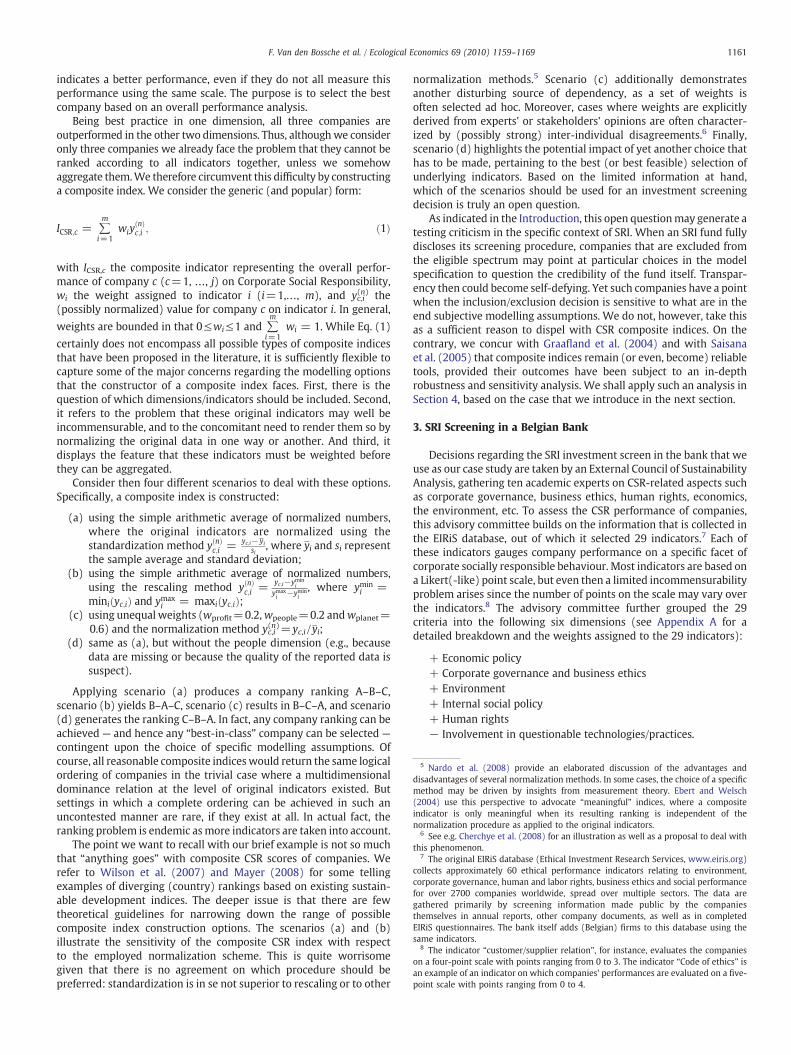
Table 1Three dimensions of Corporate Social Responsibility.
People Planet Profit
Company A 0.8 0.4 0.053Company B 0.4 0.1 0.093Company C 0.1 1 0.055
1160 F. Van den Bossche et al. / Ecological Economics 69 (2010) 1159–1169
In line with a fairly large literature, we shall take it that a screeningexercise requires reducing the information contained in various one-dimensional indicators, each describing an important aspect of CSR, insuch a way that the eventual ranking of companies (andthe concomitant selection of a “best-in-class” subset of these rankedcompanies) is based on the construction of company-specificcomposite CSR indices.2 The idea to use a composite index thataggregates the diverse dimensions of CSR into one number builds onthe recognition that the very multidimensionality of CSR may impedean adequate comparison among companies. Ideally, a compositeindex enables assessing the CSR performance of a company quicklyand efficiently and, moreover, allows for benchmarking companieswithin a particular sector (Krajnc and Glavič, 2005). The numericalnature of such indices adds a flavour of exactness to the screeningproblem, but we rather consider the construction of a compositeindex as illustrative for the subjectivity problem associated withCSR ratings. That is, the transparency and simplicity induced byresorting to a summary index manifestly raises the problem “that theresearchers who construct the benchmark make choices for thestakeholders who want to judge the company. Stakeholders shouldthus be aware that these outcomes depend on many assumptions”(Graafland et al., 2004, p. 139).
It is indeed well-known that different construction methodologiesfor such composite indices exist and that, lacking any clear theoreticalguidance as to what unequivocally constitutes the best underlyingCSR model, the eventual ranking of companies may largely be drivenby the specific modelling assumptions taken. Here, it should bestressed that the latter problem is not genuine to CSR indices; it ispervasive in themany fields for which composite indicators have beendeveloped. Thus, we shall address this concern using an appropriatemethodology that has been advocated for composite indicators ingeneral (see e.g. Saisana et al., 2005) and has been endorsed bysupranational organisations such as the European Commission andthe OECD (Nardo et al., 2008).
Essentially, this methodology seeks to transcend the subjectivityproblem by assessing to what extent alternative modelling assump-tions (that are, indeed, hardly open to objectification) bear oneventual company rankings. In short, if a company ranks consistentlyhigh, regardless of variations in the construction methodology, thereis a good case to be made that the company's underlying “rawCSR data”, rather than the index construction itself, are ultimatelythe major drivers of its ranking, thereby confirming its robustnessto methodological choices. In this sense a robustness analysis isconducive in validating the result of subjective decisions. However,what distinguishes the problem at hand from the conventional use ofcomposite indicators is that SRI screening obliges to go beyond a mereranking of companies. Modelling uncertainty possibly carries over,through the ranking, to the very heart of SRI, viz. the composition ofthe eligible universe. This requires complementing the existingrobustness assessment methodology with a tool that helps in decidingwhether a company should be in the eligible universe or not. It isexactly the latter which constitutes the central contribution of thecurrent paper.
The SRI company selection problem is ultimately a practical one.Indeed, to illustrate our proposedmethodologywe shall address someconcrete questions arising within the External Council of Sustainabil-ity Analysis that creates the SRI eligible universe for a large Belgianbank. Yet such practical problems relate to deeper issues regardingthe desired level of transparency that should be upheld in SRI. Taking
2 Evidently, other avenues for CSR assessment have been explored as well. Ness etal. (2007) discuss, next to indices, also product-related assessments and integratedassessment tools. Specifically for CSR, Schäfer (2005) provides a closer look at thedifferent rating approaches that are used, thus documenting a crucial stage incomposite indicator construction that is not addressed in this paper. As pointed out bySchäfer, such approaches produce ratings that serve as an input for sustainability andCSR indices.
its own transparency seriously, the organization we use for our casestudy extensively documents the working of its screening procedureon its website (www.kbcam.be). While this provides an exemplarysignal to both screened companies and (potential) investors, thisdisclosure occasionally leads to discussions on the appropriateness ofsome of the dimensions included in the CSR index, the suitability ofthe defined dimension weights, and the potential influence of theused aggregation scheme.
Given the modelling uncertainty that inevitably arises when tryingto gauge Corporate Social Responsibility, the transparency dilemmainstigates (i) the need for a thorough uncertainty analysis, and (ii) anasset selection procedure that is both robust and easy to convey tostakeholders, including the (sometimes unsolicited) firms that eventu-ally will find themselves positioned at one side of an investment screen.The latter is particularly relevant for investors in the light of the growingevidence of a positive— bidirectional and simultaneous— link betweencorporate social performance and financial performance (see e.g.Waddock and Graves, 1997, and the meta-analysis of Orlitzky et al.(2003). Investors aware of this result might require an adequateinvestment screen to best guarantee financial results and, not to theleast, environmental andsocial improvements. In this sense, theproblemwe study and the solution we propose are evidently not confined to thepractical difficulties confronted by one particular SRI fund. Moregenerally, the need for transparently and judiciously communicatingCSR ratings bears on the credibility of various “infomediaries” that actas information brokers between firms and stakeholders in the field ofCSR, and which have a potentially crucial role in fostering the CSRperformance of firms (see e.g. Dubbink et al., 2008).3,4
The rest of this paper is laid out as follows. The next section brieflyrecalls the subjectivity problem inherent in the construction ofcomposite indicators, and its bearing on an investment screen bymeans of a simplified example. Section 3 describes the data and somespecific questions raised by those responsible for the investment screenin our case study. Section 4 then assesses the robustness and sensitivityof companies' rankings to differentmodelling assumptions. The toolboxwe discuss broadens the scope of the robustness analysis advocated byGraafland et al. (2004). Building on Gini's concept of “transvariazione”(Dagum, 1960), we present a robust screening method in Section 5.Finally, Section 6 offers some summarizing comments.
2. Composite CSR Indices for SRI Screening: Handle with Care
An example recalls the type of assumptions that have to be madewhen constructing a composite index. Suppose for simplicity that onlythree indicators are available, each of them capturing an importantCSR aspect. The “People” indicator could for instance refer to thefemale/male ratio in top level jobs; the “Planet” indicator is based on aquantitative rating by experts from NGOs of the companies'environmental policies, while the “Profit” indicator reports the figuresfor some ratio such as return on assets. Indicator scores for three firmsare shown in Table 1. For each of the three indicators, a higher value
3 For example, stakeholders may want to know why a firm is left in or out an SRIfinancial index (such as e.g. the Domini Social 400 Index, the FTSE4Good indices, theEthibel Sustainability Index, the Dow Jones Sustainability Index, etc.).
4 Our methodology may thus be at least partially useful in addressing the critique ofSchäfer (2005) that “while CSR rating institutions call for corporate transparency andoperate as ‘social accountants’, the industry itself is currently lacking sufficienttransparency.”
5 Nardo et al. (2008) provide an elaborated discussion of the advantages anddisadvantages of several normalization methods. In some cases, the choice of a specificmethod may be driven by insights from measurement theory. Ebert and Welsch(2004) use this perspective to advocate “meaningful” indices, where a compositeindicator is only meaningful when its resulting ranking is independent of thenormalization procedure as applied to the original indicators.
6 See e.g. Cherchye et al. (2008) for an illustration as well as a proposal to deal withthis phenomenon.
7 The original EIRiS database (Ethical Investment Research Services, www.eiris.org)collects approximately 60 ethical performance indicators relating to environment,corporate governance, human and labor rights, business ethics and social performancefor over 2700 companies worldwide, spread over multiple sectors. The data aregathered primarily by screening information made public by the companiesthemselves in annual reports, other company documents, as well as in completedEIRiS questionnaires. The bank itself adds (Belgian) firms to this database using thesame indicators.
8 The indicator “customer/supplier relation”, for instance, evaluates the companieson a four-point scale with points ranging from 0 to 3. The indicator “Code of ethics” isan example of an indicator on which companies' performances are evaluated on a five-point scale with points ranging from 0 to 4.
1161F. Van den Bossche et al. / Ecological Economics 69 (2010) 1159–1169
indicates a better performance, even if they do not all measure thisperformance using the same scale. The purpose is to select the bestcompany based on an overall performance analysis.
Being best practice in one dimension, all three companies areoutperformed in the other two dimensions. Thus, althoughwe consideronly three companies we already face the problem that they cannot beranked according to all indicators together, unless we somehowaggregate them.We therefore circumvent this difficulty by constructinga composite index. We consider the generic (and popular) form:
ICSR;c = ∑m
i=1wiy
ðnÞc;i ; ð1Þ
with ICSR,c the composite indicator representing the overall perfor-mance of company c (c=1, …, j) on Corporate Social Responsibility,wi the weight assigned to indicator i (i=1,…, m), and yc,i
(n) the(possibly normalized) value for company c on indicator i. In general,
weights are bounded in that 0≤wi≤1 and ∑m
i=1wi = 1. While Eq. (1)
certainly does not encompass all possible types of composite indicesthat have been proposed in the literature, it is sufficiently flexible tocapture some of the major concerns regarding the modelling optionsthat the constructor of a composite index faces. First, there is thequestion of which dimensions/indicators should be included. Second,it refers to the problem that these original indicators may well beincommensurable, and to the concomitant need to render them so bynormalizing the original data in one way or another. And third, itdisplays the feature that these indicators must be weighted beforethey can be aggregated.
Consider then four different scenarios to deal with these options.Specifically, a composite index is constructed:
(a) using the simple arithmetic average of normalized numbers,where the original indicators are normalized using thestandardization method yðnÞc;i = yc;i− yi
si, where yi and si represent
the sample average and standard deviation;(b) using the simple arithmetic average of normalized numbers,
using the rescaling method yðnÞc;i = yc;i−ymini
ymaxi −ymin
i, where ymin
i =miniðyc;iÞ and ymax
i = maxiðyc;iÞ;(c) using unequal weights (wprofit=0.2,wpeople=0.2 andwplanet=
0.6) and the normalization method yc,i(n)=yc,i / yi;
(d) same as (a), but without the people dimension (e.g., becausedata are missing or because the quality of the reported data issuspect).
Applying scenario (a) produces a company ranking A–B–C,scenario (b) yields B–A–C, scenario (c) results in B–C–A, and scenario(d) generates the ranking C–B–A. In fact, any company ranking can beachieved — and hence any “best-in-class” company can be selected —
contingent upon the choice of specific modelling assumptions. Ofcourse, all reasonable composite indiceswould return the same logicalordering of companies in the trivial case where a multidimensionaldominance relation at the level of original indicators existed. Butsettings in which a complete ordering can be achieved in such anuncontested manner are rare, if they exist at all. In actual fact, theranking problem is endemic asmore indicators are taken into account.
The point we want to recall with our brief example is not so muchthat “anything goes” with composite CSR scores of companies. Werefer to Wilson et al. (2007) and Mayer (2008) for some tellingexamples of diverging (country) rankings based on existing sustain-able development indices. The deeper issue is that there are fewtheoretical guidelines for narrowing down the range of possiblecomposite index construction options. The scenarios (a) and (b)illustrate the sensitivity of the composite CSR index with respectto the employed normalization scheme. This is quite worrisomegiven that there is no agreement on which procedure should bepreferred: standardization is in se not superior to rescaling or to other
normalization methods.5 Scenario (c) additionally demonstratesanother disturbing source of dependency, as a set of weights isoften selected ad hoc. Moreover, cases where weights are explicitlyderived from experts' or stakeholders' opinions are often character-ized by (possibly strong) inter-individual disagreements.6 Finally,scenario (d) highlights the potential impact of yet another choice thathas to be made, pertaining to the best (or best feasible) selection ofunderlying indicators. Based on the limited information at hand,which of the scenarios should be used for an investment screeningdecision is truly an open question.
As indicated in the Introduction, this open questionmay generate atesting criticism in the specific context of SRI. When an SRI fund fullydiscloses its screening procedure, companies that are excluded fromthe eligible spectrum may point at particular choices in the modelspecification to question the credibility of the fund itself. Transpar-ency then could become self-defying. Yet such companies have a pointwhen the inclusion/exclusion decision is sensitive to what are in theend subjective modelling assumptions. We do not, however, take thisas a sufficient reason to dispel with CSR composite indices. On thecontrary, we concur with Graafland et al. (2004) and with Saisanaet al. (2005) that composite indices remain (or even, become) reliabletools, provided their outcomes have been subject to an in-depthrobustness and sensitivity analysis. We shall apply such an analysis inSection 4, based on the case that we introduce in the next section.
3. SRI Screening in a Belgian Bank
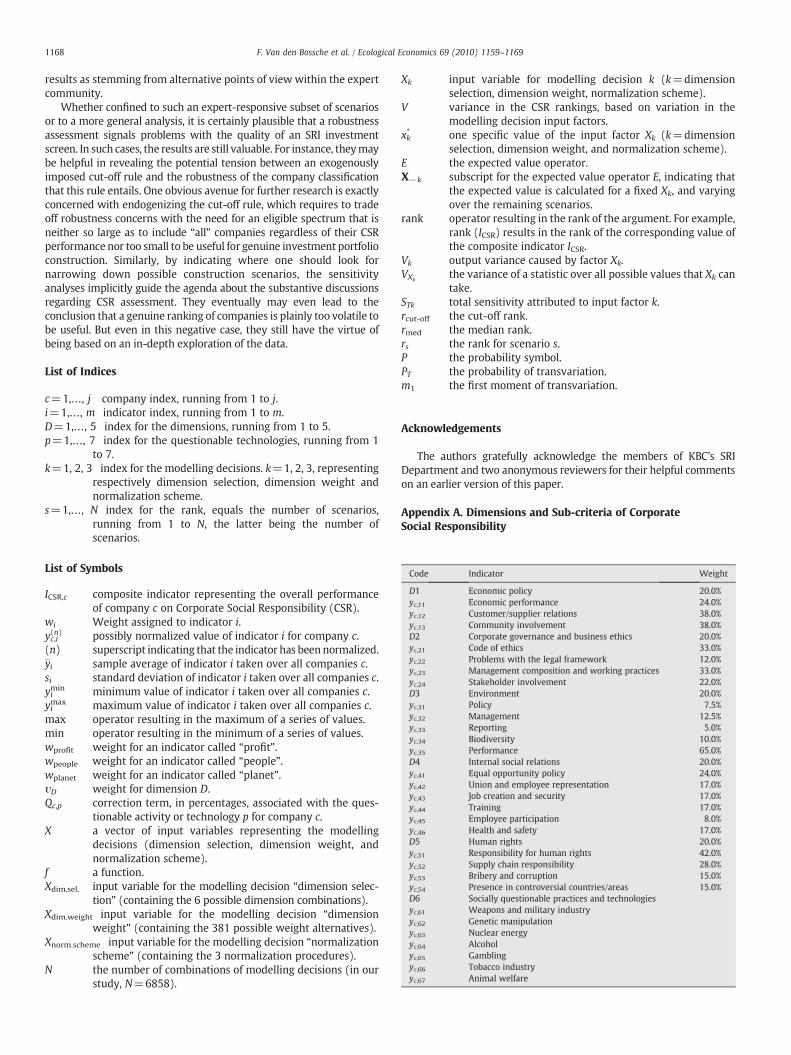
Decisions regarding the SRI investment screen in the bank that weuse as our case study are taken by an External Council of SustainabilityAnalysis, gathering ten academic experts on CSR-related aspects suchas corporate governance, business ethics, human rights, economics,the environment, etc. To assess the CSR performance of companies,this advisory committee builds on the information that is collected inthe EIRiS database, out of which it selected 29 indicators.7 Each ofthese indicators gauges company performance on a specific facet ofcorporate socially responsible behaviour. Most indicators are based ona Likert(-like) point scale, but even then a limited incommensurabilityproblem arises since the number of points on the scale may vary overthe indicators.8 The advisory committee further grouped the 29criteria into the following six dimensions (see Appendix A for adetailed breakdown and the weights assigned to the 29 indicators):
+ Economic policy+ Corporate governance and business ethics+ Environment+ Internal social policy+ Human rights− Involvement in questionable technologies/practices.
1162 F. Van den Bossche et al. / Ecological Economics 69 (2010) 1159–1169
The first five dimensions contribute positively to the companies'overall evaluation while the opposite holds for “Involvement inQuestionable Technologies/Practices”. This negative dimensionentails a correction for companies that participate or invest indisputable activities or technologies. In cases where such engagementis too strong, companies are directly excluded.9
The introduction of the group structure and the penalty in thegeneral Eq. (1) yields the following CSR composite index:
ICSR;c = ∑5
D=1υD ∑
i∈Dwiy
ðnÞc;i
� �" #× 1− ∑
7
p=1Qc;p
!; ð2Þ
with ∑i∈D
wiyðnÞc;i the performance of company c in dimension D (using
within-dimension weights wi and normalized indicators yc,i(n)), υD theweight of dimension D, and Qc,p the correction term, in percentages,associated with the questionable activity or technology p (p=1,…, 7).The composite index used by the bank builds on (i) the six dimensionslisted above, (ii) unequal weights wi (see Appendix A), (iii) the re-scaling normalization method yðnÞc;i = yc;i−ymin
iymaxi −ymin
i, and (iv) equal weights
υD for the aforementioned CSR dimensions. A company ranking isthen constructed per industry sector, and the 40% highest rankedcompanies in each sector constitute the eligible universe.10 The bank'sasset management group independently operates several ethicalinvestment (equity and/or bond) funds based on these screeningdecisions.
The advisory council uses budget allocation methods in which“100 points” are distributed (equally) over the five CSR dimensionsand (unequally) within each dimension, and the final choices aretaken to reflect a consensuswithin the council. Nevertheless, althoughthe indicator weights wi are actually not questioned by the membersof the advisory council, a recurring issue in the debates preciselyrevolves around the exact specification of the dimension weightvalues υD. Is, for instance, equal weighting of the five first dimensionsthe most appropriate choice? A second issue pertains to the inclusion/exclusion of dimensions itself, and of the “Economic Policy”dimension in particular. On the one hand, this dimension is importantfor an integral assessment of CSR (cf. the “Profit” aspect). On the otherhand, the underlying economic data are typically taken into account ina regular investment analysis that is conducted anyhow (and at amore detailed level) by the asset management department. Third,there is the meta-issue that, whatever position is eventually upheldregarding the former two problems, these choices may affect thecomposition of the SRI asset universe.
4. Robustness and Sensitivity Analysis of the CSR Index
Given Eq. (2), the concerns of the advisory council are part of abroader set of modelling options that have to be specified. Elementsthat could be questioned are the dimension and indicator selection(D and yc,i), the dimension and indicator weights (υD and wi), thenormalization method, represented by the (n) in yc,i
(n), and thecorrection terms, Qc,p. We shall here focus on the impact of choices
9 The seven activities/technologies involved are the military industry, geneticengineering, nuclear power, alcohol, gambling, tobacco and animal testing. The extentof the correction further depends on a company's participation level. For instance,when a company is present in the military industry, it is excluded from the eligibleuniverse if it produces nuclear weapons or generates more than 5% of its revenue frominvesting in vital weapon components or complete weapon systems. If a company'srevenue from such activities is less than 5% of its total revenue, it gets a negativecorrection of 6%. For producing non-vital components the negative correction issmaller, etc.10 For both the mining and the energy sector, only the 20% best are admitted.Furthermore, an additional negative exclusion criterion is applied; a company rankingacross all sectors is applied for each dimension separately and the bottom 10% ofcompanies within each dimension is excluded from the SRI universe.
with respect to D, υD and the normalization method on the ranking of120 companies within the general retailing sector.
Our analysis builds on the methodology developed by Saisana et al.(2005). Consider ICSR= f(X), where ICSR is the model output, thecomposite CSR index, and X=(Xdim.sel., Xdim.weight., Xnorm.scheme) is avector of 3 input variables representing the modelling decisions. Foreach of these variables several scenarios are defined. For Xdim.sel weconsider six possible dimension selections: one selection includes all sixdimensions, the other five selections each time exclude one of thepositively contributing dimensions.11,12 For the dimension weights υDwe consider several scenarios, with weights varying around the equalweighting scheme that is currently used. Based on the informationstemming frommembers of the advisory committee a limited degree ofvariation seems reasonable. Accordingly, we allow the weights of thepositive dimensions to vary between 10% and 30% (using a 5% interval)under the constraint that the weights sum up to 100%. In total,this results in 381 weight combinations, all included in Xdim.weight.To normalize the data, three normalization procedures are defined inXnorm.scheme: the ratio of the indicator value to its mean (yc,i(n)=yc,i / yi),the standardized normalization yðnÞc;i = yc;i− yi
si, and the rescaling nor-
malization procedure yðnÞc;i = yc;i−ymini
ymaxi −ymin
i. Hence, N=(6×381×3)=6858
combinations of modelling options are possible, each combinationresulting in a particular construction method for the composite CSRindex and, consequently, a different ranking and selection of companiesin the eligible universe. We slightly depart from Saisana et al. (2005)in that we consider all these scenarios in the sequel, rather than arandomly generated subset. Consequently, for each of the 120 generalretailers 6858 composite CSR indices and a range of associated ranks arecomputed. The scenario as used by the advisory committee (i.e., alldimensions included and equally weighted, and the rescaling normal-ization procedure) is one of these scenarios.
It is worthwhile to stress that the specific scenarios we chose to dealwith are based on the main methodological concerns as raised withinthe advisory council. For composite indicators at large, the extent ofmodelling uncertainty and, hence, alternative scenarios, is far bigger.Thuswe largelyneglect, for instance, thequestionof possible correlationamong indicators and its effect on indicator selection, alternativeaggregation methods13, alternative weighting methods (be it opinion-driven, e.g. based on the Analytical Hierarchy Process, or data-driven),etc.We refer the interested reader toNardo et al. (2008) to get an idea ofthe vast spectrumofmodelling decisions that can in fact be taken. As faras our subsequent analysis is concerned,we note,first, that it can readilybe extended to include the impact of such other subjective choices and,second, that we believe there is somemerit in narrowing down possiblescenarios in such a way that they reflect themajor debates between theexperts involved with the construction and use of a composite index(we return to this point in the concluding section).
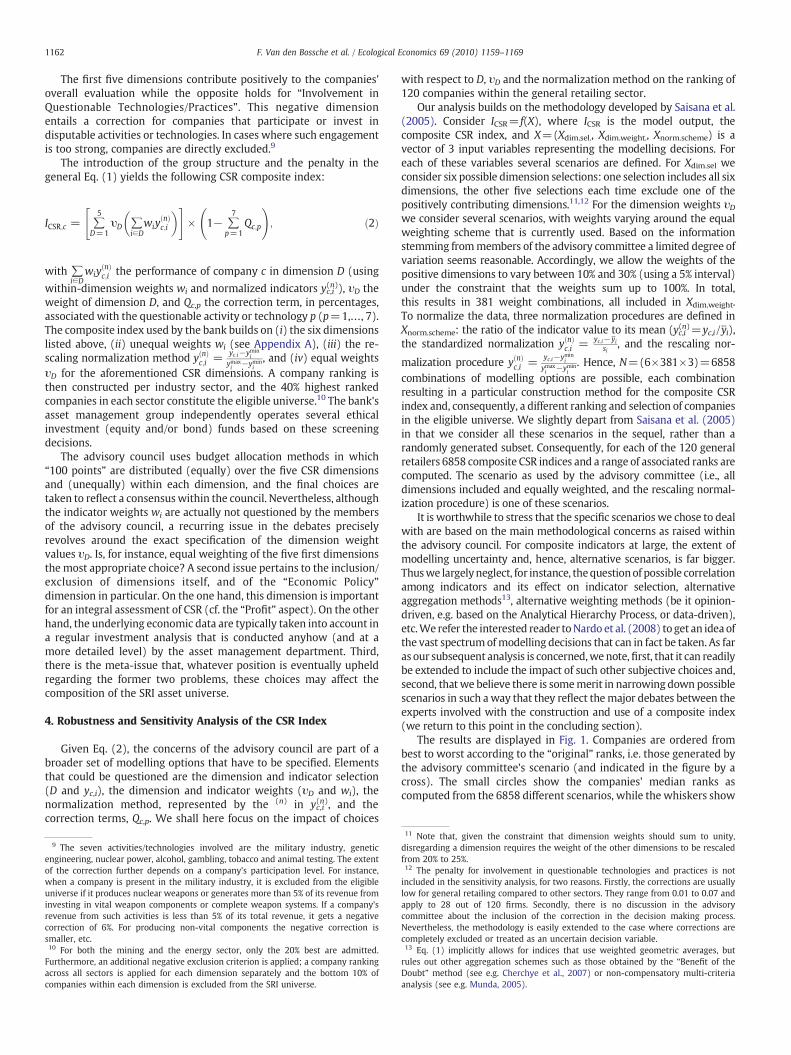
The results are displayed in Fig. 1. Companies are ordered frombest to worst according to the “original” ranks, i.e. those generated bythe advisory committee's scenario (and indicated in the figure by across). The small circles show the companies' median ranks ascomputed from the 6858 different scenarios, while the whiskers show
11 Note that, given the constraint that dimension weights should sum to unity,disregarding a dimension requires the weight of the other dimensions to be rescaledfrom 20% to 25%.12 The penalty for involvement in questionable technologies and practices is notincluded in the sensitivity analysis, for two reasons. Firstly, the corrections are usuallylow for general retailing compared to other sectors. They range from 0.01 to 0.07 andapply to 28 out of 120 firms. Secondly, there is no discussion in the advisorycommittee about the inclusion of the correction in the decision making process.Nevertheless, the methodology is easily extended to the case where corrections arecompletely excluded or treated as an uncertain decision variable.13 Eq. (1) implicitly allows for indices that use weighted geometric averages, butrules out other aggregation schemes such as those obtained by the “Benefit of theDoubt” method (see e.g. Cherchye et al., 2007) or non-compensatory multi-criteriaanalysis (see e.g. Munda, 2005).
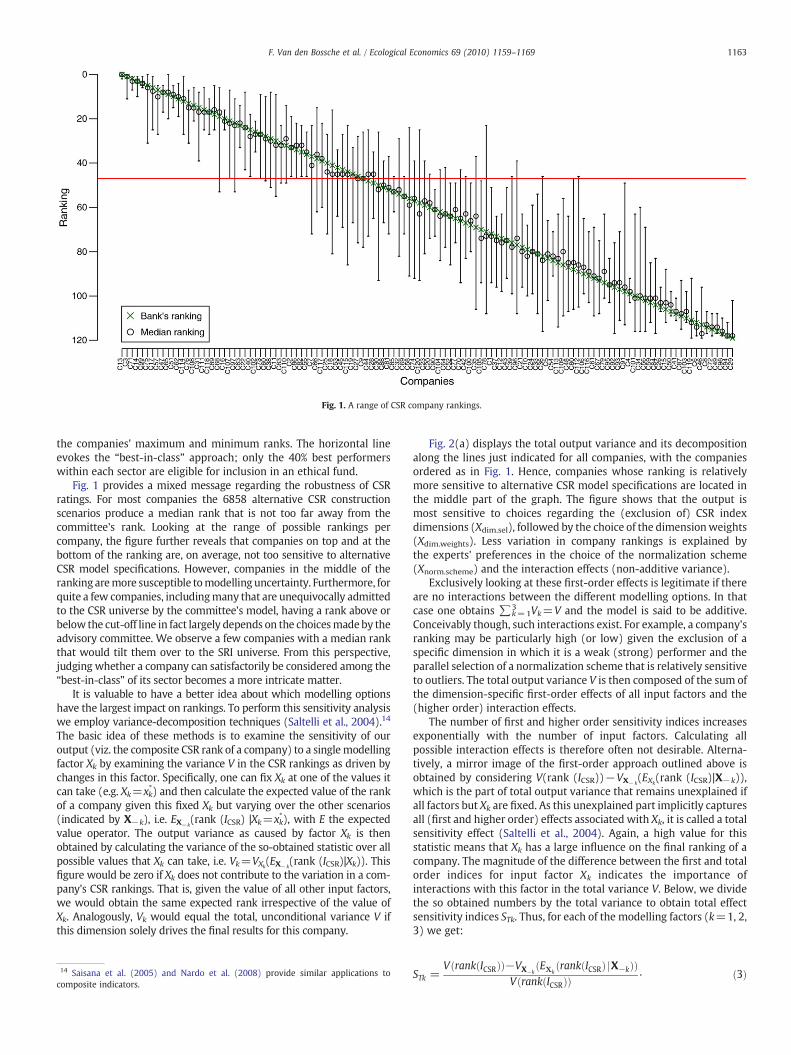
Fig. 1. A range of CSR company rankings.
1163F. Van den Bossche et al. / Ecological Economics 69 (2010) 1159–1169
the companies' maximum and minimum ranks. The horizontal lineevokes the “best-in-class” approach; only the 40% best performerswithin each sector are eligible for inclusion in an ethical fund.
Fig. 1 provides a mixed message regarding the robustness of CSRratings. For most companies the 6858 alternative CSR constructionscenarios produce a median rank that is not too far away from thecommittee's rank. Looking at the range of possible rankings percompany, the figure further reveals that companies on top and at thebottom of the ranking are, on average, not too sensitive to alternativeCSR model specifications. However, companies in the middle of theranking aremore susceptible tomodelling uncertainty. Furthermore, forquite a few companies, includingmany that are unequivocally admittedto the CSR universe by the committee's model, having a rank above orbelow the cut-off line in fact largely depends on the choicesmadeby theadvisory committee. We observe a few companies with a median rankthat would tilt them over to the SRI universe. From this perspective,judging whether a company can satisfactorily be considered among the“best-in-class” of its sector becomes a more intricate matter.
It is valuable to have a better idea about which modelling optionshave the largest impact on rankings. To perform this sensitivity analysiswe employ variance-decomposition techniques (Saltelli et al., 2004).14
The basic idea of these methods is to examine the sensitivity of ouroutput (viz. the composite CSR rank of a company) to a singlemodellingfactor Xk by examining the variance V in the CSR rankings as driven bychanges in this factor. Specifically, one can fix Xk at one of the values itcan take (e.g. Xk=xk
*) and then calculate the expected value of the rankof a company given this fixed Xk but varying over the other scenarios(indicated by X−k), i.e. EX−k
(rank (ICSR) |Xk=xk*), with E the expected
value operator. The output variance as caused by factor Xk is thenobtained by calculating the variance of the so-obtained statistic over allpossible values that Xk can take, i.e. Vk=VXk
(EX−k(rank (ICSR)|Xk)). This
figure would be zero if Xk does not contribute to the variation in a com-pany's CSR rankings. That is, given the value of all other input factors,we would obtain the same expected rank irrespective of the value ofXk. Analogously, Vk would equal the total, unconditional variance V ifthis dimension solely drives the final results for this company.
14 Saisana et al. (2005) and Nardo et al. (2008) provide similar applications tocomposite indicators.
Fig. 2(a) displays the total output variance and its decompositionalong the lines just indicated for all companies, with the companiesordered as in Fig. 1. Hence, companies whose ranking is relativelymore sensitive to alternative CSR model specifications are located inthe middle part of the graph. The figure shows that the output ismost sensitive to choices regarding the (exclusion of) CSR indexdimensions (Xdim.sel), followed by the choice of the dimensionweights(Xdim.weights). Less variation in company rankings is explained bythe experts' preferences in the choice of the normalization scheme(Xnorm.scheme) and the interaction effects (non-additive variance).
Exclusively looking at these first-order effects is legitimate if thereare no interactions between the different modelling options. In thatcase one obtains ∑k=1
3 Vk=V and the model is said to be additive.Conceivably though, such interactions exist. For example, a company'sranking may be particularly high (or low) given the exclusion of aspecific dimension in which it is a weak (strong) performer and theparallel selection of a normalization scheme that is relatively sensitiveto outliers. The total output variance V is then composed of the sum ofthe dimension-specific first-order effects of all input factors and the(higher order) interaction effects.
The number of first and higher order sensitivity indices increasesexponentially with the number of input factors. Calculating allpossible interaction effects is therefore often not desirable. Alterna-tively, a mirror image of the first-order approach outlined above isobtained by considering V(rank (ICSR))−VX− k
(EXk(rank (ICSR)|X−k)),
which is the part of total output variance that remains unexplained ifall factors but Xk are fixed. As this unexplained part implicitly capturesall (first and higher order) effects associated with Xk, it is called a totalsensitivity effect (Saltelli et al., 2004). Again, a high value for thisstatistic means that Xk has a large influence on the final ranking of acompany. The magnitude of the difference between the first and totalorder indices for input factor Xk indicates the importance ofinteractions with this factor in the total variance V. Below, we dividethe so obtained numbers by the total variance to obtain total effectsensitivity indices STk. Thus, for each of the modelling factors (k=1, 2,3) we get:
STk =VðrankðICSRÞÞ−VX−k
ðEXkðrankðICSRÞ jX−kÞÞ
VðrankðICSRÞÞð3Þ.
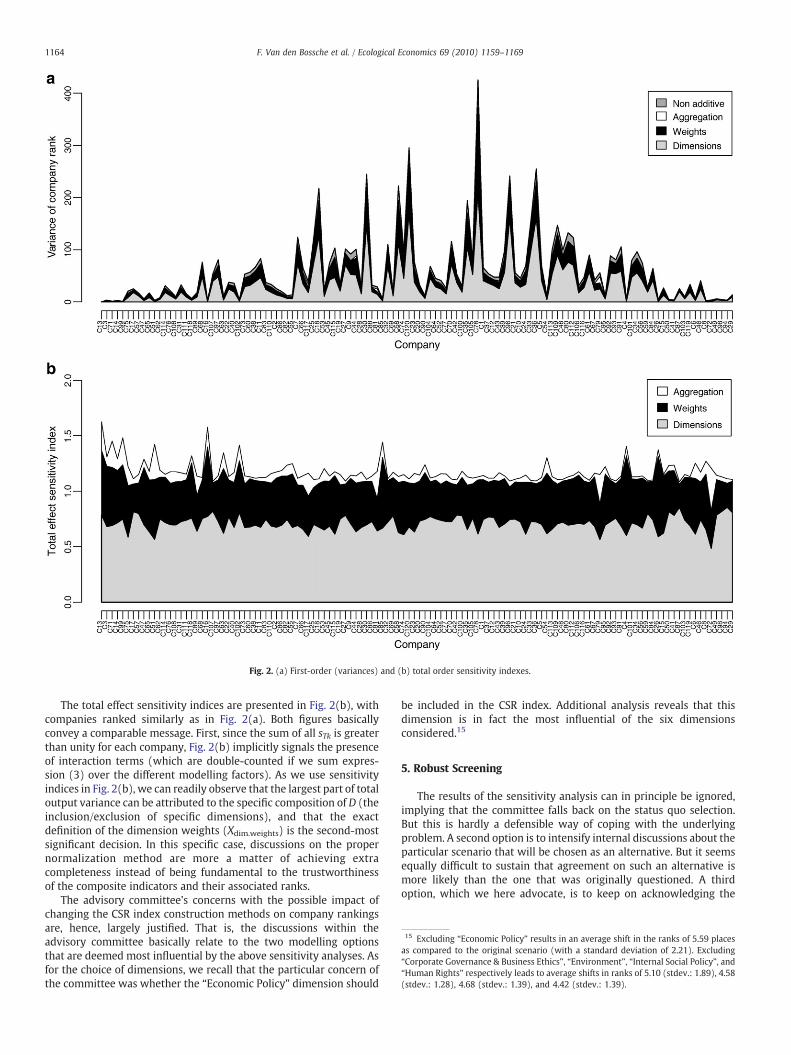
Fig. 2. (a) First-order (variances) and (b) total order sensitivity indexes.
15 Excluding “Economic Policy” results in an average shift in the ranks of 5.59 placesas compared to the original scenario (with a standard deviation of 2.21). Excluding“Corporate Governance & Business Ethics”, “Environment”, “Internal Social Policy”, and“Human Rights” respectively leads to average shifts in ranks of 5.10 (stdev.: 1.89), 4.58(stdev.: 1.28), 4.68 (stdev.: 1.39), and 4.42 (stdev.: 1.39).
1164 F. Van den Bossche et al. / Ecological Economics 69 (2010) 1159–1169
The total effect sensitivity indices are presented in Fig. 2(b), withcompanies ranked similarly as in Fig. 2(a). Both figures basicallyconvey a comparable message. First, since the sum of all sTk is greaterthan unity for each company, Fig. 2(b) implicitly signals the presenceof interaction terms (which are double-counted if we sum expres-sion (3) over the different modelling factors). As we use sensitivityindices in Fig. 2(b), we can readily observe that the largest part of totaloutput variance can be attributed to the specific composition of D (theinclusion/exclusion of specific dimensions), and that the exactdefinition of the dimension weights (Xdim.weights) is the second-mostsignificant decision. In this specific case, discussions on the propernormalization method are more a matter of achieving extracompleteness instead of being fundamental to the trustworthinessof the composite indicators and their associated ranks.
The advisory committee's concerns with the possible impact ofchanging the CSR index construction methods on company rankingsare, hence, largely justified. That is, the discussions within theadvisory committee basically relate to the two modelling optionsthat are deemed most influential by the above sensitivity analyses. Asfor the choice of dimensions, we recall that the particular concern ofthe committee was whether the “Economic Policy” dimension should
be included in the CSR index. Additional analysis reveals that thisdimension is in fact the most influential of the six dimensionsconsidered.15
5. Robust Screening
The results of the sensitivity analysis can in principle be ignored,implying that the committee falls back on the status quo selection.But this is hardly a defensible way of coping with the underlyingproblem. A second option is to intensify internal discussions about theparticular scenario that will be chosen as an alternative. But it seemsequally difficult to sustain that agreement on such an alternative ismore likely than the one that was originally questioned. A thirdoption, which we here advocate, is to keep on acknowledging the
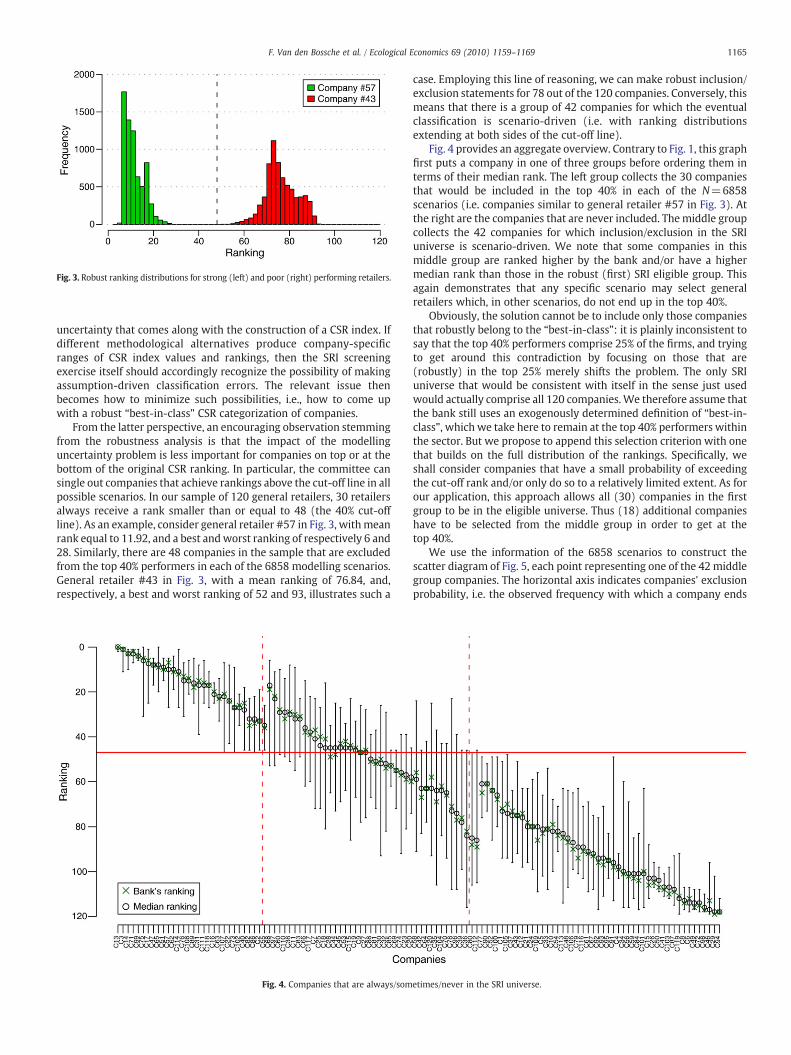
Fig. 3. Robust ranking distributions for strong (left) and poor (right) performing retailers.
1165F. Van den Bossche et al. / Ecological Economics 69 (2010) 1159–1169
uncertainty that comes along with the construction of a CSR index. Ifdifferent methodological alternatives produce company-specificranges of CSR index values and rankings, then the SRI screeningexercise itself should accordingly recognize the possibility of makingassumption-driven classification errors. The relevant issue thenbecomes how to minimize such possibilities, i.e., how to come upwith a robust “best-in-class” CSR categorization of companies.
From the latter perspective, an encouraging observation stemmingfrom the robustness analysis is that the impact of the modellinguncertainty problem is less important for companies on top or at thebottom of the original CSR ranking. In particular, the committee cansingle out companies that achieve rankings above the cut-off line in allpossible scenarios. In our sample of 120 general retailers, 30 retailersalways receive a rank smaller than or equal to 48 (the 40% cut-offline). As an example, consider general retailer #57 in Fig. 3, withmeanrank equal to 11.92, and a best andworst ranking of respectively 6 and28. Similarly, there are 48 companies in the sample that are excludedfrom the top 40% performers in each of the 6858 modelling scenarios.General retailer #43 in Fig. 3, with a mean ranking of 76.84, and,respectively, a best and worst ranking of 52 and 93, illustrates such a
Fig. 4. Companies that are always/som
case. Employing this line of reasoning, we can make robust inclusion/exclusion statements for 78 out of the 120 companies. Conversely, thismeans that there is a group of 42 companies for which the eventualclassification is scenario-driven (i.e. with ranking distributionsextending at both sides of the cut-off line).
Fig. 4 provides an aggregate overview. Contrary to Fig. 1, this graphfirst puts a company in one of three groups before ordering them interms of their median rank. The left group collects the 30 companiesthat would be included in the top 40% in each of the N=6858scenarios (i.e. companies similar to general retailer #57 in Fig. 3). Atthe right are the companies that are never included. Themiddle groupcollects the 42 companies for which inclusion/exclusion in the SRIuniverse is scenario-driven. We note that some companies in thismiddle group are ranked higher by the bank and/or have a highermedian rank than those in the robust (first) SRI eligible group. Thisagain demonstrates that any specific scenario may select generalretailers which, in other scenarios, do not end up in the top 40%.
Obviously, the solution cannot be to include only those companiesthat robustly belong to the “best-in-class”: it is plainly inconsistent tosay that the top 40% performers comprise 25% of the firms, and tryingto get around this contradiction by focusing on those that are(robustly) in the top 25% merely shifts the problem. The only SRIuniverse that would be consistent with itself in the sense just usedwould actually comprise all 120 companies.We therefore assume thatthe bank still uses an exogenously determined definition of “best-in-class”, which we take here to remain at the top 40% performers withinthe sector. But we propose to append this selection criterion with onethat builds on the full distribution of the rankings. Specifically, weshall consider companies that have a small probability of exceedingthe cut-off rank and/or only do so to a relatively limited extent. As forour application, this approach allows all (30) companies in the firstgroup to be in the eligible universe. Thus (18) additional companieshave to be selected from the middle group in order to get at thetop 40%.
We use the information of the 6858 scenarios to construct thescatter diagram of Fig. 5, each point representing one of the 42 middlegroup companies. The horizontal axis indicates companies' exclusionprobability, i.e. the observed frequency with which a company ends
etimes/never in the SRI universe.

Fig. 5. Exclusion probability and expected non-compliance with inclusion rule of middle group companies.
1166 F. Van den Bossche et al. / Ecological Economics 69 (2010) 1159–1169
up having a rank larger than 48. It is immediate that even within thisgroup of companies there is large variation as regards this probability.At one extreme are companies that exceed the cut-off line less than10 times out of 6858, whereas on the right side of the axis there arecompanies withmore than 99% of their distributionmass at thewrongside of the cut-off line.
It should be noted that companies with an exclusion probability notexceeding 0.5 are in fact companies with a favourable median rank, butwith some mass of their ranking distribution situated at the other,“wrong” side of the cut-off line. We point out that for such companiesthe exclusion probability can directly be linked with Gini's conceptof “Transvariazione”.16 Basically, a rank distribution and a cut-off rankrcut-off are said to transvariate on rank rs (s=1,…, N), with respect to ameasure of central tendency such as e.g. themedian rank rmed if the signof some of the differences rs−rcut-off is opposite to that of rmed−rcut-off.To get an idea about the extent of such transvariations, differentmeasures have been proposed. Dagum (1960) defined the concept oftransvariability. Applied to companies with a favourable medianranking (that is: rmed≤rcut-off), the appropriate measure is17:
PT = Pðrs ≥ rcut�off Þ: ð4Þ
This is nothing but the exclusion probability we referred to above.In fact, exactly half of the companies in the middle group have afavourable median rank, and since this is a sufficient number tocomplete the eligible spectrum we shall focus on this group.18
The vertical axis in Fig. 5 is similarly based on another measureassociated with the transvariation concept, to wit, a measure of
16 In the income inequality literature, this and related notions have been exploited tomeasure the distance between two distributions (i.e. the complement of the overlap oftwo distributions) or the “economic advantage” of one group over another (see e.g.Deutsch and Silber, 1999, and the references cited therein).17 Dagum (1960) distinguishes transvariability as given in Eq. (4) from the“probability of transvariation”, which normalizes transvariability by dividing it withthe probability that rs≤rmed. Since we use the median as measure of central tendency,this means that the probability of transvariation of a company equals two times itstransvariability.18 Still, it is worthwhile to point out that there is also a straightforward connectionbetween companies with an exclusion probability of more than 0.5 and thetransvariability concept. For such companies (i.e. companies with rmed≥ rcut-off, thelatter is given by PT=P(rs≤ rcut-off), and the exclusion probability is then 1−PT. Putotherwise, in general we advocate to use companies with a small probability oftransvariation if rmed≤ rcut-off, and, if necessary, to complement these with companieswith rmed≥rcut-off, but with a large probability of transvariation.
its expected intensity as given by the so-called first moment oftransvariation m1 (see again Dagum, 1960):
m1 =
∑rs ≥ rcut�off
ðrs−rcut�off Þ
N; ð5Þ
where the “transvariation” connotation is as such directly applicable tocompanies with rmed≤ rcut-off, although Eq. (5) can evidently be usedwithout such underlying interpretation for the other companies aswell. Again, we observe a large variation, from aminimal value close tozero to expected cut-off rank violations of more than 38 places.
Although it is clear that one would ideally like to select companiesthat are close to the origin, it is less obvious whether either theexclusion probability (i.e. Eq. (4)) or the expected intensity ofexclusion (Eq. (5)) should be the most important statistic on whichto base inclusion/exclusion decisions in conflicting cases. Since ourmajor concern is with robustness, we here follow Montanari (2004)who pointed out that minimizing transvariation probabilities, i.e. “thebare counting of the transvariations”, is not affected by possibly largetransvariations due to outlying data, and performs better with non-normally distributed data. Thus, we effectively read the graph from
Fig. 6. Ranking distribution of the “marginal” company (#18).
1167F. Van den Bossche et al. / Ecological Economics 69 (2010) 1159–1169
left to right and include the first 18 observations we encounter tocomplement the eligible asset universe in a robust way.
This approach in fact means that we chose to put the dividing linebetween company #18 (included) and company #9 (excluded),although the first moment of transvariation of the former (6.42) isconsiderably higher than that of the latter (3.76). In fact, the rankingdistribution of company #18, reproduced in Fig. 6, provides additionalevidence in favour of its inclusion. As can readily be inspected, theranking has a bi-modal distribution. Detailed inspection of the scenariosreveals that the second peak is entirely driven by exactly onemodellingassumption, viz. the option whether to include or exclude the“environment” dimension in the computation of the CSR compositeindex. Specifically, since excluding this dimension considerably pena-lizes the excellent environmental performance of this company, andrecalling that exclusion of this dimension is never contemplated by theadvisory committee itself, this in factprovides additional justification forkeeping the company in the eligible spectrum.
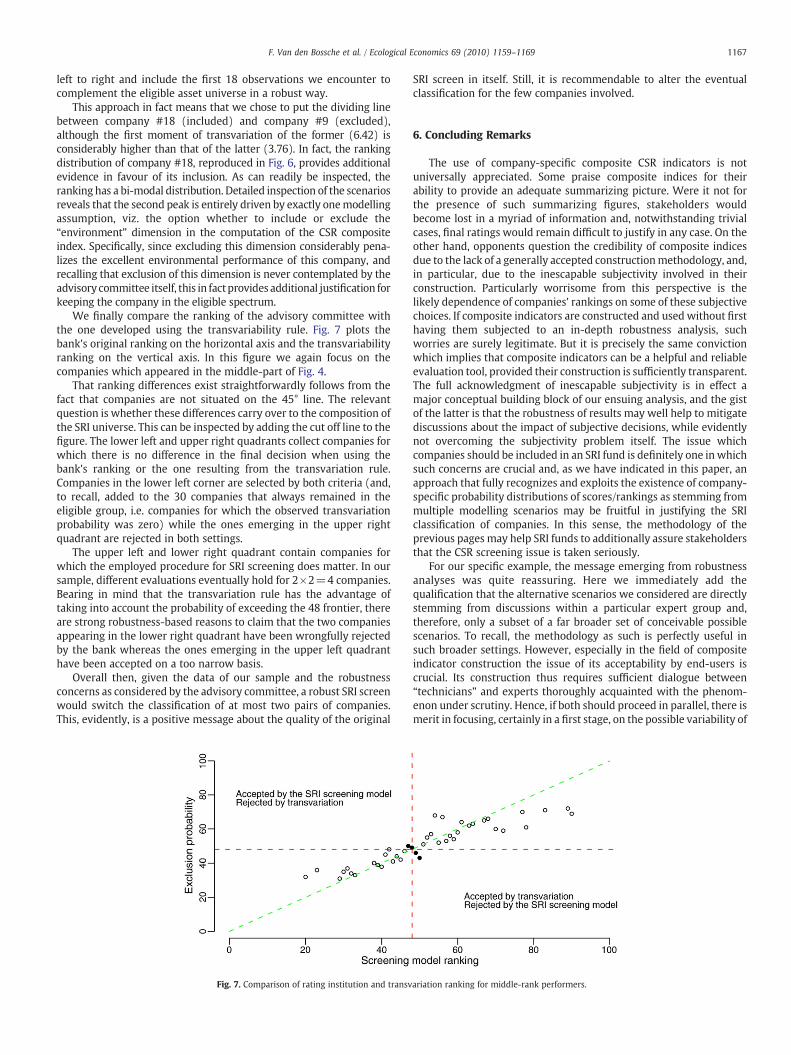
We finally compare the ranking of the advisory committee withthe one developed using the transvariability rule. Fig. 7 plots thebank's original ranking on the horizontal axis and the transvariabilityranking on the vertical axis. In this figure we again focus on thecompanies which appeared in the middle-part of Fig. 4.
That ranking differences exist straightforwardly follows from thefact that companies are not situated on the 45° line. The relevantquestion is whether these differences carry over to the composition ofthe SRI universe. This can be inspected by adding the cut off line to thefigure. The lower left and upper right quadrants collect companies forwhich there is no difference in the final decision when using thebank's ranking or the one resulting from the transvariation rule.Companies in the lower left corner are selected by both criteria (and,to recall, added to the 30 companies that always remained in theeligible group, i.e. companies for which the observed transvariationprobability was zero) while the ones emerging in the upper rightquadrant are rejected in both settings.
The upper left and lower right quadrant contain companies forwhich the employed procedure for SRI screening does matter. In oursample, different evaluations eventually hold for 2×2=4 companies.Bearing in mind that the transvariation rule has the advantage oftaking into account the probability of exceeding the 48 frontier, thereare strong robustness-based reasons to claim that the two companiesappearing in the lower right quadrant have been wrongfully rejectedby the bank whereas the ones emerging in the upper left quadranthave been accepted on a too narrow basis.
Overall then, given the data of our sample and the robustnessconcerns as considered by the advisory committee, a robust SRI screenwould switch the classification of at most two pairs of companies.This, evidently, is a positive message about the quality of the original
Fig. 7. Comparison of rating institution and transv
SRI screen in itself. Still, it is recommendable to alter the eventualclassification for the few companies involved.
6. Concluding Remarks
The use of company-specific composite CSR indicators is notuniversally appreciated. Some praise composite indices for theirability to provide an adequate summarizing picture. Were it not forthe presence of such summarizing figures, stakeholders wouldbecome lost in a myriad of information and, notwithstanding trivialcases, final ratings would remain difficult to justify in any case. On theother hand, opponents question the credibility of composite indicesdue to the lack of a generally accepted constructionmethodology, and,in particular, due to the inescapable subjectivity involved in theirconstruction. Particularly worrisome from this perspective is thelikely dependence of companies' rankings on some of these subjectivechoices. If composite indicators are constructed and used without firsthaving them subjected to an in-depth robustness analysis, suchworries are surely legitimate. But it is precisely the same convictionwhich implies that composite indicators can be a helpful and reliableevaluation tool, provided their construction is sufficiently transparent.The full acknowledgment of inescapable subjectivity is in effect amajor conceptual building block of our ensuing analysis, and the gistof the latter is that the robustness of results may well help to mitigatediscussions about the impact of subjective decisions, while evidentlynot overcoming the subjectivity problem itself. The issue whichcompanies should be included in an SRI fund is definitely one in whichsuch concerns are crucial and, as we have indicated in this paper, anapproach that fully recognizes and exploits the existence of company-specific probability distributions of scores/rankings as stemming frommultiple modelling scenarios may be fruitful in justifying the SRIclassification of companies. In this sense, the methodology of theprevious pages may help SRI funds to additionally assure stakeholdersthat the CSR screening issue is taken seriously.
For our specific example, the message emerging from robustnessanalyses was quite reassuring. Here we immediately add thequalification that the alternative scenarios we considered are directlystemming from discussions within a particular expert group and,therefore, only a subset of a far broader set of conceivable possiblescenarios. To recall, the methodology as such is perfectly useful insuch broader settings. However, especially in the field of compositeindicator construction the issue of its acceptability by end-users iscrucial. Its construction thus requires sufficient dialogue between“technicians” and experts thoroughly acquainted with the phenom-enon under scrutiny. Hence, if both should proceed in parallel, there ismerit in focusing, certainly in a first stage, on the possible variability of
ariation ranking for middle-rank performers.
Code Indicator Weight
D1 Economic policy 20.0%yc,11 Economic performance 24.0%yc,12 Customer/supplier relations 38.0%yc,13 Community involvement 38.0%D2 Corporate governance and business ethics 20.0%yc,21 Code of ethics 33.0%yc,22 Problems with the legal framework 12.0%yc,23 Management composition and working practices 33.0%yc,24 Stakeholder involvement 22.0%D3 Environment 20.0%yc,31 Policy 7.5%yc,32 Management 12.5%yc,33 Reporting 5.0%yc,34 Biodiversity 10.0%yc,35 Performance 65.0%D4 Internal social relations 20.0%yc,41 Equal opportunity policy 24.0%yc,42 Union and employee representation 17.0%yc,43 Job creation and security 17.0%yc,44 Training 17.0%yc,45 Employee participation 8.0%yc,46 Health and safety 17.0%D5 Human rights 20.0%yc,51 Responsibility for human rights 42.0%yc,52 Supply chain responsibility 28.0%yc,53 Bribery and corruption 15.0%yc,54 Presence in controversial countries/areas 15.0%D6 Socially questionable practices and technologiesyc,61 Weapons and military industryyc,62 Genetic manipulationyc,63 Nuclear energyyc,64 Alcoholyc,65 Gamblingyc,66 Tobacco industryyc,67 Animal welfare
1168 F. Van den Bossche et al. / Ecological Economics 69 (2010) 1159–1169
results as stemming from alternative points of view within the expertcommunity.
Whether confined to such an expert-responsive subset of scenariosor to a more general analysis, it is certainly plausible that a robustnessassessment signals problems with the quality of an SRI investmentscreen. In such cases, the results are still valuable. For instance, theymaybe helpful in revealing the potential tension between an exogenouslyimposed cut-off rule and the robustness of the company classificationthat this rule entails. One obvious avenue for further research is exactlyconcerned with endogenizing the cut-off rule, which requires to tradeoff robustness concerns with the need for an eligible spectrum that isneither so large as to include “all” companies regardless of their CSRperformance nor too small to be useful for genuine investment portfolioconstruction. Similarly, by indicating where one should look fornarrowing down possible construction scenarios, the sensitivityanalyses implicitly guide the agenda about the substantive discussionsregarding CSR assessment. They eventually may even lead to theconclusion that a genuine ranking of companies is plainly too volatile tobe useful. But even in this negative case, they still have the virtue ofbeing based on an in-depth exploration of the data.
List of Indices
c=1,…, j company index, running from 1 to j.i=1,…, m indicator index, running from 1 to m.D=1,…, 5 index for the dimensions, running from 1 to 5.p=1,…, 7 index for the questionable technologies, running from 1
to 7.k=1, 2, 3 index for the modelling decisions. k=1, 2, 3, representing
respectively dimension selection, dimension weight andnormalization scheme.
s=1,…, N index for the rank, equals the number of scenarios,running from 1 to N, the latter being the number ofscenarios.
List of Symbols
ICSR,c composite indicator representing the overall performanceof company c on Corporate Social Responsibility (CSR).
wi Weight assigned to indicator i.yc,i(n) possibly normalized value of indicator i for company c.
(n) superscript indicating that the indicator has been normalized.yi sample average of indicator i taken over all companies c.si standard deviation of indicator i taken over all companies c.yimin minimum value of indicator i taken over all companies c.
yimax maximum value of indicator i taken over all companies c.
max operator resulting in the maximum of a series of values.min operator resulting in the minimum of a series of values.wprofit weight for an indicator called “profit”.wpeople weight for an indicator called “people”.wplanet weight for an indicator called “planet”.υD weight for dimension D.Qc,p correction term, in percentages, associated with the ques-
tionable activity or technology p for company c.X a vector of input variables representing the modelling
decisions (dimension selection, dimension weight, andnormalization scheme).
f a function.Xdim.sel. input variable for the modelling decision “dimension selec-
tion” (containing the 6 possible dimension combinations).Xdim.weight input variable for the modelling decision “dimension
weight” (containing the 381 possible weight alternatives).Xnorm.scheme input variable for the modelling decision “normalization
scheme” (containing the 3 normalization procedures).N the number of combinations of modelling decisions (in our
study, N=6858).
Xk input variable for modelling decision k (k=dimensionselection, dimension weight, normalization scheme).
V variance in the CSR rankings, based on variation in themodelling decision input factors.
xk* one specific value of the input factor Xk (k=dimension
selection, dimension weight, and normalization scheme).E the expected value operator.X−k subscript for the expected value operator E, indicating that
the expected value is calculated for a fixed Xk, and varyingover the remaining scenarios.
rank operator resulting in the rank of the argument. For example,rank (ICSR) results in the rank of the corresponding value ofthe composite indicator ICSR.
Vk output variance caused by factor Xk.VXk
the variance of a statistic over all possible values that Xk cantake.
STk total sensitivity attributed to input factor k.rcut-off the cut-off rank.rmed the median rank.rs the rank for scenario s.P the probability symbol.PT the probability of transvariation.m1 the first moment of transvariation.
Acknowledgements
The authors gratefully acknowledge the members of KBC's SRIDepartment and two anonymous reviewers for their helpful commentson an earlier version of this paper.
Appendix A. Dimensions and Sub-criteria of CorporateSocial Responsibility
1169F. Van den Bossche et al. / Ecological Economics 69 (2010) 1159–1169
References
Cherchye, L., Moesen, W., Rogge, N., Van Puyenbroeck, T., 2007. An introduction to‘Benefit of the Doubt’ composite indicators. Social Indicators Research 82 (1),111–145.
Cherchye, L., Moesen, W., Rogge, N., Van Puyenbroeck, T., Saisana, M., Saltelli, A., Liska,R., Tarantola, S., 2008. Creating composite indicators with DEA and robustnessanalysis: the case of the technology achievement index. Journal of the OperationalResearch Society 59 (2), 239–251.
Dagum, C., 1960. Teoría de la Transvariación- sus Aplicaciones a la Economía. Metron20, 2–260.
Deutsch, J., Silber, J., 1999. Inequality Decomposition by Population Subgroups and theAnalysis of Interdistributional Inequality. In: Silber, J. (Ed.), Handbook of IncomeInequality Measurement. Kluwer Academic Press, Norwell, MA, pp. 363–397.
Dubbink, W., Graafland, J., Van Liedekerke, L., 2008. CSR, transparency and the role ofintermediate organisations. Journal of Business Ethics 82 (2), 391–406.
Ebert, U., Welsch, H., 2004. Meaningful environmental indices: a social choice approach.Journal of Environmental Economics and Management 47 (2), 270–283.
Graafland, J.J., Eijffinger, S.C.W., Smid, H., 2004. Benchmarking of Corporate SocialResponsibility: methodological problems and robustness. Journal of Business Ethics53, 137–152.
Hallerbach, W., Ning, H., Soppe, A., Spronk, J., 2004. A framework for managing aportfolio of socially responsible investments. European Journal of OperationalResearch 153 (2), 517–529.
Krajnc, D., Glavič, P., 2005. How to compare companies on relevant dimensions ofsustainability. Ecological Economics 55 (4), 551–563.
Mayer, A.L., 2008. Strengths and weaknesses of common sustainability indices formultidimensional systems. Environment International 34 (2), 277–291.
Montanari, A., 2004. Linear discriminant analysis and transvariation. Journal ofClassification 21 (1), 71–88.
Munda, G., 2005. Measuring sustainability: a multi-criterion framework. Environment,Development and Sustainability 7 (1), 117–134.
Nardo, M., Saisana, M., Saltelli, A., Tarantola, S., Hoffman, A. and Giovannini, E., 2008.Handbook on Constructing Composite Indicators: Methodology and User Guide,OECD/Joint Research Centre for the European Commission. Paris/Ispra.
Ness, B., Urbel-Piirsalu, E., Anderberg, S., Olsson, L., 2007. Categorising tools forsustainability assessment. Ecological Economics 60 (3), 498–508.
Orlitzky, M., Schmidt, F.L., Rynes, S.L., 2003. Corporate social and financial performance:a meta-analysis. Organizational Studies 24, 403–441.
Renneboog, L., Ter Horst, J., Zhang, C., 2008. Socially responsible investments: institutionalaspects, performance, and investor behavior. Journal of Banking and Finance 32 (9),1723–1742.
Saisana, M., Saltelli, A., Tarantola, S., 2005. Uncertainty and sensitivity analysis as toolsfor the quality assessment of composite indicators. Journal of the Royal StatisticalSociety Series A 168 (2), 307–323.
Saltelli, A., Tarantola, S., Campolongo, F., Ratto, M., 2004. Sensitivity Analysis in Practice.A Guide to Assessing Scientific Models. Wiley, Chichester.
Schäfer, H., 2005. International corporate social responsibility rating systems: conceptualoutline and empirical results. Journal of Corporate Citizenship 20, 107–120.
Steurer, R., Margula, S., Martinuzzi, A., 2008. Socially Responsible Investment in EUMember States. Vienna: Final Report to the EU-High Level Group on CSR.
Waddock, S.A., Graves, S.B., 1997. The corporate social performance–financial performancelink. Strategic Management Journal 18, 303–319.
Wilson, J., Tyedmers, P., Pelot, R., 2007. Contrasting and comparing sustainabledevelopment indicator metrics. Ecological Indicators 7 (2), 299–314.