Road kills of roe deer (Capreolus capreolus) in the Netherlands
78
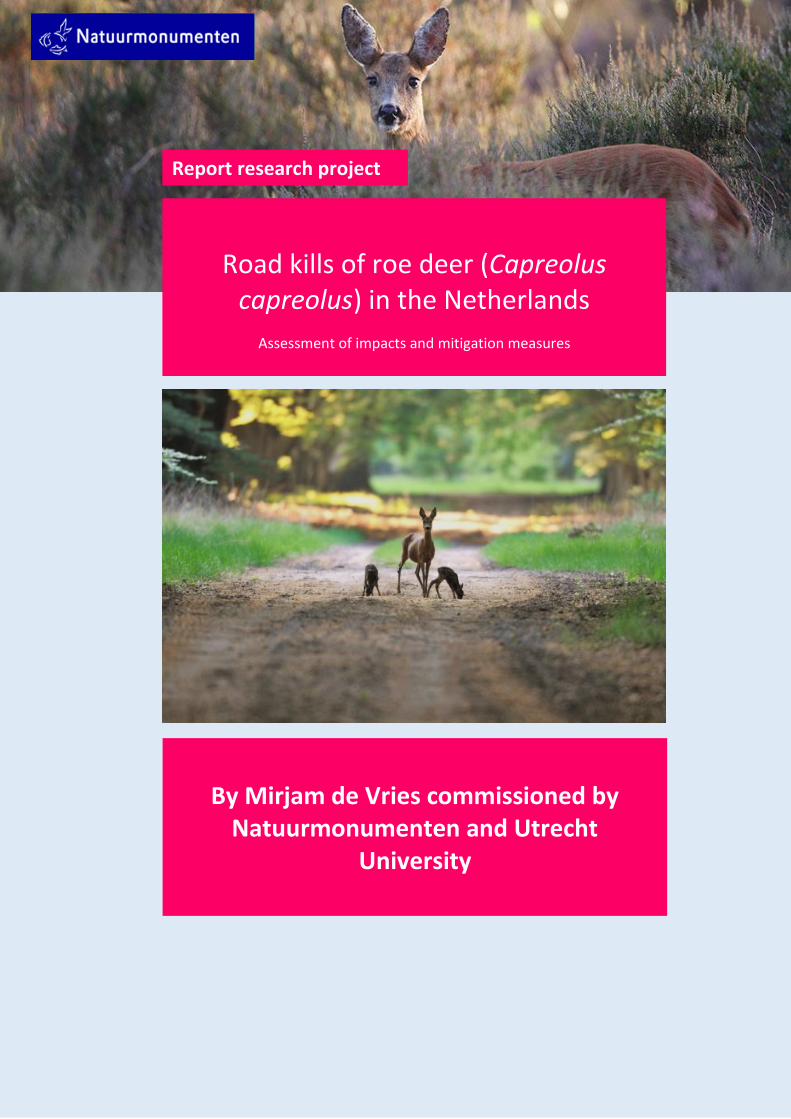
Road kills of roe deer (Capreolus capreolus) in the Netherlands Assessment of impacts and mitigation measures Report research project By Mirjam de Vries commissioned by Natuurmonumenten and Utrecht University
-
Upload
khangminh22 -
Category
Documents
-
view
0 -
download
0
Transcript of Road kills of roe deer (Capreolus capreolus) in the Netherlands
Road kills of roe deer (Capreolus
capreolus) in the Netherlands
Assessment of impacts and mitigation measures
Report research project
By Mirjam de Vries commissioned by
Natuurmonumenten and Utrecht University

Road kills of roe deer (Capreolus capreolus) in the Netherlands
Assessment of impacts and mitigation measures
Author:
M. (Mirjam) de Vries BSc
06-20377727
Commissioned by:
Natuurmonumenten and Utrecht University
Supervision:
P.A. (Pita) Verweij PhD and G. (Gijs) Steur MSc – group Energy and Resources, Copernicus Institute of Sustainable
Development, Utrecht University
M. (Michiel) van der Weide MSc – Natuurmonumenten, Nature and Landscape
Production:
Natuurmonumenten
Postbox 9955
1243 25 ‘s-Graveland
Website: www.natuurmonumenten.nl
Suggested citation:
De Vries, M. (2015). Road kills of roe deer (Capreolus capreolus) in the Netherlands: assessment of impacts and
mitigation measures, MSc Internship report, Copernicus Institute of Sustainable Development, Utrecht University
Utrecht

Summary Collisions between wildlife animals and motor vehicles are a worldwide problem and influence drivers’
safety and animal welfare. In the Netherlands, the roe deer (Capreolus capreolus) is one the main
wildlife animals frequently ending up as road kill, as a result of about 10.000 collisions involving this
species per year. Natuurmonumenten (NM), a Dutch nature conservation and wildlife protection
organisation, administers multiple natural areas bordering roads where collisions between roe deer and
vehicles occur. Therefore, NM called for an examination of measures to mitigate roe deer vehicle
collisions (DVC) in the Netherlands. In addition NM called for the creation of an action plan to advise
administrators of NM on how to reduce DVCs in the natural area under their administration. This
information need was translated into the following research question: “How can roe deer vehicle
collisions in the Netherlands be reduced?”. The main research question was translated into two partial
research questions: “Where, how frequently and why do collisions with roe deer happen in the
Netherlands?” and “Which mitigation measure(s) are effective in reducing DVCs?”. To answer the partial
research questions a review of Dutch and international literature was done and interviews with experts
on this subject were performed. Concerning the causes of DVCs, it turned out that the DVCs are related
to a combination of the natural behaviour of the roe deer, such as the territorial behaviour of dominant
bucks during spring, and the influence of humans, such as disturbance by recreational activities in
nature. Possible mitigation measures where then reviewed on the criteria of their effectiveness, risks,
management option and costs. Readily available information was used to evaluate the measures, with
the heaviest weight attributed to the criteria of effectiveness and risks. From the evaluation it was found
that a small subset of mitigation measures, such as the wildlife signalling system and a reduction in
maximum driving speed to 50 km/h were considered as most effective in theory. However, as the ‘real’
effectiveness of the mitigation measures is influenced by the characteristics of the DVC location, such as
maximum driving speed and the presence of residential areas, an action plan was created to identify the
most appropriate mitigation measure for the DVC location. The action plan was established for NM
natural area administrators and consists of a questionnaire and a flowchart. Through the questionnaire
the necessary information on DVC s can be collected. Afterwards, this information can be applied to use
the flowchart. The flowchart connects the characteristics of a DVC area, such as maximum driving speed,
to a mitigation measure that, according to the author, would be the most suitable for the particular
location. The action plan was then tested for three case areas in the Netherlands, on the basis of which
the action plan was slightly adjusted and it could be concluded that the action plan gives the most
suitable option for the tested DVC case areas. In conclusion, it was found that multiple potential
mitigation measures to reduce DVCs in the Netherlands are available. In addition, there are mitigation
measures, such as the virtual fence, light warning system and general education, that seem promising,
but data on the effectiveness of these measures was inconclusive at the moment of writing this report
and this would thus need more research. It is recommended that to reduce DVCs, it is most appropriate
to combine multiple mitigation measures as this is expected to reduce habituation by driver and/or roe
deer and give the best results. The action plan is a practical tool to identify the most suitable mitigation
measure for the particular DVC location and it is recommended to be widely applied. Furthermore, it is
important to encourage innovative strategies to reduce DVCs. And finally, cooperation and exchange of
knowledge with neighbouring countries are advised. In doing so, more information on the effectiveness
of the different mitigation measures is collected which could improve the scientific grounds for the
advice that is given to all administrators of natural areas on how to reduce DVCs in the area under their
administration.

Preface
In the second year of my Master Environmental Biology at the University of Utrecht (UU), more
specifically the track Ecology and Natural Resources Management (ENRM), I was given the opportunity
to do an internship of six months (33 EC) for my minor research project. I decided to carry out this
internship at the department Nature and Landscape of Natuurmonumenten (NM), a Dutch nature and
wildlife conservation organisation. The subject of my research was roe deer (Capreolus capreolus)
vehicle collisions (DVCs) in the Netherlands and the examination of DVC mitigation measures. The aim of
my research was to write an action plan for administrators of NM which will help them reduce the
number of DVCs. In addition a scientific report about the findings of my research had to be written for
the University of Utrecht. This report lies before you.
During my internship at Natuurmonumenten I learned to apply my scientific skills taught at the
university with modern day social-ecological problems. In addition, while at the university I was used to
focussing and making use solely of scientifically proven data, during my research this type of data was
not always available. Therefore some of the information used had to come from administrators and
people with more practical experience. This internship has not only given me the opportunity to
experience the work of a (fauna) ecologist, but has also given me a glimpse into the organization of
Natuurmonumenten itself. I would like to thank Natuurmonumenten for giving me the opportunity to
follow an internship in their organization. More specifically I would like to thank my external supervisor
Michiel van der Weide (NM) and my internal supervisors Gijs Steur (UU) and Pita Verweij (UU) for their
guidance and support during my internship.
Outline
Abbreviations and explanations ...................................................................................................... 7
I. Introduction ........................................................................................................................... 8
1.1 Background .......................................................................................................................... 8
1.2 Aims and research questions ................................................................................................ 8
1.3 Approach .............................................................................................................................. 9
1.3 Methods and limitations ...................................................................................................... 9
II. Hotspots and causes of DVCs in the Netherlands ............................................................ 10
2.1 General ecology of the roe deer ......................................................................................... 10
2.1.1 Dispersal and population density ............................................................................ 10
2.1.2 Habitat requirements ............................................................................................... 11
2.1.3 Roe deer living areas in the Netherlands ................................................................. 12
2.1.4 Behaviour ................................................................................................................ 13
2.2 Landscape design of the Netherlands ............................................................................. 16
2.2.1 Road network of the Netherlands ............................................................................ 16
2.2.2 Natural areas and agriculture in the Netherlands .................................................... 18
2.3 Causes of deer vehicle collisions .................................................................................... 19
2.3.1 Location characteristics ........................................................................................... 19
2.3.2 Behavioural aspects ................................................................................................. 20
2.3.3 Daily variation in behaviour .................................................................................... 21
2.3.4 Anthropogenic factors ............................................................................................. 21
2.3.5 Causes of DVCs: A summary ................................................................................. 23
III. Mitigation measures ............................................................................................................ 24
3.1 Measures that tackle roe deer behaviour ........................................................................ 24
3.1.1 Virtual fence ................................................................................................................. 25
3.1.2 Roadside reflectors .................................................................................................. 27
3.1.3 Chemical repellents ................................................................................................. 29
3.1.4 Car-mounted warning whistles ................................................................................ 31
3.1.5 Roadside fencing ..................................................................................................... 32
3.2 Measures that tackle road design and driver behaviour ................................................. 33
3.2.1 Reducing vehicle speed ........................................................................................... 34
3.2.2 Warning signs .......................................................................................................... 36
2.2.3 In-vehicle deer detection systems ........................................................................... 38
3.2.4 Work in progress: light warning system ................................................................. 39
3.3 Measures that tackle multiple causes .............................................................................. 39
3.3.1 Wildlife signalling system ....................................................................................... 40
3.3.2 Roadside management ............................................................................................. 41
3.3.2 Adjusting roadway and nature planning .................................................................. 43
3.3.3 General education .................................................................................................... 43
3.4 Measures that tackle population density ......................................................................... 44
3.4.1 Reducing roe deer density: culling .......................................................................... 44
3.5 Summary mitigation measures .......................................................................................... 47
III. Proposed action plan ........................................................................................................... 49
4.1 Action plan .......................................................................................................................... 49
V. Discussion and conclusion .................................................................................................. 51
5.1 Discussion ........................................................................................................................... 51
5.1.1 Reflection on the methods used ................................................................................... 51
5.1.4 Effectiveness of mitigation measures ........................................................................... 53
5.1.5 Outlook to the future .................................................................................................... 54
5.2 Conclusions and recommendations ..................................................................................... 55
References .................................................................................................................................... 57
Appendices ................................................................................................................................... 66
A. Questionnaire in Dutch ......................................................................................................... 66
B. Original Flowchart in Dutch ................................................................................................. 69
C: Case studies: implementation of the action plan in English ................................................ 70
C 1 Case study I: Zuphenseweg/Lochemseweg ................................................................ 70
C 2 Case study II: Peeskesweg .......................................................................................... 73
C 3 Case study III: Ruurloseweg ....................................................................................... 76

Page | 7
Abbreviations and explanations
AVC Animal Vehicle Collisions
DVC Deer Vehicle Collisions
WVC Wildlife Vehicle collisions
ZV Zoogdiervereniging (Dutch Mammal Society)
A society dedicated to protect mammals living in the Netherlands.
VHR Vereniging het reewild (Organisation the Roe deer)
An organization that strives to maintain sustainable populations of roe deer and
promote the welfare of deer in the Netherlands.
SBB Staatsbosbeheer (State forestry organization)
A Dutch nature and wildlife conservation organization.
Doe Female roe deer
Buck Male roe deer
Rut Time of sexual activity
SWOV Stichting Wetenschappelijk Onderzoek Verkeersveiligheid
A foundation for road safety research.

Page | 8
I. Introduction
1.1 Background
Deer vehicle collisions, as well as collisions with other large wildlife, have become a worldwide problem
and negatively influence drivers safety and animal welfare (Langbein et al., 2011 and references
therein). In addition, DVCs are estimated to cost on average €1900 per collision resulting in a major cost
item for countries (Schweizersischer Versicherungsverband, 2009; Langbein, 2006; Putman et al., 2004
and Seiler, 2003 cited by Schoon, 2011). In the Netherlands collisions with the roe deer (figure 1) are
happening frequently. Currently the number of collisions with the roe deer in the Netherlands is
approximately 10.000 per year (SWN, 2014). Therefore, reducing the amount of collisions with roe deer
in the Netherlands is of great importance and is therefore the subject of this research.
1.2 Aims and research questions
The aim of this research is to write an action plan in Dutch for administrators of NM. This action plan
could possibly help them reduce the number of collisions with roe deer in the natural area under their
administration. In addition, a scientific report in English has to be written for the University of Utrecht to
make knowledge on DVCs gained by performing this research accessible on a more international scale.
In this report one main research question and several partial research questions will be answered:
Main research question:
“How can roe deer vehicle collisions in the Netherlands be reduced?”
Partial research questions:
“Where, how frequently and why do collisions with roe deer happen in the Netherlands?”
“Which mitigation measure(s) are effective in reducing DVCs?”
Figure 1: A female roe deer and her offspring (Flickr.com, 2015).

Page | 9
1.3 Approach
To be able to answer the main research question two partial research questions need to be answered. In
answering the first partial research question the influence of the behaviour of the roe deer itself as well
as the influence of humans on the migration behaviour of roe deer will be discussed (chapter 2). In
doing so the causes of DVCs will be determined. For the second partial research question a number of
existing DVCs mitigation measures will be evaluated on the criteria of their effectiveness, risks,
management option and an estimation of the costs (chapter 3). Finally this information will be used to
write an action plan for administrators of NM in which they will be advised on how to reduce the
number of DVCs in the natural areas under their administration (chapter 4). This action plan will consist
of a questionnaire, designed to collect all necessary information on the DVC location, and a flow chart in
which advice will be given which mitigation measure will be most fitted for the DVC location. The action
plan will be tested in different case areas in the Netherlands (Appendix A, B and C). Finally, the
information gained in is this report has been discussed and used to give advice about DVCs in the
Netherlands (chapter 5).
1.3 Methods and limitations
The literature in this report will be gathered through ‘Google’ and ‘Google scholar’ by using search terms
such as ’roe deer, mitigation measures, road kills, wildlife vehicle collisions, deer vehicle collisions, etc.’.
Furthermore, reference lists from scientific articles and internal reports (UU) will be used to find more
literature. Internal reports from NM and other advice agencies (i.e. SBB, ZV etc.) will be used as well. In
addition interviews with administrators familiar with DVCs or with knowledge of the behaviour of the
roe deer in the Netherlands will be performed and used in writing the report. The focus of this report is
limited to the situation with roe deer vehicle collisions in the Netherlands. However, literature from
foreign countries about collisions between vehicles and roe deer will be used as well.

Page | 10
II. Hotspots and causes of DVCs in the Netherlands
All over the world the number of deer-vehicle collisions are increasing and are becoming a major
problem for drivers safety, animal wealth fare and is costing countries over millions of dollars a year
(Langbein et al., 2011 and references therein). This also applies to the Netherlands, where collisions
with roe deer are happening more and more frequently. In order to be able to make suggestions about
possible DVC mitigation measures, it is important to start off by getting to know and understand the
causes of the problem. Collisions with deer are the result of the behaviour of the animal leading to its
presence on the roads, and the characteristics of the infrastructure in a given area. Therefore this report
discusses both. In doing so, the ecology and the behaviour of the roe deer and the Dutch infrastructure
and landscape design are discussed. Knowledge on the basic ecology of the roe deer has mostly been
assessed from Worm (2014) in which characteristics of the roe deer in the Netherlands has been
thoroughly discussed. Finally, the ecology of the roe deer and the influence of anthropogenic changes
has been linked to the DVCs and conclusions concerning the source(s) of DVCs will be drawn.
2.1 General ecology of the roe deer
The roe deer is one of the wild animals frequently seen in the Dutch landscape (figure 2), and is known
to be smaller than the red deer (Cervus elaphus) and fallow deer (Dama dama), also living in the
Netherlands. The ecology of the roe deer is an important factor to examine as it might help explain the
causes of DVCs. This report will only discuss aspects of the ecology of the roe deer leading to the
presence of the animal on roads.
2.1.1 Dispersal and population density
The roe deer population in Europe has increased strongly over the past decades and currently inhabits
most of Northwest Europe, including the Netherlands. Presently, the roe deer is the most common deer
of Europe, and its population is still increasing. In the 1930s the roe deer population in the Netherlands
was estimated to be 3.5 thousand individuals. Nowadays, this population is estimated to consist of 60 to
Figure 2. A doe (left) and a yearling (right) roe deer in a wheat field (Łukasik, 2014)

Page | 11
Figure 3. Population estimates of the roe deer in the Netherlands in the period 1970 to 1980 (left) and in the period 2000 to 2010 (right) based on the number of validated observations (green squares) of the roe deer (adjusted from telmee.nl, 2014).
90 thousand individuals, indicating a significant population growth. Figure 3 shows an estimation of the
population growth this ungulate (i.e. group of mammals all of which have hooves) has been through in
the Netherlands between the periods of 1970-1980 and 2000-2010. Thus far, the carrying capacity in the
Netherlands has not been reached yet, as there are still (natural) areas that are not or less inhabited by
the roe deer. It is expected that the roe deer population will keep on increasing until the carrying
capacity is reached (Schoon and Spek, 2014).
It could be argued that the size of the population is also influenced by the number of individuals lost
through illness, natural predators and human activities. For instance, there are several natural predators
of the roe deer, such as the wolf (Canis lupus), the lynx (Lynx lynx), wild boar (Sus scrofa) and the fox
(Vulpes vulpes) of which only the latter two are currently (January 2015) established in the Netherlands.
In addition, the roe deer population suffers losses through mowing victims (i.e. calves get ran over by
mowing machines), culling activities and collisions with motor vehicles. Despite both the wild boar and
fox population are numerous and a proportion of the population is lost due to human activities, the roe
deer population in the Netherlands was able to increase. The success of the roe deer due to the fact that
the roe deer is able to live in many habitats and is known to habituate well to human presence (Worm,
2014).
2.1.2 Habitat requirements As mentioned in paragraph 2.1.1, the roe deer adjusts well to human presence and is able to take the
advantages of land under human influence. These advantages are, for example, the anthropogenic
changes in forests (e.g. creation of paths, logging) and the practice of agriculture which resulted in the
creation of more edge zones (i.e. zone between forest and open field). Even though roe deer are able to
live in several different biotopes; open field, forest and forest edges, the latter provides the ideal
Page | 12
Figure 4. A roe deer male eating juicy buds (Harvey, 2014).
habitat. The edge zone biotope provides both shelter and a wide variety of food, since roe deer have
access to plants associated with forests, forest edges and (the grasses of) the open field. Additional
requirements of the habitat are related to the size (e.g. habitat should be large enough for them to carry
out their specific lifestyle and behaviour) and the availability of rest spaces (Worm, 2014).
Unlike large grazers, roe deer are selective eaters also known as ‘concentrate selectors’. As the rumen of
roe deer is only able to digest small sizes of food, roe deer selects for easy digestible and energy rich
food (ZV, 2014). In early spring they start eating the juicy buds and shoots of trees (figure 4),
supplemented with shrubs and different herbs from the edges of roads and ditches. During the winter
roe deer have to live from less digestible food, such as tree bark (VHR, 2014a). The roe deer is a
ruminant (i.e. mammal which is able to progressively break down its food by alternating it between its
mouth and various stomachs, one of which is the rumen) and spends 12 to 14 hours a day searching for
food and ruminating. In addition, the roe deer likes eating berries, various crops, and even mushrooms
(ZV, 2014).
2.1.3 Roe deer living areas in the Netherlands
The distribution of the roe deer in the Netherlands comply with the habitat requirements mentioned in
2.1.2. The roe deer is mostly seen at edge zones between agricultural or grass land and forests, as this
offers them the best living conditions. However, there are some additional requirements roe deer need
in their living areas which explains their absence in some natural areas in the Netherlands. For instance,
roe deer are very susceptible to stress and can suffer illness or even die as a result (VHR, 2014b).
Consequently, roe deer tend to avoid areas with other large ungulates or livestock, as is seen in the
Oostvaardersplassen (Dutch natural area). In the Oostvaardersplassen the number of roe deer
individuals declined as a result of growing numbers of large wildlife individuals (Bijlsma, 2008 cited by
Vullink, 2009). The same is observed in the Amsterdam Water Supply Dunes, where an increase of the
fallow deer population resulted in a decrease in the local roe deer population (Groot Bruinderink et al.,
2007).

Page | 13
Figure 5. Winter herd (left) and summer herd (right). The pink figures represent does and the blue figures represent bucks. The size of the figures illustrates the age (e.g. small figure = calf , middle sized figure = yearling and large figures = adult).
2.1.4 Behaviour Yearly pattern The roe deer is, unlike the red deer or the fallow deer, a relatively unsocial ungulate. Only for specific
periods during the year roe deer refrain from their solitary existence and form small groups; known as
winter and summer herds (figure 5). A winter herd is formed at the beginning of the winter and consists
of a summer herd (i.e. a doe and her calves) with the addition of a yearling doe (i.e. female offspring of
that doe from the previous year) and often an adult buck. With the arrival of spring the winter herds fall
apart. First, the territorial and aggressive behaviour of the adult buck increases and the yearling bucks
(i.e. male offspring of that doe from the previous year) are chased away by the adult buck. The adult
bucks starts to live more solitary and is no longer part of the herd. A little bit later, when that years
calves are being born and during the subsequent lactation period dominant does chase away the
yearling does. By this time the group consists only of a mother doe with her newly born calves. From
mid-July until mid-August the rut (i.e. period of sexual activity) takes place in which approximately 98%
of the does are fertilized. The adult does and yearling does which have not or were unsuccessfully
impregnated during the rut, have the opportunity to be fertilized during the second rut (i.e. end October
till beginning of November). After fertilization the yearling does are re-joined into her family herd and a
winter herd is formed all over again (Worm, 2014).
Territorial behaviour
As mentioned in the previous paragraph (2.1.4, Yearly pattern), the behaviour of the roe deer is strongly
influenced by the time of year. In the winter roe deer live a rather social life and form herds, other than
the summer in which roe deer have a more solitary lifestyle. In the latter territorial and dominant
behaviour play a major role, especially for bucks. At the beginning of spring, whilst the winter herd is still
intact, adult bucks start to show the first signs of aggressive and dominant behaviour towards the
younger bucks and other herd members. In particular immature, non-dominant bucks are the target of
aggressive behaviour by the adult bucks. After a while the young bucks are expelled from the territory of
the dominant adult buck and start roaming. The peak in aggressive and dominant behaviour is reached
during the rut when the level of testosterone of the bucks is the highest. At this time the dominant buck
spends most of his time marking his territory and chasing away other bucks. If a buck survives to the age
of 2 or 3 he is usually able to obtain and defend his own territory. Old bucks are able to lose their
territory and as a result reduce their movements or become nomadic (Worm, 2014).
Page | 14
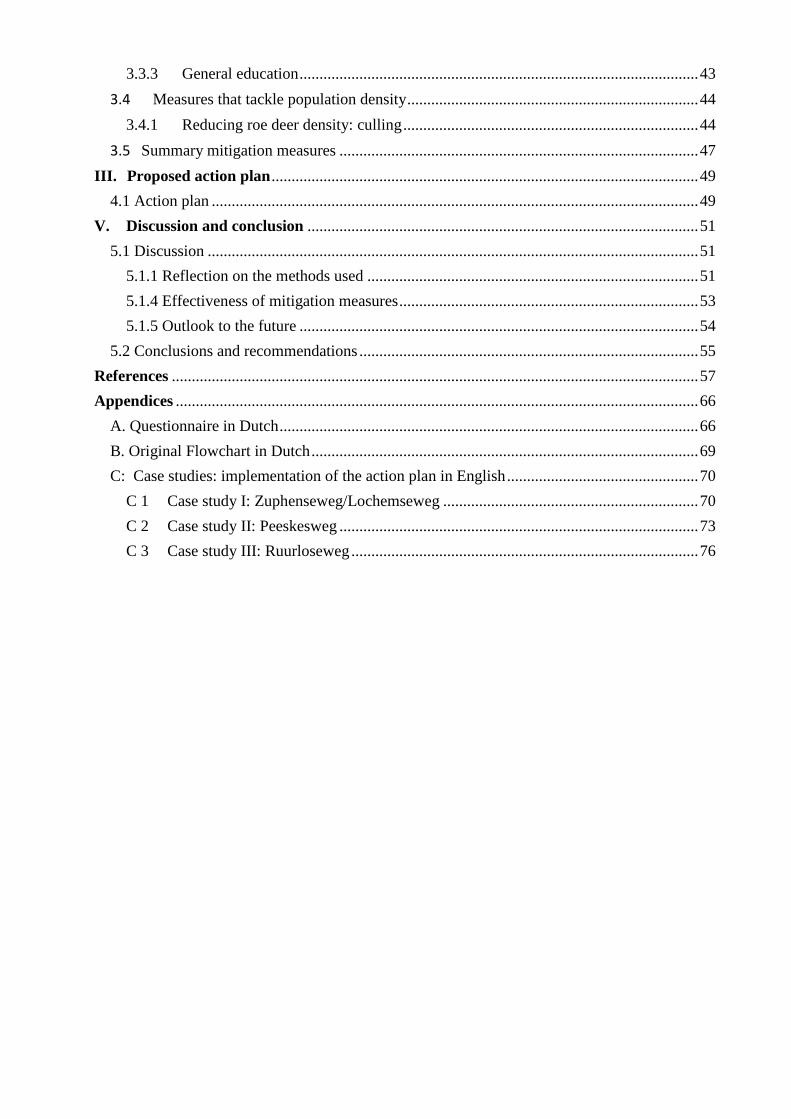
Figure 6. A doe with two calves (pixgood.com.com, 2014)
Does are known to be non-territorial as the living areas of different does are able to overlap for most
part of the year. However, this does not entail that there is no dominance hierarchy among female roe
deer. The strongest doe is able to occupy the best living area and can be intolerable towards other, less
dominant, does. The peak in dominant behaviour of does is at the time the calves are born and during
the subsequent lactation period (figure 6). During this time there is no overlap between living areas of
different does. Even though does tend to be more tolerable towards family, the yearling does (i.e.
offspring of the previous year) are chased away as well just before the birth of that years calves.
Generally dominancy ensures a good living space, including a variety of food sources, shelter and safety
(Worm, 2014).
Just as dominant does, dominant bucks are the ones with the better living areas in comparison to the
weaker, non-dominant bucks which are forced to the lesser grounds (e.g. the edges of territories of
other bucks and unsafe areas close to roads). These young, non-dominant bucks roam between
territories and are often being chased away. When the population density is high this characteristic will
result in frequent flight (Worm, 2014). In addition, there is an increased risk of predation and mortality
due to disease or parasites associated with a reduced fitness (pers. comm. M. Rijks, 2014).
An increase in population density has, in addition to an increase in flight of non-dominant bucks, an
influence on territory size as well. The size of a buck’s territory in a certain area depends on the density
of the population, the availability of ecological sources (e.g. food, escape possibilities), the age of the
bucks and the male to female ratio. If the density of the population roe deer increases the size of the
individual territories will decrease until a minimal size of the core area is reached. In that case yearling
bucks and does are expelled from the area according to the dominance hierarchy (Worm, 2014).
Daily activities On average, the most time consuming daily activities of the roe deer consists of foraging (± 6h),
ruminating (± 6h) and resting (± 7h). In addition, roe deer spend some of their time migrating through
their habitat (± 2h), maintaining social contacts (± 1h) and grooming (± 2h) (Klip, 2004). The activity
pattern of animals is regulated by their internal regulator. This makes it possible for animals to adapt

Page | 15
Figure 7. a) Annual plot of mean female (left) and b) male (right) roe deer activity in a Bavarian Forest National Park (Germany) generated by a boosted generalized additive model (colours values; from dark green to light red means increasing activity values. X-axis - time of day (hours); y-axis-date) from Statche et al., 2012.
their behavioural and physiological processes to outside changes such as change in the availability of
food, temperature and light. For instance, the changes in daily photo- and thermo period (i.e. the
duration of an animal’s daily exposure to light or to a particular temperature) among the different
seasons affect animal behaviour. An increase in temperature, for example, could lead to a reduced
animal activity during the day and a more pronounced activity during periods of crepuscular (i.e. dusk
and dawn) and night times in order to reduce energy expenditure (Alters, 2000).
The daily and annual activity pattern of male and female roe deer was studied by Statche et al. in a
Bavarian Forest National Park (Germany) (2012). By using GPS-GSM collars they analysed the activity
pattern of twenty male and nine female roe deer living in the Bavarian Forest National Park for a period
of two year (2006-2008). It turned out that even though male and female roe deer do not vary greatly in
morphology, they do differ in the use of their habitat, the size of their home range and activity pattern.
Female roe deer show most activity during periods of sunrise and sunset (figure 7a; time of sunrise and
sunset not shown in figure). This is seen throughout the whole year with highest crepuscular activity
documented from the end of October until the beginning of March. The overall activity (e.g. daytime,
night time and crepuscular time) of the female roe deer increased from March until June. The overall
higher activity during dusk and dawn documented for female roe deer is seen for male roe deer as well
(figure 7b). However the crepuscular activity of male roe deer was more pronounced. The activity at
dusk started to increase in mid-February. A little bit later, at the end of April, the activity during the day
increased and continuing until mid-June. In July the highest overall activity was documented. In August
the activity of the male roe deer decreased again.
For both sexes Statche et al. (2012) documented the highest activity during dusk and dawn. It is
Important to note that they used neck collars, and since these are placed around an animal’s neck, head
movements will affect the acceleration sensor. Activities such as grooming and grazing could result in
high activity values and constant directed runs might result in lower activity values. However the results
of Statche et al. (2012) are assumed to give a valid impression of the activity pattern of the roe deer.

Page | 16
Figure 8. The Dutch road network in 1930 (left; Tu/e, 2014) and in 2013 (right; CBS, 2014). Red lines are national roads and yellow roads are provincial roads.
2.2 Landscape design of the Netherlands
The landscape design of the Netherlands is, next to the ecology of the roe deer, an aspect influencing
DVCs. For instance, the construction and use of roads and the degree and location of agriculture and
natural areas could influence roe deer behaviour. In addition, recreational activities in the Netherlands
could disturb living areas of the roe deer, and in doing so affect the number of DVCs. Therefore, this
section focuses on human activities leading to the animal’s presence on roads.
2.2.1 Road network of the Netherlands The Dutch infrastructure (e.g. bridges, roads, railway lines etc.) has increased over the past decades to
be able to handle the growing human population and to broaden travel range (figure 8). In particular the
development and use of highways and (provincial) roads has increased, as more and more people own
and use a motor vehicle to travel, for example, to and from work. However, the creation of
infrastructure is at the expense of the connectivity and areal of natural habitats (Taylor et al., 1993). As a
result, natural areas become more isolated and the migration of many animal species is hindered. In
doing so, animals such as the roe deer, are forced to cross roads in this manner increasing the risk for
DVCs.
Types of road
There are several types of roads in the Netherlands of which three are the most common seen outside
of towns and villages; national roads, provincial roads and property access roads. It is important to know
the differences between these roads as their characteristics (e.g. permitted speed, width etc.) could
influence the probability for DVCs. National roads are designed for a rapid flow over long distances. The
permitted maximum speed on this type of road is 100-130 km/h, except for hazard points were the
maximum speed is usually lower. In order to contribute to the flow function of the road intersections

Page | 17
Figure 9. The average activity on the Dutch roads from 2004-2008 on Saturdays (blue), Sundays (green) and during work days (red). Adjusted from OViN, 2010.
are placed at floor level. Exchange to other roads are only possible at intersections or different levelled
connections. The second type of road, the provincial roads, are developed to connect residential areas
(i.e. places people live, work and/or recreate) to each other or to connect residential area’s with flow
roads. The permitted maximum speed on provincial roads is 80 km/h, except for hazard points and
intersections were the maximum speed is lower. Property access roads make it possible to access areas
were houses, businesses or agriculture is situated. Drivers have to be aware of disturbance as exchange
is able to take place both on intersections as on road levels. Therefore a lower speed limit of 60 km/h is
created, except for hazard points and intersections (Ooms, 2010).
Roadsides The design of the roadsides is able to differ greatly in terms of type of vegetation, policy and width. As
roe deer are able to feed from and cross roadsides before entering the road, this is an important aspect
of roads to discuss. Roadsides are generally characterized by various grasses and herbs from which roe
deer likes to eat. Among roadsides there are differences in the type of management. For the Dutch
National roads there is a uniform rule in which roadsides should be mowed one or two times a year.
Generally, mid-June is the first time roadsides are mowed and part of the vegetation is removed (CBS,
2013). The width of the roadsides and the degree of vegetation are also important factors affecting the
visibility of objects (e.g. warning signs, other drivers, wild) and influences driver safety (Ooms, 2010).
Use of roads Collisions between animals and vehicles occur when both parties are present on the road. The busiest
time for humans to be on the road is known to be around rush hours. In the Netherlands this is around
the time most people drive to work (i.e. 7:00 – 9:00) or drive home (i.e. 16:30 – 18:30). In figure 9 the
average number of cars on the Dutch roads are documented over a period from 2004 – 2008.

Page | 18
Driver response
In general people are less able to distinguish objects, colours and movements in the dark than in the
daylight. People driving in the dark are therefore more prone to accidents. The safety of driving in the
dark can be improved by illuminating the roads and the use other lighting techniques such as reflection
of road signs or road surface (SWOV, 2009). As the speed of a vehicle increases, the primary field of view
of the driver decreases. This is illustrated by the decrease in horizontal primary field of view from 70° to
30°, in case of a speed increase from 60 to 100 km/h. As a result drivers will observe less from their
surroundings (Ooms, 2010).
Furthermore, there is a difference in braking distance when driving different speeds (figure 10). The
braking distance is the sum of the reaction distance (i.e. distance covered during reaction) and the
distance covered during braking. For example, the braking distance for an object spotted at 28.5 m is ca.
70 m when driving 90 km/h and 38 m when driving 60 km/h (Daniels et al., 2010). This indicates that
when driving at a lower speed, the chance for a DVC to occur decreases. However, this is the in case the
animal is spotted by the driver, which is not always the case.
2.2.2 Natural areas and agriculture in the Netherlands Natural areas in the Netherlands are frequently used for recreational activities, such as cycling, (dog)
walking and horse-riding. However, natural areas are also the living spaces of many wild animals
including the roe deer and the plants they eat. The amount of recreation in blue (i.e. large lakes, rivers
and channels) and green (i.e. forests and natural areas) areas in the Netherlands has increased over the
past eight years (CBS, 2014). Aside from recreational activities, agricultural activities are also widespread
in the Netherlands and are often close to or overlap with living areas of the roe deer.
Figure 10. Total stopping distance divided in reaction and braking distance. On the X-axis the total stopping distance is shown and on the y-axis the different driving speeds. The thick black line represents the 28.5 m distance from
driver to object (Daniels et al., 2010).

Page | 19
Figure 11. The percentages of collisions in Great-Britain with roe deer throughout the year (averages from 2003 - 2005) with n= 3826, adjusted from Langbein et al., 2011, based on data from Langbein and Putman, 2006 and Langbein 2007a.
2.3 Causes of deer vehicle collisions
In the above, several aspects of the roe deer and the Dutch landscape design were discussed. However
the manner in which these aspects influence the number of roe deer vehicle collisions have not been
explained yet. Therefore this part of chapter 2 focuses on how the behaviour of the roe deer and the
Dutch landscape design affects DVCs. In figure 11 the percentages of collisions in Great-Britain from
2003 to 2005 are presented in which seasonal variation in DVCs is shown (Langbein et al., 2011 based on
data from Langbein and Putman, 2006 and Langbein 2007a). It is suggested that this graph corresponds
to the pattern in DVCs in the Netherlands. However for the Netherlands a graph for the number of
collisions per month for the entire country is not available. Aside from the differences in the number of
DVCs throughout the year, there are also differences in sex and age between the road kills. First, the
causes of DVCs with regard to the behaviour of the roe will be discussed, followed by the influence of
humans on the number of DVCs.
2.3.1 Location characteristics Collisions may occur on any type of road. However, there are some characteristics of roads (and its
surroundings) that could increase the chance of DVC: speed of the driver, type of road edge and road
width. For example, 80 km/h roads (i.e. provincial roads) are known to be related with high number of
DVCs in comparison to national or property access roads. Another example are roads with on one side
forest area and the other side agricultural area are possibly also high risk roads as these roads tend to
separate the resting area of the roe deer from their foraging area. In doing so, these roads ‘force’ the
roe deer to cross the road. As a last example, Knoflacher (1980) found that roads wider than 6 meter
were accompanied by a higher number of collisions than roads smaller than 6 meter as wildlife will have
to spend more time on the road when crossing (cited by Molenaar and Henkens, 1998).

Page | 20
Figure 12. A) Average nr. of collisions with roe deer on the Veluwe (Dutch Natural area) from 1992 – 2008 divided in: adult male (blue), adult female (pink) and calves (green). Adjusted from Groot Bruinderink et al., 2010. B) Number of collisions with roe deer bucks of different age classes (Wildbeheer Veluwe, 2012 cited by Klomberg, 2012).
2.3.2 Behavioural aspects
There are several aspects of the behaviour of the roe deer that are able to lead to or increase the
number of DVCs. These behavioural changes vary throughout the year and result in a yearly pattern in
collisions (see also figure 11; number of collisions differ per month). This paragraph describes the
behavioural changes throughout the year in relation to DVCs.
Yearly pattern in behaviour Spring and summer
The frequency of road related deer mortalities vary throughout the year and is possibly related to
season-specific behaviour of the roe deer. The majority of the DVCs occur during the period April to May
and appears to coincide with the winter herd falling apart. The yearlings leave their natal range and
adult bucks will establish new territories (Desire and Recorbet, 1990, Hartwig, 1991, SGS Environment,
1998 cited by Langbein et al., 2011; Pokorny, 2006; Groot Bruinderink and Hazebroek, 1996). In doing so
adult bucks behave aggressively, in particular towards young bucks, and exclude individuals from their
territory (Worm, 2014). As a result numerous young bucks are chased onto roads, or cross roads in
search for safe living spaces and end up as road kill. This corresponds to the majority of the road related
deer mortalities in April and May, which is male and of the age between 1 and 4 years old (figure 12B).
Around the same time, from the beginning of May until the end of June, that year’s calves are born.
Mother goats generally occupy a smaller territorial range during birth and subsequent lactation period
(Kurt, 1968, Danilkin and Hewison, 1996 cited by Klomberg, 2012) and are probably therefore less likely
to cross or to be in the vicinity of roads. At the onset of the rut, which takes place from mid-June until
mid-August (Worm, 2014), the percentages of collisions remain relatively high. During the rut adult
bucks chase after potential female mating partner(s), causing both sexes to cross roads more often and
increasing the risk for collisions. Furthermore, this period is characterized by a peak in the testosterone
level of adult bucks, making them (more) intolerable towards younger bucks (Worm, 2014).

Page | 21
Figure 13. The number of collisions between 2005 - 2011 in relation to time of day for the province Utrecht (adjusted from Schoon, 2011)
Autumn and winter
In the period from October and November a second, a more subtle peak is observed (see also figure 12).
At this point calves are about 4 to 5 months old and start to be more active and are therefore the victim
of collisions more often (figure 12B). Furthermore during this period (end of October until the beginning
of November) the second rut takes place, in which goats not impregnated during the first rut can be
fertilized. As a result, adult roe deer individuals probably crossing the road more often as bucks tend to
chase after does and chase away other bucks (Worm, 2014). At the end of autumn and the beginning of
winter, the winter herds are being formed in which the overall activity of the population is increased.
Roe deer will spend more time on searching for food and migrating from and to natural areas. During
autumn and winter more does are the victim of collisions than bucks (figure 13A). This is probably the
result of the leadership does have in the herd. As the leader of a herd tends to be the first one to cross
the road, they have a higher chance to get hit by a car (pers. comm. J. Brinkman).
2.3.3 Daily variation in behaviour Aside from having certain peaks in activity during the year, the roe deer has peaks in activity throughout
the day as well. Generally the roe deer is most active during the hours of darkness, primarily during dusk
and dawn (Statche et al., 2012). Since roe deer are relatively sensitive to stress and therefore (human)
disturbance roe deer tend to avoid open areas during daytime and prefer to migrate and forage during
crepuscular times (Putman and Mann, 1990; Putman, 1997). Unfortunately, these times are also
associated with peaks in activity on the roads (e.g. number of cars/hour) in the months were rush hour
takes places in dusk and dawn. In addition, at crepuscular times the light conditions are poor and drivers
are less able to detect deer and other wild animals on time. Therefore most deer-vehicle collisions
happen during these hours of darkness (figure 13). This was recognized in a study at Veluwe between
1979 and 1994, which observed a peak in collisions around 7:00 h and one between 21-24 h (Groot
Bruinderink & Hazebroek, 1996).
2.3.4 Anthropogenic factors Infrastructure Aside from the roe deer population, the Dutch human population has increased as well and with that
the Dutch infrastructure. As stated in section 2.2.1, the construction of roads and railways has come at

Page | 22
Figure 14. A roe deer female in wheat field (Schulz, 2014) http://www.helgeschulz.de/galerie/rehe-rehbock-rehwild/rehbock-reh-wild-bilder-fotos-roe-deer-capreolus-capreolus-photos-pics-pictures-images-08457.htm
the expense of natural areas and their connectivity (Taylor et al., 1993) and are impeding migration and
gene flow between roe deer populations. Roe deer will have to migrate as a result of population
pressures or for foraging purposes and are therefore ‘forced’ to cross roads. The sharing of the road by
roe deer and motor vehicles increases the risk for collisions. This is also seen at the start of summer,
when the clock has to be turned one hour forward, and drivers are therefore earlier on the road than
the months before. As roe deer are usually active during dawn, and the time has been converted in a
way that drivers are active at an earlier time, this results in an increase in DVCs.
Roads are able to differ in a variety of characteristics of which the width of the road is one. The width of
the road could affect the probability of motor vehicles to collide with roe deer. Also, it could be that roe
deer individuals observe roads as an edge area of their habitat if it is a certain width. According to a
study of Knoflacher (1980) the risk of collision increases with the width of the road, because the animals
are spending a longer time on the road (Knoflacher, 1980 cited by Molenaar and Henkens, 1998). The
design of the landscape surrounding roads influences the attraction of wildlife to the roads as well. In a
lot of cases roadsides in the Netherlands are edge zones and it is known that roe deer prefer edge zones
as a place to forage (Worm, 2014). In spring the roe deer are possibly attracted to the juicy buds, leaves
and shoots from trees and shrubs as well as a lot of herbs from the edges of roads and ditches.
Recreation and agricultural activities
The natural areas in the Netherlands are frequently visited by recreationalists, especially when weather
conditions are good (spring and summer). However, these areas are also the habitat of the roe deer.
Recreation is therefore able to have negative effects on the roe deer, known to be vulnerable for stress.
For example, unleashed dogs could chase deer onto streets and roads. As mentioned in 2.1.2 the roe
deer prefer edge zones between agricultural lands and forests. However, it turns out that in these areas
there has been an increase in recreational activities over the past years (CBS, 2014) possibly resulting in
an increase in DVCs. Next to recreational activities, the Netherlands has also a great deal of agricultural
activities. Agriculture is also able to influence roe deer behaviour. For example, crops are able to provide
cover for roe deer (figure 14). Once a farmer starts to harvest the crops (such as wheat (Triticum-
species) and corn (Zea mays subsp. mays)) the cover is lost and roe deer will start to roam. It could be
that this results in an increase in the number of DVCs (per. comm. J. Brinkman).

Page | 23
2.3.5 Causes of DVCs: A summary
In the figure below the major causes of roe deer collisions in the Netherlands discussed in this report
have been shown (figure 15). These are considered the main causes of roe deer collisions in the
Netherlands according to the author on the basis of own expertise acquired from the research:
Major causes related to roe deer behaviour: Major causes related to human behaviour:
Winter herd falls apart and territorial behaviour starts The beginning of spring; more people recreate in nature
Calves are being born, does become territorial Start summer; clock one hour ahead
Rut takes place and peak in territorial behaviour Harvesting of wheat
Second rut takes place and calves become more active Harvesting of corn
Winter herd is formed and an increase in food searching Start winter; clock one hour backward
Figure 15. A summary of the main causes of roe deer vehicle collisions in the Netherlands. The upper section illustrates the behaviour characteristics of the roe deer influencing collisions with roe deer and the bottom section illustrated the human activities influencing collisions with roe deer in the Netherlands. Wheat in the Netherlands is generally harvested from end July until beginning of August (Franzenlanbouw.nl, 2014). Corn in the Netherlands is generally harvested from mid-September until mid-October (wikipedia.org, 2014).

Page | 24
Figure 16. Cartoon about DVCs and DVC mitigation measures (cartoonstock.com, 2014)
III. Mitigation measures
In order to reduce the frequency of roe deer-vehicle collisions in the Netherlands several mitigation
measures have been developed over the years (figure 16). In this chapter the different mitigation
measures, their effectiveness in reducing DVCs, management application and an estimation of the costs
are discussed on the basis of literature and interviews with experts and stakeholders. In cases where
measures have not been tested for the roe deer, or the results of these tests have not been
(internationally) published, the effectiveness of that measure on the number of collisions with another
wild animal have been discussed where available. In cases where data was available from multiple
animals preferably an ungulate was chosen as these are thought to have most similarities (i.e. in
behaviour and physiology) with the roe deer of all wildlife. Nevertheless it is assumed in this review that
all wildlife react in a similar manner to the mitigation measures. Furthermore, due to limited data
availability on mitigation measures tested in the Netherlands, studies from other countries have been
used as well. The measures discussed in this chapter are grouped in the manner in which they are
thought to reduce DVCs, namely those aimed at altering roe deer behaviour (paragraph 3.1), those that
tackle road design and driver behaviour (paragraph 3.2), those that tackle multiple causes (paragraph
3.3) and those that tackle population density (paragraph 3.4). At the end of this chapter all measures
are compared to each other in a summarizing table in order to select for the mitigation measures most
effective in reducing DVCs according to the authors opinion.
3.1 Measures that tackle roe deer behaviour
As discussed in paragraph 2.3 there are several behaviour characteristics of the roe deer leading to its
presence on roads, such as territorial behaviour and travelling to foraging and/or rest areas. At times
when drivers are on the road this kind of behaviour could lead to dangerous situations such as collisions
with roe deer or evasive manoeuvres of drivers after noticing roe deer. Both situations result in a
decrease in driver safety. This paragraph will discuss mitigation measures aimed at altering roe deer
behaviour in a way that the number of DVCs will be reduced.

Page | 25
Figure 17. Virtual fence sensor attached to a roadside post (Reid, 2012).
3.1.1 Virtual fence
The virtual fence (figure 17) is a relatively new measure to reduce the number of DVCs. It differs from a
physical fence (see 3.1.5) in that it does not form a constant physical barrier for animals and in that way
does not completely isolate roe deer populations from each other. Furthermore, a physical fence is
more expensive and forms barriers for humans as well (Jachowsk, 2013). The virtual fence consists of
sensors attached to roadside posts and is designed to deter animals in the vicinity of the road only at
times when motor vehicles are approaching. The sensors are being activated by the headlights of
approaching vehicles within 300 metres and upon activation will start to produce a sound and light
signal. As a result the animals close to the sensors will be stimulated to leave the (area of the) road. The
sensors are placed on both sides of the road and on each side are spaced 50 metres from each other.
The virtual fence works autonomous with a solar powered system, making it independent of power grid
(pers. comm. J. Dorgelo).
Risks and effectiveness
The use of the virtual fence to reduce DVCs is relatively new. Therefore, few literature about the
effectiveness of this measure is available. However, a study conducted by Moser (2007) shows
promising result. During his study the virtual fence was introduced on six roads in Austria in the year
2003. Over the five year trial period (2003 to 2007) an average reduction in DVCs of 93.6 % was
documented (figure 18) in comparison to the average number of DVCs documented in the pre-trial
period (2000 to 2002). It is important to note that the study of Moser (2007) shows numbers of
collisions of all ‘deer’, without clarification which deer species the data concerns. Nevertheless, it can be
expected that the effects of the virtual fence are the same for all deer species. Currently tests with the
virtual fence are also being performed at several locations in the Netherlands. Unfortunately, no data of
this trial are available at the time of writing (January 2015).
The effectiveness of the virtual fence is dependent on several aspects. For instance, roe deer tend to
adapt quickly to changes such human activity, vehicles passing by and/or the presence of roadside
lights. Habituation is therefore a great concern in the process of selecting an effective DVC mitigation
measure. For the virtual fence, high traffic volume would result in a constant activation of the sensors.
In doing so, the sensors would constantly produce sound and light and it can be argued that roe deer
might adapt to this, making the system ineffective. However, according to the study Moser (2007) the

Page | 26
Figure 18. Total number of collisions per year on six roads in Austria. A trial with the virtual fence was started in 2003 (see red arrow). Figure adjusted from Moser (2007).
effect of habituation is proved to be not an issue as during his five year trial the number of collisions
stayed reduced in contrast to the background number. Apparently the roe deer did not habituate to the
virtual fence. Moreover, JD Traffic Safety Systems, a Dutch manufacturer of the virtual fence, states that
when activated continuously the system will stop producing sound and light and the type of sound
produced by the virtual fence is interchangeable (pers. comm. J. Dorgelo).
Theft is also an aspect to take into account when selecting mitigation measures. As the virtual fence
sensors are attached to roadside posts, they are easily detached and stolen. However, theft is, according
to the Dutch manufacturer, not of great concern as the sensors will produce an annoying high pitched
sound when detached from the posts. This sound will make you leave the area and is considered to limit
the amount of theft (pers. comm. J. Dorgelo).
The latter risk is the lack of effectiveness during the day. As the system is only activated by the headlight
of motor vehicles, and headlights are usually not on during the day, the system will not prevent
collisions from happening during daytime. Even when a car does have its headlights on during the day
the ambient light level will normally be too high to activate the virtual fence sensors. Nevertheless,
during dusk and dawn, when most collisions happen (Statche et al., 2012; figure 13), the system could
be helpful in preventing DVCs.
Management option
In order to reduce the number of DVCs a virtual fence could be placed alongside roads. The operational
time of the virtual fence sensor is, in case of continuous use, nine months, and in case of in standby
mode four years. The live span of the sensors is expected to be between around eight to ten years.
According to the Dutch manufacturer the system is maintenance free (JD Traffic Safety Systems, 2014).
Costs
The costs of the sensors are € 90 –130 per piece and the roadside posts (not always needed, as in most
cases roadside posts are already present) are € 25,50 per piece (JD Traffic Safety Systems, 2014).

Page | 27
3.1.2 Roadside reflectors Roadside reflectors are frequently used in the Netherlands to reduce the number of collisions with
wildlife. However, about their effectiveness there exists much debate. In the Netherlands different kinds
of roadside reflectors are used, generally wildlife mirrors, Swarex- and ITEK reflectors and blue reflectors
(table 1). These reflectors are installed on roadside posts on both sides of the road and reflect the light
from motor vehicles passing by either as a continuous light or as a flashing light. The way the light is
being reflected depends on the type of reflector and the way the reflector is installed. Roadside
reflectors are intended to slow down the behaviour of wildlife and alert them to oncoming motor
vehicles and not to prevent them from crossing the road. Slowing down wildlife would make them more
liable to cross the road when the motor vehicles have passed (Langbein et al., 2011).
Risks and effectiveness
As previously mentioned, roadside reflectors are regularly used in the Netherlands. However, the
effectiveness of reflectors have not been proven. In fact, Molenaar and Henkens (1998) conducted a
study in which 127 studies concerning the effectiveness of different types of wildlife reflectors have
been analysed and concluded that roadside reflectors are barely effective in reducing DVCs. First of all, it
is known that most DVCs occur during dusk and dawn (Statche et al., 2012), though during these times
not all drivers have their headlights turned on yet. As a result there is no reflection of the headlights and
in that way no influence on DVCs. Secondly, the effectiveness of the reflectors is less during dusk and
dawn as the general ambient light outside is still quite high. In addition to losing effectiveness during
dusk and dawn, the effectiveness of the reflectors will also be reduced when traffic volume is high. In
this case, wildlife will be constantly observing the reflected lights and will habituate to this (Langbein et
al., 2011). Moreover, if wildlife has no opportunity to cross the road due to high traffic volume, at some
point they will take the risk and cross the road, despite the reflectors.
Nowadays, there are reflectors in different colours such as the blue reflector. Because the blue reflector
is relatively new, limited data is available about the effectiveness. Currently blue reflectors are being
tested in Winterswijk, Netherlands. In doing so, 650 reflectors have been placed on both sides of the
road. After one year a reduction of approximately 50% in DVCs has been documented
(Achterhoeknieuwswinterswijk.nl, 2014) in comparison to the average number of collisions of the
previous years. Nevertheless the effectiveness of blue reflectors on the long run is uncertain, as
habituation could take place just as with the other types of reflectors. Pepper (1999) cited by Langbein
et al. (2011), however, did not see a difference in effectiveness in comparison of red and green-blue
reflectors. Therefore, more research on the effectiveness of different coloured reflectors is needed.
Huijser et al. (2008) studied mitigation measures to reduce wildlife vehicle collisions (WVC), but were
unable to draw conclusions about the effectiveness of roadside reflectors. They stated that the manner
of installation and maintenance could negatively influence the effectiveness of the reflectors. It is
important to note that also roadside vegetation and the management of this vegetation are factors
influencing the effectiveness of roadside reflectors. For instance, when the vegetation during a study on
the effectiveness of roadside reflectors is high, but is reduced in height during the study, this would
result in heightened visibility for driver and deer, lowering DVCs that could then be falsely attributed to
the reflectors.

Page | 28
Table 1. Four different type of roadside reflectors; roadside mirrors, Swareflex wildlife reflectors, ITEK reflectors and blue reflectors.
Roadside mirrors are polished 9 x 9 cm rustproof steel plates with
indentations. The headlights of motor vehicles will be reflected on the
mirror and perceived by wildlife as a flashing light (Ooms, 2010). From
a closing distance of 20 m the headlights start reflecting effectively. A
motor vehicle driving 80 km/h then takes 0.9 seconds before it passes
the mirror (Dienst Weg- en Waterbouwkunde, 2014).
Swareflex wildlife reflectors consists of synthetic prisms reflecting
light and are named after the provider, Swareflex. Whereas roadside
mirrors produces flashing lights, Swareflex wildlife reflectors produce
a longer, continuous light. The Swareflex wildlife reflector is available
in multiple colours. In the Netherlands the reflectors are usually white
or red (Ooms, 2010; Dienst Weg- en Waterbouwkunde, 2014).
ITEK reflectors are constructed of two Plexiglas strips decussately
fastened together and are named after the provider, ITEK. At the ends
there is retro reflective orange 3MTM diamond-grade foil on which dirt
cannot easily attached to. The ITEK reflector is fastened to the posts
by means of a chain and moves by wind. Thereby reflecting the light of
the cars in multiple directions (Ooms, 2010).
The blue reflector is a relatively new type of reflector. This reflector
has an oval-round form and has class III retro reflective foil in the
colour blue. According to the Dutch manufacturer, due to its oval-
round form habituation is less of a problem. This reflector can also be
attached to a post (JD traffic systems, 2010).
rlconsulants.nl, 2014
Ooms, 2010
fansels.nl, 2014
Trafficsystems.eu, 2014
Page | 29
Management options
Maintenance of roadside reflectors is highly important. Dirt that ends up on the reflectors due to
weather conditions and/or cars passing by will reduce the reflection capabilities of the reflectors
significantly (pers. comm. G.J. Spek). Frequent maintenance could result in a higher effectiveness of
roadside reflectors in comparison to unmaintained reflectors and is therefore required. Furthermore,
frequent mowing of the verge is required, otherwise vegetation will block the light from the headlights
to the reflectors and the reflected light into the roadside.
Costs
Roadside mirrors are currently (December 2014) not being sold anymore. The costs of a Swareflex
wildlife reflector is € 6,66 incl. tax, the costs of a ITEK wildlife reflector is € 8,40 excl. tax (Ooms, 2010)
and costs of blue reflectors are € 8,95 incl. tax, but without the roadside pole (JD traffic systems). Costs
of placing reflectors at every 25 meter on both sides of the road, inclusive roadside poles and labour
costs will be around € 1450,-per kilometre (province Flevoland, 2010 cited by Ooms, 2010). Costs of
maintenance are considered to be ‘high’ (Ooms, 2010), but exact costs are not available.
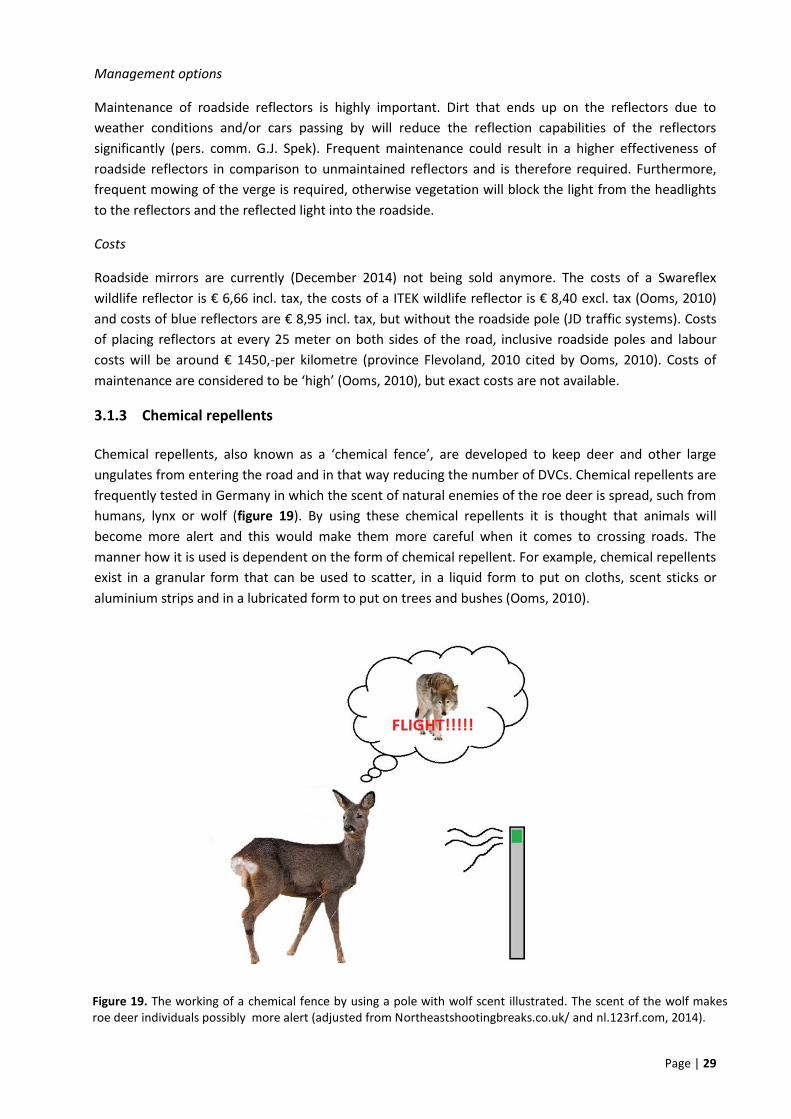
3.1.3 Chemical repellents
Chemical repellents, also known as a ‘chemical fence’, are developed to keep deer and other large
ungulates from entering the road and in that way reducing the number of DVCs. Chemical repellents are
frequently tested in Germany in which the scent of natural enemies of the roe deer is spread, such from
humans, lynx or wolf (figure 19). By using these chemical repellents it is thought that animals will
become more alert and this would make them more careful when it comes to crossing roads. The
manner how it is used is dependent on the form of chemical repellent. For example, chemical repellents
exist in a granular form that can be used to scatter, in a liquid form to put on cloths, scent sticks or
aluminium strips and in a lubricated form to put on trees and bushes (Ooms, 2010).
Figure 19. The working of a chemical fence by using a pole with wolf scent illustrated. The scent of the wolf makes roe deer individuals possibly more alert (adjusted from Northeastshootingbreaks.co.uk/ and nl.123rf.com, 2014).

Page | 30
Risk and effectiveness
Ungulates are thought to respond to the scent of natural predators in an instinctive manner, such as the
flight response. However, application of chemical repellents alongside roads and railways to reduce
WVCs have shown variable results. Andreassen et al. (2005) used the scent of ungulate predators
(brown bear (Ursus arctos), wolf and lynx) to deter Eurasian elk (Alces alces) from railways in Norway
and observed a reduction in collisions of 85%. These results are doubtful as the treatment was only
conducted over a distance of 500 meters alongside the railways, making it a low and variable sample
size. Tests with captive caribou (Rangifer tarandus) and black-tailed deer (Odocoileus hemionus)
resulted in no repulsiveness behaviour towards the synthetic repellents used (Brown et al., 2000b;
Shipley, 2001 cited by Huijser and McGowen, 2010).
However, Langbein et al. (2011) reviewed literature regarding DVCs and chemical repellents and wrote
that the German Automobile Association (ADAC) and manufacturers of chemical repellents in Germany
stated that ‘chemical fences’ are effective in reducing DVCs. Manufacturers of a commonly used German
scent fence reported, according to Langbein et al. (2011), a trial that was conducted in six test areas in
Bavaria and North-Westphalia, Germany. In this trial, a scent was used which was able to make 60% of
the animals in the treatment area withdraw from the area with the scent fence and cross the road
elsewhere. Although about 20% of the animals did cross the road area with the scent fence, they
crossed more rapidly in comparison to in the areas without the scent fence. The remaining 20% of the
animals was found to be unaffected. On one section of the road the number of DVCs declined from 20
to 2 per year (Kerzel and Kirchberger, 1993 cited by Langbein et al., 2011). However, even though the
DVCs in the trial declined with 30 to 80% in some test sections, the number of collisions outside the test
areas were increasing (Leberorger, 1993 cited by Langbein et al. 2011), reducing the overall
effectiveness of chemical fence. Unfortunately Langbein et al. (2011) did not provide information about
the duration of the trial and the type of scent fence used, which is important information to be able to
draw conclusions regarding the potential effectiveness of the chemical fence. Additionally, a short trial
(one year, in 2005) with chemical repellents in Slovenia on 11 road sections showed that the number of
road killed deer reduced with 44% in comparison to similar periods in the previous year. However, the
number of DVCs on a nearby road section increased significantly. Because of the increase in one of the
sections combined with the decrease in another section the total of DVCs did not differ significantly
from the control sections (Pokorny et al., 2008 cited by Langbein et al. 2011).
Ooms (2010) analysed several chemical scents and stated that if chemical repellents would be effective
in changing animal behaviour the effectiveness would only last for 1 to 24 weeks, and rainfall could
reduce this period greatly. Another risk is the effect of chemical repellents on the environment and
human health. On some products it is recommended to not use the product in densely populated areas
or in water extraction areas. Groot Bruinderink (2008), who tested the effect of scent fences on reducing
collisions the wild boar, stated that because of the lack of information about the components in the
chemicals in combination with the fact that some chemical agents are recommended not to use in water
extraction of densely populated areas, the use of these chemicals could lead to speculations and low
public support. Furthermore habituation of the roe deer to the scent used could happen, which will
reduce the effects of chemical repellents on the long run (G.J. Spek cited by Ooms, 2010). Huijser et al.
(2008) stated that the proof of the efficiency is not strong and it only works temporary. Huijser and
McGowen (2010) claim that “Habituation of the animals and the effort associated with continuous
replacement of the scent sources may make this mitigation measure ineffective and impractical” (p.65).

Page | 31
Management options
Management would consist of placing of the chemicals on poles (i.e. or on something else, dependent
on the choice and form of the chemical) and afterwards frequent replacement of the chemicals as the
effects are relatively short-lasting with rainfall further reducing the effective period.
Costs
The average costs will be between € 30 and € 90 for a litre for chemical scents. The costs are dependent
on the doses, the distance between the treatments locations and the replacement frequency. The yearly
material costs are estimated to be € 50 per kilometer. The costs will be higher if more repetition is
needed (Ooms, 2010).
3.1.4 Car-mounted warning whistles
Warning whistles (figure 20) can be placed on the front of a car and will emit a high frequency whistle
sound when the car drives faster than 48 km/h and air is free to flow through the whistle (Mastro et al.,
2011). The warning whistles are supposed to warn wildlife for approaching motor vehicles, and in doing
so make them leave the road area and reduce the amount of WVCs.
Risk and effectiveness
Romin and Dalton (1992) studied the effect of warning whistles on mule deer (Odocoileus hemionus). In
doing so, they were driving with a speed of 65km/h past 150 groups of mule deer that were up to 100
meters from the road and observed the behavioural responses of these ungulates. Romin and Dalton
found that two common used brands of whistles had no significant effect of the behaviour of mule deer
even in close proximity (within 10 meters). The animals were not showing acknowledgement or
avoidance of cars equipped with the whistles. Furthermore, the whistles did not reduce the number of
mule deer vehicle collisions. Despite this, deer whistles continued to be used nationwide in the United
States (Romin and Bissonette, 1996, Sullivan and Messmer, 2003).
The effectiveness of warning whistles is depended on the frequency the warning whistle produces and
the hearing capabilities of deer species it is aimed to deter. However, on both subjects literature is
limited and inconclusive. According to a review of Langbein et al. (2011) the manufacturer (name not
mentioned) states that warning whistles produce a sound of 16–20 kHz when driving at a speed of ≥48
km/h. The suggested hearing range of ‘deer’ however varies between studies but falls between 1 to 8
kHz (Scheifele et al., 2003; D’Angelo et al., 2007 cited by Langbein 2011). If this range is correct, the
Figure 20: Wildlife warning whistles (Amazon, 2014)
)

Page | 32
range of the warning whistles of the manufacturer falls short of the range of deer species. Experimental
trials performed by Scheifele et al. (1998, 2003 cited by Langbein 2011) with six other types of warning
whistles showed that the frequency they produced was between 3.3 and 10 kHz. This is, according to
Scheifele et al. (2003) more in the (presumed) auditory range of (white-tailed Odocoileus virginianus)
deer. It is important to note that normal roadway (tyre) noise produced by vehicles driving 72 km/h
produces 3.3 kHz which falls in the hearing range of deer (Scheifele et al., 2003). Therefore vehicles
driving at this speed will already be noticed by deer, making the additive value of warning whistles at
these speeds insignificant. Only at vehicle speeds between 48 and 72 km/h a warning whistle could have
an additive value in helping deer notice approaching vehicles.
In conclusion, warning whistles are ineffective in altering deer behaviour and therefore in reducing
DVCs. Firstly, even if the frequency produced by the warning whistle would be in the sensitive hearing
range of deer, normal roadway noise would overlap this sound. Secondly, roe deer are known to
habituate well to changes so even if the sound produced by whistles would influence movements in the
short term the animals will become accustomed to these sounds after long or frequent exposure
(Bomford and O’brien, 1990). In the absence of studies presenting significant evidence that whistles are
effective, they cannot be recommended (Hedlund, 2004).
Management options
No management needed as the whistles should be placed on the vehicles by the drivers themselves.
Costs
Deer whistles are about € 5,95 per piece (deerwhistle.com, 2014).
3.1.5 Roadside fencing
Roadside fencing (figure 21A) is a method to reduce the migration of animals from one place to another,
in that way reducing DVCs. This physical barrier should be of appropriate length and height and should
not prevent humans from travelling from one place to another. According to Staines et al. (2001; cited
by Langbein et al., 2011) and Putman et al. (2004) roadside fencing should not be solely designed to
prevent road crossings, but more so channel deer towards a place that is saver to cross.
Figure 21: A) Fencing for deer and B) a one-way gate in case a deer accidently ends up at the wrong side (e.g. road
side) of the fence (Derbyshire Stock Fencing LTD, 2014 and Huijser et al., 2008 respectively)
)
A B

Page | 33
Risk and effectiveness
Several researchers state that a proper designed and maintained fence, in combination with fauna
passages and one-way gates or jump outs is most effective in reducing the DVCs in Europe (Bruinderink
and Hazebroek, 1996; Putman, 1997; Staines et al., 2001 cited by Hedlund et al., 2004) and the United
states (Danielson and Hubbard 1998; Reed et al., 1979 cited by Hedlund et al. 2004). One-way gates and
jump outs are required in case an animal accidently ends up at the wrong (e.g. road) side of the fence
and make it possible for them to return to the right (e.g. forest) side of the fence (figure 21B). The
effectiveness of a roadside fence in reducing WVCs is on average 78.5 to 99 % (Reed et al., 1982;
Lavsund and Sandegren, 1991 cited by Langbein et al. 2011; Dodd et al., 2007; Ward, 1982; Sielecki,
1999 cited by Huijser and McGowen, 2010; Woods, 1990; Clevenger et al., 2001).
Cases were roadside fences have shown to be ineffective in reducing DVCs were found to be
inadequately constructed or of inadequate length (Reed et al., 1974; Ward, 1982; Clevenger et al.,
2001). One of the things to pay attention to with physical fences is that the fence should extend far
enough to prevent deer from detouring at the ends of the fence (Hedlund et al., 2004). By extending the
length of the fence the amount of detouring at the ends can be reduced (Ward, 1982; Clevenger, 2001;
Rosa, 2006 cited by Mastro et al., 2008).
Fencing is most effective when appropriate length is used in combination with alternative safer crossing
points to deflect animal movement towards these safer crossing points (Langbein et al., 2011).
Important to consider is that natural areas with only fences contribute to the fragmentation of natural
areas and reduce gene flow between populations of the same species. Therefore save passages are
necessary. In the absence of save passages animals could break through the fences bringing themselves
as drivers on the road in danger (Huijser et al.,2008).
Management options
After placement of the fence the management and maintenance efforts are minimal. Yearly checking for
holes and/or disruptions of the fence with subsequent reparations are sufficient. Maintenance of the
fence is important because deer are known to be able to find and use fence gaps (>23 cm) after which
they will find themselves stuck on the roadside with high risk for collisions (Ward, 1982; Feldamer et al.,
1986; Rosa, 2006).
Costs
The costs are around € 43,- per meter for a fence of 2.2 meter in height. For roe deer it is thought that
fences should be minimal 1.8 meter (Arfman.nl, 2014). The lifespan of these fences is on average 20
year (Arfman cited by Ooms, 2010). Inspection and maintenance costs were unknown to the author at
the time of writing (December 2014) but are expected to be relatively low.
3.2 Measures that tackle road design and driver behaviour
This paragraph focuses on mitigation measures aimed at altering road design and driver behaviour in
order to reduce DVCs. As discussed in 2.1.4, both road design and driver activity on roads are able to
influence the number of DVCs.

Page | 34
Figure 22. Distribution of DVCs in speed limit on roads of 81 road fatalities in the Netherlands (Ooms, 2010).
3.2.1 Reducing vehicle speed A reduction in maximum driving speed could aid in reducing the number of DVCs as lower driving speed
is generally associated with a longer breaking distance and reaction time. As a result drivers have more
time to respond to wildlife crossing the road and in doing so lowering the chances on DVCs. According to
an analysis conducted by Ooms (2010) in the Netherlands the vehicle speed associated with the highest
percentage (72%) of collisions is 80 km/h (figure 22). In his analysis 81 collisions with large wildlife (red-,
fallow-, roe deer and wild boar) were examined for which human injury was reported. Of the in total 81
collisions 15% occurred on 60 km/h roads and 12% on roads where the maximum speed was 100 km/h
and 120 km/h. A similar pattern is seen by Huijser et al. (2008) after studying the fatality Analysing
Reporting System (FARS) 1 from 2001 to 2005 of the United States. They were able to confirm that the
highest amount of (fatal) collisions with wildlife occur at speeds between 81-89 km/h (figure 23). In
addition, Seiler (2005) observed a peak in moose-vehicle collisions in Sweden at a speed of 90 km/h.
However, the proportion of human injuries and death increased with increasing speed limit.
However, Huijser et al. (2008) states that rural roads with a maximum driving speed around 80 km/h are
also often characterized by a higher population of wildlife. Therefore, not just the driving limit, but the
locations of these rural roads are also resulting in the high amounts of DVCs. Nonetheless, driving at a
higher speed is associated with a shorter breaking distance. Therefore lowering the maximum driving
speed on 80 km/h roads with high population of wildlife is expected to aid reducing the number of
DVCs.
Risks and effectiveness
Little scientific research was found on the effects of speed reduction on DVCs. However, some studies
were found on the effects of speed reduction on collisions with other animals, that will be discussed in
the light of DVCs. Reducing maximum speed is generally associated with resistance from road managers
and drivers, especially when reinforced by the placement of speed bumps (pers. comm. G.J. Spek, 2014).
Even when the maximum speed on a road is reduced it is uncertain if drivers will adhere to this reduced
mandatory speed limit. For example, in a study of Bertwistle in 1999 (cited by Huijser et al., 2008) the
mandatory speed limit on three separate sections (length 2.5, 4 and 9 km) of the road in Jasper National
1 FARS is a nationwide survey yearly providing data regarding fatal injuries suffered from motor vehicle traffic crashes (www. NHTSA.gov/FARS).
Figure 23. Distribution of animal vehicle collisions (AVC) by posted speed limit (Huijser et al., 2008)

Page | 35
Park in Alberta, Canada was reduced from 90 km/h to 70 km/h in order to reduce the number of
wildlife-vehicle collisions (WVCs). However, even with police controls, less than 20% of the drivers
adhered to the reduced mandatory speed limit. Jasper National Park contains different animals which
responded differently to the reduced mandatory speed limit. For instance, the number of bighorn sheep
(Ovis canadensis) collisions actually increased in the road sections with the reduced mandatory speed
limit and decreased in the road sections with the old, higher mandatory speed limit. In contrast, the
number of elk (Cervus canadensis) collisions increased in both the control as the road sections with
reduced speed limit (Bertwistle 1999). However, because just 20% of the drivers seemed to adhere to
the reduced speed limit, drawing any conclusions from this data would be invalid. Also according to
Huijser et al. (2008), an expert and fellow researcher on DVCs, the data presented by Bertwistle (1999) is
inconclusive and therefore the effect of reducing vehicle speed on WVCs is unconfirmed.
Moreover, aside from being ineffective in reducing DVCs, reducing speed limit is able to create
additional problems owing to the fact that drivers scarcely adhere to the new speed limit. For instance, a
situation will be created where multiple drivers on the same section of the road are driving different
speeds which increases the speed dispersion (i.e. the variability of vehicle speeds). Speed dispersion
increases the risk of crashes, even in situations where the average speed is decreased (Huijser et al.,
2008). Driver’s compliance to the speed limit is therefore very important. Driver’s adherence to a
reduced speed limit is influence by different factors, such as enforcement by police (Holland and Conner
1996 cited by Beckman 2004) and the presence of speed bumps or other physical deterrents. However,
even though the effectiveness of reducing speed limits in reducing WVCs is under debate it is clear that
reducing vehicle speed reduces the severity and amount of all types of car collisions and crashes
(National Research Council 1998 cited by Huijser et al, 2008).
Management application
In order to reduce the frequency of collisions with wildlife the maximum speed should be lowered (to,
for example, 50 km/h) on roads associated with high numbers of collisions (where the definition of
‘high’ should be agreed by the stakeholders). By lowering the vehicle speed, the breaking distance of
vehicles will decrease and drivers will be able to respond better to wildlife crossing the roads (Ooms,
2010). It could be argued that a lower maximum speed accompanied by wildlife-warning signs and
general education would be more effective than solely reducing vehicle speed. The addition of warning
signs helps drivers to understand why the maximum speed is reduced, possibly making them more
willing to obey. The effectiveness of wildlife warning signs however, depends on the type of warning
signs. The reduced speed limit should be enforced through police speed controls and using cameras that
track vehicle speed and use this information either for fining and/or to inform the driver. Furthermore
the road itself could be adjusted to prevent too fast driving, for instance by applying speed bumps or
adjusting the road (for instance by introducing turns to the road). Furthermore, as can be inferred from
the study of Statche et al. (2012) who studied the activity pattern of roe deer, the highest risk for
collisions is during the during dusk and dawn (see 2.1.4). It could be therefore suitable to only set a
reduced speed limit during these hours.
Costs
The costs of a sign is on average € 150,-. Applying a speed bump costs around € 2.000 to € 7.500,- and a
speed bump costs between € 10.000,- to € 20.000,- (Ooms, 2010). The exact costs vary per location and
are dependent on variables such as, road length, the kind and amount of speed bumps and/or warning
signs applied etc. Inspection and maintenance costs are unknown to the author at the time of writing
(December 2014).

Page | 36
3.2.2 Warning signs Warning signs are used to alert drivers for (possible) wildlife crossing the road and encourage them to
reduce their speed and be more alert. The efficacy of these signs differs between the different types of
warning signs. For instance, Active signs are activated only when animals are detected near the road
through infrared light, radar, laser or heat detection cameras. Upon activation a flashing message or
deer figure appears on the warning sign, alerting drivers of animals in the vicinity of the road. Active
signs are in some cases accompanied by fences, leading wildlife to safer crossing points (see 3.2.2;
wildlife signalling system). Furthermore, there are active signs activated by the presence of the driver on
the road. In this case the presence of a motor vehicle on the road activates the sign which shows a
lighted and animated deer symbol in response (Langbein et al. 2011). Furthermore there are a variety of
passive warning signs. In the Netherlands the J27 signs (figure 24) is a well-known permanent (passive)
warning signs placed on many deer-crossing locations. In other countries a similar type of passive
warning sign exists. Permanent passive warning signs are fixed signs on fixed locations with the same
message at all times. Secondly, there are temporary (passive) signs. These signs are placed temporary
only at deer migration corridors during periods of increased collision risk (e.g. during the main period of
migrations or the rut). Furthermore there are lighted and animated signs, called enhanced (passive)
signs in which signs are made more visible by addition of lights, flags or figure of a deer lighted or
animated (Hedlund, 2004). Some studies also tested the effect of adding dummy wildlife (e.g. deer,
moose) or actual deer carcasses alongside the road to show drivers that danger existed (Pojar et al.
1975).
Risks and effectiveness
The different types of warning signs differ in the effectiveness in reducing DVCs. First of all, active signs,
which are being activated by approaching vehicles, could be helpful in making drivers more alert. The
efficacy of active signs which are being activated by the presence of the animal (discussed in 3.3.1) is
variable and depends on several factors like if the sign is accompanied by advocatory or mandatory
speed limit and weather conditions (Huijser and McGowen, 2010). However, in paragraph 3.3.1 the
wildlife signalling system will be discussed which includes an active warning sign with mandatory speed
limit activated by the presence of animals at the roadside. The reported reduction of 93% in DVCs can
be partly attributed to the active sign. Moreover, on the basis of authors observations, it seemed like
drivers are obeying the reduced speed limit (author observation on the data of the Diepenheim project,
see 3.3.1).
Figure 24. Deer crossing warning sign in the Netherlands (J27) (obtained from verkeerspro.nl, 2015).

Page | 37
In the case of permanently placed passive signs there exists the risk of habituation of drivers. This would
make it less likely that drivers will respond to the sign which makes permanent signs ineffective in
reducing DVCs. Additionally, people tend to pay less time to the signs when the road in known by the
driver and when the signs are repeated multiple times. Furthermore, when there is a high traffic volume
drivers pay more attention to the road and less to the signs (Möri and Hani Abdel-Halim, 1980).
Temporary passive warning signs however, do not have the disadvantage of habituation and have
shown to reduce driver speed when comparing it to the same sign with traffic information or without
information (Hardy et al., 2006). Also, Sullivan et al. (2004) tested the effectively of temporary warning
signs in reducing speed and DVCs. However, the signs they studied were furnished with additional
reflective flags and permanent flashing amber lights. These temporary warning signs were placed at
mule deer (Odocoileus hemionus) migration routes and only during their seasonal migration (i.e. in
autumn and spring). Sullivan et al. showed that the temporary warning signs reduced the percentage of
speeders (i.e. driver that exceed the maximum permitted driving speed) from 19% to 8% during the first
year of operation. This reduction in speed was accompanied by a reduction in DVCs of 51%. But the
reduction in percentage of speeders was less pronounced during the second season, possibly because
drivers were habituating to the sign. Messmer et al. (2000) tested only signs during migration. They used
two large warning signs with flashing amber lights on a two and four mile road section. Furthermore
they used little flashing signs on each milepost between the sections. The signs resulted in a reduction of
speed of 12,9 km per hour during the three migration periods when signs were activated in comparison
to pre migration levels and reduction of DVCs of 50% and in spring of 70% during autumn in comparison
with the three year before (cited by Hedlund et al., 2004).
Enhanced passive warning signs are permanent signs but are made more noticeable by the addition of
for example bright orange flags, flashing amber warning light, or the sign is lighted entirely or displays
on Dynamic Message Signs or Variable Message Signs (DMS/VMS). DMS displays warnings for wildlife
crossings have resulted in significantly lower vehicle speed compared to DMS that were turned off. The
greatest reduction in speed was observed during the dark hours and during the weekend (Hardy et al.,
2006). Furthermore a test in which lighted animated deer crossing signs were put alongside the road the
speed of vehicles reduced with 4.8 km/h compared to the same signs when turned off (Pojar et al.,
1975). These results show that enhanced signs have a greater effect on the reduction of speed than
standard warning signs. However, enhanced warning signs did not seem to significantly reduce the
number of DVCs (Pojar et al., 1975, Stanley et al., 2006 cited by Huijser and McGowen, 2010). Lastly one
can supplement signs by the placement of carcasses. When the enhanced passive warning signs were
supplemented with real deer carcasses there was a much greater reduction in vehicle speed, namely
12.6 km/h when lights were turned off and 10 km/h when lights were turned on (Pojar et al., 1975).
Pojar et al. (1975) placed three dead deer carcasses on the shoulder of the Right Of Way (ROW), in
proximity of a deer-crossing sign. Vehicle speed of the cars passing by the sign in combination with the
carcasses was reduced by 12.6 km/h. Unfortunately for the science of the efficacy the test needed to
terminated for liability reasons. However, the use of carcasses will possibly attract scavengers that is a
chance of ending up as road kill (secondary road kill). The possible secondary road kill is the reason why
Rijkswaterstaat (Dutch organisation involved in the main road network of the Netherlands) removes
road kill from the motorways in the Netherlands (pers. comm. M. Rijks, 2014).
Management options
In order to reduce the number of DVCs warning signs should be placed on appropriate locations. This
are locations with high frequency of DVCs (e.g. when DVCs are found to be ‘high’ is dependent on the

Page | 38
opinion of the parties involved). Furthermore the type of warning signs is highly important. For instance,
for active signs there should be a power supply available. Furthermore the effectiveness of the signs
differ. Implementation of an active warning sign in combination with a fence and reduction of speed is
discussed in 3.3.1.
Costs
The cheapest, most plain sign is the Dutch J27 sign which costs about € 150,- per piece. The lifespan of a
road sign is on average 12 years (Ooms, 2010). The prices for the other signs are unknown to the author,
but will probably be higher than as they are relatively more complicated in design.
2.2.3 In-vehicle deer detection systems
A relatively new measure are the in-vehicle deer detection systems. These visual systems make it easier
for drivers to detect ungulates on the side of the road. The system consists of infra-red sensors which
detect the presence of animals or humans and this is displayed on a screen within the dashboard (figure
25). Animals or humans approaching or on the road are highlighted shown on the screen. There are thus
far (January 2015) no studies available about the effectiveness of this system.
Risk and effectiveness
As previously mentioned, there is not much known about the effectiveness of the in-vehicle deer
detection systems. However it can be argued that as this system is only installed in some, and in the
newest cars, it is unlikely that this will help reduce DVCs in the near future. The car manufacturers
Volvo, BMW and Mercedes-Benz are at the forefront of sophisticated systems that detect pedestrians
and animals (Edmunds.com, 2014). Volvo has introduced a new car with this system by the end of 2014
(Edmunds.com, 2014).
Management options
No management needed as the systems are installed in the vehicles themselves.
Figure 25: Illustration of an in-vehicle detection system (truecar.com, 2014) (left) and an animal-detection system (right) such as one on the 2015 Volvo XC90 (Edmunds.com, 2014).

Page | 39
Costs
Not applicable. For an idea: the 2014 BMW X5 features a night vision system that can detect people and
animals. It currently costs around € 21,000 (Edmunds.com, 2014), but the prices are known to differ per
car dealer.
3.2.4 Work in progress: light warning system
During this research, Natuurmonumenten organized a competition to find an effective and innovative
idea to prevent DVCs in the Netherlands. One of the participants, Charlene Hersman, came with the
following idea which has some similarities with the virtual fence. The system consist of sensors which
are being activated by the presence of animals (in this case roe deer) and as a reaction sends a signal to
other roadside poles with lights (figure 26). These lights are turned on (flickering or as a constant light)
and are intended to warn drivers for the presence of roe deer on the roadsides, making drivers more
alert. The difference between Charlene’s system and virtual fence is that the first one is aimed at
warning drivers for roe deer and the second one aimed at warning roe deer for oncoming drivers.
Risk and effectiveness, management option and costs
Because this idea has not been tested yet, the risk, effectiveness and management options are
unknown. The costs are thought to be in the same margin as the virtual fence.
3.3 Measures that tackle multiple causes
This paragraph focuses on mitigation measures aimed to influence both roe deer and driver behaviour
to reduce DVCs.
Figure 26: An illustration of the light warning system of Charlene Hersman.

Page | 40
3.3.1 Wildlife signalling system The wildlife signalling system is a newly developed system that focuses on reducing driver speed at
specific roe deer migration zones but only at times when animals are present on the roadside. The
system consists of a dynamic Dutch-J27 warning sign (i.e. deer crossing signs) in combination with a
dynamic speed limit sign of 50 km/h (figure 27A). The system has (infra-red or laser) sensors through
which it is able to detect animals in a specific corridor that is created on both roadsides (figure 27B).
Once an animal is detected by the sensors, the warning sign(s) is/are activated urging drivers to slow
down. Often this system is accompanied by roadside fences that ‘force’ the target wildlife to the use the
specific fauna corridors. In doing so, this measure forms a combination of the mitigation measures 3.2.2,
3.1.5 and 3.2.3.
Risks and effectiveness
The wildlife signalling system, accompanied by roadside fences, is currently being tested in the
Netherlands, more specifically in Diepenheim, Overijssel. During the three year trial thus far, there have
been five documented collisions with the roe deer of which two occurred when the system had a
malfunction (caused by lightning). Prior to the trial period the collision frequency was around 25 per
year (pers. comm. F. Spijker, 2014). This means the trail currently reduces DVCs with at least 93% per
year. Despite the promising trial results there are still risks and factors that have to be considered. For
instance, if the system is too sensitive or produces false warning signals the system could be activated
without the target animal being present and as a result drivers can lose trust in the system and start
ignoring it (Huijser et al., 2009a). Moreover, other tests with the system have shown variable results
apparently related to: the type of warning sign used, whether advisory of mandatory speed limits are
upheld, the condition of the road, the type of weather during the test, if local or non-local drivers are
involved and the cultural differences of the drivers involved (review in Huijser et al., 2009b).
The effectiveness of the system in reducing DVCs/WVCs abroad has been found to be around 82 to 91 %
(Mosler-Berger and Romer, 2003; Dodd and Gagnon, 2008). In Switzerland the wild signalling system has
been tested without the roadside fence on seven different locations (Huijser and McGowen, 2010) and
showed a reduction of 82% in DVCs (see table 2). This indicates that, at least for some locations, the
Figure 27. A) dynamic Dutch J27 sign (upper) in combination with a dynamic 50 km/h speed limit sign (lower), B) overview of wild signalling system with surface sensing (Kenniscentrum-reeën.nl (2015) and wegenwiki.nl (2014) respectively).
A B

Page | 41
Table 2. Number of collisions with roe and red deer before and after installation of the wildlife signalling system at different locations in Switzerland and the reduction in DVCs in percentages (image obtained from Huijser et al., 2008).
).
addition of a fence is not necessarily required. The target animals of this test were roe deer and red
deer. However, the system used was only active during the night, so collisions during the day have not
been incorporated and the overall effectiveness may be lower than the percentage presented.
Management options
In order for the system to be effective it is important that the natural migration locations of the roe deer
are incorporated as corridor gaps. Furthermore, the fence should be the appropriate length and height
for the target animal. Roe deer are thought to be able to jump high fences, therefore a minimum of 1.8
meter will be necessary (Arfman.nl, 2014). In addition the diameter of the fence can make sure other
(smaller) animals are also guided through the corridors, facilitating the prevention of collisions with
other animals as well. The requirements of the roe deer dictate that the corridor should be at least 25m
x 20m of size and that no other barriers are present (pers. comm. M. Wilborts, 2014). See 3.1.5 and
3.1.2 respectively for the operational time of fences and warning signals . In addition more information
about management options of the wildlife signalling system can be found at these paragraphs.
Costs
The wildlife signaling system used in the trial in Diepenheim, Overijssel roughly cost € 200.000, including
the actual fence (Inrichtinglandelijkgebied.nl, 2014). Additionally there will be maintenance costs. The
costs of construction and maintenance of the wildlife signalling system depend also on the length and
the type of fence used, therefore exact costs are difficult to define.
3.3.2 Roadside management Managing the roadside (e.g. mowing of roadside vegetation) is important in reducing the number of
DVCs as it reduces (forage) activity of the road (side) and increases the visibility for wildlife and drivers
(Hedlund et al, 2004 and Waring et al., 1991; figure 28). Additionally, the width of the roadside is an
important factor to consider, as this influences the view of drivers as well. According to a study of Finder
et al. (1999), conducted in Illinois (USA), the distance between the road and forest is the main
topographical factor influencing the number of DVCs. To reduce DVCs Putman (1997) as well as Groot
Bruinderink and Hazebroek (1996) advise to reduce the (forage) activity in the vicinity of roads.

Page | 42
Risk and effectiveness
Managing roadsides, or railway sides to reduce collisions have proven to be effective. As an example,
Jaren et al. (1991) conducted an experiment to test the effectiveness of vegetation removal alongside
railways. They concluded that clearing the railway side by 20-30 meters reduce the number of moose
trail collisions by 56%. In the same year, Lavsund and Sandegren (1991) were successful in reducing
DVCs by 20% by clearing the highway roadside with 20 meters on both sides. However, a test conducted
by Voss (2007) in which a 5 meter strip of vegetation (woody scrub) was removed (and maintained
thereafter clear of high vegetation) did not see a significant change in the number of DVCs 3 year before
in comparison with 3 years after trial (cited by Langbein et al. 2011). This might indicate that a 5 meter
clearance of vegetation alongside roads is not enough. Clearing vegetation in a 10 – 15 meter strip
alongside roads has successfully reduced the number of WVCs in a test in the German National Park
Müritz (Krüger pers. comm. 2003 cited by Beckman, 2004). It is considered that generally a 20-m wide
clearance zone alongside railways and major roads will not have large public support. It could be argued
that the removal of a strip alongside the road in areas with poor forward visibility would be a viable
option.
The risks of vegetation removal is the re-growth of the vegetation which could attract deer and increase
deer activity on the roadside verge (Rea, 2003). Re-sowing roadsides with special seed mixtures
containing mainly grasses and herbs (with low nutritional value) could help reduce deer activity in
roadside. Removing roadside vegetation will increase the visibility for both animals and driver (Bashore
et al., 1985 cited by Andreassen et al., 2005). However, it could be that this vegetation clearance
alongside roads increases the optical widening of the road. In doing so, people (drivers) have more
overview and may increase their speed (Ooms, 2010).
Management options
Managing the roadside vegetation is a viable option to mitigate deer vehicle collisions. It is, however, an
active measure which should be repeated frequently. Even though roadsides are already being mowed
frequently (differs between roads) in the Netherlands, the actual height of the roadside vegetation
might exceed the height in which the vision for both roe deer and driver is optimal. Therefore, this
optimal height must be investigated and mowing should be performed in a way that this height is
maintained.
Figure 28: Roadside management (hhnk.nl, 2014)

Page | 43
Costs
The circumstances at the locations influence the costs of roadside management. The target price is
around € 10 per m3 of vegetation removed (Ooms, 2010). The removal of the vegetation has to be
repeated frequently in order to keep the vegetation at the roadsides short.
3.3.2 Adjusting roadway and nature planning
As animal vehicle collision is a great problem in the Netherlands it might be important to take this into
account when roadways are being designed. For example, the location of the road, just as the number of
lanes and the number of curves are able to affect the number of DVCs (Knapp et al., 2004; Donaldson,
2006). In order to take animal crossing into account, data concerning the habitat and migration patterns
of the roe deer should be collected and the known locations of DVCs on existing roads should be offered
to the road planner before road design and planning is finished (Singleton and Lehmkuhl, 2006; cited by
Mastro et al. 2008; Donaldson, 2006). There are several studies that find correlations between DVCs and
certain landscape elements. Road designs in which these findings are incorporated may result in smaller
number of DVCs (Hussain et al., 2007 cited by Mastro et al., 2008). For example, it has been found that
deer tend to migrate alongside waterways. By constructing bridges in a way that offers enough room for
deer to pass under the bridge without risking drowning into the water (Donaldson, 2006) deer will not
be forced to cross the road with DVCs as a result (Romin 1994 cited by Mastro et al. 2008; Finder et al.,
1999 and Donaldson, 2006). Also dog walking areas are forming a great problem as dogs chase the deer
away (pers. comm. J. Brinkman). Therefore the locations of these walking areas should be carefully
selected taking in to mind the influence of dogs to nature and wildlife.
Risk and effectiveness, Management options and Costs
To the knowledge of the author currently little information on adjusting roadway and nature planning
aspects is known, and therefore further research is needed. However, it can be argued that costs can be
kept minimal when incorporating animal crossing in existing and future construction plans.
3.3.3 General education
Educating people about the existence and danger of DVCs could help reduce the number of DVCs. In the
U.S. there have been programs aimed at educating people about DVCs and what they can do themselves
(Romin and Bissonette, 1996). In doing so, the media (e.g. newspaper, radio, television and website
announcements) was used to get the public’s attention (Rodger 2004). General education provides
information to drivers about DVCs and the dangers of these collisions. In doing so, it is expected that
drivers will be more careful on the road an pay more attention to the surroundings and slower driving
speed. According to Knapp et al. (2004) and Rodgers (2004) providing the general public with specific
information, such as the migration locations and timing of deer, is more effective than general
education.
Risk and effectiveness
General education can be useful when it provides information about the specific times there is an
increased risk for DVCs, like during migration of the roe deer. This can be done by using active or
temporary passive signs. Little is known about the effectiveness of such educational programs, therefore
further research on this subject is needed.

Page | 44
Management option
An idea is to educate drivers through driving test organisations (CBR in the Netherlands), as new drivers
should know the dangers on the road, and collisions with wildlife has come to be an important one.
Furthermore during peak seasons in WVCs, the public should be educated through media sources and
know the dangers that comes with WVCs and what they have to do when encountering wildlife on the
road.
Cost
The costs are dependent on the tactic which is being chosen to educate and/or inform people about
DVCs and the associated risks. For example, raising public attention through media, like commercials
and/or advertisement will probably be more expensive then when educating people through CBR. By
educating people through CBR, one has to supplement the reading/learning materials of student drivers
with some extra information about DVCs, which is assumed to be less expensive then advertisement.
The exact costs are not available, and has to be further investigated.
3.4 Measures that tackle population density
As mentioned in 2.1.1., the roe deer population in the Netherlands has increased significantly over the
past decades and with that the number of DVCs. Therefore, a reduction in roe deer could reduce the
number of DVCs. There are two ways to reduce the roe deer population. One is to reduce the population
density through fertility control. By reducing the growth of the population, the roe deer population
density will eventually be reduced. However, according to a study of Crombach (2014), a bachelor
student studying the use of fertility control for large wildlife, it appeared that the use of anti-conception
(i.e. a well-known anti fertility treatment) is on a large scale not applicable for free living (i.e. not
enclosed) large wildlife in the Netherlands. The use of anti-conception for large wildlife is time
consuming, of low effectiveness and very stressful for the animals (more detailed information in
Crombach, 2014). Therefore fertility treatment to reduce DVCs will not be thoroughly discussed in this
report. Another way to reduce the roe deer population is by culling (i.e. killing) of a proportion of the
roe deer population. However, the roe deer in the Netherlands fall within the Dutch law on flora- and
fauna, which states that catching, hurting and/or killing of these animals is illegal (see article 9 and 10 of
the law “Flora- en Fauna wet”; maxius.nl, 2015). Only when in possession of a dispensation it is
permitted to intervene in the population size by culling of a proportion of the animals. Intervening is
only permitted when it serves an overruling goal, like improving traffic safety (see article 67 and 68 of
the law “Flora- and Fauna law”; maxius.nl, 2015).
3.4.1 Reducing roe deer density: culling Reducing the local roe deer density by culling is a measure intended to reduce the number of DVCs
(figure 29). In theory, by reducing the population the number of migrating individuals and the migratory
behaviour of the individuals is expected to be reduced as their original habitat contains sufficient
nutrition, water, living area and cover (e.g. safety) for the smaller population. As a result the roe deer
will seek less their primary needs elsewhere, minimizing roe deer movement on and near roads and in
that way possibly reducing the number collisions with roe deer (pers. comm. J. Brinkman, 2014).

Page | 45
Risk and effectiveness
In practice, culling as a means to reduce the number of DVCs is a fairly controversial subject in the
Netherlands and much debate exists about the efficacy of this measure. For instance, some researchers
were able to directly link local deer density with the frequency of DVCs (e.g. McCaffery, 1973; Schwabe
et al., 2002; Rondeau and Conrad, 2003), while others were not (e.g. Case 1978, Waring et al., 1991). If
such a link would exist, it would indicate that by reducing the population size of the roe deer the
frequency of DVCs would decline as well. However, actual scientific data proving the effectiveness of
population reduction programs on wild vehicle collisions (WVCs) is limited (Huijser and McGowen,
2010).
Nevertheless, a number of scientists were able to show evidence for the effectiveness of (sustained)
local reductions in deer population on the number of DVCs (e.g. Jones and Witham, 1993 cited by
Langbein et al. 2011; Dabielson and Hubbad, 1998; Jenks et al., 2002; Rondeau and Conrad, 2003;
Sudharsan et al., 2006). For example Doer et al. (2001) examined four different population reduction
methods over a period of two year used in Bloomington, Minnesota (U.S.A) aimed at reducing the deer
population citywide. The four methods combined were able to reduce the winter white-tailed deer
population by 46% which reduced DVCs by 30%. Furthermore, it was found that in periods with forced
hunting restrictions (Kuser and Wolgast, 1983) or a total discontinuation of culling (Langbein, 2007a) an
increase in the number of DVCs was observed. Langbein (2007a) observed during his research a fivefold
increase in DVCs in the Ashdown Forest in England from 2000 until 2007.
However, as promising as these results appear to be, it seems to be extremely hard to draw any
scientific conclusions from them as there are additional variables to consider. For instance, there is a
year-to-year variation in the number of DVCs even in the control areas where no action to reduce DVCs
have been taken (e.g. Voss, 2007; Langbein, 2007b). Other factors like traffic flow, visitor pressure,
forest felling and weather conditions are also able to change annually and in that way influence DVC
frequency. Regularly these factors are excluded from analysis by researchers (Langbein et al., 2011).
According to Langbein et al. (2011) a population reduction program should always be combined with
additional mitigation measures in order to give positive results (e.g. reduce number DVCs) as there are
other factors (e.g. visitor pressure et cetera), besides high population density, affecting the number of
DVCs.
Figure 29: Hunter with roe deer (association Duinbehoud, 2014)

Page | 46
There are several risks to take into account when considering culling programs to reduce DVCs. First of
all, these programs have a maximum culling number (i.e. number of deer they are allowed to put down)
which is based on population densities based on counts (i.e. counting of the deer living in that particular
area). However, counting of roe deer is an extremely difficult task, with a very low accuracy (pers.
comm. G.J. Spek). For example, in province Gelderland (NL) the number of wildlife living in the Veluwe
(Dutch natural reserve) was strongly underestimated. This resulted in a low number of culling (FBE
Gelderland part II, 2009) and a subsequent higher number of collisions with the wild boar, another well-
known victim of vehicle collisions in the Netherlands, the following year(s). Furthermore, culling
practices could disturb the (roe) deer individuals and in doing so increase the movement of deer and
subsequent DVCs. For example, De Boer et al., (2002) studied the flight distance of the roe and the
fallow deer in four natural areas in the Netherlands and found that an increase in culling intensity
resulted in an increase in flight distance (cited by Dekker and Geert Groot Bruinderink 2010). As this
movement could also be on and near roads, collisions could increase as well (Ooms, 2010). In addition,
the lack of public support for this measure is an important factor to take into account. For instance,
Natuurmonumenten did a questionnaire among nature enthusiasts (n = 40.000), and asked them what
they think of culling practices to increasing traffic safety. Most of the nature enthusiasts, 37% answered
that they were against culling practices, 29,3% stood neutral to the practices and 33,4% saw the practice
as a viable option (Natuurmonumenten groot wild enquete, 2014). Even though 37% is not the majority
it is still a major part of the public opinion.
Aside from these short term risks of culling and other reduction programs (e.g. fertility control), there
are also certain long term risks to consider. For example, reducing the population size in an area
influences; the immigration of roe deer from surrounding areas, the birth rate of does and the sex ratio.
The immigration of roe deer will increase as territories of culled deer become more available. Because
of these long term risks culling activities should be repeated frequently to be effective on the long term
(Ooms, 2010; Langbein et al., 2011 and Badry, 2010). Moreover birth rate could be altered due to a
phenomenon called the reproductive rebound effect (Badry, 2010). Under the reproductive rebound
effect both the pregnancy rates as the number of foetuses/pregnant female’s increases, building up the
population density towards pre-reduction levels (Bardy, 2010; Porter et al. 2004). This phenomena is
seen with white-tailed deer and is able to occur when the population quickly takes advantages of the
resources freed up after a population reduction program. The phenomena has been documented by
Porter et al. (2004) for white-tailed deer over the term of a 6 year period culling program. In addition to
birth rate, the sex ratio of the newly born calves could also be altered due to population reduction
programs. As seen by Kruuk et al. (1999) who documented a decline in the number of male red deer
born as the population density and winter rainfall increased. These changes in sex ration seemed to be
related to decreased fecundity, suggesting that these sex ratio changes were caused by differential
foetal loss.
Management options
Reducing the population size of roe deer by culling should be limited to certain areas. These areas
should be so called ’hotspots‘, with high number (i.e. the number by which parties involved, such as the
province, see the need to take action) of DVCs. Furthermore, population reduction programs should be
performed according to certain guidelines including those on: the maximum amount of culling,
male/female ratio of the culled individuals and the period of the day and year during which the culling is
being carried out. In order to increase public support, meetings should be made with the stakeholders of
the area (e.g. animal rights organisations, nature organisations, road policy organisations, province etc.)

Page | 47
to discuss how to bring the message to the public and to make agreements. This should be done before
the start of the population reduction programs.
In practice, it is important to pay attention to the time of year culling should be performed. If reduction
activities are directed at animals that are likely to die before the next breeding season, then culling will
have little effect and simply replaces natural mortality. Therefore reduction activities should be
performed after natural mortality loss has passed, meaning late winter or early spring (Badry, 2010).
Furthermore, it is important that reduction is aimed at does rather than bucks and at the younger deer.
This because does are the ones giving birth to one or two calves a year and young deer are most often
the victim of collisions. Moreover, according to Schoon (2008) culling should be performed prior to the
peaks in collisions. He states that, non-territorial roe deer calves and yearlings should be eliminated
before the first peak at the beginning of April. That case the yearlings would not be chased after by
territorial congeners.
Costs
Normally the costs of reduction in population by culling/hunting are not applicable as these will be
made by independent hunters that have to provide their own gear.
3.5 Summary mitigation measures
To be able to compare the different mitigation measures all measures (see 3.1 – 3.4) are presented in a
table summarizing their effectiveness, costs, main risks and main requirements DVC area (table 3).
These factors have been classified by the author on the basis of the presented review to allow easy
comparison. All factors use the same classification codes: “0” , “NA”, “+”, “++” and “+++”. Effectiveness
was classified in a way where deemed ineffective measures were scored with an “0” , slightly effective
measures were scored with an “+ “, highly effective measures were scored with an “++” and measures
of which the effectiveness is unknown were scored as “N/A” (not applicable). Costs were classified in a
way that both application and maintenance costs were evaluated together where “0” meant no costs
and “+” was in the range >1 to 10.000 euro and “++”was in the range of >10.000 and 50.000 euro and
,“+++” was in the range 100.000 to >100.000 euro. Important to notice that no thorough examination of
the costs have been made. Therefore, the costs should be interpreted as an rough estimation. Main risks
where established by the information gained by reading literature, which has been described in the
paragraphs of the mitigation measures. Main requirements were established partly by the information
gained by reading literature (chapter 3) and partly by authors opinion. The most important factor that
was considered for the action plan was the effectiveness of the mitigation measures.
Chapters 2 and 3 provided information about the causes of DVCs and the different mitigation measures
that could potentially reduce the amount of DVCs in the Netherlands. In following chapter, the
information gained is used to create an action plan. This action consists of a questionnaire (Appendix A
in Dutch) and a flow chart (figure 30, Dutch version Appendix B). In the flow chart only the mitigation
measures that have proven to be most effective in reducing DVCs through various studies have been
shown. This selection has been made after evaluating the larger subset of mitigation measures (table 3).
Mitigation measures have been chosen which have proven to be most effective in reducing in DVCs and
most applicable (e.g. with little risks and little environmental requirements). The costs are considered a
secondary concern, as the effectiveness of a measure is most important in reducing DVCs and financial
funds available for reducing DVCs differs between DVC locations. The flow chart is based on current
knowledge gained through literature and interviews and can at all times be adjusted as new information
comes available.

Page | 48
Mitigation measure Effectiveness Costs Main risks Main requirements DVC area
I. Measures to tackle roe deer behaviour
Virtual fence [3.1.1] + ++ - Habituation - Only effective during the night
- Roads with low-intermediate traffic flow - Low amount of housing and recreation
Roadside reflectors [3.1.2] +
+ - Only effective during first year - High maintenance
- Roads should not be higher/lower than the surroundings (elevated roads)
Chemical repellents [3.1.3] 0
N/A - DVCs in nearby roads increased - Habituation and leaching
-
Car-mounted warning whistles [3.1.4] 0
N/A - Noise whistles over lap normal traffic noise - Habituation
- None
Roadside fencing [3.1.5] ++
++ - Fragmentation of natural areas - Decrease of genetic exchange roe deer population
- The fences should not disclose houses or entrances to forests/villages etc.
II. Measures to tackle road design and driver behaviour
Reducing vehicle speed [3.2.1] ++ +++ - Should be enforced to be effective (e.g. thresholds) - Low public support
- Roads with low-intermediate traffic flow -
Warning signs [3.2.2] - Activated by driver/animal - Passive permanent/temporary signs - Enhanced warning sign
+ +
+
+
- Effectiveness differs between local and non-local residential drivers
- Temporary signs most effective when place on the right time of year on the right location
- Areas where not to many other signs are shown
-
In-vehicle deer detection systems [3.2.3] N/A N/A - Only in some of the newest cars - None
Work in progress: light warning system [3.2.4] N/A N/A - Habituation by drivers -
III. Measures to tackle multiple causes
Wild signalling system [3.3.1] ++ +++ - Expensive - When accompanied by fence; see fence
Roadside management [3.3.2] +
+ - Re-growth of the vegetation could attract deer - Optical widening increases and could encourage
speeding
-
Adjusting roadway and nature planning [3.3.3] N/A +++ - Expensive -
General education [3.3.4]
N/A + - Has to be repeated frequently to be effective - Less effective on locals
- None
IV. Measures to tackle population density
Reducing roe deer population: culling [3.4.1] +
+ - Immigration of roe deer from neighbouring areas - Has to be repeated frequently to be effective - Culling numbers dependent on questionable countings - Low public support
- Forest area - Hunters present and willing
Table 3. DVC mitigation measures discussed in this report and their effectiveness, costs, risks and the requirements for the area to fit the measurement. Effectiveness of the measures divided in;
not effective (0), unknown effectiveness (N/A), intermediate effective (+), highly effective (++). Costs; not applicable (N/A), none (0), low (+), intermediate (++), high (+++).

Page | 49
III. Proposed action plan
The previous chapters provided information about the causes of DVCs and the different mitigation
measures that could potentially reduce the amount of DVCs in the Netherlands. In this chapter, the
information gained through the previous chapters is used to create an action plan. This action plan has
been created for administrators of NM to reduce the number of collisions with roe deer in the natural
area under their administration. The action plan is developed by first developing a concept action plan
on the basis of the outcomes of the evaluation of the mitigation measures (See 3.5) secondly test
running this concept action plan in three case studies and finally establish the final action plan for NM.
4.1 Action plan
The aim of the action plan was to offer administrators of NM a handle in how to reduce the number of
collisions with roe deer in the natural area under their administration. As previously stated, the action
plan consist of a questionnaire (Appendix A in Dutch) and a flow chart (figure 30, Dutch version
Appendix B). By filling in the questionnaire the administrators have collected the necessary information
to use the flow chart. The flow chart helps guide the administrators of NM to the mitigation measure
that presumably is the most effective and most suitable for the situation. As reducing the population
density of roe deer through culling (measure 3.4.1) is least favourite by NM (i.e. due to high resistance of
NM members and ethical reasons), this measure will only be considered after other effective measures
have been proven to not give the desired effect (i.e. the amount of reduction in DVCs set by the parties
involved).
The action plan has been test run for three natural areas, the so called case areas, in the Netherlands
with DVCs (Appendix C). Case area 1 and 3 are both 80 km/h roads, considered interesting as these
provincial roads are known to be related with high DVCs, in comparison to property access or national
roads (Ooms, 2010). In addition these roads are surrounded with forest and agricultural areas in which
roe deer individuals as well as human activities (e.g. recreation, forest felling activities et cetera) occur.
Case area 2 is considered interesting as at this location the DVCs are occurring rather localized and the
environmental characteristics differ from other parts of the same road. Furthermore the case areas have
been chosen as the administrators of these areas are known by NM and were willingness to cooperate.
Through testing the action plan at the three case areas the action plan could be improved as difficulties
and setbacks will give a realistic view of what administrators of NM will encounter when implementing
the action plan.
In the course of testing the action plan some minor changes had to be made in the questionnaire and
the flow chart. The questionnaire have been simplified (the addition of boxes to check instead of a
written answer) and more linked to the information needed to use the flow chart. In the flow chart only
some minor changes, such as switching the location of some questions, have been made as well. All
three case areas were suitable for testing the action plan, as they are all DVC locations. The areas did
differ in for example, the degree of recreation, forestation and other environmental parameters.
Through these different case areas the action plan has been tested for different situations. On the basis
of these test runs it can be concluded that the action plan is ready and suiteble for implementation.

Page | 50
Box 1: Basic management. basic management of the road and its surroundings includes:
Execution of roadside management (mowing) to keep the roadside vegetation below ± 30 cm in height.
Make sure the visibility of both driver and roe deer are as optimal as possible (e.g. roadside of adequate width, no blockage of the view of drivers et cetera).
Place roadside reflectors and/or, if already present, make sure they are properly maintained (e.g. cleaned regularly to improve effectiveness).
Register the collisions with roe deer that occur on the road. Note: time, age and sex.
Box 2: Number of collisions acceptable?
The acceptability of the number of DVCs at a certain location is dependent on the parties involved. These parties are, for example, the province (i.e. often the road manager), administrators of surrounding natural areas and owners of private land(s). They have to agree on from which number of DVCs is action necessary. Meetings should be arranged in which all parties are present.
Figure 30: Flow chart. By following the flow chart advice is given which DVC mitigation measure is most suitable for a particular area (i.e. follow the solid line). When a mitigation measure is not fitted or not supported by parties involved there is a second advice (i.e. follow the dashed line). *These guidelines need to be further investigated and determined by parties involved.

51
V. Discussion and conclusion
5.1 Discussion
The aim of this research was to examine measures to mitigate DVCs in the Netherlands and create an
action plan to advise administrators of NM in how to reduce DVCs in the natural area under their
administration. This aim was translated in the following main research question: “How can roe deer
vehicle collisions in the Netherlands be reduced?”. In doing so, two partial research questions needed
to be answered; “Where, how frequently and why do collisions with roe deer happen in the
Netherlands?” and “Which mitigation measure(s) are effective in reducing DVCs”. In answering the
first partial research question the causes of DVCs have been examined for which the behaviour of the
roe deer as well as the anthropogenic impacts on the environment have been studied (Chapter 2). It
turned out that collisions with roe deer are caused by a combination of the natural behaviour of the
roe deer and the influence of humans. In answering the second partial research question a number
of existing mitigation measures to reduce DVCs have been reviewed for their potential effectiveness,
possible risks, management option and costs (Chapter 3). The mitigation measures designed to
reduce DVCs have shown variable results in effectiveness, which is also dependent on the
characteristics of the DVC location, such as the maximum permitted driving speed and/or the
presence of residential areas. The mitigation measures with highest effectiveness (as scored by the
author in table 3) are the wildlife signalling system and a reduction in speed to 50km/h. It could be
argued that this evaluation gives a valid view on the effectiveness of the measures with the
information currently available (2015). The information gained through answering the two sub
research questions have been used to be able to answer the main research question; “How can roe
deer vehicle collisions in the Netherlands be reduced?”. As the effectiveness of the mitigation
measures is dependent on the characteristics of the location where the measure is to be applied, it is
impossible to give an universal answer. Therefore the answer to the main research question has
been incorporated in the action plan for administrators of NM. This action plan includes a
questionnaire (to gain information of the DVC location) and a flowchart which advises administrators
of NM in how they could reduce the number of DVCs in the natural area under their administration.
In addition this action plan has been tested at three locations in the Netherlands with DVCs and is
recommended to be widely applied.
5.1.1 Reflection on the methods used
The information used in writing this report have been gained through scientific literature (i.e. Google
scholar, scientific books), Dutch literature (i.e. Google, books and reports gained though NM),
interviews performed with experts on this subject and writers observation. This report has made use
of expert advice in addition to scientific literature as it is thought that experts have knowledge that is
not always present in scientific literature. In addition, the author has strived to incorporate the most
up to date information on DVC mitigation measures in this report. Therefore, relatively new
measures or measures that are currently being tested are incorporated as well. In this report an
action plan has been made in which the knowledge and conclusions drawn from literature is
incorporated and made ready available for administrators. In doing so, administrators have been
offered a handle in how to deal with DVCs in the natural area under their administration. This type of
work, in which an action plan has been created and tested, has not been found elsewhere in the

52
literature read by the author while writing this report. In doing so, this report is exclusive. It could be
argued that the action plan and recommendation made in this report could also help other countries
in dealing with DVCs. However, there attention should be paid to the differences between the
Netherlands and the other countries.
In writing this report some difficulties were encountered that will be discussed here. For instance in
evaluating different mitigation measures it became clear that some measures have not been tested
specifically on the roe deer. Often studies that (also) researched the effects of possible mitigation
measures on the roe deer were very difficult to find, perhaps because they have not been
(internationally) published. It could be argued that this is because many countries publish reports in
their native language, which are possibly more difficult to find for the author. At times when
literature on the effects of the mitigation measures on the roe deer was unavailable, the author has
chosen to discuss the effects of the measure on another wild animal. In doing so, the author assumed
that wildlife have similarities in their reaction to mitigation measures. However, when available, the
author preferred to use the effects on another ungulate, as is assumed that these have most
similarities with the roe deer. If these two assumptions are validated is unknown, but until more
research on roe deer and mitigation measures in the Netherlands is done, is seems the only viable
option. It could be suggested for the Netherlands to increase the cooperation and the exchange
knowledge on DVCs and DVC mitigation measures with neighbouring countries. In doing so, more
becomes known about the effectiveness of the different mitigation measures and possibly more
progress on reducing DVCs can be made.
5.1.2 Ecology of the roe deer in the Netherlands
In searching for the causes of DVCs (to answer partial research question 1), the ecology of the roe
deer in the Netherlands have been studied. It became clear that the roe deer population in the
Netherlands has increased strongly over the past decades (Schoon and Spek, 2014). Not surprisingly
perhaps that the number of collisions with roe deer increased as well. An increase in the number of
roe deer individuals living in a natural area could lead to an increase in aggressive and territorial
behaviour, predominantly executed by dominant bucks towards younger, non-dominant bucks. The
peak in aggressive and territorial behaviour is during the rut, when mating takes place and young,
non-dominant bucks are chased onto streets and roads (Worm, 2014). If the size of a roe deer
population increases there are more young bucks to be chased away, and perhaps more young bucks
to end up on roads with an increase in collisions as a result. However, a reduction in roe deer
population might not necessarily indicate a drop in the number of DVCs. Territorial behaviour will
always be present in roe deer populations, even if the number of young, non-dominant bucks will be
decreased there will probably still be chasing of young bucks onto streets, with DVCs as a result.
5.1.3 Landscape design of the Netherlands
In discussing the causes of DVCs (further answering partial research question 1), the influence of
humans on the roe deer and DVCs have been addressed as well. Human activities such as recreation
in nature, agriculture and the creation of more infrastructure strongly affects the behaviour of the
roe deer and in doing so the number of DVCs. It should probably be more of a priority to protect
wildlife in the Netherlands and provide them with a habitat with enough food, water, cover and rest.
Regarding recreation, it appears that recreational activities such as horse riding, (mountain) bikers

53
and dog walking (particularly unleashed dogs) cause disturbance for the roe deer, which are known
to be vulnerable to stress (Worm, 2014). Creating a secluded area with both rest and enough
nutrition and cover could help reduce DVCs as long as this area is not broken up by roads. Regarding
agricultural activities roe deer benefit from the cover created by crops such as corn and wheat.
However, at times when farmers start harvesting roe deer will be forced to migrate and search for
new cover areas, resulting in an increase in migration. If in the course of their migration roe deer
pass roads this could result in an increase in DVC. The number of DVCs could possibly be reduced
through harvesting at day time when the visibility of the roe deer for drivers is higher than during the
night. However, farmers are (often) dependent on weather conditions for harvesting, and therefore
this is often not applicable. Regarding infrastructure, the planning and designing of new roads,
locations of natural areas and urban areas strongly influences the roe deer and DVCs. Roads often
fragmentize natural areas and the locations of urban areas and recreation, as previously discussed,
disturbs the natural habitat of the roe deer. It is important to take into account the effects of
infrastructural plans on the wildlife animals living in that particular area. In doing so, problems, like
DVCs can be prevented or at least reduced.
5.1.4 Effectiveness of mitigation measures In evaluating the effectiveness of mitigation measures (in answering partial research question 2) it
became evident that for several measures more research is needed in order to be able to draw
conclusions about their effectiveness, see for instance the virtual fence and light warning system (see
3.1.1 and 3.2.4 respectively). Furthermore, there have also been cases in which the literature about
the mitigation measure was scarce and/or for some others measures results was inconclusive, see for
instance adjusting roadway and nature planning and general education (see 3.3.3 and 3.3.4
respectively). General education through CBR, for example, has not been thoroughly examined and
therefore no information about the effectiveness is known. However, it is according to the author a
measure that could potentially be effective in reducing DVCs. In terms of possible inconclusiveness,
occasionally the effectiveness of a mitigation measure was indefinite because the ineffectiveness
might be due to insufficient or incorrect maintenance (e.g. cleaning, reparation) or inadequate
installation. For instance, for roadside reflectors it is generally thought that in the first year of
operation they are effective in reducing DVCs, but the following years the effectiveness reduces
significantly. However, it is not certain is this is (solely) due to habituation of roe deer or also due to
mal maintenance of the roadside reflectors (Molenaar and Henkens, 1998). Also when it comes to
literature it seems that some studies are less extensive in their results than others. Some researchers
withhold or do not register the effects of the mitigation measure in other sections of the same road.
For instance, a mitigation measure could reduce DVCs at one section of the road, but possibly
increase DVCs in the next section of the road. In doing so, the mitigation measure seems effective,
but overall is not. Mitigation measures that seem promising, but for which more research is needed
to verify their effectiveness include: the virtual fence, light warning system and general education.
After evaluating the mitigation measures it could be concluded that habituation of the roe deer, as
well as habituation of the driver to the measures are one of the main aspects affecting effectiveness.
Therefore, to be certain of the effectiveness the mitigation measures should have proven to be
effective over a longer period (> 5 years). Generally, a combination of multiple effective mitigation
measures is advised to reduce the number of DVCs most effectively. Aside from the effectiveness of
the mitigation measures, the costs associated with these measures is also important to take into
54
account. The financial resources available for a specific DVC location, determine the type(s) of
mitigation measures that could be placed at that location.
5.1.5 Outlook to the future Population size
At the beginning of this chapter (paragraph 5.1.2) the ecology of the roe deer have been discussed. In
doing so, it has been argued by the author that an increase in the number of roe deer individuals
living in a given area could lead to an increase in territorial behaviour of dominant bucks towards
young, non-dominant bucks. As a result young bucks are being chased onto streets and roads and
frequently end up as road kill. Therefore, with an increase in the population size, there is a possibility
that the number of DVCs will increase as well. Currently (2015), the Dutch roe deer population has
not reached its carrying capacity yet, therefore the roe deer population in the Netherlands is still
increasing (Schoon and Spek, 2014). As the size of the population is possibly influencing the number
of DVCs, discussing changes in the population size of roe deer for the future is of great concern as
this might influence the number of DVCs. If the Dutch roe deer population will increase until the
carrying capacity is reached is uncertain and possibly unrealistic. The total population of roe deer is
influenced by the ecological and a social carrying capacity. The ecological carrying capacity is the
maximum population size of the roe deer that the environment can sustain in terms of food, water
and cover availability. In addition there is a social carrying capacity which is the maximum population
size of the roe deer that the society finds acceptable in term of; damage to agriculture, private areas,
DVCs and the condition of the roe deer. These two carrying capacities are able to differ strongly and
it is therefore uncertain if a further increase in the Dutch roe deer population until the ecological
carrying capacity is reached, as expected, is realistic. Generally the social carrying capacity is less than
the ecological carrying capacity and due to ethical reasons (i.e. suffering of animals is commonly seen
as unacceptable) of the general Dutch public it is expected that the social carrying capacity will be
apprehended. Therefore it is expected that the roe deer population in the Netherlands will not reach
the ecological carrying capacity. However, if a population would reach the ecological carrying
capacity the population size would be stabilized and migration would possibly be minimal, and in
doing so, DVCs would be reduced. Nevertheless, the ecological carrying capacity is generally
associated with more suffering of the weaker animals of the species and as previously stated, it is not
expected to come this far as the general public and Dutch politics will possibly prevent this.
Even though the population size of the roe deer in the Netherlands will probably not reach the
ecological carrying capacity due to human interference the population will probably disperse to areas
less or not inhabited by the roe deer if these areas are suitable for the roe deer (i.e. water, food and
cover). However, roe deer individuals will probably never occupy all suited natural areas (i.e. in term
of environmental conditions) in the Netherlands as other wildlife also influences roe deer. For
example, roe deer will refrain from areas with other large ungulates, such as the red and fallow deer,
due to the stress that their presence causes for the roe deer. Therefore, changes in the population
size of other large ungulates influences roe deer behaviour and presence. Moreover, the presence of
the natural predators of the roe deer affects the roe deer in terms of population size and behaviour
as well. Current speculations about the possible (re)arrival of the wolf and the lynx after some
observations of these animals near the border with Germany (NOS.nl, 2015) make this a valid

55
hypothesis. The presence of more natural predators of the roe deer possibly indicates that more roe
deer individuals will be lost though predation. This is supported by a German study of Holzapfel et al.
(2011) in which the stomach content of in wild living wolves have been examined. They found that
the stomach content consisted primarily of roe deer with addition of some animal pets. There could
also be an effect of solely the presence of these natural predators on the behaviour of the roe deer.
It could be argued that the presence of natural predators will increase the alertness of roe deer
individuals. If roe deer individuals are in general more alert, this could mean that they will also be
more alert when crossing the road with possibly less DVCs as a result. However, it has also been
mentioned (see 3.4.1) that stressed individuals have a longer flight distance than non stressed
individuals indicating that stress from predators might also result in more DVCs (De Boer et al., 2002
cited by Dekker and Geert Groot Bruinderink 2010).
Global warming
One aspect to consider when thinking of the future is the expected increase in temperature (IPCC.nl,
2015). It is expected that the temperature will increase and this has its effect on the environment.
For example, the availability of food for roe deer will possibly increase. Where previously winters in
Europe were harsh with times of snow and low amount of nutrition and the death of weak roe deer
individuals as a result. Nowadays (2015), winters in Europe are milder and a smaller amount of the
roe deer population dies during the winter. Therefore more and more roe deer individuals survive
and the carrying capacity of natural areas increase due to the increased food supply. It could be
argued that an increase in temperature could influence winter herd forming. Winter herds are
formed because this gives the roe deer individual’s benefits in detecting predators, finding food and
cover and saving energy as a result. If winters are costing the roe deer less energy as the
temperature is higher (e.g. less energy lost in maintaining body temperature) and more food is
available (e.g. more energy gain), forming winter herds might become unnecessary.
5.2 Conclusions and recommendations
Roe deer vehicle collisions in the Netherlands are the result of the behaviour of the roe deer itself,
such as territorial behaviour, and human activities, such as recreational and agricultural activities and
the creation of infrastructure taking place in the living areas of roe deer. To reduce the number of
DVCs in the Netherlands different mitigation measures have been evaluated in this report. The
mitigation measures scored as most effective in reducing DVCs are the wildlife signalling system
(paragraph 3.4.1) and reducing driving speed (paragraph 3.2.1). There are also some measures that
seem promising in reducing DVCs but which effectiveness are inconclusive at the moment and thus
need more research. These measures are: the virtual fence (paragraph 3.1.1), light warning system
(paragraph 3.2.4) and general education (through CBR) (paragraph 3.3.4 ). Some mitigation measures
that were ineffective were chemical repellents (paragraph 3.1.3) and warning whistles (paragraph
3.1.4 ). From the test runs of the concept action plan can be concluded that often basic management
(as described in box 1) is not always being applied. Furthermore, to reduce DVCs its best to combine
multiple mitigation measures as this will reduce habituation by driver and/or roe deer and will give
the best results.
For the future it is advised to cooperate with other (neighbouring) countries to exchange knowledge
and discuss the different mitigation measures. Thus far, most information about DVCs from other
countries is obtained through published literature. However, in this way unpublished information or

56
information not translated in English regarding roe deer and DVCs is not being exchanged. Therefore
it is advised to publish reports, preferably in English, to spread the locally gained knowledge
internationally. Furthermore, nationally it is advised to educate drivers more. For instance through
incorporating WVC and the related risks in theoretical driver exams and/or more attention for this
subject by the media. The following recommendations are suggested to administrators of NM with
DVCs in the natural area under their administration:
Recommendations:
Use of the action plan presented in this report.
Cooperation and exchange of knowledge with foreign countries familiar with DVCs.
Examination of relatively new mitigation measures.
Examination of culling as a DVC mitigation measure: If organisations and/or the government
permits to reduce the local deer density through culling, in which manner should this be done
(e.g. how many bucks/does, on which locations)?

57
References
Achterhoeknieuwswinterswijk.nl (2014). Website. URL: http://www.achterhoeknieuwswinterswijk.nl/lokaal/lokaal/wildspiegels_50_procent_minder_aanrijdingen_2943004.html#.VLou7tKG9vA, Accessed in November, 2014.
Alters, S. (2000). Biology: Understanding life. Book. Jones and Barlette Publishers, Boston, p.728, SBN-13: 978-0471433651.
Amazon (2014). Website. URL:
retrieved from http://www.amazon.com/Custom-Accessories-17380-Alert-Whistles/dp/B000BOALF4 , Accessed in November 2014.
Andreassen, H.P., Gundersen, H. and Storaas, T. (2005). The effect of scent-marking, forest clearing, and supplemental feeding on moose-train collisions. Journal of Wildlife Management 69, pp. 1125-1132.
Bardy, M. (2010). Website. URL:
http://www.env.gov.bc.ca/cos/info/wildlife_human_interaction/UrbanUngulatesConflictAnalysisFINALJuly5-2010.pdf, Accessed in
November 2014.
Bashore, T. L., W. M. Tzilkowski, and E. D. Bellis. (1985). Analysis of deer–vehicle collision sites in Pennsylvania USA. Journal of Wildlife
Management 49, pp. 770–774.
Beckman, A. (2004). Road conflicts in National Parks placed in densely populated and highly cultivated areas, and ways to reconcile them.
Master thesis, Denmark: Roskilde University Department of Environment, Technology and Social Studies (TEKSAM).
Bertwistle, J. (1999). The effects of reduced speed zones on reducing bighorn sheep and elk collisions with vehicles on the Yellowhead
Highway in Jasper National Park. In: Evink, G.L., P. Garrett, and D. Zeigler (eds.). Proceedings of the Third International Conference on
Wildlife Ecology and Transportation. Book. Missoula, MT. FL-ER-73- 99. Florida Department of Transportation, Tallahassee, FL. pp. 89–97.
Bijlsma, R.G. (2008). Broedvogels van de buitenkaadse Oostvaardersplassen in 1977, 2002 en 2007. A&W-rapport 1051. Veenwouden.
Altenburg & Wymenga.
Bomford, M. O’Brien, P.H. (1990). Sonic deterrents in animal damage control: A review of device tests and effectiveness. Wildlife society
bulletin 18, pp. 411-422.
Brown, T.L., Decker, D.J., Riley, S.J., Enck, J.W., Lauber, T.B., Curtis, P.D. and Mattfeld G.F. (2000b). The future of hunting as a mechanism to
control white-tailed deer populations. Wildlife society bulletin 28, pp. 797-807.
Bruinderink, G.T.W.A., Lammertsma, D.R. and Prins, H.H.T. (2007). Damherten in de Amsterdamse waterleiding duinen; effecten van beleid.
Alterra Wageningen.
Cartoonstock.com (2014). Website. URL:
http://www.cartoonstock.com/directory/c/car_crossing.asp, Accessed in November 2014.
Case, R.M. (1978). Interstate highway road-killed animals: a data source for biologists. Wildlife society bulletin 6, pp. 8-13.
CBS, PBL, Wageningen UR (2013). Flora van wegbermen 1999-2012 (indicator 1433, versie 03, 17 december 2013). www.compendiumvoordeleefomgeving.nl. CBS, Den Haag; Planbureau voor de Leefomgeving, Den Haag/Bilthoven en Wageningen UR, Wageningen.
CBS, PBL, Wageningen UR (2014). Recreatie in groenblauwe gebieden, 2006-2012 (indicator 1258, versie 06, 18 februari 2014).
www.compendiumvoordeleefomgeving.nl. CBS, Den Haag; Planbureau voor de Leefomgeving, Den Haag/Bilthoven en Wageningen UR, Wageningen.
Clevenger, A.P., Chruszcz, B. and Gunson, K.E. (2001). Highway mitigation fencing reduces wildlife-vehicle collisions. Wildlife society bulletin
29, pp. 646-653.
Crombach, L. (2014). Bijvoeren en contraceptie als alternatieven voor afschot. Bsc. Thesis, Utrecht University.

58
D’Angelo, G.J., De Chicchis, A.R., Osborn, D.A., Gallagher, G.E., Warren, R.J. and Millen, K.V. (2007). Hearing range of white tailed deer as
determined by auditory brainstem response. Journal of wildlife management 71, pp. 1238-1242.
Daniels, S., Vaneerdewegh, P., Brijs, K., Dillen, W. and Deknudt , K. (2010). Website. URL:
http://www.vsv.be/sites/default/files/vsvlokaal_2_-_snelheidsmanagement.pdf, Accessed in January 2015.
Danielson, B.J. and Hubbard, M.W. (1998). A literature review for assessing the status of current methods of reducing deer-vehicle collisions.
Iowa Department of Transportation and Iowa Department of Natural Resources.
Danilkin, A. & Hewison, A.J.M. (1996). Behavioural ecology of Siberian and European roe deer. Book. Chapman and Hall, London. ISBN: 978-
0-412-63880-0
De Boer, H.Y., Van Breukelen, L., Hootsmans, M.J.M. and Van Wieren, S.E. (2004). Flight distance in roe deer Capreolus capreolus and
fallow deer Dama dama as related to hunting and other factors. Wildlife Biology 10. pp. 35-41.
Deerwhistle.com (2014). Website. URL:
http://deerwhistle.com/, Accessed in November 2014.
Dekker, J.J.A. and Groot Bruinderink, G.W.T.A. (2010). Effecten van populatiebeheer op gedrag van ree, damhert, edelhert en wild zwijn.
Rapport 2010.071. Zoogdiervereniging, Nijmegen.
Derbyshire Stock Fencing LTD (2014). Website. URL:
http://www.derbyshirestockfencingltd.co.uk/deer-fencing/4574949951, Accessed in November 2014.
Desire, G. and Recorbet, G. (1990). Resultats de l’enquete réalisée de 1984 à 1986 sur les collisions entre les vehicules et les grands
mammifères sauvages. Office National de la Chasse, Bulletin Mensuelle 143, pp. 38-47.
Dienst Weg- en Waterbouwkunde (2014). Website. URL:
http://www.natuurenbos.be/~/media/Files/Projecten/Dood%20doet%20leven/wildspiegels%20DWW%20studie.pdf , Accessed in
November 2014.
Dodd, N. and Gagnon, J. (2008). Preacher wildlife fence and crosswalk enhancement project state route 260. First year progress report.
Project JPA 04-088. Arizona Game and Fish Department, Research Branch.
Dodd, N.L., Gagnon, J.W., Boe, S. Manzo, A. and Schweinsburg, R.E. (2007). Evaluation of measures to minimize wildlife-vehicle collisions
and maintain wildlife permeability across highways-State route 260, Arizona, USA. Final report 540 (2002-2006). Arizona transportation
research centre, Arizona Department of transportation, Phoenix.
Donaldson, B.M. (2006). A toolkit of measures for reducing animal-vehicle collisions. Virginia Department of Transportation, Charlottesville,
Virginia, USA.
Duinbehoud (2014). Website. URL:
http://duinbehoud.nl/jachtschandaal-katwijk-breidt-zich-uit/, Accessed in November 2014.
Edmunds.com (2014). Website. URL:
http://www.edmunds.com/car-news/new-animal-detection-systems-help-drivers-avoid-accidents.html, Accessed in November 2014.
fansels.nl (2014). Website. URL:
http://www.fansels.nl/nl/weblog/2009/03/14/reflecterende-paaltjes/ , Accessed in November 2014.
FBE Gelderland (2009). Faunabeheerplan Gelderland 2009-2014 deel II. Veluwe, Stichting Faunabeheereenheid.
Feldamer, G.A., Gates, J.E., Harman, D.M., Loranger, A.J. and Dixon, K.R. (1986). Effects of interstate highway fencing on white-tailed deer
activity. Journal of wildlife management 50, pp. 497-503.
Finder, R.A. Roseberry, J.L. and Woolf, A. (1999). Site and landscape conditions at white tailed deer-vehicle collision locations in Illinois.
Landscape and Urban Planning 44, pp. 77-85.

59
Flickr.com (2015). Website. URL:
https://www.flickr.com/groups/level4allnaturesparadise/pool/56446000@N04/, accessed in February 2015.
Franzenlandbouw (2014). Website. URL:
http://www.franzenlandbouw.nl/producten/tarwe/, Accessed in November 2014.
Groot Bruinderink, G.W.T.A. and Hazebroek, E. (1996). Ungulate traffic collisions in Europe. Conservation Biology 10, pp. 1059-1067.
Hardy, A., Lee, S. and Al-Laisy, A.F. (2006). Effectiveness of animal advisory messages on dynamic message signs as a speed reduction tool.
Transportation research Record 1973, pp. 64-72.
Hartwig, D. (1991). Erfassung der Verkehrunfälle mit Wild im Jahre 1989 in Nordrhein-Westfalen im Bereich der Polizeibehörden. Zeitschtift
für Jagdwissenschaft 37, pp. 64-62.
Harvey, W. (2014). Website. URL:
http://williamharveyphotography.co.uk/roe-deer/, Accessed in November 2014.
Hedlund, J.H., Curtis, P.D., Curtis, G., and Williams A.F. (2004). Methods to reduce traffic crashes involving deer: What works and what does
not. Traffic Injury Prevention 5 , pp. 122-131.
hhnk.nl (2014). Website. URL:
http://www.huibertsbv.nl/projecten/cultuurtechniek/90/, Accessed in November 2014.
Holland C.A. and Conner M.T. (1996). Exceeding the speed limit: an evaluation of the effectiveness of a police intervention. Accident
Analysis and Prevention 28, pp. 587-597.
Holzapfel, M., Wagner, C., Kluth. G., Reinhardt, I. and Ansorge, H. (2010). Website. URL:
https://www.natuurmonumenten.nl/sites/default/files/Artikel%20Duitsland%20wolven.pdf, Acessed in February 2015
Trafficsystems.eu (2014). Website. URL:
http://www.trafficsafetysystems.eu/nieuws/2010/nieuwe_wildspiegels_voor_de_provincies_utrecht_en_overijssel, Accessed in
November 2014
Huijser, M.P. Duffield, J.W., Clevenger, A.P., Amet, A.J. and McGowen, P.T. (2009b). Cost-benefit analysis of mitigation measures aimed at
reducing collisions with large ungulates in the United States and Canada: A decision support tool. Ecology and society 14, p. 15.
Available at http://www.wcologyandsociety.org/viewissue.php?sf=41
Huijser, M.P., McGowen, P.T. (2010). Reducing Wildlife-Vehicle collisions. In J.P. Beckman, A.P. Clevenger. M.P. Huijser and J.A. Hilty (eds.).
Safe passages. Book. Island press, US, pp. 51-74. ISBN: 9781597266536.
Huijser, M.P., P. McGowen, J. Fuller, A,. Hardy, A. Kociolek, A.P. Clevenger, D. Smith and R. Ament (2008). Wildlife Vehicle Collision
Reduction Study: Report to Congress. Western Transportation Institute, Montana State University: Bozeman, MT.
Hussain, A., Armstrong, J.B., Brown, D.B. and Hogland, J. (2007). Land-use pattern, urbanization, and deer-vehicle collisions in Alabama.
Human-Wildlife conflicts 1, pp. 89-96.
Inrichtinglandelijkgebied.nl (2014). Website. URL:
http://inrichtinglandelijkgebied.nl/wp-content/uploads/2014/01/WWS-presentatie-algemeen.pdf, Accessed in November 2014.
IPCC.nl (2015). Website. URL:
http://www.ipcc.ch/publications_and_data/ar4/wg1/en/spmsspm-projections-of.html, Accessed in January 2015.
Jachowski, D.S., Slotow, R. and Millspaugh, J.J. (2013). Good virtual fences make good neighbors: opportunities for conservation. Londen:
Animal Conservation 17, pp. 187–196.
Jaren, V., R. Andersen, M. Ulleberg, P. H. Pedersen, and B. Wiseth. 1991. Moose-train collisions: the effects of vegetation removal with a
cost-benefit analysis. Alces 27, pp. 93–99.

60
JD Traffic Safety Systems (2014). Website. URL:
http://www.trafficsafetysystems.eu/producten/wildwaarschuwing_virtueel_hekwerk, Accessed in November 2014.
Jenks, J.A., Smith, W.P. and DePerno, C.S. (2002). Maximum sustained yield harvest versus trophy management. Journal of wildlife
management 66, pp. 528-535.
Jones, J.M. and Witham, J.H. (1993). Urban deer ‘problem solving’ in northeast Illinois: an overview. In J.B. McAninch (ed.). Proceedings of
the 55th Midwest fish and wildlife conference: Urban deer: A manageable resource . St. Louis, MOL The wildlife society, pp. 58-65 .
Kenniscentrum-reeen.nl (2015). Website. URL:
http://www.kenniscentrum-reeen.nl/portals/0/Afbeeldingen/beleven_beheren/verkeer/EWW_bord_kl.jpg, accessed in February 2015.
Kerzel, H and Kirchberger, U. (1993). Erfolge im kampf gegen Wildunfälle. Dir Pirsch 18, pp. 3-5.
Klip, B. (2004). Reeën kijken en beheren. Book. Stichting Canidae 2000, Warffum. ISBN 9789080621428.
Klomberg, Y. (2012). Reeën bij Staatsbosbeheer Regio Oost: Het beheer van een succesvolle diersoort nader bekeken en een stappenplan
voor een beter begeer in de gehele regio. Thesis, Wageningen universiteit.
Knapp, K.K. Oakasa, Yi, X., Oakasa, T., Thimm, W., Hudson, E. and Rathmann, C. (2004). Deer-vehicle crash countermeasure toolbox: a
decision and choice resource. Midwest Regional University Transportation centre, Madison, Wisconsin, USA.
Knoflacher, M., (1980). Untersuchung der Wirtschaftlichkeit und Wirksamkeit der im StraFennetz verwendeten Wildschutzeinrichtungen,
Bundesministerium fur Bauten und Technik, Strarenfor. Schung H. 138, Wien. P. 109.
Kruuk, L.E.B., Clutton-Brock, T.H., Albon, S.D., Pemberton, J.M. and Guinness, F.E. (1999). Population density affects sex ratio variation in
red deer. Nature 399, pp.459-461.
Kurt, F. (1968). Das Sozialverhalten des Rehes. Book. Mammalia depicta, Hamburg, ISBN B0000BS6Z7.
Kuser, J.E. and Wolgast, L.J. (1983). Deer road-kill increases with no-firearms-discharge law. Bulletin of the New Jersey Academy of science
28, pp. 71-72.
Langbein, J. and R. Putman, R. (2006). National Deer-Vehicle Collisions Project. Scotland, 2003 – 2005. Report to the Scottish Executive.
Langbein, J.(2007a). National Deer-Vehicle Collisions Projet: England 2003-2005. Final Report to the Highway Agency. Wrexham, UK: The
Deer Initiative.
Langbein, J., Putman, R., Pokorny, B. (2011). Traffic collisions involving deer and other ungulates in Europe and available measures for
mitigation. In R. Putman, M. Apollonio and R. Andersen (eds), Ungulate management in Europe: Problems and practices. Book.
Cambridge University Press, Cambridge, pp. 215-259, ISBN 9780521760591.
Lavsund, S. and Sandegren, F. (1991). Moose-vehicle relations in Sweden: a review. Alces 27, pp. 118-126.
Lebenorger, P. (1993). Verkehrpartner Wild. Weidwerk 11, pp. 47-48.
Łukasik, L. (2014). Website. URL:
http://www.lukaszlukasik.pl/galeria/Ssaki/index2.html, Accessed in November 2014.
Mastro, L.L., Conover, M.R. and Fery, S.N. (2008). Deer-vehicle collisions prevention techniques. Human-wildlife conflicts 2, pp. 80-92
Maximus.nl (2015). Website. URL:
http://maxius.nl/flora--en-faunawet/, accessed in February 2015
McCaffery, K.R. (1973). Road kills show trends in Wisconsin deer populations. Journal of Wildlife management 37, pp. 212-216
Messmer, T.A., Hendricks, C.W. Klimpack, P.W. (2000). Modifying human behavior to reduce wildlife-vehicle collisions using temporary
signage. Wildlife and highways, seventh annual meeting of the wildlife society.

61
Molenaar, J.G. and R.J.H.G. Henkens (1998). Effectiviteit van wildspiegels: een literatuurevaluatie. IBN- DLO: Wageningen.
Möri, M. en Hani Abdel-Halim, M., (1980). Road sign recognition and non-recognition. Department of Civil Engineering, Osaka University,
Japan. In: Accident Analysis & Prevention 13, pp. 101-115.
Moser, E. (2007). Acoustic Wildlife Warning Modules Under Test. OÖ Jäger 4, pp. 1-2.
Mosler-Berger, C., and J. Romer. (2003). Wildwarnsystem CALSTROM. Wildbiologie 3, pp. 1–12.
National Research Council. (1998). Managing Speed: Review of Current Practices for Setting and Enforcing Speed Limits. Transportation
Research Board, National Research Council of the National Academies. The National Academies Press: Washington, DC.
Natuurmonumenten groot wild enquete (2014), Website. URL:
https://www.natuurmonumenten.nl/groot-wild-enqu-te, Accessed in October 2014.
Natuurmonumenten.nl (2014). Website. URL:
https://www.natuurmonumenten.nl/natuurgebied/montferland/route/wandelroute-bergherbos-in-beek-vlakbij-doetinchem, Accessed
in November 2014.
Northeastshootingbreaks.co.uk/ (2014). Website. URL:
http://northeastshootingbreaks.co.uk/content.asp?cpage=Roe%20Deer%20Stalking, Accessed in November 2014.
NOS.nl (2015). Website. URL:
http://nos.nl/artikel/662735-wolf-lijkt-echt-terug-in-nederland.html, Accessed in January 2015.
Onderzoek verplaatsingen in Nederland (OViN) (2010). Website. URL:
http://www.cbs.nl/NR/rdonlyres/F53B836F-F330-47C4-939D 6AFDDB0709A4/0/OViNklantendag2010PresentatieKiM.pdf, Accessed in
November 2014.
Ooms, J.W. (2010). Website. URL:
http://www.verkeerskunde.nl/Uploads/2010/12/-Ooms--60-scriptie-26-mei-DEFINITIEF.pdf, Accessed in November 2014.
Pepper, H.W. (1999). Road traffic accidents and deer reflectors: a comparative trial of the efficacy of standard red and new blue/green
roadside reflectors at preventing motor vehicle and wild deer collisions. Internal report on Project 257. London: Forestry commission,
Forest Research.
Pixgood.com (2014). Website. URL:
http://pixgood.com/roe-deer-fawn.html, Accessed in November 2014.
Pojar, T. M., R. A. Prosence, D. F. Reed, and R. H. Woodward. (1975). Effectiveness of a lighted, animated deer crossing sign. Journal of
Wildlife Management 39, pp. 87-91.
Pokorny, B. (2006). Roe deer-vehicle collisions in Slovenia: situation, mitigation strategy and countermeasures. Veterinarski Arhiv 76, pp.
177-187.
Pokorny, B., Marolt, J. and Poličnik, H. (2008). Ocena učinkovitosti in vplivov zvočnih odvračalnih naprav kot sredstva za zmanjšanje števila
trkov vozil z veliko divjadjo. [Assessment of the effectiveness and impacts of acoustic deterrents as a countermeasure for reducing the
number of big game-vehicle collisions] (In Slovene) Final report for Slovene Hunter Association, contact no. LZS-05/1298. Velenje,
Slovenia: ERICo, p. 107.
Porter, W. F., Underwood, H.B. and Woodard, J.L. (2004). Movement behavior, dispersal and the potential for localized management of
deer in a suburban environment. Journal of Wildlife Management 68, pp. 247-256.
Putman, R.J. & Mann, J.C.E. (1990). Social organisation and behavior of British sika deer in contrasting environments. Deer 8, pp. 90-94.
Putman, R.J. (1997). Deer and Road Traffic Accidents: Options for Management. Journal of environmental management 51, pp. 43-57.

62
Putman, R.J., Langbein, J. and Staines, B.W. (2004). Deer and road traffic accidents: a review of mitigation measures - costs and cost-
effectiveness. Report for the deer commission for Scotland.
Rea, V.(2003). Modifying roadside vegetation management practices to reduce vehicular collisions with moose, Alces alces. Wildlife biology
9, pp. 81-91.
Reed, D.F., Pojar, T.M. and Woodard, T.N. (1974). Use of one-way gates by mule deer. Journal of wildlife management 38, pp. 9-15.
Reed, D.F., Woodard, T.N. and Beck, T.D.I. (1979). Regional deer-vehicle accident research. Report FHWA-CO-RD-79-11, Colorado Division of
Wildlife, Denver, Co.
Reed, D.F.,. Beck, T.D.I. and Woodard, T.N (1982). Methods of reducing deer-vehicle accidents: benefit-cost analysis. Wildlife society bulletin
10, pp. 349-954.
Reid, R. (2014). Website. URL:
http://recombu.com/cars/article/deerdeter-keeps-you-from-squishing-quadrupeds , Accessed in November 2014.
Rlconsulants.nl (2014). Website. URL:
http://www.rlconsultants.nl/paginas/projecten/faunavoorzieningen/12/faunavoorzieningen-provincie-noord-brabant-2/33, Accessed in
November 2014.
Rodgers, E. (2004). An ecological landscape study of deer-vehicle collisions in Kent country, Michigan. White Water Associates, Amasa,
Michigan, USA.
Romin, L.A. (1994). Factors associated with the highway mortality of mule deer at Jordanelle Reservoir, Utah. Thesis, Utah State University,
Logan, Utah, USA .
Romin, L.A. and Bissonette, J.A. (1996). Deer-vehicle collisions: status of state monitoring activities and mitigation efforts. Wildlife society
Bulletin 24, pp. 276-283.
Romin, L.A. and Dalton, L.B. (1992). Lack of response by mule deer to wildlife warning whistles. Wildlife society bulletin 20, pp. 382-384.
Rondeau, D. and Conrad, J.M. (2003). Managing urban deer. American Journal of Agricultural economics 85, pp. 266-281.
Rosa, S.A. (2006). Highway effects on small mammal communities and effectiveness of a deer vehicle-collision mitigation strategy. Thesis,
Utah state university, Logan, Utah, USA.
Scheifele, P.M., Browning, D.G. and Scheifele, L.M. (1998). Measurement of several types of ‘deer whistles’ for motor vehicles: frequencies,
levels, and animal threshold responses. Journal of the Acoustical society of America 104, p. 1811.
Scheifele, P.M., Browning, D.G. and Scheifele, L.M. (2003). Analysis and effectiveness of ‘deer whistles’ for motor vehicles: frequencies,
levels, and animal threshold responses. Journal of the Acoustical society of America ARLO 4, p. 13.
Schoon, R. (2011). Website. URL:
http://www.faunabeheereenheid.nl/utrecht/Faunabeheer%20in%20de%20praktijk/2011%2012%2015%20Eindrapport%20Onderzoek
%20Valwild.pdf, Accessed in November 2014.
Schoon, R. and Spek, G.J. (2014). Aanpak reeënbeheer faalt. Reewild 81, pp. 14-15.
Schulz, H. (2014). Website. URL:
http://www.helgeschulz.de/galerie/rehe-rehbock-rehwild/rehbock-reh-wild-bilder-fotos-roe-deer-capreolus-capreolus-photos-pics-
pictures-images-08457.htm, November 2014.
Schwabe, K.A., Schuhmann, P.W. and Tonkovich, M. (2003). A dynamic exercise in reducing deer-vehicle collisions: management through
vehicle mitigation techniques and hunting. Journal of agricultural and resource economics 27, pp. 261-280.
Schweizerischer Versicherungsverband (2009). Status project “Wildwarnanlage im Kanton Zürich” teilproject der präventionsprojects
“Weniger Wildunfälle”; SVV.

63
Seiler, A. (2003). The toll of the automobile: Wildlife and roads in Sweden. Thesis, Swedish University of agricultural sciences.
Seiler, A. (2005). Predicting locations of moose–vehicle collisions in Sweden. Journal of Applied Ecology 42, pp. 371–382.
SGS Environment (1998). The Prevention of Wildlife Casualties on Roads through the Use of Detterents: Prevention of Casualties among
Deer Populations. Report to UK Highway Agency SW335/V3/11-98. Ellesmere Port, UK: SGS UK Ltd.
Shipley, L.A. (2001). Evaluating WolfinTM
as a repellent to wildlife on roads in Washington and the feasibility of using deer-activated
warning signs to reduce deer-automobile collisions on highways in Washington. Research project #T9902. Department of Natural
Resources sciences, Washington State University, Pullman.
Sielecki, L.E. (1999). WARS-wildlife accident reporting system: 1998 Annual report, 1994-1998 synopsis. Britisch Colombia ministry of
transportation and highways, environmental service section, Victoria, Britisch Colombia.
Singleton, P.H. and Lehmkuhl, J.F. (2006). Assessing habitat connectivity in the interstate 90 Snoqualmie Pass corridor. Washington, pp.
331-341. In C.L. Irwin, P. Garett, and K.P. McDermott (eds.). Proceedings of the international conference on ecology and transportation.
Centre for transportation and the Environment, North Carolina State University, Raleigh, North Carolina, USA.
Spek, G.J. (2013). Reeën in het Bergherbos: Beheer- en inrichtingsplan ter beperking van het aantal aanrijdingen. Vaassen.
Staines, B., Langbein, J., Putman, R. (2001). Road traffic accidents and deer in Scotland. university of Aberdeen, Scotland..
Stanley, L., Hardy, A. and Lassacher, S. (2006). Driver responses to enhanced wildlife advisories in a simulated environment. TRB 2006
Annual Meeting CD-ROM. Transportation Research Board: Washington, DC.
Statche, A., Heller, E., Hothorn, T. and Heurich, M. (2012). Activity patters of European roe deer (Capreolus capreolus) are strongly
influenced by individual behaviour. Folia Zool. 62, pp. 67-75.
Stichting Wildaanrijdingen Nederland (SWN) (2014). Voor een uniform landelijke afhandeling van wildaanrijdingen. Handed personally to
author by VHR (vereniging het reewild) November 2014.
Sudharsan, K. Riley, S.J. and Winerstein, S.R. (2006). Relationships of autumn hunting season to the frequency of deer-vehicle collisions in
Michigan. Journal of wildlife management 70, pp. 1161-1164.
Sullivan, T.A., Williams, A.F., Messmer, T.A., Hellinga, L.A. and Kyrychenco, S.Y. (2004). Effectiveness of temporary warning signs in reducing
deer-vehicle collisions during mule deer migrations. Wildlife society bulletin 32, pp. 907-915.
Sullivan, T.L. and Messmer, T.A. (2003). Perceptions of deer-vehicle collision management by state wildlife agency and department of
transportation administrators. Wildlife society bulletin 31, pp. 163-173.
SWOV (2009). SWOV standpunt: Nut en noodzaak van verkeersborden, Stichting Wetenschappelijk Onderzoek Verkeersveiligheid.
Leidschendam.
Taylor, P. D., Fahrig, L., Henein, K., & Merriam, G. (1993). Connectivity is a vital element of landscape structure. Oikos, pp. 571-573.
Telmee.nl (2014). Website. URL:
http://www.telmee.nl/index.php?c=info&m=chart&mm=spinfo&year=*, Accessed in November 2014.
Trafficsystems.eu (2014). Website. URL:
http://www.trafficsafetysystems.eu/nieuws/2010/nieuwe_wildspiegels_voor_de_provincies_utrecht_en_overijssel, Accessed in
November 2014.
truecar.com (2014). Website. URL:
http://blog.truecar.com/2014/01/29/spotlight-on-technology-night-vision-safety-technology-from-autoliv-can-help-you-see-better-at-
night/, Accessed in November 2014.
Tu/e (2014). Website. URL:

64
http://www.techniekinnederland.nl/nl/index.php?title=Infrastructuur_tussen_de_twee_wereldoorlogen, Accessed in November 2014
verkeerspro.nl (2015). Website. URL:
http://www.verkeerspro.nl/verkeerskunde/2011/12/07/elektronisch-syteem-voor-waarschuwing-overstekend-wild/, Accessed in
November 2014.
VHR (2014a), Website. URL:
http://www.reewild.nl/het-ree/activiteiten/, Accessed in November 2014.
VHR (2014b), Website. URL:
http://www.reewild.nl/vereniging/doelstelling/, Accessed in November 2014.
Voss, H. (2007). Unfallhäufungen mit wildunfällen – Modellversuche im Oberbergischen Kreis. Gesamtverband der Deutschen
Versicherungswirtschaft e. V . Berlin: Ufallforschung der Versicherer.
Vulink, T., Van Eerden, M., Platteeeuw M. and Roos M. (2009). Website. URL:
http://www.landschap.nl/content/view/134/77/ , Accessed in November 2014.
Ward, A.L.(1982). Mule deer behavior in relation to fencing and underpasses on Interstate 80 in Wyoming. Transportation research record
859, pp. 8-13 .
Waring, G.H., Griffis, J.L. and Vaughn, M.E. (1991). White-tailed deer roadside behavior, wildlife warning reflectors, and highway mortality.
Applied animal behaviour science 29, pp. 215-223.
Wbesusterengraetheide.nl (2014). Website. URL:
http://wbesusterengraetheide.nl/wildbeheereenheid-susterengraetheide/tips-beveiliging-wegen-overstekend-wild/, accessed in
November 2014.
Wegenwiki.nl (2015). Website. URL:
http://www.wegenwiki.nl/images/Wildwaarschuwingsyssteem_Overijssel.jpg, accessed in February 2015.
Wikipedia.org (2014). Website. URL:
http://nl.wikipedia.org/wiki/Mais, Accessed in November 2014.
Wildbeheer Veluwe (2012). Aanrijdingen in relatie met bronst. Excel bestand, Niet gepubliceerd .
Woods, J.G. (1990). Effectiveness of fences and underpasses on the trans-Canada highway and their impact on ungulate populations.
Report to Banff National park warden service, Banff, Alberta.
Worm, B. (2014). Het ree: observeren en herkennen, Book. IPC groene ruimte, Arnhem. ISBN 978-90-74481-56-4.
ZV (2014). Website. URL:
http://www.zoogdiervereniging.nl/het-ree-capreolus-capreolus, Accessed in November 2014.

65
Personal communication:
M. Rijks, Staatsbosbeheer Fauna-ecologist at Staatsbosbeheer.
E Grob Administrator of Natuurmonumenten
M. van der Weide Fauna-ecologist at Natuurmonumenten.
J. Brinkman Administrator at Natuurmonumenten.
F. Spijker Involved in Diepenheim project: wildlife warning system.
G.J. Spek Ecologist at Spekadvies and Vereniging het Reewild
J. Dorgelo Manufacturer JD traffic systems
M. Wilbort Involved in Diepenheim project: wildlife warning system.

66
Appendices
A. Questionnaire in Dutch
Stap 1. Analyse van de probleemsituatie
Verzamel van de locatie met aanrijdingen en de omgeving de volgende informatie: Aanrijdingen
1. Hoeveel aanrijdingen met reeën waren er gemiddeld op deze locatie in de afgelopen 5 jaren?
≤ 5 a/j 5 – 10 a/j 11 – 15 a/j > 15 a/j
2. In welke maanden en op elke tijdstippen van de dag zijn er gemiddeld de meeste aanrijdingen?
Weg
3. Op wat voor type weg vinden de aanrijdingen met reeën plaats?
Nationale weg Provinciale weg Erf toegang weg
(≥ 100 km/h) (80 km/h) (≤ 60 km/h)
4. Hoe is de naleving van de maximaal toegestane snelheid?
Slecht Matig Goed Onbekend
5. Hoe is de weg vormgegeven:
a. Wat is de breedte van de weg?
b. Zijn er overige paden en/of wegen parallel aan deze weg?
Ja Nee
6. Hoe is de berm vormgegeven?
a. Wat is de breedte van de berm (in meters)?
` ≤ 1 m > 1 – 2 m > 2 – 5 m > 5 m

67
b. Tot hoe hoog staat de vegetatie van de berm (in cm)?
7. Wat zijn de exacte locaties op de weg waar de aanrijdingen plaatsvinden (in hectometerpaal)?
8. Hoe is het zicht van de automobilist op de locatie met de aanrijdingen (op de weg en de berm)?
Slecht Matig Goed
Landschap 9. Hoe is het landschap waar de weg doorloopt ingedeeld (gebruik bijv. Google maps)?
10. Hoe gebruikt de mens het landschap?
Recreatie Ecologische diensten Overig gebruik
(bijv. houtkap)
Ree 11. Hoeveel reeën leven er minimaal in de omgeving en wat is de verdeling in leeftijd en geslacht?
12. Wat is de populatieontwikkeling van reeën in de afgelopen jaren?
Gelijk gebleven t Toegenomen Afgenomen
13. Wordt het rustgebied van de ree gescheiden van het foerageer gebied door de weg?
Ja Nee
14. Hoe wordt het gedrag van de reeën beïnvloed door de mens (direct en indirect)?
Huidig inzet verminderen aanrijdingen 15. Wat voor maatregelen zijn er in het verleden, of wordt er op dit moment toegepast op de
wegen?
16. Hoe is het beheer van deze maatregelen georganiseerd en uitgevoerd?
17. Welk afschot is de afgelopen tijd gerealiseerd (aantallen en geslacht)?

68
18. Welke partijen zijn betrokken bij aanrijdingen met reeën op deze locatie? Bijvoorbeeld
beheerders van de weg, eigenaren gebieden rondom de weg en overige organisaties.
19. Vanaf hoeveel aanrijdingen per jaar is er draagvlak vanuit de betrokken partijen (bijv.
wegbeheerder, lokale landeigenaren) om actie te ondernemen om aanrijdingen te verminderen?

69
Stroomdiagram. Door het volgen van het stroomdiagram wordt advies gegeven over welke maatregel het meest gepast is voor de situatie met DVCs in een specifiek gebied (e.g. doorlopende lijn). Wanneer een maatregel niet passend blijkt te zijn, of de betrokken partijen staan niet achter deze maatregel wordt er een tweede advies gegeven (e.g. doorbroken lijn). *Richtlijnen moeten nog verder worden onderzocht en bepaalt worden door de betrokken partijen.
B. Original Flowchart in Dutch
Stap 2: Volg stroomdiagram naar passende maatregel
Box 1: Basis beheer. Het basis beheer van een weg en de omgeving bestaat uit:
Uitvoeren van bermbeheer (maaien) om de bermvegetatie onder de ± 30 cm te houden. Zorg ervoor dat de zichtbaarheid van de automobilist en het ree zo optimaal als mogelijk is (e.g.
berm van adequate breedte, geen blokkade op het zicht van automobilisten et cetera). Plaats berm reflectoren en/of, als ze al aanwezig zijn, zorg dat ze goed onderhouden worden (e.g.
frequent schoongemaakt om effectiviteit te verhogen). Registreer de aanrijdingen met reeën op de betreffende weg. Noteer: tijd, leeftijd en geslacht.
Box 2: Zijn het aantal aanrijdingen aanvaardbaar?
Of het aantal aanrijdingen op een bepaalde locatie als aanvaardbaar wordt gezien hangt af van de mening van de betrokken partijen. Deze partijen zijn, bijvoorbeeld, de provincie (i.e. vaak ook de wegbeheerder), beheerders van omliggende gebieden en eigenaren van privé gebieden). Ze moeten eens worden over: bij welk aantal aanrijdingen moet er actie worden ondernemen? Om dit te bewerkstellen moeten vergaderingen worden georganiseerd waar alle betrokken partijen aanwezig zijn.

70
Figure c2. Street view of the N346 at hmp 6.1 (left) and hmp 10.0 (right) (googlemaps.com, 2014)
C. Case studies: implementation of the action plan in English
C 1 Case study I: Zuphenseweg/Lochemseweg Case area I (figure c1) is on the provincial road connecting the Dutch cities Zuphen and Lochem, further
referred to as the ‘N346’, from hectometer pole (hmp; distance marker pole located at each 10 meter
alongside the Dutch roads) 6.1 until hmp 10.0 and lies in province Gelderland. From May 2007 until
December 2014 there have been 39 collisions with roe deer from hmp 6.1 until 10.0 that have been
registered and of which the exact location (in hmp) was known (data obtained through G.J. Spek).
Location and image outline
On the ‘N346’ between hectometer pole 6.1 until 10.0 (figure c2), there are several areas where DVCs
occur several times a year. From May 2007 until December 2014 there have been 39 collisions with roe
deer from hmp 6.1 until 10.0 that have been registered and of which the exact location (in hmp) was
known (data obtained through G.J. Spek). Surrounding this road there are natural areas (e.g. forests)
and private areas (e.g. houses with land and a golf club centre), with some areas supporting a larger
population of roe deer than others. The private areas are in some cases surrounded with fences (e.g.
pasture with sheep, horses or other cattle). According to Brinkman, a local administrator, at the end of
these fenced pastures the number of DVCs seems relatively higher than on places without pastures. He
Figure c1. Overview case area I from hmp 6.1 until hmp 10.0 (red arrows) of the N346 (adjusted from googlemaps.com, 2014)

71
Figure c3. Areas surrounding the N346. 1) Area with lots of cover (rest area), but less nutrition for roe deer and low recreational activity. 2) Area where logging occurs. 3) Area where logging occurs, but with lots of nutrition for roe deer and high recreational activity. 4) Open area with lots of nutrition for roe deer, but not much cover (per. comm. J. Brinkman) all indications are in relation to each other.
states that, roe deer possibly refrain from going through pastures (with cattle) before crossing the road,
but rather follow the fence lines and cross at the ends. Pastures (with cattle) are, according to Brinkman,
observed as stressful for roe deer, and therefore roe deer tend to avoid these areas (pers. comm. J.
Brinkman).
The ‘N346’ is a two lane road with a speed limit of 80 km/h, but the actual driving speed is generally
higher (pers. Comm. J. Brinkman). Case area I is in total 3.9 kilometer in length (from hmp 6.1 until 10.0)
and the road and roadsides characteristics differ between the hmp 6.1 side and the hmp 10.0 side of
this case area. The hmp 6.1 side of case area I is characterized by on one side, the side with a cycling
path, a relatively wide roadside and on the other side a relatively small roadside. At the latter there is
high vegetation (e.g. grasses, herbs and trees) relative to the wide roadside with the cycling path. The
hmp 10.0 side of case area I has on both sides of the road a relatively large roadside (2-3 meters), with
on one side a parallel road. The parallel road and the N346 are separated by a line of trees and bushes.
Case area I is surrounded by forest and agricultural areas that are being used by roe deer as a foraging
area, rest area or both. Furthermore there are recreational activities and tree logging activities
throughout the area (figure c3). Some areas surrounding the road are suited for roe deer as a rest area,
because it has cover and low to no disturbance by humans (e.g. recreation). However, these areas often
offer a low amount of nutrition in comparison to neighbouring nature areas. Furthermore, there are
areas where tree logging activities are practiced. These activities will deter roe deer as these are
stressful for roe deer (e.g. because of the human activity and the use of large machines). However,
when logging activities have passed, roe deer will probably be attracted to these areas as the removal of
trees will result in fresh re-growth of vegetation. Furthermore, recreational activities could reduce roe
deer presence during the day, when recreation is high, but, during the night roe deer might migrate to
these areas. All of these situations (e.g. living area missing one of the habitat requirements of the roe
deer, recreation, tree logging) could lead to an increased roe deer activity on or nearby roads, possibly
increasing collisions with roe deer in this area.

72
Implementation of the concept action plan
Information has been collected via J. Brinkman after which the questionnaire has been filled in. The
information has been supplemented with the authors observations of the case area. The collected
information has been used to follow the flowchart. In table c1 main characteristics of case area I,
obtained through the questionnaire, are shown.
Concept advice for administrators of case area I
With the information gained through authors observation of case area I and the answers given by J.
Brinkman to the questionnaire, the flow chart has been used. Following the flow chart it seemed that
improvements in the basic management could help reduce the amount of DVCs. One of the aspects of
the basic management (see box 1) is the visibility of the driver and roe deer. Bushes and trees, especially
at the hmp 6.1 side of case area I, should be trimmed to get a wider roadside. Possibly some trees need
to be removed. Furthermore, the vegetation at the roadsides should be mowed frequently to improve
visibility and increase the effect of the roadside reflectors. In addition maintenance of what? (e.g.
cleaning) has to be done frequently to remove dirt and increase the effectiveness of the reflectors.
Before considering further mitigation measures first the basic management has to be implemented.
After basic management has been performed, but has not given the desired effect (decrease in DVCs),
there are other measures to consider. Case area I is 3.9 km in length and the causes of the DVCs might
not be the same over the whole tract. For example, at some places recreational pressure or logging
might be higher than other areas. In case of recreational pressure and/or logging placing temporary
(enhanced) warning signs or temporary active signs during times when most DVCs occur might be a
viable option. In case DVCs occur due to roe deer behaviour, such as migrating from forage to resting
area, enforcing (e.g. police controls, speed bumps) the current maximum driving speed (80 km/h) is the
first option, as currently the compliance to this speed is low. Secondly, when enforcing maximum speed
is not reducing the DVCs or is not an option (i.e. not preferred by parties involved), reducing maximum
vehicle speed might be a good option. However, in case of low public support, but with financial
resources and the area meets the requirements (see table 2) the wildlife warning system could be
Questions Answers
Average number of DVCs per year Unknown
Max. driving speed
- Compliance?
80 km/h
No
Roadside width 2-3 meters
Roadside management Vegetation is mowed regularly (unknown frequency)
Use of landscape by humans
- Direct; recreational - Indirect; agriculture
Yes, lots of recreation in forests and nearby areas (e.g. golf club centre)Yes, tree logging activities.
Visibility driver and roe deer Differs. Some parts good, others less.
Current mitigation measures - Dutch J27 sign - White roadside reflectors
Table c1. Summary answers questionnaire. Visibility has been classified as poor, average and good.

73
Figure c5. Street view case area II. a) On the left side the road has an the open (grass) area and b) on the right side the corn field and in the distance the (open grass) area (adjusted from googlemaps.com, 2014)
placed which will help reduce DVCs. If no financial resources are available, active warning signs should
be placed at known roe deer migration zones.
C 2 Case study II: Peeskesweg Case area II is on the ’Peeskesweg’ in Montferland, Gelderland (NL). This road is (partly) located in the
Bergherbos (forest) and has DVCs at some locations of the road. One specific DVC location on this road
has been taken as case area and will be discussed in more detail (figure c4; red arrow).
Location and image outline
Case area II (figure c5) is surrounded by forests, agricultural lands (i.e. with corn and grasses) and open
field. Agricultural lands are in some cases, like in the case of a corn field, able to provide cover for roe
deer. Increased individual activity of roe deer is associated with harvesting, as they have to find new
cover. In addition, the Bergherbos provides recreational opportunities, like walking routes (figure c6;
walking route near case area II) which is able to disturb the roe deer population as well and increase
individual roe deer activity. The Peeskesweg is used by both drivers and cyclists, and is designed for that
purpose (see figure 34; cycle lane in red). The permitted driving speed on the Peeskesweg is 60 km/h,
but the actual driving speed is generally higher (pers. comm. E. Grob).
Figure c4. Overview case area (adjusted from googlemaps.com, 2014)

74
The observation of the roe deer at case area II and its surroundings is high in relation to other sections
of the road. The surroundings of case area II differs from the rest of the Peeskesweg as there is an open
(grass) area at one side of the road (figure 34; left picture). As roe deer prefers eating young growth of
plants they are often observed foraging in the open grass area (pers. comm. E. Grob). In addition, this
part of the road is at a forest edge. As mentioned in chapter 2, edge areas are preferred by roe deer as a
living and foraging area.
The roadsides of the Peeskesweg are overgrown by a variation of grasses and herbs and around 1 meter
or less in width. The only (non-lethal) mitigation measures available at or nearby case area II is the
Dutch J27 sign, which is not present at the case area II, but at a different location of the road. There are
no roadside reflectors and there is no roadside lighting present at case area II. Between the cornfield
and the road there is a line of trees (figure 34; right picture). The visibility of roe deer for drivers, and
vice versa, is limited due to the forest cover on both sides of the road.
Execution of action plan
Information has been collected via E. Grob, a local nature administrator, and a study of Spek (2013)
about collisions in that area (including case area II) after which the questionnaire has been filled in The
information has been supplemented with the authors observations of the case area The collected
information has been used to follow the flowchart. In table c2 main characteristics of case area I,
obtained through the questionnaire, are shown.
Questions Answers
Average number of DVCs per year 4.9
Max. driving speed
- Compliance?
60 km/h
No, actual driving speed generally higher.
Roadside width 1-2 meter
Roadside management unknown
Figure c6. One of the walking routes through Bergherbos nearby case area II. In blue case area II (as shown in figure 33) (adjusted from Natuurmonumenten.nl, 2014).
Table c2. Summary answers questionnaire. Visibility has been classified as poor, average and good.

75
Concept advice for administrators of case area I
Information regarding case area II have been gained by authors observation and information from the
local nature administrator J. Brinkman and has been used to fill in the questionnaire. By means of the
questionnaire and the flow-chart it seems like that the basic management (see box 1) at this case area is
not properly executed. The visibility of both driver for roe deer and roe deer for oncoming drivers is
insufficient as it is classified as ‘poor’ (table 4). Drivers are unable to see far enough into the open area,
where roe deer could be present. Also, on the other side of the road (corn field side), the driver’s sight is
limited due to the presence of trees. These trees are close to the road (< 1m), making the roadside
width limited. As a result drivers will not have much time to respond to animal activity on or nearby the
road. Furthermore, no roadside reflectors are present at case area II. Therefore, firstly basic
management must be performed to reduce the number of collisions, before considering other
mitigation measures.
The visibility of case area II can be improved by removing some of the roadside trees at the edge of the
open area to allow the driver to observe the roe deer at an earlier stage, subsequently providing more
time for the driver to react (i.e. brake). Also the line of trees between the Peeskesweg and the cornfield
can be removed, or trimmed to improve the visibility. Furthermore, roadside reflectors could be placed
at this section of the road as this is supposed to slow down deer movement and reduce DVCs. In doing
so, roadside vegetation must be kept low (i.e. to prevent vegetation from blocking the light from the
cars towards the reflectors, and the reflected light of the reflector) and preferable with low nutritional
value to minimize roe deer foraging activity. In this way the effectiveness of roadside reflectors will be
higher and the activity of animals close to the road can be reduced. In addition, the roadside reflectors
need to be maintained (e.g. cleaned) regularly to remove dirt and in doing so increase effectiveness in
reducing DVCs.
After basic management has been performed, but has not given the desired effect (decrease in DVCs),
there are other measures to consider. Aside from basic management, there are also additional
measurements which could help reduce DVCs at this location. In using the flow chart the first
appropriate measurement is compliance of the maximum driving speed. In doing so, speed bumps can
be placed at case area II or police controls. In case of lack of support or financial resources, active
warning sign could be place on both sides of the case area. This should be an active sign activated by
drivers with a message in the line of “Watch out, wildlife migration zone!” This will make drivers more
alert at this location of the road.
Use of landscape by humans
- Direct; recreational - Indirect; agriculture
Yes, walking paths present.
Yes, agricultural fields, such as corn fields, present.
Visibility driver and roe deer Poor visibility
Current mitigation measures - Reduction max. speed to 60 km/h - Presence of roadside reflectors on the road, however not on
this specific section of the road. - Dutch J27 sign(s)

76
Figure c8. Street view of the Ruurloseweg at hmp 14 (left) and hmp 17 (right) (googlemaps.com, 2014)
C 3 Case study III: Ruurloseweg The third case area with DVCs is the Ruurloseweg (N319) in Vorden, Gelderland (NL), more specifically
from hectometer pole (hmp) 14 until hmp 17 (figure c7).
Location and image outline
Case area III is part of the ruurloseweg and is surrounded by forests, agricultural lands (e.g. crops and
grasses) and private areas with houses. As shown in figure 36, the forest cover in this area is relatively
high. However, the forest is fragmented (relative to case area II) with a variety of edge areas between
forests and open field as a result. Furthermore, alongside the Ruurloseweg there is a cycling path, which
is separated from the main road by a lane of grass (figure c8). The roadsides at the cycling path side of
the road are relatively large (estimated ±2 meter) and according to authors observation provides
sufficient visibility for driver and roe deer. The size of the roadsides at the other side of the road
(without cycling path), on the other hand, varies. At hmp 14 the roadsides at this side are relatively
small, but the vegetation is kept relatively short in relation to the roadsides at hmp 17. At hmp 17 the
roadside at the roadside without cycling paths are, just as hmp 14, small. The visibility of driver and roe
Figure c7. Overview case area II from hmp 14 until hmp 17 (red arrows) of the ‘N319’. There is a railroad present (blue arrow) as well as houses with private lands and several forests patches (adjusted from googlemaps.com, 2014)

77
deer at this side of the road is poor relative to the visibility of roadside with cycling path. Close to hmp
17 there is a railway line present which is able to cause disturbance leading to more individual roe deer
activity. Furthermore, because of the fragmented forest areas, the migration of the roe deer might be
high as disturbance or lack of nutrition or rest might make then migrate to other (forest) areas. In
addition some part of case area III, the hmp 14 side, is characterized by housings with pastures (incl.
cattle). Roe deer might be present at these urban areas during quiet times (e.g. night) foraging from
(garden) plants and leave this area when the overall activity increases again (e.g. daytime). The
migratory behaviour of the roe deer might lead to DVCs at case area III. Also the agricultural activities in
some areas nearby case area III might attract (e.g. rye (Secale cereale) during the winter) or deter roe
deer during harvesting from some areas.
At case area II there have been executed some mitigation measures. For example, the Dutch J27 sign is
present as well as roadside reflectors. If the roadside reflectors are properly maintained is unknown. In
autumn 2010 the number of roadside reflectors have been doubled to the situation that currently
roadside reflectors are now present at every 50 metres. Furthermore, culling numbers have been
increased in 2011 and aimed more at does than bucks. In the following period, from 2012 – 2014, there
have only been documented 12 collisions with roe deer, and the average number of collisions over the
previous years have been 6 per year. However, the increase in the number of collisions with roe deer
has not been scientifically proven to be correlated with the changes in culling and addition of roadside
reflectors.
Execution of action plan
Information has been collected via J. Brinkman and supplemented by authors observation (through
visitation case area) after which the questionnaire has been filled in. The collected information has been
used to follow the flowchart. In table c4 main characteristics of case area I are shown.
Questions Answers
Number of DVCs per year 8.4 c/y (2008 – September 2014)
Max. driving speed
- Compliance?
80 km/h
unknown
Roadside width >2 meter one side, <1 meter other side
Roadside management Vegetation is mowed
Use of landscape by humans
- Direct; recreational - Indirect; agriculture
Unknown Yes, agricultural fields, present.
Visibility driver and roe deer Good visibility at one side of the road, poor visibility on the other.
Past mitigation measures Yes.
- Presence of roadside reflectors on the road. - Dutch J27 sign(s) - Culling
Table c4. Summary answers questionnaire case area III. Visibility classified as poor, average and good.

78
Conclusions and advice
By means of own observation and information gained through a local nature manager (J. Brinkman) it
can be stated that the basic management at case area III can be improved. The visibility for driver and
roe deer is at one side (the side without cycling path) insufficient. This is due to the relatively small
roadside, because the trees are located close to the road, and the strong vegetation growth. Poor
visibility in combination with the relatively large maximum driving speed leads to DVCs as drivers will
not have much time to respond to roe deer presence on or nearby the road.
The visibility of case area III has to be improved by removing, or at least trimming, some trees at one of
the two roadsides (i.e. the roadside without cycling path should be trimmed). In doing so, both driver
and roe deer will see each other earlier and can react on each other’s presence. In addition, the
roadside vegetation should be mowed (more?) frequently in order to keep the vegetation short, which
will also improve the effectiveness of the roadside reflectors. The roadside reflectors that are currently
present should be maintained (e.g. cleaned) frequently, as this influences their effectiveness strongly.
Aside from improving visibility, there are some mitigation measurements that would be appropriate at
case area III and are able to reduce DVCs. By using the flow chart, the first measurement is a reduction
of maximum driving speed. As the driving speed is currently 80 km/h, this can be reduced to 60 km/h.
Moreover, as compliance of maximum driving speed is generally low in the absence of enforcement, this
reduced driving can be enforced by the addition of speed bumps or police controls. In case of low public
support, but with financial support, the wildlife signalling system could be a viable option. However, at
the hmp 14 side of case III, this would be inappropriate due to housings and private areas. Therefore the
wildlife signalling system should only be placed at the hmp 17 side of case area III. The wildlife signalling
system will channel roe deer individuals towards a safer crossing point at which active warning signs
warn drivers for oncoming roe deer about to cross the road. In doing so, drivers are obligated to reduce
their driving speed to 50 km/h. At the other side of case area III, the hmp 14 side, the driving speed
should preferably be reduced to 60 km/h with the addition of enforcement measures (e.g. Speed
bumps, police controls). Furthermore, permanent or temporary warning signs should be placed on that
part of the road. In doing so, drivers will possibly pay more attention to their surroundings and the
number of DVCs will be reduced.