RNAi screen identifies Jarid1b as a major regulator of mouse HSC activity
36
doi:10.1182/blood-2013-04-496281 Prepublished online June 18, 2013; Thompson and Guy Sauvageau Mayotte, Brian T. Wilhelm, Josette R. Landry, Stephen B. Ting, Jana Krosl, Keith Humphries, Alexander Sonia Cellot, Kristin J. Hope, Jalila Chagraoui, Martin Sauvageau, Éric Deneault, Tara MacRae, Nadine RNAi screen identifies Jarid1b as a major regulator of mouse HSC activity http://bloodjournal.hematologylibrary.org/site/misc/rights.xhtml#repub_requests Information about reproducing this article in parts or in its entirety may be found online at: http://bloodjournal.hematologylibrary.org/site/misc/rights.xhtml#reprints Information about ordering reprints may be found online at: http://bloodjournal.hematologylibrary.org/site/subscriptions/index.xhtml Information about subscriptions and ASH membership may be found online at: digital object identifier (DOIs) and date of initial publication. the indexed by PubMed from initial publication. Citations to Advance online articles must include final publication). Advance online articles are citable and establish publication priority; they are appeared in the paper journal (edited, typeset versions may be posted when available prior to Advance online articles have been peer reviewed and accepted for publication but have not yet Copyright 2011 by The American Society of Hematology; all rights reserved. 20036. the American Society of Hematology, 2021 L St, NW, Suite 900, Washington DC Blood (print ISSN 0006-4971, online ISSN 1528-0020), is published weekly by For personal use only. at Harvard Libraries on June 22, 2013. bloodjournal.hematologylibrary.org From
-
Upload
independent -
Category
Documents
-
view
6 -
download
0
Transcript of RNAi screen identifies Jarid1b as a major regulator of mouse HSC activity

doi:10.1182/blood-2013-04-496281Prepublished online June 18, 2013;
Thompson and Guy SauvageauMayotte, Brian T. Wilhelm, Josette R. Landry, Stephen B. Ting, Jana Krosl, Keith Humphries, Alexander Sonia Cellot, Kristin J. Hope, Jalila Chagraoui, Martin Sauvageau, Éric Deneault, Tara MacRae, Nadine RNAi screen identifies Jarid1b as a major regulator of mouse HSC activity
http://bloodjournal.hematologylibrary.org/site/misc/rights.xhtml#repub_requestsInformation about reproducing this article in parts or in its entirety may be found online at:
http://bloodjournal.hematologylibrary.org/site/misc/rights.xhtml#reprintsInformation about ordering reprints may be found online at:
http://bloodjournal.hematologylibrary.org/site/subscriptions/index.xhtmlInformation about subscriptions and ASH membership may be found online at:
digital object identifier (DOIs) and date of initial publication. theindexed by PubMed from initial publication. Citations to Advance online articles must include
final publication). Advance online articles are citable and establish publication priority; they areappeared in the paper journal (edited, typeset versions may be posted when available prior to Advance online articles have been peer reviewed and accepted for publication but have not yet
Copyright 2011 by The American Society of Hematology; all rights reserved.20036.the American Society of Hematology, 2021 L St, NW, Suite 900, Washington DC Blood (print ISSN 0006-4971, online ISSN 1528-0020), is published weekly by
For personal use only. at Harvard Libraries on June 22, 2013. bloodjournal.hematologylibrary.orgFrom

1
RNAi screen identifies Jarid1b as a major regulator of mouse HSC activity
Sonia Cellot1,2,3, Kristin J. Hope1, Jalila Chagraoui1, Martin Sauvageau1, Éric Deneault1, Tara
MacRae1, Nadine Mayotte1, Brian T. Wilhelm1, Josette R. Landry1, Stephen B. Ting1,8, Jana
Krosl1, Keith Humphries4, Alexander Thompson5 and Guy Sauvageau1,2,6,7*
1Institute for Research in Immunology and Cancer (IRIC), Université de Montreal, Montreal,
Quebec, Canada H2W 1R7; 2Faculty of Medicine, Université de Montreal, H3C 3J7;
3Division of Hematology, Ste-Justine Hospital, Montreal, H3T 1C5, 4Terry Fox Laboratory,
British Columbia Cancer Agency, and Department of Medicine, University of British
Columbia, Vancouver, BC, 5Centre for Cancer Research and Cell Biology, Queen’s
University Belfast, Northern Ireland, BT9 7BL 6Division of Hematology, Maisonneuve-
Rosemont Hospital, Montreal, H1T 2M2; 7Leukemia Cell Bank of Quebec, Maisonneuve-
Rosemont Hospital, Montreal, H1T 2M2; 8Monash University, Melbourne, Australia.
Running title: Jarid1b negatively influences self-renewal
*Correspondence:
Guy Sauvageau
Université de Montreal
C.P.6128, succursale Centre-Ville
Montreal, Quebec, Canada H3C 3J7
E-mail : [email protected]
Blood First Edition Paper, prepublished online June 18, 2013; DOI 10.1182/blood-2013-04-496281
Copyright © 2013 American Society of Hematology
For personal use only. at Harvard Libraries on June 22, 2013. bloodjournal.hematologylibrary.orgFrom

2
Key Point: Jarid1b knockdown promotes enhanced HSC activity
ABSTRACT
Histone methylation is a dynamic and reversible process proposed to directly impact on stem
cell fate. The Jumonji (JmjC) domain-containing family of demethylases comprises 27
members which target mono-, di- and tri-methylated lysine residues of histone (or non-
histone) proteins. To evaluate their role in regulation of hematopoietic stem cell (HSC)
behaviour we performed an in vivo RNAi-based functional screen and demonstrated that
Jarid1b and Jhdm1f play opposing roles in regulation of HSC activity. Decrease in Jarid1b
levels correlated with an in vitro expansion of HSCs with preserved long term in vivo
lympho-myeloid differentiation potential. Through RNA sequencing analysis Jarid1b
knockdown was associated with increased expression levels of several HSC regulators
(Hoxa7, Hoxa9, Hoxa10, Hes1, Gata2) and reduced levels of differentiation associated genes.
shRNA against Jhdmlf, in contrast, impaired hematopoietic reconstitution of bone marrow
cells. Together, our studies identified Jarid1b as a negative, and Jhdmlf as a positive regulator
of HSC activity.
For personal use only. at Harvard Libraries on June 22, 2013. bloodjournal.hematologylibrary.orgFrom

3
INTRODUCTION
Multipotent hematopoietic stem cells (HSCs) ensure sustained production of lineage
committed blood cells throughout life. The pool of long-lived HSCs is preserved due to their
inherent capacity to undergo self-renewal divisions. Cell fate decisions result from integrated
influences of various nuclear factors, including chromatin modifiers that regulate access of
transcriptional machinery to specified genomic loci. Chromatin, consisting of intertwined
DNA, histone and non-histone proteins, can be covalently modified by epigenetic effectors.
DNA methyltransferases (DNMTs) modify carbon-5 of cytosine bases within cytosine-
guanosine dinucleotides (CpG) frequently located proximal to or in promoters1. In
mammalian cells, the mechanism and effectors of DNA demethylation are less well
understood, but recent reports suggest this process likely requires the activity of the TET
enzyme family2,3. Post-translational modifications of histones include methylation,
acetylation, phosphorylation, ubiquitination, sumoylation or ADP-ribosylation (reviewed in 4)
and introduce changes in local chromatin topography that subsequently alter gene expression
patterns in developmental stage and cell context-specific manners.
Methylation of histone residues represents a classical paradigm linking epigenetics to cell fate
and identity, best illustrated by the antagonistic forces of Polycomb (PcG) and Trithorax
(Trx) group protein complexes on regulation of key developmental loci such as Hox gene
clusters (reviewed in5). In general, PcG protein repressor complexes PRC2 and PRC1 are
associated with gene silencing, and Trx complexes (compass-like or MLL, Mixed Lineage
Leukemia, complexes) with gene activation. The histone methyltransferase (HMT) Enhancer
of Zeste Homolog 2 (EZH2) of the PRC2 complex catalyzes tri-methylation of lysine 27 on
histone H3 (H3K27me3). This covalent mark serves as a docking site for the PRC1 complex
which mono-ubiquitinates lysine 119 of histone H2A (H2AK119Ub) resulting in gene
silencing. MLL complexes counteract these epigenetic marks via tri-methylation of lysine 4
For personal use only. at Harvard Libraries on June 22, 2013. bloodjournal.hematologylibrary.orgFrom

4
on histone H3 (H3K4me3) at transcription start sites, a mark associated with active gene
transcription6 and recruitment of H3K27me3 demethylases UTX and JMJD37-9. Additional
Trx-mediated modifications such as acetylation of H3K27 (H3K27Ac) and di-methylation of
H3K36 (H3K36me2) further oppose the PcG mediated gene repression.
Histone methylation status on lysine (K) or arginine (R) residues is reported to evolve
through highly dynamic and finely regulated processes (reviewed in10). Histone demethylases
(HDMs) integrate into multi-unit complexes resulting in removal of methylation marks by
amine oxidation, deimination11 or hydroxylation. The lysine specific demethylase 1
(LSD1/KDM1A)-related HDM can demethylate mono- and di-methylated lysine residues.
Jumonji C (JmjC) domain-containing HDMs (n=27) are capable of removing all three lysine
methylation states by an oxidative reaction requiring α-ketoglutarate and iron (Fe2+) as
cofactors. Like the LSD1 family, JmjC/JARID1 proteins act as components of multi-subunit
complexes, with non-catalytic domains proposed to mediate protein-protein interactions
involved in regulation of demethylase activity and/or target specificity (reviewed in12). In
addition, JMJD6 demethylates arginine residues13, and bacterial Jumonji domain-containing
AlkB protein is involved in DNA demethylation and repair14,15 suggesting that JmjC
substrates include non-histone targets.
JmjC protein activity results in dynamic chromatin landscape changes which enable
expression of distinct gene subsets required for self-renewal 16, proliferation 17,
differentiation18-20, cellular senescence 21 and cancer development 22-24. In light of these
findings, an established in vivo RNAi based screening strategy 25 was undertaken, in a
targeted way, to assess the impact of JmjC gene down-regulation on adult primary HSC cell
fate. We identify Jarid1b as a negative regulator of HSC self-renewal and progenitor cell
activity, while Jhdm1f positively influences blood reconstitution. Results from these
experiments and possible downstream functional networks involved are presented.
For personal use only. at Harvard Libraries on June 22, 2013. bloodjournal.hematologylibrary.orgFrom

5
METHODS
Construction of shRNA retroviral vectors
For each gene target, 3-5 shRNAs were designed as single stranded oligonucleotides also
incorporating miR-30 flanking arms using the RNAi Central shRNA design tool at
http://cancan.cshl.edu/RNAi_central/main2.cgi and our previously established
methodology25.
Mice
C57BL/6J (CD45.2+) transplant recipients and C57BL/6Ly-Pep3b (CD45.1+) congenic bone
marrow donor mice were bred and manipulated in a specific pathogen-free animal facility.
Experimental procedures were revised and approved by the University of Montreal animal
ethics committee (Comité de Déontologie de l’Expérimentation sur les Animaux de
l’Université de Montréal).
Flow cytometry
Negative selection of hematopoietic lineage marker (GR-1+, B220+, Ter119+) expressing cells
(Lin-) was performed as described25. Lin- bone marrow fraction was subsequently stained
with PE-Cy7-conjugated anti-cKit, PE-Cy5-conjugated anti-Sca1 (eBioscience), PE-
conjugated anti-CD150 (BioLegend) and FITC-conjugated anti-CD48 (BD Biosciences)
antibodies, followed by isolation of HSC-enriched PE-Cy5-Sca1+/PE-Cy7-cKit+/PE-
CD150+/FITC-CD48-/APC-Lin- cell population. Day E14.5d.p.c. fetal liver derived HSCs
were purified from the Lin- cell populations by isolating the fraction of PE-Cy5-Sca1+/PE-
CD11b+/PE-Cy7-CD150+/FITC-CD48-/APC-Lin- cells. Cells were sorted using the
FACSAria cell sorter (Becton-Dickinson, San Jose, CA, USA. The frequency of LT-HSC in
the sorted populations (Table S1), the proportions of transduced (GFP+) transplant-derived
For personal use only. at Harvard Libraries on June 22, 2013. bloodjournal.hematologylibrary.orgFrom

6
(CD45.1+) peripheral blood leukocytes 26 and contribution of these cells to reconstitution of
hematopoietic lineages 25,26 were determined as described.
HSC/progenitor cell culture, retroviral infection and transplantation
Suspension cell cultures of HSC/progenitor cell enriched populations, generation of
retrovirus-producing GP+E-86 cells and infection of the sorted HSC/progenitor cells were
performed as described26. For validation assays, 1500 CD150+CD48- Lin- bone marrow
derived cells were introduced in co-culture with retroviral producers in 96-well plates26. After
5-day incubation (day 0), the total cell content of each well was harvested, and partitioned for
transplantation and cell culture as previously reported25. Briefly, 1/8 of cell suspension was
transplanted into sublethally irradiated congenic recipients (n=2 for each shRNA species).
The remaining cells were cultured for additional 7 days and proportions corresponding to 1/8
of the cell input transplanted in 3 recipient mice (day 7). To compensate for the shJhdm1f-
associated loss of reconstituting activity, ¼ of day 0 cell suspensions was transplanted in each
of the 3 recipients, and no continuing suspension cultures were initiated.
Clonogenic progenitor cell assays
The total numbers and distributions of myeloid clonogenic progenitors in various cell
populations recovered from the 5-day co-culture with retroviral producers (day 0), or from
the subsequent suspension cultures (day 5-7) were determined as described25.
Microphotograpy
Images of Wright-stained cytospin cell preparations were acquired using a Leica DMIRB
microscope with an HCXPL FluotarL 40×/0.6 numeric aperture objective (Leica) and a
Retiga EX-i camera (Q-Imaging). Images were transformed directly into TIFF files using
For personal use only. at Harvard Libraries on June 22, 2013. bloodjournal.hematologylibrary.orgFrom

7
Adobe Photoshop Version 6.0 (Adobe Systems). In situ images of colonies in semisolid
media were acquired using the same set up, but using the HC Pl Fluotar 10X/0.30, Ph 1 lens.
Competitive repopulating unit (CRU) assay
These assays were performed as previously described25,26.
Q-RT-PCR assessment of JmjC gene expression in HSC enriched populations
Gene expression was assessed by Q-RT-PCR using the Roche LightCycler® 480 System
(Roche, Basel, Switzerland). Reactions were performed in 384-well plates for 50
amplification cycles (95°C 10 s; 60°C 10 s; 72°C 10 s). Reference Taqman® gene assay
(Hprt) was purchased from Applied Biosystems. Primer sequences in Table S2, Delta Ct
values in Table S3.
ChIP-chip analysis
Two-colour hybridizations on NimbleGen MM8 Deluxe Promoter HX1 arrays were carried
out using 34μg of Cy5-labeled input and 34μg of Cy3-labeled test (shLuc or shJarid1b) ChIP
DNA using the NimbleGen hybridization kit as recommended by the manufacturer. Arrays
were scanned at 5 μm resolution using a GenePix4000B scanner (Molecular Devices). Data
extraction and peak finding analysis was done using NimbleScan 2.5 and visualized in the
UCSC genome browser.
RNA sequencing analysis
RNA sequencing was performed as previously described27. RNA was extracted from 1x 10⁶
cells for each test (sh3Jarid1b-GFP) and control (shLuc-GFP) culture condition. Cultures
were initiated with 24,000 CD150+CD48-Lin- bone marrow cells and expanded for 4 days
For personal use only. at Harvard Libraries on June 22, 2013. bloodjournal.hematologylibrary.orgFrom

8
following infection with the respective constructs. Cells from 2 independent cultures were
isolated for each condition, and only cell populations with >90% gene transfer were selected.
shRNA-mediated knockdown in NUP98-Hoxa10ΔHD-transduced HSCs
1500 purified CD150+CD48-Lin- bone marrow cells were co-cultured with irradiated (40 Gy)
GP+E86 cells producing MSCV-NUP98-HOXA10HD-IRES-Puromycin (NA10HD) virus.
After 4-day co-culture, cells were collected and cultured for 6 days in the presence of 10
μg/mL of Puromycin, harvested and stained with APC/Cy7-conjugated anti-CD43
(BioLegend), APC-conjugated anti-Sca1, PE/Cy7-conjugated anti-Gr1 and PE/Cy5-
conjugated anti-F4/80 (eBioscience). The sorted NA10-transduced Sca1+CD43+Gr1-F4/80-
cell subpopulation was co-cultured with GP+E86 cells producing shLuc, sh3Jarid1b or
sh1Moz recombinant retroviruses. After 4 days, the nonadherent cells were recovered and
expanded for additional 6 days. To assess the extent of differentiation in these cultures, cells
were stained with PE/Cy7-conjugated anti-Gr1 and PE/Cy5-conjugated anti F4/80-PE/Cy5
antibodies. Data were acquired using BD LSRII cytometer and FACSDiva Version 4.1
software (BD Biosciences PharMingen), and analyzed using the FlowJo Version 7.6.4
software (TreeStar).
Statistical Analysis
Statistical analysis was conducted using Prism (Graphpad Software version 5) or SPSS. The
two-tailed Student-t-test was performed throughout unless otherwise stated. Statistical
significance was calculated at a 95% confidence level.
For personal use only. at Harvard Libraries on June 22, 2013. bloodjournal.hematologylibrary.orgFrom

9
RESULTS
JmjC gene expression in HSC-enriched populations
Expression profiles were obtained for all JmjC genes in sorted mouse bone marrow and fetal
liver cell populations comprising ≥30% of functionally defined long-term-repopulating LTR-
HSCs, as evaluated by competitive repopulation unit (CRU) assays 28 (Table S1). Results
showed that all JmjC gene transcripts, except Hairless, were detected at relatively high levels
(Fig. 1A). The histone acetyl-transferase MOZ (MYST3), reported as essential for HSC
expansion29,30 was also highly expressed in this fraction and chosen as a control for the
functional screen. Transcript levels of four JmjC genes, namely Jarid1b, Jmjd2d, Fbxl10 and
Jmjd1c, were notably increased in the LTR-HSC-enriched fractions relative to total bone
marrow cells (Fig. 1B). In contrast, Jhdm1d, Hspbap1 and Hairless transcript levels were
notably higher in more mature cells. Genes expressed higher in the LTR-HSC enriched
population e.g. Jarid1b, Jmjd2d, Fbxl10 and Jmjd1c were assigned a HSC expression score
of one, while genes that were higher expressed in mature cells were attributed negative scores
(Fig. 1B, lower panel). Increased expression in LTR-HSCs implied a HSC biological role,
and these candidates were prioritized in the functional studies.
Functional in vivo RNAi-based primary screen
The shRNA based screen tested 23 of the 27 known JmjC mouse genes (Fig. 1C) for their
potential functional role in HSC biology. shRNA Luciferase (shLuc) was used as a negative
control, while shRNA Moz (shMoz) and Nup98Hoxa10-homeodomain (NA10hd)
overexpression were used as controls for the loss and gain of HSC activity, respectively (data
not shown for NA10hd, and31,32). HDM-directed shRNA sequences (n=112, Table S5) were
subcloned into a LMP retroviral vector and assessed for their ability to modulate
HSC/progenitor activity in vivo as previously reported 25 (summarized in Fig. 1D). The
For personal use only. at Harvard Libraries on June 22, 2013. bloodjournal.hematologylibrary.orgFrom

10
biological impact of each shRNA was evaluated by serial sampling of peripheral blood from
transplanted mice at early (3-4 weeks) and late (16-20 weeks) time points.
To prioritize candidates for validation and downstream functional studies, a “selection
threshold scoring system (STS),” weighted for HSC-enriched genes, was established (Fig. 2A
and Table S3). HSC activity was determined by the long-term blood engraftment potential of
the transduced donor cells (CD45.1+GFP+ cells) based on their contribution to blood
leucocytes, calculated as a proportion of the total donor (CD45.1+) population, which
comprises both transduced and non-transduced cells (%blood GFP= CD45.1+GFP+ cells/total
CD45.1+ cells). The percentage of blood reconstitution of the transduced cells was then
compared to the respective gene transfer (GT) level on the day of transplantation (day0), and
this ratio (Fig.2B, y-axis) used to document an increased (ratio>0.8072) or decreased
(ratio<0.2751) contribution to the donor graft (HSC activity score). This ratio was used as GT
levels for the hairpins presented in Fig.2B ranged from 20-80%, with an overall average of
49% as previously reported25 (see also Table S4 for complete data), and thus transduced cell
expansion or attrition could be measured. Overall, six hits were identified: Jmjd2a, Jhdm1f
and Jmjd1b (STS of 2); Jarid1a, Jarid1b and Hif1an (STS of 3). Four of these genes; namely
Jarid1a, Jarid1b, Jmjd2a, Hif1an, were identified as potential negative regulators of HSC
activity (Fig. 2B, green shaded areas), while Jhdm1f and Jmjd1b (Fig. 2B, red area), as
putative positive regulators.
JmjC HDM knockdown validation experiments
Hit validation was further restricted to proven JmjC domain containing histone demethylases
(HIF1AN demethylase excluded as it targets HIF1α) and for technical considerations
validation of potential positive regulators was limited to Jhdm1f. The increased hematopoietic
reconstitution levels observed with shRNA mediated knockdown of the three remaining hits;
For personal use only. at Harvard Libraries on June 22, 2013. bloodjournal.hematologylibrary.orgFrom

11
namely Jarid1a, Jarid1b, Jmjd2a (Fig.2B) prompted us to examine how the transduced HSCs
would behave in vitro, where control HSCs normally exhaust rapidly26. Validation
experiments were performed (Fig. 3A) and a gain-of-function phenotype for Jarid1a or
Jmjd2a could not be confirmed upon shRNA transduction and prolonged in vitro culture
(data not shown). Conversely, reducing Jarid1b levels in HSC populations by multiple
shRNA moieties (shJarid1b 2, 3 and 4) clearly conferred an in vivo competitive advantage to
freshly transduced cells compared to shLuc controls (Fig. 3B, left panel: n=3 different
shRNAs to Jarid1b, day 0 transplanted cells). As higher GT rates were achieved in the
validation experiments (>80%), blood reconstitution levels were measured as CD45.1+GFP+
cell percentages. The positive impact of shJarid1b on HSC activity was even more noticeable
for cells transplanted after one week of in vitro culture (Fig. 3B, middle and right panels,
cells transplanted after 7-day culture) to better detect HSC gain-of-function activity, as our
previous studies demonstrated 26. Proportions of shJarid1b-transduced cells (GFP+) in
peripheral blood remained well above those determined for shLuc controls for up to 10
months (Fig. 3B). Knockdown of shJarid1b was determined for freshly transduced cells, and
a >40% decrease in expression observed for shJarid1b 2, 3 and 4 (Fig. 3C). Decreased HSC
activity relative to control cells was confirmed with multiple shRNA constructs against
Jhdm1f (n=5), Fig. 3D,E. All five shRNAs against Jhdm1f had knockdown efficiencies >40%
(Fig. 3F). Validation experiments thus uncovered one negative (Jarid1b) and one positive
(Jhdm1f) regulator of HSC activity. Further in vitro studies of shJhdm1f-transduced cells
detected no significant change in proliferation or clonogenic progenitor activity of nucleated
cells (Figure S1) indicating a distinct role for Jhdm1f in HSC repopulation ability. The
striking impact of Jarid1b knockdown on blood reconstitution oriented research towards
Jarid1b function.
For personal use only. at Harvard Libraries on June 22, 2013. bloodjournal.hematologylibrary.orgFrom

12
Jarid1b knockdown decreases hematopoietic cell differentiation in vitro
Sh2- or sh3Jarid1b-transduced primitive hematopoietic cell populations had a ~1.5-2-fold
proliferative advantage in vitro compared to shLuc controls, while Moz knockdown decreased
expansion of the transduced cells (Fig. 4A, left panel). The expanded shJarid1b-transduced
populations comprised high proportions of morphologically immature cells (Fig. 4A, right
panel), and lower percentages of differentiated (Gr1+) myeloid cells than shLuc controls (Fig.
4B). Moreover, fractions of primitive (Gr1-) shJarid1b-transduced cells were comparable to
that determined in response to NA10hd, a well characterized enhancer of in vitro
HSC/progenitor cell expansion, while a marked elevation in differentiation was observed for
shMoz loss-of-function control (Fig. 4B). During the 7-day culture period, the numbers of
shJarid1b-transduced clonogenic progenitor cells (colony forming cell, CFC) increased ~3-
fold compared to shLuc and shMoz controls (Fig.4C). Jarid1b knockdown enhanced the
proliferative capacity of individual CFCs compared to shMoz controls (Fig.4D), and
promoted expansion of the highly proliferative granulocyte-macrophage progenitors (Fig.
4E). Although the total CFC contents of shLuc and shMoz control cultures were comparable
(Fig. 4C), and both cell populations differentiated into granulocytes and macrophages (Fig.
4E), the antiproliferative effect of Moz knockdown was evident from the decrease in sizes of
shMoz clones compared to shLuc controls (data not shown).
Q-RT-PCR assays involving selected candidates revealed a marked downregulation of
differentiation associated genes Hairless (Hr) and Pu.1 in shJarid1b-cells compared to shMoz
control (Fig. 4F). No major changes in expression levels of genes regulating senescence
(Cdkn2a (p16) and Cdkn2d (p19)) or apoptosis (Bcl2, Mcl1) were detected in shJarid1b-cells,
while modest increases in c-Myc and decreases in Mad1 levels resembled those determined
for Hoxb4-overexpressing cells (data not shown, and33). Moz knockdown was, however,
clearly associated with upregulation of Hr, Cdkn2a and Cdkn2d expression. This suggests
For personal use only. at Harvard Libraries on June 22, 2013. bloodjournal.hematologylibrary.orgFrom

13
that Jarid1b knockdown promotes in vitro HSC/progenitor expansion by suppressing
differentiation, while cells remained permissive to cell cycle re-entry. In contrast, reduced
Moz expression enforced commitment to differentiation and senescence cell fate pathways.
Jarid1b negatively regulates HSC self-renewal
Transplant recipients of shJarid1b-cells had normal numbers of total bone marrow
mononuclear cells (MNC), and no splenomegaly was observed (Fig. 5A, 1st and 2nd panels).
Contributions of the transduced (GFP+) shLuc- and shJarid1b-cells to myeloid progenitor cell
compartments were comparable (Fig. 5A, 3rd panel), but an ~8-10-fold increase in the
frequencies of shJarid1b-multilineage progenitors (Colony Forming Unit-Granulocyte,
Erythroid, Macrophage, Megakaryocyte, CFU-GEMM) compared to controls was observed
(Fig. 5A, 4th panel). This difference in immature progenitor cell content remained benign,
and no hematological abnormalities could be detected during the 12 month observation
period. Moreover, transplanted shJarid1b-cells generated normal proportions of myeloid
(Mac1+/CD11b+), B-lymphoid (B220+/CD45R+) and T-lymphoid (CD4+, CD8+) progeny
(Fig. 5B), suggesting that differentiation ability in vivo was not affected.
To examine if Jarid1b knockdown favoured self-renewal divisions, leading to expansion of
HSC populations, equal numbers of HSC-enriched (CD150+CD48-Lin-) cell populations were
co-cultured with shLuc or shJarid1b retroviral producers. HSC frequencies were determined
in samples immediately after cell sorting and after a cumulative 12-day ex vivo culture period
(Fig. 5C, top panel), using the CRU assay. CRU numbers in cell populations recovered from
shLuc cultures (Fig. 5C, green bar) were comparable to those determined for the input cell
population (Fig. 5C, red bar) suggesting no major loss or gain of HSCs during the in vitro
incubation. In contrast, the CRU numbers in shJarid1b cultures increased 8- to 20-fold above
shLuc control samples, or sorted cells prior to shJarid1b infection (Fig. 5C, blue bars),
For personal use only. at Harvard Libraries on June 22, 2013. bloodjournal.hematologylibrary.orgFrom

14
suggesting that Jarid1b knockdown promoted the in vitro maintenance/expansion of long
term-repopulating HSCs. Southern blot analyses of shJarid1b revealed a common proviral
integration pattern between bone marrow (mostly myeloid, erythroid and B-), thymus (mostly
T-) and spleen (B- and T-) cells of individual recipients (Fig. 5D) demonstrating
multipotency and oligoclonal hematopoietic reconstitution of the expanded HSCs.
Impact of Jarid1b knockdown on gene expression
To examine downstream effects of Jarid1b knockdown, results of transcriptome next
generation sequencing (RNAseq), Q-RT-PCR and ChIP-Chip assays were analyzed and
compared to controls. The similarity in HSC expansion observed between Jarid1b
knockdown and Hox gene overexpression 31,33 and the recent report that JmjC members
KDM6A (UTX) and KDM6B (JMJD3) are positive regulators of Hox gene expression 21
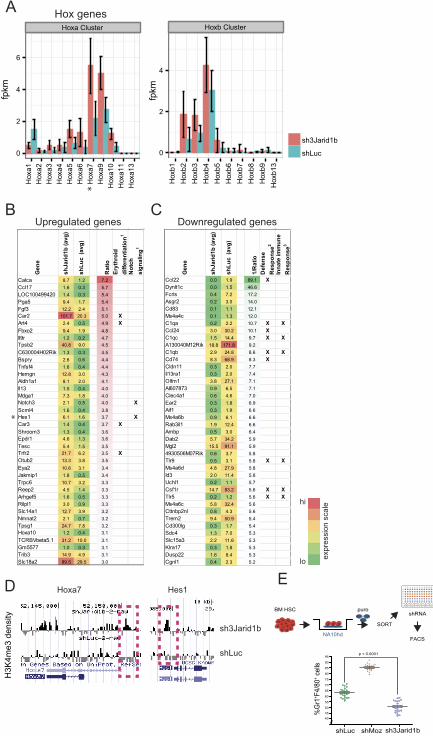
prompted initial focus on the Hox family of transcription factors (Fig. 6A). Both RNAseq
and Q-RT-PCR assays revealed that Jarid1b knockdown induced a 2 to 5-fold increase in 5’
Hoxa gene (Hoxa5 to Hoxa11) expression levels compared to controls (Fig. 6A and Figure
S2). RNAseq analysis identified upregulation of genes associated with key pathways such as
erythroid differentiation, notch signalling and stem/progenitor cell function (Fig.6B and
Figure S3), and downregulation of others involved in immune responses and differentiation
(Fig. 6C and Figure S4). Several of the candidate downstream genes, including Hoxa7, Hes1,
Hoxa10 and Hoxb2, were identified as potential direct epigenetic targets by enrichment of the
associated H3K4me3 mark in 5’ loci as determined by ChIP-Chip assays (Fig. 6D and Figure
S5). Supporting this possibility, non-regulated genes e.g. Hoxa2 demonstrated no proximal
promoter H3K4me3 enrichment following Jarid1b knockdown (Figure S5). Jarid1b
knockdown also correlated with downregulation of the previously reported putative JARID1
target Cav134 (Table S7).
For personal use only. at Harvard Libraries on June 22, 2013. bloodjournal.hematologylibrary.orgFrom

15
Study of epistasis between Jarid1b and Nup98Hoxa10-homeodomain
To directly examine potential gene interaction of Jarid1b and Hoxa overexpression,
HSC/progenitor cell populations were first transduced with NUP98Hoxa10-homeodomain
(NA10hd) and the HSC-enriched populations (Sca1+CD43+ Gr1-F4/80-; Keith Humphries,
personal communication) subsequently transduced with shJarid1b, shMoz, or control shLuc.
The proportions of mature GR1+ F4/80+ cell fractions in each condition were evaluated as a
measure of differentiation (Fig. 6E, upper panel). Results demonstrate that the combined
effects of NA10hd overexpression and Jarid1b knockdown were additive, resulting in
significant suppression of in vitro differentiation (p<0.0001; Student t-test) below the levels
determined for control NA10hd+shLuc-cells (Fig. 6E, lower panel). In contrast, shMoz
targeted knockdown overrode the maturation arrest imposed by NA10hd overexpression, and
enforced differentiation above the levels determined for controls (Fig. 6E, lower panel).
Together, the data presented support a role for Jarid1b in regulating key loci implicated in
HSC cell fate and identify Jarid1b as a negative regulator of in vitro HSC expansion.
DISCUSSION
Following the established pipeline strategy from HSC isolation and infection to in vivo
functional assessment of hematopoietic reconstitution, the presented RNAi screen highlighted
Jarid1b as a negative and Jhmd1f as a positive modulator of HSC activity. Due to defined
inclusion criteria other HDMs should not be excluded as potential HSC modifiers. Akin to
Hox gene overexpression, differentiation was restrained in shJarid1b-transduced HSC
cultures as evidenced by more primitive cell morphology, reduced granulocytic maturation,
and greater expansion of clonogenic progenitors relative to controls. After transplantation, ex
vivo expanded HSCs were able to resume normal lympho-myeloid differentiation in recipient
For personal use only. at Harvard Libraries on June 22, 2013. bloodjournal.hematologylibrary.orgFrom

16
mice, in the absence of lineage skewing or hematological abnormalities, for up to one year.
Logarithmic ex vivo expansion of shJarid1b-transduced HSCs was demonstrated by CRU
assays indicating that Jarid1b modulation influences stem cell fate decisions. Oligoclonal
origin of the repopulating HSC pool and inherent multipotency of shJarid1b-transduced
parental stem cells was shown by proviral insertion patterns in long-term recipient mice.
Mechanistically, the competitive advantage conferred to shJarid1b-transduced HSCs could
be attributed in part to the selective up-regulation of 5’ Hoxa genes. Segmental transcription
of this chromosomal region is well documented 35 and particularly targeted by epigenetic
regulators such as MLL or its derived fusion oncoproteins both in normal and leukemic stem
cells 36. Interestingly, the 5’ Hoxa cluster is also targeted by the fusion oncoprotein NUP98-
JARID1A in a mouse model of myeloid leukemia37.
In agreement with the proposed substrate specificity of JARID1B for H3K4me334, we noted
enrichment for this epigenetic mark on 5’ Hoxa genes indicating that Jarid1b contributes to
the negative regulation of Hoxa gene expression which when relieved following knockdown,
leads in part to increased HSC activity. Enhancement of NA10hd-induced maturation arrest
in the presence of reduced Jarid1b levels argues for regulation of additional cell fate
determinants to account for the HSC phenotype seen. Comprehensive transcriptome analysis
by RNAseq identified additional downstream genes, some of which are associated with key
hematopoietic or stem cell associated pathways. Recent reports further support a role for
Jarid1b in transcriptional regulation of cell fate associated genes. PU.1 induction of
transcription factor EGR2 was reported to recruit Jarid1b to the miR-17-92 promoter site,
resulting in H3H4 demethylation and transcriptional silencing of the cluster required for
monocyte maturation in a mouse model 19. Schmitz et al., recently reported that Jarid1b
depletion prevents neuronal differentiation of ESCs by indirectly preventing H3K4
For personal use only. at Harvard Libraries on June 22, 2013. bloodjournal.hematologylibrary.orgFrom

17
demethylation and silencing of pluripotency and germ cell-associated gene loci 20. Similarly,
H3K4me2/1 monoamine oxidase LSD1 was also deemed essential for proper hematopoietic
progenitor differentiation38.
We demonstrate that transcript levels of Jarid1b are increased in HSCs suggesting either a
role in preventing unrestricted self-renewal divisions or in enabling downregulation of cell
fate associated genes upon lineage commitment. Interestingly, 1q32 anomalies, which include
Jarid1b, are common genetic mutations found in cells of chronic myeloid leukemia (CML)
patients during disease progression characterized by a block in myeloid differentiation 39,40.
This observation supports the hypothesis that low Jarid1b levels maintain stem cell fate,
which combined with BCR-ABL induced proliferation, could result in development of overt
leukemia. In our studies, transplant recipients of shJarid1b-transduced cells never developed
leukemia. However, all Jarid1b hairpins tested achieved similar gene knockdown (≤50%),
and more drastic outcomes following complete Jarid1b depletion cannot be ruled out. Two
Jarid1b null alleles, one (exon 1 deletion) embryonic lethal41 the other (exon 6 deletion) no
gross abnormalities,20 have recently been described. Precise elucidation of the role Jarid1b
gene dosage plays in HSCs and leukemia development will thus likely require analyses of
HSC-specific Jarid1b deletion.
Overall, the data presented supports a cellular and developmental stage specific effect of
Jarid1b levels in modulation of HSC cell fate. To sustain stem cell fate, integrated influences
from various epigenetic effectors promote an active state of transcription at multipotency loci
(Fig.7 upper panel). Activity of chromatin modifiers, including JARID1B, should culminate
in maintenance of the H3K4me3 epigenetic mark on these loci, and exclusion of repressive
marks, such as H3K9me3 or H3K27me3. Jhdm1f/PHF8 has recently been identified as a key
regulator of ATRA response in acute promyelocytic leukemia cells43. Whether JHDM1F
For personal use only. at Harvard Libraries on June 22, 2013. bloodjournal.hematologylibrary.orgFrom

18
activity influences the methylation status of H3K9 or normal HSC fate decisions remains to
be explored. In contrast, removal of the active H3K4me3 epigenetic mark, potentially by
JARID1B, could repress transcription of “stemness” genes and favor lineage commitment
(Fig. 7, lower panel). Other JmjC candidates (e.g. Hif1an) may also be involved in this
process, underscoring the importance of further characterization of these enzymes in the
context of HSC regulation.
For personal use only. at Harvard Libraries on June 22, 2013. bloodjournal.hematologylibrary.orgFrom

19
ACKNOWLEDGEMENTS
Authors acknowledge Mélanie Fréchette and Andrea Evelyn Mejia Alfaro for their assistance
with animal care and transplantation experiments; IRIC’s technological platform members:
Danièle Gagné from Flow Cytometry Core Facility for help with cell sorting; Christian
Charbonneau from Bio-imaging Core Facility for assistance with image acquisition and
figure preparation; Raphaëlle Lambert, Pierre Chagnon and Simon Drouin from Genomic
Core Facility for Q-RT-PCR and ChIP-chip experiments. This work was supported by grants
from the Canadian Institute for Health Research (CIHR), the Canadian Cancer Society
Research Institute and Fonds de Recherche en Santé du Québec (FRSQ) to GS. GS holds a
Canada Research Chair in the Molecular Genetics of Stem Cells. SC is recipient of a CIHR
Clinician-Scientist Fellowship Award and a Cole Foundation Transition Award. KH is
recipient of a CIHR Post-Doctoral fellowship Award and a Cole Foundation Award. S.B.T. is
recipient of National Health and Medical Research Council of Australia (NHMRC), Royal
Australian College of Physicians and CIHR Postdoctoral Fellowships.
AUTHORSHIP CONTRIBUTIONS
S.C. and G.S. established the gene candidate list. M.S., J.C and S.C. contributed to isolation
and functional assessment of highly purified HSC populations used for expression profile
studies of gene candidates. S.C., K.J.H. and G.S. planned and performed the initial screen.
S.C., K.J.H. and N.M. designed and performed validation experiments. S.C., N.M., K.J.H.,
S.B.T., J.C., E.D. J.K. and M.S. contributed to HSC isolation experiments required for initial
screen, validation experiments and subsequent experiments. S.C. and N.M. performed
confirmation experiments for shJarid1b-transduced cells including cell culture, progenitor
assays and FACS. T.M. and S.C. performed RNA extraction and Q-RT-PCR analyses
involving shJarid1b transduced cells. S.C., N.M. and J.C. performed LDA experiments and
For personal use only. at Harvard Libraries on June 22, 2013. bloodjournal.hematologylibrary.orgFrom

20
analyses of long-term recipient mice. B.T.W performed RNAseq studies. A.T. optimized and
performed Q-RT-PCR assays for HoxA gene expression studies. E.D. performed Southern
Blot analyses. J.R.L., T.M., S.C. and K.J.H. performed ChIP-chip experiments. M.S. and
N.M. performed experiments involving co-transduction of NA10hd and shRNA constructs.
S.C., G.S., J.K. and A.T. wrote the paper.
CONFLICT OF INTEREST
The authors declare no competing financial interests.
For personal use only. at Harvard Libraries on June 22, 2013. bloodjournal.hematologylibrary.orgFrom

21
REFERENCES
1. Fatemi M, Pao MM, Jeong S, et al. Footprinting of mammalian promoters: use of a CpG DNA methyltransferase revealing nucleosome positions at a single molecule level. Nucleic Acids Res. 2005;33(20):e176.
2. He YF, Li BZ, Li Z, et al. Tet-mediated formation of 5-carboxylcytosine and its excision by TDG in mammalian DNA. Science. 2011;333(6047):1303-1307.
3. Ito S, Shen L, Dai Q, et al. Tet proteins can convert 5-methylcytosine to 5-formylcytosine and 5-carboxylcytosine. Science. 2011;333(6047):1300-1303.
4. Kouzarides T. Chromatin modifications and their function. Cell. 2007;128(4):693-705.
5. Mills AA. Throwing the cancer switch: reciprocal roles of polycomb and trithorax proteins. Nat Rev Cancer. 2010;10(10):669-682.
6. Barski A, Cuddapah S, Cui K, et al. High-resolution profiling of histone methylations in the human genome. Cell. 2007;129(4):823-837.
7. De Santa F, Totaro MG, Prosperini E, Notarbartolo S, Testa G, Natoli G. The histone H3 lysine-27 demethylase Jmjd3 links inflammation to inhibition of polycomb-mediated gene silencing. Cell. 2007;130(6):1083-1094.
8. Issaeva I, Zonis Y, Rozovskaia T, et al. Knockdown of ALR (MLL2) reveals ALR target genes and leads to alterations in cell adhesion and growth. Mol Cell Biol. 2007;27(5):1889-1903.
9. Lee MG, Villa R, Trojer P, et al. Demethylation of H3K27 regulates polycomb recruitment and H2A ubiquitination. Science. 2007;318(5849):447-450.
10. Cloos PA, Christensen J, Agger K, Helin K. Erasing the methyl mark: histone demethylases at the center of cellular differentiation and disease. Genes Dev. 2008;22(9):1115-1140.
11. Di Lorenzo A, Bedford MT. Histone arginine methylation. FEBS Lett. 2011;585(13):2024-2031. 12. Secombe J, Eisenman RN. The function and regulation of the JARID1 family of histone H3 lysine 4 demethylases: the Myc connection. Cell Cycle. 2007;6(11):1324-1328. 13. Chang B, Chen Y, Zhao Y, Bruick RK. JMJD6 is a histone arginine demethylase. Science. 2007;318(5849):444-447.
14. Falnes PO, Johansen RF, Seeberg E. AlkB-mediated oxidative demethylation reverses DNA damage in Escherichia coli. Nature. 2002;419(6903):178-182.
15. Trewick SC, Henshaw TF, Hausinger RP, Lindahl T, Sedgwick B. Oxidative demethylation by Escherichia coli AlkB directly reverts DNA base damage. Nature. 2002;419(6903):174-178.
For personal use only. at Harvard Libraries on June 22, 2013. bloodjournal.hematologylibrary.orgFrom

22
16. Loh YH, Zhang W, Chen X, George J, Ng HH. Jmjd1a and Jmjd2c histone H3 Lys 9 demethylases regulate self-renewal in embryonic stem cells. Genes Dev. 2007;21(20):2545-2557.
17. Hayami S, Yoshimatsu M, Veerakumarasivam A, et al. Overexpression of the JmjC histone demethylase KDM5B in human carcinogenesis: involvement in the proliferation of cancer cells through the E2F/RB pathway. Mol Cancer. 2010;9:59.
18. Jepsen K, Solum D, Zhou T, et al. SMRT-mediated repression of an H3K27 demethylase in progression from neural stem cell to neuron. Nature. 2007;450(7168):415-419. 19. Pospisil V, Vargova K, Kokavec J, et al. Epigenetic silencing of the oncogenic miR-17-92 cluster during PU.1-directed macrophage differentiation. EMBO J. 2011;30(21):4450-4464.
20. Schmitz SU, Albert M, Malatesta M, et al. Jarid1b targets genes regulating development and is involved in neural differentiation. EMBO J. 2011;30(22):4586-4600.
21. Agger K, Cloos PA, Rudkjaer L, et al. The H3K27me3 demethylase JMJD3 contributes to the activation of the INK4A-ARF locus in response to oncogene- and stress-induced senescence. Genes Dev. 2009;23(10):1171-1176.
22. He J, Nguyen AT, Zhang Y. KDM2b/JHDM1b, an H3K36me2-specific demethylase, is required for initiation and maintenance of acute myeloid leukemia. Blood. 2011;117(14):3869-3880.
23. Northcott PA, Nakahara Y, Wu X, et al. Multiple recurrent genetic events converge on control of histone lysine methylation in medulloblastoma. Nat Genet. 2009;41(4):465-472.
24. Xiang Y, Zhu Z, Han G, et al. JARID1B is a histone H3 lysine 4 demethylase up-regulated in prostate cancer. Proc Natl Acad Sci U S A. 2007;104(49):19226-19231.
25. Hope KJ, Cellot S, Ting SB, et al. An RNAi screen identifies Msi2 and Prox1 as having opposite roles in the regulation of hematopoietic stem cell activity. Cell Stem Cell. 2010;7(1):101-113.
26. Deneault E, Cellot S, Faubert A, et al. A functional screen to identify novel effectors of hematopoietic stem cell activity. Cell. 2009;137(2):369-379.
27. Simon C, Chagraoui J, Krosl J, et al. A key role for EZH2 and associated genes in mouse and human adult T-cell acute leukemia. Genes Dev. 2012;26(7):651-656. 28. Szilvassy SJ, Humphries RK, Lansdorp PM, Eaves AC, Eaves CJ. Quantitative assay for totipotent reconstituting hematopoietic stem cells by a competitive repopulation strategy. Proc Natl Acad Sci U S A. 1990;87(22):8736-8740. 29. Katsumoto T, Aikawa Y, Iwama A, et al. MOZ is essential for maintenance of hematopoietic stem cells. Genes Dev. 2006;20(10):1321-1330.
For personal use only. at Harvard Libraries on June 22, 2013. bloodjournal.hematologylibrary.orgFrom
23
30. Thomas T, Corcoran LM, Gugasyan R, et al. Monocytic leukemia zinc finger protein is essential for the development of long-term reconstituting hematopoietic stem cells. Genes Dev. 2006;20(9):1175-1186. 31. Ohta H, Sekulovic S, Bakovic S, et al. Near-maximal expansions of hematopoietic stem cells in culture using NUP98-HOX fusions. Exp Hematol. 2007;35(5):817-830. 32. Sekulovic S, Gasparetto M, Lecault V, et al. Ontogeny stage-independent and high-level clonal expansion in vitro of mouse hematopoietic stem cells stimulated by an engineered NUP98-HOX fusion transcription factor. Blood. 2011;118(16):4366-4376.
33. Cellot S, Krosl J, Chagraoui J, Meloche S, Humphries RK, Sauvageau G. Sustained in vitro trigger of self-renewal divisions in Hoxb4hiPbx1(10) hematopoietic stem cells. Exp Hematol. 2007;35(5):802-816. 34. Yamane K, Tateishi K, Klose RJ, et al. PLU-1 is an H3K4 demethylase involved in transcriptional repression and breast cancer cell proliferation. Mol Cell. 2007;25(6):801-812.
35. Rinn JL, Kertesz M, Wang JK, et al. Functional demarcation of active and silent chromatin domains in human HOX loci by noncoding RNAs. Cell. 2007;129(7):1311-1323.
36. Dorrance AM, Liu S, Yuan W, et al. Mll partial tandem duplication induces aberrant Hox expression in vivo via specific epigenetic alterations. J Clin Invest. 2006;116(10):2707-2716. 37. Wang GG, Song J, Wang Z, et al. Haematopoietic malignancies caused by dysregulation of a chromatin-binding PHD finger. Nature. 2009;459(7248):847-851.
38. Sprussel A, Schulte JH, Weber S, et al. Lysine-specific demethylase 1 restricts hematopoietic progenitor proliferation and is essential for terminal differentiation. Leukemia. 2012;26(9):2039-2051. 39. Karrman K, Sallerfors B, Lenhoff S, Fioretos T, Johansson B. Cytogenetic evolution patterns in CML post-SCT. Bone Marrow Transplant. 2007;39(3):165-171.
40. Shah NK, Wagner J, Santos G, Griffin CA. Karyotype at relapse following allogeneic bone marrow transplantation for chronic myelogenous leukemia. Cancer Genet Cytogenet. 1992;61(2):183-192. 41. Catchpole S, Spencer-Dene B, Hall D, et al. PLU-1/JARID1B/KDM5B is required for embryonic survival and contributes to cell proliferation in the mammary gland and in ER+ breast cancer cells. Int J Oncol. 2011;38(5):1267-1277. 42. Allis CD, Berger SL, Cote J, et al. New nomenclature for chromatin-modifying enzymes. Cell. 2007;131(4):633-636.
43. Arteaga MF, Mikesch JH, Qiu J, et al. The Histone Demethylase PHF8 Governs Retinoic Acid Response in Acute Promyelocytic Leukemia. Cancer Cell. 2013;23(3):376-89.
For personal use only. at Harvard Libraries on June 22, 2013. bloodjournal.hematologylibrary.orgFrom

24
FIGURE LEGENDS
Figure 1. JmjC gene expression in HSC/progenitor cell populations and selection for
RNAi screen. A) Transcript levels of histone demethylases (HDM) in HSC enriched cell
populations. Results show ΔCT values determined by quantitative (Q) RT-PCR assays (with
respect to endogenous Hprt expression levels, Ct~22) and represent average ± SEM of 5
independently sorted HSC populations (bone marrow, n=3; E14.5 d.p.c. fetal liver, n=2).
Frequencies of long term-repopulating HSCs in these populations are shown in Table S1. B)
Comparison of HDM transcript levels detected in HSCs and total bone marrow cell
populations. Relative transcript quantities (RQ) are shown in log2 scale, and represent the
ΔCT (HSC)/ΔCT(bone marrow) ratio determined by quantitative RT-PCR assays (average ±
SEM, n=3). An HSC expression score was implemented based on expression levels (ΔCT)
and differential expression (RQ) of individual HDM, to rank gene candidates according to
relative expression in HSC vs mature cells: gene not expressed in HSC, -2; less (<) expressed
in HSC vs mature cells, -1; more (>) expressed in HSC, +1; equally expressed, 0. C) List of
the 23 HDM candidates tested in primary screen. HDMs sub-families sharing similarities
outside the catalytic domain are denoted by different shading. Left column, the revised
current terminology; central column, synonyms; right column, proposed substrate
specificity10,42. Four HDM genes were excluded from the screen: Jarid1d and Uty map to
chromosome Y and are thus likely not required for regulation of HSC activity; Pla3g4b
belongs to the cytosolic phospholipase A2 family; Jhdm1e knockdown could not be achieved
by any hairpin in two independent experiments. D) Schema of shRNA retroviral vector
backbone (top), and experimental outline (bottom) of the primary screen at the bottom. At 16
week after transplantation, increase in the proportion of GFP+ peripheral blood leukocytes
above their input levels reflects knockdown of a negative regulator of HSC activity (green
box), and the inverse outcome denotes a positive HSC regulator (red box).
For personal use only. at Harvard Libraries on June 22, 2013. bloodjournal.hematologylibrary.orgFrom

25
Figure 2. HDM hit identification. A) The selection threshold score for genes was
calculated from the expression score (Fig. 1B) and HSC activity score or biological score,
(Fig. 2B). Biological score represents the number of shRNAs per HDM which modulate HSC
activity in recipients above or below the 95% confidence interval range established for
control shLuc cells (dotted blue lines in Fig. 2B). Selection threshold score of 2 and above
identifies hits selected for validation experiments. B) Contributions of GFP+ (shRNA-
transduced) cells to peripheral blood reconstitution of recipients at 20 weeks after
transplantation. Results are presented as proportions GFP+ cells within the transplant-derived
(CD45.1+) peripheral blood cells and are normalized for the gene transfer efficiency
determined on the day of transplantation (day 0). Green shaded areas, suppressors of HSC
activity; red shaded areas, enhancers of HSC activity. Raw data for gene transfer rates and
blood reconstitution levels for all recipients are provided in Table S4.
Figure 3. Validation assays for identified hits. A) Schema of experimental design. B)
Long-term contribution of GFP+ (shLuc+, shJarid1b+, or NA10hd+) cells to peripheral blood
reconstitution of recipients; gene transfer > 80% for all conditions. Left panel: recipients of
day 0 cells; central and right panel, recipients of day 7 cells. NA10hd, cells engineered to
overexpress NUP98Hoxa10-homeodomain fusion protein and green fluorescent protein
(GFP). C) Evaluation of Jarid1b knockdown in GFP+ shJarid1b-transduced cells compared
to shLuc controls. Results represent average ± SEM (n=4) RQ values determined for 6
different hairpins. Bars with dashed lines correspond to shRNA constructs (sh5,6 and 1) that
did not achieve significant (ie >30%) knockdown of Jarid1b in BM HSC. D) Long-term
contribution of GFP+ (shLuc+, or shMoz+, or shJhdm1f+) cells to peripheral blood
reconstitution in recipients of day 0 cells. Each recipient received a ¼ of the transduced cell
population, or twice the number of input cells transplanted for validation experiment shown
For personal use only. at Harvard Libraries on June 22, 2013. bloodjournal.hematologylibrary.orgFrom

26
in Fig. 3A. E). Short-term (3 weeks) contribution of GFP+ (shLuc+ or shJhdm1f+-transduced)
cells to peripheral blood reconstitution in recipients of day 0 cells. GT=99% for all
conditions. Experiment (as in Fig. 4D) was repeated to include all hairpins against Jhdm1f. F)
Evaluation of Jhmdm1f knockdown in GFP+ shJhdm1f-transduced cells compared to shLuc
controls. Results represent average ± SEM (n=3). RQ values determined for 5 different
hairpins. G) Summary of screen results.
Figure 4. Jarid 1b knockdown decreases hematopoietic cell differentiation in vitro. A)
Left panel: Jarid1b knockdown increases yields of mononuclear cells in cultures initiated
with shJarid-transduced HSC/progenitor cell populations (mean ±SD, n=2). Right panel:
Wright-stained cytospin preparations of cells on day 9 of culture, 40x magnification, white
arrows indicate primitive cells. B) shJarid1b suppresses in vitro differentiation of
HSC/progenitor cell populations. Proportions of Gr1+ cells on day 9 of culture were
determined by flow cytometry. Each dot represents an independent culture. C) Jarid1b
knockdown enhances in vitro expansion of myeloid colony forming cells (CFC). The increase
in CFC numbers was calculated from MNC and CFC numbers determined on days 2 and 9
(mean ± SD, n=4). D) Images of the predominant colony types. shJarid1b, colony forming
unit granulocyte-macrophage (CFU-GM), high proliferative potential; shMoz, colony forming
unit macrophage (CFU-M), low proliferation. Left panels, bright field; right panels,
epifluorescence. E) Proportions of the highly proliferative CFU-GM in cultures of shRNA-
transduced cells (mean ± SD, n=4). F) Q-RT-PCR-based comparison of cell fate-associated
transcript levels in day 7 (Fig. 3A) shJarid1b and shMoz-cells compared to shLuc controls.
Figure 5. In vitro-expanded shJarid1b-HSC retain long-term in vivo multipotency. A)
Analysis of hematopoietic tissues in recipients of day 7 cells (Fig. 3B) at 1 year after
For personal use only. at Harvard Libraries on June 22, 2013. bloodjournal.hematologylibrary.orgFrom

27
transplantation. From left to right: first panel, spleen weight; second panel, the total numbers
of bone marrow cells pooled from pelvis, femur and tibia; third panel, CFC frequency in the
GFP+ bone marrow cell populations; fourth panel, proportions of GFP+ multilineage
progenitors (Colony Forming Unit-Granulocyte, Erythrocyte, Monocyte, Megakaryocyte,
CFU-GEMM). Dots in first plot represent the numbers of individual mice for which all the
described parameters were analyzed. B) Contribution of day 7 (Fig. 3A) shJarid 1b (GFP+)
cells to reconstitution of myeloid (Mac1+), B-lymphoid (B220+) and T-lymphoid lineage
(CD4+, CD8+) at 1 year after transplantation. An example of typical reconstitution observed
in all recipients (n>10) is shown. C) Jarid1b knockdown promotes the in vitro expansion of
LTR-HSCs. Upper panel, experimental outline. Lower panel, CRU numbers in freshly sorted
(i.e., input) and day 7 shRNA-transduced cell populations (mean ± SE). shJarid1b CRUs
were determined in 2 independent experiments (see Table S6). D) Clonal analysis of proviral
integrations in DNA isolated from hematopoietic tissues of mouse from shJarid1b cohort
introduced in Fig. 5C. DNA was digested with EcoRI which cuts once within the provirus
such that each DNA fragment recognized by the 32P-labelled Gfp probe represents a unique
integration event. Mouse ID#, the total dose of transplanted cells, and the estimated number
of transplanted CRU are shown on top. T, thymus; S, spleen; BM, bone marrow.
Figure 6. Jarid1b knockdown modulates molecular mechanisms implicated in
maintenance of stemness. A) Quantification of Hox gene transcripts in shJarid1b-cells and
shLuc controls as assessed by RNA sequencing (RNAseq) analysis. For each Hox cluster (a
and b) genes, FPKM (fragments per kilobase per million reads) expression values are shown
for both conditions. Error bars indicate SD. RNA was isolated from HSC enriched cells in
culture (4 days following retroviral infection), and only cultures with gene transfer rates
>90% were selected. For each condition, two biological replicates were sequenced. B)
For personal use only. at Harvard Libraries on June 22, 2013. bloodjournal.hematologylibrary.orgFrom

28
Average FPKM and fold-change expression values of the 40 most upregulated (FPKM>1 for
shJarid1b-cells) and C) downregulated (FPKM >1 for shLuc controls) genes from the
RNAseq experiment described in Fig. 6A. Genes annotated to specific functions are specified
by a cross mark in respective columns. Complete data for all differentially expressed genes
(q-value < 0.05; all FPKM values included) shown in Table S7. D) Enrichment for H3K4me3
marks (black peaks) at the Hoxa7 and Hes1 loci in shJarid1b cells. Chromatin
immunoprecipitation was carried out using day 7 (Fig. 5C) shJarid1b or shLuc-cells. Total
H3K4me3 levels are presented in Fig. S6. E) Top panel: Experimental strategy for generation
of Nup98Hoxa10-homeodomain (NA10hd) plus shRNA overexpressing cells. Following
puromycin selection, the Sca1+CD43- Gr1-F4/80- NA10hd-transduced cells were infected
with shLuc-, shMoz-, and shJarid1b 1b-carrying retroviruses. Lower panel: Jarid1b
knockdown suppresses differentiation of NA10hd overexpressing cells. Proportions of
Gr1+F4/80+ (i.e. differentiated) cells in cultures were determined by flow cytometry on day 7
after shRNA transduction. Each dot represents individual culture comprising the transduced
progeny of 1,500 CD150+CD48-Lin- bone marrow cells. 1: Manual curation 2,3 : 3.4- and 3.7-
fold enrichment with false discovery rate of 4.6E-24 and 4.2E-11 in Gorilla bioinformatic
tool. *Denotes high H3K4me3 densities, refer to Fig. 6D.
Figure 7. Proposed model for JARID1B activity in modulation of HSC fate. Grey shaded
area: JARID1B erases the tri-methyl marks of H3K4 at stemness loci and represses activity of
multipotency genes. Pink area: Decrease in JARID1B activity shifts balance in favour of
histone methylases, preserving the active H3K4me3 mark at stemness loci to sustain
multipotency.
For personal use only. at Harvard Libraries on June 22, 2013. bloodjournal.hematologylibrary.orgFrom

C
A
B
Fbxl
11Jm
jd1b
Jarid
1bJa
rid1c
Jmjd
1cJa
rid1a
Jmjd
3Jm
jd1a
Jarid
2Jh
dm1d
Fbxl
19H
if1an
Fbxl
10U
txJm
jd2a
Jmjd
6Ja
rid1d
Mys
t3P
hf8
Jmjd
4Jm
jd2c
Jmjd
2bP
hf2
Aof
2U
tyH
spba
p1Jm
jd2d
Hai
rless
-5
0
5
10
15
20
25
DC
T
*
-3
-2
-1
0
1
2
3
Jarid
1bJm
jd2d
Fbxl
10Jm
jd1c
Jmjd
1aFb
xl11
Jmjd
3Jm
jd2c
Jhdm
1cJm
jd1b
Jarid
1aJa
rid1d
Jarid
2Jm
jd2b
Jhdm
1e Utx
Uty
Jmjd
6Jm
jd4
Hif1
an
Jhdm
1fJm
jd2a
Jarid
1cJh
dm1d
Hsp
bap1
Hai
rless
Stemness
NOT EXPRESSED
Differentiation
HSC expression score 1 0 -1 -2
> <= NE
KDM2A JHDM1A / FBXL11 H3K36me2 / 1
KDM2B JHDM1B / FBXL10 H3K36me2 / 1 , H3K4me3
JHDM1D / KIAA1718 H3K9me 2 / 1 , H3K27me 2 / 1
JHDM1F / PHF8 H3K9me2 / 1 , H4K20me1
KDM3A JMJD1A / JHDM2A / TSGA H3K9me2 / 1
KDM3B JMJD1B H3K9me2 / 1
JMJD1CHR
KDM4A JMJD2A / JHDM3A H3K9me3 / 2 , H3K36me2 / 1
KDM4B JMJD2B / JHDM3B H3K9me3 / 2 , H3K36me2 / 1
KDM4C JMJD2C / JHDM3C / GASC1 H3K9me3 / 2 , H3K36me2 / 1
KDM4D JMJD2D / JHDM3D 3 / 2 , H3K36meH3K9me 2 / 1
KDM5A JARID1A H3K4me3 / 2
KDM5B JARID1B H3K4me3 / 2
KDM5C JARID1C H3K4me3 / 2
JARID2KDM6A UTX H3K27me3 / 2
KDM6B JMJD3 H3K27me3 / 2
JMJD4JMJD5JMJD6 / PTDSR / PSR H3R2me2 , H4R3me 2
HSPBAP1HIF1AN HIF1a-N803
5' miR30 3' miR30 PuroPpgk IRES+LTR LTR
shRNA histone demethylase
GFP
1 111098765432 12ABCDEFGH
5-day infection
RNA
Gene transferevaluation (%GFP)
Transplantation(¼ well)
Blood (%GFP at 16 wks)
CD150+ CD48- Lin-Bone marrow cells
D
+ve HSC regulator
-ve HSC regulator
CD45.1 : CD45.21:1
CD45.1 cells
ψ
SYNONYMS SUBSTRATENAME
HS
C e
xpre
ssio
n sc
ore
log
2
For personal use only. at Harvard Libraries on June 22, 2013. bloodjournal.hematologylibrary.orgFrom

0
1
2
1 2 1 2 3 41 2 3 4 5 1 3 4 51 3 5 1 2 3 41 2 3 4 5 2 4 51 2 3 5 1 2 3 5 1 2 3 51 2 3 52 3 5 sh #Moz Jhdm1a Jhdm1b Jhdm1d Jhdm1f Jmjd1a Jmjd1b Jmjd1c Jmjd2a Jmjd2b Jmjd2c Jmjd2dHairless GeneLu
c
1 2 1 2 32 3 41 5 2 3 4 51 2 3 4 3 42 3 5 1 4 53 4 5 4 5 4 5 1 2 4 52 3 4 541 6 1 sh #Moz Jarid1a Jarid1b Jarid1c Jarid2 Jmjd3 Jmjd5 Jmjd6 Hspbap1 Hif1anJmjd4 GeneLu
c
0.8072
95% CI of mean
95% CI of mean
0.8072
0.2751
0.2751
Utx
Cellot S. et al, Fig. 2
HS
C a
ctiv
ity s
core
HS
C a
ctiv
ity s
core
0
1
2
A
B
Selection Threshold Score (STS) for hit identification
STS = IF ((HSC activity score: Fig. 2B) + (Expression score: Fig. 1B)) ≥ 2 HIT
For personal use only. at Harvard Libraries on June 22, 2013. bloodjournal.hematologylibrary.orgFrom

0
25
50
75
100
% G
FP b
lood
Luc
Moz
0
20
40
60
80
% G
FP b
lood
Luc
NA
10hd 2 3 4
Luc
NA
10hd 2 3 4
1 1 4 5
Luc
NA
10hd 2 3 4
sh #
Gene
sh #
Gene
A
B
D
C
E F
52431 sh #
Gene52431 sh #
GeneLuc
0
20
40
60
% G
FP b
lood
1 111098765432 12ABCDEFGH
CD150+ CD48- Lin-Bone marrow cells
1/8 well
day 0
day 04 mo post Tx
in vitro
0
25
50
75
100
0
25
50
75
100
day 73 mo post Tx
day 710 mo post Tx
day 7
1/8 well
G23 genecandidates 6 hits 2 hits
10 screen validation
Jarid1b
Jhdm1f
1 -ve regulator
1 +ve regulator
►► ►
►
Cellot S. et al, Fig. 3
5-day infection
0
10
20
30
40
50
% kn
ockd
own
15 6 sh #
Gene23 4
0
20
40
60
80
100
% kn
ockd
own
For personal use only. at Harvard Libraries on June 22, 2013. bloodjournal.hematologylibrary.orgFrom

A B
C D E
FLu
c
Jarid1b
Moz
0
1
2
3
4
5
CFC
DIS
TRIB
UTI
ON
CFU
-GM
/CFU
-M
%G
r1+ c
ells
(of M
NC
)
0
20
40
60
80
-1,00
0,00
1,00
2,00
-3,00
-2,00
sh2Jarid1b
sh3Jarid1b
shLuc
sh1Moz 2 3 1 sh #GenesLu
c
Jarid1b
Moz
2 3 1 sh #Genes
Luc
NA
10hd Jarid1b
Moz
2 3 1 sh #Genes
Hr Pu.1 p16 p19 C-myc Mad1 Bcl2 Mcl1
CFC
/cul
ture
(inc
reas
e ov
er in
put)
MN
C/C
ultu
re (x
106 )
30
20
10
0
Differentiation Senescence Cell Cycle Apoptosis
Time in Culture (days)2 9
5
4
3
2
1
0
sh3Jarid1b
sh2Jarid1b
shLuc
sh1Moz
p = 0.0016
sh3Jarid1bsh1MozRel
ativ
e ex
pres
sion
(RQ
) log
2
For personal use only. at Harvard Libraries on June 22, 2013. bloodjournal.hematologylibrary.orgFrom

8141Mouse ID: 81482 x 105
500.05 x 10⁵
1.3Cell dose:
HSC:Tissue:LDALDA
5-day infectionSort
7 days
sh3J
arid
1b
020406080
100120
CFC
/ 10
00 G
FP+ M
NC
shLu
c
sh3J
arid
1b
sh3J
arid
1b
T S B T S B
Bone Marrow
Spleen Thymus
C D
A
B
0.00
0.05
0.10
0.15S
plee
n w
eigh
t (g)
shLu
c
sh3J
arid
1bWT 0
13579
11
Cel
l cou
nt (x
107 )
shLu
c
sh3J
arid
1bWT
FSC
SS
C
B220
Mac
1
GFP
GFP
B22
0
CD8
CD
4
GFP
39.0%
sort
shLu
c
GFP
+ HS
C /
cultu
re (x
104 ) 4
3
2
1
8 - fold*
Cellot S. et al, Fig. 5
0.02.55.07.5
10.012.515.017.5
shLu
csh
3Jar
id1b
% C
FU-G
EMM
(o
f GFP
+ MN
C)
39.0%
52.5% 1.69%
24.2% 21.6%
22.8% 39.2%
26.4%11.6%
80.2%80.2%
12.1% 82.3%
2.86%2.76%
For personal use only. at Harvard Libraries on June 22, 2013. bloodjournal.hematologylibrary.orgFrom
Hox genes
Upregulated genes Downregulated genes
A
B C
SORT
shRNA
FACSNA10hd
puro
1 111098765432 12ABCDEFGH
BM HSC
p < 0.0001
45
40
50
55
60
65
70
75
80
85
90
95
%G
r1+ F
4/80
+ cel
ls
shLuc shMoz sh3Jarid1b
D E
H3K
4me3
den
sity
sh3Jarid1b
shLuc
Hoxa7 Hes1
expr
essi
on s
cale
lo
hi
Gen
e
shJa
rid1b
(avg
)
shLu
c (a
vg)
Rat
ioEr
ythr
oid
diffe
rent
iatio
n1
Not
chsi
gnal
ing1
Calca 8.7 1.2 7.2Ccl17 1.6 0.3 5.7LOC100499420 1.4 0.3 5.4Pga5 9.4 1.7 5.4Fgf3 12.2 2.4 5.1Car2 101.7 20.3 5.0 XArt4 2.4 0.5 4.9 XFbxo2 9.4 1.9 4.8Il9r 1.2 0.2 4.7Tpsb2 40.8 9.0 4.5C630004H02Rik 1.3 0.3 4.5Bspry 2.6 0.6 4.4Tnfsf4 1.6 0.4 4.4Hemgn 12.8 3.0 4.3Aldh1a1 8.1 2.0 4.1Il13 1.5 0.4 4.0Mdga1 7.3 1.8 4.0Notch3 2.1 0.5 4.0 XScml4 1.6 0.4 3.8Hes1 6.1 1.6 3.7 XCar3 1.4 0.4 3.7 XShroom3 1.3 0.4 3.6Epdr1 4.6 1.3 3.6Tesc 5.4 1.5 3.5Trfr2 21.7 6.2 3.5 XOtub2 13.3 3.8 3.5Eya2 10.6 3.1 3.4Jakmip1 1.8 0.5 3.4Trpc6 10.7 3.2 3.3Reep2 4.5 1.4 3.3Arhgef5 1.6 0.5 3.3Rilpl1 3.0 0.9 3.3Slc14a1 12.7 3.9 3.2Nmnat2 2.1 0.7 3.2Tpsg1 24.7 7.8 3.2Hoxa10 1.2 0.4 3.1TCRBVbeta5.1 31.2 10.0 3.1Gm5577 1.0 0.3 3.1Trib3 14.9 4.9 3.1Slc18a2 89.5 29.5 3.0
Gen
e
shJa
rid1b
(avg
)
shLu
c (a
vg)
1/R
atio
Def
ense
R
espo
nse2
Inna
te im
mun
e R
espo
nse3
Ccl22 0.0 1.9 89.1 XDynlt1c 0.0 1.5 46.6Fcrls 0.4 7.2 17.2Asgr2 0.2 3.0 14.0Cd83 0.1 1.1 12.1Ms4a4c 0.1 1.3 12.0C1qa 0.2 2.2 10.7 X XCcl24 3.0 30.2 10.1 XC1qc 1.5 14.4 9.7 X XA130040M12Rik 18.8 171.8 9.2C1qb 2.9 24.8 8.6 X XCd74 8.3 68.9 8.3 XCldn11 0.3 2.0 7.7Il13ra1 0.3 2.0 7.4Olfm1 3.8 27.1 7.1AI607873 0.9 6.5 7.1Clec4a1 0.6 4.6 7.0Ear2 0.3 1.8 6.9Aif1 0.3 1.9 6.6Ms4a6b 0.9 6.1 6.6Rab3il1 1.9 12.4 6.6Ambp 0.5 3.0 6.4Dab2 5.7 34.2 5.9Mgl2 15.5 91.1 5.94930506M07Rik 0.6 3.7 5.8Tlr9 0.5 3.1 5.8 X XMs4a6d 4.8 27.9 5.8Id3 2.0 11.4 5.8Uchl1 0.2 1.1 5.7Csf1r 14.7 83.2 5.6 X XTlr5 0.2 1.2 5.6 X XMs4a6c 5.8 32.4 5.6Cttnbp2nl 0.8 4.3 5.6Trem2 9.4 50.9 5.4Cd300lg 0.3 1.7 5.4Sdc4 1.3 7.0 5.3Slc15a3 2.2 11.6 5.3Klra17 0.3 1.8 5.3Dusp22 1.6 8.4 5.3Cgnl1 0.4 2.3 5.2
Hoxa Cluster Hoxb Cluster
0
2
4
6
0
2
4
Hox
a1H
oxa2
Hox
a3H
oxa4
Hox
a5H
oxa6
Hox
a7H
oxa9
Hox
a10
Hox
a11
Hox
a13
Hox
b1H
oxb2
Hox
b3H
oxb4
Hox
b5H
oxb6
Hox
b7H
oxb8
Hox
b9H
oxb1
3
fpkm
fpkm
*
*
sh3Jarid1b
shLuc
For personal use only. at Harvard Libraries on June 22, 2013. bloodjournal.hematologylibrary.orgFrom

MULTIPOTENCY
DIFFERENTIATION
ON
OFF
me
me
“stemness” genes(Hoxa, others?)
JARID1B
WDR5MLL
JHDM1F
?
?
Cellot S. et al, Fig. 7
For personal use only. at Harvard Libraries on June 22, 2013. bloodjournal.hematologylibrary.orgFrom