
RISK ANALYSIS OF THE LHC UNDERGROUND AREA
129
RISK ANALYSIS OF THE LHC UNDERGROUND AREA FIRE RISK DUE TO FAULTY ELECTRICAL EQUIPMENT Angela Harrison, MEng. Thesis submitted to The University of Leoben for the degree of Doctor mont. (Ph.D.) Institute for Process Technology and Industrial Environmental Protection Supervisor: O.Univ.Prof. Dipl.-Ing. Dr.mont. Werner L. Kepplinger Leoben, Austria CERN - European Organisation for Nuclear Research Supervisor: Dipl.-Ing. Dr. Friedrich Szoncs´ o Geneva, Switzerland July 2007 CERN-THESIS-2007-044 September 2007
-
Upload
khangminh22 -
Category
Documents
-
view
0 -
download
0
Transcript of RISK ANALYSIS OF THE LHC UNDERGROUND AREA

RISK ANALYSIS OF THELHC UNDERGROUND AREA
FIRE RISK DUE TO FAULTY ELECTRICAL EQUIPMENT
Angela Harrison, MEng.
Thesis submitted to The University of Leobenfor the degree of Doctor mont. (Ph.D.)
Institute for Process Technologyand Industrial Environmental Protection
Supervisor: O.Univ.Prof. Dipl.-Ing. Dr.mont. Werner L. Kepplinger
Leoben, Austria
CERN - European Organisation for Nuclear Research
Supervisor: Dipl.-Ing. Dr. Friedrich Szoncso
Geneva, Switzerland
July 2007
CE
RN
-TH
ESI
S-20
07-0
44Se
ptem
ber
2007


STATUTORY DECLARATION
I herewith declare on oath that I haveproduced the enclosed Ph.D. thesis in-dependently and without using anyother than the sources or means listed.Any thoughts directly or indirectlytaken from somebody else’s sources aremade discernible as such.


To my son Felix,who in the face of adversity never failed
to put a smile on my face and in my heart.


Abstract
The European Organisation for Nuclear Research (CERN) in Geneva, Switzerland, is cur-rently building the latest generation of particle accelerators, the LHC (Large Hadron Col-lider). The machine is housed in a circular tunnel of 27 km of circumference and is situatedapproximately 100 metres beneath the surface astride the Franco-Swiss border.
Electrically induced fires in the LHC are a major concern, since an incident couldpresent a threat to CERN personnel as well as the public. Moreover, the loss of equipmentwould result in significant costs and downtime. However, the amount of electrical equipmentin the underground area required for operation, supervision and control of the machine isessential. Thus the present thesis is assessing the risk of fire due to faulty electrical equipmentin both a qualitative as well as quantitative way.
The recommendations following the qualitative analysis suggest the introduction of fireprotection zones for the areas with the highest risk of fire due to a combination of possibleignition sources and combustible material in the vicinity. In order to be able to conductregular follow-up examinations to obtain more precise results for the quantitative analysis inthe future, the creation of a material data inventory and the collection of failure probabilitydata throughout the lifetime of the LHC are recommended.
vii


Kurzfassung
Die Europaische Organisation fur Kernforschung (CERN) in Genf errichtet zur Zeit diejungste Generation von Teilchenbeschleunigern, den sogenannten LHC (Large Hadron Col-lider). In einem kreisformigen Tunnel von 27 km Umfang in einer Tiefe von durchschnitt-lich 100 m untergebracht, verlauft dieser Beschleuniger unter der schweizerisch-franzosischenGrenze.
Elektrisch verursachte Feuer im LHC sind von besonderem Interesse, da ein Unfall eineBedrohung fur das Personal und auch die Offentlichkeit sowie den Betrieb des Beschleunigersdarstellen kann. Daruber hinaus wurde ein Verlust der Anlagen bedeutende Kosten undeine erhebliche Stillstandszeit nach sich ziehen. Dennoch sind die elektrischen Anlagen imUntertagebereich fur Betrieb, Uberwachung und Steuerung des Beschleunigers unerlasslich.Daher untersucht die vorliegende Doktorarbeit das Feuerrisiko aufgrund von fehlerhaftenelektrischen Anlagen auf qualitative als auch auf quantitative Weise.
Der der qualitativen Analyse folgende Vorschlag empfiehlt die Ausweisung von speziellenFeuerschutzzonen fur diejenigen Untertagebereiche, die aufgrund der Kombination von mog-lichen Zundquellen und nahe gelegenen brennbaren Materialien das hochste Feuerrisiko auf-weisen. Damit in der Zukunft regelmaßige Nachuntersuchungen zur Ermittlung genauererErgebnisse der quantitativen Analyse durchgefuhrt werden konnen, werden die folgendenMaßnahmen empfohlen: zum einen soll eine Datenbank bezuglich der Materialeigenschaftender verwendeten Anlagen die Bestimmung der Brandlast erleichtern, zum anderen sollen an-lagenspezifische Ausfallsdaten wahrend der gesamten Lebensdauer des LHC erfasst werden.
ix


Contents
1 Introduction 1
2 Executive Summary 3
3 The Large Hadron Collider 5
3.1 CERN . . . . . . . . . . . . . . . . . . . . . . . . . . . . . . . . . . . . . . . . 5
3.2 The LHC Project . . . . . . . . . . . . . . . . . . . . . . . . . . . . . . . . . . 6
3.2.1 The LHC Machine . . . . . . . . . . . . . . . . . . . . . . . . . . . . . 8
3.2.2 The LHC Experiments . . . . . . . . . . . . . . . . . . . . . . . . . . . 9
4 Risk Analysis 11
4.1 Historical review . . . . . . . . . . . . . . . . . . . . . . . . . . . . . . . . . . 12
4.2 Definitions . . . . . . . . . . . . . . . . . . . . . . . . . . . . . . . . . . . . . . 13
4.3 Methods, Application and Justification . . . . . . . . . . . . . . . . . . . . . . 16
4.3.1 Hazard and Operability Study . . . . . . . . . . . . . . . . . . . . . . 17
4.3.1.1 The Principle of HAZOP . . . . . . . . . . . . . . . . . . . . 17
4.3.1.2 Execution of HAZOP . . . . . . . . . . . . . . . . . . . . . . 18
4.3.2 Failure Modes and Effects Analysis . . . . . . . . . . . . . . . . . . . . 18
4.3.2.1 Execution of FMEA . . . . . . . . . . . . . . . . . . . . . . . 20
4.3.2.2 Criticality Analysis . . . . . . . . . . . . . . . . . . . . . . . 20
4.3.3 Fault Tree Analysis . . . . . . . . . . . . . . . . . . . . . . . . . . . . 22
4.3.3.1 Fault Tree Elements and Symbols . . . . . . . . . . . . . . . 23
4.3.3.2 Fault Tree Construction . . . . . . . . . . . . . . . . . . . . . 24
4.3.3.3 Quantitative Analysis . . . . . . . . . . . . . . . . . . . . . . 26
4.3.4 Event Tree Analysis . . . . . . . . . . . . . . . . . . . . . . . . . . . . 27
xi

xii CONTENTS
4.3.4.1 Event Tree Construction . . . . . . . . . . . . . . . . . . . . 27
4.3.4.2 Quantitative Analysis . . . . . . . . . . . . . . . . . . . . . . 29
4.3.5 Risk Analysis Methods at a Glance . . . . . . . . . . . . . . . . . . . . 29
4.3.6 Justification . . . . . . . . . . . . . . . . . . . . . . . . . . . . . . . . . 31
4.4 Failure Rate Data . . . . . . . . . . . . . . . . . . . . . . . . . . . . . . . . . 35
5 Fire Risk 37
5.1 Fire Risk of Electrical Installations . . . . . . . . . . . . . . . . . . . . . . . . 37
5.2 Historical Review about Fires at CERN . . . . . . . . . . . . . . . . . . . . . 38
5.3 Other Fire Risks . . . . . . . . . . . . . . . . . . . . . . . . . . . . . . . . . . 40
6 Risk Analysis - The Boundary Conditions 41
6.1 Identification of Material Data . . . . . . . . . . . . . . . . . . . . . . . . . . 41
6.1.1 CERN Regulations . . . . . . . . . . . . . . . . . . . . . . . . . . . . . 41
6.1.2 Material Data Project . . . . . . . . . . . . . . . . . . . . . . . . . . . 44
6.1.3 Material Properties . . . . . . . . . . . . . . . . . . . . . . . . . . . . . 45
6.1.4 Location of Combustible Material . . . . . . . . . . . . . . . . . . . . 46
6.2 Fire Risk of Electrical Installations . . . . . . . . . . . . . . . . . . . . . . . . 47
6.3 Combined Risks . . . . . . . . . . . . . . . . . . . . . . . . . . . . . . . . . . . 47
6.4 Frequency and Consequence Analysis . . . . . . . . . . . . . . . . . . . . . . . 48
6.4.1 Frequency Analysis . . . . . . . . . . . . . . . . . . . . . . . . . . . . . 48
6.4.2 Consequence Analysis . . . . . . . . . . . . . . . . . . . . . . . . . . . 49
6.4.3 Risk Matrix and Acceptance Criteria . . . . . . . . . . . . . . . . . . . 49
6.5 Fire Risk - Fault Tree Analysis . . . . . . . . . . . . . . . . . . . . . . . . . . 51
7 Fire Risk Analysis of the LHC Underground Area 53
7.1 Qualitative Analysis . . . . . . . . . . . . . . . . . . . . . . . . . . . . . . . . 53
7.1.1 Material Data - Combustible Material . . . . . . . . . . . . . . . . . . 53
7.1.2 Analysis of the Electrical Installation . . . . . . . . . . . . . . . . . . . 56
7.1.3 Specified LHC Areas Concerning Fire Risk . . . . . . . . . . . . . . . 61
7.2 Quantitative Analysis - Expert Judgement . . . . . . . . . . . . . . . . . . . . 64
7.3 Quantitative Analysis - A Detailed Approach . . . . . . . . . . . . . . . . . . 69
7.3.1 Risk Layer Along the Underground Area . . . . . . . . . . . . . . . . . 70
7.3.2 Fault Tree Analysis . . . . . . . . . . . . . . . . . . . . . . . . . . . . 71

CONTENTS xiii
7.3.2.1 Fault Tree Development . . . . . . . . . . . . . . . . . . . . . 72
7.3.2.2 Qualitative Analysis . . . . . . . . . . . . . . . . . . . . . . . 77
7.3.2.3 Quantitative Analysis . . . . . . . . . . . . . . . . . . . . . . 82
7.3.2.3.1 Failure Probabilities of Basic Events . . . . . . . . . 82
7.3.2.3.2 Failure Probability of the Top Event . . . . . . . . . 86
8 Discussion of the Results 95
8.1 Fire Protection Zones . . . . . . . . . . . . . . . . . . . . . . . . . . . . . . . 95
8.1.1 Reinforced Fire and Smoke Detection . . . . . . . . . . . . . . . . . . 96
8.1.2 Signposting . . . . . . . . . . . . . . . . . . . . . . . . . . . . . . . . . 96
8.1.3 Risk Description . . . . . . . . . . . . . . . . . . . . . . . . . . . . . . 97
8.1.4 Code of Conduct for Personnel - Housekeeping . . . . . . . . . . . . . 99
8.2 Material Data Inventory . . . . . . . . . . . . . . . . . . . . . . . . . . . . . . 100
8.3 Collection of Failure Probability Data . . . . . . . . . . . . . . . . . . . . . . 101
9 Conclusion and Outlook 103
Glossary 105
List of Tables 107
List of Figures 109
Bibliography 111

Chapter 1
Introduction
The Large Hadron Collider (LHC) is a large and complex project of the European Organisa-tion for Nuclear Research (CERN) in the High Energy Physics field. This particle acceleratorwill be housed in a tunnel with a circumference of approximately 27 km and an average dis-tance from the surface of 100 metres. Designed to help physicists investigate deeper intomatter than ever before, it will analyse particle collisions at very high energies. These colli-sions will take place in the so-called experiments, which are situated within the LHC perimeterand are housed in huge caverns.
Statistics about electrically induced fires in Finland show that accidents in electricalinstallations occur quite frequently compared to the total number of fires. Of special concernis the fact that in the majority of cases the fire origin is unknown, as the actual fire cause isnot obvious and no fire investigations are performed [1].
The main purpose of this thesis is the assessment of the fire risk in the LHC tunneloriginating from electrical equipment in order to quantify the anticipated fire frequency andsubsequently suggest measures to improve the situation in the future. Human error andtechnical breakdown are discussed as main possible causes.
Using the latest technologies for the LHC implicates a high amount of surveillance andcontrol equipment, which will basically consist of electrical and electronic apparatus situatedin technical galleries and alcoves next to, but also inside the main tunnel. As the LHC willpass below residential areas between the Geneva Lake and the Jura mountains, the subjectof safe machine operation and sufficient prevention measures is under question.
The complexity and dimensions of the LHC make it impossible for a single person tocarry out a risk analysis including not only fire risk, but also mechanical, chemical, biologicaland radiation risk as well as impacts from the outside (i.e. plane crash, seismic activity),which would be the most suitable study.
This thesis concentrates on the analysis of fire risk due to faulty electrical equipmentbecause of the amount of electrical equipment used and the diversity of electrical modesof operation. Moreover, there have been three major incidents involving fires due to faultyelectrical equipment in CERN’s history. Fortunately there were no casualties, but the damageof equipment and buildings as well as the downtime of the accelerator were significant.
1

2 CHAPTER 1. INTRODUCTION
The four experiments of the LHC were developed for different objectives, thus each oftheir designs and operation modes is just as diverse. Considering these particularities andcomplexities, the fire safety aspects of the experiments will not be included in the presentthesis, which will therefore focus on the main tunnel as well as the technical galleries andalcoves.
The construction of the LHC includes different project phases such as installation,commissioning and operation. It was decided to analyse the fire risk of the LHC duringoperation, which implies the period of time between commissioning and trouble-shooting ormaintenance shut-downs. It is assumed that during this phase there are no workers in thetunnel.
Within these boundaries, this thesis is aiming at revealing sensitive areas where thehighest fire risk is suspected due to the available amount of combustible material and thepresence of electrical equipment as potential ignition source. In addition to this qualitativeanalysis, a quantification of the fire risk in the tunnel in terms of frequency of occurrence willalso be completed.
After introducing CERN and the subject under investigation for this study, the LHC,different methods of analysing risk will be presented and discussed in the theoretical part.Then the boundary conditions for the analysis will be described, including a step by stepexplanation about how the problem is going to be approached. Following these guidelines,the actual qualitative and quantitative analyses will be performed. Finally, the results aregoing to be discussed and measures for improvement will be proposed.

Chapter 2
Executive Summary
The identification of hazardous areas in terms of fire risk due to faulty electrical equipmentwas determined with the help of a Failure Modes and Effects Analysis (FMEA) for electri-cal installations. Basic electrical failures such as short circuit or overheating were examinedregarding their possible causes and consequences. Alongside this analysis the material dataof equipment installed in the tunnel were collected and the combustible portion determined.Their combination revealed areas in the LHC tunnel which could be particularly suscepti-ble to developing a fire, since any concurrence of combustible material and faulty electricalequipment as possible ignition source in the vicinity creates a dangerous situation. The areasof concern include the following:
• The injection areas at points 2 and 8 due to the silicone fluid contained in the highvoltage pulse generators,
• point 4 due to a very high energy conversion of the radio frequency system and also theappearance of silicone fluid,
• the LHC arcs due to the presence of combustible material and the lack of fire and smokedetectors,
• and at last the alcoves due to the housing of major parts of the electrical distributionequipment together with part of the UPS system and therefore their importance forLHC operation.
By taking the Failure Modes and Effects Analysis one step further, the failure modes wereassessed by means of an expert judgement. Their frequency of occurrence and the severityof their consequences were judged by three experts in electrical and electronic engineering atCERN using pre-determined classifications.
Once the risk matrix was drawn, the majority of the failure modes were situated withinthe transition area between the acceptable and unacceptable risk areas. However, due tothe already advanced stage of the LHC project, an intervention in order to shift the fre-quency/consequence pairs into the acceptable risk area was not possible. Since the expertjudgement does not assess fire risk directly, but only failure modes possibly leading to a fire,
3

4 CHAPTER 2. EXECUTIVE SUMMARY
the outcome of this quantitative analysis does not necessarily enforce any actions, though itdraws attention to the importance of fire risk for experts working in this field.
A fault tree analysis (FTA) was carried out in order to obtain a more accurate quan-tification of the fire risk. A Boolean algebra computing programme was used to calculate thetop event probability of having a fire in the LHC underground.
The basis for the fault tree analysis was a so-called risk layer along the tunnel, assumingan average amount of electrical equipment along the underground area. Thus the outcomeof the fault tree was treated as an average value valid anywhere in the tunnel.
With estimated failure probability values for the basic events, the probability of firein the LHC tunnel due to faulty electrical equipment was calculated at 9.23 · 10−7, whichmeans once every 217 years. Because of the structure of a fault tree, this result does not onlyinclude technical failures, but also human error and special circumstances such as the lackof fire and smoke detectors in certain areas. Keeping this in mind, a fire probability in therange of 10−7 is a very low value. However, its inaccuracy due to inexistent failure rate dataand therefore only estimations for the basic events in the fault tree is worrying. Though thetree was developed for an equally distributed risk layer, in reality this value might increase incertain areas as a result of the accumulation of electrical equipment and combustible material.
The hazardous areas defined previously are identified as fire protection zones includingspecial rules and regulations. It is suggested to reinforce fire and smoke detection, markthem with particular signboards, complete a Risk Description form in order to support thefire brigade’s development of intervention plans and make all personnel familiar with the rulesof good housekeeping.
Concerning the quantitative assessment of the fire risk in the tunnel, two measures ofimprovement are suggested. In order to develop the identification of hazardous zones andalso facilitate the identification and quantification of combustible materials contained in theunderground area, it would be advantageous to create a material data inventory which wouldbe regularly updated. Although for this thesis inflammable material data have been collected,their acquisition should become part of a safety management system and its inaccuracy shouldbe eliminated for future application and re-analyses.
The second suggestion is heading towards the same direction, namely the collection offailure probability data throughout the lifetime of the LHC. System-dependent failure datacould then be available for a reassessment of the present results, providing a more accurateidea of the fire risks involved in the operation of electrical equipments.

Chapter 3
The Large Hadron Collider
3.1 CERN
CERN is the European Organization for Nuclear Research, the world’s largest particle physicscentre. Founded in 1954 by 12 signatories, it was one of Europe’s first joint ventures, andover time membership has grown to today’s 20 member states. The laboratory is situatedastride of the Franco-Swiss border west of Geneva at the foot of the Jura mountains.
Some 6,500 visiting scientists, half of the world’s particle physicists, are using CERN’sfacilities, representing 500 universities and over 80 nationalities. CERN itself employs about3,000 people in a variety of disciplines to collaborate and provide support and infrastructureto all the physicists taking advantage of the laboratory’s installations. In addition, variouscontracted firms support CERN staff in matters of civil engineering, installation, operationand periodic maintenance of equipment as well as repair and modification of installations [2].
CERN’s main field of study is particle physics or High Energy Physics (HEP), as it ismostly referred to, where physicists investigate the constituents of matter at the subatomiclevel.
Throughout the twentieth century, important progress was made in the field of particlephysics, from discovering the electron to the atomic nucleus and its constituents, from specialrelativity to quantum mechanics. With the foundation of CERN at the beginning of the 1950’sand hence the cooperation of European countries, sufficient financial means were availablefor more systematic and detailed particle physics research [3].
The necessary tools provided by CERN are particle accelerators which recreate theconditions that existed just after the Big Bang, aiming at the discovery of what the Universeis made of and how it works. By accelerating the particles to very high energies and smash-ing them into each other, physicists can identify their components or create new particles,revealing the nature of the interactions between them [4].
5

6 CHAPTER 3. THE LARGE HADRON COLLIDER
Figure 3.1: Schematic layout of the LHC tunnel [5]
3.2 The LHC Project
The Large Hadron Collider (LHC) is the next generation of particle accelerators built atCERN, investigating deeper into matter than ever before. As the most powerful particleaccelerator, the largest machine and the largest cryogenic installation in the world it willpush boundaries in science and engineering [6, 7].
The LHC will be housed in a circular tunnel of almost 27 km of circumference, approx-imately 100 metres below the surface (Figure 3.2). After dismantling the Large Electron-Positron Collider (LEP), the predecessor of the LHC, the civil engineering work required anumber of local changes in order to make way for the installation of the LHC.
Two counter rotating beams of protons or heavy ions will be circulating in two separate

3.2. THE LHC PROJECT 7
Figure 3.2: View of the LHC tunnel [8]
vacuum pipes, directed by a large number of superconducting magnets. Beam collisionswill take place inside the four main detectors (experiments) of the LHC in order to findanswers for the most fundamental questions concerning the understanding of our universe:supersymmetry, dark matter and the origin of mass. At injection, each beam will have anenergy of 450 GeV, reaching 7 TeV after acceleration and hence giving a total of 14 TeV. Thebeams will be stored at high energy for approximately 10 hours during which the collisionswill take place.
The LHC tunnel is divided into eight equal parts, the so-called octants (Figure 3.1) [9].Situated in the middle of the octants are the interaction points, which are usually big caverns.Sectors range from one interaction point to the other, with the approximately 3.3 km longarc in the middle. The accelerator will bend along the arcs and has so-called long straightsections (LSS) at the interaction points. Technical galleries run in parallel to the main tunneland alcoves exist in the form of smaller lateral tunnels; both are dedicated to the housing ofrequired installations.
According to the purpose of the eight interaction points, the LHC can be divided intotwo main parts: on the one hand the machine and on the other hand the experiments. Atpoints 1, 2, 5 and 8 the experiments ATLAS, ALICE, CMS, LHCb and TOTEM are found.The remaining points are occupied by the collimation system, the radio frequency systemand the beam dump. Close to points 2 and 8 the beam injection system kicks the injectionbeams onto the orbit of the machine.
In the following sections LHC machine and experiments will be introduced briefly.

8 CHAPTER 3. THE LARGE HADRON COLLIDER
Moreover, the main systems operating the machine will be described.
3.2.1 The LHC Machine
In order to be able to operate the LHC at the energy of 14 TeV, some of the most impressiveand innovative engineering achievements are involved in the project [9].
Superconducting magnets:
As the beams have a very high momentum, they require a very high magnetic field inorder to bend them around the tunnel, thus superconducting magnets are needed. Themagnets are cooled down to almost absolute zero (1.9 K), reaching the superconductingstate. It allows the specially designed cables of the magnets to conduct current withoutresistance and produce the required magnetic field at zero electrical loss.
Cryogenic system:
In order to keep the magnets cold, a huge cryogenic system is required. A 1.9 K bathof superfluid helium at atmospheric pressure contains the magnets’ windings, whichwill be cooled by low pressure liquid helium flowing in heat exchanger tubes along themagnets. A mass of 96 tons of liquid helium will be needed within the cryogenic system.
Vacuum system:
The beams are travelling in two separate beam tubes housed in the same physicalstructure of the magnets. In order to avoid collisions of the beams with residual gasparticles and increase the lifetime and stability of the beams, the requirements for thebeam vacuum are very high. The vacuum levels of the insulation vacuum systems forthe cryomagnets and the helium distribution line are less stringent, but the necessityof three systems is a specific feature of the LHC.
Power Converter system:
The power converters feeding the superconducting magnets will supply large currents atlow voltages, with different converter types providing up to 13 kA per circuit. Becauseof the constraints of the already existing infrastructure of the tunnel, reduced volumeand high efficiency was a must. In total, there will be more than 1,700 power convertersinstalled in the tunnel, with a total current supply of approximately 1,850 kA.
Machine Interlock systems:
As the energy stored in the beams (340 MJ each) and the magnet system (10 GJ withoutexperiments) is unprecedented, the protection of the machine is of utmost importance.In case of failure, the beam has to be dumped and the stored energy dissipated safelyin order to prevent equipment damage. Two systems, namely the powering interlockand the beam interlock system, communicate with several complex protection systemsas well as other main LHC systems and assure the safe operation of the machine.
The following systems are found at different interaction points of the LHC, dedicated todifferent tasks in order to operate the machine [9].

3.2. THE LHC PROJECT 9
Injection System (TI2 and TI8):
Following the accelerator complex of CERN, the particle packets will be injected intothe LHC from the SPS (Super Proton Synchrotron) via the transfer lines TI2 andTI8. Injection kicker magnets and septum magnets deflect the beam horizontally andvertically onto the LHC orbit. In order to protect the equipment against any injectionerror, various elements, such as shielding elements and collimators, are installed.
Beam Cleaning and Collimation System (IP3 and IP7):
Due to the stored beam energy of 340 MJ each, any occurring beam losses can havesevere effects for the equipment. In order to avoid the damage of equipment and ensurethe survival of components against radioactive dose, the collimation system is designedto capture beam losses. At the interaction points 3 and 7 the beam losses are absorbedby different types of collimators [10].
Radio Frequency system (IP4):
As the beams are injected at only 450 GeV, they have to be accelerated until they reachtheir maximum energy of 7 TeV each. This is done by the so-called RF cavities at point4 of the LHC, which capture the beam and transfer energy of radio waves to the beams(total RF power in the range of several MW). Each beam has its own independentacceleration system comprising eight superconducting, four normal conducting cavitiesand other corresponding equipment [4, 11].
LHC Beam Dump system (IP6):
The beam dumping system has to be the most reliable system of the LHC, as the highenergy and therefore destructive power of the beams require a safe extraction in anycase and, above all, in case of trouble. At point 6 of the LHC, extraction kicker magnetskick the beams off the orbit horizontally (0.33 mrad). Subsequently, they are deflectedvertically (2.4 mrad) and guided towards the absorber block by additional magnets.The absorber blocks are situated at the end of two straight tunnels in a beam dumpcavern, one for each beam, consisting of a graphite core assembly and associated steeland concrete shielding. This block is the only equipment of the LHC ready to receivethe full power of the beams without damaging the machine [12].
3.2.2 The LHC Experiments
The collisions of the beams will take place in the four main experiments of the LHC, eachdedicated to finding information on specific phenomena of particle physics. In addition,the fifth LHC experiment does not focus on particle collisions, but measures other physicsphenomena along the LHC beams.
As the detectors have to be able to see up to 600 million collision events per secondand trace particle trajectories, they have to be tremendously big. For example, the cavernhousing the biggest experiment ATLAS is as big as the nave of Notre Dame Cathedral inParis [13].

10 CHAPTER 3. THE LARGE HADRON COLLIDER
ATLAS (A large Toroidal LHC ApparatuS):
ATLAS is a general-purpose experiment designed to search for new particles such asHiggs bosons and supersymmetric particles. It will cover the largest possible range ofLHC physics, investigating beyond the Standard Model of particles and forces. Withapproximately 1,800 physicists from more than 150 universities and laboratories in 35countries working for ATLAS, it is one of the largest collaborations in the field of physicssciences [14,15].
ALICE (A Large Ion Collider Experiment):
Recreating the conditions of the Universe just shortly after the Big Bang, ALICE willstudy heavy-ion collisions in order to explore the basic structure of ordinary matter.In such a way the current understanding of the evolution of the early Universe and thestructure of the atom and its nucleus will be carried further [14,16].
CMS (Compact Muon Solenoid):
As the second general-purpose experiment of the LHC, CMS is also designed to explorefundamental particle physics phenomena such as the discovery of the Higgs boson andsupersymmetric particles. Moreover, additional subsystems are able to measure theenergy and momentum of charged particles. Compared to the ATLAS experiment,CMS is smaller in size but weighs much more [14,17,18].
LHCb (Large Hadron Collider beauty):
The purpose of the LHCb experiment is to investigate the asymmetry between mat-ter and antimatter in the Universe. As matter and antimatter were created in equalamounts in the Big Bang, physicists today are occupied by the question why the anti-matter disappeared and where it has gone [14,19].
TOTEM (TOTal cross-section and Elastic scattering Measurement):
Compared to the remaining experiments, TOTEM is rather small and moderatelypriced. Since the general-purpose experiments of the LHC are not able to cover allaspects of physics, its purpose is the measurement of the total proton-proton cross-section as well as elastic scattering and diffractive dissociation. With CMS as its hostexperiment, TOTEM will reach into the tunnel on both sides of the main experiment,accomplishing its task very close to the LHC beams [14,20].

Chapter 4
Risk Analysis
Risk analysis and risk assessment form the two major phases of risk management, being sep-arate, but closely related activities. While risk analysis is concerned with the identificationof hazards and their frequency and consequences, risk assessment is needed for their quanti-tative evaluation, thereby being able to check on previously set goals or acceptance criteria(Figure 4.1) [21].
The basic guideline shown in Figure 4.1 does not only show the successive approach torisk analysis and assessment, but even leads one step further to the field of risk managementand control.
Before starting an analysis it is of great importance to pay attention to analysis prepa-ration and system definition. Without considering these two steps previously, the analysiswill miss its objective, which certainly makes it hard to focus on where to go and what shouldand can be achieved. The analysis preparation is aiming at a full understanding of the systemunder examination and the collection of all necessary data. A definition of the objectives,the clarification of the applied methods, the procedure, the scope of resources and the precisedetermination of the object of analysis with its system boundaries are then needed for thesystem definition.
Once these steps are accomplished, the hazards of the system are identified and theirfrequency of occurrence and severity of consequences are determined. For these steps thealready known risk analysis methods are indispensable, approaching the problem successivelyas well as providing guiding principles and overview. A risk analysis is then completed bydepicting the revealed risks of the system in form of graphics in order to present them in aconcise way.
Looking at the results of a risk analysis certainly raises the question of meaningfulconclusions and resulting consequences for the system. Thus in order to be able to assess theresults, it is necessary to compare them to previously set acceptance criteria. These criteriacan either be legal requirements or might well be individual goals defined by the organisationitself. In case the study shows that the risks are above the acceptance criteria, risk reducingmeasures have to be considered and implemented. The intention of risk management and con-trol is then to observe their implementation and control their consequences and effectivenessupon the system in a repetitive loop.
11

12 CHAPTER 4. RISK ANALYSIS
Analysis Preparation
System Definition
Risk Reducing Measure
Hazard Identification
Frequency Analysis
Consequence Analysis
More Risk Reducing Measures
Acceptance Criteria
Risk Illustration
Risk Evaluation
Risk Estimation
Risk Analysis
Risk Assessment
Risk Management and Risk Control
Figure 4.1: The procedure of risk analysis [21]
The present chapter is intended to give an insight into the field of risk analysis and riskassessment, which aims to provide a background for the subsequent following performance ofthe risk analysis of the LHC underground area.
4.1 Historical review
During World War II, the armed forces in the US as well as in Europe observed majorproblems with the reliability of their armament. After the war, studies were carried outin order to analyse the origin of these problems, and the first steps towards reliability andrisk analysis were taken. The results revealed in the majority of cases that the equipment’savailability was far too low, and the cost for maintenance and repair during the lifetime ofthe equipment exceeded the cost of production by far. Although not yet performed in asystematical and consistent way, these early studies marked the beginning of the discipline

4.2. DEFINITIONS 13
of reliability and risk analysis [22].
In the 1960’s the aerospace and nuclear industries launched their first attempts onsetting goals for their safety policy and quantifying the risks of success or failure of theirendeavours. In the US aerospace sector this rethinking was raised by an accident of theApollo test AS-204 in 1967, which resulted in enormous additional costs and provoked aconsiderable loss of public support. The results of early estimates on the probability ofcatastrophic failures posed a threat to the plausibility of the entire space programme.Theprobability results were very high, and means for identifying these probabilities were notyet available and limited the possibilities of taking the step from mere qualitative studies tomeaningful quantitative analysis. NASA has since been working in the field of quantitativerisk analysis, and with its help could even reassure the US Congress that the money spenton shuttle development has not been in vain.
Although the basic methods of probabilistic risk analysis originated in the aerospaceindustry, the nuclear sector was then the first industry to actually carry out a full scale riskanalysis. The Reactor Safety Study WASH-1400 was published by the US Nuclear Regula-tory Commission (NRC) in 1975, which included a complex study of accident consequences.The reception of this study in the scientific world was very controversial, and ended in analienation of the NRC itself following review reports which stated that the conclusions ofthe Reactor Safety Study were “greatly understated”. With this development the future ofprobabilistic risk analysis did not look very bright. However, when in 1979 the Three MileIsland - 2 accident happened and it was revealed that the Reactor Safety Study had actuallypredicted this particular accident scenario, two independent analyst teams recommended tomake greater use of probabilistic methods in judging nuclear plant risks [23].
The methodology of probabilistic risk analysis has since developed very rapidly, whichis approved by numerous publications during the last 25 years extending the subject from theaerospace and nuclear sectors to industries as different as business management and banking.New approaches to risk analysis and assessment have been developed, now taking into accountmany different aspects of risk, and trying to achieve far more demanding safety goals set toprotect people and the environment as well as the business itself.
4.2 Definitions
In the field of probabilistic risk analysis, terms and definitions are often used with differentmeanings, depending on the type of industry being analysed and also on the persons incharge and their background. In order to avoid confusion and misunderstanding, the termswith their meanings used throughout this work will be subsequently given [24–27]:
Hazard describes a condition or activity, which has the potential of causing a dangerousor undesired event. In this way, a bucket of petrol considered on its own would not yet presentany hazard, but concretising this danger to people, environment or machines does result ina serious hazard.
Risk (R) is a measure for the magnitude of a hazard, covering two parameters: the ex-pected frequency (F) and the possible consequences (C) of an undesired event. The definition

14 CHAPTER 4. RISK ANALYSIS
Activity
Undesirable events
Consequence Loss
K2
K1
…
K3
C1
C2
…
C3
Figure 4.2: General risk model [24]
of risk is then:
R = F · C (4.1)
Or for an activity causing consequences of different magnitude i with their correspond-ing frequencies:
R =∑
Fi · Ci (4.2)
The consequences of an undesirable event are usually very diverse concerning their scaleof measurement. For example, the bursting of a pressure vessel can be caused by a subsystemor component failure and results in fatalities, personal injuries, environmental damage and/orloss of equipment or economic value. In order to be able to compare these consequences witheach other, they would have to be converted into a numerical loss using the same scale ofmeasurement. However, this conversion is difficult to undertake and is therefore replaced byseparate analyses of the different groups of consequences (Figure 4.2).
Graphically, the relation between the frequency and the consequence of an undesirableevent is represented in a so-called risk curve (Figure 4.3). The consequence is displayed on thehorizontal axis, in ascending order from the least to the worst; the corresponding frequencyis displayed on the vertical axis. If the relation is shown in the form of a complementarycumulative distribution curve, as illustrated in Figure 4.3, the curve gives the frequency ofan undesired event to produce a damage of the magnitude X or greater. As the definition ofrisk as pointed out in equation (4.1) gives only information about one frequency/consequencepair, it is suggested to obtain a risk curve for assessing risks whenever possible.
Risk analysis is the process of systematically analysing risk, consisting of the followingsteps: system definition, identification of hazards, frequency and consequence analysis andillustration of risk (possibly in a risk curve). The definition of risk assessment is thequantification of the frequency of an undesired event and its measurable consequences, asalready addressed above. Moreover, the comparison of these results with previously definedgoals to achieve or acceptance criteria. This definition shows that risk assessment and riskanalysis are very closely related to each other, and their meanings can therefore be easilyconfused.

4.2. DEFINITIONS 15
Com
plem
enta
ry C
umul
ativ
e Fr
eque
ncy
(x =
X)
Consequence (X)
1.E+04 1.E+05 1.E+06 1.E+07 1.E+08
1.E-09
1.E-08
1.E-07
1.E-06
1.E-05
1.E-04
Figure 4.3: Risk curve
The term risk management summarises all before mentioned definitions and con-cludes the step-by-step process with the control and communication of risk. In case theassessment results in unacceptable risks, adequate risk reducing measures are introduced andtheir execution and effect on the system are being observed. Risk management must there-fore be seen as a continual mission and be integrated in the activities of an organization orcompany.
Reliability is defined as the ability of a component or a system to perform a specificfunction within a given time period at default conditions, expressed as a probability. Similarto the definition of a risk analysis, the reliability analysis is a systematic analysis of thereliability of a component or a system. It is essentially the prediction of the frequency ofan undesired event, which connects closely the terms of risk and reliability analysis, as thelatter might form part of a risk analysis. When executing a reliability analysis, the mainfocus is on the component failure. On the contrary, a risk analysis rather focuses on theidentification of undesirable events and their consequences for the system, thus resting oncomponent reliability.
In contrast to reliability, the availability of a component or a system includes main-tenance, thus gives the probability that at a specific point in time the component or systemwill be in a functional state.
In IEC Standard 61508, “Functional safety of electrical/electronic/programmable elec-

16 CHAPTER 4. RISK ANALYSIS
Figure 4.4: Exemplary plant
tronic safety-related systems”, the term safety is defined as “freedom from unacceptable riskof physical injury or of damage to the health of people, either directly or indirectly as a resultof damage to property or to the environment” [28].
4.3 Methods, Application and Justification
The intention of the following chapter is to give an overview of some of the most commonreliability and risk analysis methods. Their basic principles and their execution will beexplained, and the reasons for choosing one of these for the present risk analysis will bediscussed.
In order to point out the differences between the methods, their applications will bedemonstrated with reference to the following exemplary plant (Figure 4.4, following [21]):The system comprises a tank in which an exothermic reaction takes place and therefore hasto be cooled, a heat exchanger and a cooling water pump. The amount of required coolant forthe heat exchanger is regulated by a control valve which is connected to the cooling water pipevia a temperature sensor. In case the pressure sensor in the tank indicates an overpressure,the operator can step in and increase the output of the pump. In case of emergency, theoperator can stop the pump via an emergency stop switch. Moreover, the tank is equippedwith a pressure relief valve.

4.3. METHODS, APPLICATION AND JUSTIFICATION 17
Guide Word Meaning
NO/NOT Negation of intention
MORE Quantitative increase
LESS Quantitative decrease
AS WELL AS Qualitative increase
PART OF Qualitative decrease
REVERSE Logical opposite of intention
OTHER THAN Complete substitution
Table 4.1: HAZOP - Commonly used guide words [22]
4.3.1 Hazard and Operability Study
The Hazard and Operability Study (HAZOP) [22,27] was designed for the qualitative analysisof the processes in a technical system by means of so-called guide words. The applicationof these guide words should identify the causes and effects of a deviation from the intendeddesign condition. By this means possible hazards in the system and caused by the system, aswell as the causes of operational failures and abnormalities compromising regular productioncan be discovered. Originally HAZOP was aimed at continuously producing plants, but byappropriately adapting the guide words it can also be applied to discontinuous processes.
4.3.1.1 The Principle of HAZOP
In order to carry out a HAZOP analysis, a full description of the process and the engineeringline diagram of the plant must be available. By questioning every part of it, the deviationsfrom the design intent are supposed to be revealed, and their causes and consequences canbe examined. Attention has to be paid to the required documentation, as it is absolutelynecessary that all data are up-to-date and consistent. At this point it is important to mentionthat HAZOP is not meant to be a compensation for good design. In case the analysisshows a high number of basic design faults, there is something fundamentally wrong and theengineering plan should be reassessed.
Commonly used guide words and their meanings are given in Table 4.1. In order to givean example of how to apply these guide words, some possible process parameter deviations ofa technical system are listed in Table 4.2. It must be pointed out that this basic set of guidewords has to be changed naturally according to the different requirements of the processparameters. However, their basic meaning as given in Table 4.1 does not change.

18 CHAPTER 4. RISK ANALYSIS
Process Parameter Deviation
Flow NO flow
REVERSE flow
MORE flow
Temperature HIGHER temperature
LOWER temperature
Pressure HIGHER pressure
LOWER pressure
Volume HIGHER level (in a tank)
Volume rate changes FASTER than expected
PROPORTION of volumes is CHANGED
Composition MORE component A
LESS component B
MISSING component C
pH HIGHER pH
LOWER pH
Viscosity HIGHER viscosity
LOWER viscosity
Phase WRONG phase
EXTRA phase
Table 4.2: Process parameter deviations for HAZOP [27]
4.3.1.2 Execution of HAZOP
In order to facilitate the performance of a HAZOP analysis and to provide a guideline through-out the whole process, a HAZOP form is filled out. It contains all features ranging from theguide word and its corresponding deviation over possible causes and consequences to neces-sary actions to be taken. Following this form step by step for each process parameter enforcesa gradual way of thinking and by this means helps to avoid ignoring important aspects of thetechnical system.
Table 4.3 shows one possibility of filling in a HAZOP form. In this example, any causecan result in any consequence for each guide word.
4.3.2 Failure Modes and Effects Analysis
Failure Modes and Effects Analysis (FMEA) [29] is another major method of identifying thehazards of a technical system. Different from the HAZOP method, the FMEA systematicallyreviews the system on a component-by-component basis. So starting from the possible failure

4.3. METHODS, APPLICATION AND JUSTIFICATION 19G
uid
eW
ord
Dev
iati
onPos
sible
cause
sC
onse
quen
ces
Act
ion
requir
ed
NO
No
flow
of
cooling
wate
rB
lock
age
inth
epip
ebef
ore
the
tank
No
cooling
ofth
eta
nk
Inst
all
flow
indic
ato
rin
the
cool-
ing
wate
rcy
cle
Blo
ckage
inth
epip
eaft
erth
eta
nk
Over
pre
ssure
inth
eta
nk,
pote
n-
tialex
plo
sion
Red
undant
cooling
wate
rcy
cles
Ruptu
reofth
epip
eR
elea
seofco
oling
wate
rR
egula
rm
ain
tenance
mea
sure
s
Failure
ofth
epum
pO
ver
hea
ting
ofth
epum
pR
edundant
pum
ps
Auto
mati
csh
ut-
dow
nofth
epum
pat
maxim
um
capaci
tyand
shut-
dow
nofth
esy
stem
LE
SS
Dec
reasi
ng
flow
of
cooling
wate
rFailure
ofth
epum
pR
educe
dor
no
cooling
ofth
eta
nk
Auto
mati
csh
ut-
dow
nofth
epum
pat
maxim
um
capaci
tyand
shut-
dow
nofth
esy
stem
Failure
ofhea
tex
changer
Over
hea
ting
ofth
epum
pR
egula
rm
ain
tenance
mea
sure
s
Part
ialblo
ckage
Over
pre
ssure
inth
eta
nk
Red
undant
pum
ps
Ruptu
reofth
epip
eN
egati
ve
effec
tsfo
rth
epro
cess
cy-
cle
(inco
rrec
tpro
cess
para
met
ers)
Inst
all
flow
indic
ato
rin
the
cool-
ing
wate
rcy
cle
Rel
ease
ofco
oling
wate
rR
edundant
cooling
wate
rcy
cles
MO
RE
...
...
...
...
NO
No
flow
ofco
ola
nt
Blo
ckage
ofth
epip
eN
oco
oling
ofth
eta
nk
Reg
ula
rm
ain
tenance
mea
sure
s
Ruptu
reofth
epip
eO
ver
pre
ssure
inth
eta
nk,
pote
n-
tialex
plo
sion
Inst
all
flow
indic
ato
rin
the
coola
nt
cycl
e
Failure
ofhea
tex
changer
Rel
ease
ofco
ola
nt
Inst
all
tem
per
atu
reala
rmdev
ice
(abov
em
axim
um
cooling
wate
rte
mper
atu
re)
Failure
ofte
mper
atu
rese
nso
rR
edundant
senso
rs
Failure
ofco
ntr
olva
lve
LE
SS
...
...
...
...
Tab
le4.
3:H
AZO
Pfo
rm(f
ollo
win
g[2
2])

20 CHAPTER 4. RISK ANALYSIS
modes of each component, the effects on the adjacent units and then the whole systemare detected. Experience shows that 80% of failures, which occur during the lifetime ofcomponents, are due to weak points in their design and development [21]. Thus by starting theanalysis at a component level and bearing in mind these elementary failure modes, adequatesafety measures for the whole system can be proposed.
A further development of the FMEA, which provides the analyst not only with a quali-tative, but also a quantitative analysis, is the Failure Modes, Effects and Criticality Analysis(FMECA). The identified failure modes are assessed by means of two more parameters, thefrequency of occurrence of a failure mode and the severity of its consequences. Depending onthe needs of the study, either FMEA can be carried out on its own or in combination with acriticality analysis.
4.3.2.1 Execution of FMEA
Guidance on FMEA and FMECA is given in BS 5760, “Reliability of systems, equipmentand components, Part 5: Guide to failure modes, effects and criticality analysis (FMEA andFMECA)”, out of which the general principles to be illustrated in this work are taken.
Like for the HAZOP method, a FMEA form is filled out in order to proceed graduallyand to maintain overview throughout the study (Table 4.4). In this way all componentsare listed, their possible failure modes identified and then examined with respect to possiblefailure causes and consequences.
As a component can fail in more than one way, and moreover the failure causes mightas well be multiple, it is very important to deal with each of these parameters in detail.The list of failure modes of a single component can be very extensive, as shown in a list ofgeneric failure modes (Table 4.5). Moving on from a list of different failure modes to theirpossible causes is then again a significant step with regard to the possibly following criticalityanalysis, for which, depending on the identified failure causes, the frequency of occurrence isestimated.
4.3.2.2 Criticality Analysis
When analysing a system with a view to criticality, the previous worksheet for the FMEA isextended by two more columns, frequency of occurrence and severity of consequences.
By assigning frequency and severity to each failure mode of a component, a so-calledrisk matrix can be obtained, in which the frequency is displayed on the vertical axis andthe severity on the horizontal axis. Plotting all frequency - severity pairs results in a visualpresentation of the relative importance of each failure mode. When the area of the matrixis divided into four zones (A, B, C and D), as shown in Figure 4.5, the pairs located inzone D indicate those cases with the highest frequency of occurrence and the most significantconsequences. Therefore these cases are revealed as those with the highest priority in termsof corrective actions.

4.3. METHODS, APPLICATION AND JUSTIFICATION 21It
emR
efIt
emD
escr
iption
Fai
lure
Entr
yC
ode
Fai
lure
Mode
Pos
sible
Cau
ses
Pos
sible
Con
sequen
ces
Com
pen
sati
ng
Pro
vis
ions
1P
um
p1.1
Lea
kage
Faulty
sealing,
wea
r,co
rrosi
on
Red
uce
dor
no
cooling,
over
-pre
ssure
inth
eta
nk,
inco
rrec
tpro
cess
para
met
ers,
rele
ase
of
cooling
wate
r,ov
erhea
ting
of
the
pum
p
Flo
win
dic
ato
rin
the
cooling
wate
rcy
cle,
corr
osi
on
pro
tec-
tion,re
dundant
pum
ps
1.2
Blo
ckage
Impuri
ties
No
cooling,
over
pre
ssure
inth
eta
nk
(pote
nti
alex
plo
sion),
over
-hea
ting
ofth
epum
p
Auto
mati
csh
ut-
dow
nof
the
pum
patm
axim
um
capaci
tyand
shut-
dow
nof
the
syst
em,
filt
erand
flow
indic
ato
rin
the
cooling
wate
rcy
cle,
redundant
pum
ps
1.3
Bre
akdow
nFailure
of
the
engin
e,pow
erfa
ilure
No
cooling,
over
pre
ssure
inth
eta
nk
(pote
nti
alex
plo
sion)
Reg
ula
rm
ain
tenance
mea
sure
s,re
dundant
pum
ps
2H
eat
exch
anger
2.1
Lea
kage
(cooling
wate
rand
coola
nt)
Faulty
sealing,
wea
r,co
rrosi
on
Red
uce
dor
no
cooling,
over
-pre
ssure
inth
eta
nk,
inco
rrec
tpro
cess
para
met
ers,
rele
ase
of
cooling
wate
rand
coola
nt
Tem
per
atu
reala
rmdev
ice,
flow
indic
ato
rsin
both
cycl
es,co
rro-
sion
pro
tect
ion
2.2
Blo
ckage
(cooling
wate
rand
coola
nt)
Impuri
ties
No
cooling,
over
pre
ssure
inth
eta
nk
(pote
nti
alex
plo
sion),
over
-hea
ting
ofth
epum
p
Tem
per
atu
reala
rmdev
ice,
flow
indic
ato
rsin
both
cycl
es,filt
ers
inboth
cycl
es
3C
ontr
olva
lve
3.1
Fails
open
Mec
hanic
albre
akdow
nIn
corr
ect
pro
cess
para
met
ers
Flo
win
dic
ato
rin
the
coola
nt
cycl
e
3.2
Fails
close
dM
echanic
albre
akdow
nN
oco
oling,
over
pre
ssure
inth
eta
nk
(pote
nti
alex
plo
sion)
Flo
win
dic
ato
rin
the
coola
nt
cycl
e
3.3
Open
s/cl
ose
spart
ially
Faulty
data
transm
is-
sion,m
echanic
albre
ak-
dow
n
Inco
rrec
tpro
cess
para
met
ers
Flo
win
dic
ato
rin
the
coola
nt
cycl
e
3.4
Lea
kage
Faulty
sealing,ru
ptu
re,
wea
r,co
rrosi
on
Inco
rrec
tpro
cess
para
met
ers
Reg
ula
rm
ain
tenance
mea
sure
s,co
rrosi
on
pro
tect
ion
4...
4.1
...
...
...
...
Tab
le4.
4:FM
EA
wor
kshe
et(f
ollo
win
g[2
9])

22 CHAPTER 4. RISK ANALYSIS
1 Cracked/fractured 21 Binding/jamming
2 Distorted 22 Loose
3 Undersize 23 Incorrect adjustment
4 Oversize 24 Seized
5 Fails to open 25 Worn
6 Fails to close 26 Sticking
7 Fails open 27 Overheated
8 Fails closed 28 False response
9 Internal leakage 29 Displaced
10 External leakage 30 Delayed operation
11 Fails to stop 31 Burned
12 Fails to start 32 Collapsed
13 Corroded 33 Overloaded
14 Contaminated 34 Omitted
15 Intermittent operation 35 Incorrect assembly
16 Open circuit 36 Scored
17 Short circuit 37 Noisy
18 Out of tolerance (drifted) 38 Arcing
19 Fails to operate 39 Unstable
20 Operates prematurely 40 Chafed
Table 4.5: Generic failure modes [29]
In reference to the exemplary plant, an assessment of a blockage of the pump (failureentry code 1.2 in Table 4.4) could reveal e.g. a frequency of class 4 and a severity of class 5.These values would place it into zone D of the risk matrix and therefore rate it as a failuremode for which improvement measures have to be implemented without the least delay. Onthe contrary, a control valve failing open (failure entry code 3.1 in Table 4.4) may occur lessoften and may have less severe consequences for the system, thus is situated in zone A of therisk matrix.
4.3.3 Fault Tree Analysis
After analysing the system, identifying inherent hazards and studying possible consequencesby means of a HAZOP or FMEA/FMECA, the next step is a failure frequency analysis.Technical systems are usually very complex, and the interaction and linking of the componentsare difficult to determine. It is therefore rather impossible to identify the frequency of asystem failure without reverting to the history leading up to it.
A fault tree analysis (FTA) [22, 23, 30] is a graphical method which allows the analyst

4.3. METHODS, APPLICATION AND JUSTIFICATION 23
A
A
A
A
A
A
A
A
A
A
B
B
B
B
B
C
C
C
C
C
C
C
D
D
D
1 2 3 4 5
1
2
3
4
5
Severity classes
Failu
re fr
eque
ncy
clas
ses
Figure 4.5: Risk matrix for FMECA [29]
to illustrate the events which result in a defined system failure. By applying simple logicalrelationships in order to define the behaviour of components, it is possible to reproduce thesystem and represent it in a methodical structure. Boolean algebra is then used to calculatea system failure rate based on identified component failure rates.
4.3.3.1 Fault Tree Elements and Symbols
The basic elements for the construction of a fault tree are the top event, intermediate events,basic events and the logic gates. The top event is usually defined as an undesired event. Asthe failure of the whole system is hard to specify, it is rather defined as the failures of certainfunctions which significantly affect the performance of the entire system, i.e. fire, explosion,toxic release. Starting from this top event, the fault tree is then developed top down overintermediate to finally basic events. These basic events represent the failure of a componentand are not further developed. All elements and their graphical representation can be foundin Table 4.6.
In order to link all elements of a fault tree together, logic gates are needed. A gatealways consists of several input events and one output event. The logic gate then illustrateshow the input events are interacting with each other in order to result in the output event.The two main gates used are the AND gate and the OR gate. The output event of an AND

24 CHAPTER 4. RISK ANALYSIS
Symbol Function Description
Basic event Event requiring no further development
Intermediate eventEvent which occurs due to antecedent causes acting through alogic gate
Undeveloped event Event for which further subdivision was not done
Transfer inSymbol indicating that the tree is developed further at the cor-responding Tranfer out symbol
Transfer out
Symbol indicating that the portion of the tree below the symbolis to be attached to the main tree at the corresponding Transferin symbol
Table 4.6: Elements of a fault tree analysis [22,30]
gate only occurs if the input events all occur at the same time. As opposed to this, thecondition for an OR gate is that at least one out of all input events must occur in orderto cause the output event to happen. There are a small number of other gates, shown andexplained in Table 4.7.
4.3.3.2 Fault Tree Construction
The first step in the procedure of constructing a fault tree is the definition of the systemunder discussion with its boundaries and the determination of a top event. As the faulttree is a logic representation of reality, it is important to define the system very precisely.Depending on the type of system (i.e. system with a reactor, safety system) and the purposeof the analysis, the boundaries have to be set in a reasonable way in order to avoid leavingout important components or, on the contrary, taking too many components into accountwhich are not directly associated with and might not even influence the top event.
When the top event is defined, the tree is developed top down by finding all necessarycauses, which should be components where failures provoke the top event to occur. This isdone step by step, first the immediate events which are then further developed and thereforebecome more detailed, finally leading to the basic events. It is very important to describethe state of each event, intermediate as well as basic, in order to avoid misunderstanding andconfusion (Figure 4.6) [23].
Guidelines for the construction of a fault tree are given in [Kumamoto and Henley, 1996, p.184]:

4.3. METHODS, APPLICATION AND JUSTIFICATION 25
Fig
ure
4.6:
Qua
ntit
ativ
ean
alys
isof
afa
ult
tree

26 CHAPTER 4. RISK ANALYSIS
Symbol Function Description
AND gate Event occurs only if all input events occur simultaneously
OR gate Event occurs if one or more of the input events occur
PRIORITY ANDgate
Event occurs only if all input events occur in a specific sequence(specified by conditioning event to the right of the gate)
EXCLUSIVE ORgate
Event occurs only if one of the input events occurs alone
INHIBIT gateEvent occurs only if input event attached to the right occurswhile the event attached to the bottom and forming the condi-tion is in force
Table 4.7: Symbols of a fault tree analysis [22,30]
1. Replace an abstract event by a less abstract event.Example: “motor operates too long” versus “current to motor too long”.
2. Classify an event into more elementary events.Example: “tank rupture” versus “rupture by overfilling” or “rupture due to runawayreaction”.
3. Identify distinct causes for an event.Example: “runaway reaction” versus “large exotherm” and “insufficient cooling”.
4. Couple trigger event with “no protective action”.Example: “overheating” versus “loss of cooling” coupled with “no system shutdown”.
5. Find cooperative causes for an event.Example: “fire” versus “leak of flammable fluid” and “relay sparks”.
6. Pinpoint a component failure event.Example: “no current to motor” versus “no current to wire”. Another example is “nocooling water” versus “main valve is closed” coupled with “bypass valve is not opened”.
4.3.3.3 Quantitative Analysis
When a fault tree is analysed in a quantitative way, probability data for each basic eventare required. Based on that, probability values of the intermediate events can be calculatedaccording to the logic structure of the tree, finally producing the probability of occurrence

4.3. METHODS, APPLICATION AND JUSTIFICATION 27
Symbol Boolean Algebra Relation Probability Relation A
B C
A = BC P(A) = P(B)P(C)
A
B C
P(A) = P(B) + P(C) - P(B)P(C)
A = B + C Provided that the probabilities are low:
P(A) ≈ P(B) + P(C)
Table 4.8: Probability relations for a quantitative fault tree analysis [22]
of the top event. The probability relations for the two main logic gates of a fault tree areshown in Table 4.8.
If a basic event occurs more than once and in case the tree is large with e.g. 20 or morebasic events, the help of computer programmes is needed.
The quantification of the fault tree in Figure 4.6 has been done manually following theprobability relations in Table 4.8. After defining the basic events’ failure probabilities, thetop event probability has been calculated at 1.00 · 10−6.
4.3.4 Event Tree Analysis
Compared to a fault tree analysis, an event tree analysis (ETA) [22,26] does not present theevents leading up to, but shows the possible consequences of a failure of the system. It isdeveloped bottom-up, so starting from an initial event all possible outcomes after reaction ofsubsequent safety-engineering systems are illustrated. If it is used in a qualitative way, theresult is a list of possible states of the system after an initiating event. However, used in aquantitative way, also the probability of each individual outcome can be determined.
4.3.4.1 Event Tree Construction
The first step to the construction of an event tree is the definition of an initial event. Thiscan be either an accident due to the failure of a system component or an external impacton the system, i.e. explosion, toxic release, flooding. The second step is the definition andidentification of all safety systems which could be triggered after the accident. They arearranged in their order of coming into operation as headings of the event tree. Once thisis done, the possible consequences following the initial event are deduced and pictured inso-called branches, each representing a different sequence of events and resulting in a definedfinal system state. The initial event is usually placed on the left, and the branches are drawn

28 CHAPTER 4. RISK ANALYSIS
Tem
pera
ture
se
nsor
Initi
atin
g ev
ent
Con
trol v
alve
Pres
sure
sen
sor
Ope
rato
r Pr
essu
re re
lief
valv
e
P(B
ranc
h) =
Syst
em s
tate
9.41
· 10
-7
2.48
· 10
-9
7.22
· 10
-9
9.50
· 10
-11
1.79
· 10
-9
3.80
· 10
-8
1.81
· 10
-11
4.75
· 10
-12
2.50
· 10
-11
9.41
· 10
-9
4.70
· 10
-10
Fa
ilure
in
cool
ant c
ycle
1.0
· 10-6
Safe
sta
te
Safe
sta
te
Fail
safe
T
ank
expl
osio
n Fa
il sa
fe
Tan
k ex
plos
ion
Safe
sta
te
Fail
safe
T
ank
expl
osio
n Fa
il sa
fe
Tan
k ex
plos
ion
0.95
0.05
0.99
0.01
0.95
0.05
0.80
0.20
0.99
0.01
0.99
0.01
0.95
0.05
0.80
0.20
0.99
0.01
0.99
0.01
1.00
· 10
-6
Fig
ure
4.7:
Qua
ntit
ativ
ean
alys
isof
anev
ent
tree

4.3. METHODS, APPLICATION AND JUSTIFICATION 29
Criteria HAZOP FMEA FTA ETA
Applicability 1 2 2 0
Significance 1 1 2 0
Traceability 1 2 2 0
Σ 3 5 6 0
Table 4.9: Overview of risk analysis methods
to the right (Figure 4.7).
In order to be able to draw the branches it is necessary to define one success and onefailure state for each safety system. So in case the safety system would be a pressure reliefvalve, the corresponding success state would be the safe release of overpressure from the tankand the failure state the breakdown of the valve resulting in a tank explosion. Each of thesetwo states gives a branch of the tree. Once the states for each system are defined, the accidentsequences linked to the initial event can be obtained step by step by applying binary logicto each safety system which is demanded. The final system states are then a combinationof either success or failure of each safety system during the development of the tree. Thestandard tree structure is thereby defined with the success states above the failure states.
4.3.4.2 Quantitative Analysis
The objective of evaluating an event tree is the determination of the probability of eachaccident sequence and therefore the probability of all possible system states, provided theinitial event has occurred.
For the calculation, the conditional probabilities of success and failure states of eachsafety system have to be defined and the frequency of occurrence of the initial event has tobe known. Then this frequency has to be multiplied by the conditional probabilities of thesafety systems for each branch. In this manner, the frequencies of all possible final systemstates are determined. The sum of all these frequencies has to produce the frequency of theinitial event, the conditional probabilities have to sum up to 100 (Figure 4.7).
4.3.5 Risk Analysis Methods at a Glance
Table 4.9 gives an overview of the previously introduced risk analysis methods in view of theproblem at hand, the fire risk due to faulty electrical equipment in the LHC tunnel. Thethree criteria are assessed for each method and the rating is added up, thereby revealing themost adequate technique. For the assessment, the subsequent classification is used: good (2),medium (1), bad (0).
In order to be able to judge the risk analysis methods on the basis of the three criteria,they will be explained and discussed briefly.

30 CHAPTER 4. RISK ANALYSIS
The highest score for applicability is assigned to a method if its procedure and intendedoutcome match the requirements for the present problem. A method is applicable to assessingthe fire risk in the LHC tunnel if the results can actually reveal frequency and consequences ofan incident. Determining the significance of a method then goes one step further and has todecide if the outcome does have a meaning for the analysis. Although applicability might begood, the significance of the results could turn out not to be meaningful for the assessment ofthe situation. The highest score for significance can only be assigned if an actual probabilityof having a fire in the LHC tunnel can be determined. Finally, traceability of a method isjudged in order to evaluate how easily the procedure can be traced and understood.
The rating shows that a fault tree analysis as well as a Failure Modes and EffectsAnalysis are considered the best options for the analysis of the LHC fire risk. On the otherhand, a Hazard and Operability Study and an event tree analysis are less appropriate.
With the least possible score the event tree analysis is not suitable for analysing andassessing fire risk. It is a method intended to reveal the consequences of an initial event (e.g.fire) relating to the answers of subsequent safety systems. This means that by definition itcannot be applied for determining the probability of fire risk in the tunnel.
Conducting a Hazard and Operability Study would in principle be possible; however,applying guide words to electricity in respect to electrical equipment complicates their specificdefinition. Moreover, faulty electrical equipment does not only include failures related to adeviation of the power supply, but also failures referring to mechanical malfunctions. Thesignificance of a HAZOP study for the present problem is only minor, as no quantitativeassessment is possible. Traceability of this method would be slightly difficult, as the questionof how to apply guide words to electricity is not always clear.
With a score of 5 points out of 6, the Failure Modes and Effects Analysis is certainlyapplicable to the problem of determining the fire risk in the LHC tunnel. A controlled wayof defining failure modes of the system as well as their possible causes and consequencesprovides a list of events which can occur. The quantitative analysis by means of frequencyand consequence analysis then allows for a classification of failures and the setting of prioritiesregarding improvement measures. However, in terms of significance a FMEA would not beable to deliver suitable results, as it is not possible to estimate a total probability of fire.
This problem leads directly to the last method to be discussed, the fault tree analysis.The significance of this technique was judged slightly better than of the FMEA, because asan overall result a system failure rate can be calculated. Developing the tree top-down withfire in the LHC tunnel as the top event leads to the basic events to which failure rates can beassigned. With the help of Boolean algebra the probability of a fire in the LHC undergroundcan then be calculated.
The highest scores for applicability, significance and traceability were assigned to thefault tree analysis, and therefore it will be chosen for analysing the present problem. However,since it would not be able to provide with a concise and easily understandable listing of systemfailure modes and their possible causes and consequences, it will be coupled with a FailureModes and Effects Analysis.

4.3. METHODS, APPLICATION AND JUSTIFICATION 31
4.3.6 Justification
As illustrated in the previous chapters, an extensive risk analysis and assessment requiresa precise knowledge of the entire system. Depending on the purpose of the study and theavailable resources, different risk analysis methods can be applied. Before going into the de-tailed analysis, basic questions such as clarification of methods, procedure, scope of resources,definition of objectives, determination of the object of analysis and its system boundaries,and specification of the system status to be analysed have to be considered.
The present chapter gives explanations concerning the development from original ideasof an overall risk analysis of the LHC underground, including all subsystems, to the actualsubject of this thesis.
In the history of CERN, several risk analyses for the detectors of the Large Electron-Positron Collider have been carried out [31–34]. Although for some of those known riskanalysis methods have been used, they were not presented in a detailed way, showing pro-gressively the development from hazards over causes and consequences to resulting safetymeasures. Others were undertaken only by compiling lists of possible hazards in combinationwith the already existing safety measures and then deriving arrangements for improvement.As in the 1980’s the risk analysis methods were not yet as mature and in-depth as we knowthem today, the way of approaching the problem by logical listing of hazards and structuringof the system is understandable. However, without thinking extensively about possible causesand consequences of failures, the accident scenarios cannot be judged correctly and may notlead to the deduction of the actually necessary safety measures. Moreover, the following ofa certain technique and its guidelines would help to keep an overview and not to overlookimportant facts.
For the LHC, the situation is slightly different. Public interest in safety as well as thescope of the field of risk analysis has increased. CERN has to try for safe operation of the ma-chine in view of public acceptance and the protection of people, environment and equipmentfrom major hazards. Risk analyses for single systems of the LHC, e.g. the cryogenic system,have been undertaken in order to arrange appropriate safety measures in case of operatingproblems [35]. However, the interaction with other systems and a view to the entire systemof the LHC was not approached.
The original idea of the present study was to prepare an extensive risk analysis forthe entire LHC tunnel and its systems. Following the basic guideline (Figure 4.1), the firstapproach to define the system was done as shown in Figure 4.8.
As the LHC is a complex system, it was essential to reduce the boundaries in order tobe able to consider the LHC as a whole. Thus the vital subsystems were chosen and classifiedin three different groups by their function and objective for the whole system, which is mostlycorresponding to the conventionally used classification at CERN. The three main groups aretherefore the Machine Operation system, the Machine Protection system and the GeneralSafety system.
The Machine Operation system includes all systems which are necessary to operate themachine, thus superconducting and conventional magnets, powering network and electricaldistribution, power converters (PCs), cryogenics system, vacuum system (VAC), cooling and

32 CHAPTER 4. RISK ANALYSIS
LBDS, BLM, PIS, BIS, QPS, Collimation
Magnets, Powering and electrical distribution, PCs, VAC, Cryogenics, C&V, RF
Machine Protection system
fire/smoke detection, ODH detection, flooding detection, …
Machine Operation system
General Safety system
LHC
Figure 4.8: System definition of the LHC underground
ventilation (C&V) and radio frequency system (RF). All these were designed with intrinsicsafety measures, such as e.g. overpressure valves for the cryogenic system. However, in orderthat the operation of the machine is kept under control, the Machine Protection system isneeded [36].
The aim of the Machine Protection system is to protect all equipment against uncon-trolled release of energy stored in the magnets and the beams. This means that in case oftriggering the Beam Interlock system (BIS), the beams are dumped safely via the LHC BeamDumping system at point 6 (LBDS). Other systems making a contribution to the protectionof the machine are the Beam Loss Monitors (BLM), the Power Interlock system (PIS), theQuench Protection system (QPS) and the Collimation system. With the Machine Operationsystem and the Machine Protection system in place the LHC is ready for operation and verywell covered from the point of view of machine and equipment safety.
The General Safety system [37] is designed for personnel and environmental safety,as there still remain general risks which are not related to radiation: external risks (suchas earthquake, flooding, fire or plane crash) and internal risks (such as dissemination ofradioactive or toxic material, internal/external exposure to ionizing radiation, fire, explosion,chemical risks, mechanical risks or cryogenic risks) [38]. They consist of different safetysystems with the aim of primarily preventing any accident to happen. However, in case anexisting risk does cause an accident, they protect personnel and environment by reducingits severity. The following systems form part of the General Safety system: fire and smoke

4.3. METHODS, APPLICATION AND JUSTIFICATION 33
detection, flammable gas detection, Oxygen Deficiency Hazard (ODH) detection, EmergencyCommunication system, Emergency Evacuation system, emergency stop, flooding detectionand Blocked Lift Alarm system.
The LHC Access systems [39], the CERN Safety Alarms Monitoring system (CSAM)[40] and the Radiation Monitoring System for the Environment and Safety (RAMSES) [41]also play an important role for safety, but are not part of the General Safety system.
The LHC Access systems comprise the following elements: the LHC Access Safetysystem (LASS) and the LHC Access Control system (LACS). The former ensures that duringoperation of the machine personnel is protected against radiation hazards resulting fromaccelerator operation. On the other hand, while the machine is not operating, the lattersystem identifies personnel requesting access and verifies the required qualifications (safetytraining) and authorisations (access rights).
CSAM is responsible for receiving and transmitting all alarms triggered by safety sys-tems of the LHC to the fire brigade. Thereby it is guaranteed that a professional interventionof the fire brigade is possible.
RAMSES was originally designed for radiation protection; however, today it also in-cludes conventional environmental measurements. Its principal duty though is the monitoringof the ambient dose equivalent rate in the LHC underground areas as well as on the CERNsurface sites.
A risk analysis can be applied at any state of a project, starting with the researchand development phase over planning, installation, commissioning and operation phases toshutdown and removal of the plant. In the case of the present thesis it was in the interestof CERN to analyse the remaining risks of the machine after examining all technical andsafety systems and possibly discovering inconsistencies. Thus it was decided to prepare theanalysis for the state of machine operation. This condition implies that there are actuallyno people in the tunnel and therefore environmental and machine safety was stressed. Theobjectives behind it were the discovery of high risk interdependencies and an input for im-proved protection of environment and equipment with regard to the already existing safetysystems.
The determination of the object of analysis and its system boundaries then was acomplicated task to accomplish. At first it seemed to be rather easy, taking the entire LHCwith all its different subsystems as defined in Figure 4.8 into account. However, the setting ofsystem boundaries turned out to be very problematic. The problem specification was actuallylimited to the LHC underground, but most of the subsystems are connected to the surface insuch a way that it is difficult to draw a line between important interactions and those whichcan be omitted for the study. Moreover, their interactions with each other are very complexand barely definable in a concise way. So e.g. a leak in the cryogenic system could lead toproblems in the vacuum system, an embrittlement of mechanic structures, a magnet quenchand a contamination of the tunnel with helium. The number of involved systems concerningthe consequences is very high, but it is even higher when considering all safety systems whichare supposed to respond as well.
Another demanding subject in connection with the definition of the system is the levelof detail, so the analysis depth up to which the problem should be questioned. With that

34 CHAPTER 4. RISK ANALYSIS
many subsystems and different technical equipments involved, it was impossible to find thesame level for all systems which would not distort the final results.
Summarising all the difficulties and problems mentioned above, and also thinking aboutthe fact that an extensive risk analysis of this size would require a much higher manpower,it was then decided to concentrate on only one important aspect for a detailed study.
In order to operate the LHC and at the same time take care of machine and environ-mental safety, a great number of electronic and electrical equipment for operation as wellas control and surveillance is installed in the underground area. Therefore the emphasis ofthe present thesis was laid on fire risk due to faulty electrical equipment. The history ofincidents involving fires at CERN shows that the chosen issue is of interest, as actually all ofthem were caused by failures in electrical installations. Although fortunately there were nocasualties, the damage caused was quite impressive: burnt equipment, superficial damagingof the building and surroundings and/or downtime of the machine. The cost of repair in onecase even amounted to 11 million CHF.
When considering a cost of a magnet of 1 million CHF, the consequences of an incidentin these contained conditions are amplified in respect of both cost and downtime. Couplingthis with the radiation risk demonstrates the extreme safety concerns for the machine, itspersonnel, the public and the environment.
The new definition of the problem, namely a fire in the LHC underground caused bya failure in electrical equipment, reduced the complexity of the analysis and simplified thedefinition of systems involved: the LHC as a whole will be seen as an electrical installation,thus only one system is to be examined.
The methodical way of solving the problem is based on a combination of existing riskanalysis methods. Following the comparison of different methods and their rating in view ofthe present problem, two methods were chosen: the Failure Modes and Effects Analysis andthe fault tree analysis.
As the full understanding of the system is the most important factor for a meaning-ful result, the FMEA was chosen for this first step. It forces the analyst into successivethinking and provides a concise overview of possible failure modes of electrical equipmentand subsequently their causes and consequences. A breakdown of the entire system can beachieved and all actually involved participants can be identified. The possibility of includingfrequency and consequence analysis (Figure 4.1) allows for an assessment of how probableelectrical failures are and how severe their consequences could be.
Alongside the FMEA the question of location and material properties of the LHCsubsystems is also to be examined, as among the main influencing factors for fire risk in thetunnel is actually the presence of inflammable material and its vicinity to possible ignitionsources. Thus the collecting of material properties of the LHC subsystems and their locationin the tunnel form an important part of the thesis. The combination of location of inflammablematerial and electrical equipment then allows for the discovery of all the areas significantlyaffected.
Once the first step of the study is completed, the question how high the risk of firein the LHC underground is still remains unanswered. The method to be used when asking

4.4. FAILURE RATE DATA 35
for a probability of occurrence of a fire is the fault tree analysis. With the help of the treestructure the failure sequences can be illustrated in a descriptive and clear way. By assigningfailure rates to basic events in the fault tree and applying Boolean algebra calculations, theoverall risk of fire in the LHC tunnel can be determined.
4.4 Failure Rate Data
The correct identification of failure rate data for a quantitative risk analysis is the mostcomplex and intense part of the entire procedure [21].
Internally collected system-dependent failure rate data of a facility are the best sourcefor reliable data. In order to be able to create a database of the components in use and theirbehaviour during operation, documentation concerning failures together with the operationalcircumstances and their frequency of occurrence should be kept. In this manner, the validityof the data is beyond doubt and can be used for a quantitative analysis.
In case no system-dependent data are available, generic data can be useful. They areusually deduced or calculated data issued in general publications. However, since these dataare taken from comparable facilities and transcribed to the object under investigation, theirvalidity for the present application is not always beyond doubt. In order to be able to applythis data, it is necessary to be absolutely sure about the characterisation of the object and theoperating conditions for which the data were recorded. However, if exercised with caution,these data can be used and do present an augmentation of the base data.
The last possible approach to assessing the frequency of occurrence would be an esti-mation done by experts concerning the behaviour of the item under consideration. An expertin this case would be a person working with the object, preferably with some years of expe-rience. Although it is a rather dissatisfactory solution for the analysis, it is often the onlypossibility.


Chapter 5
Fire Risk
5.1 Fire Risk of Electrical Installations
The subject of fire hazards due to electrical equipment failures has not been addressed ex-tensively in literature. Although there is information available, the majority of these studiesusually focuses only on 120/240 V distribution systems and the failures involving electricalhousehold appliances. So according to fire statistics in the 1990’s concerning home structurefires in the US, the cause of electrical distribution failures accounts for 9.7% of the totalnumber of fires. Electrical distribution failure is therefore ranked fifth concerning the causeof fires, ranked fourth concerning the cause of fire fatalities, and ranked second concerningthe cause of property loss.
Though international databases providing fire statistics do exist, there are some dif-ficulties to keep in mind before applying this data. Research about the actual physicalmechanisms of faulty electrical equipment leading to a fire is generally scarce. Moreover, thedetailed reporting concerning the real cause of the fire is often missing, thus not permittingto draw conclusions without uncertainty of the data [42].
By analysing the existing statistical data, Keski-Rahkonen, Mangs and Turtola (1999,2002) study the electrical causes of fires in both nuclear and non-nuclear installations [1,43].Statistics according to the Federation of Finnish Insurance Companies were analysed con-cerning large fire accidents in Finland from 1980 - 1993. Using the national accident databaseONTIKA (1991) the total number of fires in Finland in 1994 and 1995 were investigated, fo-cussing on electrical fire causes. A level of uncertainty of the statistics applies to both cases,as either detailed fire investigations were not conducted at all or the fire causes were justroughly guessed.
Concerning nuclear installations the Advanced Incident Reporting System (AIRS) data-base (1997) was used, which is a database maintained by the Nuclear Energy Agency (NEA)and the International Atomic Energy Agency (IAEA). The authors state that the most fre-quent types of electrical ignition mechanisms in nuclear installations are short circuit, groundfault, arcing and overheating. Compared to that, loose connections as the cause of a fire donot occur as often. However, since the group of unknown failure mechanisms accounts for
37
38 CHAPTER 5. FIRE RISK
more than 30% of the events, the uncertainty of the analysed data is apparent. Additionally,the problem of defining the true cause of a fire is aggravated by the fact that usually not onlyone failure mechanism occurs, but a chain of faults.
When a fire occurs, it has to be distinguished between the first failed component andthe first ignited component or material. These two classes do not necessarily have to coincide,as a fault in one electrical device can provoke a chain of faults eventually leading to ignitionof another device.
In non-nuclear facilities the first failed components are electrical distribution cablesand other components connected therewith. In contrast, the first material ignited is oil fromtransformers, breakers, etc., followed by cable insulation. The authors therefore come to theconclusion that cable insulation is the most important flammable material at the initial phaseof a fire due to electrical equipment failures. In nuclear installations wiring and cables arenot as frequently the first failing components due to stricter quality control.
The LHC project is a large electrical installation, containing high amounts of cables andelectrical equipment and involving both high and low power distribution systems. Bearingthe afore mentioned statistical information concerning nuclear and non-nuclear installationsin mind, the study of fire risk in the LHC tunnel is of very high importance.
5.2 Historical Review about Fires at CERN
In CERN’s history there have been a few fires with rather severe consequences, fortunatelynot involving casualties. The damage is limited to burnt equipment, superficial damagingof the building and surroundings and/or downtime of the machine. The following accidentshave one common feature: their actual cause is the failure of electrical equipment. Thedevelopment of these fires did not occur in the presence of workmen causing it through anyhuman failure, but purely from an internal failure of equipment.
The number of fires at CERN in total is certainly higher than those mentioned above;however, in this study only those where the causes can not be attributed directly to humanintervention or human failure will be discussed.
In 1975 a temporary patch panel in the PS (Proton Synchrotron) complex caught fire,propagating towards the gallery underneath and through the cable trays towards the PSsubstation [44]. The actual cause of the fire could not be defined precisely; however, in thefinal report it was stated that its origin was electric: either arcing or overheating. Metalincrustations in the concrete found close to the patch panel, which could be an indication ofan electric arc between cables and metal.
The fire was actually detected by a failure report in the Control Room concerning thetemporary patch panel. After an inspection on the spot, smoke was detected underneath thepanel.
Where the fire had spread, the equipment and surrounding was totally damaged.Within a wider perimeter, the equipment was internally damaged because of corrosive smoke.Buildings in the surrounding area were superficially damaged due to the deposition of hy-

5.2. HISTORICAL REVIEW ABOUT FIRES AT CERN 39
drochloric acid (HCl). Approximately 400 kg of PVC were burnt, releasing about 400 kg ofhydrochloric acid (36%).
After the fire, the measures taken were primarily focusing on reconsidering the use ofother types of insulation than PVC and PE, the better configuration of equipment to allowcooling and the arrangement for smoke, temperature and/or fire detection. As during theincident there have also been detected problems with the emergency stop and the emergencylightening systems, their improvement was proposed.
In 1982 a magnet in building EHN2 of the SPS (Super Proton Synchrotron) complexcaught fire [45]. It originated from the signal cables BICC which, for any reason, wereoverloaded by an unacceptable current. Tests on these cables showed that given certainconditions a fire could emerge, causing the ignition of the Macrolon protection of the magnet.During a short circuit test of the cables carried out over some hours, the whole systemheated up and the cables started to deform. The current increased, suddenly a flash occurred(probably on the metallic support of the cables) and a small fire appeared in the mass ofcables. In fact, it was the plastic support of the BICC cables which burned.
The fire was detected only due to the coincidental presence of a person in the vicinity.
The Macrolon protection of the upper part of the magnet was completely burnt. Due toburning and dropping of the material the signal cabling of the lower part was also damaged.Control circuits and signal cabling (PVC) were burnt. As a rather low quantity of PVC wasinvolved, the measures of hydrochloric acid (HCl) at selected points of the magnet did notshow an exceedance of the given limit. The magnet had to be demounted for reparation.
As no fire detection existed despite propositions made, it was decided to install firedetectors before the anew start-up of the machine. In addition, a study concerning smokeextraction systems for all experimental halls at CERN was proposed, be it either a mobile ora stationary system.
The most recent fire at CERN occurred in 1997, when a new oil capacitor caught firein building BA3 of the SPS Zone 3 [46]. After a short circuit of the capacitor of the snubbernetwork (18 kV busbar), the glowing resistor ignited the transformer oil.
As the fire detection of the building was out of service at the time because of main-tenance measures, the fire was not detected. Only when the fire detection was triggeredin a building close-by, the passing fire brigade discovered smoke coming from building BA3coincidentally. It turned out later on that no fire occurred in the building where the alarmwas actually triggered.
The consequences of this fire were quite severe, including a downtime of the machinesof two months. The BA3 radio frequency installation was corroded because of the burningPVC, and the 18 kV system was destroyed. In total, the damage accounted for approximately11 million CHF.
After the accident an inquiry was conducted, identifying a major modification of theinstallation without a subsequent re-commissioning as the cause of the fire. An elementwith a built-in protection device was replaced by an oil capacitor without such protectionequipment. The installing of a protection device in series would have been enough to securesafety.

40 CHAPTER 5. FIRE RISK
As a consequence, electrical inspections of installations and also the re-commissioningof installations after major modifications were thereafter enforced with much more rigour.
5.3 Other Fire Risks
Although there are obviously other fire risks which threaten the operation of the LHC ma-chine, they will only be mentioned briefly, as the main focus of this thesis is the fire risk dueto electrical equipment failures.
Swamp gas:
Swamp gas present in the LHC tunnel would mean a significant increase of the risk ofexplosion, as it consists of 55 - 75% of Methane. However, experience from LEP showsthat swamp gas is no actual threat, as the tunnel is located in average 100 metres belowthe surface, a depth where swamp gas is not produced anymore.
Other gases:
In the LHC machine tunnel there is on the one hand helium gas in large quantities usedfor the cryogenic system and on the other hand only a few other types of gases in rathersmall quantities. However, for the fire risk assessment they do not play a decisive role.Other different gases are used for the experiments, but they do not form part of thepresent study.
External events:
In terms of possible external events being able to cause a fire in the LHC, it is the accesspits which pose a threat. There are two potential scenarios: either burning substancesmay fall down and set fire to equipment or inflammable gas might be sucked in throughthe pit.
Malicious activity:
Although conceivable, malicious activity is not part of the fire risk consideration.

Chapter 6
Risk Analysis - The Boundary Con-ditions
The present chapter is focussing on the successive procedure of the risk analysis for the LHCtunnel, giving explanation and reasons for the actions taken step by step.
6.1 Identification of Material Data
Three conditions have to be fulfilled in order that a fire can develop:
• the presence of oxygen,
• an ignition source,
• and inflammable material in the immediate vicinity.
In the case of the LHC tunnel, a failure in the electrical installation (i.e. an electric arc, ashort circuit fault) is a possible cause of generating an ignition source. With two of the threeconditions fulfilled, the remaining variable and the most important factor is actually the dif-ferent materials present in the tunnel and their properties. Consequently, the determinationof material data, their properties and location presents a vital part of the analysis.
6.1.1 CERN Regulations
As CERN is an international organisation and carries out works which are unique in Europe,it also has its own specific safety regulations. Although based on the member states’ rules, atleast the same level of safety as in force in the host states, Switzerland and France, has to beguaranteed. In case CERN believes that a more rigorous level should be maintained, it cancertainly put its own special regulations into force. In general, safety instructions and safety
41

42 CHAPTER 6. RISK ANALYSIS - THE BOUNDARY CONDITIONS
codes are mandatory documents, whereas safety notes and safety bulletins are only meant toprovide further information on safety [47].
Concerning the fire risk in the tunnel due to the presence of inflammable materials,CERN’s Safety Instructions (IS) 23 and 41 have to be applied [48,49]. The former one dealswith criteria and test methods for the selection of electric cables and wires with regard tofire safety and radiation resistance, the latter is concerned with the use of plastic and othernon-metallic materials at CERN in general, but also with reference to fire safety and radiationresistance.
These two safety instructions both certainly refer to standards and publications ofthe International Electrotechnical Commission (IEC) and other internationally recognisedbodies. For the different material properties and requirements that have to be met, they givethe appropriate standards which have to be applied.
The requirements for all materials given in both instructions are the following:
• Electrical, mechanical, chemical, thermal and environmental resistance properties suit-able for the desired application, and conforming to the appropriate standards
• Flame retardant characteristics satisfying the relevant standards
• Halogen and sulphur free
• Low smoke density
• Low toxicity of gases from fires
• Low corrosivity of gases from fires
• Adequate radiation resistance
With these requirements in mind, some generally used materials such as polyvinyl chloride(PVC), chlorosulphonated polyethylene (Hypalon), polychloroprene (Neoprene), fluorocar-bons (i.e. Teflon) and other halogenated or sulphur containing compounds are excluded fromusage in the installations.
IS 41 provides a classification of plastics for use at CERN, specifying not only thesuitable base materials, but also restrictions for others and eventually the prohibited materials(Table 6.1). It is intended to be used only as a preliminary selection criterion, and wheredeviations from these rules are suspected, the materials should be tested before use. Theinstructions have to be followed for all new installations as well as for modifications to existinginstallations.
IS 23 and 41 are supplemented by Electrical Safety Code C1, which deals with regu-lations for the construction, installation and use of electrical equipment in order to protectpersonnel and property. As well as defining requirements for manufacturing, installing andoperating electrical equipment and specific qualifications on the part of personnel, it also refersto the appropriate choice of material used for this equipment concerning fire safety and makesreference to the safety instructions mentioned before. This document is of course also basedon the latest standards and recommendations of the International Electrotechnical Commis-sion (IEC) and the European Committee for Electrotechnical Standards (CENELEC) [50].
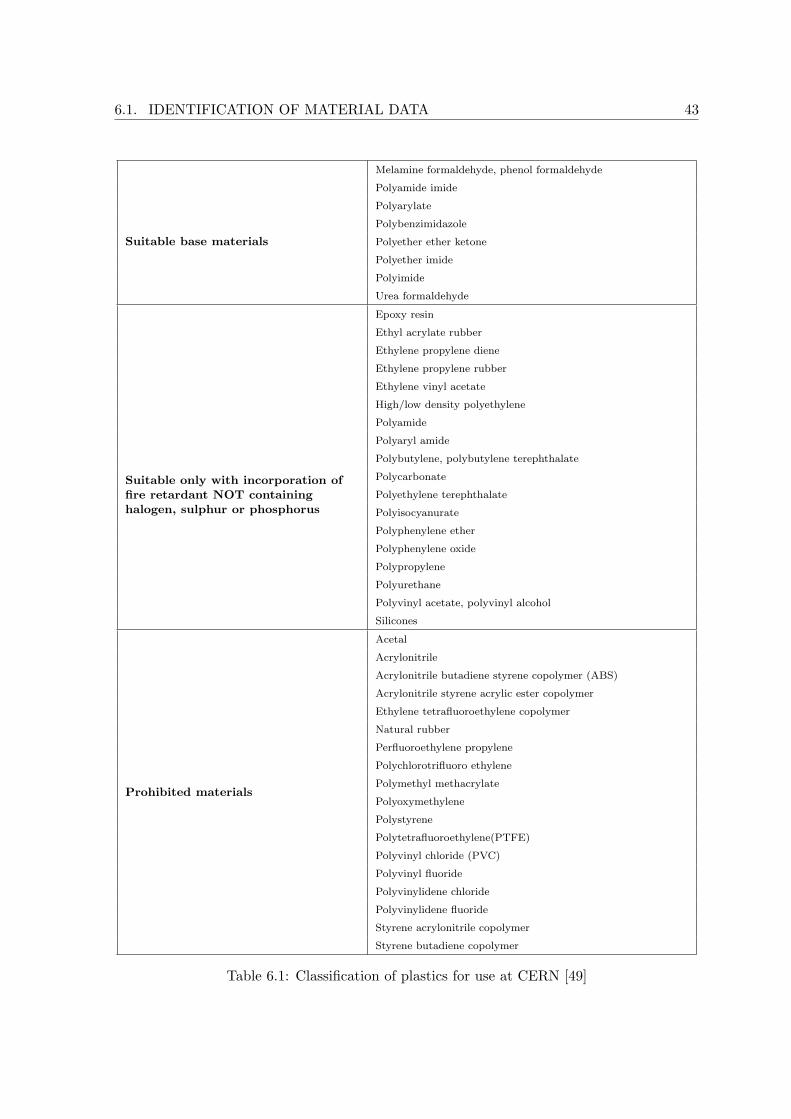
6.1. IDENTIFICATION OF MATERIAL DATA 43
Suitable base materials
Melamine formaldehyde, phenol formaldehyde
Polyamide imide
Polyarylate
Polybenzimidazole
Polyether ether ketone
Polyether imide
Polyimide
Urea formaldehyde
Suitable only with incorporation offire retardant NOT containinghalogen, sulphur or phosphorus
Epoxy resin
Ethyl acrylate rubber
Ethylene propylene diene
Ethylene propylene rubber
Ethylene vinyl acetate
High/low density polyethylene
Polyamide
Polyaryl amide
Polybutylene, polybutylene terephthalate
Polycarbonate
Polyethylene terephthalate
Polyisocyanurate
Polyphenylene ether
Polyphenylene oxide
Polypropylene
Polyurethane
Polyvinyl acetate, polyvinyl alcohol
Silicones
Prohibited materials
Acetal
Acrylonitrile
Acrylonitrile butadiene styrene copolymer (ABS)
Acrylonitrile styrene acrylic ester copolymer
Ethylene tetrafluoroethylene copolymer
Natural rubber
Perfluoroethylene propylene
Polychlorotrifluoro ethylene
Polymethyl methacrylate
Polyoxymethylene
Polystyrene
Polytetrafluoroethylene(PTFE)
Polyvinyl chloride (PVC)
Polyvinyl fluoride
Polyvinylidene chloride
Polyvinylidene fluoride
Styrene acrylonitrile copolymer
Styrene butadiene copolymer
Table 6.1: Classification of plastics for use at CERN [49]

44 CHAPTER 6. RISK ANALYSIS - THE BOUNDARY CONDITIONS
6.1.2 Material Data Project
Material data of the most important equipment families installed in the LHC tunnel havebeen collected in order to be able to estimate the existing fire load.
The list of equipment families was intended to cover all involved LHC groups, certainlyaiming at the most significant and comparatively largest equipments. It has to be pointedout clearly that not all equipments present in the tunnel could be included, as the numberof different LHC subsystems and their corresponding equipments is vast. The material datagiven do not claim to be extensive and correct, as it certainly depends on the collaborationand accuracy of the responsible person providing the data. A template was prepared in orderto give a guideline and it was asked, where possible, for specifications as exact as possible (e.g.position of equipment in the underground area, combustible material exposed to air, quantityof combustible material). Considering the size and complexity of the LHC, unfortunately inmost cases this was not achievable. Thus the major part of the data only gives an estimationof the actual quantity of materials and working fluids. As different people respond differentlyto the same demand, the level of uncertainty cannot be easily determined. However, thoughthe present database is not exhaustive, the major components and major risk materials arecovered.
The data were collected octant by octant, again due to the fact that giving the detailedlocation of each item was too elaborate, in some cases not even possible (e.g. pipes, cables).However, the data added up for one octant are too inaccurate to be used as a basis for theanalysis. So in order to be able to judge the potential fire risk, the data of each equipmentfamily have to be examined separately considering their location and adjacent equipmentand installations with regard to CERN’s civil engineering nominations. An accumulation ofcombustible material in one specific spot without any ignition source nearby has then to beregarded as less hazardous than a smaller amount of inflammable material close to a possiblesource of ignition. In the case of equipment which cannot be divided into single items,it should be considered as more or less equally distributed along the tunnel and technicalgalleries, respectively.
Another very important issue for the analysis is the position of combustible materialwithin the boundary of the equipment itself. It has to be taken into consideration that infact there might be inflammable material present, but it is an inherent part of the equipmentand not normally exposed to air. In this case it is of course contained in the list of materialdata, but has to be discussed with special attention.
The data concerning plastics used in the tunnel is classified according to IS 41:
• Group 1: Suitable base materials
• Group 2: Suitable only with incorporation of fire retardant NOT containing halogen,sulphur or phosphorus
• Group 3: Prohibited material
• Group 4: As for some of the equipment families no detailed specifications about theplastics were provided, they were classified as undefined and added up in this group.

6.1. IDENTIFICATION OF MATERIAL DATA 45
The warm cables, that is to say all cabling outside the magnets’ cryostats, were not includedin the general collection of material data, but extracted from a special database for theentire tunnel in total. The result is a list of more than 200 different types of cables in use.Unfortunately, the specifications of these cable types are not included in the database, sotheir analysis is rather difficult. The mass given for each meter of cable type summarisesboth the metal and the insulation part, thus a separated examination of the insulation is notpossible unless the specification for each type is provided. The detailed analysis is thereforereplaced by an overall estimation for the fractions of plastics and metal.
The extracted data from the database have to be handled with great care, as some ofits features make it difficult to obtain the exact data. The sum of the mass of cables of alloctants does not give the same result as the global sum of the mass of cables within the LHC.This is due to the fact that some of the cables are running over more than two octants (i.e.from octant 2 to octant 4) and are therefore only included in the global sum. This meansthat the sum per octant misses out a certain mass of cables. However, as the quantities ofthe materials are high, the final result will only be affected to a limited extent.
6.1.3 Material Properties
After determining all types of combustible material in the tunnel, the next step towardsassessing fire risk is the examination of their material properties. In the following, theseproperties are discussed for all appearing combustible materials in the specified areas.
Polymers of Group 1 pass the standard fire tests relating to properties such aslow smoke density, low toxicity and low corrosiveness of fire gases and a satisfactory fireperformance (ease of ignition, etc.). They are naturally fire retardant, in some cases evenself-extinguishing, and therefore do not propagate the fire.
As mentioned above, polymers of Group 2 are only considered suitable if theycontain fire retardant without halogen, sulphur or phosphorus. These polymers maybe resista fire better than polymers of Group 1, but once a fire is in progress, they will not beself-extinguishing and will certainly continue to burn.
Since polymers of Group 3 contain fire retardant such as halogen or chloride, theywill certainly resist a fire for a certain amount of time. However, if the ignition source is bigenough and the combustion is started, they will burn easily and release toxic, corrosive andvery dense gases.
With no specification available, polymers of Group 4 present a special case con-cerning the identification of their fire load. At worst, they have the same fire properties aspolymers of Group 3, which is why these two groups will be treated equally.
Graphite is basically a combustible material which can be ignited by friction, heat,sparks or flames; auto ignition is started at about 450◦C. Once a fire has developed, irritatingand/or toxic gases may be released [51].
Based on a sample of an electronic rack of the LHC Power Interlock system, an esti-mation of the constituents reveals that about 30% of the materials are polymers of various

46 CHAPTER 6. RISK ANALYSIS - THE BOUNDARY CONDITIONS
types, and the remaining components are made up mainly by aluminium, copper and a fewother metals. Therefore electronic components do present a certain fire load. Due tothe unknown specifications of the polymers, its magnitude can not be determined in detail.However, for the analysis of fire risk, electronic components cannot be neglected.
The only inflammable liquid used in the LHC tunnel within the boundaries of thisstudy is silicone oil. Depending on the supplier and the type of product, its properties mayvary slightly. However, it is a combustible liquid with a flash point of about 300◦C. Duringa fire, the decomposition products may include hazardous gases such as carbon oxides andincompletely burned carbon compounds, silicone dioxide and formaldehyde [52,53].
Due to the remarkable number of cable types and missing specification details, theactual fire load of the warm cables has to be estimated. For this analysis it will be assumedthat the insulation of a cable makes up about 80% of its total weight, whereas the remaining20% comprise its metal part. This assumption is only true for certain cable types, namelysignal and high voltage cables. However, this overestimation of the proportion of the plasticswill affect the analysis in such a way that the result is on the safe side.
IS 41 does restrict the usage of insulation material which is not either suitable basematerial or suitable base material incorporating fire retardant. Consequently the assumptionconcerning the types of polymers used as cable insulation material and therefore the fireproperties of the cables is based thereon. However, it also has to be assumed that theremight be a number of cables which do not abide by this regulation. This means that thefire load of the warm cables is mainly defined by polymers of Group 1 and 2 with possibleoutliers of polymers of Group 3.
6.1.4 Location of Combustible Material
In order to finish the overall analysis of the materials and their contribution to a fire risk inthe tunnel, the determination of their position with respect to each other and their positionwith regard to possible ignition sources is essential. As the number of different equipmentfamilies in total is rather high, only the largest and the most influential equipment familieswill be taken into account.
The material data inventory will give both location of equipment families with theiramount of inflammable material and location of electrical equipment (being part of some of theequipment families). However, it will not be possible to cover all electrical equipment. Highvoltage transformers as well as low power apparatus (switchgears, batteries, UPS systems,electronic racks and computers for supervision) are distributed over the entire undergroundarea and cannot be included in the material data in a precise way.
The localisation of equipment families will be estimated, as most of them are spreadover a large area in the tunnel. It will only be possible to provide approximate positions withrespect to CERN’s civil engineering terminology.
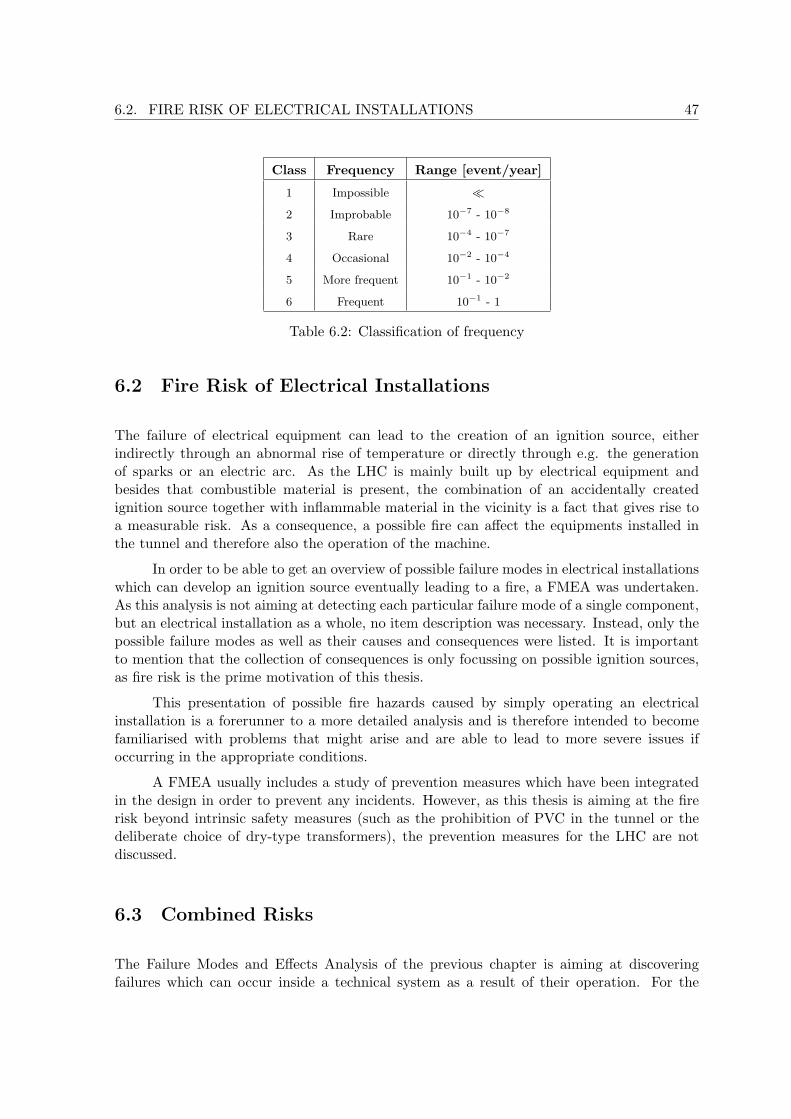
6.2. FIRE RISK OF ELECTRICAL INSTALLATIONS 47
Class Frequency Range [event/year]
1 Impossible �
2 Improbable 10−7 - 10−8
3 Rare 10−4 - 10−7
4 Occasional 10−2 - 10−4
5 More frequent 10−1 - 10−2
6 Frequent 10−1 - 1
Table 6.2: Classification of frequency
6.2 Fire Risk of Electrical Installations
The failure of electrical equipment can lead to the creation of an ignition source, eitherindirectly through an abnormal rise of temperature or directly through e.g. the generationof sparks or an electric arc. As the LHC is mainly built up by electrical equipment andbesides that combustible material is present, the combination of an accidentally createdignition source together with inflammable material in the vicinity is a fact that gives rise toa measurable risk. As a consequence, a possible fire can affect the equipments installed inthe tunnel and therefore also the operation of the machine.
In order to be able to get an overview of possible failure modes in electrical installationswhich can develop an ignition source eventually leading to a fire, a FMEA was undertaken.As this analysis is not aiming at detecting each particular failure mode of a single component,but an electrical installation as a whole, no item description was necessary. Instead, only thepossible failure modes as well as their causes and consequences were listed. It is importantto mention that the collection of consequences is only focussing on possible ignition sources,as fire risk is the prime motivation of this thesis.
This presentation of possible fire hazards caused by simply operating an electricalinstallation is a forerunner to a more detailed analysis and is therefore intended to becomefamiliarised with problems that might arise and are able to lead to more severe issues ifoccurring in the appropriate conditions.
A FMEA usually includes a study of prevention measures which have been integratedin the design in order to prevent any incidents. However, as this thesis is aiming at the firerisk beyond intrinsic safety measures (such as the prohibition of PVC in the tunnel or thedeliberate choice of dry-type transformers), the prevention measures for the LHC are notdiscussed.
6.3 Combined Risks
The Failure Modes and Effects Analysis of the previous chapter is aiming at discoveringfailures which can occur inside a technical system as a result of their operation. For the

48 CHAPTER 6. RISK ANALYSIS - THE BOUNDARY CONDITIONS
remaining risks compensating measures should be implemented to be able to keep themunder control. However, in case of an incident despite of foreseen prevention measures, theconsequences of these failure modes have to be judged correctly by additionally taking intoaccount the surrounding conditions. So when talking about combined risks for this analysis,one is referring to the presence of combustible material in the LHC tunnel.
As addressed before, only the combination of inflammable material and an ignitionsource in the vicinity can lead to an unexpected incident with regard to fire risk. This impliesthat after the first step of analysing the situation by identifying and locating combustiblematerials and carrying out the FMEA for the electrical installation, it is the second step whichhas to combine both factors in order to find out about the actual impact on the system. Infact it is this combination which allows a real estimation of the consequences, and thereforeforms a continuation of the consequence analysis of the FMEA for electrical installations.When considering the location of combustible materials, the consequences can be narroweddown to the areas where an ignition source actually can coincide with inflammable material.
6.4 Frequency and Consequence Analysis
The identification of hazards and failure modes in the course of the analysis forms an essentialpart of the overall risk analysis procedure (see Figure 4.1). Frequency and consequenceanalysis present the continuation of the process from a qualitative to a quantitative analysisand allow an estimation of risk. Only by determining the frequency of occurrence of afailure mode and the severity of its consequences, a judgement can be made concerningthe impact on the equipment itself, the adjacent installations and subsequently the entiresystem. Although consequences have already been addressed by means of the Failure Modesand Effects Analysis, they do not yet show a measure of damage and therefore have to beexamined further.
In order to be able to judge frequency of occurrence and severity of consequences,acceptance criteria have to be defined beforehand. Without identifying objectives for therisk analysis in the form of acceptable/unacceptable risks, the results do not mean anything.Once the acceptance criteria are set, priorities for closer examination can be determined andimprovement measures can be discussed.
6.4.1 Frequency Analysis
In order to be able to assess the frequency of occurrence and to illustrate the risk, a clas-sification of the frequency has to be drawn up (Table 6.2). The derivation of the so-calledfrequency classes depends on the respective analysis, its object under investigation and itspurpose. The classification is intended to facilitate the process, and in case more experts arecontributing to the assessment, it allows keeping track of the consistency of opinions.

6.4. FREQUENCY AND CONSEQUENCE ANALYSIS 49
Class Severity Description
1.a
Negligible
No malfunction of the machine
1.b No effect on equipment
1.c No effect on people
2.a
Small
Breakdown of one subsystem, machine stays operational
2.b Slight degradation of equipment
2.c Minor effects on people
3.a
Significant
Propagation of incident, breakdown of more than one subsystem, machineis not operational
3.b Damage of equipment
3.c Fair effect on people, injury with full recovery
4.a
Severe
Cut-off of one sector of the machine, machine is not operational
4.b Significant damage of equipment
4.c Severe effect on people, injury with long-term damage
5.a
Critical
Complete breakdown of the machine
5.b Loss of equipment
5.c Fatal injury
Table 6.3: Classification of consequences (following [29])
6.4.2 Consequence Analysis
The determination of the consequences in the Failure Modes and Effects Analysis only showsqualitatively the impact on the system. For quantitative risk estimation it is necessary todefine the severity of the consequences. Thus, such as done for the frequency analysis, also forthe consequence analysis a classification has to be created. The definition of the consequenceclasses is thereby concentrating on the effect of a certain failure on the system. The severityranges from impacts kept within the local equipment to impacts that can even pass beyondthe equipment boundaries and affect the surroundings as well as the entire system. As one ofthe preconditions for this study is the absence of personnel in the tunnel during operation,Table 6.3 only includes effects on people for the sake of completeness.
6.4.3 Risk Matrix and Acceptance Criteria
With the help of frequency and consequence analysis, the risks can now be illustrated in arisk matrix. The previously introduced classifications of frequency of occurrence and severityof consequences make it possible to present the risks in a descriptive way and reveal thosewith the highest frequency of occurrence and the most severe consequences. In this manner,the most hazardous incidents can be chosen and discussed more into detail.
Figure 6.1 shows the risk matrix for the present problem including acceptance intervals

50 CHAPTER 6. RISK ANALYSIS - THE BOUNDARY CONDITIONS
Figure 6.1: Risk matrix with acceptance intervals
with intergradations: acceptable risks, transition area (acceptability of the risk under certainconditions needs to be discussed), unacceptable risks. It shows the relationship betweenfrequency and consequences, clearly outlining the high risk area.
Acceptance intervals or criteria, respectively, are essential for a conclusive performanceof a risk analysis. Without defining objectives and determining criteria for interpretation, theresults of the analysis do not bear a meaning. For example, a frequently occurring incident onthe shop floor with severe consequences for production would without doubt be investigatedmore into detail, as the predicament is obvious. However, the assessment of another incidentthreatening production just as severely, but with a lower frequency of occurrence, is muchmore difficult. Depending on the acceptance criteria set beforehand, it is possible to decideif the risk is still acceptable or measures have to be taken to improve the situation.
In the case where a frequency/consequence pair is set in the transition area, a con-sideration of interests is necessary. Generally, the ALARP principle is applied: As Low AsReasonably Practicable. Thus a balance between the costs of improvement measures and thecosts of indemnity in case the incident actually occurs has to be found. For the remainingtwo areas of the risk matrix the procedure is clear: either the risk is acceptable or actionshave to be taken in order to reduce the risk, thereby prioritizing disastrous scenarios.
Establishing acceptance criteria can take place in various ways. They may be imposedby law or competition on the market, but a company may also follow its own target values

6.5. FIRE RISK - FAULT TREE ANALYSIS 51
for production and quality.
For the present thesis, considerations concerning the foreseen lifetime of the LHC have dic-tated the establishing of the acceptance intervals. Beginning with the lowest severity class,the intervals are derived from the following basic assumptions:
• With an expected operation time of 20 years, frequency classes 5 and 6 imply thatan incident may happen between 0.2 and 20 times per LHC lifetime. Incidents foundwithin this frequency range are by no means acceptable.
• Between frequency classes 4 and 5 (0.002 to 0.2 times per LHC lifetime), incidents fallinto the transition area and decisions have to be made according to the circumstances.
• Below frequency class 4 (less than 0.002 times per lifetime), risks are acceptable. Witha growing severity class, apparently the intervals have to be adjusted downwards grad-ually.
• From severity classes 2 to 3, the state of the machine goes from operational to non-operational. As this is a significant indication that effects are being more severe, thisis the point from which the intervals decline.
Once the highest severity class is reached, the area of unacceptable risks has come downto frequency class 4. Considering the lifetime of the LHC, this frequency does not actuallyhave a great importance. However, an incident with these characteristics has the potential tocause a fire and threaten the operation of the machine to an even greater extent (disaster).
Considering the area of acceptable risks in comparison to the areas of transition andunacceptable risks, the intervals seem to be fairly generous. The reason for this lies in the factthat the Failure Modes and Effects Analysis is not trying to assess fire risk, but failure modeswhich eventually might lead to a fire. So these slightly more tolerant acceptance intervalsimply that there is more to a fire than just the failure of electrical equipment.
6.5 Fire Risk - Fault Tree Analysis
So far during the course of the analysis no actual evaluation of the fire risk has been carriedout. The frequency and consequence analysis described in the previous chapter only assessesthe frequency and consequences of the failure modes of electrical installations, but not therisk of having a fire in the underground area. Moreover, the material data project has onedownside which has not yet been overcome by any of the before mentioned analysis steps,namely the uncertainty of the collected data.
Therefore a so-called risk layer for the entire underground area is defined, which presentsinflammable material together with electrical equipment (possible ignition sources) as a layerequally distributed along the underground. For this risk layer a fault tree with the top event“fire in the LHC underground” (due to faulty electrical equipment) will be developed andanalysed, revealing the probability of occurrence of a fire in the tunnel as well as the logiccorrelations between the events leading to it.


Chapter 7
Fire Risk Analysis of the LHC Un-derground Area
The actual fire risk analysis of the LHC tunnel will be undertaken as laid out in theory inthe previous chapter.
7.1 Qualitative Analysis
7.1.1 Material Data - Combustible Material
In order to be able to isolate the areas in the tunnel where an actual fire risk exists, thelocation of combustible material and the accumulation of electrical equipments have to betaken into account.
Table 7.1 lists combustible materials and fluids present in the LHC tunnel. The totalamount of combustible material is made up of polymers, graphite and electronic components.On the part of inflammable working fluids there is only silicone liquid present in the tunnel.
Polymers of Group 1 are mainly coming from the superconducting main dipoles andquadrupoles, and are therefore more or less uniformly distributed along the tunnel. Theincreased amount of these polymers in octant 6 can be attributed to the ejection dump kickergenerators. As suitable base material, these polymers do not have first priority in terms offire risk. Moreover, they are located inside the magnet assembly, thus not directly exposedto air.
Polymers of Group 2 are treated similarly to polymers of Group 1, as they are onlyallowed to be used in the tunnel with the incorporation of fire retardant not containinghalogen, sulphur and phosphorus. Mainly contributing to the presence of these polymers arethe superconducting main dipoles, main quadrupoles and insertion quadrupoles, as well asthe warm magnets, the cryogenic distribution line, the cryostats housing the magnets, powerconverters and beam position monitors. In octants 2, 6 and 8 the amounts of these materials
53

54 CHAPTER 7. FIRE RISK ANALYSIS OF THE LHC UNDERGROUND AREA
Octant
Material Workingfluid
Polymers (groups according to IS 41) [t]Graphite [t]
Electronic
components [t]
Silicone
fluid [m3]Group 1 Group 2 Group 3 Group 4
Octant 1 12.9 38.1 0.4 0.2 0.0 1.6 0.00
Octant 2 12.9 48.6 0.2 0.2 0.0 1.7 7.60
Octant 3 12.6 36.6 1.2 0.2 0.1 1.5 0.00
Octant 4 13.1 38.9 0.2 0.2 0.0 3.5 7.32
Octant 5 12.9 38.1 0.4 0.2 0.0 1.6 0.00
Octant 6 18.6 96.1 7.5 0.3 9.1 1.7 0.00
Octant 7 12.6 36.3 1.1 0.2 0.2 1.5 0.00
Octant 8 12.9 48.6 0.2 0.2 0.0 1.7 7.60
Total 108.5 381.3 11.2 1.7 9.4 14.8 22.52
Table 7.1: Location of combustible material (February 2007)
increase noticeably due to the injection and extraction kicker generators. In general, anymagnets as well as the cryogenic distribution line are situated along the main tunnel, thoughthe rest of contributing equipments is found in the technical galleries.
Polymers of Group 3 according to IS 41 are prohibited materials for the usage in theLHC underground. However, some remarkable amounts of these materials are found in themain tunnel and technical galleries. The contributing equipments are the warm magnets andthe septa magnets as well as the kicker generators. Outstanding is the amount of more thanseven tons in octant 6 due to the ejection kicker generators. Derogations to IS 41 have beengranted for the amounts contained within the magnets by Safety Commission due to the factthat because of radiation requirements the choice of adequate material is limited. In contrastto that, up to the present state of this thesis no derogations have been requested concerningthe polymers of the generators in octant 6.
The last group of polymers is the group of undefined materials. They are generallysituated in the technical galleries, contained in electrical control equipment. In comparisonto polymers of Groups 1, 2 and 3, their amount is negligible in terms of fire risk. However,together with the group of electronic components the undefined polymers call attention toa general problem of the material data project, namely the unknown amounts of electroniccontrol equipment in the underground area. Due to the fact that it is very laborious to specifythis type of equipment in detail, it has to be assumed that in many cases data were eithernot provided or just summed up in a single figure. Thus the actual amount and the actuallocation of electronic equipment together with the contained plastics will stay unknown.
The group of electronic components mentioned in Table 7.1 is mainly made up bythe Quench Protection system, in particular the protection racks situated underneath themain dipoles in the tunnel. In octant 4 it is the radio frequency system which contributesnoticeably. However, as mentioned before, the amount of electronic equipment either not

7.1. QUALITATIVE ANALYSIS 55
Octant Warm cables [t]
Octant 1 195
Octant 2 498
Octant 3 242
Octant 4 314
Octant 5 198
Octant 6 208
Octant 7 105
Octant 8 435
Total 2,195
Table 7.2: Location of warm cables (October 2005)
provided or included in one of the other combustible material groups is not known. Thusit has to be assumed that the number of unreported cases is much higher and probablyuniformly distributed along the underground areas.
The last combustible material in Table 7.1 is graphite, which is contained within thecollimators as well as the LHC Beam Dump system. The amounts are rather small comparedto the rest of the groups. Moreover, it is located within the collimators in vacuum, thus notdirectly exposed to air [54]. In octant 6, it is the external beam dump for the ejected beamwhich accounts for the better part of graphite. There are 4.5 tons of graphite on either side ofpoint 6 at each end of the two straight tunnels leading away from the main tunnel. As theseamounts are about 600 metres away from the main tunnel and the blocks are air-cooled andunder nitrogen atmosphere, the beam dump tunnels are not considered dangerous in termsof fire risk.
Silicone oil is used within the injection kicker generators in octants 2 and 8 as well asfor the radio frequency system. The amount is remarkable, and although good fire propertiesof the product are assumed, its examination for the fire risk analysis is important.
As mentioned in the previous chapter, the warm cables present a matter which has tobe discussed separately (Table 7.2).
The superconducting cables do not have any insulation, since they are an integral partof the superconducting magnets and are therefore not particularly mentioned in the commentsabove.
In Table 7.2 the total weight of all non-superconducting cables is made up of morethan 200 different types of cables, including both the fractions of metal and insulation. Withan estimated value of 80% of insulation and 20% of metal per cable (see 6.1.3), the entireunderground area of the LHC comprises about 1,756 tons of polymer insulation. As mentionedbefore, the bigger part of these insulation materials will be polymers of Group 1 and 2.Since also some prohibited polymers are expected due to disregard of regulations, the fireproperties of the warm cables play an important part in the fire risk analysis. Moreover, it

56 CHAPTER 7. FIRE RISK ANALYSIS OF THE LHC UNDERGROUND AREA
is their sheer quantity which implies significance in view of creating an ignition source whileconducting current because of a failure as well as presenting a considerable fire load becauseof the properties of the polymers. The latter fact is supported by a study analysing existingstatistical data on electrical causes of fires in nuclear and non-nuclear installations, whichconcludes that cable insulation is the most important combustible material at the initialphase of a fire (see 5.1).
7.1.2 Analysis of the Electrical Installation
The first step for an extensive analysis is the understanding of the system and in particularthe understanding of possible failures of the equipment and the resulting consequences. TheFailure Modes and Effects Analysis for electrical installations is presented in Table 7.3.
The number of different failure modes shown illustrates clearly how an ignition sourcein the tunnel might emerge. It has to be pointed out that there has not been consideredany deliberate malpractice or malice, but simply the operation of electrical equipment. Cer-tainly for the possible causes human failure has been taken into consideration (e.g. incorrectinstallation).
The generation of an ignition source is determined by the presence of a high temper-ature, leading to a fire if combustible material is located in the vicinity. The causes for anunusual high temperature are various, ranging from the failure of the electrical insulationover incorrect installation to the internal failure of equipment. The consequences thereaftermight be the generation of sparks, arcing, overheating of equipment or the accumulation offlammable gases in the air. Although causes and consequences show different possible combi-nations and different sequences of events, the actual origin of a fire is always a cable junctionor other interconnections where the failure occurs. Thus the conclusion is that the fire canonly develop where cable junctions are found or accidentally created by whatever failure, orwhere electrical equipment is defective (e.g. switch gear, power supply, magnet). Cables ingeneral are not regarded as being responsible for the generation of a fire, but they do presentan important fire load and contribute to fire propagation.
Following the comments concerning the origin of a fire above, the inflammable materialin the tunnel is mainly made up by cable insulation and other plastics in the different equip-ments. According to IS 23, all cables used in the tunnel are supposed to be flame retardant.This means that they do not contribute to an initiating fire and have to resist it for a certaintime, in compliance with the applying IEC standards. However, once a smoulder or a fireoccurs and is (under appropriate conditions, such as malfunction of fire and smoke detectors)able to outlive the fire retarding property of the cables, a significant amount of combustiblematerial has to be considered, also taking into account the density of cables within the cabletrays and panels.
A particularly precarious issue in terms of possible ignition sources in the tunnel are badcable connections. The actual physical process is an abnormal rise of contact resistance, andas a result the slow increase of temperature and the possible smouldering of cables. Differentfrom a short or ground circuit fault, bad connections do not show their impact immediately,

7.1. QUALITATIVE ANALYSIS 57FM
Ref
Fai
lure
Mode
Pos
sible
Cau
ses
Con
sequen
ces
1O
ver
hea
ting
Failure
ofel
ectr
icalin
sula
tion
Gra
dualte
mper
atu
reri
se
Inco
rrec
tin
stallati
on
Acc
um
ula
tion
ofhea
tand
effluen
tin
the
vic
inity
Bad
conta
cts
Spark
gen
erati
on
Over
curr
ent
ina
cable
Ther
malagei
ng
ofin
sula
ting
mate
rial
Mis
use
(i.e
.ru
nnin
ga
hig
h-p
ower
edappliance
off
alo
w-
pow
erex
tensi
on
cable
)A
ccum
ula
tion
and
diff
usi
on
offlam
mable
gase
sin
air
may
giv
eri
seto
an
ignit
ion
or
explo
sion
Short
and
gro
und
circ
uit
fault
Mec
hanic
aldis
tort
ion
modifyin
gel
ectr
icalco
nta
cts
or
in-
sula
ting
mate
rial
Failure
ofa
com
ponen
t,an
inte
rnalpart
or
an
ass
oci
ate
dsy
stem
(i.e
.ven
tila
tion)
Exte
rnalhea
ting
(am
bie
ntte
mper
atu
rein
the
LH
Ctu
nnel
appro
xim
ate
ly30◦C
)
2Short
circ
uit
and
gro
und
fault
Mec
hanic
alim
pact
(i.e
.duri
ng
inst
allati
on,m
ain
tenance
)A
bnorm
al
tem
per
atu
reri
se(s
ignifi
cant
aft
ersh
ort
tim
e,lo
-ca
lise
d)
Inco
rrec
tin
stallati
on
Poss
ible
emis
sion
oflight,
smoke,
flam
mable
gase
s
Def
ecti
ve
cable
sR
elea
seofglo
win
gm
ate
rials
or
subst
ance
s
Dis
engaged
conduct
ors
,bad
conta
cts
Arc
ing
Ingre
ssofco
nduct
ing
fore
ign
bodie
s
Sudden
failure
ofco
mponen
tor
inte
rnalpart
Failure
ofel
ectr
icalin
sula
tion
Flo
odin
g
3A
rcin
gFailure
ofel
ectr
icalin
sula
tion
(dam
age)
Inte
nsi
ve
hea
tin
asm
all
volu
me
Over
curr
ent
Poin
tso
urc
eig
nit
or
Inco
rrec
tin
stallati
on
(act
ion
exposi
ng
live
part
sor
bri
ng-
ing
them
toget
her
)Poss
ible
emis
sion
oflight,
flam
mable
gase
sand
flam
es
Short
and
gro
und
circ
uit
fault
Ruptu
reofa
conta
ct
conti
nued
on
nex
tpage

58 CHAPTER 7. FIRE RISK ANALYSIS OF THE LHC UNDERGROUND AREAco
nti
nued
from
pre
vio
us
page
FM
Ref
Fai
lure
Mode
Pos
sible
Cau
ses
Con
sequen
ces
Sudden
failure
ofco
mponen
tor
inte
rnalpart
Mec
hanic
alim
pact
(i.e
.duri
ng
inst
allati
on,m
ain
tenance
)
4B
ad
conta
cts
Abra
sion
Gra
dualte
mper
atu
reri
se
Mec
hanic
aldis
tort
ion
modifyin
gel
ectr
icalco
nta
cts
Acc
um
ula
tion
ofhea
tin
the
vic
inity
Inco
rrec
tin
stallati
on
Short
circ
uit
and
gro
und
fault
Hig
htr
ansi
tion
resi
stance
Over
hea
ting
Mec
hanic
alim
pact
(i.e
.duri
ng
inst
allati
on,m
ain
tenance
)A
ccum
ula
tion
and
diff
usi
on
offlam
mable
gase
sin
the
vic
inity
Corr
osi
on
5Failure
of
elec
tri-
calin
sula
tion
Mec
hanic
alim
pact
(i.e
.duri
ng
inst
allati
on,m
ain
tenance
)A
ccum
ula
tion
and
diff
usi
on
offlam
mable
gase
sin
the
vic
inity
Bad
quality
Over
hea
ting
Abra
sion
(i.e
.fr
icti
on)
Arc
ing
Conduct
ing
dust
Gra
dualte
mper
atu
reri
se
Hum
idity
Acc
um
ula
tion
ofhea
tin
the
vic
inity
Conduct
ing
fore
ign
bodie
sShort
circ
uit
and
gro
und
fault
Agei
ng
Inco
rrec
tin
stallati
on
Dam
age
6C
ircu
it-c
ircu
itfa
ult
Mec
hanic
alim
pact
(i.e
.duri
ng
inst
allati
on,m
ain
tenance
)Poss
ible
emis
sion
ofvis
ible
light,
flam
mable
gase
sand
flam
es
Squash
edca
ble
sA
ccid
enta
lco
upling
oftw
oci
rcuit
s
Inco
rrec
tin
stallati
on
Short
circ
uit
and
gro
und
fault
Spark
gen
erati
on
7P
rote
ctio
nfa
ilure
Inte
rnalfa
ilure
ofpro
tect
ion
dev
ice
Over
load
Agei
ng
Short
circ
uit
and
gro
und
fault
Mec
hanic
alim
pact
(i.e
.duri
ng
inst
allati
on,m
ain
tenance
)
conti
nued
on
nex
tpage

7.1. QUALITATIVE ANALYSIS 59co
nti
nued
from
pre
vio
us
page
FM
Ref
Fai
lure
Mode
Pos
sible
Cau
ses
Con
sequen
ces
8Tra
nsf
erof
com
-ponen
tfa
ilure
Inte
rnalfa
ilure
ofeq
uip
men
tTra
nsf
eroffa
ilure
toth
epow
ersy
stem
No
pro
tect
ion
dev
ice
toav
oid
transf
er
Failure
ofpro
tect
ion
dev
ice
9M
isse
dquality
contr
ol
Mec
hanic
alim
pact
aft
erco
mm
issi
onin
g(i
.e.
duri
ng
inst
al-
lati
on
ofadja
cent
equip
men
t)D
egra
dati
on
ofth
esy
stem
No
insp
ecti
on,no
com
mis
sionin
gPow
erfa
ilure
Inco
rrec
tin
stallati
on
Tab
le7.
3:Fa
ilure
mod
esfo
rel
ectr
ical
inst
alla
tion
s(f
ollo
win
g[5
5])

60 CHAPTER 7. FIRE RISK ANALYSIS OF THE LHC UNDERGROUND AREA
but with a delay of hours, days or even weeks. As the performance of the cables is still accept-able and the consequences of a bad connection are not instantly obvious to the operation, thisfailure mode is easily overlooked during installation, commissioning or maintenance. Withrespect to the amount of cables and cable junctions in the tunnel, its possible frequency ofoccurrence has to be considered as being of special concern. As above all the detection ofbad connections is hampered by its slow and unobtrusive development, this failure mode hasto be regarded as significant for this thesis.
If a bad cable connection happens to occur within the superconducting cable network,that is to say the warm part feeding the superconducting circuits, there is no possibility offast interruption. Thus the current flows until the energy of the magnet is fully consumed,thereby smouldering cables. With the rise of the temperature of the cable also its resistanceincreases, and even more energy is transformed. Due to the available amount of energy withinthe magnet system, these conditions may lead to a fire.
The situation may look slightly different for cables of the distribution network. Badconnections stay undiscovered for a rather long time, as the detection during operation is verydifficult. The connections are usually invisible and the effects do not appear immediately.However, if a short circuit - and therefore a current ten to twenty times higher than nominalcurrent - occurs in addition to a high transition resistance, there is suddenly enough energyfor a fire available.
The supervision of electrical junctions could be done with the help of infra-red cameras.Regularly taking pictures during operation would allow for an early detection of deterioratingconnections and subsequently problem areas. However, as the radiation level in the tunnelrestricts the application of these cameras, CERN is not able to employ a systematic controlof electrical junctions.
Although the common failure mode of short circuit and ground fault is mentioned in theFMEA, the circuit-circuit fault is noted in particular because of its significance for this study.The disposable space for equipment in the LHC is limited due to the fact that the tunnel itselfis already more than 20 years old. This means that with the given tunnel profile, the finalassembly for the LHC had to be adapted to restricted space. As a consequence, the space leftfor people and equipment to pass is limited and makes the installation vulnerable to externaldamage during installation and maintenance. The possibility of generating a circuit-circuitfault by accidentally coupling two independent circuits without noticing is hence apparent.
Usually electrical equipment is provided with inherent protection devices in order todetect a failure within the equipment and secure its safe shutdown. However, the protectiondevice itself has a certain level of reliability and can therefore fail. Certainly the reliabilityof the various equipments has been considered in the design phase, but as there is always amargin for equipment failure, it cannot be neglected.
In case an internal failure of equipment occurs and the protection device does not re-spond correctly, the failure might be transferred from the equipment to the power system.Although the transfer can only happen when both failure modes occur at the same time(internal failure of equipment and failure of the protection device), they are mentioned sepa-rately in the FMEA. The reason is that in spite of their close connection, both failure modesmay occur independently and have different consequences for the installation.

7.1. QUALITATIVE ANALYSIS 61
Quality control plays a very important role for the installation and operation of acomplex system like the LHC and cannot be neglected. The passing of technical inspectionsof all electrical equipment is a basic requirement for the start-up of the machine. But sinceits complexity makes all the difference compared to a small manageable technical system, the“failure mode” of missed quality control has to be mentioned and considered in the fire riskanalysis. Although it is not a failure mode in terms of technical problems of an electricalinstallation, it can present the origin of electrical failure modes.
As mentioned previously, general fire prevention measures for the equipments situatedin the tunnel and neighbouring galleries, junctions and alcoves were not implemented, mainlybecause of the shortage of space. Different subsystems of the LHC do have their appropri-ate failure prevention measures; however, these measures are not coordinated among eachother and are therefore not a facility applicable for the electrical installation as a whole.Instead, an automatic fire and smoke detection system for the LHC underground areas hasbeen implemented in order to detect a developing fire as soon as possible and mitigate theconsequences [56].
The fire and smoke detectors are planned to be located in areas with a significantamount of inflammable material or areas where the consequences of a fire would be unac-ceptable (the experimental halls, the tunnel enlargements, junctions and alcoves). Once analarm is triggered, the fire brigade and the Technical Control Room (TCR) are informedvia the CERN Safety Alarm Monitoring system. Then a decision has to be made in orderto determine which actions have to be taken. The detectors are connected to Control andIndicating Equipment (CIE) in the service areas of the tunnel, such as luminous panels pro-viding a visual warning to the occupants. However, there is no automatic evacuation alarmtriggered and no automatic power-off of the corresponding area.
In case of fire, one of the subsystems of the LHC monitoring the beam operation andenvironment will trigger an error which will lead to a beam dump and interrupt the operationof the machine. Yet if the detectors are not able to discover the fire, the reason behind theproblem of the subsystem will stay unclear, and appropriate action regarding the fire cannotbe taken as fast as actually desired or required.
7.1.3 Specified LHC Areas Concerning Fire Risk
The combination of the results of the material data inventory, that is to say the location ofcombustible material as well as the accumulation of electrical equipment, with the FailureModes and Effects Analysis for electrical installations reveals the following areas of concern:
Points 2 and 8:
The silicone fluid contained in the high voltage pulse generators of the injection kickersin the underground areas of points 2 and 8 make these areas especially interesting from thepoint of view of fire risk. Although the silicone oil is well contained and protected, there isan actual accumulation of electrical equipment in the close vicinity increasing the probabilityof a potential fire. The generators are situated in the technical galleries parallel to the maintunnel, where not just low power apparatus is found, but also a number of electronic racks
62 CHAPTER 7. FIRE RISK ANALYSIS OF THE LHC UNDERGROUND AREA
and high energy equipment (i.e. power converters).
In case any mechanical failures of the container (leakage, residual liquid on the floor,frequent maintenance activities required, etc.) appear simultaneously to an emerging fire,the consequences of such an incident are enormous.
The injection system is responsible for the safe injection of the beam onto the orbitof the LHC. If the system fails, extensive effects could be provoked concerning surroundingequipment and infrastructure as well as the operation of the machine. The fire itself and itseffects (quench, explosion, etc.) would damage the magnets and other neighbouring equip-ments as well as the building itself. Subsequently a serious downtime of the machine wouldhave to be expected.
The technical galleries where the pulse generators are located are equipped with fireand smoke detection. In addition, mechanical and hydraulic measures are taken in order tomonitor the silicone liquid. Interlocks and the general surveillance system of the kicker gener-ators, such as surveillance of the liquid level within the enclosures or temperature detection,guarantee further securing of the area [57].
The inventory of the material data of the kicker generators reveals that their structuredoes contain significant amounts of polymers. In addition to suitable base material, polymersof Group 2 amount to approximately 16 tons in total for points 2 and 8, and prohibitedmaterial of Group 3 (including polyacetal and polymethyl methacrylate alias Plexiglas) addup to about 250 kg. Up to the present day, no derogations to IS 41 for the latter wererequested.
Point 4:
The radio frequency system at point 4 of the LHC is using silicone liquid, therefore alsopresenting a problem in view of fire risk. A very high energy conversion in this area favoursthe development of unintended heat sources; a concentration of electrical equipment providesthe potential ignition sources. In principle the same situation as for the injection systemapplies, as any problem with the silicone liquid might lead to an unexpected fire incident.
Being in charge of acceleration and storage of the beams, the RF system is vital for theoperation of the machine. The effects of a fire in this area compromise not only the intendedpurpose of the RF system by deteriorating the parameters of the beams, but can also lead toserious damage of the equipments and building due to the beams’ stored energy. Necessarydowntime of the machine would represent additional trouble.
The fire and smoke detection system is present in most places, but not sufficiently inthe entire area occupied by the RF system. From the cavern at the interaction point, RFequipment spreads out into the main tunnel and the technical galleries. Fire and smokedetectors are located in the technical areas, but not in the main tunnel.
The material inventory of the RF system does not contain any prohibited polymerswith respect to IS 41. Polymers of Group 2 are present, but only add up to minor quantities.In the cavern, the amount of electronic components (racks) constitutes nearly 2 tons.
Arcs:
The LHC arc is mainly taken up by the superconducting magnets, the cryogenic dis-
7.1. QUALITATIVE ANALYSIS 63
tribution line and cable trays along the wall of the tunnel. In addition, there are low voltagepower converters (dipole orbit correctors) and protection racks of the Quench Protection sys-tem (containing capacitors) beneath the magnets. Although this is combustible material inrather high quantities distributed over a fairly long distance coupled with a lot of cables inits vicinity, there is no fire and smoke detection foreseen in the LHC arcs. With a potentialand significant fire risk present, this thesis is an attempt to reassess the necessity of fire andsmoke detectors in these areas.
In case a fire does develop, it could be detected indirectly via an error of certain LHCsubsystems. However, this shows a failure in the system and not a fire, and therefore this wayof detection takes up too much time and might allow a fire to develop and even propagate.Once the fire is in progress, not only a dangerous effort of the fire brigade due to limitedaccess to the zone has to be taken into consideration, but also the effects on the machine.
The energy stored in one LHC dipole is 7.6 MJ, thus with 1,232 dipoles in the LHC arcsin total this amounts to 9.4 GJ. This latter value corresponds to the energy stored in 2 tonsof TNT, which could melt 20 tons of copper [8]. It is therefore clear that the consequencesof a fire in one of the LHC arcs can cause unforeseen damage (e.g. explosion).
Although the magnets do contain polymers of Group 2, the fire load of the area ismainly determined by the amount of cables. The polymers of the magnets are an inherentpart of the mechanical structure and are not directly exposed to air, whereas the cables in thecable trays along the wall of the tunnel are openly accessible. In addition, power convertersand quench protection racks underneath the magnets present a possible source of ignitionand combustible material.
A fire simulation conducted for another part of the LHC tunnel at point 7 assumes afire originating in the cable trays and shows that once this fire is in progress, it can causeserious damage. Besides the generation of smoke and soot, peak temperatures can reach upto approximately 1,500 K. Depending on the configuration of the ventilation system (openand closed), considerable amounts of combustible material are consumed and the duration ofthe fire varies between 3,000 and 700 seconds. Although this study states that the probabilityof a fire occurring in this area is close to zero due to preventive measures, it nevertheless givesserious weight to the installation of fire and smoke detectors [58].
Alcoves:
The alcoves of the LHC, located at both sides of the arcs, mainly house the electricaldistribution equipment for the LHC machine and the UPS system. A fire in these areasis a major concern with regard to severe consequences for LHC operation and an extendeddowntime.
The limited space and layout of the alcoves has lead to a rather close assembly ofequipment, thereby increasing the potential development of heat and ignition sources. Withtransformers, switchboards and the UPS system some vital equipments are housed in theseareas, and a fire is therefore by no means acceptable. The history of fires at CERN showsthat three of them occurred as a result of faulty electrical equipment, that is to say signalcables, a patch panel and a transformer. Keeping this experience in mind, the combinationof electrical equipment as the failure cause as well as the combustible material in the alcoves,importance has to be attached to these areas.
64 CHAPTER 7. FIRE RISK ANALYSIS OF THE LHC UNDERGROUND AREA
These sensitive areas are also equipped with fire and smoke detectors. However, dueto the amount of equipment in a small area, the frequency of occurrence remains unclear.Therefore the alcoves are included in this list of hazardous areas.
7.2 Quantitative Analysis - Expert Judgement
In order to be able to quantify the frequency of occurrence and the severity of consequences,the Failure Modes and Effects Analysis for electrical installations was extended by an expertjudgement (Table 7.4).
Three experts in electrical and electronic engineering with many years of experienceat CERN were chosen. With the help of the pre-determined frequency and severity classi-fications, each failure mode was assessed. Concerning the severity, the failure modes werejudged independently regarding (a) global consequences for the LHC machine operation and(b) local consequences for equipments. Then the average of all three subjective opinions wastaken and the results presented in risk matrices (Figures 7.1 and 7.2).
It must be mentioned that actually all failure modes potentially threatening the opera-tion of the machine are situated within the transition area of the risk matrix. Regarding localconsequences for equipment in the tunnel a similar situation is arising, except for one failuremode being situated in the unacceptable risk area. The FMEA on which these risk matricesare based, is showing possible ways of creating ignition sources; it does not necessarily implythe emerging of a fire as a consequence. Nevertheless the judgement rates the failure modesas most likely hazardous for machine operation and equipments.
By definition for any frequency/consequence pair located within the transition area thenecessity of risk-reducing measures has to be discussed. In the present case it is debatable ifimprovement is required or even possible. During the design phase of individual systems fail-ures have been considered naturally and taken care of. However, the complexity of the wholestructure does imply unexpected incidents and adverse combinations of incidents eventuallyleading to more severe consequences. Due to the space restrictions in the tunnel and theadvanced project stage at the present time, modifications of the original design or additionalarrangements would be difficult to implement and rather costly in terms of time and money.
This risk matrix does not directly show the fire risk within the LHC, but only possibleinitial events. Although the possibilities of intervening at the present stage are low, thisassessment done by internal experts certainly directs attention to fire risk in the LHC andrecalls the importance of regular check-ups. With respect to the areas of concern (see 7.1.3)it is justified to question if existing prevention and safety measures are sufficient.
The failure modes of overheating as well as short circuit and ground fault are situatedin the same area of the risk matrix concerning the operation of the machine. This assessmentwas expected, as these two failure modes are connected closely in the way that one cancause the other and vice versa. However, it is significant that local effects of overheating onequipment is rated as much more severe than the general effects on machine operation, sincethis shifts it into the unacceptable risk area. In spite of the LHC cooling and ventilationsystem, the expert judgement still points out a particular hazard through local overheating

7.2. QUANTITATIVE ANALYSIS - EXPERT JUDGEMENT 65FM
Ref
Fai
lure
Mode
Pos
sible
Cau
ses
Con
sequen
ces
Sev
erity
Cla
ssFre
quen
cyC
lass
1O
ver
hea
ting
Failure
ofel
ectr
icalin
sula
tion
Gra
dualte
mper
atu
reri
se
2.3
a/3.3
b4.3
Inco
rrec
tin
stallati
on
Acc
um
ula
tion
ofhea
tand
effluen
tin
the
vic
inity
Bad
conta
cts
Spark
gen
erati
on
Over
curr
ent
ina
cable
Ther
malagei
ng
ofin
sula
ting
mate
rial
Mis
use
(i.e
.ru
nnin
ga
hig
h-p
ower
edappliance
off
alo
w-p
ower
exte
nsi
on
cable
)A
ccum
ula
tion
and
diff
usi
on
offlam
mable
gase
sin
air
may
giv
eri
seto
an
ignit
ion
or
explo
sion
Short
and
gro
und
circ
uit
fault
Mec
hanic
aldis
tort
ion
modifyin
gel
ectr
icalco
n-
tact
sor
insu
lati
ng
mate
rial
Failure
ofa
com
ponen
t,an
inte
rnalpart
or
an
ass
oci
ate
dsy
stem
(i.e
.ven
tila
tion)
Exte
rnalhea
ting
(am
bie
nt
tem
per
atu
rein
the
LH
Ctu
nnel
appro
xim
ate
ly30◦C
)
2Short
circ
uit
and
gro
und
fault
Mec
hanic
al
impact
(i.e
.duri
ng
inst
allati
on,
main
tenance
)A
bnorm
al
tem
per
atu
reri
se(s
ignifi
cant
aft
ersh
ort
tim
e,lo
calise
d)
2.3
a/2.3
b4.7
Inco
rrec
tin
stallati
on
Poss
ible
emis
sion
of
light,
smoke,
flam
mable
gase
s
Def
ecti
ve
cable
sR
elea
seofglo
win
gm
ate
rials
or
subst
ance
s
Dis
engaged
conduct
ors
,bad
conta
cts
Arc
ing
Ingre
ssofco
nduct
ing
fore
ign
bodie
s
Sudden
failure
ofco
mponen
tor
inte
rnalpart
Failure
ofel
ectr
icalin
sula
tion
Flo
odin
g
3A
rcin
gFailure
ofel
ectr
icalin
sula
tion
(dam
age)
Inte
nsi
ve
hea
tin
asm
all
volu
me
3.3
a/3.3
b3.0
Over
curr
ent
Poin
tso
urc
eig
nit
or
Inco
rrec
tin
stallati
on
(act
ion
exposi
ng
live
part
sor
bri
ngin
gth
emto
get
her
)Poss
ible
emis
sion
oflight,
flam
mable
gase
sand
flam
es
Short
and
gro
und
circ
uit
fault
conti
nued
on
nex
tpage

66 CHAPTER 7. FIRE RISK ANALYSIS OF THE LHC UNDERGROUND AREAco
nti
nued
from
pre
vio
us
page
FM
Ref
Fai
lure
Mode
Pos
sible
Cau
ses
Con
sequen
ces
Sev
erity
Cla
ssFre
quen
cyC
lass
Ruptu
reofa
conta
ct
Sudden
failure
ofco
mponen
tor
inte
rnalpart
Mec
hanic
al
impact
(i.e
.duri
ng
inst
allati
on,
main
tenance
)
4B
ad
conta
cts
Abra
sion
Gra
dualte
mper
atu
reri
se
2.0
a/2.3
b5.0
Mec
hanic
aldis
tort
ion
modifyin
gel
ectr
icalco
n-
tact
sA
ccum
ula
tion
ofhea
tin
the
vic
inity
Inco
rrec
tin
stallati
on
Short
circ
uit
and
gro
und
fault
Hig
htr
ansi
tion
resi
stance
Over
hea
ting
Mec
hanic
al
impact
(i.e
.duri
ng
inst
allati
on,
main
tenance
)A
ccum
ula
tion
and
diff
usi
on
offlam
mable
gase
sin
the
vic
inity
Corr
osi
on
5Failure
of
elec
tri-
calin
sula
tion
Mec
hanic
al
impact
(i.e
.duri
ng
inst
allati
on,
main
tenance
)A
ccum
ula
tion
and
diff
usi
on
offlam
mable
gase
sin
the
vic
inity
3.0
a/3.0
b3.7
Bad
quality
Over
hea
ting
Abra
sion
(i.e
.fr
icti
on)
Arc
ing
Conduct
ing
dust
Gra
dualte
mper
atu
reri
se
Hum
idity
Acc
um
ula
tion
ofhea
tin
the
vic
inity
Conduct
ing
fore
ign
bodie
sShort
circ
uit
and
gro
und
fault
Agei
ng
Inco
rrec
tin
stallati
on
Dam
age
6C
ircu
it-c
ircu
itfa
ult
Mec
hanic
al
impact
(i.e
.duri
ng
inst
allati
on,
main
tenance
)Poss
ible
emis
sion
of
vis
ible
light,
flam
mable
gase
sand
flam
es3.3
a/3.0
b3.3
Squash
edca
ble
sA
ccid
enta
lco
upling
oftw
oci
rcuit
s
Inco
rrec
tin
stallati
on
Short
circ
uit
and
gro
und
fault
Spark
gen
erati
on
conti
nued
on
nex
tpage

7.2. QUANTITATIVE ANALYSIS - EXPERT JUDGEMENT 67co
nti
nued
from
pre
vio
us
page
FM
Ref
Fai
lure
Mode
Pos
sible
Cau
ses
Con
sequen
ces
Sev
erity
Cla
ssFre
quen
cyC
lass
7P
rote
ctio
nfa
ilure
Inte
rnalfa
ilure
ofpro
tect
ion
dev
ice
Over
load
3.7
a/4.0
b3.3
Agei
ng
Short
circ
uit
and
gro
und
fault
Mec
hanic
al
impact
(i.e
.duri
ng
inst
allati
on,
main
tenance
)
8Tra
nsf
erof
com
-ponen
tfa
ilure
Inte
rnalfa
ilure
ofeq
uip
men
tTra
nsf
eroffa
ilure
toth
epow
ersy
stem
4.0
a/4.0
b3.7
No
pro
tect
ion
dev
ice
toav
oid
transf
er
Failure
ofpro
tect
ion
dev
ice
9M
isse
dquality
contr
ol
Mec
hanic
al
impact
aft
erco
mm
issi
onin
g(i
.e.
duri
ng
inst
allati
on
ofadja
cent
equip
men
t)D
egra
dati
on
ofth
esy
stem
2.7
a/2.3
b4.7
No
insp
ecti
on,no
com
mis
sionin
gPow
erfa
ilure
Inco
rrec
tin
stallati
on
Tab
le7.
4:Fa
ilure
mod
esfo
rel
ectr
ical
inst
alla
tion
s-
inte
grat
ion
offr
eque
ncy
and
cons
eque
nce
anal
ysis
(fol
low
ing
[55]
)

68 CHAPTER 7. FIRE RISK ANALYSIS OF THE LHC UNDERGROUND AREA
of equipment. Although the cooling and ventilation system is already in place as a riskreducing measure, this outcome again advises special caution and suggests frequent andnumerous check-ups as often as temporary machine shutdowns allow it.
Similar to a short circuit and ground fault is the accidental coupling of two independentcircuits. More severe regarding global than local effects, this failure mode overall is rated witha rather high severity compared to a short circuit and ground fault. Contrary to expectations,its frequency is fairly low. Due to space restrictions in the tunnel and therefore possiblemishaps during installation, maintenance and trouble-shooting, its frequency of occurrencewas anticipated to be much higher.
The failure mode of bad contacts is located right on the upper bound of the transitionarea in both matrices. This reflects what has been mentioned before: because of the amountof cables and therefore cable junctions in the LHC its frequency of occurrence is presumablyrather high. Its severity with respect to local effects on equipment is judged even moresignificant, which is a reasonable result.
Missed quality control has worse effects on the operation of the machine globally thanlocally on the equipment itself. Good design of equipment is a key characteristic for a flawlessoperation. However, quality control is essential in order to check on correct installation andmake sure the components can actually work according to their intended purpose. For aninstallation such as the LHC, inspection of equipment is a major undertaking and mightimply both overlapping as well as overlooking of important details.
The failure of electrical insulation is hazardous to the same degree on a local as well as aglobal level. The reason for this can be attributed to the fact that once a cable is destroyed, italso constrains an electrical circuit which may be important for one or more LHC subsystems.Although this failure mode can have quite severe consequences such as overheating, shortcircuit and ground fault, arcing or the accumulation and diffusion of flammable gases in thevicinity, the result of the expert judgement is not as pessimistic as expected.
The severity of an internal failure of protection devices of a LHC subsystem is judgedas being able to threaten the operation of the machine severely, and even more so the stateof equipment locally. Closely connected is the transfer of this failure from the individualcomponent to the power system. Regarding effects on machine operation, this is the failuremode with the most severe consequences. This is plausible, as any fault affecting the powersystem has to be a hazard for operation. Since a transfer can only happen when an internalfailure of equipment and a malfunction of the protection device occur at the same time, itsfrequency of occurrence is higher than the value for a protection device failure on its own, asanticipated. This also reflects the high reliability values of state-of-the-art electronic devices.
At last, arcing is the failure mode with the lowest frequency, but a fairly high severityfor both machine operation and equipment. As it is situated on the lower bound of thetransition area, it is actually judged as presenting the smallest risk with respect to creatingignition sources.
In conclusion, all failure modes but one assessed by means of an expert judgement aresituated within the transition area of the risk matrices. This means that necessary actionsmust be discussed and justified both in terms of financial impact as well as time and effortconcerning re-design, purchasing and installation. Due to the advanced stage of the LHC

7.3. QUANTITATIVE ANALYSIS - A DETAILED APPROACH 69
Figure 7.1: Risk matrix - Consequences for machine operation (a)
project, inherent measures to the entire system can not be implemented. Actions mustbe arranged concerning effectiveness and sufficient employment of already existing safetymeasures. This concerns systems which come into play after an incident has occurred andare actually designed to mitigate its effects, i.e. fire and smoke detectors and the training ofpersonnel.
7.3 Quantitative Analysis - A Detailed Approach
The material data of the different LHC subsystems and their location in the undergroundarea formed the basis for the fire risk analysis of the previous chapter. Due to the sizeand complexity of the LHC, the uncertainty of the collected data was expected, even thedeliberate omission of certain equipment families. The combination of the Failure Modesand Effects Analysis with the material data project revealed hazardous areas in the LHCunderground area. With the help of frequency and consequence analysis based on expertjudgement, an assessment of possible fire causes (ignition sources) could be carried out.However, a magnitude for the fire risk in the tunnel could not be given yet. In consequence,an assessment of the fire risk including all electrical equipment will be approached in thefollowing chapter.

70 CHAPTER 7. FIRE RISK ANALYSIS OF THE LHC UNDERGROUND AREA
Figure 7.2: Risk matrix - Consequences for the equipment (b)
7.3.1 Risk Layer Along the Underground Area
As mentioned previously, there is electrical equipment in the underground area which hasnot been included in the study, as it was not possible to integrate it into the material dataproject. As the project was aiming at collecting data concerning the most important andcomparatively largest equipments, this equipment has not been entirely included. Althoughfor some of the equipment families their electrical components have been integrated, otherequipments have not even been mentioned. This means that the actual amount of electricalequipment and thus on the one hand combustible material and on the other hand potentialignition sources is even higher than shown in Table 7.1.
The type of equipment concerned comprises mainly high voltage transformers as well aslow power apparatus such as switchgears, batteries, UPS systems, electronic racks and com-puters for supervision, distributed over the entire underground area. The detailed recordingof these equipments and their integration into the assessment of the fire risk is difficult tocarry out. Moreover, the warm cables of the LHC posed another difficulty in terms of firerisk assessment. The amount of different cable types and therefore varying fire properties sofar could not be integrated into the study in a feasible way.
For this reason, the nomination of a risk layer is introduced. As locating all combustiblematerial in the tunnel in detail is impossible, the risk layer is supposed to present the amountof inflammable material as well as electrical equipment as the possible ignition sources as a

7.3. QUANTITATIVE ANALYSIS - A DETAILED APPROACH 71
layer equally distributed along the main tunnel, technical galleries and alcoves. Included inthis risk layer will be the warm cables and all equipment mentioned previously which hasnot been incorporated in the material data project. Independent of the accumulation ofcombustible materials in certain areas, the evaluation of fire risk due to electrical equipmentwill be calculated as equal in every position in the underground.
The objective of this thesis is to give an order of magnitude for the fire risk of thisrisk layer in the LHC underground. The reasons for introducing this equally distributedrisk layer can be derived from two different motivations. On the one hand the inability ofincorporating every type of equipment in the material database implicates an imprecisionof the analysis carried out in chapter 6. And on the other hand the fact that fires in lowpower apparatus do occur quite frequently has to be taken into account. Since low powerequipment is not controlled as strictly as high power equipment, the possibility of failuresoccurring is increasingly apparent. With the idea of a risk layer along the underground areas,these concerns are being taken into account.
Although the approximation is rather inaccurate, the complexity of the LHC never-theless justifies a preferably simple and safe approach to estimating fire risk. Since alsoquantitatively unknown inflammable material will be included in the results, the possibilityexists that in this way the fire risk will be overestimated. However, as the LHC is such aprestigious project, where a fire accident could mean an extended downtime and involve highcosts, it is reasonable to be on the safe side.
7.3.2 Fault Tree Analysis
The Failure Modes and Effects Analysis for electrical installations is intended on the one handto describe the system under investigation and on the other hand to identify failure modeswhich can lead to a fire. In addition, the frequency and consequence analysis and eventuallythe creation of a risk matrix presents a transition from a qualitative to a quantitative analysis.As the assessment of frequency of occurrence and severity of consequences is actually basedon expert judgement and is therefore rather unsatisfactory, a way of approaching the problemof a more in-depth assessment and the examination of the failure origin is a fault tree analysis.
A fault tree analysis is a graphical and very descriptive way of illustrating the eventsleading to the system failure, determining the causes of the incident on a more detailed levelcompared to the FMEA. The most important advantage though from the point of view offrequency analysis is the determination of the basic events. As these are intended to describefaults on the lowest level of the analysis concerning the component structure of the system,it is supposed to be much easier to assign a value to the frequency of occurrence. Throughapplying basic Boolean algebra starting from the basic events at the bottom of the tree upto the top event, the probability of failure of the entire system can be calculated.
The top event for the fault tree will be defined as “fire in the LHC underground” dueto faulty electrical equipment. With this universal approach it is possible to determine theprobability of fire in the tunnel, revealing also the development and the contributing factors.
Certainly the results of the fault tree analysis have to be discussed according to the

72 CHAPTER 7. FIRE RISK ANALYSIS OF THE LHC UNDERGROUND AREA
source of the frequency values attributed to the basic events. Depending on the source, theycan vary to a great extent. However, in comparison to the FMEA, the fault tree analysisaddresses the global system failure and asks progressively about the contributing factors,which means that the core of the problem is tackled and examined. In the case of the LHC,the occurrence of an ignition source would be tracked to the bottom of the problem, aimingat the triggering factors.
7.3.2.1 Fault Tree Development
In this chapter, the assessment of the risk layer in the LHC tunnel is completed by means ofa fault tree analysis. As mentioned above, the fault tree has been developed in a universalway, valid for any position in the tunnel (Figures 7.3, 7.4 and 7.5).
The fault tree has been drawn up with the help of a software programme which allows toarrange the structure clearly and also includes features for qualitative as well as quantitativeanalysis. OpenFTA is an open source programme and was developed by Formal SoftwareConstruction Limited [59].
As the present fault tree is very complex and a fault tree analysis does have somerestrictions concerning the events and their interactions, explanations will be given in thefollowing paragraphs.
The tree was developed top down with a possible fire in the LHC underground due tofailures of electrical equipment as the top event. Following the three basic conditions for thegeneral development of a fire, the first level of intermediate events was apparent: an ignitionsource, inflammable material and oxygen. However, oxygen has not been included formallyinto the fault tree, as oxygen in the form of air is available anywhere in the tunnel. As thefailure probability of this basic event is 1 and it is logically linked with an AND gate, it wouldnot influence the quantitative analysis of the fault tree.
One of the reasons for the execution of this study was the worry about sufficient safetymeasures such as fire and smoke detectors. As these detectors are only found in certain areasof the LHC, the possible states of this system (non-existent, failing and reacting too late)have to be taken into account. Therefore the possibility of a non-detected fire or smoke hadto be included at this stage of the analysis. The case in which the fire brigade does notrespond to a given alarm is added, as human error concerning the correct reaction as well astechnical problems is probable. The causes involved could be mistaking the alarm for a testor the dysfunction of the Safety Control Room (SCR).
Two causes influence the presence of inflammable material. On the one hand it canbe the poor fire reaction of certain material. On the other hand a failure of an associatedsystem (cooling and ventilation) can create extreme thermal conditions (overheating), therebypromoting a poor fire reaction of usually fire-resisting material.
The question why there is actually any material present with poor fire properties canbe answered quite simply. First, inflammable material is necessary for certain equipmenttypes. This fact is supposed to be reported by the responsible group and approved by thecompetent authorities in the form of derogations to existing rules and regulations (e.g. septa

7.3. QUANTITATIVE ANALYSIS - A DETAILED APPROACH 73
Fig
ure
7.3:
Faul
ttr
eean
alys
is-
Top
even
t“F
ire
inth
eLH
Cun
derg
roun
d”

74 CHAPTER 7. FIRE RISK ANALYSIS OF THE LHC UNDERGROUND AREA
Figure 7.4: Fault tree analysis - Subtree 1
magnets). Second, packaging material such as wooden boxes or plastics has been left behindby workmen after installation, either due to carelessness or malice. Third, non-rated materialwas installed in the tunnel (i.e. non-standard cables). This is possible when at the same timepeople have arbitrarily decided to violate the rules and quality control (i.e. inspections) ofinstalled equipment has failed. The latter two failures are both down to human error.
The analysis of the development of an ignition source due to the failure of electricalequipment in the LHC underground obviously makes the biggest part of the fault tree. Incase a smoulder or fire occurs e.g. in an electronic rack, the affected system would not givegreen light for operation. This means that in the CERN Control Centre (CCC) the operatorswould have to trace the problem of this system, which would eventually involve people beingsent to the tunnel for investigation. This would present an indirect way of detecting a possibleignition source, if the time between the occurrence of the problem and the actual physicalintervention is not long enough for a fire to develop. However, if this indirect possibility ofdetection fails, the equipment failure might cause a source of ignition.
The subject of electrical faults and the detailed analysis of their causes are very complexand delicate. As Babrauskas [42] mentions in his article about electrical faults associated withwiring or with wiring devices in 120/240 V distribution systems, the evolution of an electricalfailure is usually not just one, but a chain of events. As an example, faulty cable insulationcan lead to a short circuit, which on his part can provoke electric arcing. The lack of studiesdealing with the basic physical mechanisms of electrical faults and the possibilities of their
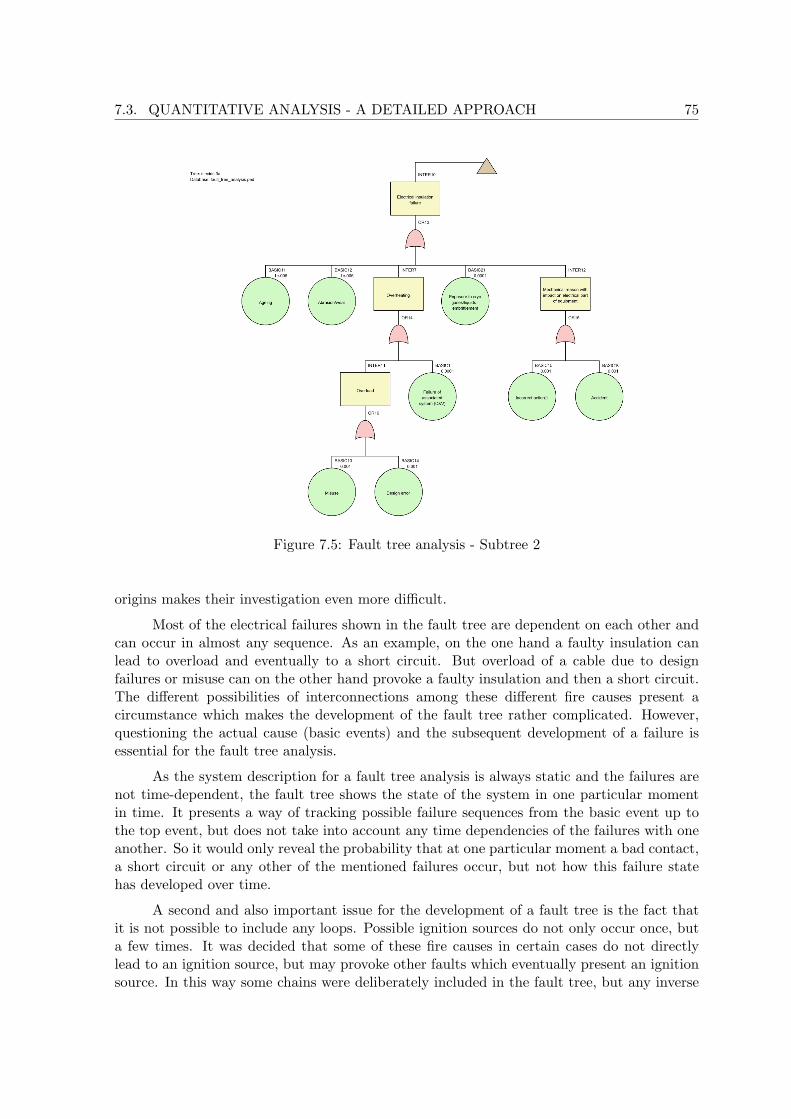
7.3. QUANTITATIVE ANALYSIS - A DETAILED APPROACH 75
Figure 7.5: Fault tree analysis - Subtree 2
origins makes their investigation even more difficult.
Most of the electrical failures shown in the fault tree are dependent on each other andcan occur in almost any sequence. As an example, on the one hand a faulty insulation canlead to overload and eventually to a short circuit. But overload of a cable due to designfailures or misuse can on the other hand provoke a faulty insulation and then a short circuit.The different possibilities of interconnections among these different fire causes present acircumstance which makes the development of the fault tree rather complicated. However,questioning the actual cause (basic events) and the subsequent development of a failure isessential for the fault tree analysis.
As the system description for a fault tree analysis is always static and the failures arenot time-dependent, the fault tree shows the state of the system in one particular momentin time. It presents a way of tracking possible failure sequences from the basic event up tothe top event, but does not take into account any time dependencies of the failures with oneanother. So it would only reveal the probability that at one particular moment a bad contact,a short circuit or any other of the mentioned failures occur, but not how this failure statehas developed over time.
A second and also important issue for the development of a fault tree is the fact thatit is not possible to include any loops. Possible ignition sources do not only occur once, buta few times. It was decided that some of these fire causes in certain cases do not directlylead to an ignition source, but may provoke other faults which eventually present an ignitionsource. In this way some chains were deliberately included in the fault tree, but any inverse
76 CHAPTER 7. FIRE RISK ANALYSIS OF THE LHC UNDERGROUND AREA
direction was avoided in order not to create loops.
It has to be stressed that the fault tree at hand is only one possibility of presenting thesubject of fires due to failures of electrical equipment. Keeping the afore made assumptionsand preconditions in mind, the final result for the fire risk in the LHC tunnel has to bediscussed with furthermost caution.
The equipment failures due to electrical reasons were divided into the following groups:overheating, bad contacts, electrical insulation failure and faults causing sudden high temper-atures. The first three are distinguished from the latter, as they are characterised by a rathergradual temperature rise over a long period of time compared to a significant temperaturerise within a short period of time. The last group is further classified and contains shortcircuit and ground fault, arcing, component failures inside electronic equipment and blockedmotors.
A few more failures within the latter group could be mentioned (such as explosion ofcapacitors or winding short circuit). However, they present special cases of the basic failureswith actually the same causes. They will not be included in this fault tree, since the repetitionof the basic events for very similar immediate events would distort the result for the top event.
Overheating of a cable can be caused by an overload or the failure of an associatedsystem such as cooling and ventilation [60]. By failing to cool the equipment itself or neigh-bouring systems, external heat sources and therefore extreme thermal ambient conditionscan be created. External heat sources might even emerge in spite of a perfect design, asthe operation of the machine can lead to non-intended conditions (long-term effects). Thecauses for overload can either be a design failure or the misuse of electric equipment, such asfeeding more consumers than actually designed for or running the equipment under abnormalconditions. Both are human failures, but they are not mentioned together, since their originsare of a different nature.
Unlike overheating, bad contacts do not occur along the full length of the cable, butonly at cable junctions or interconnections. These are the spots where corrosion, ageingand abrasion appear, or where a mechanical problem can lead to a loose connection andan abnormally high transition resistance. The transformation of this high resistance intoheat energy can lead to glowing connections [42]. A bad contact would be very difficult todetect, as its development can take weeks. This means that during the progress of transitionresistance rise-up until the failure becomes acute, the connection is still working.
Mechanical reasons for bad contacts are generally caused by human error. This failure“mode” is mentioned twice, once implying an incorrect human action, and once meaning anaccident or mishap. Incorrect human action could be failures during installation or commis-sioning or even malice; accidents are unintended actions such as a mishap with the transportvehicle or a handling accident.
The amount of cables and the number of different cable types in the tunnel is veryhigh, the problem of failing cable insulation is therefore apparent. On the one hand thereare natural causes of failure such as abrasion and ageing of material, and on the other handthere is certainly possible mechanical impact damaging the insulation from the outside aswell as overheating leading to carbonizing and melting of insulation [60]. A special dangerfor insulation material in the LHC tunnel is the presence of cryogenic gases. In case of leakage
7.3. QUANTITATIVE ANALYSIS - A DETAILED APPROACH 77
of helium from the cryogenic system, the insulating material may embrittle and deterioratefaster than actually expected. Regarding the mechanical causes of insulation failure, thesame explanations as for bad contacts apply.
Short circuit or ground fault occur when either two conductors of different potentialsare in contact or current flows between a conductor and the earth. As the resistance is verylow, the short circuit current is between 10 to 20 times higher than nominal current. Becauseof the released heat energy, short circuit or ground fault may be ignition sources and causefires or explosions [60].
Reasons for the occurrence of short circuits or ground faults can be an electrical in-sulation failure or an abnormally high humidity. The latter can allow the current to flowalong a different path than intended (water as the conducting material). This may happeneither directly due to a flooding or indirectly due to the failure of an associated system (i.e.condensation).
An electric arc is created when current flows through air from one conductor to theother. Air is usually an insulator; however, if the surrounding conditions (sufficient electricfield strength to exceed its dielectric strength) allow the air to be ionised, it can becomeconductive. Extremely high temperatures of a few 1,000◦C and therefore a vaporization ofmetal create high pressure and cause a blast [61,62].
Similar to the causes of a short circuit or ground fault, electrical arcing is provokedthrough a failure of electrical insulation or exceptional circumstances during operation. Ex-ceptional circumstances can create unexpected conditions and facilitate the development ofan arc (i.e. inappropriate electrical switching or an interlock override).
Blocked motors as well as failures of components inside electronic equipment are alsofailures causing sudden high temperatures.
The failure mode of human error has the greatest influence on the final result. Itis represented in most of the subtrees, thereby stressing its importance for the analysis.Although any mistake or mishap should be reported, this is dependent on the advertency aswell as the sincerity of the individual. The fault tree was not developed in any more detailconcerning failures of personnel (including noticing/not noticing and reporting/not reportingan accident or incorrect action, etc.), as human error would have been overrated.
7.3.2.2 Qualitative Analysis
After developing the fault tree, the qualitative analysis is done by determining its minimalcut sets. A minimal cut set is the smallest set of a minimum number of failing basic eventswhich result in a breakdown of the system, thus the top event. If one basic event is removed,the remaining basic events are not a cut set anymore, which means that they are not able tolead to a system failure.
In the OpenFTA software the determination of minimal cut sets is an integrated featurefor the analysis. The following report is generated:
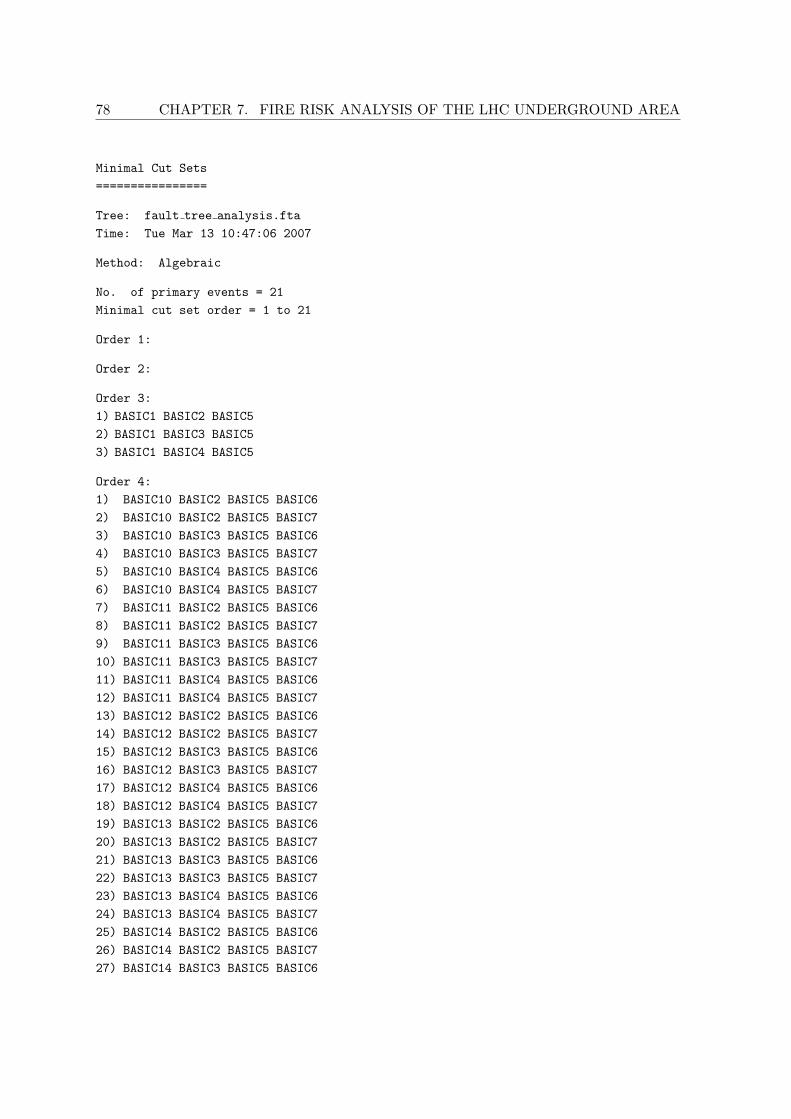
78 CHAPTER 7. FIRE RISK ANALYSIS OF THE LHC UNDERGROUND AREA
Minimal Cut Sets
================
Tree: fault tree analysis.fta
Time: Tue Mar 13 10:47:06 2007
Method: Algebraic
No. of primary events = 21
Minimal cut set order = 1 to 21
Order 1:
Order 2:
Order 3:
1) BASIC1 BASIC2 BASIC5
2) BASIC1 BASIC3 BASIC5
3) BASIC1 BASIC4 BASIC5
Order 4:
1) BASIC10 BASIC2 BASIC5 BASIC6
2) BASIC10 BASIC2 BASIC5 BASIC7
3) BASIC10 BASIC3 BASIC5 BASIC6
4) BASIC10 BASIC3 BASIC5 BASIC7
5) BASIC10 BASIC4 BASIC5 BASIC6
6) BASIC10 BASIC4 BASIC5 BASIC7
7) BASIC11 BASIC2 BASIC5 BASIC6
8) BASIC11 BASIC2 BASIC5 BASIC7
9) BASIC11 BASIC3 BASIC5 BASIC6
10) BASIC11 BASIC3 BASIC5 BASIC7
11) BASIC11 BASIC4 BASIC5 BASIC6
12) BASIC11 BASIC4 BASIC5 BASIC7
13) BASIC12 BASIC2 BASIC5 BASIC6
14) BASIC12 BASIC2 BASIC5 BASIC7
15) BASIC12 BASIC3 BASIC5 BASIC6
16) BASIC12 BASIC3 BASIC5 BASIC7
17) BASIC12 BASIC4 BASIC5 BASIC6
18) BASIC12 BASIC4 BASIC5 BASIC7
19) BASIC13 BASIC2 BASIC5 BASIC6
20) BASIC13 BASIC2 BASIC5 BASIC7
21) BASIC13 BASIC3 BASIC5 BASIC6
22) BASIC13 BASIC3 BASIC5 BASIC7
23) BASIC13 BASIC4 BASIC5 BASIC6
24) BASIC13 BASIC4 BASIC5 BASIC7
25) BASIC14 BASIC2 BASIC5 BASIC6
26) BASIC14 BASIC2 BASIC5 BASIC7
27) BASIC14 BASIC3 BASIC5 BASIC6

7.3. QUANTITATIVE ANALYSIS - A DETAILED APPROACH 79
28) BASIC14 BASIC3 BASIC5 BASIC7
29) BASIC14 BASIC4 BASIC5 BASIC6
30) BASIC14 BASIC4 BASIC5 BASIC7
31) BASIC15 BASIC2 BASIC5 BASIC6
32) BASIC15 BASIC2 BASIC5 BASIC7
33) BASIC15 BASIC3 BASIC5 BASIC6
34) BASIC15 BASIC3 BASIC5 BASIC7
35) BASIC15 BASIC4 BASIC5 BASIC6
36) BASIC15 BASIC4 BASIC5 BASIC7
37) BASIC16 BASIC2 BASIC5 BASIC6
38) BASIC16 BASIC2 BASIC5 BASIC7
39) BASIC16 BASIC3 BASIC5 BASIC6
40) BASIC16 BASIC3 BASIC5 BASIC7
41) BASIC16 BASIC4 BASIC5 BASIC6
42) BASIC16 BASIC4 BASIC5 BASIC7
43) BASIC17 BASIC2 BASIC5 BASIC6
44) BASIC17 BASIC2 BASIC5 BASIC7
45) BASIC17 BASIC3 BASIC5 BASIC6
46) BASIC17 BASIC3 BASIC5 BASIC7
47) BASIC17 BASIC4 BASIC5 BASIC6
48) BASIC17 BASIC4 BASIC5 BASIC7
49) BASIC18 BASIC2 BASIC5 BASIC6
50) BASIC18 BASIC2 BASIC5 BASIC7
51) BASIC18 BASIC3 BASIC5 BASIC6
52) BASIC18 BASIC3 BASIC5 BASIC7
53) BASIC18 BASIC4 BASIC5 BASIC6
54) BASIC18 BASIC4 BASIC5 BASIC7
55) BASIC19 BASIC2 BASIC5 BASIC6
56) BASIC19 BASIC2 BASIC5 BASIC7
57) BASIC19 BASIC3 BASIC5 BASIC6
58) BASIC19 BASIC3 BASIC5 BASIC7
59) BASIC19 BASIC4 BASIC5 BASIC6
60) BASIC19 BASIC4 BASIC5 BASIC7
61) BASIC2 BASIC20 BASIC5 BASIC6
62) BASIC2 BASIC20 BASIC5 BASIC7
63) BASIC2 BASIC21 BASIC5 BASIC6
64) BASIC2 BASIC21 BASIC5 BASIC7
65) BASIC20 BASIC3 BASIC5 BASIC6
66) BASIC20 BASIC3 BASIC5 BASIC7
67) BASIC20 BASIC4 BASIC5 BASIC6
68) BASIC20 BASIC4 BASIC5 BASIC7
69) BASIC21 BASIC3 BASIC5 BASIC6
70) BASIC21 BASIC3 BASIC5 BASIC7
71) BASIC21 BASIC4 BASIC5 BASIC6
72) BASIC21 BASIC4 BASIC5 BASIC7

80 CHAPTER 7. FIRE RISK ANALYSIS OF THE LHC UNDERGROUND AREA
Order 5:
1) BASIC10 BASIC2 BASIC5 BASIC8 BASIC9
2) BASIC10 BASIC3 BASIC5 BASIC8 BASIC9
3) BASIC10 BASIC4 BASIC5 BASIC8 BASIC9
4) BASIC11 BASIC2 BASIC5 BASIC8 BASIC9
5) BASIC11 BASIC3 BASIC5 BASIC8 BASIC9
6) BASIC11 BASIC4 BASIC5 BASIC8 BASIC9
7) BASIC12 BASIC2 BASIC5 BASIC8 BASIC9
8) BASIC12 BASIC3 BASIC5 BASIC8 BASIC9
9) BASIC12 BASIC4 BASIC5 BASIC8 BASIC9
10) BASIC13 BASIC2 BASIC5 BASIC8 BASIC9
11) BASIC13 BASIC3 BASIC5 BASIC8 BASIC9
12) BASIC13 BASIC4 BASIC5 BASIC8 BASIC9
13) BASIC14 BASIC2 BASIC5 BASIC8 BASIC9
14) BASIC14 BASIC3 BASIC5 BASIC8 BASIC9
15) BASIC14 BASIC4 BASIC5 BASIC8 BASIC9
16) BASIC15 BASIC2 BASIC5 BASIC8 BASIC9
17) BASIC15 BASIC3 BASIC5 BASIC8 BASIC9
18) BASIC15 BASIC4 BASIC5 BASIC8 BASIC9
19) BASIC16 BASIC2 BASIC5 BASIC8 BASIC9
20) BASIC16 BASIC3 BASIC5 BASIC8 BASIC9
21) BASIC16 BASIC4 BASIC5 BASIC8 BASIC9
22) BASIC17 BASIC2 BASIC5 BASIC8 BASIC9
23) BASIC17 BASIC3 BASIC5 BASIC8 BASIC9
24) BASIC17 BASIC4 BASIC5 BASIC8 BASIC9
25) BASIC18 BASIC2 BASIC5 BASIC8 BASIC9
26) BASIC18 BASIC3 BASIC5 BASIC8 BASIC9
27) BASIC18 BASIC4 BASIC5 BASIC8 BASIC9
28) BASIC19 BASIC2 BASIC5 BASIC8 BASIC9
29) BASIC19 BASIC3 BASIC5 BASIC8 BASIC9
30) BASIC19 BASIC4 BASIC5 BASIC8 BASIC9
31) BASIC2 BASIC20 BASIC5 BASIC8 BASIC9
32) BASIC2 BASIC21 BASIC5 BASIC8 BASIC9
33) BASIC20 BASIC3 BASIC5 BASIC8 BASIC9
34) BASIC20 BASIC4 BASIC5 BASIC8 BASIC9
35) BASIC21 BASIC3 BASIC5 BASIC8 BASIC9
36) BASIC21 BASIC4 BASIC5 BASIC8 BASIC9
Order 6:
Order 7:
Order 8:
Order 9:
Order 10:

7.3. QUANTITATIVE ANALYSIS - A DETAILED APPROACH 81
Order 11:
Order 12:
Order 13:
Order 14:
Order 15:
Order 16:
Order 17:
Order 18:
Order 19:
Order 20:
Order 21:
Qualitative Importance Analysis:
Order Number
----- ------
1 0
2 0
3 3
4 72
5 36
6 0
7 0
8 0
9 0
10 0
11 0
12 0
13 0
14 0
15 0
16 0
17 0
18 0
19 0
20 0
21 0
ALL 111

82 CHAPTER 7. FIRE RISK ANALYSIS OF THE LHC UNDERGROUND AREA
The report states the name of the file as well as the time when the report was generated.With 21 basic events (called primary events in OpenFTA) within the fault tree structure, thetotal number of minimal cut sets is 111, divided into minimal cut sets of orders 3, 4 and 5.
The qualitative importance analysis shows that there are 3 minimal cut sets of order3, 72 of order 4, and 36 of order 5. The order of a cut set determines the number of affectedbasic events, therefore in the present case 21 minimal cut set orders could be anticipated.However, the structure of the tree allows only for minimal cut sets of orders 3, 4 and 5.
The lower the order, the more influential is a minimal cut set concerning the appearanceof the top event. This comes from the fact that the simultaneous occurrence of e.g. threefailing basic events is much more probable than the occurrence of five failing basic events.
In the present case the majority of minimal cut sets is of order 4, which means thatat least four basic events have to fail at the same time in order that the system is failing.Together with minimal cut sets of order 5 they present about 97% of the total sum. However,the combination of four or five basic events is expected to happen rather infrequently, whichmeans that attention has to be turned to the minimal cut sets of order 3. Clearly dependingon their failure probabilities, these basic events will play an important role within the faulttree.
The qualitative analysis of a fault tree provides an overview of minimal cut sets as wellas their distribution to orders. Furthermore, it gives an idea of the importance of particularcombinations of basic events involved in the occurrence of the top event, thus facilitating theunderstanding of the fault tree structure. However, without failure probabilities assigned tothe basic events, their effective influence on the top event cannot be identified.
As the basis for the quantitative analysis, the minimal cut sets present an importantstep towards assessing a fault tree.
7.3.2.3 Quantitative Analysis
After analysing the fault tree in a qualitative way, the next step leads on to answering thequestion of how probable it is that a fire in the LHC underground occurs due to faultyelectrical equipment. In this chapter, failure probabilities of the basic events together withexplanations concerning their origin will be discussed and the final result presented.
The failure probabilities will be given as relative frequencies, not refering to unit oftime. Due to the probability relations for the quantitative analysis of a fault tree, only valuesindependent of time can be applied without restrictions (see chapter 4.3.3.3).
7.3.2.3.1 Failure Probabilities of Basic Events
Essential for the evaluation of a fault tree is the definition of failure probabilities for the basicevents. A difference will be made between failures related to human error and those relatedto technical breakdown.

7.3. QUANTITATIVE ANALYSIS - A DETAILED APPROACH 83
It has to be stated that the definition of failure probabilities for the present fire riskanalysis of the LHC tunnel is a very difficult task. Unfortunately no detailed records have beenkept from the LEP operation time containing failures as well as their causes and consequences.Thus no statistical evaluation resulting in system-dependent failure probability data couldbe conducted. For the fault tree at hand this means that for the bigger part of the basicevents’ probability data only estimations were possible. Where feasible, data were takenfrom related statistics and failure probabilities for the basic events were deduced. However,the background information concerning these values comes from different origins, and thedirectly available probability data were not taken from one common source. This means thatthe quantitative analysis leaves room for uncertainty.
The subject of determining probabilities concerning human error is a very delicate issue.The range of human actions and responses to present situations is broad, and so is the rangeof human unreliability values. In the present fault tree human error plays an important role,as it is part of almost all possible ignition sources. However, as the human behaviour is acomplex subject and the possibilities of incorrect actions or reactions within the boundariesof this work are numerous, only rough estimates for the failure probabilities are feasible.Therefore a general distinction between two particular forms of human behaviour (actionand reaction) has been made and the corresponding probability values have been estimated(following [22]).
Whenever a task has to be accomplished, a human action is required. Within this task,a failure can occur either deliberately or undeliberately. However, as it is assumed that theperson is trained adequately and does not intend to harm the project willingly, the failureprobability of the first group (action) is estimated to be 1.0 · 10−3.
In case of an alarm or error signal in the control room, a response of the operator tothe new conditions is required. In a situation like this, where a reaction is needed in orderto restore the system or initiate emergency assistance, the person in charge is usually undertime pressure and outside of his/her routine. Due to this fact, the failure probability of thesecond group (reaction) is estimated to be higher and is therefore 1.0 · 10−2.
In the following, the basic events involving human error are grouped according to thedetermined distinction.
ACTION:
BASIC 7: Packaging material (wooden boxes, plastic) left behind after installation
This basic event is determined by human inadvertency as well as neglect of writteninstructions.
BASIC 8: Quality control failure
Any failure concerning the technical inspections of electrical equipment in the LHCtunnel occurs either due to inadvertency or due to excessive demand because of thecomplexity of the project.
BASIC 9: Arbitrary act - purchase and installation
This basic event represents an apparent neglect of instructions.

84 CHAPTER 7. FIRE RISK ANALYSIS OF THE LHC UNDERGROUND AREA
BASIC 13: Misuse
The misuse of equipment is usually unintended and rather a result of inadvertency orunexpected operating conditions.
BASIC 14: Design error
A failure of equipment design is clearly caused by inadvertency of design engineers.Although this failure is prone to be discovered during various equipment tests, it cannotbe ruled out completely.
BASIC 15: Incorrect action
This basic event includes any incorrect action during installation, whether it is a mistakeor failures due to inadvertency.
BASIC 16: Accident
Working in the tunnel always implies the possibility of accidents with any tools ortransport vehicles.
REACTION:
BASIC 4: No response to alarm on the part of the fire brigade
This basic event is not only influenced by human error, but also by the possibility of atechnical problem, such as the dysfunction of the Safety Control Room. However, thegreat difference of the order of magnitude of failure probabilities between a technicalsystem and human error certainly shifts the emphasis towards human error. The presentcase requires a reaction of the fire brigade to an alarm, where a misinterpretation ofthe signal is possible (e.g. mistaken for a test, assuming a faulty channel, as it has beenproblematic prior to the event) and the person in charge is under pressure.
BASIC 5: Indirect way of detection fails
The indirect detection of a fire or smoulder is dependent on whether or not the con-cerned subsystem is equipped with a possibility to send an error message as well ason the reaction of the operator in the CCC. Out of these two factors it is the humanintervention which has the higher failure probability and is therefore affecting this basicevent more significantly.
Failures related to a technical breakdown are presented subsequently:
BASIC 1: Failure of associated system
This basic event mainly concerns a failure within the cooling and ventilation system,with the emphasis on elements such as pumps or filters. These are active components,and their probability of failure is estimated to be 1.0 · 10−4 [21].
BASIC 2: No fire or smoke detection system available
The ratio of the area without fire and smoke detectors to the entire underground areawas taken as an indication for the probability of a fire occurring in an unequipped

7.3. QUANTITATIVE ANALYSIS - A DETAILED APPROACH 85
location. The number of civil works concerned by this study is approximately 170, ofwhich 40 are provided with detectors. Therefore the “failure” probability is about 7.5· 10−1. The underground area is a single compartment, and cooling and ventilationcan propagate smoke. This means that about 25% of the underground area is directlycovered by fire and smoke detection, and a fire in the remaining 75% would be detectedwith delay. Thus the probability of a fire occurring in an unequipped area was adjusteddownwards to 3.5 · 10−1.
BASIC 3: Fire or smoke detection system fails or reacts too late
The efficiency factor of the used fire and smoke detectors is 95%, which results in afailure probability of 5.0 · 10−2 [63].
BASIC 6: Inflammable material necessary for certain equipments
The ratio between the total amount of materials in the tunnel to the amount of com-bustible material is taken as an indication for the probability of finding inflammablematerial in the LHC tunnel. Referring to the material inventory of the material dataproject, the total amount of materials used for equipments is approximately 47,082 t,and the total quantity of cables in the underground area amounts to approximately2,194 t. The sum of 527 t of combustible material and 1,756 t of insulation polymersrepresents approximately 5% of the total amount of combustibles. Considering the factthat polymers of Group 1 and 2 are presenting the biggest part of the combustiblesand moreover not all materials are exposed directly to air, the probability of findinginflammable material in the LHC tunnel is adjusted downwards to 2.5 · 10−2.
BASIC 10: Corrosion
Corrosion is the deterioration of material properties due to the material’s reaction withits surroundings [64]. It is a passive process and the probability of e.g. cable junctionscorroding is therefore 1.0 · 10−6.
BASIC 11: Ageing
Components are usually in use over a certain time period, and with time their propertiesdeteriorate. Ageing is again a passive process; the probability of e.g. ageing cableinsulation is 1.0 · 10−6.
BASIC 12: Abrasion/wear
When the surface of a component is in contact with another solid, fluid or gaseousbody, material can be gradually removed from its surface [64]. As a passive process,the probability of e.g. wearing cable insulation is 1.0 · 10−6.
BASIC 17: Blocked motors
Motors are active elements and their failure probability is approximately 1.0 · 10−4 [21].
BASIC 18: Component failure inside electronic equipment
The failure of components inside electronic equipment are assessed as the malfunction ofelectromechanical parts, thus their failure probability is estimated to be 5.0 · 10−4 [21].

86 CHAPTER 7. FIRE RISK ANALYSIS OF THE LHC UNDERGROUND AREA
BASIC 19: Exceptional circumstances during operation
As there is no experience available concerning the operation of a machine such as theLHC, exceptional circumstances during operation are to be expected. As this is mainlydue to failures of electromechanical parts, the failure probability of this basic event is5.0 · 10−4 [21].
BASIC 20: Flooding
Although the LHC is running through the territory of a few municipalities, only oneof them had as much as three floodings between 1983 and 2004, the remaining oneseven less than three [38]. As there have been no reported consequences for the LHCtunnel, a natural cause for flooding will not be the crucial factor for the determinationof the probability of occurrence. In case of flooding due to the breakdown of C&Vequipment, a cascade of pumps in the tunnel is designed to take on the excess ofwater [65]. Although the pumps are redundant, the estimation for the analysis willbe based on the failure probability of one pump. As an active element, its failureprobability is 1.0 · 10−4 [21].
BASIC 21: Exposure to cryo gases/liquids - embrittlement
Due to its cryogenic temperature and therefore ability to freeze any substance, a heliumspill could lead to the embrittlement of surrounding materials. Within the LHC tunnelit is the cryogenic distribution line as well as the so-called jumper connections whichcould present a source of problems. The latter contains active components such asvalves; therefore the failure probability of this basic event is 1.0 · 10−4 [21].
7.3.2.3.2 Failure Probability of the Top Event
As mentioned before, OpenFTA uses the minimal cut sets of the qualitative analysis as abasis in order to obtain a failure probability of the top event. This is done by calculating theprobability of each minimal cut set and subsequently the probability of at least one minimalcut set occurring. The latter value is then the failure probability of the top event.
In OpenFTA the following quantitative report is generated:
Probabilities Analysis
======================
Tree: fault tree analysis.fta
Time: Tue Mar 13 10:59:33 2007
Number of primary events = 21
Number of minimal cut sets = 111
Order of minimal cut sets = 21
Unit time span = 1.000000
Minimal cut set probabilities:
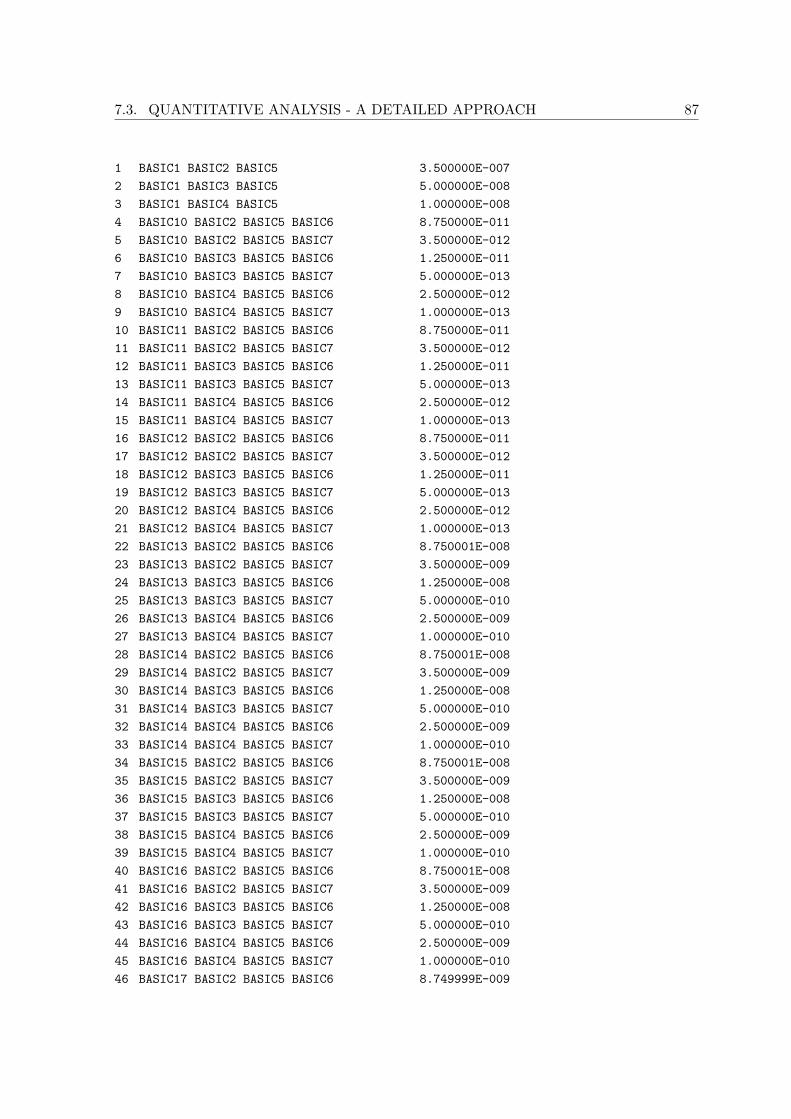
7.3. QUANTITATIVE ANALYSIS - A DETAILED APPROACH 87
1 BASIC1 BASIC2 BASIC5 3.500000E-007
2 BASIC1 BASIC3 BASIC5 5.000000E-008
3 BASIC1 BASIC4 BASIC5 1.000000E-008
4 BASIC10 BASIC2 BASIC5 BASIC6 8.750000E-011
5 BASIC10 BASIC2 BASIC5 BASIC7 3.500000E-012
6 BASIC10 BASIC3 BASIC5 BASIC6 1.250000E-011
7 BASIC10 BASIC3 BASIC5 BASIC7 5.000000E-013
8 BASIC10 BASIC4 BASIC5 BASIC6 2.500000E-012
9 BASIC10 BASIC4 BASIC5 BASIC7 1.000000E-013
10 BASIC11 BASIC2 BASIC5 BASIC6 8.750000E-011
11 BASIC11 BASIC2 BASIC5 BASIC7 3.500000E-012
12 BASIC11 BASIC3 BASIC5 BASIC6 1.250000E-011
13 BASIC11 BASIC3 BASIC5 BASIC7 5.000000E-013
14 BASIC11 BASIC4 BASIC5 BASIC6 2.500000E-012
15 BASIC11 BASIC4 BASIC5 BASIC7 1.000000E-013
16 BASIC12 BASIC2 BASIC5 BASIC6 8.750000E-011
17 BASIC12 BASIC2 BASIC5 BASIC7 3.500000E-012
18 BASIC12 BASIC3 BASIC5 BASIC6 1.250000E-011
19 BASIC12 BASIC3 BASIC5 BASIC7 5.000000E-013
20 BASIC12 BASIC4 BASIC5 BASIC6 2.500000E-012
21 BASIC12 BASIC4 BASIC5 BASIC7 1.000000E-013
22 BASIC13 BASIC2 BASIC5 BASIC6 8.750001E-008
23 BASIC13 BASIC2 BASIC5 BASIC7 3.500000E-009
24 BASIC13 BASIC3 BASIC5 BASIC6 1.250000E-008
25 BASIC13 BASIC3 BASIC5 BASIC7 5.000000E-010
26 BASIC13 BASIC4 BASIC5 BASIC6 2.500000E-009
27 BASIC13 BASIC4 BASIC5 BASIC7 1.000000E-010
28 BASIC14 BASIC2 BASIC5 BASIC6 8.750001E-008
29 BASIC14 BASIC2 BASIC5 BASIC7 3.500000E-009
30 BASIC14 BASIC3 BASIC5 BASIC6 1.250000E-008
31 BASIC14 BASIC3 BASIC5 BASIC7 5.000000E-010
32 BASIC14 BASIC4 BASIC5 BASIC6 2.500000E-009
33 BASIC14 BASIC4 BASIC5 BASIC7 1.000000E-010
34 BASIC15 BASIC2 BASIC5 BASIC6 8.750001E-008
35 BASIC15 BASIC2 BASIC5 BASIC7 3.500000E-009
36 BASIC15 BASIC3 BASIC5 BASIC6 1.250000E-008
37 BASIC15 BASIC3 BASIC5 BASIC7 5.000000E-010
38 BASIC15 BASIC4 BASIC5 BASIC6 2.500000E-009
39 BASIC15 BASIC4 BASIC5 BASIC7 1.000000E-010
40 BASIC16 BASIC2 BASIC5 BASIC6 8.750001E-008
41 BASIC16 BASIC2 BASIC5 BASIC7 3.500000E-009
42 BASIC16 BASIC3 BASIC5 BASIC6 1.250000E-008
43 BASIC16 BASIC3 BASIC5 BASIC7 5.000000E-010
44 BASIC16 BASIC4 BASIC5 BASIC6 2.500000E-009
45 BASIC16 BASIC4 BASIC5 BASIC7 1.000000E-010
46 BASIC17 BASIC2 BASIC5 BASIC6 8.749999E-009

88 CHAPTER 7. FIRE RISK ANALYSIS OF THE LHC UNDERGROUND AREA
47 BASIC17 BASIC2 BASIC5 BASIC7 3.500000E-010
48 BASIC17 BASIC3 BASIC5 BASIC6 1.250000E-009
49 BASIC17 BASIC3 BASIC5 BASIC7 5.000000E-011
50 BASIC17 BASIC4 BASIC5 BASIC6 2.500000E-010
51 BASIC17 BASIC4 BASIC5 BASIC7 1.000000E-011
52 BASIC18 BASIC2 BASIC5 BASIC6 4.375000E-008
53 BASIC18 BASIC2 BASIC5 BASIC7 1.750000E-009
54 BASIC18 BASIC3 BASIC5 BASIC6 6.250000E-009
55 BASIC18 BASIC3 BASIC5 BASIC7 2.500000E-010
56 BASIC18 BASIC4 BASIC5 BASIC6 1.250000E-009
57 BASIC18 BASIC4 BASIC5 BASIC7 5.000000E-011
58 BASIC19 BASIC2 BASIC5 BASIC6 4.375000E-008
59 BASIC19 BASIC2 BASIC5 BASIC7 1.750000E-009
60 BASIC19 BASIC3 BASIC5 BASIC6 6.250000E-009
61 BASIC19 BASIC3 BASIC5 BASIC7 2.500000E-010
62 BASIC19 BASIC4 BASIC5 BASIC6 1.250000E-009
63 BASIC19 BASIC4 BASIC5 BASIC7 5.000000E-011
64 BASIC2 BASIC20 BASIC5 BASIC6 8.749999E-009
65 BASIC2 BASIC20 BASIC5 BASIC7 3.500000E-010
66 BASIC2 BASIC21 BASIC5 BASIC6 8.749999E-009
67 BASIC2 BASIC21 BASIC5 BASIC7 3.500000E-010
68 BASIC20 BASIC3 BASIC5 BASIC6 1.250000E-009
69 BASIC20 BASIC3 BASIC5 BASIC7 5.000000E-011
70 BASIC20 BASIC4 BASIC5 BASIC6 2.500000E-010
71 BASIC20 BASIC4 BASIC5 BASIC7 1.000000E-011
72 BASIC21 BASIC3 BASIC5 BASIC6 1.250000E-009
73 BASIC21 BASIC3 BASIC5 BASIC7 5.000000E-011
74 BASIC21 BASIC4 BASIC5 BASIC6 2.500000E-010
75 BASIC21 BASIC4 BASIC5 BASIC7 1.000000E-011
76 BASIC10 BASIC2 BASIC5 BASIC8 BASIC9 3.500000E-015
77 BASIC10 BASIC3 BASIC5 BASIC8 BASIC9 5.000000E-016
78 BASIC10 BASIC4 BASIC5 BASIC8 BASIC9 1.000000E-016
79 BASIC11 BASIC2 BASIC5 BASIC8 BASIC9 3.500000E-015
80 BASIC11 BASIC3 BASIC5 BASIC8 BASIC9 5.000000E-016
81 BASIC11 BASIC4 BASIC5 BASIC8 BASIC9 1.000000E-016
82 BASIC12 BASIC2 BASIC5 BASIC8 BASIC9 3.500000E-015
83 BASIC12 BASIC3 BASIC5 BASIC8 BASIC9 5.000000E-016
84 BASIC12 BASIC4 BASIC5 BASIC8 BASIC9 1.000000E-016
85 BASIC13 BASIC2 BASIC5 BASIC8 BASIC9 3.500000E-012
86 BASIC13 BASIC3 BASIC5 BASIC8 BASIC9 5.000001E-013
87 BASIC13 BASIC4 BASIC5 BASIC8 BASIC9 1.000000E-013
88 BASIC14 BASIC2 BASIC5 BASIC8 BASIC9 3.500000E-012
89 BASIC14 BASIC3 BASIC5 BASIC8 BASIC9 5.000001E-013
90 BASIC14 BASIC4 BASIC5 BASIC8 BASIC9 1.000000E-013
91 BASIC15 BASIC2 BASIC5 BASIC8 BASIC9 3.500000E-012
92 BASIC15 BASIC3 BASIC5 BASIC8 BASIC9 5.000001E-013

7.3. QUANTITATIVE ANALYSIS - A DETAILED APPROACH 89
93 BASIC15 BASIC4 BASIC5 BASIC8 BASIC9 1.000000E-013
94 BASIC16 BASIC2 BASIC5 BASIC8 BASIC9 3.500000E-012
95 BASIC16 BASIC3 BASIC5 BASIC8 BASIC9 5.000001E-013
96 BASIC16 BASIC4 BASIC5 BASIC8 BASIC9 1.000000E-013
97 BASIC17 BASIC2 BASIC5 BASIC8 BASIC9 3.500000E-013
98 BASIC17 BASIC3 BASIC5 BASIC8 BASIC9 5.000000E-014
99 BASIC17 BASIC4 BASIC5 BASIC8 BASIC9 1.000000E-014
100 BASIC18 BASIC2 BASIC5 BASIC8 BASIC9 1.750000E-012
101 BASIC18 BASIC3 BASIC5 BASIC8 BASIC9 2.500000E-013
102 BASIC18 BASIC4 BASIC5 BASIC8 BASIC9 5.000001E-014
103 BASIC19 BASIC2 BASIC5 BASIC8 BASIC9 1.750000E-012
104 BASIC19 BASIC3 BASIC5 BASIC8 BASIC9 2.500000E-013
105 BASIC19 BASIC4 BASIC5 BASIC8 BASIC9 5.000001E-014
106 BASIC2 BASIC20 BASIC5 BASIC8 BASIC9 3.500000E-013
107 BASIC2 BASIC21 BASIC5 BASIC8 BASIC9 3.500000E-013
108 BASIC20 BASIC3 BASIC5 BASIC8 BASIC9 5.000000E-014
109 BASIC20 BASIC4 BASIC5 BASIC8 BASIC9 1.000000E-014
110 BASIC21 BASIC3 BASIC5 BASIC8 BASIC9 5.000000E-014
111 BASIC21 BASIC4 BASIC5 BASIC8 BASIC9 1.000000E-014
Probability of top level event (minimal cut sets up to order 21 used):
1 term +9.753211E-007 = 9.753211E-007 (upper bound)
2 terms -5.320028E-008 = 9.221208E-007 (lower bound)
3 terms +8.199447E-010 = 9.229408E-007 (upper bound)
4 terms -1.134826E-010 = 9.228273E-007 (lower bound)
Primary Event Analysis:
Event Failure contrib. Importance
BASIC1 4.100000E-007 44.43%
BASIC10 1.066041E-010 0.01%
BASIC11 1.066041E-010 0.01%
BASIC12 1.066041E-010 0.01%
BASIC13 1.066041E-007 11.55%
BASIC14 1.066041E-007 11.55%
BASIC15 1.066041E-007 11.55%
BASIC16 1.066041E-007 11.55%
BASIC17 1.066041E-008 1.16%
BASIC18 5.330206E-008 5.78%
BASIC19 5.330206E-008 5.78%
BASIC2 8.325916E-007 90.22%
BASIC20 1.066041E-008 1.16%
BASIC21 1.066041E-008 1.16%
BASIC3 1.189416E-007 12.89%
BASIC4 2.378832E-008 2.58%
BASIC5 9.753211E-007 105.69%

90 CHAPTER 7. FIRE RISK ANALYSIS OF THE LHC UNDERGROUND AREA
BASIC6 5.435575E-007 58.90%
BASIC7 2.174230E-008 2.36%
BASIC8 2.174230E-011 0.00%
BASIC9 2.174230E-011 0.00%
Similar to the qualitative report, the quantitative report starts off with the listing ofall minimal cut sets. However, this time the failure probability of each minimal cut set isincluded, providing information about how probable it is for each basic event combinationto occur. The three minimal cut sets with only three basic events affected have a ratherhigh failure probability compared to the remaining cut sets. Following the discussion of thequalitative analysis, this was an already expected outcome due to their low order.
The probability of the top event is then calculated using the failure probabilities avail-able for each minimal cut set. Since a minimal cut set is the minimum number of failingbasic events leading to a system failure, the probability of the top event occurring is:
P (topevent) = P (M1 OR M2 OR M3 . . . OR Mn)= P (M1 ∪ M2 ∪ . . . ∪ Mn)
(7.1)
In formula (7.1) M is a minimal cut set and n is the total number of minimal cut setsfor a fault tree. Since basic events may not only occur once, but several times in a fault tree,and the minimal cut sets are neither mutually exclusive nor independent, it follows that
P (topevent) =n∑
i=1
P (Mi)
−n∑
i=2
i−1∑j=1
P (Mi ∩ Mj)
+n∑
i=3
i−1∑j=2
j−1∑k=1
P (Mi ∩ Mj ∩ Mk)
− . . .
+ (−1)n−1P (M1 ∩ M2 ∩ . . . ∩ Mn)
(7.2)
The number of terms is dependent on the number of minimal cut sets, thus 2n. There-fore the calculation of an even rather small fault tree would take a prohibitively long time.In the present case, 21 basic events result in 111 minimal cut sets, which would require tocalculate 2111 (more than 1030) terms to determine the probability of the top event.
OpenFTA compasses this problem with an approximation for equation (7.2), givingresults close to the exact value:

7.3. QUANTITATIVE ANALYSIS - A DETAILED APPROACH 91
P1 ≡n∑
i=1
P (Mi)
≡ P1 −n∑
i=2
i−1∑j=1
P (Mi ∩ Mj)
≡ P2 −n∑
i=3
i−1∑j=2
j−1∑k=3
P (Mi ∩ Mj ∩ Mk)
. . .
(7.3)
With 2n terms in total, the first term is the sum of all minimal cut set probabilitiesadjusted towards the exact result by each additional term. Every other increment is negative,which means that the exact value is approximated alternately with an upper and a lowerbound. Usually it is not necessary to use more than three terms for the calculation, theresult is sufficiently accurate.
For the fault tree at hand, a failure probability of the top event of 9.23 · 10−7 iscalculated. Four terms have been used for the calculation, showing a gradual approximationto the exact value. With a correction of only -1.13 · 10−10 for the fourth term, the precisionof the result is certainly sufficient.
In addition to providing a failure probability of the top event, the quantitative analysisalso includes a primary event analysis. This analysis specifies the contribution of each basicevent towards the system failure and presents it as a percentage importance value. Againbased on the minimal cut sets determined in the qualitative analysis, all minimal cut setprobabilities which affect one single basic event are added up and taken as a percentageof the top event failure probability. As an example, the basic event “failure of associatedsystem” (BASIC1) is contained in three minimal cut sets; the sum of their probabilities is4.10 · 10−7, which is 44.43% of 9.23 · 10−7.
The present fault tree has been developed for a risk layer along the LHC tunnel, assum-ing that combustible material and possible ignition sources are equally distributed. Takinginto consideration that in some areas there are accumulations of electrical equipments andinflammable materials close by, an even higher probability of fire can be expected. This isparticularly true for the specified areas concerning fire risk (see chapter 7.1.3).
As an average fire probability due to faulty electrical equipment valid for the entireunderground area, 9.23 · 10−7 presents a plausible result. Considering approximately 5,000operating hours of the LHC per year, a fire would occur every 217 years. With an expectedlifetime of the LHC of 20 years, the risk of fire in the LHC tunnel is very low.
The expert judgement of the previous chapter assessed the failure modes of an electricalinstallation, their frequency of occurrence and the severity of their consequences, but it didnot assess directly the risk of having a fire in the underground area. Different to that, thefault tree analysis goes one step further and asks for the events leading to these electricalfailure modes and their interactions among each other as well as with external circumstancesrelating to the top event. Due to the way of developing a fault tree, it does not only include

92 CHAPTER 7. FIRE RISK ANALYSIS OF THE LHC UNDERGROUND AREA
the apparent problems of failure in electrical equipments, but also criticised circumstancessuch as insufficient fire and smoke detection in some areas as well as the impact of humanfailure. Taking these issues and also the complexity of the LHC into consideration, a fire riskof 9.23 · 10−7 is a very low value. In these calculations only failures due to faulty electricalequipment are included, for an overall fire risk for the LHC tunnel including any possiblecauses certainly a higher failure probability has to be expected.
Although the result seems to be an acceptable outcome, it does not reveal any con-clusions relating to the level of uncertainty. In this context, the influence of certain basicevents on the failure probability of the top event, as shown in the primary events analysis, isan interesting as well as important subject to discuss. The importance is dependent on thenumber of minimal cut sets a basic event is involved in. So if the probability values of basicevents with a high importance are very uncertain i.e. due to lack of basis data, the result forthe top event is highly probable to have a wide range of uncertainty as well.
In the present fault tree, the basic event “indirect way of detection fails” (BASIC5) hasan importance of 105.69% and has consequently the greatest influence on the top event. Sinceit is actually contained within all 111 minimal cut sets, a modification of its probability valuewould certainly show an impact on the final result. By changing the human error probabilityfrom 1.0 · 10−2 to 1.0 · 10−3, the system failure goes down to as much as 9.23 · 10−8, a dropof factor 10, whereas the importance value distribution stays approximately the same. If thehuman error probability is increased, an opposite effect on the top event failure probabilitycan be observed, but again the primary event analysis is unaffected.
On the contrary, if a probability value of a basic event with a low importance value ismodified, the impact on the overall system failure and the importance value distribution isminor or even negligible.
The most influential basic events are the failure of an associated system (BASIC1,44.43%), the lack of sufficient fire and smoke detection (BASIC2, 90.22%), the inability ofdetecting a developing fire indirectly (BASIC5, 105.69%) and the presence of inflammablematerial (BASIC6, 58.90%). Interestingly, there is only one basic event concerning humanerror included in this group. This means that the emphasis on the complex subject ofestimating human error probabilities is shifted, only leaving one instead of nine basic humanevents to be analysed within the fault tree.
With the human error estimation of 1.0 · 10−2 for reacting and detecting a fire indirectly,this study is intended to show a conservative approach. In case of an even more extremeassumption of 1.0 · 10−1 for the human error probability of reacting on a new situation, theorder of magnitude of the occurrence of the top event is shifted towards 10−6. However, ifassuming a trained and experienced operator, the latter value of 10−6 is rather unlikely.
The remaining basic events with the highest importance values are all failures relatedto a technical breakdown or a given technical condition. The one with the highest level ofuncertainty is the question whether there is sufficient fire and smoke detection in the entireunderground area. If the value of “no fire or smoke detection system available” (BASIC2) ismodified to the most extreme value possible, that is to say 7.5 · 10−1 (thereby only includ-ing areas equipped with direct fire and smoke detection), the probability of system failureincreases to 1.82 · 10−6 and the importance of the availability of fire and smoke detection to

7.3. QUANTITATIVE ANALYSIS - A DETAILED APPROACH 93
98.23%. On the contrary, assuming that there are actually fire and smoke detectors almosteverywhere in the tunnel (failure probability of 1.0 · 10−2), the top event value would dropto 1.64 · 10−7 and the importance of the availability of fire and smoke detection to 14.54%.This means that fire risk could be reduced almost by a factor 10 by increasing the numberof detectors. However, the gain of safety has to be weighed against the cost of the necessaryequipment.
The basic events concerning the failure of an associated system and the presence ofinflammable material in the tunnel present fairly safe estimations or are given values. More-over, any modifications of their failure probabilities result in only minor changes of the topevent result, which remains within the order of magnitude of 10−7.


Chapter 8
Discussion of the Results
The purpose of the thesis was not only a qualitative as well as quantitative analysis of the riskof fire in the LHC tunnel, but also the identification of the main reasons for this risk in orderto reduce its probability. Therefore proposals for improvement of the problems identifiedduring the performance of the risk analysis will be made in the following sections.
The impossibility of changing the configurations of materials and/or electrical equip-ments in the LHC limits the actions to be taken in order to reduce the fire risk. A possible wayof approaching this problem would be to gain deeper knowledge of the subject by monitoringit in the future, which will eventually allow for a refinement of its results.
8.1 Fire Protection Zones
The fire protection zones are sensitive areas in the LHC tunnel in terms of fire risk outlinedby this thesis. However, their identification is not sufficient and further action is requiredwith the purpose of improving fire safety in these and other underground areas.
Safety measures must be implemented in order to either prevent an incident fromhappening or to mitigate its effects. Concerning the LHC, the recommended actions will befocusing on the prevention as well as on the mitigation of consequences: the areas will bemarked as special fire protection zones implying reinforced fire and smoke detection as wellas special indication, rules and responsibilities.
The principle of identifying protection zones is applied in industry in relation to explo-sion protection. Areas with the potential to create an explosive atmosphere are divided intozones depending on its residence time. The mixture of air and combustible gases, vapouror mist can be frequently (Zone 0), occasionally (Zone 1) or temporary (Zone 2) available.Adequate safety measures aim at the removal of ignition sources or, if this is not possible,the reduction of their frequency of occurrence [66].
With regard to the LHC, grading of the fire hazardous zones is not required, since anyrisk, however small, needs to be addressed. Therefore only two classifications exist: fire risk
95

96 CHAPTER 8. DISCUSSION OF THE RESULTS
Figure 8.1: Signboard for fire protection zones
and no fire risk.
8.1.1 Reinforced Fire and Smoke Detection
Fire and smoke detection is of principal importance in all the underground areas, but evenmore within these particularly sensitive zones. Some areas of the LHC tunnel are alreadyequipped with detectors, but other areas, which have been analyzed here, do not have any fireand smoke detection equipment as a consequence of underestimating their fire risk elsewhere.
The recommendation given is to urgently re-design the layout and increase the numberof the detectors in the tunnel in order to improve the coverage. The quantitative analysisof the previous chapter revealed that fire risk could be reduced almost by a factor 10 byincreasing the number of detectors (see chapter 7.3.2.3.2).
8.1.2 Signposting
Following the Council Directive 92/58/EEC of June 24th, 1992, on the minimum requirementsfor the provision of safety and/or health signs at work, and in order to make people aware ofthe special risk of the areas, eye-catching signposting must be provided (Figure 8.1) [67].
The signs must be easily recognisable and members of personnel have to be able toassociate them with the corresponding rules.

8.1. FIRE PROTECTION ZONES 97
8.1.3 Risk Description
The LHC underground area has a special status regarding the efforts of the fire brigade.With only eight access points for a total tunnel length of 27 km and the restricted accesswithin the underground area to a possible fire, the fire brigade’s response to a fire must becautiously coordinated. As CERN has its own fire service department, personnel are trainedfor this particular working environment. However, the knowledge about special areas at riskcan help even further to provide the best possible assistance and preventive action.
In order to support the fire brigade, the persons in charge of the fire protection zone(from the department operating the hazardous equipment) should complete a so-called RiskDescription form. In this form data should be provided in such a way that based on thesethe fire brigade can develop their intervention plans for the underground areas in case of fire.
The fire brigade’s intervention plan includes the following issues [68]:
• Location and access of the zone,
• description of the zone including its purpose, dimensions and structure,
• description of the type of hazards,
• details concerning active as well as passive prevention measures,
• instructions concerning the intervention,
• and the names, functions and telephone numbers of the persons in charge.
Based on this, the Risk Description form was developed to provide a background for eachtopic in order to reduce the amount of enquiry for the fire brigade. Figure 8.2 shows anexample of how regular reviews of the situation in each area of interest may look like.
In order to complete the form correctly, the recommendations below must be followed.
The area of special fire risk must be indicated using CERN’s civil engineering termi-nology. A detailed plan of the area must be provided, showing all possibilities of access.The description of the zone includes information concerning the purpose of the activities, thedimensions of the building as well as the number of access possibilities and floors.
Depending on the equipment and materials in the fire protection zone, the hazardsare diverse. This section is supposed to provide the fire brigade with all types of hazardswhich could aggravate a mission. Thus the kind of hazard has to be mentioned (e.g. due toelectrical equipment, cryogenic equipment, radiation, explosion) together with a more detaileddescription of why and how it presents a hazard. In connexion with this, all combustiblematerials as well as their quantities must be listed. The total amount of inflammable materialthen gives an idea of the fire load available, impacting greatly on how the fire brigade willdeal with an incident.
Once the hazards of the zone are known, the active and passive prevention measureshave to be mentioned in particular. Active prevention measures may include fire and smoke
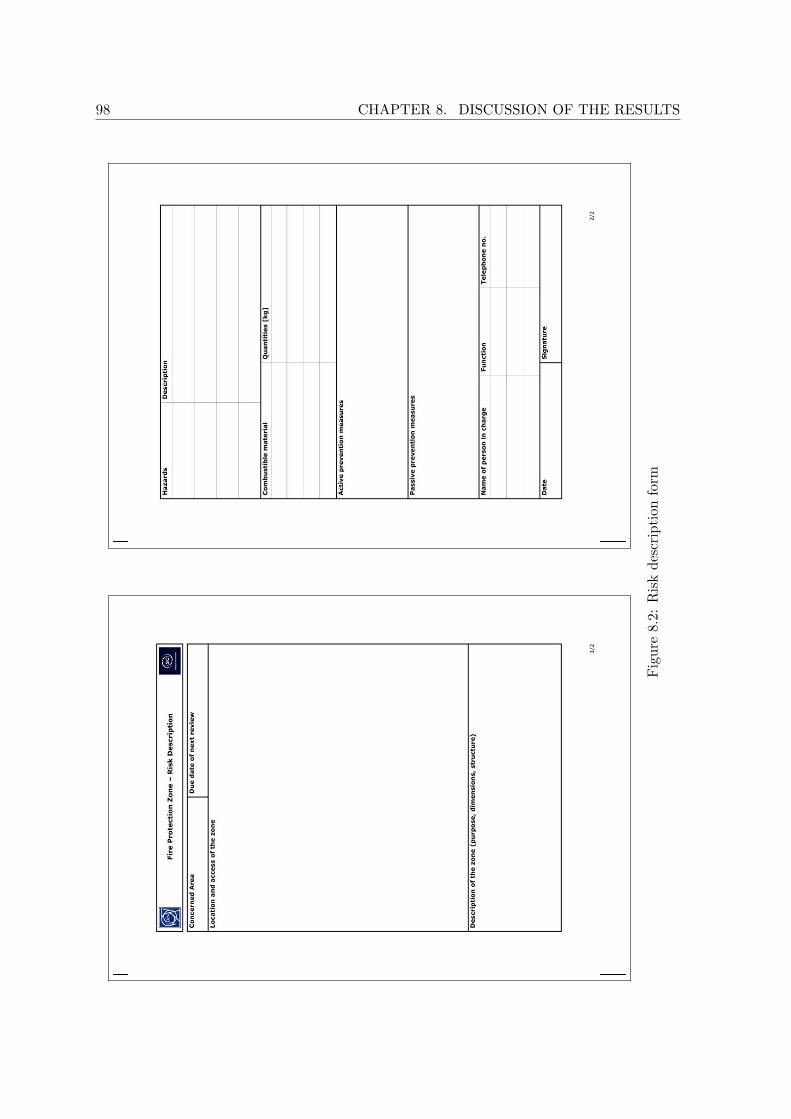
98 CHAPTER 8. DISCUSSION OF THE RESULTS
Fig
ure
8.2:
Ris
kde
scri
ptio
nfo
rm
8.1. FIRE PROTECTION ZONES 99
detectors, evacuation alarm or ODH detectors. On the contrary, passive prevention measurescould be structural fire protection or a retention basin.
The above mentioned specifications then help the fire brigade to determine details con-cerning the intervention, such as special personal protection equipment or specific behaviourfor the types of hazards mentioned.
The last entry of the Risk Description form names the persons in charge of the zonein terms of safety and their functions (e.g. Territorial Safety Officer) as well as telephonenumbers.
Revision periods should be based on existing maintenance cycles, otherwise a periodiccheck of the situation may be done every year. In case of modifications to the system, it isthe responsibility of the persons in charge of the modification to report to the fire brigade. Ifalterations with major impacts on the zone are carried out, a review of the Risk Descriptionmust be performed immediately; it is not acceptable to wait until the following due date ofrevision. Without considering modifications, the effective efforts of the fire brigade may bejeopardised and people put at risk.
Keeping descriptions simple is a generally applicable rule for completing the Risk De-scription form, since complicated explanations concerning the background of equipment andactivities would not be of any help for the firemen. Therefore the data should be presentedin a comprehensible manner, able to be understood by the fire brigade.
8.1.4 Code of Conduct for Personnel - Housekeeping
The present thesis refers to fire risk during the operation of the machine, not installation,trouble-shooting or maintenance phases. However, whenever people are working in thesesensitive zones, they have to be reminded of the special impact which any of their actionsmight have on machine operation.
The precondition for preventing any fire incident in the first place or facilitating theactions of the fire brigade is good housekeeping [69]. Housekeeping in general includes keepingthe work place in a clean state as well as removing waste. It has to be made top priority,since any other administrative procedures enforced by management will not be sustainablein the long term.
In order that the process is successful, housekeeping must be part of the daily practicesof all personnel. Hence the training of personnel in housekeeping practices is essential. It isthe responsibility of the persons in charge of works conducted in these areas to train theirpersonnel adequately and make sure the rules of housekeeping are abided by.
Basically there are three important housekeeping rules for the fire protection zones in theLHC:
1. Take any rubbish away when leaving the area
During troubleshooting and maintenance periods, repairs and replacements are beingcarried out, which implicate boxes of new equipment and casing material. This packag-

100 CHAPTER 8. DISCUSSION OF THE RESULTS
ing material is made up mainly by combustibles, i.e. wooden boxes or plastic wrapping.When the machine is in operation again, such material left behind presents an additionalfire load.
2. Keep the area clear of obstructions
Besides packaging material also tools are brought along for the works to be done in thearea. Once these assignments are finished, every member of the personnel has to makesure that the work place is clean and no tools are left behind. A clean floor free ofobstructions (especially walkways and entrances) is essential for a successful effort ofthe fire brigade.
3. Report mishaps, accidents and also near misses
Where people are working, accidents and mishaps will happen. As no human is perfect,human failure is likely to occur during any activity. Hence it is important to reportevery incident in order to allow for inspection and re-commissioning accordingly. Anyunreported damage to equipment due to accidents and mishaps may provoke unexpectedfailures with serious consequences which safety systems have not been designed for.In this context near misses have to be mentioned in particular. Although the wordalready implies that no accident has happened, side-effects might have gone unnoticedand practices may need to be modified.
These housekeeping rules should be respected everywhere in the underground area. However,it is particularly important for the protection zones due to a higher fire risk.
8.2 Material Data Inventory
Two different motivations favour the creation of a material data inventory: firstly, the identifi-cation of hazardous zones can be continued more into detail, and secondly, material propertiesare made available to be studied more into depth to examine their behaviour and determineif the fire load is tolerated.
Although a material data collection has been conducted for the present analysis, it isnot sufficiently detailed yet. Improvements can be made regarding several issues.
The fact that most of the designs for the LHC machine were already done when thisstudy was initiated was probably the most problematic issue of all. Since the state of theproject was advanced and people had to deal with additional problems, cooperation andwillingness to provide basic data was sparse. If people are obliged to keep a list of materialsinvolved in their equipments as well as their quantities, it rather becomes part of the procedureand does not present any further work load. Safety authorities at CERN should make itmandatory and a culture to report the types of materials, quantities and locations. Theadequate way of collecting this data has to be determined according to the workforce available.
In doing so, it will be assured that all equipment families are included in the inventoryand no important elements are left out. The data should be easily available for everybodyto stop repeatedly investigating material properties of equipments which are used by more

8.3. COLLECTION OF FAILURE PROBABILITY DATA 101
than one department. Moreover, they should be communicated to the design and installationdepartements in order to be able to place combustible materials the greatest distance awayfrom potential sources of ignition, or in certain extremes put protection barriers into place.A culture of greater awareness of each other’s equipment allows this process to be efficientand not more work.
Connected with the creation of a material data inventory is the problem of reportingmaterial which is necessary for the equipment, but actually prohibited by certain regulations.In the course of this thesis, prohibited material in rather large quantities was reported in onecase, but there were no derogations found in the database of the safety authorities. Sincepersonnel in charge of safety should not be contacting each department separately in orderto ask for material data and possible conflicts with the rules, it is a reason more to push theroutine collection and transmission of data. In this manner, derogations will be automaticallytaken care of. In case unauthorized materials are still used and this information is not passedon to the safety authorities, a culture of disciplinary action should be enforced.
After including a material data inventory in everyday work, attention can be turnedto the details of how to efficiently collect the data. In order to give the fire brigade a betteridea of the fire hazard zones, the location of the materials within the building as well astheir location within the equipment itself is of importance. The latter is referring to twodefinitions: either directly exposed to air or contained within other materials.
The advantages of providing a more precise location of combustible materials are thefollowing: the Risk Description form can be completed more detailed and the fire load of aspecific area may be determined much easier. Moreover, combustibles not directly exposedto air can still be included in the study, but with less importance.
Although the LHC project is coming to an end with view to design and choice ofequipment, it is worthwhile to work on the existing data and eliminate the uncertainties.This will be a more precise input for the quantitative analysis, which can then be re-examinedand, if necessary, be corrected.
8.3 Collection of Failure Probability Data
With the help of a fault tree analysis, the probability of having a fire in the tunnel dueto faulty electrical equipment was assessed. However, there were no system-dependent fail-ure probability data available, since no reliable records were kept from the former particleaccelerator LEP.
Since the LHC is only at the beginning of its operation time, the opportunity to collectspecific data in the event of fire is still possible. Most of the LHC subsystems have anintegral feature of post mortem analysis. However, it will not be able to use these data foridentifying fire causes and failure probabilities, as it is too detailed and focussing only on asingle subsystem.
The collection of data in the event of fire should be done in form of detailed reportswith certain key points. These key points should include the following:

102 CHAPTER 8. DISCUSSION OF THE RESULTS
• Possible causes,
• consequences,
• the initiating event,
• the chain of following events,
• and the equipments as well as materials and quantities involved.
It is recommended to have only a limited number of people in charge of this data collection,thus the process of entering data can be supervised adequately and the same method can beassured for each incident.
With this reporting system in place, the failure probabilities of the basic events inthe fault tree of the previous chapter can be determined by system-dependent data in thefuture, which will eventually allow for a much more accurate result on which adequate safetymeasures are based. Apparently it will not be easy to create such detailed reports, buteven more difficult will be the correct statistical evaluation of the input data. However, thecollection of system-dependent data and their analysis should be made first priority withregard to a result as close as possible to reality during future re-analyses.

Chapter 9
Conclusion and Outlook
The first beam will be injected into part of the LHC in November 2007 at low energy as atest run, after which the winter close-down will be used for further refinement of the machine.The final start-up is scheduled for spring 2008.
The fault tree analysis revealed a top event probability of having a fire in the LHCunderground due to faulty electrical equipment of 9.23 · 10−7, which corresponds to one fireevery 217 years or approximately 0.1 fires during the LHC lifetime. This is an acceptablevalue relating to a machine operating in such an extreme environment.
Once the machine is running, current operating data are available and can be usedfor regular analyses. Since the procedure of risk management does not only focus on thequalitative and quantitative assessment, but also includes a regular reassessment and controlof the implementation of risk reducing measures, the subject of this thesis should be followedup repeatedly. If system-dependent failure data from the LHC operation are applied to thepresent analysis, the results can be corrected and measures can be re-adapted accordingly.Moreover, a better understanding of the system and its mechanisms can be achieved.
The thesis at hand has been focussing on a technical risk analysis to better understandthe system and identify the fire risk in the LHC tunnel due to faulty electrical equipment.In the future, CERN will have to evolve towards an integral application of risk managementin all possible fields, not only fire risk. CERN has begun this journey with the introductionof the Environmental Management System (EMS) and the new Safety Management System(SMS).
103


Glossary
AIRS Advanced Incident Reporting SystemALICE A Large Ion Collider ExperimentATLAS A large Toroidal LHC ApparatuSBIS Beam Interlock systemBLM Beam Loss MonitorC CelsiusC&V Cooling & VentilationCCC CERN Control CentreCENELEC European Committee for Electrotechnical StandardsCERN Conseil Europeen pour la Recherche Nucleaire
European Organisation for Nuclear ResearchCHF Swiss FrancCIE Control and Indicating EquipmentCMS Compact Muon SolenoidCSAM CERN Safety Alarms Monitoring systemEMS Environmental Management SystemETA Event Tree AnalysisFMEA Failure Modes and Effects AnalysisFMECA Failure Modes, Effects and Criticality AnalysisFTA Fault Tree AnalysisGeV Giga electron voltGJ Giga JouleHAZOP Hazard and Operability StudyHCl Hydrochloric acidHEP High Energy PhysicsIAEA International Atomic Energy AgencyIEC International Electrotechnical CommissionIP Interaction pointK KelvinkA Kiloamperekg Kilogramkm KilometreLACS LHC Access Control systemLASS LHC Access Safety systemLBDS LHC Beam Dump system
105

106 CHAPTER 9. GLOSSARY
LEP Large Electron-Positron ColliderLHC Large Hadron ColliderLHCb Large Hadron Collider beautyLSS Long Straight Sectionm MetreMJ Mega Joulemrad Milli RadianMW Mega WattNASA National Aeronautics and Space AdministrationNEA Nuclear Energy AgencyNRC Nuclear Regulatory CommissionODH Oxygen Deficiency HazardP(X) Probability of XPC Power ConverterPE PolyethylenePIS Power Interlock systemPS Proton SynchrotronPVC Polyvinyl chlorideQPS Quench Protection systemRAMSES Radiation Monitoring System for the Environment and SafetyRF Radio frequencySCR Safety Control RoomSMS Safety Management SystemSPS Super Proton Synchrotront TonsTCR Technical Control RoomTeV Tera electron voltTI Transfer and InjectionTNT TrinitrotolueneTOTEM TOTal cross-section and Elastic scattering MeasurementUPS Uninterruptible Power SupplyV VoltVAC Vacuum system
List of Tables
4.1 HAZOP - Commonly used guide words [22] . . . . . . . . . . . . . . . . . . . 17
4.2 Process parameter deviations for HAZOP [27] . . . . . . . . . . . . . . . . . . 18
4.3 HAZOP form (following [22]) . . . . . . . . . . . . . . . . . . . . . . . . . . . 19
4.4 FMEA worksheet (following [29]) . . . . . . . . . . . . . . . . . . . . . . . . . 21
4.5 Generic failure modes [29] . . . . . . . . . . . . . . . . . . . . . . . . . . . . . 22
4.6 Elements of a fault tree analysis [22,30] . . . . . . . . . . . . . . . . . . . . . 24
4.7 Symbols of a fault tree analysis [22,30] . . . . . . . . . . . . . . . . . . . . . . 26
4.8 Probability relations for a quantitative fault tree analysis [22] . . . . . . . . . 27
4.9 Overview of risk analysis methods . . . . . . . . . . . . . . . . . . . . . . . . 29
6.1 Classification of plastics for use at CERN [49] . . . . . . . . . . . . . . . . . . 43
6.2 Classification of frequency . . . . . . . . . . . . . . . . . . . . . . . . . . . . . 47
6.3 Classification of consequences (following [29]) . . . . . . . . . . . . . . . . . . 49
7.1 Location of combustible material (February 2007) . . . . . . . . . . . . . . . . 54
7.2 Location of warm cables (October 2005) . . . . . . . . . . . . . . . . . . . . . 55
7.3 Failure modes for electrical installations (following [55]) . . . . . . . . . . . . 59
7.4 Failure modes for electrical installations - integration of frequency and conse-quence analysis (following [55]) . . . . . . . . . . . . . . . . . . . . . . . . . . 67
107


List of Figures
3.1 Schematic layout of the LHC tunnel [5] . . . . . . . . . . . . . . . . . . . . . 6
3.2 View of the LHC tunnel [8] . . . . . . . . . . . . . . . . . . . . . . . . . . . . 7
4.1 The procedure of risk analysis [21] . . . . . . . . . . . . . . . . . . . . . . . . 12
4.2 General risk model [24] . . . . . . . . . . . . . . . . . . . . . . . . . . . . . . . 14
4.3 Risk curve . . . . . . . . . . . . . . . . . . . . . . . . . . . . . . . . . . . . . . 15
4.4 Exemplary plant . . . . . . . . . . . . . . . . . . . . . . . . . . . . . . . . . . 16
4.5 Risk matrix for FMECA [29] . . . . . . . . . . . . . . . . . . . . . . . . . . . 23
4.6 Quantitative analysis of a fault tree . . . . . . . . . . . . . . . . . . . . . . . . 25
4.7 Quantitative analysis of an event tree . . . . . . . . . . . . . . . . . . . . . . 28
4.8 System definition of the LHC underground . . . . . . . . . . . . . . . . . . . 32
6.1 Risk matrix with acceptance intervals . . . . . . . . . . . . . . . . . . . . . . 50
7.1 Risk matrix - Consequences for machine operation (a) . . . . . . . . . . . . . 69
7.2 Risk matrix - Consequences for the equipment (b) . . . . . . . . . . . . . . . 70
7.3 Fault tree analysis - Top event “Fire in the LHC underground” . . . . . . . . 73
7.4 Fault tree analysis - Subtree 1 . . . . . . . . . . . . . . . . . . . . . . . . . . . 74
7.5 Fault tree analysis - Subtree 2 . . . . . . . . . . . . . . . . . . . . . . . . . . . 75
8.1 Signboard for fire protection zones . . . . . . . . . . . . . . . . . . . . . . . . 96
8.2 Risk description form . . . . . . . . . . . . . . . . . . . . . . . . . . . . . . . . 98
109


Bibliography
[1] O. Keski-Rahkonen, J. Mangs. Electrical ignition sources in nuclear power plants: sta-tistical, modelling and experimental studies. Nuclear Engineering and Design 213, pages209 – 221, 2002.
[2] TIS - Division de l’Inspection Technique et de la Securite. Regles de securite applicablesaux activites des entreprises sur le domaine du CERN. CERN/TIS-GS/98-10, CERN,1998.
[3] CERN. LHC General Info. <http://lhc.web.cern.ch/lhc/general/gen info.htm> Ac-cessed: 02 August, 2005.
[4] CERN. CERN - The world’s largest particle physics laboratory.<http://public.web.cern.ch/public> Accessed: 01 August, 2005, and 12 Septem-ber, 2006.
[5] CERN. EDMS Web Navigator - Naming & Conventions.<http://edms.cern.ch/cedar/plsql/navigation.tree?cookie=2887135&p top -id=1894086584&p top type=P&p open id=1894086584&p open type=P> Accessed:07 May, 2007.
[6] CERN. LHC Machine Outreach. <http://lhc-machine-outreach.web.cern.ch> Accessed:11 September, 2006.
[7] J. Gillies. Introducing the Large Hadron Collider. Symmetry Magazine, Volume 03, Issue06, August 2006.
[8] R. Schmidt. Powering LHC, 2007. Presentation given at the Training for Commissioningof the LHC powering system.
[9] J. Poole. LHC Design Report, Volume I, 2004.
[10] R. W. Assmann et al. The final collimation system for the LHC. In European ParticleAccelerator Conference EPAC 2006.
[11] T. Taylor. Superconducting Magnets and RF Cavities for the LHC. In 38th INFNEloisatron Project Workshop: Superconducting Materials for High Energy Colliders “Et-tore Majorana”, 1999.
111

112 BIBLIOGRAPHY
[12] R. Filippini, E. Carlier, L. Ducimetiere, B. Goddard, J. Uythoven. Reliability Analysisof the LHC Beam Dumping System. In Particle Accelerator Conference PAC 2005.
[13] J. Gillies. Extracting Physics from the LHC. Symmetry Magazine, Volume 03, Issue 06,August 2006.
[14] CERN Annual Report 2005. CERN Communications Group.
[15] CERN. The ATLAS Experiment. <http://atlas.ch> Accessed: 12 September, 2006.
[16] CERN. Alice Experiment: The ALICE Portal. <http://aliceinfo.cern.ch> Accessed: 01September, 2006.
[17] CERN. The Compact Muon Solenoid Experiment. <http://cms.cern.ch> Accessed: 01September, 2006.
[18] Wikipedia, the free encyclopedia. Compact Muon Solenoid.<http://en.wikipedia.org/wiki/Compact Muon Solenoid> Accessed: 01 September,2006.
[19] CERN. Large Hadron Collider beauty experiment. <http://lhcb-new.web.cern.ch/LHCb-new> Accessed: 01 September, 2006.
[20] The TOTEM Collaboration. Total Cross Section, Elastic Scattering and DiffractionDissociation at the Large Hadron Collider at CERN. CERN-LHCC-2004-002, TOTEM-TDR-001, CERN, 2004.
[21] W. Kroger. Methoden der Risikoanalyse und des Risikomanagements. EidgenossischeTechnische Hochschule (ETH) Zurich - Laboratorium fur Sicherheitsanalytik (LSA),2004. Skriptum zur Vorlesung.
[22] F. P. Lees. Loss Prevention in the Process Industries - Hazard Identification, Assessmentand Control, volume 1. Butterworth-Heinemann, 2. edition, 1996.
[23] T. Bedford, R. Cooke. Probabilistic Risk Analysis: Foundations and Methods. CambridgeUniversity Press, 2001.
[24] T. Aven. Reliability and Risk Analysis. Elsevier Science Publishers Ltd, 1992.
[25] D. J. Smith. Reliability, Maintainability and Risk - Practical methods for engineers.Butterworth-Heinemann, 6. edition, 2001.
[26] N. J. McCormick. Reliability and Risk Analysis. Academic Press, 1981.
[27] H. Kumamoto, E. J. Henley. Probabilistic Risk Assessment and Management for Engi-neers and Scientists. Wiley-IEEE Press, 2. edition, 2000.
[28] International Electrotechnical Commission. IEC 61508: Functional safety of electri-cal/electronic/programmable electronic safety/related systems, 2005.
[29] British Standards Institution. BS 5760: Reliability of systems, equipment and com-ponents Part 5 - Guide to failure modes, effects and criticality analysis (FMEA andFMECA), London, 1991.

BIBLIOGRAPHY 113
[30] British Standards Institution. BS 5760: Reliability of systems, equipment and compo-nents Part 7 - Guide to fault tree analysis, London, 1991.
[31] R. Davies. Risk Analysis of the L3 Detector. CERN/EF/4062H/RD/sb, CERN, 1988.
[32] R. Davies. Risk Analysis of the Delphi Detector. CERN/EF/4035H/RD/sb, CERN,1988.
[33] R. Davies. Risk Analysis of the Aleph Detector. CERN/EF/3750H/RD/sb, CERN,1988.
[34] P. Peyron. Etude de securite Aleph. Technical report, CERN, 1985.
[35] M. Chorowski et al. Preliminary Risk Analysis of the LHC Cryogenic System. LHCProject Note 177, CERN, 1999.
[36] F. Bordy, R. Denz, K. H. Mess, B. Puccio, F. Rodriguez Mateos, R. Schmidt. MachineProtection for the LHC: Architecture of the Beam and Powering Interlock Systems. LHCProject Report 521, CERN, 2001.
[37] A. Chouvelon, A. Faugier. Systeme Generaux de Securite du LHC. LHC-P-ES-0002v.1.1, CERN, 2002.
[38] R. Trant. Rapport provisoire de surete du SPS/CNGS et du LHC - Section I.7Presentation des risques potentiels. RPS I.7 v.1.0, CERN, 2006.
[39] E. Cennini, G. Roy. The LHC Access Control System. LHC-Y-ES-0006 v.1.0, CERN,2004.
[40] E. Manola-Poggioli, L. Scibile. CERN Safety Alarm Monitoring System. In Proceedingsof EPAC 2006.
[41] L. Scibilie. Radiation Monitoring System for the Environment and Safety (RAMSES).LHC-P-ES-0003, CERN, 2006.
[42] V. Babrauskas. How do electrical wiring faults lead to structure ignitions? In Proc. Fireand Materials 2001 Conf., London, 2001. Interscience Communications Ltd.
[43] O. Keski-Rahkonen, J. Mangs, A. Turtola. Ignition of and fire spread on cables andelectronic components. Espoo, 1999. Technical Research Centre of Finland, VTT Pub-lications 387.
[44] Rapport d’enquete sur l’incendie du PS du 29.8.1975. 7/HS/SY/IS/GL/jl, CERN, 1975.
[45] Rapport d’enquete sur l’incendie de l’aimant NA9 (EHN2). HS/SY/GL/fp, CERN, 1982.
[46] Private conversation with Fritz Szoncso, 10 October, 2006.
[47] CERN. Safety Commission. <http://safety-commission.web.cern.ch/safety-commission/SC-site/index.html> Accessed: 17 November, 2005.

114 BIBLIOGRAPHY
[48] Safety Commission/General Safety. Safety Instruction 23 rev.3: Criteria and StandardTest Methods for the Selection of Electric Cables and Wires with respect to Fire Safetyand Radiation Resistance. CERN, 2005.
[49] Safety Commission/General Safety. Safety Instruction 41 rev.1: The Use of Plasticand other Non-Metallic Materials at CERN with respect to Fire Safety and RadiationResistance. CERN, 2005.
[50] Safety Commission/General Safety. Electrical Safety Code. CERN, 1990.
[51] The University of Akron - Hardy Research Group. Graphite.<http://ull.chemistry.uakron.edu/erd/chemicals/7000/6547.html> Accessed: 23February, 2007.
[52] Dow Corning Silicones. Dow Corning 561 Silicone Transformer Liquid.<http://www.dowcorning.com> Accessed: 02 April, 2007.
[53] Bluestar Silicones. Rhodorsil 47V50. <http://www.rhodia-silicones.com/silicones/home.jsp> Accessed: 02 April, 2007.
[54] R. Assmann. New Machine Layout in IR3 and IR7. LHC-LJ-EC-0002 v.1.0, CERN,2004.
[55] International Electrotechnical Commission. IEC 60695: Fire hazard testing, 1999.
[56] R. Nunes, F. Bonthond. Automatic Fire Detection System for the LHC UndergroundAreas. LHC-SF-ES-0001 v.5.4, CERN, 2004.
[57] E. Carlier, L. Ducimetiere, V. Mertens. Surveillance and Over-Temperature Protectionfor the High Voltage Pulse Generators of the LHC Injection Kickers. LHC-MKIGA-ES-0001 v.1.0, CERN, 2005.
[58] I. Zaidi, F. Corsanego. Computer Fluid Dynamic Fire Simulation LHC Point 7. CERN-SC-2005-011-GS-TN v.3, CERN, 2005.
[59] Formal Software Construction Limited. OpenFTA Version 1.0 User Manual, 2005.
[60] International Labour Organisation. Sources of Fire Hazards.<http://www.ilo.org/encyclopedia/?docnd=857100195> Accessed: 05 October,2006.
[61] Wikipedia, the free encyclopedia. Electrical breakdown.<http://en.wikipedia.org/wiki/Electrical breakdown> Accessed: 07 November,2006.
[62] T. Crnko, S. Dyrnes. Arcing Flash/Blast Review With Safety Suggestions for Design andMaintenance. <http://www.efcog.org/wg/ism esip/index.htm> Accessed: 07 Novem-ber, 2006.
[63] Private conversation with Fabio Corsanego, 08 March, 2007.

BIBLIOGRAPHY 115
[64] W. Beitz, K.-H. Grote. Dubbel - Taschenbuch fur den Machinenbau. Springer, 19. edition,1997.
[65] Consigne Intervention - Pompage d’eau dans les UX-LHC. Cons-int-2006-05-fr, CERNFire Brigade, 2006.
[66] Hauptverband der gewerblichen Berufsgenossenschaften - Fachausschuss Chemie. BGR104 Explosionsschutz-Regeln - Regeln fuer das Vermeiden von Gefahren durch explo-sionsfahige Atmosphare mit Beispielsammlung, 2005.
[67] Council Directive 92/58/EEC of 24 June 1992 on the minimum requirements for theprovision of safety and/or health signs at work, 1992. OJ L 245.
[68] Pierre Rool. Plans d’interventions des batiments 180, 2173, 3585. IUT LORIENT - HSE2004/2005, CERN et Institut Universitaire de Technologie Lorient, 2005.
[69] A. I. Olo Martinez. Analysis and Reduction of Workplace accidents at at particlesphysics laboratory: CERN. Master’s thesis, Universidad de Oviedo - Escuela TecnicaSuperior de Ingenieros de Minas, 2007.