Revisiting the European sovereign bonds with a permutation-information-theory approach
10
Eur. Phys. J. B (2013) 86: 509 DOI: 10.1140/epjb/e2013-40660-7 Regular Article T HE EUROPEAN P HYSICAL JOURNAL B Revisiting the European sovereign bonds with a permutation- information-theory approach Aurelio Fern´ andez Bariviera 1 , Luciano Zunino 2, 3 , 4 , a , Mar´ ıa Bel´ en Guercio 4, 5 , Lisana B. Martinez 1 , and Osvaldo A. Rosso 4, 6, 7 1 Department of Business, Universitat Rovira i Virgili, Av. Universitat 1, 43204 Reus, Spain 2 Centro de Investigaciones ´ Opticas (CONICET La Plata - CIC), C.C. 3, 1897 Gonnet, Argentina 3 Departamento de Ciencias B´ asicas, Facultad de Ingenier´ ıa, Universidad Nacional de La Plata (UNLP), 1900 La Plata, Argentina 4 Consejo Nacional de Investigaciones Cient´ ıficas y T´ ecnicas (CONICET), C1033AA5, Ciudad Aut´onoma de Buenos Aires, Argentina 5 Universidad Nacional del Sur, 8000 Bah´ ıa Blanca, Argentina 6 Laboratorio de Sistemas Complejos, Facultad de Ingenier´ ıa, Universidad de Buenos Aires. 1063 Av.Paseo Col´on 840, Ciudad Aut´ onoma de Buenos Aires, Argentina 7 Instituto de F´ ısica, Universidade Federal de Alagoas, BR 104 Norte km 97, 57072-970 Macei´o, Brazil Received 9 July 2013 / Received in final form 17 October 2013 Published online 16 December 2013 – c EDP Sciences, Societ`a Italiana di Fisica, Springer-Verlag 2013 Abstract. In this paper we study the evolution of the informational efficiency in its weak form for seventeen European sovereign bonds time series. We aim to assess the impact of two specific economic situations in the hypothetical random behavior of these time series: the establishment of a common currency and a wide and deep financial crisis. In order to evaluate the informational efficiency we use permutation quantifiers derived from information theory. Specifically, time series are ranked according to two metrics that measure the intrinsic structure of their correlations: permutation entropy and permutation statistical complexity. These measures provide the rectangular coordinates of the complexity-entropy causality plane ; the planar location of the time series in this representation space reveals the degree of informational efficiency. According to our results, the currency union contributed to homogenize the stochastic characteristics of the time series and produced synchronization in the random behavior of them. Additionally, the 2008 financial crisis uncovered differences within the apparently homogeneous European sovereign markets and revealed country-specific characteristics that were partially hidden during the monetary union heyday. 1 Introduction The study of informational efficiency is a classic topic in financial economics. According to the usual definition of Fama [1], a market is informationally efficient if prices reflect all relevant information. Based on the extent of the information set, efficiency can be divided into three nested groups. The first one is the weak form of the in- formational efficiency. According to it, a market is weak- efficient if prices incorporate the past history of prices. The second one is the semi-strong form of informational efficiency, and is fulfilled whenever prices reflect all pub- lic available information, in addition to previous prices. Finally the most demanding definition of informational efficiency is its strong form, where the validation set is all kind of information (both public and private). It has been extensively documented in both developed and emerging markets, that informational efficiency, at least in its weak form, is not constant through time [2]. a e-mail: [email protected] In fact, Bariviera [3] finds that it is affected by liquidity. Moreover, Zunino et al. [4,5] show that informational effi- ciency varies according to the developmental stage of the country. Finally, Bariviera et al. [6] find that long-term memory in some European markets was affected by the 2008 credit crunch. The aim of this paper is to study the evolution of the informational efficiency of seventeen European sovereign bond indices. Our sample covers European Monetary Union (EMU) and non-EMU countries. In particular we are interested in studying the behavior of the informa- tional efficiency since the inception of the euro until present in order to determine factors that affect the trans- mission of information through the markets. The remaining of the paper is organized as follows. Section 2 covers a brief review on financial integration. Section 3 explains the methodology used in this paper. Section 4 details the data used in this article and is fol- lowed by Section 5, which describes the results. Finally, Section 6 draws the main conclusions of our paper.
Transcript of Revisiting the European sovereign bonds with a permutation-information-theory approach

Eur. Phys. J. B (2013) 86: 509DOI: 10.1140/epjb/e2013-40660-7
Regular Article
THE EUROPEANPHYSICAL JOURNAL B
Revisiting the European sovereign bonds with a permutation-information-theory approach
Aurelio Fernandez Bariviera1, Luciano Zunino2,3,4,a, Marıa Belen Guercio4,5,Lisana B. Martinez1, and Osvaldo A. Rosso4,6,7
1 Department of Business, Universitat Rovira i Virgili, Av. Universitat 1, 43204 Reus, Spain2 Centro de Investigaciones Opticas (CONICET La Plata - CIC), C.C. 3, 1897 Gonnet, Argentina3 Departamento de Ciencias Basicas, Facultad de Ingenierıa, Universidad Nacional de La Plata (UNLP),
1900 La Plata, Argentina4 Consejo Nacional de Investigaciones Cientıficas y Tecnicas (CONICET), C1033AA5, Ciudad Autonoma de Buenos Aires,
Argentina5 Universidad Nacional del Sur, 8000 Bahıa Blanca, Argentina6 Laboratorio de Sistemas Complejos, Facultad de Ingenierıa, Universidad de Buenos Aires. 1063 Av.Paseo Colon 840,
Ciudad Autonoma de Buenos Aires, Argentina7 Instituto de Fısica, Universidade Federal de Alagoas, BR 104 Norte km 97, 57072-970 Maceio, Brazil
Received 9 July 2013 / Received in final form 17 October 2013Published online 16 December 2013 – c© EDP Sciences, Societa Italiana di Fisica, Springer-Verlag 2013
Abstract. In this paper we study the evolution of the informational efficiency in its weak form for seventeenEuropean sovereign bonds time series. We aim to assess the impact of two specific economic situations in thehypothetical random behavior of these time series: the establishment of a common currency and a wide anddeep financial crisis. In order to evaluate the informational efficiency we use permutation quantifiers derivedfrom information theory. Specifically, time series are ranked according to two metrics that measure theintrinsic structure of their correlations: permutation entropy and permutation statistical complexity. Thesemeasures provide the rectangular coordinates of the complexity-entropy causality plane; the planar locationof the time series in this representation space reveals the degree of informational efficiency. According to ourresults, the currency union contributed to homogenize the stochastic characteristics of the time series andproduced synchronization in the random behavior of them. Additionally, the 2008 financial crisis uncovereddifferences within the apparently homogeneous European sovereign markets and revealed country-specificcharacteristics that were partially hidden during the monetary union heyday.
1 Introduction
The study of informational efficiency is a classic topic infinancial economics. According to the usual definition ofFama [1], a market is informationally efficient if pricesreflect all relevant information. Based on the extent ofthe information set, efficiency can be divided into threenested groups. The first one is the weak form of the in-formational efficiency. According to it, a market is weak-efficient if prices incorporate the past history of prices.The second one is the semi-strong form of informationalefficiency, and is fulfilled whenever prices reflect all pub-lic available information, in addition to previous prices.Finally the most demanding definition of informationalefficiency is its strong form, where the validation set is allkind of information (both public and private).
It has been extensively documented in both developedand emerging markets, that informational efficiency, atleast in its weak form, is not constant through time [2].
a e-mail: [email protected]
In fact, Bariviera [3] finds that it is affected by liquidity.Moreover, Zunino et al. [4,5] show that informational effi-ciency varies according to the developmental stage of thecountry. Finally, Bariviera et al. [6] find that long-termmemory in some European markets was affected by the2008 credit crunch.
The aim of this paper is to study the evolution of theinformational efficiency of seventeen European sovereignbond indices. Our sample covers European MonetaryUnion (EMU) and non-EMU countries. In particular weare interested in studying the behavior of the informa-tional efficiency since the inception of the euro untilpresent in order to determine factors that affect the trans-mission of information through the markets.
The remaining of the paper is organized as follows.Section 2 covers a brief review on financial integration.Section 3 explains the methodology used in this paper.Section 4 details the data used in this article and is fol-lowed by Section 5, which describes the results. Finally,Section 6 draws the main conclusions of our paper.

Page 2 of 10 Eur. Phys. J. B (2013) 86: 509
2 Financial integration: a brief review
The interest of the European Central Bank (ECB) in ahigh degree of financial integration stems from the needsof a monetary policy to be applied and transmitted ef-ficiently to consumption and investment decisions acrossthe whole euro area. Solans [7] refers to the desirable levelof financial integration where the capital is assigned to themost profitable investment opportunities and removes alldistortions which would hinder the efficient allocation ofresources within the eurozone.
The road toward the single currency among EuropeanUnion (EU) member states began in the early 1990’s withthe signature of the Maastricht Treaty. It entailed the lib-eralization of capital movements and the beginning of amacroeconomic convergence process. Additionally, it pro-vided the substitution of national currencies by a commoncurrency and established a set of rules for the convergenceof some macroeconomic variables such as price stability,exchange rates, public deficit and debt levels for the mem-ber countries. A fixed exchange rate among euro partnerswas set effective at the beginning of 1999, marking thebirth of the euro as an accounting currency, completed inJanuary 2002 with the circulation of euro banknotes.
Among the benefits of the EMU are the reduction intransactions costs associated with the existence of mul-tiple currencies, greater efficiency due to the decline ofuncertainty related to currency instability and increasedcredibility of monetary policy within Europe [8]. Baeleet al. [9] highlight three important benefits related tofinancial integration: expanded opportunities to sharerisk, increased capital distribution and enhanced economicgrowth. Terceno and Guercio [10] show evidence that fi-nancial integration in Latin American markets favors eco-nomic growth in that region. Before the introduction of theeuro, yield differentials within sovereign European debt in-struments were mostly determined by four elements: ex-change rate variation, differences in domestic tax treat-ments, liquidity and credit risk [11].
However a great financial integration decreasesfinancial opportunities to diversified financial portfolios,and moreover increases the contagion effect when facingeconomics problems. According to Baele et al. [9] finan-cial integration is achieved when all potential market par-ticipants in the euro area face identical rules and havethe same access to financial instruments or services in themarket. This definition entails three important features:inclusion of financial markets intermediates, absence offrictions in the process and the presence of single sup-ply and demand for investment opportunities as a typicalmarket.
Since all products are nominated in a common cur-rency, financial risk is reduced and transparency of assetsprices is increased. Since the inception of the EMU the ex-change rate risk between members states disappeared andthe financial markets became more integrated. Pagano andVon Thadden [12] consider that EMU opened the possi-bility for the creation of a new and integrated financialmarket. Ca’ Zorzi and Rubaszek [13] show that foreignexchange rates were the first to translate the effects of
the euro introduction. Alonso and Cendejas [14] mentionthe interbank market as one of the most integrated mar-kets, additionally to the money market. Moreover, Baeleet al. [9] consider two categories to measure the degreeof financial integration based on the law of the one price.The first one, related to yield spreads and the second one,associated with the response of asset prices in individualcountries to common factors. According to the existence ofdifferent measures for the financial integration, it is com-monly studied the influence of domestic and internationalfactors as main drivers of sovereign bonds spreads.
Many studies focus on studying the degree of financialintegration, especially since the start of the financial cri-sis in 2008 in United States which has been propagatedto some European financial markets. Most of them ana-lyze government bond markets evolution since the euroera and the consecutive effect of the financial crisis im-pact over the European Union, distinguishing betweenEMU and non-EMU countries [15]. Gomez-Puig [16] af-firms that the EMU produced important changes relatedwith the financial integration, especially in the euro areasovereign securities market, even though the market sizeproduces differences between the spreads of diverse mem-bers. It is evident that the process of integration is farfrom complete. In particular, the euro area still lacks aunified market infrastructure. Abad et al. [17] study theintegration in European government bond markets andshow evidence that the financial markets since 2007 movedtoward higher segmentation, especially within EMU mem-bers. The 2008 financial crisis produced different conse-quences over European countries. Sovereign bond spreadslevels and the inception of new hedge instruments, affectedfinancial markets evolution. Zunino et al. [5] find that thestochastic characteristics of sovereign bonds time series isdifferent for EMU and non-EMU countries. The extent ofthe crisis obligated European policy makers to undertakerigorous fiscal measures, to inject large amounts of moneyinto financial institutions and to set rescue packages formore affected countries such as Greece, Ireland, Portugaland, to some extent, Spain.
The recent financial crisis produced considerable globalimpact, not only because of its scale but also by thefact that it has been originated in the largest economyof the world. The consequences differ from country tocountry. Abad et al. [18] analyze the impact of the intro-duction of the euro over the degree of the integration ofEuropean government bond markets applying the CAPM-based model and find that EMU members are less vul-nerable to the influence of world risk factors, but moresusceptible to the EMU ones. Bariviera et al. [6] find thatthe 2008 financial crisis affected the long term memoryof bond returns of several European markets. It seemsclear that the global financial crisis modified investors’perception of risk and that the regional diversificationof investment portfolios propagated market risks. Since2008 European countries are more unstable and the singlecurrency acted as a transmission mechanism of instabili-ties, becoming the Achilles’ heel of the EMU, putting intoquestion the convenience of a close economic and financial

Eur. Phys. J. B (2013) 86: 509 Page 3 of 10
integration. Alonso and Cendejas [14] study the effect ofthe financial crisis over European financial markets andreaffirm that this period goes to the financial divergencein the European Union.
3 Permutation-information-theory basedquantifiers
3.1 Entropy and statistical complexity
The information content of a system is usually evalu-ated via a probability distribution function (PDF) de-scribing the apportionment of some measurable or observ-able quantity, commonly a time series S(t) = {xt; t =1, . . . , N}. An information measure can be roughly de-fined as a quantity that characterizes this given probabil-ity distribution. The Shannon entropy is very often used asthe most “natural” one [19]. Given any arbitrary discreteprobability distribution P = {pi, i = 1, . . . , M}, with Mthe number of degrees of freedom, Shannon’s logarithmicinformation measure reads
S[P ] = −M∑
i=1
pi ln pi. (1)
It can be regarded as a measure of the uncertainty as-sociated with the physical process described by P . IfS[P ] = Smin = 0 we are in position to predict with com-plete certainty which of the possible outcomes i, whoseprobabilities are given by pi, will actually take place.Our knowledge of the underlying process described bythe probability distribution is maximal in this instance.In contrast, our knowledge is minimal for the equiprob-able distribution Pe = {pi = 1/M, i = 1, . . . , M} and,consequently, the uncertainty is maximal, S[Pe] = Smax.
It is widely known that an entropic measure does notquantify the degree of structure presents in a process [20].Moreover, it was recently shown that measures of statisti-cal or structural complexity are necessary for a better un-derstanding of chaotic time series because they are able tocapture their organizational properties [21]. This specifickind of information is not revealed by randomness’ mea-sures. The opposite instances of perfect order and maxi-mal randomness (a periodic sequence and a fair coin toss,for example) are very simple to describe because they donot have any structure. The complexity should be zero inboth these cases. At a given distance from these extremes,a wide range of possible degrees of physical structure ex-ists. The complexity measure allows to quantify this arrayof behavior [21]. Rosso and coworkers introduced an effec-tive statistical complexity measure (SCM) that is able todetect essential details of the dynamics and differentiatedifferent degrees of periodicity and chaos [22]. This spe-cific SCM, that provides important additional informationregarding the peculiarities of the underlying probabilitydistribution, is defined via the product1
CJS [P ] = QJ [P, Pe]HS [P ] (2)1 This functional product form for the SCM is due to Lopez-
Ruiz et al. [23].
of the normalized Shannon entropy
HS [P ] = S[P ]/Smax, (3)
with Smax = S[Pe] = lnM , (0 ≤ HS ≤ 1) and Pe theequiprobable distribution, and the so-called disequilibriumQJ . This latter quantifier is defined in terms of the ex-tensive (in the thermodynamical sense) Jensen-Shannondivergence J [P, Pe] that links two PDFs. We have
QJ [P, Pe] = Q0J [P, Pe], (4)
with
J [P, Pe] = S [(P + Pe)/2] − S[P ]/2 − S[Pe]/2. (5)
Q0 is a normalization constant, equal to the inverse of themaximum possible value of J [P, Pe]. We stress on the factthat the statistical complexity defined above is the prod-uct of two normalized entropies (the Shannon entropy andthe Jensen-Shannon divergence), but it is a non-trivialfunction of the entropy because it depends on two differ-ent probabilities distributions, i.e., the one correspondingto the state of the system, P , and the equiprobable dis-tribution, Pe (taken as reference state). Furthermore, ithas been shown that for a given value of HS , the rangeof possible SCM values varies between a minimum Cmin
and a maximum Cmax [24]. Therefore, the evaluation ofthe complexity provides additional insight into the detailsof the systems probability distribution, which is not dis-criminated by randomness measures like the entropy. Itcan also help to uncover information related to the corre-lational structure between the components of the physicalprocess under study [25,26].
3.2 Complexity-entropy plane
In statistical mechanics one is often interested in isolatedsystems characterized by an initial, arbitrary, and discreteprobability distribution, and the main objective is to de-scribe its evolution towards equilibrium. At equilibrium,we can suppose, without loss of generality, that this stateis given by the equiprobable distribution Pe. The temporalevolution of the statistical complexity measure (SCM) canbe analyzed using a two-dimensional (2D) diagram of CJS
versus time t. However, the second law of thermodynamicsstates that, for isolated systems, entropy grows monoton-ically with time (dHS/dt ≥ 0). This implies that HS canbe regarded as an arrow of time, so that an equivalent wayto study the temporal evolution of the SCM is through theanalysis of CJS versus HS . The complexity-entropy planehas been used to study changes in the dynamics of a sys-tem originated by modifications of some characteristic pa-rameters (see, for instance, Refs. [4,5,27,28] and referencestherein).
3.3 Estimation of the probability distribution function
The study and characterization of time series S(t) by re-course to information theory tools assume that the under-lying probability distribution function (PDF) is a priori

Page 4 of 10 Eur. Phys. J. B (2013) 86: 509
given. Consequently, part of the concomitant analysis in-volves extracting the PDF from the data. Bandt andPompe (BP), almost ten years ago, introduced a success-ful methodology for the evaluation of the PDF associ-ated to scalar time series data using a symbolization tech-nique [29]. The pertinent symbolic data are created byranking the values of the series and defined by reorderingthe embedded data in ascending order, which is equiva-lent to a phase space reconstruction with embedding di-mension (pattern-length) D and time lag τ (see definitionsand methodological details in Ref. [30]). In this way it ispossible to quantify the diversity of the ordering symbols(patterns) derived from a scalar time series.
Note that the appropriate symbol-sequence arises nat-urally from the time series and no model-based assump-tions are needed. In fact, the “partitions” are devisedby comparing the order of neighboring amplitude valuesrather than by apportioning these amplitudes accordingto different levels. This technique, as opposed to most ofthose in current practice, takes into account the tempo-ral structure of the time series generated by the physicalprocess under study. This feature allows us to uncoverimportant details concerning the ordinal structure of thetime series [31–34].
It is clear that, applying this prescription for symbol-izing time series, some details of the original amplitudeinformation and variability are lost. However, a meaning-ful reduction of the complex systems to their basic in-herent structure is provided. The symbolic representationof time series by recourse to a comparison of consecutivepoints (τ = 1) or non-consecutive (τ > 1) points allowsfor an accurate empirical reconstruction of the underlyingphase-space, even in the presence of weak (observationaland dynamical) noise [29]. Furthermore, the ordinal pat-tern associated PDF is invariant with respect to nonlin-ear monotonous transformations. Accordingly, nonlineardrifts or scalings artificially introduced by a measurementdevice will not modify the quantifiers’ estimation, a use-ful property if one deals with experimental data (see, i.e.,Ref. [35]). These advantages make the BP approach moreconvenient than conventional methods based on range par-titioning. Additional advantages of the method reside inits simplicity (we need few parameters: the embedding di-mension D and the embedding delay τ) and the extremelyfast nature of the pertinent calculation-process.
The BP-generated probability distribution P is ob-tained once we fix the embedding dimension D and theembedding delay τ . The former parameter plays an impor-tant role in the evaluation of the appropriate probabilitydistribution, since D determines the number of accessi-ble states, given by D!. Moreover, it has been establishedthat the length N of the time series must satisfy the con-dition N � D! in order to achieve a reliable statisticsand proper distinction between stochastic and determin-istic dynamics [31,36]. With respect to the selection of theparameters, BP suggest in their cornerstone paper [29] toestimate with 3 ≤ D ≤ 7 and time lag τ = 1. Nevertheless,other values of τ might provide additional information. Ithas been recently shown that this parameter is strongly
related, when it is relevant, to the intrinsic time scales ofthe system under analysis [37–40].
In this work both quantifiers, namely the normal-ized Shannon entropy, HS (Eq. (3)), and the SCM, CJS
(Eq. (2)), are evaluated using the permutation probabil-ity distribution. Defined in this way, these quantifiers areusually known as permutation entropy and permutationstatistical complexity [41]. They characterize the diversityand correlational structure, respectively, of the orderingspresent in the complex time series. The complexity-entropycausality plane (CECP) is defined as the two-dimensional(2D) diagram obtained by plotting permutation statisti-cal complexity (vertical axis) versus permutation entropy(horizontal axis) for a given system [31]. For further de-tails about the estimation of permutation quantifiers andan exhaustive list of its main biomedical and econophysicsapplications we refer the readers to reference [30].
The estimation of the permutation quantifiers consid-ered in this work does not require the stationarity of thetime series under analysis. Actually, it has been shownthat the distribution of ordinal patterns is time-invariantfor processes with stationary increments. Consequently,unbiased estimators of the ordinal pattern probabilitiesare obtained by their corresponding relative frequen-cies [42]. Particularly, fractional Brownian motions, thatare non-stationary stochastic processes, have been suitablecharacterized by estimating these symbolic information-theory-derived quantifiers [31,41,43,44].
4 Data
We use the JP Morgan government bond index (GBI).This index is made up of domestic sovereign fixed-rate bonds that give international institutional investorsan opportunity to invest in liquid debt markets. Thismeans that bonds are stable, active and regularly is-sued. We use daily redemption yield of the indices ofgovernment bonds that mature between seven and tenyears. Our database, retrieved from Datastream, com-prises seventeen European countries: Austria, Belgium,Czech Republic, Denmark, Finland, France, Germany,Greece, Hungary, Ireland, Italy, Netherlands, Poland,Portugal, Spain, Sweden and the United Kingdom. Pe-riod of study goes from 01/01/1999 until 23/04/2013 fora total of N = 3733 datapoints, except for Poland that be-gins on 01/12/1999 (N = 3495 datapoints) and Hungaryand Czech Republic that begin on 01/01/2001 (N = 3212datapoints). We perform the analysis dividing the sam-ple into three non-overlapping periods. The rationale fordividing the sample is to evaluate the information con-tent of the time series in different stages of the EuropeanMonetary Union. The first period goes from 01/01/1999to 30/12/2003 and corresponds to the introduction of theEuro as common currency. The second period correspondsto the consolidation of the common currency until the2008 financial crisis. The date we select as the beginningof the financial crisis is 15/09/2008, the fall of LehmanBrother. This date was also used in several studies, e.g.in references [45,46]. Finally, the third period comprises

Eur. Phys. J. B (2013) 86: 509 Page 5 of 10
Table 1. Permutation entropy and permutation statistical complexity of JP Morgan GBI time series for D = 5 and τ = 1.
1999–2003 2004–2008 2008–2013# Country HS CJS HS CJS HS CJS
1 Germany 0.898 0.145 0.902 0.139 0.899 0.1512 France 0.899 0.145 0.904 0.140 0.887 0.1643 Italy 0.895 0.151 0.905 0.139 0.870 0.1884 Spain 0.891 0.154 0.904 0.139 0.869 0.1865 Greece 0.888 0.159 0.906 0.137 0.714 0.2406 Ireland 0.530 0.240 0.905 0.138 0.862 0.1907 Austria 0.888 0.161 0.906 0.135 0.881 0.1728 Belgium 0.896 0.148 0.906 0.135 0.867 0.1849 Finland 0.898 0.150 0.903 0.138 0.895 0.15810 Netherlands 0.897 0.145 0.905 0.137 0.893 0.16311 Portugal 0.890 0.157 0.906 0.137 0.845 0.19712 Denmark 0.894 0.151 0.895 0.146 0.896 0.14913 UK 0.893 0.154 0.909 0.132 0.914 0.13114 Sweden 0.893 0.155 0.894 0.147 0.885 0.16815 Hungary 0.865 0.198 0.882 0.168 0.878 0.17616 Poland 0.845 0.205 0.878 0.170 0.857 0.19217 Czech Republic 0.875 0.182 0.868 0.182 0.861 0.187
Mean 0.867 0.165 0.899 0.145 0.869 0.176Std. Dev. 0.088 0.026 0.012 0.014 0.044 0.024
data since the start of the financial turmoil until the endof the sample.
Daily prices are analyzed in this work. It is well-knownthat most research on financial markets focus on price re-turns because they are stationary. However, it has previ-ously shown that in the particular case of the normal-ized permutation entropy and in order to discriminatetime series, better results are obtained for prices thanreturns [47].
5 Results
According to the aim of our paper, i.e. to analyze the be-havior of the informational efficiency under different eco-nomic environments, we compute a set of quantifiers (de-scribed in Sect. 3) for each country and for each subperiod(detailed in Sect. 4). In particular we are interested in ex-tracting the information endowment of bond yields timeseries during the period of establishment of the euro, itsconsolidation and since the aftermath of the 2008 financialcrisis.
Permutation entropy and permutation statistical com-plexity are estimated for pattern lengths (embedding di-mensions) D = {3, 4, 5} and embedding delay τ = 1 (be-cause we use daily data). The pattern length should beas large as possible in order to include more informationinto the permutations. Nevertheless, the sample size (N)should fulfill the condition N � D! in order to obtain reli-able statistics [31,36]. Consequently the maximum patternlength under consideration is D = 5. Table 1 shows theresults of the permutation entropy and permutation sta-tistical complexity for each market and each subperiod,considering D = 5 and τ = 1. Results for the other pat-tern lengths are similar.
0.65 0.7 0.75 0.8 0.85 0.9 0.95 10
0.02
0.04
0.06
0.08
0.1
0.12
0.14
0.16
0.18
0.2
HS
C JS
[1999-2003][2004-2008][2008-2013]
Fig. 1. Localization of the different European sovereign bondsin the CECP for D = 3 and τ = 1. The maximum and mini-mum possible values of the permutation statistical complexityare also shown (segmented curves).
Figures 1–3 show the graphical representation of theCECP for the different considered embedding dimensions.The planar localization of each market in each subperiod,distinguished with different symbols and colors, are dis-played. As it can be seen, results are similar for all D.We detect the presence of two outliers; the first one cor-responds to Ireland during the first subperiod and thesecond one to Greece during the third period. In these fig-ures we also observe clusters of points, which are roughlygrouped by subperiods. Since the greater the embeddingdimension the greater the causality information, hereafterresults are discussed only for D = 5. We can observe theseclusters with better detail in Figure 4.

Page 6 of 10 Eur. Phys. J. B (2013) 86: 509
0.55 0.6 0.65 0.7 0.75 0.8 0.85 0.9 0.950.06
0.08
0.1
0.12
0.14
0.16
0.18
0.2
0.22
0.24
HS
C JS
[1999-2003][2004-2008][2008-2013]
Fig. 2. Same as Figure 1 but for D = 4 and τ = 1.
0.5 0.55 0.6 0.65 0.7 0.75 0.8 0.85 0.9 0.95 10
0.05
0.1
0.15
0.2
0.25
0.3
HS
C JS
[1999-2003][2004-2008][2008-2013]H = 0.90
H = 0.80
H = 0.30
H = 0.10
H = 0.20
H = 0.40
H = 0.45
H = 0.50
H = 0.55
H = 0.70
H = 0.60
H = 0.65
Fig. 3. Same as Figure 1 but for D = 5 and τ = 1.The curve described by fBms with different Hurst exponents(H ∈{0.10, 0.20, 0.30, 0.40, 0.45, 0.50, 0.55, 0.60, 0.65, 0.70, 0.80,0.90}) is also plotted (black continuous curve).
A high correlation is clearly observed between bothquantifiers, i.e. permutation entropy and permutationstatistical complexity. This information redundancy ischaracteristic of stochastic processes. In order to exem-plify this fact we have performed the analysis of frac-tional Brownian motions (fBms) with different Hurstexponents. These correlated stochastic processes arewidely used for modeling financial time series. More pre-cisely, we have generated one thousand numerical in-dependent realizations of fBms with Hurst exponentH ∈ {0.10, 0.20, 0.30, 0.40, 0.45, 0.50, 0.55, 0.60, 0.65, 0.70,0.80, 0.90} of length N = 3733 datapoints. The functionwfbm of MATLAB, that follows the algorithm proposedby Abry and Sellan [48], was employed for the simulationtask. The curve described by fBms in the CECP with D =5 and τ = 1 is depicted in Figures 3 and 4 (black continu-ous curve). Location of the European sovereign bonds andfBms are very close in the CECP, supporting the fact thatthey share some dynamical properties. More precisely, ac-cording to this information-theory-derived methodology,
0.8 0.82 0.84 0.86 0.88 0.9 0.920.11
0.12
0.13
0.14
0.15
0.16
0.17
0.18
0.19
0.2
0.21
1 2 3
4 5 7
8 910
11
121314
15
16
17
1
2
3 4 6
7
8
910
11
12
13
14
15
1617
HS
C JS
[1999-2003][2004-2008][2008-2013]
H = 0.70
H = 0.60
H = 0.65
H = 0.55
H = 0.50
Fig. 4. Detail of the most efficient area of Figure 3. Numberscorrespond to the European sovereign bonds in Table 1. Notethat the majority of bonds are closer to the location of an fBmwith H ≈ 0.5 (uncorrelated dynamics) during the intermediateperiod [2004, 2008] (period of consolidation of the monetaryunion).
0.5 0.55 0.6 0.65 0.7 0.75 0.8 0.85 0.9 0.95 10
0.05
0.1
0.15
0.2
0.25
HS
C JS
Original data, [1999-2003]Original data, [2004-2008]Original data, [2009-2013]Shuffled data, [1999-2003]Shuffled data, [2004-2008]Shuffled data, [2009-2013]
Fig. 5. Locations of the original and shuffled sovereign bondsin the CECP are compared.
fBms with Hurst exponent H ∈ [0.5, 0.7] could be suitablefor modeling purposes (please see Fig. 4). It is worth re-marking here that the majority of bonds are closer to thelocation of an fBm with H ≈ 0.5 (uncorrelated dynam-ics) during the intermediate period [2004, 2008] (period ofconsolidation of the monetary union).
In Figure 5 we compare the location in the CECPof the original and shuffled data. Shuffling procedure de-stroys all non-trivial temporal correlations sorting theoriginal data in a random order. Estimated permutationentropy and statistical complexity quantifiers for the shuf-fled realization are close to 1 and 0, respectively. This re-sult allows us to conclude that the underlying temporalcorrelations are significant and play a starring role in thebond price formation. Moreover, we confirm with this sim-ple test that the estimated values obtained from sovereignbond original data are not obtained by chance.

Eur. Phys. J. B (2013) 86: 509 Page 7 of 10
Table 2. Informational efficiency of JP Morgan GBI time series based on results of Table 1.
Inefficiency# Country 1999–2003 2004–2008 2008–20131 Germany 0.177 0.170 0.1822 France 0.177 0.170 0.1993 Italy 0.184 0.168 0.2294 Spain 0.189 0.169 0.2285 Greece 0.195 0.166 0.3736 Ireland 0.528 0.168 0.2357 Austria 0.196 0.165 0.2098 Belgium 0.181 0.165 0.2279 Finland 0.181 0.169 0.19010 Netherlands 0.178 0.167 0.19511 Portugal 0.192 0.166 0.25112 Denmark 0.185 0.180 0.18213 UK 0.188 0.160 0.15714 Sweden 0.188 0.181 0.20415 Hungary 0.240 0.205 0.21416 Poland 0.257 0.209 0.23917 Czech Republic 0.221 0.225 0.233
Mean 0.215 0.177 0.220Std. Dev. 0.084 0.019 0.047Mean∗ 0.185 0.169 0.217Std. Dev.∗ 0.006 0.006 0.053
∗without #6,15,16,17
As it was explained in Section 3, the CECP allowsfor an informational efficiency discrimination according tothe planar location of the time series under analysis. Con-sequently, the distance to the maximal efficiency point,i.e. HS = 1 and CJS = 0, could be considered as aninefficiency metric. Taking this fact into account we pro-pose the Euclidean distance to this point as our ineffi-ciency index:
Inefficiency = +√
(HS − 1)2 + (CJS)2. (6)
Table 2 displays the inefficiency of each market for eachsubperiod. If we consider each subperiod as a whole set, weobserve that information quantifiers during the first sub-period has a mean inefficiency of 0.215. Graphically (seeFig. 3), four outliers could be detected: Ireland, Poland,Hungary and Czech Republic. These four countries exhibitthe worst informational efficiency for this period. The lastthree countries did not belong to the EU during this sub-period. The remaining thirteen countries of the sampleconstitute a compact cluster with a mean inefficiency of0.185. Within this group the most efficient are Germanyand France, and the least one is Austria.
If we analyze the second subperiod practically all mar-kets in the sample enhances their informational efficiency.There is only one exception (Czech Republic). We detectthat three of the outliers of the previous period (Poland,Hungary and Czech Republic) continue showing a singu-lar behavior, locating apart from the other countries. Itmust be highlighted that these countries joined the EUat the beginning of this subperiod. On the other hand,Ireland seems to approach the other countries to con-form a compact cluster. This behavior reflects the period
of consolidation of the monetary union. The mean ineffi-ciency of this period for all markets in the sample is 0.177,reflecting an improvement of this metric. In order to com-pare results with the previous period, without the originalfour outliers, mean inefficiency is 0.169, reflecting also amore random behavior of the markets. Within this groupthe most efficient is United Kingdom (UK) and the leastefficient is Sweden.
The third period, as defined in Section 4, begins withthe spillover of the 2008 financial crisis across the EU. Themain finding in this period is a deterioration of informa-tional efficiency for all countries except UK. The mean in-efficiency is 0.220, and considering all the markets exceptthe four original outliers the mean inefficiency is 0.217.This situation means that the disturbation produced bythe financial crisis was common to all countries, evidentlywith the aforementioned exception of UK. On contrary tothe previous periods, there is no cluster formation. Con-sidering that the four original outliers does not alter ourresults, we continue our static comparative analysis withthe remaining thirteen markets. In this case, there is alarge increase in the standard deviation of the inefficiencyindex for all countries. The standard deviation in this pe-riod is close to ten times greater than in the previous one.The most efficient market is United Kingdom again andthe worst is Greece.
An alternative analysis could be done by looking forthe relative position that each market has in each period.Table 3 ranks markets from the most until the least ef-ficient in each subperiod. In the first subperiod, we canobserve that Ireland and three countries that were not atthe EU at that moment are at the bottom of the ranking.These countries were among the least developed countries
Page 8 of 10 Eur. Phys. J. B (2013) 86: 509
Table 3. Efficiency ranking derived from the proposed inefficiency index (Eq. (6)) in each subperiod.
1999–2003 2004–2008 2008–2013Germany UK UKFrance Austria Germany
Netherlands Belgium DenmarkBelgium Greece FinlandFinland Portugal NetherlandsItaly Netherlands France
Denmark Ireland SwedenUK Italy Austria
Sweden Spain HungarySpain Finland Belgium
Portugal France SpainGreece Germany ItalyAustria Denmark Czech Republic
Czech Republic Sweden IrelandHungary Hungary PolandPoland Poland PortugalIreland Czech Republic Greece
Note: countries not belonging to the euro area are in bold.Shaded cells reflect markets which have an inefficiencyabove the mean inefficiency value of each period.
of our sample, according to the Gross Domestic Product(GDP) per capita. During the second period, the con-solidation of the euro area helped some countries, suchas Ireland and Greece, to increase their efficiency. Thenew countries of the EU (Hungary, Poland and CzechRepublic) remain at the bottom of the ranking. However,one remarking feature of this period is that EU coun-tries that do not belong to the euro area (Denmark andSweden) reduced their efficiency vis-a-vis euro countries.In some way it seems that not belonging to the euro was ahandicap for enhancing efficiency. The exception was UK,which is the most efficient market in our sample for thisperiod. In the third subperiod results changed radically. Inthe bottom part of the ranking there are, besides Polandand the Czech Republic, PIIGS (Portugal, Ireland, Italy,Greece, Spain) countries and Belgium. Additionally, coun-tries that do not adopt the euro are better off than eurocountries. Indeed, they are ranked in a better positionthan in the first and second subperiods.
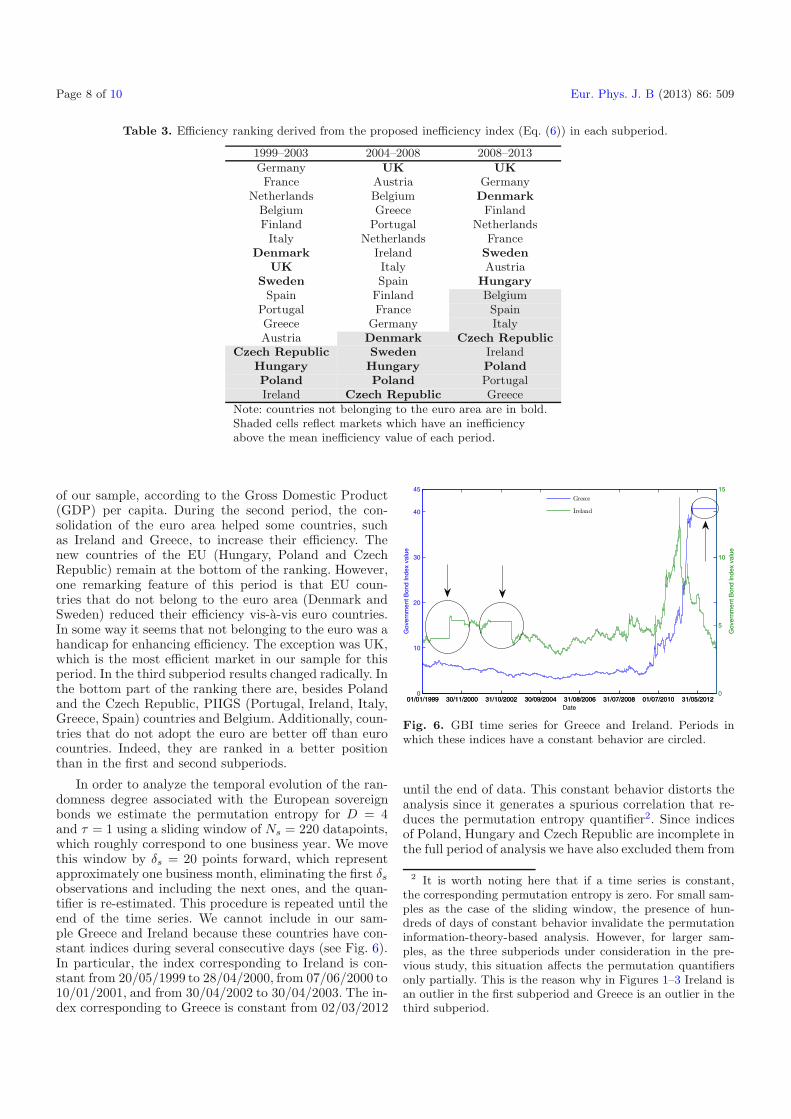
In order to analyze the temporal evolution of the ran-domness degree associated with the European sovereignbonds we estimate the permutation entropy for D = 4and τ = 1 using a sliding window of Ns = 220 datapoints,which roughly correspond to one business year. We movethis window by δs = 20 points forward, which representapproximately one business month, eliminating the first δs
observations and including the next ones, and the quan-tifier is re-estimated. This procedure is repeated until theend of the time series. We cannot include in our sam-ple Greece and Ireland because these countries have con-stant indices during several consecutive days (see Fig. 6).In particular, the index corresponding to Ireland is con-stant from 20/05/1999 to 28/04/2000, from 07/06/2000 to10/01/2001, and from 30/04/2002 to 30/04/2003. The in-dex corresponding to Greece is constant from 02/03/2012
01/01/1999 30/11/2000 31/10/2002 30/09/2004 31/08/2006 31/07/2008 01/07/2010 31/05/20120
10
20
30
40
45
Gov
ernm
ent B
ond
Inde
x va
lue
01/01/1999 30/11/2000 31/10/2002 30/09/2004 31/08/2006 31/07/2008 01/07/2010 31/05/20120
5
10
15
Date
Gov
ernm
ent B
ond
Inde
x va
lue
Greece
Ireland
Fig. 6. GBI time series for Greece and Ireland. Periods inwhich these indices have a constant behavior are circled.
until the end of data. This constant behavior distorts theanalysis since it generates a spurious correlation that re-duces the permutation entropy quantifier2. Since indicesof Poland, Hungary and Czech Republic are incomplete inthe full period of analysis we have also excluded them from
2 It is worth noting here that if a time series is constant,the corresponding permutation entropy is zero. For small sam-ples as the case of the sliding window, the presence of hun-dreds of days of constant behavior invalidate the permutationinformation-theory-based analysis. However, for larger sam-ples, as the three subperiods under consideration in the pre-vious study, this situation affects the permutation quantifiersonly partially. This is the reason why in Figures 1–3 Ireland isan outlier in the first subperiod and Greece is an outlier in thethird subperiod.

Eur. Phys. J. B (2013) 86: 509 Page 9 of 10
nov 1999 may 2001 dec 2002 jun 2004 dec 2005 jul 2007 jan 2009 jul 2010 feb 20120.84
0.86
0.88
0.9
0.92
0.94
0.96
Date
HS
Fig. 7. Mean (red curve) and standard deviation (blue verticallines) of the permutation entropy for all markets (excludingGreece, Ireland, Hungary, Poland and Czech Republic) usingsliding windows (Ns = 220, δs = 20, D = 4, and τ = 1).The three subperiods employed in the previous analysis areindicated with segmented black vertical lines.
the present dynamical analysis. With the estimated per-mutation entropy values for all the different countries foreach sliding window, we evaluate the mean and standarddeviation of the permutation entropy as a function of time.In this way we sketch a graph of the randomness evolu-tion averages and deviations obtained for the whole periodof data. Figure 7 exhibits the mean permutation entropy(red curve) and the corresponding standard deviation(blue vertical lines). Segmented black vertical lines indi-cate the three subperiods considered in the previous staticanalysis.
The results of the analysis performed with sliding win-dows confirm the fact that the common currency and the2008 financial crisis affected the synchronization of theEuropean markets. In fact, as it can be observed in Fig-ure 7, there is a reduction in the standard deviation of thepermutation entropy until June 2004. This reduction isachieved during the first subperiod of our previous anal-ysis. From this date until mid 2008 the standard devia-tion remains at low levels, reflecting the consolidation ofthe monetary union. The contagion effect of the finan-cial crisis seems to generate a desynchronization of themarkets, reflected in a constant increase in the standarddeviation of the permutation entropy. The absolute mini-mum value of the standard deviation of the permutationentropy during the whole period is reached just before theoutbreak of the crisis. We believe that the separation be-tween the three periods is confirmed by the analysis per-formed with sliding windows. Last but not least, in Fig-ure 7 there are inconclusive clues of the starting of a newperiod of synchronization among markets, reflected in adecrement of the standard deviation values. This could bea consequence of the bailout programs set by the EU andthe stronger measures adopted by the European CentralBank. The analysis should be continued in time in orderto confirm this provisional finding.
6 Conclusions
This paper studies the evolution of the informational ef-ficiency of seventeen European sovereign bonds markets.The period under analysis (1999–2013) is long enough toscrutinize the impact of important economic events suchas the establishment of the common currency and the2008 financial crisis. The time series are analyzed usingtwo symbolic quantifiers, permutation entropy and per-mutation statistical complexity, which are derived from in-formation theory. The proposed methodology is new andalternative to standard econometric analysis. Accordingto our results, we detect diverse informational efficiencylevels. From 1999 until 2008 there is trend toward a syn-chronization of the time series of the different markets,reflected in the conformation of a more compact clusterin the CECP. Moreover, this synchronization is observedby a reduction in the standard deviation of the unpre-dictability degree of the time series, quantified via thepermutation entropy, when using sliding windows. Thistime series coupling seems to be a consequence of the es-tablishment of the euro. In fact during 2004–2008 the mostefficient sovereign markets are those of the euro area, withthe exception of the UK. The informational efficiency wasnegatively affected by the 2008 financial crisis, which pro-duced a decoupling in the European sovereign bonds timeseries, reflected in an increment of the standard deviationof the permutation entropy and a greater dispersion of themarkets across the CECP. Additionally the most affectedmarkets are those of the euro area. On the contrary, sev-eral non-EMU markets, although being less efficient thanin the previous period, increased their relative efficiencyposition within our sample.
The authors would like to thank two anonymous reviewers fortheir helpful comments, remarks and suggestions that lead to asignificant improvement of the manuscript. Luciano Zunino, M.Belen Guercio and Osvaldo A. Rosso were supported by Con-sejo Nacional de Investigaciones Cientıficas y Tecnicas (CON-ICET), Argentina. Lisana B. Martinez acknowledges the sup-port of a Ph.D. scholarship from Department of Business ofUniversitat Rovira i Virgili, Spain. Osvaldo A. Rosso acknowl-edges support as a FAPEAL fellow, Brazil.
References
1. E.F. Fama, J. Finance 25, 383 (1970)2. J.S. Yang, W. Kwak, T. Kaizoji, I. Mook Kim, Eur. Phys.
J. B 61, 241 (2008)3. A.F. Bariviera, Physica A 390, 4426 (2011)4. L. Zunino, M. Zanin, B.M. Tabak, D.G. Perez, O.A. Rosso,
Physica A 389, 1891 (2010)5. L. Zunino, A.F. Bariviera, M.B. Guercio, L.B. Martinez,
O.A. Rosso, Physica A 391, 4342 (2012)6. A.F. Bariviera, M.B. Guercio, L.B. Martinez, Econ. Lett.
116, 426 (2012)7. E.D. Solans, Los mercados financieros en la Union
Monetaria Europea (2001), http://www.ecb.int/press/
key/date/2001/html/sp010608.es.html

Page 10 of 10 Eur. Phys. J. B (2013) 86: 509
8. W.J. McKibbin, T. Bok, Journal of Policy Modeling 23,775 (2001)
9. L. Baele, A. Ferrando, P. Hordahl, E. Krylova,C. Monnet, Occasional Paper Series 14, EuropeanCentral Bank (2004), http://www.ecb.int/pub/pdf/
scpops/ecbocp14.pdf
10. A. Terceno, M.B. Guercio, European Research onManagement and Business Economics 17, 33 (2011)
11. L. Codogno, C. Favero, A. Missale, Economic Policy 18,503 (2003)
12. M. Pagano, E.L. Von Thadden, Oxford Review ofEconomic Policy 20, 531 (2004)
13. M. Ca’ Zorzi, M. Rubaszek, Working Paper Series 895,European Central Bank (2008), http://www.ecb.europa.eu/pub/pdf/scpwps/ecbwp895.pdf
14. F. Alonso, J.L. Cendejas, Revista de Economıa Mundial31, 21 (2012)
15. L.B. Martinez, A. Terceno, Boletın Economico del ICE3028, 29 (2012)
16. M. Gomez-Puig, Journal of International Money andFinance 27, 455 (2008)
17. P. Abad, H. Chulia, M. Gomez-Puig, Time-varyingintegration in European government bond markets (2011),http://www.alde.es/encuentros/anteriores/xiveea/
trabajos/g/pdf/075.pdf
18. P. Abad, H. Chulia, M. Gomez-Puig, J. Bank. Finance 34,2851 (2010)
19. C.E. Shannon, W. Weaver, The Mathematical Theory ofCommunication (University of Illinois Press, Champaign,IL, 1949)
20. D.P. Feldman, J.P. Crutchfield, Phys. Lett. A 238, 244(1998)
21. D.P. Feldman, C.S. McTague, J.P. Crutchfield, Chaos 18,043106 (2008)
22. P.W. Lamberti, M.T. Martın, A. Plastino, O.A. Rosso,Physica A 334, 119 (2004)
23. R. Lopez-Ruiz, H.L. Mancini, X. Calbet, Phys. Lett. A209, 321 (1995)
24. M.T. Martın, A. Plastino, O.A. Rosso, Physica A 369, 439(2006)
25. O.A. Rosso, C. Masoller, Phys. Rev. E 79, 040106(R)(2009)
26. O.A. Rosso, C. Masoller, Eur. Phys. J. B 69, 37 (2009)
27. O.A. Rosso, H. Craig, P. Moscato, Physica A 388, 916(2009)
28. L. Zunino, B.M. Tabak, F. Serinaldi, M. Zanin, D.G. Perez,O.A. Rosso, Physica A 390, 876 (2011)
29. C. Bandt, B. Pompe, Phys. Rev. Lett. 88, 174102 (2002)30. M. Zanin, L. Zunino, O.A. Rosso, D. Papo, Entropy 14,
1553 (2012)31. O.A. Rosso, H.A. Larrondo, M.T. Martın, A. Plastino,
M.A. Fuentes, Phys. Rev. Lett. 99, 154102 (2007)32. M. Zanin, Chaos 18, 013119 (2008)33. J.M. Amigo, S. Zambrano, M.A.F. Sanjuan, Europhys.
Lett. 79, 50001 (2007)34. J.M. Amigo, S. Zambrano, M.A.F. Sanjuan, Int. J. Bifur.
Chaos 20, 2915 (2010)35. P.M. Saco, L.C. Carpi, A. Figliola, E. Serrano, O.A. Rosso,
Physica A 389, 5022 (2010)36. M. Staniek, K. Lehnertz, Int. J. Bifur. Chaos 17, 3729
(2007)37. L. Zunino, M.C. Soriano, I. Fischer, O.A. Rosso, C.R.
Mirasso, Phys. Rev. E 82, 046212 (2010)38. M.C. Soriano, L. Zunino, O.A. Rosso, I. Fischer, C.R.
Mirasso, IEEE J. Quantum Electron. 47, 252 (2011)39. M.C. Soriano, L. Zunino, L. Larger, I. Fischer, C.R.
Mirasso, Opt. Lett. 36, 2212 (2011)40. L. Zunino, M.C. Soriano, O.A. Rosso, Phys. Rev. E 86,
046210 (2012)41. O.A. Rosso, L. Zunino, D.G. Perez, A. Figliola, H.A.
Larrondo, M. Garavaglia, M.T. Martın, A. Plastino, Phys.Rev. E 76, 061114 (2007)
42. M. Sinn, K. Keller, Comput. Stat. Data Anal. 55, 1781(2011)
43. C. Bandt, F. Shiha, J. Time Ser. Anal. 28, 646 (2007)44. L. Zunino, D.G. Perez, M.T. Martın, M. Garavaglia,
A. Plastino, O.A. Rosso, Phys. Lett. A 372, 4768 (2008)45. P. Sieczka, D. Sornette, J.A. Holyst, Eur. Phys. J. B 82,
257 (2011)46. T. Grammatikos, R. Vermeulen, J. Int. Money Financ. 31,
517 (2012)47. L. Zunino, M. Zanin, B.M. Tabak, D.G. Perez, O.A. Rosso,
Physica A 388, 2854 (2009)48. P. Abry, F. Sellan, Appl. Comput. Harmon. Anal. 3, 377
(1996)