social bonds, sustainability bonds and green bonds: views ...
Upload
khangminh22Category
view
2download
0
Journal of Financial Economics 142 (2021) 499–516
Contents lists available at ScienceDirect
Journal of Financial Economics
journal homepage: www.elsevier.com/locate/jfec
Corporate green bonds
✩
Caroline Flammer
Questrom School of Business, Boston University, 595 Commonwealth Avenue, Boston, MA 02215, USA
a r t i c l e i n f o
Article history:
Received 9 July 2018
Revised 16 March 2020
Accepted 14 April 2020
Available online 31 January 2021
JEL classification:
G14
G32
Q56
M14
Keywords:
Sustainable finance
Climate change
Green bonds
Impact investing
Corporate sustainability
a b s t r a c t
I examine corporate green bonds, whose proceeds finance climate-friendly projects. These
bonds have become more prevalent over time, especially in industries where the envi-
ronment is financially material to firm operations. I show that investors respond posi-
tively to the issuance announcement, a response that is stronger for first-time issuers
and bonds certified by third parties. The issuers improve their environmental performance
post-issuance (i.e., higher environmental ratings and lower CO 2 emissions) and experience
an increase in ownership by long-term and green investors. Overall, the findings are con-
sistent with a signaling argument—by issuing green bonds, companies credibly signal their
commitment toward the environment.
© 2021 Elsevier B.V. All rights reserved.
✩ I thank an anonymous referee, the editor (Bill Schwert), Ruth Aguil-
era, Pat Akey, Edward Baker, Petra Christman, Ramona Dagostino, Xavier
Giroud, Olga Hawn, Ioannis Ioannou, Kris Irwin, Hao Liang, Jiao Luo, Chris
Marquis, Mary-Hunter McDonnell, Aldo Musacchio, Stephen Park as well
as seminar participants at Boston University, Baruch College, Columbia
University, Hong Kong University, Nanjing University, Tsinghua Univer-
sity, University of Cambridge, University of Geneva, University of Lugano,
Standard & Poor’s Global Ratings, the 2018 AOM-STR Executive Commit-
tee Research Day (Wharton), the 2018 Impact & Sustainable Finance Fac-
ulty Consortium (Kellogg), the 2018 GRASFI Conference, the 2018 Geneva
Summit on Sustainable Finance, the 2018 United Nations’ Principles for
Responsible Investment Academic Network Conference, the 2018 Interna-
tional Corporate Governance Society Conference, the 2018 Global Alliance
for Sustainable Finance and Investment Conference, the 2019 NBER Con-
ference on Environmental and Energy Policy and the Economy, the 2019
FTSE World Investment Forum, the 2019 Alliance for Corporate Sustain-
ability Conference, the 2019 Academy of Management Annual Meeting,
the 2019 Academy of Management Slovenia Special Conference, and the
2019 Strategic Management Society Annual Conference for helpful com-
ments and suggestions.
E-mail address: [email protected]
https://doi.org/10.1016/j.jfineco.2021.01.010
0304-405X/© 2021 Elsevier B.V. All rights reserved.
1. Introduction
A recent development in corporate finance is the use of
corporate green bonds—that is, bonds whose proceeds are
committed to finance environmental and climate-friendly
projects, such as renewable energy, green buildings, or re-
source conservation. For example, in March 2014, Unilever
issued a £250 M green bond to “cut in half the amount of
waste, water usage and greenhouse gas emissions of exist-
ing factories.”1 Similarly, in June 2017, Apple issued a $1B
green bond to finance “renewable energy and energy effi-
ciency at its facilities and in its supply chain.”2
Corporate green bonds have become increasingly pop-
ular in recent years—Morgan Stanley refers to this evolu-
tion as the “green bond boom.”3 Corporate green bonds
were essentially inexistent prior to 2013. In that year, the
1 See “Unilever issues £250 m green bond,” Financial Times, March 19,
2014. 2 See “Should you invest in “green bonds”?” Forbes, June 29, 2017. 3 See Morgan Stanley, “Behind the green bond boom,” October 11, 2017.

C. Flammer Journal of Financial Economics 142 (2021) 499–516
total issuance of corporate green bonds was about $5B.
Since then, the issuance of corporate green bonds has sky-
rocketed. In 2018 alone, the corporate sector issued green
bonds worth $95.7B. 4
While the use of corporate green bonds has become in-
creasingly more prevalent in practice, we know very little
about this new financial instrument. Intuitively, it might
seem puzzling that companies choose to issue green bonds
in lieu of conventional bonds, as the proceeds from green
bonds are committed to green projects, which restricts
companies’ investment policies. Moreover, to qualify as a
“certified” green bond, companies have to undergo third-
party verification to establish that the proceeds are funding
projects that generate environmental benefits, which gives
rise to administrative and compliance costs. Given the con-
straining nature of green bonds, a seemingly superior strat-
egy would be to issue conventional bonds and then invest
the proceeds in green projects if they are deemed to be
financially more viable than other projects. 5
So, what are the rationales for issuing corporate green
bonds, and what are their implications? There are three
potential rationales. First, green bonds may serve as a cred-
ible signal of the company’s commitment toward the en-
vironment ( signaling argument ). Such a signal can be valu-
able, as investors often lack sufficient information about
the company’s environmental commitment (e.g., Lyon and
Maxwell, 2011 ; Lyon and Montgomery, 2015 ). Due to their
constraining nature, green bonds may allow companies
to credibly signal that they are indeed committed to
undertaking investments in green projects and improving
their environmental footprint. Second, issuing green bonds
could be a form of “greenwashing”—that is, the practice
of making unsubstantiated or misleading claims about the
company’s environmental commitment. In this vein, com-
panies would issue green bonds to portray themselves as
environmentally responsible but without taking tangible
actions ( greenwashing argument ). 6 Third, if green bond
investors are willing to trade off financial returns for soci-
etal benefits, companies may issue green bonds to obtain
cheaper financing ( cost of capital argument ). This paper
examines these three rationales and provides evidence
suggesting that corporate green bonds serve as a credible
signal of companies’ commitment toward the environment.
To empirically examine corporate green bonds, I com-
pile a data set of corporate green bonds from Bloomberg’s
fixed income database. The data set covers the full uni-
verse of corporate green bonds followed by Bloomberg
that are issued by public and private companies across the
4 This represents only a small share of the overall bond market. The
size of the worldwide bond market (based on total debt outstanding) is
estimated at $102.8T in 2018. See SIFMA (Securities Industry and Financial
Markets Association), “Capital markets fact book 2019,” 2019. 5 This is analogous to mathematical optimization. The feasible set is
largest when optimizing an objective function without constraints. It fol-
lows that any unconstrained optimum is (weakly) superior to a con-
strained optimum. In this vein, companies issuing conventional bonds are
able to choose from a wider set of investment strategies to maximize firm
value compared to companies that issue green bonds. 6 This greenwashing concern originates in the lack of public governance
of the green bonds market (see Section 2.2 ).
500
world since the early days of this market in 2013 until
2018.
I start the empirical analysis by showing several styl-
ized facts pertaining to corporate green bonds. First, as
mentioned above, corporate green bonds have become
increasingly popular over time. Second, corporate green
bonds are more prevalent in industries where the natu-
ral environment is financially material to the companies’
operations (e.g., energy). Third, corporate green bonds are
especially prevalent in China, the US, and Europe.
I then examine how the stock market responds to the
issuance of green bonds. Using an event study method-
ology, I find that the stock market responds positively—
in a short time window around the announcement of
green bond issues, the cumulative abnormal return (CAR)
is 0.49%, which is significantly different from zero at the
5% level. Moreover, CARs are larger for i) green bonds that
are certified by independent third parties and ii) first-time
issuers of green bonds.
Previous work has shown that the stock market re-
sponds positively to companies’ eco-friendly behavior
(e.g., Flammer, 2013 ; Klassen and McLaughlin, 1996 ;
Krueger, 2015 ). 7 Accordingly, if corporate green bonds do
provide a (credible) signal of companies’ commitment to
the environment, one would indeed expect (i) a positive
stock market reaction to the announcement of green bond
issuance, (ii) a stronger response for certified green bonds
(i.e., green bonds for which the signal is more costly), and
(iii) a stronger response for first-time issuers (i.e., when
the green bond signal is provided to the market for the
first time), all of which I find. These results are most con-
sistent with the signaling argument.
Next, I examine the evolution of various firm-level out-
comes following the issuance of green bonds. To obtain a
plausible counterfactual of how green bond issuers would
have fared had they issued a regular bond (in lieu of a
green bond), I use a matching methodology. Specifically, in
the year preceding the bond issuance, I match each green
bond issuer to a (nongreen) bond issuer in the same coun-
try, industry, and year. Within the pool of candidates, I
then select the nearest neighbor based on a large set of
covariates. Doing this ensures that the comparison group—
that is, (nongreen) bond issuers—are as similar as possible
to green bond issuers ex ante.
Using this matching approach, I find that green bond
issuers improve their environmental performance post-
issuance—specifically, I observe i) an increase in the
company’s environmental rating (measured by the en-
vironmental score of Thomson Reuters’ ASSET4) and ii)
a decrease in CO 2 emissions. These findings are again
consistent with the signaling argument. To the extent
that green bonds provide a credible signal of the firm’s
7 The rationale is that eco-friendly behavior is beneficial to firms, at
least in the long run. This rationale is consistent with the large (and
growing) literature on ESG (environmental, social, and governance). This
literature shows a positive relation between ESG and performance (e.g.,
Eccles, Ioannou, and Serafeim, 2014 ; Edmans, 2011 , 2012 ; Flammer, 2015 ;
Flammer, Hong, and Minor, 2019 ; Guenster et al., 2011 ) and a negative
relation between ESG and risk (e.g., Godfrey, Merrill, and Hansen, 2009 ;
Hoepner et al., 2019 ).

C. Flammer Journal of Financial Economics 142 (2021) 499–516
commitment toward the environment, one would expect
significant improvements in environmental performance
going forward. Importantly, these findings are inconsistent
with the greenwashing argument. If companies were to is-
sue green bonds to portray themselves as environmentally
conscious, but without any intent to deliver, one would
not observe tangible improvements in environmental
performance post-issuance.
Note that the above results need not imply a causal
effect of green bonds on environmental performance. In
fact, the green bonds themselves are likely too small to
bring about significant improvements at the firm level
(among public firms, the average green bond issue is
$0.26B compared to the average issuer’s asset size of
$33.5B). Instead, and consistent with the signaling argu-
ment, a natural interpretation is that green bonds signal
a credible commitment toward the environment. As this
commitment materializes in eco-friendly behavior, com-
panies improve their environmental performance. Some of
these improvements—but not necessarily all of them—may
be due to the projects that are financed by the green bond
proceeds.
I also examine how equity ownership evolves following
the green bond issuance. Using the matching methodology
described above, I find that green bond issuers (com-
pared to otherwise similar bond issuers) experience an
increase in ownership by i) long-term investors and ii)
green investors post-issuance. These findings are again
consistent with the signaling argument—as green bonds
provide a credible signal of the commitment toward the
environment, companies are better able to attract an
investor base that is mindful of the long term and the
natural environment.
Finally, I explicitly examine the cost of capital argu-
ment. To study the pricing of corporate green bonds, I fol-
low the methodology used by Larcker and Watts (2020) in
the context of municipal green bonds. Specifically, for each
green bond, I match an otherwise similar “brown” (i.e.,
nongreen) bond by the same issuer. Doing this ensures that
the two bonds are as similar as possible, except for the
“greenness.” When comparing the yields of both, I find that
the median difference is exactly zero and the average dif-
ference is small and statistically insignificant. This finding
is consistent with Larcker and Watts’s (2020) finding of no
pricing difference between green and brown bonds in the
market for municipal bonds. 8 This finding is also consis-
tent with industry practice—qualitative evidence from sur-
veys and interviews reveals that investors would not in-
vest in green bonds if the returns were not competitive. 9
As such, my finding of no pricing differential for corpo-
rate green bonds is inconsistent with the cost of capital ar-
gument, according to which companies would issue green
bonds to benefit from a cheaper source of financing.
8 Prior work on the green bond premium ( Baker et al., 2018 ; Karpf and
Mandel, 2017 ; Zerbib, 2019 ) found mixed results. Larcker and Watts
(2020 , p. 4) revisit this literature and argue that “the mixed evidence
from prior studies is the result of methodological design misspecifica-
tions that produce biased estimates.” I review and discuss this literature
in Section 7 . 9 For example, see John Chiang, “Growing the US green bond market,”
California State Treasurer’s Office, 2017.
501
Taken together, the findings of this study suggest that
corporate green bonds serve as a credible signal of compa-
nies’ commitment toward the environment. As this com-
mitment materializes, companies reduce their CO 2 emis-
sions, achieve higher environmental ratings, and become
attractive for an investor clientele—such as long-term and
green investors—that values the environment.
This study makes several contributions to the literature.
First, it contributes to the growing literature that studies
the green bond market (e.g., Baker et al., 2018 ; Karpf and
Mandel, 2017 ; Zerbib, 2019 ). This literature—reviewed in
Section 7 —focuses primarily on the pricing of green bonds
in the market for municipal (and sovereign) green bonds.
An exception is the contemporaneous article by Tang and
Zhang (2020) , who also study corporate green bonds. Con-
sistent with my results, they find that the stock market re-
sponds positively to the issuance of corporate green bonds.
My study complements this body of research by examining
how firm-level outcomes evolve following the issuance of
green bonds.
Second, this study contributes to the growing literature
on impact investing (e.g., Barber et al., 2021 ; Geczy et al.,
2020 ). Impact investing refers to a relatively new set of
financial instruments that aim to generate “social and
environmental impact alongside financial return.”10 This
paper examines a relatively novel instrument of impact
investing—corporate green bonds.
Third, this paper indicates that corporate green bonds
help attract an investor clientele that values the long term
and the environment. This finding contributes to the litera-
ture showing that better environmental, social, and gover-
nance (ESG) performance improves access to finance (e.g.,
Cheng et al., 2014 ; El Ghoul et al., 2011 ) as well as the
emerging literature that studies investors’ preferences for
ESG (e.g., Barber, 2007 ; Dimson et al., 2015 ; Dyck et al.,
2019 ; Ilhan et al., 2020 ; Krueger et al., 2020 ; Starks et al.,
2018 ).
Finally, my results add to the body of evidence that
points to a positive link between companies’ environ-
mental responsibility and stock market performance (e.g.,
Flammer, 2013 ; Hamilton, 1995 ; Klassen and McLaugh-
lin, 1996 ) as well as the broader literature that shows
a positive relation between corporate social responsibility
(CSR) and stock market performance (e.g., Edmans, 2011 ,
2012 ; Edmans et al., 2017 ; Flammer, 2015 ; Krueger, 2015 ).
The remainder of this paper is organized as follows.
Section 2 presents the conceptual framework. Section 3 de-
scribes the data on corporate green bonds and presents
a series of stylized facts. Section 4 describes the issuer-
level data. Section 5 presents the results of the event
study. Section 6 describes the analysis of firm outcomes.
Section 7 discusses the pricing of corporate green bonds.
Finally, Section 8 concludes.
2. Conceptual framework
What are the rationales for issuing green bonds and
their implications? In the following, I discuss three
10 See Global Impact Investing Network, “Impact investing,” 2018.

C. Flammer Journal of Financial Economics 142 (2021) 499–516
13 As the green bond market is still in an early stage, there are only few
instances of green defaults. That being said, as the example of the Span-
potential rationales: 1) signaling (i.e., corporate green
bonds provide a credible signal of the company’s commit-
ment toward the environment), 2) greenwashing (i.e., com-
panies issue green bonds to portray themselves as environ-
mentally responsible yet do not take tangible actions), and
3) the cost of capital (i.e., green bonds provide a cheaper
source of financing).
2.1. Signaling
Companies know more about their capabilities than
their investors. This information asymmetry induces a
transaction cost of identifying companies with desirable
characteristics (e.g., Akerlof, 1970 ; Williamson, 1985 ). Ac-
cordingly, it is in the companies’ best interest to reduce
this information asymmetry by sending a “signal”—that is,
by taking actions that credibly convey this information. In
signaling theory, a signal is credible if it is costly to mimic
by firms with less desirable characteristics ( Riley, 1979 ;
Spence, 1973 ).
The issuance of corporate green bonds can be inter-
preted through the lens of signaling theory. Investors often
lack sufficient information to evaluate the company’s com-
mitment to the environment (e.g., Lyon and Maxwell, 2011 ;
Lyon and Montgomery, 2015 ). From the investors’ perspec-
tive, this creates a need to (credibly) distinguish between
those companies that are committed toward the environ-
ment versus those that are not.
By issuing green bonds, companies can signal their
commitment toward the environment. This signal is likely
to be credible, for the following reasons. First, by issu-
ing green bonds, companies commit substantial amounts
of money to green projects (among public firms, the aver-
age size of corporate green bonds is $0.26B). Second, green
bonds are often certified by independent third parties to
guarantee that the proceeds are indeed used to finance
the green projects that are outlined in the bond prospec-
tus. Complying with the green bond standards—such as the
Climate Bonds Standard of the Climate Bonds Initiative—
requires substantial managerial effort and resources, which
is costly to the issuer. 11 , 12 What is more, non-compliance
with certification (so-called “green default”) is costly as
well. For example, in the event of noncompliance with
the Climate Bonds Standard, the issuer needs to notify the
board of the Climate Bonds Initiative within one month of
becoming aware of the noncompliance. The board would
then suggest corrective actions for compliance to be re-
stored. If compliance is not restored within a reasonable
11 In a recent interview with the Financial Times, Hiro Mizuno, chief
investment officer of Japan’s Government Pension Investment Fund—the
world’s largest pension fund—highlights that green bonds are “costly and
complicated and cumbersome” for issuers. See “World’s top pension fund
warns against risk of green-bond “fad”,” Financial Times, July 2, 2019. 12 For example, the certification process under the Climate Bonds Stan-
dard is split into two phases. In the pre-issuance phase, the certifier ver-
ifies that i) the projects to be financed by the bond proceeds are eligible
under the Climate Bonds Standard , and ii) the issuer has established in-
ternal processes and controls to keep track of how the bond proceeds
are used (which includes the submission of annual reports). In the post-
issuance phase, the certifier verifies that the proceeds have been allocated
to green projects in accordance with the Climate Bonds Standard . For de-
tails, see Climate Bonds Initiative, “Climate Bonds Standard,” 2020.
502
timeframe, the board would then revoke the certification
of the green bond. 13
In sum, the issuance of green bonds may serve as a
credible signal of the company’s commitment to the en-
vironment. This signaling role of corporate green bonds is
often mentioned in anecdotal accounts. For example, re-
ferring to Unilever’s £250 M green bond issue, Unilever’s
chief financial officer stated that “the green bond was an-
other step intended to demonstrate to the financial com-
munity the centrality of sustainability to the group’s busi-
ness model.”14
The signaling argument offers several testable implica-
tions. First, the previous literature has shown that share-
holders respond positively to companies’ engagement to-
ward the environment. Several event studies show positive
abnormal returns in response to companies’ eco-friendly
behavior (e.g., Flammer, 2013 ; Klassen and McLaughlin,
1996 ; Krueger, 2015 ). Similarly, Flammer (2015) finds that
the stock market responds positively to the adoption of
close-call shareholder proposals advocating the pursuit of
eco-friendly policies. 15 Accordingly—to the extent that the
issuance of green bonds signals a credible commitment to-
ward the environment—one would expect the stock market
to respond positively to the issuance of green bonds. More-
over, the stock market response is likely to be stronger for
green bonds that are certified (i.e., green bonds for which
the signal is more credible) and for first-time issuers (i.e.,
issuers that have not yet used this signaling device).
Second, another implication is that, following the is-
suance of green bonds, issuers would improve their en-
vironmental performance (e.g., the volume of CO 2 emis-
sions). Indeed, if green bonds signal a credible com-
mitment toward the environment, this should ultimately
translate in improved environmental performance. Note
that this argument need not imply that green bonds cause
improvements in environmental performance. In fact, the
green bond amounts are likely too small compared to the
size of the respective issuers to bring about significant im-
provements at the firm level (among public firms, the av-
erage green bond issue is $0.26B compared to the aver-
age issuer’s asset size of $33.5B). Instead, the argument
is that, by issuing green bonds, companies signal a (cred-
ible) commitment toward the environment. As this com-
mitment materializes in eco-friendly behavior, companies’
ish oil company Repsol illustrates, noncompliance with the green bonds
standards can have important consequences. In May 2017, a controversy
arose around Repsol’s €500 M “green” bond that was deemed noncompli-
ant. On the day of the controversy, Repsol’s stock price dropped by about
1%. The bond was subsequently excluded from green bond indices, with
major reputation losses for Repsol. See “Repsol green bond excluded from
main indexes,” Environmental Finance, May 31, 2017. 14 See “Unilever issues £250 m green bond,” Financial Times, March 19,
2014. 15 As mentioned in Section 1 , the rationale behind the positive stock
market response is that eco-friendly behavior is beneficial to firms, at
least in the long run. This is consistent with the literature that shows a
positive relation between ESG and performance (e.g., Eccles, Ioannou, and
Serafeim, 2014 ; Edmans, 2011 , 2012 ; Flammer, 2015 ; Flammer, Hong, and
Minor, 2019 ; Guenster et al., 2011 ) and a negative relation between ESG
and risk (e.g., Godfrey, Merrill, and Hansen, 2009 ; Hoepner et al., 2019 ).

C. Flammer Journal of Financial Economics 142 (2021) 499–516
18 This prediction can be obtained from Fama and French’s ( 2007 ) taste-
based framework. If mean-variance investors have a “taste” for holding
green assets (or, more broadly, assets from which they derive nonpecu-
niary benefits), green assets will be priced at a premium compared to
nongreen assets. Intuitively, as investors derive utility from holding the
green assets, they are willing to settle for lower expected returns. 19 This finding of no pricing difference is consistent with industry prac-
tice (for example, see John Chiang, “Growing the US green bond mar-
ket,” California State Treasurer’s Office, 2017) and the recent work by
Larker and Watts (2020) , who find no evidence for a green bond premium
among municipal bonds. See Section 7 for details. 20 Those issuers include development banks and supranational entities
(e.g., the European Bank for Reconstruction and Development, the Asian
Development Bank). While these entities qualify as “corporate” due to
their private status, they are not “corporations” in a traditional sense. 21 The data set includes special purpose entities such as Mexico City Air-
port Trust that issued eight green bonds between September 29, 2016
and September 20, 2017 (in amount of $12B). Those are coded as “cor-
porates” in Bloomberg and have nongovernment BICS codes (e.g., Mexico
City Airport Trust has BICS code “Transportation and logistics”). Never-
environmental performance improves. Some of these im-
provements, but not necessarily all of them, may be due to
the projects that are financed by the green bond proceeds.
Third, another implication is that, following the is-
suance of green bonds, ownership by long-term and green
investors would be expected to increase. Indeed, as compa-
nies signal their commitment toward the environment by
issuing green bonds, they would be expected to become
more attractive for an investor clientele that is sensitive to
the environment.
All these empirical predictions are supported by the
data (see Sections 5 and 6 ). Before turning to the empirical
analysis, I discuss alternative rationales for issuing green
bonds.
2.2. Greenwashing
Another potential rationale is that green bonds may
represent a tool of greenwashing. “Greenwashing”—that
is, the practice of making unsubstantiated or misleading
claims about the company’s environmental commitment—
is a widespread phenomenon (e.g., Berrone et al., 2017 ;
Lyon and Montgomery, 2015 ; Marquis et al., 2016 ). Green-
washing comes in many flavors. For example, companies
may use selective disclosure, dubious eco-labels, mislead-
ing visual imagery (e.g., the display of biodiversity symbols
on the product), and misleading narratives (for details, see
Lyon and Montgomery, 2015 ).
As discussed in Section 2.1 , issuing green bonds is
costly to firms and hence need not represent a suit-
able greenwashing strategy. If the aim is to engage in
greenwashing, other means—such as those listed above—
are likely more appealing. Nevertheless, practitioners
have raised concerns about a potential greenwashing mo-
tive underlying the issuance of green bonds. For example,
referring to the rapid growth of the green bond market,
commentators highlight that “a few skeptical voices are
starting to question the value of this innovation, asking in
particular whether green bonds make any real difference
or whether they are just another case of greenwashing.”16
This greenwashing concern roots in the lack of public
governance of corporate green bonds. Instead, the green
bond market relies on private governance regimes such
as the certification standards described in the previous
section. These private governance regimes do not have the
same enforcement mechanisms as public regulation. 17
If indeed the greenwashing motive prevails, one would
not expect any improvement in environmental perfor-
mance following the issuance of corporate green bonds.
The results of this study are inconsistent with this pre-
diction, as I find that environmental performance increases
post-issuance (see Section 6 ).
2.3. The cost of capital
Another rationale for issuing green bonds could be the
cost of capital. Specifically, if green bond investors are
16 See “The dark side of green bonds,” Financial Times, June 13, 2015. 17 See Park (2018) for a discussion of the governance challenge that
arises in the green bond market due to the absence of public governance.
503
willing to accept lower yields for the greater good of fight-
ing climate change, green bonds may represent a cheaper
source of financing. 18 This, in turn, would predict a posi-
tive stock market response, as equityholders benefit from
the cheaper source of debt financing.
Nevertheless, the findings of this paper are inconsistent
with the cost of capital argument, as I find no evidence
that corporate green bonds are priced at a premium com-
pared to nongreen bonds (see Section 7 ). 19
3. Corporate green bonds
To compile a database of corporate green bonds, I
extract all corporate bonds in Bloomberg’s fixed income
database that are labeled as “green bonds” (more precisely,
bonds for which the field “Green bond indicator” is “Yes”).
I exclude bonds whose issuer’s BICS (Bloomberg Industry
Classification System) is “Government.”20 Given the com-
prehensive coverage of Bloomberg’s fixed income database,
the resulting data set is likely to closely map the full uni-
verse of corporate green bonds. 21
The above criteria yield a total of 1189 corporate green
bonds issued from January 1, 2013 until December 31,
2018. For each bond, Bloomberg contains a wealth of infor-
mation including the amount, currency, maturity, coupon,
and credit rating. To facilitate comparisons, I convert all
amounts into US dollars. In the following, I provide some
stylized facts based on these data.
3.1. Corporate green bonds over time
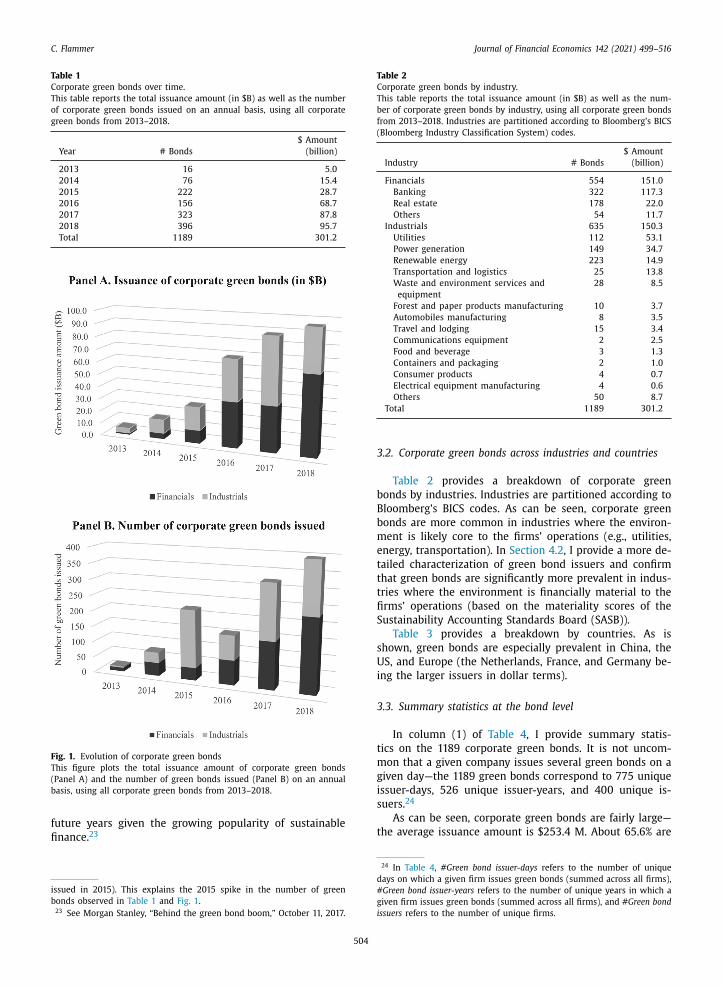
In Table 1 , I report the evolution of corporate green
bonds over the years (the corresponding statistics are
plotted in Fig. 1 ). This table shows the rapid growth in
corporate green bonds over the past few years. While
the total amount issued in 2013 was $5B (correspond-
ing to 16 bonds), it soared to $95.7B (corresponding to
396 bonds) in 2018. 22 This trend is likely to continue in
theless, their inclusion is immaterial for the results. The main analysis is
conducted with green bonds of publicly traded firms, and none of them
are special purpose entities. 22 Note that SolarCity (a Tesla subsidiary) issued 140 green bonds be-
tween October 15, 2014 and January 14, 2016 (out of which 131 were
C. Flammer Journal of Financial Economics 142 (2021) 499–516
Table 1
Corporate green bonds over time.
This table reports the total issuance amount (in $B) as well as the number
of corporate green bonds issued on an annual basis, using all corporate
green bonds from 2013–2018.
Year # Bonds
$ Amount
(billion)
2013 16 5.0
2014 76 15.4
2015 222 28.7
2016 156 68.7
2017 323 87.8
2018 396 95.7
Total 1189 301.2
Fig. 1. Evolution of corporate green bonds
This figure plots the total issuance amount of corporate green bonds
(Panel A) and the number of green bonds issued (Panel B) on an annual
basis, using all corporate green bonds from 2013–2018.
Table 2
Corporate green bonds by industry.
This table reports the total issuance amount (in $B) as well as the num-
ber of corporate green bonds by industry, using all corporate green bonds
from 2013–2018. Industries are partitioned according to Bloomberg’s BICS
(Bloomberg Industry Classification System) codes.
Industry # Bonds
$ Amount
(billion)
Financials 554 151.0
Banking 322 117.3
Real estate 178 22.0
Others 54 11.7
Industrials 635 150.3
Utilities 112 53.1
Power generation 149 34.7
Renewable energy 223 14.9
Transportation and logistics 25 13.8
Waste and environment services and
equipment
28 8.5
Forest and paper products manufacturing 10 3.7
Automobiles manufacturing 8 3.5
Travel and lodging 15 3.4
Communications equipment 2 2.5
Food and beverage 3 1.3
Containers and packaging 2 1.0
Consumer products 4 0.7
Electrical equipment manufacturing 4 0.6
Others 50 8.7
Total 1189 301.2
future years given the growing popularity of sustainable
finance. 23
issued in 2015). This explains the 2015 spike in the number of green
bonds observed in Table 1 and Fig. 1 . 23 See Morgan Stanley, “Behind the green bond boom,” October 11, 2017.
504
3.2. Corporate green bonds across industries and countries
Table 2 provides a breakdown of corporate green
bonds by industries. Industries are partitioned according to
Bloomberg’s BICS codes. As can be seen, corporate green
bonds are more common in industries where the environ-
ment is likely core to the firms’ operations (e.g., utilities,
energy, transportation). In Section 4.2 , I provide a more de-
tailed characterization of green bond issuers and confirm
that green bonds are significantly more prevalent in indus-
tries where the environment is financially material to the
firms’ operations (based on the materiality scores of the
Sustainability Accounting Standards Board (SASB)).
Table 3 provides a breakdown by countries. As is
shown, green bonds are especially prevalent in China, the
US, and Europe (the Netherlands, France, and Germany be-
ing the larger issuers in dollar terms).
3.3. Summary statistics at the bond level
In column (1) of Table 4 , I provide summary statis-
tics on the 1189 corporate green bonds. It is not uncom-
mon that a given company issues several green bonds on a
given day—the 1189 green bonds correspond to 775 unique
issuer-days, 526 unique issuer-years, and 400 unique is-
suers. 24
As can be seen, corporate green bonds are fairly large—
the average issuance amount is $253.4 M. About 65.6% are
24 In Table 4 , #Green bond issuer-days refers to the number of unique
days on which a given firm issues green bonds (summed across all firms),
#Green bond issuer-years refers to the number of unique years in which a
given firm issues green bonds (summed across all firms), and #Green bond
issuers refers to the number of unique firms.

C. Flammer Journal of Financial Economics 142 (2021) 499–516
Table 3
Corporate green bonds by country.
This table reports the total issuance amount (in $B) as well as the num-
ber of corporate green bonds by country, using all corporate green bonds
from 2013–2018.
Country # Bonds
$ Amount
(billion)
China 190 75.1
Netherlands 46 33.2
United States 194 31.5
France 157 30.8
Germany 57 19.4
Mexico 9 12.2
Sweden 140 11.6
United Kingdom 25 10.8
Luxembourg 20 8.9
Spain 17 7.6
Hong Kong 31 7.4
Japan 37 6.7
Australia 15 5.4
Italy 10 4.6
Norway 20 4.4
India 17 4.2
Brazil 6 3.4
Canada 10 3.4
Denmark 4 2.1
Austria 5 1.7
South Korea 5 1.7
United Arab Emirates 3 1.6
Taiwan 21 1.6
Singapore 10 1.2
Others 140 10.9
Total 1189 301.2
Table 4
Summary statistics at the green bond level.
This table provides summary statistics for all corporate green bonds (col-
umn (1)) and separately for corporate green bonds issued by private firms
(column (2)) and public firms (column (3)). #Green bond issuer-days refers
to the number of unique days on which a given firm issues green bonds
(summed across all firms); #Green bond issuer-years refers to the number
of unique years in which a given firm issues green bonds (summed across
all firms); and #Green bond issuers refers to the number of unique firms.
Amount is the issuance amount (in $M). Certified is a dummy variable
equal to one if the green bond is certified by an independent third party.
Maturity is the maturity of the green bond (in years). Fixed-rate bond is
a dummy variable equal to one if the bond has a fixed coupon payment.
Coupon is the coupon rate for fixed-rate bonds. Credit rating is the credit
rating of the green bond. For each characteristic, the table reports sample
means and standard deviations (in parentheses), except for the credit rat-
ing, where the median is reported (based on Standard & Poor’s, Moody’s,
and Bloomberg’s rating scales, respectively).
All Private Public
(1) (2) (3)
# Green bonds 1189 624 565
# Green bond issuer-days 775 391 384
# Green bond issuer-years 526 301 225
# Green bond issuers 400 231 169
Amount (in $M) 253.4 245.5 262.0
(421.0) (329.5) (503.3)
Certified (1/0) 0.656 0.684 0.625
(0.475) (0.465) (0.485)
Maturity (years) 7.7 7.4 8.1
(29.5) (5.5) (42.3)
Fixed-rate bond (1/0) 0.753 0.732 0.775
(0.432) (0.443) (0.418)
Coupon (for fixed-rate bonds) 0.037 0.038 0.036
(0.022) (0.022) (0.022)
Credit rating
S&P rating (median) A– BBB + A–
Moody ̓s rating (median) A3 A3 A2
Bloomberg ̓s composite rating (median) A– BBB + A–
505
certified by independent third parties. 25 The average matu-
rity is 7.7 years, and 75.3% of the bonds are fixed rate with
an average coupon of 3.7%. Finally, the median credit rating
is A- (based on Standard & Poor’s rating scale), A3 (based
on Moody’s rating scale), and A- (based on Bloomberg’s
composite rating). 26
In columns (2) and (3), I distinguish between green
bonds that are issued by private firms (624 bonds, cor-
responding to 231 unique issuers) and public firms (565
bonds, corresponding to 169 unique issuers). Not surpris-
ingly, public firms issue larger bonds. Moreover, these
bonds tend to have longer maturities and are more likely
to be fixed-rate bonds. In the remainder of this paper, I
restrict the sample to the green bonds of public firms,
since detailed firm-level data (e.g., stock market data, ac-
counting data) are available that can be used to study how
firm-level outcomes evolve following the issuance of green
bonds.
4. Firm-level data
In this section, I describe the firm-level data that are
used in the analysis.
4.1. Data sources
The firm-level data are obtained from several sources,
which are described below. 27
Accounting data. The accounting data are obtained from
Standard & Poor’s Compustat. I use both Compustat North
America (that includes data for US and Canadian compa-
nies) and Compustat Global (that includes data for all other
public companies). Compustat contains detailed accounting
information for each firm, along with firm, industry, and
location identifiers. The main variables I construct from
Compustat are as follows. Size is the natural logarithm of
the book value of total assets (in US dollars). Return on as-
sets (ROA) is the ratio of operating income before depre-
ciation to the book value of total assets. Tobin’s Q is the
ratio of the market value of total assets (obtained as the
book value of total assets plus the market value of com-
mon stock minus the book value of common stock) to the
book value of total assets. Leverage is the ratio of debt
(long-term debt plus debt in current liabilities) to the book
value of total assets. To mitigate the impact of outliers, all
ratios are winsorized at the 1st and 99th percentiles of
their empirical distribution.
Stock market data. The stock market data are obtained
from the daily stock file of Compustat North America and
Compustat Global.
25 The certification information is obtained from the Climate Bonds Ini-
tiative database. This database compiles information on the certification
of each green bond along with the identity of the third-party certifier.
The most common certifiers include Sustainalytics, Vigeo Eiris, Ernst &
Young, and CICERO (Center for International Climate Research). 26 Bloomberg’s rating is a composite of the ratings from four rating
agencies—DBRS, Fitch, Moody’s, and Standard & Poor’s. For details, see
Bloomberg, “Index methodology,” 2015. 27 In Section 6 , I introduce additional data that will be used in the finer-
grained analysis.

C. Flammer Journal of Financial Economics 142 (2021) 499–516
ESG data. The ESG data are obtained from Thomson
Reuters’ ASSET4. ASSET4 specializes in providing objec-
tive, relevant, auditable, and systematic ESG information
and investment analysis tools to professional investors who
build their portfolios by integrating ESG data into their
traditional investment analysis. ASSET4 rates companies
along three dimensions (“pillars”): environment, social is-
sues, and corporate governance. In the analysis, I use all
three ratings ( environment rating, social rating, governance
rating ). Note that the ASSET4 universe does not cover all
public firms, and hence I do not have ESG data for all bond
issuers.
Materiality data. The data on environment materiality
(i.e., the extent to which the natural environment is finan-
cially material to the company’s operations) are obtained
from SASB. SASB is an independent, California-based, stan-
dards setting organization dedicated to fostering standard-
ized disclosure of material sustainability information that
meets investor needs. For each industry, SASB assesses the
materiality of the environment based on a set of environ-
mental issues (“disclosure topics”). I construct the materi-
ality index as the number of environmental issues that are
deemed financially material for companies in the industry
( environment materiality ). 28 , 29
4.2. Summary statistics at the issuer level
The 565 green bonds of public firms correspond to 225
unique firm-year observations (since some companies is-
sue multiple green bonds in a given year). In column (1)
of Table 5 , I provide summary statistics for the characteris-
tics described above. The statistics are recorded in the fis-
cal year that ends before the green bond’s issue date.
In column (2), I compare green bond issuers with other
public firms. To make the comparison informative, the
comparison group only consists of public firms that are
bond issuers (but not green bond issuers). Again, the statis-
tics are recorded in the fiscal year that ends prior to the
bond issue. I identify bond issuers from Bloomberg’s fixed
income database. For each characteristic, I compute the av-
erage across all firms in the comparison group that are in
the same two-digit SIC (Standard Industrial Classification)
industry, country, and year. As can be seen, green bond is-
suers are, on average, larger than other bond-issuing public
firms, while they are similar based on profitability (ROA),
firm value (Tobin’s Q), and capital structure (leverage).
Moreover, green bond issuers have higher environmental
ratings (and higher ESG ratings).
Finally, since the last characteristic—environment
materiality—is at the industry level, I adjust the compar-
ison group by taking the average across all comparison
firms in the same country and year, excluding those
operating in the same two-digit SIC industry as the green
bond issuer. As can be seen, green bond issuers are sig-
nificantly more likely to operate in industries where the
28 SASB uses their own industry classification—SICS
( Sustainable Industry Classification System )—to partition industries. I
obtain the mapping of SICS codes to companies from SASB. 29 For a more detailed description of SASB and the SASB data, see
Khan et al. (2016) .
506
environment is financially material to the companies’
operations. This suggests that companies are more likely
to issue green bonds when green projects are beneficial to
them.
5. Stock market reaction to the issuance of corporate
green bonds
In this section, I first describe the event study method-
ology and then present the event study results.
5.1. Event study methodology
The event study methodology examines the stock price
reaction around the announcement of an event. In the fol-
lowing, I use this methodology to assess how the stock
market responds to the announcement of the issuance of
corporate green bonds. A useful feature of Bloomberg’s
database is that it contains the announcement date, that
is, the day on which the company announced that it will
be issuing the green bond. The announcement date (as op-
posed to the issuance date) is the relevant date for the
event study since it captures the day when the informa-
tion is provided to the market. In contrast, on the issuance
date, no new information is conveyed to the market.
To conduct the event study, I use the announcement
date as event date (day 0). In keeping with Krueger (2015) ,
I account for the possibility that some information may
have been known to the public prior to the announcement
by including the five previous trading days and account for
the possibility of a staggered response by including the fol-
lowing ten trading days—that is, the baseline event win-
dow is [–5, 10]. To see if there is any run-up in stock prices
before and after the event window, I also consider the time
intervals [–20, –11] and [–10, –6] prior to and the time in-
tervals [11, 20] and [21, 60] after the event window.
For each firm i , I compute the abnormal returns using
the market model. The coefficients αi and β i of the market
model are estimated by ordinary least squares (OLS) based
on 200 trading days prior to the first event window (i.e.,
the 200 trading days used in the estimation correspond to
the interval [–220, –21]) using daily returns. Formally, I es-
timate
R it = αi + βi × R mt + ε it ,
where R it is the return on the stock of company i on day t,
R mt is the daily market return, and ԑit is the residual. Mar-
ket returns are country specific. 30
The estimated return on the stock of firm i on day t is
then given by
ˆ R it = ˆ αi +
ˆ βi × R mt .
I then calculate the abnormal daily return (AR) of firm
i on day t as follows:
A R = R − ˆ R .
it it it30 For the US, I use the S&P 500. For all other countries, I use the coun-
try’s leading stock market index (e.g., CAC 40 for France, IBEX 35 for
Spain, NIKKEI 225 for Japan). In robustness checks, I show that the results
are similar if instead of using country-specific stock market indices, I use
a global stock market index (the MSCI All Country World Equity Index).

C. Flammer Journal of Financial Economics 142 (2021) 499–516
Table 5
Summary statistics at the issuer level.
Column (1) provides summary statistics for green bond issuers in the year preceding the green bond issue. Log (assets) is the natural logarithm of the book
value of total assets (in US dollars). Return on assets is the ratio of operating income before depreciation to the book value of total assets. Tobin’s Q is the
ratio of the market value of total assets to the book value of total assets. Leverage is the ratio of debt to the book value of total assets. All these variables
are obtained from Compustat North America and Compustat Global. Environment rating, social rating , and governance rating are the ESG ratings of Thomson
Reuters’ ASSET4. Environment materiality is the materiality index (i.e., the number of environmental issues that are deemed material for companies in the
industry) obtained from SASB data. For each characteristic, the table reports sample means and standard deviations (in parentheses). In column (2), the
statistics refer to the average across all bond issuers (but not green bond issuers) in the same two-digit SIC industry, country, and year as the green bond
issuer. In column (3), the statistics refer to the average across all bond issuers (but not green bond issuers) in the same country and year but excluding
those operating in the same two-digit SIC industry as the green bond issuer. Column (4) reports the p -value of the difference-in-means test. ∗ , ∗∗ , and ∗∗∗
denotes significance at the 10%, 5%, and 1% level, respectively.
N Green bond (Nongreen) bond (Nongreen) bond p -value
issuers issuers in same issuers in same (diff. in means)
country, industry, country and year but
and year different industries
(1) (2) (3) (4)
Log(assets) 225 10.470 8.942 – 0.000 ∗∗∗
(2.460) (1.003)
Return on assets 225 0.056 0.059 – 0.378
(0.040) (0.029)
Tobin ̓s Q 225 1.179 1.196 – 0.704
(0.404) (0.311)
Leverage 225 0.331 0.355 – 0.138
(0.178) (0.108)
Environment rating (ASSET4) 157 80.097 62.315 – 0.000 ∗∗∗
(19.659) (17.058)
Social rating (ASSET4) 157 74.370 58.334 – 0.000 ∗∗∗
(25.282) (18.698)
Governance rating (ASSET4) 157 60.498 47.630 – 0.008 ∗∗∗
(29.313) (23.456)
Environment materiality (SASB, industry level) 225 1.742 – 1.298 0.000 ∗∗∗
(1.715) (0.815)
Table 6
Stock market reaction to the announcement of corporate green bond is-
suance.
This table reports the average cumulative abnormal return (CAR) for dif-
ferent time windows around the announcement of green bond issues. The
sample consists of N = 384 green bond issuance events (corresponding to
the 384 unique issuer-day observations from Table 4 ). ∗ , ∗∗ , and ∗∗∗ de-
notes significance at the 10%, 5%, and 1% level, respectively.
Event time CAR Std. err.
[–20, –11] −0.129 0.157
[–10, –6] 0.051 0.245
[–5, 10] 0.489 ∗∗ 0.241
[11, 20] −0.029 0.218
[21, 60] −0.122 0.645
Finally, I compute the CARs for each time interval by
summing up the abnormal returns within the specific time
window and report CARs for the time intervals [–20, –11],
[–10, –6], [11, 20], and [21, 60] in addition to the event
window [–5, 10].
5.2. Event study results
The event study results are reported in Table 6 . The
sample includes all 384 issuer-day observations. For each
event window, I report the average CAR as a percentage
(with the corresponding standard error in parentheses). As
is shown, the average CAR in the event window [–5, 10]
is 0.49% and significant at the 5% level. All other inter-
vals before and after this event window yield CARs that
are small and insignificant, which indicates that the results
507
are not driven by unrelated trends around the event date.
The positive CARs suggest that the stock market responds
positively to the issuance of green bonds.
This finding speaks to the large literature in corporate
finance that studies how the stock market responds to the
issuance of securities. A typical finding in this literature—
consistent with the pecking order theory of Myers and Ma-
jluf (1984) —is that the stock market responds negatively
to equity issues but shows no significant reaction to bond
issues (see Eckbo et al., 2007 for a survey of the empiri-
cal literature). Compared to regular bond announcements,
green bond announcements blend two pieces of informa-
tion: (i) a bond issuance and (ii) a signal of the company’s
commitment to the environment. Since the stock mar-
ket is typically unresponsive to conventional bond issues,
the positive stock market reaction to green bond issues
is likely to reflect the latter—consistent with prior studies
that show positive CARs in response to the announcement
of companies’ eco-friendly actions (e.g., Flammer, 2013 ;
Klassen and McLaughlin, 1996 ; Krueger, 2015 ).
In Table 7 , I examine which characteristics drive the
announcement returns. First, in Panel A, I find that the
stock market reaction is large and significant for certified
green bonds, while it is small and insignificant for noncer-
tified green bonds. As discussed in Section 2.1 , certification
is costly—to qualify as a “certified green bond,” companies
have to undergo third-party verification to establish that
the proceeds are funding projects that generate envi-
ronmental benefits, which gives rise to administrative
and compliance burdens. Accordingly, certified green
bonds represent a more credible signal of the company’s

C. Flammer Journal of Financial Economics 142 (2021) 499–516
Table 7
Cross-sectional heterogeneity.
This table reports the average CAR[ −5, 10] from Table 6 for different sub-
samples. Panel A distinguishes between green bonds that are certified by
independent third parties and green bonds that are not. Panel B distin-
guishes between first-time and seasoned issues of green bonds. Panel C
distinguishes between green bond issuers operating in industries with
above- versus below-median SASB scores of environment materiality. ∗ , ∗∗ , and ∗∗∗ denotes significance at the 10%, 5%, and 1% level, respectively.
CAR Std.
[–5, 10] err.
Panel A. Certified vs. noncertified
Certified green bonds ( N = 192) 0.710 ∗∗ 0.292
Noncertified green bonds ( N = 192) 0.268 0.535
Panel B. First-time issue vs. seasoned issue
First-time green bond issue ( N = 169) 0.798 ∗∗ 0.322
Seasoned green bond issue ( N = 215) 0.246 0.512
Panel C. Financial materiality of the environment
SASB score above median ( N = 172) 0.699 ∗∗∗ 0.143
SASB score below median ( N = 212) 0.318 0.303
Table 8
Robustness.
This table reports alternative ways of computing CAR[ −5, 10] from
Table 6 . In row 1, the MSCI All Country World Equity Index is used in
lieu of country-specific market indices. In row 2, the global three-factor
model of Fama and French (1993) is used instead of the market model.
In row 3, returns are industry adjusted by subtracting the average return
across all stocks on a given trading day in the same country and same
two-digit SIC industry. In row 4, standard errors are computed using the
“crude dependence adjustment” (CDA) of Brown and Warner (1980 , 1985) .
Row 5 reports the precision-weighted average CAR. Row 6 excludes finan-
cials. Row 7 excludes event dates on which companies make other rele-
vant announcements such as the announcement of equity issues, (regular)
bond issues, or quarterly earnings. Row 8 reports the median CAR. Row 9
excludes issuers from countries that provide subsidies for issuing green
bonds (China, Hong Kong, and Singapore). ∗ , ∗∗ , and ∗∗∗ denotes signifi-
cance at the 10%, 5%, and 1% level, respectively.
CAR[–5, 10] Std. err.
1. Global market model based on MSCI
World Index
0.481 ∗∗ 0.230
2. Global three-factor model of Fama and
French
0.511 ∗∗ 0.252
3. Industry-adjusted CARs 0.496 ∗∗ 0.221
4. Cross-sectional correlation 0.489 ∗∗ 0.244
5. Precision-weighted CARs 0.530 ∗∗ 0.217
6. Excluding financials 0.569 ∗∗∗ 0.170
7. Excluding confounding events 0.527 ∗∗ 0.256
8. Median CARs 0.336 ∗∗ 0.128
9. Excluding countries with green bond
subsidies
0.452 ∗∗ 0.226
commitment toward the environment. As such, the
stronger stock market response is consistent with the
signaling argument.
In Panel B, I find that the abnormal returns are large
and significant for first-time issuers but are small and in-
significant for seasoned issuers. This finding is again con-
sistent with the signaling argument. After the first-time is-
sue, the market has learned about the firm’s commitment
to green projects. As a result, the information content of
subsequent issues might be closer to that of conventional
bond issues, which have been shown to yield insignificant
abnormal returns (see Eckbo et al., 2007 ). 31
Finally, in Panel C, I show that the abnormal returns
are only significant in industries where the natural envi-
ronment is financially material to the firms’ operations.
While this test does not speak directly to the signaling
argument, it helps validate the underlying assumption that
shareholders value companies’ commitment toward the
environment. Indeed, to the extent that shareholders are
sensitive to companies’ eco-friendly behavior, one would
expect a stronger stock market response in industries
where the natural environment is material to the com-
panies’ financial performance. The findings are consistent
with this argument. 32
5.3. Robustness
In Table 8 , I present a series of robustness checks that
address potential concerns. In what follows, I briefly de-
scribe each of them.
Global market model based on MSCI World Index. In row
1, I rerun the event study but using a world market index
(specifically, the MSCI All Country World Equity Index) in
lieu of country-specific market indices. Using this alterna-
tive benchmark yields very similar results.
31 Note that there is only limited overlap between certified green bonds
and first-time green bonds. The correlation between these two character-
istics is 28.9%. 32 I caution that the differences across groups in Table 7 are not signif-
icant at conventional levels. Given the limited number of events, I may
not have sufficient power to identify cross-sectional differences, even if
they are present.
508
Global three-factor model of Fama and French. In the
baseline event study, I use the market model to estimate
abnormal returns. A concern is that abnormal returns may
reflect other factors that are priced during the sample pe-
riod. To mitigate this concern, I use the global three-factor
model of Fama and French (1993) in row 2. As is shown,
the results are robust to using this extended set of fac-
tors. 33
Industry-adjusted CAR. In row 3, I verify that the results
are not driven by industry trends. Specifically, I rerun the
event study using industry-adjusted returns at the two-
digit SIC level (industry-adjusted returns are obtained by
subtracting the average return across all stocks on a given
trading day in the same country and same two-digit SIC
industry). As can be seen, the results remain very similar
when using industry-adjusted CARs.
Cross-sectional correlation. In row 4, I recompute stan-
dard errors using the “crude dependence adjustment”
(CDA) of Brown and Warner (1980 , 1985) . This correction
accounts for cross-sectional correlation in abnormal re-
turns across events. As is shown, my results are robust to
this adjustment.
Precision-weighted CARs. When computing the average
CAR, each stock is given the same weight. An alternative
is to compute the precision-weighted average CAR, which
gives more weight to less volatile (i.e., more precisely esti-
mated) abnormal returns. As is shown in row 5, the results
are robust to using precision-weighted average CARs.
33 The Fama-French three-factor model includes, in addition to the mar-
ket factor, the size factor SMB (“small minus big”) and the book-to-
market factor HML (“high minus low”). I obtain the global SMB and HML
factors from Kenneth French’s website https://mba.tuck.dartmouth.edu/
pages/faculty/ken.french/data _ library.html .

C. Flammer Journal of Financial Economics 142 (2021) 499–516
37 The existing literature points at the existence of “investor clienteles”—
that is, different categories of investors that invest in different compa-
Excluding financials. Green bonds issued by banks are
somewhat different. Instead of investing the proceeds in
green projects, they invest them in green loans. In row 6,
I show that the results are robust (in fact, larger) after ex-
cluding financial firms.
Excluding confounding events. In row 7, I reestimate
CARs, excluding event dates on which companies make
other relevant announcements—for example, the an-
nouncement of equity issues, (regular) bond issues, or
quarterly earnings. To identify these, I review newspaper
articles on each of the 384 event dates considered in the
baseline. There are 42 event dates with other relevant an-
nouncements. As is shown, my results are robust to their
exclusion.
Median CAR. In row 8, I report the median CAR (in lieu
of the average CAR) to mitigate the issue that the results
might be driven by a small number of stocks with extreme
stock price reactions. As can be seen, the median CAR
is somewhat lower (0.34% compared to the mean CAR of
0.49%). Importantly, it remains significant at the 5% level.
Excluding countries with green bond subsidies. China,
Hong Kong, and Singapore provide subsidies for issuing
green bonds, which could affect the stock market response.
In row 9, I show that my results are robust to excluding is-
suers from these countries.
6. Corporate green bonds and firm-level outcomes
In this section, I examine how firm-level outcomes
evolve following the issuance of green bonds. I first de-
scribe the outcome variables and the methodology, and I
then present the results.
6.1. Data and methodology
6.1.1. Firm outcomes
Environmental performance. I use two measures of en-
vironmental performance. The first measure is the envi-
ronmental rating from ASSET4. A caveat of this measure is
the subjective nature of ESG ratings (e.g., Berg et al., 2020 ;
Chatterji et al., 2016 ). For example, it could be that ASSET4
analysts perceive the issuance of green bonds as good en-
vironmental practice and upgrade the company’s environ-
mental rating accordingly. In this scenario, finding an in-
crease in the ASSET4 environmental rating post-issuance
could capture the green bond itself as opposed to tan-
gible improvements in environmental performance. How-
ever, note that the issuance of green bonds does not en-
ter the assessment grid used by ASSET4 to determine the
rating. 34 As such, there is no mechanical link between the
issuance of green bonds and higher environmental ratings.
To further mitigate this issue, I use a second measure of
environmental performance: the ratio of CO 2 emissions (in
tons) from ASSET4 divided by the book value of assets. 35 , 36
CO emissions are (more) objectively measured. Moreover,
234 See Thomson Reuters, “Thomson Reuters ESG scores,” 2017. 35 More precisely, I use item ENERDP023 from ASSET4 (“total CO 2 and
CO 2 equivalent emissions in tons”). 36 I winsorize this ratio at the 1 st and 99 th percentiles of its empirical
distribution.
509
this metric is easier to interpret compared to the environ-
mental rating that blends several dimensions of corporate
environmental behavior.
Ownership structure. For US companies, I characterize
their equity ownership using holding data from Thom-
son Reuters. By tracking changes in ownership, I can ex-
amine whether the issuance of green bonds helps attract
specific investor clienteles. 37 I use four measures of own-
ership. Institutional ownership is the percentage of shares
owned by institutional investors. The other three measures
are based on finer categories of institutional owners. Own-
ership by long-term investors is the percentage of shares
owned by long-term institutional investors. I construct this
measure in two different ways, depending on how I iden-
tify long-term investors. First, I use the duration measure
of Cremers and Pareek (2016 , Eq. (2) on p. 292)—which
captures the holding horizon of investors—and code an in-
vestor as long term if the duration measure is above the
median across all investors ( duration ). Second, I use the
churn ratio of Gaspar et al. (2005 , Eq. (1) on p. 143)—which
captures the frequency at which investors rebalance their
portfolios—and code an investor as long term if the churn
ratio is below the median across all investors ( churn ratio ).
Finally, ownership by green investors is the percentage of
shares owned by “green” institutional investors. I identify
green investors as those who are members of the Ceres In-
vestor Network on Climate Risk and Sustainability. The list
of members is obtained from Ceres’s website. 38
6.1.2. Matching
To study how corporate green bonds affect firm-level
outcomes, I examine the outcome variables described
above in the years following the green bond issuance.
In doing so, one empirical challenge is that the is-
suance of green bonds is endogenous with respect to firm
outcomes—that is, unobservables may drive a spurious re-
lation between the issuance of green bonds and firm out-
comes.
Ideally, I would address this endogeneity concern by us-
ing an instrument for the issuance of green bonds. Unfor-
tunately, it is difficult to find such an instrument—the is-
suance of green bonds is not random, and it is hard to find
an empirical setting in which companies (quasi-)randomly
issue green bonds. Instead, to build a plausible counterfac-
tual of how firm-level outcomes would evolve absent the
green bond issue, I use a matching approach. Specifically,
for each of the 225 public firms that issue green bonds
(which, for ease of exposition, I refer to as “treated” firms),
I match a “control” firm that is as similar as possible to the
treated firm ex ante (i.e., prior to the green bond issuance).
To build the matched control group, I use several
matching criteria. First, among the pool of public firms, I
nies depending on specific characteristics. In particular, previous work
has identified a dividend clientele ( Graham and Kumar, 2006 ) and more
broadly the existence of “style” investors who seek specific types of firms
( Barberis and Shleifer, 2003 ). 38 Ceres is a sustainability nonprofit organization working with investors
and companies to build leadership and drive solutions to sustainability
challenges, including climate change, water scarcity, and pollution.

C. Flammer Journal of Financial Economics 142 (2021) 499–516
only consider those that are bond issuers (but not green
bond issuers). Second, I require that the control firm
operates in the same country and the same two-digit SIC
industry as the treated firm. Third, out of the remaining
candidates, I select the nearest neighbor based on seven
firm-level characteristics: size, Tobin’s Q, ROA, leverage,
and the company’s environmental, social, and governance
ratings. For each characteristic, I consider the variable in
the year preceding the green bond issuance (i.e., at t – 1)
as well as the “pre-trend” (i.e., the change from t – 2 to
t – 1). Accordingly, 14 matching variables are used. The
nearest neighbor is the firm with the lowest Mahalanobis
distance to the treated firm across these 14 matching
characteristics. 39
This matching procedure is designed to ensure that
control firms are highly similar to the treated firms ex
ante. In particular, using the environmental rating as a
matching characteristic ensures that treated and control
firms have similar environmental performance prior to
the green bond issuance. The same intuition applies to
the other ESG ratings. Using measures of profitability
(ROA) and firm value (Tobin’s Q) rules out concerns that
the treated firms may be more profitable or have better
growth opportunities. Using size and debt capacity (lever-
age) further addresses the possibility that treated firms
may have better access to capital markets. 40 Moreover,
matching firms based on country, industry, and year en-
sures that treated and matched control firms face the same
conditions in their business environment (including eco-
nomic, regulatory, and other conditions).
To illustrate the similarity between treated and con-
trol firms, Table 9 reports descriptive statistics for the 14
matching characteristics (Panel A) and several nonmatch-
ing characteristics (Panel B). Levels (e.g., log(assets)) are
measured in the year preceding the green bond issuance,
while pre-trends (e.g., � log(assets)) are measured in the
two-year window preceding the green bond issuance. For
each characteristic, the table reports means, medians, and
standard deviations for the 225 treated firms and the 225
matched control firms. 41 , 42 In the last two columns, the ta-
ble further reports the p -value of the difference-in-means
test and the difference-in-medians test, respectively. As is
shown, treated and control firms are very similar along
all these characteristics. In particular, the null of equal
means cannot be rejected (with p -values ranging from
0.22 to 0.93) and neither can the null of equal medians
(with p -values from 0.14 to 0.97). 43 Overall, these statistics
39 Formally, the Mahalanobis distance δ between treated firm i and can-
didate firm j is given by δ = [( X i – X j )’ �−1 ( X i – X j )]
½ , where X is
a (14 × 1) vector containing the 14 matching variables and � is the
(14 × 14) covariance matrix of these 14 matching variables. See, e.g.,
Frésard and Valta (2016) for a similar methodology. 40 The four Compustat characteristics (i.e., size, ROA, Tobin’s Q, and
leverage) are commonly used in the economics and finance literature to
construct a set of comparable firms (e.g., Almeida et al., 2012 ; Frésard and
Valta, 2016 ). 41 The ESG ratings from ASSET4 are available for 157 out of the 225
firms. For companies without ASSET4 coverage, the matching is done
based on the other four characteristics (i.e., eight matching variables). 42 The number of observations varies depending on data availability. 43 In particular, the fact that treated and control firms have a similar
level of CO 2 emissions (and a similar pre-trend in CO 2 emissions) miti-
510
confirm that control firms are very similar to treated
firms and hence likely provide a reliable counterfactual of
how treated firms would behave absent the green bond
issuance.
6.1.3. Difference-in-differences specification
To examine how firm-level outcomes evolve follow-
ing the issuance of corporate green bonds, I estimate a
difference-in-differences specification using all firm-year
observations of the treated and matched control firms from
2010–2018. 44 Specifically, I estimate the following regres-
sion:
y it = αi + αc × αt + αs × αt + β × Green bond it + ε it , (1)
where i indexes firms, t indexes years, c indexes coun-
tries, and s indexes two-digit SIC industries. y is the out-
come variable of interest (e.g., CO 2 emissions, institutional
ownership), αi are firm fixed effects, αc × αt are coun-
try by year fixed effects, αs × αt are industry by year
fixed effects, Green bond is a dummy variable (“treatment
dummy”) that equals one if firm i has issued a green bond
by year t and zero otherwise, and ε is the error term. 45
I cluster standard errors at the two-digit SIC industry
level. The coefficient of interest is β , which measures the
difference-in-differences in outcome variable y between
treated and matched control firms. In other words, β mea-
sures the change in y following the green bond issue ac-
counting for contemporaneous changes in y at otherwise
comparable firms that do not issue green bonds.
The difference-in-differences specification in Eq. (1) can
be extended to characterize the dynamics of the treatment.
To do so, I estimate a variant of Eq. (1) in which I re-
place the treatment dummy Green bond with a set of three
dummies: i) Green bond (pre-issue year) , equal to one in
the year preceding the green bond issuance, ii) Green bond
(short-term, 1 year) , equal to one in the year following the
green bond issuance, and iii) Green bond (long-term, 2 +
year) , equal to one in the subsequent years. This speci-
fication allows me to distinguish between the short- and
long-term responses and to formally test for pre-trends in
the data. In the following, I estimate both specifications for
each outcome variable.
6.2. Results
6.2.1. Environmental performance
In Table 10 , I find that environmental performance goes
up substantially in the long run. The ASSET4 environ-
ment rating goes up by 7 percentage points, which corre-
sponds to an increase by 8.7% (given the mean of 80.1 from
Table 9 ). Similarly, emissions are reduced by 13 tons of CO 2
per $1 M of assets, a reduction by 12.9% (given the mean
gates concerns that firms that have emission problems issue green bonds
for reputational purposes. 44 To allow for a sufficient treatment window, I start the sample three
years before the first green bond issuance in 2013. The results are similar
if I use a longer treatment window. 45 I do not include controls in the regression. By construction, the
matching ensures that the two groups of firms are similar based on rel-
evant covariates. Nevertheless, I have verified that my results are un-
changed if the matching characteristics are included as controls.

C. Flammer Journal of Financial Economics 142 (2021) 499–516
Table 9
Matching.
This table presents descriptive statistics comparing treated and matched control firms. Levels (e.g., log(assets)) are measured in the year preceding the
bond issue ( t – 1), while pre-trends (e.g., � log(assets)) are measured in the two-year window preceding the bond issue (changes from t – 2 to t – 1).
The variables in Panel A are described in Table 5 ; those in Panel B are described in Tables 10 and 11 . The last two columns report the p -value of the
difference-in-means and difference-in-medians test, respectively. ∗ , ∗∗ , and ∗∗∗ denotes significance at the 10%, 5%, and 1% level, respectively.
Obs. Mean Median Std. dev. p -value p -value
(diff. in means) (diff. in medians)
Panel A. Matching characteristics
Log(assets) Green bond 225 10.470 10.065 2.460 0.781 0.688
Matched control 225 10.359 9.891 2.106
Return on assets Green bond 225 0.056 0.056 0.040 0.666 0.529
Matched control 225 0.054 0.053 0.040
Tobin ̓s Q Green bond 225 1.179 1.037 0.404 0.870 0.901
Matched control 225 1.186 1.033 0.369
Leverage Green bond 225 0.331 0.321 0.178 0.909 0.929
Matched control 225 0.333 0.318 0.179
Environment rating (ASSET4) Green bond 157 80.10 90.25 19.66 0.385 0.714
Matched control 157 78.13 89.13 22.68
Social rating (ASSET4) Green bond 157 74.37 85.98 25.28 0.820 0.564
Matched control 157 73.80 82.94 23.31
Governance rating (ASSET4) Green bond 157 60.50 68.09 29.31 0.458 0.305
Matched control 157 58.00 65.08 28.69
� Log(assets) Green bond 225 0.045 0.030 0.071 0.884 0.319
Matched control 225 0.043 0.044 0.065
� Return on assets Green bond 225 0.002 0.001 0.013 0.222 0.383
Matched control 225 0.003 0.002 0.011
� Tobin ̓s Q Green bond 225 0.023 0.010 0.076 0.901 0.409
Matched control 225 0.022 0.014 0.068
� Leverage Green bond 225 0.006 0.004 0.028 0.662 0.144
Matched control 225 0.007 0.008 0.021
� Environment rating (ASSET4) Green bond 157 3.83 0.87 10.46 0.648 0.308
Matched control 157 3.32 1.17 8.10
� Social rating (ASSET4) Green bond 157 3.93 1.68 9.67 0.647 0.320
Matched control 157 3.46 2.01 6.44
� Governance rating (ASSET4) Green bond 157 2.09 1.51 7.35 0.625 0.935
Matched control 157 1.68 1.55 8.73
Panel B. Other characteristics
CO 2 emissions Green bond 132 101.14 13.66 184.63 0.931 0.953
Matched control 132 98.23 13.67 186.69
Institutional ownership Green bond 34 0.405 0.381 0.419 0.731 0.935
Matched control 34 0.422 0.386 0.427
Ownership by long-term investors (duration) Green bond 34 0.191 0.112 0.252 0.826 0.705
Matched control 34 0.193 0.105 0.236
Ownership by long-term investors (churn rate) Green bond 34 0.176 0.087 0.253 0.625 0.634
Matched control 34 0.170 0.085 0.244
Ownership by green investors Green bond 34 0.038 0.015 0.043 0.802 0.923
Matched control 34 0.037 0.015 0.048
� CO 2 emissions Green bond 132 −0.35 −0.01 7.98 0.652 0.940
Matched control 132 −0.82 −0.01 7.35
� Institutional ownership Green bond 34 0.005 0.003 0.116 0.836 0.970
Matched control 34 0.004 0.003 0.129
� Ownership by long-term investors (duration) Green bond 34 0.001 0.002 0.033 0.843 0.592
Matched control 34 0.002 0.003 0.036
� Ownership by long-term investors (churn rate) Green bond 34 0.003 0.002 0.031 0.778 0.726
Matched control 34 0.002 0.002 0.027
� Ownership by green investors Green bond 34 0.006 0.004 0.041 0.574 0.911
Matched control 34 0.005 0.004 0.034
of 101.1 from Table 9 ). These results indicate that compa-
nies improve their environmental performance following
the issuance of green bonds. 46 These findings are consis-
tent with the signaling argument, as they suggest that cor-
porate green bonds do signal subsequent improvements in
46 As mentioned above, these improvements are unlikely to be directly
driven by the projects that are financed by the green bond proceeds, as
those are an order of magnitude smaller compared to the size of the is-
suer (see Section 2.1 ).
511
environmental performance. Importantly, this is inconsis-
tent with a greenwashing motive for green bonds, accord-
ing to which companies issue green bonds without any in-
tention to improve their environmental footprint.
6.2.2. Ownership structure
In Table 11 , I examine how ownership structure evolves
following the issuance of green bonds. In columns (1)-(2),
I find that institutional ownership increases slightly but
not significantly. Importantly, in columns (3)-(8), I find that

C. Flammer Journal of Financial Economics 142 (2021) 499–516
Table 10
Environmental performance following the issuance of green bonds.
This table reports estimates of the difference-in-differences specification in Eq. (1) . Green bond is a dummy variable equal to one
if the firm has issued a green bond. Green bond (pre-issue year) is a dummy variable equal to one in the year preceding the green
bond issue. Green bond (short-term, 1 year) and Green bond (long-term, 2 + years) are defined analogously with respect to the year
following the green bond issue and the subsequent years, respectively. Environment rating is described in Table 5 . CO 2 emissions
is the ratio of CO 2 emissions (in tons) from ASSET4 divided by the book value of assets in US dollars. The sample includes all
firm-year observations of the treated and matched control firms from 2010–2018. Standard errors (reported in parentheses) are
clustered at the two-digit SIC industry level. ∗ , ∗∗ , and ∗∗∗ denotes significance at the 10%, 5%, and 1% level, respectively.
Environmental performance
Environment rating CO 2 emissions
(1) (2) (3) (4)
Green bond 6.118 ∗∗ −10.898 ∗∗∗
(2.438) (4.101)
Green bond (pre-issue year) 1.333 1.083
(2.502) (4.229)
Green bond (short-term, 1 year) 4.079 −7.667
(2.663) (4.879)
Green bond (long-term, 2 + years) 7.034 ∗∗ −12.977 ∗∗
(3.286) (5.325)
Firm fixed effects Yes Yes Yes Yes
Country-year fixed effects Yes Yes Yes Yes
Industry-year fixed effects Yes Yes Yes Yes
Observations 1466 1466 1196 1196
R-squared 0.88 0.88 0.90 0.90
Table 11
Ownership structure following the issuance of green bonds.
This table reports estimates of the difference-in-differences specification in Eq. (1) . Green bond is a dummy variable equal to one if the firm has issued a
green bond. Green bond (pre-issue year) is a dummy variable equal to one in the year preceding the green bond issue. Green bond (short-term, 1 year) and
Green bond (long-term, 2 + years) are defined analogously with respect to the year following the green bond issue and the subsequent years, respectively.
The dependent variables used in this table are only available for US companies. Institutional ownership is the percentage of shares owned by institutional
investors. Ownership by long-term investors (duration) is the percentage of shares owned by institutional investors whose holding duration (computed as in
Cremers and Pareek, 2016 , Eq. (2) on p. 292) is above the median across all investors. Ownership by long-term investors (churn rate) is the percentage of
shares owned by institutional investors whose churn rate (computed as in Gaspar et al., 2005 , Eq. (1) on p. 143) is below the median across all investors.
Ownership by green investors is the percentage of shares owned by “green” institutional investors, that is, investors who are members of the Ceres Investor
Network on Climate Risk and Sustainability. The sample includes all firm-year observations of the treated and matched control firms from 2010–2018.
Standard errors (reported in parentheses) are clustered at the two-digit SIC industry level. ∗ , ∗∗ , and ∗∗∗ denotes significance at the 10%, 5%, and 1% level,
respectively.
Long-term investors Green investors
Institutional ownership
Ownership by long-term
investors (duration)
Ownership by long-term
investors (churn rate)
Ownership by green
investors
(1) (2) (3) (4) (5) (6) (7) (8)
Green bond 0.011 0.017 ∗∗ 0.014 ∗∗ 0.025 ∗∗
(0.010) (0.007) (0.006) (0.011)
Green bond (pre-issue year) −0.001 0.001 0.000 0.002
(0.010) (0.006) (0.004) (0.008)
Green bond (short-term, 1 year) 0.010 0.011 0.004 0.014
(0.011) (0.008) (0.007) (0.012)
Green bond (long-term, 2 + years) 0.011 0.022 ∗∗ 0.018 ∗∗ 0.029 ∗∗
(0.013) (0.009) (0.007) (0.013)
Firm fixed effects Yes Yes Yes Yes Yes Yes Yes Yes
Industry-year fixed effects Yes Yes Yes Yes Yes Yes Yes Yes
Observations 361 361 361 361 361 361 361 361
R-squared 0.80 0.80 0.62 0.62 0.56 0.56 0.70 0.70
the share of i) long-term investors and ii) green investors
increases significantly (by 1.8% to 2.2% for long-term in-
vestors, by 2.9% for green investors).
These findings indicate that the issuance of green bonds
helps attract an investor clientele that values the long
term and the natural environment. Again, this evidence is
consistent with the signaling argument—by issuing green
bonds, companies can (credibly) signal their commitment
512
to the environment. This, in turn, increases the companies’
appeal for investors who are sensitive to the environment.
6.2.3. Certification
In Table 12 , I revisit the results of Tables 10 and
11 to examine the role of certification. Specifically, I in-
teract Green bond with two dummy variables that indicate
whether or not the green bond is certified by independent

C. Flammer Journal of Financial Economics 142 (2021) 499–516
Table 12
Certification.
This table presents variants of the regressions in Tables 10 and 11 , interacting Green bond with dummy variables that distinguish between green bonds that
are certified by independent third parties and green bonds that are not. The sample includes all firm-year observations of the treated and matched control
firms from 2010–2018. Standard errors (reported in parentheses) are clustered at the two-digit SIC industry level. ∗ , ∗∗ , and ∗∗∗ denotes significance at the
10%, 5%, and 1% level, respectively.
Environment CO 2 emissions Institutional Ownership by Ownership by Ownership by
rating ownership long-term long-term green investors
investors investors
(duration) (churn rate)
(1) (2) (3) (4) (5) (6)
Green bond × certified 7.656 ∗∗∗ −14.392 ∗∗∗ 0.012 0.020 ∗∗ 0.018 ∗∗ 0.034 ∗∗∗
(2.737) (5.154) (0.013) (0.010) (0.008) (0.014)
Green bond × noncertified 2.224 −2.051 0.010 0.012 0.007 0.015
(2.445) (4.476) (0.011) (0.009) (0.008) (0.012)
Firm fixed effects Yes Yes Yes Yes Yes Yes
Country-year fixed effects Yes Yes – – – –
Industry-year fixed effects Yes Yes Yes Yes Yes Yes
Observations 1466 1196 361 361 361 361
R-squared 0.88 0.90 0.80 0.62 0.56 0.70
48 More precisely, Larcker and Watts (2020 , p. 14) note: “There
are several concerns with the methodological approach used by
Baker et al. (2018) models. This approach requires the fixed effects to be
third parties. As can be seen—regardless of the outcome
variable—the estimates are large and significant for certi-
fied green bonds, while they are small and insignificant for
noncertified green bonds. These findings are again consis-
tent with the signaling argument—certification is a costlier
signal and hence reflects a stronger commitment toward
the natural environment. 47
7. Is there a premium for corporate green bonds?
7.1. Green versus brown bonds of the same issuer
Some prior work on green bonds—Karpf and Man-
del (2017) , Baker et al. (2018) , and Zerbib (2019) —has fo-
cused on the pricing of green bonds and whether green
bonds are priced at a premium compared to nongreen (i.e.,
brown) bonds. These studies focus primarily on munici-
pal bonds (Zerbib’s sample also includes sovereign bonds
and a small set of corporate bonds). Their findings are
mixed. Karpf and Mandel (2017) find a green bond dis-
count (i.e., a positive yield differential for green bonds)
of about eight basis points; Zerbib (2019 , p. 40) finds a
“small, albeit significant” green bond premium of two ba-
sis points; Baker et al. (2018) find a green bond premium
of about six basis points.
In a recent article, Larcker and Watts (2020) revisit
these studies. They argue that “the mixed evidence from
prior studies is the result of methodological design mis-
specifications that produce biased estimates” (p. 4). Specif-
ically, they note that Karpf and Mandel (2017) compare
taxable and nontaxable securities (i.e., they ignore the role
of taxation in the municipal securities market), which bi-
ases the estimates toward finding a green bond discount.
They further argue that Baker et al.’s (2018) pooled fixed
effects regression insufficiently accounts for differences be-
tween green and brown bonds, which biases the analysis
47 Note that, unlike in Table 7 , I do not distinguish between first-time
and seasoned issuers. The reason is that the green bond dummy (i.e., the
treatment dummy) in Eq. (1) switches to one (and remains one) as of the
first year in which the company issues a green bond.
513
toward finding a green bond premium. 48 To carefully ex-
amine the possibility of a green bond premium (or dis-
count), Larcker and Watts (2020) use a very tight matching
methodology, in which they match each green bond to a
quasi-identical brown bond of the same issuer. When us-
ing this refined matching, they find that the green bond
premium is essentially zero.
While the above literature focuses primarily on the
pricing of municipal green bonds, little is known about
corporate green bonds. To shed light on the latter, I ap-
ply Larcker and Watts’s (2020) methodology in my sample
of corporate green bonds. I proceed as follows. First, out
of the 565 corporate green bonds issued by public firms, I
restrict the sample to bonds with nonmissing information
on the offering yield (item “yield at issue” in Bloomberg’s
fixed income database). A total of 152 bonds have this in-
formation, corresponding to 65 unique issuers. For each of
these 65 issuers, I extract from Bloomberg’s fixed income
database all brown bonds (i.e., bonds for which the item
“Green bond indicator” is “No”) that have nonmissing in-
formation on the offering yield and were issued between
January 1, 2010 and December 31, 2018. Doing this yields a
total of 1690 brown bonds by the 65 issuers (and hence an
average of 26 potential brown bond matches per issuer).
I then match each green bond to the most comparable
brown bond of the same issuer. The matching is done
in two steps. First, I require that the credit rating be the
same (based on Bloomberg’s composite credit rating). I
then pick the nearest neighbor (using the Mahalanobis
distance) based on four characteristics: (i) log(issuance
amount), (ii) maturity, (iii) coupon, and (iv) the number of
effective controls. It is easy to imagine a situation where the fixed effects
will be inadequate. For example, green issuers (which tend to be signifi-
cantly larger) may outperform non-green issuers over the sample period.
Even when controlling for rating-maturity-issuance month fixed effects
and issuer fixed effects, a greenium would be observed in this setting
when it does not actually exist.”

C. Flammer Journal of Financial Economics 142 (2021) 499–516
Table 13
Is there a premium on corporate green bonds?.
This table reports the mean and median of yield at issue for green bonds
and matched nongreen bonds of the same issuer. The matching is de-
scribed in Section 7.1 . The two rows at the bottom report the difference-
in-means and difference-in-medians tests, along with the corresponding
p -values. ∗ , ∗∗ , and ∗∗∗ denotes significance at the 10%, 5%, and 1% level,
respectively.
Yield at issue (in%)
Obs. Mean Median
Green bond 152 3.654 3.600
Matched nongreen bond 152 3.673 3.600
Difference −0.019 0.000
p -value (difference) 0.942 1.000
days in between the green and brown bond issuance. By
design, this matching procedure provides for each green
bond a matched brown bond by the same issuer that is as
similar as possible except for the “greenness.”
The results are provided in Table 13. 49 As can be seen,
for a given issuer, there is no noticeable difference be-
tween the yields of green versus brown bonds. The me-
dian difference is exactly zero ( p -value = 1.0 0 0). The mean
difference is small in economic terms (0.019%) and statis-
tically insignificant ( p -value = 0.942). This finding is con-
sistent with Larcker and Watts’s (2020) finding of nearly
identical pricing for green and brown (municipal) bonds.
This evidence also implies that my finding of a positive
stock market reaction is unlikely to be driven by a cost
of capital argument (i.e., companies accessing a cheaper
source of capital).
7.2. Discussion of the no pricing difference
The finding of no green bond premium warrants some
discussion. First, is this finding consistent with industry
practice? Intuitively, one might expect that green bond in-
vestors are willing to trade off financial returns for societal
benefits. Yet, as it turns out, this is not the prevailing view
among industry practitioners. For example, participants re-
sponding to a survey by the California State Treasurer’s Of-
fice on green bonds unanimously stated that “their firms
would not accept a lower yield for a green bond.”50 This
was further confirmed by Larcker and Watts (2020, p. 4) in
their interviews of several traders, portfolio managers, and
investment bankers, who all shared that sentiment. I also
conducted my own interviews of industry practitioners, in-
cluding two fixed income analysts at asset management
firms, a green bond research analyst at a leading financial
institution, and the director of the sustainable division of
one of the world’s largest banks. They unanimously stated
that they would not invest in green bonds if the returns
were not competitive.
Naturally, this raises the question of why there is no
green bond premium. Larcker and Watts (2020) provide a
49 Appendix Table A.1 shows the covariate balance for the matching
characteristics, confirming there is no significant difference between the
green bonds and matched brown bonds. 50 See John Chiang, “Growing the US green bond market,” California
State Treasurer’s Office, 2017.
514
detailed discussion of this question and conclude that the
most likely explanation is that the green projects are prof-
itable enough to generate competitive returns. They note
on p. 3: “Instead, it is much more likely that asset prices
are a function of the impact of ESG and CSR on future firm
profitability and risk.” This rationale is consistent with the
large (and growing) literature that shows a positive rela-
tion between ESG and performance (e.g., Eccles et al., 2014 ;
Edmans, 2011 , 2012 ; Flammer, 2015 , 2019 ; Guenster et al.,
2011 ) and a negative relation between ESG and risk (e.g.,
Godfrey et al., 2009 ; Hoepner et al., 2019 ). The results of
this study lend further support to this argument, as they
indicate that shareholders perceive a (credible) commit-
ment toward eco-friendly behavior as value-enhancing.
Finally, it is worth highlighting that the market for cor-
porate green bonds is still at a relatively early stage. As
mentioned in Section 1 , the market for corporate green
bond represents only a tiny share of the overall corpo-
rate bond market (the issuance of corporate green bonds
was $95.7B in 2018, while the size of the worldwide bond
market is estimated at $102.8T in 2018). As such, my find-
ing of no pricing differential need not generalize to future
years. In particular, it could very well be that the existing
corporate green bonds take advantage of the low-hanging
fruits of eco-friendly behavior—that is, green projects that
are profitable enough to sustain competitive returns. Yet,
as the market expands (and the set of profitable green
projects may eventually become scarce), it is possible that
green bond investors may ultimately settle for a lower
yield compared to nongreen bonds.
8. Conclusion
This paper sheds light on corporate green bonds, a rel-
atively new instrument in sustainable finance. I first show
several stylized facts on corporate green bonds: (i) corpo-
rate green bonds have become more prevalent over time,
(ii) corporate green bonds are more prevalent in industries
in which the environment is material to the firm’s opera-
tions (e.g., energy), and (iii) corporate green bonds are es-
pecially prevalent in China, the US, and Europe.
I then examine how the stock market responds to the
issuance of corporate green bonds. I find that the stock
market responds positively to the announcement of green
bond issuance. The response is stronger for green bonds
that are certified by independent third parties and first-
time issuers. Moreover, I find that, following the issuance
of green bonds, companies improve their environmental
performance (i.e., higher environmental ratings and lower
CO 2 emissions) and experience an increase in ownership
by long-term and green investors.
Overall, my results are consistent with a signaling ar-
gument: by issuing green bonds, companies credibly sig-
nal their commitment toward the environment. The stock
market responds positively to this signal, consistent with
prior work that finds a positive link between eco-friendly
behavior and stock market outcomes (e.g., Flammer, 2013 ;
Klassen and McLaughlin, 1996 ; Krueger, 2015 ). As this
commitment materializes, companies show improved en-
vironmental performance and become more attractive for
an investor clientele that is sensitive to the environment.

C. Flammer Journal of Financial Economics 142 (2021) 499–516
Table A.1
Covariate balance for the within-issuer matching of green bonds to nongreen bonds.
This table presents descriptive statistics comparing green bonds and matched nongreen bonds of the same issuer. The matching is described in Section 7.1 .
Log (amount issued) is the natural logarithm of the issuance amount. Maturity is the maturity of the bond (in years). Coupon is the coupon rate. The last
two columns report the p -value of the difference-in-means and difference-in-medians test, respectively. ∗ , ∗∗ , and ∗∗∗ denotes significance at the 10%, 5%,
and 1% level, respectively.
Obs. Mean Median Std. dev. p -value p -value
(diff. in means) (diff. in medians)
Log(amount issued) Green bond 152 17.909 18.302 2.177 0.792 0.592
Matched nongreen bond 152 17.844 18.174 2.080
Maturity (years) Green bond 152 7.604 7.509 0.775 0.174 0.997
Matched nongreen bond 152 7.727 7.510 0.792
Coupon Green bond 152 0.037 0.036 0.025 0.961 1.000
Matched nongreen bond 152 0.036 0.036 0.023
In contrast, my findings are inconsistent with the view
that green bonds are merely a tool of greenwashing. If
that were the case, one would not observe improvements
in environmental performance following the issuance of
green bonds. My results are also inconsistent with a cost of
capital argument, according to which green bonds would
provide a cheaper source of debt financing, as I find no
pricing difference between green bonds and quasi-identical
brown bonds by the same issuer. This finding of no pric-
ing difference for corporate green bonds is consistent with
Larker and Watts’s (2020) finding of no pricing difference
in the market for green municipal bonds.
This study calls for future research. First, since cor-
porate green bonds are a new financial instrument, the
results are based on a relatively small number of obser-
vations. As more data become available, future research
could provide larger-scale evidence and a more refined
characterization of the long-term implications of corporate
green bonds. Second, while the matching used in this
study helps mitigate the endogeneity of corporate green
bonds, it does not substitute for a (quasi-)experiment. In
this vein, future developments in the green bond market
(e.g., regulations) may provide alternative empirical set-
tings that could help deepen our understanding of green
bonds. Third, an important (but difficult) question pertains
to the optimal design of the governance of the green
bond market. The current regime is mainly in the form of
private governance (through certification by independent
third parties). Yet, this need not be the optimal governance
regime compared to, for example, a combination of private
and public governance. Making ground on these questions
is an exciting avenue for future research.
Appendix
Table A.1 .
References
Akerlof, G.A. , 1970. The market for “lemons”: quality uncertainty and the
market mechanism. Q. J. Econ. 84, 488–500 . Almeida, H. , Campello, M. , Laranjeira, B. , Weisbenner, S. , 2012. Corporate
debt maturity and the real effects of the 2007 credit crisis. Critical
Finance Rev. 1, 3–58 . Baker, M.P., Bergstresser, D.B., Serafeim, G., Wurgler, J.A., 2018. Financ-
ing the response to climate change: the pricing and ownership of USgreen bonds. Unpublished working paper. Harvard Business School.
Barber, B.M. , 2007. Monitoring the monitor: evaluating CalPERS’ activism.J. Invest. 16, 66–80 .
515
Barber, B.M. , Morse, A . , Yasuda, A . , 2021. Impact investing. J. Financ. Econ.
139, 162–185 .
Barberis, N. , Shleifer, A. , 2003. Style investing. J. Financ. Econ. 68, 161–199 . Berg, F., Koelbel, J., Rigobon, R., 2020. Aggregate confusion: the divergence
of ESG ratings. Unpublished working paper. Massachusetts Institute of Technology.
Berrone, P. , Fosfuri, A. , Gelabert, L. , 2017. Does greenwashing pay off? Un- derstanding the relationship between environmental actions and en-
vironmental legitimacy. J. Bus. Ethics 144, 363–379 . Brown, S. , Warner, J. , 1980. Measuring security price performance. J. Fi-
nanc. Econ. 8, 205–258 .
Brown, S. , Warner, J. , 1985. Using daily stock returns: the case of event studies. J. Financ. Econ. 14, 3–31 .
Chatterji, A.K. , Durand, R. , Levine, D.I. , Touboul, S. , 2016. Do ratings of firms converge? Implications for managers, investors and strategy re-
searchers. Strategic Management Journal 37, 1597–1614 . Cheng, B. , Ioannou, I. , Serafeim, G. , 2014. Corporate social responsibility
and access to finance. Strategic Management Journal 35, 1–23 .
Cremers, M. , Pareek, A. , 2016. Patient capital outperformance: the invest- ment skill of high active share managers who trade infrequently. J.
Financ. Econ. 122, 288–306 . Dimson, E. , Karakas, O. , Li, X. , 2015. Active ownership. Rev. Financ. Stud.
28, 3225–3268 . Dyck, I.J.A. , Lins, K.V. , Roth, L. , Wagner, H.F. , 2019. Do institutional in-
vestors drive corporate social responsibility? International evidence.
J. Financ. Econ. 131, 693–714 . Eccles, R.G. , Ioannou, I. , Serafeim, G. , 2014. The impact of corporate sus-
tainability on organizational processes and performance. Manag. Sci. 60, 2381–2617 .
Eckbo, E.B. , Masulis, R.W. , Norli, O. , 2007. Security offerings. In: Eckbo, B.E. (Ed.), Handbooks in Finance: Handbook of Empirical Corporate Fi-
nance. Elsevier/North-Holland, Amsterdam, pp. 233–373 .
Edmans, A. , 2011. Does the stock market fully value intangibles? Employee satisfaction and equity prices. J. Financ. Econ. 101, 621–640 .
Edmans, A. , 2012. The link between job satisfaction and firm value, with implications for corporate social responsibility. Acad. Manag. Perspect.
26, 1–19 . Edmans, A., Li, L., Zhang, C., 2017. Employee satisfaction, labor market
flexibility, and stock returns around the world. Unpublished working
paper. London Business School. El Ghoul, S. , Guedhami, O. , Kwok, C.C.Y. , Mishra, D.R. , 2011. Does corpo-
rate social responsibility affect the cost of capital? J. Bank. Finance 35, 2388–2406 .
Fama, E.F. , French, K.R. , 1993. Common risk factors in the returns on stocks and bonds. J. Financ. Econ. 33, 3–56 .
Fama, E.F. , French, K.R. , 2007. Disagreement, tastes, and asset prices. J. Fi-
nanc. Econ. 83, 667–689 . Flammer, C. , 2013. Corporate social responsibility and shareholder reac-
tion: the environmental awareness of investors. Acad. Manag. J. 56, 758–781 .
Flammer, C. , 2015. Does corporate social responsibility lead to superior financial performance? A regression discontinuity approach. Manag.
Sci. 61, 254 9–256 8 . Flammer, C. , Hong, B. , Minor, D. , 2019. Corporate governance and the
rise of integrating corporate social responsibility criteria in executive
compensation: effectiveness and implications for firm outcomes. Strat. Manag. J. 40, 1097–1122 .
Frésard, L. , Valta, P. , 2016. How does corporate investment respond to in- creased entry threat? Rev. Corpor. Finance Stud. 5, 1–35 .
Gaspar, J.M. , Massa, M. , Matos, P. , 2005. Shareholder investment horizons and the market for corporate control. J. Financ. Econ. 76, 135–165 .

C. Flammer Journal of Financial Economics 142 (2021) 499–516
Geczy, C.C. , Jeffers, J. , Musto, D.K. , Tucker, A.M. , 2020. Contracts with (so-cial) benefits: the implementation of impact investing. J. Financ. Econ.
forthcoming . Godfrey, P.C. , Merrill, C.B. , Hansen, J.M. , 2009. The relationship between
corporate social responsibility and shareholder value: an empiricaltest of the risk management hypothesis. Strat. Manag. J. 30, 425–445 .
Graham, J.R. , Kumar, A. , 2006. Do dividend clienteles exist? Evidence on
dividend preferences of retail investors. J. Finance 61, 1305–1336 . Guenster, N. , Bauer, R. , Derwall, J. , Koedijk, K. , 2011. The economic value
of corporate eco-efficiency. Eur. Financ. Manag. 17, 679–704 . Hamilton, J. , 1995. Pollution as news: media and stock market reactions
to the TRI data. J. Environ. Econ. Manag. 28, 98–113 . Hoepner, A.G.F., Oikonomou, I., Sautner, Z., Starks, L.T., Zhou, X., 2019. ESG
shareholder engagement and downside risk. Unpublished working pa-per. University College Dublin.
Ilhan, E. , Krueger, P. , Sautner, Z. , Starks, L.T. , 2020. Institutional investors’
Views and Preferences On Climate Risk Disclosure. University ofGeneva Unpublished working paper .
Karpf, A. , Mandel, A. , 2017. Does It Pay to Be green?. Unpublished workingpaper. Pantheon-Sorbonne University .
Khan, M. , Serafeim, G. , Yoon, A. , 2016. Corporate sustainability: first evi-dence on materiality. Account. Rev. 91, 1697–1724 .
Klassen, R.D. , McLaughlin, C.P. , 1996. The impact of environmental man-
agement on firm performance. Manag. Sci. 42, 1199–1214 . Krueger, P. , 2015. Corporate goodness and shareholder wealth. J. Financ.
Econ. 115, 304–329 .
516
Krueger, P. , Sautner, Z. , Starks, L.T. , 2020. The importance of climate risk for institutional investors. Rev. Financ. Stud. 33, 1067–1111 .
Larcker, D.F. , Watts, E.M. , 2020. Where’s the greenium? J. Account. Econ. 69, 101312 .
Lyon, T.P. , Maxwell, J.W. , 2011. Greenwash: corporate environmental dis- closure under threat of audit. J. Econ. Manag. Strat. 20, 3–41 .
Lyon, T.P. , Montgomery, A.W. , 2015. The means and end of greenwash. Or-
gan. Environ. 28, 223–249 . Marquis, C. , Toffel, M.W. , Zhou, Y. , 2016. Scrutiny, norms, and selective dis-
closure: a global study of greenwashing. Organ. Sci. 27, 483–504 . Myers, S. , Majluf, N. , 1984. Corporate financing and investment decisions
when firms have information that investors do not have. J. Financ. Econ. 13, 187–221 .
Park, S.K. , 2018. Investors as regulators: green bonds and the governance challenges of the sustainable finance revolution. Stanford J. Int. Law
54, 1–47 .
Riley, J. , 1979. Informational equilibrium. Econometrica 47, 331–359 . Spence, M. , 1973. Job market signaling. Q. J. Econ. 87, 355–374 .
Starks, L.T. , Venkat, P. , Zhu, Q. , 2018. Corporate ESG Profiles and Investor Horizons. University of Texas at Austin Unpublished working paper .
Tang, D.Y. , Zhang, Y. , 2020. Do shareholders benefit from green bonds? J. Corporate Finance 61, 101427 .
Williamson, O.E. , 1985. The Economic Institutions of Capitalism. The Free
Press, New York . Zerbib, O.D. , 2019. The effect of pro-environmental preferences on bond
prices: evidence from green bonds. J. Bank. Finance 98, 39–60 .
Copyright © 2022 FDOKUMEN