revisiting problem gamblers' harsh gaze on casino service
13
Revisiting Problem Gamblers’ Harsh Gaze on Casino Services: Applying Complexity Theory to Identify Exceptional Customers Arch G. Woodside Boston College Catherine Prentice Swinburne University of Technology Anders Larsen Copenhagen Business School ABSTRACT This study revisits the theory, data, and analysis in Prentice and Woodside (2013). The study here applies fuzzy-set qualitative comparative analysis (fsQCA) to customer service–evaluation data from seven mega casinos in the world’s gambling capital—Macau. The study includes contrarian case analysis and offers complex algorithms of highly favorable customer outcomes—an alternative stance to theory and data analysis in comparison to the dominant logic of statistical analyses that Prentice and Woodside (2013) report. Contrary to their principal hypotheses, Prentice and Woodside (2013) report a negative main effect between problem gambling and casino service evaluations. The findings in the reanalysis here include more complex, nuanced views on the antecedent conditions relating to high problem-gambling, immediate service evaluations, and desired customer behavior measures in casinos. Counter to the findings using symmetric testing via multiple regression analysis in Prentice and Woodside (2013), the present study, using asymmetric testing via fsQCA, recognizes the occurrence of causal asymmetry, and draws conclusions from different algorithms leading to high scores for favorable and unfavorable outcome conditions. The findings indicate that not all problem gamblers gaze on casino services harshly; the minority of problem gamblers who view casinos positively versus harshly may be the most valuable customers for the casinos—the casinos’ exceptional customers. © 2014 Wiley Periodicals, Inc. Using the “Problem Gambling Severity Index” (PGSI) and grouping gamblers into categories by severity, Prentice and Woodside (2013) propose that problem gamblers are unique in antecedent conditions and have a positive relationship with service evaluations of the service providers (i.e., the casinos). Using data col- lected from inside seven casinos in the world’s largest gambling market (Macau), their study tests the two hypotheses. The study finds statistically significant relationships between demographic and gambling be- havioral antecedent and problem gambling. The study also finds statistically significant negative relation- ships with problem gambling and casino service evalu- ations, suggesting that problem gamblers view casino services harshly. This negative relationship finding was contrary to the hypothesis of their study, and Prentice and Woodside offer revisions of the theory by adapt- ing Nataraajan and Goff’s (1991) motive-control con- tinuum: the harsh view is due to a blame of the service provider for likely negative outcomes (e.g., gambling losses) rather than oneself. Compulsive buyers may both want to buy and to avoid such behavior (Frost, Stekettee, & Williams, 2002). Nataraajan and Goff (1991) suggest two types of compulsive buying based on this distinction: obsessive–compulsive disordered buy- ing and impulse-control disordered buying. How each problem gambler comes to understand and manage such a personal desire–avoidance conundrum likely re- sults in a wider variance of responses to problem gam- blers’ evaluations of casino services than captured by reporting only a negative (or positive) statistically sig- nificant main effect. Prentice and Woodside (2013) both oversimplify Nataraajan and Goff’s (1991) theory and miss reporting on valuable information available by Psychology and Marketing, Vol. 32(1): 65–77 (January 2015) View this article online at wileyonlinelibrary.com/journal/mar © 2014 Wiley Periodicals, Inc. DOI: 10.1002/mar.20763 65
Transcript of revisiting problem gamblers' harsh gaze on casino service
Revisiting Problem Gamblers’ HarshGaze on Casino Services: ApplyingComplexity Theory to IdentifyExceptional CustomersArch G. WoodsideBoston College
Catherine PrenticeSwinburne University of Technology
Anders LarsenCopenhagen Business School
ABSTRACT
This study revisits the theory, data, and analysis in Prentice and Woodside (2013). The study hereapplies fuzzy-set qualitative comparative analysis (fsQCA) to customer service–evaluation data fromseven mega casinos in the world’s gambling capital—Macau. The study includes contrarian caseanalysis and offers complex algorithms of highly favorable customer outcomes—an alternative stanceto theory and data analysis in comparison to the dominant logic of statistical analyses that Prenticeand Woodside (2013) report. Contrary to their principal hypotheses, Prentice and Woodside (2013)report a negative main effect between problem gambling and casino service evaluations. The findingsin the reanalysis here include more complex, nuanced views on the antecedent conditions relating tohigh problem-gambling, immediate service evaluations, and desired customer behavior measures incasinos. Counter to the findings using symmetric testing via multiple regression analysis in Prenticeand Woodside (2013), the present study, using asymmetric testing via fsQCA, recognizes theoccurrence of causal asymmetry, and draws conclusions from different algorithms leading to highscores for favorable and unfavorable outcome conditions. The findings indicate that not all problemgamblers gaze on casino services harshly; the minority of problem gamblers who view casinospositively versus harshly may be the most valuable customers for the casinos—the casinos’exceptional customers. © 2014 Wiley Periodicals, Inc.
Using the “Problem Gambling Severity Index” (PGSI)and grouping gamblers into categories by severity,Prentice and Woodside (2013) propose that problemgamblers are unique in antecedent conditions and havea positive relationship with service evaluations of theservice providers (i.e., the casinos). Using data col-lected from inside seven casinos in the world’s largestgambling market (Macau), their study tests the twohypotheses. The study finds statistically significantrelationships between demographic and gambling be-havioral antecedent and problem gambling. The studyalso finds statistically significant negative relation-ships with problem gambling and casino service evalu-ations, suggesting that problem gamblers view casinoservices harshly. This negative relationship finding wascontrary to the hypothesis of their study, and Prenticeand Woodside offer revisions of the theory by adapt-
ing Nataraajan and Goff’s (1991) motive-control con-tinuum: the harsh view is due to a blame of the serviceprovider for likely negative outcomes (e.g., gamblinglosses) rather than oneself. Compulsive buyers mayboth want to buy and to avoid such behavior (Frost,Stekettee, & Williams, 2002). Nataraajan and Goff(1991) suggest two types of compulsive buying based onthis distinction: obsessive–compulsive disordered buy-ing and impulse-control disordered buying. How eachproblem gambler comes to understand and managesuch a personal desire–avoidance conundrum likely re-sults in a wider variance of responses to problem gam-blers’ evaluations of casino services than captured byreporting only a negative (or positive) statistically sig-nificant main effect. Prentice and Woodside (2013) bothoversimplify Nataraajan and Goff’s (1991) theory andmiss reporting on valuable information available by
Psychology and Marketing, Vol. 32(1): 65–77 (January 2015)View this article online at wileyonlinelibrary.com/journal/mar© 2014 Wiley Periodicals, Inc. DOI: 10.1002/mar.20763
65
going beyond the use of multiple regression analysis(MRA; i.e., they use symmetric tests only).
The contribution of the present study is in demon-strating an alternative perspective that leads to dif-ferent routes to explaining the antecedent conditionsof problem gamblers and how problem gamblers ver-sus non–problem gamblers evaluate the casino servicesin addition to the hypotheses and findings in Prenticeand Woodside (2013). The present contribution is alsoin demonstrating the application of fuzzy-set qualita-tive comparative analysis (fsQCA)—an asymmetric testthat rests on both a quantitative and qualitative ap-proach to data analysis and theory in that the methodis able to generalize across cases while still being ableto explain complexity at the case level.
The present study demonstrates asymmetrical waysof thinking about relationships for complex antecedentconditions and outcomes—which allows for a more nu-anced understanding of the underlying configurationshow customers’ combine service facet evaluations whenassessing casinos. In doing so, the study includes con-trarian case analysis (CCA). CCA includes recognizingthat nearly all data sets include cases whereby an in-dicator (independent variable) associates with an out-come (condition or dependent variable) in a mannercounter to the reported principal symmetric relation-ship. Thus, while Prentice and Woodside (2013) report anegative association between problem gambling scoresand casino evaluation variables, at the individual caselevel a few cases occur showing high problem gam-bling scores associating with highly positive evaluationscores. The study labels such cases as “contrarian type1” cases, that is, cases showing contrarian high scoresfor an antecedent condition and high scores of the out-come condition (dependent variable) while the main ef-fect indicates a negative relationship. Contrarian type 2cases are those cases with low scores in the antecedentcondition (indicator or independent variable) associat-ing with low scores of the outcome condition (depen-dent variable) when a study reports a negative variablemain-effect relationship. The study here calls for andshows how to model complex antecedent conditions forboth types 1 and 2 contrarian cases.
The findings from the present study allow for newperspectives of both theory and methodology. Specifi-cally, the findings support the value in understandingmore complex configurations regarding casino evalu-ations than findings from symmetric-based statisticalanalysis (e.g., MRA), and so it does not support theconclusion that high problem gambling associates onlywith lower overall casino evaluations, but rather lowevaluations of casinos are part of more complex an-tecedent configurations. In terms of method, the studyhere supports the proposals by Ragin (2008) and Wood-side (2010, 2013) that fsQCA is useful in providing in-formation beyond hypothesis testing using MRA.
Following this introduction, the next section pro-vides a brief review on complexity and configural the-ory, laying the groundwork of applying fsQCA to thePrentice and Woodside (2013) data. The third section
reviews the study by Prentice and Woodside (2013). Thefourth section presents a reanalysis of the study apply-ing fsQCA to the available data. The fifth section of-fers conclusions, limitations, and suggestions for futureresearch.
THEORY OF COMPLEXITY ANDCONFIGURAL THEORY
“Relationships between variables can be non-linearwith abrupt switches occurring, so the same “cause”can, in specific circumstances produce different effects”(Urry, 2005). The prior research on problem gamblingand casino evaluations makes use of symmetric tests ofstatistical hypothesis using tools to calculate net effectson outcome conditions. Such statistical tools as MRAexplicitly assume a symmetrical relationship betweenvariables, thus high values of a simple or complex vari-able X (i.e., X can take the form of a simple continuousvariable, or can be made up of an equation containingseveral constructs) associates with high values in a de-pendent variable Y, and low values of X are associatedwith low values of Y. Thus, a symmetric predicationstates that for Y to be high, X must also be high; andfor Y to be low, X must also below.
However, in comparison to the rectangular distri-bution of XY scores indicating no significant relation-ship (Figure 1A) or a symmetrical XY relationship (Fig-ure 1B), asymmetrical relationships are often presentin most real-life contexts and XY relationships arerarely symmetrical (Ragin, 2008). This perspective sug-gests that either high values of X are sufficient butnot necessary for high values of Y as Figure 1C shows,where high values of Y occur both with low and high val-ues of X. Another asymmetrical relationship is wherehigh values of X are necessary but not sufficient for highvalues of Y as Figure 1D shows, where high values of Yoccur only with high values of X.
With his claim, “Scientists’ tools are not neutral,”Gigerenzer (1991) argues that research methods andinstruments shape the way we think and test theories.Too often then, when examining net effects of variablesan indirect assumption of symmetry in data is taken,even though real-life contexts have proven to take onasymmetrical relationships. Gigerenzer’s (1991) think-ing enhances the value of complexity. It is too simplisticto think of high outcomes of Y as associating only withhigh outcomes of X. On his work on complexity theory,Byrne (2005) points out that those evidently causal pro-cesses in complex systems cannot be accessed by simpleanalysis. The trajectories of complex systems will bealways be directed by complex and contingent causes(indicators). As such, depending on the configuration,both high and low scores of X can lead to high outcomesof Y. “In the diversity-oriented view, causes combine indifferent and sometimes contradictory ways to producethe same outcome, revealing different paths” (Ragin,2000, p. 15).
66 WOODSIDE, PRENTICE, AND LARSENPsychology and Marketing DOI: 10.1002/mar

Figure 1. Rectangular, symmetric, and asymmetric relationships of 20 cases.
The analysis and findings in Table 1 are from thePrentice and Woodside (2013) data set on problemgambling’s association with customers’ evaluations ofcasino services. The findings in Table 1 and the ad-ditional findings in the Prentice and Woodside (2013)study demonstrate a significant negative associationbetween problem gambling and customers’ casino eval-uations. Table 1 shows respondents to a survey of cus-tomers conducted inside seven casinos; the respondentsare segmented from very low to very high scores onthe PGSI. Table 1 reports the findings for just one offour global evaluations, “overall service quality” (OSQ),but the findings are consistent for all four global mea-sures and for six intermediate service dimensions—thefindings show an overall negative association betweenPGSI scores and OSQ evaluations. However, examin-ing Table 1 deeply at the case level indicates contrariantype 1 and type 2 cases. Contrarian type 1 cases hereinclude the 20% of the cases having high scores on prob-lem gambling and high scores on OSQ. Contrarian type2 cases include the 39% of the cases having low scoreson problem gambling and low scores on OSQ.
While the overall variable-level analysis by Pren-tice and Woodside (2013) supports their harsh-gaze-on-casino-services-by-problem-gamblers finding, CCAserves to deepen and partially refute their implica-tions for theory and casino management practice. Mod-eling indicators for contrarian type 1 and type 2 casesthat go beyond the use of symmetric statistical testssupport the conclusion that some problem gamblersview casino service performance very favorably andsome non–problem gamblers view casino service per-formance very unfavorable. More generally, recogniz-ing the near-universal presence of contrarian type 1and type 2 cases supports the call for “embracing com-plexity theory by performing contrarian case analysisand modeling multiple realities” (Woodside, 2014, p. 9).
Both complexity theory and configural theory buildfrom the core principle of equifinality (von Bertalanffy,1968), which states that several possible complex con-figurations of antecedent conditions (i.e., algorithms)lead to the same outcome. Configural theory also buildsfrom the principle of causal asymmetry. Followingthe criticism of the symmetrical approaches of MRA
IDENTIFYING EXCEPTIONAL CUSTOMERS 67Psychology and Marketing DOI: 10.1002/mar

Table 1. Problem Gambling Symmetric and Asymmetric Associations with OSQ.
and analysis of variance (ANOVA), causal asymmetrystates that the causes leading to the presence of an out-come might be very different from the causes leading toan absence of the outcome (Ragin, 2008). Thus, whenanalyzing problem gambling using MRA one might findthat having a casino reward card associates positivelywith problem gambling, which also means that not hav-ing reward card associates with low problem gambling.The principle of causal asymmetry however suggeststhat not being in possession of reward card is not nec-essarily an ingredient in all configurations leading tolow problem gambling, even if having a reward cardis an ingredient in all configurations leading to highscores of problem gambling.
The present study adds value to the literature by em-ploying the data analysis tool fsQCA (Ragin, 2009) thatcarries out analysis using algorithms to examine out-come conditions in an asymmetrical framework. Thisapproach allows for complex analyses of configurationsleading to high outcomes in problem gambling, imme-diate service evaluations, and positive action measuresfor casinos.
Using the framework appearing visually inFigure 2 and asymmetric testing procedures, a reanal-ysis of the Prentice and Woodside (2013) data pro-vides informative complex antecedent conditions that
accurately indicate problem gamblers as well as non–problem gamblers. The arrows in Figure 2 are subjectto testing and indicate the following propositions. (1) Afew specific demographic combinations and casino gam-bling behavior configurations indicate problem gam-blers. (2) A few specific demographic combinations andcasino gambling behavior configurations indicate non–problem gamblers. (3) Problem gambling and demo-graphics configurations as well as casino gambling be-havior configurations indicate high immediate casinoservice evaluations. (4) Problem gambling and imme-diate service evaluations configurations indicate highOSQ. (5) Configurations of problem gambling and im-mediate service evaluations as well as OSQ influencedesired customer behavior among casino guests.
PRENTICE AND WOODSIDE’S STUDY OF“PROBLEM GAMBLERS’ HARSH GAZE ONCASINO SERVICES”
Based on an extensive relevant literature review,Prentice and Woodside (2013) propose that problemgambling is explainable through unique antecedentconditions. Furthermore, the study discusses thenumerous consequences of problem gambling from the
68 WOODSIDE, PRENTICE, AND LARSENPsychology and Marketing DOI: 10.1002/mar
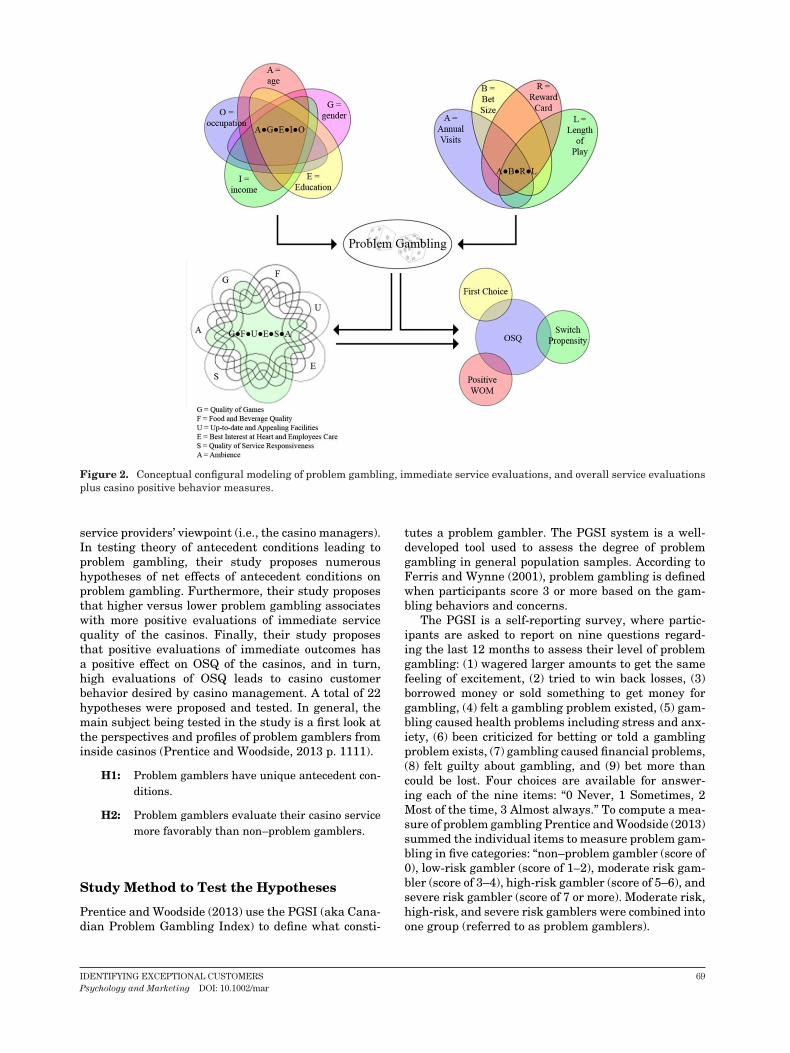
Figure 2. Conceptual configural modeling of problem gambling, immediate service evaluations, and overall service evaluationsplus casino positive behavior measures.
service providers’ viewpoint (i.e., the casino managers).In testing theory of antecedent conditions leading toproblem gambling, their study proposes numeroushypotheses of net effects of antecedent conditions onproblem gambling. Furthermore, their study proposesthat higher versus lower problem gambling associateswith more positive evaluations of immediate servicequality of the casinos. Finally, their study proposesthat positive evaluations of immediate outcomes hasa positive effect on OSQ of the casinos, and in turn,high evaluations of OSQ leads to casino customerbehavior desired by casino management. A total of 22hypotheses were proposed and tested. In general, themain subject being tested in the study is a first look atthe perspectives and profiles of problem gamblers frominside casinos (Prentice and Woodside, 2013 p. 1111).
H1: Problem gamblers have unique antecedent con-ditions.
H2: Problem gamblers evaluate their casino servicemore favorably than non–problem gamblers.
Study Method to Test the Hypotheses
Prentice and Woodside (2013) use the PGSI (aka Cana-dian Problem Gambling Index) to define what consti-
tutes a problem gambler. The PGSI system is a well-developed tool used to assess the degree of problemgambling in general population samples. According toFerris and Wynne (2001), problem gambling is definedwhen participants score 3 or more based on the gam-bling behaviors and concerns.
The PGSI is a self-reporting survey, where partic-ipants are asked to report on nine questions regard-ing the last 12 months to assess their level of problemgambling: (1) wagered larger amounts to get the samefeeling of excitement, (2) tried to win back losses, (3)borrowed money or sold something to get money forgambling, (4) felt a gambling problem existed, (5) gam-bling caused health problems including stress and anx-iety, (6) been criticized for betting or told a gamblingproblem exists, (7) gambling caused financial problems,(8) felt guilty about gambling, and (9) bet more thancould be lost. Four choices are available for answer-ing each of the nine items: “0 Never, 1 Sometimes, 2Most of the time, 3 Almost always.” To compute a mea-sure of problem gambling Prentice and Woodside (2013)summed the individual items to measure problem gam-bling in five categories: “non–problem gambler (score of0), low-risk gambler (score of 1–2), moderate risk gam-bler (score of 3–4), high-risk gambler (score of 5–6), andsevere risk gambler (score of 7 or more). Moderate risk,high-risk, and severe risk gamblers were combined intoone group (referred to as problem gamblers).
IDENTIFYING EXCEPTIONAL CUSTOMERS 69Psychology and Marketing DOI: 10.1002/mar

The data were collected using a survey form. Mea-sures of antecedent conditions included demographics(e.g., age, gender, education, income, and occupation)and measures of casino gambling behavior (possessionof a casino reward card, length of play of each visit, av-erage bet size, and number of annual visits). Dependingon the measurement, the participants assigned them-selves to an appropriate group or gave open-ended re-sponses to the questioner. The casino evaluation in-cluded six immediate outcomes that were constructsusing items of service experiences unique to casinos.The constructs were built of evaluation questions witheach measured on a 1–7 scale. The six evaluations usedto measure customer casino service experience wereas follows: (1) casino has up-to-date appealing facili-ties, (2) quality of service responsiveness, (3) casino hasbest interest at heart plus employees care, (4) qualityof games, (5) food and beverage quality, and (6) am-bience. The purpose of these immediate outcomes isto test the hypothesis that they have direct influenceon the four global outcomes: (1) OSQ, and the threedesired casino customer behavior measurements—(2)casino is my first choice, (3) positive word-of-mouthfor this casino, and (4) propensity to switch from thiscasino. Regarding the global outcomes, Prentice andWoodside (2013) furthermore propose that OSQ is alynchpin influence on the rest of the global outcomes(i.e., desired customer behavior) supporting prior re-search (see Chang, Tseng, and Woodside, 2013; Wood-side, Frey, and Daly, 1989) modeling customer evalua-tions of specific acts, overall satisfaction, and the inten-tion to visit the same service provider in the future.
Prentice and Woodside (2013) collected data fromseven mega casinos in the “Special Administrative Re-gion of China,” that is, Macau. In recent years, Macauhas become the world’s biggest gambling center, andthe data were collected in the seven largest casinosmeasured on revenue. The participants in the studywere adults confirmed to be engaged in gambling inone of the seven casinos. In total, the data set consistsof 411 individual cases.
Following Figure 2 in Prentice and Woodside (2013),antecedent conditions were individually regressed onproblem gambling, and problem gambling in turn wasregressed on both immediate and global outcomes, im-mediate outcomes were regressed on OSQ and the otherglobal outcomes, and finally OSQ was regressed on thethree remaining global outcomes. (Prentice and Wood-side, 2013 p. 1111)
Rather than focusing on individual main effects, analternative approach to the analysis would be to lookat combinations (i.e., configurations) of antecedent con-ditions leading to high outcomes in the variable beinganalyzed; such an analysis serves to maintain the dataat the individual case level and allows for a more nu-anced, complex view of the data. The analytic proce-dure to perform such analysis (i.e., QCA) is able to an-alyze the data across all the antecedent conditions andpropose different combinations leading to high problemgambling, high OSQ, or high scores in desired customer
behavioral outcomes, thus being able to offer profiles ofantecedent conditions leading to high outcome in theabove mentioned results. The fsQCA of Prentice andWoodside (2013) data in the present study offers suchan analysis.
Prentice and Woodside’s Findings andConclusions
Prentice and Woodside’s (2013) main findings includeregressions of each antecedent condition on problemgambling. All estimated relationships are statisticallysignificant except for education, which is not associ-ated with problem gambling. The findings suggest thatthe following antecedent conditions associate positivelywith problem gambling: age, gender (male = 1, female= 0), income, casino reward card (card = 1, no card = 0),length of play of each visit, average bet size, and num-ber of annual visits. Occupational status is negativelyassociated with problem gambling; however it is tedious(boring?) in the sense that it is only partially confirmed.The findings generally support the hypothesis proposedfor unique antecedent conditions associated with prob-lem gamblers except for the income variable.
The findings of problem gambling and immediateoutcomes of casino service evaluations plus OSQ showconsistently negative associations between problemgambling and casino service evaluations. The findingsfor the desired customer behavior indicate that problemgambling is negatively associated with “casino is myfirst choice,” “positive word-of-mouth,” and “propensityto switch,” which supported revising the second hypoth-esis proposed by Prentice and Woodside (2013).
In conclusion, the study revised the proposed rela-tionship based on the findings in Prentice and Wood-side (2013, p. 1118) and offered the following explana-tion: “Problem gamblers are likely to recognize, thattheir casino gambling is unhealthy—and that the ser-vice provider is at least partially (if not entirely) toblame for their behaviors. Blaming the service providermay be preferable than blaming oneself for surrender-ing to a highly intense desire.” This revision expands onUrry’s (1990) “tourist gaze” in interpreting surprisingrelationships.
The examination of these findings indicates that theanalysis predicting net effects using simple and mul-tiple linear regression models is overly simplistic. AsPrentice and Woodside (2013 p. 1118) point out whendiscussing the findings, McClelland’s (1998) recommen-dation to look beyond simple linear relationships whenexamining variables is confirmed by these findings. Theadoption of an fsQCA case-based (i.e., individual) levelanalysis uses combinatorial configurations to explainoutcome conditions and hence solves for some of theunderlying complexity suggested in the original analy-sis. The following section applies fsQCA to the Prenticeand Woodside (2013) data and shows the applicationsand findings using the case-based approach.
70 WOODSIDE, PRENTICE, AND LARSENPsychology and Marketing DOI: 10.1002/mar
FsQCA OF THE PRENTICE ANDWOODSIDE (2013) DATA
A consistency index is one of the outcome metrics offsQCA. This index indicates the degree that the out-comes scores (Y) are equal to or higher than the recipescores (X) across all the cases. The Y scores are equalto or higher than all X sores, the consistency index isequal to 1.00. A high consistency index indicates thathigh scores for the recipe (X) associates with high scoresfor the outcome (Y). The consistency index in fsQCAgauges the degree that cases share a simple or com-plex configuration (i.e., combination) in displaying theoutcome condition. Thus, consistency can be viewed asanalogous to correlation in classic correlation statistics.
The software program for fsQCA (available atfsQCA.com) provides a second output metric, the cov-erage index. The coverage index assesses the degree towhich a simple or complex configuration “accounts for”instances of an outcome condition. The coverage indexis analogous to the r2 value in regression analysis, thatis, how much of the variation in the outcome is beingexplained by the complex statements, and indicates em-pirical relevance or importance.
Consistency is equal to the following value, (Xi �Yi) = � [min (Xi, Yi)] / � (Xi). Scores for Xi indicatecase i’s membership score in the set denoted X; and Yi
is case i’s membership score in the outcome conditiondenoted Y. (Xi � Yi) is the subset relation, to whichthe “min” indicates the selection of the lower of thetwo values in the subset relation. Coverage is equalto the following value, (Xi � Yi) = � [min (Xi, Yi)] /� (Yi), where the Xi in the denominator has been re-placed by Yi in comparison with the formula for con-sistency. “Thus, the measure of fuzzy-set coverage issimply the overlap (� [min (Xi, Yi)]) expressed as aproportion of the sum of the membership scores in theoutcome (� (Yi))” (Ragin, 2008, p. 57).
Ragin (2008, p. 9) reports on the main differencebetween fsQCA and other conventional quantitativemethods: “The key difference between the two is cap-tured in the idea of a ‘causal recipe’ [configuration]—a specific combination of causally relevant ingredientslinked to an outcome. In set-theoretic work, the ideaof a causal recipe is straightforward, for the notion ofcombined causes is directly captured by the principleof set intersection.” To fully elaborate on and describethe method would be substantial, and thus an overviewof key concepts and a brief introduction has been givenin this section. Ragin (2008) provides extensive theoryand user guidance on the use of QCA—furthermore,a user guide for the software FsQCA is available atwww.fsQCA.com.
Estimating Complex Causal Statements
For fuzzy sets, the researcher needs to calibrate theoriginal data into scores between 0 and 1 indicatingtheir degree of membership. The next step is to
assess each case degree of membership in a givencausal recipe, which is given as the intersection ofthe fuzzy-set causal conditions that comprise therecipe using Boolean algebra (Zadeh, 1965). Considerestimating high scores for problem gambling by usinga demographic configuration of antecedent conditionsincluding age, gender, education, occupational status,and income. Consider the following complex antecedentconfiguration in the following model:
age • gender • education • occupational status
•income ≤ problem gambling. (1)
Model 1 proposes that older, males, low in educa-tion, low in occupation status, and in high income havehigh problem-gambling membership scores. The tilde(�) represents the negation (full nonmembership) inthe condition and the mid-level dot (•) represents the“logical and” in fuzzy sets. For example, using case Afrom the Prentice and Woodside (2013)—an old cus-tomer (age = 0.95), male (gen = 0.99) with low educa-tion (edu = 0) and low occupational status (occ = 0.05)but high income (inc = 0.82), his degree of membershipto the causal recipe would be 0.82, which indicates amembership level of more-in-than-out to the complexcausal recipe. Analogous to this example, consider caseB—a young female with high education and high occu-pational status but low income. Her degree of member-ship to the causal recipe would be 0.01, which indicatesfull nonmembership.
Calibration of Antecedent Conditionsto Fuzzy-set Scores
The fuzzy-set scores for simple antecedent and com-plex conditions range from 0.00 to 1.00. These valuesindicate the degree of membership of the case in eachcondition. A transformation (i.e., calibration) from theoriginal values into fuzzy-set scores has to be made bythe analyzer. The fuzzy-set scores are not comparableto probabilities, but instead should be looked upon astruth values to a statement. The reason that originalvalues are calibrated is, as Ragin (2008, p. 174) argues,“Because they must be calibrated, they are superiorin many respects to conventional measures, as they areused in both quantitative and qualitative social science.In essence, I argue that fuzzy sets offer a middle pathbetween quantitative and qualitative measurements.However, this middle path is not a compromise betweenthe two; rather, it transcends many of the limitationsof both.”
The calibration from conventional scores to fuzzy-setvalues makes use of external information to assess thedegree of membership of each variable. Within the end-points 0.00 for full nonmembership and 1 for full mem-bership, three breakpoints must be assessed. The firstbeing 0.05 for the threshold for full nonmembership, thesecond being 0.50—the crossover point of membershipambiguity, and 0.95 for full membership.
IDENTIFYING EXCEPTIONAL CUSTOMERS 71Psychology and Marketing DOI: 10.1002/mar

Table 2. Calibrations of All Conditions.
Variable/Antecedent Descriptive StatisticsCalibrations
(0.95, 0.50; 0.05)
PGSI μ = 11.09, σ = 3.14, min = 9, max = 24 (16, 11, 9)Demographics
Age (age) μ = 2.98, σ = 1, min = 1, max = 6 (5, 3, 1)Gender (gen) male = 250 [1], female = 161 [0] (1, 0.5, 0)Education (edu) μ = 2.75, σ = 0.84, min = 1, max = 4 (4, 3, 2)Income (inc) μ = 2.21, σ = 1.44, min = 1, max = 8 (5, 3, 1)Occupational status (occ) μ = 3.17, σ = 1.629, min = 1, max = 6 (6, 4, 2)
Casino gambling behaviorCasino reward card holder/user (rwc) yes = 234 [1], no = 171 [0] (1, 0.5, 0)Length of play in each visit, hours (lop) μ = 3.03, σ = 1.54, min = 1, max = 10 (5, 3, 1)Average bet size (abs) μ = 1.98, σ = 1.79, min = 1, max = 5 (3, 2, 1)Number of annual visits (nav) μ = 2.66, σ = 1.79, min = 1, max = 7 (5, 3, 1)
Casino immediate service evaluation ratingsCasino up-to-date appealing facilities (uaf) μ = 20, σ = 3.29, min = 10, max = 28 (24, 16, 8)Quality of service responsiveness (qsr) μ = 14.37, σ = 2.61, min = 6, max = 21 (18, 12, 6)Casino has best interest at heart plus
employees care (hep)μ = 26.31, σ = 6.06, min = 9, max = 41 (36, 24, 12)
Quality of the games (qog) μ = 15.65, σ = 2.68, min = 8, max = 21 (18, 12, 6)Food and beverage quality (fbq) μ = 14.25, σ = 2.45, min = 8, max = 21 (18, 12, 6)Ambience (amb) μ = 10.18, σ = 1.74, min = 5, max = 14 (12, 8, 4)
Casino quality ratingsOSQ (osq) μ = 9.66, σ = 1.55, min = 5, max = 14 (12, 8, 4)Casino is my first choice (fch) μ = 4.26, σ = 1.32, min = 1, max = 7 (6, 4, 2)Positive word-of-mouth for this
casino (wom)μ = 8.24, σ = 2.43, min = 2, max = 14 (12, 8, 4)
Propensity to switch from this casino (psw) μ = 9.55, σ = 1.85, min = 2, max = 14 (12, 8, 4)
Table 3. Antecedent Conditions for High Problem Gambling.
Antecedent conditionsCoverage
Model Age Gender Education IncomeOcc
StatusRw
CardLen ofPlay
AveBet
No. AnnVis Raw Unique Consistency
1 ◦ • • ◦ • • ◦ ◦ • 0.17 0.10 0.842 • • ◦ • • • ◦ • ◦ 0.14 0.07 0.85
Solution coverage: 0.24, solution consistency: 0.82.
Table 2 shows the antecedent conditions carried outin the analysis. Each antecedent has descriptive statis-tics from the sample and the final calibrated score. No-tably, all the antecedents regarding constructs usingitems of 7-point scale evaluations by customers havebeen given a fixed calibration of full nonmembership(0.05) for the original score equal to 2, which is a ratherpoor evaluation of the construct; the crossover point(0.50) is an evaluation equal to 4, which is the neutralpoint in a 7-point Likert scale; full membership (0.95)for the original value equal to 6, which is a rather posi-tive evaluation of that particular construct. Dependingon how many items the constructs were made up of,this method has been scaled to fit that number.
FINDINGS
The findings follow the conceptual model in Figure 2.This section compares the findings with the results
from the analyses carried out by Prentice and Wood-side (2013).
Findings for High- and Low-Score ProblemGambling
Table 3 reports the findings for high scores of prob-lem gambling using fsQCA and shows two complexrecipes predicting high scores of problem gambling. Thetwo models for high problem gambling consist of males(both young and old), one with low education and highincome, and one with high education and low income.Both algorithms have high occupational status and arein position of a casino reward card, while their lengthof play of each visit to the casino is low. One has highaverage bet size and low annual visits, while the otherone has low average bet size and high annual visits.
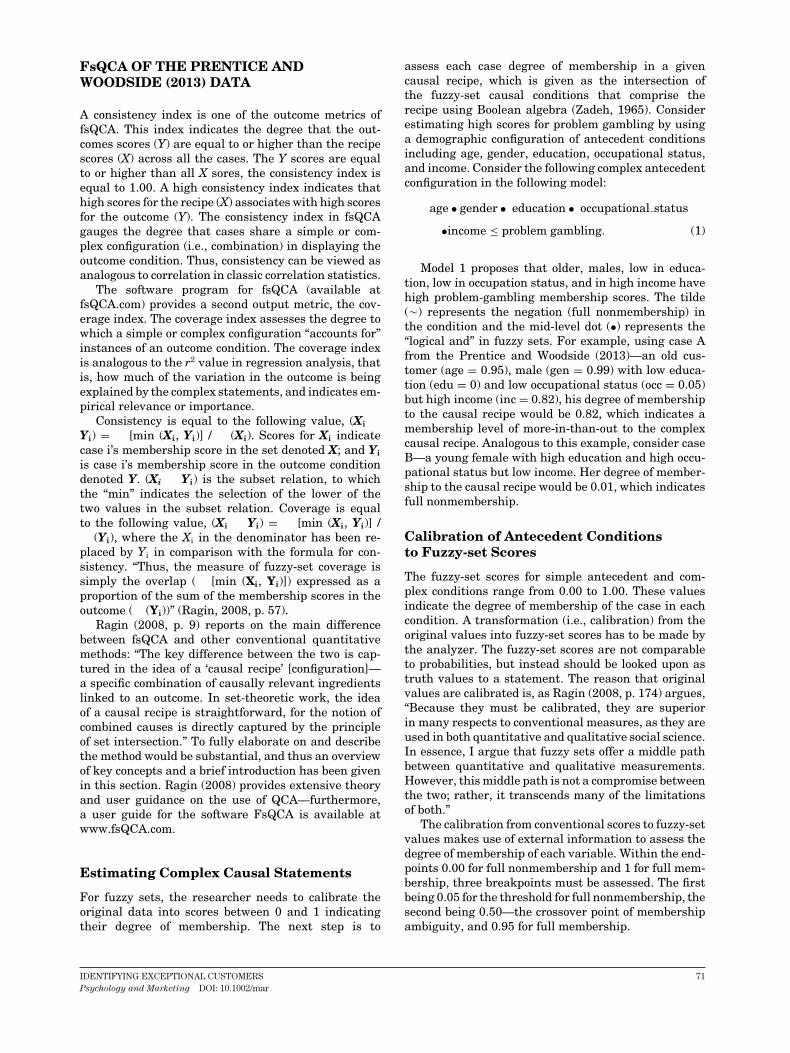
Table 4 shows complex recipes that work in predict-ing low scores of problem gambling. The four models
72 WOODSIDE, PRENTICE, AND LARSENPsychology and Marketing DOI: 10.1002/mar
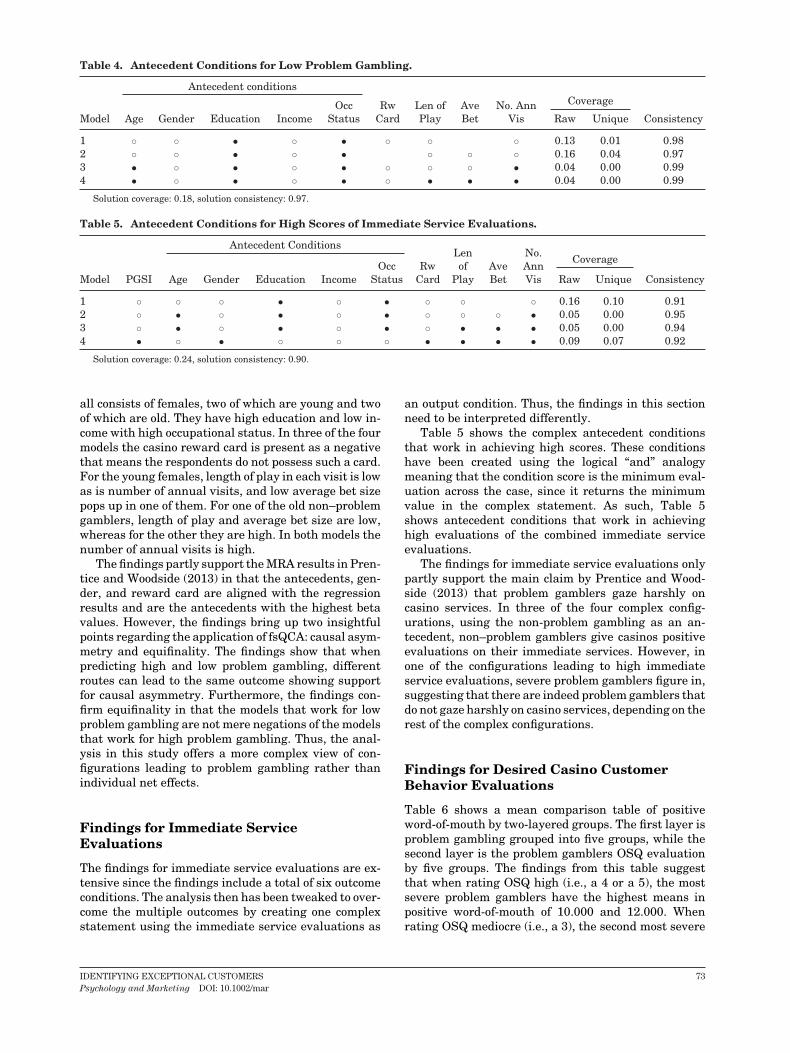
Table 4. Antecedent Conditions for Low Problem Gambling.
Antecedent conditionsCoverage
Model Age Gender Education IncomeOcc
StatusRw
CardLen ofPlay
AveBet
No. AnnVis Raw Unique Consistency
1 ◦ ◦ • ◦ • ◦ ◦ ◦ 0.13 0.01 0.982 ◦ ◦ • ◦ • ◦ ◦ ◦ 0.16 0.04 0.973 • ◦ • ◦ • ◦ ◦ ◦ • 0.04 0.00 0.994 • ◦ • ◦ • ◦ • • • 0.04 0.00 0.99
Solution coverage: 0.18, solution consistency: 0.97.
Table 5. Antecedent Conditions for High Scores of Immediate Service Evaluations.
Antecedent ConditionsCoverage
Model PGSI Age Gender Education IncomeOcc
StatusRw
Card
Lenof
PlayAveBet
No.AnnVis Raw Unique Consistency
1 ◦ ◦ ◦ • ◦ • ◦ ◦ ◦ 0.16 0.10 0.912 ◦ • ◦ • ◦ • ◦ ◦ ◦ • 0.05 0.00 0.953 ◦ • ◦ • ◦ • ◦ • • • 0.05 0.00 0.944 • ◦ • ◦ ◦ ◦ • • • • 0.09 0.07 0.92
Solution coverage: 0.24, solution consistency: 0.90.
all consists of females, two of which are young and twoof which are old. They have high education and low in-come with high occupational status. In three of the fourmodels the casino reward card is present as a negativethat means the respondents do not possess such a card.For the young females, length of play in each visit is lowas is number of annual visits, and low average bet sizepops up in one of them. For one of the old non–problemgamblers, length of play and average bet size are low,whereas for the other they are high. In both models thenumber of annual visits is high.
The findings partly support the MRA results in Pren-tice and Woodside (2013) in that the antecedents, gen-der, and reward card are aligned with the regressionresults and are the antecedents with the highest betavalues. However, the findings bring up two insightfulpoints regarding the application of fsQCA: causal asym-metry and equifinality. The findings show that whenpredicting high and low problem gambling, differentroutes can lead to the same outcome showing supportfor causal asymmetry. Furthermore, the findings con-firm equifinality in that the models that work for lowproblem gambling are not mere negations of the modelsthat work for high problem gambling. Thus, the anal-ysis in this study offers a more complex view of con-figurations leading to problem gambling rather thanindividual net effects.
Findings for Immediate ServiceEvaluations
The findings for immediate service evaluations are ex-tensive since the findings include a total of six outcomeconditions. The analysis then has been tweaked to over-come the multiple outcomes by creating one complexstatement using the immediate service evaluations as
an output condition. Thus, the findings in this sectionneed to be interpreted differently.
Table 5 shows the complex antecedent conditionsthat work in achieving high scores. These conditionshave been created using the logical “and” analogymeaning that the condition score is the minimum eval-uation across the case, since it returns the minimumvalue in the complex statement. As such, Table 5shows antecedent conditions that work in achievinghigh evaluations of the combined immediate serviceevaluations.
The findings for immediate service evaluations onlypartly support the main claim by Prentice and Wood-side (2013) that problem gamblers gaze harshly oncasino services. In three of the four complex config-urations, using the non-problem gambling as an an-tecedent, non–problem gamblers give casinos positiveevaluations on their immediate services. However, inone of the configurations leading to high immediateservice evaluations, severe problem gamblers figure in,suggesting that there are indeed problem gamblers thatdo not gaze harshly on casino services, depending on therest of the complex configurations.
Findings for Desired Casino CustomerBehavior Evaluations
Table 6 shows a mean comparison table of positiveword-of-mouth by two-layered groups. The first layer isproblem gambling grouped into five groups, while thesecond layer is the problem gamblers OSQ evaluationby five groups. The findings from this table suggestthat when rating OSQ high (i.e., a 4 or a 5), the mostsevere problem gamblers have the highest means inpositive word-of-mouth of 10.000 and 12.000. Whenrating OSQ mediocre (i.e., a 3), the second most severe
IDENTIFYING EXCEPTIONAL CUSTOMERS 73Psychology and Marketing DOI: 10.1002/mar
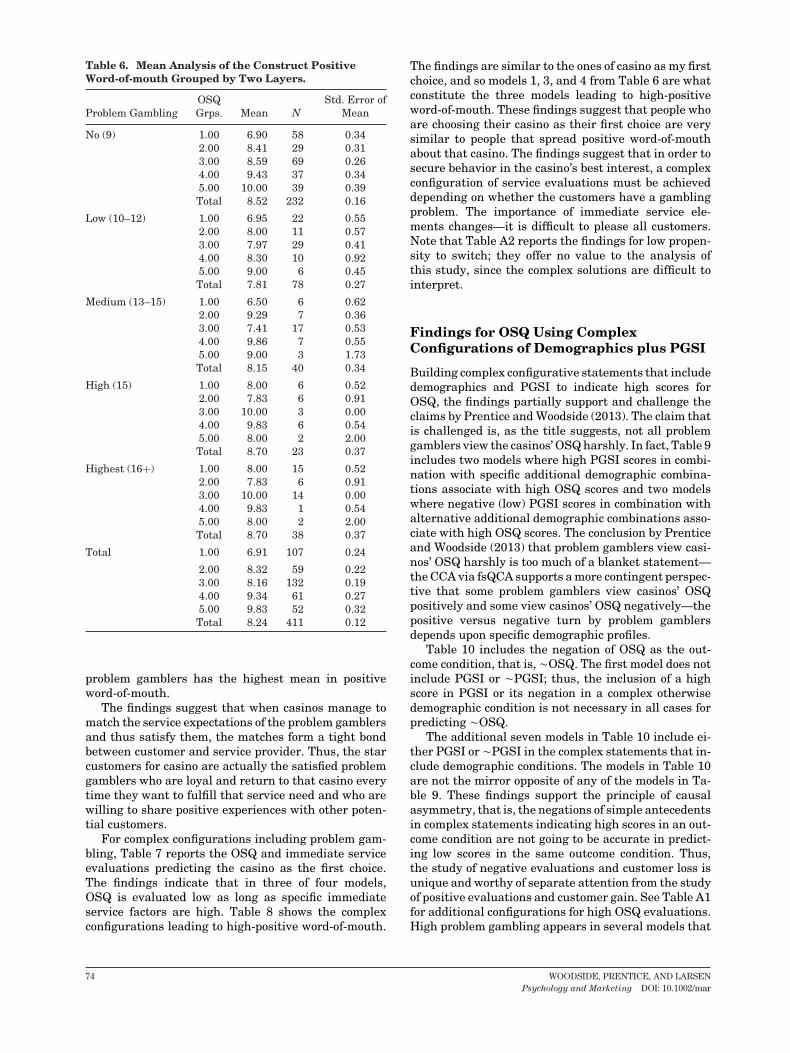
Table 6. Mean Analysis of the Construct PositiveWord-of-mouth Grouped by Two Layers.
OSQ Std. Error ofProblem Gambling Grps. Mean N Mean
No (9) 1.00 6.90 58 0.342.00 8.41 29 0.313.00 8.59 69 0.264.00 9.43 37 0.345.00 10.00 39 0.39Total 8.52 232 0.16
Low (10–12) 1.00 6.95 22 0.552.00 8.00 11 0.573.00 7.97 29 0.414.00 8.30 10 0.925.00 9.00 6 0.45Total 7.81 78 0.27
Medium (13–15) 1.00 6.50 6 0.622.00 9.29 7 0.363.00 7.41 17 0.534.00 9.86 7 0.555.00 9.00 3 1.73Total 8.15 40 0.34
High (15) 1.00 8.00 6 0.522.00 7.83 6 0.913.00 10.00 3 0.004.00 9.83 6 0.545.00 8.00 2 2.00Total 8.70 23 0.37
Highest (16+) 1.00 8.00 15 0.522.00 7.83 6 0.913.00 10.00 14 0.004.00 9.83 1 0.545.00 8.00 2 2.00Total 8.70 38 0.37
Total 1.00 6.91 107 0.24
2.00 8.32 59 0.223.00 8.16 132 0.194.00 9.34 61 0.275.00 9.83 52 0.32Total 8.24 411 0.12
problem gamblers has the highest mean in positiveword-of-mouth.
The findings suggest that when casinos manage tomatch the service expectations of the problem gamblersand thus satisfy them, the matches form a tight bondbetween customer and service provider. Thus, the starcustomers for casino are actually the satisfied problemgamblers who are loyal and return to that casino everytime they want to fulfill that service need and who arewilling to share positive experiences with other poten-tial customers.
For complex configurations including problem gam-bling, Table 7 reports the OSQ and immediate serviceevaluations predicting the casino as the first choice.The findings indicate that in three of four models,OSQ is evaluated low as long as specific immediateservice factors are high. Table 8 shows the complexconfigurations leading to high-positive word-of-mouth.
The findings are similar to the ones of casino as my firstchoice, and so models 1, 3, and 4 from Table 6 are whatconstitute the three models leading to high-positiveword-of-mouth. These findings suggest that people whoare choosing their casino as their first choice are verysimilar to people that spread positive word-of-mouthabout that casino. The findings suggest that in order tosecure behavior in the casino’s best interest, a complexconfiguration of service evaluations must be achieveddepending on whether the customers have a gamblingproblem. The importance of immediate service ele-ments changes—it is difficult to please all customers.Note that Table A2 reports the findings for low propen-sity to switch; they offer no value to the analysis ofthis study, since the complex solutions are difficult tointerpret.
Findings for OSQ Using ComplexConfigurations of Demographics plus PGSI
Building complex configurative statements that includedemographics and PGSI to indicate high scores forOSQ, the findings partially support and challenge theclaims by Prentice and Woodside (2013). The claim thatis challenged is, as the title suggests, not all problemgamblers view the casinos’ OSQ harshly. In fact, Table 9includes two models where high PGSI scores in combi-nation with specific additional demographic combina-tions associate with high OSQ scores and two modelswhere negative (low) PGSI scores in combination withalternative additional demographic combinations asso-ciate with high OSQ scores. The conclusion by Prenticeand Woodside (2013) that problem gamblers view casi-nos’ OSQ harshly is too much of a blanket statement—the CCA via fsQCA supports a more contingent perspec-tive that some problem gamblers view casinos’ OSQpositively and some view casinos’ OSQ negatively—thepositive versus negative turn by problem gamblersdepends upon specific demographic profiles.
Table 10 includes the negation of OSQ as the out-come condition, that is, �OSQ. The first model does notinclude PGSI or �PGSI; thus, the inclusion of a highscore in PGSI or its negation in a complex otherwisedemographic condition is not necessary in all cases forpredicting �OSQ.
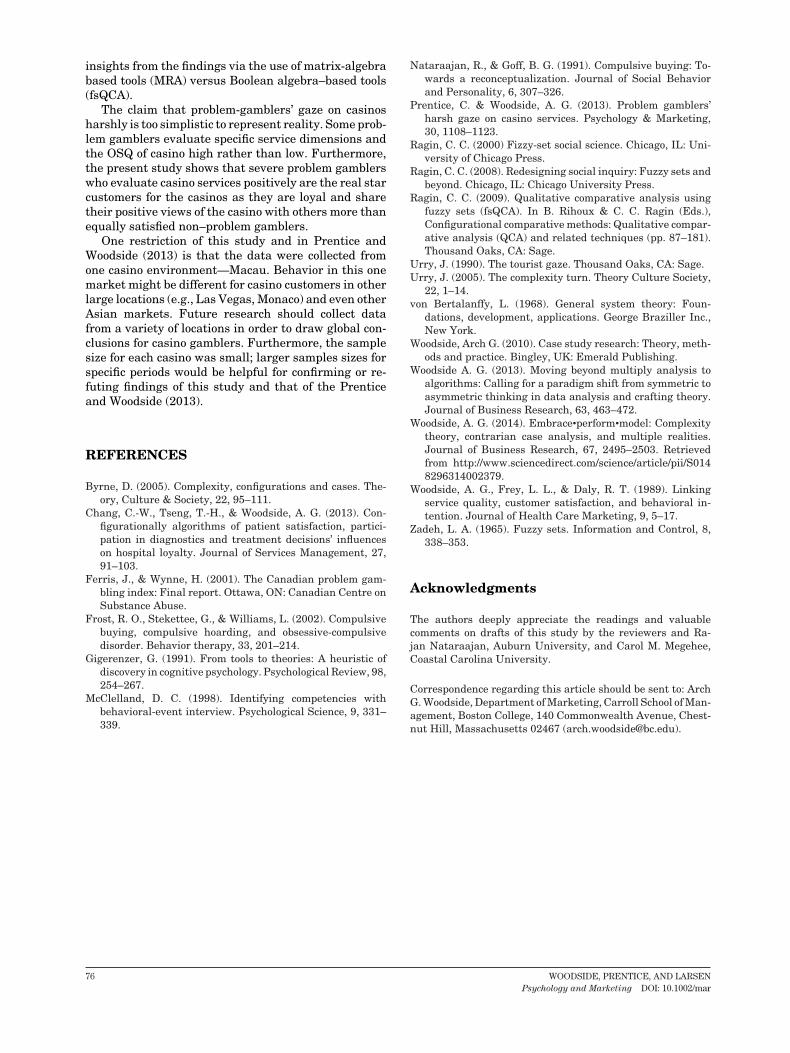
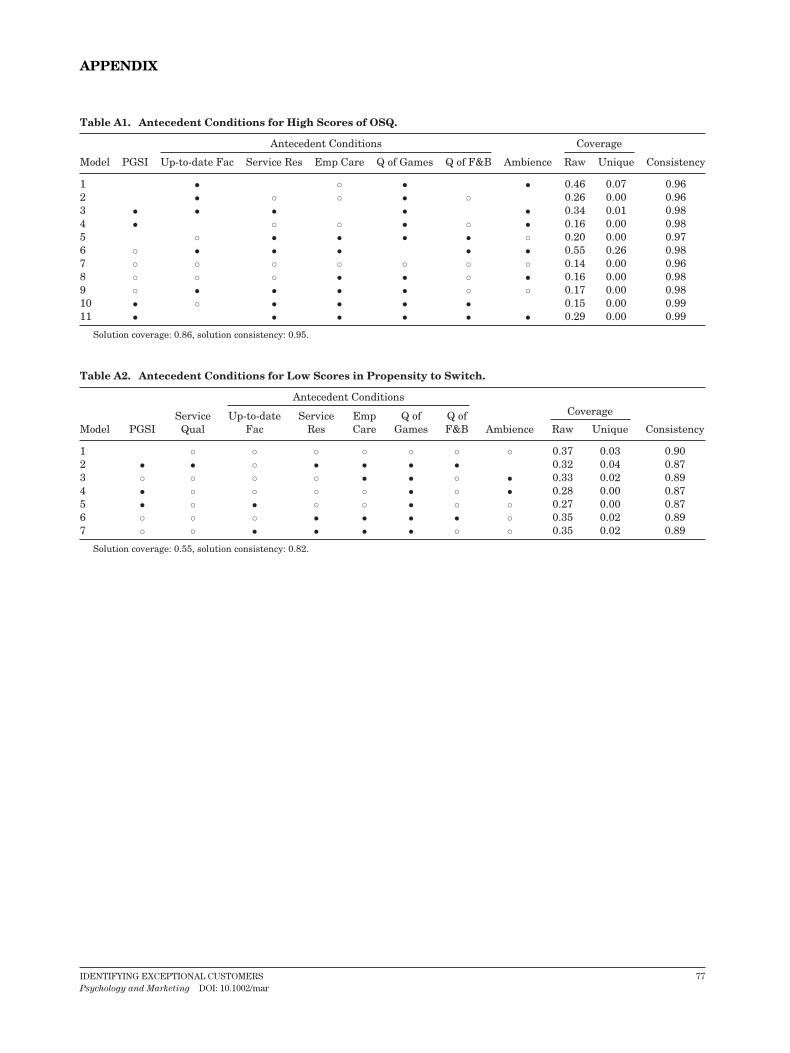
The additional seven models in Table 10 include ei-ther PGSI or �PGSI in the complex statements that in-clude demographic conditions. The models in Table 10are not the mirror opposite of any of the models in Ta-ble 9. These findings support the principle of causalasymmetry, that is, the negations of simple antecedentsin complex statements indicating high scores in an out-come condition are not going to be accurate in predict-ing low scores in the same outcome condition. Thus,the study of negative evaluations and customer loss isunique and worthy of separate attention from the studyof positive evaluations and customer gain. See Table A1for additional configurations for high OSQ evaluations.High problem gambling appears in several models that
74 WOODSIDE, PRENTICE, AND LARSENPsychology and Marketing DOI: 10.1002/mar
Table 7. Antecedent Conditions for High Scores in Casino First Choice.
Antecedent ConditionsCoverage
Model PGSIServiceQual
Up-to-dateFac
ServiceRes
EmpCare
Q ofGames
Q ofF&B Ambience Raw Unique Consistency
1 • • ◦ • • • • 0.17 0.06 0.912 ◦ ◦ ◦ ◦ • • ◦ • 0.17 0.01 0.913 ◦ ◦ ◦ • • • • ◦ 0.18 0.01 0.924 ◦ ◦ • • • • ◦ ◦ 0.19 0.02 0.91
Solution coverage: 0.27, solution consistency: 0.90.
Table 8. Antecedent Conditions for High Scores in Positive Word-of-mouth.
Antecedent ConditionsCoverage
Model PGSIServiceQual
Up-to-dateFac
ServiceRes
EmpCare
Q ofGames
Q ofF&B Ambience Raw Unique Consistency
1 • • ◦ • • • • 0.18 0.07 0.902 ◦ ◦ ◦ • • • • ◦ 0.19 0.01 0.923 ◦ ◦ • • • • ◦ ◦ 0.20 0.02 0.92
Solution coverage: 0.28, consistency: 0.91.
work in predicting high OSQ evaluations. The findingssupport the claim that depending on the configurations,problem gambling plays a part in several solutions lead-ing to high OSQ.
CONCLUSIONS, LIMITATIONS, ANDCONTRIBUTION TO THEORY
The present study shows the effectiveness of CCAusing configural causal recipes versus the use only ofconventional net-effects analysis via MRA or ANOVA.
The solutions of the present study offer nuancedcomplexity and depth in understanding the uniqueconfigural antecedent conditions of problem gamblers,service evaluations of the casinos, and how to achievedesired behavior from different types of customers. Thestudy offers additional information by comparing QCAto MRA as tools of analysis. The contribution here liesin examining the usefulness of modeling causal recipesand choosing appropriate tools for the analysis athand, which the scientists use to offer different resultsand conclusions as Gigerenzer (1991) proposes. Thisstudy focuses on the differences in the findings and in
Table 9. Complex Configurations with High Scores of Complex Antecedent Demographic Statements plus PGSIAssociating with High Scores for the Outcome Condition of OSQ.
Antecedent Conditions Coverage
Model PGSI Age Gender Education Income Occ Status Title Status Raw Unique Consistency
1 ◦ • ◦ ◦ ◦ • 0.16 0.10 0.762 • ◦ • ◦ ◦ • ◦ 0.14 0.06 0.813 ◦ ◦ ◦ • • • • 0.05 0.04 0.924 • ◦ • • • • • 0.08 0.02 0.84
Solution coverage: 0.295607, solution consistency: 0.82.
Table 10. Complex Configurations with High Scores of Complex Antecedent Demographic Statements plus PGSIAssociating with High Scores for the Outcome Condition of the Negation of OSQ.
Antecedent Conditions Coverage
Model PGSI Age Gender Education Income Occ Status Title Status Raw Unique Consistency
1 • ◦ ◦ • ◦ 0.27 0.05 0.872 ◦ ◦ • • ◦ • 0.13 0.03 0.843 ◦ • ◦ ◦ • • 0.09 0.02 0.794 • ◦ • • • • 0.15 0.03 0.865 • • • ◦ • 0.15 0.05 0.826 ◦ ◦ ◦ • • • • 0.04 0.01 0.857 ◦ • ◦ ◦ • • 0.17 −0.00 0.848 ◦ • • ◦ ◦ • 0.13 0.00 0.79
Solution coverage: 0.50, solution consistency: 0.83.
IDENTIFYING EXCEPTIONAL CUSTOMERS 75Psychology and Marketing DOI: 10.1002/mar
insights from the findings via the use of matrix-algebrabased tools (MRA) versus Boolean algebra–based tools(fsQCA).
The claim that problem-gamblers’ gaze on casinosharshly is too simplistic to represent reality. Some prob-lem gamblers evaluate specific service dimensions andthe OSQ of casino high rather than low. Furthermore,the present study shows that severe problem gamblerswho evaluate casino services positively are the real starcustomers for the casinos as they are loyal and sharetheir positive views of the casino with others more thanequally satisfied non–problem gamblers.
One restriction of this study and in Prentice andWoodside (2013) is that the data were collected fromone casino environment—Macau. Behavior in this onemarket might be different for casino customers in otherlarge locations (e.g., Las Vegas, Monaco) and even otherAsian markets. Future research should collect datafrom a variety of locations in order to draw global con-clusions for casino gamblers. Furthermore, the samplesize for each casino was small; larger samples sizes forspecific periods would be helpful for confirming or re-futing findings of this study and that of the Prenticeand Woodside (2013).
REFERENCES
Byrne, D. (2005). Complexity, configurations and cases. The-ory, Culture & Society, 22, 95–111.
Chang, C.-W., Tseng, T.-H., & Woodside, A. G. (2013). Con-figurationally algorithms of patient satisfaction, partici-pation in diagnostics and treatment decisions’ influenceson hospital loyalty. Journal of Services Management, 27,91–103.
Ferris, J., & Wynne, H. (2001). The Canadian problem gam-bling index: Final report. Ottawa, ON: Canadian Centre onSubstance Abuse.
Frost, R. O., Stekettee, G., & Williams, L. (2002). Compulsivebuying, compulsive hoarding, and obsessive-compulsivedisorder. Behavior therapy, 33, 201–214.
Gigerenzer, G. (1991). From tools to theories: A heuristic ofdiscovery in cognitive psychology. Psychological Review, 98,254–267.
McClelland, D. C. (1998). Identifying competencies withbehavioral-event interview. Psychological Science, 9, 331–339.
Nataraajan, R., & Goff, B. G. (1991). Compulsive buying: To-wards a reconceptualization. Journal of Social Behaviorand Personality, 6, 307–326.
Prentice, C. & Woodside, A. G. (2013). Problem gamblers’harsh gaze on casino services. Psychology & Marketing,30, 1108–1123.
Ragin, C. C. (2000) Fizzy-set social science. Chicago, IL: Uni-versity of Chicago Press.
Ragin, C. C. (2008). Redesigning social inquiry: Fuzzy sets andbeyond. Chicago, IL: Chicago University Press.
Ragin, C. C. (2009). Qualitative comparative analysis usingfuzzy sets (fsQCA). In B. Rihoux & C. C. Ragin (Eds.),Configurational comparative methods: Qualitative compar-ative analysis (QCA) and related techniques (pp. 87–181).Thousand Oaks, CA: Sage.
Urry, J. (1990). The tourist gaze. Thousand Oaks, CA: Sage.Urry, J. (2005). The complexity turn. Theory Culture Society,
22, 1–14.von Bertalanffy, L. (1968). General system theory: Foun-
dations, development, applications. George Braziller Inc.,New York.
Woodside, Arch G. (2010). Case study research: Theory, meth-ods and practice. Bingley, UK: Emerald Publishing.
Woodside A. G. (2013). Moving beyond multiply analysis toalgorithms: Calling for a paradigm shift from symmetric toasymmetric thinking in data analysis and crafting theory.Journal of Business Research, 63, 463–472.
Woodside, A. G. (2014). Embrace•perform•model: Complexitytheory, contrarian case analysis, and multiple realities.Journal of Business Research, 67, 2495–2503. Retrievedfrom http://www.sciencedirect.com/science/article/pii/S0148296314002379.
Woodside, A. G., Frey, L. L., & Daly, R. T. (1989). Linkingservice quality, customer satisfaction, and behavioral in-tention. Journal of Health Care Marketing, 9, 5–17.
Zadeh, L. A. (1965). Fuzzy sets. Information and Control, 8,338–353.
Acknowledgments
The authors deeply appreciate the readings and valuablecomments on drafts of this study by the reviewers and Ra-jan Nataraajan, Auburn University, and Carol M. Megehee,Coastal Carolina University.
Correspondence regarding this article should be sent to: ArchG. Woodside, Department of Marketing, Carroll School of Man-agement, Boston College, 140 Commonwealth Avenue, Chest-nut Hill, Massachusetts 02467 ([email protected]).
76 WOODSIDE, PRENTICE, AND LARSENPsychology and Marketing DOI: 10.1002/mar
APPENDIX
Table A1. Antecedent Conditions for High Scores of OSQ.
Antecedent Conditions Coverage
Model PGSI Up-to-date Fac Service Res Emp Care Q of Games Q of F&B Ambience Raw Unique Consistency
1 • ◦ • • 0.46 0.07 0.962 • ◦ ◦ • ◦ 0.26 0.00 0.963 • • • • • 0.34 0.01 0.984 • ◦ ◦ • ◦ • 0.16 0.00 0.985 ◦ • • • • ◦ 0.20 0.00 0.976 ◦ • • • • • 0.55 0.26 0.987 ◦ ◦ ◦ ◦ ◦ ◦ ◦ 0.14 0.00 0.968 ◦ ◦ ◦ • • ◦ • 0.16 0.00 0.989 ◦ • • • • ◦ ◦ 0.17 0.00 0.9810 • ◦ • • • • 0.15 0.00 0.9911 • • • • • • 0.29 0.00 0.99
Solution coverage: 0.86, solution consistency: 0.95.
Table A2. Antecedent Conditions for Low Scores in Propensity to Switch.
Antecedent ConditionsCoverage
Model PGSIServiceQual
Up-to-dateFac
ServiceRes
EmpCare
Q ofGames
Q ofF&B Ambience Raw Unique Consistency
1 ◦ ◦ ◦ ◦ ◦ ◦ ◦ 0.37 0.03 0.902 • • ◦ • • • • 0.32 0.04 0.873 ◦ ◦ ◦ ◦ • • ◦ • 0.33 0.02 0.894 • ◦ ◦ ◦ ◦ • ◦ • 0.28 0.00 0.875 • ◦ • ◦ ◦ • ◦ ◦ 0.27 0.00 0.876 ◦ ◦ ◦ • • • • ◦ 0.35 0.02 0.897 ◦ ◦ • • • • ◦ ◦ 0.35 0.02 0.89
Solution coverage: 0.55, solution consistency: 0.82.
IDENTIFYING EXCEPTIONAL CUSTOMERS 77Psychology and Marketing DOI: 10.1002/mar