Review of Vehicle Engine Efficiency and Emissions SAE 2018 ...
11
Emerging LD Engine Technologies Dr. Ameya Joshi Dr. Tim Johnson April 13, 2018 ARPA-E NEXTCAR 2018 Southfield, MI [email protected] [email protected]
-
Upload
khangminh22 -
Category
Documents
-
view
1 -
download
0
Transcript of Review of Vehicle Engine Efficiency and Emissions SAE 2018 ...
Emerging LD Engine Technologies
Dr. Ameya Joshi
Dr. Tim Johnson
April 13, 2018
ARPA-E NEXTCAR 2018
Southfield, MI
[email protected]@Corning.com
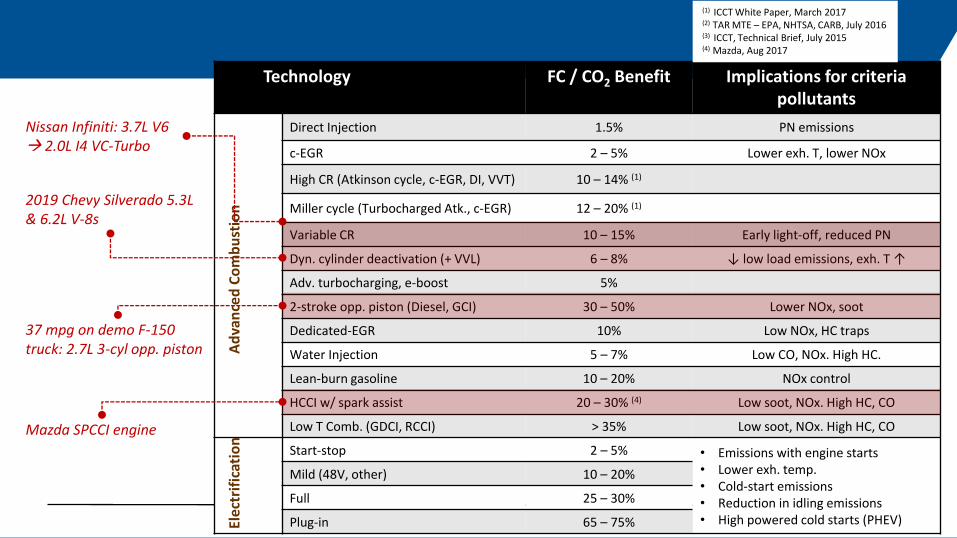
Technology FC / CO2 Benefit Implications for criteria pollutants
Direct Injection 1.5% PN emissions
c-EGR 2 – 5% Lower exh. T, lower NOx
High CR (Atkinson cycle, c-EGR, DI, VVT) 10 – 14% (1)
Miller cycle (Turbocharged Atk., c-EGR) 12 – 20% (1)
Variable CR 10 – 15% Early light-off, reduced PN
Dyn. cylinder deactivation (+ VVL) 6 – 8% ↓ low load emissions, exh. T ↑
Adv. turbocharging, e-boost 5%
2-stroke opp. piston (Diesel, GCI) 30 – 50% Lower NOx, soot
Dedicated-EGR 10% Low NOx, HC traps
Water Injection 5 – 7% Low CO, NOx. High HC.
Lean-burn gasoline 10 – 20% NOx control
HCCI w/ spark assist 20 – 30% (4) Low soot, NOx. High HC, CO
Low T Comb. (GDCI, RCCI) > 35% Low soot, NOx. High HC, CO
Start-stop 2 – 5% • Emissions with engine starts• Lower exh. temp.• Cold-start emissions• Reduction in idling emissions • High powered cold starts (PHEV)
Mild (48V, other) 10 – 20%
Full 25 – 30%
Plug-in 65 – 75%
(1) ICCT White Paper, March 2017(2) TAR MTE – EPA, NHTSA, CARB, July 2016(3) ICCT, Technical Brief, July 2015(4) Mazda, Aug 2017
Ad
van
ced
Co
mb
ust
ion
Elec
trif
icat
ion
2019 Chevy Silverado 5.3L & 6.2L V-8s
37 mpg on demo F-150 truck: 2.7L 3-cyl opp. piston
Mazda SPCCI engine
Nissan Infiniti: 3.7L V6 2.0L I4 VC-Turbo
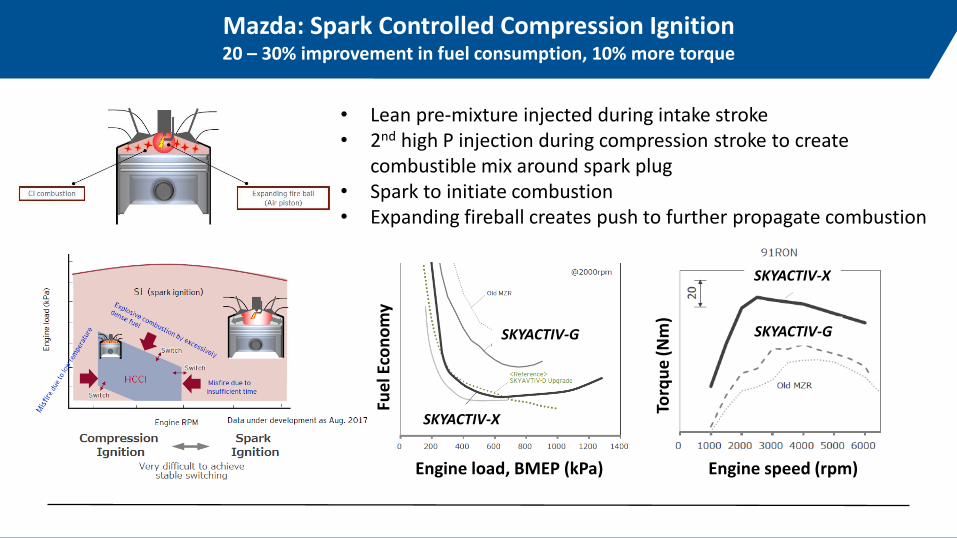
Mazda: Spark Controlled Compression Ignition20 – 30% improvement in fuel consumption, 10% more torque
• Lean pre-mixture injected during intake stroke• 2nd high P injection during compression stroke to create
combustible mix around spark plug• Spark to initiate combustion• Expanding fireball creates push to further propagate combustion
Fue
l Eco
no
my
Engine load, BMEP (kPa)
SKYACTIV-G
SKYACTIV-X
Torq
ue
(Nm
)
Engine speed (rpm)
SKYACTIV-G
SKYACTIV-X
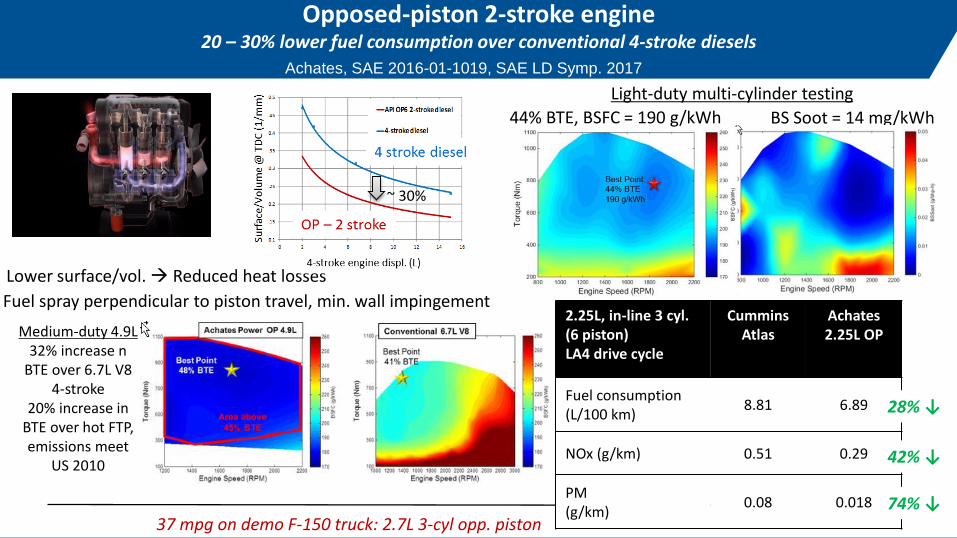
2.25L, in-line 3 cyl. (6 piston)LA4 drive cycle
Cummins Atlas
Achates 2.25L OP
Fuel consumption (L/100 km)
8.81 6.89
NOx (g/km) 0.51 0.29
PM (g/km)
0.08 0.018
28% ↓
42% ↓
74% ↓
Fuel spray perpendicular to piston travel, min. wall impingement
37 mpg on demo F-150 truck: 2.7L 3-cyl opp. piston
Lower surface/vol. Reduced heat losses
44% BTE, BSFC = 190 g/kWh BS Soot = 14 mg/kWh
Light-duty multi-cylinder testing
Opposed-piston 2-stroke engine20 – 30% lower fuel consumption over conventional 4-stroke diesels
Achates, SAE 2016-01-1019, SAE LD Symp. 2017
~ 30%
Medium-duty 4.9L 32% increase n
BTE over 6.7L V8 4-stroke
20% increase in BTE over hot FTP, emissions meet
US 2010
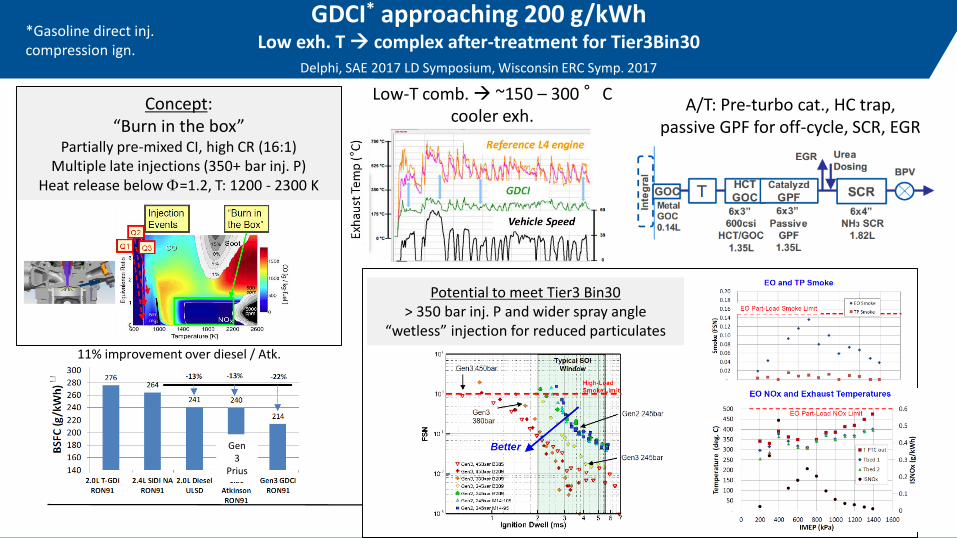
GDCI* approaching 200 g/kWhLow exh. T complex after-treatment for Tier3Bin30
Delphi, SAE 2017 LD Symposium, Wisconsin ERC Symp. 2017
*Gasoline direct inj. compression ign.
Low-T comb. ~150 – 300 °C cooler exh.
A/T: Pre-turbo cat., HC trap, passive GPF for off-cycle, SCR, EGR
Gen 3
Prius
11% improvement over diesel / Atk.
Potential to meet Tier3 Bin30> 350 bar inj. P and wider spray angle
“wetless” injection for reduced particulates
Concept: “Burn in the box”
Partially pre-mixed CI, high CR (16:1) Multiple late injections (350+ bar inj. P)
Heat release below F=1.2, T: 1200 - 2300 K
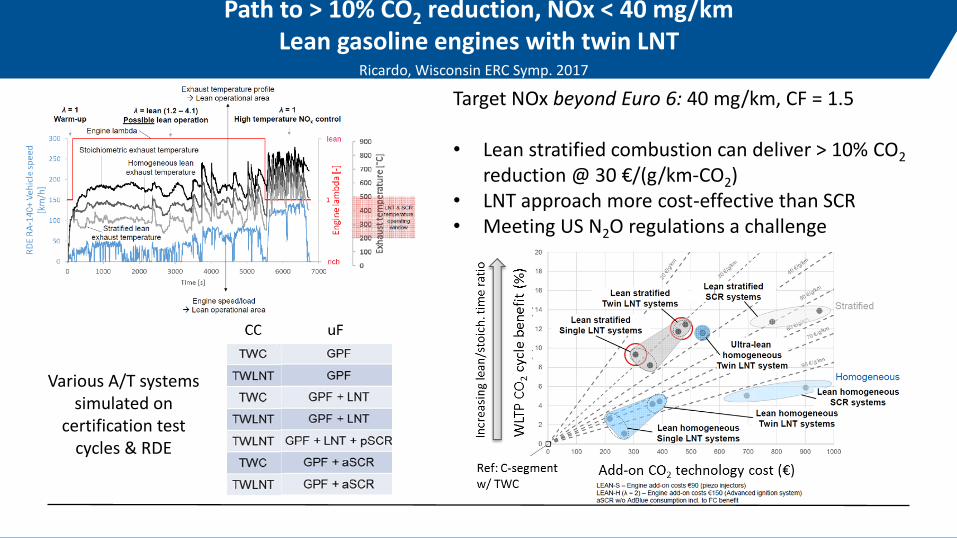
Path to > 10% CO2 reduction, NOx < 40 mg/kmLean gasoline engines with twin LNT
Ricardo, Wisconsin ERC Symp. 2017
Various A/T systems simulated on
certification test cycles & RDE
Target NOx beyond Euro 6: 40 mg/km, CF = 1.5
• Lean stratified combustion can deliver > 10% CO2
reduction @ 30 €/(g/km-CO2)• LNT approach more cost-effective than SCR• Meeting US N2O regulations a challenge
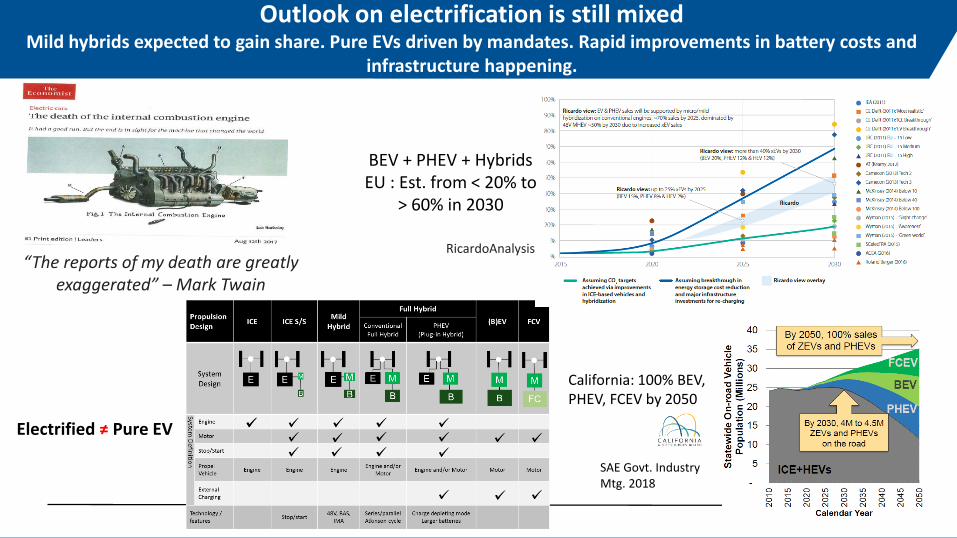
Outlook on electrification is still mixedMild hybrids expected to gain share. Pure EVs driven by mandates. Rapid improvements in battery costs and
infrastructure happening.
SAE Govt. Industry Mtg. 2018
California: 100% BEV, PHEV, FCEV by 2050
“The reports of my death are greatly exaggerated” – Mark Twain
BEV + PHEV + HybridsEU : Est. from < 20% to
> 60% in 2030
RicardoAnalysis
Electrified ≠ Pure EV

Electric Vehicle Perspectives
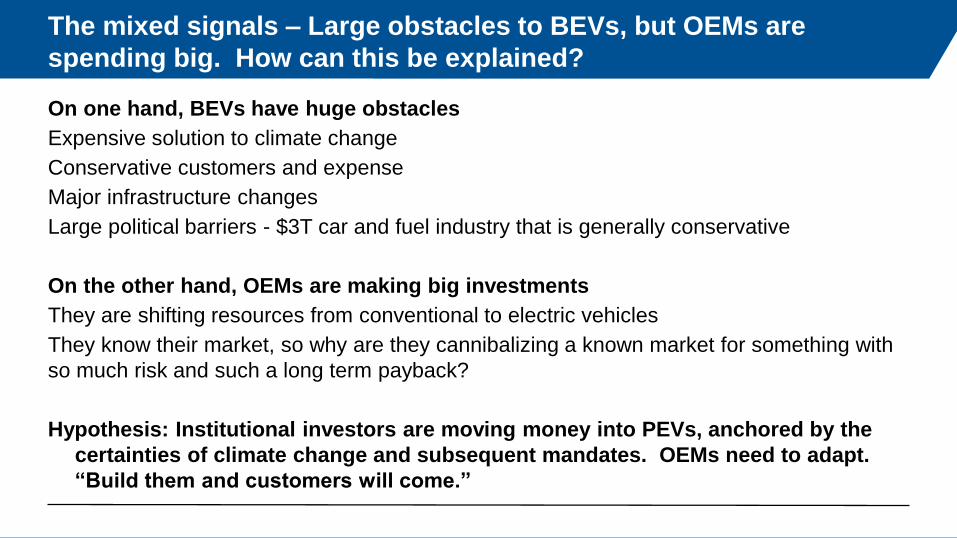
The mixed signals – Large obstacles to BEVs, but OEMs are
spending big. How can this be explained?
On one hand, BEVs have huge obstacles
Expensive solution to climate change
Conservative customers and expense
Major infrastructure changes
Large political barriers - $3T car and fuel industry that is generally conservative
On the other hand, OEMs are making big investments
They are shifting resources from conventional to electric vehicles
They know their market, so why are they cannibalizing a known market for something with
so much risk and such a long term payback?
Hypothesis: Institutional investors are moving money into PEVs, anchored by the
certainties of climate change and subsequent mandates. OEMs need to adapt.
“Build them and customers will come.”
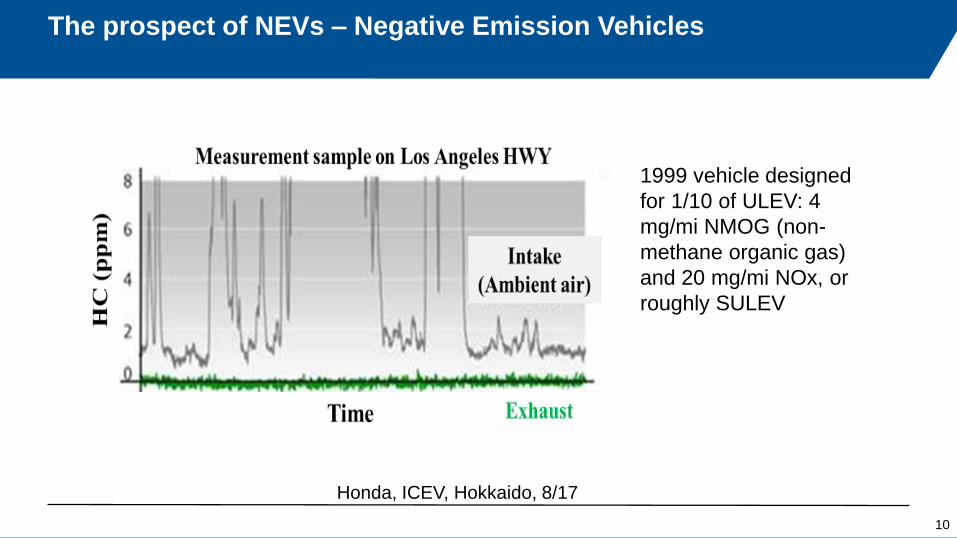
The prospect of NEVs – Negative Emission Vehicles
10
Honda, ICEV, Hokkaido, 8/17
1999 vehicle designed
for 1/10 of ULEV: 4
mg/mi NMOG (non-
methane organic gas)
and 20 mg/mi NOx, or
roughly SULEV
Review of Vehicle Engine Efficiency and EmissionsSAE 2018-01-0329
Thank you
Paper # (if applicable)11
Tim Johnson
Corning Incorporated
Corning, NY 14831
[email protected] (new)
Ameya Joshi
Corning Incorporated
Corning, NY 14831