REVIEW OF TRUCK SAFETY - STAGE 2: UPDATE OF CRASH STATISTICS
66
REVIEW OF TRUCK SAFETY – STAGE 2: UPDATE OF CRASH STATISTICS by Narelle Haworth Mark Symmons October, 2003 Report No. 205 ACCIDENT RESEARCH CENTRE
Transcript of REVIEW OF TRUCK SAFETY - STAGE 2: UPDATE OF CRASH STATISTICS

REVIEW OF TRUCK SAFETY – STAGE 2: UPDATE OF CRASH STATISTICS
by
Narelle Haworth Mark Symmons
October, 2003
Report No. 205
ACCIDENT RESEARCH CENTRE

ii MONASH UNIVERSITY ACCIDENT RESEARCH CENTRE

REVIEW OF TRUCK SAFETY - STAGE 2: UPDATE OF CRASH STATISTICS iii
MONASH UNIVERSITY ACCIDENT RESEARCH CENTRE REPORT DOCUMENTATION PAGE
Report No. Date ISBN Pages
205 October 2003 0 7326 1714 6 55 Title and sub-title: Review of truck safety – Stage 2: Update of crash statistics Author(s): Haworth, N. and Symmons, M. Sponsoring Organisation(s): VicRoads Abstract: This report presents an updated statistical profile of the characteristics of heavy vehicle crashes in Victoria to provide a basis for estimating benefit:cost ratios (BCRs) for underrun protection.
Significant limitations exist in the availability, scope and timeliness of truck crash data, particularly for rigid trucks. Comparisons between truck crashes in Victoria and nationally showed that the number of fatal crashes appears to have increased Australia-wide and in Victoria since 1997. Fatality rates for articulated and rigid trucks (both in terms of registered vehicles and in terms of distance travelled) are lower in Victoria than Australia-wide. Australia-wide and in Victoria, fatality rates are higher for articulated than rigid trucks. Otherwise, the characteristics of fatal truck crashes in Victoria and the rest of Australia are generally similar.
From 1996-2000 in Victoria, about 40% of truck casualty crashes involved articulated trucks and 60% involved rigid trucks. Articulated truck crashes were more severe overall, and for truck occupants in particular. Car occupants were the largest group among those killed (64%) with 16% of those killed being truck occupants. Only 20% of crashes occurred at night but these crashes were generally more severe than daytime crashes. About three-quarters of the crashes occurred in metropolitan areas, although the proportion was lower for articulated than rigid truck crashes. The proportion of crashes resulting in death or serious injury increased with speed zone. For both articulated and rigid trucks, the largest number of fatal crashes involved vehicles travelling in opposing directions – ‘head-on’ crashes. Same direction crashes were the most common type of serious injury and other injury crash for both articulated and rigid trucks.
For all of the underrun protection measures included, the BCRs were higher for articulated trucks than rigid trucks. A package of front, side and rear underrun had a BCR of greater than 1 for both articulated trucks and rigid trucks, whether a 17- or 25- year lifetime is assumed. Not surprisingly, the BCR was doubled if the package cost $500, compared to if the package cost $1,000. The BCRs also exceeded 1 for each type of underrun protection – front (at a cost of either $100 or $200), side or rear – for both articulated trucks and rigid trucks; again regardless of the lifetime. The BCRs were considerably larger for front underrun protection than for side underrun protection, with the lowest BCRs found for rear underrun protection.
Key Words: Disclaimer Safety, accident, injury, heavy vehicle, design, vehicle occupants, under-ride protection
The views expressed are those of the authors, and not necessarily those of Monash University, VicRoads, or of the aforementioned organisations or people
Reproduction of this page is authorised Monash University Accident Research Centre,
Wellington Road, Clayton, Victoria, 3800, Australia. Telephone: +61 3 9905 4371, Fax: +61 3 9905 4363

iv MONASH UNIVERSITY ACCIDENT RESEARCH CENTRE
Preface
Project Manager / Team Leader:
George Rechnitzer
Research Team:
• Narelle Haworth
• Mark Symmons
• John Lambert

REVIEW OF TRUCK SAFETY - STAGE 2: UPDATE OF CRASH STATISTICS v
Contents
EXECUTIVE SUMMARY........................................................................................................ IX
1. INTRODUCTION ...............................................................................................................1 1.1 BACKGROUND ......................................................................................................................1 1.2 AIM OF THE PROJECT..........................................................................................................1 1.3 PROJECT TASKS....................................................................................................................1
2. DATA SOURCES AND ISSUES .......................................................................................3 2.1 CRASH DATA.........................................................................................................................3
2.1.1 State crash databases ......................................................................................................3 2.1.2 The ATSB Monthly Fatality Crash Database.................................................................4 2.1.3 The ATSB Fatality File ..................................................................................................4
2.2 EXPOSURE DATA..................................................................................................................4 2.3 SPECIAL REPORTS................................................................................................................4
3. NATIONAL COMPARISONS ............................................................................................7 3.1 GENERAL TRENDS ...............................................................................................................7
3.1.1 Crash rates ......................................................................................................................7 3.2 CRASH CHARACTERISTICS................................................................................................9
4. ANALYSES OF VICTORIAN DATA ...............................................................................11 4.1 GENERAL TRENDS .............................................................................................................11 4.2 CRASH CHARACTERISTICS..............................................................................................12
4.2.1 Severity.........................................................................................................................12 4.2.2 Time of day...................................................................................................................13 4.2.3 Location........................................................................................................................13 4.2.4 Speed zone....................................................................................................................13 4.2.5 Intersection vs. midblock crashes.................................................................................16 4.2.6 Crash type.....................................................................................................................17 4.2.7 Type of traffic control ..................................................................................................20
4.3 ROAD USERS INVOLVED..................................................................................................22 4.3.1 Metropolitan vs. rural areas ..........................................................................................27 4.3.2 Type of vehicle and road user.......................................................................................28 4.3.3 Crash type.....................................................................................................................28 4.3.4 The truck drivers...........................................................................................................31
5. POTENTIAL BENEFITS OF UNDERRUN PROTECTION .............................................35 5.1 IDENTIFICATION OF POTENTIAL UNDERRUN CRASHES IN VICTORIAN DATA .35
5.1.1 Identifying crashes that could be influenced by front underrun protection..................36 5.1.2 Identifying crashes that could be influenced by side underrun protection ...................39 5.1.3 Identifying crashes that could be influenced by rear underrun protection ...................39 5.1.4 Summary ......................................................................................................................40
5.2 ESTIMATE OF NUMBER OF UNDERRUN CRASHES AUSTRALIA-WIDE.................43 5.3 COST OF UNDERRUN CRASHES......................................................................................44 5.4 EFFECTIVENESS OF UNDERRUN PROTECTION DEVICES.........................................45 5.5 ESTIMATED BENEFITS OF UNDERRUN PROTECTION DEVICES .............................46

vi MONASH UNIVERSITY ACCIDENT RESEARCH CENTRE
5.6 COST OF UNDERRUN PROTECTION DEVICES .............................................................47 5.7 CALCULATION OF ESTIMATED BENEFIT:COST RATIOS ..........................................47
6. SUMMARY AND CONCLUSIONS .................................................................................49 6.1 NATIONAL COMPARISONS ..............................................................................................49 6.2 TRUCK CRASHES IN VICTORIA 1996-2000 ....................................................................49 6.3 POTENTIAL BENEFITS OF UNDERRUN PROTECTION................................................51
REFERENCES.......................................................................................................................53
APPENDIX 1: CALCULATIONS OF BENEFIT:COST RATIOS ..........................................55
Figures FIGURE 1. THE NUMBER OF FATAL ARTICULATED VEHICLE CRASHES AND THE NUMBER OF PERSONS KILLED IN
VICTORIA AND AUSTRALIA SINCE 1990. FROM ATSB.........................................................................7 FIGURE 2. YEARLY TREND OF THE NUMBER OF TRUCK-INVOLVED CRASHES IN VICTORIA...................................11 FIGURE 3. DISTRIBUTION OF CRASH SEVERITY FOR DAYTIME AND NIGHT-TIME CRASHES....................................14 FIGURE 4. CRASH SEVERITY AS A FUNCTION OF SPEED ZONE. ..............................................................................16 FIGURE 5. YEARLY TREND OF FATALITIES. ..........................................................................................................26 FIGURE 6. YEARLY TREND OF SERIOUS INJURIES. ................................................................................................26 FIGURE 7. YEARLY TREND OF OTHER INJURIES ....................................................................................................27
Tables TABLE 1. NUMBER OF FATAL TRUCK CRASHES IN AUSTRALIA AND VICTORIA IN 1992, 1994 AND 1996.
SOURCE: ATSB FATALITY FILE...........................................................................................................8 TABLE 2. NUMBER OF FATAL CRASHES INVOLVING ARTICULATED AND RIGID TRUCKS IN AUSTRALIA AND
VICTORIA IN 1992, 1994 AND 1996. SOURCE: ATSB FATALITY FILE. ...............................................8 TABLE 3. FATALITY RATES DERIVED FROM 1996 FATAL CRASH DATA AND THE 1995 ABS SURVEY OF
MOTOR VEHICLE USE. ..........................................................................................................................8 TABLE 4. FATAL CRASH RATES FOR ARTICULATED AND RIGID TRUCKS IN VICTORIA AND AUSTRALIA IN
1997......................................................................................................................................................9 TABLE 5. SUMMARY OF CHARACTERISTICS OF FATAL TRUCK CRASHES IN AUSTRALIA AND VICTORIA IN
1992, 1994 AND 1996. SOURCE: ATSB FATALITY FILE. ..................................................................10 TABLE 6. NUMBER OF TRUCK CRASHES IN VICTORIA. ........................................................................................11 TABLE 7. THE NUMBER OF CRASHES IN VICTORIA AT EACH LEVEL OF SEVERITY................................................12 TABLE 8. CRASH SEVERITY AS A PERCENTAGE OF TOTAL CRASHES. ...................................................................13 TABLE 9. TRUCK CRASHES BY TIME OF DAY. ......................................................................................................14 TABLE 10. TRUCK CRASHES AS A FUNCTION OF METROPOLITAN/RURAL AREA AND CRASH SEVERITY..................15 TABLE 11. TRUCK CRASHES ACCORDING TO SPEED ZONE. ....................................................................................15 TABLE 12. TRUCK CRASHES BY SEVERITY AND LOCATION – INTERSECTION/MIDBLOCK AND METRO/RURAL. ......17 TABLE 13. ARTICULATED TRUCK CRASHES BY SEVERITY AND CRASH CATEGORY (DCA CODE). .........................18 TABLE 14. RIGID CRASHES BY SEVERITY AND CRASH CATEGORY (DCA CODE). ..................................................19 TABLE 15. ALL TRUCK CRASHES BY SEVERITY AND CRASH CATEGORY (DCA CODE). .........................................19 TABLE 16. METRO/RURAL CRASHES ACCORDING TO PRESENCE OF A TRAFFIC CONTROL DEVICE..........................20 TABLE 17. TRUCK CRASHES FOR URBAN AND METROPOLITAN AREAS ACCORDING TO TYPE OF TRAFFIC
CONTROL PRESENT. .............................................................................................................................21 TABLE 18. ARTICULATED TRUCK CRASHES BY CRASH CATEGORY (DCA) AND TYPE OF TRAFFIC CONTROL AND
METROPOLITAN/RURAL LOCATION. .....................................................................................................22 TABLE 19. RIGID CRASHES BY CRASH CATEGORY (DCA) AND TYPE OF TRAFFIC CONTROL AND
METROPOLITAN/RURAL LOCATION. .....................................................................................................23 TABLE 20. TRUCK CRASHES BY CRASH CATEGORY (DCA) AND TYPE OF TRAFFIC CONTROL AND
METROPOLITAN/RURAL LOCATION. .....................................................................................................24 TABLE 21. NUMBER OF PERSONS INJURED AT EACH LEVEL OF INJURY SEVERITY..................................................25
REVIEW OF TRUCK SAFETY - STAGE 2: UPDATE OF CRASH STATISTICS vii
TABLE 22. THE NUMBER OF PERSONS INJURED IN TRUCK CRASHES IN VICTORIA AT EACH LEVEL OF SEVERITY... 25 TABLE 23. PERSONS INJURED IN TRUCK CRASHES IN METROPOLITAN AND RURAL AREAS.................................... 27 TABLE 24. INJURIES AS A FUNCTION OF TYPE OF OTHER VEHICLE INVOLVED IN CRASH. ...................................... 29 TABLE 25. PERSONS INJURED IN ARTICULATED TRUCK CRASHES AS A FUNCTION OF CRASH TYPE (DCA
CATEGORY). ....................................................................................................................................... 30 TABLE 26. PERSONS INJURED IN RIGID TRUCK CRASHES AS A FUNCTION OF CRASH TYPE (DCA CATEGORY). ..... 30 TABLE 27. PERSONS INJURED IN TRUCK CRASHES AS A FUNCTION OF CRASH TYPE (DCA CATEGORY). ............... 31 TABLE 28. AGE DISTRIBUTION OF CRASH-INVOLVED TRUCK DRIVERS. ................................................................ 32 TABLE 29. GENDER DISTRIBUTION OF CRASH-INVOLVED TRUCK DRIVERS........................................................... 32 TABLE 30. STATE OF LICENSING OF CRASH-INVOLVED TRUCK DRIVERS. ............................................................. 33 TABLE 31. STATE OF REGISTRATION OF CRASH-INVOLVED TRUCKS..................................................................... 33 TABLE 32. CRASHES POTENTIALLY ADDRESSED BY FRONT UNDERRUN PROTECTION – INVOLVING FRONT OF
THE TRUCK AND THE REAR OF A LIGHT VEHICLE AS IDENTIFIED BY DCA CODE.................................. 37 TABLE 33. CRASHES POTENTIALLY ADDRESSED BY FRONT UNDERRUN PROTECTION – CRASHES INVOLVING
THE FRONT OF THE TRUCK AND THE FRONT OF THE LIGHT VEHICLE AS IDENTIFIED BY DCA CODE..... 37 TABLE 34. CRASHES POTENTIALLY ADDRESSED BY FRONT UNDERRUN PROTECTION – INVOLVING FRONT OF
THE TRUCK AND THE SIDE OF THE LIGHT VEHICLE AS IDENTIFIED BY DCA CODE. .............................. 38 TABLE 35. CRASHES POTENTIALLY ADDRESSED BY FRONT UNDERRUN PROTECTION – INVOLVING FRONT OF
THE TRUCK AND THE SIDE OR REAR OF THE LIGHT VEHICLE AS IDENTIFIED BY DCA CODE................. 38 TABLE 36. CRASHES POTENTIALLY ADDRESSED BY SIDE UNDERRUN PROTECTION – INVOLVING THE SIDE OF
THE TRUCK AND THE FRONT OF THE LIGHT VEHICLE AS IDENTIFIED BY DCA CODE. ........................... 39 TABLE 37. CRASHES POTENTIALLY ADDRESSED BY REAR UNDERRUN PROTECTION – INVOLVING THE REAR OF
THE TRUCK AND THE FRONT OF THE LIGHT VEHICLE AS IDENTIFIED BY DCA CODE............................ 40 TABLE 38. TOTAL NUMBER OF POTENTIAL UNDERRUN CRASHES SUMMARISED BY CRASH TYPE (DCA CODE). ... 41 TABLE 39. NUMBER OF POTENTIAL UNDERRUN CRASHES SUMMARISED BY CRASH SCENARIO. ............................ 42 TABLE 40. NUMBER OF POTENTIAL UNDERRUN CRASHES. VICTORIA 1996-2000. ADJUSTED FOR DOUBLE
COUNTING. ......................................................................................................................................... 43 TABLE 41. ESTIMATE OF ANNUAL NUMBER OF POTENTIAL UNDERRUN CRASHES AS A FUNCTION OF INJURY
SEVERITY. AUSTRALIA. ...................................................................................................................... 44 TABLE 42. ESTIMATED ANNUAL COST ($000S) OF ESTIMATED NUMBER OF UNDERRUN CRASHES (NUMBER OF
POTENTIAL CRASHES DIVIDED BY 2) INVOLVING A LIGHTER VEHICLE IN AUSTRALIA. BASED ON ESTIMATES OF CRASHES AUSTRALIA-WIDE 1996-2000 AND BTE (2000) CRASH COSTS TIMES 1.5..... 45
TABLE 43. ESTIMATES FROM RECHNITZER (1993) TABLE 5.8. OF THE REDUCTIONS IN FATALITIES AND INJURY SEVERITY RESULTING FROM IMPROVED FRONTAL AND SIDE DESIGN OF TRUCKS................................. 46
TABLE 44. SUMMARY OF BENEFIT:COST RATIOS FOR A RANGE OF UNDERRUN PROTECTION MEASURES. ASSUMES DISCOUNT RATE OF 7% AND 15 YEAR LIFETIME. ................................................................ 48
TABLE 45. SUMMARY OF BENEFIT:COST RATIOS FOR A RANGE OF UNDERRUN PROTECTION MEASURES. ASSUMES DISCOUNT RATE OF 7% AND 25 YEAR LIFETIME. ................................................................ 48

viii MONASH UNIVERSITY ACCIDENT RESEARCH CENTRE

REVIEW OF TRUCK SAFETY - STAGE 2: UPDATE OF CRASH STATISTICS ix
EXECUTIVE SUMMARY
This report presents an updated statistical profile of the characteristics of heavy vehicle crashes in Victoria to provide a basis for estimating the benefits and costs of the recommended design improvements arising from the Stage 1 report on Underrun Protection.
National comparisons
Significant limitations exist in the availability, scope and timeliness of truck crash data, particularly for rigid trucks. Nevertheless, some comparisons between truck crashes in Victoria and nationally were undertaken. These analyses showed that
• Since 1997, the number of fatal crashes appears to have increased Australia-wide. In Victoria, the number of both rigid and articulated truck crashes has been steadily increasing between 1996 and 2000, with rigid truck crashes increasing at a slightly higher rate.
• In 1997, the fatality rates for articulated and rigid trucks (both in terms of registered vehicles and in terms of distance travelled) were lower in Victoria than for Australia as a whole. Otherwise, the characteristics of fatal truck crashes in Victoria and the rest of Australia in 1992, 1994 and 1996 are generally similar.
• Australia-wide and in Victoria, fatality rates (in terms of registered vehicles or distance travelled) are higher for articulated than rigid trucks.
Truck crashes in Victoria 1996-2000
From 1996-2000 there were 5,622 reported truck crashes in Victoria, of which 282 were fatal, 1656 resulted in serious injury and 3,684 resulted in other injury. About 40% of these crashes involved articulated trucks and 60% involved rigid trucks. A higher proportion of articulated truck crashes resulted in fatalities compared with rigid truck crashes.
Overall, 316 people were killed, 2,077 were seriously injured and 5,342 sustained some other injury in truck crashes in Victoria in 1996-2000. Of those killed, 177 were involved in articulated truck crashes and 147 were involved in rigid truck crashes. Car occupants were the largest group among those killed (64%), followed by truck occupants (16%), pedestrians (9%), motorcyclists (6%) and bicyclists (4%). At lower levels of severity, the representation of truck occupants increased and the representation of other road users decreased. Articulated truck crashes were almost twice as likely to result in death or serious injury to the truck occupant than rigid truck crashes.
About 80% of the crashes occurred during daylight hours but night-time crashes were generally more severe than daytime crashes. About three-quarters of the crashes occurred in metropolitan areas, although the proportion was lower for articulated than rigid truck crashes. The proportion of crashes resulting in death or serious injury increased with speed zone.
For both articulated and rigid trucks, the largest number of fatal crashes involved a collision between vehicles travelling in opposing directions – ‘head-on’ crashes. Same

x MONASH UNIVERSITY ACCIDENT RESEARCH CENTRE
direction crashes were the most common type of serious injury and other injury crash for both articulated and rigid trucks.
Potential benefits of underrun protection
The Victorian road crash database does not allow crashes in which underrun occurred to be clearly identified. Crash types that could potentially result in underrun were identified using the Definitions for Coding Accidents (DCA) system, which provides a numerically coded description of the crash. During the period 1996-2000 inclusive, a total of 3,488 separate crashes were identified, where the crash could have involved underrun. In calculating benefit:cost ratios (BCRs), it was assumed that half of these crashes actually involved underrun.
The three most common types of crashes involved rigid trucks – a rigid truck hitting the rear of a lighter vehicle, followed by a lighter vehicle striking the side of a rigid truck and then a rigid truck running into the side of a lighter vehicle. The fourth, fifth and sixth most common types of crashes involved articulated trucks and followed a different pattern – an articulated truck hitting the rear of a light vehicle, followed by an articulated truck running into the side of a lighter vehicle, and then a lighter vehicle striking the side of an articulated truck.
Fatalities were most likely to occur in crashes involving the front of a truck. However, light vehicles running into the side of rigid trucks produced the highest number of serious injury crashes, followed by rigid trucks running into the side of lighter vehicles and then rigid trucks hitting the rear of lighter vehicles.
The analysis presented here assumed that front and side underrun protection will have the same level of effectiveness, changing 15% of fatal crashes to serious injury crashes and 30% of serious injury crashes to other injury crashes. It was assumed that rear underrun protection will change 30% of fatal crashes to serious injury crashes and 30% of serious injury crashes to other crashes.
For all of the underrun protection measures included, the BCRs were higher for articulated trucks than rigid trucks. The BCRs were higher when a 15-year lifetime was assumed, than when a 25-year lifetime was assumed. A package of front, side and rear underrun had a BCR of greater than 1 for both articulated trucks and rigid trucks, whether a 17- or 25- year lifetime is assumed. Not surprisingly, the BCR was doubled if the package cost $500, compared to if the package cost $1,000.
The BCRs also exceeded 1 for each type of underrun protection – front (at a cost of either $100 or $200), side or rear – for both articulated trucks and rigid trucks; again regardless of the lifetime. The BCRs were considerably larger for front underrun protection than for side underrun protection, with the lowest BCRs found for rear underrun protection.
REVIEW OF TRUCK SAFETY - STAGE 2: UPDATE OF CRASH STATISTICS 1
1. INTRODUCTION
1.1 BACKGROUND
Heavy vehicles (GVM>3.5t) are involved in approximately 15% of serious injury and fatal crashes in Australia. Studies both in Australia and internationally have identified that there is a significantly increased injury risk to other road users where crashes involve heavy vehicles. In these crashes, some 80% of injuries are to the other road users.
Various studies have identified that a major contributing factor to injury risk in crashes involving heavy vehicles is the lack of compatibility with other road users. Various improvements to heavy vehicle design have been identified, including the provision of front, side and rear underrun protection. The need for improved crashworthiness of the cabin of heavy vehicles for increased driver protection in crashes has also been identified.
In addition to improvements in vehicle crashworthy design to reduce crash injury risk, crash prevention measures have also been identified in various studies. These include attention to the handling characteristics of heavy vehicles and attention to road design and infrastructure as they relate to heavy vehicle needs.
Although significant effort has gone into implementing improvements to the design of passenger vehicles, there are still considerable opportunities available to improve the safety of heavy vehicles and hence reduce their contribution to road trauma.
1.2 AIM OF THE PROJECT
The aim of the project is to produce an updated statistical profile of the characteristics of heavy vehicle crashes in Victoria and use this as a basis for estimating the benefits and costs of the recommended design improvements arising from the Stage 1 report on Underrun Protection.
1.3 PROJECT TASKS
The project task is to analyse available mass crash data to provide a profile of the characteristics of truck crashes in Victoria. From this analysis, the potential benefits of prevention of underrun crashes will be estimated.

2 MONASH UNIVERSITY ACCIDENT RESEARCH CENTRE

REVIEW OF TRUCK SAFETY - STAGE 2: UPDATE OF CRASH STATISTICS 3
2. DATA SOURCES AND ISSUES
2.1 CRASH DATA
In general terms, there are three types of data collections relating to truck crashes:
• state crash databases
• the Australian Transport Safety Bureau (ATSB) Monthly Fatality Crash Database
• the ATSB Fatality File
The scope and timeliness of these data collections differ as described below.
2.1.1 State crash databases
Each State and Territory maintains a database of information about road crashes occurring within their jurisdiction (including but not limited to those crashes involving trucks). The databases are compiled from Police report forms with some enhancement by the State road authority. The categories of crashes covered by the crash databases differ. All of the databases include crashes resulting in injury but some jurisdictions do not include non-injury crashes (e.g. Victoria). Other jurisdictions include non-injury crashes where the extent of property damage is above a certain threshold or a vehicle needs to be towed away. There is some concern about underreporting of minor crashes but this is less of an issue for truck crashes because injury is likely to occur or property damage is likely to be extensive.
Crash data in Victoria Victoria Police collect data on each road crash in Victoria where they are notified of the incident. This includes instances where the Police attend the scene of the crash as well as cases where the crash is reported at a police station after the fact. In either case, the officer(s) dealing with the crash records a number of details regarding the incident, including information relating to the vehicles and to the individuals involved. VicRoads maintains a database of this information (termed “crash database” from here on) that includes only those crashes where an injury has occurred.
The analyses described in Section 4 of this report are based on the Victoria crash database for the period 1996-2000, inclusive. The database used is a recent and updated version (September 2001), where a number of previous anomalies have been rectified. Only crashes involving trucks are included – both rigid trucks and articulated trucks (semi truck-trailer combinations). Each crash may involve non-truck entities as well, such as cars or pedestrians.
Each database crash record is based on an individual person involved in the crash and provides information regarding injuries to individuals, damage to vehicles, the circumstances of the crash and the road environment. Each crash has a unique crash number and all parties involved in that crash share that number. Each record also lists up to four other parties involved in the crash and denotes the most severe level of injury that occurred in the crash. As such, each crash is adequately described by the record of just one party that was involved (with the caveat that if more than five trucks were involved in a

4 MONASH UNIVERSITY ACCIDENT RESEARCH CENTRE
single crash then there is a possibility that not all trucks in that particular crash will be included).
The crash-based analysis described in Section 4 is based on a single crash record for each crash – there were 5,622 crashes in Victoria that involved trucks in the period 1996-2000 inclusive. The person-based analysis takes account of all records – there were 15,913 parties involved in crashes that involved at least one truck over the same period. The underrun analysis is based on the crash-based record. In all analyses rigid trucks and articulated trucks are considered separately, along with all trucks (the combination of these categories).
It should be noted that the definitions for a rigid truck and an articulated truck as recorded in the database have been coded subjectively by the police officers attending the scene. There is no mass criterion that separates a truck from a utility or four-wheel drive with a tray. It is essentially the police officer’s decision at the scene as to how the vehicle should be recorded.
2.1.2 The ATSB Monthly Fatality Crash Database
The Australian Transport Safety Bureau maintains a Monthly Fatality Crash Database which includes basic information on fatal crashes involving articulated trucks (not rigid trucks). The data items include: date of crash, speed zone, type of crash (single truck, pedestrian, multiple vehicle), State or Territory the crash occurred in and day or night.
2.1.3 The ATSB Fatality File
The ATSB Fatality File combines information from crash databases and coronial records for all fatal crashes (including those involving trucks). It is available for a range of years (e.g. 1992, 1994, 1996, 1997) but is generally not available for several years after the occurrence of the crash. Thus, it is a source of detailed but not timely data on a relatively small sample of crashes.
2.2 EXPOSURE DATA
Exposure data describe the amount and type of use of vehicles. Thus, they provide denominator data in the calculation of crash rates. The most commonly used data source for truck exposure is the Australian Bureau of Statistic’s Survey of Motor Vehicle Use (SMVU). The SMVU provides information on the number of articulated and rigid trucks (and other vehicles) registered in each State and Territory and how far they have travelled in the 12 months of the survey period. The SMVU is now available annually and so is about as timely as the crash data.
There are several drawbacks to using the SMVU, however. Firstly, the method used in the Survey changed after 1995. Thus, estimates before and after 1995 are not strictly comparable. Secondly, the distance travelled data relate to distances travelled by trucks according to where they are registered. The generally available data do not provide information on how much travel occurs in each State (which is needed for crash rates).
2.3 SPECIAL REPORTS
A number of special reports have been published that provide information about truck crashes. The most recent is:

REVIEW OF TRUCK SAFETY - STAGE 2: UPDATE OF CRASH STATISTICS 5
ATSB. (2001). Articulated truck crashes. Monograph 8. Canberra: Australian Transport Safety Bureau.

6 MONASH UNIVERSITY ACCIDENT RESEARCH CENTRE

REVIEW OF TRUCK SAFETY - STAGE 2: UPDATE OF CRASH STATISTICS 7
3. NATIONAL COMPARISONS
3.1 GENERAL TRENDS
The number of fatal articulated vehicle crashes and the number of persons killed in Victoria and Australia since 1990 is shown in Figure 1. There was a reduction from 1990 to 1991. From 1991 to 1997, the number of articulated vehicle crashes was reasonably constant. Since 1997, the number of crashes appears to have increased Australia-wide but this trend is not as evident in Victoria.
0
50
100
150
200
250
300
1990 1991 1992 1993 1994 1995 1996 1997 1998 1999 2000
Num
ber o
f fat
al c
rash
es o
r fat
aliti
es
Vic fatalitiesAustralia fatalitiesVic crashesAustralia crashes
Figure 1. The number of fatal articulated vehicle crashes and the number of persons killed in Victoria and Australia since 1990. From ATSB.
In 1992, 1994 and 1996 there was a total of 780 fatal truck crashes in Australia. Of these crashes, 146 (18.7%) occurred in Victoria (see Table 1). During this period, 19.9% of the fatal articulated truck crashes and 17.2% of the fatal rigid truck crashes occurred in Victoria (see Table 2).
3.1.1 Crash rates
Australia-wide data show that fatality rates are higher for articulated than rigid trucks regardless of whether registered vehicles or distance travelled is used as the denominator (Table 3).
Crash rates as a function of distance travelled for particular jurisdictions are available only for those years for which information is available about travel in particular jurisdictions. Table 4 shows that in 1997, the number of fatal articulated truck crashes per 100 million vehicle kilometres travelled was 2.66 for Australia as a whole and 2.08 in Victoria. The number of persons killed in articulated truck crashes per 100 million vehicle kilometres

8 MONASH UNIVERSITY ACCIDENT RESEARCH CENTRE
travelled was 3.12 for Australia as a whole and 2.16 in Victoria. The number of persons killed in rigid truck crashes per 100 million vehicle kilometres travelled was also higher Australia-wide than in Victoria. The fatality rates in terms of registered trucks showed the same pattern.
Table 1. Number of fatal truck crashes in Australia and Victoria in 1992, 1994 and 1996. Source: ATSB Fatality File.
Year Victoria Other States and Territories
Australia
1992 50 (18.5%) 220 (81.5%) 270 (100%)
1994 50 (18.9%) 215 (81.1%) 265 (100%)
1996 46 (18.8%) 199 (81.2%) 245 (100%)
Total 146 (18.7%) 634 (81.3%) 780 (100%)
Table 2. Number of fatal crashes involving articulated and rigid trucks in Australia and Victoria in 1992, 1994 and 1996. Source: ATSB Fatality File.
Fatal crashes involving
Victoria Other States and Territories
Australia
Articulated trucks 93 (19.9%) 375 (80.1%) 468 (100%)
Rigid trucks 56 (17.2%) 270 (82.8%) 326 (100%)
Table 3. Fatality rates derived from 1996 fatal crash data and the 1995 ABS Survey of Motor Vehicle Use.
Measure Articulated trucks
Rigid trucks
Total
Fatal crashes 154 95 245 Fatalities 188 110 294 Fatal crashes per 10,000 vehicles
26.58 2.83 6.23
Fatalities per 10,000 vehicles
32.45 3.28 7.47
Fatal crashes per 100 million kms travelled
3.02 1.41 2.07
Fatalities per 100 million kms travelled
3.69 1.64 2.49

REVIEW OF TRUCK SAFETY - STAGE 2: UPDATE OF CRASH STATISTICS 9
Table 4. Fatal crash rates for articulated and rigid trucks in Victoria and Australia in 1997.
Articulated trucks Rigid trucks
Australia Victoria Australia Victoria
Number of fatal crashes 146 26 n.a. 25 Number of fatalities 171 27 116 25 Number of trucks registered 58,794 16,946 335,430 82,674 Distance travelled (100 million km)
54.8 12.5 53.8 12.9
Fatal crashes per 10,000 registered trucks
24.8 15.3 - 3.0
Fatalities per 10,000 registered trucks
29.1 15.9 3.5 3.0
Fatal crashes per 100 million km 2.66 2.08 - 1.93 Fatalities per 100 million km 3.12 2.16 2.15 1.93
3.2 CRASH CHARACTERISTICS
Table 5 summarises the characteristics of the fatal truck crashes in Victoria and the rest of Australia in 1992, 1994 and 1996. Overall, 14% of fatal truck crashes involved a single truck only, 11.5% involved a truck and a pedestrian, and 74.5% were multiple-vehicle crashes. The patterns for Victoria and the rest of Australia did not differ significantly.
In Australia as a whole, 15% of fatal truck crashes occurred on divided roads, 67% on undivided roads and information was unknown for 18% of crashes. The patterns for Victoria and the rest of Australia did not differ significantly (see Table 5).
In Victoria, a larger proportion of fatal truck crashes occurred in the capital city and in rural areas and a smaller proportion occurred in other urban areas compared to other States and Territories.
In all jurisdictions, about two-thirds of fatal truck crashes occurred during daytime (6 am to 6 pm) and about one-third at night (6 pm to 6 am).

10 MONASH UNIVERSITY ACCIDENT RESEARCH CENTRE
Table 5. Summary of characteristics of fatal truck crashes in Australia and Victoria in 1992, 1994 and 1996. Source: ATSB Fatality File.
Characteristic Victoria Other States and Territories
Australia
Crash type
Single truck only 18 (12.3%) 91 (14.4%) 109 (14.0%)
Truck-pedestrian 15 (10.3%) 75 (11.8%) 90 (11.5%)
Multiple vehicle 113 (77.4%) 468 (73.8%) 581 (74.5%)
Road type
Divided 26 (17.8%) 90 (14.2%) 116 (14.9%)
Undivided 92 (63.0%) 434 (68.5%) 526 (67.4%)
Unknown 28 (19.2%) 110 (17.4%) 138 (17.7%)
Location
Capital city 48 (32.9%) 140 (22.1%) 188 (24.1%)
Other urban 14 (9.6%) 153 (24.1%) 167 (21.4%)
Rural 84 (57.5%) 324 (51.1%) 408 (52.3%)
Unknown 0 (0.0%) 17 (2.7%) 17 (2.2%)
Time of day
6 am – 6 pm 102 (69.9%) 411 (64.8%) 513 (65.8%)
6 pm – 6 am 44 (30.1%) 223 (35.2%) 267 (34.2%)

REVIEW OF TRUCK SAFETY - STAGE 2: UPDATE OF CRASH STATISTICS 11
4. ANALYSES OF VICTORIAN DATA
4.1 GENERAL TRENDS
This section of the report presents an analysis of the numbers and characteristics of truck-involved crashes in Victoria in the period 1996-2000. Table 6 and Figure 2 examine the yearly trend of truck-involved crashes. The statistics are divided into articulated trucks and rigid trucks. It should be noted that the total number of truck-involved crashes (“Truck” used in some tables in the report) does not necessarily equate to the simple addition of articulated-involved and rigid-involved collisions. For example, in 1996 there were 444 crashes reported to the police that involved an articulated truck, and 646 crashes that involved rigid trucks. However, overall there were 1,075 truck-involved crashes, rather than 1,090 crashes as would result from combining the two categories. This indicates that 15 crashes involved at least one articulated truck and at least one rigid truck.
Table 6. Number of truck crashes in Victoria. 1996 1997 1998 1999 2000 Total
Artic 444 429 462 504 450 2289
Rigid 646 702 672 709 715 3444
Truck 1075 1113 1108 1187 1139 5622
400
500
600
700
800
900
1000
1100
1200
1996 1997 1998 1999 2000
All trucksRigidArtic
Figure 2. Yearly trend of the number of truck-involved crashes in Victoria.
As demonstrated by the trend lines in Figure 2, the number of truck-involved crashes for both rigid and articulated trucks has been steadily increasing over time between 1996 and 2000, with rigid truck crashes increasing at a slightly higher rate.
Artic trend line
Truck trend line
Rigid trend line

12 MONASH UNIVERSITY ACCIDENT RESEARCH CENTRE
4.2 CRASH CHARACTERISTICS
4.2.1 Severity
Each crash record includes a classification of the overall severity of the crash. This variable can take the values of “Fatal”, “Serious injury” or “Other injury”, and indicates the most severe injury sustained in the crash. Hence, a crash recorded as “fatal” indicates that there was at least one fatality associated with the crash. It does not indicate the number of fatalities or the number and presence of serious injuries or other injuries.
The number of crashes at each level of severity is summarised in Table 7. Table 8 shows the number of crashes at each level of severity in both absolute and relative terms. Approximately two-thirds of truck-involved crashes resulted in an “other injury” as the most severe injury for the crash. Just under one-third of crashes for each truck category resulted in a “serious injury”, and less than 10% of crashes were classified as a fatality. A higher proportion of articulated truck crashes result in fatalities compared with rigid truck crashes – 7% versus 4% respectively.
Table 7. The number of crashes in Victoria at each level of severity. 1996 1997 1998 1999 2000
Fatal
Artic 33 26 30 35 32
Rigid 17 25 28 34 29
Truck 48 51 57 66 60
Serious injury
Artic 134 103 151 147 141
Rigid 179 202 211 215 212
Truck 308 299 355 349 345
Other injury
Artic 277 300 281 322 277
Rigid 450 475 433 460 474
Truck 719 763 696 772 734

REVIEW OF TRUCK SAFETY - STAGE 2: UPDATE OF CRASH STATISTICS 13
Table 8. Crash severity as a percentage of total crashes. Fatal Serious injury Other injury Total
No. % of total No. % of total No. % of total
Articulated 156 7% 676 30% 1457 64% 2289
Rigid 133 4% 1019 30% 2292 67% 3444
Truck 282 5% 1656 29% 3684 66% 5622
4.2.2 Time of day
Table 9 explores the influence of time of day on the number of truck crashes – divided into daylight hours (6am-6pm) versus hours of darkness (6pm-6am). Overall, 79% of truck crashes occurred during daylight hours (72% of articulated truck crashes and 85% of rigid truck crashes). For each truck type the number of each type of injury crash is substantially greater during daylight hours than during darkness. However, this may be an issue of exposure as well as risk – it is expected that there would be fewer trucks travelling during darkness compared to daylight hours.
Figure 3 shows that night-time crashes were generally more severe than daytime crashes. This may reflect higher travel speeds at night because of less traffic congestion.
4.2.3 Location
Table 10 shows that most truck crashes occurred in metropolitan areas – 61% of all articulated truck crashes, 82% of all rigid truck crashes, and 74% of all truck-involved crashes. Fatal crashes involving articulated trucks are the only type of truck crash that is more common in rural areas than in the metropolitan area.
4.2.4 Speed zone
Table 11 summarises the occurrence of truck-involved crashes according to the speed zone in which the crash occurred. For the purposes of this analysis, the nine separate speed zones in the database were collapsed into low speed areas (40-60 km/h), medium speed areas (70-90 km/h), and high speed areas (100+ km/h). Across all injury types and truck types, the number of crashes is highest in high speed areas followed by low speed areas. This may reflect the preponderance of these two zones relative to the number of medium speed areas.

14 MONASH UNIVERSITY ACCIDENT RESEARCH CENTRE
Table 9. Truck crashes by time of day. Crash time Crash Severity Total
Fatal Serious injury Other injury
Articulated 6am-6pm 90 459 1098 1647
6pm-6am 66 217 359 642
Total 156 676 1457 2289
Rigid 6am-6pm 104 827 1984 2915
6pm-6am 29 192 308 529
Total 133 1019 2292 3444
Truck 6am-6pm 190 1253 3023 4466
6pm-6am 92 403 661 1156
Total 282 1656 3684 5622
0% 10% 20% 30% 40% 50% 60% 70% 80% 90% 100%
Artic
Rigid
Truck
Artic
Rigid
Truck
6am
-6pm
6pm
-6am
Tim
e of
Day
Fatal Serious injury Other injury
Figure 3. Distribution of crash severity for daytime and night-time crashes.

REVIEW OF TRUCK SAFETY - STAGE 2: UPDATE OF CRASH STATISTICS 15
Table 10. Truck crashes as a function of metropolitan/rural area and crash severity. LGA type Crash Severity Total
Fatal Serious injury Other injury
Artic Metro 51 380 962 1393
Rural 105 295 495 895
Total 156 675 1457 2288
Rigid Metro 86 816 1929 2831
Rural 47 203 363 613
Total 133 1019 2292 3444
Truck Metro 135 1178 2843 4156
Rural 147 477 841 1465
Total 282 1655 3684 5621
Table 11. Truck crashes according to speed zone. Speed zone Crash severity Total
Fatal Serious injury Other injury
Artic 40-60 22 186 483 691
70-90 23 187 426 636
100 + 111 303 545 959
Unknown 3 3
Total 156 676 1457 2289
Rigid 40-60 38 498 1273 1809
70-90 35 264 603 902
100 + 60 253 409 722
Unknown 4 7 11
Total 133 1019 2292 3444
Truck 40-60 60 676 1739 2475
70-90 58 444 1013 1515
100 + 164 532 922 1618
Unknown 4 10 14
Total 282 1656 3684 5622

16 MONASH UNIVERSITY ACCIDENT RESEARCH CENTRE
The greatest number of articulated-involved fatal crashes occur in high speed areas – approximately double the combined number of fatalities across all other speed limit zones. The number of serious injury and other injury articulated truck crashes is also highest for high speed areas, and the number of these injury crashes occurring in low and medium speed areas is approximately equivalent.
The pattern is somewhat different for rigid trucks. In the case of rigid truck-involved crashes, the greatest number of fatality crashes occurred in high speed areas, but both serious and other injuries were more likely in low speed areas. In terms of the total number of injury crashes, low speed areas have the greatest number of crashes, followed by the medium speed areas, with high speed zones reflected by the least number of injury crashes.
For trucks overall, low speed areas had the highest number of injury crashes, followed by high speed areas and then mid-speed areas.
Figure 4 indicates that the proportion of crashes resulting in death or serious injury increased with speed zone. In low speed zones and high speed zones, articulated truck crashes were more likely to be fatal than rigid truck crashes.
������������������
������������
��������������
��������������
����������������������������������������
���������������������������������������������
���������������������������������������������������������������������������������������������������������������������������������������
���������������������������������������������������������������������������������������������������������������������������������������������
��������������������������������������������������������������������������������������������������
��������������������������������������������������������������������������������������������������
����������������������������������������������������������������������������������������������������������
������������������������������������������������������������������������������������������������������������������������������������������������������������������������������
������������������������������������������������������������������������������������������������������������������������������������������������������������������������������������������������������������������������������������������������������������������������������������������������������������������������������������������������������������
������������������������������������������������������������������������������������������������������������������������������������������������������������������������������������������������������������������������������������������������������������������������������������������������������������������������������������������������������������
������������������������������������������������������������������������������������������������������������������������������������������������������������������������������������������������������������������������������
������������������������������������������������������������������������������������������������������������������������������������������������������������������������������������������������������������������������������
��������������������������������������������������������������������������������������������������������������������������������������������������������������������������������������������
������������������������������������������������������������������������������������������������������������������������������������������������������������������������������������������������������������������������������������������������������������������������������������������
0% 10% 20% 30% 40% 50% 60% 70% 80% 90% 100%
Artic40-60 km/h
Rigid
Artic70-90 km/h
Rigid
Artic100+ km/h
Rigid
Spee
d zo
ne
��������Fatal
��������Serious injury
�������� Other injury
Figure 4. Crash severity as a function of speed zone.
4.2.5 Intersection vs. midblock crashes
A further variable that describes each crash is whether it occurred at an intersection or on a stretch of road between intersections (a midblock) – see Table 12. Overall, 47% of truck crashes occurred at intersections (41% of articulated truck crashes and 50% of rigid truck crashes).

REVIEW OF TRUCK SAFETY - STAGE 2: UPDATE OF CRASH STATISTICS 17
As would be expected, the ratio of the number of midblock crashes to intersection crashes is substantially higher for rural areas, probably due in large part to the fact that there are relatively fewer intersections. Among metropolitan crashes, 52% of truck crashes occurred at intersections (49% of metropolitan articulated truck crashes and 53% of metropolitan rigid truck crashes).
Table 12. Truck crashes by severity and location – intersection/midblock and metro/rural.
Crash Severity Total
Fatal Serious
injury Other injury
Articulated Metro Intersection 21 188 478 687
Midblock 30 192 484 706
Rural Intersection 30 78 148 256
Midblock 75 216 347 638
Rigid Metro Intersection 38 385 1083 1506
Midblock 48 431 844 1323
Rural Intersection 16 77 131 224
Midblock 31 126 232 389
Truck Metro Intersection 58 566 1543 2167
Midblock 77 612 1298 1987
Rural Intersection 44 146 275 465
Midblock 103 330 566 999
In metropolitan areas, midblock crashes were more highly represented among fatal crashes than intersection crashes. This pattern was not evident for rural crashes.
4.2.6 Crash type
VicRoads uses a numerical system for categorising crashes that provides some detail as to how a crash occurred. The structure is called the Definitions for Classifying Accidents (DCA) coding system. Individual DCA codes are grouped according to a number of categories:
• Crashes that involved a pedestrian
• Crashes that occurred between vehicles approaching from adjacent directions (intersections only)
• Crashes that occurred between vehicles travelling in opposing directions

18 MONASH UNIVERSITY ACCIDENT RESEARCH CENTRE
• Crashes that occurred between vehicles travelling in the same direction
• Crashes that occurred while a vehicle was manoeuvring
• Crashes that occurred while a vehicle was overtaking
• Crashes between a vehicle and an obstacle in the path of travel
• Crashes that occurred when a vehicle left a straight roadway
• Crashes that occurred when a vehicle left a curved roadway
• Miscellaneous crashes.
Tables 13 to 15 summarise the number of crashes in each DCA group for articulated trucks, rigid trucks and all trucks. Overall, the largest number of crashes for both articulated and rigid trucks involved vehicles travelling in the same direction. For both articulated and rigid truck crashes, the largest number of fatal crashes involved a collision between vehicles travelling in opposing directions – ‘head-on’ crashes. Same direction crashes were the most common type of serious injury and other injury crash for both articulated and rigid trucks.
Table 13. Articulated truck crashes by severity and crash category (DCA code). DCA category Crash Severity Total
Fatal Serious injury Other injury
Pedestrian 13 23 15 51
Adjacent vehicle 25 85 130 240
Opposing direction 55 87 128 270
Same direction 17 208 701 926
Manoeuvring 12 40 55 107
Overtaking 8 18 33 59
On path 2 38 64 104
Off path straight 7 84 161 252
Off path curve 15 77 147 239
Miscellaneous 2 16 23 41
Total 156 676 1457 2289

REVIEW OF TRUCK SAFETY - STAGE 2: UPDATE OF CRASH STATISTICS 19
Table 14. Rigid crashes by severity and crash category (DCA code). DCA category Crash Severity Total
Fatal Serious injury Other injury
Pedestrian 14 77 75 166
Adjacent vehicle 28 169 326 523
Opposing direction 42 176 264 482
Same direction 15 280 955 1250
Manoeuvring 9 63 168 240
Overtaking 3 23 51 77
On path 10 93 180 283
Off path straight 3 74 169 246
Off path curve 6 40 65 111
Miscellaneous 3 24 39 66
Total 133 1019 2292 3444
Table 15. All truck crashes by severity and crash category (DCA code). DCA category Crash Severity Total
Fatal Serious injury Other injury
Pedestrian 26 99 90 215
Adjacent vehicle 52 250 450 752
Opposing direction 95 258 387 740
Same direction 30 466 1614 2110
Manoeuvring 21 103 222 346
Overtaking 10 36 82 128
On path 12 130 239 381
Off path straight 10 158 328 496
Off path curve 21 117 212 350
Miscellaneous 5 39 60 104
Total 282 1656 3684 5622

20 MONASH UNIVERSITY ACCIDENT RESEARCH CENTRE
4.2.7 Type of traffic control
The crash database records the type of traffic control present at the scene, such as a set of traffic lights or a roundabout. Table 16 presents the number of injury crashes (and percentage of the totals) that occurred in metropolitan and rural areas according to whether the crash occurred at a traffic control device or not. Entries of “unknown” and “missing” are the same for the purposes of this analysis. “Missing” corresponds to where no data were entered into the database as opposed to instances where “unknown” was recorded.
Table 16. Metro/rural crashes according to presence of a traffic control device. Artic Rigid Truck
Metro Rural Metro Rural Metro Rural
No. % No. % No. % No. % No. % No. %
Controlled 455 33% 129 14% 905 32% 132 22% 1344 32% 255 17%
Uncontrolled 877 63% 738 82% 1712 60% 459 75% 2539 61% 1160 79%
Unknown 15 1% 12 1% 29 1% 3 0% 44 1% 15 1%
Missing 46 3% 16 2% 185 7% 19 3% 229 6% 35 2%
Total 1393 100% 895 100% 2831 100% 613 100% 4156 100% 1465 100%
Overall, a traffic control device was present for 32% of metropolitan crashes and 17% of rural crashes. In metropolitan areas, traffic control devices were equally common at the site of articulated compared to rigid truck crashes. In rural areas, traffic control devices were more likely to be found at the sites of rigid truck crashes (22%) than articulated truck crashes (14%).
Table 17 provides more detail on the types of traffic controls present at the crash sites (those listed as “missing” in Table 15 are not included). Stop-go lights followed by give-way signs, were the most traffic control devices at the sites of articulated truck crashes in metropolitan areas. For articulated truck crashes in rural areas, the most likely traffic control device present was a give-way sign. Rigid truck crashes in metropolitan areas were also most likely to occur at stop-go lights, however stop signs and roundabouts were the next most likely locations. For rigid truck crashes in rural areas, stop signs were the most likely traffic control present. Give-way signs were one of the least common devices present for rigid trucks in either metropolitan or rural crashes involving an injury.

REVIEW OF TRUCK SAFETY - STAGE 2: UPDATE OF CRASH STATISTICS 21
Table 17. Truck crashes for urban and metropolitan areas according to type of traffic control present.
Traffic control Articulated Rigid Truck
Metro Rural Metro Rural Metro Rural
No control 877 738 1712 459 2539 1160
Stop-go lights 327 19 534 25 852 44
Flashing lights 4 5 9
Out of order 1 2 4 5 2
Pedestrian lights 5 1 5 9 1
Pedestrian crossing 8 8
Railway crossing gates & booms 1 6 7
Railway crossing bells & lights 3 2 2 3
Railway crossing no control 4 39 7 4
Roundabout 19 6 113 18 57 13
Stop sign 31 17 158 71 143 33
Give way sign 54 71 2 1 210 139
School - flags 2 1
Police 1 1 2
Other 12 6 28 10 38 15
Unknown 15 12 29 3 44 15
Total 1347 879 2646 594 3927 1430
Tables 18 to 20 summarise the characteristics of truck crashes at the most common types of traffic controls. Stop-go lights and give-way signs were the most common traffic control devices present for crashes involving a truck in metropolitan and rural areas respectively. Most of the truck crashes at stop-go lights in metropolitan areas involved vehicles travelling in the same direction. About 20% of these crashes involved adjacent vehicles and about another 20% involved vehicles from opposing directions. The bulk of truck crashes in metropolitan areas that occurred at stop and give way signs involved adjacent vehicles. For truck crashes at give-way signs in rural areas, the most likely crash category was “adjacent vehicle”.

22 MONASH UNIVERSITY ACCIDENT RESEARCH CENTRE
4.3 ROAD USERS INVOLVED
Overall, 316 people were killed, 2,077 were seriously injured and 5,342 sustained some other injury in truck crashes in Victoria in 1996-2000 (see Table 21). Of those killed, 177 were involved in articulated truck crashes and 147 were involved in rigid truck crashes.
Articulated truck crashes were generally more severe than rigid truck crashes (see Table 21). Almost 3% of persons in articulated truck crashes were killed, compared to about 1.5% of persons in rigid truck crashes.
Table 22 and Figures 5 to 7 summarise the yearly trend of number of injuries in articulated- and rigid-involved crashes, as well as all truck crashes. Generally, articulated-involved crashes produced more fatalities (except for 1998) than rigid crashes, but rigid-involved produced a greater number of serious injuries, other injuries and instances of non-injuries as a result of a crash.
Table 18. Articulated truck crashes by crash category (DCA) and type of traffic control and metropolitan/rural location.
Traffic control
DCA Category Total
Adjacent vehicle
Opposing direction
Same direction
Manoeuvre Overtaking On path Off path straight
Off path curve
Misc
Metropolitan area No control 12 83 512 70 15 66 61 43 15 877 Stop-go lights 66 63 169 10 2 2 12 1 2 327 Flashing lights 2 2 4 Out of order 1 1 Pedestrian lights
1 4 5
Railway crossing gates & booms
1 1
Roundabout 4 9 4 2 19 Stop sign 23 2 3 1 2 31 Give way sign 36 1 13 3 1 54 Police 1 1 Other 1 2 5 3 1 12 Unknown 2 7 1 3 1 1 15 Total 145 155 724 81 17 72 85 48 20 1347 Rural areas No control 12 106 178 26 40 26 151 186 13 738 Stop-go lights 9 4 6 19 Out of order 1 1 2 Pedestrian lights
1 1
Railway crossing bells & lights
1 2 3
Railway crossing no control
4 4
Roundabout 1 1 3 1 6 Stop sign 15 2 17 Give way sign 54 2 9 3 1 2 71 Other 1 1 1 1 1 1 6 Unknown 1 2 1 2 4 2 12 Total 94 115 198 26 42 27 165 191 21 879

REVIEW OF TRUCK SAFETY - STAGE 2: UPDATE OF CRASH STATISTICS 23
Table 19. Rigid crashes by crash category (DCA) and type of traffic control and metropolitan/rural location.
Traffic Control DCA Category Total Adjacent
vehicle Opposing direction
Same direction
Manoeuvring Overtaking On path
Off path straight
Off path curve
Misc
Metropolitan area No control 49 231 775 179 45 222 134 33 44 1712 Stop-go lights 136 127 245 14 2 9 1 534 Flashing lights 1 1 3 5 Out of order 2 2 4 Pedestrian lights 1 4 5 Pedestrian crossing
6 2 8
Railway crossing gates & booms
4 1 1 6
Railway crossing bells & lights
1 1 2
Roundabout 15 3 13 1 1 4 2 39 Stop sign 87 6 1 6 1 1 9 2 113 Give way sign 123 6 20 3 1 3 1 1 158 School - flags 2 2 Police 1 1 Other 5 3 10 1 9 28 Unknown 1 2 19 1 1 4 1 29 Total 419 382 1104 207 47 237 163 38 49 2646 Rural areas No control 18 90 109 30 28 32 72 70 10 459 Stop-go lights 2 5 18 25 Roundabout 4 1 1 1 7 Stop sign 16 1 1 18 Give way sign 59 1 2 1 1 6 1 71 School - flags 1 1 Other 2 2 4 1 1 10 Unknown 1 1 1 3 Total 102 99 136 32 29 34 79 73 10 594

24 MONASH UNIVERSITY ACCIDENT RESEARCH CENTRE
Table 20. Truck crashes by crash category (DCA) and type of traffic control and metropolitan/rural location.
Traffic control DCA Category Total Adjacent
vehicle Opposing direction
Same direction
Manoeuvring Overtaking On path
Off path straight
Off path curve
Misc
Metropolitan area No control 61 311 1247 248 58 287 193 76 58 2539 Stop-go lights 200 189 408 24 2 4 21 1 3 852 Flashing lights 3 1 5 9 Out of order 3 2 5 Pedestrian lights
1 8 9
Pedestrian crossing
6 2 8
Railway crossing gates & booms
4 1 2 7
Railway crossing bells & lights
1 1 2
Roundabout 18 3 22 1 1 8 4 57 Stop sign 109 8 4 7 1 1 11 2 143 Give way sign 158 7 32 3 1 6 2 1 210 School - flags 2 2 Police 1 1 2 Other 6 5 14 1 11 1 38 Unknown 1 4 26 1 2 7 1 2 44 Total 559 532 1780 287 62 307 246 86 68 3927 Rural areas No control 29 190 269 56 62 54 223 256 21 1160 Stop-go lights 11 9 24 44 Out of order 1 1 2 Pedestrian lights
1 1
Railway crossing bells & lights
1 2 3
Railway crossing no control
4 4
Roundabout 5 1 2 3 2 13 Stop sign 29 1 3 33 Give way sign 110 3 11 1 1 9 2 2 139 School - flags 1 1 Other 3 2 5 1 1 1 1 1 15 Unknown 2 2 2 2 4 3 15 Total 190 207 316 58 65 57 244 264 29 1430

REVIEW OF TRUCK SAFETY - STAGE 2: UPDATE OF CRASH STATISTICS 25
Table 21. Number of persons injured at each level of injury severity Injury severity Total
Fatal injury Serious injury Other injury Non injury
Artic 177 887 2119 2910 6093
% of Artic total 2.9% 14.6% 34.8% 47.8%
Rigid 147 1242 3310 5031 9730
% of Rigid total 1.5% 12.8% 34.0% 51.7%
Truck 316 2077 5342 7795 15530
% of Truck total 2.0% 13.4% 34.4% 50.2%
Table 22. The number of persons injured in truck crashes in Victoria at each level of severity.
1996 1997 1998 1999 2000
Fatal
Artic 39 27 32 39 40
Rigid 22 25 34 36 30
Truck 58 52 65 72 69
Serious injury
Artic 188 140 192 192 175
Rigid 219 244 247 261 271
Truck 399 375 431 434 438
Other injury
Artic 380 423 405 483 428
Rigid 649 670 619 664 708
Truck 1021 1074 1010 1126 1111
Non-injury
Artic 558 523 555 701 573
Rigid 941 999 984 1024 1083
Truck 1481 1491 1511 1689 1623

26 MONASH UNIVERSITY ACCIDENT RESEARCH CENTRE
Plotting each of the injury types as a function of time produces Figures 5 to 7. In some cases the gradient is not steep, however trend lines indicate that the number of each type of injury for both rigid and articulated trucks has been on the increase between 1996 and 2000.
20
30
40
50
60
70
80
1996 1997 1998 1999 2000
Num
ber o
f inj
urie
s
Artic fatal Rigid fatal Truck fatal
Figure 5. Yearly trend of fatalities.
Yearly trend of serious injuries
100
150
200
250
300
350
400
450
1996 1997 1998 1999 2000
Num
ber
of in
juri
es
Artic serious injury Rigid serious injury Truck serious injury
Figure 6. Yearly trend of serious injuries.
Artic trend line
Truck trend line
Rigid trend line
Artic trend line
Truck trend line
Rigid trend line

REVIEW OF TRUCK SAFETY - STAGE 2: UPDATE OF CRASH STATISTICS 27
300
400
500
600
700
800
900
1000
1100
1200
1996 1997 1998 1999 2000
Num
ber o
f inj
urie
s
Artic other injury Rigid other injury Truck other injury
Figure 7. Yearly trend of other injuries
4.3.1 Metropolitan vs. rural areas
In a similar pattern to that revealed in the crash-based analysis earlier, there were substantially more articulated-involved fatalities in crashes in rural LGAs than in metropolitan areas (see Table 23). However, substantially more persons were involved in crashes and received other injuries and no injuries in metropolitan areas. A somewhat greater number of persons sustained serious injuries in articulated crashes in rural areas, however the difference is not as great as for the other categories of injury. For rigid truck crashes, there were more of each type of injury in metropolitan compared to rural LGAs.
Table 23. Persons injured in truck crashes in metropolitan and rural areas. Crash Location Injury severity Total
Fatal injury Serious injury Other injury Non injury
Artic Metro 55 486 1345 2108 3994
Rural 122 400 774 801 2097
Total 177 886 2119 2909 6091
Rigid Metro 97 974 2688 4300 8059
Rural 50 268 622 731 1671
Total 147 1242 3310 5031 9730
Truck Metro 150 1439 3977 6311 11877
Rural 166 637 1365 1483 3651
Total 316 2076 5342 7794 15528
Truck trend line
Rigid trend line
Artic trend line

28 MONASH UNIVERSITY ACCIDENT RESEARCH CENTRE
4.3.2 Type of vehicle and road user
Table 24 considers the injuries in crashes involving trucks on the basis of the type of road user who was injured. Of the 316 people killed in truck crashes, 202 (64%) were car occupants, 51 (16%) were truck occupants, 19 (6%) were motorcyclists, 13 (4%) were bicyclists and 28 (9%) were pedestrians. The remainder were occupants of other vehicles. At lower levels of severity, the representation of truck occupants increased and the representation of other road users decreased.
Articulated truck crashes were more likely to result in death or serious injury to the truck occupant than rigid truck crashes. Of the 177 people killed in articulated vehicle crashes, 34 (19%) were occupants of the articulated truck and 4 (2%) were occupants of rigid trucks. Of the 147 people killed in rigid truck crashes, 17 (12%) were occupants of the rigid truck.
4.3.3 Crash type
A summary of the number of persons injured in different types of crashes (DCA categories) is presented in Tables 25 to 27. For both articulated and rigid truck crashes, the largest number of fatalities occurred where the vehicles involved were travelling in opposing directions. This category produced the second highest number of serious injuries, other injuries and non-injuries. The crash category ‘vehicles travelling in the same direction’ produced the highest number of non-fatal injuries.

REVIEW OF TRUCK SAFETY - STAGE 2: UPDATE OF CRASH STATISTICS 29
Table 24. Injuries as a function of type of other vehicle involved in crash. Vehicle type Truck
type Injury Level Total
Fatal injury Serious injury Other injury Non injury Car Artic 108 547 1416 923 2994 Rigid 97 768 2235 1805 4905 Truck 202 1294 3636 2725 7857 Articulated truck Artic 34 203 496 1810 2543 Rigid 8 22 92 122 Truck 34 203 496 1810 2543 Rigid truck Artic 4 22 49 55 130 Rigid 17 250 718 2950 3935 Truck 17 250 718 2950 3935 Bus/Coach Artic 2 30 58 90 Rigid 3 62 79 144 Truck 5 91 137 233 Mini bus Artic 1 5 6 Rigid 1 2 3 Truck 1 6 2 9 Motor cycle Artic 10 39 33 3 85 Rigid 9 53 58 8 128 Truck 19 92 91 12 214 Bicycle Artic 5 17 24 1 47 Rigid 8 55 88 2 153 Truck 13 72 112 3 200 Horse Artic 5 2 7 Rigid 2 1 3 Truck 7 2 1 10 Tram Artic 3 5 13 21 Rigid 1 14 40 55 Truck 4 19 53 76 Train Artic 12 15 12 39 Rigid 2 2 Truck 12 15 14 41 Other vehicle Artic 1 7 19 21 48 Rigid 1 9 12 20 42 Truck 2 16 31 41 90 Pedestrian Artic 14 29 22 2 67 Rigid 15 93 98 8 214 Truck 28 121 120 10 279 Unknown Artic 1 3 12 16 Rigid 2 22 24 Truck 1 5 37 43

30 MONASH UNIVERSITY ACCIDENT RESEARCH CENTRE
Table 25. Persons injured in articulated truck crashes as a function of crash type (DCA category).
DCA category Injury Level Total
Fatal injury Serious injury Other injury Non injury
Pedestrian 13 24 17 56 110
Adjacent vehicle 28 121 199 331 679
Opposing direction 66 138 241 328 773
Same direction 23 254 1041 1643 2961
Manoeuvring 12 54 78 127 271
Overtaking 8 41 59 98 206
On path 2 47 83 102 234
Off path straight 8 92 189 106 395
Off path curve 15 84 172 37 308
Miscellaneous 2 32 40 82 156
Total 177 887 2119 2910 6093
Table 26. Persons injured in rigid truck crashes as a function of crash type (DCA category).
DCA category Injury Level Total
Fatal injury Serious injury Other injury Non injury
Pedestrian 14 79 81 191 365
Adjacent vehicle 33 230 518 730 1511
Opposing direction 47 244 456 690 1437
Same direction 16 336 1388 2473 4213
Manoeuvring 10 69 239 301 619
Overtaking 3 33 82 120 238
On path 12 103 224 194 533
Off path straight 3 79 202 170 454
Off path curve 6 44 73 30 153
Miscellaneous 3 25 47 132 207
Total 147 1242 3310 5031 9730

REVIEW OF TRUCK SAFETY - STAGE 2: UPDATE OF CRASH STATISTICS 31
Table 27. Persons injured in truck crashes as a function of crash type (DCA category).
DCA category Injury Level Total
Fatal injury Serious injury Other injury Non injury
Pedestrian 26 102 97 247 472
Adjacent vehicle 60 345 709 1056 2170
Opposing direction 111 374 684 1010 2179
Same direction 36 564 2381 4011 6992
Manoeuvring 22 123 315 427 887
Overtaking 10 65 137 208 420
On path 14 149 301 290 754
Off path straight 11 171 389 274 845
Off path curve 21 128 245 67 461
Miscellaneous 5 56 84 205 350
Total 316 2077 5342 7795 15530
4.3.4 The truck drivers
Analyses were also conducted regarding a number of demographic details of the truck drivers involved in truck crashes. In both articulated and rigid truck crashes, the largest age group of truck drivers represented was 31 to 40 years old, followed by 41 to 50 years old (see Table 28). “Years of driving experience” is also coded by the database but around 95% of the cases are listed as “unknown”, making any conclusions unreliable. There were very few female truck drivers (see Table 29).
As might be expected, the majority of truck drivers were licensed in Victoria, with NSW representing the second largest group (see Table 30). While the vast majority of trucks involved in crashes were registered in Victoria, the second most common state of registration for articulated trucks was South Australia (see Table 31).

32 MONASH UNIVERSITY ACCIDENT RESEARCH CENTRE
Table 28. Age distribution of crash-involved truck drivers. Age group Artic Rigid Truck
17-20 4 57 61
21-25 165 308 459
26-30 382 480 832
31-40 760 994 1688
41-50 562 752 1264
51-60 323 512 801
61-100 79 157 224
Missing 176 199 360
Table 29. Gender distribution of crash-involved truck drivers. Artic Rigid Truck
Female 10 38 47
Male 2298 3264 5356
Unknown 143 157 286

REVIEW OF TRUCK SAFETY - STAGE 2: UPDATE OF CRASH STATISTICS 33
Table 30. State of licensing of crash-involved truck drivers. Licensing State Artic Rigid Truck
Victoria 1821 3123 4774
Australian Capital Territory 8 2 10
Commonwealth 22 7 28
Northern Territory 3 3
New South Wales 175 57 214
Overseas 9 9
Queensland 68 20 85
South Australia 120 21 130
Tasmania 3 3
Western Australia 35 7 40
Not Available 10 24 33
Unknown 186 189 360
Table 31. State of registration of crash-involved trucks. Registration State Artic Rigid Truck
Victoria 1850 3215 4893
Australian Capital Territory 7 1 7
Commonwealth 41 8 45
Northern Territory 2 2
New South Wales 123 44 154
Overseas 1 1
Queensland 57 18 74
South Australia 156 25 170
Tasmania 7 1 8
Western Australia 14 4 17
Not Available 1 1 2
Unknown 193 141 316

34 MONASH UNIVERSITY ACCIDENT RESEARCH CENTRE

REVIEW OF TRUCK SAFETY - STAGE 2: UPDATE OF CRASH STATISTICS 35
5. POTENTIAL BENEFITS OF UNDERRUN PROTECTION
The likelihood of severe injury outcomes in collisions between trucks and smaller vehicles due to the imbalances in mass and rigidity was discussed earlier. A further source of incompatibility between trucks and smaller vehicles is the difference in ride heights. The front, sides and rear of a rigid truck or an articulated truck with a trailer are often at the same height (or higher) above the roadway as the bonnet or boot of a car. Thus, when a smaller vehicle and truck collide, significant intrusion, and therefore injury to car occupants, can result. Additionally, the car can become firmly wedged under the truck, making it more difficult to treat and extricate casualties.
Underrun protection devices on trucks are designed to engage the car safety systems and thus reduce the level of intrusion into the passenger compartment in these crashes. Some devices also crumple to absorb some of the impact energy.
Front underrun protection devices aim to reduce the severity of injury outcome of crashes in which:
• the front of the truck impacts the side of the light vehicle
• the front of the truck impacts the rear of the light vehicle
• the front of the truck impacts the front of the light vehicle
Side underrun protection devices are designed to reduce the severity of injury outcome of crashes in which:
• the front of the light vehicle impacts the side of the truck
Rear underrun protection devices are designed to reduce the severity of injury outcome of crashes in which:
• the front of the light vehicle impacts the rear of the truck
This section of the report examines the crash data to estimate the prevalence of crashes where underrun protection has the potential to reduce the severity of injury. A cost-benefit ratio for fitting all trucks with underrun protection is then estimated.
5.1 IDENTIFICATION OF POTENTIAL UNDERRUN CRASHES IN VICTORIAN DATA
The Victorian road crash database does not allow crashes in which underrun occurred to be clearly identified. However, the crash types that could potentially result in underrun can be identified using the DCA coding system. As described in Section 4.2.6, the DCA coding system provides a numerically coded description of the crash. Most of the DCA codes describe collisions between two vehicles, but other codes specify a number of ways that a pedestrian could be involved, or collisions with a stationary object or an animal, or a single vehicle leaving the path of travel.
Twenty-eight of the 81 DCA codes describe potential underrun scenarios but how many of these actually involve underrun is unknown. For example, a car may collide with the side of a semi trailer, but hit the wheels of the trailer without any underrun occurring. In

36 MONASH UNIVERSITY ACCIDENT RESEARCH CENTRE
addition, the specific configuration of how the vehicles collided and the point of impact often cannot be determined from the DCA coding. For this reason, the number of crashes identified as potential underrun crashes by using the DCA codes will overestimate the actual number of underrun crashes.
The crash diagrams for each of the 28 DCA codes that represent potential underrun crashes are presented in the tables which follow, along with the number of crashes that occurred. In order for the crash to have involved underrun, the truck must have been coded as a particular vehicle (i.e. vehicle 1 or vehicle 2) for each DCA code. In some types of crashes (as indicated in the tables) the truck could have been vehicle 1 or vehicle 2.
It should be noted that the crash database allows for up to four vehicles per crash to be included. However, only one DCA code is listed for the crash, and DCA codes only describe the interaction of one or two vehicles. This means that only one or two vehicles can be considered to have been involved in the primary crash, and any other vehicles involved must be considered to be subsequent to the DCA event. While any number of these subsequent vehicles may have underrun a truck that has already been involved in a crash, the data file does not allow the type of crash to be deduced. Accordingly, only the truck and the other primary vehicle are considered in these analyses.
5.1.1 Identifying crashes that could be influenced by front underrun protection
As noted earlier, front underrun protection devices are designed to reduce the severity of injury outcome in crashes in which the front of the truck impacts the side, rear or front of the light vehicle.
Table 32 summarises the 11 DCA codes that describe crashes where the front of a truck appears to have collided with the rear of another vehicle. There were 1,045 crashes of this type. The most common scenario was where a truck collided with the back of another vehicle while both vehicles were travelling in the same direction (DCA code 130), a total of 630 crashes, or 60% of the total for this category.
Table 33 summarises the three DCA codes that describe crashes where a truck collided with the front of another vehicle – head-on crashes. Of these 354 crashes, 98% (or 346 crashes) occurred where one of the vehicles was travelling on the wrong side of the road and neither vehicle was overtaking.
Table 34 summarises the nine DCA codes that describe crashes where the front of a truck has collided with the side of another vehicle. There were 936 instances of this type of crash, with 309 crashes (33%) where the vehicles approached each other at right angles at a cross intersection (DCA code 110). However, it should be noted that in DCA 110 the crash could involve the front of the truck impacting the side of another vehicle (addressed by front underrun protection) or the front of the other vehicle impacting the side of the truck (addressed by side impact protection) and the truck could be either vehicle 1 or vehicle 2 in the crash. As such, these 309 crashes are listed here as well as being included in the potential side underrun crashes (see Table 36). The actual configuration of the particular crash depends on which vehicle entered the intersection first but the crash database does not allow this distinction to be made.

REVIEW OF TRUCK SAFETY - STAGE 2: UPDATE OF CRASH STATISTICS 37
Table 32. Crashes potentially addressed by front underrun protection – involving the front of the truck and the rear of a light vehicle as identified by DCA code.
DCA code Crash configuration
Total crashes
DCA code Crash configuration
Total crashes
111
(truck=veh 1)
33
153
(truck=veh 2) 7
116
(truck=veh 2)
24
154
(truck=veh 1) 15
130
(truck=veh 1)
630 160
(truck=veh 1 or 2)69
131
(truck=veh 1)
97
161
(truck=veh 1)
2
132
(truck=veh 1)
152
162
(truck=veh 1)
11
145
(truck=veh 2)
5
Table 33. Crashes potentially addressed by front underrun protection – crashes involving the front of the truck and the front of the light vehicle as identified by DCA code.
DCA code Crash configuration
Total crashes
DCA code Crash configuration
Total crashes
120
(truck=veh 1 or 2)
346 150
(truck=veh 1 or 2)
8
122
(truck=veh 1)
0
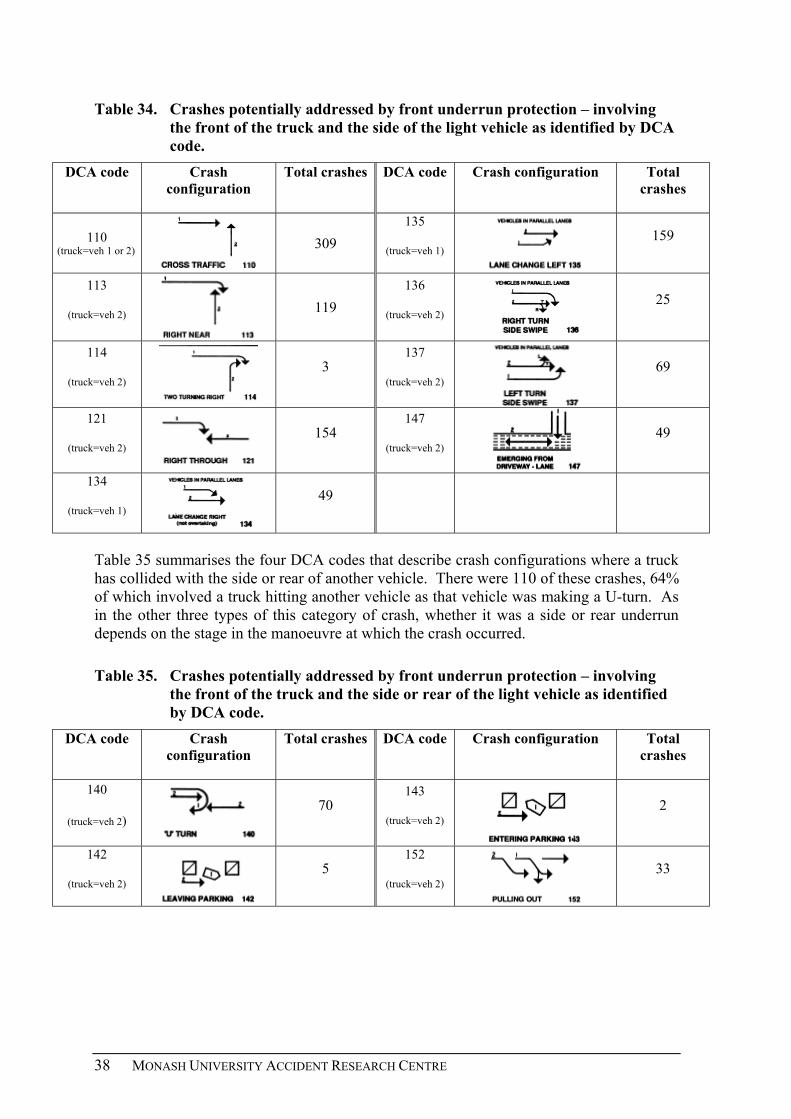
38 MONASH UNIVERSITY ACCIDENT RESEARCH CENTRE
Table 34. Crashes potentially addressed by front underrun protection – involving the front of the truck and the side of the light vehicle as identified by DCA code.
DCA code Crash configuration
Total crashes DCA code Crash configuration Total crashes
110 (truck=veh 1 or 2)
309
135
(truck=veh 1)
159
113
(truck=veh 2)
119 136
(truck=veh 2)
25
114
(truck=veh 2)
3 137
(truck=veh 2)
69
121
(truck=veh 2)
154 147
(truck=veh 2)
49
134
(truck=veh 1)
49
Table 35 summarises the four DCA codes that describe crash configurations where a truck has collided with the side or rear of another vehicle. There were 110 of these crashes, 64% of which involved a truck hitting another vehicle as that vehicle was making a U-turn. As in the other three types of this category of crash, whether it was a side or rear underrun depends on the stage in the manoeuvre at which the crash occurred.
Table 35. Crashes potentially addressed by front underrun protection – involving the front of the truck and the side or rear of the light vehicle as identified by DCA code.
DCA code Crash configuration
Total crashes DCA code Crash configuration Total crashes
140
(truck=veh 2)
70 143
(truck=veh 2)
2
142
(truck=veh 2)
5 152
(truck=veh 2)
33

REVIEW OF TRUCK SAFETY - STAGE 2: UPDATE OF CRASH STATISTICS 39
5.1.2 Identifying crashes that could be influenced by side underrun protection
As noted earlier, side underrun protection devices are designed to reduce the severity of injury outcome in crashes in which the front of the light vehicle impacts the side of the truck.
Table 36 summarises the 14 DCA codes that describe crashes where another vehicle has collided with the side of a truck. Again, DCA 110 (the cross intersection crash) is the most common of the 986 crashes in this category (309 crashes, or 31%).
Table 36. Crashes potentially addressed by side underrun protection – involving the side of the truck and the front of the light vehicle as identified by DCA code.
DCA code
Crash configuration Total crashes DCA code Crash configuration Total crashes
110 (truck=veh 1
or 2
309 136
(truck=veh 1)
22
112
(truck=veh 1)
4 137
(truck=veh 1)
42
113
(truck=veh 1)
150 140
(truck=veh 1)
48
114
(truck=veh 1)
1 142
(truck=veh 1)
2
121
(truck=veh 1)
165 143
(truck=veh 1)
10
134
(truck=veh 2)
104 147
(truck=veh 1)
64
135
(truck=veh 2)
49 152
(truck=veh 1)
16
5.1.3 Identifying crashes that could be influenced by rear underrun protection
Rear underrun protection devices are designed to reduce the severity of injury outcome of crashes in which the front of the light vehicle impacts the rear of the truck.
Table 37 summarises the ten DCA codes that describe crashes where another vehicle collided with the rear of a truck. Of these 432 crashes, 218 (51%) occurred when the light vehicle was travelling in the same lane behind the truck and the light vehicle collided with the rear of the truck.

40 MONASH UNIVERSITY ACCIDENT RESEARCH CENTRE
Table 37. Crashes potentially addressed by rear underrun protection – involving the rear of the truck and the front of the light vehicle as identified by DCA code.
DCA code Crash configuration
Total crashes
DCA code Crash configuration
Total crashes
116
(truck=veh 1)
22
142
(truck=veh 1)
2
130
(truck=veh 2)
218
145
(truck=veh 1)
35
131
(truck=veh 2)
28 152
(truck=veh 1)
16
132
(truck=veh 2)
50 161
(truck=veh 2)
0
140
(truck=veh 1)
48 162
(truck=veh 2)
13
5.1.4 Summary
The analyses presented have identified a total of 3,488 crashes that could have involved an underrun of any configuration. Table 38 provides a summary of the number of crashes of each DCA type, while Table 39 summarises the crashes according to the type of underrun crash. Table 39 shows that front underrun protection is relevant to a larger number of crashes than side underrun, and rear underrun is relevant to the smallest number of crashes. The actual number of potential underrun crashes to which each type of protection is relevant cannot be clearly estimated because for 309 crashes it is unclear whether front or side underrun protection is relevant and for 66 crashes it is unclear whether side or rear underrun protection is relevant.
A total of 3,488 separate crashes occurred between either a rigid or articulated truck and another vehicle (but not another truck), where the crash could have involved underrun. Table 40 summarises the numbers of each crash severity type, categorised by truck type – articulated and rigid trucks.
Fatal crashes are most likely to occur in frontal impacts between cars and trucks. Indeed, more fatal crashes arise from any sort of crash involving the front of a truck than a car running under the rear or side of the truck. Serious injuries, however, follow a different pattern.
Serious injuries, however, follow a different pattern. Light vehicles running into the side of rigid trucks produces the highest number of serious injury crashes, followed by rigid trucks running into the side of lighter vehicles and then rigid trucks hitting the rear of lighter vehicles. In terms of other injuries, rigid trucks running into the rear of lighter vehicles is

REVIEW OF TRUCK SAFETY - STAGE 2: UPDATE OF CRASH STATISTICS 41
the most common, followed by light vehicles running into the side of rigid trucks and then articulated trucks striking the rear of a lighter vehicle.
Table 38. Total number of potential underrun crashes summarised by crash type (DCA code).
DCA code Number Percent DCA code Number Percent
110 309 8.7 136 47 1.3
111 33 0.9 137 111 3.1
112 4 0.2 140 118 3.3
113 269 7.6 142 7 0.2
114 4 0.1 143 12 0.3
116 46 1.3 145 40 1.1
120 346 9.8 147 113 3.2
121 319 9.0 150 8 0.2
122 0 0.0 152 49 1.4
130 848 24.0 153 7 0.2
131 125 3.5 154 15 0.4
132 202 5.7 160 69 2.0
134 153 4.3 161 2 0.1
135 208 5.9 162 24 0.7
Total 3488

42 MONASH UNIVERSITY ACCIDENT RESEARCH CENTRE
Table 39. Number of potential underrun crashes summarised by crash scenario.
Type of underrun protection relevant
Crash type Number
Front truck into rear of another vehicle 1045
truck into front of another vehicle 354
truck into side of another vehicle 936
(includes 309 crashes that could belong to side
underrun)
truck into side or rear of another vehicle
110
Side another vehicle into side of truck 986
(includes 309 crashes that could belong to front
underrun and 66 crashes that could belong to rear
underrun)
Rear another vehicle into rear of truck 432
(includes 66 crashes that could belong to side
underrun)
Total 3,488

REVIEW OF TRUCK SAFETY - STAGE 2: UPDATE OF CRASH STATISTICS 43
Table 40. Number of potential underrun crashes. Victoria 1996-2000. Adjusted for double counting.
Type of protection
Type of crash Crash severity
relevant Fatal Serious injury
Other injury
ARTICULATED TRUCKS Front underrun Truck into rear of light vehicle 4 65 308 Truck into front of light vehicle 42 41 58 Truck into side 21.5 96 231 Truck into side or rear of light
vehicle 6 24 18
Total front underrun 73.5 226 615 Side underrun Light vehicle into side of
truck 16.5 86 170.5
Rear underrun Light vehicle into rear of truck
3 50 82.5
RIGID TRUCKS Front underrun Truck into rear of light vehicle 5 118 545 Truck into front of light vehicle 30 90 93 Truck into side 24.5 126 282.5 Truck into side or rear of light
vehicle 4 17 41
Total front underrun 63.5 351 961.5 Side underrun Light vehicle into side of
truck 19.5 149 357
Rear underrun Light vehicle into rear of truck
7 83 180.5
ALL TRUCKS Front underrun Truck into rear of light vehicle 9 183 853 Truck into front of light vehicle 72 131 151 Truck into side 46 223 513.5 Truck into side or rear of light
vehicle 10 41 59
Total front underrun 137 578 1576.5 Side underrun Light vehicle into side of
truck 36 236 525.5
Rear underrun Light vehicle into rear of truck
10 126 263
5.2 ESTIMATE OF NUMBER OF UNDERRUN CRASHES AUSTRALIA-WIDE
In 1992, 1994 and 1996, 20% of Australia’s fatal articulated truck crashes and 17% of Australia’s fatal rigid truck crashes occurred in Victoria (see Table 2). Similar information is not available for truck crashes resulting in serious injury or other injury. If it is assumed that the distribution of serious injury or other injury crashes is similar to that of fatal crashes, and if it is assumed that the distribution of underrun crashes follows that of all truck crashes, then it is possible to estimate the number of underrun crashes Australia-wide by extrapolating from the Victorian data. The results of this estimation are presented in Table 41.

44 MONASH UNIVERSITY ACCIDENT RESEARCH CENTRE
Table 41. Estimate of annual number of potential underrun crashes as a function of injury severity. Australia.
Type of protection Crash severity
relevant Fatal Serious injury Other injury
ARTICULATED TRUCKS
Front underrun 73.5 226.0 615.0
Side underrun 16.5 86.0 170.5
Rear underrun 3.0 50.0 82.5
RIGID TRUCKS
Front underrun 74.7 412.9 1131.2
Side underrun 22.9 175.3 420.0
Rear underrun 8.2 97.6 212.4
ALL TRUCKS
Front underrun 148.2 638.9 1746.2
Side underrun 39.4 261.3 590.5
Rear underrun 11.2 147.6 294.9
5.3 COST OF UNDERRUN CRASHES
There are no published estimates of the costs of underrun crashes. In terms of the costs of truck crashes overall, Cairney (1991) concluded that the average costs of truck crashes involving injuries were approximately double those of casualty crashes that did not involve a truck. He states that “it is recommended that road authorities adopt these weighting factors when assessing the need for safety-related improvements” (Cairney, 1991, p.14). In developing their submission to the Neville Inquiry, the Australian Transport Safety Bureau (ATSB) assumed that the average heavy vehicle crash costs 50% more than other crashes at the same severity level. They note that this assumption was arbitrary, but probably conservative.
If the ATSB approach is taken, then the cost of heavy vehicle crashes can be estimated as
fatal crash $2,479,491
serious injury crash $611,985
other injury crash $20,664
In Table 42, the annual costs of underrun crashes in Australia are estimated using these crash costs and assuming that half of the potential underrun crashes actually involve

REVIEW OF TRUCK SAFETY - STAGE 2: UPDATE OF CRASH STATISTICS 45
underrrun. The table shows that the estimated annual total cost of underrun crashes in Australia is approximately $594 million. Front underrun crashes account for almost two-thirds of this amount.
Table 42. Estimated annual cost ($000s) of estimated number of underrun crashes (number of potential crashes divided by 2) involving a lighter vehicle in Australia. Based on estimates of crashes Australia-wide 1996-2000 and BTE (2000) crash costs times 1.5.
Type of protection Crash severity
relevant Fatal Serious injury Other injury Total
ARTICULATED TRUCKS
Front underrun 91,121,294 69,154,305 6,354,180 166,629,779
Side underrun 20,455,801 26,315,355 1,761,606 48,532,762
Rear underrun 3,719,237 15,299,625 852,390 19,871,252
Total 115,296,332 110,769,285 8,968,176 235,033,793
RIGID TRUCKS
Front underrun 92,616,281 126,356,903 11,687,315 230,660,500
Side underrun 28,441,220 53,638,685 4,339,440 86,419,346
Rear underrun 10,209,669 29,879,268 2,194,031 42,282,967
Total 131,267,171 209,874,856 18,220,786 359,362,812
ALL TRUCKS
Front underrun 183,737,576 195,511,208 18,041,495 397,290,279
Side underrun 48,897,021 79,954,040 6,101,046 134,952,107
Rear underrun 13,928,905 45,178,893 3,046,421 62,154,219
Total 246,563,502 320,644,141 27,188,962 594,396,605
Using the same cost for articulated and rigid truck crashes may not be appropriate, given that the cost of the cargo is likely to be higher for an articulated truck. However, in many underrun crashes there is little damage to the truck and cargo.
5.4 EFFECTIVENESS OF UNDERRUN PROTECTION DEVICES
Rechnitzer (1993) and Rechnitzer and Foong (1991) reviewed a number of studies of the likely effectiveness of underrun protection devices. Rechnitzer and Foong (1991) cite a Swedish study showing that the introduction of rear underrun devices (in conjunction with improvements in occupant restraint and improved rear visibility of trucks) led to a reduction in fatalities due to underrun crashes from 13% to about 3%. They also cite a

46 MONASH UNIVERSITY ACCIDENT RESEARCH CENTRE
British study by Riley et al (1981) which found that 20 of the 55 fatalities in rear underrun crashes could have been prevented by having an appropriate guard (this assumes survivability at 60 km/h of restrained occupants). Based on these and a number of other studies, they estimated the reductions in fatalities and injury severity resulting from improved frontal and side design of trucks. These reductions are summarised in Table 43.
Table 43. Estimates from Rechnitzer (1993) Table 5.8. of the reductions in fatalities and injury severity resulting from improved frontal and side design of trucks.
Crash type Expected reduction in fatalities
Estimated reduction in injury severity for injury
cases
Car-truck 15+% 30%
Pedestrian-truck 20% 25+%
Two wheeler-truck 20+% 25+%
Total 16% 28%
Rigid rear underrun systems are highly effective for speeds up to 60-70 km/h as they then engage the car’s safety systems. Energy absorbing rear underrun systems are effective at speeds up to 70-90 km/h for airbag-equipped cars. An English study estimated that rear underrun systems would prevent about 35% of fatalities in rear underrun crashes (Riley et al, 1981, cited in Rechnitzer and Foong, 1991).
Rechnitzer and Foong (1991) state that “the current ADR regulations (ADR 42.6 Rear Bumper for Semi-Trailers), only applies to a very limited range of vehicles, and is known to be inadequate. Common deficiencies found on rear guard designs are inadequate bracing and connection design and execution, and incorrect height, with the potential load resistance being wasted by inadequate design and detailing. It is evident that many of these barriers could be redesigned and substantially upgraded in capacity, with little penalty in the way of cost or weight increase, above what is already being incurred” (p.22).
5.5 ESTIMATED BENEFITS OF UNDERRUN PROTECTION DEVICES
Underrun protection will not prevent crashes. In most instances, it will save lives and reduce the extent of injury but in many cases, some level of injury will still occur. The actual reduction in the cost of property damage is likely to be small, compared to the benefits in terms of the savings in lives and long-term injuries.
The analysis presented here will assume that:
• front underrun protection will change 15% of fatal crashes to serious injury crashes and 30% of serious injury crashes to other injury crashes
• side underrun protection will change 15% of fatal crashes to serious injury crashes and 30% of serious injury crashes to other injury crashes

REVIEW OF TRUCK SAFETY - STAGE 2: UPDATE OF CRASH STATISTICS 47
• rear underrun protection will change 30% of fatal crashes to serious injury crashes and 30% of serious injury crashes to other crashes
5.6 COST OF UNDERRUN PROTECTION DEVICES
Effective rigid rear underrun systems do not require significantly more material or work than is currently used. The cost varies from about $200 to $500. Energy absorbing rear underrun systems would work at speeds up to 70-90 km/h for airbag-equipped cars and would cost roughly $1,000 to $1,500. Costs could be somewhat less with good commercial design development.
Front underrun systems as used in Europe comprise a simple steel beam with a cost of about $100 to $150. Discussions with one European manufacturer found that they did not regard the front underrun protection to be any additional cost as they used it to support other components.
5.7 CALCULATION OF ESTIMATED BENEFIT:COST RATIOS
Benefit:Cost Ratios (BCRs) were estimated for the following scenarios:
• A package of front, side and rear underrun costing $500
• A package of front, side and rear underrun costing $1,000
• Front underrun protection costing $100
• Front underrun protection costing $200
• Side underrun protection costing $200
• Rear underrun protection costing $200
The number of trucks to which these costs should be applied was taken from the numbers of articulated and rigid trucks in the Survey of Motor Vehicle Use. The ABS Survey of Motor Vehicle Use for the 12 months ending 31 October 2000 (ABS, 2001) estimated there were 341,484 rigid trucks and 59,989 articulated trucks in Australia. Some of these trucks will already have adequate underrun protection fitted, but it was assumed that this would reduce both benefits and costs in a similar manner, and therefore the benefit:cost ratios would not be affected.
The calculations assumed a 7% discount rate with lifetimes of 15 years or 25 years.
The BCR calculations are presented in Appendix 1 and are summarised in Tables 44 and 45. For all of the underrun protection measures included, the BCRs were higher for articulated trucks than rigid trucks. The BCRs were higher when a 15-year lifetime was assumed, than when a 25-year lifetime was assumed.
A package of front, side and rear underrun had a BCR of greater than 1 for both articulated trucks and rigid trucks, whether a 17- or 25- year lifetime is assumed. Not surprisingly, the BCR was doubled if the package cost $500, compared to if the package cost $1,000.

48 MONASH UNIVERSITY ACCIDENT RESEARCH CENTRE
The BCRs also exceeded 1 for each type of underrun protection – front (at a cost of either $100 or $200), side or rear – for both articulated trucks and rigid trucks; again regardless of the lifetime. The BCRs were considerably larger for front underrun protection than for side underrun protection, with the lowest BCRs found for rear underrun protection.
Table 44. Summary of benefit:cost ratios for a range of underrun protection measures. Assumes discount rate of 7% and 15 year lifetime.
Type of measure Articulated trucks Rigid trucks All trucks
Package ($500) 16.5 4.9 6.6
Package ($1,000) 8.2 2.5 3.3
Front underrun ($100)
54.9 15.0 21.0
Front underrun ($200)
27.5 7.5 10.5
Side underrun 9.0 3.0 3.9
Rear underrun 4.8 1.8 2.2
Table 45. Summary of benefit:cost ratios for a range of underrun protection measures. Assumes discount rate of 7% and 25 year lifetime.
Type of measure Articulated trucks Rigid trucks All trucks
Package ($500) 13.3 4.0 5.4
Package ($1,000) 6.6 2.0 2.7
Front underrun ($100)
44.2 12.1 16.9
Front underrun ($200)
22.1 6.1 5.1
Side underrun 7.2 2.4 3.1
Rear underrun 3.8 1.4 1.8

REVIEW OF TRUCK SAFETY - STAGE 2: UPDATE OF CRASH STATISTICS 49
6. SUMMARY AND CONCLUSIONS
This report presents an updated statistical profile of the characteristics of heavy vehicle crashes in Victoria and then uses this as a basis for estimating the benefits of the recommended design improvements arising from the Stage 1 report on Underrun Protection.
6.1 NATIONAL COMPARISONS
Truck crash data vary in their availability, scope and timeliness. Basic timely data are available nationally for fatal articulated truck crashes but not for rigid truck crashes. Statewide crash data are available for articulated and rigid truck crashes that result in injury, although delays in finalising data can occur. Estimates of the amount of travel in particular jurisdictions can be difficult to obtain and therefore jurisdiction-wide crash rates are not available for all years.
The number of truck crashes appears to be increasing. From 1991 to 1997, the number of fatal articulated vehicle crashes in Victoria and Australia was reasonably constant. Since 1997, the number of fatal crashes appears to have increased Australia-wide. In Victoria, the number of both rigid and articulated truck crashes has been steadily increasing between 1996 and 2000, with rigid truck crashes increasing at a slightly higher rate.
In 1997, the fatality rates for articulated and rigid trucks (both in terms of registered vehicles and in terms of distance travelled) were lower in Victoria than for Australia as a whole.
Australia-wide and in Victoria, fatality rates are higher for articulated than rigid trucks regardless of whether registered vehicles or distance travelled is used as the denominator.
The fatal truck crashes in Victoria and the rest of Australia in 1992, 1994 and 1996 were similar in terms of mixture of crash types (single truck only, truck-pedestrian, and multiple-vehicle), divided and undivided roads and day and night-time crashes. In Victoria, relatively more fatal truck crashes occurred in the capital city and in rural areas and relatively fewer occurred in other urban areas compared to other States and Territories.
6.2 TRUCK CRASHES IN VICTORIA 1996-2000
From 1996-2000 there were 5,622 reported truck crashes in Victoria, of which 282 were fatal, 1,656 resulted in serious injury and 3,684 resulted in other injury. About 40% of truck crashes involved articulated trucks and 60% involved rigid trucks. A higher proportion of articulated truck crashes resulted in fatalities compared with rigid truck crashes – 7% versus 4% respectively.
Overall, 316 people were killed, 2,077 were seriously injured and 5,342 sustained some other injury in truck crashes in Victoria in 1996-2000. Of those killed, 177 were involved in articulated truck crashes and 147 were involved in rigid truck crashes.
Of the people killed in truck crashes, 64% were car occupants, 16% were truck occupants, 9% were pedestrians, 6% were motorcyclists and 4% were bicyclists. At lower levels of severity, the representation of truck occupants increased and the representation of other road users decreased.

50 MONASH UNIVERSITY ACCIDENT RESEARCH CENTRE
Articulated truck crashes were more likely to result in death or serious injury to the truck occupant than rigid truck crashes. Almost 20% of people killed in articulated vehicle crashes were occupants of the articulated truck and an additional 2% were occupants of rigid trucks involved in collisions with articulated trucks. Of the people killed in rigid truck crashes, 12% were occupants of the rigid truck.
About 80% of the crashes occurred during daylight hours (a lower proportion for articulated than rigid truck crashes), possibly reflecting their pattern of use. Night-time crashes were generally more severe than daytime crashes. This may reflect higher travel speeds at night because of less traffic congestion.
About three-quarters of the crashes occurred in metropolitan areas, although the proportion was lower for articulated than rigid truck crashes. Fatal crashes involving articulated trucks were more common in rural areas than in the metropolitan area. Articulated truck crashes were more likely to have occurred in higher speed zones than rigid truck crashes. For trucks overall, low speed areas had the highest number of injury crashes, followed by high speed areas and then mid-speed areas. The proportion of crashes resulting in death or serious injury increased with speed zone. In low speed zones and high speed zones, articulated truck crashes were more likely to be fatal than rigid truck crashes.
About half of the crashes occurred at intersections (a lower proportion for articulated than rigid truck crashes). In the metropolitan area, similar proportions of articulated and rigid truck crashes occurred at intersections.
The most common type of crash for both articulated and rigid trucks involved vehicles travelling in the same direction. For both articulated and rigid trucks, the largest number of fatal crashes involved a collision between vehicles travelling in opposing directions – ‘head-on’ crashes. Same direction crashes were the most common type of serious injury and other injury crash for both articulated and rigid trucks.
A traffic control device was present in 32% of metropolitan crashes and 17% of rural crashes. In metropolitan areas, traffic control devices were equally common at the sites of articulated and rigid truck crashes. In rural areas, traffic control devices were more likely to be found at the sites of rigid truck crashes than articulated truck crashes. Stop-go lights were the most traffic control devices at the sites of truck crashes in metropolitan areas. For articulated truck crashes in rural areas, the most likely traffic control device present was a give-way sign. For rigid truck crashes in rural areas, stop signs were the most likely traffic control present.
Most of the truck crashes at stop-go lights in metropolitan areas involved vehicles travelling in the same direction. About 20% of these crashes involved adjacent vehicles and about another 20% involved vehicles from opposing directions. The bulk of truck crashes in metropolitan areas that occurred at stop and give way signs involved adjacent vehicles. For truck crashes at give-way signs in rural areas, the most likely crash category was “adjacent vehicle”.
The most common age group of truck drivers in crashes was 31 to 40 years old, followed by 41 to 50 years old. “Years of driving experience”was missing from the database for most drivers. There were very few female truck drivers. The majority of truck drivers were licensed in Victoria, with NSW representing the second largest group. While the vast majority of trucks involved in crashes were registered in Victoria, the second most common state of registration for articulated trucks was South Australia.
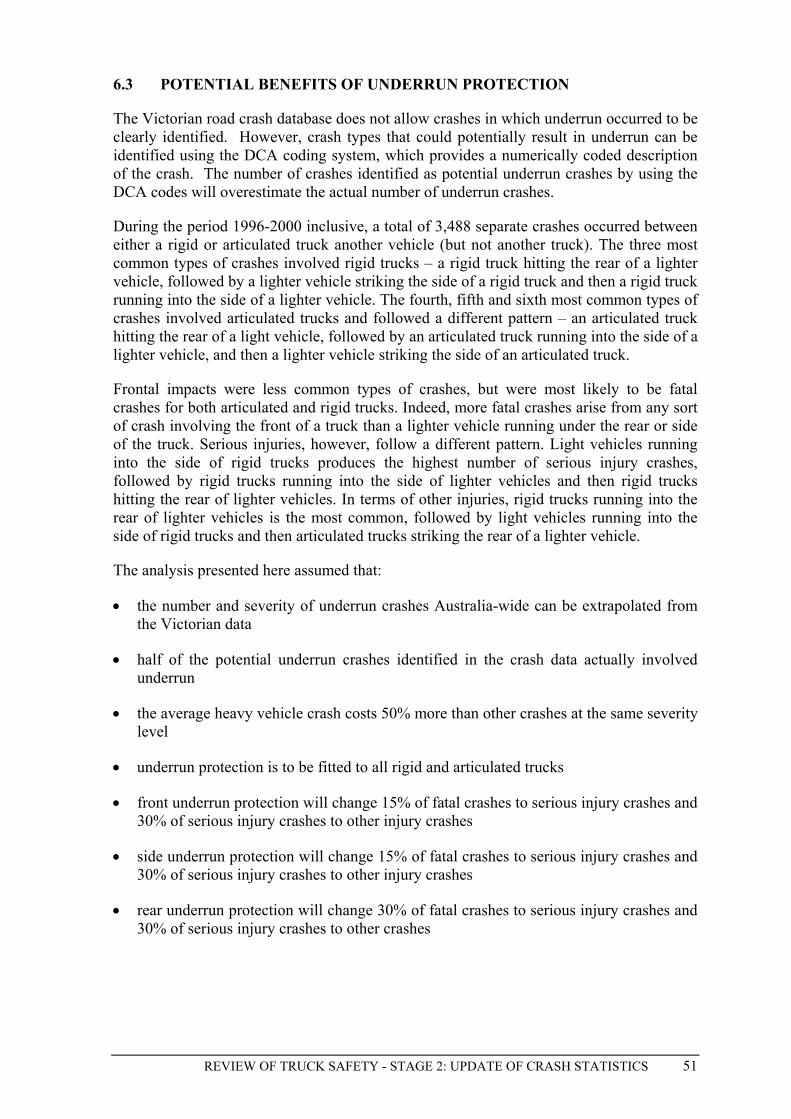
REVIEW OF TRUCK SAFETY - STAGE 2: UPDATE OF CRASH STATISTICS 51
6.3 POTENTIAL BENEFITS OF UNDERRUN PROTECTION
The Victorian road crash database does not allow crashes in which underrun occurred to be clearly identified. However, crash types that could potentially result in underrun can be identified using the DCA coding system, which provides a numerically coded description of the crash. The number of crashes identified as potential underrun crashes by using the DCA codes will overestimate the actual number of underrun crashes.
During the period 1996-2000 inclusive, a total of 3,488 separate crashes occurred between either a rigid or articulated truck another vehicle (but not another truck). The three most common types of crashes involved rigid trucks – a rigid truck hitting the rear of a lighter vehicle, followed by a lighter vehicle striking the side of a rigid truck and then a rigid truck running into the side of a lighter vehicle. The fourth, fifth and sixth most common types of crashes involved articulated trucks and followed a different pattern – an articulated truck hitting the rear of a light vehicle, followed by an articulated truck running into the side of a lighter vehicle, and then a lighter vehicle striking the side of an articulated truck.
Frontal impacts were less common types of crashes, but were most likely to be fatal crashes for both articulated and rigid trucks. Indeed, more fatal crashes arise from any sort of crash involving the front of a truck than a lighter vehicle running under the rear or side of the truck. Serious injuries, however, follow a different pattern. Light vehicles running into the side of rigid trucks produces the highest number of serious injury crashes, followed by rigid trucks running into the side of lighter vehicles and then rigid trucks hitting the rear of lighter vehicles. In terms of other injuries, rigid trucks running into the rear of lighter vehicles is the most common, followed by light vehicles running into the side of rigid trucks and then articulated trucks striking the rear of a lighter vehicle.
The analysis presented here assumed that:
• the number and severity of underrun crashes Australia-wide can be extrapolated from the Victorian data
• half of the potential underrun crashes identified in the crash data actually involved underrun
• the average heavy vehicle crash costs 50% more than other crashes at the same severity level
• underrun protection is to be fitted to all rigid and articulated trucks
• front underrun protection will change 15% of fatal crashes to serious injury crashes and 30% of serious injury crashes to other injury crashes
• side underrun protection will change 15% of fatal crashes to serious injury crashes and 30% of serious injury crashes to other injury crashes
• rear underrun protection will change 30% of fatal crashes to serious injury crashes and 30% of serious injury crashes to other crashes

52 MONASH UNIVERSITY ACCIDENT RESEARCH CENTRE
Benefit:cost ratios (BCRs) were estimated for the following scenarios:
• A package of front, side and rear underrun costing $500 per vehicle
• A package of front, side and rear underrun costing $1,000 per vehicle
• Front underrun protection costing $100 per vehicle
• Front underrun protection costing $200 per vehicle
• Side underrun protection costing $200 per vehicle
• Rear underrun protection costing $200 per vehicle
For all of the underrun protection measures included, the BCRs were higher for articulated trucks than rigid trucks. The BCRs were higher when a 15-year lifetime was assumed, than when a 25-year lifetime was assumed.
A package of front, side and rear underrun had a BCR of greater than 1 for both articulated trucks and rigid trucks, whether a 17- or 25- year lifetime is assumed. Not surprisingly, the BCR was doubled if the package cost $500, compared to if the package cost $1,000.
The BCRs also exceeded 1 for each type of underrun protection – front (at a cost of either $100 or $200), side or rear – for both articulated trucks and rigid trucks; again regardless of the lifetime. The BCRs were considerably larger for front underrun protection than for side underrun protection, with the lowest BCRs found for rear underrun protection.

REVIEW OF TRUCK SAFETY - STAGE 2: UPDATE OF CRASH STATISTICS 53
REFERENCES
Australian Bureau of Statistics. (2001). Survey of Motor Vehicle Use - 12 Months Ended 31 October 2000 (9208.0). Canberra: 2001.
Rechnitzer, G. (1993). Truck involved crash study. Fatal and injury crashes of cars and other road users with the front and sides of heavy vehicles (Report 35). Melbourne: Monash University Accident Research Centre.
Rechnitzer, G. and Foong, C.W. (1991). Truck involved crash study. Report on fatal and injury crashes of cars into the rear of trucks (Report 26). Melbourne: Monash University Accident Research Centre.

54 MONASH UNIVERSITY ACCIDENT RESEARCH CENTRE

REVIEW OF TRUCK SAFETY - STAGE 2: UPDATE OF CRASH STATISTICS 55
APPENDIX 1: CALCULATIONS OF BENEFIT:COST RATIOS
Underrun protection package Cost Discount 7% and 15 years=0.362 Package 1=$500 Discount 7% and 25 years=0.175 Package 2=$1000 Lifetime 15yrs Crash cost saving Discount Benefit No. vehs Cost BCR PACKAGE 1, artics 1366643.2 0.362 494724.8 60,000 30000 16.5 PACKAGE 1, rigids 2304604.5 0.362 834266.8 340,000 170000 4.9 PACKAGE 1, all trucks 3671247.7 0.362 1328991.7 400,000 200000 6.6 PACKAGE 2, artics 1366643.2 0.362 494724.8 60,000 60000 8.2 PACKAGE 2, rigids 2304604.5 0.362 834266.8 340,000 340000 2.5 PACKAGE 2, all trucks 3671247.7 0.362 1328991.7 400,000 400000 3.3 Lifetime 25yrs Crash cost saving Discount Benefit No. vehs Cost BCR PACKAGE 1, artics 2277738.7 0.175 398604.3 60,000 30000 13.3 PACKAGE 1, rigids 3841007.5 0.175 672176.3 340,000 170000 4.0 PACKAGE 1, all trucks 6118746.2 0.175 1070780.6 400,000 200000 5.4 PACKAGE 2, artics 2277738.7 0.175 398604.3 60,000 60000 6.6 PACKAGE 2, rigids 3841007.5 0.175 672176.3 340,000 340000 2.0 PACKAGE 2, all trucks 6118746.2 0.175 1070780.6 400,000 400000 2.7
Rear underrun protection Discount 7% and 15 years=0.362 Cost=$200 Discount 7% and 25 years=0.175
Lifetime 15yrs Crash cost saving Discount Benefit No. vehs Cost BCR artics 158258.6 0.362 57289.6 60,000 12000 4.8 rigids 329041.0 0.362 119112.8 340,000 68000 1.8 all trucks 487299.5 0.362 176402.4 400,000 80000 2.2
Lifetime 25yrs Crash cost saving Discount Benefit No. vehs Cost BCR artics 263764.3 0.175 46158.7 60,000 12000 3.8 rigids 548401.6 0.175 95970.3 340,000 68000 1.4 all trucks 812165.9 0.175 142129.0 400,000 80000 1.8
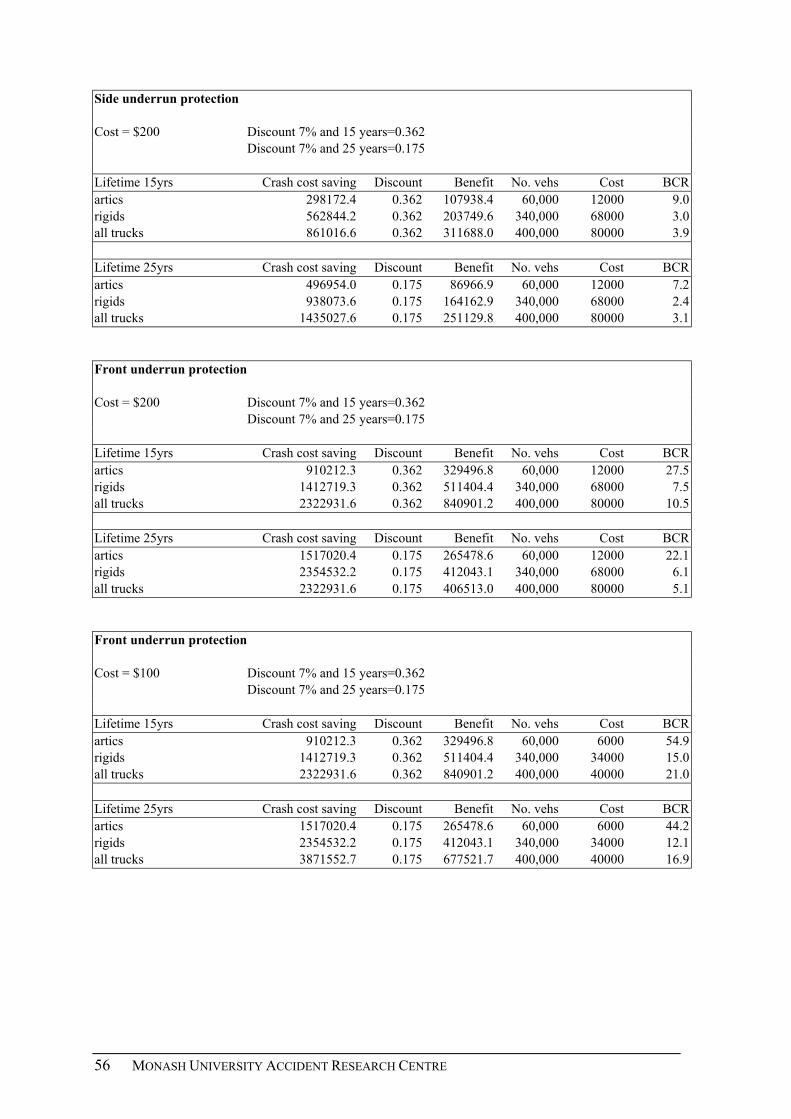
56 MONASH UNIVERSITY ACCIDENT RESEARCH CENTRE
Side underrun protection Cost = $200 Discount 7% and 15 years=0.362
Discount 7% and 25 years=0.175
Lifetime 15yrs Crash cost saving Discount Benefit No. vehs Cost BCR artics 298172.4 0.362 107938.4 60,000 12000 9.0 rigids 562844.2 0.362 203749.6 340,000 68000 3.0 all trucks 861016.6 0.362 311688.0 400,000 80000 3.9
Lifetime 25yrs Crash cost saving Discount Benefit No. vehs Cost BCR artics 496954.0 0.175 86966.9 60,000 12000 7.2 rigids 938073.6 0.175 164162.9 340,000 68000 2.4 all trucks 1435027.6 0.175 251129.8 400,000 80000 3.1
Front underrun protection Cost = $200 Discount 7% and 15 years=0.362
Discount 7% and 25 years=0.175
Lifetime 15yrs Crash cost saving Discount Benefit No. vehs Cost BCR artics 910212.3 0.362 329496.8 60,000 12000 27.5 rigids 1412719.3 0.362 511404.4 340,000 68000 7.5 all trucks 2322931.6 0.362 840901.2 400,000 80000 10.5
Lifetime 25yrs Crash cost saving Discount Benefit No. vehs Cost BCR artics 1517020.4 0.175 265478.6 60,000 12000 22.1 rigids 2354532.2 0.175 412043.1 340,000 68000 6.1 all trucks 2322931.6 0.175 406513.0 400,000 80000 5.1
Front underrun protection Cost = $100 Discount 7% and 15 years=0.362 Discount 7% and 25 years=0.175
Lifetime 15yrs Crash cost saving Discount Benefit No. vehs Cost BCR artics 910212.3 0.362 329496.8 60,000 6000 54.9 rigids 1412719.3 0.362 511404.4 340,000 34000 15.0 all trucks 2322931.6 0.362 840901.2 400,000 40000 21.0
Lifetime 25yrs Crash cost saving Discount Benefit No. vehs Cost BCR artics 1517020.4 0.175 265478.6 60,000 6000 44.2 rigids 2354532.2 0.175 412043.1 340,000 34000 12.1 all trucks 3871552.7 0.175 677521.7 400,000 40000 16.9