Review of root dynamics in forest ecosystems grouped by climate, climatic forest type and species
61
Plant and Soil 187: 159-219, 1996. © 1996 KluwerAcademic Publishers. Printed in the Netherlands. 159 Review of root dynamics in forest ecosystems grouped by climate, climatic forest type and species Kristiina A. Vogt, Daniel J. Vogt, Peter A. Palmiotto, Paul Boon, Jennifer O'Hara and Heidi Asbjornsen School of Forestry and Environmental Studies, 370 Prospect St., Yale University, New Haven, CT 06511, USA* Received 8 January 1996. Accepted in revised form 27 July 1996 Key words: above- and belowground biomass and production, above- and belowground litter transfers, boreal forests, climatic variables, cold and warm temperate forests, forest floor accumulations, nutrients, soil organic matter, subtropical and tropical forests Abstract Patterns of both above- and belowground biomass and production were evaluated using published information from 200 individual data-sets. Data sets were comprised of the following types of information: organic matter storage in living and dead biomass (e.g. surface organic horizons and soil organic matter accumulations), above- and belowground net primary production (NPP) and biomass, litter transfers, climatic data (i.e. precipitation and temperature), and nutrient storage (N, P, Ca, K) in above- and belowground biomass, soil organic matter and litter transfers. Forests were grouped by climate, foliage life-span, species and soil order. Several climatic and nutrient variables were regressed against fine root biomass or net primary production to determine what variables were most useful in predicting their dynamics. There were no significant or consistent patterns for above- and belowground biomass accumulation or NPP change across the different climatic forest types and by soil order. Similarly, there were no consistent patterns of soil organic matter (SOM) accumulation by climatic forest type but SOM varied significantly by soil order- the chemistry of the soil was more important in determining the amount of organic matter accumulation than climate. Soil orders which were high in aluminum, iron, and clay (e.g. Ultisols, Oxisols) had high total living and dead organic matter accumulations - especially in the cold temperate zone and in the tropics. Climatic variables and nutrient storage pools (i.e. in the forest floor) successfully predicted fine root NPP but not fine root biomass which was better predicted by nutrients in litterfall. The importance of grouping information by species based on their adaptive strategies for water and nutrient-use is suggested by the data. Some species groups did not appear to be sensitive to large changes in either climatic or nutrient variables while for others these variables explained a large proportion of the variation in fine root biomass and/or NPP. Introduction The issue of global climate change has inspired a plethora of research efforts concerning the effects of climate change (e.g. elevated CO2) on plant growth rates and the ability of plants to sequester carbon (Anderson, 1991; Cannell and Dewar, 1994; Lands- berg et al., 1991, 1995). At the ecosystem level, this research has focused on the development and refine- ment of models which can be used to predict the impact * Fax No: + 12034323929. E-mail: KDVOGT@ YALEVM.CIS.YALE>EDU of human induced stress on forests (Aber and Federer, 1992; Landsberg, et al., 1995; Rastetter et al., 1992; Running and Hunt, 1993). The development of these models has been limited by a poor understanding of the mechanisms which control carbon allocation to leaves, fine roots, stems, stored carbohydrates and secondary plant defensive chemicals (Waring, 1987), and how these relationships vary by plant species (Lambers and Poorter, 1992). The ability to effectively predict the impacts that climate change will have on the carbon cycle has been further hindered since half of the sys-
-
Upload
independent -
Category
Documents
-
view
1 -
download
0
Transcript of Review of root dynamics in forest ecosystems grouped by climate, climatic forest type and species
Plant and Soil 187: 159-219, 1996. © 1996 KluwerAcademic Publishers. Printed in the Netherlands.
159
Review of root dynamics in forest ecosystems grouped by climate, climatic forest type and species
Kristiina A. Vogt, Daniel J. Vogt, Peter A. Palmiotto, Paul Boon, Jennifer O ' H a r a and
Heidi Asbjornsen School of Forestry and Environmental Studies, 370 Prospect St., Yale University, New Haven, CT 06511, USA*
Received 8 January 1996. Accepted in revised form 27 July 1996
Key words: above- and belowground biomass and production, above- and belowground litter transfers, boreal forests, climatic variables, cold and warm temperate forests, forest floor accumulations, nutrients, soil organic matter, subtropical and tropical forests
Abstract
Patterns of both above- and belowground biomass and production were evaluated using published information from 200 individual data-sets. Data sets were comprised of the following types of information: organic matter storage in living and dead biomass (e.g. surface organic horizons and soil organic matter accumulations), above- and belowground net primary production (NPP) and biomass, litter transfers, climatic data (i.e. precipitation and temperature), and nutrient storage (N, P, Ca, K) in above- and belowground biomass, soil organic matter and litter transfers. Forests were grouped by climate, foliage life-span, species and soil order. Several climatic and nutrient variables were regressed against fine root biomass or net primary production to determine what variables were most useful in predicting their dynamics. There were no significant or consistent patterns for above- and belowground biomass accumulation or NPP change across the different climatic forest types and by soil order. Similarly, there were no consistent patterns of soil organic matter (SOM) accumulation by climatic forest type but SOM varied significantly by soil order- the chemistry of the soil was more important in determining the amount of organic matter accumulation than climate. Soil orders which were high in aluminum, iron, and clay (e.g. Ultisols, Oxisols) had high total living and dead organic matter accumulations - especially in the cold temperate zone and in the tropics. Climatic variables and nutrient storage pools (i.e. in the forest floor) successfully predicted fine root NPP but not fine root biomass which was better predicted by nutrients in litterfall. The importance of grouping information by species based on their adaptive strategies for water and nutrient-use is suggested by the data. Some species groups did not appear to be sensitive to large changes in either climatic or nutrient variables while for others these variables explained a large proportion of the variation in fine root biomass and/or NPP.
Introduction
The issue of global climate change has inspired a plethora of research efforts concerning the effects of climate change (e.g. elevated CO2) on plant growth rates and the ability of plants to sequester carbon (Anderson, 1991; Cannell and Dewar, 1994; Lands- berg et al., 1991, 1995). At the ecosystem level, this research has focused on the development and refine- ment of models which can be used to predict the impact
* Fax No: + 1 2 0 3 4 3 2 3 9 2 9 .
E-mail: KDVOGT@ YALEVM.CIS.YALE>EDU
of human induced stress on forests (Aber and Federer, 1992; Landsberg, et al., 1995; Rastetter et al., 1992; Running and Hunt, 1993). The development of these models has been limited by a poor understanding of the mechanisms which control carbon allocation to leaves, fine roots, stems, stored carbohydrates and secondary plant defensive chemicals (Waring, 1987), and how these relationships vary by plant species (Lambers and Poorter, 1992). The ability to effectively predict the impacts that climate change will have on the carbon cycle has been further hindered since half of the sys-
160
tem's response may be occurring belowground, mak- ing these effects difficult to study (Vogt et al., 1993).
In order to predict the growth rate of trees in forests and the ability of these systems to sequester carbon under different climate scenarios, an understanding of the natural patterns and factors controlling carbon allo- cation within plants is required. Much research has been completed on how plants allocate carbon within aboveground vegetative structures since these compo- nents are relatively easy to monitor and measure (Baz- zaz et al., 1987; Chapin, 1991; Chapin et al., 1987; Coley 1988; Field, 1991; Lambers and Poorter, 1992; Reich et al., 1992; Waring, 1987). However, this con- trasts with our poor understanding of the belowground processes because of the methodological difficulties and dynamic nature associated with studying this por- tion of the system. If the coarse structural roots con- tributed most significantly to the carbon storage and transfers occurring in the ecosystem, understanding the role of the belowground in ecosystems would be relatively simple since their dynamics can be predicted from aboveground parameters (e.g. diameter at breast heights of trees) (Santantonio, 1990). Furthermore, on a weight basis, coarse roots contribute more to the total ecosystem biomass (on average globally, about a quar- ter of total biomass) than fine roots (Vogt et al., 1987). However, biomass values are relatively static and do not reflect the annual changes that can occur below- ground or how a system responds to disturbance. For example, even though fine roots may contribute less than 2% of the total ecosystem biomass, they may contribute up to 40% of the total ecosystem production (Vogt et al., 1990). This, means that when examining carbon allocation in forests, the fine root component (similar to the foliage in the aboveground) may be very sensitive to environmental change and thus may respond most strongly to a disturbance (Vogt et al., 1993).
The majority of model predictions have not includ- ed data from several belowground parts of ecosystems (e.g. fine roots, exudation, mycorrhizas, respiration, decomposer organisms - soil animals, bacteria, and fungi) since it is unclear how they should be included as part of the ecosystem response to stress. An addi- tional problem modelers have had is how to use data, from a few intensively studied sites scattered around the world, to identify general response variables that could be considered common to all sites (Brown and Lugo, 1982; Cole and Rapp, 1982; O'Neill and DeAn- gelis, 1982; Post et al., 1982; Schlesinger, 1977; Vogt et al., 1986, 1995; Vogt, 1991), For example, attempts
have been made to predict fine root biomass, produc- tion and turnover rates by using measurements taken from aboveground vegetative structures as a way of bridging this data gap (Marshal and Waring, 1985; Raich and Nadelhoffer, 1989; Vogt et al., 1985), how- ever, these measurements are frequently site specific and not transferable to other sites.
The objectives of this paper were to generate broad- scale patterns of root growth variability to show how the grouping level of analysis are important to consid- er when attempting to predict root growth and senes- cence. Another objective was to identify at what scale fine root information was most sensitively predicted by a variety of abiotic and biotic factors. Many compar- isons have been made at the level of comparing hard- woods to conifers or deciduous species to evergreen species (Reich et al., 1992) and then generalizing that information in models. This does not address the fact that these higher level analyses or lumping of informa- tion from several levels may minimize the ability to predict how growth or senescence is being controlled at the ecosystem level (Vogt et al., 1996). Nor does these groupings deal with the fact that differences in plant allocation of carbon may vary substantially with- in each group since different relative growth rates may exist within each broad-scale grouping category (Lam- bers and Poorter, 1992). It is important to identify which parameters may transcend as relevant predic- tive variables across different grouping levels at vari- ous spatial scales. This large data-set which includes research from the tropics to the boreal zones is quite useful to begin grouping information at different levels and to begin teasing apart where fine root biomass and production can be most effectively predicted. The rela- tionships produced using this large data-set should be used to help design research that would further exam- ine these patterns. This type of information is crucial to know when attempting to incorporate the belowground parameters into models of carbon dynamics in forest ecosystems. When determining carbon budgets, most large scale forest models do not incorporate variables which accurately portray the magnitude of carbon allo- cation to belowground processes.
Using a larger data-base (200 data-sets), we were interested in determining if the few variables identi- fied in the 1970--80's (Aber et al., 1985; Vogt et al., 1986) were able to predict carbon allocation patterns for fine root biomass and production of ecosystems ranging from the boreal to the tropical zones. In addi- tion to expanding the temperate zone data base, our analyses include a greater expanded data base from the
wet and dry tropics. The purpose of this paper was to explore the relationships between fine roots and abiotic variables which have been poorly studied in the past. Since fine roots can contribute a sizable proportion of ecosystem net primary production and few clear rela- tionships have been developed for fine roots (Vogt et al., 1986), it is worthwhile exploring general patterns of root growth and what factors might be useful to predict this growth.
A p p r o a c h
The data-set synthesized in this paper includes only those studies for which fine root data were available (Appendix B). A large synthesized data base already exists for belowground biomass that is derived from estimates of coarse structural roots (see Cannell, 1982) and are not included in our data-base. The data-set in this paper also excluded fine root studies conducted in agroforestry systems as well as studies reporting fine root biomass values obtained from one sampling time where seasonal patterns of root growth were not available.
No attempt was made to standardize fine root data reported in the literature. Fine root data synthesized in Appendix B show the inconsistent and variable diam- eters selected by researchers to define their fine root category. In general, fine roots were classified as being <2 mm or <5 mm in diameter. Since the contribution to biomass by the >2-5 mm diameter roots is generally small (Vogt et al., 1989), comparing data with differ- ent diameter sizes is not unrealistic. In addition, the biomass data on fine roots do not include carbon lost from roots due to respiration or as exudation (Lambers and Poorter, 1992). The inability to account for these fluxes results in most carbon budgets underestimating the total carbon flows occurring in an ecosystem. If future studies verify the suggested carbon rhizodeposi- tion value of approximately 5% (Lambers and Poorter, 1992) for mature plants, not accounting for these flux- es may not be a problem since these levels are within the error term of the biomass values themselves.
The data were first analyzed as a whole using a four-way ANOVA GLM procedure SAS (Appendix A). This was followed by analyses (ANOVA) which used groupings of data by climate, climatic forest types, soil orders, and finally by species. Regressions were developed on log transformed data at the level of leaf life-span (i.e. evergreen, deciduous, semi decid- uous), climatic forest type climatic forest types (cold
161
temperate broadleaf deciduous, cold temperate needle- leaf evergreen, warm temperate broadleaf deciduous, warm temperate needleleaf evergreen, mediterranean needleleaf evergreen, mediterranean broadleaf ever- green, subtropical broadleaf deciduous, subtropical broadleaf evergreen, tropical broadleaf deciduous and tropical broadleaf evergreen), soil order, climatic forest type x soil order, soil texture (14 classes were ordered by coarseness and given numeric values for regres- sion analysis: sand, loamy sand, sandy loam, fine sand loam, very fine sandy loam, loam, silt loam, silt, sandy clay loam, silt loam, clay loam, sandy clay, silt clay, clay), and species (i.e. conifers excluding pines, pines (as a group followed by separating them into climate groupings: cold temperate, warm temperate + subtrop- ical, tropical), oaks, hardwoods excluding oaks (as a group followed by separating them into climate group- ing as above). The species groupings were selected because they are common species for which data has been collected by researchers around the world and prior analyses suggested that they respond as a group to abiotic variables.
In the analysis of the data-set (Appendix B), only stands that had reached canopy closure or were mature were included (in the tropics this consisted of stands older than 8 years old and in the remaining climatic zones this included all stands older than 20 years of age). Also, sites that had been manipulated (i.e. fer- tilized, irrigated or received applications of saw-dust or were spacing trials) were excluded from these anal- yses. As a result of this selection criteria most of the analyses were conducted on 173 of the 200 data points.
Variables utilized to determine what factors pre- dicted fine root biomass and net primary production were selected because previous research had identified them as important across the diversity of climatic forest types. Only variables for which there existed plausible mechanistic explanations were used in these analy- ses. Factors analyzed in this paper were also limited by what data had been synthesized from the literature - the incompleteness of these data is apparent from an examination of Appendix B. For example, certain climatic data (precipitation; average mean, minimum and maximum temperatures) were frequently reported by authors in their papers however, information on soil water or nutrient availabilities were commonly lacking (Appendix B).
Water availability to plants was indexed using annual precipitation and soil texture data. Ideally, estimates of the actual evapotranspiration (AET) for each site would have been the best variable to deter-

162
mine plant available water (Pallardy et al., 1995). Since only two sites out of the 200 study sites pre- sented AET data, and climatic information to cal- culate this for the other sites was not readily avail- able, we were unable to calculate AET for use in our analyses. Annual precipitation data was also used in this analysis although in many of the tropical areas, seasonal precipitation patterns are probably more important in controlling biomass accumulation and production than annual precipitation data. How- ever, because most studies presented annual precipita- tion values, comparisons were made at this level. The climatic variables included in this study consisted of mean annual temperature, minimum annual tempera- ture, maximum annual temperature, annual precipita- tion, mean temperature/precipitation ratio, minimum temperature/precipitation ratio, maximum tempera- ture/precipitation ratio. The temperature/precipitation ratios have been shown to be useful in explaining plant growth in the tropics and root biomass accumula- tion across large vegetative climatic groups (Lugo and Brown, 1982; Vogt et al., 1986).
Those nutrients which have been shown to control photosynthetic rates or for which fertilization additions have shown strong growth responses were included in these analyses (Chapin et al., 1987; Reich et al., 1992; Schulze, 1982; Vogt et al., 1990). Plant available nutrients were examined using parameters that have been shown to reflect the cycling of these nutrients on the site - the magnitude of tree cycling of nutrients in litterfall and by the accumulation rates and residence times of nutrients in surface organic horizons (N, P, Ca, K contents of aboveground litterfall; N/P, N/Ca and N/K ratios of aboveground litterfall; forest floor N, P, Ca, K contents and mean residence times).
Statistical analyses were performed using SAS (version, 6.11) for all data computations, linear regres- sions, one-way analysis of variance, four-way analysis of variance, and multiple comparisons of means using the Student-Newman-Keuls test at p - 0.10. Log trans- formations were use to normalize the distribution of the dependent variables. Correlations (Pearson) were ini- tially developed for individual parameters to determine how much of the variation in fine root biomass or pro- duction could be explained by one variable. Because plants are exposed to multiple stresses (Pallardy et al., 1995) it would be appropriate to use multiple regres- sion techniques as a predictive tool. However, due to the incompleteness of the data published, the number of data-sets used and comparisons made in the multiple regression analysis were dramatically reduced.
Results and discussion
Large scale biomass and productivity comparisons by climatic forest type and soil order
Above- and belowground biomass At the largest scale of analysis where no grouping of data had occurred, a four-way ANOVA showed that aboveground and belowground biomass are sig- nificantly correlated to climate and there is a signif- icant interaction term between climate and soil order (Appendix A). However, predicting how above- and belowground biomass accumulations vary by forest climatic type and within soil order groupings within each forest type is hampered by this grouping approach showing no significant differences in the amount of measurable above- and/or belowground biomass from the boreal to the tropics (climate groupings) (Table 1). High within group variation in recorded above- and belowground biomasses by climatic forest types makes it impossible to isolate significant group differences.
Separation of aboveground biomass data by soil order within climatic forest groupings did show that when high aboveground biomasses (> 300 Mg ha - l ) were recorded for forests that they tended to be found growing on Ultisols, Inceptisols, Oxisols, Alfisols and Spodosols in the cold temperate and tropical zones (Table 1). This does not mean that above- ground biomasses were always > 300 Mg ha - l within these groupings but the potential for measuring high biomasses did occur within these groupings. Above- ground biomasses > 300 Mg ha- 1 were not recorded in the boreal, warm temperate or subtropical zones (Table 1), Deciduous forests growing on the same soil series as the evergreen and semi-deciduous forests also tend- ed to accumulate less aboveground (and total) biomass (Table 1).
Based on a much smaller data-base, Schulze (1982) noted that conifers growing in the boreal and temper- ate zone appeared to achieve much higher aboveground biomass values than the broad-leaved forests located in the temperate and tropical zones. The expanded data- set of this paper show that some tropical areas may have higher aboveground biomasses than previously documented. The low biomasses recorded in the sub- tropical forests are probably related to the dominant disturbance cycle which affects the forests where most of this data was collected. Hurricanes are common on several of the subtropical sites and appear to maintain these forests in early successional stages (i.e. stages
163
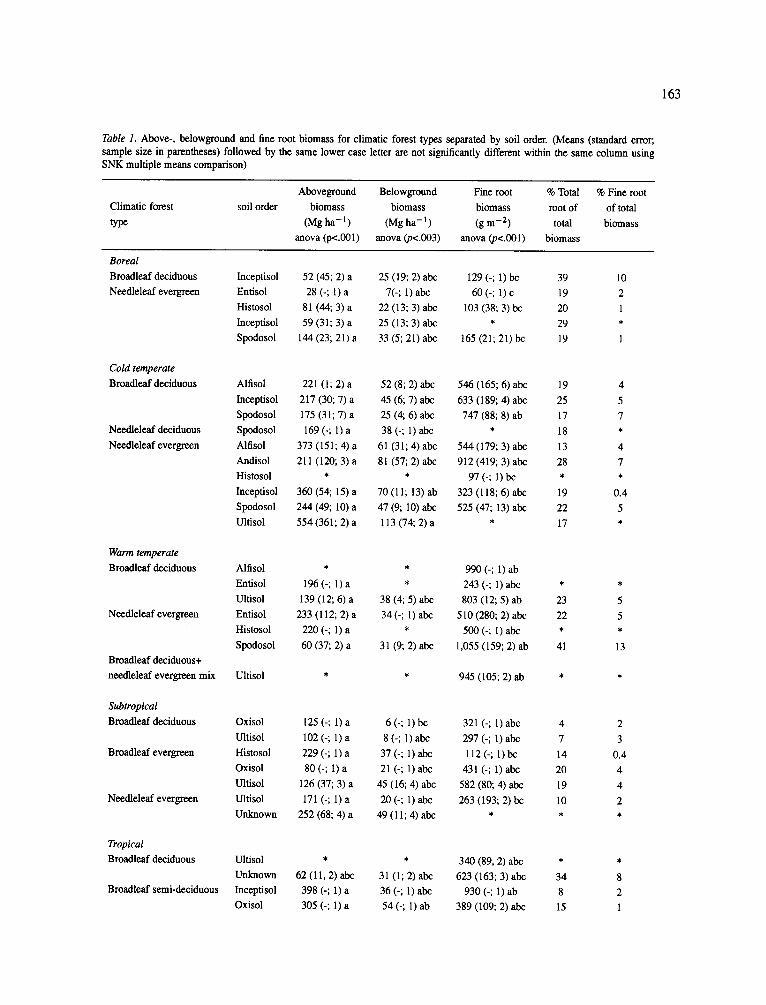
Table 1. Above-, belowground and fine root biomass for climatic forest types separated by soil order. (Means (standard error; sample size in parentheses) followed by the same lower case letter are not significantly different within the same column using SNK multiple means comparison)
Aboveground Belowground Fine root % Total % Fine root
Climatic forest soil order biomass biomass biomass root of of total
type (Mg ha -1 ) (Mg ha -1 ) (gm -2) total biomass
anova (p<.001) anova (p<.003) anova (p<.001) biomass
Boreal Broadleaf deciduous
Needleleaf evergreen
Cold temperate
Broadleaf deciduous
Needleleaf deciduous
Needleleaf evergreen
Warm temperate Broadleaf deciduous
Needleleaf evergreen
Broadleaf deciduous+
needleleaf evergreen mix
Subtropical Broadleaf deciduous
Broadleaf evergreen
Needleleaf evergreen
Tropical Broadleaf deciduous
Broadleaf semi-deciduous
Inceptisol 52 (45; 2) a 25 (19; 2) abc 129 (-; 1) bc 39 10
Entisol 28 (-; I) a 7(-; 1) abc 60 (-; 1) c 19 2
Histosol 81 (44; 3) a 22 (13; 3) abc 103 (38; 3) bc 20 1
Inceptisol 59 (31; 3) a 25 (13; 3) abc * 29 *
Spodosol 144 (23; 21) a 33 (5; 21) abc 165 (21; 21) bc 19 1
Alfisol 221 (1; 2) a 52 (8; 2) abc 546 (165; 6) abc 19 4
Inceptisol 217 (30; 7) a 45 (6; 7) abc 633 (189; 4) abc 25 5
Spodosol 175 (31; 7) a 25 (4; 6) abc 747 (88; 8) ab 17 7
Spodosol 169 (-; 1) a 38 (-; 1) abc * 18 *
Alfisol 373 (151; 4) a 61 (31; 4) abc 544 (179; 3) abc 13 4
Andisol 211 (120; 3) a 81 (57; 2) abc 912 (419; 3) abc 28 7
Histosol * * 97 (-; 1) bc * *
Inceptisol 360(54; 15)a 70(11; 13) ab 323 (118; 6) abc 19 0.4
Spodosol 244 (49; 10) a 47 (9; 10) abc 525 (47; 13) abc 22 5
Ultisol 554 (361; 2) a 113 (74; 2) a * 17 *
Alfisol * * 990 (-; 1) ab
Entisol 196 (-; 1) a * 243 (-; 1) abc * *
Ultisol 139 (12; 6) a 38 (4; 5) abc 803 (12; 5) ab 23 5
Entisol 233 (112; 2) a 34 (-; 1) abc 510 (280; 2) abc 22 5
Histosol 220 (-; 1) a * 500 (-; I) abc * *
Spodosol 60 (37; 2) a 31 (9; 2) abc 1,055 (159; 2) ab 41 13
Ultisol * * 945 (105; 2) ab * *
Oxisol 125 (-; 1) a 6 (-; 1)bc 321 (-; 1) abc 4 2
Ultisol 102 (-; 1) a 8 (-; 1) abc 297 (-; 1) abc 7 3
Histosol 229 (-; 1) a 37 (-; 1) abc 112 (-; 1) bc 14 0.4
Oxisol 80 (-; 1) a 21 (-, 1) abc 431 (-; 1) abc 20 4
Ultisol 126 (37; 3) a 45 (16; 4) abc 582 (80; 4) abc 19 4
Ultisol 171 (-; 1) a 20 (-; 1) abc 263 (193; 2) bc 10 2
Unknown 252 (68; 4) a 49 (1 I; 4) abc * * *
Ultisol * * 340 (89, 2) abc * *
Unknown 62 (11, 2) abc 31(1; 2) abc 623 (163; 3) abc 34 8 Inceptisol 398 (-; 1) a 36 (-; 1) abc 930 (-; 1) ab 8 2
Oxisol 305 (-; 1) a 54 (-; 1) ab 389 (109; 2) abc 15 1
164
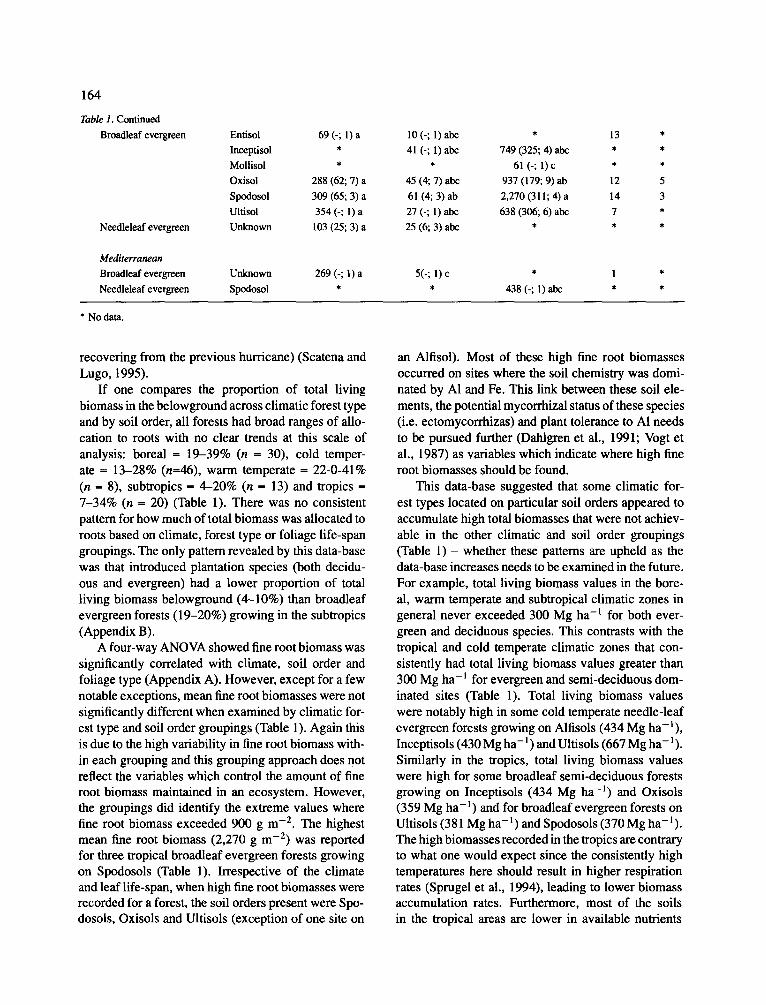
Table 1. Continued
Broadleaf evergreen Entisol
Inceptisol
MoUisol
Oxisoi
Spodosol
Ultisol
Needleleaf evergreen Unknown
Mediterranean
Broadleaf evergreen Unknown
Needleleaf evergreen Spodosol
69(-; l ) a
288 (62; 7) a
309 (65; 3) a 354 (-; 1) a
103 (25; 3) a
10 (-; 1) abc * 13 *
41 (-; 1) abc 749 (325; 4) abc * *
• 61 (-; 1) c * *
45 (4; 7) abc 937 (179; 9) ab 12 5
61 (4; 3) ab 2,270 (311; 4) a 14 3
27 (-; 1) abc 638 (306; 6) abc 7 *
25 (6; 3) abc * * *
269 (-; 1) a 5(-; 1) c * 1 *
• * 438 (-; 1) abc * *
* No data.
recovering from the previous hurricane) (Scatena and Lugo, 1995).
If one compares the proportion of total living biomass in the belowground across climatic forest type and by soil order, all forests had broad ranges of allo- cation to roots with no clear trends at this scale of analysis: boreal = 19-39% (n = 30), cold temper- ate -- 13-28% (n=46), warm temperate -- 22-0-41% (n = 8), subtropics = 4-20% (n = 13) and tropics = 7-34% (n -- 20) (Table 1). There was no consistent pattern for how much of total biomass was allocated to roots based on climate, forest type or foliage life-span groupings. The only pattern revealed by this data-base was that introduced plantation species (both decidu- ous and evergreen) had a lower proportion of total living biomass belowground (4-10%) than broadleaf evergreen forests (19-20%) growing in the subtropics (Appendix B).
A four-way ANOVA showed fine root biomass was significantly correlated with climate, soil order and foliage type (Appendix A). However, except for a few notable exceptions, mean fine root biomasses were not significantly different when examined by climatic for- est type and soil order groupings (Table 1). Again this is due to the high variability in fine root biomass with- in each grouping and this grouping approach does not reflect the variables which conlrol the amount of fine root biomass maintained in an ecosystem. However, the groupings did identify the extreme values where fine root biomass exceeded 900 g m -2. The highest mean fine root biomass (2,270 g m - E ) w a s reported for three tropical broadleaf evergreen forests growing on Spodosols (Table 1). Irrespective of the climate and leaf life-span, when high fine root biomasses were recorded for a forest, the soil orders present were Spo- dosols, Oxisols and Ultisols (exception of one site on
an Alfisol). Most of these high fine root biomasses occurred on sites where the soil chemistry was domi- nated by A1 and Fe. This link between these soil ele- ments, the potential mycorrhizal status of these species (i.e. ectomycorrhizas) and plant tolerance to AI needs to be pursued further (Dahlgren et al., 1991; Vogt et al., 1987) as variables which indicate where high fine root biomasses should be found.
This data-base suggested that some climatic for- est types located on particular soil orders appeared to accumulate high total biomasses that were not achiev- able in the other climatic and soil order groupings (Table 1) - whether these patterns are upheld as the data-base increases needs to be examined in the future. For example, total living biomass values in the bore- al, warm temperate and subtropical climatic zones in general never exceeded 300 Mg ha-1 for both ever- green and deciduous species. This contrasts with the tropical and cold temperate climatic zones that con- sistently had total living biomass values greater than 300 Mg ha- l for evergreen and semi-deciduous dom- inated sites (Table 1). Total living biomass values were notably high in some cold temperate needle-leaf evergreen forests growing on Alfisols (434 Mg ha-l) , Inceptisols (430 Mg ha- l) and Ultisols (667 Mg ha- 1). Similarly in the tropics, total living biomass values were high for some broadleaf semi-deciduous forests growing on Inceptisols (434 Mg ha - l ) and Oxisols (359 Mg ha- l) and for broadleaf evergreen forests on Ultisols (381 Mg ha - l ) and Spodosols (370 Mg ha-l) . The high biomasses recorded in the tropics are contrary to what one would expect since the consistently high temperatures here should result in higher respiration rates (Sprugel et al., 1994), leading to lower biomass accumulation rates. Furthermore, most of the soils in the tropical areas are lower in available nutrients
(Vitousek and Sanford, 1986) which should preclude high production rates. Despite this, high biomasses were recorded for forests on those soil orders char- acterized by high accumulation of soil organic matter (Vogt et al., 1995) as evidenced by the high production trends observed on Ultisols and Spodosols. The high accumulations of organic matter in the soil may result in better nutrient and water relationships for the forests growing on these sites. The high biomasses recorded in the cold-temperate zone can be explained by ever- green tree species having lower respiration rates due to the cooler annual maximum temperatures and most tree growth occurring during the winter (Waring and Franklin, 1979), a lower turnover rate of tissues (Aerts, 1995; Vogt et al., 1986) and a more efficient use of nutrients (Lambers and Poorter, 1992).
Net primary production
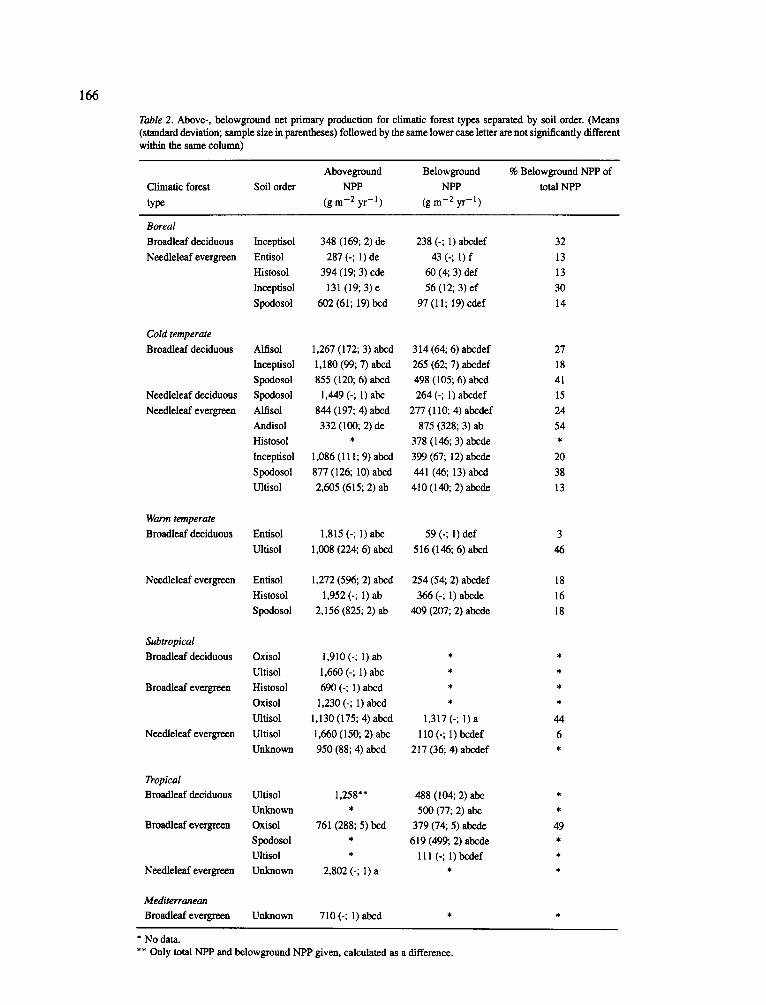
Similar to the large scale biomass comparisons, above- and below production values could be significantly grouped using climate and soil order (also foliage type for aboveground NPP) (Appendix A). However, a com- bined climatic forest types and soil order grouping was not useful in identifying clear patterns of above- and belowground NPP (Table 2). The range of variation in above- and belowground NPP were, in general, so broad within a grouping that few significant differences could be identified. However, higher total NPP values (> 1,500 g m 2 yr -1) were recorded for both deciduous and evergreen forests in the warm temperate and cold temperate zones (Table 2). Unlike the biomass compar- isons where evergreen species accumulated more total biomass, no significant differences between evergreen and deciduous forests were recorded for NPP (Table 2). The patterns recorded for aboveground NPP did not occur for belowground NPP - high aboveground NPP was not associated with a significantly lower below- ground NPP or vise-versa. This trend reflects the fact that plant responses to their environment are expressed as shifts in carbon allocation between the above- and belowground (see later discussion on nutrient controls on C allocation).
The proportion of total productivity found below- ground varied considerably (3-54%) without any con- sistent pattern by climatic forest type or soil order (Table 2). Those few sites with the highest allocations of carbon to the belowground (> 40% of total NPP) were: broadleaf evergreen forests in the tropics grow- ing on Oxisols (49%) and subtropics on Ultisols (44%); broadleaf deciduous forests on Ultisols (46%) in the
165
warm temperate zones; broadleaf deciduous forests on Spodosols (41%) and needleleaf evergreen forests on Andisols (54%) in the cold temperate zone. Even though these sites had high belowground productivities and allocated a large proportion of total productivity to fine roots, they also had a low percentage (6-7%) of total living biomass in fine roots (Table I). Again, there is no apparent relationship between the biomass of roots maintained by a forest and the amount of car- bon allocated annually to maintaining the growth and function of fine roots. The lowest allocation to below- ground production (5%) was recorded for a subtropical needle-leaf evergreen forest which was an introduced conifer species growing in a plantation (Lugo, 1992).
There is a general pattern which suggests that the highest allocations to belowground production are found in soils where high levels of A1 and Fe may lim- it plant growth - again this follows the pattern found for fine root biomass. Higher annual allocations of carbon to root growth may be a mechanism which enables these plants to avoid A1 toxicity (Dahlgren et al., 1991). The tropical forests with high annual alloca- tions to roots are also characterized by having surface root mats and apogeotrophic roots (Benzing, 1991) - both typically found where nutrient availability to plants is low (Sanford, 1987).
In contrast to the patterns found for above- and belowground biomass accumulations by forest climatic type and soil orders, high total productivities (> 2,000 g m 2 yr -1) were recorded in the warm temperate and subtropical (not including plantations) climatic zones (Tables 1 and 2). Even though high total productivities were recorded in these forests, biomass accumulations were not high due to annual losses of production to the detrital pools (i.e. droughts, hurricanes etc.) (Vogt et al., 1986). The only exception to this pattern of high productivity and low biomass accumulation occurred in three broadleaf evergreen forests in the subtropics and in two cold temperate needle-leaf evergreen forests both growing on Ultisols (Tables 1 and 2).
Detrital transfers, organic matter accumulations by climatic forest type and soil order groupings Our earlier analyses indicated that knowledge of allo- cation patterns for both above- and belowground biomass does not enable prediction of ecosystem pro- duction. Part of this is due to the fact that the turnover rate of above- and belowground tissues did not vary in a predictable manner across different forest types; the losses of annual production to litter inputs varied
166
Table 2. Above-, belowground net primary production for climatic forest types separated by soil order. (Means (standard deviation; sample size in parentheses) followed by the same lower case letter are not significantly different within the same column)
Aboveground Belowground % Belowground NPP of
Climatic forest Soil order NPP NPP total NPP type (gm -2 yr -1) (gm -2 yr -1 )
Boreal
Broadleaf deciduous
Needleleaf evergreen
Inceptisol 348 (169; 2) de 238 (-; 1) abedef 32
Entisol 287 (-; 1) de 43 (-; 1) f 13
Histosol 394 (19; 3) cde 60 (4; 3) def 13
Inceptisol 131 (19; 3) e 56 (12; 3) ef 30
Spodosol 602 (61; 19) bed 97 (11; 19) cdef 14
Cold temperate
Broadleaf deciduous
Needleleaf deciduous
Needleleaf evergreen
Alfisol 1,267 (172; 3) abed 314 (64; 6) abedef 27
lnceptisol 1,180 (99; 7) abed 265 (62; 7) abedef 18
Spodosol 855 (120; 6) abed 498 (105; 6) abed 41 Spodosol 1,449 (-; 1) abe 264 (-; 1) abedef 15
Alfisol 844 (197; 4) abed 277 (110; 4) abedef 24
Andisol 332 (100; 2) de 875 (328; 3) ab 54
Histosol * 378 (146; 3) abede *
Incepfisol 1,086 (111; 9) abed 399(67; 12) abede 20
Spodosol 877 (126; 10) abed 441 (46; 13) abed 38
Ultisol 2,605 (615; 2) ab 410 (140; 2) abede 13
Warm temperate
Broadleaf deciduous Entisol 1,815 (-; 1) abe 59 (-; 1) def 3
Ultisol 1,008 (224; 6) abed 516 (146; 6) abed 46
Needleleaf evergreen Entisol 1,272 (596; 2) abed 254 (54; 2) abedef 18
Histosol 1,952 (-; 1) ab 366 (-; I) abode 16 Spodosol 2,156 (825; 2) ab 409 (207; 2) abcde 18
Subtropical
Broadleaf deciduous
Broadleaf evergreen
Needleleaf evergreen
Oxisol 1,910 (-; 1) ab * *
Ultisol 1,660 (-; 1) abe * *
Histosol 690 (-; 1) abed * *
Oxisol 1,230 (-; 1) abed * *
Ultisol 1,130(175; 4) abed 1,317(-; 1)a 44
Ultisol 1,660 (150; 2) abe 110 (-; 1) bedef 6
Unknown 950 (88; 4) abed 217 (36; 4) abedef *
Tropical Broadleaf deciduous
Broadleaf evergreen
Needleleaf evergreen
Uttisol 1,258"* 488 (104; 2)abe * Unknown * 500 (77; 2) abe *
Oxisol 761 (288; 5) bed 379 (74; 5) abede 49
Spodosoi * 619 (499; 2) abede * Ultisol * 111 (-; 1) bedef * Unknown 2,802 (-; 1) a * *
Mediterranean
Broadleaf evergreen Unknown 710 (-; 1) abed * *
* N o data. ** Only total NPP and belowground NPP given, calculated as a difference.
167
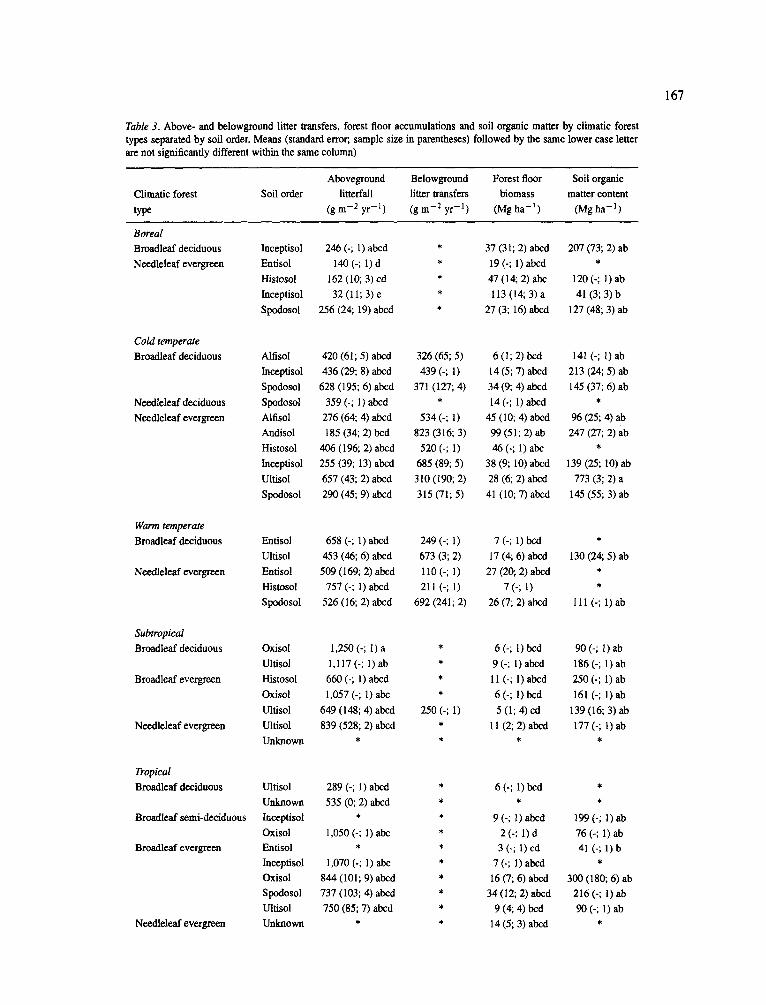
Table 3. Above- and belowground litter transfers, forest floor accumulations and soil organic matter by climatic forest types separated by soil order. Means (standard error;, sample size in parentheses) followed by the same lower case letter are not significantly different within the same column)
Aboveground Belowground Forest floor Soil organic Climatic forest Soil order litterfall litter transfers biomass matter content type (gm -2 yr -~ ) (gin -2 yr -1) (Mgha - l ) (Mgha -1 )
Boreal Broadleaf deciduous
Needleleaf evergreen
Inceptisol 246 (-; 1) abcd * 37 (31; 2) abed 207 (73; 2) ab
Entisol 140 (-; 1) d * 19 (-; 1) abed *
Histosol 162 (10; 3) cd * 47 (14; 2) abe 120 (-; 1) ab
Inceptisol 32 (11; 3) e * 113 (14; 3) a 41 (3; 3) b
Spodosol 256 (24; 19) abed * 27 (3; 16) abed 127 (48; 3) ab
Cold temperate Broadleaf deciduous
Needleleaf deciduous
Needleleaf evergreen
Alfisol 420 (61; 5) abed 326 (65; 5) 6 (1; 2) bed 141 (-; 1) ab
Inceptisol 436 (29; 8) abed 439 (-; 1) 14 (5; 7) abed 213 (24; 5) ab
Spodosol 628 (195; 6) abed 371 (127; 4) 34 (9; 4) abed 145 (37; 6) ab
Spodosot 359 (-; 1) abed * 14 (-; 1) abed * Alfisol 276 (64; 4) abed 534 (-; 1) 45 (10; 4) abed 96 (25; 4) ab
Andisol 185 (34; 2) bed 823 (316; 3) 99 (51; 2) ab 247 (27; 2) ab
Histosol 406 (196; 2) abed 520 (-; 1) 46 (-; 1) abc *
lnceptisol 255 (39; 13) abed 685 (89; 5) 38 (9; 10) abcd 139 (25; 10) ab
Ultisol 657 (43; 2) abed 310 (190; 2) 28 (6; 2) abed 773 (3; 2) a
Spodosol 290 (45; 9) abed 315 (71; 5) 41 (10; 7) abed 145 (55; 3) ab
Warm temperate Broadleaf deciduous
Needleleaf evergreen
Entisol 658 (-; 1) abed 249 (-; 1) 7 (-; 1) bed *
Ultisol 453 (46; 6) abed 673 (3; 2) 17 (4; 6) abed 130 (24; 5) ab
Entisol 509 (169; 2) abed 110 (-; 1) 27 (20; 2) abed *
Histosol 757 (-; 1)abed 211 (-; 1) 7 (-; 1) *
Spodosol 526 (16; 2) abed 692(241;2) 26 (7; 2) abed 111 (-; l ) ab
Subtropical Broadleaf deciduous
Broadleaf evergreen
Needleleaf evergreen
Oxisol 1,250 (-; 1)a * 6(-; t )bcd 90(-; 1)ab
Ulfisol 1,117(-; 1)ab * 9(-; 1) abcd 186(-; 1)ab
Histosol 660 (-; 1) abed * 11 (-; 1) abed 250 (-; 1) ab
Oxisol 1,057 (-; 1) abe * 6 (-; 1) bed 161 (-; 1) ab
Ultisol 649 (148; 4) abed 250 (-; 1) 5 (1; 4) cd 139 (16; 3) ab
Ultisol 839 (528; 2) abed * 11 (2; 2) abed 177 (-; 1) ab
Unknown * * * *
Tropical Broadleaf deciduous
Broadleaf semi-deciduous
Broadleaf evergreen
Needleleaf evergreen
Ultisol 289 (-; 1) abed * 6 (-; 1) bed * Unknown 535 (0; 2) abed * * *
Inceptisol * * 9 (-; l) abed 199 (-; 1) ab
Oxisol 1,050 (-; 1) abe * 2 (-; l) d 76 (-; 1) ab Entisol * * 3 (-; 1) cd 41 (-; 1) b Inceptisol 1,070 (-; 1) abe * 7 (-; 1) abed *
Oxisol 844 (101; 9) abed * 16 (7; 6) abed 300 (180; 6) ab Spodosol 737 (103; 4) abed * 34 (12; 2) abed 216 (-; 1) ab
Ulfisol 750 (85; 7) abed * 9 (4; 4) bed 90 (-; 1) ab
Unknown * * 14 (5; 3) abed *
168
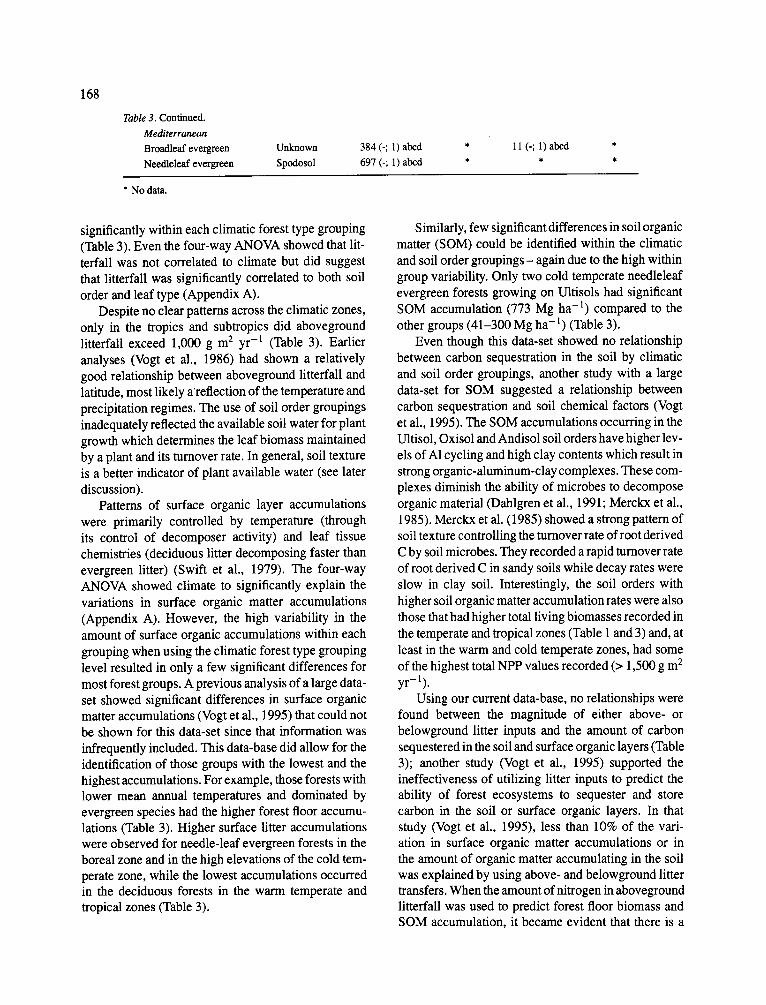
Table 3. Continued.
Mediterranean
Broadleaf evergreen Unknown
Needleleaf evergreen Spodosol
384 (-; 1)abcd * 11 (-; 1)abcd *
697 (-; 1) abcd * * *
* No data.
significantly within each climatic forest type grouping (Table 3). Even the four-way ANOVA showed that lit- terfall was not correlated to climate but did suggest that litterfall was significantly correlated to both soil order and leaf type (Appendix A).
Despite no clear patterns across the climatic zones, only in the tropics and subtropics did aboveground litterfall exceed 1,000 g m 2 yr -1 (Table 3). Earlier analyses (Vogt et al., 1986) had shown a relatively good relationship between aboveground litterfall and latitude, most likely a'reflection of the temperature and precipitation regimes. The use of soil order groupings inadequately reflected the available soil water for plant growth which determines the leaf biomass maintained by a plant and its turnover rate. In general, soil texture is a better indicator of plant available water (see later discussion).
Patterns of surface organic layer accumulations were primarily controlled by temperature (through its control of decomposer activity) and leaf tissue chemistries (deciduous litter decomposing faster than evergreen litter) (Swift et al., 1979). The four-way ANOVA showed climate to significantly explain the variations in surface organic matter accumulations (Appendix A). However, the high variability in the amount of surface organic accumulations within each grouping when using the climatic forest type grouping level resulted in only a few significant differences for most forest groups. A previous analysis of a large data- set showed significant differences in surface organic matter accumulations (Vogt et al., 1995) that could not be shown for this data-set since that information was infrequently included. This data-base did allow for the identification of those groups with the lowest and the highest accumulations. For example, those forests with lower mean annual temperatures and dominated by evergreen species had the higher forest floor accumu- lations (Table 3). Higher surface litter accumulations were observed for needle-leaf evergreen forests in the boreal zone and in the high elevations of the cold tem- perate zone, while the lowest accumulations occurred in the deciduous forests in the warm temperate and tropical zones (Table 3).
Similarly, few significant differences in soil organic matter (SOM) could be identified within the climatic and soil order groupings- again due to the high within group variability. Only two cold temperate needleleaf evergreen forests growing on Ultisols had significant SOM accumulation (773 Mg ha -1) compared to the other groups (41-300 Mg ha-l) (Table 3).
Even though this data-set showed no relationship between carbon sequestration in the soil by climatic and soil order groupings, another study with a large data-set for SOM suggested a relationship between carbon sequestration and soil chemical factors (Vogt et al., 1995). The SOM accumulations occurring in the Ultisol, Oxisol and Andisol soil orders have higher lev- els of A1 cycling and high clay contents which result in strong organic-aluminum-clay complexes. These com- plexes diminish the ability of microbes to decompose organic material (Dahlgren et al., 1991; Merckx et al., 1985). Merckx et al. (1985) showed a strong pattern of soil texture controlling the turnover rate of root derived C by soil microbes. They recorded a rapid turnover rate of root derived C in sandy soils while decay rates were slow in clay soil. Interestingly, the soil orders with higher soil organic matter accumulation rates were also those that had higher total living biomasses recorded in the temperate and tropical zones (Table 1 and 3) and, at least in the warm and cold temperate zones, had some of the highest total NPP values recorded (> 1,500 g m 2 yr-1).
Using our current data-base, no relationships were found between the magnitude of either above- or belowground litter inputs and the amount of carbon sequestered in the soil and surface organic layers (Table 3); another study (Vogt et al., 1995) supported the ineffectiveness of utilizing litter inputs to predict the ability of forest ecosystems to sequester and store carbon in the soil or surface organic layers. In that study (Vogt et al., 1995), less than 10% of the vari- ation in surface organic matter accumulations or in the amount of organic matter accumulating in the soil was explained by using above- and belowground litter transfers. When the amount of nitrogen in aboveground litterfall was used to predict forest floor biomass and SOM accumulation, it became evident that there is a
significant relationship between aboveground litterfall N and forest floor biomass (even though only 23% of the variation was explained) (Vogt et al., 1995). In contrast, there appeared to be no relationship between aboveground litterfall N and SOM for that data-set (Vogt et al., 1995).
Factors predicting carbon allocation patterns
Aboveground Past studies have shown good relationships between aboveground biomass or productivity and climatic variables (see O'Neill and DeAngelis, 1982). How- ever, few significant relationships were found between these variables with the data in Appendix B. For exam- ple, mean annual temperature explained the highest proportion of the variation in aboveground biomass and even though the correlation was significant (p = 0.009) it only explained 6% of this variation. In con- trast some of the nutrient pools and fluxes explained significantly more, albeit low percentage (12-47%), of the variation in aboveground biomass. For example, forest floor nutrient contents were negatively correlat- ed with aboveground biomass while litterfall cycling of nutrients were positively correlated with aboveground biomass (i.e. mean residence time of forest floor K (r = -0.57, p = 0.003, n = 25); mean residence time of forest floor N (r = -0.56, p = 0.003; n = 38); mean residence time of forest floor Ca (r = --0.48, p = 0.014; n =2); mean residence time forest floor P (r = -0.41, p - 0.003; n - 38); aboveground litterfall N (r = 0.41, p = 0.001; n = 57); aboveground litterfall P (r = 0.41, p = 0.005; n =45); aboveground litterfall K (r = 0.37, p = 0.016; n = 4); aboveground litterfall Ca (r = 0.37, p = 0.017; n = 42). The negative correlations with forest floor nutrient contents probably reflect the fact that as the forest floor accumulates less nutrients are avail- able to trees because nutrients are immobilized in the surface organic layers (Vogt et al., 1986). In contrast, litterfall nutrient contents indirectly reflect the amount of nutrients being cycled within the ecosystem (Cole and Rapp, 1981) so that a positive relationship should be expected.
In contrast to the relationships obtained with above- ground biomass, using the entire dataset to examine how aboveground productivity was related to climat- ic and nutrient factors showed both variable group- ings to be effective and better at predicting changes in aboveground production. For example, mean annual temperature (r = 0.61, p = 0.0001, n =91), minimum
169
annual temperature (r = 0.56, p = 0.0001, n = 54), and mean annual temperature/precipitation ratio (r ,- 0.47, p = 0.0001, n = 91) as individual variables were able to explain a significant portion of the variability in above- ground production. The best predictive relationships were obtained with nutrient variables even though the sample sizes were lower for these comparisons - again the mean residence time of forest floor nutrients were negatively correlated and litterfall nutrients were pos- itively correlated to aboveground productivity. Forest floor nutrient contents and their mean residence times (i.e. mean residence time of forest floor N [r = -0.82, p = 0.0001, n = 36]; mean residence time forest floor K [r = -0.66,p = 0.001, n = 24]) were effective at explain- ing the recorded variations in aboveground production. Similarly, litterfall nutrient contents as individual vari- ables were able to explain about a third of the variation in aboveground production (aboveground litterfall Ca [r = 0.60, p = 0.001; n = 57]; aboveground litterfall P [r ~ 0.41, p = 0.005; n = 45]; aboveground litterfall K [r = 0.37, p - 0.016; n - 41]).
Belowground Studies from the 1980's successfully predicted fine root biomass and production in several ecosystems using mainly climatic and nutrient data (Gower, 1987; Nadelhoffer et al., 1985; Vogt et al., 1986, 1990). These studies were conducted in the cold temperate zone where the following variables appeared to explain between one-half to three-fourths of the variation in fine root biomass or fine root turnover: mean annu- al temperature, mean annual temperature/precipitation ratio, soil nitrogen mineralization rates and nitrate production rates, litterfall N, litterfall Ca, and for- est floor N mean residence time. Based on these earlier small data-sets, maximum monthly temper- atures explained 65% of the variation in fine root biomass for needle-leafed evergreen forests but not for broadleaf deciduous forests (Vogt et al., 1986). Temperature variables by themselves were unable to explain any of the variation in fine root dynamics in broadleaf forests; however, a mean annual tempera- ture/precipitation ratio explained 79% of the variation in fine root turnover. This contrasted with the needle- leafed forests where a temperature/precipitation ratio did not increase the ability of predicting fine root dynamics (Vogt et al., 1986). Variables reflecting N cycling in ecosystems explained approximately 75% of the variation in fine root turnover in cold temperate
170
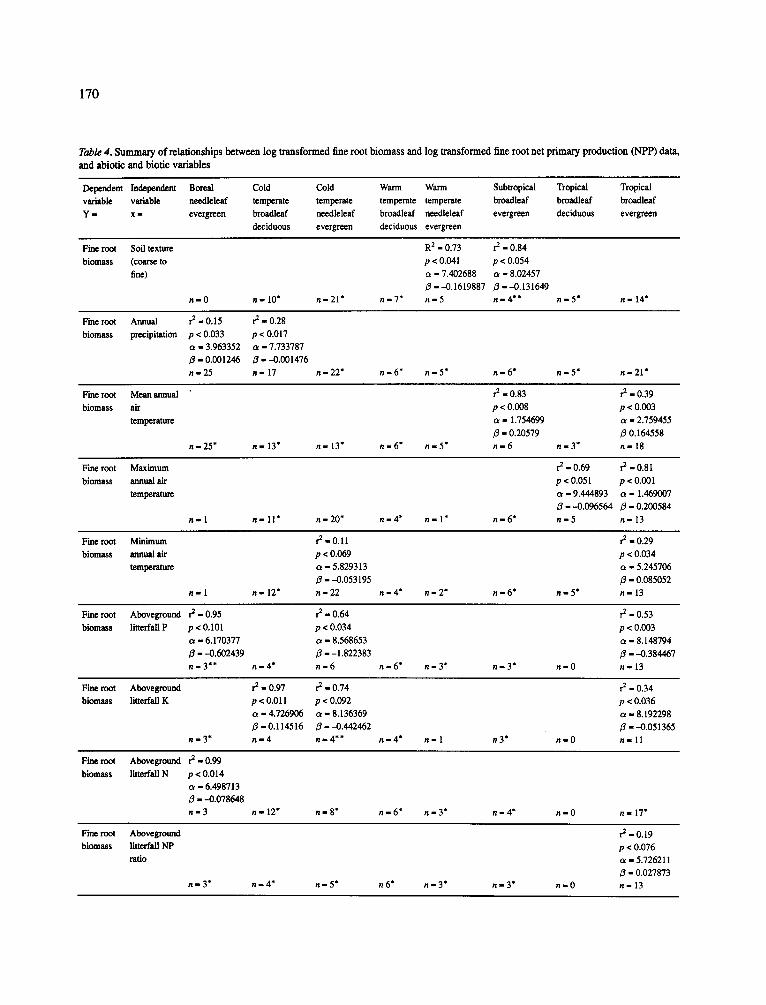
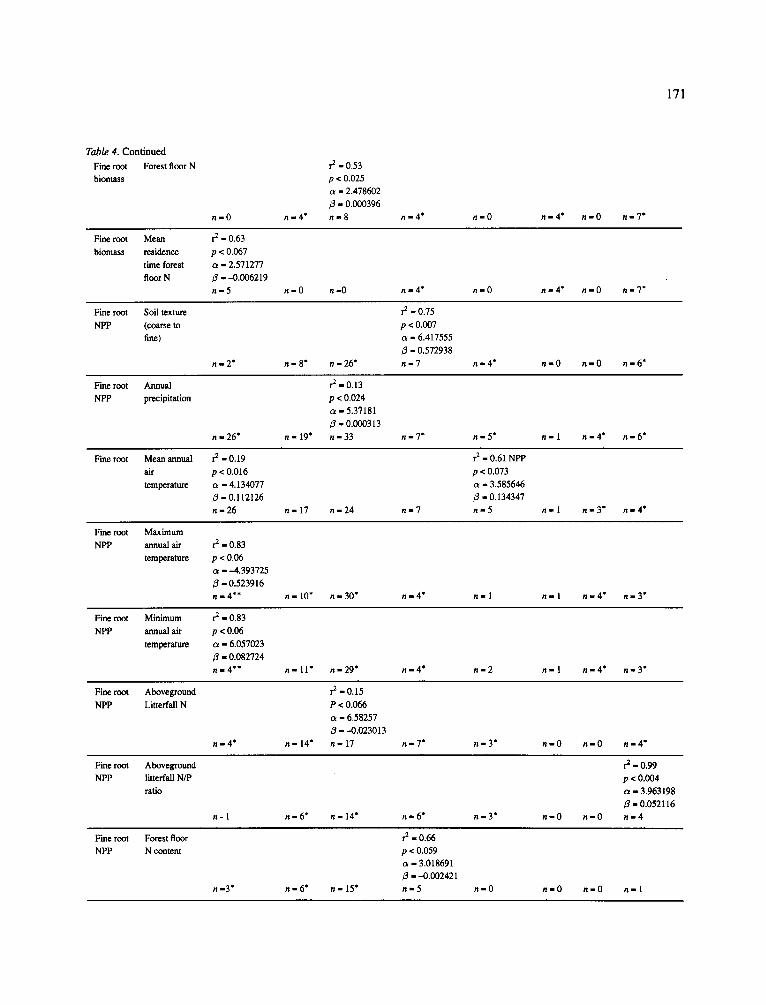
Table 4. S u m m a r y o f re la t ionsh ips b e t w e e n log t r a n s f o r m e d f ine roo t b i o m a s s and log t r a n s f o r m e d f ine roo t ne t p r i m a r y p roduc t ion ( N P P ) data,
and abiot ic and b io t ic va r i ab le s
Dependent Independent Boreal Cold Cold Warm Warm Subtropical Tropical Tropical
variable variable needleleaf temperate temperate temperate temperate broadleaf bmadleaf broadleaf
Y - x - evergreen broadleaf needleleaf broadleaf needleleaf evergreen deciduous evergreen
deciduous evergreen deciduous evergreen
Fine root Soil texture R 2 - 0.73 r 2 - 0.84
biomass (coarse to p < 0.041 p < 0.054
f i ~ ) a l 7.402688 ot - 8.02457
3 ---0.1619887 3 --0.131649
n - 0 n - 1 0 * n - 2 1 * n - 7 * n - 5 n - 4 * * n - 5" n - 14"
Fine root Annual re - O. 15 r e - 0.28
biomass precipitation p < 0.033 p < 0.017
c~ - 3.963352 c~ - 7.733787
/3 " 0.001246 3 " -0 .001476
n - 2 5 n - 17 n - 2 2 " n - 6 * n - 5 * n - 6 * n - 5 * n - 2 1 *
Fine root Mean annual
biomass air
temperature
n - 2 5 * n - 13" n - 13" n - 6 * n - 5 *
re - 0.83
p < 0.008
a - 1.754699
/3 - 0.20579
n - 6 n-3*
r 2 - 0.39
p < 0.003
o~ - 2.759455
/~ 0.164558
n-18
Fine root Maximum
biomass annual air
temperature
n - 1 n - 11" n - 2 0 * n - 4 * n - l * n - 6 *
r2 - 0.69 re - 0 . 8 1
p < 0.051 p < 0.001
ot - 9.444893 a - 1.469007
/3 - --0.096564 3 - 0.200584
n - 5 n - 1 3
Fine root Minimum
biomass annual air
temperature
n - 1 n - 12"
r 2 - 0 . 1 1
p < 0.069
a - 5.829313
3 - -0.053195
n - 22 n - 4* n - 2* a - e * n - 5 *
re - 0.29
p < 0.034
a - 5.245706
/3 - 0.085052
n - 13
Fine root Aboveground re - 0.95
biomass litteffall P p < 0.101
a - 6.170377
/3 - -0.602439
n - 3 * * n - 4 *
r 2 - 0.64
p < 0.034
a - 8.568653
/3 - -1.822383
n - 6 n - 6 * n - 3 * n - 3 * n - 0
re - 0.53
p < 0.003
ot - 8.148794
/3 - -0.384467
n - 1 3
Fine root Aboveground
biomass litterfall K
n - 3 *
r 2 - 0.97 rre - 0.74
p < 0 . 0 1 1 p < 0.092
c~ - 4.726906 a - 8.136369
3 - 0 . 1 1 4 5 1 6 3 - - 0 . 4 4 2 4 6 2
n - 4 n - 4 * * n - 4 * n - 1 n3* n - O
- 0.34
p < 0.036
- 8.192298
3 - -0 .051365
n - 11
Fine root Abovegronnd r 2 - 0.99
biomass litterfall N p < 0.014
a - 6.498713
3 - -0.078648
n - 3 n - 12" n - 8" n - 6" a - a * n - 4 * n - 0 n - 17"
Firm root Aboveground
biomass litteffall NP
ratio
n - 3* n - 4 * n - 5* n 6* n - 3* n - 3 * n - 0
re - 0.19
p < 0.076
a - 5.726211
3 - 0.027873
n - 13
171
Table 4. Continued
Fine root Forest floor N
biomass
n - 0
r 2 - 0 . 5 3
p < 0.025
a - 2.478602
/3 - 0.000396
n - 4 * n - 8 n g 4 * n - O n - 4 * n - O n - 7 *
Fine root Mean r 2 - 0.63
biomass residence p < 0.067
time forest a - 2.571277
floor N fl - -0 .006219
n - 5 n = 0 n - 0 n m 4 * n - O n - 4 * n - O n - 7 "
Fine root Soil texture
NPP (coarse to
fine)
r im2* n - 8* n - 26"
1"2 - 0.75
p < 0.007
oL - 6.417555
/3 - 0.572938
n-7 rim4* n - O n - O n-6*
Fine root Annual
NPP precipitation
n - 26"
:-o.13 p < 0.024
a - 5.37181
fl - 0.000313
n - 19" n - 33 n - 7 * n - 5 * n=l n-4* n - 6 *
Fine root Mean annual r 2 - 0.19
air p < 0.016
temperature o~ - 4.134077
/3 = 0.112126
n = 26 n - 17 n - 2 4 n - 7
r 2 - 0.61 NPP
p < 0.073
ot - 3.585646
/3 - 0.134347
n - 5 n - I n - 3 * n - 4 *
Fine root Maximum
NPP annual air r 2 - 0.83
temperature p < 0.06
c~ - -4 .393725
/3 = 0.523916
n=4** n - 10" n - 30* r im4* n - 1 n - 1 n - 4 * n - 3 *
Fine root Minimum r 2 - 0.83
NPP annual air p < 0.06
temperature a - 6.057023
fl - 0 .082724
n = 4 * * n - 11" n - 2 9 " n - 4 * n - 2 n - I n - 4 * n - 3 *
Fine root Aboveground
NPP Litterfall N
n - 4 *
r 2 - 0 . 1 5
P < 0.066
oz = 6.58257
fl 1 - 0 . 0 2 3 0 1 3
n - 14" n - 17 n n 7 * n - 3 * n - O n - O n - 4 *
Fine root Aboveground
NFP litteffail N/P
ratio
n - 1 n - 6* n - 14" n - 6 * h i 3 *
r 2 - 0.99
p < 0.004
ot - 3.963198
fl - 0.052116
n - 0 n - 0 n - 4
Fine root Forest floor
NPP N content
n m3* n - 6* n - 15"
r 2 - 0.66
p < 0.059
ct - 3.018691
fl - -0 .002421
n - 5 n-0 n-0 n-0 n-I
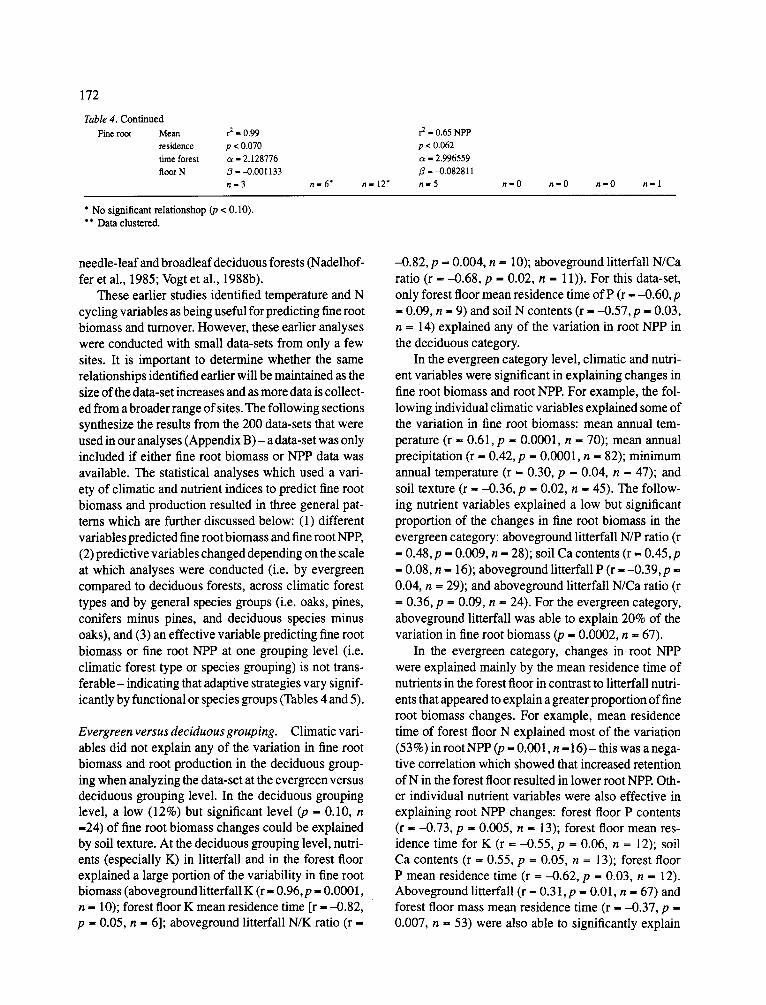
172
Table 4. Cont inued
Fine root Mean r 2 = 0.99
residence p < 0.070
time forest ct = 2.128776
floor N 13 = -0.001133
n = 3 n l 6 * n - 12"
r 2 - 0.65 NPP
p < 0.062
ct - 2.996559
/3 = -0.082811
n - 5 n = O n = O n = O n - 1
* No s ignif icant re la t ionshop (p < 0.10).
** Data clustered.
needle-leaf and broadleaf deciduous forests (Nadelhof- fer et al., 1985; Vogt et al., 1988b).
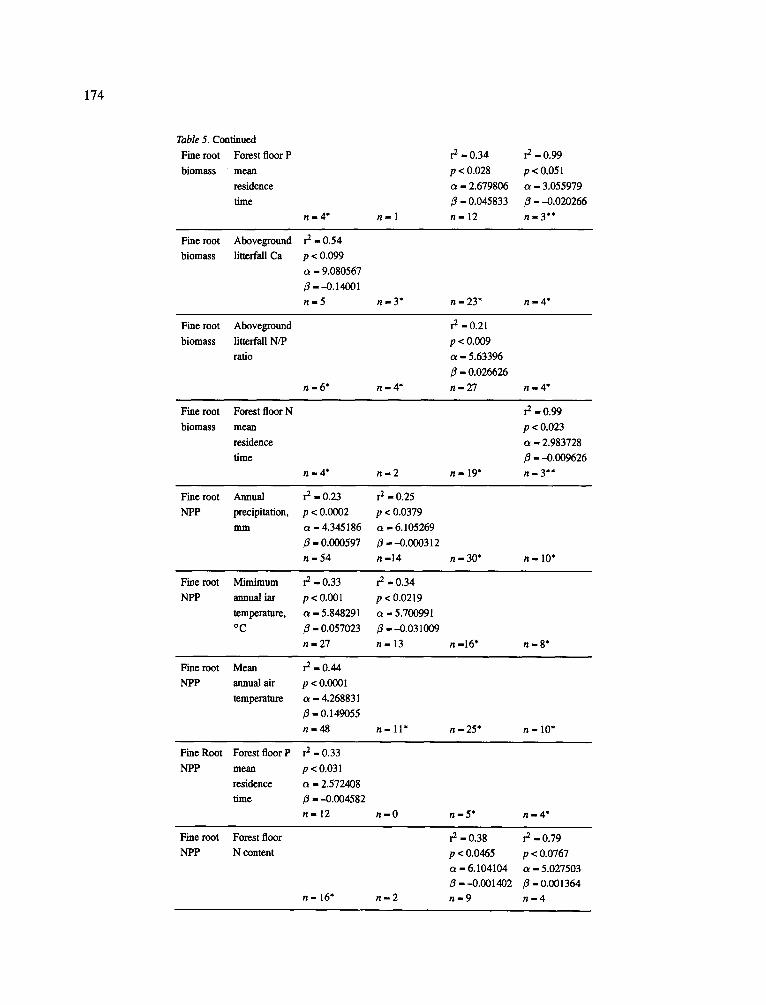
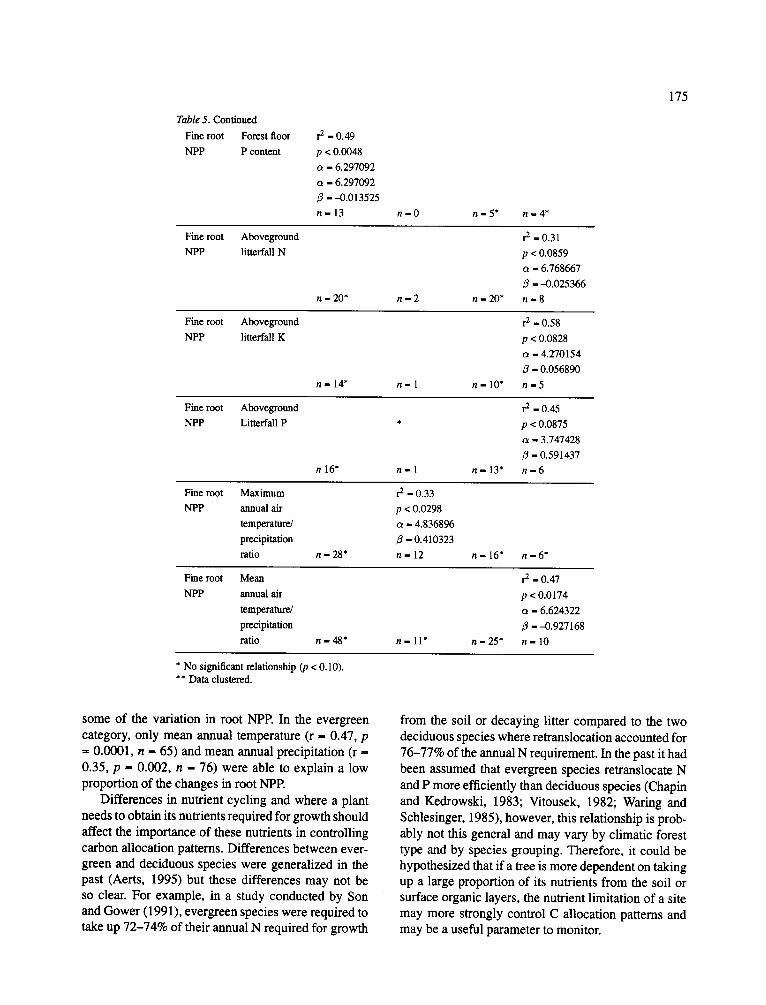
These earlier studies identified temperature and N cycling variables as being useful for predicting fine root biomass and turnover. However, these earlier analyses were conducted with small data-sets from only a few sites. It is important to determine whether the same relationships identified earlier will be maintained as the size of the data-set increases and as more data is collect- ed from a broader range of sites. The following sections synthesize the results from the 200 data-sets that were used in our analyses (Appendix B ) - a data-set was only included if either fine root biomass or NPP data was available. The statistical analyses which used a vari- ety of climatic and nutrient indices to predict fine root biomass and production resulted in three general pat- terns which are further discussed below: (1) different variables predicted fine root biomass and fine root NPP, (2) predictive variables changed depending on the scale at which analyses were conducted (i.e. by evergreen compared to deciduous forests, across climatic forest types and by general species groups (i.e. oaks, pines, conifers minus pines, and deciduous species minus oaks), and (3) an effective variable predicting fine root biomass or fine root NPP at one grouping level (i.e. climatic forest type or species grouping) is not trans- ferable- indicating that adaptive strategies vary signif- icantly by functional or species groups (Tables 4 and 5).
Evergreen versus deciduous grouping. Climatic vari- ables did not explain any of the variation in fine root biomass and root production in the deciduous group- ing when analyzing the data-set at the evergreen versus deciduous grouping level. In the deciduous grouping level, a low (12%) but significant level (p - 0.10, n -24) of fine root biomass changes could be explained by soil texture. At the deciduous grouping level, nutri- ents (especially K) in litterfall and in the forest floor explained a large portion of the variability in fine root biomass (aboveground litterfall K (r - 0.96, p - 0.0001, n - 10); forest floor K mean residence time [r = -0.82, p - 0.05, n - 6]; aboveground litterfall N/K ratio (r =
-0.82, p = 0.004, n = 10); aboveground litterfall N/Ca ratio (r = -0.68, p = 0.02, n = 11)). For this data-set, only forest floor mean residence time of P (r - -0 .60 ,p = 0.09, n - 9) and soil N contents (r - -0.57, p - 0.03, n = 14) explained any of the variation in root NPP in the deciduous category.
In the evergreen category level, climatic and nutri- ent variables were significant in explaining changes in fine root biomass and root NPP. For example, the fol- lowing individual climatic variables explained some of the variation in fine root biomass: mean annual tem- perature (r ~ 0.61, p = 0.0001, n - 70); mean annual precipitation (r = 0.42, p = 0.0001, n - 82); minimum annual temperature (r - 0.30, p - 0.04, n - 47); and soil texture (r - -0.36, p - 0.02, n = 45). The follow- ing nutrient variables explained a low but significant proportion of the changes in fine root biomass in the evergreen category: aboveground litterfall N/P ratio (r = 0.48,p = 0.009, n - 28); soil Ca contents (r - 0.45,p - 0.08, n = 16); aboveground litterfall P (r = -0.39, p = 0.04, n = 29); and aboveground litterfall N/Ca ratio (r = 0.36, p = 0.09, n = 24). For the evergreen category, aboveground litterfall was able to explain 20% of the variation in fine root biomass (p = 0.0002, n = 67).
In the evergreen category, changes in root NPP were explained mainly by the mean residence time of nutrients in the forest floor in contrast to litterfall nutri- ents that appeared to explain a greater proportion of fine root biomass changes. For example, mean residence time of forest floor N explained most of the variation (53%) in root NPP (p - 0.001, n = 1 6 ) - this was a nega- tive correlation which showed that increased retention of N in the forest floor resulted in lower root NPP. Oth- er individual nutrient variables were also effective in explaining root NPP changes: forest floor P contents (r - -0.73, p - 0.005, n - 13); forest floor mean res- idence time for K (r = -0.55, p = 0.06, n = 12); soil Ca contents (r = 0.55, p = 0.05, n = 13); forest floor P mean residence time (r = -0.62, p = 0.03, n = 12). Aboveground litterfall (r - 0.31, p - 0.01, n - 67) and forest floor mass mean residence time (r = -0.37, p 0.007, n - 53) were also able to significantly explain
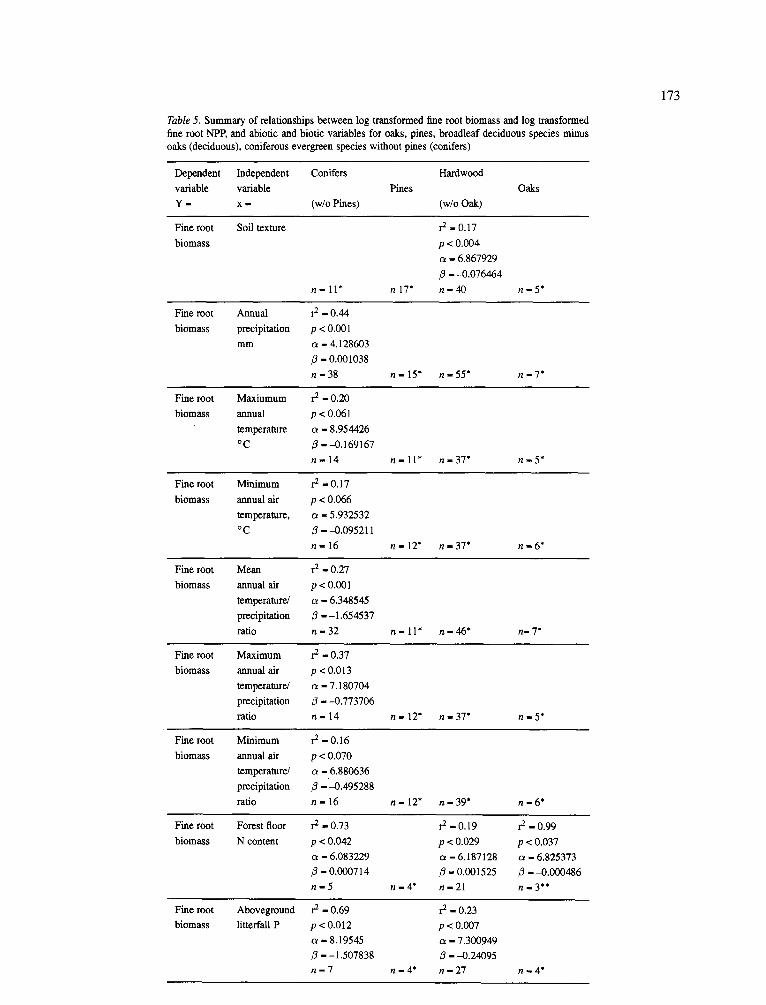
Table 5. Summary of relationships between log transformed fine root biomass and log transformed
fine root NPP, and abiotic and biotic variables for oaks, pines, broadleaf deciduous species minus
oaks (deciduous), coniferous evergreen species without pines (conifers)
1 7 3
Dependent Independent Conifers Hardwood
variable variable Pines
Y - x - (w/o Pines) (w/o Oak)
Oaks
Fine root
biomass
Soil texture r 2 - 0 . 1 7
p < 0.004
a - 6.867929
13 - 4) .076464
n - l l * n17* n - 4 0 n - 5 *
Fine root
biomass
Annual
precipitation
m m
- 0.44
p < 0.001
a - 4.128603
/3 - 0 . 0 0 1 0 3 8
n - 38 n - 15" n - 55* n - 7"
Fine root
biomass
Maxiumum
annual
temperature
o C
r 2 - 0,20
p < 0.061
a - 8.954426
g - 4) . 169167
n - 1 4 n - 11" n - 37* n - 5 *
Fine root
biomass
Minimum
annual air
temperature,
o C
- 0.17
p < 0.066
a - 5.932532
/3 - - 0 . 0 9 5 2 1 1
n - 16 n - 12" n - 37* n - 6*
Fine root
biomass
Mean
annual air
temperature/
precipitation
ratio
r 2 - 0.27
p < 0.001
a - 6.348545
- - 1 . 6 5 4 5 3 7
n - 32 n - l l * n - 4 6 " n - 7 *
Fine root
biomass
Maximum
annual air
temperature/
precipitation
ratio
- 0.37
p < 0.013
a - 7.180704
/3 - - 0 . 7 7 3 7 0 6
n - 14 n - 12" n - 37" n - 5*
Fine root
biomass
Minimum
annual air
temperature/
precipitation
ratio
r 2 - 0 . 1 6
p < 0.070
a - 6.880636
/3 - 4) .495288
n - 1 6 n - 12" n - 39* n - 6*
Fine root
biomass
Forest floor
N content
r 2 - 0 . 7 3
p < 0.042
- 6.083229
/3 - 0.0O0714
n - 5 n - 4*
r 2 - 0 . 1 9
p < 0.029
cz - 6.187128
/3 - 0.001525
n - 2 1
r 2 - 0.99
p < 0.037
- 6.825373
/3 - 4) .000486
n - 3**
Fine mot
biomass
Aboveground
litterfall P
r 2 - 0.69
p < 0 . O 1 2
a - 8.19545
/3 - -1.507838
n - 7 r t - 4*
r 2 - 0.23
p < 0.007
a - 7.300949
- -0 .24095
n - 27 r / - 4 *
174
Table 5. Continued
Fine root Forest floor P
biomass m e a n
residence
time
n - 4" n - 1
r 2 - 0 . 3 4
p < 0.028
a - 2.679806
3 - 0.045833
n - 1 2
r 2 - 0.99
p < 0.051
a - 3.055979
3 - -O.02O266
/ / - 3 * *
Fine root Abovegmtmd
biomass litterfall Ca
r 2 - 0 . 5 4
p < 0.099
a - 9.080567
3 - -0.14001
n - 5 n - 3 * n - 23* / / - 4 *
Fine root Aboveground
biomass litterfall N/P
ratio
r / - a * n m 4 *
r 2 - 0 . 2 1
p < 0.009
a - 5.63396
3 - 0.026626
n - 27 / /m4*
Fine root Forest floor N
biomass mean
residence
time
n - 4 * n - 2 n - 19"
r 2 - 0 . 9 9
p < 0.023
a - 2.983728
3 - -0 .009626
n - 3 * *
Fine root Annual
NPP precipitation,
m m
r 2 - 0.23
p < 0.0002
a - 4.345186
- 0.000597
n - 54
r 2 - 0.25
p < 0.0379
a - 6.105269
3 - - 0 . 0 0 0 3 1 2
n - 1 4 n - 30" n - 10"
Fine root Mimimum r 2 - 0.33 r 2 - 0.34
NPP annual iar p < 0.001 p < 0.0219
temperature, a - 5.848291 a - 5.700991
°C 3 - 0.057023 3 - -0 .031009
n - 2 7 n - 1 3 n - 1 6 " / / - 8 *
Fine root Mean
NPP annual air
temperature
r 2 - 0 . 4 4
p < 0.0001
ct - 4.268831
3 - 0.149055
n - 4 8 n - l l * n - 25* n - 10"
Fine Root Forest floor P r 2 - 0.33
NPP mean p < 0,031
residence a - 2.572408
time 3 - -0 .004582
n - 1 2 n - 0 / / - 5 * / /m4*
Fine root Forest floor
NPP N content
n - 16" n - 2
r 2 - 0 . 3 8
p < 0.0465
a - 6.104104
3 - - 0 . 0 0 1 4 0 2
n - 9
r 2 - 0.79
p < 0.0767
ct - 5.027503
3 - 0.001364
n - 4
175
Table 5. Continued
Fine root Forest floor NPP P content
rE -0.49
p < 0.0048
ct - 6.297092 a - 6.297092 B - -0.013525 n - 1 3 n - 0 n - 5 *
Fine root Aboveground NPP litterfall N
n - 20" n - 2 n - 20*
Fine root Aboveground NPP litterfall K
n - 14" n - 1 n - 10"
Fine root Aboveground NPP Litterfall P
n 16" n - 1 n - 13"
Fine root NPP
Maximum annual air
temperature/ precipitation ratio n - 28*
rE - 0.33 p < 0.0298 a - 4.836896
B - 0.410323 n - 12 n - 16"
Fine root Mean NPP annual air
temperature/ precipitation
ratio n - 4 8 " n - 11" n - 25*
* No significant relationship (p < 0.10). * * Data clustered.
/ / -4*
rE -0.31
p < 0.0859 ct - 6.768667
B - -0.025366 n - 8
r E - 0.58
p < 0.0828 a - 4.270154
B - 0.056890 n - 5
r 2 -0.45
p < 0.0875
a - 3.747428 B - 0.591437 n - 6
n - 6 "
rE - 0.47
p < 0.0174 a - 6.624322
B --0.927168 n - 10
some o f the var ia t ion in root N P E In the everg reen
category, only mean annual temperature (r - 0.47, p
= 0.0001, n = 65) and m e a n annual precipi ta t ion (r =
0.35, p = 0.002, n = 76) were able to expla in a low
propor t ion o f the changes in root N P E
Di f fe rences in nutr ient cyc l ing and where a plant
needs to obtain its nutrients requi red for growth should
affect the impor tance o f these nutrients in control l ing
carbon al locat ion patterns. Di f fe rences be tween ever-
green and dec iduous species were genera l ized in the
past (Aerts, 1995) but these di f ferences may not be
so clear. For example , in a study conduc ted by Son
and G o w e r (1991), eve rg reen species were requi red to
take up 7 2 - 7 4 % o f their annual N required for growth
f rom the soil or decaying litter compared to the two
dec iduous species where re t ranslocat ion accounted for
7 6 - 7 7 % of the annual N requirement . In the past it had
been assumed that eve rg reen species re t ranslocate N
and P more eff iciently than dec iduous species (Chapin
and Kedrowski , 1983; Vitousek, 1982; Waring and
Schlesinger , 1985), however , this relat ionship is prob-
ably not this genera l and may vary by cl imat ic forest
type and by species grouping. Therefore , it could be
hypothes ized that i f a tree is more dependen t on taking
up a large propor t ion o f its nutrients f rom the soil or
surface organic layers, the nutrient l imi ta t ion o f a site
may more strongly control C a l locat ion patterns and
may be a useful parameter to monitor.

176
Climatic forest type. At the grouping level of the cli- matic forest type, climatic variables were ineffective in explaining variations in fine root biomass or NPP (Table 4). Climatic variables were best at explaining variations in belowground processes at the extreme ends of the temperature gradients: boreal, subtropical and tropical climatic zones. Precipitation explained a low proportion of the variation in fine root biomass only in the boreal and cold temperate zones. The pro- portion of the changes in fine root biomass and NPP explained by precipitation were lower than what was obtained using the larger scale grouping categories of evergreen and deciduous.
Analyzing the data set by climatic forest type and then separately by species showed that some cli- matic variables were better predictors of fine root biomass across several climatic forest types and in some species groupings but they were poor predic- tors of fine root NPP (Table 4). The different abilities to predict changes in fine root biomass compared to fine root NPP is highlighted by examining the role of mean annual precipitation in explaining changes in fine root dynamics in the cold temperate broadleaf decidu- ous forests (Table 4). While annual precipitation sig- nificantly explained 28% of the variation in fine root biomass in this climatic forest type, it explained none of the variation in fine root NPP. Similarly, maximum annual air temperature explained 81% of the varia- tion in fine root biomass but none of the variation in fine root NPP for tropical broadleaf evergreen forests. Whether these relationships are sustained as the data- base is expanded will be important to monitor since these relationships are presently formed from small data-sets.
Even though the data base is quite small, strong correlations of fine root biomass and NPP with above- ground litterfall transfers of N, P, or K were obtained in climatic forest types where these nutrients limit their growth (Cuevas and Medina, 1986; Husni Mohd. Shar- iff and Miller 1991; Lugo and Scatena, 1995; Vitousek, 1982; Vitousek and Sanford, 1986). Nitrogen in litter- fall correlated with fine root NPP in cold (r 2 - 0.44) and warm temperate (r 2 - 0.81) needleleafed forests, and in cold temperate broadleaf deciduous forests (r 2 - 0.59). In tropical broadleaf evergreen forests where both N and P can limit tree growth (Cuevas and Medina, 1986), a ratio of N/P in aboveground litterfall explained 99% of the variation in fine root NPP (Table 4). Sim- ilarly, 53% of the variation in fine root biomass was explained by aboveground litterfall P in the tropical broadleaf evergreen forests and 34% of the variation
by aboveground litterfall K in the tropical broadleaf evergreen forests (Table 4).
Species groupings. Climatic variables at the species grouping level were better at explaining the variations in fine root dynamics than using the climatic forest type grouping (Tables 4 and 5). At the species grouping level for conifers, annual precipitation explained 44% of the variation in fine root biomass and 23% of the variation in fine root NPP (Table 5). This contrasts the cold temperate needleleaf evergreen forests where none of the variation in fine root biomass and 13% of the variation in root production was explained by mean annual precipitation.
When the conifer group did not include Picea spp., the variability in fine root biomass explained by pre- cipitation increased to 78% while 31% of variation in fine root NPP was explained. This shows the impor- tance of the grouping level in determining how much of the variability in fine root dynamics can be explained by individual climatic variables. The predictive rela- tionship between fine root biomass and precipitation for the coniferous species (Table 5) is similar to that obtained in the earlier analyses (Vogt et al., 1986). This relationship between fine root biomass and annual pre- cipitation in the coniferous forests did not exist far the pine, oak and hardwood groupings (Table 5).
The low ability to predict fine root dynamics using precipitation may be related to species drought adap- tive strategies which would confer on these species high water-use-efficiencies (Valentini et al., 1992) and the fact that precipitation does not reflect the water stor- age capacity of the soil. Research has shown strong relationships between site soil water potential and the leaf area supported by a stand when comparisons were made regionally for conifers growing on sites with very different water balances (Grier and Run- ning, 1976). Analyzing within the climatic forest type groupings, soil texture had strong correlations with fine root biomass but not fine root NPP in warm temper- ate and tropical evergreen sites where it explained a high proportion (73 to 84%) of the variability in fine root biomass (Table 4). The lack of a correlation with precipitation but strong correlations with soil texture demonstrate the importance of water availability in controlling tree growth and the fact that precipitation by itself may not reflect the water holding capacity of a site.
A general pattern has been suggested that tree growth is lower as precipitation decreases and the leaf area decreases and root growth is favored (Schulze,

1982). Few comparative studies of changing water budgets for evergreen and deciduous forests have been reported that would allow for a speculation of the pat- terns obtained with precipitation and biomass accumu- lation or growth (Schulze, 1982). Conifers have been shown to intercept annually 15-20% (up to 66% for Pseudotsuga menziesii) more water at the leaf surface than broad-leaved trees resulting in conifers having less water totally available on the site (Schulze, 1982). How the differential ability of forests to retain pre- cipitation on the site affects plant access to water is not clear and needs to be examined in relationship to plant adaptive strategies for acquiring water and their water-use-efficiencies.
The lack of a good relationship between soil tex- ture or precipitation and fine root biomass for the oaks is probably due to the oaks being more drought tolerant than most other hardwood species (Abrams, and Kubiske, 1990). Sclerophyllous leaves with thick cuticular layers common to oaks help reduce water loss and enhance resistance to drought (Mooney and Dunn, 1970). If the oaks are able to adapt to varying soil water levels, any variable reflecting site water avail- ability will not be effective in predicting oak growth. For example, the capacity of white oak to increase the number of root tips, and in turn, the root sys- tem biomass, despite moisture and nutrient constraints which limit root elongation rates, may be an important mechanism for drought resistance which can compen- sate for fluctuations in water availability (Teskey and Hinckley, 1981).
Comparison of different grouping levels. At the ever- green and deciduous grouping level, temperature vari- ables were ineffective in explaining any of the changes in fine root biomass or NPP for deciduous species while mean annual temperature did explain 38%, of the vari- ation in fine root biomass and 22% of the variation in root NPP. At the level of the individual climatic forest type, temperature variables were better at explaining changes in root dynamics than in the evergreen and deciduous grouping. In the climatic forest type group- ings, the extreme ends of the climatic gradient (i.e. boreal, tropics) had temperature variables effectively explaining changes in fine root dynamics. In the cli- matic forest groupings, mean and maximum annual temperatures were effective in explaining from 39 to 83% of the variation found in the amount of fine root biomass but not fine root NPP maintained by broadleaf forests of the tropics and subtropics (Table 4). In the boreal needleleaf evergreen forests, maximum annu-
177
al temperature appeared to explain a high proportion (83%) of the variation in root NPE A combination of temperature and precipitation as an independent vari- able to predict fine root biomass or NPP were ineffec- tive in improving our ability to predict fine root dynam- ics. Even though research conducted by Luxmoore et al. (1995) suggested pines should be sensitive to max- imum mean annual temperatures, we were unable to tease this relationship apart with our data-set.
There is a strong influence of soil nutrients on carbon allocation patterns in plants especially when the availability of these nutrients limits plant growth (Ingestad and Agren, 1992). In contrast to the studies using climatic variables to predict fine root dynam- ics, studies have shown good relationships between nutrient availability indices and fine roots in a few sites localized in the warm and cold temperate climat- ic zones. In the cold temperate zone, several different N availability indices have been shown to have some utility for predicting root biomass and/or turnover rates (Aber et al., 1985; Gower et al., 1992; Vogt et al., 1986). In 13 forests located in Wisconsin and Mas- sachusetts, soil nitrification rates predicted 78% of the variation in fine root biomass - fine root biomass decreased as the nitrification rates increased (Aber et al., 1985). The relationship with nitrification rates did not occur with N mineralization rates suggesting that nitrate levels had a very different effect on root biomass compared to ammonium levels. Similarly, in cold-temperate needle-leafed forests, 76-77% of the variation in fine root biomass and fine root turnover was explained by the mean residence time of nitrogen in the forest floor and the amount of nitrogen cycled in aboveground litterfall, respectively (Vogt et al., 1986). In broad-leaved forests of the cold temperate zone, litterfall nitrogen explained even a higher proportion of fine root turnover (88%) than in the needle-leafed forests (Vogt et al., 1986). The number of data points used for the forest floor mean residence time and lit- terfall nitrogen comparisons with fine roots was small (e.g. 5-6) so it is not clear if these patterns are gener- ally transferable to other ecosystems or are unique to the region where the data was collected.
At the species grouping level, the importance of forest floor nutrient contents versus litterfall cycling of nutrients were not as clear (Table 5) except for the fact that the pine category had none of the nutrient variables explaining any of the variation in root growth and biomass accumulation. Again, a greater number of nutrient variables were capable of explaining changes in fine root biomass than for root NPP (Table 5).
178
The species level grouping also appears to need further subdivision to effectively predict root dynam- ics. For example, pines appear to have 3 basic adaptive strategies of phenological patterns for carbon alloca- tion that varies by climate - 1 strategy for cold tem- perate and boreal species (i.e. determinate growth), a 2nd strategy for warm temperate and subtropical pines (i.e. semi-determinate growth) and a 3rd strategy for tropical pines (i.e. indeterminate growth) (Gower et al., 1995). Our data-set lends support for separating pines into smaller groups by climate type instead of lumping pines as one group. Data were analyzed separately for the pines by cold temperate and boreal, and warm tem- perate and subtropical. Pines in the warm temperate and subtropical zones had mean annual temperature and soil texture explaining 52% and 47%, respective- ly, of the variation in root NPP. When the pines were combined as a group, 33% of the variation in root NPP was explained by mean annual temperature and none of the variation could be explained by soil texture. When pines were analyzed separately for the cold temperate and boreal zones as a group, no variables were able to explain root NPP. Similarly for fine root biomass, grouping of pines by zones showed that cold temperate and boreal pines were the only ones that had maximum annual temperature ( r - 0.76, p - 0.05, n - 7) explaining over half of the variation in fine root biomass. Similar- ly for the warm temperate and subtropical pines, soil texture (r - -0.81, p -- 0.03, n = 7) and precipitation (r - -0.80, p - 0.10, n - 5) were able to significantly predict fine root biomass. The importance of maximum mean annual temperature in controlling pine growth as suggested by Luxmoore et al. (1995) was teased apart in this smaller grouping of data but could not be shown when larger data groupings were used.
When the hardwood species were separated into smaller groups using the climate grouping approach (i.e. boreal + cold temperate; warm temperate + sub- tropical; tropical), other variables were effective at predicting root dynamics. The cold temperate and boreal hardwoods had climatic variables explaining a significant portion of the variability in fine root biomass (mean annual temperature explaining 68% of the variation, precipitation 61% and maximum temper- ature/precipitation ratio explaining 44% of the varia- tion). Root NPP was better explained by nutrients than climatic variables. The tropical hardwoods had SOM (r - -0.76, p - 0.08, n - 6) and the other nutrients identified in the climatic forest groupings explaining a significant portion of fine root biomass.
The multiple regressions developed for predicting fine root biomass and NPP have many of the vari-
ables identified earlier explaining a significant portion of this variability across climatic forest types and soil types. With a sample size of 15, 69% of the varia- tion in fine root biomass was predicted using precip- itation, aboveground litterfall N/Ca ratio and soil Ca contents (p - 0.004). This contrasted root NPP where mean annual temperature and soil Ca contents were best able to predict NPP with an R 2 = 0.62 (p - 0.0003, n ~ 20). The multiple regressions developed for the belowground contrast that produced for the above- ground which incorporated the following variables: forest floor Ca contents, soil N contents, aboveground litterfall and mean residence time of forest floor N (R 2
0.90,p = 0.0001, n - 21). These regressions combine climatic and nutrient variables and utilize similar vari- ables in the equations so that the distinctions between biomass and productivity are not as clear.
Conclusions
In the process of attempting to predict the role of the belowground in ecosystem response to disturbances, it becomes apparent that variables that reflect shifts in carbon allocation between above- and belowground biomass are important response variable to monitor. Analysis of this data-base suggested that climatic vari- ables and nutrient pools are important controlling fac- tors in determining the amount of fine root biomass maintained on a site while nutrient fluxes are important in predicting the amount of roots produced annually (NPP). Interestingly, the variables that were effective at predicting fine root biomass were poor at predicting fine root NPP and viceversa. Depending on the scale at which data were grouped, climatic variables increased in their ability to predict root dynamics as the groupings became more specific (i.e., evergreen and deciduous, climatic forest grouping to species and species groups by climatic zones). The high variability in either root biomass or root NPP by climatic forest type showed that variables other than climate are important in deter- mining the amount of carbon that is allocated to roots in many forest groupings. Fine root biomass was signifi- cantly predicted by either the N, P, or K contents or N/P ratio of aboveground litterfall - again variations in fine root NPP were not as well explained by a nutrient being cycled in aboveground litterfall. In contrast root NPP was better explained by the nutrients stored or being cycled in the surface organic layers. The data showed the importance of identifying functional groups at dif- ferent scales, for example at the level of a climatic forest type and/or species groupings (e.g. pines vs.
oaks) based on mechanistic physiological differences which strongly influence carbon allocation to roots and NPP.
Acknowledgements
We thank Kris H Johnson and Oswald Schmitz for con- sultations on statistical questions and John Ranciato for assistance with library research. The ideas devel- oped in this paper occurred while conducting research supported by the National Science Foundation Grant # BSR-8811902 (Long-term Ecological Research Pro- gram in the Luquillo Experimental Forest, Puerto Rico) and DEB9306758 to Yale University, and from the USDA Forest Service Insect and Disease Laborato- ry, Northeast Forest Experiment Station and Northeast Global Change Program.
References
Aber J D, Melilio J M, Nadelhoffer K J, McClangherty C A and Pastor J 1985 Fine root turnover in forest ecosystems in relation to quantity and form of nitrogen availability: a comparison of two methods. Oecoiogia 66, 317-321.
Aber J D and Federer C A 1992 A generalized, lumped-parameter model of photosynthesis, evapotranspiration and net primary pro- duction in temperate and boreal forest ecosystems. Oecologia 92, 463-474.
Abrams M D and Kubiske M E 1990 Leaf structural characteristics of 31 hardwood and conifer tree species in central Wisconsin: influence of light regime and shade tolerance rank. For. Ecol. Manage. 31,245-254.
Aerts R 1995 The advantages of being evergreen. Trends Ecol. Evol 10, 402-407.
Alexander I J and Fairley R I 1983 Effects of N fertilization on populations of fine roots and mycorrhizas in spruce humus. Plant and Soil 71, 49-53.
Anderson J M 1991 The effects of climate change on decomposition processes in grassland and coniferous forests. Ecol. Appl. 1,326- 347.
Arthur M A and Fahey T J 1992 Biomass and nutrients in an Engel- mann spruce-subalpine fir forest in north central Colorado: pools, annual production, and internal cycling. Can. J. For. Res. 22, 315- 325.
Axelsson B and Brakenhiehn S 1980 Investigation sites of the Swedish Coniferous Forest project- biological and physiograph- ical features. In Structure and Function of Northern Coniferous Forests - an Ecosystem Study. Ed. T Persson. Ecol. Bull. 32, 25-64.
Bazzaz F A, ChiarieUo N R, Coley P D and Pitelka L F 1987 Allo- cating resources to reproduction and defense. BioSci. 37, 58--67.
Benzing D H 1991 Aerial roots and their environments. In Plant Roots. The Hidden Half. F_As. Y Wiasel, A Eshel and U Katkafi. pp 867-886. Marcel Dekker, Inc. New York, USA.
Berish C W 1982 Root biomass and surface area in three successional tropical forests. Can. J. For. Res. 12, 699-704.
Bloomfield J, Vogt K A and Vogt D J 1993 Decay rate and substrate quality of fine roots and foliage of two tropical tree species in the Luquillo Experimental Forest, Puerto Rico. Plant and Soil 150, 233-245.
179
Blyth J R and MacLeod D A 1981 Sitka spruce (Picea sitchensis) in northeast Scotland. I. Relationships between site factors and growth. Forestry 54, 41-62.
Bormann F H and Likens G E 1979 Pattern and Process in a Forested Ecosystem. Springer-Verlag, New York, USA.
Boudot J P, Bel Hadj B A and Chone T 1986 Carbon mineralization in andosols and aluminum rich highland soils. Soil Biol. Biochem. 18, 457-461.
Brown S and Lugo A E 1982 The storage and production of organic matter in tropical forests and their role in the global carbon cycle. Biotropica 14, 161-187.
Burke M K and Raynal D J 1995 Fine root growth phenology, pro- duction, and turnover in a northern hardwood forest ecosystem. Plant and Soil 162, 135-146.
Cabanettes A 1979 Croissance, biomasse et productivit6 de Pinus pinea L. en petite Camargue. Unpublished Ph.D. Dissertation. Academi6 de Montpellier, Universit~ des Sciences et Techniques du Languedoc, Montpellier, France.
Cannell M G R 1982 World Forest Biomass and Primary Production Data. Academic Press, London, UK.
Cannell M G R and Dewar R C 1994 Carbon allocation in trees: a review of concepts for modelling. Adv. Ecol. Res. 25, 59-105.
Carey M L and Farrell E P 1978 Production, accumulation and nutrient content of Sitka spruce litterfall. Ir. For. 35, 35-44.
Castellanos J, Maass M and Kummerow J 1991 Root biomass of a dry deciduous tropical forest in Mexico. Plant and Soil 131, 225-228.
Cavelier J 1992 Fine-root biomass and soil properties in a semide- ciduous and a lower montane rain forest in Panama. Plant and Soil 142, 187-201.
Chapin F S III 1991 Integrated responses of plants to stress. BioSci. 41, 29-36.
Chapin F S III and Kedrowski R A 1983 Seasonal changes in nitro- gen and phosphorous fractions and autumn retranslocations in evergreen and deciduous taiga trees. Ecology 64, 376-391.
Chapin F S III, Bloom A J, Field C B and Waxing R H 1987 Plant responses to multiple environmental factors. BioSci. 37, 49-57.
Climates of the States 1980 National Oceanic and Atmospheric Administration Narrative Summaries, Tables, and Maps for Each State. 2rid ed. Vols. 1 and 2. Gale Research, Book Tower, Detroit, Michigan, USA.
Cole D W and Gessel S P 1968 Cedar River Research. A Program for Studying the Pathways, Rates, and Processes of Elemental Cycling in a Forest Ecosystem. Forest Resources Monograph. Institute of Forest Products, University of Washington College of Forest Resources Contribution No 4. 54 p.
Cole D W and Rapp M 1981 Elemental cycling in forests. In Dynam- ic Properties of Forest Ecosystems. International Biological Pro- gramme 23. Ed. D E Reichle. pp 341-409. Cambridge University Press, London, UK.
Coleman D C, Oades J M and Uehara G (eds) 1989 Dynamics of Soil Organic Matter in Tropical Ecosystems. NifTAL Project. Department of Agronomy and Soil Science, College of Trop. Agric. and Human Resources, University of Hawaii.
Coley P D 1988 Effects of plant growth rate and leaf lifetime on the amount and type of anti-herbivore defense. Oecologia 74, 531-536.
Comeau P G and Kimmins J P 1989 Above- and below-ground biomass and production of lodgepole pine on sites with differing soil moisture regimes. Can. J. For. Res. 19, 447-454.
Covington W W 1976 Forest floor organic matter and nutrient con- tent and leaffall during secondary succession in Northern hard- woods. Ph D Dissertation. Yale University, New Haven, CT, USA.
180
Covington W W 1981 Changes in forest floor organic matter and nutrient content following clear cutting in northern hardwoods. Ecology 62, 41-48.
Cox T L, Harris T L, Ausmus B S and Edwards N T 1978 The role of roots in biogeochemicai cycles in an eastern deciduous forest. Pedobiologica 18, 264--271.
Cromack K Jr 1973 Litter production and decomposition in a mixed hardwood watershed and a white pine watershed at Coweeta Hydrologic Station, North Carolina. Unpublished PhD Disserta- tion. University of Georgia, Athens, Georgia, USA.
Cuevas E and Medina E 1986 Nutrient dynamics within Amazonian forest ecosystems. I. Nutrient flux in fine litter fall and efficiency of nutrient utilization. Oecologia 68, 466-472.
Cuevas E and Medina E 1988 Nutrient dynamics within Amazonian forests. II. Fine root growth, nutrient availability and leaf litter decomposition. Oecologia 76, 222-235.
Cuevas E, Brown S and Lugo A E 1991 Above- and belowground organic matter storage and production in a tropical pine plantation and a paired broadleaf secondary forest. Plant and Soil 135, 257- 268.
Dahlgren R A, Vogt K A and Ugolini F C 1991 The intluence of soil chemistry on fine root aluminum concentrations in a subalpine Spodosol, Washington, USA. Plant and Soil 133 117-129.
Day F P Jr 1982 Litter decomposition rates in the seasonally flooded Great Dismal Swamp. Ecology 63, 670-678.
Day F P Jr 1984 Biomass and litter accumulation in the Great Dismal Swamp. In Cypress Swamps. Eds. K C Ewel and H T Odum. pp 386-392. University Florida Press Gainesville, Florida, USA.
DeAngelis D L, Gardner R H and Shugart H H 1981 Productivi- ty of forest ecosystems studied during the IBP: The woodlands data set. In Dynamic Properties of Forest Ecosystems. Intema- tionai Biological Programme 23. Ed. D E Reichle. pp 567-672. Cambridge University Press, London, UK.
Deans J D 1979 Fluctuations of the soil environment and fine root growth in a young Sitka spruce plantation. Plant and Soil 52, 195-208.
Deans J D 1981 Dynamics of coarse-root production in a young plantation ofPicea sitchensis. Forestry 54, 139-155.
Edwards P J 1977 Studies of mineral cycling in a montane rainforest in New Guinea. II. The production and disappearance of litter. J. Ecol. 65, 971-992.
Edwards P J 1982 Studies of mineral cycling in a montane rainforest in New Guinea. V. Rates of cycling in throughfall and litterfall. J. Ecol. 70, 807-827.
Edwards P J and Grubb P J 1977 Studies of mineral cycling in a montane rainforest in New Guinea. I. The distribution of organic matter in the vegetation and soil. J. Ecol. 65,943-969.
Edwards P J and Grubb P J 1982 Studies of mineral cycling in a montane rainforest in New Guinea. IV. Soil characteristics and the division of mineral elements between the vegetation and soil. J. Ecol. 70, 649-666.
Egtmjobi J K and Bada S O 1979 Biomass and nutrient distribution in stands of Pinus caribaea L. in the dry forest zone of Nigeria. Biotropica 11,130-135.
Ewel J J 1976 Litterfall and leaf decomposition in a tropical forest succession in eastern Guatemala. J. Ecol. 64, 293-308.
Ewel K C, Cropper W P Jr and Gholz H L 1987a Soil CO2 evolution in Florida slash pine plantations. I. Changes through time. Can. J. For. Res. 17, 325-329.
Ewel K C, Cropper W P Jr and Gholz H L 1987b Soil CO2 evo- lution in Florida slash pine plantations. II. Importance of root respiration. Can. J. For. Res. 17, 330-333.
Fahey T J and Hughes J W 1994 Fine root dynamics in a north- era hardwood forest ecosystem, Hubbard Brook Experimental Forest, NH. J. Ecol. 82, 533-548.
Farrish K W 1991 Spatial and temporal fine-root distribution in three Louisiana forest soils. Soil Sci. Soc. Am. J. 55, 1752-1757.
Field C B 1991 Ecological scaling of carbon gain to stress and resource availability. In Response of Plants to Multiple Stresses. Eds. H A Mooney, W E Winner and E J Pell. pp 35-61. Academic Press, London, UK.
Fogel R and Hunt G 1979 Fungal and arboreal biomass in a western Oregon Douglas-fir ecosystem: distribution patterns and turnover. Can. J. For. Res. 9, 245-256.
Fogel R and Hunt G 1983 Contribution of mycorrhizae and soil fungi to nutrient cycling in a Douglas-fir ecosystem. Can. J. For. Res. 13,219-232.
FOlster H, De Las Salas G and Khanna P 1976 A tropical evergreen forest site with perched water table, Magdalena Valley, Columbia. Biomass and bioelement inventory of primary and secondary vegetation. Oecol. Plant. 11,297-320.
Gholz H L, Hendry L C and Cropper W P Jr 1986 Organic matter dynamics of fine roots in plantations of slash pine (Pinus ellioni) in north Florida. Can. J. For. Res. 16, 529-538.
Goaster S Le, Dambrine E and Ranger J 1991 Croissance et nutrition min6rale d'un peuplement d'6pic6a sur sol pauvre. I. l~volution de la boimasse et dynamique d'incorporation d'616ments min6raux. Acta Oecol. 12, 771-789.
Gomez M M and Day F P Jr 1982 Litter nutrient content and pro- duction in the Great Dismal Swamp. Am. J. Bot. 69, 1314--1321.
Gower S T 1987 Relations between mineral nutrient availability and fine root biomass in two Costa Rican tropical wet forests. Biotropica 19, 171-175.
Gower S T, Isebrands J G and Sheriff D W 1995 Carbon allo- cation and accumulation in conifers. In Resource Physiology of Conifers: Acquisition Allocation, and Utilization. Eds. W K Smith and T M Hinckley. Academic Press, New York, USA.
Gower S T, Vogt K A and Grier C C 1992 Carbon dynamics of Rocky Mountain Douglas-fir: influence of water and nutrient availability. Ecol. Monogr. 62, 43-65.
Gower S T, Running S W, Gholz H L, Haynes B E, Hunt J E R, Ryan M G, Waring R H and Cropper J W P 1996 Influence of climate and nutrition on carbon allocation and net primary production of four conifer forests. Tree Physiol. (In press).
Greenland D J and Kowal J M 1960 Nutrient content of moist tropical forest in Ghana. Plant and Soil 12, 154-174.
Grier C C 1976 Biomass productivity and nitrogen-phosphorns cycles in bemlock-sprnce stands of the central Oregon coast. In Western Hemlock Management. Eds. W A Atkinson and R J Zasoski. pp 71-81. University of Washington Press, Seattle, Washington, USA.
Grier C C and Running S W 1976 Leaf area of mature northwestern coniferous forests: relation to site water balance. Ecology 58, 893-899.
Grier C C and Logan R S 1977 Old growth Pseudotsuga menziesii communities of a western Oregon watershed: Biomass distribu- tion and production budgets. Ecol. Monogr. 47, 373-400.
Grier C C and Ballard T M 1981 Biomass, nutrient distribution, and net production in alpine communities of the Kluane Mountains, Yukon Territory, Canada. Can. J. Bot. 59, 2635-2649.
Grier C C, Vogt K A, Keyes M R and Edmonds R L 1981 Biomass distribution and above- and belowgronnd production in young and mature Abies amabilis zone ecosystems of the Washington Cascades. Can. J. For. Res. 11,155-167.
Grnbb P J and Tanner E V J 1976 The montane forests and soils of Jamaica: a reassessment. J. Arnold Arboretum 57, 513-568.
Harris W F, Sollins P, Edwards N T, Dinger B E and Shugart H H 1975 Analysis of carbon flow and productivity in a temperate deciduous forest ecosystem. In Productivity of World Ecosystems. Eds. D E Reichle, J F Franklin and D W Goodall. pp 116-122. National Academy of Science, Washington D.C., USA.
Hase H and F61ster H 1982 Bioelement inventory of a tropical (semi-) evergreen seasonal forest on eutropic alluvial soils, West- ern Llanos, Venezuela. Acta Oecol./Oecol. Plant. 3, 331-346.
Haynes B E and Gower S T 1995 Belowground carbon allocation in unfertilized and fertilized red pine plantations in northern Wis- consin. Tree Physiol. 15, 317-325.
Helmisaari H-S 1995 Nutrient cycling in Pinus sylvestris stands in eastern Finland. Plant and Soil 168/169, 327-336.
Hendrick R L and Pregitzer K S 1993 The dynamics of fine root length, biomass, and nitrogen content in two northern hardwood ecosystems. Can. J. For. Res. 23, 2507-2520.
Homer J D, Cates R G and Gosz J R 1987 Tannin, nitrogen, and cell wall composition of green vs. senescent Douglas-fir foliage. Within- and between-stand differences in stands of unequal den- sity. Oecologia 72, 515-519.
Huntington T G, Ryan D F and Hamburg S P 1988 Estimating soil nitrogen and carbon pools in a northern hardwood forest ecosystem. Soil Sci. Soc. Am. J. 52, 1162-1167. 1989
Husni Mohd. Shariff A and Miller H G 1991 Soil fertility and tree species diversity in two Malaysian forests. J. Trop. For. Sci. 3, 318-331.
Huttel Ch 1969 Rapport d'Activit6 l'Ann6e 1968. Off. Reich. Sci. Technique Outremer, Centre d'Adiopodoume, Cote d'Ivoire.
Huttell C 1975 Root distribution and biomass in three Ivory Coast rain forest plots. In Tropical Ecological Systems. Trends in Ter- restrial and Aquatic Research. Eds. F B Golley and E Medina. pp 123-130. Springer-Verlag, New York, USA.
Huttel C and Bemhard-Reversat F 1975 Recherches sur l'~cosyst~me de al for6t sub-~quatoriale de Basse C6te-d'Ivoire. Terre Vie Rev. F~,col. Appl. 29, 169-264.
Ingestad T and Agren G 1992 Theories and methods on plant nutri- tion and growth. Physiol. Plant. 84, 177-184.
Jenkinson D S, Adams D E and Wild A 1991 Model estimates of CO2 emissions from soil in response: to global warming. Nature 351,304--306.
Jianping S, Dali T, Sidong Z and Miao W 1993 Fine root dynamics of broadleaved Korean pine forest in Changbai Mountain, China. Chinese J. Appl. Ecol. 4, 241-245.
Johnson D W, Cole D W, Bledsoe C S, Cromack K Jr, Edmonds R L, Gessel S P, Grier C C, Richards B N and Vogt K A 1982 Nutrient cycling in forests of the Pacific Northwest. In Analysis of Coniferous Forest Ecosystems in the Western United States. US/IBP Synthesis Series 14. Ed. R L Edmonds. pp 186--232. Hutchinson Ross Publishing Co., Pennsylvania, USA.
Jordan C F 1971 Productivity of a tropical forest and its relation to a world pattern of energy storage. J. Ecol. 59, 127-142.
Joslin J D and Anderson G S 1987 Organic matter and nutrients associated with fine root turnover in a white oak stand. For. Sci. 33, 330-346.
Kangas P 1992 Root regrowth in a subtropical wet forest in Puerto Rico. Biotropica 24, 463-465.
Kaul O N, Singli R P, Srivastava V K and Gurumurti K 1982 Distri- bution of organic matter in Pinus elliottii plantations. Indian For. 108, 39-50.
Keyes M R and Grier C C 1981 Below- and above-ground biomass and net production in two contrasting Douglas-fir stands. Can. J. For. Res. 11,599-605.
Kimmins J P and Hawkes B C 1978 Distribution and chemistry of fine roots in a white spruce- subalpine fir stand in British Columbia: Implications for management. Can. J. For. Res. 8, 265-279.
Kinerson R S, Ralston C W and Wells C G 1977 Carbon cycling in a loblolly pine plantation. Oecologia 29, 1-10.
Klinge H 1973 Root mass estimation in lowland tropical rain forests of central Amazunia, Brazil. I. Fine root masses of a pale yellow latosol and a giant humus podzol. Trop. Ecol. 14, 29-38.
181
Klinge H 1975 Root mass estimation in lowland tropical rainforests of central Ammonia, Brazil. III. Nutrients in fine roots from giant humus podsols. Trop. Ecol. 16, 28-38.
Klinge H and Rodrigues W A 1968a Litter production in an area of Amazonian terra firme forest. Part I. Litter-fall, organic carbon and total nitrogen contents of litter. Amazonian 1,287-302.
Klinge H and Rodrigues W A 1968b Litter production in an area of Amazonian terra firme forest. Part II. Mineral nutrient content of the litter. Amazonian 1,303-310.
Klinge H and Herrera R 1978 Biomass studies in Amazon caatinga forest in southern Venezuela. I. Standing crop of composite root mass in selected stands. Trop. Ecol. 19, 93-110.
Klinge H, Rodrigues W A, Brnnig E and Fittkau E J 1975 Biomass and structure in a central Amazonian rainforest. In Tropical Eco- logical Systems. Trends in Terrestrial and Aquatic Research. Eds. F B Golley and E Medina. pp 115-122. Springer-Verlag, Berlin, Germany.
Kummerow J, Castillanos J, Maas M and Lariganderie A 1990 Pro- duction of fine roots and the seasonality of their growth in a Mexican deciduous dry forest. Vegetatio 90, 73-80.
Lambers H and Poorter H 1992 Inherent variation in growth rate between higher plants: a search for physiological causes and ecological consequences. Adv. Ecol. Res. 23, 187-261.
Landsberg J J, Linder S and McMurtrie R E 1995 A strategic plan for research on managed forest ecosystems in a globally changing environment. Global Change and Terrestrial Ecosystems GCTE Report No. 4. GCTE Activity 3.5: Effects of Global Change on Managed Forests. Implementation Plan, pp 1-17.
Landsberg J J, Kaufmann M R, Binldey D, Isebrands J and Jarvis P G 1991 Evaluating progress towards closed forest models based on fluxes of carbon, water and nutrients. Tree Physiol. 9, 1-15.
Lawson G W, Armstrong-Mensah K O and Hall J B 1970 A catena in tropical moist deciduous forest near Kade, Ghana. J. Ecol. 58, 371-398.
Linder S and Axelsson B 1982 changes in carbon uptake and alloca- tion patterns as a result of irrigation and fertilization in a young Pinus sylvestris stand. In Carbon Uptake and Allocation: Key to Management of Subalpine Forest Ecosystems. Ed. R H War- ing. pp 38-44. IUFRO Workshop. For. Res. Lab., Oregon State University Corvallis Oregon USA.
Lodge D J, Scatena F N, Asbury C E and Sanchez M J 1991 Fine lit- terfall and related nutrient inputs resulting from Hurricane Hugo in subtropical wet and lower montane rain forests of Puerto Rico. Biotropica 23, 336-342.
Lugo A E 1992 Comparison of tropical tree plantations with sec- ondary forest, of similar age. Ecol. Monogr. 62, 1-41.
Lugo A E and Scatena F N 1995 Ecosystem-level properties of the Luquillo Experimental forest with emphasis on the Forest. In Tropical Forests: Management and Ecology. Ecological Studies. 112. Eds. A E Lugo and C Lowe. pp. 59-100. Springer-Verlag, New York, USA.
Luxmoore R J, Oren R, Sheriff D W and Thomas R B 1995 Source- sink-storage relationships of conifers. In Resource Physiology of Conifers: Acquisition, Allocation, and Utilization. Eds. W K Smith and T M Hincldey. pp 179-216. Academic Press, New York, USA.
Mabbedey D J 1992 Tropical Rain Forest Ecology. 2rid Ed. Chapman and Hall, New York, USA. 300 p.
Malk~nen E 1975 Annual primary production and nutrient cycle in a birch stand. Commun. Inst. For. Fenn. 91, 1-35.
Marshall J D and Waring R H 1985 Predicting fine root production and turnover by monitoring root starch and soil temperature. Can. J. For. Res. 15, 791-800.
McClaugherty C A, Aber J D and MeliUo J M 1982 The role of fine roots in the organic matter and nitrogen budgets of two forested ecosystems. Ecology 63, 1481-1490.
182
McClaugberty C A, Aber J D and Mdillo J M 1984 Decomposition dynamics of fine roots in forested ecosystems. Oikos 42, 378- 386.
McGinty D T 1976 Comparative root and soil dynamics on a white pine watershed and in the hardwood forest in the Coweeta Basin. Unpublished Ph.D. Dissertation. University of Georgia, Athens, Georgia, USA.
Megonigal J P and Day F P Jr 1988 Organic matter dynamics in four seasonally flooded forest communities of the Dismal Swamp. Am. J. Bot. 75, 1334-1343.
Meier C 1981 The role of fine roots in N and P budgets in young and mature Abies amabilis ecosystems. Ph.D. Dissertation. University of Washington, Seattle, WA, USA.
Merckx R, den Hartog A and Van Vcen J A 1985 Turnover of root- derived material and related microbial biomass formation in soils of different texture. Soil Biol. Biochem. 17, 565-569.
Mooney H A and Duma E L 1970 Photosynthetic systems of Mediter- ranean climate shrubs and trees of California and Chile. Am. Nat. 104, 447-453.
Mooney H A, Drake B G, Luxmoore R J, Oechd W C and Pitel- ka L F 1991 Predicting ecosystem responses to elevated CO2 concentrations. Bin Sci. 41, 96-104.
Nadelhoffer K J, Aber J D and Mdillo J M 1983 Leaf litter production and soil organic matter dynamics along a nitrogen availability gradient in southern Wisconsin (USA). Can. J. For. Res. 13, 12- 21.
Nadelhoffer K J, Aber J D and Mdillo J M 1985 Fine roots, net primary production and nitrogen availability: a new hypothesis. Ecology 66, 1377-1390.
Nilsson U and Albrektson A 1993 Productivity of needles and alloca- tion of growth in young Scots pine trees of different competitive status. For. Ecol. Manage. 62, 173-187.
Nye P H 1961 Organic matter and nutrient cycles under moist tropical forest. Plant and Soil 13,333-346.
Odum H T 1970 Summary: an emerging view of the ecological system at El Verde. In A Tropical Rain Forest. Eds. H T Odum and R F Pigeon. Ch. 1-10. US Atomic Energy Commission, Div. Tech. Inf Nat. Tech. Inf Serv., Springfield, Virginia, USA.
Ogawa H, Yoda K, Ogino K and Kira T 1965 Comparative ecological studies of three main types of forest vegetation in Thailand. 2. Plant biomass. Nature Life Southeast Asia 4, 49-81.
O'Neill R V and DeAngelis D L 1982 Comparative productivity and biomass relations of forest ecosystems. In Dynamic Properties of Forest Ecosystems. International Biological Programme 23. Ed. D E Reichle. pp 411-449. Cambridge University Press, London, UK.
Ovington J D and Olson J S 1970 Biomass and chemical content of El Verde Lower Montane rain forest plants. In A Tropical Rain Forest. Eds. H T Odum and R F Pigeon. Ch. 11-2. US Atomic Energy Commission, Div. Tech. Inf Nat. Tech. Inf Serv., Springfield, Virginia, USA.
Owen T H 1954 Observations on the monthly litterfall and nutrient content of Sitka spruce litter. Forestry 27, 7-15.
Pallardy S G, Cermak J, Ewers F W, Kanfmann M R, Parker W C and Sperry J S 1995. Water transport dynamics in trees and stands. In Resource Physiology of Conifers: Acquisition, Allocation, and Utilization. Eds. W K Smith and T M Hinckley. pp 301-389. Academic Press, New York, USA.
Pastor J P, Aber J D, McClaugberty C A and MdiUo J M 1984 Aboveground production and N and P cycling along a nitrogen mineralization gradient on Blacldaawk Island, Wisconsin. Ecolo- gy 65, 256-268.
Persson H 1978 Root dynamics in a young Scots pine stand in central Sweden. Oikos 30, 508-519.
Persson H 1980 Death and replacement of fine roots in a mature Scots pine stand. Ecol. Bull. (Stockholm) 32, 251-260.
Post W M, Emanuel W R, Zinke P J and Stangenberger A G 1982 Soil carbon pools and world life zones. Nature 298, 156-159.
Powell S W and Day F P Jr 1991 Root production in four communi- ties in the Great Dismal Swamp. Am. J. Bot. 78, 288-297.
Priess J and FOlster H 1994 Carbon cycle dynamics and soil respi- ration of forests under natural degradation in the Gran Sabana. Intersciencia 19, 317-322.
Puff S, Singh V, Bhushan B and Singh S 1994 Biomass production and distribution of roots in three stands of Populus deltoides. For. Ecol. Manage. 65, 135-147.
Raich J W and Naddhoffer K J 1989 Belowground carbon allocation in forest ecosystems: global trends. Ecology 70, 1346-1354.
Rastetter E B, King A W, Cosby B J, Hornberger G M, O'Neill R V and Hobbie J H 1992 Aggregating fine-scale ecological knowledge to model coarser-scale attributes of ecosystems. Ecol. Appl. 2, 44-70.
Reich P B, Waiters M B and Ellsworth D S 1992 Leaf life-span in relation to leaf, plant, and stand characteristics among diverse ecosystems. Ecol. Monogr. 62, 365-392.
Roy S and Singh J S 1995 Consequences of habitat heterogeneity for availability of nutrients in a dry tropical forest. J. Ecol. 82, 503-509.
Ruark G A and Bockheim J G 1987 Below-ground biomass of 10-, 20-, and 32-year-old Populus tremuloides in Wisconsin. Pedobi- ologia 30, 207-217.
Running S W and Hunt J E R 1993 Generalization of a forest ecosys- tem process model for other biomes, BIOME-BGC, and an appli- cation for global-scale models. In Scaling Physiological Process- es: Leaf to Globe. Eds. J R Ehleringer and C B Field. pp 141-156. Academic Press, New York, USA.
Safford L O 1974 Effect of fertilization on biomass and nutrient content of fine roots in a beech-birch-maple stand. Plant and Soil 40, 349--363.
Sanford R L Jr 1989 Root systems of three adjacent, old growth Amazon forests and associated transition zones. J. Trop. For. Sci. 1,268-279.
Sanford R L Jr 1989 Apogeotropic roots in an Amazon rain forest. Science 235, 1062-1064.
Santantonio D 1990 Modeling growth and production of tree roots. In Process Modeling of Forest Growth Responses to Environmental Stress. Eds. R K Dixon, R S Mddahl, G A Ruark and W G Warren. pp 124-141. Timber Press, Portland, Oregon, USA.
Santantonio D and Herrmann R K 1985 Standing crop, production, and turnover of fine roots on dry, moderate, and wet sites of mature Douglas-fir in western Oregon. Ann. Sci. For. 42, 113- 142.
Santantonio D and Santantonio E 1987 Effect of thinning on pro- duction and mortality of fine roots in a Pinus radiata plantation on a fertile site in New Zealand. Can. J. For. Res. 17 919--928.
Santantonio D and Grace J C 1987 Estimating fine-root production and turnover from biomass and decomposition data: a compart- ment flow model. Can. J. For. Res. 17, 900-908.
Schlesinger W H 1977 Carbon balance in terrestrial detritus. Annu. Rev. Ecol Syst. 8, 51-81.
Schulze E-D 1982 Plant life forms and their carbon, water and nutri- ent relations. In Physiological Plant Ecology 11. Water Relations and Carbon Assimilation. Eds. O L Lange, P S Nobel, C B Osmond and H Ziegler. pp 616--676. Springer-Verlag, Berlin, Germany.
Singh J S and Singh S P 1987 Forest vegetation of the Himalaya. The Bot. Rev. 53, 80-192.
Singh V 1994 Root distribution in Pinus deltoides "G-3" plantations in an arid region of northwestern India. Trop. Ecol. 35, 105-113.
Sollins P, Grier C C, McCorison F M, Cromack K Jr, Fogel R and Frederikson R L 1980 The internal dement cycles of an old-
growth Douglas-fir ecosystem in western Oregon. Ecol. Monogr. 50, 261-285.
Son Y and Gower S T 1991 Aboveground nitrogen and phosphorus use by five plantation-grown trees with different leaf longevities. Biogeocbemistry 14, 167-191.
Sprugel D G, Ryan M K, Brooks J R, Vogt K A and Martin T A 1994 Respiration. from the organ-level to the stand-a model system for the application of scaling techniques. In Resource Physiology of Conifers. Acquisition, Allocation, and Utilization. Eds. W K Smith and T M Hinckley. pp 255-299. Academic Press. San Diego, New York, USA.
Spycher G, Sollins P and Rose S 1983 Carbon and nitrogen in the light fraction of a forest soil: vertical distribution and seasonal patterns. Soil Sci. 135, 79-87.
Srivastava S K, Singh K P and Upadhyay R S 1986 Fine root growth dynamics in teak (Tectona grandis Linn. F.). Can. J. For. Res. 16, 1360-1364.
Stark N and Spratt M 1977 Root biomass and nutrient storage in rain forest oxisols near San Carlos de Rio Negro. Trop. Ecol. 18, 1-9.
Swank W T and Crossley D A 1988 Introduction and site description. In Forest Hydrology and Ecology at Coweeta. Eds. W T Swank and D A Crossley Jr. pp 3-16. Springer-Verlag New York, USA.
Swift M J, Heal O W and Anderson J M 1979 Decomposition in Terrestrial Ecosystems. Blackwell Publications, Oxford, UK.
Tanner E V J 1977 Four montane rain forests of Jamaica: a quan- titative characterization of the floristics, the soils and the foliar mineral levels, and a discussion of the interrelations. J. Ecol. 65, 883-918.
Tanner E V J 1980a Studies on the biomass and productivity in a series of montane rain forests in Jamaica. J. Ecol. 68, 573-588.
Tanner E V J 1980b Litterfall in montane rain forests of Jamaica and its relation to climate. J. Ecol. 68, 833-848.
Tanner E V J 1985 Jamaican montane forests: nutrient capital and cost of growth. J. Ecol. 73, 553-568.
Teskey R O and Hinckley T M 1981 Infuence of temperature and water potentials on root growth of white oak. Physiol. Plant. 52, 363-369.
Turner J 1975 Nutrient cycling in a Douglas-fir ecosystem with respect to age and nutrient status. Unpublished Ph.D. Disserta- tion, University of Washington, Seattle, Washington, USA.
Valentini R, Mugnozza G E S and Ehleringer J R 1992 Hydrogen and carbon isotope ratios of selected species of a Mediterranean macchia ecosystem. Funct. Ecol. 6, 627-631.
Vance E D and Nadkami N M 1992 Root biomass distribution in a moist tropical montane forest. Plant and Soil 142, 31-39.
Van Praag H J, Sougnez-Remy S, Weissen F and Carletti G 1988 Root turnover in a beech and a spruce stand of the Belgian Ardennes. Plant and Soil 105, 87-103.
Viereck L A, Dymess C T, Van Cleve K and Foote M J 1983 Veg- etation, soils, and forest productivity in selected forest types in interior Alaska. Can. J. For. Res. 13, 703-720.
Visalakshi N 1994 Fine root dynamics in two tropical dry evergreen forests in southern India. J. Biosci. 19, 103-116.
Vitousek P 1982 Nutrient cycling and nutrient use efficiency. Am. Nat. 119, 553-572.
Vitousek P M, Gosz J R, Grier C C, Melillo J M and Reiners W A 1982 A comparative analysis of potential nitrification and nitrate mobility in forest ecosystems. Ecol. Monogr. 52, 155-177.
Vitousek P M and Sanford R L Jr 1986 Nutrient cycling in moist tropical forests. Annu. Rev. Ecol. Syst. 17, 137-167.
Vogt D J 1987 Douglas-fir ecosystems in western Washington biomass and production as related to site quality and stand age. Ph.D. Dissertation. University of Washington, Seattle, Washing- ton, USA.
Vogt K A 1991 Carbon cycling in forest ecosystems. Tree Physiol. 9, 69-86.
183
Vogt K A, Grier C C, Meier C E and Edmonds R L 1982 Myc- orrhizal role in net primary production and nutrient cycling in Abies amabilis ecosystems in western Washington. Ecology 63, 370-380.
Vogt K A, Vogt D J, Moore E E, Littke W, Grier C and Leney C 1985 Estimating Douglas-fir fine root biomass and production from living bark and starch. Can. J. For. Res. 15, 177-179.
Vogt K A Grier C C and Vogt D J 1986 Production, turnover, and nutrient dynamics of above and belowground detritus of world forests. Adv. Ecol. Res. 15, 303-377.
Vogt K A, Dalalgren R A, Ugolini F, Zabowski D, Moore E E and Zasoski R J 1987 Above- and belowground: I. Concentrations of A1, Fe, Ca, Mg, K, Mn, C'u, Zn and P for Abies amabilis and Tsuga mertensiana. Biogeoebemistry 4, 277-294.
Vogt K A, Vogt D J, Moore E E and Sprugel D G 1989 Methodologi- cal considerations in measuring biomass, production, respiration and nutrient resorption for tree roots in natural ecosystems. In Applications of Continuous and Steady-State Methods to Root Biology. Eds. J G Torrey and L J Winship. pp 217-232. Kluwer Academic Publishers, Dordrecht, the Netherlands.
Vogt K A, Vogt D J, Gower S T and Grier C C 1990 Carbon and nitrogen interactions for forest ecosystems. In Above- and below- ground interactions in forest trees in acidified soils. Air Pollution Report 32. Ed. H Persson. pp 203-235. Commission of the Euro- pean Communities. Directorate-General for Science, Research and Development. Environment Research Programme, Brussels, Belgium.
Vogt K A, Publicover D A, Bloomfield J, Perez J M, Vogt D J and Silver W L 1993 Belowground responses as indicators of environmental change. Environ. Exp. Bot. 33, 189-205.
Vogt K A, Vogt D, Brown S, Tilley J Edmonds R, Silver W and Siccama T 1995 Forest floor and soil organic matter contents and factors controlling their accumulation in boreal temperate and tropical forests. Adv. Soil Sci. 159-178.
Vogt K A, Gordon J C, Wargo J P, Vogt D J, Asbjomsen H, Palmiotto P A, Clark H J, O'Hara J L, Keeton W S and Patel- Weynand T 1996 Ecosystems: Balancing Science with Manage- ment. Springer-Verlag, New York, USA.
Waring R H and Franklin J F 1979 The evergreen coniferous forests of the Pacific Northwest. Science 204, 1380-1386.
Waring R H 1987 Characteristics of trees predisposed to die: stress causes distinctive changes in photosynthate allocation. BioSci. 37, 569-574.
Waring R H and Schlesinger W H 1985 Forest Ecosystems: Concepts and Management. Academic Press, Orlando, Florida, USA.
Welch T G and Klemmedson J O 1975 Influence of the biotic fac- tor and parent material on distribution of nitrogen and carbon on ponderosa pine ecosystems. In Forest Soils and Forest Land Man- agement. Eds. B Bernier and C H Winget. pp 159-178. University of Laval Press, Quebec, Canada.
White C S, Gosz J R, Homer J D and Moore D I 1988 Season- al, annual, and treatment-induced variation in available nitrogen pools and nitrogen-cycling processes in soils of two Douglas-fir stands. Biol. Fertil. Soils 6, 93-99.
Yin X, Perry J A and Dixon R K 1989 Fine-root dynamics and biomass distribution in a Quercus ecosystem following harvest- ing. For. Ecol. Manage. 27, 159-177.
Yoda K and Kira T 1969 Comparative ecological studies on three main types of forest vegetation in Thailand. 5. Accumulation and turnover of soil organic matter, with notes on the altitudinal soil secyuenee on Khao (Mt.) Luang, peninsular Thailand. Nature Life Southeast Asia 6, 88-110.
Section editor: H Lambers
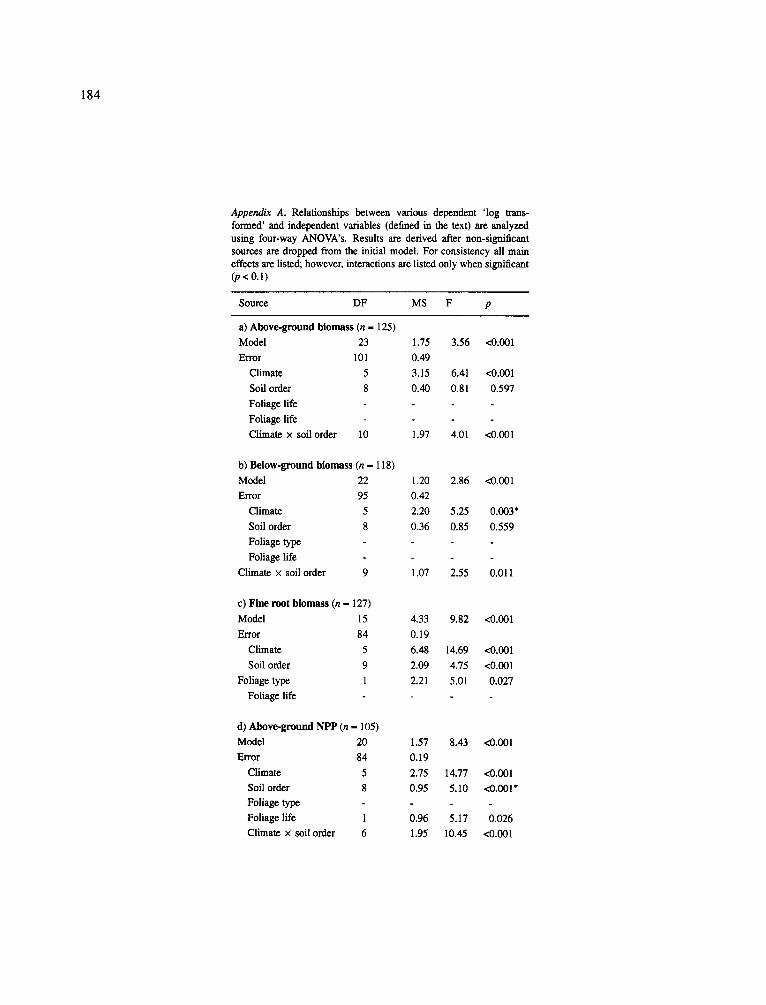
184
Appendix A. Relationships between various dependent 'log trans- formed' and independent variables (defined in the text) are analyzed using four-way ANOVA's. Results are derived after non-significant sources are dropped from the initial model. For consistency all main effects are listed; however, interactions are listed only when significant (p < 0.I)
Source DF MS F p
a) Above.ground bionmss (n - 125)
Model 23 1.75 3.56 <0.001
Error 101 0.49
Climate 5 3.15 6.41 <0.001
Soil order 8 0.40 0.81 0.597
Foliage life
Foliage life
Climate x soil order 10 1.97 4.01 <0.001
b) Below-ground biomass (n - 118)
Model 22 1.20 2.86 <0.001
Error 95 0.42
Climate 5 2.20 5.25 0.003*
Soil order 8 0.36 0.85 0.559 Foliage type
Foliage life
Climate x soil order 9 1.07 2.55 0.011
c) Fine root biomass (n - 127)
Model 15 4.33 9.82 <0.001
Error 84 0.19
Climate 5 6.48 14.69 <0.001
Soil order 9 2.09 4.75 <0.001
Foliage type 1 2.21 5.01 0.027
Foliage life
d) Above-ground NPP (n - 105)
Model 20 1.57 8.43 <0.001
Error 84 0.19
Climate 5 2.75 14.77 <0.001
Soil order 8 0.95 5.10 <0.001" Foliage type
Foliage life 1 0.96 5.17 0.026
Climate x soil order 6 1.95 10.45 <0.001
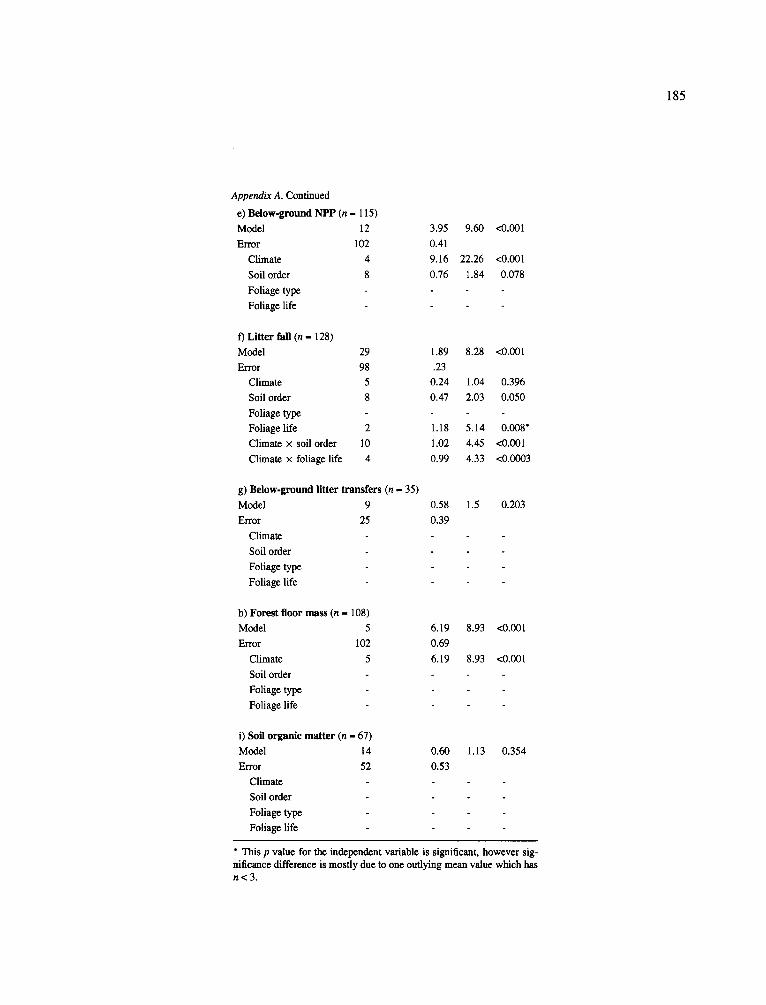
185
Appendix A. Continued
e) Below-ground NPP (n - 115)
Model 12
Error 102
Climate 4
Soil order 8
Foliage type
Foliage life
3.95 9.60 <0.001
0.41
9.16 22.26 <0.001
0.76 1.84 0.078
f) Litter fall (n - 128)
Model 29
Error 98
Climate 5
Soil order 8
Foliage type Foliage life 2
Climate x soil order 10
Climate x foliage life 4
1.89 8.28 <0.001
.23
0.24 1.04 0.396
0.47 2.03 0.050
1.18 5.14 0.008*
1.02 4.45 <0.001
0.99 4.33 <0.0003
g) Below.ground litter transfers (n - 35)
Model 9
Error 25
Climate
Soil order
Foliage type
Foliage life
0.58 1.5 0.203
0.39
h) Forest floor mass (n - 108)
Model 5
Error 102
Climate 5
Soil order
Foliage type
Foliage life
6.19 8.93 <0.001
0.69
6.19 8.93 <0.001
i) Soil organic matter (n - 67)
Model 14
Error 52
Climate
Soil order
Foliage type
Foliage life
0.60 1.13 0.354
0.53
* This p value for the independent variable is significant, however sig- nificance difference is mostly due to one outlying mean value which has n < 3 .
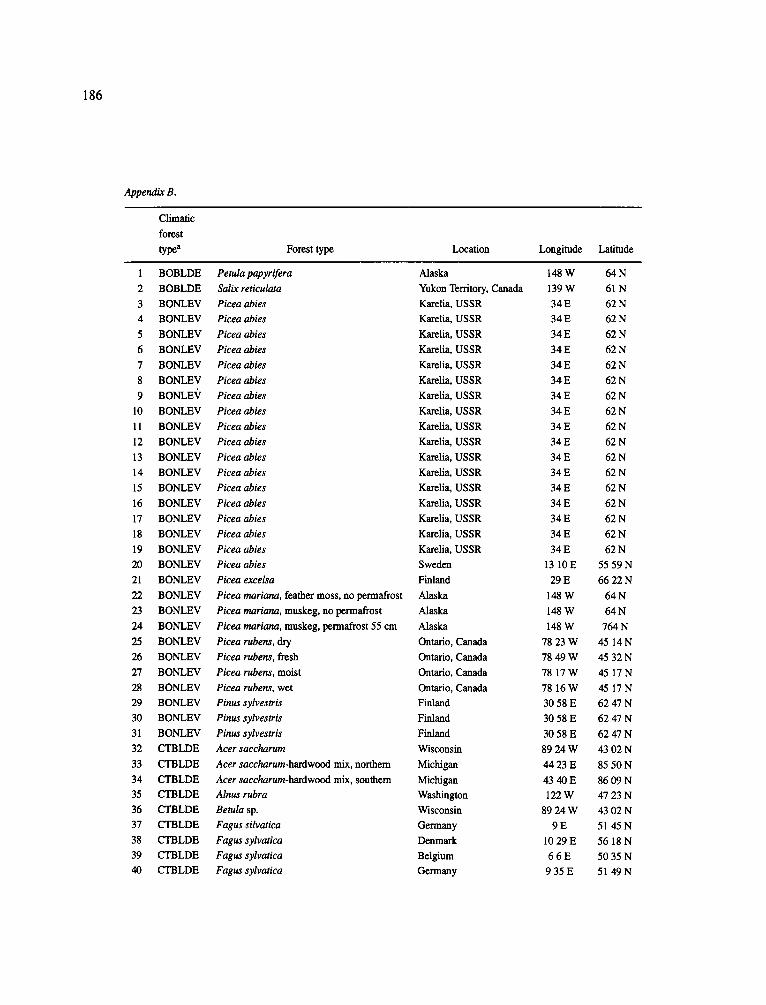
186
Appendix B.
Climatic
forest
type a Forest type Location Longitude Latitude
1 BOBLDE
2 BOBLDE
3 BONLEV
4 BONLEV
5 BONLEV
6 BONLEV
7 BONLEV
8 BONLEV
9 BONLE~ r
10 BONLEV
11 BONLEV
12 BONLEV
13 BONLEV
14 BONLEV
15 BONLEV
16 BONLEV
17 BONLEV
18 BONLEV
19 BONLEV
20 BONLEV
21 BONLEV
22 BONLEV
23 BONLEV
24 BONLEV
25 BONLEV
26 BONLEV
27 BONLEV
28 BONLEV
29 BONLEV
30 BONLEV
31 B ONLEV
32 CTBLDE
33 CTBLDE
34 CTBLDE
35 CTBLDE
36 CTBLDE
37 CTBLDE
38 C'I~LDE
39 CTBLDE 40 CTBLDE
P etula papyrifera
Salix reticulata
Picea abies
Picea abies
Picea abies
Picea abies
Picea abies
Picea abies
Picea abies
Picea abies
Picea abies
Picea abies
Picea abies
Picea abies
Picea abies
Picea abies
Picea abies
Picea abies
Picea ables
Picea abies
Picea excelsa
Picea mariana, feather moss, no permafrost
Picea mariana, muskeg, no permafrost
Picea mariana, muskeg, permafrost 55 cm
Picea rubens, dry
Picea rubens, fresh
Picea rubens, moist
Picea rubens, wet
Pinus sylvestris
Pinus sylvestris
Pinus sylvestris
Acer saccharum
Acer saccharum-hardwood mix, northem
Acer saccharum-hardwood mix, southern Alnus rubra
Betula sp.
Fagus silvatica
Fagus sylvatica
Fagus sylvatica
Fagus sylvatica
Alaska 148 W 64 N
Yukon Territory, Canada 139 W 61 N
Karelia, USSR 34 E 62 N
Karelia, USSR 34 E 62 N
Karelia, USSR 34 E 62 N
Karelia, USSR 34 E 62 N
Karelia, USSR 34 E 62 N
Karelia, USSR 34 E 62 N
Karelia, USSR 34 E 62 N
Karelia, USSR 34 E 62 N
Karelia, USSR 34 E 62 N
Karelia, USSR 34 E 62 N
Karelia, USSR 34 E 62 N
Karelia, USSR 34 E 62 N
Karelia, USSR 34 E 62 N
Karelia, USSR 34 E 62 N
Karelia, USSR 34 E 62 N
Karelia, USSR 34 E 62 N
Karelia, USSR 34 E 62 N
Sweden 13 10 E 55 59 N
Finland 29 E 66 22 N
Alaska 1 48 W 64 N
Alaska 148 W 64 N
Alaska 148 W 764 N
Ontario, Canada 78 23 W 45 14 N
Ontario, Canada 78 49 W 45 32 N
Ontario, Canada 78 17 W 45 17 N
Ontario, Canada 78 16 W 45 17 N
Finland 30 58 E 62 47 N
Finland 30 58 E 62 47 N
Finland 30 58 E 62 47 N
Wisconsin 89 24 W 43 02 N
Michigan 44 23 E 85 50 N
Michigan 43 40 E 86 09 N
Washington 122 W 47 23 N
Wisconsin 89 24 W 43 02 N
Germany 9 E 51 45 N
Denmark 10 29 E 56 18 N
Belgium 6 6 E 50 35 N
Germany 9 35 E 51 49 N
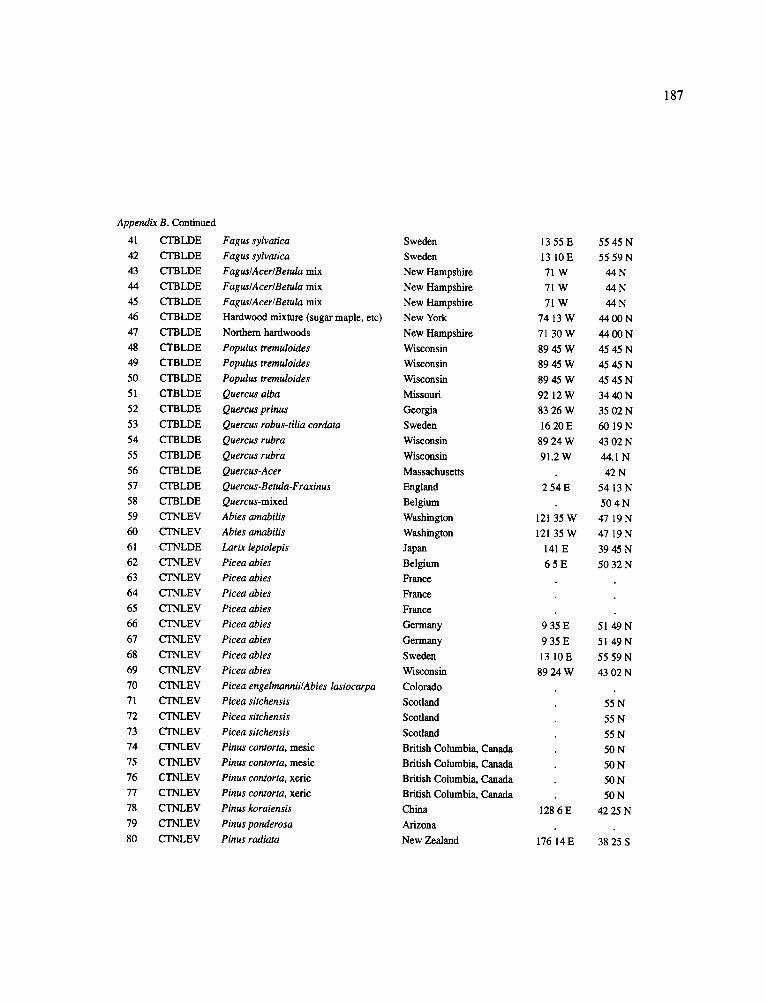
187
Appendix B. Continued
41 CTBLDE Fagus sylvatica 42 CTBLDE Fagus sylvatica 43 CTBLDE Fagus/Acer/Betula mix
44 CTBLDE Fagus/Acer/Betula mix
45 CTBLDE Fagus/Acer/Betula mix
46 CTBLDE Hardwood mixture (sugar maple, etc)
47 CTBLDE Northern hardwoods
48 CTBLDE Populus tremuloides 49 CTBLDE Populus tremuloides 50 CTBLDE Populus tremuloides 51 CTBLDE Quercus alba 52 CTBLDE Quercus prinus
53 CTBLDE Quercus robus-tilia cordata 54 CTBLDE Quercus rubra 55 CTBLDE Quercus rubra
56 CTBLDE Quercus-Acer 57 CTBLDE Quercus-Betula-Fraxinus 58 CTBLDE Quercus-mixed 59 CTNLEV Abies amabilis 60 CTNLEV Abies amabilis 61 CTNLDE Larix leptolepis 62 CTNLEV Picea abies 63 CTNLEV Picea abies 64 CTNLEV Picea abies
65 CTNLEV Picea abies 66 CTNLEV Picea abies 67 CTNLEV Picea abies
68 CTNLEV Picea abies 69 CTNLEV Picea abies
70 CTNLEV Picea engelmannii/Abies lasiocarpa 71 CTNLEV Picea sitchensis 72 CTNLEV Picea sitchensis
73 CTNLEV Picea sitchensis 74 CTNLEV Pinus contorta, mesic
75 CTNLEV Pinus contorta, mesic
76 CTNLEV Pinus contorta, xeric
77 CTNLEV Pinus contorta, xeric
78 CTNLEV Pinus koraiensis
79 CTNLEV Pinus ponderosa 80 CTNLEV Pinus radiata
Sweden
Sweden
New Hampshire
New Hampshire
New Hampshire
New York
New Hampshire
Wisconsin
Wisconsin
Wisconsin
Missouri
Georgia
Sweden
Wisconsin
Wisconsin
Massachusetts
England
Belgium
Washington
Washington
Japan
Belgium
France
France
France
Germany
Germany
Sweden
Wisconsin
Colorado
Scotland
Scotland
Scotland
British Columbia, Canada
British Columbia, Canada
British Columbia, Canada
British Columbia, Canada
China
Arizona
New Zealand
13 55E
13 10 E
71W
71W
71W
74 13 W
71 30W
8945W
8945W
8945 W
92 12W
83 26 W
1620E
89 24 W
91.2W
254E
121 35 W
121 35 W
141E
6 5 E
935E
935E
13 10E
89 24 W
128 6E
176 14E
55 45 N
55 59 N 44N
44N
44N
4400N
4400N
4545N
4545N
4545N
3440N
35 02 N
60 19N
43 02 N
44.1N
42N
5413N
50 4N
47 19N
47 19N
3945 N
50 32 N
5149N
51 49N
55 59 N
43 02 N
55 N
55 N
55 N
50 N
50 N
50 N
50 N
4225N
38 25 S
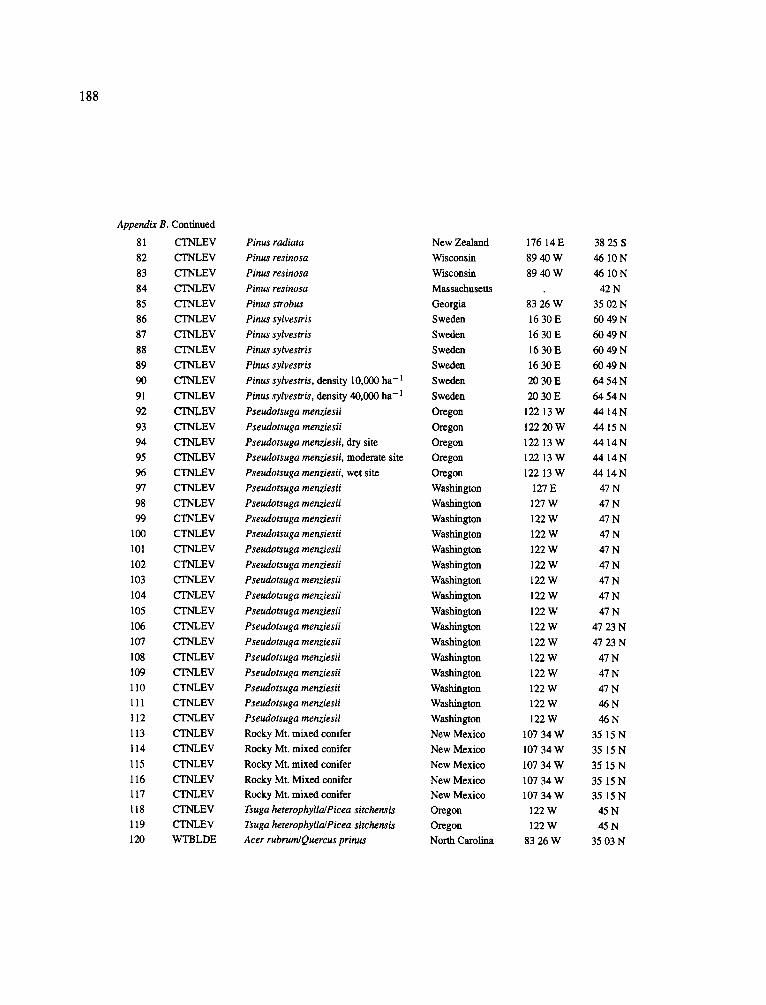
188
Appendix B.
81
82
83
84
85
86
87
88
89
90
91
92
93
94
95
96
97
98
99
100
101
102
103
104
105
106
107
108
109
110
111
112
113
114
115
116 117
118
119 120
Continued
CTNLEV
CTNLEV
CTNLEV
CTNLEV
CTNLEV
CTNLEV
CTNLEV
CTNLEV
CTNLEV
CTNLEV
CTNLEV
CTNLEV
CTNLEV
CTNLEV
CTNLEV
CTNLEV
CTNLEV
CTNLEV
CTNLEV
CTNLEV
CTNLEV
CTNLEV
CTNLEV
CTNLEV
CTNLEV
CTNLEV
CTNLEV
CTNLEV
CTNLEV
CTNLEV
CTNLEV
CTNLEV
CTNLEV
CTNLEV
CTNLEV
CTNLEV CTNLEV
CTNLEV
CTNLEV
WTBLDE
Pinus radiata Pinus resinosa Pinus resinosa Pinus resinosa Pinus strobus Pinus sylvestris Pinus sylvestris Pinus sylvestris Pinus sylvestris Pinus sylvestris, density 10,000 ha-1
Pinus sylvestris, density 40,000 ha- 1
Pseudotsuga menztesii Pseudotsuga menztesii Pseudotsuga menziesii, dry site
Pseudotsuga menztesii, moderate site
Pseudotsuga menztesii, wet site
Pseudotsuga menztesii Pseudotsuga menz~esii Pseudotsuga menztesii Pseudotsuga menszesii Pseudotsuga menztesii Pseudotsuga menztesii Pseudotsuga menztesii Pseudotsuga menztesii Pseudotsuga menztesii Pseudotsuga menzzesii Pseudotsuga menztesii Pseudotsuga menztesii Pseudotsuga menz~esii Pseudotsuga menztesii Pseudotsuga menztesii Pseudotsuga menztesii Rocky Mt. mixed conifer
Rocky Mt. mixed conifer
Rocky Mt. mixed conifer
Rocky Mt. Mixed conifer Rocky Mt. mixed conifer
Tsuga heterophylla/Picea sitchensis Tsuga heterophylla/Picea sitchensis Acer rubrum/Quercus prinus
New Zealand
Wisconsin
Wisconsin
Massachusetts
Georgia
Sweden
Sweden
Sweden
Sweden Sweden Sweden Oregon Oregon Oregon Oregon Oregon Washington Washington Washington Washington Washington Washington Washington Washington
Washington
Washington
Washington
Washington
Washington
Washington Washington Washington New Mexico New Mexico
New Mexico
New Mexico
New Mexico Oregon
Oregon
North Carolina
176 14E
89 40W
89 40W
83 26 W
16 30 E
16 30E
16 30E
16 30E
20 30 E
20 30E
122 13 W
122 20W
122 13 W
122 13 W
122 13 W
127 E
127W
122 W
122 W
122 W
122 W
122 W
122 W
122 W
122 W
122 W
122 W
122 W
122 W
122 W
122 W
107 34 W
107 34 W
107 34 W
107 34 W 107 34 W
122 W
122 W
83 26W
38 25 S
46 10N
46 10N
42N
35 02 N
6049N
6049N
6049N
6049N
6454N
6454N
4414N
4415N
4414N
4414N
44 14N
47N
47N
47N
47N
47N
47N
47N
47N
47N
47 23N
47 23N
47N
47N
47N
46N
46N
35 15N
35 15 N
35 15 N
35 15N 35 15N
45N
45N
35 03 N
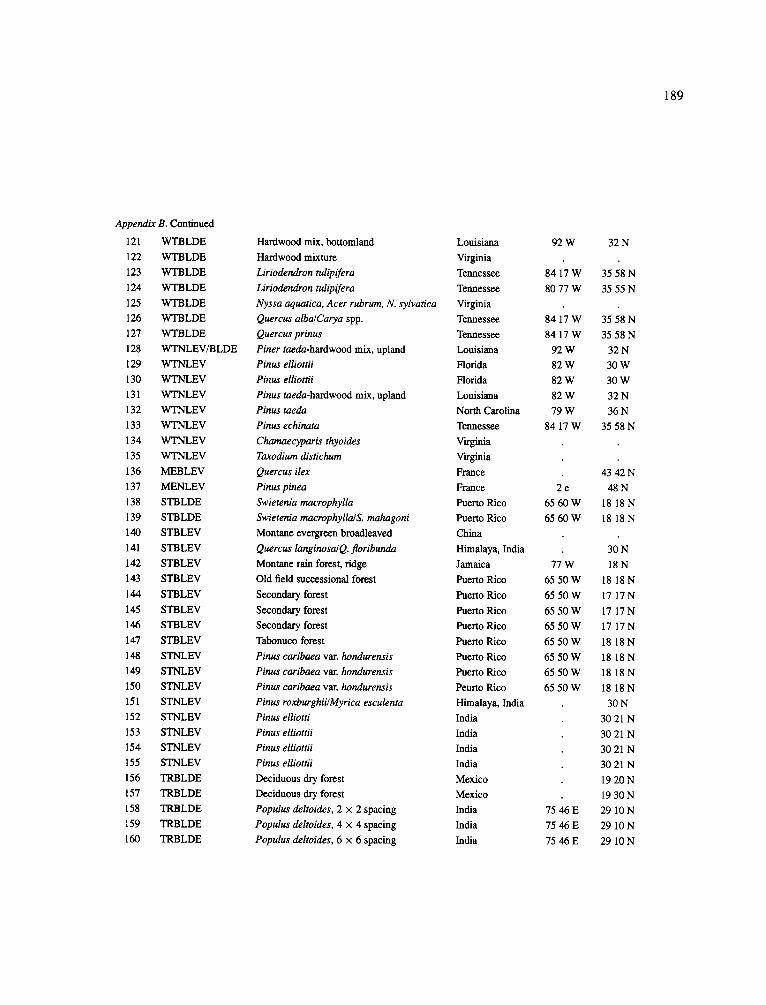
189
Appendix B. Continued
121 WTBLDE
122 WTB LDE
123 WTBLDE
124 WTBLDE
125 WTBLDE
126 WTBLDE
127 WTBLDE
128 WTNLEV/BLDE
129 WTNLEV
130 WTNLEV
131 WTNLEV
132 WTNLEV
133 WTNLEV
134 WTNLEV
135 WTNLEV
136 MEBLEV
137 MENLEV
138 STBLDE
139 STBLDE
140 STBLEV
141 STBLEV
142 STBLEV
143 STBLEV
144 STBLEV
145 STBLEV
146 STBLEV
147 STBLEV
148 STNLEV
149 STNLEV
150 STNLEV
151 STNLEV
152 STNLEV
153 STNLEV
154 STNLEV
155 STNLEV
156 TRBLDE
157 TRBLDE
158 TRBLDE
159 TRBLDE
160 TRBLDE
Hardwood mix, bottomland
Hardwood mixture
Liriodendron tulipifera
Liriodendron tulipifera Nyssa aquatica, Acer rubrum, N. sylvatica Quercus alba/Carya spp.
Quercus prinus Piner taeda-hardwood mix, upland
Pinus elliottii Pinus elliottii Pinus taeda-hardwood mix, upland
Pinus taeda Pinus echinata
Chamaecyparis thyoides Taxodium distichum
Quercus ilex Pinus pinea Swietenia macrophylla
Swietenia macrophylla/ S. mahagoni Montane evergreen broadleaved
Quercus langinosa/ Q. floribtmda Montane rain forest, ridge
Old field successional forest
Secondary forest
Secondary forest
Secondary forest
Tabonuco forest
Pinus caribaea var. hondurensis Pinus caribaea var. hondurensis Pinus caribaea var. hondurensis Pinus roxburghii/Myrica esculenta Pinus elliotti
Pinus elliottii Pinus elliottii Pinus elliottii
Deciduous dry forest
Deciduous dry forest
Populus deltoides, 2 × 2 spacing
Populus deltoides, 4 × 4 spacing
Populus deltoides, 6 × 6 spacing
Louisiana
Virginia
Tennessee
Tennessee
Virginia
Tennessee
Tennessee
Louisiana
Florida
Florida
Louisiana
North Carolina
Tennessee
Virginia
Virginia
France
France
Puerto Rico
Puerto Rico
China
Himalaya, India
Jamaica
Puerto Rico
Puerto Rico
Puerto Rico
Puerto Rico
Puerto Rico
Puerto Rico
Puerto Rico
Peurto Rico
Himalaya, India
India
India
India
India
Mexico
Mexico
India
India
India
92 W
84 17W
80 77W
84 17W
84 17W
92W
82W
82W
82W
79W
84 17W
2e
65 60W
65 60W
77W
65 50W
65 50W
65 50W
65 50W
65 50W
65 50W
65 50W
65 50W
75 46E
75 46E
75 46E
32 N
35 58 N
35 55 N
35 58 N
35 58 N
32 N
30 W
30 W
32 N
36 N
35 58 N
43 42N
48N
18 18 N
18 18 N
30 N
18N
18 18 N
17 17 N
17 17 N
17 17N
18 18 N
18 18 N
18 18 N
18 18 N
30 N
3021N
3021N
3021N
3021N
19 20 N
19 30 N
29 10N
29 10 N
29 10 N
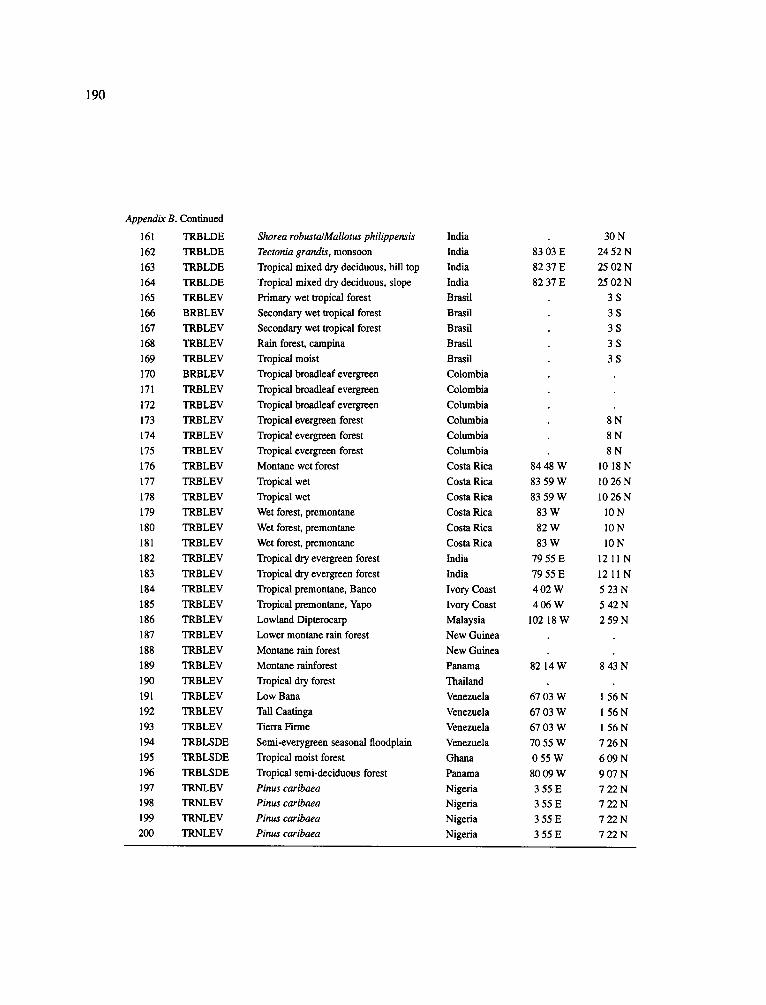
190
Appendix B. Continued
161 TRBLDE
162 TRBLDE
163 TRBLDE
164 TRBLDE
165 TRBLEV
166 BRBLEV
167 TRBLEV
168 TRBLEV
169 TRBLEV
170 BRBLEV
171 TRBLEV
172 TRBLEV
173 TRBLEV
174 TRBLEV
175 TRBLEV
176 TRBLEV
177 TRBLEV
178 TRBLEV
179 TRBLEV
180 TRBLEV
181 TRBLEV
182 TRBLEV
183 TRBLEV
184 TRBLEV
185 TRBLEV
186 TRBLEV
187 TRBLEV
188 TRBLEV
189 TRBLEV
190 TRBLEV
191 TRBLEV
192 TRBLEV
193 TRBLEV
194 TRBLSDE
195 TRBLSDE
196 TRBLSDE
197 TRNLEV 198 TRNLEV
199 TRNLEV
200 TRNLEV
Shorea robusta/Mallotus philippensis
Tectonia grandis, monsoon
Tropical mixed dry deciduous, hill top
Tropical mixed dry deciduous, slope
Primary wet tropical forest
Secondary wet tropical forest
Secondary wet tropical forest
Rain forest, campina
Tropical moist
Tropical broadleaf evergreen
Tropical broadleaf evergreen
Tropical broadleaf evergreen
Tropical evergreen forest
Tropical evergreen forest
Tropical evergreen forest
Montane wet forest
Tropical wet
Tropical wet
Wet forest, premontane
Wet forest, premontane
Wet forest, premontane
Tropical dry evergreen forest
Tropical dry evergreen forest
Tropical premontane, Banco
Tropical premontane, Yapo
Lowland Dipterocarp
Lower montane rain forest
Montane rain forest
Montane rainforest
Tropical dry forest
Low Bana
Tall Caatinga
Tierra Firme
Semi-everygreen seasonal floodplain
Tropical moist forest
Tropical semi-deciduous forest
Pinus caribaea Pinus caribaea
Pinus caribaea
Pinus caribaea
India
India
India
India
Brasil
Brasil
Brasil
Brasil
Brasil
Colombia
Colombia
Columbia
Columbia
Columbia
Columbia
Costa Rica
Costa Rica
Costa Rica
Costa Rica
Costa Rica
Costa Rica
India
India
Ivory Coast
Ivory Coast
Malaysia
New Guinea
New Guinea
Panama
Thailand
Venezuela
Venezuela
Venezuela
Venezuela
Ghana
Panama
Nigeria
Nigeria
Nigeria
Nigeria
83 03 E
82 37 E
82 37 E
8448W
83 59W
83 59W
83W
82W
83W
79 55 E
79 55 E
402W
406W
102 18W
82 14W
67 03 W
67 O3 W
67 03 W
70 55 W
055W
80 09 W
355 E
3 55E
355E
355E
30 N
24 52 N
25 02 N
25 02 N
3S
3S
3S
3S
3S
8N
8N
8N
10 18 N
1026N
10 26 N
10N
10N
10N
1211N
1211N
523N
542N
259N
8 43 N
1 56N
1 56N
1 56N
7 26N
609N
907 N
722N
7 22N
722N
722N
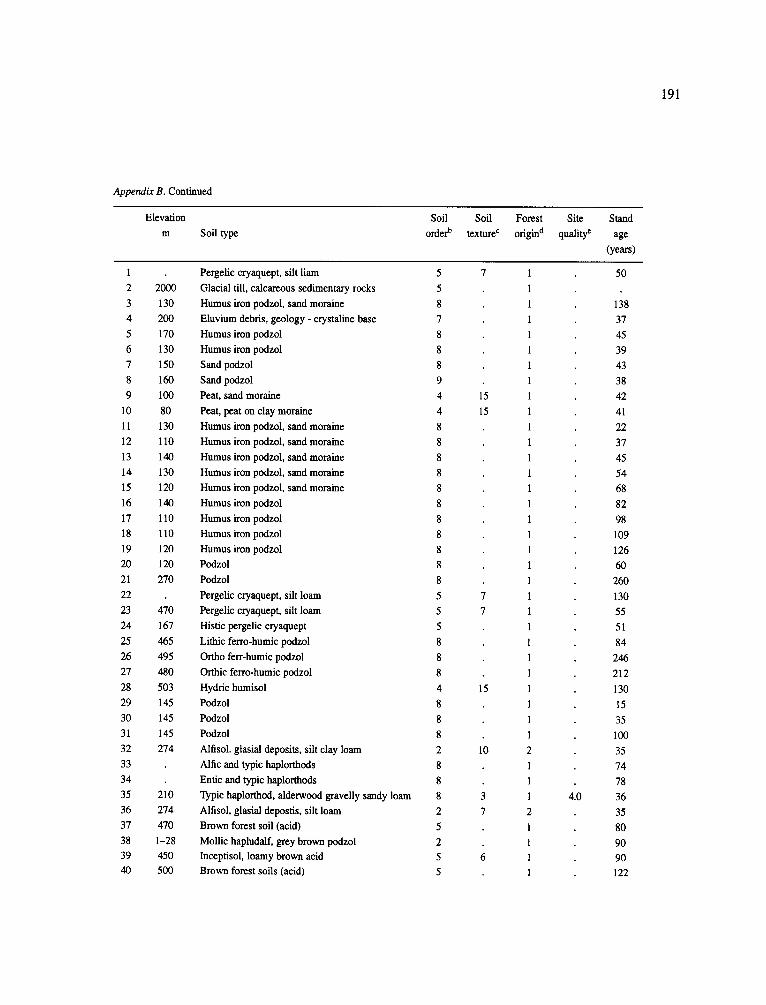
191
Appendix B. Continued
Elevation
m Soil type
Soil order b
Soil mxmre c
Forest
origin a
Sim quality e
Stand
age
(years)
I
2
3
4
5
6
7
8
9
10
11
12
13
14
15
16
17
18
19
20
21
22
23
24
25
26
27
28
29
30
31
32
33
34
35
36
37
38
39 40
2000
130
200
170
130
150
160
100
80
130
110
140
130
120
140
110
110
120
120
270
470
167
465
495
480
503
145
145
145
274
210
274
470
1-28
450 500
Pergelic cryaquept, silt liam
Glacial till, calcareous sedimentary rocks
Humus iron podzol, sand moraine
Eluvium debris, geology - crystaline base
Humus iron podzol
Humus iron podzol
Sand podzol
Sand podzol
Peat, sand moraine
Peat, peat on clay moraine
Humus iron podzol, sand moraine
Humus iron podzol, sand moraine
Humus iron podzol, sand moraine
Humus iron podzol, sand moraine
Humus iron podzol, sand moraine
Humus iron podzol
Humus iron podzol
Humus iron podzol
Humus iron podzol
Podzol
Podzol
Pergelic cryaquept, silt loam
Pergelic cryaquept, silt loam
Histic pergelic cryaquept
Lithic ferro-humic podzol
Ortho ferr-humic podzol
Orthic ferro-humic podzol
Hydric humisol
Podzol
Podzol
Podzol
Alfisol. gtasial deposits, silt clay loam
Alfic and typic haplorthods
Entic and typic haplorthods
Typic haplorthod, alderwood gravelly sandy loam
Alfisol, glasial depostis, silt loam
Brown forest soil (acid)
Mollic hapludalf, grey brown podzol Inceptisol, loamy brown acid Brown forest soils (acid)
5
5
8
7
8
8
8
9
4
4
8
8
8
8
8
8
8
8
8
8
8
5
5
5
8
8
8
4
8
8
8
2
8
8
8
2
5
2 5
5
15
15
15
10
4.0
50
138
37
45
39
43
38
42
41
22
37
45
54
68
82
98
109
126
60
260
130
55
51
84
246
212
130
15
35
100
35
74
78
36
35
80
90 90
122
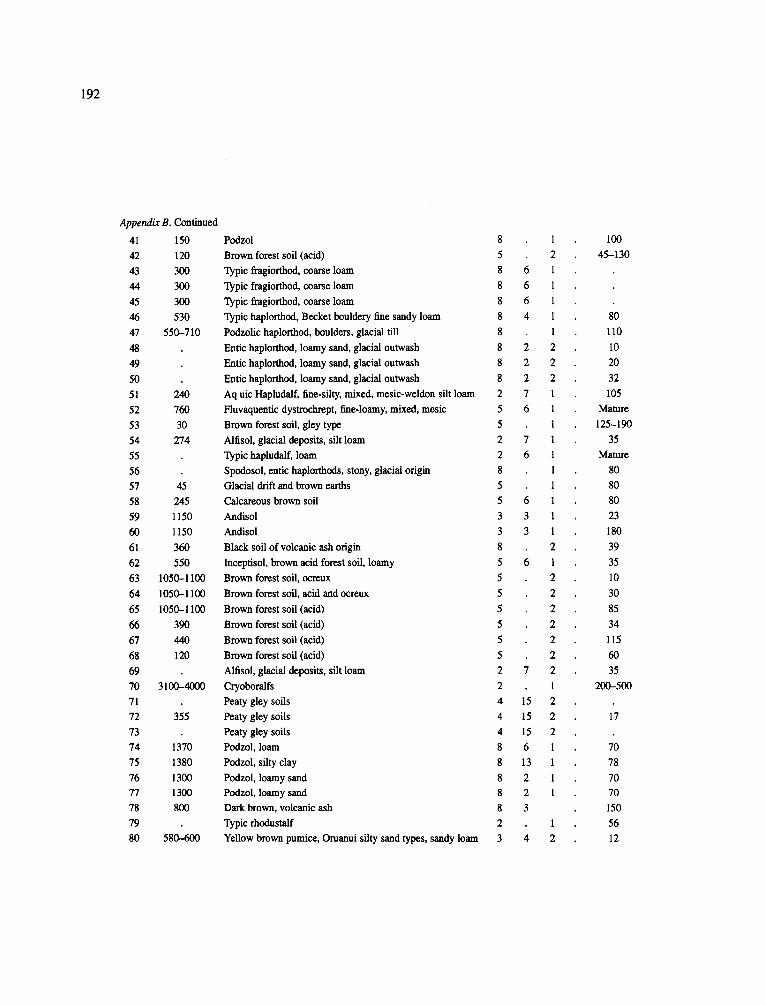
192
Appendix B. Continued
41 150
42 120 43 300
44 300
45 300
46 530
47 550-710
48
49
50 51 240
52 760
53 30 54 274
55
56 57 45 58 245
59 1150
60 1150
61 360
62 550
63 1050-1100
64 1050-1100
65 1050-1100 66 390
67 440
68 120
69 70 3100--4000
71
72 355
73 74 1370
75 1380
76 1300 77 1300
78 800
79 80 580-600
Podzol 8 1
Brown forest soil (acid) 5 2 Typic fragiorthod, coarse loam 8 6 1
Typic fragiorthod, coarse loam 8 6 1
Typic fragiorthod, coarse loam 8 6 1 Typic haplorthod, Becket bouldery fine sandy loam 8 4 1
Podzolic haplorthod, boulders, glacial till 8 1
Entic haplorthod, loamy sand, glacial outwash 8 2 2
Entic haplorthod, loamy sand, glacial outwash 8 2 2
Entic haplorthod, loamy sand, glacial outwash 8 2 2
Aq uic Hapludalf, fine-silty, mixed, mesic-weldon silt loam 2 7 1
Huvaquentic dystrochrept, fine-loamy, mixed, mesic 5 6 1
Brown forest soil, gley type 5 1
Alfisol, glacial deposits, silt loam 2 7 1 Typic hapludalf, loam 2 6 1
Spodosol, entic haplorthods, stony, glacial origin 8 1
Glacial drift and brown earths 5 1
Calcareous brown soil 5 6 1
Andisol 3 3 1
Andisol 3 3 1
Black soil of volcanic ash origin 8 2
Inceptisol, brown acid forest soil, loamy 5 6 1
Brown forest soil, ocreux 5 2
Brown forest soil, acid and ocreux 5 2
Brown forest soil (acid) 5 2
Brown forest soil (acid) 5 2
Brown forest soil (acid) 5 2
Brown forest soil (acid) 5 2
Alfisol, glacial deposits, silt loam 2 7 2
Cryoboralfs 2 1 Peaty gley soils 4 15 2
Peaty gley soils 4 15 2
Peaty gley soils 4 15 2 Podzol, loam 8 6 1
Podzol, silty clay 8 13 1
Podzol, loamy sand 8 2 1 Podzol, loamy sand 8 2 1
Dark brown, volcanic ash 8 3 Typic rhodustalf 2 1
Yellow brown pumice, Oruanui silty sand types, sandy loam 3 4 2
100
45-130
80
110
10
20
32
105 Mature
125-190
35 Mature
80 80
80
23
180
39
35
10
30
85
34
115 60
35
200-500
17
70
78
70 70
150
56 12

193
Appendix B. Continued
81 580-600 Yellow brown pumice, Oruanui silty sand types, sandy loam
82 500 Sandy, mixed frigid entic haplotthod, loamy fine sand
83 500 Sandy, mixed frigid entic haplorthod, loamy fine sand
84 Spodosol, entic haplorthods, stony, glacial origin
85 760 Fuvaquentic dystrochrept, fine-loamy, mixed mesic
86 185 Spodosol, sandy sediments
87 185 Spodosol, sandy sediments
88 185 Spodosol, sandy sediments
89 185 Spodosol, sandy sediments
90 Spodosol, sandy
91 Spodosol, sandy
92 Bohannon gravely loam
93 430-670 Inceptisol
94 610 Typic dystrochrept, loam, glacial terrace
95 790 Entic haplumbrept, loam, overlaying clay loam
96 520 Typic haplohumult, clay loam overlaying loam clay 97 URic haploxeralfs, fine-loamy, mixed mesic
98 Dystric zerochrepts, sandy-skeletal, mixed mesic
99 Typic xerumbrepts, fine-loamy, mixed mesic
100 Typic xerumbrepts, fine-loamy, mixed mesic
101 Typic xerumbrepts, fine-loamy, mixed mesic
102 Typic xerumbrepts, fine-loamy, mixed mesic 103 Dystric entic durochrepts, medial, mesic
104 Dystric entic durochrepts, medial, mesic
105 Dystric entic durochrepts, medial, mesic
106 210 Typic haplorthod, Everett gravelly sandy loam
107 210 Typic haplorthod, Everett gravelly sandy loam
108 Typic haplorthod, Everett gravelly sandy loam
109 Typic haplorthod, Everett gravelly sandy loam
110 Mixed mesic duric haplorthods, over sandy or sandy-skeletal 111 320 Typic haplorthod, glacial outwash, gravelly loamy sand 112 320 Wilkeson series, colluvial soil with lake sediments
113 2900 Mollic paleoboralf, clayey-skeletal
114 2900 Mollic paleoboralf, clayey-skeletal
115 2900 Mollic paleoboralf, clayey-skeletal
116 2900 Mollic paleoboralf, clayey-skeletal
117 2900 Mollic paleoboralf, clayey-skeletal 118 200 Ultisol
119 200 Ultisol
120 726--993 Typic hapludult, loamy, saluda stony loam
3 4 2
8 2 2 8 2 2
8 2
5 2 8 1 2
8 1 2
8 1 1 8 1 1
8 1 2
8 1 2
5 6 1
5 6 1
5 6 1 5 6 1
8 11 1 2 6 1
5 2 1
5 6 1
5 6 1
5 6 1
5 6 1
5 1
5 1
5 1
8 3 2
8 3 1
8 3 1
8 3 1
8 3 1
8 3 1 5 6 1
2 14 1
2 14 1
2 14 1
2 14 1
2 14 1
6 1
6 I
6 6 1
12
31
31
53
18
20
120
20
20
16
16
35-50 2.5 450
3.0 70
3.0 170
3.0 120 2.0 150
4.0 70
4.0 1
4.0 10
4.0 40
4.0 150
2.0 1
2.0 10
2.0 70
4.0 36
4.0 9
4.0 40 4.0 40
2.0 40 4O
40
50 5O
5O
50
5O
1.0 121
1.0 26 6O--2OO

194
Appendix B. Continued
121 122 123 265-360
124 225
125 126 265-360
127 265-360
128 129
130
131 132 144
133 265-360
134
135
136 180
137
138 170
139 200
140
141
142 1550
143 200-230
144 500-600
145 170 146 200
147 250-500 1 48 200-230
149 550--600
150 550--600
151 152 640
153 640
154 640
155 640
156 500 157 158 215
159 215 160 215
Thermic typic glossaqualfs, fine-silty, mixed 2 2 1
Typic ochraquult, fine, loamy, mixed thermic 6 6 1 Ultisol, typic paleudult, deep alluvial emory silt loam 6 7 1
Ultisol, typic paleudult, deep alluvial emory silt loam 6 7 1
Thermic histic fluvaquent mix, fine, silty 7 8 1 Ultisol, typic paleudult, deep alluvial emory silt loam 6 7 1
Ultisol, typic paleudult, deep alluvial emory silt loam 6 7 1
Thermic typic paleudults, fine-loamy, siliceous 6 2 1
Ultic haplaquod, poorly drained 8 1 2
Ultic haplaquod, porly drained 8 1 2
Thermic typic paleudults, fine-loamy, siliceous 6 2 1
Red-yellow podsols, sandy acid loams 8 5 2
Typic paleudults, derived dolomitic residium 7 7 2
Dysic, thermic, typic medisaprist 4 15 1
Typic fluvaquent, silty clay loam clayey, mixed acid 7 10 1
Brunified Mediterranean red soil 1
Spodosol 8 2
Typic tropohumults, isohyperthermic, clayey, kaolinitic 6 14 2
Tropeptic haplorthox, clayey, oxidic, isohyperthermic 9 14 2
Ultisol, acid, from granite, dark colour and fine texture 6 1
Ultisol, dolomite limestone and conglomeratic sandstone 6 1
Peat podzol 4 1 Eqiaquic palehumults, isothermic, clayey 6 14 1
Epiaquic palehumults, isothermic, clayey 6 14 1 Typic tropohumults, isohyperthermic, clayey, kaolinitic 6 14 1
Tropeptic haplorthox, oxidic, isohyperthermic, clayey 9 14 1
Ultisols, typic trophumults 6 10 1
Epiaquic palehumults, clayey, mixed isothermic 6 14 2 Epiaquic palehumults, clayey, mixed isothermic 6 14 2
Epiaquic palehumults, clayey, mixed, isothermic 6 14 2
Ultisol, slates and dolomite 6 1
Alluvial, non calcareous, ferruginous, sandy loam to loam 3 2
Alluvial, non calcareous, ferruginous, sandy loam to loam 3 2
Alluvial, non calcareous, ferruginous, sandy loam to loam 3 2
Alluvial, non calcareous, ferruginous, sandy loam to loam 3 2
Sandy loam with gravely structure 3 1 Sandy loam with gravely structure 3 1
Typic camborthids, sandy loams 10 3 2
Typic camborthids, sandy loams 10 3 2 Typic camborthids, sandy loams 10 3 2
Mature
78 30-80
48
52 30-80
30-80
Mature
7
27
Mature
16
3O
57
86
150
17
49 100
Mature
Mature
3-8
15-30
15-30
>50 Mature
4
11
18.5 Mature
10
20
30 40
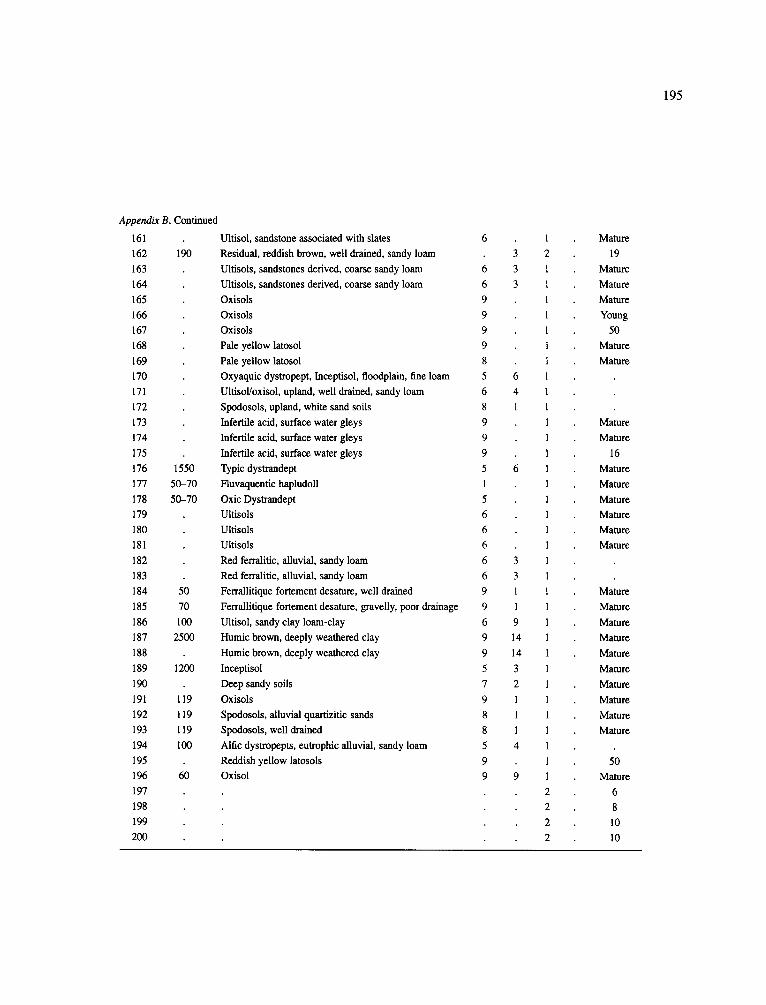
195
Appendix B. Continued
161
162
163
164
165
166
167
168
169 170
171
172
173 174
175
176
177
178 179
180
181
182
183
184
185
186
187
188
189
190
191
192 193
194
195 196
197
198
199
200
190
1550
50-70
50-70
50
70 100
2500
1200
119
119
119
I00
60
Ultisol, sandstone associated with slates 6
Residual, reddish brown, well drained, sandy loam
Ultisols, sandstones derived, coarse sandy loam 6
Ultisols, sandstones derived, coarse sandy loam 6
Oxisols 9
Oxisols 9
Oxisols 9 Pale yellow latosol 9
Pale yellow latosol 8 Oxyaquic dystropept, Inceptisol, floodplain, fine loam 5
Ultisol/oxisol, upland, well drained, sandy loam 6
Spodosols, upland, white sand soils 8
Infertile acid, surface water gleys 9
Infertile acid, surface water gleys 9
Infertile acid, surface water gleys 9
Typic dystrandept 5
Fluvaquentic hapludoll 1
Oxic Dystrandept 5
Ultisols 6 Ultisols 6
Ultisols 6
Red ferralitic, alluvial, sandy loam 6 Red ferralitic, alluvial, sandy loam 6
Ferrallitique fortement desature, well drained 9
Ferrallitique fortement desature, gravelly, poor drainage 9
Ultisol, sandy clay loam-clay 6 Humic brown, deeply weathered clay 9
Humic brown, deeply weathered clay 9
Inceptisol 5
Deep sandy soils 7
Oxisols 9
Spodosols, alluvial quartizitic sands 8
Spodosols, well drained 8
Alfic dystropepts, eutrophic alluvial, sandy loam 5
Reddish yellow latosols 9 Oxisol 9
3
3
3
6 4
I
6
3
3 1
1
9 14
14
3
2
1
1
1
4
9
Mature
19 Mature
Mature
Mature
Young
50
Mamm Mature
Mature
Mature
16 Mature
Mature
Mature Mature
Mature Mature
Mature
Mature
Mature
Mature
Mature
Mature
Mature
Mature
Mature
Mature
50 Mature
6
8
10
10
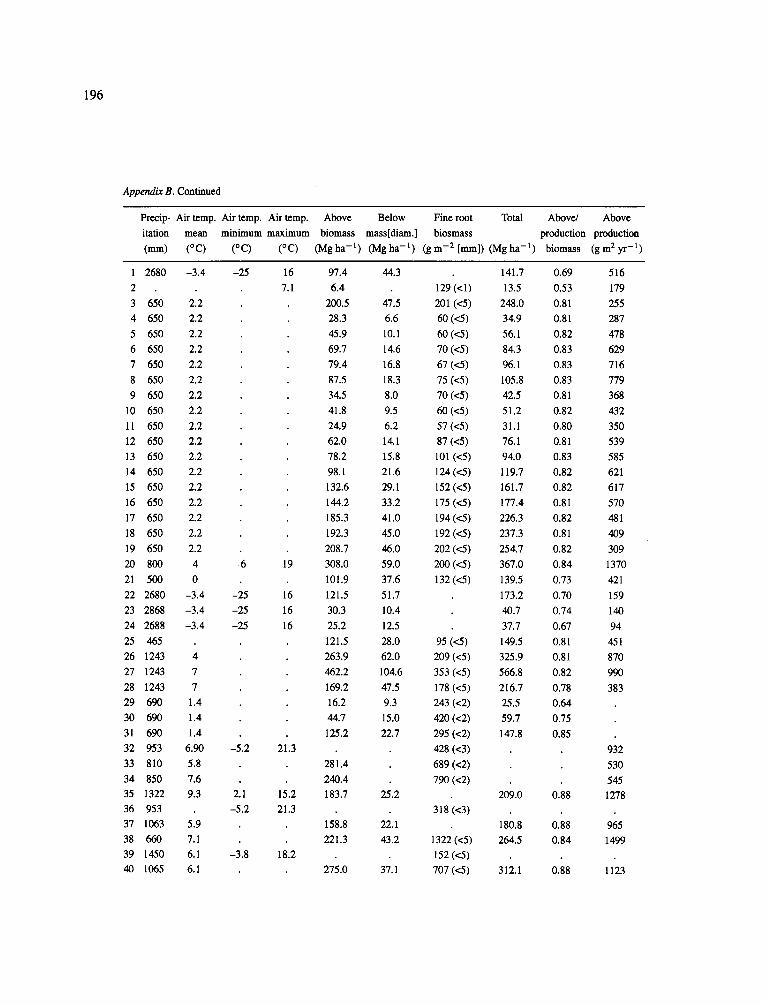
196
Appendix B. Continued
Precip- Air temp. Air temp. Air temp. Above
itation mean minimum maximum biomass
(ram) (°C) (°C) (°C) (Mgha -1)
Below Fine root Total Above/
mass[diam.] biosmass production (Mgha -1) (gm -2 [man]) (Mgha - l ) biomass
Above
production (gm2yr -1)
1 268O -3.4
2
3 650 2.2
4 650 2.2
5 650 2.2
6 650 2.2
7 650 2.2
8 650 2.2
9 650 2.2
10 650 2.2
11 650 2.2
12 650 2.2
13 650 2.2
14 650 2.2
15 650 2.2
16 650 2.2
17 650 2.2
18 650 2.2
19 650 2.2
20 800 4
21 500 0
22 2680 -3.4
23 2868 -3.4
24 2688 -3.4
25 465
26 1243 4
27 1243 7
28 1243 7
29 690 1.4
30 690 1.4
31 690 1.4
32 953 6.90
33 810 5.8
34 850 7.6
35 1322 9.3
36 953
37 1063 5.9
38 660 7.1
39 1450 6.1 40 1065 6.1
-25 16
7.1
-6 19
-25 16
-25 16
-25 16
-5.2
2.1
-5.2
-3.8
21.3
15.2
21.3
18.2
97.4 44.3 141.7 0.69 516
6.4 129 (<I) 13.5 0.53 179
200.5 47.5 201 (<5) 248.0 0.81 255
28.3 6.6 60 (<5) 34.9 0.81 287
45.9 10.1 60 (<5) 56.1 0.82 478
69.7 14.6 70 (<5) 84.3 0.83 629
79.4 16.8 67 (<5) 96.1 0.83 716
87.5 18.3 75 (<5) 105.8 0.83 779
34.5 8.0 70 (<5) 42.5 0.81 368
41.8 9.5 60 (<5) 51.2 0.82 432
24.9 6.2 57 (<5) 31.1 0.80 350
62.0 14.1 87 (<5) 76.1 0.81 539
78.2 15.8 101 (<5) 94.0 0.83 585
98.1 21.6 124 (<5) 119.7 0.82 621
132.6 29.1 152 (<5) 161.7 0.82 617
144.2 33.2 175 (<5) 177.4 0.81 570
185.3 41.0 194 (<5) 226.3 0.82 481
192.3 45.0 192 (<5) 237.3 0.81 409
208.7 46.0 202 (<5) 254.7 0.82 309
308.0 59.0 200 (<5) 367.0 0.84 1370
101.9 37.6 132 (<5) 139.5 0.73 421
121.5 51.7 173.2 0.70 159
30.3 10.4 40.7 0.74 140
25.2 12.5 37.7 0.67 94
121.5 28.0 95 (<5) 149.5 0.81 451
263.9 62.0 209 (<5) 325.9 0.81 870
462.2 104.6 353 (<5) 566.8 0.82 990
169.2 47.5 178 (<5) 216.7 0.78 383
16.2 9.3 243 (<2) 25.5 0.64
44.7 15.0 420 (<2) 59.7 0.75
125.2 22.7 295 (<2) 147.8 0.85
428 (<3) 932
281.4 689 (<2) 530
240.4 790 (<2) 545
183.7 25.2 209.0 0.88 1278 318 (<3)
158.8 22.1 180.8 0.88 965
221.3 43.2 1322 (<5) 264.5 0.84 1499
152 (<5) 275.0 37.1 707 (<5) 312.1 0.88 1123
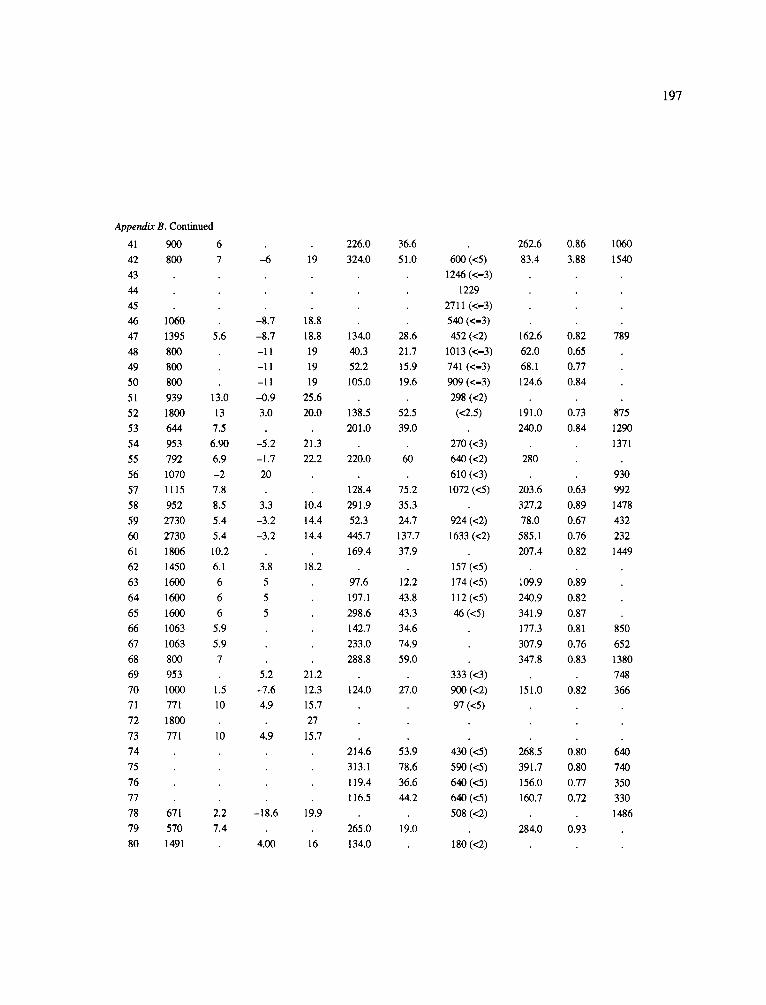
197
Appendix B. Continued
41 900 6
42 800 7 -6
43
44
45
46 1060 -8.7
47 1395 5.6 -8.7
48 800 -11 49 800 -11
50 800 -11
51 939 13.0 -0.9
52 1800 13 3.0
53 644 7.5
54 953 6.90 -5.2
55 792 6.9 -1.7
56 1070 -2 20
57 1115 7.8
58 952 8.5 3.3
59 2730 5.4 -3.2
60 2730 5.4 -3.2
61 1806 10.2
62 1450 6.1 3.8
63 1600 6 5
64 1600 6 5
65 1600 6 5
66 1063 5.9
67 1063 5.9
68 800 7
69 953 5.2
70 I000 1.5 -7.6
71 771 10 4.9
72 1800
73 771 10 4.9
74
75
76
77
78 671 2.2 -18.6
79 570 7.4
80 1491 4.00
19
18.8
18.8
19
19
19
25.6
20.0
21.3
22.2
10.4
14.4
14.4
18.2
21.2
12.3
15.7
27
15.7
19.9
16
226.0
324.0
134.0
40.3
52.2
105.0
138.5
201.0
220.0
128.4
291.9
52.3
445.7
169.4
97.6
197.1
298.6
142.7
233.0
288.8
124.0
214.6
313.1
119.4
116.5
265.0
134.0
36.6
51.0
28.6
21.7
15.9
19.6
52.5
39.0
60
75.2
35.3
24.7
137.7
37.9
12.2
43.8
43.3
34.6
74.9
59.0
27.0
53.9
78.6
36.6
44.2
19.0
600 (<5)
1246 (<-3)
1229
2711 (<-3)
540 (<-3)
452 (<2)
1013 (<-3)
741 (<-3)
909 (<-3)
298 (<2)
(<2.5)
270 (<3)
640 (<2)
610 (<3)
1072 (<5)
924 (<2)
1633 (<2)
157 (<5)
174 (<5)
112 (<5) 46 (<5)
333 (<3)
900 (<2)
97 (<5)
430 (<5)
590 (<5)
640 (<5)
640 (<5)
508 (<2)
180 (<2)
262.6
83.4
162.6
62.0
68.1
124.6
191.0
240.0
280
203.6
327.2
78.0
585. I
207.4
109.9
240.9
341.9
177.3
307.9
347.8
151.0
268.5
391.7
156.0
160.7
284.0
0.86
3.88
0.82
0.65
0.77
0.84
0.73
0.84
0.63
0.89
0.67
0.76
0.82
0.89
0.82
0.87
0.81
0.76
0.83
0.82
0.80
0.80
0.77
0.72
0.93
1060
1540
789
875
1290
1371
930
992
1478
432
232
1449
850
652
1380
748
366
640
740
350
330
1486
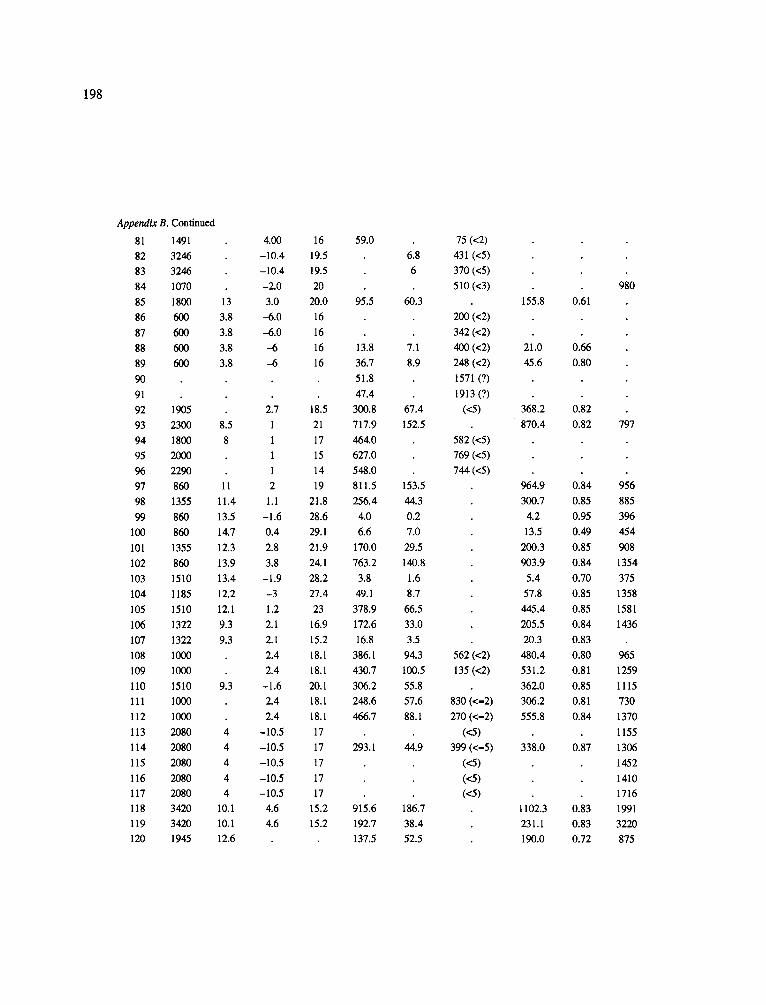
198
AppendixB, Continued
81 1491 ~00 16
82 3246 -10.4 19,5
83 3246 -10.4 19.5
84 1070 -2,0 20
85 1800 13 3.0 20.0
86 600 3.8 -6.0 16
87 600 3,8 -6,0 16
88 600 3.8 -6 16
89 600 3.8 -6 16
90
91
92 1905 2.7 18.5
93 2300 8.5 1 21
94 1800 8 1 17
95 2000 1 15
96 2290 1 14
97 860 11 2 19
98 1355 11.4 1.1 21.8
99 860 13.5 -1.6 28.6
100 860 14.7 0.4 29.1
101 1355 12.3 2.8 21.9
102 860 13.9 3.8 24,1
103 1510 13,4 -1.9 28.2
104 1185 12.2 -3 27.4
105 1510 12.1 1.2 23
106 1322 9.3 2,1 16.9
107 1322 9.3 2.1 15,2
108 1000 2.4 18,1
109 1000 2.4 18.1
110 1510 9,3 -1.6 20.1
111 1000 2.4 18.1
112 1000 2.4 18,1
113 2080 4 -10.5 17
114 2080 4 -10.5 17
115 2080 4 -10.5 17
116 2080 4 -10.5 17
117 2080 4 -10.5 17
118 3420 10.1 4.6 15.2
119 3420 10.1 4.6 15.2
120 1945 12.6
59.0
95.5
13.8
36.7
51.8
47.4
300.8
717.9
464,0
627.0
548.0
811,5
256.4
4.0
6,6
170.0
763.2
3.8
49.1
378.9
172.6
16.8
386,1
430.7
306.2
248.6
466,7
293.1
915.6
192.7
137,5
6.8
6
60.3
7.1
8.9
67.4
152.5
153,5
44.3
0.2
7.0
29.5
140.8
1.6
8.7
66.5
33.0
3.5
94.3
100.5
55.8
57.6
88,1
44.9
186.7
38.4
52.5
75 (<2)
431 (<5)
370 (<5)
510 (<3)
200 (<2)
342 (<2)
400 (<2)
248 (<2)
1571 (?)
1913 (?)
(<5)
582(<5)
769(<5)
744(<5)
562 (<2)
135 (<2)
830 (<-2)
270 (<-2)
(<5)
399 (<-5)
(<5)
(<5)
(<5)
155.8
21.0
45.6
368.2
870.4
964.9
300.7
4.2
13.5
200.3
903.9
5.4
57,8
445.4
205.5
20.3
480.4
531.2
362.0
306.2
555.8
338.0
1102.3
231.1
190.0
0.61
0.66
0.80
0.82
0.82
0.84
0.85
0,95
0.49
0,85
0.84
0.70
0.85
0.85
0.84
0.83
0.80
0.81
0.85
0.81
0.84
0.87
0.83
0.83
0.72
980
797
956
885
396
454
908
1354
375
1358
1581
1436
965
1259
1115
730
1370
1155
1306
1452
1410
1716
1991
3220
875
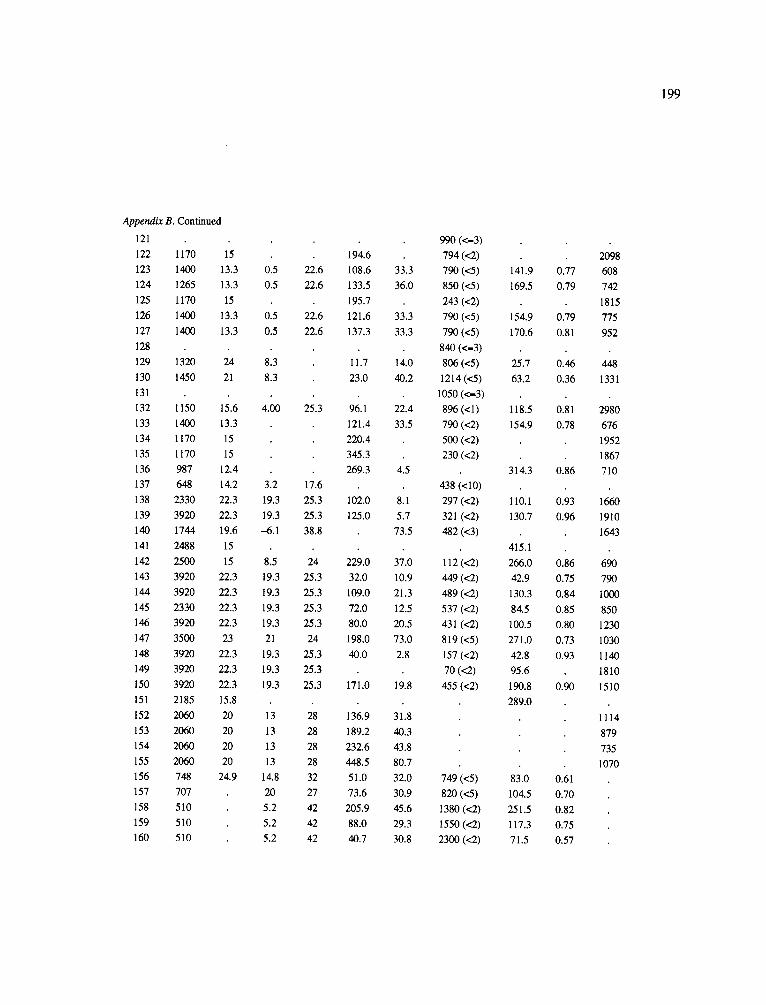
199
Appendix B. Continued
121 990 (<-3)
122 1170 15 194.6 794 (<2) 2098
123 1400 13.3 0.5 22.6 108.6 33.3 790 (<5) 141.9 0.77 608
124 1265 13.3 0.5 22.6 133.5 36.0 850 (<5) 169.5 0.79 742
125 1170 15 195.7 243 (<2) 1815
126 1400 13.3 0.5 22.6 121.6 33.3 790 (<5) 154.9 0.79 775
127 1400 13.3 0.5 22.6 137.3 33.3 790 (<5) 170.6 0.81 952
128 840 (<-3)
129 1320 24 8.3 11.7 14.0 806 (<5) 25.7 0.46 448
130 1450 21 8.3 23.0 40.2 1214 (<5) 63.2 0.36 1331
131 1050 (<-3)
132 1150 15.6 4.00 25.3 96.1 22.4 896(<1) 118.5 0.81 2980
133 1400 13.3 121.4 33.5 790 (<2) 154.9 0.78 676
134 1170 15 220.4 500 (<2) 1952
135 1170 15 345.3 230 (<2) 1867
136 987 12.4 269.3 4.5 314.3 0.86 710
137 648 14.2 3.2 17.6 438 (<10)
138 2330 22.3 19.3 25.3 102.0 8.1 297 (<2) 110.1 0.93 1660
139 3920 22.3 19.3 25.3 125.0 5.7 321 (<2) 130.7 0.96 1910
140 1744 19.6 ~5.1 38.8 73.5 482 (<3) 1643
141 2488 15 415.1
142 2500 15 8.5 24 229.0 37.0 112 (<2) 266.0 0.86 690
143 3920 22.3 19.3 25.3 32.0 10.9 449 (<2) 42.9 0.75 790
144 3920 22.3 19.3 25.3 109.0 21.3 489 (<2) 130.3 0.84 1000
145 2330 22.3 19.3 25.3 72.0 12.5 537 (<2) 84.5 0.85 850
146 3920 22.3 19.3 25.3 80.0 20.5 431 (<2) 100.5 0.80 1230
147 3500 23 21 24 198.0 73.0 819 (<5) 271.0 0.73 1030
148 3920 22.3 19.3 25.3 40.0 2.8 157 (<2) 42.8 0.93 1140
149 3920 22.3 19.3 25.3 70 (<2) 95.6 1810
150 3920 22.3 19.3 25.3 171.0 19.8 455 (<2) 190.8 0.90 1510
151 2185 15.8 289.0
152 2060 20 13 28 136.9 31.8 1114
153 2060 20 13 28 189.2 40.3 879
154 2060 20 13 28 232.6 43.8 735
155 2060 20 13 28 448.5 80.7 1070
156 748 24.9 14.8 32 51.0 32.0 749 (<5) 83.0 0.61
157 707 20 27 73.6 30.9 820 (<5) 104.5 0.70
158 510 5.2 42 205.9 45.6 1380 (<2) 251.5 0.82
159 510 5.2 42 88.0 29.3 1550 (<2) 117.3 0.75
160 510 5.2 42 40.7 30.8 2300 (<2) 71.5 0.57
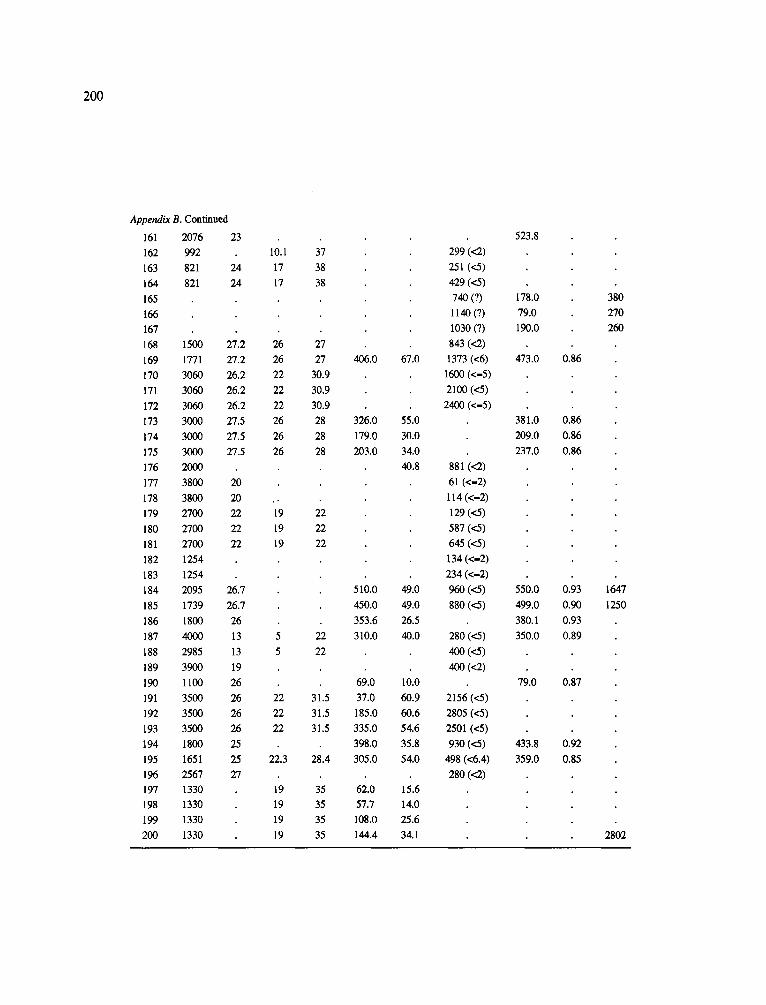
200
Append~B. Continued
161 2076 23
162 992 10.1 37
163 821 24 17 38
164 821 24 17 38
165
166
167 168 1500 27.2 26 27
169 1771 27.2 26 27
170 3060 26.2 22 30.9
171 3060 26.2 22 30.9
172 3060 26.2 22 30.9
173 3000 27.5 26 28
174 3000 27.5 26 28
175 3000 27.5 26 28
176 2000
177 3800 20
178 3800 20 ..
179 2700 22 19 22
180 2700 22 19 22
181 2700 22 19 22
182 1254
183 1254
184 2095 26.7
185 1739 26.7
186 1800 26
187 4000 13 5 22
188 2985 13 5 22
189 3900 19
190 1100 26
191 3500 26 22 31.5
192 3500 26 22 31.5
193 3500 26 22 31.5
194 1800 25
195 1651 25 22.3 28.4
196 2567 27 197 1330 19 35
198 1330 19 35
199 1330 19 35
200 1330 19 35
406.0
326.0
179.0
203.0
510.0
450.0
353.6
310.0
69.0
37.0
185.0
335.0
398.0
305.0
62.0
57.7
108.0
144.4
67,0
55.0
30.0
34.0
40.8
49.0
49.0
26.5
40.0
10.0
60.9
60.6
54.6
35.8
54.0
15.6
14.0
25.6
34.1
299 (<2)
251 (<5)
429 (<5)
740 (?)
1140(.'?) 1030 (?)
843 (<2)
1373 (<6)
1600 (<-5)
2100 (<5)
2400 (<-5)
881 (<2) 61 (<-2)
114 (<-2) 129 (<5)
587 (<5)
645 (<5)
134 (<-2)
234 (<-2)
960 (<5)
880 (<5)
280 (<5) 400 (<5)
400 (<2)
2156 (<5)
2805 (<5)
2501 (<5)
930 (<5)
498 (<6.4)
280 (<2)
523.8
178.0
79.0
190.0
473.0
381.0
209.0
237.0
550.0
499.0
380.1
350.0
79.0
433.8
359.0
0.86
0.86
0.86
0.86
0.93
0.90
0.93
0.89
0.87
0.92
0.85
380
270 260
1647
1250
2802
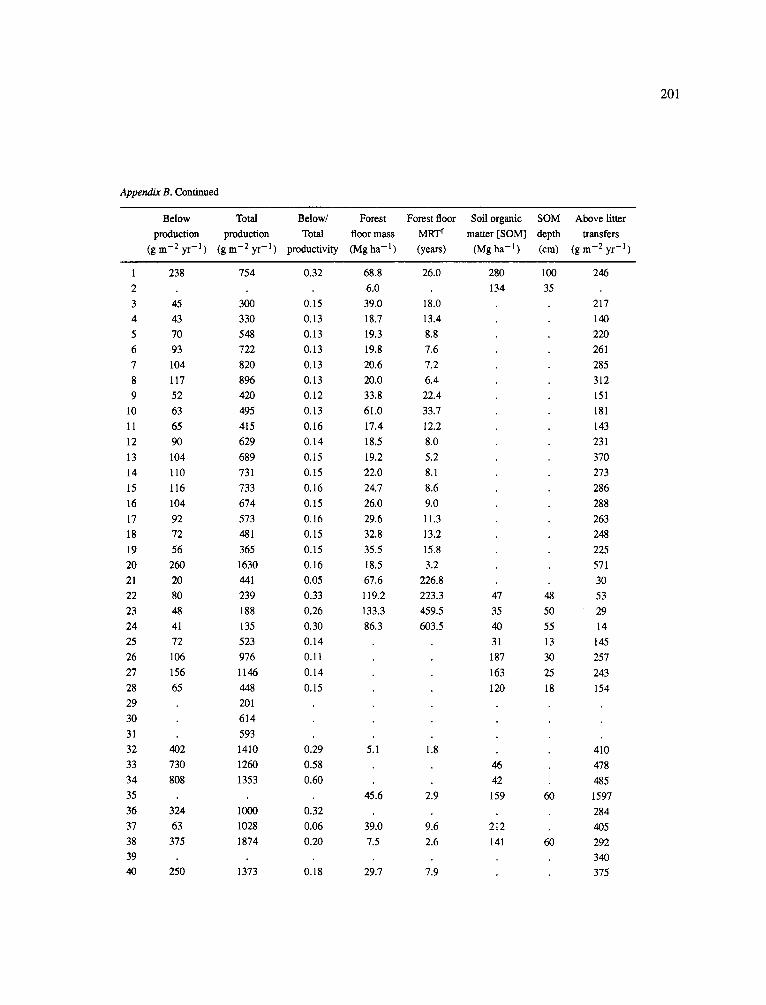
201
Appendix B. Continued
Below Total Below/ Forest Forest floor Soil organic SOM Above litter
production production Total floor mass MRT f matter [SOM] depth transfers (gm-2yr -1) (gm-2yr -1) productivity (Mgha -1) (years) (Mgha -1) (cm) (gm-2yr -1)
1 238 754 0.32
2
3 45 300 0.15
4 43 330 0.13
5 70 548 0.13
6 93 722 0.13
7 104 820 0.13
8 117 896 0.13
9 52 420 0.12
10 63 495 0.13
11 65 415 0.16
12 90 629 0.14
13 104 689 0.15
14 110 731 0.15
15 116 733 0.16
16 104 674 0.15
17 92 573 0.16
18 72 481 0.15
19 56 365 0.15
20 260 1630 0.16
21 20 441 0.05
22 80 239 0.33
23 48 188 0.26
24 41 135 0.30
25 72 523 0.14
26 106 976 0.11
27 156 1146 0.14
28 65 448 0.15
29 201
30 614
31 593
32 402 1410 0.29
33 730 1260 0.58
34 808 1353 0.60
35
36 324 1000 0.32
37 63 1028 0.06
38 375 1874 0.20
39
40 250 1373 0.18
68.8 26.0
6.0
39.0 18.0
18.7 13.4
19.3 8.8
19.8 7.6
20.6 7.2
20.0 6.4
33.8 22.4
61.0 33.7
17.4 12.2
18.5 8.O
19.2 5.2
22.0 8.1
24.7 8.6
26.0 9.0
29.6 11.3
32.8 13.2
35.5 15.8
18.5 3.2
67.6 226.8
119.2 223.3
133.3 459.5
86.3 603.5
5.1 1.8
45.6 2.9
39.0 9.6
7.5 2.6
29.7 7.9
280 100 246
134 35
47 48
35 50
40 55
31 13
187 30
163 25
120 18
46
42
159
212
141
60
60
217
140
22O
261
285
312
151
181
143
231
370
273
286
288
263
248
225
571
3O
53
29
14
145
257
243
154
410
478
485
1597
284
405
292
340
375
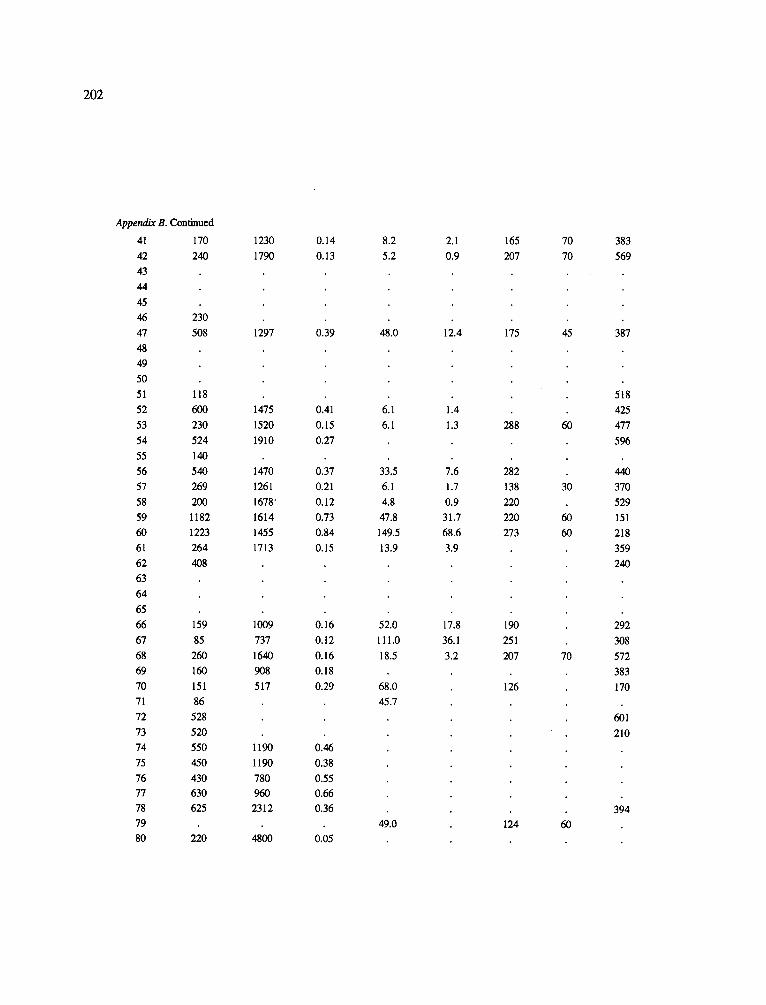
202
Appendix B. Continued
41 170 1230 0.14
42 240 1790 0.13
43
44
45
46 230
47 508 1297 0.39
48
49
50
51 118
52 600 1475 0.41
53 230 1520 O. 15
54 524 1910 0.27
55 140
56 540 1470 0.37
57 269 1261 0.21
58 200 1678' 0.12
59 1182 1614 0.73
60 1223 1455 0.84
61 264 1713 0.15
62 408
63
64
65
66 159 1009 0.16
67 85 737 O. 12
68 260 1640 0.16
69 160 908 0.18
70 151 517 0.29
71 86
72 528
73 520
74 550 1190 0.46
75 450 1190 0.38
76 430 780 0.55
77 630 960 0.66
78 625 2312 0.36
79
80 220 4800 0.05
8.2
5.2
48.0
6.1
6.1
33.5
6.1
4.8
47.8
149.5
13.9
52.0
111.0
18.5
68.0
45.7
49.0
2.1
0.9
12.4
1.4
1.3
7.6
1.7
0.9
31.7
68.6
3.9
17.8
36.1
3.2
165
207
175
288
282
138
220
220
273
190
251
207
126
124
70
70
45
60
30
60
60
70
60
383
569
387
518
425
477
596
440
370
529
151
218
359
240
292
308
572
383
170
601
210
394
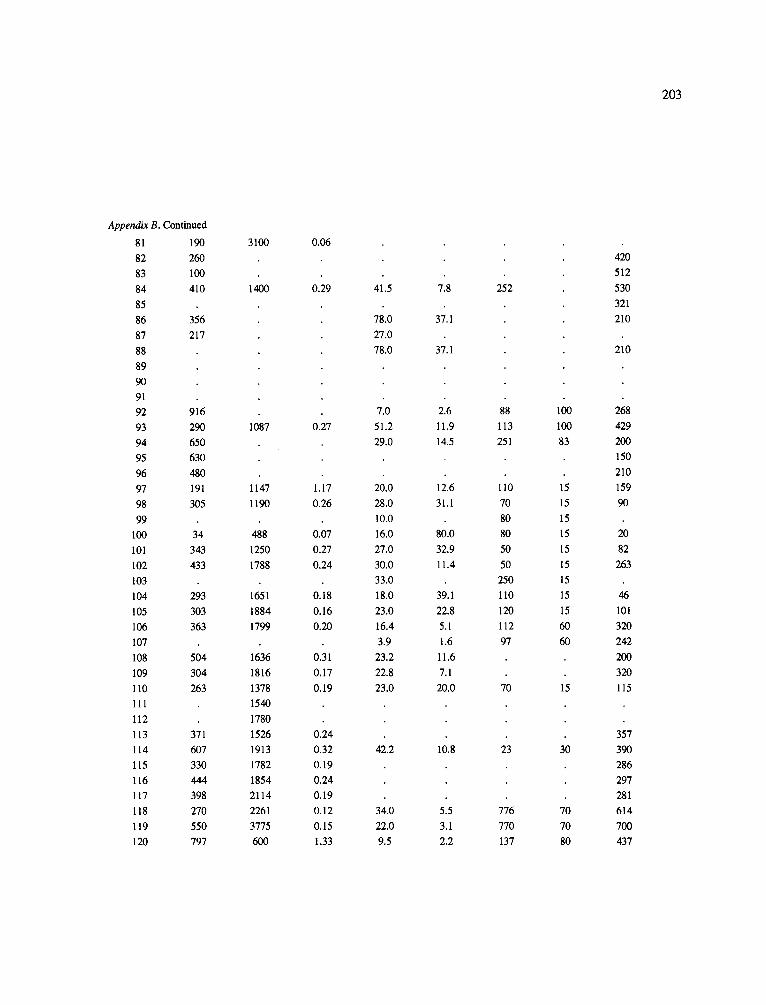
203
Append~ B. Continued
81 190
82 260
83 100
84 410
85
86 356
87 217
88
89
90
91
92 916
93 290
94 650
95 630
96 480
97 191
98
99
100
101
102
103
104
105
106
107
108
109
110
111
112
113
114
115
116
117
118
119
120
3100
1400
1087
1147
305 1190
34 488
343 1250
433 1788
0.06
0.29
0.27
1.17
0.26
0.07
0.27
0.24
293 1651 0.18
303 1884 0.16
363 1799 0.20
504 1636 0.31
304 1816 0.17
263 1378 0.19
1540
1780
371 1526 0.24
607 1913 0.32
330 1782 0.19
444 1854 0.24
398 2114 0.19
270 2261 0.12
550 3775 0.15
797 600 1.33
41.5 7.8
78.0 37.1
27.0
78.0 37.1
252
7.0 2.6 88 100
51.2 11.9 113 100
29.0 14.5 251 83
12.6
31.1
20.0
28.0
10.0
16.0 80.0
27.0 32.9
30.0 11.4
33.0
18.0 39.1
23.0 22.8
16.4 5.1
3.9 1.6
23.2 11.6
22.8 7.1
23.0 20.0
110
70
80
80
50
50
250
110
120
112
97
70
15
15
15
15
15
15
15
15
15
60
60
15
420
512
530
321
210
210
268
429
200
150
210
159
90
20
82
263
46
101
320
242
200
320
115
357
42.2 10.8 23 30 390
286
297
281
34.0 5.5 776 70 614
22.0 3.1 770 70 700
9.5 2.2 137 80 437
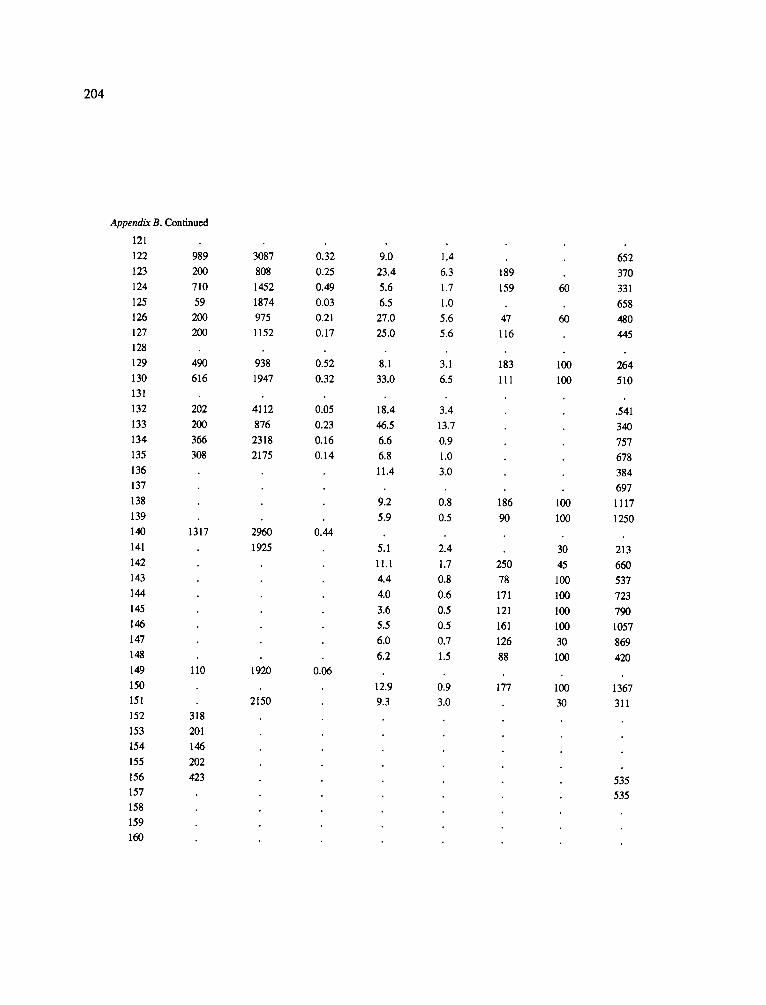
204
Appendix B. Continued
121
122 989
123 200
124 710
125 59
126 200
127 200
128
129 490
130 616
131
132 202
133 200
134 366
135 308
136
137
138
139
140 1317
141
142
143
144
145
146
147
148
149 I10
150
151
152 318
153 201
154 146
155 202
156 423
157
158
159
160
3087
808
1452
1874
975
1152
938
1947
4112
876
2318
2175
2960
1925
1920
2150
0.32
0.25
0.49
0.03
0.21
0.17
0.52
0.32
0.05
0.23
0.16
0.14
0.44
0.06
9.0
23.4
5.6
6.5
27.0
25.0
8.1
33.0
18.4
46.5
6.6
6.8
11.4
9.2
5.9
5.1
11.1
4.4
4.0
3.6
5.5
6.0
6.2
12.9
9.3
1.4
6.3
1.7
1.0
5.6
5.6
3.1
6.5
3.4
13.7
0.9
1.0
3.0
0.8
0.5
2.4
1.7
0.8
0.6
0.5
0.5
0.7
1.5
0.9
3.0
189
159
47
116
183
111
186
90
250
78
171
121
161
126
88
177
6O
6O
100
100
100
I00
30
45
100
100
100
100
30
100
100
30
652
370
331
658 480
445
264
510
.541
340
757
678
384
697
1117
1250
213
660
537
723
790
1057
869
420
1367
311
535 535
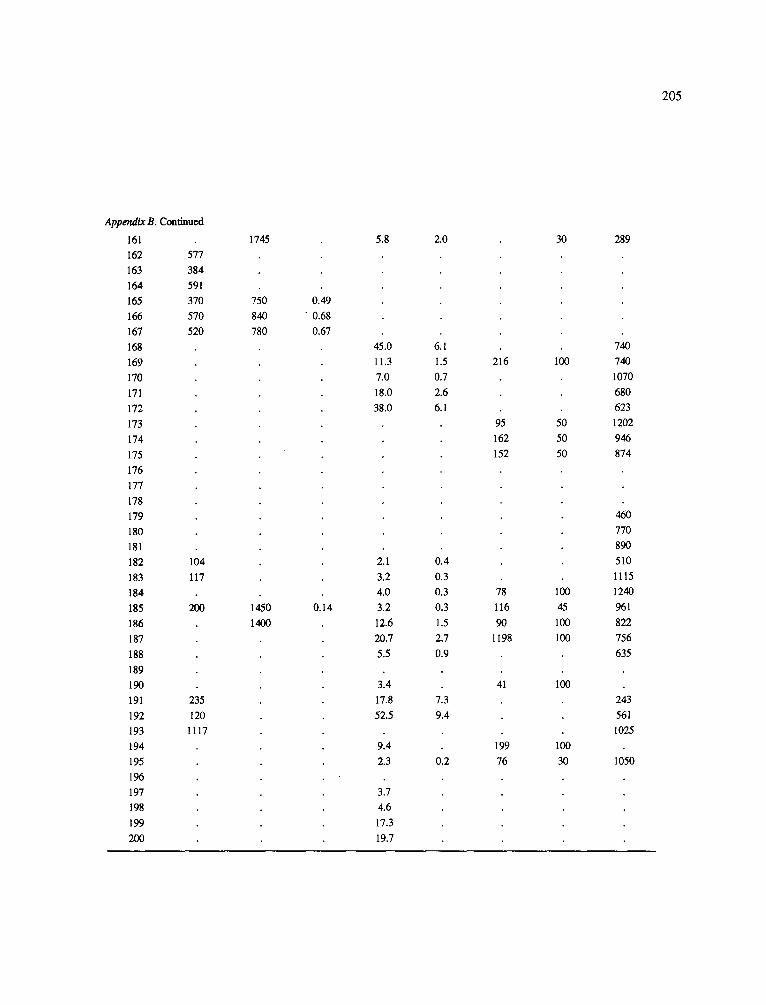
205
AppendixB. Continued
161 162 577
163 384
164 591
165 370
166 570
167 520
168
169
170
171
172
173
174
175
176
177
178
179
180
181
182 104
183 117
184
185 200
186
187
188
189
190
191 235
192 120
193 1117
194
195
196
197
198
199
200
1745
750
840
780
1450
1400
0.49
" 0.68
0.67
0.14
5.8
45.0
11.3
7.0
18.0
38.0
2.1
3,2
4,0
3.2
12.6
20.7
5.5
3.4
17.8
52.5
9.4
2.3
3.7
4.6
17.3
19.7
2.0
6.1
1.5
0.7
2.6
6.1
0.4
0.3
0.3
0.3
1.5
2.7
0.9
7.3
9.4
0.2
216
95
162
152
78
116
90
1198
41
199
76
30
100
50
50
50
100
45
100
100
100
100
30
289
740
740
1070
680
623
1202
946
874
460
770
890
510
1115
1240
961
822
756
635
243
561
1025
1050
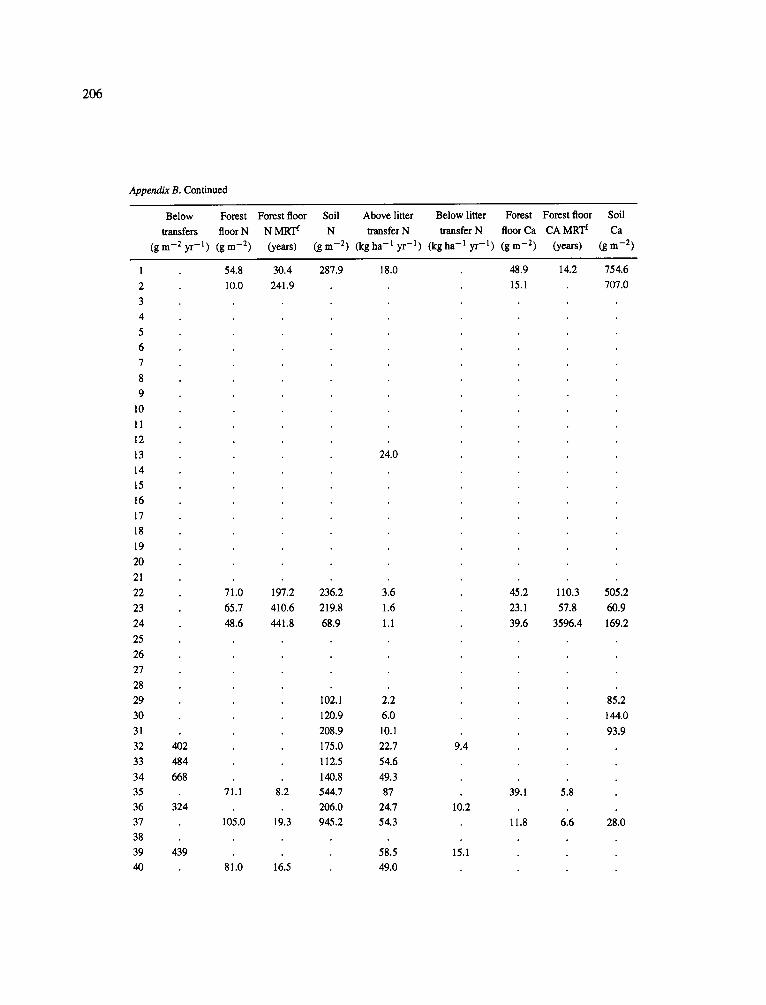
206
Appendix B. Continued
Below Forest Forest floor Soil Above litter Below litter Forest Forest floor Soil
transfers floor N N MRT f N transfer N transfer N floor Ca CA MRT f Ca (g m-2 yr - t ) (gin -2) (years) (gin -2) (kgha - t yr -1) (kgha -1 yr -1) (gin -2) (years) (gin -2)
1
2
3
4
5
6
7
8
9
10
11
12
13
14
15
16
17
18
19
2O
21
22
23
24
25
26
27
28
29
30
31
32
33
34
35
36
37
38
39
40
54.8 30.4 287.9 18.0 48.9 14.2 754.6
10.0 241.9 15.1 707.0
24.0
71.0 197.2 236.2 3.6
65.7 410.6 219.8 1.6
48.6 441.8 68.9 1.1
102.1 2.2
120.9 6.0
208.9 10.1
402 175.0 22.7
484 112.5 54.6
668 140.8 49.3 71.1 8.2 544.7 87
324 206.0 24.7 10.2
105.0 19.3 945.2 54.3
9.4
439 58.5 15.1
81.0 16.5 49.0
45.2 110.3 505.2
23.1 57.8 60.9
39 .6 3596.4 169.2
39.1 5.8
11.8 6.6
85.2
144.0
93.9
28.0
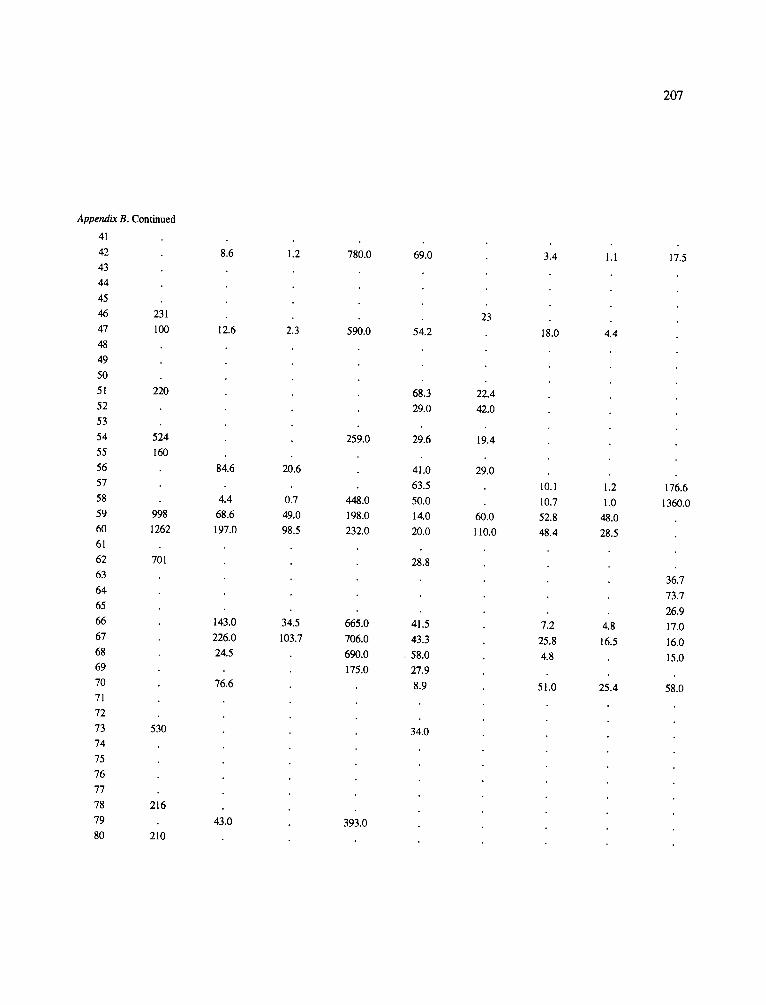
207
AppendixB. Continued
41
42
43
44
45
46 231
47 100
48
49
50
51 220
52
53
54 524
55 160
56
57
58
59 998
60 1262
61
62 701
63
64
65
66
67
68
69
70
71
72
73 530
74
75
76
77
78 216
79
80 210
8.6
12.6
84.6
4.4
68.6
197.0
143.0
226.0
24.5
76.6
43.0
1.2
2.3
20.6
0.7
49.0
98.5
34.5
103.7
780.0
590.0
259.0
448.0
198.0
232.0
665.0
706.0
690.0
175.0
393.0
69.0
54.2
68.3
29.0
29.6
41.0
63.5
50.0
14.0
20.0
28.8
41.5
43.3
58.0
27.9
8.9
34.0
23
22.4
42.0
19.4
29.0
60.0
110.0
3.4
18.0
10.1
10.7
52.8
48.4
7.2
25.8
4.8
51.0
1.1
4.4
1.2
1.0
48.0
28.5
4.8
16.5
25.4
17.5
176.6
1360.0
36.7
73.7
26.9
17.0
16.0
15.0
58.0
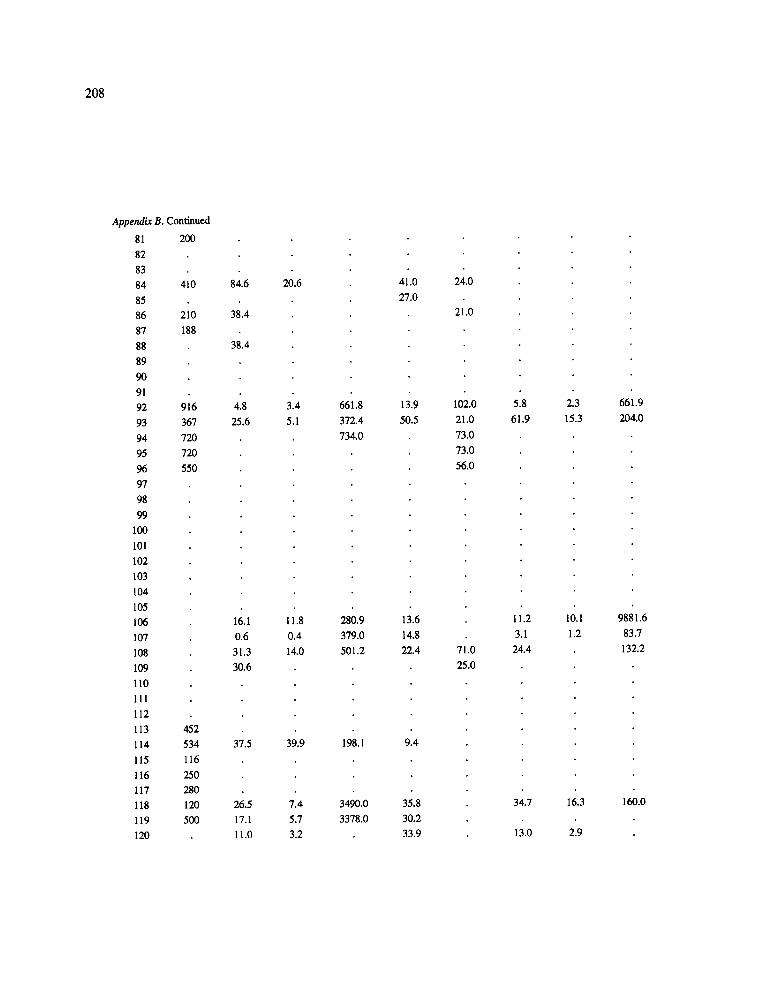
208
Appendix B. Continued
81 200
82
83 84 410
85 86 210
87 188
88
89
90
91
92 916
93 367
94 720
95 720
96 550
97
98
99
100
101
102
103
104
105 106
107
108
109
110
111
112
113 452
114 534
115 116
116 250 117 280
118 120
119 500
120
84.6
38.4
38.4
4.8
25.6
20.6
3.4 661.8
5.1 372.4
734.0
41.0
27.0
13.9
50.5
16.1 11.8 280.9 13.6
0.6 0.4 379.0 14.8
31.3 14.0 501.2 22.4
30.6
37.5 39.9 198.1 9.4
26.5 7.4 3490.0 35.8
17.1 5.7 3378.0 30.2
11.0 3.2 33.9
24.0
21.0
102.0
21.0
73.0
73.0
56.0
71.0
25.0
5.8
61.9
11.2
3.1
24.4
34.7
13.0
2.3
15.3
I0.1
1.2
16.3
2.9
661.9
204.0
9881.6
83.7
132.2
160.0
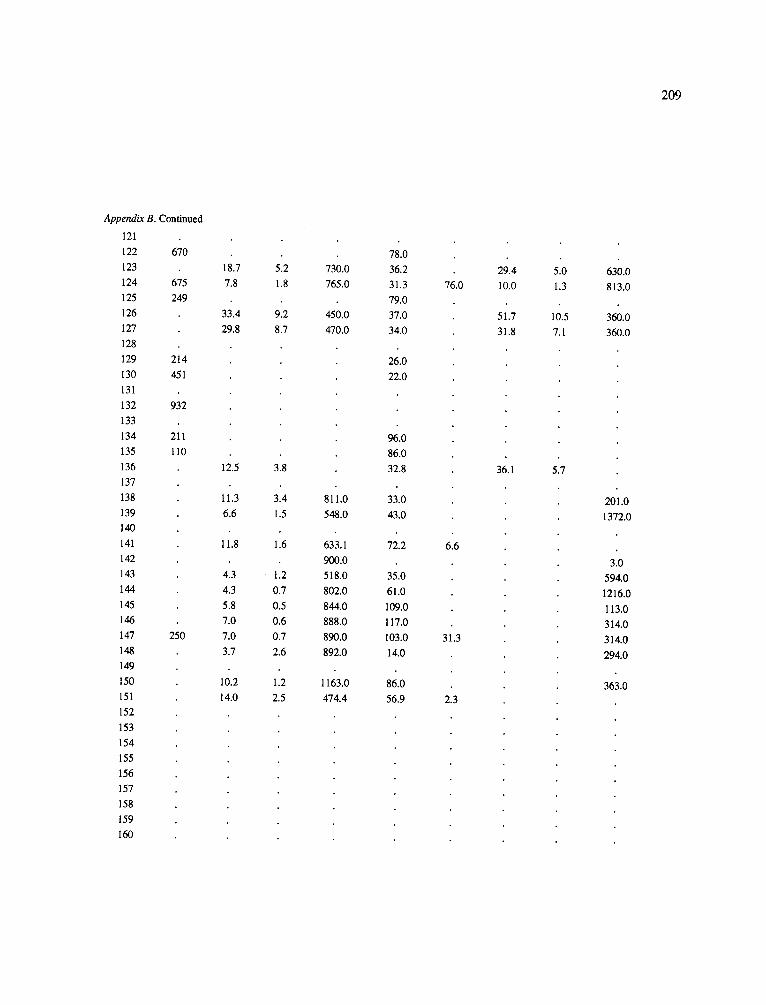
209
Append~ B. Continued
121
122 670
123
124 675
125 249
126
127
128
129 214
130 451
131
132 932
133
134 211
135 10
136
137
138
139
140
141
142
143
144
145
146
147 250
148
149
150
151
152
153
154
155
156
157
158
159
160
18.7
7.8
33.4
29.8
12.5
11.3
6.6
11.8
4.3
4.3
5.8
7.0
7.0
3.7
10.2
14.0
5.2
1.8
9.2
8.7
3.8
3.4
1.5
1.6
1.2
0.7
0.5
0.6
0.7
2.6
1.2
2.5
730.0
765.0
450.0
470.0
811.0
548.0
633.1
900.0
518.0
802.0
844.0
888.0
890.0
892.0
1163.0
474.4
78.0
36.2
31.3
79.0
37.0
34.0
26.0
22.0
96.0
86.0
32.8
33.0
43.0
72.2
35.0
61.0
109.0
117.0
103.0
14.0
86.0
56.9
76.0
6.6
31.3
2.3
29.4
10.0
51.7
31.8
36.1
5.0
1.3
10.5
7.1
5.7
630.0
813.0
360.0
360.0
201.0
1372.0
3.0
594.0
1216.0
113.0
314.0
314.0
294.0
363.0
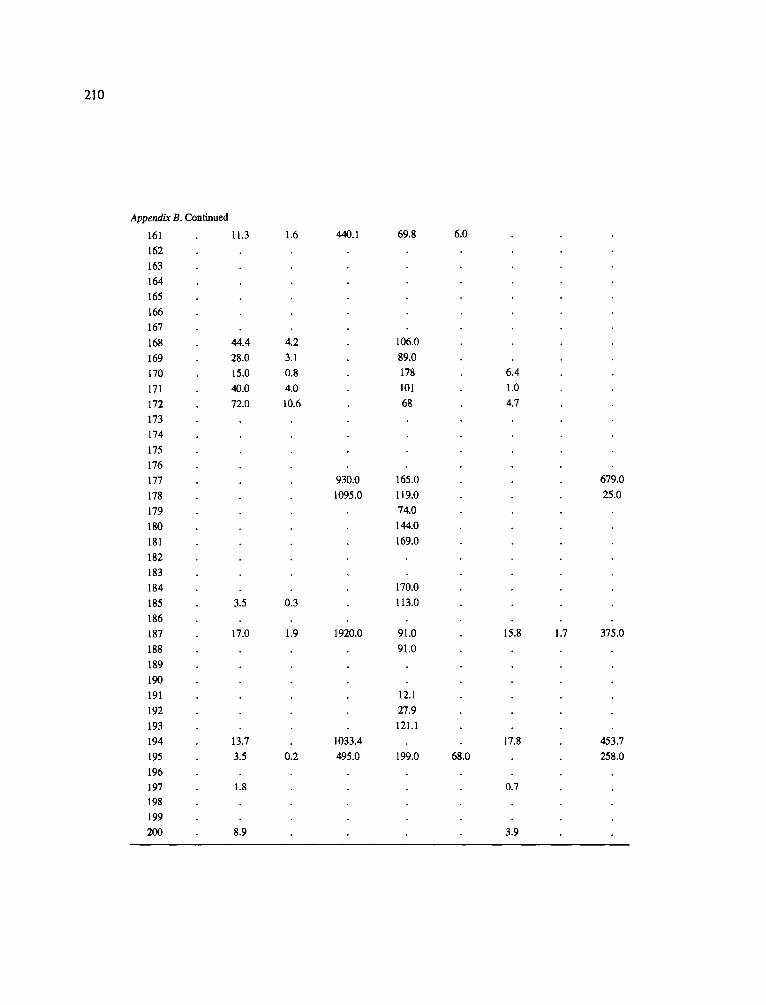
210
Append~B. Continued
161 11.3
162
163
164
165
166
167
168 44.4
169 28.0
170 15.0
171 40.0
172 72.0
173
174
175
176
177
178
179
180
181
182
183
184
185 3.5
186
187 17.0
188
189
190
191
192
193
194 13.7
195 3.5
196 197 1.8
198
199 200 8.9
1.6
4.2
3.1
0.8
4,0
10.6
0.3
1.9
0.2
440.1
930.0
1095.0
1920.0
1033.4
495.0
69.8
106.0
89.0
178
101
68
165.0
119.0
74.0
144.0
169.0
170.0
113.0
91.0
91.0
12.1
27.9
121.1
199.0
6.0
68.0
6.4
1.0
4.7
15.8
17.8
0.7
3.9
1.7
679.0
25.0
375.0
453.7
258.0
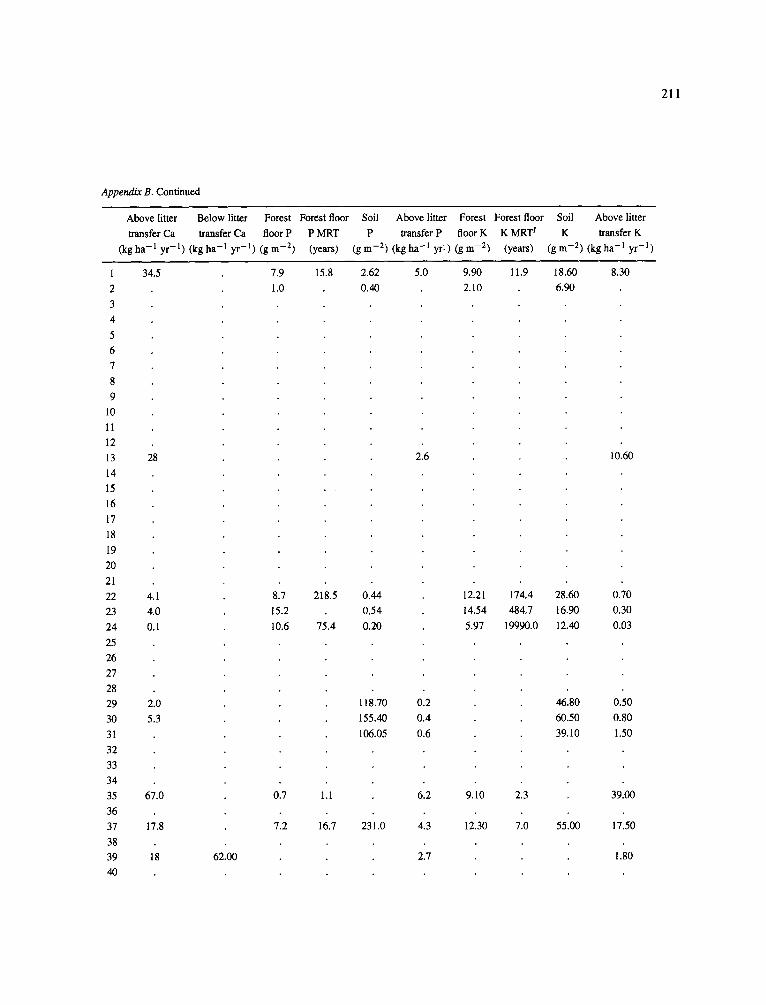
211
Appendix B. Continued
Above litter Below litter Forest Forest floor Soil Above litter Forest Forest floor Soil Above litter
transfer Ca transfer Ca floor P P MRT P transfer P floor K K MRT f K transfer K (kgha -1 yr -1) (kgha -1 yr -1) (gin -2) (years) (gin -2) (kgha - l yrl) (gm -2) (years) (gm -2) (kgha -1 yr -1)
1
2
3 4
5
6
7
8
9
10
11
12
13
14
15
16
17
18
19
20
21
22
23
24
25
26
27
28
29
30
31
32
33
34
35
36
37
38
39
40
34.5 7.9 15.8 2.62 5.0 9.90 11.9 18.60 8.30
1.0 0.40 2.10 6.90
28
4.1
4.0
0. I
2.0
5.3
8.7 218.5 0.44
15.2 0.54
10.6 75.4 0.20
2.6
118.70 0.2
155.40 0.4
106.05 0.6
10.60
67.0 0.7 1.1 6.2 9.10 2.3 39.00
17.8 7.2 16.7 231.0 4.3 12.30 7.0 55.00 17.50
18 62.00 2.7 1.80
46.80 0.50
60.50 0.80
39.10 1.50
12.21 174.4 28.60 0.70
14.54 484.7 16.90 0.30
5.97 19990.0 12.40 0.03
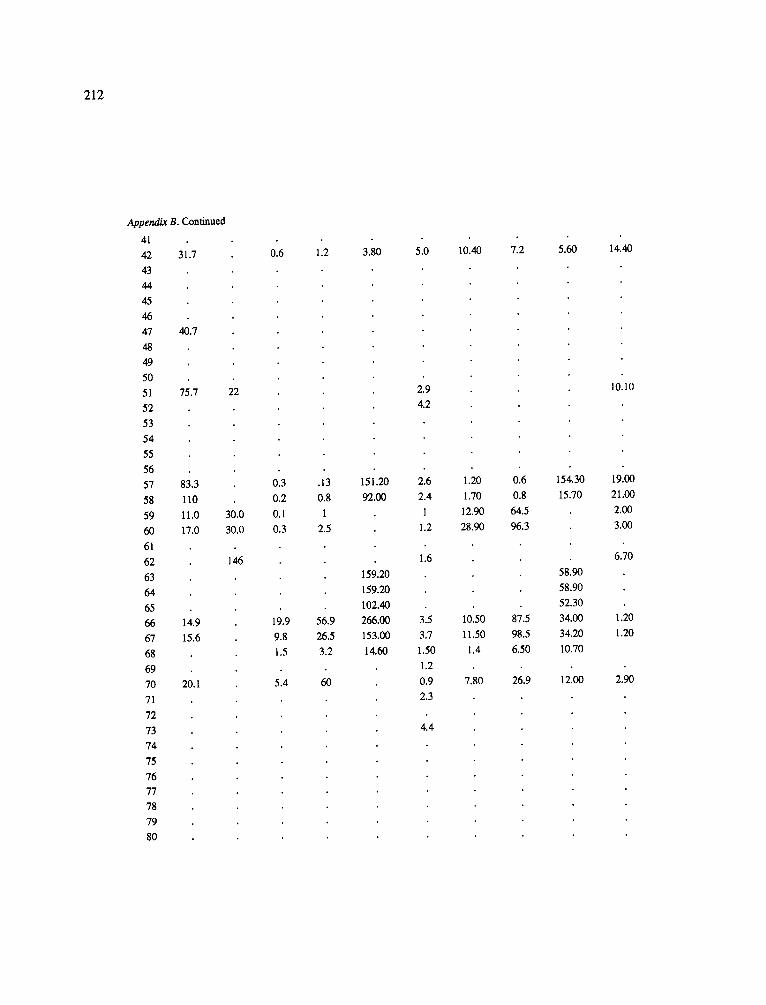
212
Appendix B. Continued
41
42 31.7
43 44
45
46
47 40.7
48
49
50 51 75.7
52
53
54
55
56 57 83.3
58 110
59 11.0
60 17.0
61
62
63
64
65 66 14.9
67 15.6
68
69
70 20.1
71
72
73
74
75
76 77
78
79
80
22
30.0
30.0
146
0.6
0.3
0.2
0.1
0.3
19.9
9.8
1.5
5.4
1.2
.13
0.8
1
2.5
56.9
26.5
3.2
60
3.80
151.20
92.00
159.20
159.20
102.40
266.00
153.00
14.60
5.0 10.40
2.9
4.2
7.2
2.6 1.20 0.6
2.4 1.70 0.8
1 12.~ 64.5
1.2 28.~ 96.3
1.6
3.5 10.50 87.5
3.7 11.50 98.5
1.50 1.4 6.50
1.2
0.9 7.80 26.9
2.3
4.4
5.60
154.30
15.70
58.90
58.90
52.30
34.00
34.20
10.70
12.00
14.40
10.10
19.00
21.00
2.00
3.00
6.70
1.20
1.20
2.90
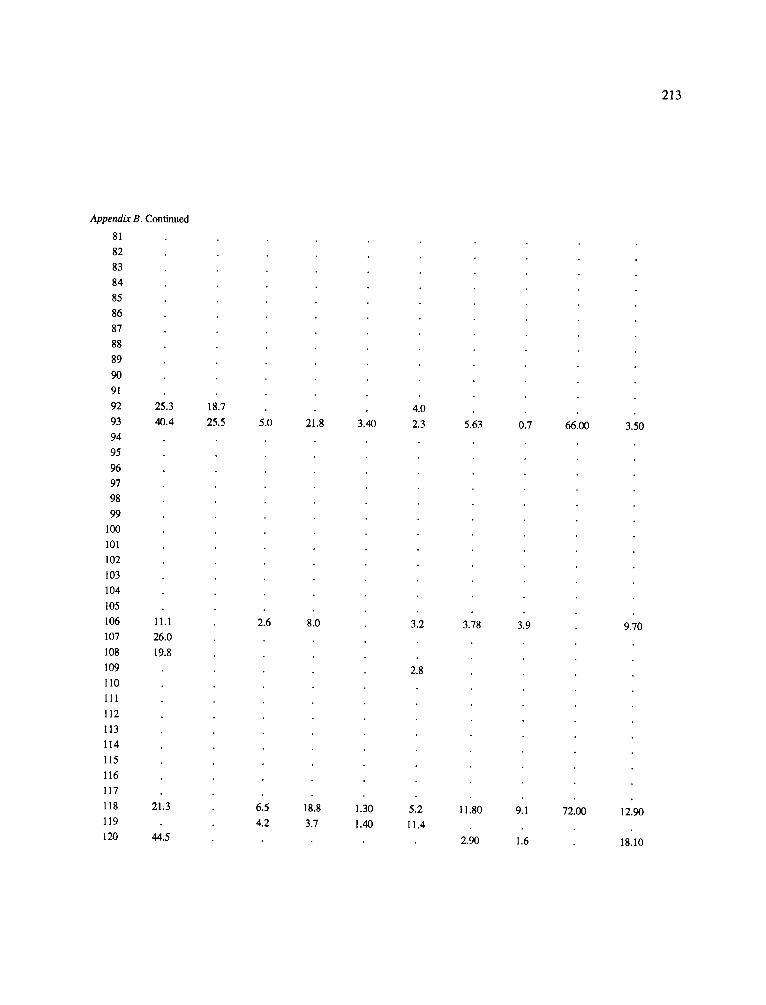
213
AppendixB. Continued
81
82
83
84
85
86
87
88
89
90
91
92 25.3
93 40.4
94
95
96
97
98
99
100
101
102
103
104
105
106 11.1
107 26.0
108 19.8
109
110
111
112
113
114
115
116
117
118 21.3
119
120 44.5
18.7
25.5 5.0
2.6
6.5
4.2
21.
8.0
18.8
3.7
3.40
1.30 1.40
4.0
2.3
3.2
2.8
5.2
11.4
5.63
3.78
11.80
2.90
0.7
3.9
9.1
1.6
66.00
72.00
3.50
9.70
12.90
18.10

214
Appendix B. Continued
121
122 86.0
123 58.3
124 77.7
125 77.0
126 49.1
127 45
128
129 28.0
130 18.0
131
132
133
134 114.0
135 83.0
136 63.9
137
138
139
140
141 89.2
142
143
144
145
146
147 63.2
148
149
150 151 74.2
152
153
154
155
156 157
158
159 160
8.1
1.1
0.5
2.2
1.8
0.4
0.4
0.3
0.2
0.2
0.3
0.2
0.2
0.4
4.1
1.9
8.1
7.5
1.4
3.45
1.73
1
0.67
0.54
0.68
2.57
1.52
140.00
284.00
120.00
120.00
4.3
2.7
2.8
4.5
2.70
2.4
1.6
1.5
5.6
5.8
2.8
1.1
1.5
1.8
3.0
5.2
3.1
0.7
2.5
1.40
0.92
2.60
2.60
0.7 3600.00 19.10
0.5 3896.00 19.00
1.02
0.92
0.60
0.59
0.58
0.56
0.67
0.65
0.98
1.3 3800.00 19.80
1.6 3800.00 16.40
0.6
5.50
4.00
16.20
5.20
5.00
8.10
18.90
16.50
16.30
3.40
9.60
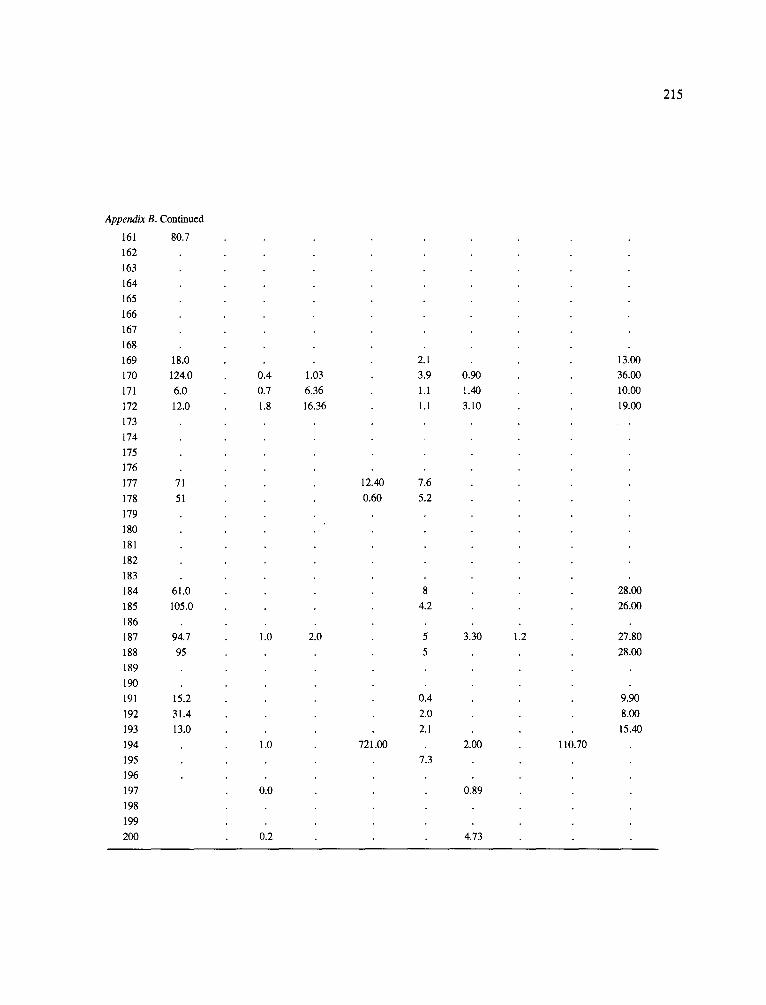
215
Append~B. Continued
161 80.7
162
163
164
165
166
167
168
169 18.0
170 124.0
171 6.0
172 12.0
173
174
175
176
177 71
178 51
179
180
181
182
183
184 61.0
185 105.0
186
187 94.7
188 95
189
190
191 15.2
192 31.4
193 13.0
194
195
196
197
198
199
200
0.4
0.7
1.8
1.0
1.0
0.0
0.2
1.03
6.36
16.36
2.0
12.40
0.60
721.00
2.1
3.9
1.1
1.1
7.6
5.2
8
4.2
0.4
2.0
2.1
7.3
0.90
1.40
3.10
3.30
2.00
0.89
4.73
1.2
110.70
13.00
36.00
10.00
19.00
28.00
26.00
27.80
28.00
9.90
8.00
15.40
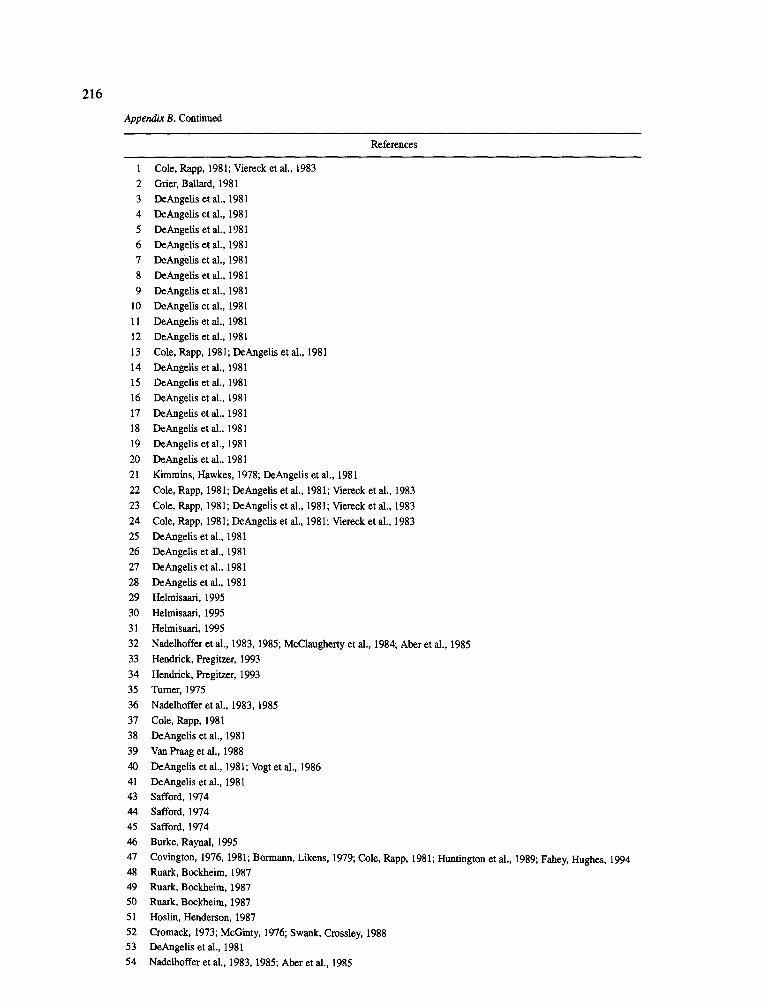
216
Appendix B. Continued
References
1 Cole, Rapp, 1981; Viereck et al., 1983 2 Grier, BaUard, 1981 3 DeAngelis et al., 1981 4 DeAngelis et al., 1981 5 DeAngelis et al., 1981 6 DeAngelis et al., 1981 7 DeAngelis et al., 1981 8 DeAngelis et al., 1981
9 DeAngelis et al., 1981 10 DeAngelis et al., 1981 11 DeAngelis et al., 1981 12 DeAngelis et al., 1981 13 Cole, Rapp, 1981; DeAngelis et al., 1981 14 DeAngelis et al., 1981 15 DeAngelis et al., 1981 16 DeAngelis et al., 1981 17 DeAngelis et al., 1981 18 DeAngelis et al., 1981
19 DeAngelis et al., 1981 20 DeAngelis et al., 1981
21 Kimmins, Hawkes, 1978; DeAngelis et al., 1981
22 Cole, Rapp, 1981; DeAngelis et al., 1981; Viereck et al., 1983 23 Cole, Rapp, 1981; DeAngelis et al., 1981; Viereck et al., 1983 24 Cole, Rapp, 1981; DeAngelis et al., 1981; Viereck et al., 1983 25 DeAngelis et al., 1981 26 DeAngelis et al., 1981
27 DeAngelis et al., 1981 28 DeAngelis et al., 1981 29 Helmisaari, 1995 30 Helmisaari, 1995
31 Helmisaari, 1995
32 Nadelhoffer et al., 1983, 1985; McClaugherty et al., 1984; Aber et al., 1985 33 Hendrick, Pregitzer, 1993 34 Hendrick, Pregitzer, 1993 35 Tumer, 1975 36 Nadelhoffer et al., 1983, 1985
37 Cole, Rapp, 1981 38 DeAngelis et al., 1981
39 Van Praag et al., 1988 40 DeAngelis et al., 1981; Vogt et al., 1986 41 DeAngelis et al., 1981 43 Safford, 1974 44 Safford, 1974 45 Safford, 1974 46 Burke, Raynal, 1995
47 Covington, 1976, 1981; Bormann, Likens, 1979; Cole, Rapp, 1981; Huntington et al., 1989; Fahey, Hughes, 1994 48 Ruark, Bockheim, 1987 49 Ruark, Bockheim, 1987 50 Ruark, Bockheim, 1987 51 Hoslin, Henderson, 1987 52 Cromack, 1973; McGinty, 1976; Swank, Crossley, 1988 53 DeAngelis et al., 1981
54 NadeUaoffer et al., 1983, 1985; Aber et al., 1985
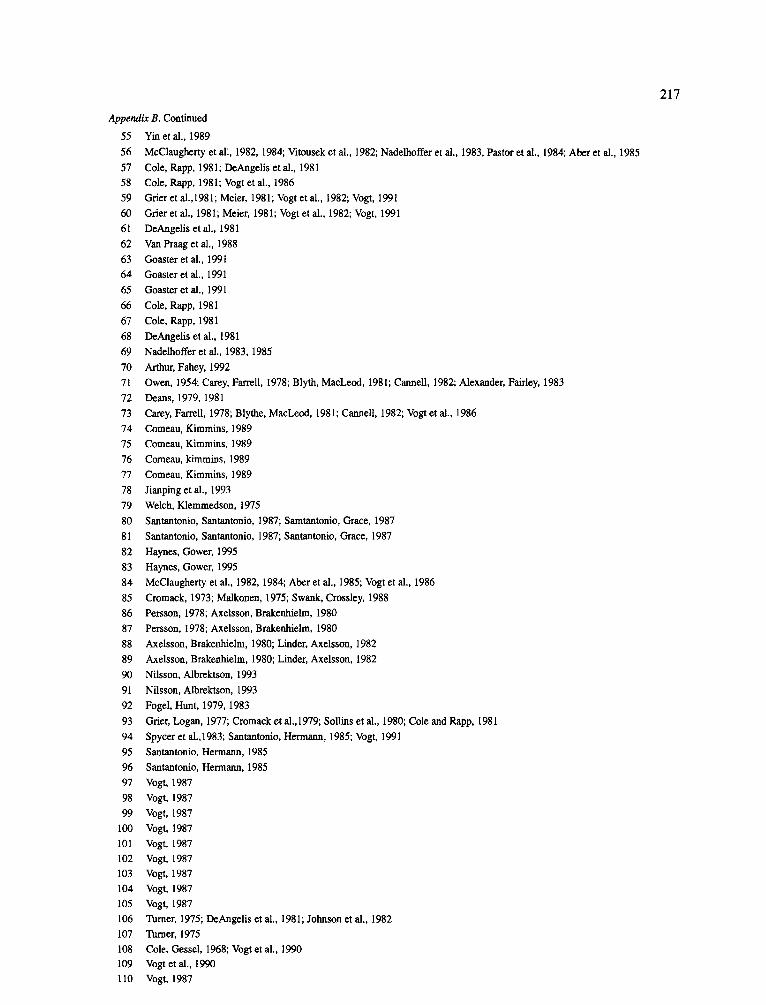
Appendix B. Continued
55 Yin et al., 1989
56 McClaugherty et aL, 1982, 1984; Vitousek et al., 1982; Nadelhoffer et al., 1983, Pastor et al., 1984; Aber et al., 1985
57 Cole, Rapp, 1981; DeAngelis et al., 1981 58 Cole, Rapp, 1981; Vogt et al., 1986 59 Grier et a1.,1981; Meier, 1981; Vogt et al., 1982; Vogt, 1991
60 Grier et al., 1981; Meier, 1981; Vogt et al., 1982; Vogt, 1991 61 DeAngelis et al., 1981
62 Van Praag et al., 1988 63 Goaster et al., 1991 64 Goaster et al., 1991 65 Goaster et al., 1991
66 Cole, Rapp, 1981 67 Cole, Rapp, 1981 68 DeAngelis et al., 1981 69 Nadelhoffer et al., 1983, 1985
70 Arthur, Fahey, 1992 71 Owen, 1954; Carey, Farrell, 1978; Blyth, MacLeod, 1981; Cannell, 1982; Alexander, Fairley, 1983
72 Deans, 1979, 1981 73 Carey, Farrell, 1978; Blythe, MacLeod, 1981; Cannell, 1982; Vogt et al., 1986
74 Comeau, Kimmins, 1989 75 Comeau, Kimmins, 1989
76 Comeau, kimmins, 1989 77 Comeau, Kimmins, 1989 78 Jianping et al., 1993
79 Welch, Klemmedson, 1975 80 Santantonio, Santantonio, 1987; Samtantonio, Grace, 1987
81 Santantonio, Santantonio, 1987; Santantonio, Grace, 1987 82 Haynes, Gower, 1995
83 Haynes, Gower, 1995 84 McClaugherty et al., 1982, 1984; Aber et al., 1985; Vogt et al., 1986
85 Cromack, 1973; Malkonen, 1975; Swank, Crossley, 1988 86 Persson, 1978; Axelsson, Brakenhielm, 1980 87 Persson, 1978; Axelsson, Brakenhielm, 1980 88 Axelsson, Brakenhielm, 1980; Linder, Axelsson, 1982 89 Axelsson, Brakenhielm, 1980; Linder, Axelsson, 1982
90 Nilsson, Albrektson, 1993 91 Nilsson, Albrektson, 1993
92 Fogel, Hunt, 1979, 1983
93 Grier, Logan, 1977; Cromack et a1.,1979; Sollins et al., 1980; Cole and Rapp, 1981 94 Spycer et a1.,1983; Santantonio, Hermann, 1985; Vogt, 1991 95 Santantonio, Hermann, 1985 96 Santantonio, Hermarm, 1985 97 Vogt, 1987 98 Vogt, 1987 99 Vogt, 1987
100 Vogt, 1987 101 Vogt, 1987 102 Vogt, 1987 103 Vogt, 1987 104 Vogt, 1987 105 Vogt, 1987 106 Turner, 1975; DeAngelis et al., 1981; Johnson et al., 1982 107 Tumer, 1975 108 Cole, Gessel, 1968; Vogt et al., 1990 109 Vogt et al., 1990 110 Vogt, 1987
217
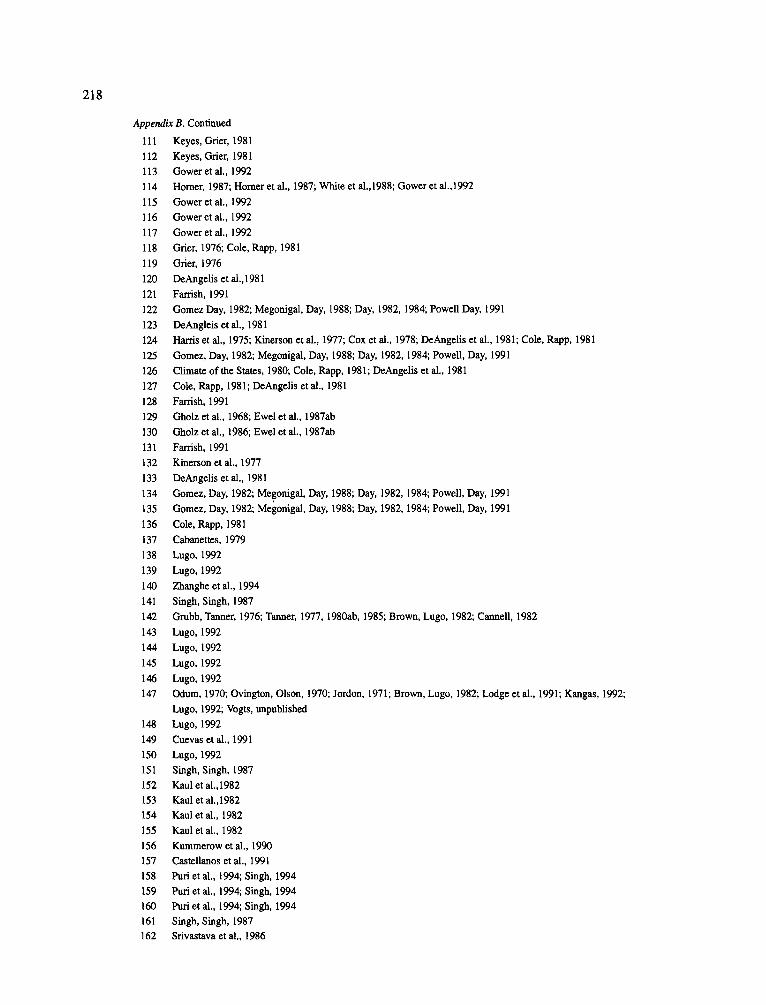
218
Appendix B. Continued
111 Keyes, Orier, 1981 112 Keyes, Cn-ier, 1981 I 13 Gower et al., 1992 i 14 Homer, 1987; Homer et al., 1987; White et al., 1988; Gower et ai.,1992
115 Oower et al., 1992 116 Gower et al., 1992 117 Gower et al., 1992 118 Grier, 1976; Cole, Rapp, 1981
I19 Grier, 1976 120 DeAngelis et ai.,1981 121 Farrish, 1991 122 Gomez Day, 1982; Megonigal, Day, 1988; Day, 1982, 1984; Powell Day, 1991 123 DeAngleis et aI,, 1981 124 Harris et al., 1975; Kinerson et al., 1977; Cox et al., 1978; DeAngelis et al., 1981; Cole, Rapp, 1981
125 Gomez, Day, 1982; Megonigal, Day, 1988; Day, 1982, 1984; Powell, Day, 1991 126 Climate of the States, 1980; Cole, Rapp, 1981; DeAngelis et al., 1981 127 Cole, Rapp, 1981; DeAngelis et al., 1981 128 Farrish, 1991 129 Gholz et al., 1968; Ewel et al., 1987ab 130 Gholz et al., 1986; Ewel et al., 1987ab 131 Fardsh, 1991 132 Kinerson et al., 1977 133 DeAngelis et al., 1981 134 Gomez, Day, 1982; Megonigal, Day, 1988; Day, 1982, 1984; Powell, Day, 1991 135 Gomez, Day, 1982; Megonigal, Day, 1988; Day, 1982, 1984; Powell, Day, 1991
136 Cole, Rapp, 1981
137 Cabanettes, 1979 138 Lugo, 1992 139 Lugo, 1992 140 Zhanghe et al., 1994 141 Singh, Singh, 1987 142 Gmbb, Tanner, 1976; Tanner, 1977, 1980ab, 1985; Brown, Lugo, 1982; Cannell, 1982
143 Lugo, 1992 144 Lugo, 1992
145 Lugo, 1992
146 Lugo, 1992 147 Odum, 1970; Ovington, Olson, 1970; Jordon, 1971; Brown, Lugo, 1982; Lodge et al., 1991; Kangas, 1992;
Lugo, 1992; Vogts, unpublished 148 Lugo, 1992
149 Cuevas et al., 1991 150 Lugo, 1992 151 Singh, Singh, 1987 152 Kaul et a1.,1982 153 Kaul et a1.,1982 154 Kaul et al., 1982 155 Kaul et al., 1982 156 Kummerow et al., 1990 157 Castellanos et al., 1991 158 Puri et al., 1994; Singh, 1994 159 Purl et al., 1994; Singh, 1994 160 Puri et al., 1994; Singh, 1994 161 Singh, Singh, 1987 162 Srivastava et al., 1986

Appendix B. Continued
163 Roy, Singh, 1995
164 Roy, Singh, 1995
165 Priess, Ft~lster, 1994
166 Priess, FOlster, 1994
167 Priess, F6lster, 1994
168 Huttel, 1969; Klinge, 1973, 1975; Klinge, Herrera, 1978; Edwards, 1982
169 Klinge, Rodriguez, 1968; Klinge et al., 1875; Brown, Lugo, 1982; Vogt et al., 1986
170 Duivenvoorden, Lips, 1995
171 Duivenvoorden, Lips, 1995
172 Duivenvoorden, Lips, 1995
173 F~lster et al., 1976
174 F61ster et al., 1976
175 F~lster et al., 1976
176 Vance, Nadkarni, 1992
177 Gower, 1987
178 Gower, 1987
179 Ewel, 1976; Berish, 1982
180 Ewel, 1976; Berish, 1982
181 Ewel, 1976; Stark, Spratt, 1977; Berish, 1982
182 Visalakshi, 1994
183 Visalakshi, 1994 184 Huttel, Bernhard-Reversat, 1975; Huttel, 1975; Brown, Lugo, 1982; Cannell, 1982; Vislakshi, 1994
185 Huttel, bernhard-Reversat, 1975; Huttel, 1975; Brown, Lugo, 1982; Cannell, 1982; Visalakshi, 1994
186 DeAngelis et al., 1981
187 Edward, Grubb, 1977, 1982; Edwards, 1977, 1982
188 Edwards, 1977; Edwards, 1982; Edwards, Grubb, 1982
189 Cavelier, 1992
190 Ogawa et al., 1965; Yoda, Kira, 1969
191 Klinge, Herrera, 1978; Cuevas, Medina, 1988; Sanford, 1989
192 Klinge, Herrera, 1978; Vuevas, Medina, 1988; Sanford, 1989
193 Klinge, Herrera, 1978; Cuevas, Medina, 1988; Sanford, 1989
194 Hase, F~lster, 1982
195 Greenland, Kowal, 1960; Nye, 1961; Lawson et al., 1970; Edwards, Grubb, 1982; Mabberley, 1992
196 Cavelier, 1992
197 Egunjobi, Bada, 1979
198 Egunjobi, Bada, 1979
199 Egunjobi, Bada, 1979
200 Egunjobi, Bada, 1979
219
aClimatic forest type: BOBLDE - Boreal broadleaf deciduous; BONLEV - Boreal needleleaf evergreen; CTBLDE - cold temperate broadleaf deciduous; CTBLEV - cold temperate broadleaf evergreen; CTNLEV - cold temperate needleleaf evergreen; WTBLDE - warm temperate broadleaf deciduous; WTBLEV - warm temperate broadleaf evergreen; WTNLEV -. warn temperate needleleaf evergreen; STBLDE - subtropical broadleaf deciduous; STBLEV - subtropical broadleaf evergreen; STNLEV - subtropical needleleaf evergreen; TRBLDE - tropical bmadleaf deciduous; TRBLSDE - tropical broadleaf semi-deciduous; TRBLEV - tropical bmadleaf evergreen; TRNLEV - tropical needleleaf evergreen; MENLEV- mediterranean needleleaf evergreen; MEBLEV - mediterranean broadleaf evergreen. bSoil order - 1 - Mollisol; 2 - Alfisol; 3 - Andisol; 4 - Histosol; 5 - Inceptisol; 6 - Ultisol; 7 - Entisol; 8 - Spodosol; 9 - Oxisol; 10 - Aridisol; 11 - Vertisol;. unknown. cSoil texture - 1 - sand; 2 - loamy sand; 3 - sandy loam; 4 - fine sandy loam; 5 - vry fine sandy loam; 6 - loam; 7 - silt loam; 8 - silt; 9 - sandy clay loam; 10 - silt clay loam; 11 - clay loam; 12 - sandy clay; 13 - silty clay; 14 - clay;, unknown. aForest origin. eSite quality. fMRT - mean residence time.