Review of 2007 EUR version - Skanska Group
160
Review of 2007 EUR version
-
Upload
khangminh22 -
Category
Documents
-
view
2 -
download
0
Transcript of Review of 2007 EUR version - Skanska Group

ska
nsk
a R
eview
of 2
00
7 – eU
R v
eRsio
n
Review of 2007EUR version
Skanska ABwww.skanska.com
Råsundavägen 2se-169 83 solnaswedenTel: +46 8 753 88 00fax: +46 8 755 12 56

About Skanska
Skanska in 2007
Commercial Development a record year, with 23 new projects started and with leases signed for more than 300,000 sq. m (3.23 million sq. ft.) of space. investors are showing continued good demand for completed projects. Read more on page 34
Infrastructure Developmentvalue growth was good, and unrealized develop-ment gains increased by eUR 286 M. Read more on page
42
Skanska is one of the world’s largest construction companies, with a leading position in a number of home markets in Europe, the United States and Latin America. Skanska also carries out project development in selected geographic markets in the residential and commercial property fields, as well as in infrastructure by means of public-private partnerships. By combining international expertise with a local presence, Skanska acts as a local company with global strength. The Skanska Group has 60,000 employees, and in 2007 its revenue totaled EUR 15.0 billion.
4
The President and CEO: ”we have set bold new financial targets and challenged ourselves to lead the industry in developing economical solutions to enable our customers to reduce Co2 consumption.” Read more on page
18
Constructionimproved earnings in nine markets out of ten. operating income increased by 33 percent. operating margin reached 3.4 percent, which means that it surpassed the “outperform” target for this business stream.Read more on page
Residential Development Despite a downturn primarily in the Danish and norwegian markets, the business stream ended the year close to its financial targets.Read more on page
28
Addresses
Skanska ABse-169 83 solnaswedenstreet address: Råsundavägen 2Tel: +46 8 753 88 00fax: +46 8 755 12 56www.skanska.com
Skanska Swedense-169 83 solnaswedenstreet address: Råsundavägen 2Tel: +46 8 504 350 00 fax: +46 8 755 63 17Customer service: 020-30 30 40(from inside sweden only)www.skanska.se
Skanska NorwayP.o. Box 1175 sentrumno-0107 oslonorwaystreet address: Drammensveien 60Tel: +47 40 00 64 00 fax: +47 23 27 17 30 www.skanska.no
Skanska DenmarkBaltorpvej 158Dk-2750 BallerupDenmarkTel: +45 44 77 99 99 fax: +45 44 77 98 99www.skanska.dk
Skanska FinlandP.o.Box 114fi-00101 Helsinkifinlandstreet address: Paciuksenkatu 25Tel: +358 20 719 211 fax: +358 20 719 2271 www.skanska.fi
Skanska Poland ul. Gen. J. Zajaczka 9PL-01-518 warsawPolandTel: +48 22 561 30 00fax: +48 22 561 30 01www.skanska.pl
Skanska Czech Republic kubánské námestí 1391/11CZ-100 05 Prague 10 - vrsoviceCzech RepublicTel: +420 267 310 476fax: +420 267 310 644www.skanska.cz
Skanska UK Maple Cross HouseDenham way, Maple CrossRickmansworthHertfordshire wD3 9swUnited kingdomTel: +44 1923 776 666 fax: +44 1923 423 900www.skanska.co.uk
Skanska USA Building1633 Littleton RoadParsippany, nJ 07054U.s.a.Tel: +1 973 753 3500fax: +1 973 753 3499www.usa.skanska.com
Skanska USA Civil16-16 whitestone expresswaywhitestone nY 11357 U.s.a.Tel: +1 718 747 34 54 fax: +1 718 747 34 58 www.usa.skanska.com
Skanska Latin Americaavenida del Libertador 2442 – Piso 5B1636DsR olivos, Buenos airesargentina Tel: +54 11 4341 7000 fax: +54 11 4341 7355 www.skanska.com.ar
Skanska Residential Development Nordicse-169 83 solnaswedenstreet address: Råsundavägen 2Tel: +46 8 504 350 00fax: +46 8 504 361 99www.skanska.com/residentialnordic
Skanska Commercial Development Nordicse-169 83 solnaswedenstreet address: Råsundavägen 2Tel: +46 8 504 350 00 fax: +46 8 504 361 99www.skanska.se/fastigheter
Skanska Commercial Development Europese-169 83 solnaswedenstreet address: Råsundavägen 2Tel: +46 8 504 350 00 fax: +46 8 504 361 99www.skanska.com/property
Skanska Infrastructure Developmentse-169 83 solnaswedenstreet address: Råsundavägen 2Tel: +46 8 504 350 00 fax: +46 8 755 13 96www.skanska.com/id
Skanska Financial Servicesse-169 83 solnaswedenstreet address: Råsundavägen 2Tel: +46 8 504 350 00 fax: +46 8 753 18 52www.skanska.com
Skanska Project Supportse-169 83 solnaswedenstreet address: Råsundavägen 2Tel: +46 8 504 350 00fax: +46 8 753 48 42www.skanska.com/projectsupport
For other addresses:www.skanska.com

Skanska Review of 2007 1
Group overview 2The Skanska Group 2Comments by the President and CEO 4Mission, goals and strategy 6Financial targets 10Risk management 11Employees 13Share data 16
Business streams 18Construction 18Residential Development 28Commercial Development 34Infrastructure Development 42 Sustainable development 50Social agenda 52Environmental agenda 54Economic agenda 56 Financials 2007 57Financial Review 2007 58Consolidated income statement 67Consolidated balance sheet 68Consolidated statement of recognized income and expenses 70Consolidated cash flow statement 71Notes, table of contents 72Statement of the President and Chief Executive Officer 138Independent Auditor’s Report 139
Corporate governance 141Corporate governance report 141Senior Executive Team 147Board of Directors 148
Report from Annual Shareholders’ Meeting 150Financial information 150 More information about Skanska 151Definitions and abbreviations 155
ContentsHome markets
Key ratios
United StatesLatin America
Cover photos: The Escambia Bay Bridge in the Florida Panhandle is a new 4.2 km (2.6 mi.) long twin span across Escambia Bay on Interstate Highway 10. The Skanska-led construction team won a USD 10 M bonus for completing the first span
ahead of schedule. Skanska employee Leonid Stotland works on the Triborough Bridge in New York City, yet another of Skanska’s many renovation projects on the city’s major bridges.
Geografisk fördelning av intäkter
Sverige, 22%
Övriga Norden, 20%
Övriga Europa, 27%
USA, 28%
Övriga marknader, 3%
Revenue by geographic area
Sweden, 22%
Other Nordic countries, 20%
Other European countries, 27%
United States, 28%
Other markets, 3%
Intäkter verksamhetsgrenar
Byggverksamhet, 93%
Bostadsutveckling, 5%
Kommersiell utveckling, 2%
Infrastrukturutveckling, 0%
Revenue by business stream
Construction, 93%
Residential Development, 5%
Commercial Development, 2%
Infrastructure Development, 0%
Rörelseresultatverksamhetsgrenar
Byggverksamhet, 73%
Bostadsutveckling, 12%
Kommersiell utveckling, 15%
Infrastrukturutveckling, 0%
Operating income by business stream
Construction, 73%
Residential Development, 12%
Commercial Development, 15%
Infrastructure Development, 0%
Highlights EUR M SEK M
Revenue 15,002 138,781
Operating income 584 5,406
Income after financial items 613 5,667
Earnings per share, EUR/SEK 1.06 9.78
Return on equity, % 21.1 21.1
Return on capital employed, % 25.1 25.1
Order bookings1 15,822 146,373
Order backlog1 15,468 146,154
1 Refers to Construction operations
SwedenNorwayFinlandDenmarkUnited KingdomEstoniaPolandCzech RepublicSlovakiaHungary
Earnings and dividend per share
0
2
4
6
8
10
20072006200520042003
Earnings per share
Dividend per share
Extra dividend per share
SEK
The financial statements presented in this Review have been prepared in EUR (euro) as the presentation currency. As the functional currency of the Parent Company is SEK (Swedish kronor), Skanska’s statutory Annual Report including the consolidated financial statements and the financial statements of the Parent Company has been prepared using Swedish kronor (SEK) as the presentation currency. For currency exchange rates, see page 80.

Gro
up
over
view
2 The Skanska Group Skanska Review of 2007
The SkanskaGroup
Residential DevelopmentConstruction Commercial Development Infrastructure Development
Skanska Financial Services
Senior Executive Team
Group staff units Skanska Project Support
Skanska Residential Development Nordic
Skanska Sweden
Skanska Norway
Skanska Finland
Skanska Poland
Skanska Czech Republic
Skanska UK
Skanska USA Building
Skanska USA Civil
Skanska Latin America
Skanska Commercial Development Europe
Skanska Commercial Development Nordic
Skanska Infrastructure Development
Construction refers to building construction (both non-residential and residential) and civil construction. It is Skanska’s largest business stream. The Construction business stream operates through nine business units in selected home markets – Sweden, Norway, Finland and Estonia, Poland, the Czech Republic and Slovakia, the United Kingdom, the United States and Latin America.
The Residential Development business stream initiates and develops residential projects for sale. Housing units are tailored for selected customer categories. Skanska is one of the leading residential developers in the Nordic countries and also has a sizeable presence in the Czech Republic and Slovakia. The business stream operates through its own Nordic business unit and as part of Construction in the Czech Republic.
Commercial Development initiates, develops, leases and divests commercial property projects, with a focus on office buildings, shopping malls and logistics properties. The business stream works through two business units: Skanska Commercial Development Nordic and Skanska Commercial Development Europe.
Infrastructure Development develops, manages and divests privately financed infrastructure projects such as roads, hospitals, schools and power generating plants. The business stream focuses on creating new potential for projects in markets where Skanska has construction business units. It works through the Skanska Infrastructure Development business unit.
Revenue EUR 830 M
Share of Group 5%
Operating income EUR 78 M
Share of Group 12%
Revenue EUR 338 M
Share of Group 2%
Operating income EUR 98 M
Share of Group 15%
Revenue EUR 13 M
Share of Group 0%
Operating income EUR –12 M
Share of Group 0%
Operating income EUR 480 M
Share of Group 73%
Revenue EUR 14,322 M
Share of Group 93%

Skanska Review of 2007 Group overview 3
”Our employees are the reason this is such a great company and they are the main reason Skanska will prosper also if conditions get tougher.”Stuart E. Graham, President and CEO

Gro
up
over
view
4 Comments by the President and CEO Skanska Review of 2007
The year 2007 marks the end of the first phase of our “Outperform” strategy. The emphasis has been on achieving financial targets for operating margin, return on capital and return on equity as well as the now famous qualitative targets, the 4 Zeros, expanded to 5 Zeros with the inclusion of a goal of zero defects. During the same period we more than doubled the time spent on recruiting, management and leadership development.
As a result of the effort of thousands of colleagues throughout Skanska we have achieved all of our financial targets in all business streams except Residential Development, where deteriorating market conditions and our own shortcomings in certain areas caused us to finish the year just short of the targets.
ConstructionI am most pleased to report that we reached 3.4 percent operating margin, exceeding the 3.3 percent margin target in the Construction business stream, which includes the lower-margin construction management business in USA Building. Particularly strong performances were turned in by Sweden with a 4.7 percent operating margin, Norway 4.3 percent, Finland 4.1 percent, Poland 4.7 percent, USA Civil 5.0 percent, and Skanska Latin America 5.0 percent. These impressive margins were reached while achieving a working capital to revenue ratio of nega-tive 9.3 percent.
The improvement over the past three years is largely due to much better risk management, based on our principles of not taking on projects for which we do not have experienced Skanska managers,
sticking to our home markets and cus-tomer selectivity. This bodes well for 2008 as well because the order book contains higher margins than in the past.
Commercial DevelopmentThe Commercial Development business stream had its best year ever in terms of new investments, with 23 new projects started and a total investment value of EUR 560 M. The value created from these investments will be realized over the next few years. New leases signed in 2007 exceeded 300,000 square meters (3.23 million square feet) and the trend continues in the first quarter of 2008. The Skanska brand is one reason tenants and investors are attracted to our projects. Despite the fact that this was a year of heavy investment in new projects, we still realized operating income of over EUR 95 M in Commercial Development. All in all a great year for the best develop-ment team in Europe.
During 2007 we expanded our com-mercial development footprint to include Helsinki, Ostrava in the Czech Republic, and Wrocław in Poland. We now have commercial development activities in 11 cities in the Nordics and Central Europe.
Residential DevelopmentDespite the severe market downturn in Denmark and Norway, the Residential Development business stream still came quite close to its operating margin target of 10 percent, with 9.4 percent on sales of 3,900 units. Return on capital employed was 14.9 percent vs. a target of 18 percent.
Most importantly for the future, we invested heavily in the Skanska Xchange, a concept aimed at reducing the cost of construction of our residential units by 15 percent over three years. Smarter design, consolidated purchasing, more prefabrication and a much more efficient construction process are all part of this effort. We are also focusing more atten-tion on the consumer of our residential units to make sure our products meet the expectation of ever more demanding cus-tomers. We are determined to reach our goal and to take market share as a result.
Infrastructure DevelopmentThe value of our portfolio of completed and in-progress Infrastructure Devel-opment projects now has an estimated market value of EUR 991 M, an increase of EUR 325 M over 2006. The valua-tion does not include value potential coming from future recapitalization opportunities. During 2007 we divested one small project, and late in the year we announced an agreement to sell our share
”We have set bold new financial targets and challenged ourselves to lead the industry in developing economical solutions to enable our customers to reduce energy consumption and CO2 emissions.”
Comments by the President and CEO

Skanska Review of 2007 Group overview 5
of the Ponte de Pedra hydropower station in Brazil at a gain of about EUR 59 M, to be reported in 2008.
In December the Walsall Hospital project reached financial close, where Skanska will invest EUR 11.9 M and get a construction contract worth EUR 0.3 billion.
In 2008 we will tender for some very large road concession projects in North America with an aim of achieving our goal of committing further investment in this sector of EUR 106 M a year. We also now see more public-private partnership (PPP) opportunities in Central Europe.
Skanska GroupOn a Group level we achieved a return on equity of 21.1 percent, surpassing the target and ending the year with a net cash position of EUR 1.5 billion.
The 2008-2010 business plan: Outperform Phase IISkanska is now ready for the next phase of development.
Our brand is highly regarded and our financial position is strong, but most of all our people have high expectations of themselves and their colleagues. We have set bold new financial targets and challenged ourselves to lead the industry in developing economical solutions and enable our customers to reduce energy consumption and CO2 emissions.
Internally, we are becoming a green company as well; in our offices, our cars, our equipment, and in our personal lives. We are convinced that the substantial investment we are making in green initia-tives will be good for the environment and good for our bottom line.
In 2008, we will continue our work in consolidated purchasing and initi-ate more productivity improvements in construction.
As I write this letter the financial mar-kets are in turmoil. Shares, including our own, are falling and there is a great deal of worry about recession. But, in my opinion the future of Skanska has never been bet-ter. Here is why.
In the “Group overview” section
During 2007 I met face to face with over 7,000 Skanska colleagues in 45 locations around the world. I can assure you they are highly skilled and very committed to making Skanska a winner. I am very pleased that our shareholders have voted to incentivize all of our employees to pur-chase shares in Skanska. They are the rea-son this is such a great company and they are the main reason Skanska will prosper also if conditions get tougher. Long term, we will also benefit greatly from the world-wide trend toward urbanization. As a result, our core competence as a “City Builder” will be increasingly in demand.
I am very pleased that the Board of Directors has selected Johan Karlström to succeed me as CEO of Skanska. I have worked closely with Johan for many years and respect his ability and experience in the industry. Johan’s energy and enthu-siasm for our business coupled with his knowledge of Skanska and sound judg-ment mean that we face a future filled with opportunity and risk with a leader who we can all count on to deliver.
Thank you all for your support during my time as CEO. It has been a privilege.
Solna, March 2008
Stuart E. Graham President and CEO
Skanska B
SIX Construction Index(c) FINDATA
Skanska share price movement, January 1, 2003–January 31, 2008
OMX Stockholm_PI
Monthly trading volume, thousands (incl. after hours trading) right-hand scale
Skanska B
SIX Bygg & Anläggningsrelaterat
(c) FINDATA
Kursutveckling Skanska-aktien 1 januari 2003–31 januari 2008
OMX Stockholm_PI
Omsatt antal aktier 1 000-tal (inkl efteranmälda) höger axel
20 000
40 000
60 000
80 000 60
80
100
120
140
160
35 2003 2004 2005 2006 2007 2008
Kr 180
100 000
20,000
40,000
60,000
80,000 60
80
100
120
140
160
35 2003 2004 2005 2006 2007 2008
SEK 180
100,000
50
100
150
200
2003 2004 2005 2006 2007 2008
Totalavkastning i Skanska-aktien jämfört med SIX Return Index (avkastningsindex) 1 januari 2003–31 januari 2008
Skanska B (inklusive utdelning)
SIX Return Index(c) FINDATA
30
Kr
250
Total return of Skanska shares compared to the SIX Return Index, January 1, 2003–January 31, 2008
Skanska B (including dividend)
SIX Return Index(c) FINDATA
50
100
150
200
2003 2004 2005 2006 2007 200830
SEK
250
6
11
13
16
Johan Karlström, new President and CEO from April 3, 2008.
Skanska Tender Approval Procedure
S T A P
ORA
Strategic focus on profitability
Common procedures for risk management
Share data
Recruitment, increased diversity, managementdevelopment

Gro
up
over
view
6 Mission, goals and strategy Skanska Review of 2007
Construction and project development are complex businesses. Unlike industrial production at fixed plants, in construction and project development most projects are unique. In principle, each project is implemented in a new location, in a new environment and with a unique design. Customers are usually local and many projects are carried out for completely new customers. Market conditions also vary among countries and regions within countries.
As a rule, construction projects are large. It is not unusual for them to be the cus-tomer’s largest single investment. Another distinguishing feature of construction is the large number of local players involved in each project – public agencies, archi-tects and engineers, financiers, consul-tants, suppliers and subcontractors. This is why Skanska consists of local units in a global network.
Skanska’s core businessesSkanska operates in four business streams.
Construction The business includes construction of non-residential and residential build-ings as well as civil construction projects. It is Skanska’s largest business stream, performing construction assignments for external customers as well as for Skanska’s development business streams. Operations are conducted in selected home markets – Sweden, Norway, Finland and Estonia, Poland, the Czech Republic and Slovakia, the United Kingdom, the United States and Latin America. Skanska attaches special importance to metropolitan regions, which often demonstrate higher growth than their respective country as a whole. Skanska
Strategic focus on profitability
offers many of the products and services that are needed in growing cities – workplaces, schools, hospitals, sports and leisure facili-ties, as well as housing and infrastructure for transportation, energy, water and more. In individual markets, Skanska operates today in certain segments, but by taking advantage of its collective expertise, the Company can enhance its opportunities for growth and higher earnings in these markets.
Residential Development Skanska initiates and develops residential projects for sale primarily to consum-ers. It operates in selected markets where Skanska has a permanent presence – Sweden, Norway, Denmark, Finland and Estonia as well as the Czech Republic and Slovakia. Skanska is one of the lead-
ing residential developers in the Nordic region. Operations focus primarily on small and medium-sized residential units in attractive locations. Nordic opera-tions are gathered in one business unit, Residential Development Nordic. In the Czech Republic and Slovakia, the local construction business unit carries out residential development through a spe-cialized division.
Commercial Development Skanska initiates, develops, invests in, leases and divests commercial real estate projects, with a focus on office space, retail centers and logistics properties in Stockholm, Gothenburg, Öresund ( Malmö and Copenhagen), Helsinki, Warsaw, Wrocław, Prague, Ostrava and
Skanska Review of 2007 Mission, goals and strategy 7
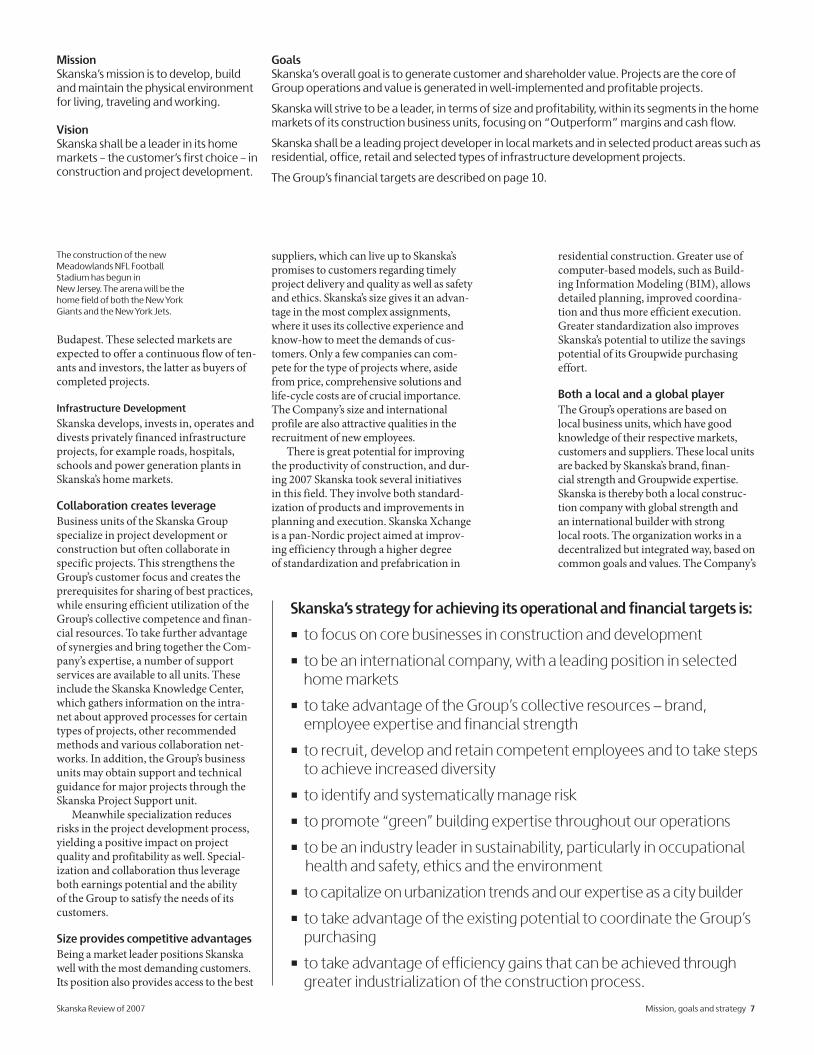
MissionSkanska’s mission is to develop, build and maintain the physical environment for living, traveling and working.
VisionSkanska shall be a leader in its home markets – the customer’s first choice – in construction and project development.
The construction of the new Meadowlands NFL Football Stadium has begun in New Jersey. The arena will be the home field of both the New York Giants and the New York Jets.
Skanska’s strategy for achieving its operational and financial targets is:
• to focus on core businesses in construction and development
• to be an international company, with a leading position in selected home markets
• to take advantage of the Group’s collective resources – brand, employee expertise and financial strength
• to recruit, develop and retain competent employees and to take steps to achieve increased diversity
• to identify and systematically manage risk
• to promote “green” building expertise throughout our operations
• to be an industry leader in sustainability, particularly in occupational health and safety, ethics and the environment
• to capitalize on urbanization trends and our expertise as a city builder
• to take advantage of the existing potential to coordinate the Group’s purchasing
• to take advantage of efficiency gains that can be achieved through greater industrialization of the construction process.
Budapest. These selected markets are expected to offer a continuous flow of ten-ants and investors, the latter as buyers of completed projects.
Infrastructure Development Skanska develops, invests in, operates and divests privately financed infrastructure projects, for example roads, hospitals, schools and power generation plants in Skanska’s home markets.
Collaboration creates leverageBusiness units of the Skanska Group specialize in project development or construction but often collaborate in specific projects. This strengthens the Group’s customer focus and creates the prerequisites for sharing of best practices, while ensuring efficient utilization of the Group’s collective competence and finan-cial resources. To take further advantage of synergies and bring together the Com-pany’s expertise, a number of support services are available to all units. These include the Skanska Knowledge Center, which gathers information on the intra-net about approved processes for certain types of projects, other recommended methods and various collaboration net-works. In addition, the Group’s business units may obtain support and technical guidance for major projects through the S kanska Project Support unit.
Meanwhile specialization reduces risks in the project development process, yielding a positive impact on project quality and profitability as well. Special-ization and collaboration thus leverage both earnings potential and the ability of the Group to satisfy the needs of its customers.
Size provides competitive advantagesBeing a market leader positions Skanska well with the most demanding customers. Its position also provides access to the best
suppliers, which can live up to Skanska’s promises to customers regarding timely project delivery and quality as well as safety and ethics. Skanska’s size gives it an advan-tage in the most complex assignments, where it uses its collective experience and know-how to meet the demands of cus-tomers. Only a few companies can com-pete for the type of projects where, aside from price, comprehensive solutions and life-cycle costs are of crucial importance. The Company’s size and international profile are also attractive qualities in the recruitment of new employees.
There is great potential for improving the productivity of construction, and dur-ing 2007 Skanska took several initiatives in this field. They involve both standard-ization of products and improvements in planning and execution. Skanska Xchange is a pan-Nordic project aimed at improv-ing efficiency through a higher degree of standardization and prefabrication in
residential construction. Greater use of computer-based models, such as Build-ing Information Modeling (BIM), allows detailed planning, improved coordina-tion and thus more efficient execution. Greater standardization also improves Skanska’s potential to utilize the savings potential of its Groupwide purchasing effort.
Both a local and a global player The Group’s operations are based on local business units, which have good knowledge of their respective markets, customers and suppliers. These local units are backed by Skanska’s brand, finan-cial strength and Groupwide expertise. Skanska is thereby both a local construc-tion company with global strength and an international builder with strong local roots. The organization works in a decentralized but integrated way, based on common goals and values. The Company’s
GoalsSkanska’s overall goal is to generate customer and shareholder value. Projects are the core of Group operations and value is generated in well-implemented and profitable projects. Skanska will strive to be a leader, in terms of size and profitability, within its segments in the home markets of its construction business units, focusing on “Outperform” margins and cash flow. Skanska shall be a leading project developer in local markets and in selected product areas such as residential, office, retail and selected types of infrastructure development projects. The Group’s financial targets are described on page 10.

Gro
up
over
view
8 Mission, goals and strategy Skanska Review of 2007
Employee Ownership Program (SEOP), for all permanent employees.
Meanwhile Skanska is broadening its recruitment base by attaching greater importance to increasing the diversity of its workforce in terms of gender, ethnicity and educational background.
Risk management systemConstruction work involves technical, legal, financial, employee, safety and envi-ronmental risks. The ability to identify and manage these risks is crucial to the Group’s success and is thus an important prerequisite for achieving its strategic goals. Unforeseen risks may have a sub-stantial adverse impact on earnings. This is why the Group’s risk management sys-tem is of key importance (see page 11).
Laying the groundwork for profitabilitySkanska’s earnings are achieved through well-implemented, profitable projects. The right market, the right projects and the right project managers are funda-mental to success. The groundwork is laid by the Group’s strategic planning, which identifies selected markets and segments. Skanska continuously builds up knowledge of its customers through a
extensive network enables it to offer its global know-how to customers at the local level.
Skanska’s strengthsEmployeesSkanska’s highly skilled, dedicated employees combine expertise with the Group’s overall focus on sustainable development in order to successfully deliver projects to customers. The Group’s ability to transfer knowledge between different geographic markets also contrib-utes to its strength.
Brand The Skanska brand, built up during more than 120 years of working in many differ-ent countries. One element of the brand is the Group’s Code of Conduct, which includes policies on employee relations, health and safety, the environment and business ethics.
Financial strengthFinancial strength is an important factor in maintaining the confidence of custom-ers and capital markets in Skanska. It also enables the Group to invest in project development and assume responsibility for and invest in major privately financed infrastructure projects.
Talent management vitalA good reputation is an important fac-tor in attracting the best employees. To achieve its long-term goals, Skanska must ensure its supply of future managers for its projects as well as for other parts of the organization. Identifying and developing the lead-ers of tomorrow is a core activity for both local units and the Group. For this reason the company continuously measures and assesses employees with leadership poten-tial. A substantial proportion of executive time and resources is devoted to manage-ment development (see page 13).
To increase Skanska’s attractiveness and create a closer affinity between employees and the Company, effective from 2008 it is introducing a new long-term shareholding program, the Skanska
While the steel and concrete decks of New York City’s Triborough Bridge are being replaced, 200,000 vehicles per day are continuing to use the bridge throughout the project. Seven lanes are always open, while work is underway on the eighth. This is possible because for the first time, the construction team is using overhead bridge cranes spanning the entire roadway.
permanent presence in these markets. It ensures a highly skilled project organiza-tion by means of local and Groupwide tal-ent management programs. Profitability, safety, ethics and the environmentSkanska must act in ways that are sustain-able and responsible in the long term and meet the demands of shareholders, customers and employees, as well as society at large. Skanska’s aim is to ensure that all projects will be profitable and will also be implemented without envi-ronmental incidents, work site accidents or ethical breaches. The market- and customer-specific expertise of local units, combined with Skanska’s corporate busi-ness and control systems, the Group’s Code of Conduct and common risk management system, provide support for achieving both financial and qualitative targets. During 2007 Skanska expanded its qualitative targets, the Four Zeros, by adding a new target: “Zero defects”. After this, it has referred to its qualita-tive targets as the Five Zeros. In addi-tion, Skanska wishes to work actively to minimize climate change. Through a new “Green Construction” initiative, Skanska intends to become a leader in environ-

Skanska Review of 2007 Mission, goals and strategy 9
Skanska’s key stakeholders
• Customers
• Employees
• Shareholders
• Media and general public
• Suppliers and subcontractors
• National, regional and local government agencies
• Local residents
• Voluntary organizations
All construction projects in a community have an impact on people and environments. As a responsible company, Skanska contributes to social development, generates value and satisfies the interests of different groups.
New initiatives in 2007
During the year, Skanska took a number of new initiatives aimed at strengthening the Company’s future competitiveness. They include far-reaching investments in productivity, the environment and employee support.
The city builder – an initiative to better leverage Skanska’s broad expertise in urban construction. The aim is to take advantage of faster growth in certain metropolitan areas compared to other parts of each respective home market. Skanska can offer everything required in an urban built environment – workplaces, housing, schools and hospitals as well as various types of infrastructure.
Skanska Xchange –a pan-Nordic development project to reduce the cost of residential construction. It involves a thorough analysis primarily aimed at improving processes and increasing standardization and prefabrication.
Enhanced use of Building Information Modeling (BIM) – in which a project is described in its entirety in 3-D plus the time dimension. This facilitates planning and coordination of activities and supports improved logistics. BIM is used to streamline the entire construction process, from design and planning to purchasing and implementation.
Skanska’s green initiative – a plan to strengthen the Company’s environmental expertise and ensure it a leading role in environmental and energy conservation. The green initiative is aimed both internally and externally. Its focus is on creating both energy-efficient buildings and reduced carbon dioxide emissions.
Groupwide guidelines for the Company’s vehicle fleet which are aimed at improving fuel efficiency and thereby reducing carbon dioxide emissions.
The introduction of a new qualitative target − zero defects– aimed at strengthening the Company’s profitability and customer satisfaction. This brings Skanska’s qualitative targets to five: Zero loss-making projects, zero work site injuries, zero environmental incidents, zero ethical breaches and zero defects.
A new Skanska Knowledge Center on the Group’s intranet that includes best practices, Skanska know-how, the Project Database and collaboration networks.
A long-term shareholding program for all permanent employees – the Skanska Employee Ownership Program (SEOP) − aimed at increasing Skanska’s ability to recruit and retain qualified personnel while creating closer links between employees and the Company. SEOP is being introduced starting in January 2008.
A new Global Trainee Program designed to attract and recruit employees with a variety of educational backgrounds as well as increase ethnic and gender diversity. The first program, with 13 participants, began in 2007 and will be underway for 20 months, combining work, training and mentoring.
mentally friendly and energy-efficient construction. Its ambition, internally as well as externally, is to develop both pro-cesses and products that increase energy efficiency and reduce greenhouse gas emissions economically. This initiative should give Skanska’s local units a com-petitive advantage.

10 Financial targets Skanska Review of 2007
Gro
up
over
view
Each market and business unit has “Out-perform” targets, which provide the basis for incentive systems at various levels of the organization. Skanska has adopted new “Outperform” targets in its business plan for 2008–2010.
Operating marginThe operating margin is an important yardstick of performance in Construction and Residential Development. Margins are dependent on what type of business is being carried out, and they may also vary between different geographic markets. The “Outperform” targets for individual markets are weighed together into one target for an entire business stream.
Return on capital and equity The Residential and Infrastructure Development (ID) business streams − where Skanska invests in project develop-ment − have targets for return on capital employed. The target for adjusted return on capital employed in ID includes chang-es in market value but not exchange rate effects. For 2008–2010, the Commercial Development target is based on value creation; i.e., accrued unrealized devel-
New financial and qualitative targets
opment gains after subtracting the costs of the development organization. For the Group, there is a target for return on equity.
Qualitative targets − the 5 zeros visionIn addition to financial targets, Skanska has also adopted qualitative targets, based on the vision that operations shall take place with• zero loss-making projects − by avoid-
ing loss-making projects and unac-ceptable financial risks and selecting projects carefully (loss-making projects destroy both profitability and customer relationships)
• zero work site accidents − by guarantee-ing safety at and around job sites for employees as well as subcontractors, suppliers and the general public
• zero environmental incidents − by car-rying out projects in ways that minimize environmental impact
• zero ethical breaches − by zero toler-ance toward all forms of bribes and corruption
• zero defects − by leading to better final results and greater customer satisfaction
Some of these targets are based on specific
levels to be achieved in a given year, while others have absolutely zero tolerance − for example, “zero ethical breaches.” In addi-tion to the five zeros visions, there are also management development targets.
Remuneration connected to financial and qualitative targetsAt Skanska many employees are covered by some form of flexible salary elements or bonus. Total remuneration can be divided into fixed salary, flexible cash remuneration and the Group’s long-term incentive program, based on shares. (For more information, see Note 37, page 127.) The allocation from the latter two com-ponents is based on how well Skanska’s financial and qualitative targets have been met. The requirements in the Group’s financial target plan have been broken down in such a way that every project, district, region etc. has targets that sup-port Skanska’s overall ambitions.
If qualitative targets are not met, any flexible remuneration based on financial targets may be reduced. Such remunera-tion may be reduced by up to 50 percent if none of the qualitative targets is achieved. Capital structureCapital requirements vary between busi-ness operations. Skanska’s construction projects are mainly performed based on customer funding. As a result, in its Construction business stream, the Com-pany can operate with negative working capital. However, the equity requirement for a construction company is substantial and is related to Skanska’s large business volume and to the risks inherent in the various types of construction assignments carried out. Skanska must also take into account the financing of goodwill and the performance guarantees required in pub-licly procured projects in the U.S. market.
In the Board’s judgment, during 2008, Group equity needs to total about EUR 1.8 billion. The ambition is to invest net cash surplus for short or long periods in the Group’s three development business streams − Residential, Commercial and Infrastructure Development.
%
Rörelsemarginal i Byggverksamhet Rullande 12 månader
%
Operating margin in Construction Rolling 12 months
”Outperform” -mål 2007: 3,3%Utfall: 3,4%
0,0
0,5
1,0
1,5
2,0
2,5
3,0
3,5
4,0
Kv4 2007
Kv2 2007
Kv4 2006
Kv2 2006
Kv 4 2005
Kv 2 2005
Kv 4 2004
Kv 2 2004
Kv 4 2003
Kv 2 2003
”Outperform” target 2007: 3.3%Outcome: 3.4%
0.0
0.5
1.0
1.5
2.0
2.5
3.0
3.5
4.0
Q4 2007
Q2 2007
Q4 2006
Q2 2006
Q4 2005
Q2 2005
Q4 2004
Q2 2004
Q4 2003
Q2 2003
Skanska’s financial targets are based on an ambition that exceeds the industry norm in the Group’s respective geographic markets and within specific segments.
Financial ”Outperform” targets, 2007Group
Return on equity, target 2007 18.0%
Return on equity, outcome 2007 21.1%Residential Commercial Infrastructure
Construction Development Development Development
Operating margin, target 2007 3.3% 10.0%
Operating margin, outcome 2007 3.4% 9.4%
Return on capital employed, target 2007 18.0% 15.0%1 16.0%2
Return on capital employed, outcome 2007 14.9% 15.9%1 58.0%2
1 Including unrealized development gains and change in market value.2 Including unrealized development gains and changes in market value but excluding currency rate effects.
Financial ”Outperform” targets 2010Group
Return on equity, target 2010 20.0%Residential Commercial Infrastructure
Construction Development Development Development
Operating margin, target 2010 4.0% 12.0%
Return on capital employed, target 2010 18.0% 0.0%2
Value creation, SEK M per annum 500–7001
Corresponding to value creation, EUR M per annum 55–751
1 Accrued development gain minus expenses in the development organization, based on annual gross investments of SEK 4-5 billion (corresponding to EUR 430-540 M)
2 Including unrealized investment gains and changes in market value, excluding currency rate effects. Invested capital/investment committment of SEK 6 billion (corresponding to EUR 650 M) at the end of 2010.

Skanska Review of 2007 Risk Management 11
By focusing on selected home markets, Skanska’s local business units become thor-oughly familiar with each market and can analyze them continuously. These analyses are an integral element of the SET’s work. Construction investments in a country normally follow the trend of GDP with a time lag of one to three quarters. The amplitude of these fluctuations varies between different markets but are gener-ally larger for construction investments than for GDP. Economic cycles are not the same in all markets and segments. Some are more volatile than others. Skanska works in many markets and in many seg-ments for both public sector and private customers, which reduces the risk to its overall business.
Operational risksThe construction business is largely about risk management. Practically every proj-ect is unique. Size, shape, environment – everything varies for each new assign-ment. The construction industry differs in this way from a typical manufacturing company that operates in permanent facilities and with long production runs.
Projects are Skanska’s primary source of revenue. The Group’s profitability is dependent on the earnings of individual projects. Unforeseen risks can cause losses. One characteristic of the construc-tion business is that risks and opportuni-
Common procedures for risk management
ties are not symmetrical. A well-executed project can mean that the margin in the project may increase by one or more per-centage points. A large loss-making proj-ect, however, may result in a considerably larger negative deviation in earnings.
Given the traditionally low margins in the business, several profitable projects are thus needed in order to offset a single loss-making project.
In the construction business, opera-tional risks are substantially higher than financial risks. The Company’s ability to foresee and manage operational risks is crucial in achieving good earnings.
Projects are accounted for using the percentage of completion method. This means that earnings are recognized as costs are accrued. Each project is evaluat-ed on a quarterly basis, with adjustments in the percentage of completion being made for any changes in the estimated project completion cost.
Estimated losses in ongoing projects are recognized in their entirety on the date the estimate is made. A loss-making project that previously reported a profit must expense the entire previously rec-ognized profit. In addition, the entire estimated loss must be recognized on the same occasion. If no further changes occur, the project will then recognize zero gross income during the remainder of the construction period.
Uniform risk management systemTo ensure a systematic and uniform assessment of construction projects, Skanska uses a common procedure for identifying and managing potential risks throughout the Group. With the help of the Skanska Tender Approval Proce-dure (STAP) and the Operational Risk Assessment (ORA), Skanska evaluates construction projects continuously, from tender preparation to completion of the assignment, with regard to technical, legal and financial risks. It also analyzes a number of general “public exposure” issues − among them ethical, social and environmental aspects − in conjunction with planned projects.
Risk management is one of the cornerstones of the Company’s success as a builder and project developer. The Senior Executive Team (SET) is responsible for long-term, overall management of such strategic risks as those of a political, social or macroeconomic nature.
Skanska Tender Approval Procedure (STAP)
Go further?Abstain?
Business unit/Senior Executive Team
Business unit
Pre-ORA* evaluation • Within Skanska’s core
competency? • Are there project resources?• Right customer?• Special risks to manage?
*ORA – Operational Risk Assessment
Submit tender?Abstain?
Business unit/Senior Executive Team/Board of Directors
Business unit
Draft of tender (ORA)• Risk management• Calculations• Human resources
Execution according to contract
Monitoring and control• Financial outcome and
forecasts• Technical issues• Timetable• Feedback to ORA
Business unit/Senior Executive Team/Board of Directors
Contract negotiations
Business unit
Business unit
Final tender• Preparation• Submission
Activity
Responsible
Decision
Responsible
Order backlog EUR 15.5 bn
Project size
USD 0–15 M, 23%
USD 16–30 M, 14%
USD 31–100 M, 22%
USD >100 M, 41%
USD 0–15 M, 92%
USD 16–30 M, 4%
USD 31–100 M, 3%
USD >100 M, 1%
Number of projects

12 Risk Management Skanska Review of 2007
Gro
up
over
view
Analyses of earlier loss-making projects indicate that such factors as improper choices related to staffing and geographic location are often behind poor outcomes. Experience also shows that initial profit-ability problems tend to worsen rather than diminish over time.
The ORA process means that the prep-aration of tenders is systematized. Pos-sible new projects are analyzed in light of the core strengths of business operations, in terms of expertise, geographic market, contract types and contract size as well as available project resources. This core competence has been mapped for each local unit. Potential projects must match the established expertise profile of a unit.
The business unit carries out a risk assessment and identifies specific mea-sures for limiting risks. Then the unit, in some cases after approval by the Senior Executive Team, decides whether a tender should be submitted.
Skanska’s risk management system does not imply avoidance of all risks, but instead aims at identifying, manag-ing and pricing these risks. The support unit Skanska Project Support provides business units and the Senior Executive Team with back-up in the analysis, plan-ning, follow-up and implementation of major civil construction projects. In the early stages, for example, Skanska Project Support can make its own calculations to verify assumptions in tender calculations compiled by the various local operations. Another support unit, Skanska Financial Services, evaluates financial risks related to cash flows, customers, subcontractors and joint venture partners.
Fewer loss-making projectsIn all types of major projects that continue over a long period, Skanska conducts regular follow-up of its risk assessment. In addition, the Senior Executive Team carries out quarterly reviews of a number of projects, which altogether are equiva-lent to about one third of total construc-tion volume, loss-making projects and those projects deemed to involve special risks. Since systematic risk management work was introduced in 2002, the number
of new loss-making projects and their annual adverse impact on earnings has declined.
Risks related to material pricesIn Skanska’s operations there are many different types of contractual mecha-nisms. The degree of risk associated with the prices of goods and services varies greatly, depending on the contract type. In cases where Skanska works on a cost-plus basis, any cost increases are passed directly to the customer. In assignments for public sector customers, Skanska often has fixed-price contracts. Certain con-tracts contain indexing clauses that allow an upward revision of the contract value, equivalent to price increases.
But in some geographic markets, there is no such tradition; instead the contrac-tor is bound by the quoted price even if costs increase. To protect itself against such risks, Skanska endeavors to procure materials and approved subcontractors as soon as feasible after signing a contract. In most cases, finished agreements are in place as early as the tendering phase and are conditional on Skanska signing a con-tract with its customer. Financial risksForeign exchange risksProject revenue and costs are normally denominated in the same currency, and transaction risks from exchanges between different currencies are thus very limited. Known and budgeted financial flows are hedged. The foreign exchange risk that arises because portions of the Group’s equity are invested long-term in foreign subsidiaries is not hedged. One exception is Skanska’s American operations, where half the equity is hedged. Investments in development business streams are hedged, since the intention is to sell these assets over time.
Interest rate risksInterest rate risk is the impact on earn-ings arising from a change in interest rate. Interest-bearing assets exceed interest-bearing liabilities. This means that net financial items are favorably affected by
an increase in interest rate. At year-end 2007, the average interest refixing period for interest-bearing assets, EUR 2.1 bil-lion, was 0.1 (0.2) years and on interest-bearing liabilities excluding pension liabilities, EUR 0.4 billion, it was 0.5 (0.9) years. The size of Skanska’s interest-bear-ing pension liability, EUR 122 M (172), is largely connected to the interest rate on long-term central government debt. An increase or decrease in long-term inter-est rates leads to a decrease or increase in pension liability. Such changes are recog-nized directly in the equity of the Group. (see Note 28, page 114).
Refinancing risk and liquidityRefinancing risk is the risk caused by lack of liquidity or by difficulty in obtaining or rolling over external loans. At year end, the Group’s unutilized credit facilities totaled EUR 775 M (694) and the maturity of the borrowing port-folio, including the maturity on unutilized credit facilities, was 6.5 years (5.0).
Interest-bearing liabilities and assetsDec. 31 Dec. 31
EUR bn 2007 2006
Interest-bearing gross liabilities –0.5 –0.6
Cash and cash equivalents and interest-bearing receivables 2.1 1.7
Interest-bearing net receivables 1.5 1.1
Sensitivity of pension obligation to change in discount rate
EUR M Sweden Norway U.K. U.S. Total
Pension obliga-tions, Dec. 31, 2007 442 223 460 56 1,181
Discount rate increase/decrease1 +/–15 +/–10 +/–20 +/–451 Estimated change in pension obligation/pension liability if the discount rate changes. If
pension liability increases, the Group’s equity is reduced by about 75 percent of the increase in pension liability, after taking into account deferred tax and social insurance contributions.
Impact on the Group of a change in EUR against all currencies
EUR bn +/–10%
Revenue +/–1.38
Operating income +/–0.05
Equity1 +/–0.19The above sensitivity analysis shows in EUR bn the Group’s sensitivity to a 10% unilateral change in EUR against all currencies.
1 Refers to amount before currency hedges.
Of whichEur bn +/–10% USD+/–10%

Skanska Review of 2007 Employees 13
In recent years, Skanska has developed processes and additional methods with a focus on recruitment, greater diversity and management development.
Human resource issues are always on the agenda and are among vari-ables measured and used for assessing senior managers. For Skanska, it is vital to successfully recruit, develop and retain good employees at all levels. The Group’s profitability rests with its thousands of projects, and their success is dependent on employee performance. The need to hire capable employees, and competi-tion for their services, will increase in the coming years. According to Skanska’s new business plan for 2008–2010, each busi-ness unit is required to plan its recruit-ment needs and set targets for overall recruitment as well as diversity and professional development activities for its personnel. The planning process also includes establishing guidelines on which target groups and schools to prioritize in recruitment efforts.
Skanska’s improved financial results in recent years, combined with its qualitative targets, have strengthened the Group’s attractiveness among university-level stu-dents and recent graduates in particular. According to national surveys, students in Norway, the Czech Republic, Poland and Sweden view Skanska as the most attractive construction company. Such aids as the Recruiting Toolbox, found on the Skanska intranet, enable units to exchange experience and share successful strategies for increasing the influx of job applicants.
Recruiting and retaining employees Many current employees are approach-ing retirement and the supply of experi-enced management is limited. Skanska
Recruitment, increased diversity, managementdevelopment
has taken various initiatives to increase its attractiveness, including a focus on broadening its recruitment base and increasing diversity. Starting in 2008, Skanska is introducing a new long-term Skanska Employee Ownership Program (SEOP) intended for all employees, for the purpose of creating greater affinity with the Company. The Skanska Unlimited exchange program is being launched dur-ing 2008 mainly to provide professional development and stimulation to younger employees who have worked at the Com-pany for some years. The Global Trainee Program is also continuing, with a second round of trainees accepted in 2008.
As for talent management, Skanska’s annual evaluation of future managers − the Talent Review − plays a key role. This review enables the Company to examine and take steps to address both individual development needs and whether a given employee is in the right position. Mean-while the Talent Review provides a basis for selecting candidates for higher positions. According to Skanska’s Great Boss con-cept, good managers are a crucial factor in recruiting as well as retaining and profes-sionally developing employees.
Senior executives visit all markets Teamwork and the creation of closer ties among employees and affinity with Skanska are fundamental in fostering good leadership at all levels. During 2007, some 7,000 employees had the opportu-nity to meet and discuss various issues with the CEO as well as other members of the Senior Executive Team. Their tour brought them to 45 locations and covered all of Skanska’s geographic markets.
For many years, the Company has identified and provided professional development for people in leadership
positions. Every year, more than 70 employees from throughout the Group attend the Skanska Top Executive Program (STEP), provided in collabora-tion with the business school IMD in Switzerland. In addition, numerous employees with leadership potential attend advanced human resource develop-ment programs at local business units.
Analyzing development needsFor many years, all local business units have carried out employee surveys aimed at measuring job satisfaction and the need for human resource development, as well as tracking how many people are hired and how many leave the company, respectively. A Groupwide measurement standard has been developed to provide comparable data. The surveys have also been broad-ened to cover all white collar employees and certain skilled workers. The purpose is to better understand employee needs, demands and wishes and to enable Skanska to increase employee motivation to remain in the Company.
Broadened recruitment means greater diversityThe initiatives to strengthen recruitment and ensure Skanska’s long-term supply of skilled personnel introduced in 2006 continued in 2007. Skanska attaches great importance to broadening its recruitment base in terms of educational or occupa-tional background, gender and ethnicity.
For many years, male engineers have been the dominant employee category at Skanska. To harmonize with society at large and with its own customer profile, Skanska needs to increase the diversity of its workforce. This enriches the Company by adding experience from other indus-tries, academic disciplines and cultures.
Recruitment, professional development and retention of employees are high-priority tasks for both Group executives and local business units.
Of whichEur bn +/–10% USD+/–10%

14 Employees Skanska Review of 2007
Gro
up
over
view
Åldersfördelning 2007
< 29 år, 22%
30–39 år, 26%
40–49 år, 25%
50–59 år, 21%
> 60 år, 6%
Age distribution 2007
< 29 years old, 22%
30–39 years old, 26%
40–49 years old, 25%
50–59 years old, 21%
> 60 years old, 6%
Meanwhile the Company increases its ability to build up a larger pool of employ-ees as a base for future management development. This is why Skanska is also seeking future employees outside the tra-ditional ranks of male engineers. In addi-tion, a broadened recruitment base means that the Company will be less dependent on hiring new engineering graduates, who will be a shrinking resource in relation to the needs of the business sector.
Women in management positionsTo meet its requirements and achieve a more even gender balance, Skanska needs more women at all levels, especially in line positions. A number of women are work-
tions, about 40 percent of new engineer-ing graduates hired were women, for the second consecutive year. This exceeded the target, which had been set at 35 per-cent. Another target was also achieved: ensuring that the percentage of female engineers leaving Skanska of their own volition is no higher than the correspond-ing percentage of male engineers who do so. The initiative has now been expanded and has become part of planning at addi-tional business units. The experience of Skanska and other companies shows that a higher percentage of women in the orga-nization also opens the way to increased diversity in other respects. A tolerant, open environment benefits the recruit-ment and retention of people with differ-ent ethnic and educational backgrounds.
Employee turnoverA certain degree of employee turnover is unavoidable and is also an indication that Skanska has attractive personnel. Although the economic situation in most markets has led to tough competition for both new university-level graduates and experienced employees, the Company has successfully kept employee turnover under control. Naturally this varies from one business unit to another, but generally speaking, recruitments have increased more than departures. One challenge is to achieve a good balance in age distribu-tion. Today numerous Skanska employ-
ing at project manager level, but the pro-portion of women in management posi-tions is still very low. Networks are a key instrument for strengthening underre-presented employee categories. In Sweden there is a network for exchange of experi-ence between women project managers. Similar networks also exist in a number of other countries. During 2008, Skanska is introducing a Groupwide network for women in management positions.
Women − 40 percent of newly recruited engineers in SwedenEfforts to increase the Company’s diver-sity are being carried out at all units. In Skanska’s Swedish construction opera-
Skanska’s profitability is generated by its employees in thousands of projects
Each year some of Skanska’s top-performing employees are honored with the Golden Hard Hat award, established in 2005 to focus attention on key individuals who not only meet but surpass “Outperform” targets. The 2007 winners were, from the left: Tony Taddeo, Skanska USA Civil, winner in the Estimator category; Erik Olsen, SkanskaResidential Development Nordic, winner in the category Project Manager Development Units; Viktor Petras, Skanska CZ, winner in the Production Manager category; and Adam Grotowski, Skanska Poland, who won in the Project Manager category.
Female employees at Skanska1
% 2007 2006
Skilled workers 2 2
White collar employees 24 23
Skanska AB Board2 11 22
Senior executives 12 11
Total 11 101 These employee figures are based on annual averages.2 Refers to members elected by the Annual meeting. If employee
representatives are included women account for 20 (27) percent.

Skanska Review of 2007 Employees 15
Recruitment of students and trainees
Skanska has both local and international trainee programmes. Like most other units, for many years Skanska Poland has recruited employees directly from universities and institutes of technology in its local markets. In Poland there is also a local trainee program that is highly appreciated among Polish students. Early in 2007, a new Skanska Global Trainee Program also started up. From a pool of 900 applicants, 13 trainees were selected for the 20-month long program. Of those accepted, four are women and eight have an educational background other than undergraduate engineering. The program combines work, training and guidance by mentors at Skanska Sweden, Skanska Czech Republic, Skanska UK, Skanska USA Building, Skanska Infrastructure Development and Skanska Commercial Development Nordic. The program is continuing during 2008, with 25 new trainees being accepted for the second round.
ees are over 50 years old. If the share of employees in the 30–40 age range is too small, this may limit the supply of candi-dates for the next generation of managers.
Employee retention effortsDue to the Company’s age structure, many employees will reach retirement age in the next several years. One major challenge is to bridge the generation gap and ensure transfer of knowledge between experienced employees approaching retirement and younger employees who will assume leadership roles.
An initiative to retain expertise as long as possible is underway in Skanska’s Norwegian operations. A number of employees aged 60 or older with at least five years working in the Company have been offered individual solutions that enable them to keep working. The aim is to utilize their experienced strengths in various positions, especially when it comes to advising and mentoring younger employees. To make this job extension period attractive, Skanska has created specially adapted employment conditions.
Keeping the expertise in projectsIt is vital both to Skanska’s operations and to individual employees that there are opportunities to pursue a career at the same time as expertise can be kept in proj-
ects. Career advancement has tradition-ally meant that highly skilled employees leave their jobs in the field and move into offices. This is not optimal, since many employees are both needed and enjoy working in or near projects. Meanwhile, many highly proficient employees want professional development, new challenges and a career path. In a number of geo-graphic markets, Skanska has thus estab-lished the Dual Career Track, enabling them to combine overall responsibility for results with more direct construction responsibility. Skanska is applying such a model in the U.S. In Sweden, managers of large projects enjoy the same status as senior managers in terms of salary, title and level in the organization. In the Czech Republic, Skanska also applies a system that enables project managers to pursue a career while remaining in production.
Advanced training and safetyEfforts to retain and foster professional development of employees include both skill-enhancing specialized training and steps to safeguard employee health, safety and job satisfaction.
The zero-accident work siteDuring 2007 Skanska has mobilized fur-ther resources, both at the corporate level and at business units, to improve safety at
work sites. One health and safety initia-tive is Safety Week, which has been car-ried out Groupwide every autumn for the past four years. Its purpose is to focus on safety activities with a goal of zero-acci-dent work sites. This is one of Skanska’s qualitative targets. Another example is group warm-up exercises, which take place at the beginning of the working day. In many projects, “stretch and flex” exer-cises have helped decrease back problems among employees, for instance.
Learning-oriented gamesA project simulation game to increase awareness of the complex interrela-tionships in projects is one example of advanced employee training. This game was developed in Sweden but is now being used in a number of markets. Skanska also uses it to provide part of the instruction in certain courses at the Royal Institute of Technology in Stockholm. A special three-year training program called Skanska University is pro-vided in Poland, with a focus on training in leadership, business skills and personal development. So far this initiative, which began in 2003, has involved more than 2,400 employees, who have undergone about 13,700 training days in all. The project is 50 percent financed by grants from the European Union.

16 Share data Skanska Review of 2007
Gro
up
over
view
Share data
The overall market capitalization of Skanska amounted to SEK 51.1 billion (corresponding to EUR 5.4 billion) during the year.
Skanska’s Series B shares are quoted on the OMX Nordic Exchange Stockholm and are traded under the SKA B sym-bol in round lots of 200 shares. Cur-rent price information is available on www.skanska.com/investors, in the Reuters system under the SKAb.ST sym-bol or the - Bloomberg system under the SKAB SS symbol. At the end of 2007, a total of 423.1 million shares were out-standing, with a quota value (formerly par value) of SEK 3 per share (corresponding to EUR 0.32 per share). Of the shares outstanding, 22.5 mil-lion were Series A shares with 10 votes apiece, 396.1 million were Series B shares with one vote apiece and 4.5 million were Series D shares with one vote apiece. Series D shares are held by Skanska, which may not exercise its voting right. Of the shares in circulation, Series B shares accounted for 93.6 percent of share capital and 63.4 percent of voting power. During 2007, Skanska shares traded on the OMX Nordic Exchange Stockholm totaled 654.9 (541.4) mil-lion, at a value of SEK 92.0 billion (66.3) (corresonding to EUR 9.9 billion [7.2]). Average volume per trading day totaled 2.6 million shares, up 21 percent from an average volume of 2.2 million shares during 2006. Trading volume during 2007 was equivalent to 165 (135) percent of the total number of Series B shares at the end of the year.
Share performanceDuring 2007 the market price decreased by 9.6 percent to SEK 122.00 per share (corresponding to EUR 12.91 per share) as the final price paid. The overall market capitalization of Skanska thus decreased during the year to SEK 51.1 billion (corre-sponding to EUR 5.4 billion). The highest price paid for a Skanska share was SEK 165.50 (corresponding to EUR 17.52) on June 4. The lowest price paid was SEK 110.25 (corresponding to EUR 11.67) on November 20. The Stockholm all share index, now called OMX Stockholm_PI (OMXSPI), decreased by 6.0 percent during 2007. The Dow Jones Titans Con-struction Index, which includes Skanska, rose by 8.6 percent. Skanska’s Series B shares are also included in the
Dow Jones Stoxx 600, Dow Jones Stoxx 30 Nordic, S&P Global 1200 and S&P Europe 350, among others.
Ownership changesAt the close of 2007, the number of share-holders totaled 75,815 (75,763). The pro-portion of share capital owned by Swedish shareholders increased during the year from 69.5 percent to 73.6 percent, and their share of voting power from 75.9 per-cent to 78.7 percent. Of shareholders outside Sweden, U.S. residents made up the largest group, with about 44 million shares representing just above 10 percent of share capital. At year-end, Swedish institutional owners accounted for 57 per-cent of shares, while 16 percent were owned by Swedish private individuals. Industrivärden has the largest proportion of share capital, 8.0 percent, as well as the largest number of votes, with 27.1 percent of total voting power. The “free float” in Skanska’s shares is regarded as making up 100 percent of the number of Series B shares outstanding.
Capital structure and dividend policyEquity after the proposed dividend shall be equivalent to 13 percent of the previ-ous year’s revenue in the Construction business stream. Surplus equity may be distributed to the shareholders. It is esti-mated that such a dividend can amount to 50–80 percent of profit for the year. In the judgment of the Board of Directors, dur-ing 2008 the Group’s equity needs to total about EUR 1.8 billion.
DividendThe Annual Meeting adopted a regular dividend of SEK 5.25 (4.75) per share (corresponding to EUR 0.56 [0.53] per share) and an extra dividend of SEK 3.00 (3.50) per share (corresponding to EUR 0.32 [0.39] per share) for the 2007 financial year, totaling SEK 8.25 (8.25) per share (equivalent to EUR 0.88 [0.92] per share). This was equivalent to a total dividend payout of SEK 3,453 M (3,453) (corresponding to EUR 365 [382]).
Total returnThe total return of a share is calculated as the change in share price, together with the value of reinvested dividends.
During 2007, total return on a Skanska share amounted to –4.7 percent. The Stockholm Stock Exchange’s SIX Return Index decreased by 2.6 percent during the year. During the five-year period January 1, 2003 to December 31, 2007, the total return on a Skanska share amounted to 203 percent. During the same period, the SIX Return Index rose by 176 percent.
Share ownership programThe new Skanska Employee Ownership Program (SEOP), intended for all per-manent employees, is being introduced starting in 2008. The program runs for three years, 2008–2010. The program gives employees the opportunity to invest in Skanska shares while receiving incen-tives in the form of possible allocation of additional share awards. This allocation is predominantly performance-based.
Share capital by shareholder category
Swedish companies and institutions, 42%
Shareholders outside Sweden, 27%
Private individuals in Sweden, 16%
Public sector, 5%
Other shareholders in Sweden, 6%
Relief and interest organizations, 4%Source: VPC
Share capital by size of holdings
1–500, 2%
501–1,000, 3%
1,001–5,000, 7%
5,001–10,000, 3%
10,001–15,000, 2%
15,001–20,000, 1%
20,001–, 82%Source: VPC
Total, SEK bn
0
2
4
6
8
10
Transfer of capital to Skanska's shareholders
Regular dividend per share, SEK
Extra dividend, SEK
2004 2005 2006 2007 2008
SEK
1.3 1.7 2.7 3.5 3.5

Skanska Review of 2007 Share data 17
Skanska B
SIX Construction Index(c) FINDATA
Skanska share price movement, January 1, 2003–January 31, 2008
OMX Stockholm_PI
Monthly trading volume, thousands (incl. after hours trading) right-hand scale
Skanska B
SIX Bygg & Anläggningsrelaterat
(c) FINDATA
Kursutveckling Skanska-aktien 1 januari 2003–31 januari 2008
OMX Stockholm_PI
Omsatt antal aktier 1 000-tal (inkl efteranmälda) höger axel
20 000
40 000
60 000
80 000 60
80
100
120
140
160
35 2003 2004 2005 2006 2007 2008
Kr 180
100 000
20,000
40,000
60,000
80,000 60
80
100
120
140
160
35 2003 2004 2005 2006 2007 2008
SEK 180
100,000
50
100
150
200
2003 2004 2005 2006 2007 2008
Totalavkastning i Skanska-aktien jämfört med SIX Return Index (avkastningsindex) 1 januari 2003–31 januari 2008
Skanska B (inklusive utdelning)
SIX Return Index(c) FINDATA
30
Kr
250
Total return of Skanska shares compared to the SIX Return Index, January 1, 2003–January 31, 2008
Skanska B (including dividend)
SIX Return Index(c) FINDATA
50
100
150
200
2003 2004 2005 2006 2007 200830
SEK
250
Major listed construction companiesAbsolute
return
Total return
Total return Market
capitalization,
Revenue, Income after
financial items,
Return on
Return on capital
2007, % 2007, % 2003–2007, % EUR bn EUR bn1 EUR M1 equity,%1 employed, %1
AMEC (United Kingdom) 99 104 598 2.3 4.7 –160 44.2 9.0
ACS (Spain) –5 –2 339 14.3 14.1 1,644 40.1 7.1
Balfour Beatty (United Kingdom) 13 16 306 1.8 6.6 183 24.5 26.1
Bilfinger Berger (Germany) –6 –5 325 1.9 7.5 173 7.7 8.2
Bouygues (France) 17 20 232 19.8 26.4 1,655 23.3 12.1
FCC (Spain) –33 –32 177 6.7 9.5 887 20.5 9.7
Ferrovial (Spain) –35 –34 117 6.7 12.2 678 40.7 3.6
Fluor Corp. (USA) 79 80 456 8.8 11.2 305 15.2 19.9
Hochtief (Germany) 66 68 721 6.4 15.5 338 4.9 6.7
NCC (Sweden) –26 –20 290 1.6 6.0 245 25.1 21.2
Royal BAM Groep (Netherlands) 7 10 626 2.1 8.6 228 19.8 11.2
Skanska (Sweden) –10 –5 203 5.4 13.6 539 20.5 22.6
Vinci (France) 5 7 346 24.7 25.6 2,032 16.3 9.41 Refers to 2006 Source: Reuters Company Views
Equity and adjusted equityEUR bn 2007 2006 2005
Equity attributable to equity holders 2.2 2.1 2.0
Unrealized Commercial Development gains1 0.3 0.2 0.2
Unrealized Infrastructure Development gains1 0.6 0.4 0.3
Adjusted equity 3.1 2.7 2.4
Equity per share, EUR 5.19 5.07 4.70
Adjusted equity per share, EUR 7.42 6.42 5.741 Less 10% standard corporate tax
Skanska share history2007 2006 2005 2004 2003
Year-end market price, SEK 122.00 135.00 121.00 79.75 63.50
Corresponding to year-end market price, EUR 12.91 14.93 12.89 8.86 7.00
Year-end market capitalization, SEK bn 51.1 56.5 50.6 33.4 26.6
Corresponding to year-end market capitalization, EUR bn 5.4 6.2 5.4 3.7 2.9
Average number of shares for the year, million 418.6 418.6 418.6 418.6 418.6
Highest share price during the year, SEK 165.50 136.50 125.50 83.75 65.00
Corresponding to highest share price during the year, EUR 17.52 15.10 13.37 9.31 7.17
Lowest share price during the year, SEK 110.25 98.50 79.00 57.50 38.10
Corresponding to lowest share price during the year, EUR 11.67 10.89 8.41 6.39 4.20
Yield, percent1 6.8 6.1 5.4 5.0 4.71 Dividend as a percentage of respective year-end share price.
Shares by category (series) on December 31, 2007
Series No. of shares % of capital % of votes
A 22,464,731 5.3 35.9
B 396,088,341 93.6 63.4
D1 4,500,000 1.1 0.7
Total 423,053,072 100.0 100.01 Skanska’s holding.
Change in shares outstanding (millions) and capital stock
Year and eventReduc-
tionStock
dividend
New share issue
Shares out-standing
Par value of capital stock,
EUR M
2001 cancellation of repurchased shares –9.2 – – 104.7 138.5
2001 split 4:1 – 314.0 – 418.6 138.5
2006 new share issue, Series D shares 4.5 423.1 139.9
The largest shareholders in Skanska AB, ranked by voting power, Dec. 31, 20071
Shareholders, excluding Skanska’s own holdings
Series A shares
Series B shares
% of votes
% of capital
Industrivärden (investment co.) 15,010,700 18,315,000 27.1 8.0
AMF Pension and AMF Pension Funds
0
26,675,317
4.3
6.4
SHB Pension Foundation 1,600,000 2,800,000 3.0 1.1
Swedbank Robur Funds 0 14,380,094 2.3 3.4
Svenska Handelsbanken (SHB) 1,000,000 2,555,802 2.0 0.8
SEB Funds 0 11,645,477 1.9 2.8
AFA Insurance 0 11,319,405 1.8 2.7
Alecta (retirement insurance co.) 0 11,012,000 1.8 2.6
SHB Pension Fund 1,000,000 0 1.6 0.2
SHB/SPP Funds 0 9,039,679 1.5 2.2
10 largest shareholders in Sweden 18,610,700 107,742,774 47.3 30.2
Other shareholders in Sweden 1,454,579 180,417,921 31.4 43.4
Total shareholders in Sweden 20,065,279 288,160,695 78.7 73.6
Shareholders outside Sweden, of which 2,399,452 107,927,646 21.3 26.4
SIS Segaintersettle AG/Zurich 2,077,996 2,915,540 3.8 1.2
State of New Jersey Pension Fund 0 7,000,000 1.1 1.7
Total 22,464,731 396,088,341 100.0 100.01 Not including Series D shares Sources: VPC AB and SIS Ägarservice.

18 Construction Skanska Review of 2007
Busi
ness
str
eam
sVerksamheter
Husbyggande, 57% Anläggnings-
byggande, 35% Bostäder, 4% Service, 4%
Stat & kommun, 39%Institutioner1), 12% Företag, 23% Kommersiella fastig-
hetsutvecklare, 14% Bostäder, 4% Övrigt, 8%
1) Främst hälsovård och utbildning i privat regi
Tidsfördelning
Produktion under 2008, 62%
Produktion 2009–, 38%
Sverige, 15% Övr. Norden, 13% Övr. Europa, 32% USA, 37% Latinamerika, 3%
Geografisk fördelning Kundstruktur
Orderstock, 146 Mdr kr
Operations
Building con- struction, 57%
Civil con- struction, 35%
Residential, 4% Service, 4%
Government, 39%Institutional1, 12% Corp. Industrial, 23% Commercial
Development, 14% Residential, 4% Other, 8%
1 Mainly private healthcare and educational institutions.
Sweden, 15% Other Nordic
countries, 13% Other European
countries, 32% USA, 37% Latin America, 3%
Duration
Construction in 2008, 62%
Construction in 2009-, 38%
Geographic area Customer structure
Construction order backlog, EUR 15.5 bn
Construction“Outperform” target achieved
Busi
ness
str
eam
s EUR M 2007 2006
Revenue 14,322 12,829
Operating income 480 361
Operating margin, % 3.4 2.8
Capital employed 35 280
Working capital/revenue, % –9.3 –9.5
Operating cash flow from business operations1 933 362
Order bookings 15,822 14,495
Order backlog 15,468 14,942
Number of employees 59,180 54,4801 Before taxes, financing operations and dividends

Skanska Review of 2007 Construction 19
kanska’s strategic focus on boosting profit-ability in construction operations remained successful during 2007. Strict risk manage-ment as well as analysis and careful project selection are among the important reasons behind improved profitability. The Com-pany’s earnings were thus affected to a
lesser extent by project losses. In the future, greater productivity in construction will help the business stream to improve profitability. During the year, new initiatives were taken to further improve the efficiency of the construction process. Skanska Xchange aims at increasing standardization in design and selection of methods and materials, thereby lower-ing construction cost. These efforts are primarily aimed at residential construction. Improved planning is another element of efficiency improvement. Computer-aided systems such as Building Information Modeling (BIM) are used in order to streamline the entire construction process, from design and planning to purchasing and execution. The mission of the Construction business stream is to offer services in non-residential building and civil construction as well as residential construction. The business stream also performs assignments of a service nature: construction-related services, repairs and the like as well as operation and maintenance of industrial and transportation facilities. Operations focus on serving corporate and institu-tional customers as well as public agencies. By virtue of its size and leading position, Skanska can undertake the largest, most complex assignments for the most demand-ing customers. Construction business units also perform contracting assignments for Skanska’s other business streams, which develop commercial space, residential projects and pub-lic-private partnerships (PPP) related to infrastructure. This collaboration generates both large construction assignments and synergies. Order backlog, totaling EUR 15 billion at the end of 2007, is divided among several thousand projects. Non-residential building construction accounts for 57 percent, civil construction 35 percent and residential construction 4 percent of order backlog for the business stream. The remaining 4 percent consists of services. At
Construction, which is Skanska’s largest business stream, achieved its “Outperform” target for 2007. The consolidated construction margin, which amounted to 3.4 percent, has increased for three consecutive years. To ensure a continued good profitability trend, the Group is implementing measures to improve planning, increase productivity and improve consolidated purchasing. Order bookings have been very good, and in most markets Skanska is close to its capacity ceiling. The supply of employees and control of price increases are pivotal issues.
year-end, the part of backlog that Skanska plans to exe-cute in 2008 corresponded to 69 percent of 2007 revenue.
A leading builder in selected marketsThe Construction business stream operates in a number of selected home markets – Sweden, Norway, Finland and Estonia, Poland, the Czech Republic and Slovakia, the U.K., the U.S. and Latin America.
In its selected markets, the Skanska Group is regarded as one of the leaders or as having the potential to become a leader in terms of size and profitability. Skanska also endeavors to be a leader in its industry in sustainable development as well as ethics, health and safety.
The Group’s primary goal is to increase its profitabil-ity. Growth in its business units is prioritized only when financial targets are achieved.
Local conditionsConditions vary between home markets, and the opera-tions of Skanska’s local business units thus differ. Some specialize in selected market segments, while others operate in a broader spectrum. The earnings at Skanska’s construction units must be evaluated in light of local market conditions, the segments in which these units operate and varying contractual mechanisms.
Non-residential, civil and residential constructionNon-residential and residential building construction is generally characterized by high capital turnover, limited capital employed and low margins.
Civil construction projects are usually underway for longer periods, have a higher risk profile and are more capital-intensive. They consequently have a somewhat higher margin.
The Company’s risk management processes are aimed at identifying and managing operational risks and thereby helping ensure higher profitability. Risk analysis is carried out before deciding on a tender or commitment and then continuously during the implementation phase. This is both a matter of avoiding risks that may generate costs and of ensuring that the Company is compensated for the risks that it chooses to assume (see page 11).
During 2007, Skanska’s Construction units per-formed EUR 378 M worth of work for projects in the Residential Development business stream. The cor-
Rapid urbanization around Atlanta, Georgia, is increas-ing the need for water supply and wastewater treatment. In Douglasville, Skanska is build-ing the South Central Waste Water Treatment Plant. It is also building major water projects in New York; Tampa, Florida, and elsewhere in the U.S.
A fresh new working environment reflecting green values26
Worksite health and safety issues are top priorities20
A trendy shopping mall and student residential units22
S

20 Construction Skanska Review of 2007
Busi
ness
str
eam
s
responding figure for projects in Commercial Develop-ment was EUR 162 M. For projects in Infrastructure Development in which Skanska is a co-owner, Construction units performed assignments worth EUR 778 M. Project opportunities are also created by taking advantage of the Group’s financial expertise. Skanska Financial Services often helps arrange financing solu-tions for certain types of projects.
Size provides competitive advantagesSkanska’s size enables it to compete for large, complex projects for international customers with strict standards of quality and execution. In the very largest projects, which require high-level performance guarantees, few competitors can measure up to Skanska in expertise and strength. This leads to increased opportunity for higher profit margins. Customers that operate in more than one market, such as the pharmaceutical company Pfizer and the oil and gas company StatoilHydro, can be offered the same service in all of the Group’s home markets via Skanska’s network of local business units. Due to a selective approach when choosing possible projects, especially when it comes to lump-sum bidding, the Company is increasingly distancing itself from proj-ects with low margins or projects where high risk is not offset by higher compensation. Skanska’s ambition is to enlarge the share of its projects which are negotiated con-tracts, where customers value service as well as price. The Company’s clear emphasis on its qualitative targets, the Five Zeros, is a distinguishing factor.
Focus on safetyWorkplace health and safety are extremely important areas for Skanska. Construction sites unavoidably involve various risky aspects, for example working high above the ground or with heavy lifting. The frequency of injuries in the construction industry has traditionally been higher than in manufacturing industry, which has more easily been able to build up safety systems and safe procedures. For some years, Skanska has engaged in a focused effort to create safe working environments in order to reduce the risks of accident and injury at construction work sites. This effort includes the introduction of more systematic safety-mindedness, various types of physi-cal safety arrangements, requirements to wear safety equipment and training of skilled workers and other per-sonnel. The long-term target is to carry out operations entirely without accidents. The frequency of accidents has declined in recent years.
Greater efforts to improve efficiencyOne important factor in the Company’s profitability is improving construction efficiency and boosting pro-ductivity. By increasing the degree of industrialization in the construction process, an ever-larger proportion of each project will be built using standardized com-ponents that have been prefabricated. This effort will take time but success in this area will have a bearing on many parameters in the construction process. The time spent on-site will decrease, which means reduced costs. In addition, quality increases and workplace health and safety improve when more and more items can be manu-factured in a factory setting instead of at the job site.
Worksite health and safety are top priorities. All Skanska business units make major efforts to minimize accidents and injuries.
The largest Nordic contractors, sales, June 30, 20071
Company Country EUR bn
Skanska Sweden 14.2
NCC Sweden 6.4
YIT Finland 3.5
Peab Sweden 3.2
Veidekke Norway 2.2
Lemminkäinen Finland 1.9
MT Højgaard Denmark 1.61 Rolling 12 months.Sources: Half-year report of each respective company.
The largest global contractors1, sales, June 30, 20072, 3
Company Country EUR bn
VINCI France 28.0
Bouygues France 27.8
Grupo ACS Spain 18.5
Hochtief Germany 16.5
Bechtel USA 15.7
Skanska Sweden 14.2
Fluor USA 11.4
Centex, Dallas USA 9.21 Excluding Asian construction companies. 2 Rolling 12 months.3 Including non-construction-related operations.Sources: Reuters Company Views, half-year report 2007 of each respective company.
Skanska’s home markets, 2006GDP per
capita USDConstruction
per capitaConstruction as % of GDP
Sweden 42,179 3,223 7.6
Norway 72,430 7,931 10.9
Denmark 50,931 6,711 13.2
Finland 39,994 5,747 14.4
Poland 8,940 900 10.1
Czech Republic 13,884 2,112 15.2
United Kingdom 39,630 4,195 10.6
United States 44,024 3,984 9.1
Argentina 5,455 224 4.1Sources: National construction trade organizations and analysts. EcoWin. IMF

Skanska Review of 2007 Construction 21
Coordinated purchasing reduces costsGreater standardization is also an important element of purchasing work. Since a large share of project costs consist of purchased goods and services, the Group also aims at achieving economies of scale by coordinating its purchases. Standardization of product ranges and focused pur-chasing work are initiatives that Skanska has taken in order to lower costs and thereby enhance competitive-ness and customer benefit. Coordinated purchasing is a way of aggregating purchasing volume and enables Skanska to take advantage of its savings potential and improve quality. Skanska has signed favorable global, national and regional purchasing contracts with selected suppliers of certain key products. During 2007, the Company signed new contracts with substantially improved conditions for such products as steel, elevators, doors, kitchen equip-ment and computers as well as for leasing of cars and light trucks. Global contracts for heavy vehicles, excava-tors and tools were signed previously. In Scandinavia, Skanska also signed a contract with four suppliers of building materials.
Percentage of completion methodProjects are accounted for using the percentage of com-pletion method. This means that earnings are recognized as costs are accrued. Each project is evaluated on at least a quarterly basis, with adjustments in the percentage of completion being made for any changes in the estimated project completion cost. Estimated losses in ongoing projects are recognized in their entirety on the date when it becomes clear that they will occur. A loss-making project that previously report-
Environmentally sound constructionWhile Skanska was building the Clarion Hotel Sign, Stockholm’s biggest hotel, a large propor-tion of building materials were delivered by railroad directly to the site.
Markets in Construction
Revenue
Operating income
Operating margin, %
Order bookings Order bookings/
revenue, %
Order backlogEUR M 2007 2006 2007 2006 2007 2006 2007 2006 2007 2006 2007 2006
Sweden 2,961 2,607 138.8 118.9 4.7 4.6 3,168 2,973 107 114 2,333 2,179
Norway 1,379 1,149 59.9 48.1 4.3 4.2 1,434 1,337 104 116 1,180 1,074
Denmark 350 413 0.2 –34.4 0.1 –8.3 324 405 92 98 20 223
Finland 1,054 906 42.8 20.6 4.1 2.3 1,057 1,040 100 115 801 775
Poland 854 738 39.8 29.1 4.7 3.9 582 612 68 83 411 647
Czech Republic 1,233 1,219 51.8 35.9 4.2 2.9 1,010 1,262 82 104 1,265 1,448
United Kingdom 1,912 1,331 33.2 44.5 1.7 3.3 1,965 2,561 103 192 3,259 3,516
USA Building 2,938 2,998 31.9 29.9 1.1 1.0 3,740 2,712 127 90 3,336 2,889
USA Civil 1,171 1,062 58.7 49.7 5.0 4.7 1,911 1,199 163 113 2,381 1,888
Latin America 470 406 23.5 18.2 5.0 4.5 632 394 134 97 482 303
Total 14,322 12,829 480.5 360.5 3.4 2.8 15,822 14,495 110 113 15,468 14,942
Denmark
USA Building
100%
0%
0%
100%
0%
0%
Finland
USA Civil
75%
15%
10%
0%
100%
0%
United Kingdom
Norway
71%
29%
0%
73%
12%
15%
Poland
Latin America
31%
69%
0%
0%
78%
22%
Sweden
Czech Republic
Building construction Civil construction Service
66%
34%
0%
38%
62%
0%
Breakdown of order backlog, EUR 15.5 bn

22 Construction Skanska Review of 2007
Busi
ness
str
eam
s
The former Stockholm Tax Authority Skyscraper now features a trendy shopping mall and student residential units. Renovated, opened up and renamed Skrapan (The Scraper), it is topped by a restaurant and bar with one of the city’s best views.

Skanska Review of 2007 Construction 23
“Skanska’s construction operations in Sweden, Norway and Finland all achieved very good earnings and reached their ‘Outperform’ targets during 2007.”
Skanska’s Danish construction operations were dis-continued during 2007, leaving only a small number of projects that are being completed in Skanska’s name. No new assignments will be accepted. Experience has shown that the conditions for achieving the Company’s “Out-perform” targets are less than favorable, due to the special nature of the Danish market. Most of the Danish unit’s employees are continuing to work under new auspices.
Sweden, Norway and Finland achieve targetsSkanska’s construction operations in Sweden, Norway and Finland all achieved very good earnings and reached their “Outperform” targets during 2007. Underlying fac-tors are improvements in project implementation and in the market, which was strong. Because of the large quan-tity of projects in the market, the construction industry was working at close to its capacity ceiling.
Retailing was one of the stronger market segments in the Nordic countries during 2007. This mainly involved extensions of existing retail centers. The market for new office building construction also improved in Sweden and Norway. Residential construction, which for a time was the strongest segment in all of Skanska’s Nordic con-struction markets, has decelerated.
Good outlook for 2008In 2008 the markets for retail and industrial space are expected to be stable, along with demand for office build-ings and various health care facilities. The underlying need for housing also remains large, but the number of units started during the year will be affected by financial market turmoil. In civil construction, the potential for an improved market is considered good. Several large transportation infrastructure projects that were delayed due to financing problems are expected to be put out for bidding during 2008.
The market for public-private partnership (PPP) projects will eventually grow in the Nordic countries, although this process will occur slowly. Interest in PPP projects is based on the fact that long-term ownership and operating responsibility create a strong incentive for economically and environmentally sustainable solu-tions. In Sweden, there are still hopes that portions of major transportation infrastructure needs will be solved through public-private partnerships.
Skanska’s main competitors in the Nordic markets are NCC, Peab, JM, Veidekke, YIT as well as Germany’s Bilfinger Berger.
Central Europe – strong civil construction marketIn the Central European markets where Skanska operates − Poland, the Czech Republic and Slovakia − the Group’s construction units specialize in housing, public sector and commercial premises and infrastructure.
Strong market for commercial space in PolandThe Polish business unit achieved its “Outperform” targets for 2007. In Poland, commercial space for such international companies as consumer goods manufac-turer Proctor & Gamble and the retail chain Lidl is an important segment. During 2007 Skanska completed Złote Tarasy − a major shopping mall and office cen-ter in downtown Warsaw − and the first phase of the A1 highway at Gdansk, a PPP project. The strong Polish construction market led to major price increases. Labor shortages are another risk factor, but Skanska Poland’s supply of human resources is being ensured by a number
ed a profit must expense the entire previously recognized profit. The entire estimated loss must also be recognized. All else being equal, the project will then recognize zero gross profit for the remainder of the construction period.
MarketsThe Nordic countries – strong earnings in Sweden and Norway Skanska’s operations in the Nordic markets – Sweden, Norway and Finland including Estonia – encompass a broad spectrum of construction services. The largest product segments in the Nordic countries consist of new construction of homes, offices, industrial facilities, retail centers, hotels and infrastructure − mainly for the trans-portation sector − as well as various types of renovations and construction services.
Skanska’s Nordic construction units carry out thou-sands of projects each year. Many projects are small or medium-sized. But the construction units also signed a number of large contracts during 2007. The largest was for an underwater parking garage in central Oslo. The order was worth EUR 95 M. Skanska Norway also received several assignments with a contract value of about EUR 54 M, among them a railroad expansion, a combined office and residential project in Stavanger and a shopping center in Trondheim. The largest new assign-ments in Sweden are related to above-ground facilities at the Aitik copper mine and extensions of the correctional facilities at Kumla, Hall and Härnösand, as well as a new Marriott hotel in Stockholm. Skanska Sweden also started several large office building projects for Skanska Commercial Development Nordic, which also began con-struction of Skanska’s first commercial project in Finland during 2007.
Improved working environment
Proper safety equipment improves the work-ing environment. Skanska Norway uses a risk management database from the oil industry to improve worksite health and safety − reporting hazardous situations, accidents and events that might have led to accidents. Here 100 student units are being built at Nydalstoppen, Oslo, a turnkey contract worth about EUR 13 M.

24 Construction Skanska Review of 2007
Busi
ness
str
eam
s
In the Czech Republic, Skanska is carrying out numerous transport infrastructure projects, including major upgrades in the road net-work. This bridge is part of the D47 highway expansion near the eastern Czech city of Ostrava.
of recruitment campaigns at vocational schools and in the higher education system.
Record-high sales of residential units in Czech Republic In the Czech Republic, the number of residential units sold and started set a record because many buyers wanted to act before the value-added tax (VAT) increase that went into effect in January 2008. Transport infrastruc-ture projects account for about half of Skanska’s revenue in the Czech Republic, but during most of 2007 there were few project opportunities, with some improvement toward year-end and in preparation for 2008. Inflation was relatively high, but as a rule, contracts with public sector customers are inflation-indexed. The commercial project market was good, but competition is keen in this segment. In 2007 Skanska completed the head office of the Czech bank ČSOB in Prague. The building was the first in the Czech Republic to be certified as complying with America’s Leadership in Energy and Environmental Design (LEED) standard.
Positive trend expected in 2008The economies in Skanska’s Central European mar-kets were strong during 2007, and this positive trend is expected to continue in 2008. The new political leader-ship in Poland is likely to speed the pace of infrastructure expansion with the help of both EU funds and PPP solu-tions. Poland will host the European Football Champion-ships in 2012, which will require various investments that will stimulate the construction market.
During 2008 the Czech Republic and Slovakia will again offer a good market for commercial projects. Due to the VAT increase, the Czech housing market will probably weaken somewhat in 2008, but the underlying need for housing remains strong. Skanska’s operations in Slovakia are still relatively small but have major future potential. Slovakia has one of the fastest-growing economies in Europe, among other things because several car compa-nies have established production plants in the country. The construction market is expected to offer good opportunities in the next several years. Skanska’s business in Slovakia is reported under its Czech business unit.
Skanska competes in Poland with Budimex (owned mainly by Ferrovial), Hochtief and Strabag. In the Czech Republic the main competitors are Metrostav and SSZ (subsidiary of VINCI). In Slovakia, Doprastav and Zipp (subsidiary of Strabag) are the largest competitors.
The U.K – strong market with record-sized projectsThe operations of Skanska UK include building and civil construction, utility networks and construction services. Skanska is also a leader in public-private partnership (PPP) projects, known in the United Kingdom as the Private Finance Initiative (PFI) program. The Company mainly operates in Greater London and southeastern England but also in a number of other local markets. The year was characterized by a good construction market in both the private and public sectors. Internation-al financial market turmoil has yet not curbed the demand for commercial space. During 2007 Skanska UK was awarded assignments in London that included the Wal-brook office and retail center, worth about EUR 0.2 bil-lion, and the 202 m (663 ft) Heron Tower office building (one of London’s tallest), worth EUR 0.4 billion. In the civil construction sector, the Docklands Light Railway extension was one of Skanska UK’s largest new contracts.
The market for service and construction of utility networks was good. Skanska took advantage of this through last year’s acquisition of the specialist company Mc Nicholas, which was integrated into Skanska UK during 2007.
Schools and hospitals in public-private partnershipsThe British market for public-private partnerships remains strong, and Skanska is one of the largest PPP/PFI construction companies. The new hospital in Coventry was completed, as well as the first of several new school buildings in Bristol and in the Midlothian area near Edinburgh. A number of large hospital projects are under construction, and during 2007 Skanska UK received an order for the Manor Hospital in Walsall. The construc-tion contract totals about EUR 0.3 billion. Preparations for the Olympic GamesDuring the next few years, preparations for the 2012 Olympic Games in London will intensify. Skanska UK is already working with certain infrastructure assignments, and additional opportunities will open up. In civil con-struction, there are major needs for road construction and paving, as well as water treatment and solid waste processing facilities. The market for utility networks will remain strong in energy − mainly electricity and gas − as well as telecom, water and sewage networks.
Positive outlook for 2008The order book is good and − subject to any impact financial market trends may have on the office sector in London − the outlook for 2008 is mainly positive. Skanska, which is a market leader in its segments, competes with such companies as Balfour Beatty, Bovis, Amec and Carillion.
The U.S. – strong year in Skanska’s biggest marketThe American construction market is the world’s largest, and Skanska is one of the leading companies in this mar-ket. The U.S. accounts for 29 percent of Skanska’s revenue and is thus the Group’s biggest single market. Skanska USA Building provides construction management, pre-

Skanska Review of 2007 Construction 25
construction engineering and design/build services for a broad spectrum of American industries, including pharmaceuticals, healthcare, education, electronics, infrastructure, sports and entertainment.
Skanska USA Civil specializes in construction of traf-fic infrastructure as well as energy, water and wastewater facilities in the eastern U.S., Colorado and California.
Skanska’s U.S. markets had a strong year in 2007 and the Company’s business units achieved very good earn-ings. Skanska USA Civil reached its “Outperform” targets and S kanska USA Building reported strongly improved earnings. Financial market turmoil and the home mort-gage crisis did not significantly affect the segments in which Skanska operates.
The market for building construction − including commercial space, hospitals and schools − was very good. In local currency terms, Skanska USA Build-ing’s order bookings increased by 50 percent. This included one of Skanska’s largest new assignments: the new Meadowlands Stadium in New Jersey, with a con-tract value of about USD 1 billion. However, the renova-tion of the United Nations headquarters in New York is not included in 2007 order bookings. The contract, which is expected to total more than USD 1 billion, will be included in phases as the project unfolds. The project will begin during 2008.
Largest-ever order bookingsThe American civil construction market was very good during 2007 and order bookings were the largest ever. Skanska is the largest civil construction company in New York City, which was Skanska USA Civil’s strongest mar-ket during the year. This included being awarded various new transport infrastructure assignments, for example two major subway system expansions worth a total of EUR 381 M. Water treatment facilities are another grow-ing segment. The Company’s largest single U.S. order to date is for the Croton Water Filtration Plant in the Bronx, New York, with Skanska’s contract totaling more than EUR 778 M. Skanska USA Civil is also assembling steel structures at the New Yankee Stadium in the Bronx and the new Meadowlands Stadium in New Jersey.
In 2008 the civil construction market is expected to remain very strong, with increased demand in the northeastern U.S. The Rocky Mountain region is also expected to remain a good market, while state infra-structure investments on the West Coast are expected to slow somewhat. Expansion of water treatment facilities is expected to increase, providing new opportunities in a number of states during the next few years. Various projects may be financed via federal transportation infra-structure (SAFETEA-LU) program funding, which totals nearly USD 300 billion during the period 2004–2009.
Competition is tough in all segments, but for the largest projects Skanska has a competitive advantage due to its financial strength and ability to obtain the per-formance guarantees that are required in bids for public sector assignments.
The market for public-private partnership (PPP) assignments remains attractive, although bidding pro-cesses tend to be prolonged. Skanska is well positioned to land road, tunnel and bridge projects.
Selected for many construction projectsThe building construction market, including commercial space, hospitals and schools, is expected to remain strong, especially in the northeastern and northwestern United
First LEED Gold-certified hospital
The Providence Newberg Medical Center near Portland, Oregon, is the first U.S. hospital to receive Leadership in Energy and Environmental Design (LEED) Gold certification. The hospital saves 26 percent in energy costs per year. LEED is the best-known American environmental and energy certification system.
States. Among important indicators is that Skanska has been selected by many customers for a number of build-ing projects. In most cases this will turn into large con-tracts after completion of the preparatory phases. At the national level, USA Building competes mainly with companies like Turner (a subsidiary of Germany’s Hochtief) and Bovis Lend Lease, as well as with numer-ous local players in their respective geographic markets.
USA Civil competes with a few large national players, among them Kiewit, Fluor, Bechtel and Granite, as well as with numerous players in local geographic markets.
Latin America – continued strong oil, gas and other energy marketSkanska Latin America is one of the leading construction companies in its region and one of Skanska’s most profit-able business units. Its operations focus on construction, operation and service assignments for the oil and gas industry, where the market was very good during 2007. A large number of these service assignments are small, but with long-term contracts that have continuously been renewed. Due to heavy demand for petroleum products, the business unit’s services are sought-after. The Brazilian economy showed very strong growth, which is another reason behind the unit’s success. During 2007 Skanska Latin America received large new assignments for various types of energy facilities in Brazil. These included a large power generating plant, two gas production facilities and expansion of a refinery. Together with USA Building, the unit also received an assignment to build a pipeline in Puerto Rico. USA Building is familiar with this market after various pharmaceutical assignments, and Skanska Latin America will contribute its energy project expertise.In 2008, Skanska Latin America’s markets are expected to remain strong. This applies to both construction for the energy sector and to the operation and maintenance of oil and gas extraction facilities.

26 Construction Skanska Review of 2007
Busi
ness
str
eam
s The first Czech LEED office building
A fresh new working environment with green values. The employees of the Czech bank ČSOB in Prague can enjoy working in the Czech Republic’s first office building that has been certified as meeting America’s Leadership in Energy and Environmental Design (LEED) standard. Among the building’s environmental qualities are the heat recovery and advanced control systems that optimize its energy usage. The green nature of the building is emphasized by plants, both indoors and on its roof. Open-plan offic-es characterize the working environment. Skanska was responsible for designing and constructing the 83,000 sq. m (893,400 sq. ft.) ČSOB head office building, with five floors above ground and three floors below. It accommodates three large atrium courts, two restaurants and a conference hall below its greenery-clad roof. The project offered a number of technical challenges. One was the metro rail line, which cuts diagonally through the building’s foot-print, only about one meter below its bottom floor. Skanska helped acquire land in a good location. The selection process was thorough. No fewer than 48 dif-ferent proposals were examined by the customer. The decision took into account location, design and financing as well as environmental and work environ-ment aspects. Through various working groups, the 2,400 ČSOB employees had a major influence when Skanska was chosen. Skanska was able to offer seven different locations and two alternative designs. “Skanska had the best total solution from all aspects. And for a large and important project like this, we really wanted to make sure to have a strong partner. That’s another reason for choosing Skanska,” says Luděk Schollar, Senior Manager Investment of ČSOB. “We are very proud of our new building, which must be unique in Europe. The final result is very, very good and we are very satisfied,” Mr Schollar says.
Leadership in Energy and Environmental Design (LEED) is an energy and environmental rating system for building design, construction and operation. The LEED review and certification process are performed by the U.S. Green Building Council, an independent nonprofit coalition of construction-industry leaders that advocates for environmen-tally responsible, profitable and healthy workplaces.

Skanska Review of 2007 Construction 27

Busi
ness
str
eam
s
28 Residential Development Skanska Review of 2007
Residential DevelopmentImproved efficiency for continued residential market expansion
Busi
ness
str
eam
s
Startade enheter
0
500
1 000
1 500
2 000
Sålda enheter
0
500
1 000
1 500
2 000
SverigeNorge
Finland
DanmarkTjeckien Sverige
Norge Finland
DanmarkTjeckien
2006 2007
Units started
0
500
1,000
1,500
2,000
Units sold
0
500
1,000
1,500
2,000
SwedenNorway
Finland Denmark
Czech Republic SwedenNorway
Finland
Denmark
Czech Republic
2006 2007
EUR M 2007 2006
Revenue 830 734
Operating income 78 92
Operating margin, % 9.4 12.6
Investments –540 –545
Divestments 585 450
Operating cash flow from business operations1 41 –50Capital employed 470 406
Return on capital employed, % 14.9 27.6
Number of employees 565 467
1 Before taxes, financing operations and dividends

Skanska Review of 2007 Residential Development 29
here is a great need for new housing in the Nordic countries, despite the slowdown in demand. The national economies remain strong and there is a heavy influx of peo-ple into urban areas − in Finland the larg-est since World War II. In Sweden, too few residential units are still being built in
relation to the population. This is partly due to high costs.
Skanska is responding to this by improving the effi-ciency of its residential construction through higher productivity and increased standardization. The new Skanska Xchange initiative is a comprehensive strategy for achieving both competitive prices and greater profit-ability. Skanska Xchange is a pan-Nordic development project primarily aimed at improving processes and increasing standardization and prefabrication. After a thorough analysis, the best methods for pro-ducing such components as outer walls, floors and stairs will be identified and form the framework of a number of project platforms. This will raise quality and efficiency and increase the potential for improving procurement efforts by boosting volume. During 2008 the first pilot projects will start, followed by gradual implementation. This standardization mainly applies to components that are not visible to the customer. Structures beneath and behind the surface layers will be standardized in order to create a few selected, proven models and methods. This means that, where so demanded, adaptation to local taste or requirements will continue to occur.
Building Information Modeling (BIM) − where an entire project is described in 3-D plus the time dimen-sion − facilitates planning and coordination of activities and supports improved logistics. BIM, which Skanska introduced in 2007, is used in order to streamline the entire construction process, from design and planning to purchasing and execution.
Responsible for the entire development chainSkanska is one of the leading residential developers in the Nordic countries. The Nordic housing markets have great similarities and are thus combined in one unit − Skanska Residential Development Nordic. Skanska Finland performs residential development in Estonia as well. Residential Development is one of Skanska’s invest-ment businesses but does not perform any construction work of its own. In the Nordic countries, it buys contract-ing services primarily from Skanska’s construction units in each respective market.
The growth of the Nordic residential markets decelerated during 2007. The turmoil in the American financial market, along with a housing oversupply in Norway and Denmark, were among the reasons.
Single-family homes in Prague’s outskirts 32
A new neighborhood emerges in Stockholm30
BIM used in planning work, Finland 31
In addition to the Nordic countries, Skanska carries out residential development in the Czech Republic and Slovakia as part of its construction operations.
The value enhancement processDevelopment of residential projects is a continuous process – land acquisition, planning, product definition, marketing, construction and sales – in which the devel-oper has full responsibility in all phases. Development operations are capital-intensive, especially during the start-up of new projects. Value enhancement occurs con-tinuously in the subsequent phases. In order to reduce tied-up capital, a rapid pace of sales is sought. A supply of land suitable for development is a pre-condition for a continuous flow of projects. Due to lengthy planning and permit processes, ample lead time is required to ensure a supply of building rights (a “land bank”) so that construction will meet demand. Market surveys and analysis of population trends − as well as macroeconomic factors such as employment, inflation and interest rate trends that influence the demand for housing − are crucial to decisions on investments in new projects.
Increasing the value of building rightsThe value of land and building rights varies with the demand for housing, i.e. changes in prices and rents. Value also depends on location. As development risks diminish, value increases. A major step in value enhance-ment occurs when a parcel of undeveloped land is transformed into a building right. The process leading to an approved local development plan may take up to five years. Skanska plays a proactive role, working closely with local government bodies in planning processes for land use and neighborhood development. Value is further enhanced in the next phase, when the building right is turned into a completed project that can be sold at the prevailing market price. Of fundamental importance for successful residential development is Skanska’s ability to correctly assess demand and customer preferences in such a way that its development work results in attractive housing of the expected quality in the right place, at the right time and at the right price. Cus-tomer surveys provide data on the preferences of poten-tial customers in terms of location, design and price level. Projects are accounted for using the percentage of completion method. This means that earnings are recog-nized as costs are accrued. When applying the percentage of completion method, Residential Development also takes into account the percentage of a project that has
Silverdal, a new residential neighborhood in Sollentuna north of Stockholm, is being turned into a modern garden suburb with natural scenery and the waters of Edsviken within walking distance. Central Stockholm and the Kista and Sollentuna shopping malls are only a few minutes away by car.
T
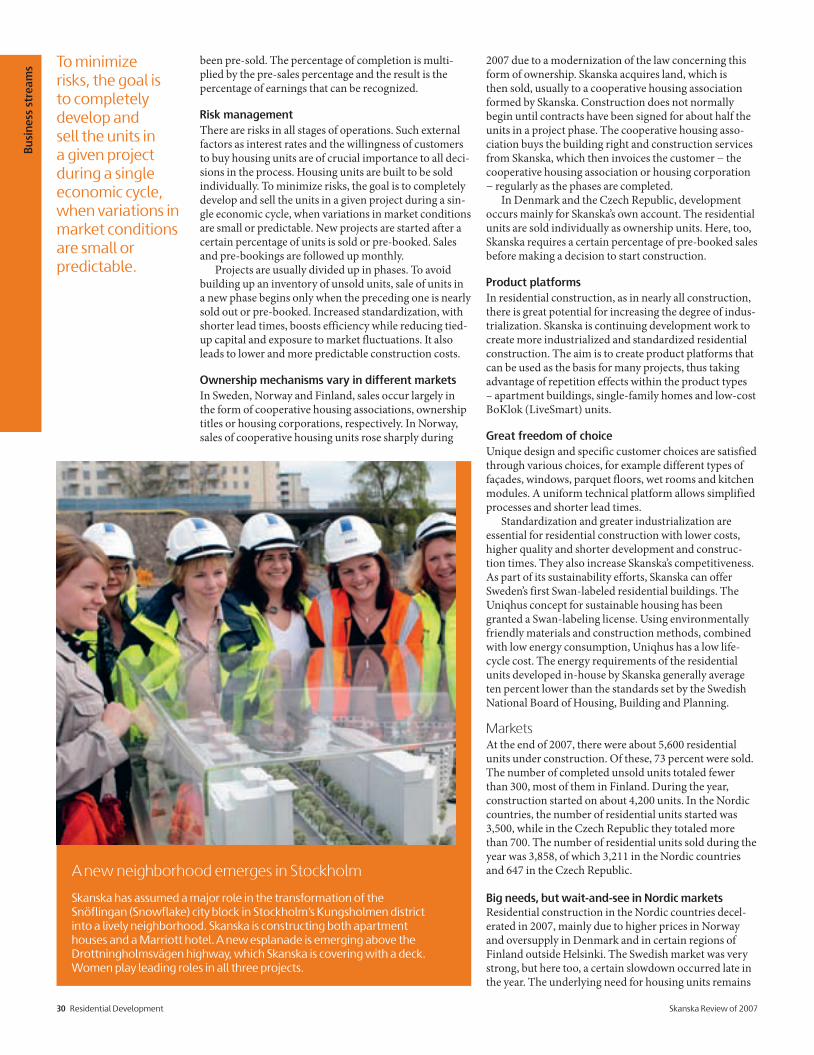
Busi
ness
str
eam
s
30 Residential Development Skanska Review of 2007
been pre-sold. The percentage of completion is multi-plied by the pre-sales percentage and the result is the percentage of earnings that can be recognized.
Risk managementThere are risks in all stages of operations. Such external factors as interest rates and the willingness of customers to buy housing units are of crucial importance to all deci-sions in the process. Housing units are built to be sold individually. To minimize risks, the goal is to completely develop and sell the units in a given project during a sin-gle economic cycle, when variations in market conditions are small or predictable. New projects are started after a certain percentage of units is sold or pre-booked. Sales and pre-bookings are followed up monthly. Projects are usually divided up in phases. To avoid building up an inventory of unsold units, sale of units in a new phase begins only when the preceding one is nearly sold out or pre-booked. Increased standardization, with shorter lead times, boosts efficiency while reducing tied-up capital and exposure to market fluctuations. It also leads to lower and more predictable construction costs.
Ownership mechanisms vary in different marketsIn Sweden, Norway and Finland, sales occur largely in the form of cooperative housing associations, ownership titles or housing corporations, respectively. In Norway, sales of cooperative housing units rose sharply during
A new neighborhood emerges in Stockholm
Skanska has assumed a major role in the transformation of the Snöflingan (Snowflake) city block in Stockholm’s Kungsholmen district into a lively neighborhood. Skanska is constructing both apartment houses and a Marriott hotel. A new esplanade is emerging above the Drottningholmsvägen highway, which Skanska is covering with a deck. Women play leading roles in all three projects.
To minimize risks, the goal is to completely develop and sell the units in a given project during a single economic cycle, when variations in market conditions are small or predictable.
2007 due to a modernization of the law concerning this form of ownership. Skanska acquires land, which is then sold, usually to a cooperative housing association formed by Skanska. Construction does not normally begin until contracts have been signed for about half the units in a project phase. The cooperative housing asso-ciation buys the building right and construction services from Skanska, which then invoices the customer − the co operative housing association or housing corporation − regularly as the phases are completed. In Denmark and the Czech Republic, development occurs mainly for Skanska’s own account. The residential units are sold individually as ownership units. Here, too, Skanska requires a certain percentage of pre-booked sales before making a decision to start construction.
Product platformsIn residential construction, as in nearly all construction, there is great potential for increasing the degree of indus-trialization. Skanska is continuing development work to create more industrialized and standardized residential construction. The aim is to create product platforms that can be used as the basis for many projects, thus taking advantage of repetition effects within the product types – apartment buildings, single-family homes and low-cost BoKlok (LiveSmart) units.
Great freedom of choiceUnique design and specific customer choices are satisfied through various choices, for example different types of façades, windows, parquet floors, wet rooms and kitchen modules. A uniform technical platform allows simplified processes and shorter lead times. Standardization and greater industrialization are essential for residential construction with lower costs, higher quality and shorter development and construc-tion times. They also increase Skanska’s competitiveness. As part of its sustainability efforts, Skanska can offer Sweden’s first Swan-labeled residential buildings. The Uniqhus concept for sustainable housing has been granted a Swan-labeling license. Using environmentally friendly materials and construction methods, combined with low energy consumption, Uniqhus has a low life-cycle cost. The energy requirements of the residential units developed in-house by Skanska generally average ten percent lower than the standards set by the Swedish National Board of Housing, Building and Planning.
MarketsAt the end of 2007, there were about 5,600 residential units under construction. Of these, 73 percent were sold. The number of completed unsold units totaled fewer than 300, most of them in Finland. During the year, construction started on about 4,200 units. In the Nordic countries, the number of residential units started was 3,500, while in the Czech Republic they totaled more than 700. The number of residential units sold during the year was 3,858, of which 3,211 in the Nordic countries and 647 in the Czech Republic.
Big needs, but wait-and-see in Nordic markets Residential construction in the Nordic countries decel-erated in 2007, mainly due to higher prices in Norway and oversupply in Denmark and in certain regions of Finland outside Helsinki. The Swedish market was very strong, but here too, a certain slowdown occurred late in the year. The underlying need for housing units remains

Skanska Review of 2007 Residential Development 31
Every step in the Reimantorni residential project in Esbo, Finland, was planned in 15-minute sequences using Building Information Modeling (BIM). Construction was planned minute by minute using 4-D animations − 3-D plus the time dimension. Potential obstacles were discovered and removed right in the planning stage.
large throughout the Nordic countries, however, driven by greater urbanization and economies that are strong regardless of financial market turmoil. Overall, Nordic housing markets were characterized by a wait-and-see attitude, which is leading to longer sales periods.
In spite of this, the Nordic residential business unit was very close to achieving its “Outperform” targets.
Sweden achieves its targetsIn Sweden, Skanska invested in new land with existing or planned building rights in Stockholm, Gothenburg and Trelleborg. The Group’s Swedish residential business achieved its highest-ever operating margin. All regions achieved their targets. During 2008, Skanska foresees continued stable demand for good housing units in good locations. But the pace of sales is expected to be somewhat slower, determined in large part by financial market developments.
Slowdown in Norway and Finland In Norway, the slowdown in residential demand began as early as the spring of 2007. As a consequence, new construction reached historically low levels − the number of units sold was halved from the previous year. Market prices fell by 3–4 percent. In spite of this, a number of regions were able to achieve their “Outperform” targets. During the year, 45 percent fewer units were started than in 2006. Skanska invested in new land with existing or planned building rights. The number of new projects started in the overall Norwegian residential market is expected to fall by 10–12 percent in 2008 compared to 2007. There seems to be good potential for a stabiliza-tion of prices and demand during 2008, thanks to high employment and the number of people moving to cities.
Residential Development
Revenue
Operating income
Operating margin, %
Capital employed Return on
capital employed,%EUR M 2007 2006 2007 2006 2007 2006 2007 2006 2007 2006
Sweden 371 283 46.4 32.2 12.5 11.4 82 66 42.6 >100
Norway 187 170 10.7 17.6 5.7 10.4 150 152 6.6 12.9
Denmark 66 58 –2.7 10.4 –4.1 17.9 100 86 –2.2 23.3
Finland incl. Estonia 135 170 13.6 23.9 10.1 14.0 138 72 11.9 24.4
Czech Republic 71 53 10.3 8.0 14.5 15.2 1 32 32.2 26.1
Total 830 734 78.3 92.1 9.4 12.6 470 406 14.9 27.6
Number of unutilized building rights
Market Master plan Local plan underway Local plan approved Building permit stage Total building rights1 Other rights
Sweden 3,300 3,800 1,600 1,200 9,900 1,800
Norway 500 400 2,400 100 3,400 1,700
Finland incl. Estonia 400 800 4,900 500 6,600 4,600
Denmark 0 100 600 0 700 100
Nordic countries 4,200 5,100 9,500 1,800 20,600 8,200
Czech Republic 0 1,900 1100 200 3,200 500
Total 4,200 7,000 10,600 2,000 23,800 8,7001 Including building rights in associated companies
Residential Development, number of unitsMarket Units started Under construction Pre-sold, % Total units sold Completed, unsold
Sweden 1,528 2,396 81 1,406 18
Norway 464 605 80 441 17
Finland incl. Estonia 1,365 1,538 50 1,258 233
Denmark 123 175 83 106 17
Nordic countries 3,480 4,714 71 3,211 285
Czech Republic 716 879 83 647 8
Total 4,196 5,593 73 3,858 293

Busi
ness
str
eam
s
32 Residential Development Skanska Review of 2007
Startade enheter1)
0
1000
2 000
3 000
4 000
5 000
JM NCC Skanska
Jämförelse nordiska bostadsutvecklare
2006 2007
Sålda enheter1)
0
1 000
2 000
3 000
4 000
5 000
JM NCC Skanska
1) Totalt i respektive koncern
Källa: Respektive bolags Bokslutskommuniké
Units started1
0
1,000
2,000
3,000
4,000
5,000
JM NCC Skanska
Comparison of Nordic residential developers
2006 2007
Units sold1
0
1,000
2,000
3,000
4,000
5,000
JM NCC Skanska
1 Group total
Source: Year-end report of each respective company
In 2007 the housing market was very strong in the Czech Republic, reinforced by a value-added tax increase on homes that took effect in January 2008. In the rolling hills just southwest of Prague, Skanska built 22 single-family homes ranging from 200–300 sq. m (2,150–3,230 sq. ft.) in size. The homes in Černošice feature large lots of up to 1,500 sq. m (16,150 sq. ft.).
Värdeskapande i Bostadsutveckling
MarkförvärvTid
Värde
Idé och analys
Planläggning och bygglov
Marknadsföring och projektering
Försäljning och produktion
Kundvård
Förhandsbokning inför produktionsstart
Tillträde
5–7 år
Value creation in Residential Development
Land purchaseTime
Value
Concept andanalysis
Planning and permitting
Marketing and pre-construction engineering
Sales and construction
Customer care
Advance bookingbefore groundbreaking
Move-in
5–7 years
Generating value, step by stepIn residential development, macroeconomic and demographic trends are fundamental in generating value. Before making land purchases, Skanska also analyzes local conditions in detail. Maximum customer value is achieved in stages. During initial plan-ning, Skanska establishes a framework in close collaboration with local government. Based on the potential offered by the surround-ings, it then creates a neighborhood with clear character. The design and marketing of an attractive product is also based on the wishes of well-defined customer categories. The Skanska project team leading this task includes business and project developers, architects, salespeople and builders. When pur-chasing their homes, individual customers will also contribute to the process with their specific requirements and requests.
In Finland, the residential development business noted a market slowdown late in 2007, especially outside the Helsinki region. In Estonia, the market was relatively stable. The number of project start-ups declined by about 25 percent from 2006. None of the Finnish regions achieved its “Outperform” targets. During 2007, 30 per-cent fewer residential units were started than the year before. Both certain investments in new land and divest-ments of building rights were implemented. The outlook for 2008 is characterized by a wait-and-see approach among buyers, leading to a lower rate of sales, fewer project start-ups and falling prices. The Finnish economy
is showing satisfactory strength, however, and this is expected to provide continued good demand in areas such as Helsinki and vicinity in 2008.
Demand for economical BoKlok units in Denmark In Denmark, housing oversupply in the Copenhagen area led to a near-total halt in Skanska’s new construction. The only exception is BoKlok (LiveSmart) units and homes in lower price segments. Impairment losses and higher costs at a project in Copenhagen resulted in negative earnings. Oversupply in higher price segments in Copenhagen will also dominate the market in 2008, with continued fall-ing prices and slower sales, but there is demand in lower price segments, for example BoKlok units.
Czech Republic – demand still heavy in PragueResidential development in the Czech Republic and Slovakia takes place within Skanska Czech Republic, which develops, builds and sells residential units directly to private individuals. During 2007 there was very heavy demand in the Czech Republic. Skanska sold 647 apartments, equivalent to an increase of about 4 percent compared to the preced-ing year. During 2007, construction began on 716 units, which represented an increase of 49 percent on 2006. Demand in the Czech Republic was driven by the coun-try’s harmonization with EU value-added tax (VAT) rules. Starting in January 2008, VAT on home sales was raised. Many customers thus chose to make their home purchase before the tax hike. A certain deceleration will thus ini-tially be noticeable in the Czech Republic. But both the Czech and Slovakian economies are showing growth. The housing market is thus expected to remain strong during 2008. Skanska’s residential development is concentrated in Prague, Czech Republic, and Bratislava, Slovakia, which are the main growth centers. The demand for hous-ing is driven both by expanding population and greater consumer purchasing power in these capital city areas.

Skanska Review of 2007 Residential Development 33
By the sea
By the sea I want to live,” sang rock poet Ulf Lundell. Now Skanska is making such a dream possible for others − in the open landscape of Stavstensudde, a peninsula on the Bal-tic Sea outside Trelleborg. “We got what we wanted, and we are very pleased,” says Linda Sernerup, who moved with husband Fredrik and sons Filip and Viggo into a new 135 sq. m (1,450 sq. ft.) one-story home, located near Sweden’s southern tip. “We got hooked on the location. Then we got a house that is flexible and perfect in every detail, with good finishes,” Fredrik Sernerup says. “The builders did a good job − no cutting corners. We have found them easy to deal with the whole time. When we wanted something changed, they took care of it.” In May 2007 the family moved in, and by now their outdoor environment has also become green. Skanska based the design of their house on extensive customer surveys. The single-level home is suitable both for families with small children and for an older generation. Its bright, open feel is reinforced by a semi-open kitchen, a high living room ceiling and generous bathrooms. The layout is flexible. A garden awaits right outside a sliding door. Attention to detail applies not only to the homes. The neighborhood has been planned to blend with its natural setting and to be aesthetically pleasing and safe. The outdoor environment has become a living room for everyone. Between houses is plenty of space with green oases, playgrounds and paved walkways. “One important aspect when we chose our Skanska home was that it is spacious and not so densely built-up, with lots of green landscaping,” says Mr. Sernerup, who rides the bus every day from right outside the neighbor-hood to his job at the Atkins technical consulting firm in Malmö. The Sernerup family lives in a “village” of one-story homes. At Stavstensudde, Skanska has also developed a neighborhood of low-cost BoKlok (LiveSmart) single-family homes and apartment houses, as well as a cluster of 18 Uniqhus homes, which are a bit more luxurious and are Sweden’s first home design to earn the Swan label for environmental sustainability and low energy use.
Residential Development 2007Further information about Skanska’s housing develop-ment can be found in “Skanska Residential Development 2007,” which can be downloaded from www.skanska.com/investors and can also be ordered from Skanska AB, Investor Relations.

34 Commercial Development Skanska Review of 2007
Busi
ness
str
eam
s
Commercial DevelopmentAn intensive year with many new projects
EUR M 2007 2006
Revenue 338 370
Operating income 98 131
of which gain from divestments of properties1 114 136
of which operating net on completed properties2 12 11
Investment obligations, projects started during the year 560 175
Investments –264 –181
Divestments 303 333
Operating cash flow from operating activities3 32 134
Capital employed 770 636
Return on capital employed, % 14.2 21.2
Return on capital employed, %4 16.0 17.5
Number of employees 141 1351 Additional gain included in eliminations was2 After selling and administrative expenses3 Before taxes, financing activities and dividends4 Calculated according to the definition of financial targets
3 4
Busi
ness
str
eam
s

Skanska Review of 2007 Commercial Development 35
The Nepliget Center – office building in Hungary40
Commercial development in Wrocław, Poland36
Skanska’s first GreenBuilding project37
uring 2007, Skanska intensified its investment in and development of new commercial projects. It started 23 new projects, 17 of them in the Nordic coun-tries. Of these 23 projects, 12 were office space, among them Skanska’s first com-mercial development projects in
Helsinki, Finland; in Ostrava, Czech Republic; and in Wrocław, Poland.
Leasing work resulted in the signing of leases for more than 300,000 sq. m (3.23 million sq. ft.) − a new record. Skanska divested projects for a total of EUR 303 M, with a capital gain of EUR 114 M. The Commercial Development business stream has established aggressive value creation targets for the peri-od 2008–2010, based on estimated annual investments. The conditions for developing commercial space were very favorable during 2007 in Skanska’s markets in the Nordic countries and Central Europe. There was strong interest both from tenants and investors. The good market situation for Skanska’s products − modern and functional premises in the right locations − is expected to continue during 2008. This provides the basis for new project starts and for the acquisition of building rights. During 2007, Skanska invested a total of EUR 264 M in new commercial development projects and building rights.
Decades of larger divestmentsDuring the past 20 years, Skanska’s development of com-mercial projects has generated yearly capital gains aver-aging about EUR 95 M. The annual value creation − the difference between accrued development gains and costs to the internal organization − and during the period 1997 to 2007, amounted to about EUR 42 M. The strategic focus on core business that began in 2002 implies that the Company primarily concentrates its property operations on developing, leasing and divest-ing new projects. Skanska aims at a high turnover rate for completed properties. In recent years, major divestments have taken place. Today Skanska’s portfolio thus has relatively few completed properties for sale. During 2007, operations concentrated on investing in new commercial projects that will generate future capital gains. This con-centration also applies to the new business plan for 2008 through 2010. In Commercial Development, Skanska takes overall responsibility for the whole project development cycle – land purchase, the planning and permitting process,
Emerging at Norra Bantorget is Skanska’s Swedish answer to New York City’s historic Flat Iron Building: 14,000 sq. m (150,000 sq. ft.) of modern, flexible office space. A more central location is hard to find in Stockholm.
In Commercial Development, Skanska takes overall responsibility for the whole project development cycle – land purchase, the planning and permitting process, pre-construction engineering, design, leasing, construction, property management and divestment.
design, leasing, construction, property management and divestment.
Commercial Development is one of Skanska’s invest-ment operations. It creates value both by developing new projects and by upgrading and improving completed properties. It also generates building assignments for the Group’s construction units.
Selected marketsSkanska performs commercial project development in selected markets in Scandinavia and Central Europe – Stockholm and Gothenburg ( Sweden); the Öresund region ( Malmö and Lund, Sweden/ Copenhagen, Denmark); Helsinki (Finland): Warsaw, Wrocław, ( Poland); Prague and Ostrava ( Czech Republic) and Budapest ( Hungary). A local presence in the various markets is necessary in order to identify both tenants and investors, the latter as future owners of projects.
Operations take place in two business units: Skanska Commercial Development Nordic and Skanska Commercial Development Europe. About 77 percent of capital employed is attributable to project develop-ment in the Nordic countries and 23 percent in Central Europe. Skanska’s commercial development focuses on three types of projects – office space, retail centers and logistics properties or distribution centers. The allocation between them varies with economic cycles and demand for each respective type of product.
Tenants and investors – two customer categoriesCommercial property operations target two different customer categories with the same product. The primary customer is the tenant, who has certain expectations and requirements regarding the premises. The second cus-tomer is the investor, which buys the property in order to own and manage it, with a certain targeted return. This dual customer relationship means that the product, as well as the services that go with it, must be adapted to be attractive to both customer categories. In some cases, the tenant is also the buyer of the property.
Focus on value creation The Group’s new business plan for the three-year period 2008 through 2010 budgets for gross investments in com-mercial space amounting to EUR 423–529 M annually. The target is to achieve value creation in new projects amounting to an estimated EUR 53–74 M per year during the period.
D

36 Commercial Development Skanska Review of 2007
Busi
ness
str
eam
s
Skanska starts new projects at the pace the market situa-tion allows and when the risk-return ratio is deemed to fulfill the requirements established for these operations. Commercial development is a continuous process in which the developer has full responsibility during all phases. The focus is on those stages of the process that create the greatest value, that is, planning, leasing and divestment. Land and building rights are the basis for commercial development operations. A supply of land suitable for development is essential for a continuous flow of projects. Due to lengthy planning and permitting processes, ample lead time is required to ensure a supply of building rights (a “land bank”) that will meet demand. The average development cycle – from planning to divestment of the fully developed project – is 18 to 36 months. In order to reduce tied-up capital and enable the development of new projects, a rapid pace of sales is sought.
Value increasesThe value of land and building rights varies with demand, i.e. rental trends and the returns demanded by property investors. Land value also increases as permit-ting risks diminish. A major step in value enhancement occurs when a parcel of undeveloped land is transformed into a building right. The process leading up to an approved commercial development plan may take several years. Skanska plays a proactive role, working closely with local government bodies in planning processes for land use, zoning and commercial development. Large-scale leasing sharply increases the value of the
project. Leasing activity begins at an early stage. In many cases, long-term leases are signed with anchor tenants as early as the planning stage, or within a short time after construction work begins. By the completion date, the goal is to have leased most premises. Value increases further when the building right is turned into a completed project that generates rental income. In some cases, projects that have been fully leased are divested even before completion.
Close collaborationTo ensure that the development process results in appro-priate and efficient commercial space, Skanska collabo-rates closely in its design and planning work with tenants and potential buyers. Carrying out commercial development work success-fully on a long-term basis is also facilitated by a limited portfolio of completed projects. Managing these prop-erties provides daily contact with the leasing market. This, in turn, offers insights about changes in customer preferences and also generates new projects. Owning a portfolio of completed properties also lends flexibility to the divestment process, because it enables Skanska to time the divestment of these properties based on market conditions. Energy-efficient solutionsBuildings are estimated to account for more than 30 per-cent of carbon dioxide emissions in the EU.
Skanska’s sustainability efforts are positive for our cli-mate and lead to added value for both users and investors.
Värdeskapande i Kommersiell utveckling
18–36 månaderTid
Värde
1. Planläggning och bygglov
2. Design och projektering
3. Uthyrning
4. Byggande5. Förvaltning
6. Försäljning
Value creation in Commercial Development
18–36 monthsTime
Value
1. Planning and permitting
2.Design and pre-construction
3. Leasing
4. Construction5. Property management
6. Divestment
The first project in Wrocław
In Poland, Skanska started four commercial projects during 2007. Two − Atrium City and Marynarska Point − are in Warsaw. The others are two phases of Grunwaldzki Center, Skanska’s first project in the regional hub of Wrocław with several universities and colleges. The Polish projects now underway range from 11,000–20,000 sq. m (118,000–215,000 sq. ft.). Reflecting the good market situation, the projects that Skanska has started are well on their way toward being fully pre-leased.
The development of commercial projects is a continuous process, with several clearly defined phases – planning and permitting, design and pre-construction engineering, leasing, construction, property management and divestment. The average development cycle is 18–36 months.
Generating value, step by step1. Macroeconomic and market analyses precede a land purchase,
which is the foundation of the value-generating process. A major step in value enhancement occurs when undeveloped land is transformed into a building right.
2. Suitable premises are designed, in close collaboration with tenants and potential buyers.
3. Successful leasing work is a precondition for breaking ground. Larger tenants are contacted at an early stage.
4. The project developer orders construction services, as a rule from Skanska’s own construction units.
5. Active management and customer relations can add further value to the property.
6. New projects are developed with an eye to future divestment. Sometimes a project can be sold while still in the construction phase.
Divestments
Investments
Capital gains
Properties Investments, divestments and capital gains
–0.4
–0.2
–0.0
0.2
0.4
0.6
0.8
1.0
2004 2005 2006 20072003
EUR bn

Skanska Review of 2007 Commercial Development 37
Skanska’s first GreenBuildingSkanska is helping reduce the energy usage and climate impact of properties developed under its own auspices. Hagaporten III, a commercial project in Solna, near Stockholm, has been approved according to the EU’s GreenBuilding classification. The office building, which is being developed for the engineering consultancy Ångpanneföreningen (ÅF), is a full 25 percent more energy- efficient than prescribed by Swedish standards for newly built properties. Skanska is a partner in the EU’s GreenBuilding project.
Commercial Development projects 2007Commercial
Development Nordic
Commercial Development
Europe
Total
Number of projects started 17 6 23
Total investment, EUR M 362 198 560
Number of ongoing projects 15 7 22
Leasable space, sq.m. 233 121 354
Economic occupancy rate, % 62 50 58
Ongoing projects sold 9 1 10
Leasable space, sq.m. 70 14 84
Ongoing projects Type of project
City
Leasable area
000 sq.m
Completion
year
Occupancy
rate, %
Nordic
Stora Frösunda, Hagaporten phase III Office Stockholm 44 2008 64
Norra Bantorget Office Stockholm 15 2008 25
Sturegatan 1 Office Sundbyberg 14 2009 0
Gångaren 16, building 17 Office Stockholm 18 2009 60
Gångaren 11 Office Stockholm 32 2009 92
Sunnanå Logistics Malmö 15 2008 100
Högsbo 27:8 Logistics Gothenburg 10 2008 100
Backa 30:3 Logistics Gothenburg 20 2009 100
Scylla 3:1 Office Malmö 11 2008 52
Scylla 3:2 Office Malmö 6 2009 0
Stora Bernstorp 1, Burlöv Retail Malmö 11 2008 91
Stora Bernstorp 2, Burlöv Retail Malmö 8 2008 100
Stora Bernstorp 3. Burlöv Retail Malmö 9 2009 89
Forskaren E 1 Office Lund 5 2009 0
Lintolahti Office Helsinki 16 2009 25
Europe
Marynarska Point, phase 1 Office Warsaw 17 2008 98
Marynarska Point, phase 2 Office Warsaw 20 2008 51
Atrium City Office Warsaw 26 2009 69
Grunwaldzki Ctr, phase 1 Office Wrocław 16 2008 63
Grunwaldzki Ctr, phase 2 Office Wrocław 21 2008 0
Vysehrad Office Prague 6 2008 44
Nordic Center Office Ostrava 15 2008 0
Total 354 58In 2007 Skanska started 23 commercial projects, 17 of them in the Nordic countries, and signed new leases for over 300,000 sq. m. (3.23 M sq. ft.)
For some years, Skanska has worked to develop energy-efficient solutions. As a result, by using such techniques as improved insulation and heat recycling, Skanska can lower energy consumption by 20–30 percent and by at least 30 percent compared to Nordic standards for new construction. Through its green initiative, the Group is beginning an effort to make its products even more com-petitive from an environmental standpoint (see page 9).
Risk managementThere are risks in all stages of operations. Such external factors as interest rates, customers’ leasing needs and the willingness of investors to buy commercial projects are of crucial importance to all decisions in the process. By means of frequent customer contacts, Skanska tracks the leasing requirements of customers continuously. The occupancy level in completed projects and the pre-leas-ing level in ongoing projects are carefully monitored.
Capital at riskRisks are limited because the business stream has an established ceiling on capital exposure in projects that have not been pre-leased. Capital at risk is measured in carrying amount for completed projects and is based on completion cost for projects that have been started but are not yet fully leased. Capital at risk is limited to a maximum amount approved by the Board of Directors.
MarketsRecord leasing volume in the Nordic countriesSkanska Commercial Development Nordic initiates and develops real estate projects, mainly office, logistics and retail buildings. Office building operations focus mainly on the Stockholm, Gothenburg and Malmö regions in Sweden; the Copenhagen region in Denmark; and Helsinki, Finland. The business unit pursues the devel-

38 Commercial Development Skanska Review of 2007
Busi
ness
str
eam
s
opment of logistics and high-volume retail properties at strategic locations in Sweden, Denmark and Finland, It operates via three regional companies − Gothenburg, Stockholm and Öresund ( Malmö/Copenhagen). The business unit achieved its “Outperform” targets for 2007. The demand for modern, purpose-built premis-es was very good. The unit signed leases for 250,000 sq. m (2.69 million sq. ft.) of space, thereby setting a record. This large leasing volume was based on its efforts in recent years to acquire land in good locations and devel-op modern, energy-efficient premises. The largest con-tracts were with the insurance company Skandia, energy producer Vattenfall and logistics company DHL. Investors also showed great interest. Nine completed properties and nine projects were sold, of which six before completion. In all, the business unit had 15 on -going projects at year-end 2007. During the year, Skanska began its first commercial project in Finland. The project, which will be completed during 2009, is about 25 percent pre-leased. Hagaporten III, an office building being devel-oped for the Swedish engineering consultancy
Carrying amounts and market values EUR M
Carrying amount,
Dec 31. 2007
Carrying amount
upon completion
Market value,
Dec 31. 2007
Surplus value
Leasable
space, 000 sq m
Economic
occupancy level, %
Operating
net
Yield on carrying
amount, %
Yield on
market value, %
Projected rental value fully leased
Average
lease, years
Completed projects 237 237 339 102 234 90 133 5.5 3.9 355 4.0
Completed projects in 2007 37 37 47 10 16 82 34 7.1 5.6 35 5.8
Ongoing projects 227 675 8592 184 354 58 554 8.0 6.3 596 11.7
Total 502 949 1 245 295 604 71
Development properties1 161 161 215 54
Total 663 1,110 1,459 349 1 “Development properties” refers to land with building rights for commercial use, totaling about 980,000 sq.m. (10.55 million sq.ft.) and described below.2 Internal appraisal on each respective completion date. Accrued market value at year-end totaled EUR 265 M.3 Estimated operating net before corporate and business area overhead in 2007 on annual basis assuming current occupancy rate.4 Estimated operating net before corporate and business area overhead fully leased in year 1 when the properties are completed.5 Total of contracted rents and estimated rent for unoccupied space.6 Estimated rental value fully leased in year 1 when the property is completed.
Ångpanneföreningen (ÅF), has been approved according to the EU’s GreenBuilding classification. The require-ment is 25 percent lower energy use and climate impact than the standard for new properties in compliance with the construction rules of the Swedish National Board of Housing, Building and Planning. This is Skanska’s first commercial development project to achieve GreenBuilding status. Positive trends have also characterized early 2008. The outlook for the year remains good, both for leasing activity and divestments. Low or declining unemploy-ment will mean continued demand for premises, with falling vacancies and rising rent levels. Investors’ yield requirements for projects in good locations are expected to remain stable.
Strong market in Central EuropeSkanska Commercial Development Europe initiates and develops real estate projects, with a focus on office and logistics buildings. Its operations are concentrated in major cities in Poland, Hungary and the Czech Republic. The Central European markets were generally strong in
Commercial Development
Revenue Operating income Gain from divestments
of properties Capital employed Return on
capital employed, %1
EUR M 2007 2006 2007 2006 2007 2006 2007 2006 2007 2006
Nordic 307 292 97 115 100 118 596 549 16.9 18.3
Europe 32 78 2 15 13 18 174 86 11.6 13.01 Calculated in accordance with the definition of financial targets.
0
5
10
15
20
25
30%
1999 2000 2001 2002 2003 2004 2005 2005 2007
Adjusted return on capital employed at market value and carrying amount, 1999–20071
Return on capital employed, carrying amount
Return on capital employed, market value
1 Including operating net, accrued unrealized development gains as well as changes in market value.
Completed properties, carrying amount, January 1, 2008
Stockholm, 59%
Gothenburg, 19%
Malmö/Copenhagen, 22%
Central Europe, 0%
Volume of Commercial Development1
2003 2004 2005 2006 2007
Projects sold
Ongoing projects
Projects completed during
the year
1 Refers to book value of completed projects and projected book value of ongoing real estate projects upon completion.
EUR bn
0.0
0.2
0.4
0.6
0.8
1.0

Skanska Review of 2007 Commercial Development 39
2007. Poland showed the highest activity both in terms of project start-ups and leasing. Investor interest was also strong. The business unit achieved its “Outperform” targets. Six new projects were started during the year. Four of these investments were made in Poland: two in Warsaw − Atrium City and Marynarska Point − plus two phases of Grunwaldzki Center, Skanska’s first project in Wrocław. Generally speaking, Skanska’s Polish proj-ects are relatively large, between 11,000–20,000 sq. m (118,000–215,000 sq. ft.). Reflecting the good market situation, the projects that Skanska has started are well on their way toward being fully pre-leased. Skanska’s strong position in Poland is based on its efforts during the past several years to acquire building rights and to start projects. In the Czech Republic, two small projects were started: the Vysehrad Victoria office building project in Prague and the business unit’s first project in Ostrava. In Budapest, Hungary, where the demand for com-mercial space is relatively good but the supply of space is larger, Skanska started no new projects during 2007. The ongoing Nepliget office building project was sold,
Commercial Development 2007 Further information about Skanska’s Commercial Development operations and about the property portfolio can be found in “Skanska Commercial Development 2007,” which can be downloaded from www.skanska.com/investors. The publication can also be ordered from Skanska AB, Investor Relations.
however. The first phase was completed early in 2008, and the two following phases are being started. All three phases were sold in the same transaction, and Skanska will be responsible for leasing the premises. The outlook for 2008 is good in Skanska’s Polish and Czech operations, both when it comes to leas-ing and interest in investment projects. In Budapest, tenants’ need for modern space remains large but supply and vacancies also higher than in Poland and the Czech Republic. Energy-efficient, modern premises in good locations are expected to remain attractive to international investors during 2008.
In Copenhagen, Atrium is the first office project in Havneholmen that is ready for occupancy. It is a 12,500 sq. m (135,000 sq. ft.) building whose tenants include the Danish headquarters of Svenska Handelsbanken, a major Swedish bank. During 2007 Skanska sold the Havneholm Atrium property to the real estate company Norrporten. Skanska has another 40,000 sq. m (430,000 sq. ft.) of building rights in Havneholmen.

40 Commercial Development Skanska Review of 2007
Busi
ness
str
eam
s New projects being started in Central EuropeThe pace is fast in the real estate markets of the new EU member countries in Central Europe. Their strong economic growth is reflected in heavy demand for new, modern commercial space. In preparation for this large upturn, Skanska had six office building proj-ects ready for start-up to meet customer needs. New leases for a total of 52,000 sq. m (560,000 sq. ft.) of space were signed in 2007. In Warsaw, Prague and Budapest, Skanska has been well established for years. Skanska is now expanding its radius of activity to regional growth centers in Central Europe. During 2007 it took its first steps as a commercial developer in Wrocław, Poland and in Ostrava, Czech Republic. These are administra-tive and commercial hubs, which also have a number of higher educational institutions and occupy central locations in the heart of Europe. Among the companies that have signed leases with Skanska in Central Europe are the professional services provider Deloitte and the financial services groups Credit Suisse and DnB Nord. Office projects dominate so far, but the market for logistics space is expected to offer new opportunities in the future. Activity was also high among investors. One mea-sure of confidence in Skanska is that even ongoing, uncompleted projects attract investor interest. Late in 2007 the Nepliget Center office project (photo) in Budapest was sold to an international real estate fund. The project comprises a total of 26,000 sq. m (280,000 sq. ft.) of space and is being built in three phases. The first was completed early in 2008, and the two following phases will be completed during 2008 and 2009, respectively. Skanska will remain respon-sible for leasing of space in the project during a two-year period after completion. The climate change issue is vital, and energy effi-ciency is an increasingly important factor when ten-ants choose their premises. Skanska is in the forefront in offering solutions that save energy and minimize greenhouse gas emissions during a property’s opera-tional phase.

Skanska Review of 2007 Commercial Development 41

42 Infrastructure Development Skanska Review of 2007
Infrastructure DevelopmentPublic-private partnership projects growing in value
EUR M 2007 2006
Revenue 13 16
Operating income –12 –1
Investments –8 –31
Divestments 19 21
Operating cash flow from operating activities1 –1 –9
Capital employed 267 267
Gross present value, project portfolio 991 695
Return on capital employed, %2 58 34
Number of employees 121 1031 Before taxes, financing operations and dividends2 Calculated in accordance with the definition of financial targets
Busi
ness
str
eam
s
–50
0
50
100
150
200
250
204820432038203320282023201820132008
Estimated annual cash flow in Skanska ID's project portfolio, December 20071
Inflow: EUR 3,692 M (interest, dividends and repayments) Outflow: EUR –117 M (contracted future investments)
1 Cash flows have been translated into EUR at the exchange rates prevailing on December 31, 2007.
EUR M

Skanska Review of 2007 Infrastructure Development 43
The estimated unrealized development gain in Skanska’s project portfolio increased by EUR 286 M during 2007, totaling EUR 643 M (357) at year-end.
The U.K. is an international leader in public-private partner-ship (PPP) projects, and Skanska is a leading player in this market. Aside from major hospital proj-ects, Skanska is developing and managing a number of school facilities. The first, in Bexleyham, has been in operation for several years. In 2007 the first of several new school buildings opened in Bristol (photo), along with the first two of eight schools including in a PPP project in the Midlothian area of Scotland.
Skanska sells its holding in Brazil’s Ponte de Pedra hydropower plant 48
New schools in Bristol, United Kingdom43
Finnish highway built as a public-private partnership project47
uring 2007 Skanska divested its remain-ing stake in Maputo Port, Mozambique with a capital gain of EUR 8 M. At the end of the year, Skanska also signed an agreement to divest its 50 percent hold-ing in the Ponte de Pedra hydropower plant in Brazil. A capital gain of about
EUR 60 M was recognized in early 2008 when the trans-action received the approval of public agencies. Skanska reached financial close for its British hospital project in Walsall. The investment amounts to EUR 12 M, and Skanska UK’s construction contract totals EUR 0.3 billion. The Infrastructure Development business stream, through the Skanska Infrastructure Development (Skanska ID) business unit, works in the public-private partnership (PPP) field, or with privately financed infrastructure.
Public-private partnershipsPublic-private partnerships mean that private market players provide facilities and buildings to public agen-cies. This often implies a number of macroeconomic advantages for customers, taxpayers, users and builders. The model makes more room for investments in public facilities by spreading large public investments over longer time periods. It lowers life-cycle costs and also increases the benefit to users because the service or facil-ity becomes available earlier than would be the case with traditional procurement and financing. Public-private partnership projects create value-added for Skanska by generating large construction assignments as well as continuous revenue and cash flows during the lengthy operation phase. In addition to construction contracts, in many cases Skanska is also responsible for long-term service and maintenance assignments. From an investor perspective, Skanska ID creates assets characterized by reliable cash flows over a service life lasting many years, once the operation phase begins. The development processIn public-private partnership projects, Skanska is involved in the entire development chain from design and financing to construction, operation and mainte-nance. By assuming an overall responsibility, Skanska optimizes both construction and operating costs. Skanska-led consortia are awarded these projects not only because of price but, above all, on the basis of how well the product they offer meets the needs of the cus-tomer today and in the future.
During the development process, which is led by Skanska ID, the customer, owners (Skanska ID and its partners), Skanska’s construction units and suppliers of operating and maintenance services are integrated into the task from the start, which reduces the overall risks to Skanska.
Risk management – generating value-addedThe investment, which is Skanska ID’s part of the value chain, must meet ordinary commercial financial return targets. In order to create commercially attractive long-term assets, Skanska ID must efficiently manage risks and opportunities during the development process, that is, before and after financial close. Substantial value-added is generated during this process.
Thorough selection processThe selection process is crucial to Skanska. First and foremost, projects must be in product and geographic areas matching Skanska’s competencies. The investment must also meet the yield requirements (or return targets) Skanska has established for each respective product seg-ment and market. Skanska performs a thorough exami-nation of risks and opportunities, in close collaboration with the Group’s construction units. Since public-private partnership projects largely undergo final planning dur-ing the bidding phase, the bidding costs are substantially higher than for traditionally procured construction contracts. The bidding period is usually also longer. By means of a very thorough internal selection process, Skanska’s total bidding costs can be kept down and the prospects of being selected can increase. Together with one or more suitable partners, Skanska ID forms a bidding consortium. In collaboration between the bidding consortium, Skanska’s local construction units and other suppliers, Skanska ID develops a bid. After the consortium has been selected as the preferred bidder, final negotiations with the customer and poten-tial financiers begin. Only when financial close has been achieved are assignments included in the order books of the construction unit and in Skanska ID’s market appraisal.
Integrated modelAs a rule, Skanska’s local construction company carries out most of the construction project as a design-build contract with a fixed price and completion date. The margin potential in these projects can, if risks are man-aged, be higher than is the case in traditionally procured projects. This is mainly because Skanska is involved in the entire process and can thus influence planning and design from the very beginning. The local construction
D

Busi
ness
str
eam
s
44 Infrastructure Development Skanska Review of 2007
company is often also contracted to operate and maintain the completed facility. The greatest risk from an inves-tor perspective is that the asset cannot go into service on schedule and that quality standards are not met. When Skanska participates in the construction assignment, this risk is regarded as substantially lower. Once the construction phase ends, the ramp-up phase begins, that is, the time it takes for the project to achieve the expected utilization levels and degrees of functional-ity. Its length varies depending on the type of project and the payment model.
Two different compensation modelsThe project company, in which Skanska ID is a part owner, receives compensation mainly according to one of two different models.
The availability modelIn the availability model, compensation is based on providing a given amenity and agreed services at a pre-determined price. Compensation, which is adjusted for inflation, is payable regardless of the extent to which the facility is utilized. The project company is exclu-sively responsible for keeping the services and facilities available, functioning smoothly and up to the agreed standard. Shortcomings may result in deductions from payments. Because the customer in availability model projects is normally a national or local government, the
project company’s credit and payment risk is low. In this model, on overwhelming proportion of Skanska’s invest-ment consists of subordinated debenture loans. The availability model is more common in Skanska’s project portfolio and is the most prevalent model in Europe.
The market risk modelIn the market risk model, compensation is based entirely on the volume of utilization and the fees paid by end-users, for example tolls collected from motorists on a stretch of road. In this case, the project company’s credit and payment risks are higher, while it also has major potential for increasing the return on its investment by means of more efficient operation and higher utilization. In the market risk model, Skanska’s investment consists largely of share capital. Payment streams thus consist mainly of dividends, which are determined by the profit-ability of the facility. The market risk model is more com-mon in the U.S. and Latin America.
Financing of projects The financing of a project or project company is allocated between Skanska ID and its partners, which invest in the project company in the form of equity and subordinated debenture loans. The rest of the financing − which in availability projects may total more than 90 percent and in market risk projects 60–70 percent − consists of bank or bond loans. Cash flows from the project company
Phases in the development processTerminology Meaning Financial implications for Skanska Market appraisal
Bidder Tries actively to be awarded the project. Costs are recognized continuously in the income statement. No
Preferred bidder A consortium is selected and pursues final negotiations to sign a contract with exclusive rights.
The project is highly likely to be implemented. Bidding costs are capitalized in the balance sheet.
No
Financial close All contracts are signed. Debt funding is raised, often in the form of a syndicated bank loan or bonds. The first disbursement is made to the project company.
Construction and service contracts are reported among order bookings. An initial risk premium is added to Skanska’s discount rate.
Yes
Completion of construction phase
Construction is completed, entirely or partly (in stages), and the asset is in operation.
The initial operating phase has begun. The initial risk pre-mium has gradually been reduced, but a certain risk premium is retained through the ramp-up phase.
Yes
Ramp-up The initial operating phase. The duration varies, de-pending on the type of project and payment.
The ramp-up risk premium is gradually reduced. Yes
Steady state The project is in full operation and has achieved long-term revenue and cost levels.
The long-term discount rate is applied. Yes
Appraisal methodology
Category Steady state methodologySteady-state discount rate
Risk premium during development phase ID projects
U.K. hospitals, availability Secondary market yields where a deep market exists. 8% Add 1–2 percentage point when financial close has been reached. This premium is reduced on a linear basis including the first year of steady state. Barts hospital project includes a 2 percentage point premium due to the long ramp-up until the asset is in full operation.
Barts, Coventry, Derby, Mansfield and Walsall
Other U.K. projects, availability
As above. 8% As above. Bexley, Bristol and Midlothian
Other European projects, availability
As above. 8% As above. The A1 project has a higher base rate due to some traffic risk plus 2 percentage points in risk premium during ramp-up due to some traffic volume risk.
A1, E18, E39 and Nelostie
Highways, market risk, Chile
Based on long-term government borrowing cost plus risk premium. Test against listed companies with highway holdings and completed divestments.
11% Add 3–4 percentage point when financial close has been reached. This is reduced on a linear basis until steady state is reached.
Autopista Central
Other projects, Latin America
Based on long-term government borrowing cost plus risk premium. Test against listed companies with similar holdings and completed divestments.
13% Add 2–4 percentage points at financial close. This is reduced on a linear basis until steady state is reached.
Manaus/Breitener

Skanska Review of 2007 Infrastructure Development 45
to Skanska ID consist of interest and principal repay-ments on subordinated loans issued by Skanska and of dividends from the project company’s profits and, finally, repayment of share capital. In today’s project portfolio, Skanska’s share of owner-ship in project companies never exceeds 50 percent, and Skanska thus does not exercise dominant ownership control. Appraisal methodologySkanska ID conducts an annual internal market appraisal of its portfolio. Estimated future cash flows are dis-counted at an interest rate equivalent to a yield require-ment on equity. The level of this requirement is based on country risk, risk model and project phase for the various projects. The yield requirement is also set on the basis of completed transactions involving comparable assets. The yield requirement that is selected is applied to all future cash flows starting on the appraisal date from an owner perspective. This means that cash flow is based on current borrowing for the project and its trend over time, assuming that the project company pays taxes on its profits and observes the limitations usually imposed on dividends to shareholders. Dividends in the EU and the Nordic countries are generally not taxed, whereas there may be taxation by countries in Latin America. The appraisals have not taken any tax expenses into account. The most recently updated financial model is used as a base. This financial model, which describes all cash flows in the project, has been examined and approved by banks, credit investment companies and rating companies. Data for the financial model is updated at least once a year.
A market value is assigned only to projects that have achieved financial close. The appraisal is performed from the perspective of Skanska ID. In other words, all flows to and from the project company are appraised. Differences in the appraisal over time are due to changes in estimated future cash flow, in time value (the closer the cash flow is in time, the larger its value) and in the yield requirement used. Since all investments are denominated in currencies other than Swedish kronor, there is a currency translation effect in the change in market values.
The 2007 appraisalAt year-end 2007, the estimated gross present value of cash flows from projects totaled EUR 991 M (695). Estimated unrealized development gains in Skanska ID increased during 2007 by EUR 286 M and thus amounted to EUR 643 M (357). This sharply higher value is largely due to Skanska’s active management of the portfolio and to higher estimated future cash flow, including its time value. Most of the increase was due to the fact that divi-dends between Sweden and Chile will be taxed at a lower tax rate than previously estimated. In the same way as other projects in the portfolio are handled, the tax effect has been entirely excluded. Future cash flows from the Autopista Central highway will thus be larger. This increases value by EUR 106 M. Otherwise the increases in cash flow are connected, among other things, to the expectation that highway toll income from Autopista Central will increase more and that the operational expenses to achieve this will be lower. The appraisal includes the Ponte de Pedra hydropower plant at its
Marknadsriskprojekt, exempel Tillgänglighetsprojekt, exempel
Diskonteringsränta, % Nettonuvärde Årligt kassaflöde
Byggfas Långsiktig driftfas
Uppstartsfas
Byggfas Långsiktig driftfas
Uppstartsfas
Market risk concession, example Availability project, example
Discount rate, % Net Present Value Cash Flow value, annually
Construction Steady state
Ramp-up
Construction Steady state
Ramp-up
Kategori
Anläggning, 15%
Väg, 6%
Social infrastruktur, 15%
Motorväg Autopista Central, Chile, 64%
Bedömt bruttonuvärde fördelat per:
Ersättningsmodell
Tillgänglighet, 36%
Marknadsrisk, 64%
Återstående koncessionslöptid
< 10 år, 1%
10−20 år, 4%
20−30 år, 84%
> 30 år, 11%
Fas
Bygg, 16%
Lång driftfas, 16%
Uppstartsfas, 68%
Geografi
Norden, 4%
Storbritannien, 15%
Övriga Europa, 2%
Brasilien, 15%
Chile, 64%
Category
Facility, 15%
Highway, 6%
Social infrastructure, 15%
Highway Autopista Central, Chile, 64%
Estimated gross present value by
Payment type
Availability, 36%
Market risk, 64%
Remaining concession
< 10 years, 1%
10−20 years, 4%
20−30 years, 84%
> 30 years, 11%
Phase
Construction, 16%
Steady state, 16%
Ramp-up, 68%
Location
Nordics, 4%
UK, 15%
Other European countries, 2%
Brazil, 15%
Chile, 64%
Sensitivity analysisEUR M Change
Discount rate (–/+ 1 percentage point) 116.4 –95.2
Autopista cash flow (+/–10%) 63.5 –63.5
EUR M
Discount rate
0
200
400
600
800
1,000
1,200
1,400
1,600
1,800
2,000
16.1%15.1%14.1%13.1%12.1%11.1%10.1%9.1%8.1%7.1%6.1%
EUR 991 M
Sensitivity analysis, Gross present value of cash flow from projects, EUR 991 M

Busi
ness
str
eam
s
46 Infrastructure Development Skanska Review of 2007
sale price of about EUR 110 M. This sale price exceeds the previous year’s internal appraisal estimate by about EUR 59 M. Interest in PPP projects as an asset class remains intensive, and a large number of major projects changed owners during 2007. Increasing interest is reflected in generally higher price levels and lower yield require-ments. The weighted discount rate used in the appraisal was 11.1 (11.7) percent. Underlying yield requirements did not change compared to 2006. The lower discount rate reflects lower risk in the portfolio because projects have entered or are approaching their operating phase. Positive currency translation effects increased unrealized development gains by EUR 19 M. In the consolidated accounts, elimination of intra-Group profits totaled EUR 43 M (44), which meant that
unrealized development gains at Group level amounted to EUR 686 M (401) at year-end. A well-reputed investment bank conducted its own assessment of the value of Skanska ID’s portfolio and found that Skanska’s appraisal reflects a cautious but real-istic assessment.
MarketsIncrease in project portfolio value The operations of Skanska ID focus on three segments – highways, social infrastructure such as hospitals and schools, and facilities. At year-end 2007, the project portfolio consisted of a total of 15 projects in Europe and Latin America. The estimated market value of the portfolio of completed and ongoing Infrastructure Development projects is now
Project portfolio, EUR M Type
Category
Payment type
Country
Owner-ship
Invested capital,
Dec 31, 2007
Total commit-
ment
Year of operation/ full operation
Concession ends
In operation, fully or partially,December 2007Nelostie Highway Highway Availability Finland 50% 3.4 3.4 1999 2012
E39 Highway Highway Availability Norway 50% 7.5 7.5 2005 2028
Autopista Central Highway Highway Market risk Chile 48% 119.8 119.8 2004/2006 2031
Coventry Hospital Social infrastructure Availability U.K. 25% 11.7 11.7 2005/2007 2035
Bexley schools Schools Social infrastructure Availability U.K. 50% 2.4 2.4 2005 2030
Ponte de Pedra Power Facility Availability Brazil 50% 43.5 43.5 2005 2036
(Manaus) Breitener Power Facility Availability Brazil 35% 18.4 39.3 2006 2025
Midlothian Schools Social infrastructure Availability U.K. 50% 2.1 2.1 2007/2008 2037
A1 Highway Highway Availability Poland 30% 4.1 10.3 2007/2010 2032
Mansfield Hospital Social infrastructure Availability U.K. 50% 0.0 20.3 2006/2011 2043
Derby Hospital Social infrastructure Availability U.K. 25% 0.0 13.3 2006/2008 2043
Ongoing projects
E18 Highway Highway Availability Finland 41% 7.8 9.1 2010 2031
Barts and London Hospital Social infrastructure Availability U.K. 38% 10.3 54.5 2006/2016 2048
Bristol Schools Social infrastructure Availability U.K. 50% 5.9 5.9 2007/2008 2034
Walsall Hospital Social infrastructure Availability U.K. 50% 0.0 11.2 2007/2010 2041
Total, Skanska ID 237.1 354.4
Accumulated share of earnings in joint ventures 23.7
Carrying amount, Skanska ID 260.8
Definitions, Skanska ID’s appraisal model
Gross present value The discounted present value of all flows from the project to Skanska ID.
Present value of remaining investments The discounted present value of remaining investment commitments in ongoing projects. This is discounted at the same discount rate as the project.
Net present value (NPV) The discounted present value of all flows to/from the project. The same as the sum of present value of cash flow from projects and present value of remaining investments.
Unrealized development gain Net present value minus carrying amount of projects.
Change in unrealized development gain Annual change in unrealized development gain.
Valuation in 2007 by category, EUR M
CategoryGross present
value, Dec 2007Discount rate,
2007, %NPV, remaining
investments1
Carrying amount, Dec 20072
Unrealized develop-ment gain, 2007
Highways 63 8.8% 7 26 30
Highway Autopista Central, Chile 635 11.5% 0 134 501
Social infrastructure 149 9.0% 64 36 49
Facilities 143 n.a4 17 64 62
Total 991 11.1% 87 261 6433
Accumulated development gain, 2006 357
Change, 2007 2861 Nominal value EUR 117 M.2 Invested capital plus accrued value of participations in project companies corresp. to Skanska’s ownership.3 Eliminations at Group-level reduces the book value and hence increases the accumulated development profit with EUR 43 M to EUR 686 M. 4 Not applicable, since Ponte de Pedra is included at sale price.

Skanska Review of 2007 Infrastructure Development 47
EUR 991 M, equivalent to an increase of EUR 286 M compared to the 2006 appraisal. A number of completed and operating projects are generating a revenue stream. The Autopista Central highway in Santiago, Chile and the E39 highway near Trondheim, Norway have been in operation for a few years, and traffic volume is increasing. The first schools in the large Bristol and Bexleyham school projects in the U.K. are also in operation. During 2007 the first two of a total of eight schools opened as part of a PPP project in the Midlothian district of Scotland. The hospital in Coventry, England also opened.
For the Finnish Road Administration, the company Tieyhtiö Ykköstie is building and will manage a 51 km (32 mile) long section of the E18 highway between Helsinki and Turku, Finland. Skanska Infrastructure Development has a 41 per-cent shareholding in Tieyhtiö Ykköstie. The contract period is 21 years, counting from the end of 2008 when the road will open up to traffic.
In Poland, late in 2007 the first phase of about 25 km (16 mi.) of the A1 expressway opened. This is Skanska’s first PPP project in Central Europe. Heavy interest in PPP solutions continuing in 2008International interest in PPP solutions remains strong in 2008. Most project volume is in the United Kingdom. A continuous flow of new project opportunities is expected there, including plans for bids on additional hospital projects. In other European and Nordic markets, the selection is more limited. Meanwhile the outlook has brightened in Central Europe. A number of potential infrastructure development projects will probably emerge in the next few years in the Czech Republic and Slovakia. North America has the greatest expansion potential, but lead times are long. In 2008 Skanska plans to submit bids on some very large highway concessions in North America. The Group intends to increase its investments in this sector by some EUR 100 M per year.
Openingbalance
December2006
Reduceddiscount
rate
Timevalue
Change in project
cash�ow
Tax adjust-ment
Autopista Central
Ponte de Pedra
Ex-change
rate
Closingbalance,
December2007
Pro�t in assoc. compa-
nies
Changes in unrealized development gain, 2007
EUR M
106
24
0
100
200
300
400
500
600
700 59 2 –8 643
5133
357
New projects
19

Busi
ness
str
eam
s
48 Infrastructure Development Skanska Review of 2007
Energy and sustainable development in BrazilPonte de Pedra, located in the Mato Grosso region, was developed by Skanska Infrastructure Development and built by Skanska Latin America and Impregilo of Italy. Skanska has also been in charge of operation and maintenance since the generating plant went into service in 2005. The generating plant, with a capacity if 176 MW, can supply about 700,000 people with electric power. The electricity produced is sold to CEMIG, which is one of Brazil’s largest electric power distributors. A natural 242 m (794 ft.) drop in the Correntes River allows efficient utilization of the water. The Brazilian economy is experiencing robust growth, and such regions as Mato Grosso have large energy needs. The hydroelectric plant not only supplies sustainable energy but also supports a school and an activity center for both young people and the elderly in the area. In addition, the project has generated jobs, improved such local infrastructure as the healthcare system and increased tax revenue. Last year the nearby cities of Sonora and Itiquira collected about EUR 2 M for the right to utilize the water. Before construction of the generating plant and its associated dam, Skanska conducted the appropriate environmental impact assessment, and the project was approved by Brazilian environmental authorities. Late in 2007, Skanska signed an agreement to divest its 50 percent stake in the Ponte de Pedra hydropower plant. The sale price for its shares totaled about EUR 110 M, and the capital gain was about EUR 59 M. The capital gain on the sale is being recog-nized in the accounts early in 2008 when the appro-priate public agencies have approved the transaction.

Skanska Review of 2007 Infrastructure Development 49

Sust
aina
ble
dev
elop
men
t
50 Sustainable development Skanska Review of 2007
Skanska has made significant progress since it published its first Environment Report for 1996. Some of this is evident from the many successful projects completed around the world, using innovative approaches to over-come a variety of challenges related to sustainability. Improved gathering and interpretation of appropriate data – on accident statistics, training, recycling rates and even the evaluation of chemical products – has also contributed to a greater understanding of Skanska’s real impact – socially, environmentally and economically. Companies today, across all sectors, operate in a rapidly changing landscape. Ideas and actions regarded as show-ing environmental initiative a few years ago are now an integral part of most organizations’ daily activity. How-ever, the construction industry in particular occupies an unusual position in terms of sustainability.
Meaningful measurement and reportingConstruction is a project-based business. Buildings are designed, financed, built, commissioned and leased or sold in a complex series of interrelated transactions. The project list is always changing and, as a consequence, Skanska and its workforce is always in flux. This makes measurement of many of the conventional reporting parameters for sustainability, which work satisfactorily in other business sectors, difficult if not impossible in this industry. Where performance data can be gathered, it frequently provides a meaningless comparison for year-on-year improvements because baselines are constantly moving. Skanska believes that further work is required by major players in construction and related areas, to ensure that where data is used for reporting, it is both meaningful and accurate.
With leadership comes responsibilityThe construction industry is ideally placed to make a significant contribution to the sustainable development agenda. Skanska’s position of leadership carries with
Sustainable developmentAlways thinking ahead
Skanska’s commitment to sustainable development and the contribution made thus far to improving the Group’s environmental, social and economic performance are well known to many stakeholders. This is the twelfth year that Skanska has reported publicly on achievements relating to these important aspects of business. Initially, the focus was on the environment. In more recent years, this has been expanded to include all three areas of sustainable development – social, environmental and economic – proof in itself that Skanska operates well ahead of most of the construction industry in terms of this commitment.
it responsibilities. Not only does the company need to constantly improve its own performance in all three areas – society, environment and economy – it must also con-tribute to raising standards throughout the entire build-ing sector. The purpose of this Sustainability Review is to report on the achievements made in the past year, as well as highlighting areas of business where further work is still required. Many of the initiatives that began during the year will form the foundation for an even stronger, sustainable future for Skanska, its workforce and customers.
Through its Environmental Policy, published this year, and a three-year Environmental Strategy taking the company to 2010, Skanska has made several public com-mitments about its strategic objectives, key performance indicators (KPI) and targets. These will form the basis of future reporting, both internally and externally, using the annual Sustainability Review and the Skanska Group website.
Social aspects, important to Skanska’s future devel-opment, are also the focus of programs which were implemented in 2007 and will take the business forward to the end of the decade. Health and safety are Skanska’s single most important social responsibility. To this end, during 2007 a revised Safety Policy, Guidelines and Stan-dards were put in place throughout all of Skanska’s home markets. In support of this policy, there is a monthly, company-wide Safety Statistics Reporting Protocol sup-ported by a global reporting database for collection and analysis.
Economically, the future focus for Skanska will be on developments in major cities and conurbations. By 2030, an estimated 60 percent of the world’s population will be living in urban areas. It is Skanska’s objective in its home markets to ensure that it contributes to the quality of life of city dwellers, not only through the construction of new office buildings but also by providing infrastructure development, including new hospitals and schools.
Making sure the workforce lives and breathes its philosophy on sustainability is vital for Skanska in order to achieve its goals. To this end, during 2007 the company produced a number of publications to help and guide employees, from a booklet of practical energy tips to a comprehensive range of energy efficiency best practice guides on operating construction machinery in ways that reduce greenhouse gas emissions.

Skanska Review of 2007 Sustainable development 51
Skanska’s 5 zero visions – zero loss-making projects, zero environmental incidents, zero work site accidents, zero ethical breaches and zero defects – are closely aligned with the concept of sustainable development. They con-tinue to be central to the company’s philosophy.
Management systems, reporting structures and train-ing procedures have been in place for several years to ensure that Skanska operates all of its business units, in every home market, to ensure compliance with all relevant laws, regulations and standards. Skanska will continue to work with regulators, quality assurance bod-
ies and many other stakeholders to understand fully the particular challenges and opportunities facing the con-struction industry, and to encourage the adoption of mea-surement tools that are more meaningful to project-based activities than heretofore. The result will be improved accuracy and relevance of the reporting and benchmark-ing of environmental, social and economic impacts – not only for Skanska, or for the construction industry, but also for other sectors that are project-, rather than manu-facturing, focused.
Gaining independent recognition is an important part of demonstrating that a business is on the right track. Here is a selection of Skanska’s achievements this year:
• Skanska UK won the 2007 award for Best Sustainable Contractor/Construction Manager of the Year from Business Sustainability Awards.
• Skanska Latin America won the Latin American Safety Award from the Latin American Association of Occupational Safety and Hygiene ( ALASEHT).
• Skanska USA Building was rated the Top Green Contractor in the Green Contractors Survey.
• In Poland, Skanska is the highest ranked construction company in corporate social responsibility (CSR), according to German publication Manager Magazin 2007 Good Company ranking and Skanska was rated general contractor with the highest economic value-added in a list of 50 companies with the highest EVA published in 2007 by the Rzeczpospolita daily.
• Skanska Finland earned first prize in all categories of Going Safely in the 21st Century – the annual occupational safety competition in the Uusimaa region in southern Finland. Skanska won the awards for the Espoo Reimantorni residential project and for a civil project in Ilves and was named best company in both the residential and civil construction categories. The annual trophy was presented by the Uusimaa Occupational Safety Inspectorate.
Gas plant exceeds targets
The construction of the El Casquete gas plant in a desolate part of Argentina some 1,300 km (800 mi.) west of Buenos Aires was a major challenge, which was performed so well that the project received the internal award Best Project of the Year in the Civil Engineering category. The cus-tomer benefited from completion of the project ahead of schedule. Skanska fulfilled both its financial and quality targets. The margin was above average, and the job was carried out entirely without accidents.
Six Skanska business units (Skanska UK, Skanska Norway, Skanska Sweden, Skanska Com-mercial Development Nordic, Skanska Residential Develop-ment Nordic and Skanska USA Building) actively contributed to the Sustainable City Develop-ment Conference in Malmö, Sweden in September 2007. This Nordic event was one of a number held regionally around the world, culminating in a global conference during 2008 in Melbourne, Australia. Best practices and advice on the correct selection and use of sus-tainable construction techniques and materials were shared with delegates.

Sust
aina
ble
dev
elop
men
t
52 Sustainable development Skanska Review of 2007
member of the public. An initial report is submitted to Skanska AB within 48 hours and appropriate actions are undertaken by business unit management in conjunc-tion with external agencies. A final report is submitted to Skanska AB when the investigation is concluded, generic learning is extracted and shared via the Skanska Safety Alert briefing and the Skanska Safety Performance Network reviews each fatality at its half-yearly meetings to identify ways to try to eliminate the risk that similar incidents will occur in the future.
Business ethics Based on periodic research by Transparency Interna-tional, ethical behavior is particularly open to abuse in the construction sector. This presents a constant chal-lenge for responsible companies like Skanska. In 2002 the Company published its Code of Conduct and in 2003 separate Compliance Guidelines were produced to sup-port implementation of this Code. A revised version of the Code will be published in 2008 and the Compliance Guidelines will be updated during the year. Skanska was instrumental in the development of the original United Nations Business Principles for Countering Bribery in the Engineering & Construction Industry. These have now become the Partnership Against Corruption Initia-tive (PACI) principles – endorsed by over 110 companies employing more than 1.5 million employees worldwide, with annual revenues of USD 500 billion. In an industry which has not enjoyed the most exemplary record, Skan-ska operates a zero tolerance approach to bribery. Any breaches are dealt with promptly and severely.
Supply chainAn estimated 75 percent of the costs of Skanska’s proj-ects relate to the purchase of goods or services. The procurement processes across all business units involve thousands of suppliers and subcontractors. All must be properly screened and evaluated with regard to national
One example of how corporate control is implemented comes from Skanska’s operations in the Far East
In China it is a mandatory requirement for all manufacturers and suppliers doing business with Skanska to meet all elements of the Code of Conduct. Operating locally in the region, Skanska staff carry out environmental and social audits, as well as providing a corporate resource for the centralized purchasing operations of Skanska Sweden.Some important factors in performance include:• Complying with legal requirements that apply to
the countries where Skanska does business.• Respecting the United Nations Universal
Declaration of Human Rights and to recognizing the Group’s responsibility to observe those rights.
• Being committed to doing business with a high standard of integrity and ethics.
• Having an open-minded dialogue with those affected by its operations.
Michael Yue is Skanska’s chief representative in Shanghai and in charge of the Group’s procurement work in the Chinese market.
Social agendaHealth and safety Employees, understandably, play a key role in health and safety. Recognizing the high accident rate for driv-ers in Skanska Latin America, Skanska took the bold step of installing on-board tachographs in thousands of road vehicles in a bid to make driving safer for workers. Drivers are now more aware of their behavior, which has resulted in a significant reduction in incidents. This dedi-cation to safety contributed to the Latin American Safety Award won by Skanska in 2007. Skanska Norway also has an excellent safety record, encouraged by its extensive work for the oil and gas sec-tor. Oil sector risk management software has been adopt-ed by Skanska Norway to aid its work toward continuous improvement in this area. This tool allows the reporting of dangerous conditions, accidents and near misses. It also provides supervisors access to corrective actions and shared best practice responses. The reporting element of Synergi produces monthly and quarterly statistics and trends, with data exports being made available to major clients.
Skanska is fully aware that its safety record will only be acceptable when it can record zero fatalities and acci-dents. Until then, the Company continues to aim for the highest possible safety standards including a zero toler-ance policy on any behavior construed as dangerous in the workplace.
Throughout 2007, an increasing number of line man-agers have been given responsibility with training and competency as key aspects of their role. They are sup-ported by safety experts within the organization.
During 2007, one employee and seven subcontractors sadly lost their lives as a result of accidents. This is clearly unacceptable; when a fatality occurs the Fatality Accident Protocol provides a clear procedure for reporting, inves-tigating and communicating the incident irrespective whether it is a Skanska employee, a subcontractor or a
Environmental training
The percentage of Skanska staff who have participated in basic environmental training was maintaines.
%
0
10,000
20,000
30,000
40,000
50,000
2007200620052004200320022001
Spreading the word(Code of Conduct)
Throughout 2007, 45,000 suppliers and sub-contractors were informed about the Skanska Code of Conduct using a variety of communication methods.
Number of contacts
0
20
40
60
80
100
2007200620052004200320022001
Miljöutbildning
Andelen Skanska-anställda som har fått grundläggande miljö-utbildning har kommer text från Agneta.
%
0
10 000
20 000
30 000
40 000
50 000
2007200620052004200320022001
Att sprida information (uppförandekoden)
Under 2007 har 45 000leverantörer och under-entreprenörer fått information om Skanskas uppförandekod via ett antal olika kommunika-tionskanaler.
Antal kontakter
0
20
40
60
80
100
2007200620052004200320022001

Skanska Review of 2007 Sustainable development 53
legislation, as well as environmental and human rights aspects. The vast majority of purchases are currently handled locally in each project. Procurement is gov-erned by regional management systems adapted to each specific home market. In 2007, Skanska made increas-ing use of centralized purchasing functions. As this resource is developed, the company will benefit from long-term global agreements with suppliers. As a direct consequence of increased centralized purchasing, further improvements in chain of custody and other internation-al environmental and social initiatives protecting people, natural resources and raw materials will be achievable. Skanska’s procurement team encourages the purchase of materials from sustainable sources wherever possible and is mindful of the need to select suppliers through Pre-Qualifying Questionnaires that assess safety and envi-ronmental criteria as part of the prerequisites for being allowed to submit a tender.
TrainingEvery method of teaching and communicating must be used, every opportunity taken, to make construction a safer profession. Proper training of everyone involved in a project is crucial. It also plays an important role in educating employees, suppliers and subcontractors about safety and environmental best practices.
Up to 250,000 subcontractors work for Skanska in any given year. They make up a significant proportion of the workforce, and it is important that each of them complies with Skanska’s own stringent health and safety requirements.
As part of the Young Offenders Training and Employ-ment Program, Skanska UK is working in partnership with its customer, National Grid – which manages the country’s gas and electricity infrastructure. This is an example of new initiatives to address the shortage of per-sonnel. A 13-week course is run in prisons to identify and employ future team leaders to work on gas mains replace-
ment. During the training program the trainees are still in prison but are released daily under license. A total of 71 young offenders have commenced the program since July 2005, of whom 28 are now employed full-time by Skanska UK and 5 are still trainees.
During 2007 Skanska further developed an ongoing recruitment program aimed at attracting university-level graduates and, in particular, women, to work for the Company. Skanska is not immune to the skills shortage that faces the global construction industry. However, using innovative recruitment and training techniques both to attract new employees and to ensure better reten-tion of existing personnel, the Company continues to make good progress.
All training is normally delivered throughout Skanska at a business unit level. One exception is a Groupwide program for Skanska’s top 250 executives. The Skanska Top Executive Programme (STEP) focuses on strategy, change and leadership and is delivered in partnership with the IMD business school in Lausanne, Switzerland. Participants also work in project teams that perform assignments for the Group. The result of one of the projects is a new Corporate Citizenship program. This lays out a strategy which links Skanska more effec-tively, and meaningfully, to the communities in which it operates.
Diversity Diversity is about embracing and utilizing the different talents and viewpoints that individuals bring to a team, regardless of their background. Skanska is working hard to ensure that it encourages employees from all walks of life and maximizes its use of the skills they bring with them.
With customer encouragement, Skanska USA Build-ing has developed a Diversity Program at the new Mead-owlands Stadium. The goal is to achieve a participation in the project of at least 20 percent from minorities,
One health and safety initiative is group warm-up exercises, which take place at the begin-ning of the working day. In many projects, “stretch and flex” exer-cises have helped decrease back problems among employees.

Sust
aina
ble
dev
elop
men
t
54 Sustainable development Skanska Review of 2007
Environmental agenda Energy and climateThe four environmental priority areas in which efforts will be made in the coming years to consolidate Skanska’s position as a leading, environmentally responsible busi-ness are energy and climate, materials, ecosystems and local impacts.
Skanska’s knowledge and experience of sustainable building practices is helping its clients to mitigate climate change. The construction of energy-efficient public, commercial and residential buildings will continue to play a big part in delivering local, national and inter-national targets for reduced carbon dioxide emissions. Although the initial investment can sometimes be higher at the construction phase, properly managed buildings incorporating energy-efficient materials and design ulti-mately cost much less, both in terms of the total energy consumption, (reductions of 30–40 percent are possible), and their carbon dioxide footprint. However, higher initial cost is not always the case. ModernaHus, a new development in prefabricated housing, is a good example of how Skanska Sweden is building homes which are both more affordable to buy and less expensive to run. Anoth-er excellent demonstration of low energy construction is the Holstetin Center for Sustainable Rural Development in the Czech Republic. Built to extremely low energy con-sumption specifications using traditional techniques and local resources, this project was the first non-residential, passive energy building in Europe to receive EU funding.
Not all projects involve new construction. Skanska Sweden’s transformation of existing apartment houses demonstrates how entire communities can be enhanced through the improvement of living conditions. Using sustainable solutions to update residences, Skanska is undertaking more than property renovation – it is looking at ways to create a safe and healthy living envi-ronment, both inside buildings and outside. Using envi-ronmentally friendly materials and techniques, the trans-
women and small business enterprises (MWBE). A key aspect of the program is developing and maintaining dialogue and action that promotes the utilization and mentoring of MWBE firms and creates opportunities for them to participate in the project. Using a variety of online media channels, Skanska reached out to over 8,000 minority businesses, encouraging them to con-tact the Company to learn more about opportunities to become suppliers and subcontractors. Skanska also held sponsored procurement fairs to inform potential MWBE partners about the opportunities for working on the Meadowlands Stadium project and to introduce them to prime contractors.
Lowering energy consumption plays a crucial role in reducing carbon dioxide emissions. Analyzing the energy used during the entire life cycle of a typical building, as little as five percent is consumed during construction. Up to 15 percent is embedded in the materials used for its construction (many of which could ultimately be reused or recycled). The remaining 80+ percent is then consumed by occupants during the building’s useful operating life. By constructing homes and offices that are energy-efficient, Skans-ka contributes far more to the reduction of global carbon emissions than the Company could ever achieve at the point of construction, even if total energy consumption during construction were reduced to almost zero.
Environmentally certified office building in SeattleThe Alley24 office and retail project in downtown Seattle, WA, U.S.A. has received Leader-ship in Energy and Environmen-tal Design (LEED) Gold certifica-tion. Alley24 met LEED Gold standards for both the building and its interior. Together with the NBBJ archi-tectural firm, Skanska designed and built the project. Both companies now have offices there. For Skanska, it meant about 40 percent less energy consumption than at its previous office. The move to a healthy new environment helped lower employee absences considerably. The customer, Vulcan Real Estate, was also pleased that Skanska completed the building below budget.
Skanska Commercial Development Europe used a range of energy conservation solutions, during the construction of the Nepliget Center in Hungary. Solar panels provide 60 percent of the building’s requirements for hot water. Liquid chillers, designed to reduce energy consumption and operating costs, have been installed and automated low energy lighting prevents unnecessary use of electricity. When Skanska Infrastructure Development undertook the construction of Bristol Brunel Academy, carbon emissions of 40 percent less than the required standard were achieved. Sustainable building methods, including the use of recycled materials, sustainable urban drainage systems and the re-use of rainwater were employed throughout the project.
Eco design projects
0
50
100
150
200
20072006200520042003
A wide range of Eco Design tools are available throughout Skanska’s home markets and business units. The number of projects undertaken during 2007 has risen for the fifth consecutive year.
Number
0
20
40
60
80
100
120
2007200620052004
The number of trained or accredited professionals available within Skanska increased 6 fold in the past four years.
Eco design professionalsNumber
Miljöanpassad design
0
50
100
150
200
20072006200520042003
På Skanskas hemma- marknader och i affärs- enheterna används en rad olika verktyg för miljö- anpassad design. Antalet projekt under 2007 har ökat för femte året i rad.
Antal projekt
0
20
40
60
80
100
120
2007200620052004
Antalet professionellt utbildade eller godkända inom området har i Skanska sexfaldigats under de senaste fyra åren.
Erfarenhet av miljöanpassad design
Antal

Skanska Review of 2007 Sustainable development 55
Earthquake reliefSkanska personnel are closely involved with the construction and operation of coastal installations for the Camisea gas project, a major development situated near Pisco in Peru. The facility is used to separate liquefied natural gas drawn from the Malvinas Gas Plant, which was built by Skanska Latin America. In August 2007, the region was hit by a major earthquake and the city of Pisco was severely damaged, along with neighboring towns. Thousands of Peruvians were left homeless as a result of the disaster, hospitals and other public buildings were badly damaged, with communication systems and the regional airport also being affected. A large number of Skanska personnel were in the area at the time of the earthquake, having been given ongoing responsibility for the maintenance of the Camisea plant. Immediately after the earthquake struck, a Crisis Commit-tee was mobilized. Skanska employees and their families were accounted for and moved initially into an emergency center before being relocated to safe, temporary accommodation. A team of volunteers ensured that food, cloth-ing and clean water were delivered to the Skanska families, as well as many of their neighbors. Meanwhile, the condition of the Camisea installation was carefully checked and work began on restarting the liquid fractioning systems. Emergency lighting was also provided to Pisco’s town square and to the air-port. In the days and weeks following the earthquake, Skanska provided much needed expertise and equipment to help with the disaster relief. In particular, six schools which were severely damaged were quickly demolished, so that temporary accommodation could be erected, enabling classes to continue with a minimum of disruption.
formed apartments will benefit from lower energy con-sumption and operating costs. Elsewhere, in Norway, the reconstruction of an existing building as part of the UN Environment Program saw the GRID-Arendal offices equipped with solar collectors for water heating, flexible internal wall positioning, the use of advanced insulation materials and other energy-saving measures.
Transporting material, equipment and plant to and from construction sites is an inevitable part of Skanska’s activities. To minimize the environmental impact of traf-fic movements , both in terms of carbon dioxide emis-sions and local disruption, at the Clarion Sign Hotel in Stockholm, large building components were brought in by rail from Slovakia, in cooperation with Green Cargo (a Swedish environmentally certified freight transporta-tion organization) and the Swedish Rail Administration. Significantly reducing both the carbon dioxide footprint of the project and shipping costs, it is estimated that Skanska Sweden’s actions saved the equivalent road miles of 30 truck journeys around the world.
Reducing emissions due to vehicle operations is part of Skanska’s Environmental Strategy (2008–2010). The role that vehicle management can play in improving sus-tainability is recognized by Skanska’s new global Green Car policy, introduced to improve fuel efficiency and thus to reduce carbon dioxide emissions throughout the group. All cars owned or leased by Skanska will be cat-egorized according to carbon dioxide emissions. In the short term, new vehicles emitting from 260 to 130 grams per kilometer will be acceptable only when vehicles with lower emissions are not available in local markets. In the medium term, a target of 50 percent of the entire fleet will be replaced by cars that emit less than 130 grams/kilometer, well ahead of the EU target date of 2012.
MaterialsAs well as using materials from local sources wherever possible, the reuse, recycling and minimization of final
waste streams are important aspects of all Skanska projects. At the Corona Train Maintenance Facility, con-structed by Skanska USA Civil, site redevelopment was undertaken in accordance with the Leadership in Energy and Environmental Design (LEED) certification pro-cess. During construction, local suppliers were favoured and 24 percent of the total building supplies used were manufactured from raw materials that were harvested, extracted or recovered from within 800 km (500 miles) of the project site. The priority for the Skanska team was to use sources with low embodied energy or high recycled content. In all, 13 percent of the supplies used were man-ufactured from recycled material.
Ecosystems For many years, Skanska has been actively involved in ecosystem protection, as part of its commitment to reduce the impact of its operations on local flora and fauna. Indirect improvements are best made through considered use of the supply chain. With the trend toward more centralized purchasing, potential exists for more careful selection of major suppliers, to ensure that resources such as timber and quarry products like dimen-sional stone are only obtained from properly recognized, approved systems. Direct improvements in Skanska’s activities are also an important part of current and future operations, particularly where large infrastructure devel-opment projects involve the construction of highways or waterways.
Skanska Poland operates a chain-of-custody policy to ensure that wood is only purchased from sustainable sources. Certificates of conformity from recognized for-estry plans, along with invoices, are tracked and recorded by the purchasing department to ensure that materials meet the required environmental standards. Further work has been done to educate employees on the verifica-tion methods developed by the Forest Stewardship Coun-cil (FSC) and the Program for the Endorsement of Forest
Skanska was the first Swedish company to sign up to the EU Corporate Leaders Group on Cli-mate Change. It was also the first company in the construction sector to do so. The Group’s recent initiatives include the Bali Communiqué, a call by 150 business leaders for a legally binding UN frame-work for tackling climate change. Skanska’s active involvement in the UN Sustainable Buildings and Construction Initiative, its membership in the World Business Council for Sustainable Develoment and external relation-ships with influential groups including the UN Global Compact and UN COP reinforces the Company’s position and commitment in terms of sustainability.

Sust
aina
ble
dev
elop
men
t
56 Sustainable development Skanska Review of 2007
Choosing a sounder environmental solution
Skanska assumed its environmental responsibility beyond the requirements of the law when manu-facturing prefabricated concrete elements in Fre-drikstad, Norway. Shipping the large elements to Oslo required dredging a channel with polluted sediment on the bottom. Public agencies said that this mud could have been dumped at sea. But after a dialogue with various environmental organizations, Skan-ska chose to solve the problem by depositing the material at a landfill, at its own expense.
Certification Schemes (PEFC). Not only has the initiative raised awareness internally of the importance of verifi-able chains of custody, it also ensures that customers can be confident that materials originate from well managed, sustainable supplies.
In Peru, Skanska led a consortium of businesses which provided upstream and downstream process infrastruc-ture for a major gas installation. Designed to reduce the country’s dependence on oil, the Camisea plant was built in close consultation with the Peruvian government, as well as local, national and international NGOs. Extensive stakeholder dialogue was undertaken throughout the project in order to carefully manage the social and envi-ronmental impacts. The related biodiversity monitoring work was undertaken in collaboration with over 100 local guides, government agencies, educational institu-tions and scientists and researchers from South America and elsewhere. Strict provisions for erosion control and immediate reforestation formed an important aspect of the overall system.
Local impacts Considering the impacts on the local community and their environment is a high priority for Skanska. The company regularly operates above and beyond its legis-lated obligation, if there is a cost effective alternative that will benefit the local population. One example of going beyond compliance is provided by Skanska Norway. Concrete elements fabricated in Fredrikstad were des-tined for use in a parking lot deck to be built underwater, to provide the foundations for a new housing project in Tjuvholmen, Oslo. Once completed, the elements were to be transported by barge. However, dredging was neces-sary to increase the depth of the channel.
Investigations showed that the material on the bed of the waterway was contaminated. An environmental assessment proved that there was minimal risk and a proposal was put to the customer and the local govern-
ment to deposit the dredged material in an approved area of the sea bed. Local media and NGOs were concerned about possible contamination and unhappy with the local government’s decision, so Skanska volunteered a more sustainable solution and undertook, at its own expense, to deposit all the contaminated material in a depot facil-ity on land. Skanska consulted closely with local environ-mental organizations during the work.
Economic agendaSharing benefits – adding value to societySustainable societies need strong foundations built on sound legal systems, good social services, effective infra-structure and a high quality environment. All of this takes money, usually derived from companies and indi-viduals in the form of taxes, which ideally are redistribut-ed in an equitable way for the benefit of the whole society. The taxes paid by Skanska and those collected from its employees on behalf of governments are important con-tributors to the creation of well-being in the markets in which we operate. In 2007 the Company reported income tax expenses totaling EUR 167 M, up 16 percent over 2006. Likewise, of the 92 percent of 2007 revenue paid to employees in salaries and to subcontractors and suppliers in contracts, a significant amount will find its way back into society in the form of direct and indirect taxes paid by Skanska’s workforce and commercial partners.
While fulfilling its financial responsibilities to the shareholders, Skanska believes it is important to balance these with ensuring that business decisions are made only when all the risks have been assessed. These risks are not purely financial. They also take into account unacceptable social or environmental issues. Propri-etary risk assessment tools such as the Skanska Tender Approval Process (STAP) and the Skanska Operational Risk Assessment (ORA), allow the efficient and accurate screening of all projects.
Value-added to society
Suppliers, 74%
Employees, 18%
Retained earnings, 5%
Dividends, 2%
Income tax, 1%
Mervärde till samhället
Leverantörer, 74%
Anställda, 18%
Balanserade vinstmedel, 5%
Utdelning, 2%
Inkomstskatt, 1%
Skanska Review of 2007 Financial Review 57
Skanska Financials 2007The financial statements presented in this reviewhave been prepared in EUR (euro) as the presentation currency.
As the functional currency of the Parent Company is SEK (Swedish kronor), Skanska’s Statutory Annual Report including the consolidated financial statements and the financial statements of the parent company has been prepared using Swedish kronor (SEK) as the presentation currency.

58 Financial Review Skanska Review of 2007
Financial Review
The strong construction climate continued during 2007. The Group and its business streams surpassed all their financial targets, with the excep-tion of Residential Development, where the situation in several markets deteriorated. The currently prevailing turbulence in financial markets has not yet had a major impact on the Group’s operations. If the trend moves toward an economic downturn, Skanska will naturally also be affected. Most business units in the Construction business stream showed good earnings, with historically very high margins. The “Outperform” earnings targets established by the Board of Directors three years ago were surpassed by Construction. The business stream’s improvement over time is the result of a strong construction climate but also largely the result of improved risk management and selectivity in bidding. Order bookings increased from an already high level. In Residential Development, there was a general slowdown in both the rate of price increases and sales, especially in the Norwegian and Danish markets. In spite of this, the year ended close to the business stream’s financial “Outperform” targets, with an operating margin of 9.4 percent compared to a target of 10 percent and a return on capital employed of 14.9 percent compared to a target of 18 percent. In Sweden, Finland and the Czech Republic, Residential Development reported good earnings. Capacity shortages and higher material prices had a restraining effect on new project start-ups. The Group’s initiatives in industrialization and coordinated purchasing will be increasingly important in enabling it to reduce the costs of residential construction. In Commercial Development there was continued good demand from the investor market, both in the Nordic countries and in Central Europe, for properties with efficient space in good locations and with a good occupancy rate. This provided a strong market for new development. Twenty-three new projects were started, equivalent to an investment totaling EUR 0.6 billion. Divestments of completed properties were made at prices that exceeded the Group’s market appraisals by an average of about 20 percent. The Group increased its investment activity, and the number of project start-ups was large during 2007. Commercial Development signed leases for more than 300,000 sq. m (3.23 million sq. ft.) of space. The market value of the project portfolio in the Infrastructure Development business stream increased to EUR 0.99 billion (0.70). The Group’s Danish construction operations again showed a negative trend. After a thorough evaluation of the conditions for pursuing successful construction operations in Denmark, Skanska decided to discontinue these operations. By year-end, most of them had been divested or transferred to another unit of Skanska. The phase-out is expected to be completed in 2009. The Group’s residential development and commercial development operations in Denmark are not affected.
Order bookings and backlog Order bookings Order backlog
EUR M 2007 2006 2007 2006
Sweden 3,167.8 2,973.3 2,333.3 2,179.3
Norway 1,434.0 1,337.1 1,179.6 1,074.2
Denmark 323.6 404.7 19.7 222.6
Finland 1,057.2 1,040.3 801.0 775.2
Poland 581.8 612.0 410.6 646.8
Czech Republic 1,010.1 1,261.8 1,264.7 1,448.0
United Kingdom 1,965.1 2,561.2 3,259.3 3,516.1
USA Building 3,740.4 2,711.8 3,336.4 2,889.3
USA Civil 1,910.7 1,199.0 2,380.9 1,887.6
Latin America 631.8 394.1 482.2 302.9
Other 34.1 28.9 1.4 8.1
Total 15,856.4 14,524.2 15,469.0 14,950.1
Order bookings and backlogOrder bookings increased by 9 percent and amounted to EUR 15.8 billion (14.5). Adjusted for currency rate effects, order bookings increased by 13 percent, of which 1 percentage point was acquired order bookings. Currency rate effects were mainly attributable to the weakening of the American dollar against the euro. During 2007, order bookings increased primarily in Skanska’s U.S. and Nordic units. In the U.S., building construction and civil construction operations increased their order bookings by 51 and 74 percent, respectively, in local currency. Among major orders received, it is worth mentioning Skanska’s largest U.S. order to date, which was signed by the Skanska USA Civil business unit. This contract was for a water treatment plant in New York City. Skanska’s share of the contract value was about EUR 0.8 billion. Skanska USA Building was selected to renovate the United Nations headquarters in New York. This assignment has an expected order value of about EUR 0.7 billion and will be completed in phases. The same business unit was commissioned to build a stadium for two NFL football teams, the New York Jets and New York Giants. The contract value totaled about EUR 0.8 billion. In central London, Skanska was awarded a number of large construction assignments, including the Walbrook office and retail center, with a con-tract value of about EUR 0.2 billion, and the Heron Tower office project, worth about EUR 0.4 billion. Skanska reached financial close for the Manor Hospital project in Walsall, England, which is a public-private partnership project. Skanska is investing EUR 11.9 M, equivalent to a 50 percent share in the project company. The consortium is responsible for financing, design, construction and facility management during a 33-year contract period. As a result, Skanska UK received a construction contract worth EUR 0.3 billion. In Norway, Skanska was commissioned to build an underwater parking garage in central Oslo, an assignment worth about EUR 95.1 M. In Brazil, Skanska signed a contract to build a power generating plant outside São Paulo worth about EUR 102.7 M as well as a con-tract to build a steam pipeline with an expected order value of about EUR 84.3 M. Order backlog amounted to EUR 15.5 billion (15.0), equivalent to an increase of 3 percent. Excluding negative currency rate effects of EUR –1.0 billion, the increase amounted to 10 percent. The currency rate effect was mainly attributable to the weakening of the American dollar and the British pound against the Euro. American (North and Latin America), Nordic and other European operations accounted for 40, 28 and 32 percent of order backlog, respectively. Of order backlog, an estimated 62 (60) percent will be completed during 2008.
Order backlogEUR bn
Q1–07
Q2–06
Q3–06
Q4–06
Q3–07
Q4–07
Q1–06
Q2–07
0
5
10
15
20
0
5
10
15
20
Order backlog
Order bookings, rolling 12 month basis
Revenue, rolling 12 month basis
Order bookings per quarter

Skanska Review of 2007 Financial Review 59
RevenueEUR M 2007 2006
Revenue by business stream
Construction 14,322.2 12,829.4
Residential Development 830.1 733.6
Commercial Development 338.3 370.2
Infrastructure Development 12.5 16.3
Central and eliminations –501.5 –375.1
Skanska Group 15,001.7 13,574.3
Revenue increased by 11 percent and totaled EUR 15.0 billion (13.6). Adjusted for negative currency rate effects of EUR 0.3 billion, revenue rose by 13 percent, of which 2 percentage points consisted of acquired growth. In the Construction business stream, revenue increased by 14 percent in local currencies.
Income Operating incomeOperating income amounted to EUR 584.4 M (514.6). Given unchanged exchange rates compared to the previous year, operating income would have been EUR 6.2 M higher.
ConstructionIn the Construction business stream, operating income rose by 33 percent and amounted to EUR 480.5 M (360.5). The operating margin increased to 3.4 (2.8) percent. Margins and earnings rose in most business units and stood at a historically very high level. Six out of ten business units achieved or surpassed the “Outperform” targets they had established. In the United Kingdom, however, both earnings and operating margin declined as a consequence of cost increases that have affected a few long-term projects with fixed-price commitments. During 2007, the Group discontinued most Construction operations in Denmark. After provisions for estimated expenses, however, these operations showed a positive operating income for the year.
Residential DevelopmentIn Residential Development, operating income declined to EUR 78.3 M (92.1). The operating margin in this business stream amounted to 9.4 (12.6) percent. A general slowdown in both price increases and the pace of sales led to lower margins, since the costs of materials and subcontracting services meanwhile continued to rise. In Sweden, Finland and the Czech Republic, the business stream nevertheless reported good earnings. In Norway, Skanska reported some impairment losses for land and provisions for increased construction costs. Earnings in Danish residential development operations were also affected by poorer earnings in a large ongoing project.
Commercial DevelopmentOperating income in the Commercial Development business stream totaled EUR 98.4 M (130.8). Operating income in the business stream included capital gains from property divestments amounting to EUR 113.6 M (136.2), with a total sale price of EUR 302.2 M (320.5). Of this, EUR 28.7 M (15.1) is attributable to ongoing projects that were divested ahead of completion. For these projects, Skanska applies the percentage of completion method. Divestments of completed properties were made at prices that averaged about 20 percent above the estimated market values assigned at the end of 2006.
Infrastructure DevelopmentOperating income amounted to EUR –11.6 M (–0.9). Higher bidding costs for new projects and lower divestment volume explain the lower earnings. Operating income included EUR 7.9 M (12.7) in capital gains on the divestment of project holdings. This was related to the sale of Skanska’s remaining share of Maputo Port, Mozambique.
CentralCentral expenses increased to EUR –60.5 M (–55.5). This item included Group headquarters and central companies as well as provisions in the consolidated financial statements. The amount included infringement fines of EUR 18.4 M for anti-competitive activi-ties levied as a result of court rulings in Sweden and EUR 1.4 M for such fines in Finland. The International unit, with a number of businesses that are being phased out or shut down, accounted for EUR +12.3 M of this item.
Eliminations of intra–Group profitsIn the consolidated financial statements, Skanska eliminates such items as profits in Construction operations related to property and infrastructure projects equivalent to the Group’s share of ownership of these projects. These eliminations are reversed over the depreciation/contract period or when the projects are divested. The year’s elimination of intra-Group profits amounted to EUR –0.6 M (–12.3).
EUR M 2007 2006
Operating income
Construction 480.5 360.5
Residential Development 78.3 92.1
Commercial Development 98.4 130.8
Infrastructure Development –11.6 –0.9
Central –60.5 –55.5
Eliminations –0.6 –12.3
Operating income 584.4 514.6
Net interest items 49.9 32.3
Change in fair value –11.2 –12.8
Other financial items –10.5 4.5
Net financial items 28.2 24.1
Income after financial items 612.6 538.7
Taxes –167.1 –143.7
Profit for the year 445.5 395.0
Profit for the year attributable to
Equity holders (shareholders) 442.8 392.8
Minority interest 2.7 2.2
Earnings per share for the year, EUR 1.06 0.94
Income after financial itemsNet financial items totaled EUR 28.2 M (24.1). Net interest income improved to EUR 49.9 M (32.3). Due among other things to higher average interest rates and improved financial items related to defined-benefit pension plans, interest income rose to EUR 67.8 M (43.9). Capitalization of interest expenses in ongoing projects for Skanska’s own account totaled EUR 6.6 M (3.7). The net change in the fair value of financial instruments amounted to EUR –11.2 M (–12.8). These were mainly related to negative interest rate differences in currency hedging of investments in Infrastructure Development in Latin America as well as currency hedging of Skanska’s equity denominated in American dol-lars. Other financial items amounted to EUR –10.5 M (4.5) and mainly consisted of currency rate differences plus various financial fees, mainly related to Latin American operations.

60 Financial Review Skanska Review of 2007
Profit for the yearAfter subtracting the year’s tax expenses of EUR –167.1 M (–143.7), profit for the year attributable to equity holders amounted to EUR 442.8 M (392.8). The effective tax rate was 27 (27) percent. Earn-ings per share amounted to EUR 1.06 (0.94).
Residential, Commercial and Infrastructure Development
Breakdown of carrying amount, current-asset properties, Dec 31, 2007Residential Commercial
EUR M Development Development Construction Total
Completed projects 36.1 237.0 12.8 285.9
Ongoing projects1 93.8 264.7 11.5 370.0
Undeveloped land and development properties 525.2 160.9 54.8 740.9
Total 655.1 662.5 79.2 1,396.8
1 The amount EUR 264.7 M includes projects completed in 2007 totaling EUR 37.3 M.
Residential DevelopmentAt the end of 2007, the Group had 5,593 (6,487) residential units under construction. Of these, 73 (81) percent were sold. The number of completed unsold residential units totaled 293 (119). During the year, construction began on 4,196 (4,715) units. In the Nordic countries, the number of residential units started was 3,480 (4,234), while in other markets (the Czech Republic and Slovakia) they totaled 716 (481). The number of residential units sold was 3,858 (4,486). In the Nordic countries, the number of units sold totaled 3,211 (3,862), while sales in other markets rose to 647 (624) units. The carrying amount of current-asset properties in Residential Development totaled EUR 0.66 billion (0.59). Of this, undeveloped land and development properties (the “land bank”) were reported at EUR 0.53 billion (0.48). This was equivalent to building rights for about 21,700 residential units. In addition, under certain circumstances Skanska has options to acquire a further 8,700 building rights. There were also about 2,100 building rights in associated companies.
Commercial Development
EUR M
Carrying amount,
end of period
Carrying amount
upon com-pletion
Market value,
Dec 31, 2007Occupancy
rate, %
Degree of comple-tion, %
Completed projects 237.0 237.0 338.9 90 100
Projects completed in 2007 37.3 37.3 46.9 82 100
Undeveloped land
and development properties (land bank) 160.9 160.9 214.8
Subtotal 435.1 435.1 600.6
Ongoing projects 1 227.4 674.9 264.6 58 35
Total 662.5 1,110.0 865.2
1 Market value refers to accrued market value
The carrying amount of current-asset properties in Commercial Development was EUR 0.67 billion (0.62). Commercial Development had 22 projects underway, 15 of them in the Nordic countries. Ongoing projects represented leasable space of about 354,000 sq. m (3.81 million sq. ft.), of which 58 percent was pre-leased. In addition to these projects, 10 projects with 84,000 sq. m (904,000 sq. ft.) of leasable space were sold before completion, with a pre-leasing level of 100 percent on the divestment date. At year-end, the carrying amount for ongoing projects was EUR 0.22 billion (0.09). The carrying amount upon completion is expected to total EUR 0.68 billion, with an estimated market value of EUR 0.86 billion, of which EUR 0.26 billion had been accrued at the end of 2007. The degree of completion in ongoing projects was about 35 percent. Expected yield of ongoing projects, based on carrying amount, was estimated at about 8 percent. The carrying amount of Skanska’s portfolio of completed properties amounted to EUR 0.23 billion (0.28), with an estimated market value of about EUR 0.34 billion (0.39). This estimate was partially made in col-laboration with external appraisers. The occupancy rate, measured in rent, amounted to 90 (70) percent. Including properties that were recognized as completed on January 1, 2008, estimated total market value amounted to some EUR 0.38 billion (0.45), with a corresponding carrying amount of EUR 0.28 billion (0.32). The change in market value of an identical portfolio of completed properties, adjusted for investments, amounted to about EUR 5.3 M, which was equivalent to an increase of about 1 percent. The carrying amount of undeveloped land and development properties (building rights) totaled about EUR 0.16 billion (0.20), with an estimated market value of EUR 0.21 billion.
Other commercial properties“Other commercial properties” are part of the Construction business stream. The gain on property divestments, including reversals of intra-Group profits, totaled EUR 23.5 M (10.7). The carrying amount at year-end was EUR 79.2 M (105.7).
Infrastructure developmentThe Infrastructure Development business stream is part owner of 15 proj-ects, of which 11 are fully or partially in operation. At year-end 2007, the carrying amount of shares, participations, subordinated loans and con-cessions in the business stream totaled about EUR 0.26 billion (0.26). Remaining investment obligations related to ongoing projects nominally amounted to about EUR 0.12 billion (0.10), with a present value of about EUR 0.08 billion (0.07). The gain on divestments made during the year, including reversals of intra-Group profits, amounted to EUR 8.2 M (13.5). Skanska conducts an annual appraisal of the Infrastructure Develop-ment project portfolio. The appraisal that was carried out at year-end 2007 encompassed an update of the financial models and a review of the yield requirements applied. The assessment of market value was made in collaboration with external appraisal expertise. Market value consists of estimated present value of cash flow in the form of dividends and repayments of loans and equity from projects and amounted to about EUR 0.99 billion (0.70) on the appraisal date. The appraisal does not take into account the potential for future refinancing of projects. The weight-ed discount rate used in the appraisal was 11.1 (11.7) percent, as a con-sequence of reduced risk premiums. The long-term discount rates were left unchanged compared to the preceding year. The appraisal includes the Ponte de Pedra project, which was divested after year-end, at its sale price. The increase in the present value of cash flows was attributable to time value as well as higher cash flows in absolute numbers than were estimated a year earlier. A change related to taxation of project dividends resulted in an increase in present value totaling about EUR 0.11 billion.
Earnings per share
2003 2004 2005 20060.0
0.2
0.4
0.6
0.8
1.0
1.2
2007
EUR

Skanska Review of 2007 Financial Review 61
InvestmentsThe Group’s investments totaled EUR –1,059.6 M (–1,059.3). Divest-ments totaled EUR 1,059.9 M (935.5). On a net basis, the Group divested EUR 0.3 M (–123.9). Investments in property, plant and equipment, which were mainly related to continuous replacement investments in operations, increased to EUR –204.7 M (–186.8). Depreciation on property, plant and equip-ment during the year amounted to EUR –127.6 M (–115.8). Investments in the form of equity and subordinated loans in the Infrastructure Development business stream amounted to EUR –7.9 M (–30.9). The same business stream sold EUR 19.2 M (20.8) in assets. Divestments consisted of to Skanska’s holding in Maputo Port, Mozambique and repayments of subordinated loans. Skanska made net divestments in current-asset properties totaling EUR 127.7 M (80.7). Projects were sold for EUR 958.2 M (844.2), while investments amounted to EUR –830.5 M (–763.4). This included projects carried out in the Residential Development and Commercial Development business streams and “Other commercial properties.” In Residential Development, investments declined to EUR –538.6 M (–556.9), of which about EUR 0.19 billion was related to purchases of land equivalent to about 6,600 building rights. The net increase in the number of building rights during the year was about 2,300 units. Resi-dential units were sold for an amount of EUR 583.0 M (481.5). Net divestments were EUR 44.3 M (–75.4) in Residential Development operations.
In Commercial Development, investments increased to EUR –255.3 M (–177.1). Of this, about EUR 35.1 M was related to investments in land for new development. Divestments in the form of sale of completed properties and ongoing projects decreased to EUR 302.2 M (320.5). Commercial Development carried out net divestments of EUR 46.9 M (143.4). Strategic net divestments amounted to EUR 12.8 M (–57.5). Compa-nies were acquired at a cost of EUR 8.0 M. Companies, shares and other assets were divested in the amount of EUR 20.8 M. The Slovakian com-pany Stamart Martin s.r.o. was consolidated during the year. Most of Skanska’s Danish construction operations were discontinued during the latter part of 2007. The sale price was about EUR 20.5 M. Cash flow
The Group’s operating cash flow
EUR M 2007 2006
Cash flow from business operations before change in working capital 463.3 376.3
Change in working capital 479.1 9.7
Net investments in the business –12.4 –66.4
Adjustments in payment dates of net investments 31.6 44.1
Taxes paid in business operations –121.9 –112.4
Cash flow from business operations 839.6 251.4
Net interest items and other financial items 18.6 9.7
Taxes paid in financing activities –5.6 –2.9
Cash flow from financing activities 13.0 6.8
Cash flow from operations 852.6 258.2
Net strategic investments 12.8 –57.5
Taxes paid on strategic divestments –1.8 0.0
Cash flow from strategic investments 10.9 –57.5
Dividend etc. –373.8 –293.1
Cash flow before change in interest-bearing receiv-ables and liabilities 489.7 –92.4
Change in interest-bearing receivables and liabilities –169.8 –160.8
Cash flow for the year 319.9 –253.2
Cash and cash equivalents, January 1 1,213.2 1,456.3
Reclassifications in cash and cash equivalents 43.2 0.0
Exchange rate differences in cash and cash equivalents –72.6 10.1
Cash and cash equivalents, December 31 1,503.8 1,213.3
Cash flow for the year amounted to EUR 319.9 M (–253.2). Cash flow from business operations increased to EUR 839.6 M (251.4). Stronger earnings in Construction are the main explanation as to why cash flow from business operations before change in working capital increased to EUR 463.3 M (376.3). Reduced tied-up working capital in Construction was the primary reason that working capital contributed EUR 479.1 M (9.7) to positive cash flow. The underlying causes included a sharply higher invoicing surplus compared to project costs. However, sizable invoiced amounts related to project costs were paid early in 2008. Net investments in the business affected cash flow in the amount of EUR –12.4 M (–66.4). In Residential Development, cash flow increased as a consequence of higher divestment volume in relation to investment volume, while Commercial Development decreased its cash flow as an effect of lower divestment volume of projects and completed properties, as well as higher investments in ongoing projects. The positive cash flow from net strategic divestments was attrib-utable to divestments of businesses and shares in a net amount of EUR 10.9 M (–57.5). Taxes paid amounted to EUR –129.4 M (–115.3). Dividends and adjustments of minority interest amounted to EUR –373.8 M (–293.1). The item “Changes in interest-bearing receivables and liabilities” showed a negative cash flow of EUR –169.8 M (–160.8).
Investments/Divestments
EUR M 2007 2006
Operations – Investments
Intangible assets –4.1 –4.1
Property, plant and equipment –204.7 –186.8
Assets in Infrastructure Development –7.9 –30.9
Shares –4.3 –0.3
Current-asset properties –830.5 –763.4
of which Residential Development –538.6 –556.9
of which Commercial Development –255.3 –177.1
of which other commercial properties –36.5 –29.4
Investments –1,051.6 –985.5
Operations – Divestments
Intangible assets 0.2 0.2
Property, plant and equipment 54.8 53.6
Assets in Infrastructure Development 19.2 20.8
Shares 6.7 0.4
Current-asset properties 958.2 844.2
of which Residential Development 583.0 481.5
of which Commercial Development 302.2 320.5
of which other commercial properties 73.0 42.1
Divestments 1,039.1 919.2
Net investments in operations –12.4 –66.4
Strategic Investments
Acquisitions of businesses –8.0 –73.8
Strategic investments –8.0 –73.8
Strategic Divestments
Divestments of businesses 20.8 15.1
Shares 0.0 1.2
Strategic divestments 20.8 16.3
Net strategic investments1 12.8 –57.5
Total investments1 0.4 –123.9
Depreciation/amortization, non-current assets –139.1 –124.0
1 Positive figures are divestments.

62 Financial Review Skanska Review of 2007
Financing and liquidityAt year-end 2007, the Group had interest-bearing net receivables, including provisions, amounting to EUR 1,543.1 M (1,147.6). The proportion of interest-bearing net assets in foreign currencies, after taking derivatives into account, increased to 76 (43) percent. A large part of this increase was attributable to higher financial assets in North American operations. Interest-bearing assets rose to EUR 2,054.7 M (1,707.7). The average interest rate refixing period for all of the Group’s interest-bearing assets was 0.1 (0.2) years, and the interest rate averaged 4.01 (3.26) percent at year-end.
Change in interest-bearing assets and liabilitiesEUR M 2007 2006
Net receivables (+)/Net debt (–),January 1 1,147.6 1,183.0
Cash flow from business operations 839.6 251.4
Cash flow from financing activities excluding changes in interest-bearing liabilities and receivables 13.0 6.8
Cash flow from strategic investments 10.9 –57.5
Dividend etc. –373.8 –293.1
Acquired/divested interest-bearing liabilities 0.4 2.4
Exchange rate differences –48.3 18.3
Change in pension liability 12.2 70.4
Reclassifications –43.0 –27.2
Other changes –15.6 –6.8
Net receivables (+)/Net debt (–), December 31 1,543.1 1,147.6
The Group’s interest-bearing liabilities and provisions decreased to EUR 511.6 M (560.0). The average interest rate refixing period for all interest-bearing liabilities, excluding pension liability, was 0.5 (0.9) years, and the average maturity amounted to 2.3 (2.4) years. The average interest rate for all Group interest-bearing liabilities, excluding pension liability, amounted to 3.84 (4.00) percent at year-end. The proportion of loans in foreign currencies decreased to 49 (53) percent. At year-end, the Group’s unutilized credit facilities amounted to EUR 774.5 M (694.1).
Return on equity and capital employedThe equity of the Group attributable to equity holders amounted to EUR 2,171.0 M (2,122.3). Return on equity increased to 21.1 (20.5) percent. Aside from profit for the year, EUR 442.8 M, the change in equity is explained by disbursement of a dividend of EUR 373.3 M to the share-holders as well as negative currency translation differences of about EUR 25 M. Capital employed amounted to EUR 2,704.8 M (2,698.6) at year-end. Return on capital employed increased to 25.1 (22.6) percent.
Equity/assets and debt/equity ratioThe equity/assets ratio decreased to 26.3 (27.1) percent. The net debt/equity ratio was –0.7 (–0.5).
Principal risks and uncertaintiesThe construction business is largely about risk management. Practically every project is unique. Size, shape, environment − everything varies for each new assignment. The construction industry differs in this way from a typical manufacturing company that has permanent facilities and serial production. In Skanska’s operations there are many different types of contractual mechanisms. The degree of risk associated with the prices of goods and services varies greatly depending on the contract type. Sharp increases in material prices may pose a risk, especially in long-term projects with fixed-price commitments. Shortages of human resources as well as certain input goods may also adversely affect
operations. Delays in the design phase or changes in design are other circumstances that may adversely impact projects. To ensure a systematic and uniform assessment of construction projects, Skanska uses a common model for identifying and managing risks throughout the Group. With the help of this model, Skanska evaluates construction projects continuously, from tender preparation to completion of the assignment, with regard to technical, legal and financial risks. In Residential Development operations, there are risks in all stages from concept to completed project. Such external factors as interest rates and the willingness of customers to buy housing units are of crucial importance to all decisions in the process. Housing units are built to be sold individually. To minimize risks, the goal is to completely develop and sell the units in a given project during a single economic cycle, when variations in market conditions are small and predictable. New projects are started after a predetermined percentage of units is sold or pre-booked. Greater standardization, with shorter lead times, reduces the period of exposure and thus the risk of fluctuations in market demand. Due to lengthy planning and permitting processes, ample lead time is required to ensure a supply of building rights (a “land bank”) that will meet demand. Commercial Development manages risks connected with external factors, customers’ leasing needs and the willingness of investors to buy commercial projects. By means of frequent customer contacts, Skanska tracks the leasing requirements of customers continuously. Risks are limited because the business stream has an established ceil-ing on how much capital may be tied up in projects that have not been pre-leased or sold. Investments made in Infrastructure Development operations require efficient risk management during the development phase, that is, before and after financial close. During the construction phase, the greatest risk is that the asset cannot go into service on schedule and that quality standards are not met. When Skanska performs the construction assignment itself, this risk is substantially lower. Depending on the type of asset, there are risks during the entire implementation phase, which may extend over decades. Examples of such risks are external factors − demographic, environmentally related and financial − that are managed during the service life of a project. For a further account of principal risks and uncertainties, see the sec-tion on market outlook as well as Note 2, “Key estimates and judgments.” Financial risks are described in Note 6, “Financial instruments.” Ongoing litigationIn the Swedish Competition Authority’s suit requesting infringement fines, Stockholm City Court issued a ruling in July 2007. According to the ruling, all seven companies that were involved in the case − which concerns alleged collusive anti-competitive practices in the asphalt and civil construction sectors − were ordered to pay infringement fines. Skanska’s portion of these fines amounted to EUR 18.4 M. The Competi-
Return on equity and return on capital employed
Return on equity
Return on capital employed
2003 2004 2005 2006 20070
5
10
15
20
25
30
0
5
10
15
20
25
30%
Equity/assets ratio and debt/equity ratio
times
Equity/assets ratio (%)
Debt/equity ratio
2003 2004 2005 2006 20070
5
10
15
20
25
30
0
5
10
15
20
25
30
–0.8
–0.7
–0.6
–0.5
–0.4
–0.3
–0.2
–0.1
0.0%

Skanska Review of 2007 Financial Review 63
tion Authority had requested that Skanska’s portion should total EUR 60.2 M. Skanska has decided not to appeal the City Court’s ruling, and the case is thus over as regards Skanska. Skanska and another company have been sued by a number of Swedish municipalities that maintain that they have suffered damage in procurements alleged to have been the object of collusive cartels between the contractors. Skanska has been sued for a total of EUR 6.0 M. Skanska denies the allegations. In Finland, the Market Court issued a ruling in December 2007 in the Finnish Competition Authority’s suit against a number of companies in the civil construction sectors, among them Skanska, concerning alleged collusive anti-competitive activities. The Market Court ordered Skanska to pay the equivalent of EUR 1.4 M in infringement fines. The Competition Authority had sued for about EUR 10.8 M. Skanska decided to appeal the ruling after the Competition Authority had appealed the ruling. In October 2006, Slovakia’s competition authority decided to fine six companies that had participated in tendering for a road project. Skan-ska was part of a joint venture led by a local Slovakian company. The fine in Skanska’s case is the equivalent of EUR 7.2 M and was charged to 2006 earnings. Skanska denied the Authority’s allegations and has requested that the decision be reviewed by a court of law. The court case is underway.
Changes in the Board of Directors and Senior Executive TeamAt the Annual Shareholders’ Meeting in April 2007, Board members Roger Flanagan and Ulrika Francke resigned. Sir Adrian Montague and Matti Sundberg were elected as new Board members. The Annual Meeting re-elected Sverker Martin-Löf as Chairman of the Board. Among the Board members appointed by employee organizations, Folmer Knudsen resigned as a regular member and was replaced by Inge Johansson. Richard Hörstedt was appointed as a new deputy member. No changes occurred in the Senior Executive Team during 2007. At its meeting on February 6, 2008, the Board of Directors appointed Johan Karlström as the new President and CEO of Skanska. He succeeded Stuart Graham, who had previously notified the Board that he would step down as President and CEO during 2008. Mr. Karlström assumed his new position on April 3, 2008 in conjunction with the Annual Shareholders’ Meeting of Skanska. Sustainable developmentDuring 2007 Skanska carried out numerous activities to adapt its sustainable development work to best practices. One starting point was the Triple Bottom Line concept, which means that companies generate financial results that are sustainable in the long term by reducing their environmental impact and acting in accordance with the expectations of society at large. Another is the international sustainability reporting guidelines published by the Global Reporting Initiative (GRI). The task of contributing to the creation of sustainable development is challenging, given the Group’s decentralized business model and project-based working methods. Based on the GRI guidelines for sus-tainability reporting, during 2007 Skanska prioritized between activities of a general nature and such activities that are of a more local nature and that must be decided upon by individual business units. For a project-based company like Skanska, it is difficult to manage operations using conventional sustainability-related targets and key figures, because its operations are constantly changing shape as projects are completed and started. During 2008 the task of better identifying and developing suitable key figures will continue. The task of analyzing operations in light of the GRI guidelines for sustainability reporting has led to the identification of areas where fur-ther efforts are needed. One of the most important new activities was an emphasis on greater social commitments. A new policy document was introduced during 2007 and will mean an increased focus on training and safety. During 2007 Skanska continued to play an internationally proactive role by promoting good practices in a number of fields – such as supporting the development of ISO 26000, an new international standard for social
responsibility, providing economic support and taking other steps to promote energy efficiency in buildings, through the influential New York Academy of Sciences and by being the first construction company and the first Swedish-based company to join the respected EU Corporate Leaders Group on Climate Change (EU CLG). One important contribu-tion from EU CLG during the year was the Bali Communiqué, a report supporting the EU and its progressive policy on climate change in the run-up to the global governmental meeting in Indonesia. The report was signed by more than 150 of the largest companies in the world. With support from Skanska, together with a group of leading companies from other industries, the international secretariat of ChemSec (a non-gov-ernment organization, or NGO) is continuing its work to reach agreement on a list of harmful substances that should be phased out. The list is being compiled by affected parties worldwide. Skanska’s commitment to the UN Global Compact and Global Compact Nordic Network also continued during 2007. A safe working environment for all Skanska employees and subcon-tractors is a top priority. During the year, 57 percent of the workforce worked according to an occupational health and safety management system certified under OHSAS 18000 standards. The Safety Performance Network, which consists of highly qualified safety experts at Skanska, met twice during the year. In 2007 this network developed a new safety policy document, new safety guidelines and four new safety standards, which will strengthen and improve current practices. The common monthly reporting system developed during 2006 also went into full operation during the year, and further improvements were made in reporting and presenting data on the number of accidents and fatalities. As during the previous two years, Skanska held its Safety Week in October, whose theme was the importance of always being well-prepared. The total frequency of accidents during 2007 was more or less unchanged and stood at 5.9 (5.8) per 1,000,000 hours worked. The number of work-related fatalities increased to 8 (6), of whom 7 were subcontractors. During the past two years (2006–2007), the number of work-related fatalities was sharply lower than during the preceding four years (2002–2005). This trend can be ascribed, among other things, to the work performed by the safety network, which was established late in 2005. During 2008 further efforts are planned in order to achieve the zero-accidents vision. No serious violations were reported during 2007 related to the section of the Skanska Code of Conduct that deals with business ethics. During the year, the Code of Conduct published in 2002 was revised. The updated Code reflects changes and best practice developments that occurred in the preceding five years, among other things coordination with the GRI international guidelines for sustainability reporting. The revised Code of Conduct will be published in early 2008. Skanska is continuing to work on behalf of responsible environmental management and toward its goal of zero environmental incidents. Dur-ing the year, 95 percent of Skanska’s employees worked in accordance with environmental management systems certified as meeting ISO 14001 standards. In response to requirements for carrying out certain projects, Skanska obtained environmental permits from the appropriate public agencies. Implementation and monitoring then took place within the Group’s environmental management system. During the year, many changes were introduced in local, regional, national and international environmental legislation. These changes are identified and administered within the environmental management systems of each respective business unit. At the international level, it is worth mentioning the continuously ongoing improvements and devel-opment of legislation and other regulatory instruments − among them emission trading systems − that affect energy efficiency and climate change. For a company like Skanska, these changes are generally positive, because they lead to demands for more efficient buildings. This gives Skanska an opportunity to adapt its products and services to the new markets that will arise on the basis of this, while requiring reductions in the environmental impact of travel, vehicles, heavy equipment and offices.

64 Financial Review Skanska Review of 2007
A new environmental policy document was approved by Skanska’s Senior Executive Team and a new three-year strategy was adopted, for the first time including a number of global key figures. This strategy is especially formulated to operate side by side with the 2008–2010 busi-ness plan and to be better integrated with important business functions. As one element of the Group’s efforts to reduce its energy needs and the related climate change risks, Skanska has continued its commitment to two international initiatives – the United Nations Sustainable Building & Construction Initiative (SBCI) and the World Business Council for Sustainable Development’s Energy Efficiency in Buildings (EEB) project. The number of construction projects with externally certified environmental assessment tools, for example LEED (United States) and BREEAM (United Kingdom), increased to 141 (124), which indicates that “green building” is a growing market for Skanska. For this purpose, late in 2007 Skanska decided to establish a unit that will promote green building throughout the Group and in each respective home market. Meanwhile the number of employees accredited to handle these environmental assessment tools rose to 116 (50). During 2007 no serious environmental incidents were reported by Skanska’s business units. A total of 135 (167) environmental management audits were performed by external ISO 14001 certification organizations. In addition to these, 1,019 (1,177) internal audits took place. Human resourcesThe average number of employees during 2007 was 60,435 (56,085), including 10,963 (10,631) in Sweden. Employee turnover was at a normal level, and the number of employees who left the Group of their own volition (excluding retirements) was kept below the 10 percent target. The overall goals of the Group’s human resource work are to recruit, develop and retain employees as well as to increase diversity and achieve more even gender allocation among the Group’s employees. During 2007 Skanska focused especially on recruitment and diversity issues. Goal-oriented recruitment is vital in order to secure a supply of capable employees in the future. Each business unit has worked out its own recruitment plans to ensure that recruitment goals are achieved. The need for recruitment is expected to increase by 50 percent compared to the previous three-year period. To support local activities, in 2007 the Group developed a new offer to potential employees to increase its attractiveness. This includes a program called Skanska Unlimited, in which new employees are offered 6-months of practical training at a Skanska unit in another country. Developing and retaining Group employees includes working with annual employee surveys in order to obtain a picture of job satisfaction, morale and professional development needs. The 2007 employee survey showed that these efforts have had an impact. Employee satisfaction reached a new peak during the year. One of the most important elements of employee satisfaction is the degree of professional development that an employee experiences. This is why the Group focuses on creating a positive learning climate between supervisor and employee, giving employees opportunities for new, growth-stimulating assignments and providing special training to hone their skills. At the Group level, this includes the Skanska Top Executive Program (STEP), provided in collaboration with the business school IMD in Switzerland. There are also other management training programs at large business units, which enable employees at various levels to obtain relevant training. To strengthen opportunities for an international career, Skanska also initiated an international program aimed at making it easier for employees to obtain short- or long-term assignments in another business unit. Annual employee development dialogues are another important component in efforts to retain and develop employees. The Group also monitors long periods of absence from work due to illness. Increasing diversity implies, among other things, seeking new employees outside the traditional pool of male engineers. Each business unit has targets for diversity in terms of gender, ethnicity and education-al background. Skanska has also created a Groupwide diversity team that will document and monitor best practices for achieving these targets.
For Swedish operations, the target has been that 35 percent of all newly recruited engineers should be women. This target was achieved during 2007. Another important issue has been to ensure that the percentage of female engineers who leave the Group of their own volition should not be higher than the corresponding percentage for male engineers. Activities carried out to achieve a more even gender bal-ance include continuous monitoring of efforts to achieve this target, establishment of a network for women in construction and intensified efforts in the Senior Executive Team to stimulate a change of attitudes and behaviors in the Group.
Remuneration to senior executivesFor information about the most recently approved guidelines for determining salaries and other remuneration to the President and CEO as well as other executive officers, see Note 37, “Compensation to executive officers and Board members.”
Guidelines for determining salary and other remuneration to the CEO and other senior executivesOn April 3, 2008, the Annual Meeting approved the following guidelines for salary and other remuneration to senior executives. Remuneration to the CEO and other senior executives shall consist of fixed salary, variable remuneration if any, other customary benefits and pension. The other senior executives include the CFO and other Executive Vice Presidents. The combined remuneration for each execu-tive must be competitive in the labor market in which the executive is active, and distinguished performance shall be reflected in the total remuneration. Fixed salary and variable remuneration shall be related to the senior executive’s responsibility and authority. The variable remuneration shall be payable in cash and/or shares and it shall be capped and related to the fixed salary. Distribution of shares shall have a vesting period of three years and be part of a long-term incentive program. The variable remuneration must be based on results in relation to targets and must be aligned with the interests of the shareholders. In case of employment termination, the normal period of notice is six months. Severance pay may correspond to a maximum of 24 months of fixed salary, with the exception of the CEO, to whom a maximum of 30 months of severance pay is payable. Pension benefits should be either defined-benefit or defined-contri-bution schemes, or a combination of these, and should entitle the execu-tive to the right to receive a pension from the age of 65. However, a pen-sion age of earliest 60 years may be granted under special circumstances. For defined-benefit plans, years of service required for fully earned benefits shall normally correspond to the years of service required for general pension plans in the same jurisdiction. Variable salary shall not be included in pensionable salary except when it follows from the rules under a general pension plan. The Board of Directors may under special circumstances deviate from these principles in individual cases. Matters related to remuneration to senior executives are decided by the Compensation Committee and, when it comes to the CEO, are decided by the Board of Directors. Long-term share incentive program, 2005–2007The Skanska Share Award Plan applied during 2005–2007, with dis-bursements in the form of Skanska shares during 2009–2011, and covers about 300 managers. Aside from financial targets, the Plan includes targets for health and safety, environmental impact, business ethics, fewer loss-making projects and management development as criteria for share award allocation. The Plan may provide a maximum 30 percent addition to fixed annual salary. A reconciliation of how financial and qualitative targets were met led to an average outcome in addition to fixed salary of about 15 percent for 2005, about 18 percent for 2006 and about 18 percent for 2007 in allocations to those managers included in the Plan. The allocation for 2007 will be established and finally approved in April 2008.

Skanska Review of 2007 Financial Review 65
The cost for the Plan excluding social insurance contributions amounted to about EUR 17.7 M, allocated over four years, equivalent to 1,244,860 shares. The cost during 2007 of the 2005–2007 program amounted to EUR 4.2 M. To receive share awards, those included in the Plan must be employees of the Skanska Group for three years after the end of the measurement period. The dilution effect during 2007 is estimated at 527,392 shares or 0.13 percent of the number of shares outstanding. The maximum dilution for the Plan at the end of the vesting period in 2011 will total 1,244,860 shares or 0.3 percent. To ensure the delivery of Series B shares, Series D shares held by the Company will be converted into Series B shares at the end of each respective vesting period and will be delivered free of charge to those covered by the Plan.
New long-term Employee Ownership Program, 2008–2010 In November 2007, an Extraordinary Shareholders’ Meeting approved the introduction of a long-term share ownership program for all permanent employees of the Skanska Group. The program replaces the three-year share incentive program for senior executives, which expired during 2007. The share ownership program also replaces the Profit Sharing Foundation for the employees of the Swedish companies in the Skanska Group and the incentive program for certain employees active in Skanska’s American operations. The purpose of the program is to strengthen the Group’s ability to retain and recruit qualified personnel and to align employees more closely to the Company and its shareholders. The program gives employees the opportunity to invest in Skanska shares while receiving incentives in the form of possible allocation of addi-tional share awards. This allocation is predominantly performance-based. The program is proposed to contain no more than 13,500,000 Series B shares and will be aimed at the approximately 47,000 permanent employees in the Group, including some 2,000 key employees and about 300 executives. These employee groups will be offered an opportunity to invest in Skanska shares. The investment is maximized at 5, 7.5 and 10 percent, respectively of gross salary for these employee groups. For each four Series B shares acquired, the employee will be offered one “match-ing” share free of charge. In addition, for every four Series B shares the employee may receive an additional 3–15 “performance” shares in the Company, depending on job position and based on how earnings-based performance conditions are met. These are based on the “Outperform” targets that Skanska’s Board of Directors decides yearly. The Board also has the option of reducing the allocation of shares. The program runs for three years, 2008–2010, with allotment of shares earned by the employees not taking place until after a three-year vesting (or “lock-up”) period, i.e. during the years 2011–2013. To be able to earn matching and performance shares, a person must be employed during the entire vesting period and have retained the shares purchased within the framework of the program. The total cost of the program will be limited by a cost ceiling, meaning that Skanska’s total cost for each year’s program may not exceed 15 percent of operating income or a maximum of EUR 66.7 M. The programs now being replaced had a total maximum annual cost of EUR 52.4 M. For further information, see Note 26, “Equity/Earnings per share,” and Note 37, “Remuneration to senior executives and Board members.”
Repurchases of sharesThe Board of Directors has decided to exercise its authorization by the Extraordinary Shareholders’ Meeting for Skanska to acquire its own Series B shares. The Meeting’s authorization may be exercised on one or more occasions, but no later than before the Annual Shareholders’ Meeting in 2008. The maximum acquisition is 4,500,000 shares and the purpose of the acquisition is to ensure delivery of shares to the participants in the Skanska Employee Ownership Program. Acquisition may only
occur at a price within the applicable share price interval on the OMX Nordic Exchange Stockholm on each occasion. The Board of Directors proposed that the Shareholders’ Meeting in 2008 authorize the Board to decide on acquisition of 4,500,000 Series B shares under the same conditions. This authorization may be exercised no later than before the Annual Shareholders’ Meeting in 2009. Skanska has held 4,500,000 of its own Series D shares since an earlier date.
Annual MeetingThe Annual Meeting was held on April 3, 2008 in Stockholm, Sweden.
DividendThe Annual Meeting adopted a regular dividend of SEK 5.25 (4.75) per share (corresponding to EUR 0.56 [0.53] per share) and an extra divi-dend of SEK 3.00 (3.50) per share (corresponding to EUR 0.32 [0.39] per share) for the 2007 financial year, totaling SEK 8.25 (8.25) per share (equivalent to EUR 0.88 [0.92] per share). This was equivalent to a total dividend payout of SEK 3,453 M (3,453) (corresponding to EUR 365.4 [381.9]).
Market outlookConstructionThe outlook for building construction has continued to be positive in Skanska’s main markets and especially in the Nordic markets and in Central Europe even though the growth rate is expected to decrease. In these markets, retail space and office buildings are among the stronger segments. In the United Kingdom, the market in Skanska’s segments also remains stable. In the American building construction market, Skanska’s largest segments – healthcare and education – remain strong, so far without signs of any slowdown. The market outlook in the Nordic as well as Central European civil construction markets remains positive. The outlook for American civil construction is stable and especially good in New York. The financial market turmoil around the world has not yet resulted in any noticeably change in requests for proposals from customers.
Residential DevelopmentThe underlying demand for residential units remains good in Sweden, Norway and Finland but housing markets are slowing down due to uncertain economic conditions. In several markets, home prices have leveled off or even fallen. Due to interest rate hikes and stricter lending practices, fewer people have an opportunity to buy a new home, which is leading to downward pressure on prices. A number of submarkets have had an oversupply for some time, for example Copenhagen. In Norway, because of higher interest rates and very high prices − driven by increased construction costs − the market will see fewer project start-ups and longer sales periods. In the Czech Republic and Slovakia, the housing market is showing continued good demand.
Commercial DevelopmentVacancy rates in modern properties in the office markets of Scandina-via and parts of Central Europe are declining, and rents are rising. As a consequence of increasing project activity, investments are growing. In Scandinavia as well as Central Europe, there is continued good demand from the investor market for properties with efficient space in the right locations.
Infrastructure DevelopmentThe volume of public-private partnership (PPP) projects in the United Kingdom is still large. In Skanska’s other European markets, the sup-ply of projects is more limited, although interest in PPP solutions has increased in Skanska’s Central European markets. The lead times for PPP projects in the U.S. remain difficult to predict.

66 Financial Review Skanska Review of 2007
Events after the end of the financial yearLate in 2007 the Group signed an agreement to sell its 50 percent hold-ing in the Ponte de Pedra hydropower plant in Brazil. The sale price for these shares totals about EUR 110 M, and the gain on the sale is about EUR 60 M. The transaction was conditional upon approval by the appropriate public agencies, which was received during the first quarter of 2008. The transaction will also be recognized in the financial statements in the same quarter. At its meeting on February 6, 2008, the Board of Directors appointed Johan Karlström as the new President and CEO of Skanska. He succeed-ed Stuart Graham, who had previously notified the Board that he would step down as President and CEO during 2008. Mr. Karlström assumed his new position on April 3, 2008 in conjunction with the Annual Share-holders’ Meeting of Skanska.
66 Financial Review Skanska Review of 2007

Skanska Review of 2007 Consolidated income statement 67
Consolidated income statement
EUR M Note 2007 2006
Revenue 8, 9 15,001.7 13,574.3
Cost of sales 9 –13,599.3 –12,344.1
Gross income 1,402.4 1,230.2
Selling and administrative expenses 11 –861.5 –754.9
Income from joint ventures and associated companies 20 43.5 39.3
Operating income
10, 12, 13, 22,
36, 38, 40 584.4 514.6
Financial income 69.8 50.4
Financial expenses –41.6 –26.4
Income from associated companies 0.0 0.1
Net financial items 14 28.2 24.1
Income after financial items 15 612.6 538.7
Taxes 16 –167.1 –143.7
Profit for the year 445.5 395.0
Profit for the year attributable toEquity holders 442.8 392.8
Minority interest 2.7 2.2
Earnings per share, EUR 26, 44
before dilution 1.06 0.94
after dilution 1.06 0.94
Average number of shares 26
before dilution 418,553,072 418,553,072
after dilution 419,080,464 418,827,470
See also Notes 1, 2, 3, 4, 5, 6, 7, 34, 39, 41, 42, 43 and 44.

68 Consolidated balance sheet Skanska Review of 2007
Consolidated balance sheet
EUR M Note 2007 2006
ASSETSNon-current assetsProperty, plant and equipment 17, 40 632.1 603.5
Goodwill 18 485.1 496.6
Other intangible assets 19 69.6 81.8
Investments in joint ventures and associated companies 20 205.8 209.5
Financial non-current assets 21 77.0 165.9
Deferred tax assets 16 101.2 218.5
Total non-current assets 1,571.0 1,775.8
Current assetsCurrent-asset properties 22 1,396.8 1,308.0
Inventories 23 81.4 53.5
Financial current assets 21 495.9 348.8
Tax assets 16 43.5 36.5
Gross amount due from customers for contract work 9 598.6 577.5
Trade and other receivables 24 2,663.6 2,572.8
Cash equivalents 25 55.1 235.7
Cash 1,448.6 977.5
Total current assets 6,783.5 6,110.4
Total assets 32 8,354.4 7,886.2
of which interest-bearing non-current assets 31 67.1 158.5
of which interest-bearing current assets 31 1,987.6 1,549.2
2,054.7 1,707.7See also Notes 1, 2, 3, 4, 5, 6, 7, 34, 39, 41, 42, 43 and 44.

Skanska Review of 2007 Consolidated balance sheet 69
EUR M Note 2007 2006
Equity 26
Share capital 139.9 139.9
Paid-in capital 34.8 34.8
Reserves 63.7 95.7
Retained earnings 1,931.9 1,852.0
Equity attributable to equity holders 2,170.2 2,122.4
Minority interest 23.0 16.2
Total equity 2,193.2 2,138.6
LiabilitiesNon-current liabilities
Financial non-current liabilities 27 101.1 225.5
Pensions 28 121.6 172.1
Deferred tax liabilities 16 219.0 319.8
Non-current provisions 29 10.2 13.2
Total non-current liabilities 451.8 730.6
Current liabilitiesFinancial current liabilities 27 286.1 154.4
Tax liabilities 16 94.3 80.5
Current provisions 29 385.9 384.4
Gross amount due to customers for contract work 9 1,666.6 1,256.0
Trade and other payables 30 3,276.5 3,141.7
Total current liabilities 5,709.4 5,017.0
Total liabilities 6,161.2 5,747.6
Total equity and liabilities 32 8,354.4 7,886.2
of which interest-bearing financial liabilities 31 377.7 372.6
of which interest-bearing pensions and provisions 31 133.9 187.5
511.6 560.1
Information about the Group’s assets pledged, contingent liabilities and contingent assets can be found in Note 33.
Consolidated balance sheet

70 Consolidated statement of recognized income and expenses Skanska Review of 2007
EUR M 2007 2006
Translation differences for the year –47.2 –14.1
Hedging of exchange rate risk in operations outside Sweden 23.0 19.0
Cash flow hedge
Recognized directly in equity 0.5 2.5
Transfer to income statement –8.6 –4.9Change in pension liability
Changed assumptions 19.3 50.5Difference between expected and actual return on plan assets
–6.9 19.9
Social insurance contributions –1.0 7.2
Share-based payment 3.0 1.9
Other transfers of assets recognized directly in equity 3.6 –0.1
Tax attributable to items recognized directly in equity –2.6 –23.0
Changes in assets recognized directly in equity, excluding transactions with the Company’s owners –16.9 58.9
Profit for the year 445.5 395.0
Total changes in assets, excluding transactionswith the Company’s owners 428.6 453.9
Attributable to:
Equity holders 421.1 452.1
Minority 7.5 1.8
See also Note 26.
Consolidated statement of recognized income and expenses

Skanska Review of 2007 Consolidated cash flow statement 71
Consolidated cash flow statement
EUR M 2007 2006
Operating activitiesOperating income 584.4 514.6
Adjustments for items not included in cash flow –121.1 –138.3
Income tax paid –118.0 –109.2
Cash flow from operating activities before change in working capital 345.3 267.2
Cash flow from change in working capitalInvestments in current-asset properties –779.3 –729.3
Divestments of current-asset properties 938.5 854.1
Changes in inventories and operating receivables –249.4 –133.4
Change in operating liabilities 728.5 143.1
Cash flow from change in working capital 638.3 134.6
Cash flow from operating activities 983.6 401.7
Investing activitiesAcquisitions of businesses –8.0 –73.8
Investments in intangible assets –4.1 –4.1
Investments in property, plant and equipment –204.7 –186.8
Investments in Infrastructure Development assets –7.9 –30.9
Investments in shares –4.3 –0.3Increase in interest-bearing receivables, loans provided
–346.0 –223.5
Disposals of businesses 20.8 15.1
Divestments of intangible assets 0.2 0.2
Divestments of property, plant and equipment 54.8 53.6
Divestments of Infrastructure Development assets 19.2 20.8
Divestments of shares 6.7 1.6Decrease in interest-bearing receivables, payments of loans provided
214.7 85.5
Income tax paid –5.7 –3.2
Cash flow from investing activities –264.4 –345.8
Financing activitiesNet interest items 40.0 29.8
Other financial items –21.4 –20.1
Borrowings 64.3 98.6
Repayment of debt –102.8 –121.4
Dividend paid –373.3 –294.1
Dividend to/Contribution from minority –0.5 1.0
Income tax paid –5.6 –2.9
Cash flow from financing activities –399.3 –309.1
Cash flow for the year 319.9 –253.2
Cash and cash equivalents, January 1 1,213.2 1,456.3
Reclassifications 43.2 0.0Translation differences in cash and cash equivalents
–72.6 10.1
Cash and cash equivalents, December 31 1,503.8 1,213.2
Change in interest-bearing net receivablesEUR M 2007 2006
Interest-bearing net receivables, January 1 1,147.6 1,183.0
Cash flow from operating activities 983.6 401.7
Cash flow from investing activities excluding change in interest-bearing receivables –133.1 –207.8Cash flow from financing activities excluding change in interest-bearing liabilities
–360.8 –286.3
Change in pension liability 12.2 70.4
Reclassifications 1 –43.0 –27.2
Net receivable/liability acquired/divested 0.4 2.4
Translation differences –48,3 18.3
Other items –15.6 –6.8
Interest-bearing net receivables, December 31 1,543. 1 1,147.6
1 The EUR –43.0 M amount consisted of discounting of advance payments from customers. In 2006 the amount included EUR –14.4 M due to reclassification to a financial lease on cars in Sweden and EUR –9.7 M due to discounting of debt to sellers upon the purchase of properties.
Consolidated operating cash flow statementEUR M 2007 2006
Cash flow from business operations before change in working capital and taxes paid 463.3 376.3Change in working capital excluding current-asset properties 479.1 9.7
Net investments in operations –12.4 –66.4
Cash flow adjustment, net investments 1 31.6 44.1
Taxes paid in business operations –121.9 –112.4
Cash flow from business operations 839.6 251.4
Net interest items and other net financial items 18.6 9.7
Taxes paid in financing items –5.6 –2.9
Cash flow from financing activities 13.0 6.8
Cash flow from operations 852.6 258.2
Net strategic investments 12.8 –57.5
Taxes paid on net strategic investments –1.8 0.0
Cash flow from strategic investments 10.9 –57.5
Dividend etc. –373.8 –293.1
Cash flow before changes in interest-bearing receivables and liabilities 489.7 –92.4Change in interest-bearing receivables and liabilities –169.8 –160.8
Cash flow for the year 319.9 –253.2
1 Refers to payments made during the year in question related to investments/ divestments in prior years, and unpaid investments/divestments related to the year in question.
See also Note 35.

72 Notes, including accounting and valuation principles Skanska Review of 2007
Table of contents, notesPage
Note 01 Accounting and valuation principles 73
Note 02 Key estimates and judgments 81
Note 03 Effects of changes in accounting principles 81
Note 04 Segment reporting 82
Note 05 Non-current assets held for sale 86
Note 06 Financial instruments 87
Note 07 Business combinations 95
Note 08 Revenue 96
Note 09 Construction contracts 96
Note 10 Operating income 97
Note 11 Selling and administrative expenses 98
Note 12 Depreciation/amortization 98
Note 13 Impairment losses/reversals of impairment losses 99
Note 14 Net financial items 100
Note 15 Borrowing costs 100
Note 16 Income taxes 100
Note 17 Property, plant and equipment 102
Note 18 Goodwill 104
Note 19 Intangible assets 105
Note 20 Investments in joint ventures and associated companies 106
Note 21 Financial assets 108
Note 22 Current-asset properties/Project development 109
Note 23 Inventories etc. 111
Page
Note 24 Trade and other receivables 111
Note 25 Cash equivalents 111
Note 26 Equity/Earnings per share 111
Note 27 Financial liabilities 114
Note 28 Pensions 114
Note 29 Provisions 117
Note 30 Trade and other payables 117
Note 31 Specification of interest-bearing receivables per asset and liability 118
Note 32 Expected recovery periods of assets and liabilities 119
Note 33 Assets pledged, contingent liabilities and contingent assets 120
Note 34 Effect of changes in foreign exchange rates 121
Note 35 Cash flow statement 124
Note 36 Personnel 126
Note 37 Remuneration to senior executives and Board members 127
Note 38 Fees and other remuneration to auditors 130
Note 39 Related party disclosures 130
Note 40 Leases 130
Note 41 Events after the balance sheet date 131
Note 42 Consolidated quarterly results 132
Note 43 Five-year Group financial summary 133
Note 44 Definitions 136
Note 45 Supplementary information 137
Amounts in million Euro (EUR M) unless otherwise specified. Income is reported in posi-
tive figures and expenses in negative figures. Both assets and liabilities are reported in
positive figures. Interest-bearing net receivables/liabilities are reported in positive figures
if they are receivables and negatives figures if they are liabilities.
Notes including accounting and valuation principles
Accumulated depreciation/amortization and accumulated impairment losses are
reported in negative figures. Generally speaking, in the Annual Report, financial
statements for 2007, 2006, 2005 and 2004 have been prepared in compliance with
IFRSs and 2003 financial statements according to previous Swedish generally accepted
accounting principles (SWGAAP).

Skanska Review of 2007 Notes, including accounting and valuation principles 73
Note 01 Consolidated accounting and valuation principles
Conformity with laws and standardsIn compliance with the ordinance approved by the European Union (EU) on the
application of international accounting standards, these financial statements have been
prepared in compliance with International Financial Reporting Standards (IFRSs) and
International Accounting Standards (IASs), issued by the International Accounting Stan-
dards Board (IASB), as well as the interpretations by the International Financial Report-
ing Interpretations Committee (IFRIC) and its predecessor the Standing Interpretations
Committee (SIC), to the extent these standards and interpretations has been adopted
by the EU.
These financial statements were approved for publication by the President and CEO
on April 3, 2008. The statutory annual report was adopted by the Annual Meeting on
the same day.
Conditions when preparing the Group’s financial statementsThe functional currency of the Parent Company is Swedish crowns or kronor (SEK). The
statutory Annual Report of the Parent Company and the Group is prepared with SEK as
the presentation currency. These financial statements were prepared with euros (EUR)
as the presentation currency. All amounts are rounded off to the nearest million, unless
otherwise stated.
Preparing the financial statements in compliance with IFRSs requires management to
make judgments and estimates as well as make assumptions that affect the application
of accounting principles and the recognized amounts of assets, liabilities, revenue and
expenses. Actual outcomes may diverge from these estimates and judgments.
Estimates and assumptions are reviewed regularly. Changes in estimates are
recognized in the period the change is made if the change only affects this period, or
in the period the change is made and future periods if the change affects both the period
in question and future periods.
Judgments made by management when applying IFRSs that have a substantial
impact on the financial statements and estimates that may lead to significant adjust-
ments in the financial statements of subsequent years are described in more detail in
Note 2, “Key estimates and judgments.”
The accounting principles for the Group stated below have been applied consistently
for all periods that are presented in the consolidated financial statements, unless
otherwise indicated below. The accounting principles for the Group have been applied
consistently in reporting and consolidation of the Parent Company and its subsidiaries,
associated companies and joint ventures.
New standards and interpretationsOf the standards and interpretations that entered into force starting in 2007, IFRS 7 and
IFRIC 10 have been of significance in preparing the 2007 financial statements.
IFRS 7, “Financial Instruments: Disclosures” and related amendments to IAS 1,
“Presentation of Financial Statements” require extensive disclosures on the significance
that financial instruments have for the Company’s financial position and earnings as
well as qualitative disclosures of the nature and scale of risks. Disclosures must also be
provided on the Group’s financial goals and capital management.
IFRIC 10, “Interim Financial Reporting and Impairment,” prohibits reversal of an
impairment loss recognized in a previous interim report is respect of goodwill, an
investment in an equity instrument or in a financial asset carried at cost.
Application in advance of IFRSs and interpretations newly published or revised during 2007Newly issued IFRSs or interpretations have not been applied in advance.
New IFRSs, amendments of standards and interpretations that have not yet begun to be applied or been adopted by the EUIFRS 8, “Operating Segments,” states what an operating segment is and what informa-
tion shall be provided about such segments in financial statements. The standard will be
applied to financial years that begin on January 1, 2009 or later.
Amendments to IAS 23, “Borrowing Costs,” Borrowing costs that are directly attrib-
utable to the acquisition, construction or production of an asset that takes a substantial
period of time to complete shall be capitalized. The amendment will be applied to
financial years that begin on January 1, 2009 or later. The amendment has not yet been
adopted by the EU. Because Skanska already applies this principle now, the amendment
of the standard will mean nothing new for Skanska.
IFRIC 11, “IFRS 2 − Group and Treasury Share Transactions,” clarifies how a transaction
settled with equity instruments shall be classified in a company that receives services
from employees. The interpretation went into effect on March 1, 2007 and is applied to
financial years that begin on that date or later.
IFRIC 12, “Service Concession Arrangements,” deals with the question of how a service
concession operator should account for the infrastructure as well as the rights they receive
and the obligations they undertake under these arrangements. It cannot yet be stated
how the interpretation will affect the accounting of earnings and financial position in the
Group’s infrastructure projects. The interpretation has not yet been adopted by the EU.
IFRIC 14, “IAS 19 −The Limit of a Defined Benefit Asset, Minimum Funding Require-
ments and their Interaction,” deals with how certain funding requirements interact with
the rules in IAS 19 about ceilings on a defined-benefit asset. The interpretation has not
yet been adopted by the EU.
IFRIC has issued a draft interpretation, “IFRC D21, Real Estate Sales,” that deals with
the timing of revenue recognition for the sale of real estate (IAS 18) and what can be
included in the concept of “construction contract” and thus be recognized in compli-
ance with IAS 11. If the draft is not amended and leads to an interpretation, real estate
sales will no longer be recognized on the contract date, but instead normally when the
buyer takes possession. In addition, sales of residential units built at the Group’s own ini-
tiative will no longer be recognized as revenue according to the percentage of comple-
tion method, adjusted for the degree of sales. According to the draft interpretation, this
revenue will be recognized only when the buyer takes possession of the residential unit.
Skanska has chosen to wait for IFRIC’s interpretation (and the EU’s adoption of this) of
what standard shall be applied, and in what way. Until this has occurred, the effect on the
Group’s earnings and financial position cannot be assessed.
IAS 1, “Presentation of Financial Statements”Income statement
Reported as revenue are project revenue, compensation for other services performed,
divestment of current-asset properties, deliveries of materials and merchandise, rental
income and other operating revenue. Revenue from the sale of machinery, equipment,
non-current-asset properties and intangible assets are not included here, but are instead
recognized on a net basis among operating expenses against the carrying amounts of
the assets.
Reported as cost of sales are, among others, direct and indirect manufacturing
expenses, loss risk provisions, the carrying amounts of divested current-asset properties,
bad debt losses and warranty expenses. Also included is depreciation on property, plant
and equipment that is used for construction, manufacturing and property management.
Selling and administrative expenses include customary administrative expenses,
technical expenses and selling expenses, as well as depreciation of machinery and
equipment that have been used for selling and administration. Goodwill amortization
and impairment losses are also reported as a selling and administrative expense.
Income/loss from joint ventures and associated companies is recognized separately
in the income statement, allocated between operating income (share of income after
financial items) and tax expense.
Share of income in partnerships and limited partnerships, including their foreign
equivalents, is recognized in its entirety as operating income.
Financial income and expenses are recognized divided into three lines: “Financial
income,” “Financial expenses” and “Income from associated companies.” Among
items recognized under financial income are interest income, dividends, gains on
divestments of shares and other financial items. Among financial expenses are interest
expenses and other financial items. Changes in the fair value of financial instruments,
primarily derivatives connected to financial activities, are recognized as a separate
sub-item allocated between financial income and expenses. The net amount of
exchange rate differences is recognized either as financial income or expenses. Financial
income and expenses are described in more detail in Note 6, “Financial instruments,”
and in Note 14, “Net financial items.”
Assets
Assets are allocated between current assets and non-current assets. An asset is regarded
as a current asset if it is expected to be realized within twelve months from the balance
sheet date or within the Company’s operating cycle. Operating cycle refers to the period
from the signing of a contract until the Company receives cash payment on the basis of
a final inspection or deliveries of goods (including properties). Since the Group performs
large contracting projects and project development, which as a rule are underway for
more than twelve months, the operating cycle criterion means that many more assets
are labeled as current assets than if the only criterion were “within twelve months.”
Cash and cash equivalents consist of cash and immediately available deposits at banks
and equivalent institutions plus short-term liquid investments with a maturity from the
acquisition date of less than three months, which are subject to only an insignificant risk of
fluctuations in value. Checks that have been issued reduce liquid assets only when cashed.
Cash and cash equivalents that cannot be used freely are reported as current assets (current
receivables) if the restriction will cease within twelve months from the balance sheet date.

74 Notes, including accounting and valuation principles Skanska Review of 2007
In other cases, cash and cash receivables are reported as non-current assets. Cash and cash
equivalents that belong to a construction consortium are cash and cash equivalents with
restrictions if they may only be used to pay the debts of the consortium.
Assets that meet the requirements in IFRS 5, “Non-current Assets Held for Sale and
Discontinued Operations” are accounted for as a separate item among current assets.
Note 31, “Specification of interest-bearing receivables per asset and liability,” shows
the allocation between interest-bearing and non-interest-bearing assets.
In Note 32, assets are allocated between amounts for assets expected to be recovered
within twelve months from the balance sheet date and assets expected to be recovered
after twelve months from the balance sheet date. The division for non-financial non-current
assets is based on expected annual depreciation. The division for current-asset properties is
mainly based on outcomes during the past three years. This division is even more uncertain
than for other assets, since the outcome during the coming year is strongly influenced
by the dates when binding contracts for large individual properties are signed.
Equity
The Group’s equity is now allocated between “Share capital,” “Paid-in capital,”
“Reserves,” “Retained earnings” and “Minority interest.”
Acquisitions of the Company’s own shares and other equity instruments are recognized
as a deduction from equity. Proceeds from the divestment of equity instruments are rec-
ognized as an increase in equity. Any transaction costs are recognized directly in equity.
Dividends are recognized as a liability, once the Annual Shareholders’ Meeting has
approved the dividend.
A description of equity, the year’s changes and disclosures concerning capital man-
agement are provided in Note 26, “Equity/Earnings per share.”
Liabilities
Liabilities are allocated between current liabilities and non-current liabilities. Recognized
as current liabilities are liabilities that are either supposed to be paid within twelve
months from the balance sheet date or, although only in the case of business-related
liabilities, are expected to be paid within the operating cycle. Since the operating cycle is
thus taken into account, no non-interest-bearing liabilities, for example trade accounts
payable and accrued employee expenses, are recognized as non-current. Liabilities
that are recognized as interest-bearing due to discounting are included among current
liabilities, since they are paid within the operating cycle. Interest-bearing liabilities can
be recognized as non-current even if they fall due for payment within twelve months
from the balance sheet date, if the original maturity was longer than twelve months and
the company has reached an agreement to refinance the obligation long-term before
the annual accounts are submitted. Information on liabilities is provided in Notes 27,
“Financial liabilities,” and Note 30, “”Trade and other payables.”
In Note 32, “Expected recovery periods of assets and liabilities,” liabilities are allocated
between amounts for liabilities to be paid within twelve months of the balance sheet date
and liabilities to be paid after twelve months from the balance sheet date. Note 31, “Speci-
fication of interest-bearing receivables per asset and liability,” also provides information
about the allocation between interest-bearing and non-interest-bearing liabilities.
IAS 27, “Consolidated and Separate Financial Statements”The consolidated financial statements encompass the accounts of the Parent Company
and those companies in which the Parent Company, directly or indirectly, has a controlling
influence. “Controlling influence” implies a direct or indirect right to shape a company’s
financial and operating strategies for the purpose of obtaining financial benefits. This
normally requires ownership of more than 50 percent of the voting power of all partici-
pations, but a controlling influence also exists when there is a right to appoint a majority
of the Board of Directors. When judging whether a controlling influence exists, potential
voting shares that can be utilized or converted without delay must be taken into account.
If, on the acquisition date, a subsidiary meets the conditions to be classified as held for
sale in compliance with IFRS 5, “Non-current Assets Held for Sale and Discontinued
Operations,” it must be reported according to that accounting standard.
Acquired companies are consolidated from the quarter within which the acquisition/
divestment occurs. In a corresponding way, divested companies are consolidated up to
and including the final quarter before the divestment date.
Intra-Group receivables, liabilities, revenue and expenses are eliminated in their
entirety when preparing the consolidated financial statements.
Gains that arise from intra-Group transactions and that are unrealized from the
standpoint of the Group on the balance sheet date are eliminated in their entirety.
Unrealized losses on intra-Group transactions are also eliminated in the same way as
unrealized gains, to the extent that the loss does not correspond to an impairment loss.
Goodwill is expressed in in functional currency of the business it is related to. Transla-
tion to EUR complies with IAS 21, “The Effects of Changes in Foreign Exchange Rates.”
IFRS 3, “Business Combinations”This accounting standard deals with business combinations, which refers to mergers
of separate companies or businesses. If an acquisition does not relate to a business,
which is normal when acquiring properties, IFRS 3 is not applied. In such cases, the cost
is allocated among the individual identifiable assets and liabilities based on their relative
fair values on the acquisition date, without recognizing goodwill and any deferred tax
assets/liability as a consequence of the acquisition.
Acquisitions of businesses, regardless of whether the acquisition concerns holdings in
another company or a direct acquisition of assets and liabilities, are reported according to
the purchase method of accounting. If the acquisition concerns holdings in a company,
the method implies that the acquisition is regarded as a transaction through which the
Group indirectly acquires the assets of a subsidiary and assumes its liabilities and contingent
liabilities. Cost in the consolidated accounts is determined by means of an acquisition
analysis in conjunction with the business combination. The analysis establishes both
the cost of the holdings or the business and the fair value of acquired identifiable assets
plus the liabilities and contingent liabilities assumed. The difference between the
cost of holdings in a subsidiary and the fair value of acquired assets and liabilities and
contingent liabilities assumed is goodwill on consolidation. In compliance with IFRS 3, it
is not permitted to recognize restructuring reserves in connection with the acquisition.
Goodwill is carried at cost less accumulated impairment losses. Goodwill is allocated
among cash-generating units and subjected to annual impairment testing in compliance
with IAS 36, “Impairment of Assets.”
In case of business combinations where the cost of acquisition is below the net value
of acquired assets and the liabilities and contingent liabilities assumed, the difference is
recognized directly in the income statement.
If a business combination occurs in several stages, revaluation of previous acquisitions
occurs to the extent there has been a change in the fair value of assets and liabilities in
the acquired business. This revaluation is recognized directly in equity.
As for goodwill acquired before January 1, 2004, in transitioning to IFRS the Group
has not applied IFRS 3 retroactively. Instead the carrying amount as of that date serves
as the Group’s cost.
As provided by IFRS 1, acquisitions of businesses that occurred before 2004 were not
restated when establishing the Group’s opening balance in compliance with IFRS on
January 1, 2004.
IAS 21, “The Effects of Changes in Foreign Exchange Rates”Foreign currency transactions
Foreign currency transactions are translated into an entity’s functional currency at the
exchange rate prevailing on the transaction date. Monetary assets and liabilities in
foreign currency are translated to the functional currency at the exchange rate prevailing
on the balance sheet date. Exchange differences that arise from translations are
recognized in the income statement. Non-monetary assets and liabilities recognized
at historic cost are translated at the exchange rate on the transaction date.
Functional currency is the currency of the primary economic environment where the
companies in the Group conduct their business.
Financial statements of foreign operations
Assets and liabilities in foreign operations, including goodwill and other consolidated
surpluses and deficits, are translated to euros at the exchange rate prevailing on the bal-
ance sheet date. Revenue and expenses in foreign operations are translated to euros at
the average exchange rate. If a foreign operation is located in a country with hyperinfla-
tion, revenue and expenses are to be translated in a special way. In the year’s financial
statements, it has not been necessary to do this. Translation differences that arise from
currency translation of foreign operations are recognized directly in equity as a transla-
tion reserve.
Net investment in foreign operations
Translation differences that arise in connection with translation to euros of an investment in
another currency and accompanying effects of hedging of net investments are recognized
directly in the translation reserve in equity. When divesting an operation with a functional
currency other than euros, accumulated translation differences attributable to the operation
are realized in the consolidated income statement after subtracting any currency hedging.
As for accumulated translation differences attributable to the period before January 1, 2004,
these are stated at zero upon transition to IFRS.
Foreign currency loans and currency derivatives for hedging of translation exposure
(equity loans) are carried at the exchange rate on the balance sheet date. Exchange rate
differences are recognized, taking into account the tax effect, in the equity of the Group.
Note 01 Continued

Skanska Review of 2007 Notes, including accounting and valuation principles 75
Hedging of translation exposure reduces the exchange rate effect when translating the
financial statements of foreign operations to the functional currency of the respective
unit. Any forward contract premium is accrued until maturity and is recognized as inter-
est income or an interest expense.
IFRS 5, “Non-current Assets Held for Sale and Discontinued Operations”A discontinued operation is a portion of a company’s operations that represents a
separate line of business or a major operation in a geographic area and is part of a single
coordinated plan to dispose of a separate line of business or a major operation carried
out in a geographic area, or is a subsidiary acquired exclusively with a view to resale.
Classification as a discontinued operation occurs upon divestment, or at an earlier
date when the operation meets the criteria to be classified as held for sale. A disposal
group that is to be shut down can also qualify as a discontinued operation if it meets the
above size criteria.
If a non-current asset or disposal group is to be classified as held for sale, the asset
(disposal group) must be available for sale in its present condition. It must also be highly
probable that the sale will occur. In order for a sale to be highly probable, a decision
must have been made at management level, and active efforts to locate a buyer and
complete the plan must have been initiated. The asset or disposal group must be actively
marketed at a price that is reasonable in relation to its fair value, and it must be prob-
able that the sale will occur within one year. Skanska also applies the principle that with
regard to a single noncurrent asset, its value must exceed EUR 20 M.
Depreciation or amortization of a non-current asset is not made as long as it is
classified as held for sale.
Non-current assets classified as held for sale as well as disposal groups and liabilities
attributable to them must be presented separately in the balance sheet.
IAS 28, “Investments in Associates”Reported as associated companies are companies in which the Skanska Group exercises
significant but not controlling influence, which is presumed to be the case when the
Group’s holding amounts to a minimum of 20 percent and a maximum of 50 percent
of the voting power. In addition, it is presumed that this ownership is one element of a
long-term connection and that the holding shall not be reported as a joint venture.
The equity method
From the date when Skanska obtains a significant influence, holdings in associated
companies are included in the consolidated financial statements according to the
equity method. Any difference upon acquisition between the cost of the holding and
the owner company’s share of net fair value of the associated company’s identifiable
assets, liabilities and contingent liabilities is recognized in compliance with IFRS 3,
“Business Combinations.” The equity method implies that the carrying amount of the
Group’s shares in associated companies is equivalent to the Group’s proportion of their
share capital as well as goodwill in the consolidated accounts and any other remaining
consolidated surpluses and deductions of internal profits. The consolidated income
statement includes the Group’s share of the associated company’s income after financial
items, adjusted for any depreciation/amortization, impairment losses or withdrawal
of acquired surpluses or deficits as well as internal profits, among “Income from joint
ventures and associated companies.” The Group’s proportion of the tax expense of an
associated company is included in “Taxes.” Dividends received from an associated
company reduce the carrying amount of the investment.
When the Group’s share of recognized losses in an associated company exceeds the
carrying amount of the holdings in the consolidated financial statements, the value
of the holding is reduced to zero. Settlement of losses also occurs against long-term
unsecured financial assets which, in substance, form part of Skanska’s net investment
in the associated company and are thus recognized as shares. Continued losses are not
recognized unless the Group has provided guarantees to cover losses arising in the
associated company.
Internal profits
When profits arise from transactions between the Group and an associated company,
the portion equivalent to the Group’s share of ownership is eliminated. If the carrying
amount of the Group’s holding in the associated company is below the elimination of
internal profit, the excess portion of the elimination is recognized among provisions.
The elimination of the internal profit is adjusted in later financial statements based on
how the asset is used or when it is divested. If a loss arises from a transaction between
the Group and an associated company, the loss is eliminated only if it does not corre-
spond to an impairment loss on the asset.
The equity method is applied until the date when significant influence ceases.
Note 20, “Investments in joint ventures and associated companies,” provides
information about associated companies.
IAS 31, “Interests in Joint Ventures”Companies operated jointly with other companies, and in which control is exercised
jointly according to agreement, are reported as joint ventures.
The equity method, which is described in the section on associated companies,
is applied when preparing the consolidated financial statements. The consolidated
income statement recognizes the Group’s share of the income in joint ventures before
taxes, adjusted for any depreciation/amortization, impairment losses or withdrawals
of acquired surplus or deficit amounts as well as internal profits, among “Income from
joint ventures and associated companies.” The Group’s share of the tax expense of a
joint venture is included in “Taxes.”
In connection with infrastructure projects, the Group’s investment may include either
holdings in or subordinated loans to a joint venture. Both are treated in the accounts as
holdings.
Internal profits
Internal profits that have arisen from transactions between the Group and a joint venture
are eliminated based on the Group’s share of ownership. If the carrying amount of the
Group’s holding in a joint venture is below the elimination of internal profit, the excess
portion of the elimination is recognized among provisions. The elimination of the
internal profit is adjusted in later financial statements based on how the asset is used or
when it is divested. If a loss instead arises from a transaction between the Group and a
joint venture, the loss is eliminated only if it does not correspond to an impairment loss
on the asset.
Note 20, “Investments in joint ventures and associated companies,” provides infor-
mation about joint ventures.
IAS 11, “Construction Contracts”Project revenues are reported in compliance with IAS 11, “Construction Contracts.” This
implies that the income from a construction project is reported successively as the proj-
ect accrues. The degree of accrual is mainly determined on the basis of accumulated
project expenses in relation to estimated accumulated project expenses upon completion.
If the outcome cannot be estimated in a satisfactory way, revenue is reported as equivalent
to accumulated expenses on the balance sheet date (zero recognition). Anticipated
losses are immediately reported as expenses. If the construction project also includes lia-
bility to the customer for divestment of completed housing units, the number of unsold
units is taken into account when recognizing the earnings of the construction project, by
recognizing a profit that is proportional to both the degree of accrual and the degree
of sales. This means that if the degree of accrual is 50 percent and the degree of sales
likewise is 50 percent, 25 percent of forecasted final profit is reported (forecasted loss is
reported immediately as an expense at 100 percent).
Recognized as project revenue are the originally agreed contract amount as well as
additional work, claims for special compensation and incentive payments, but normally
only to the extent that these have been approved by the customer. All services that are
directly related to the construction project are covered by IAS 11. Other services are
covered by IAS 18, “Revenue.”
If substantial non-interest-bearing advance payments have been received, the
advance payment is discounted and recognized as an interest-bearing liability. The
difference between a nominal amount and a discounted amount constitutes project
revenue and is recognized as revenue according to the percentage of completion method.
The upward adjustment in the present value of the advance payment in subsequent
financial statements is reported as an interest expense.
The difference between accrued project revenue and a not yet invoiced amount is
recognized as an asset (gross amount due to customers for contract work) according
to the percentage of completion method. Correspondingly, the difference between an
invoiced amount and not yet accrued project revenue is reported as a liability (liabilities
to the customer as provided in the construction contract). Income on the sale of land in
conjunction with residential projects is included in project reporting. Major machinery
purchases that are intended only for an individual project and significant start-up expens-
es are included to the extent they can be attributed to future activities as claims on the
customer and are included in the asset or liability amount stated in this paragraph, how-
ever without affecting accrued project revenue.
Tendering expenses are not capitalized, but instead are recognized on a continu-
ous basis. Tendering expenses that arose during the same quarter that the order was
received, and that are attributable to the project, may be treated as project expendi-
tures. In the case of infrastructure projects, instead of the quarter when the order was
received, this applies to the quarter when the Group receives the status of preferred bid-
der. Tendering expenses that were recognized in prior interim or annual financial state
ments may not be recognized as project expenses in later financial statements.
Unrealized gains and losses on forward contracts related to hedging of operating
transaction exposure are included, to the degree of completion, in the reporting of

76 Notes, including accounting and valuation principles Skanska Review of 2007
the respective project. If hedge accounting is not applicable, the liquidity effect when
extending a forward contract that will meet future cash flow shall be included among
operating expenses. If the amount has a significant impact, it shall be excluded when
determining degree of completion.
A construction consortium that has been organized to perform a single construction
assignment is not an independent legal entity, since the participating co-owners are also
directly liable for its obligations. Skanska’s share of the construction assignment is thus
recognized as an independent operation.
Most construction contracts contain clauses concerning warranty obligations on the
part of the contractor, with the contractor being obliged to remedy errors and omissions
discovered within a certain period after the property has been handed over to the customer.
Such obligations may also be required by law. The main principle is that a provision for war-
ranty obligations must be calculated for each individual project. Provision must be made
continuously during the course of the project and the estimated total provision must be
included in the project’s expected final expenses. For units with similar projects, the provision
may occur in a joint account instead and be calculated for the unit as a whole with the help
of ratios that have historically provided a satisfactory provision for these expenses.
IAS 18, “Revenue”Revenue other than project revenue is recognized in compliance with IAS 18. For lease
income, this means that the revenue is divided evenly over the period of the lease. The
total cost of benefits provided is recognized as a reduction in lease income on a straight-
line basis over the lease period. Compensation for services performed that does not
comprise project revenue is recognized as revenue based on the degree of completion on
the balance sheet date, which is normally determined as services performed on the balance
sheet date as a proportion of the total to be performed. The difference that may then
arise between services invoiced and services performed is recognized in the balance sheet
among “Other operating receivables” (or “Other operating liabilities”). Deliveries of mer-
chandise are reported as revenues when the risks and rewards associated with ownership
of the merchandise have been transferred to the buyer. Divestment of completed current-
asset properties belonging to Commercial Development is normally reported as a revenue
item during the reporting period when a binding agreement on the sale is reached. How-
ever, if the property being divested is not yet completed and the buyer will occupy it only
after completion, the gain is reported at the pace that the property is completed.
A dividend is recognized as revenue when the right to receive payment has been
established.
Income from the sale of financial investments is recognized when the significant risks
and rewards associated with ownership of the instruments have been transferred to the
buyer and the Group no longer controls the instruments.
Interest is recognized using an interest rate that provides a uniform return on the
asset in question, which is achieved by applying the effective interest method. Effective
interest is the interest rate at which the present value of all future payments is equal to
the carrying amount of the receivable.
Revenue is carried at the fair value of what is received or will be received. This means
that receivables arising at the time of divestments are regarded as having been acquired
at fair value (discounted present value of future incoming payments) if the interest rate on
the date of the purchase is below the market interest rate and the difference is significant.
For example, discounting of a receivable may occur in connection with a property
divestment if the purchase price receivable is not settled immediately. This takes into
account that any operating net until the property is transferred is recognized as interest.
Revenue is recognized only if it is probable that the economic benefits will flow to the
Group. If uncertainty later arises with regard to the possibility of receiving payment for
an amount that has already been recognized as revenue, the amount for which
payment is no longer probable is instead recognized as an expense, instead of as an
adjustment of the revenue amount that was originally recognized.
A divestment of a portion of a Group company to a minority interest is recognized
directly in equity.
IAS 17, “Leases”The accounting standard distinguishes between finance and operating leases. A finance
lease is characterized by the fact that the economic risks and rewards incidental to
ownership of the asset have substantially been transferred to the lessee. If this is not the
case, the agreement is regarded as an operating lease.
Finance leases
Finance lease assets are recognized as an asset in the consolidated balance sheet. The
obligation to make future lease payments is recognized as a non-current or current
liability. Leased assets are depreciated during their respective useful life. When making
payments on a financial lease, the minimum lease payment is allocated between interest
expense and retirement of the outstanding liability. Interest expense is allocated over
the lease period in such a way that each reporting period is charged an amount equivalent
to a fixed interest rate for the liability recognized during each respective period. Variable
payments are recognized among expenses in the periods when they arise.
Assets leased according to finance leases are not recognized as property, plant and
equipment, since the risks incidental to ownership have been transferred to the lessee.
Instead a financial receivable is recognized, related to future minimum lease payments.
Operating leases
As for operating leases, the lease payment is recognized as an expense over the lease
term on the basis of utilization, and taking into account the benefits that have been
provided or received when signing the lease.
The Commercial Development business stream carries out operating lease business.
Information on future minimum lease payments (rents) is provided in Note 40, “Leases,”
which also contains other information about leases.
IAS 16, “Property, Plant and Equipment”Property, plant and equipment are recognized as assets in the balance sheet if it is probable
that the Group will derive future economic benefits from them and the cost of an asset
can be reliably estimated. Property, plant and equipment are recognized at cost minus
accumulated depreciation and any impairment losses. Cost includes purchase price plus
expenses directly attributable to the asset in order to bring it to the location and condition
to be operated in the intended manner. Examples of directly attributable expenses are
delivery and handling costs, installation, ownership documents, consultant fees and
legal services. Borrowing costs are included in the cost of self-constructed property,
plant and equipment. Impairment losses are applied in compliance with IAS 36,
“Impairment of assets.”
The cost of self-constructed property, plant and equipment includes expenditures for
materials and compensation to employees, plus other applicable manufacturing costs
that are considered attributable to the asset.
Further expenditures are added to cost only if it is probable that the Group will enjoy
future economic benefits associated with the asset and the cost can be reliably estimated.
All other further expenditures are recognized as expenses in the period when they arise.
What is decisive in determining when a further expenditure is added to cost is whether
the expenditure is related to replacement of identified components, or their parts, at
which time such expenditures are capitalized. In cases where a new component is cre-
ated, this expenditure is also added to cost. Any undepreciated carrying amounts for
replaced components, or their parts, are disposed of and recognized as an expense at
the time of replacement. If the cost of the removed component cannot be determined
directly, its cost is estimated as the cost of the new component adjusted by a suitable price
index to take into account inflation. Repairs are recognized as expenses continuously.
Property, plant and equipment that consist of parts with different periods of service
are treated as separate components of property, plant and equipment. Depreciation
occurs on a straight-line basis during the estimated period of service, taking into account
any residual value at the end of the period.
Office buildings are divided into foundation and frame, with a depreciation period
of 50 years; installations, depreciation period 35 years; and non-weight-bearing parts,
depreciation period 15 years. Generally speaking, industrial buildings are depreciated
during a 20-year period without allocation into different parts. Stone crushing and
asphalt plants as well as concrete mixing plants are depreciated over 10 to 25 years
depending on their condition when acquired and without being divided into different
parts. For other buildings and equipment, division into different components occurs only
if major components with divergent useful lives can be identified. For other machinery
and equipment, the depreciation period is normally between 5 and 10 years. Minor
equipment is depreciated immediately. Gravel pits and stone quarries are depreciated as
materials are removed. Land is not depreciated. Assessments of an asset’s residual value
and period of service are performed annually.
The carrying amount of a property, plant and equipment item is removed from the
balance sheet when it is disposed of or divested, or when no further economic benefits
are expected from the use or disposal/divestment of the asset.
Provisions for the costs of restoring an asset are normally made in the course of utili-
zation of the asset, because the prerequisites for an allocation at the time of acquisition
rarely exist.
IAS 38, “Intangible Assets”This accounting standard deals with intangible assets. Goodwill that arises upon
acquisition of companies is recognized in compliance with the rules in IFRS 3, “Business
Combinations.”
Note 01 Continued

Skanska Review of 2007 Notes, including accounting and valuation principles 77
An intangible asset is an identifiable non-monetary asset without physical substance
that is used for producing or supplying goods or services or for leasing and administration.
To be recognized as an asset, it is necessary both that it be probable that future economic
advantages that are attributable to the asset will benefit the company and that the cost
can be reliably calculated. It is especially worth noting that expenditures recognized in
prior annual or interim financial statements may not later be recognized as an asset.
Research expenses are recognized in the income statement when they arise.
Development expenses, which are expenses for designing new or improved materials,
structures, products, processes, systems and services by applying research findings or
other knowledge, are recognized as assets if it is probable that the asset will generate
future revenue. Other development expenses are expensed directly. Expenses for regular
maintenance and modifications of existing products, processes and systems are not
recognized as development expenses. Nor is work performed on behalf of a customer
and recognized in compliance with IAS 11, “Construction Contracts,” recognized as
development expenses.
Intangible assets other than goodwill are recognized at cost minus accumulated
amortization and impairment losses. Impairment losses are applied in compliance with
IAS 36, “Impairment of Assets.”
Amortization is recognized in the income statement on a straight-line basis over the
period of service of intangible assets, to the extent such a period can be determined.
Consideration is given to any residual value at the end of the period. Concession fees
are amortized on a straight-line basis over the part of the concession period that occurs
after the building or facility has gone into service for its intended purpose. Purchased
service agreements are depreciated over their remaining contractual period (in applicable
cases 3–6 years). Purchased software (major computer systems) is amortized over a
maximum of five years.
Further expenditures for capitalized intangible assets are recognized as an asset in
the balance sheet only when they increase the future economic benefits of the specific
asset to which they are attributable.
Accrued expenses for internally generated goodwill are recognized in the income
statement when the expense arises.
IAS 36, “Impairment of Assets”Assets covered by IAS 36, “Impairment of Assets,” must be tested on every balance
sheet date for indications of impairment. The valuation of exempted assets, for example
inventories (including current-asset properties), assets arising when construction contracts
are carried out and financial assets included within the scope of IAS 39, “Financial
Instruments: Recognition and Measurement,” is tested according to the respective
accounting standard.
Impairment losses are determined on the basis of the recoverable amount of assets,
which is the higher of fair value less costs to sell and value in use. In calculating value in
use, future cash flows are discounted using a discounting factor that takes into account
risk-free interest and the risk associated with the asset. Estimated residual value at the
end of the asset’s useful life is included as part of value in use. For an asset that does
not generate cash flows that are essentially independent of other assets, the recover-
able amount is estimated for the cash-generating unit to which the asset belongs. A
cash-generating unit is the smallest group of assets that generates cash inflows that
are independent of other assets or groups of assets. For goodwill, the cash-generating
unit is mainly the same as the Group’s business unit or other unit reporting to the Parent
Company. Exempted from the main rule are operations that are not integrated into the
business unit’s other operations. The same business unit may also contain a number of
cash-generating units if it works in more than one segment.
Impairment of assets attributable to a cash-generating unit is allocated mainly to
goodwill. After that, a proportionate impairment loss is applied to other assets included
in the unit.
Goodwill impairment is not reversed. According to IFRIC 10, “Interim Financial Report-
ing and Impairment,” this also applies within the same financial year. A goodwill-related
impairment loss recognized in a previous interim report may not be reversed in a later
interim report.
Impairment losses on other assets are reversed if there has been a change in the
assumptions on which the estimate of recoverable amount was based.
An impairment loss is reversed only to the extent that the carrying amount of the
asset after the reversal does not exceed the carrying amount that the asset would have
had if no impairment loss had occurred, taking into account the amortization that
would then have occurred.
IAS 23, “Borrowing Costs”Borrowing costs are capitalized provided that it is probable that they will result in future
economic benefits and the costs can be measured reliably. Generally speaking, capital-
ization of borrowing costs is limited to assets that take a substantial period of time for
completion, which in the Skanska Group’s case implies that capitalization mainly covers
the construction of current-asset properties and properties for the Group’s own use
(non-current-asset properties). Capitalization occurs when expenditures included in cost
have arisen and activities to complete the building have begun. Capitalization ceases
when the building is completed. Borrowing costs during an extended period when work
to complete the building is interrupted are not capitalized. If separate borrowing has
occurred for the project, the actual borrowing cost is used. In other cases, the cost of the
loan is calculated on the basis of the Group’s borrowing cost.
IAS 12, “Income Taxes”Income taxes consist of current tax and deferred tax. Taxes are recognized in the income
statement except when the underlying transaction is recognized directly in equity, in
which case the accompanying tax effect is recognized in equity. Current tax is tax to be
paid or received that is related to the year in question, applying the tax rates that have
been decided or in practice have been decided as of the balance sheet date; this also
includes adjustment of current tax that is attributable to earlier periods.
Deferred tax is calculated according to the balance sheet method, on the basis of
temporary differences between carrying amounts of assets and liabilities and their
values for tax purposes. The amounts are calculated based on how the temporary
differences are expected to be settled and by applying the tax rates and tax rules that
have been decided or announced as of the balance sheet date. The following temporary
differences are not taken into account: for a temporary difference that has arisen when
goodwill is first recognized, the first recognition of assets and liabilities that are not
business combinations and on the transaction date affect neither accounting profit
nor taxable profit. Also not taken into account are temporary differences attributable
to shares in subsidiaries and associated companies that are not expected to reverse in
the foreseeable future. Offsetting of deferred tax assets against deferred tax liabilities
occurs when there is a right to settle current taxes between companies.
Deferred tax assets related to deductible temporary differences and loss carry-forwards
are recognized only to the extent that they can probably be utilized. The value of
deferred tax assets is reduced when it is no longer considered probable that they can
be utilized.
IAS 2, “Inventories”Aside from customary inventories of goods, the Group’s current-asset properties are
also covered by this accounting standard. Both current-asset properties and inventories
of goods are measured item by item at the lower of cost and net realizable value. Net
realizable value is the estimated selling price in the ordinary course of business less the
estimated costs for completion and the estimated costs necessary to make the sale.
When item-by-item measurement cannot be applied, the cost of inventories is
assigned by using the first-in, first-out (FIFO) formula and includes expenditures that
have arisen from acquisition of inventory assets and from bringing them to their present
location and condition. For manufactured goods, cost includes a reasonable share
of indirect costs based on normal capacity utilization. Materials not yet installed at
construction sites are not recognized as inventories, but are included among project
expenses.
Except for properties that are used in Skanska’s own business, the Group’s property
holdings are reported as current assets, since these holdings are included in the Group’s
operating cycle. The operating cycle for current-asset properties amounts to about
3 to 5 years.
Acquisitions of properties are recognized in their entirety only when the conditions
exist for completion of the purchase. If advance payments related to ongoing property
acquisitions have been made, these are recognized under the balance sheet item for
current-asset properties. Property acquisitions through purchases of property-owning
companies are recognized when the shares have been taken over by Skanska.
Current-asset properties are allocated between Commercial Development, Other com-
mercial properties and Residential Development. Note 22, “”Current-asset properties/
Project development,” provides information about these properties.
Before impairment loss, properties both completed and under construction are carried
at directly accumulated costs, a reasonable proportion of indirect costs and interest
expenses during the construction period.
Information on customary inventories of goods is found in Note 23, “Inventories etc.”
IAS 37, “Provisions, Contingent Liabilities and Contingent Assets”Provisions
A provision is recognized in the balance sheet when the Group has a present legal or
constructive obligation as a result of a past event, and it is probable that an outflow of
economic resources will be required to settle the obligation and a reliable estimate of
the amount can be made.
Skanska makes provisions for future expenses due to warranty obligations according

78 Notes, including accounting and valuation principles Skanska Review of 2007
to construction contracts, which imply a liability for the contractor to remedy errors and
omissions that are discovered within a certain period after the contractor has handed
over the property to the customer. Such obligations may also exist according to law.
More about the accounting principle applied can be found in the section on IAS 11,
“Construction Contracts,” in this note.
A provision is made for disputes related to completed projects if it is probable that a
dispute will result in an outflow of resources from the Group. Disputes related to ongoing
projects are taken into consideration in the valuation of the project and are thus not
included in the balance sheet item “Reserve for legal disputes,” which is reported in
Note 29, “Provisions.”
Provisions for restoration expenses related to stone quarries and gravel pits does not
normally occur until the period that materials are bring removed.
Provisions for restructuring expenses are recognized when a detailed restructuring plan
has been adopted and the restructuring has either begun or been publicly announced.
Contingent liabilities
Contingent liabilities are possible obligations arising from past events and whose existence
will be confirmed only by the occurrence or non-occurrence of one or more future
events not wholly within the control of the Company. Also reported as contingent
liabilities are obligations arising from past events but that have not been recognized as a
liability because it is not likely that an outflow of resources will be required to settle the
obligation or the size of the obligation cannot be estimated with sufficient reliability.
The amounts of contract fulfillment guarantees are included until the contracted
property has been transferred to the customer, which normally occurs upon its approved
in a final inspection. If the guarantee covers all or most of the contract sum, the amount
of the contingent liability is calculated as the contract sum minus the value of the portion
performed. In cases where the guarantee only covers a small portion of the contract
sum, the guarantee amount remains unchanged until the property is handed over to the
customer. The guarantee amount is not reduced by being offset against payments not yet
received from the customer. Guarantees that have been received from subcontractors and
suppliers of materials are not taken into account, either. If the Group receives reciprocal
guarantees related to outside consortium members’ share of joint and several liability,
these are not taken into account. Tax cases, court proceedings and arbitration are not
longer included in contingent liability amounts. Instead a separate description is provided.
In connection with contracting assignments, security is often provided in the form
of a completion guarantee from a bank or insurance institution. The issuer of the
guarantee, in turn, normally receives an indemnity from the contracting company or
other Group company. Such indemnities related to the Group’s own contracting assign-
ments are not reported as contingent liabilities, since they do not involve any increased
liability compared to the contracting assignment.
Note 33, “Assets pledged, contingent liabilities and contingent assets,” presents
information about contingent liabilities.
Contingent assets
Contingent assets are possible assets arising from past events and whose existence will
be confirmed only by the occurrence or non-occurrence of one or more uncertain future
events not wholly within the control of the Company.
In the Group’s construction operations, it is not unusual that claims for additional
compensation from the customer arise. If the right to additional compensation is con-
firmed, this affects the valuation of the project when reporting in compliance with IAS
11, “Construction Contracts.” As for claims that have not yet been confirmed, it is not
practicable to provide information about these, unless there is an individual claim of
substantial importance to the Group.
IAS 19, “Employee Benefits”This accounting standard makes a distinction between defined-contribution and
defined-benefit pension plans. Defined-contribution pension plans are defined as plans
in which the company pays fixed contributions into a separate legal entity and has no
obligation to pay further contributions even if the legal entity does not have sufficient
assets to pay all employee benefits relating to their service until the balance sheet date.
Other pension plans are defined-benefit. The calculation of defined-benefit pension
plans uses a method that often differs from local rules in each respective country.
Obligations and costs are to be calculated according to the “projected unit credit method.”
The purpose is to recognize expected future pension disbursements as expenses in a way
that yields more uniform expenses over the employee’s period of employment. Expected
future wage or salary increases and expected inflation are taken into account in the
calculation. The present value of the obligations is to be discounted primarily on the
basis of the market return on high quality corporate bonds (United Kingdom), or govern-
ment bonds (Norway and Sweden), with maturities matching the pension obligations,
on the balance sheet date. The fair value of plan assets, for example in pension funds,
is to be subtracted from the estimated value of the obligations. The pension expense
and the return on plan assets recognized in the income statement refer to the pension
expense and return estimated on January 1. Divergences from actual pension expense
and return comprise actuarial gains and losses. These are recognized directly in equity
and do not have any impact on earnings.
When there is a difference between how pension expense is determined in a legal
entity and the Group, a provision or receivable is recognized concerning the difference
for taxes and social insurance contributions based on the Company’s pension expenses.
The provision or receivable is not calculated at present value, since it is based on
present-value figures. Social insurance contributions on actuarial gains and losses are
recognized directly in equity.
Obligations related to contributions to defined-contribution plans are recognized as
expenses in the income statement as they arise.
The Group’s net obligation related to other long-term employee benefits, aside
from pensions, amounts to the value of future benefits that employees have earned as
compensation for the services they have performed during the current and prior periods.
The obligation is calculated using the projected unit credit method and is discounted at
present value, and the fair value of any plan assets is subtracted. The discount rate is the
interest rate on the balance sheet date for high quality corporate bonds, or government
bonds, with a maturity matching the maturity of the obligations.
A provision is recognized in connection with termination of employees only if the
Company is obligated to end employment before the normal retirement date or when
benefits are offered in order to encourage voluntary termination. In cases where the
Company terminates employees, the provision is calculated on the basis of a detailed
plan that at least includes the location, function and approximate number of employees
affected as well as the benefits for each job classification or function and the time at
which the plan will be implemented.
IFRS 2, “Share-based Payment”The Share Award Plan that was introduced during 2005 is recognized as share-based
payments that are settled with equity instruments, in compliance with IFRS 2. This
means that fair value is calculated on the basis of estimated fulfillment of established
income targets during the measurement period. After the end of the measurement
period, fair value is established. This value is allocated over the four-year vesting period.
There is no reappraisal after fair value is established during the remainder of the vesting
period except for changes in the number of shares because the condition of continued
employment during the vesting period is no longer met.
IAS 7, “Cash Flow Statements”In preparing its cash flow statement, Skanska applies the indirect method in compliance
with the accounting standard. Aside from cash and bank balance flows, cash and cash
equivalents are to include short-term investments whose transformation into bank bal-
ances may occur in an amount that is mainly known in advance. Short-term investments
with maturities of less than three months are regarded as cash and cash equivalents.
Cash and cash equivalents that are subject to restrictions are reported either as current
receivables or as non-current receivables.
In addition to the cash flow statement prepared in compliance with the standard, the
Report of the Directors presents an operating cash flow statement that does not conform
to the structure specified in the standard. The operating cash flow statement was
prepared on the basis of the operations that the various business streams carry out.
IAS 33, “Earnings per Share”Earnings per share are reported directly below the consolidated income statement and
are calculated by dividing the portion of profit for the year that is attributable to the
Parent Company’s equity holders (shareholders) by the average number of shares
outstanding during the period.
For the Share Award Plan that was introduced during 2005, the dilution effect is
calculated by dividing potential ordinary shares by the number of shares outstanding.
The calculation of potential ordinary shares occurs in two stages. First there is an assess-
ment of the number of shares that may be issued when established targets are fulfilled.
The number of shares for the respective year covered by the Plan is then determined the
following year, provided that the condition of continued employment is met. In the next
step, the number of potential ordinary shares is reduced by the value of the consideration
that Skanska is expected to receive, divided by the average market price of a share during
the period.
Note 01 Continued

Skanska Review of 2007 Notes, including accounting and valuation principles 79
IAS 24, “Related Party Disclosure”According to this accounting standard, information must be provided about transactions
and agreements with related companies and physical persons. In the consolidated
financial statements, intra-Group transactions fall outside this reporting requirement.
Note 36, “Personnel,” Note 37, “Remuneration to senior executives and Board mem-
bers,” and Note 39, “Related party disclosures,” provide disclosures in compliance with
the accounting standard.
IAS 40, “Investment Property”Skanska reports no investment properties. Properties that are used in the Group’s own
operations are reported in compliance with IAS 16, “Property, Plant and Equipment.”
The Group’s holdings of current-asset properties are covered by IAS 2, “Inventories”
and thus fall outside the application of IAS 40, “Investment Property.”
IAS 14, “Segment Reporting”A segment is a distinguishable portion of the Group that is either engaged in providing
products or services (business streams) or goods and services within a particular economic
environment (geographic area) that is subject to risks and returns that are different from
other segments. The division into business streams and markets reflects the internal
organization of the Company and its reporting system.
Skanska’s business streams are its primary segment reporting format. Skanska carries
out its operations in four business streams: Construction, Residential Development,
Commercial Development and Infrastructure Development. Skanska’s geographic mar-
kets are its secondary segment reporting format. The markets are Sweden, the Nordic
countries excluding Sweden, Europe excluding the Nordic countries, the United States
and, finally, other markets. Infrastructure Development has consistently been reported
as “Other markets.”
The geographic division in the secondary segment reflects the division of Skanska’s
business into different home markets.
In transactions between business streams, pricing occurs on market terms.
IAS 10, “Events After the Balance Sheet Date”Events after the balance sheet date may, in certain cases, confirm a situation that existed
on the balance sheet date. According to the standard, such events shall be taken into
account when financial statements are prepared. Information is provided about other
events after the balance sheet date that occur before the signing of the financial state-
ments if its omission would affect the ability of a reader to make a correct assessment
and a sound decision.
As stated earlier, divestment of a property is normally reported as income during the
period when a binding agreement is signed, even if necessary regulatory approvals have
not yet been received. Contractual terms that in some way are at the disposition of the
counterparty may cause the reporting of income to be postponed while waiting for the
terms to be fulfilled. In some cases this also applies to regulatory approvals.
Information about events after the balance sheet date is provided in Note 41, “Events
after the balance sheet date.”
IAS 32, “Financial Instruments: Presentation”Offsetting of financial assets and financial liabilities occur when a company has a legal
right to offset items against each other and intends to settle these items with a net
amount or, at the same time, divest the asset and settle the liability.
Prepaid income and expenses as well as accrued income and expenses that are
related to the business are not financial instruments. Pension liabilities and receivables
from or liabilities to employees are not financial instruments either. Nor are assets and
liabilities not based on contracts, for example income taxes, financial instruments.
Information in compliance with the accounting standard is provided mainly in
Notes 6, “Financial instruments,” Note 21, “Financial assets” and Note 27, “Financial
liabilities.”
IAS 39, “Financial Instruments: Recognition and Measurement”The accounting standard deals with measurement and recognition of financial instruments.
Excepted from application in compliance with IAS 39 are, among others, holdings in
subsidiaries, associated companies and joint ventures, leases, the rights under employ-
ment contracts, the Company’s own shares and financial instruments to which IFRS 2,
“Share-based Payments” applies. All financial instruments covered by this standard,
including all derivatives, are reported in the balance sheet.
A derivative is a financial instrument whose value changes in response to changes in
an underlying variable, that requires no initial investment or one that is small and that is
settled at a future date. An embedded derivative is a contract condition that causes
the value of the contract to be affected in the same way as if the condition were an
independent derivative. This is the case, for example, when a construction contract is
expressed in a currency which is a foreign currency for both parties. If it is customary for
the foreign currency to be used for this type of contract, the embedded derivative will
not be separated. According to IFRIC 9, “Reassessment of Embedded Derivatives,”
a reassessment of whether embedded derivatives shall be separated from the host
contract is needed only if the host contract is changed.
A financial asset or financial liability is recognized in the balance sheet when the
Group becomes a party to the contractual provisions of the instrument. Trade accounts
receivable are recognized in the balance sheet when an invoice has been sent. A liability
is recognized when the counterparty has performed and there is a contractual obligation
to pay, even if the invoice has not yet been received. Trade accounts payable are
recognized when an invoice has been received.
A financial asset is derecognized from the balance sheet when the contractual rights
are realized, expire or the Group loses control of them. The same applies to a portion of
a financial asset. A financial liability is derecognized from the balance sheet when the
contractual obligation is fulfilled or otherwise extinguished. The same applies to a
portion of a financial liability.
Acquisitions and divestments of financial assets are recognized on the transaction
date, which is the date that the Company undertakes to acquire or divest the asset.
Financial instruments are initially recognized at cost, equivalent to the instrument’s
fair value plus transaction costs, except instruments in the category “assets at fair value
through profit or loss,” which are recognized exclusive of transaction costs. Recognition
then occurs depending on how they are classified as described below.
Financial assets, including derivatives, are classified as “assets at fair value through
profit or loss,” “held-to-maturity investments,” “loans and receivables” and
“available-for-sale assets.”
“Assets at fair value through profit and loss,” and “available-for-sale financial
assets” are measured at fair value in the balance sheet. Change in value of “assets at
fair value through profit or loss” is recognized in the income statement, while change
in value of “available-for-sale assets” is recognized directly in equity. When the latter
assets are divested, accumulated gains or losses are transferred to the income statement.
Also in the latter category are shares carried at cost. “Held-to-maturity investments”
and “loans and receivables” are measured at accrued cost.
Financial liabilities including derivatives are classified as “liabilities at fair value
through profit and loss” and “other financial liabilities.”
“Liabilities at fair value through profit and loss” are measured at fair value in the
balance sheet, with change of value recognized in the income statement. “Other
financial liabilities” are measured at accrued cost.
Skanska uses currency derivatives and foreign currency loans to hedge against
fluctuations in exchange rates. Recognition of derivatives varies depending on whether
hedge accounting in compliance with IAS 39 is applied or not.
Unrealized gains and losses on currency derivatives related to hedging of operational
transaction exposure are measured in market terms and recognized at fair value in the
balance sheet. The entire change in value is recognized directly in the income statement,
except in those cases that hedge accounting is applied. In hedge accounting, unrealized
gain or loss is recognized in the income statement according to a project’s degree of
completion, while the remainder is recognized in equity. When the hedged transaction
occurs and is recognized in the income statement, accumulated changes in value are
transferred from equity to the income statement.
Unrealized gains and losses on embedded currency derivatives in commercial
contracts are measured and recognized at fair value in the balance sheet. Changes in
fair value are recognized in the income statement.
Currency derivatives and foreign currency loans for hedging translation exposure
are carried at fair value in the balance sheet. Because hedge accounting is applied,
exchange rate differences after taking into account tax effect are recognized in consoli-
dated equity. If an operation in a country that has a functional currency other than the
euro is divested, accumulated exchange rate differences attributable to hedging of that
operation are transferred from equity to the income statement. The interest component
and changes in the value of the interest component of currency derivatives are recog-
nized as financial income or expenses.
Skanska uses interest rate derivatives to hedge against fluctuations in interest rates.
Hedge accounting in compliance with IAS 39 is not applied, however.
Unrealized gains and losses on interest rate derivatives are recognized at fair value
in the balance sheet. Changes in value excluding the current interest coupon portion,
which is recognized as interest income or an interest expense, are recognized as financial
income or expenses in the income statement.
IFRS 7, “Financial Instruments: Disclosures”This standard supplements the principles for recognizing, measuring and classifying
financial assets and liabilities in IAS 32 and IAS 39. According to this standard, the
Company must provide disclosures that make it possible to evaluate the significance

80 Notes, including accounting and valuation principles Skanska Review of 2007
of financial instruments for its financial position and performance as well as provide
disclosures that make it possible to evaluate the nature and extent of risks arising from
financial instruments to which the Company is exposed on the balance sheet date.
Disclosures in compliance with this accounting standard are presented in Note 6,
“Financial instruments.”
The note shows how financial instruments have been grouped into classes and
includes a reconciliation with the income statement.
IAS 20, “Accounting for Government Grants and Disclosure of Government Assistance”“Government assistance” refers to action by government designed to provide an
economic benefit specific to one company or a range of companies that qualify under
certain criteria. Government grants are assistance by government in the form of
transfers of resources to a company in return for past or future compliance with
certain conditions relating to its operations.
Government grants are recognized in the balance sheet as prepaid income or
reduction in the investment when it is reasonable assurance that the grants will be
received and that the Group will meet the conditions associated with the grant.
Order bookings and order backlogIn Construction assignments, an order booking refers to a written order confirmation or
signed contract. This also includes orders from Residential Development and Commercial
Development. For services related to fixed-price work, the order booking is recorded
when the contract is signed, and for services related to cost-plus work, the order booking
coincides with revenue. In Residential Development and Commercial Development, no
order bookings are reported.
Order backlog refers to the difference between order bookings for a period and
accrued revenue (accrued project expenses plus accrued project income adjusted for
loss provisions) plus order backlog at the beginning of the period.
The order backlog in the accounts of acquired subsidiaries on the date of acquisition
is not reported as order bookings, but is included in order backlog amounts.
Market appraisalCommercial Development
Note 22, “Current-asset properties/Project development” states estimated market
values for Skanska’s current-asset properties. For completed properties that include
commercial space and for development properties, market values have been partly cal-
culated in cooperation with external appraisers.
Infrastructure Development
Skanska obtains an estimated market value for infrastructure projects by discounting
estimated future cash flows in the form of dividends and loan repayments and equity by
a discount rate based on country, risk model and project phase for the various projects.
The discount rate chosen is applied to all future cash flows starting on the appraisal
date. The most recently updated financial model is used as a base. This financial model
describes all cash flows in the project and serves as the ultimate basis for financing,
which is carried out with full project risk and without guarantees from Skanska.
A market value is assigned only to projects that have reached financial close. All flows
are appraised − investments in the project (equity and subordinated debenture loans),
interest and principal payments on subordinated loans as well as dividends to and from
the project company. Today substantially all investments are denominated in currencies
other than euros. This means there is also an exchange rate risk in market values.
Market values have been partly calculated in cooperation with external appraisers.
Exchange rates, euros (EUR) per currency unit
Year-end exchange rate Average exchange rate
Currency Country/zone Dec 31 2007 Dec 31 2006 Jan–Dec 2007 Jan–Dec 2006
ARS Argentina 0.216 0.247 0.235 0.259
CZK Czech Republic 0.038 0.036 0.036 0.035
DKK Denmark 0.131 0.134 0.134 0.134
EUR EU euro zone 1.000 1.000 1.000 1.000
GBP U.K. 1.360 1.490 1.461 1.467
NOK Norway 0.125 0.121 0.125 0.124
PLN Poland 0.278 0.261 0.265 0.257
SEK Sweden 0.106 0.111 0.108 0.108
USD U.S. 0.680 0.759 0.731 0.797
Note 01 Continued

Skanska Review of 2007 Notes, including accounting and valuation principles 81
Note 02 Key estimates and judgments
Key estimates and judgmentsThe Senior Executive Team has discussed with the Board of Directors and the Audit
Committee the choices and disclosures related to the Group’s important accounting
principles and estimates, as well as the application of these principles and estimates.
Certain important accounting-related estimates that have been made when applying
the Group’s accounting principles are described below.
Goodwill impairment testingIn calculating the recoverable amount of cash-generating units for assessing any
goodwill impairment, a number of assumptions about future conditions and estimates
of parameters have been made. A presentation of these can be found in Note 18,
“Goodwill.” As understood from the description in this note, major changes in the
prerequisites for these assumptions and estimates might have a substantial effect
on the value of goodwill.
Pension assumptionsSkanska recognizes defined-benefit pension obligations according to the alternative
method in IAS 19, “Employee Benefits.” In this method, actuarial gains and losses are
recognized directly in equity and thus give rise to no effect on income. The consequence
is that future changes in actuarial assumptions, both positive and negative, will have an
immediate effect on recognized equity and on interest-bearing pension liability.
Note 28, “Pensions,” describes the assumptions and prerequisites that provide
the basis for recognition of pension liability, including a sensitivity analysis.
Percentage of completionSkanska applies the percentage of completion method, i.e. using a forecast of final
project results, income is recognized successively during the course of the project based
on the degree of completion. This requires that the size of project revenue and project
expenses can be reliably determined. The prerequisite for this is that the Group has
efficient, coordinated systems for cost estimating, forecasting and revenue/expense
reporting. The system also requires a consistent judgment (forecast) of the final outcome
of the project, including analysis of divergences compared to earlier assessment dates.
This critical judgment is performed at least once per quarter according to the “grandfather
principle,” i.e. the immediate superior examines the project in a number of reviews at
successively higher levels of the organization.
Note 03 Effects of changes in accounting principles
Due to the introduction of IFRS 7, “Financial Instruments: Disclosures,” effective on
January 1, 2007, the Group has revised Note 6, “Financial instruments.”
DisputesManagement’s best judgment has been taken into account in reporting disputed
amounts, but the actual future outcome may diverge from this judgment.
See Note 33, “Assets pledged, contingent liabilities and contingent assets,” and
Note 29, “Provisions.”
Investments in Infrastructure DevelopmentEstimated market values are based on discounting of expected cash flows for each
respective investment. Estimated yield requirements on investments of this type have
been used as discount rates. Changes in expected cash flows, which in a number of cases
extend 20–30 years ahead in time, and/or changes in yield requirements, may materially
affect both estimated market values and carrying amounts for each investment.
Current-asset propertiesThe stated total market value is estimated on the basis of prevailing price levels in the
respective location of each property. Changes in the supply of similar properties as well
as changes in demand due to changes in targeted return may materially affect both
estimated fair values and carrying amounts for each property.
In Residential Development operations, the supply of capital and the price of capital
for financing residential unit buyers’ investments are critical factors.
Prices of goods and servicesIn the Skanska Group’s operations, there are many different types of contractual
mechanisms. The degree of risk associated with the prices of goods and services varies
greatly, depending on the contract type.
Sharp increases in prices of materials may pose a risk, especially in long-term projects
with fixed-price obligations. Shortages of human resources as well as certain input
goods may also adversely affect operations. Delays in the design phase or changes in
design are other circumstances that may adversely affect projects.
82 Notes, including accounting and valuation principles Skanska Review of 2007
Note 04 Segment reporting
The division into business streams and markets reflects the Company’s internal organiza-
tion and reporting system.
Skanska’s business streams are reported as primary segments. Skanska carries out its
operations in four business streams: Construction, Residential Development, Commercial
Development and Infrastructure Development.
Geographic markets are reported as secondary segments. The market division that is
used is based on the natural delimitations between markets in the Group. “Other mar-
kets” refers to Latin America and the markets where the Infrastructure Development
business stream operates.
Intra-Group pricing between business streams occurs on market terms.
A. Primary segment – Business streamsConstruction is the Group’s largest business stream. Construction includes both building
and civil construction.
Residential Development creates residential projects for immediate sale. Housing
units are adapted to selected customer categories. The business units are responsible for
planning and selling the projects. Construction assignments are performed by Skanska’s
construction units in each respective market.
Commercial Development initiates, develops, leases and divests commercial property
projects.
Project development in this business stream focuses on office buildings, shopping
malls and logistics properties located in Stockholm, Gothenburg, the Öresund region
of southern Sweden and eastern Denmark, Warsaw and Wrocław (Poland), Budapest
(Hungary); and Prague and Ostrava (Czech Republic). Construction assignments are per-
formed in most markets by Skanska’s construction units.
Infrastructure Development specializes in identifying, developing and investing in
privately financed infrastructure projects, such as highways, hospitals and power gen-
erating plants. The business stream focuses on creating new potential projects in the
markets where the Group has operations. Construction assignments are performed in
most markets by Skanska’s construction units.
“Central and eliminations” includes the cost of Group headquarters and earnings of
central companies. The International unit, with a number of businesses that are being
discontinued, is also part of this item. In the consolidated financial statements, profits in
Construction related to property and infrastructure projects equivalent to the Group’s
ownership stake in the projects are eliminated. These eliminations are reversed as the
depreciation/contract period progresses or when projects are divested.
Assets and liabilities by business streamEach business stream has operating responsibility for its capital employed. The capital
employed by each business stream consists of its total assets minus tax assets and intra-
Group receivables invested in Skanska’s treasury unit (”internal bank”) less non-interest-
bearing liabilities excluding tax liabilities. Acquisition goodwill has been reported in the
business stream to which it belongs.
Revenue and expenses by business streamEach business stream has operating responsibility for its income statement down to and
including operating income. If its assets include interest-bearing receivables and cash
and cash equivalents other than funds invested in the Group’s treasury unit, the compa-
ny is also responsible for the interest income that these assets earn. No interest expenses
or taxes are included in the income statements of the respective business streams.

Skanska Review of 2007 Notes, including accounting and valuation principles 83
Construction Residential
Development Commercial
Development Infrastructure Development
Central and eliminations Group total
2007 2006 2007 2006 2007 2006 2007 2006 2007 2006 2007 2006
Income statement
External revenue 13,782.7 12,356.9 830.1 733.6 337.2 357.4 12.4 16.3 39.3 110.1 15,001.7 13,574.3
Intra-Group revenue 539.5 472.5 1.2 12.8 0.1 –540.8 –485.2 0.0 0.0
Total revenue 14,322.3 12,829.4 830.1 733.6 338.3 370.2 12.5 16.3 –501.5 –375.1 15,001.7 13,574.3
Cost of sales –13,176.7 –11,857.1 –704.9 –600.6 –214.0 –216.5 –22.5 –19.0 518.9 349.1 –13,599.3 –12,344.1
Gross income 1,145.5 972.2 125.2 133.0 124.3 153.7 –9.9 –2.7 17.4 –26.0 1,402.4 1,230.2
Selling and administrative expenses –673.3 –618.4 –59.3 –46.7 –27.7 –25.4 –20.3 –20.2 –80.9 –44.2 –861.5 –754.9
Income from joint ventures and associated companies 8.3 6.7 12.4 5.7 1.7 2.5 18.7 22.0 2.3 2.4 43.5 39.3
Operating income 1 480.5 360.5 78.3 92.1 98.4 130.8 –11.6 –0.9 –61.2 –67.9 584.4 514.6
Interest income 14.9 9.6 1.4 0.6 2.4 2.3 0.1 49.0 31.3 67.8 43.9
Interest expenses –17.8 –11.6 –17.8 –11.6
Change in fair value –11.2 –12.8 –11.2 –12.8
Other financial items –10.5 4.5 –10.5 4.5
Income after financial items 495.4 370.1 79.7 92.7 100.7 133.0 –11.5 –0.9 –51.8 –56.3 612.6 538.7
Taxes –167.1 –143.7 –167.1 –143.7
Profit for the year 495.4 370.1 79.7 92.7 100.7 133.0 –11.5 –0.9 –218.9 –200.0 445.5 395.0
Profit for the year
attributable toEquity holders 442.8 392.8
Minority 2.7 2.2
1 of which depreciation/amortization –135.2 –118.0 –0.2 –0.5 –0.3 –0.1 –2.4 –2.3 –1.0 –3.0 –139.1 –124.0
of which impairment losses/reversals of impairment losses goodwill –0.9 –0.9 0.0
other assets –0.8 –10.3 –1.2 –0.5 –3.8 –5.7 –10.8
of which gains from divest-ments of residential units 120.5 113.2 –0.5 –1.1 120.0 112.1
of which gains from commer-cial property divestments 24.9 13.2 113.6 136.2 1.7 1.8 140.2 151.2
Note 04 Continued
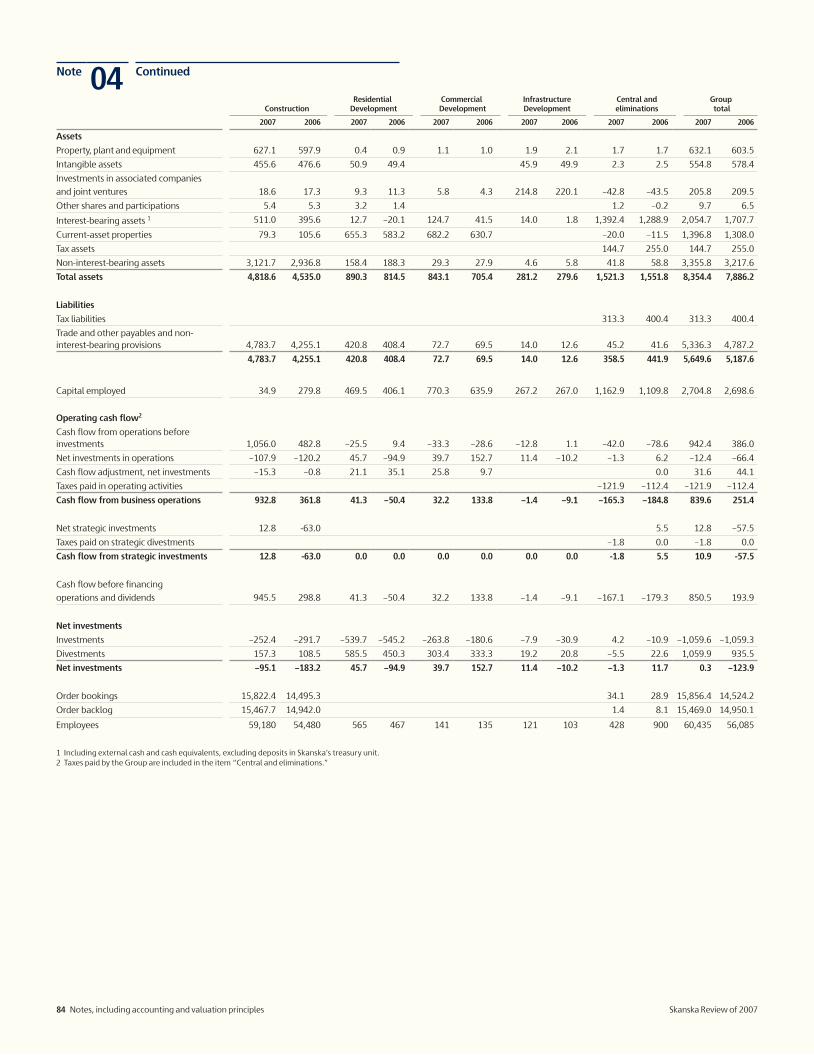
84 Notes, including accounting and valuation principles Skanska Review of 2007
Note 04 Continued
Construction Residential
Development Commercial
Development Infrastructure Development
Central and eliminations
Group total
2007 2006 2007 2006 2007 2006 2007 2006 2007 2006 2007 2006
Assets
Property, plant and equipment 627.1 597.9 0.4 0.9 1.1 1.0 1.9 2.1 1.7 1.7 632.1 603.5
Intangible assets 455.6 476.6 50.9 49.4 45.9 49.9 2.3 2.5 554.8 578.4
Investments in associated companies
and joint ventures 18.6 17.3 9.3 11.3 5.8 4.3 214.8 220.1 –42.8 –43.5 205.8 209.5
Other shares and participations 5.4 5.3 3.2 1.4 1.2 –0.2 9.7 6.5
Interest-bearing assets 1 511.0 395.6 12.7 –20.1 124.7 41.5 14.0 1.8 1,392.4 1,288.9 2,054.7 1,707.7
Current-asset properties 79.3 105.6 655.3 583.2 682.2 630.7 –20.0 –11.5 1,396.8 1,308.0
Tax assets 144.7 255.0 144.7 255.0
Non-interest-bearing assets 3,121.7 2,936.8 158.4 188.3 29.3 27.9 4.6 5.8 41.8 58.8 3,355.8 3,217.6
Total assets 4,818.6 4,535.0 890.3 814.5 843.1 705.4 281.2 279.6 1,521.3 1,551.8 8,354.4 7,886.2
Liabilities
Tax liabilities 313.3 400.4 313.3 400.4
Trade and other payables and non- interest-bearing provisions 4,783.7 4,255.1 420.8 408.4 72.7 69.5 14.0 12.6 45.2 41.6 5,336.3 4,787.2
4,783.7 4,255.1 420.8 408.4 72.7 69.5 14.0 12.6 358.5 441.9 5,649.6 5,187.6
Capital employed 34.9 279.8 469.5 406.1 770.3 635.9 267.2 267.0 1,162.9 1,109.8 2,704.8 2,698.6
Operating cash flow2
Cash flow from operations before investments 1,056.0 482.8 –25.5 9.4 –33.3 –28.6 –12.8 1.1 –42.0 –78.6 942.4 386.0
Net investments in operations –107.9 –120.2 45.7 –94.9 39.7 152.7 11.4 –10.2 –1.3 6.2 –12.4 –66.4
Cash flow adjustment, net investments –15.3 –0.8 21.1 35.1 25.8 9.7 0.0 31.6 44.1
Taxes paid in operating activities –121.9 –112.4 –121.9 –112.4
Cash flow from business operations 932.8 361.8 41.3 –50.4 32.2 133.8 –1.4 –9.1 –165.3 –184.8 839.6 251.4
Net strategic investments 12.8 -63.0 5.5 12.8 –57.5
Taxes paid on strategic divestments –1.8 0.0 –1.8 0.0
Cash flow from strategic investments 12.8 -63.0 0.0 0.0 0.0 0.0 0.0 0.0 -1.8 5.5 10.9 -57.5
Cash flow before financing
operations and dividends 945.5 298.8 41.3 –50.4 32.2 133.8 –1.4 –9.1 –167.1 –179.3 850.5 193.9
Net investments
Investments –252.4 –291.7 –539.7 –545.2 –263.8 –180.6 –7.9 –30.9 4.2 –10.9 –1,059.6 –1,059.3
Divestments 157.3 108.5 585.5 450.3 303.4 333.3 19.2 20.8 –5.5 22.6 1,059.9 935.5
Net investments –95.1 –183.2 45.7 –94.9 39.7 152.7 11.4 –10.2 –1.3 11.7 0.3 –123.9
Order bookings 15,822.4 14,495.3 34.1 28.9 15,856.4 14,524.2
Order backlog 15,467.7 14,942.0 1.4 8.1 15,469.0 14,950.1
Employees 59,180 54,480 565 467 141 135 121 103 428 900 60,435 56,085
1 Including external cash and cash equivalents, excluding deposits in Skanska’s treasury unit.2 Taxes paid by the Group are included in the item “Central and eliminations.”

Skanska Review of 2007 Notes, including accounting and valuation principles 85
Note 04 Continued
B. Secondary segment − Geographic markets
SwedenOther Nordic
countriesOther
EuropeUnitedStates
Othermarkets
Central andeliminations Total
2007
External revenue 3,262.5 3,021.8 4,086.2 4,109.3 482.7 39.3 15,001.7
Internal revenue 323.9 201.1 15.8 0.1 –540.8 0.0
Total revenue 3,586.3 3,222.9 4,101.9 4,109.3 482.8 –501.5 15,001.7
Total assets 2,393.1 2,083.6 2,737.5 1,699.2 537.9 –1,096.9 8,354.4
Investments in non-current assets and businesses –59.1 –48.8 –56.5 –37.1 –25.2 –2.4 –229.1
Investments in current-asset properties –265.4 –431.3 –140.5 6.7 –830.5
Total investments –324.5 –480.1 –197.1 –37.1 –25.2 4.3 –1,059.6
Divestments of non-current assets and businesses 17.1 29.3 19.5 14.9 21.1 –0.1 101.7
Divestments of current-asset properties 429.9 434.8 99.0 –5.5 958.2
Total divestments 447.0 464.1 118.5 14.9 21.1 –5.6 1,059.9
2006
External revenue 2,875.2 2,699.4 3,407.5 4,059.7 422.3 110.1 13,574.3
Internal revenue 260.8 213.9 10.6 –485.2 0.0
Total revenue 3,136.0 2,913.3 3,418.1 4,059.7 422.3 –375.1 13,574.3
Total assets 2,218.5 1,914.4 2,448.5 1,462.2 460.8 –618.2 7,886.2
Investments in non-current assets and businesses –42.7 –28.2 –143.7 –37.4 –42.4 –1.5 –295.9
Investments in current-asset properties –267.8 –396.7 –89.5 –9.4 –763.4
Total investments –310.5 –424.9 –233.2 –37.4 –42.4 –10.9 –1,059.3
Divestments of non-current assets and businesses 17.2 5.5 27.8 10.4 23.3 7.1 91.3
Divestments of current-asset properties 322.5 377.3 128.9 15.5 844.2
Total divestments 339.7 382.8 156.7 10.4 23.3 22.6 935.5

86 Notes, including accounting and valuation principles Skanska Review of 2007
Note 04 Continued
C. Other information by business stream/reporting unit and breakdown of eliminations
Revenue Operating
income Operating margin, %
Return on capital employed, % Order backlog Order bookings
Group 2007 2006 2007 2006 2007 2006 2007 2006 2007 2006 2007 2006
Construction 1
Sweden 2,960.7 2,607.0 138.8 118.9 4.7 4.6 2,333.3 2,179.3 3,167.8 2,973.3
Norway 1,378.8 1,149.5 59.9 48.1 4.3 4.2 1,179.6 1,074.2 1,434.0 1,337.1
Denmark 349.9 413.4 0.2 -34.4 0.1 -8.3 19.7 222.6 323.6 404.7
Finland 1,054.0 906.2 42.8 20.6 4.1 2.3 801.0 775.2 1,057.2 1,040.3
Poland 854.0 738.0 39.8 29.1 4.7 3.9 410.6 646.8 581.8 612.0
Czech Republic 1,233.1 1,219.0 51.8 35.9 4.2 2.9 1,264.7 1,448.0 1,010.1 1,261.8
United Kingdom 1,912.3 1,330.6 33.2 44.5 1.7 3.3 3,259.3 3,516.1 1,965.1 2,561.2
USA Building 2,938.5 2,997.6 31.9 29.9 1.1 1.0 3,336.4 2,889.3 3,740.4 2,711.8
USA Civil 1,170.8 1,062.0 58.7 49.7 5.0 4.7 2,380.9 1,887.6 1,910.7 1,199.0
Latin America 470.2 406.0 23.5 18.2 5.0 4.5 482.2 302.9 631.8 394.1
14,322.2 12,829.4 480.5 360.5 3.4 2.8 >100 >100 15,467.7 14,942.0 15,822.4 14,495.3
Residential Development
Sweden 370.9 283.2 46.4 32.2 12.5 11.4 42.6 >100
Norway 187.4 169.9 10.7 17.6 5.7 10.4 6.6 12.9
Denmark 66.0 57.9 –2.7 10.4 –4.1 17.9 –2.2 23.3
Finland 134.9 170.1 13.6 23.9 10.1 14.0 11.9 24.4
Czech Republic 70.8 52.5 10.3 8.0 14.5 15.2 32.2 26.1
830.1 733.6 78.3 92.1 9.4 12.6 14.9 27.6
Commercial Development 338.3 370.2 98.4 130.8 14.2 21.2
Infrastructure Development 12.5 16.3 –11.6 –0.9 –4.2 0.6
Central 52.1 122.9 –60.5 –55.5 1.4 8.1 34.1 28.9
Eliminations
Intra-Group construction forResidential Development 2 –382.6 –362.6
Commercial Development –162.3 –96.2 –9.3 –3.7
Infrastructure Development 1 –1.3 –13.3
Intra-Group property divestments –9.3 –15.7 –2.2 –2.6
Divestments, Commercial Development 4.0 4.3
Divestments, Infrastructure Development 0.3 0.8
Dissolution over useful lifeInfrastructure Development 1.9 1.7
Other 0.5 –23.6 5.8 0.4
–553.6 –498.0 –0.6 –12.3
Total 15,001.7 13,574.3 584.4 514.6 25.1 22.6 15,469.0 14,950.1 15,856.4 14,524.2
1 Construction included EUR 773.0 M (582.9) in intra-Group construction for Infrastructure Development. Elimination does not occur, since this revenue comprises invoicing to joint ventures, which are not consolidated but are instead recognized according to the equity method of accounting.
2 Because the Group applies the percentage of completion method, taking into account the degree of sales and completion, no intra-Group gains arise in the consolidated financial statements that need to be eliminated. Elimination is done in Residential Development. See Note 1, “Accounting and valuation principles,” and IAS 11, “Construction Contracts.”.
Note 05 Non-current assets held for sale and discontinued operations
Non-current assets held for sale and discontinued operations are recognized in compli-
ance with IFRS 5. See “Accounting and valuation principles,” Note 1. During 2007 and
2006, no units were recognized as discontinued.
Nor were any non-current assets recognized as held for sale.

Skanska Review of 2007 Notes, including accounting and valuation principles 87
Note 06 Financial instruments
Financial instruments are reported in compliance with IAS 39, “Financial Instruments: Recognition and Measurement, ”IAS 32, “Financial Instruments:
Presentation” and IFRS 7, “Financial Instruments: Disclosures.”
The importance of financial instruments for the financial position and earnings of the Group
Financial instruments in the balance sheet
The following table presents the recognized and fair value of financial instruments by category as well as a reconciliation with total assets and liabilities
in the balance sheet. See also Note 21, “Financial assets,” Note 24, “Trade and other receivables,” Note 27, “Financial liabilities” and Note 30, “Trade
and other payables.”Financial assets
at fair value through
profit or loss
Hedgeaccountedderivatives
Held tomaturity
investments
Availablefor sale
financial assetsLoans and
receivables
Totalcarryingamount
Fairvalue
2007
Financial instruments
Interest-bearing assets and derivatives
Financial assets 1
Financial investments at fair value 8.8 3.5 84.1 96.4 96.4
Financial investments at amortized cost 62.7 62.7 62.7
Financial interest-bearing receivables 404.2 404.2 404.3
8.8 3.5 62.7 84.1 404.2 563.2 563.3
Cash equivalents at fair value 55.1 55.1 55.1
Cash 1,448.6 1,448.6 1,448.6
8.8 3.5 62.7 139.3 1,852.8 2,067.0 2,067.1
Trade accounts receivable 2 2,139.0 2,139.0 2,139.0
Other operating receivables including shares
Shares recognized as available-for-sale assets 3 9.7 9.7 9.7
Other operating receivables 2, 4 20.2 20.2 20.2
0.0 0.0 0.0 9.7 20.2 29.9 29.9
Total financial instruments 8.8 3.5 62.7 149.0 4,012.0 4,235.9 4,236.0
2006
Financial instruments
Interest-bearing assets and derivatives
Financial assets 1
Financial investments at fair value 26.0 10.1 182.0 218.1 218.1
Financial investments at amortized cost 72.4 72.4 72.4
Financial interest-bearing receivables 217.7 217.7 217.7
26.0 10.1 72.4 182.0 217.7 508.2 508.2
Cash equivalents at fair value 235.7 235.7 235.7
Cash 977.5 977.5 977.5
26.0 10.1 72.4 417.7 1,195.2 1,721.4 1,721.4
Trade accounts receivable 2 2,121.1 2,121.1 2,121.1
Other operating receivables including shares
Shares recognized as available-for-sale assets 3 6.5 6.5 6.5
Other operating receivables 2, 4 25.3 25.3 25.3
0.0 0.0 0.0 6.5 25.3 31.9 31.9
Total financial instruments 26.0 10.1 72.4 424.2 3,341.6 3,874.4 3,874.4
1 The carrying amount for financial assets excluding shares, totaling EUR 387.1 M (379.9), can be seen in Note 21, “Financial assets.”
Financial non-current assets Financial investments excluding shares Financial receivablesFinancial current assets Financial investments Financial receivables
41.326.0
117.8378.1
100.359.1
190.2158.6
563.2 508.2
2 See Note 24, “Trade and other receivables.”3 The shares are measured at cost. The shares are reported in the consolidated balance sheet among financial assets. See also Note 21, “Financial assets.”4 In the consolidated balance sheet, EUR 2,663.6 M (2,572.8) is reported as “Trade and other receivables.” See Note 24, “Trade and other receivables.” Trade account receivables of EUR 2,139.0 M
(2,121.1) and other operating receivables of EUR 20.2 M (25.3), totaling EUR 2,159.2 M (2,146.4) are reported as financial instruments. The remaining amount in the balance sheet item, EUR 504.4 M (426.3), is reported below in the reconciliation with the balance sheet. Accrued interest income, deposits, receivables on divested properties etc. are reported as financial operating receivables. Non-financial other operating receivables include, for example, interim items other than accrued interest, VAT receivables, pension-related receivables and other employee-related receivables.

88 Notes, including accounting and valuation principles Skanska Review of 2007
Liabilities
Financial liabilities at fair value
through profit or loss
Hedgeaccountedderivatives
Financialliabilities at
amortized costTotal carrying
amount Fair value
2007
Financial,instruments
Interest-bearing,liabilities,and,derivatives
Financial,liabilities,1
Financial,liabilities,at,fair,value 3.0 6.5 9.4 9.4
Financial liabilities at amortized cost 377.7 377.7 378.8
3.0 6.5 377.7 387.1 388.2
Operating liabilities
Trade accounts payable 1,577.8 1,577.8 1,577.8
Other operating liabilities 2 186.4 186.4 186.4
0.0 0.0 1,764.2 1,764.2 1,764.2
Total financial instruments 3.0 6.5 2,141.9 2,151.3 2,152.4
2006
Financial instruments
Interest-bearing liabilities and derivatives
Financial liabilities 1
Financial liabilities at fair value 4.9 2.4 7.3 7.3
Financial liabilities at amortized cost 372.6 372.6 374.1
4.9 2.4 372.6 379.9 381.4
Operating liabilities
Trade accounts payable 1,533.6 1,533.6 1,533.6
Other operating liabilities 2 155.9 155.9 155.9
0.0 0.0 1,689.6 1,689.6 1,689.6
Total financial instruments 4.9 2.4 2,062.2 2,069.5 2,071.0
1 The carrying amount for financial liabilities totaling EUR 387.1 M (379.9) can be seen in Note 27 “Financial liabilities.”2 Other operating liabilities, totaling EUR 1,698.7 M (1,608.1) are reported in the balance sheet together with trade accounts payable of EUR 1,577.8 M (1,533.6). The
total balance sheet item “Trade and other payables” amounts to EUR 3,276.5 M (3,141.7). See Note 30. Accrued interest expenses, checks issued but not cashed liabilities for unpaid properties etc. are reported as other financial operating liabilities. Other non-financial operating liabilities are, for example, interim items other than accrued interest, VAT liabilities, pension-related liabilities and other employee-related liabilities.
Note 06 Continued
Reconciliation with balance sheet 2007 2006
Assets
Financial instruments 4,235.9 3,874.4
Other assets
Property, plant and equipment and intangible assets 1,186.9 1,181.9
Investments in joint ventures and associated companies 205.8 209.5
Tax assets 144.7 255.0
Current-asset properties 1,396.8 1,308.0
Inventories 81.4 53.5
Gross amount due from customers for contract work 598.6 577.5
Trade and other receivables 4 above 504.4 426.3
Total assets 8,354.4 7,886.2

Skanska Review of 2007 Notes, including accounting and valuation principles 89
Reconciliation with balance sheet 2007 2006
Equity and liabilities
Financial instruments 2,151.3 2,069.5
Other liabilities
Equity and liabilities 2,193.2 2,138.6
Pensions 121.6 172.1
Tax liabilities 313.3 400.4
Provisions 396.0 397.6
Gross amount due to customers for contract work 1,666.6 1,256.0
Trade and other payables2 above 1,512.3 1,452.1
Total equity and liabilities 8,354.4 7,886.2
Note 06 ContinuedFinancial assets and liabilities at fair value through profit or loss“Financial assets and liabilities at fair value through profit or loss” belong to the catego-
ry that has been identified as such on the first recognition date or consist of derivatives.
Assets
The Group has EUR 8.8 M (26.0) in financial assets at fair value through profit or loss.
The entire 2007 amount is attributable to derivatives. In 2006, EUR 22.3 M consisted
of an investment in a Swedish liquidity fund.
Liabilities
The Group has EUR 3.0 M (4.9) in financial liabilities at fair value through profit or loss.
The entire amount is attributable to derivatives.
Fair value
Fair value of financial instruments in the consolidated accounts can be seen in the
table above.
In setting fair value, the official price quotation in an active market is primarily used.
If this does not exist, fair value is calculated by discounting future cash flows based on
quoted market interest rates for each respective maturity and currency. This method is
the one most commonly used. A few transactions with option elements have been cal-
culated using the Black-Scholes model. In calculating fair value in the borrowing port-
folio, Skanska takes into account current market interest rates, which include the credit
risk premium that Skanska is estimated to pay for its borrowing.
The total change in fair value of financial assets and liabilities calculated according to
the Black-Scholes model amounts to EUR 0.2 M (0), which is recognized in the income
statement.
The accumulated change in value of available-for-sale assets amounts to EUR 0 M (0).

90 Notes, including accounting and valuation principles Skanska Review of 2007
Note 06 Continued
Income and expenses from financial instruments recognized in the income statement 2007 2006
Recognized in operating income
Interest income on loan receivables 0.9 1.8
Interest expenses on financial liabilities at cost –0.2 –0.1
Impairment loss/reversal of impairment loss on loan receivables –3.6 –1.0
Cash flow hedge removed from equity and recognized in income statement 8.6 4.9
Total income and expenses in operating income 5.7 5.6
Recognized in financial items
Interest income on financial assets at fair value through profit or loss 5.8 0.2
Interest income on available-for-sale assets 12.9 12.0
Interest income on held-to-maturity investments 1.2 2.1
Interest income on loan receivables 8.6 5.5
Interest income on cash 28.1 23.7
Divestments of available-for-sale financial assets 0.1
Changes in market value of financial assets at fair value through profit or loss 0.1
Changes in market value of financial liabilities at fair value through profit or loss 0.3 0.2
Net exchange rate differences 4.0
Income on financial liabilities at amortized cost 1 3.7
Income from equity swaps 2.8
Total income in financial items 57.2 54.1
Interest expenses on financial liabilities at fair value through profit or loss 2 0.1 3.0
Interest expenses on financial liabilities at amortized cost –16.1 –16.0
Changes in market value of financial assets at fair value through profit or loss –0.3 –0.9
Changes in market value of financial liabilities at fair value through profit or loss –0.1
Net financial items from hedging of net investments in foreign subsidiaries 3 –11.4 –12.0
Impairment loss on available-for-sale financial assets –1.2 0.0
Net exchange rate differences –4.6 0.0
Expenses for borrowing programs –1.2 –1.0
Bank-related expenses –1.0 –1.3
Total expenses in financial items –35.7 –28.2
Net income and expenses from financial instruments reported in income statement 27.2 31.6
Of which interest income on financial assets not at fair value through profit or loss 51.7 45.1
Of which interest expenses on financial assets not at fair value through profit or loss –16.3 –16.1
1 Refers to loan redemption discounts.2 The amounts have arisen due to positive interest rate differences in currency swaps for the Group’s borrowing.3 The amount includes interest expenses totaling EUR –10.6 M (-12.0) attributable to currency futures.
Reconciliation with financial items 2007 2006
Total income from financial instruments in financial items 57.2 54.1
Total expenses from financial instruments in financial items –35.7 –28.2
Other interest income 11.1 0.4
Other interest expenses –1.8 1.4
Other financial items –2.6 –3.8
Income/loss from associated companies 0.1
Total financial items 28.2 24.1
See also Note 14. “Net financial items.”
Impact of financial instruments on the consolidated income statement and consolidated equity

Skanska Review of 2007 Notes, including accounting and valuation principles 91
Note 06 Continued
Income and expenses from financial instruments recognized directly in equity 2007 2006
Cash flow hedge recognized directly in equity 0.5 2.5
Cash flow hedge removed from equity and recognized in income statement –8.6 –4.9
Changes in value of available-for-sale assets 0.0 0.0
Translation differences for the year –48.4 –13.9
Minus hedging of foreign exchange risk in operations outside Sweden 23.0 19.0
Total –33.5 2.7
of which recognized in cash flow hedge reserve –8.1 –2.4
of which recognized in translation reserve –25.4 5.1
–33.5 2.7
CollateralThe Group has provided collateral (assets pledged) in the form of financial receivables
amounting to EUR 47.2 M (42.6). See also Note 33. These assets may be utilized by a
customer if Skanska does not fulfill its obligations according to the respective construc-
tion contract.
To a varying extent, the Group has obtained collateral for trade accounts payable in
the form of guarantees issued by banks and insurance companies and, in some cases, in
the form of guarantees from the parent companies of customers.
The Group did not obtain any asset during the year by taking control of collateral
received.
Financial hedgingTransaction exposure occurs when expected future net payment flows are in a currency
other than the functional currency of the local unit. Skanska uses currency derivatives to
minimize the risks of transaction exposure.
Net investments in foreign Group companies are regarded as investments of a long-
term nature and, as a rule, are not hedged.
Exceptions may occur, however, and in these cases the risks are reduced through
foreign currency loans and currency derivatives. Foreign exchange risks when borrowing
are reduced through currency swaps, and the risk of unfavorable interest rate refixing is
reduced through interest rate swaps.
Hedge accountingHedge accounting occurs to a limited extent as follows.
Cash flow hedging
Hedge accounting is applied to currency derivatives for contracted future net currency
flows according to the table below.
Currency derivatives for which hedge accounting is applied 2008 2009
2010and later
EUR sold at forward rate –155.1 –8.8
BRL sold at forward rate –44.8
Total equivalent value –199.9 –8.8 0
The fair value of currency derivatives outstanding varies with the current exchange rate.
Fair value at the exchange rates on December 31 can be seen in the following table.
Information on the changes recognized in the consolidated income statement and con-
solidated equity during the period is found in the above table with the heading “Impact
of financial instruments on consolidated income statement and consolidated equity.”
The hedges meet effectiveness requirements, which means that all changes due to
changes in exchange rates are recognized in equity.
Fair value of currency derivatives used as hedging instruments 2008 2009
2010 and later Total
EUR 12.4 0.5 12.9
Recognized gains 12.4 0.5 0.0 12.9
EUR –0.2 –0.2
BRL –0.3 –0.3
Recognized losses –0.5 0.0 0.0 –0.5
Hedging of net investments outside Sweden
Hedge accounting is applied when hedging net investments outside Sweden.
Net investments in North American operations are approximately 50 percent hedged
by means of currency futures due to their significant impact on Group equity in relation
to the Parent Company’s functional currency, SEK, in case of exchange rate fluctuations.
Net investments in Commercial Development and Infrastructure Development oper-
ations are currency hedged, by means of funding in local currencies or by entering into
currency futures contracts, since the intention is to sell these assets over time.
The fair value of foreign currency loans amounted to EUR 69.4 M (70.6) and the fair
value of forward currency contracts amounted to EUR –3.0 M (7.6).
At year-end, Skanska had hedged net investments outside Sweden amounting to
EUR 553.9 M (546.2).
Hedging of net investments outside Sweden
2007 2006
CurrencyNet
investment Hedge1Percentage
hedgedNet
investment Hedge 1
Percentage hedged
BRL 58.7 47.7 81% 48.0 39.9 83%
CLP 110.0 63.1 57% 118.3 67.3 57%
USD 365.9 191.3 52% 353.7 163.9 46%
EUR 522.1 236.5 45% 481.3 228.1 47%
GBP 107.7 9.9 9% 103.8 8.7 8%
PLN 131.5 0.0 0% 92.6 38.3 41%
NOK 358.9 5.4 2% 290.3 0.0 0%
Others 432.4 0.0 0% 410.3 0.0 0%
Total 2,087.2 553.9 27% 1,898.4 546.2 29%
1 After subtracting the tax portion.
The hedges meet effectiveness requirements, which means that all changes due to
changes in exchange rates are recognized in the translation reserve in equity.
See also Note 34, “Effect of changes in foreign exchange rates.”
Fair value hedges
Skanska currently has no fair value hedges.
Risks attributable to financial instrumentsThe risks that arise through financial instruments and to which the Group is exposed are
divided into credit risk, liquidity risk and market risk.
Credit risk describes the Group’s risk related to financial assets, and the risk is that a
counterparty will not fulfill its contractual payment obligations toward Skanska. Credit
risk is divided into financial credit risk and customer credit risk.
Liquidity risk is defined as the risk that Skanska cannot meet its payment obligations
due to lack of liquidity or to difficulties in obtaining or rolling over external loans.
Market risk is the Group’s risk that the fair value of or future cash flows from financial
instruments will fluctuate due to changes in market prices. Market risk is divided into
foreign exchange risk, interest rate risk and other price-related risks.
For example, other price-related risks include the risks of changes in share prices.
Skanska’s ongoing projects are not recognized as a financial instrument and the risk
in these projects is thus not reported in this note.
Disclosures concerning these risks can be read in the Report of the Directors and in
Note 2, “Key estimates and judgments.”

92 Notes, including accounting and valuation principles Skanska Review of 2007
Note 06 Continued
Objectives and policyThe Group’s Financial Policy states guidelines, objectives and limits for financial manage-
ment and administration of financial risks in the Group.
This policy document regulates the allocation of responsibility among Skanska’s
Board, the Senior Executive Team, Skanska Financial Services and the business units.
The purpose is to achieve a systematic assessment of both financial and business
risks, using a Groupwide risk management model.
The risk management model does not imply avoidance of risks, but is instead aimed
at identifying and managing these risks.
Within the Group, Skanska Financial Services has operational responsibility for ensur-
ing Group financing and for managing liquidity, financial assets and financial liabilities.
The objectives and policy for each type of risk are described in the respective sections
below.
Credit riskThe maximum credit exposure for financial assets on the balance sheet date is equiva-
lent to their fair value. This credit risk is divided below into financial credit risk, which
refers to risk in interest-bearing assets, and customer credit risk, which refers to the risk
in trade accounts receivable. The risk in other operating receivables is also described.
Financial credit risk − Risk in interest-bearing assets and derivativesThis is the risk that the Group runs in its relations with financial counterparties in the
case of deposits of surplus funds, bank account balances and investments in financial
assets. Credit risk also arises when using derivatives and consists of the risk that a
potential gain will not be realized in case the counterparty does not fulfill its part of the
contract.
In order to reduce the credit risk in derivatives, Skanska has signed standardized net-
ting agreements with all financial counterparties with which it enters into derivative
contracts.
Skanska endeavors to limit the number of financial counterparties, which must pos-
sess a rating at least equivalent to BBB+ at Standard & Poor’s or the equivalent rating at
Moody’s. The permitted exposure volume per counterparty is dependent on the coun-
terparty’s credit rating and the maturity of the exposure.
Exposure was EUR 2,067.0 M and maturity mainly within 3 months, as indicated by
the table headed “Liquidity reserve and maturity structure.”
At year-end, past-due interest-bearing assets and derivatives were EUR 0 M (0).
Impairment losses on interest-bearing receivables were EUR 0 M (0).
Customer credit risk − Risk in trade accounts receivableSkanska’s credit risk with regard to trade receivables has a high degree of risk diversifica-
tion, due to the large number of projects of varying sizes and types with numerous dif-
ferent customer categories in a large number of geographic markets.
The portion of Skanska’s operations related to construction projects extends only
limited credit, since projects are invoiced in advance as much as possible. In other opera-
tions, the extension of credit is limited to customary invoicing periods.
Trade,accounts,receivable 2007 2006
Carrying,amount 2,139.0 2,121.1
Impairment losses 29.3 27.1
Cost 2,168.3 2,148.2
Changes in impairment losses, trade accounts receivable 2007 2006
January 1 27.1 29.0
Acquisitions of companies 0.4
Impairment loss/reversal of impairment loss 3.9 1.5
Impairment losses settled –1.9 –4.1
Exchange rate differences 0.3 0.3
December 31 29.3 27.1
Risk in other operating receivables including sharesOther financial operating receivables consist of accrued interest income, deposits,
receivables for properties divested etc. No operating receivables became past-due and
there were no impairment losses on operating receivables.
Other financial operating receivables are reported by time interval with respect to
when the amounts fall due in the future.
2007 2006
Due within 30 days 2.6 5.6
Due in over 30 days but no more than 1 year 17.1 17.4
Due in more than 1 year 0.4 2.3
Total 20.2 25.3
Holdings of less than 20 percent of voting power in a company are reported as shares.
Their carrying amount is EUR 9.7 M (6.5).
Shares are subject to changes in value. Impairment losses on shares total EUR 2.5 M
(1.5), of which EUR 1.2 M (0) during the year.
Liquidity riskLiquidity risk is defined as the risk that Skanska cannot meet its payment obligations due
to lack of liquidity or to difficulties in obtaining or rolling over external loans.
The Group uses liquidity forecasting as a means of managing the fluctuations in
short-term liquidity. Surplus liquidity shall, if possible, primarily be used to repay the
principal on loan liabilities.
FundingSkanska has several borrowing programs, which provide good preparedness for tempo-
rary fluctuations in the Group’s liquidity requirements.
Bank credit facilitiesSkanska’s committed bank credit facilities consist of:
− A syndicated bank loan with a ceiling of EUR 750 M and a final due date of
June 30, 2014. On December 31, 2007, the degree of utilization was 0 percent,
since the loan facility had not yet been used.
− Two bilateral loan agreements with the Nordic Investment Bank amounting to
EUR 40 M and EUR 30 M, respectively.
These loans fall due in 2012. The Group’s unutilized credit lines at year-end amounted
to EUR 774.5 M (694.1).
Market funding programSkanska has two market funding programs.
− Commercial paper (CP) program related to short-term borrowing for maturities of up
to one year. The loan ceiling in the CP program amounts to SEK 6,000 M (correspond-
ing to about EUR 630 M). On December 31, 2007, the borrowed amount was SEK 0 M.
− Medium Term Note (MTN) program for borrowing with maturities between
1–10 years. The loan ceiling in the MTN program amounts to SEK 8,000 M (corre-
sponding to about EUR 850 M) On December 31, 2007, the borrowed amount was
SEK 665 M (939) (corresponding to about EUR 70 M [100]) with an average maturity of
0.6 (1.3) years.
These borrowing programs are mainly intended for borrowing in the Swedish credit
market, but it is possible to borrow in EUR within the framework of these programs.

Skanska Review of 2007 Notes, including accounting and valuation principles 93
Note 06 Continued
Liquidity reserve and maturity structureThe objective is to have a liquidity reserve of at least SEK 4 billion (corresponding to about EUR 0.42 billion) available within one week in the
form of cash equivalents or committed credit facilities. At year-end 2007, this amounted to about SEK 21 (14) billion (corresponding to about
EUR 2.22 billion [1.55]). The maturity structure of financial interest-bearing assets and liabilities and derivatives, was distributed over coming
years according to the following table.
Maturity
Maturity period by asset classWithin
3 monthsOver 3 months,
within 1 yearOver 1 year,
within 5 yearsMore than
5 years Total
2007
Financial investments at fair value 55.5 41.0 96.4
Financial investments at amortized cost 62.3 0.3 62.6
Financial interest-bearing assets 269.0 109.1 25.0 1.1 404.2
Cash equivalents at fair value 55.1 55.1
Cash 1,448.6 1,448.6
Total 1,772.8 226.9 65.9 1.3 2,066.9
2006
Financial investments at fair value 112.5 105.6 218.1
Financial investments at amortized cost 72.4 72.4
Financial interest-bearing assets 111.6 9.1 92.1 4.9 217.7
Cash equivalents at fair value 235.7 235.7
Cash 977.5 977.5
Total 1,324.8 194.0 197.7 4.9 1,721.4
The maturity structure of financial interest-bearing liabilities and derivatives was distributed over coming years according to the following table.
Maturity
Maturity period by liability classWithin
3 monthsOver 3 months.
within 1 yearOver 1 year.
within 5 yearsMore than
5 years Total
2007
Financial liabilities at fair value 9.4 9.4
Financial liabilities at amortized cost 42.1 140.4 188.6 6.6 377.7
Total 42.1 149.9 188.6 6.6 387.1
2006
Financial liabilities at fair value 7.3 7.3
Financial liabilities at amortized cost 40.4 46.1 210.4 75.8 372.6
Total 40.4 53.4 210.4 75.8 379.9
Of total interest-bearing financial liabilities, 42 (65) percent carried fixed interest rates and 58 (35) percent carried variable interest rates.
The allocation between fixed and variable interest rate fixing has been adjusted, taking into account interest rate swap contracts. The
Group’s interest rate swap portfolio on December 31 amounted to a nominal EUR 116.4 M (215.4). A net amount of EUR 10.6 M of liabilities
were swapped from fixed to variable interest rates; in 2006 the net amount was EUR 38.5 M from variable to fixed interest rates.
On December 31, 2007, the average maturity of the borrowing portfolio was 2.3 (2.4) years.
The Group’s most commonly occurring payment terms for trade accounts payable, by market, can be seen in the following table.
Number of days from invoicing to due date
Sweden 30
Norway 30
Denmark 30
Finland 14
Poland 30
Czech Republic 90
United Kingdom 30
United States 45
Latin America 1 39
1 This figure is a weighted average for the various countries of the region where the Group has operations.

94 Notes, including accounting and valuation principles Skanska Review of 2007
Note 06 Continued
Other operating liabilities that consist of financial instruments fall due for payment
according to the table below.
Other operating liabilities 2007 2006
Due within 30 days 97.8 112.6
Due in over 30 days but no more than 1 year 45.6 10.7
Due in more than 1 year 43.0 32.6
186.4 155.9
Market riskThe Group uses various derivative instruments, mainly interest rate swaps and currency
futures, to control and adapt its risk exposure to fluctuations in interest rates and for-
eign exchange rates.
Derivative contracts, including derivatives that are embedded in other not closely
related instruments or in commercial contracts, are continuously recognized at fair
value in the balance sheet. Their change in fair value is recognized in the income state-
ment, except for hedges of net investments outside Sweden and part of the cash flow
hedges of transaction exposure for which hedge accounting is applied.
Interest rate risk
Interest rate risk is the risk that changes in interest rates will affect the Group’s future
earnings and cash flow.
Interest rate risk is defined as the possible negative impact on net financial items in
case of a sudden one percentage point increase in interest rates across all maturities.
The risk may never exceed EUR 10.6 M.
Various forms of derivative contracts, mainly interest rate swaps and currency swaps,
are used in order to adapt the interest rate refixing period and currency.
Interest rate risk (excluding pension liability)
The average interest rate refixing period for all interest-bearing liabilities was 0.5 (0.9)
years. The average interest rate for these amounted to 3.84 (4.00) percent at year-end.
The average interest rate refixing period for all interest-bearing assets was 0.1 (0.2)
years. The average interest rate for these was 4.01 (3.26) percent at year-end.
The objective of Skanska’s financial asset management is to achieve a satisfactory
return, given a relatively low risk level. The average maturity of interest-bearing assets
may not exceed 12 months. The fair value of the Group’s portfolio of derivatives related
to borrowing was EUR 5.8 M (–1.2), of which EUR 0.3 M (0.2), can be related to changes
in market interest rates.
The fair value of interest-bearing financial assets and liabilities, plus derivatives,
would change by about EUR 4.8 M in case of a one percentage point change in market
interest rates across the yield curve, given the same volume and interest rate refixing
period as on December 31, 2007.
Foreign exchange risk
Foreign exchange risk is defined as the risk of negative impact on the Group’s earnings
due to fluctuations in exchange rates. This risk can be divided into transaction exposure,
i.e. net operating and financial (interest/principal payment) flows, and translation expo-
sure related to net investments in subsidiaries outside Sweden.
Transaction exposure
Although the Group has a large international presence, its operations are of a local
nature in terms of foreign exchange risks. Project revenue and costs are mainly denomi-
nated in the same currency, and transaction risks from exchanges between different
currencies are thus very limited.
The objective is that all transaction exposures for each respective business unit shall
be currency hedged. The foreign exchange risk for the Group may amount to a total
of EUR 5.3 M, with risk calculated as the effect on earnings of a five percentage point
shift in exchange rates. As of December 31, 2007, foreign exchange risk accounted for
EUR 4.2 M of transaction exposure.
Expected contracted net flows in currencies that are foreign to the respective Group
company are distributed among currencies and maturities as follows.
The Group’s expected net foreign currency flow 2008 20092010 and
later
USD 12.7
EUR 244.0 30.6 0.2
BRL 44.8
CAD 5.7
JPY 6.9
MTL –4.2
NOK 3.6
PLN –3.9
SKK –3.8
Other currencies –0.2
Total equivalent value 305.5 30.6 0.2
The fair value of outstanding currency derivatives varies with the current exchange rate.
Fair value using the exchange rates prevailing on December 31, 2007 can be seen in the
following table, which shows fair value related to the Group’s currency hedges of trans-
action exposure for which hedge accounting is not applied, and fair value of embedded
derivatives.
Fair value of derivatives related to transaction exposure for which hedge accounting is not applied 2008 2009 Total
EUR 4.6 0.4 5.0
PLN 0.1 0.1
JPY 1 1.1 1.1
Other currencies 0.2 0.2
Recognized gains 5.9 0.4 6.3
EUR –3.2 –0.3 –3.5
JPY 1 –1.1 –1.1
Other currencies –0.3 –0.3
Recognized losses –4.6 –0.3 –4.9
1 Flows in JPY are attributable to a road project in Slovakia.
Skanska applies hedge accounting mainly in its Polish operations for contracted flows
in EUR.
The effects of these hedges are reported above in the “Hedge accounting” section.
Translation exposureNet investments in subsidiaries outside Sweden are generally not hedged. There are
exceptions, however. See the “Hedge accounting” section.
The translation difference in the equity of the Group may be significant for certain
periods of major exchange rate fluctuations. The largest exposures on December 31,
2007 aside from the Parent Company’s functional currency, SEK, were in USD, NOK
and CZK.
An exchange rate shift where the euro falls/rises by 10 percent would have an effect
of EUR ,0.19 bn against other currencies after taking hedges into account.
See also the table under the section “Hedging of net investments outside Sweden”
above as well as Note 34, “Effect of changes in foreign exchange rates.”

Skanska Review of 2007 Notes, including accounting and valuation principles 95
Note 07 Business combinations
Acquisitions of shares CountryOwnership
percentage1Purchase
price Investment
2007
Stamart Martin s.r.o. Slovakia 100 5.5 5.5
Rakennus Vuorenpää Oy (bought from minority shareholder) Finland 100 1.3 1.3
Forserumsten HB (purchase of 50%) Sweden 100 0.6 0.6
Wexio AB Sweden 100 0.5 0.5
Total 8.0 8.0
2006
Maarakennus Lantman Oy
(bought from minority shareholder) Finland 100 0.5 0.5
Jedynka Projekt Poznańskie Przedsiębiorstwo Projektowe S.A (bought from minority shareholder) Poland 95 1.0 1.0
McNicholas Holdings PLC U.K. 100 73.6 72.3
Total 75.1 73.8
1 Refers to both voting power and percentage of share capital unless otherwise stated.
The net assets of the acquired companies on the acquisition date
2007
Carrying amount in
acquired com-panies before
acquisitionFair value
adjustment
Fair value recognized by
Skanska Group
Property, plant and equipment 0.8 1.3 2.1
Intangible assets 0.0 0.6 0.6
Interest-bearing receivables 1.1 1.1
Current-asset properties 0.4 0.4
Non-interest-bearing receivables 8.0 8.0
Interest-bearing liabilities –0.1 –0.1
Non-interest-bearing liabilities including deferred tax liabilities –9.0 –0.5 –9.5
Net identifiable assets and liabilities 1.2 1.4 2.6
Acquired minority interest 0.5
Group goodwill 4.9
Purchase price paid 1 8.0
Less cash and cash equivalents in acquired companies 0.0
Effect on consolidated cash and cash equivalents, investment 8.0
1 Purchase price is stated including EUR 0.1 M in acquisition-related expenses.
2006
Carrying amount in
acquired com-panies before
acquisitionFair value
adjustment
Fair value recognized by
Skanska Group
Property, plant and equipment 6.4 6.4
Intangible assets 12.1 12.1
Interest-bearing receivables 5.1 5.1
Non-interest-bearing receivables 67.4 67.4
Cash and cash equivalents 1.3 1.3
Interest-bearing liabilities –5.1 –5.1
Non-interest-bearing liabilities including deferred tax liabilities –69.1 –3.7 –72.7
Net identifiable assets and liabilities 6.1 8.4 14.5
Acquired minority interest 1.2
Group goodwill 59.4
Purchase price paid 1 75.1
Less cash and cash equivalents in acquired companies 1.3
Effect on consolidated cash and cash equivalents, investment 73.8
1 Purchase price is stated including EUR 2.5 M in acquisition-related expenses.
Business combinations (acquisitions of businesses) are reported in compliance with
IFRS 3, “Business Combinations.” See “Accounting and valuation principles,” Note 1.
Acquisitions of Group companiesDuring the year, four small acquisitions were made. The total investment was
EUR –8.0 M (–73.8).
At the end of 2006, Skanska signed an agreement to acquire the construction compa-
ny Stamart Martin s.r.o. In Slovakia. In organizational terms, Stamart is part of Skanska’s
Czech operations. The company was consolidated as of January 1, 2007. The purchase
price amounted to EUR 5.5 M. EUR 0.5 M was allocated to property, plant and equip-
ment in the form of buildings and land.
Deferred tax on the amount comprises EUR 0.2 M. EUR 4.1 M was allocated to good-
will, which largely refers to access to a growing market, the skills of employees and
synergies.
In the first quarter of 2007, Skanska acquired Wexio AB in Sweden for EUR 0.5 M. The
company holds a patent related to electrical installations and was consolidated from
January 1. The purchase price was allocated in its entirety to the patent, less tax of
EUR 0.1 M.
In the second quarter, Skanska made a 10 percentage point supplementary acquisi-
tion from the minority owner of the Finnish company Rakennus Vuorenpää Oy, which
belongs to the Skanska Group. In connection with the purchase, EUR 0.8 M was allo-
cated to goodwill.
In the third quarter, Skanska acquired the remaining 50 percent of Forserumsten HB,
a company that includes a gravel pit, for EUR 0.6 M. In connection with the purchase,
EUR 0.8 M of the purchase price was allocated to property, plant and equipment and
was for land. Deferred tax on the amount totals EUR 0.2 M. The company was consoli-
dated effective on July 1 and was recognized in the accounts according to the equity
method during January 1–June 30.
No contingent liabilities are included in the year’s acquisitions. All acquisitions are
in the Construction business stream. There are no plans to divest any portion of the
acquired businesses.
The acquired units, including McNicholas, accounted for EUR 283.2 M of Group
revenue and EUR 4.4 M of Group earnings.
McNicholas was acquired on December 31, 2006 and was thus not included in
reported revenue for 2006. If all of the year’s acquired units had been consolidated
from January 1, Group revenue would have increased by EUR 0.5 M and Group earnings
by EUR 0 M.
In 2006, Skanska made three acquisitions. McNicholas Holding PLC in the United
Kingdom, a company specializing in servicing distribution networks for electricity, gas
and water, was consolidated effective on December 31, 2006. Skanska also made two
small acquisitions from minority shareholders.

96 Notes, including accounting and valuation principles Skanska Review of 2007
Note 08 Revenue
Revenue by category
2007 2006
Construction contracts 13,049.1 12,063.2
Services 2 854.3 534.1
Sales of goods 91.8 81.6
Rental income 48.4 51.2
Divestments of properties 958.2 844.2
Total 15,001.7 13,574.3
1 For allocation of eliminations, see Note 4, “Segment reporting,” Point C.2 EUR 260.6 M of the increase is explained by the acquisition of McNicholas in the United
Kingdom, which occurred on December 31, 2006 and was thus not included in reported revenue during the comparative year. As for other types of revenue, dividends and interest income are recognized in financial items. See Note 14, “Net financial items.”
Other mattersInvoicing to associated companies and joint ventures amounted to EUR 760.0 M (631.5).
For other related party transactions, see Note 39, “Related party transactions.”
Note 09 Construction contracts
Information from the balance sheet
Gross amount due from customers for contract work 2007 2006
Accrued revenue 8,966,8 9,014.7
Invoiced revenue –8,368.2 –8,437.2
Total, asset 598.6 577.5
Gross amount due to customers for contract work 2007 2006
Invoiced revenue 17,794.4 17,149.4
Accrued revenue –16,127.7 –15,893.4
Total, liability 1,666.6 1,256.0
Construction contracts are recognized as revenue at the pace of project completion. See
“Accounting and valuation principles,” Note 1.
Information from the income statementRevenue recognized during the year amounted to EUR 13,049.1 M (12,063.2).
Recognized revenue in ongoing projects including recognized gains minus recognized
loss provisions amounted to EUR 25,094.5 M (24,908.1).
Advance payments received totaled EUR 46.5 M (92.0).
Amounts retained by customers, which have been partly invoiced according to an
established plan and which the customer is retaining in accordance with contractual
terms until all the conditions specified in the contract are met, amounted to
EUR 302.8 M (280.9).
Projects in Skanska’s contracting operations are reported in compliance with IAS 11, “Construction Contracts.” See Note 9.
Revenue other than project revenue is recognized in compliance with IAS 18, “Revenue.” See “Accounting and valuation principles,” Note 1.
“Other markets” refers to Latin America and those markets where the Infrastructure Development business stream operates.
Revenue by primary and secondary segmentSecondary segment – Geographic markets
Primary segment – Business streams SwedenOther Nordic
countriesOther
EuropeUnitedStates
Othermarkets
Central andeliminations
Totalrevenue
2007
Construction 2,960.7 2,782.7 3,999.4 4,109.3 470.2 14,322.2
Residential Development 370.9 388.4 70.8 830.1
Commercial Development 254.8 51.8 31.8 338.3
Infrastructure Development 12.5 12.5
Other
Central 52.1 52.1
Eliminations 1 –323.9 –201.1 –15.8 –0.1 –12.8 –553.6
Total 3,262.5 3,021.8 4,086.2 4,109.3 482.7 39.3 15,001.7
2006
Construction 2,607.0 2,469.0 3,287.6 4,059.7 406.0 12,829.4
Residential Development 283.2 397.9 52.5 733.6
Commercial Development 245.8 46.4 78.0 370.2
Infrastructure Development 16.3 16.3
Other
Central 122.9 122.9
Eliminations 1 –260.8 –213.9 –10.6 –12.8 –498.0
Total 2,875.2 2,699.4 3,407.5 4,059.7 422.3 110.1 13,574.3

Skanska Review of 2007 Notes, including accounting and valuation principles 97
Note 10 Operating income
Operating income by business stream Operating income
2007 2006
Construction 480.5 360.5
Residential Development 78.3 92.1
Commercial Development 98.4 130.8
Infrastructure Development –11.6 –0.9
Central –60.5 –55.5
Eliminations –0.6 –12.3
Total 584.4 514.6
The Parent Company and other corporate units are reported as “Central.” Competition
infringement fines of EUR 19.8 M in Sweden and Finland are included. Also included is
EUR 12.3 M (–19.8) for the International unit, which has a number of operations that
are being shut down or phased out.
Eliminations of profits from intra-Group sales and transfers of these are reported as
“Eliminations.” The amounts are explained in the following table:
.
2007 2006
Intra-Group profits carried as investments in joint ventures related to contracting work for Infrastructure Development
Provision for the year –1.3 –13.3
Transfers for the year over service life 1.9 1.7
Transfers for the year through divestments 0.3 0.8
Intra-Group profits carried as current-asset properties
Provision for the year related to contracting work –9.3 –3.7
Provision for the year related to intra-Group divestments –2.2 –2.6
Transfers for the year through divestments 4.0 4.3
Other 5.8 0.4
Total –0.6 –12.3
2007 2006
Revenue 15,001.7 13,574.3
Personnel expenses 1 –2,761.2 –2,452.3
Depreciation/amortization –139.1 –124.0
Impairment losses –6.6 –10.8
Other operating expenses 2 –11,510.4 –10,472.6
Operating income 584.4 514.6
1 Recognized as personnel costs are wages, salaries and other remuneration plus social insurance contributions, recognized according to Note 36, “Personnel,” and non-monetary remuneration such as free healthcare and car benefits.
2 Other operating expenses are allocated according to the following table.
2007 2006
Carrying amount of current-asset properties divested –698.0 –580.9
Income from joint ventures and associated companies 43.5 39.3
Other –10,855.9 –9,931.0
Total other operating expenses –11,510.4 –10,472.6
Analysis of operating income
2007 2006
Impairment losses
Goodwill impairment losses –0.9
Impairment losses on other intangible assets –1.6
Impairment losses/reversals of impairment losses on property, plant and equipment 0.3 –2.5
Impairment losses/reversals of impairment losses on current-asset properties –4.4 –8.3
–6.6 –10.8
Gains from divestments of current-asset properties
Commercial Development 116.7 140.5
Other commercial properties 23.5 10.7
Residential Development 120.0 112.1
260.2 263.3
Income from joint ventures and associated companies 43.5 39.3
Income/loss in Denmark 0.2 –34.4
Other operating income 287.1 257.2
Total according to the income statement 584.4 514.6
Using the exchange rates prevailing in 2006, operating income would have been
EUR 6.2 M higher in 2007. See also Note 34, “Effect of changes in foreign exchange
rates.”
Disclosures on revenue and expenses from financial instruments are provided in
Note 6, “Financial instruments.”
.
Operating expenses by category of expenses During 2007, revenue increased by EUR 1,427.4 M to EUR 15,001.7 M (13,574.3). Oper-
ating income increased by EUR 69.7 M to EUR 584.4 M (514.6). Personnel expenses for
the year amounted to EUR –2,761.2 M (–2,452.3).
Other operating expenses adjusted for current-asset properties divested, income in
joint ventures and associated companies and gain on divestments of Group companies
amounted to EUR –10,855.9 M (–9,931.0).

98 Notes, including accounting and valuation principles Skanska Review of 2007
Note 11 Selling and administrative expenses
Selling and administrative expenses are recognized as one item. See “Accounting and valuation principles,” Note 1.
Distribution of selling and administrative expenses by primary and secondary segment
Secondary segment − Geographic markets
Primary segment − Business streams SwedenOther Nordic
countriesOther
EuropeUnitedStates
Othermarkets
Central andeliminations Total
2007
Construction –175.0 –141.4 –220.9 –106.3 –29.7 –673.3
Residential Development –22.9 –29.8 –6.6 –59.3
Commercial Development –16.8 –2.4 –8.5 –27.7
Infrastructure Development –20.3 –20.3
Central and eliminations –80.9 –80.9
Total –214.7 –173.6 –236.1 –106.3 –50.0 –80.9 –861.5
2006
Construction –150.9 –130.4 –214.2 –99.4 –23.5 –618.4
Residential Development –18.5 –22.8 –5.4 –46.7
Commercial Development –15.5 –1.9 –8.0 –25.4
Infrastructure Development –20.1 –20.1
Central and eliminations –44.3 –44.3
Total –184.8 –155.2 –227.6 –99.4 –43.6 –44.3 –754.9
Note 12 Depreciation/amortization
Depreciation and amortization are carried out in compliance with IAS 16, “Property, Plant and Equipment,” and IAS 38, “Intangible Assets.” See Note 1,
“Accounting and valuation principles.”
Depreciation and amortization are presented below by business stream.
For further information on depreciation and amortization, see Note 17, “Property, plant and equipment,” and Note 19, “Intangible assets.”
Depreciation/amortization by asset class and business stream
ConstructionResidential
DevelopmentCommercial
DevelopmentInfrastructureDevelopment
Central andeliminations Total
2007
Intangible assets –9.2 –0.1 –2.1 –0.2 –11.6
Property, plant and equipment
Property –5.6 –5.6
Plant and equipment –120.3 –0.1 –0.3 –0.4 –0.8 –121.9
Total –135.1 –0.2 –0.3 –2.5 –1.0 –139.1
2006
Intangible assets –5.4 –0.4 –1.9 –0.3 –8.1
Property, plant and equipment
Property –7.6 –7.6
Plant and equipment –105.1 –0.1 –0.1 –0.3 –2.7 –108.3
Total –118.1 –0.5 –0.1 –2.3 –3.0 –124.0

Skanska Review of 2007 Notes, including accounting and valuation principles 99
Note 13 Impairment losses/Reversals of impairment losses
Impairment losses are recognized in compliance with IAS 36, “Impairment of Assets.” See Accounting and valuation principles,” Note 1.
Impairment losses on current-asset properties are recognized in compliance with IAS 2, “Inventories,” and are presented in Note 22.
Impairment losses/reversals of impairment losses are presented below by business stream.
For further information on impairment losses/reversals of impairment losses, see Note 19, “Intangible assets, Note 17,
“Property, plant and equipment” and Note 22, “Current-asset properties/Project development.”
Impairment losses/reversals of impairment losses by asset class and business stream
ConstructionResidential
DevelopmentCommercial
DevelopmentInfrastructureDevelopment
Central andeliminations Total
2007
Recognized in operating income
Goodwill –0.9 –0.9
Other intangible assets –1.6 –1.6
Property, plant and equipment
Property –0.6 –0.6
Plant and equipment 1 1.5 –0.5 1.0
Current-asset properties
Commercial Development –3.8 –3.8
Residential Development –0.6 –0.6
–1.6 –1.2 –3.8 0.0 0.0 –6.6
Recognized in financial items
Financial assets –0.4 –0.8 –1.2
Total –2.1 –1.9 –3.8 0.0 0.0 –7.8
2006
Recognized in operating income
Property, plant and equipment
Property 0.1 0.1
Plant and equipment –2.6 –2.6
Current-asset properties
Other commercial properties –7.8 –7.8
Residential Development –0.5 –0.5
–10.3 –0.5 0.0 0.0 0.0 –10.8
Recognized in financial items
Financial assets 0.0
Total –10.3 –0.5 0.0 0.0 0.0 –10.8
1 The amount includes EUR 2.2 M in reversals of impairment losses on plant and equipment in Czech operations divested during the year.

100 Notes, including accounting and valuation principles Skanska Review of 2007
Note 15 Borrowing costs
Interest capitalized
during the year
Total accumulated capitalized interest
included in cost
2007 2006 2007 2006
Intangible assets 0.2 9.9 10.4
Current-asset properties 6.6 3.5 20.4 18.9
Total 6.6 3.7 30.4 29.3
Borrowing costs related to investments that require a substantial period for completion
are capitalized. See “Accounting and valuation principles,” Note 1.
During 2007, borrowing costs were capitalized at an interest rate of about 4 percent.
Note 16 Income taxes
Income taxes are reported in compliance with IAS 12, “Income Taxes.” See “Accounting
and valuation principles,” Note 1.
Tax expenses
2007 2006
Current taxes –147.3 –129.3
Deferred tax expenses/benefits from change in tempo-rary differences –15.2 5.7
Deferred tax benefits/expenses from change in loss
carry-forwards 1.0 –20.4
Taxes in joint ventures –5.3 0.3
Taxes in associated companies –0.2 –0.1
Total –167.1 –143.7
Tax items recognized directly in equity2007 2006
Deferred taxes attributable to cash flow hedging 1.5 0.4
Deferred taxes attributable to pensions –4.1 –23.5
Total –2.6 –23.0
There was no deferred tax attributable to financial assets classified as held for sale.
Income taxes paid in 2007 amounted to EUR –129.4 M (–115.3).
Relation between taxes calculated at weighted average tax rate and taxes recognizedThe Group’s weighted average tax rate was estimated at 29 (30) percent.
The average nominal tax rate in Skanska’s home markets in Europe amounted to
about 26 (26) percent and in the United States about 40 (40) percent.
The relation between taxes calculated according to an aggregation of nominal tax
rates and recognized taxes of 27 (27) percent is explained in the table below.
2007 2006
Income after financial items 612.6 538.7
Taxes according to aggregation of nominal tax rates, 29 (30) percent –177.6 –161.6
Tax effect of:
Property/company divestments/disposal of businesses 13.1 24.4
Losses not offset by deferred tax assets –1.1 –11.8
Other items –1.5 5.2
Recognized tax expenses –167.1 –143.7
The discontinuation of Construction operations in Denmark did not result in any
tax expense.
Note 14 Net financial items
2007 2006
Financial income
Interest income 67.8 43.9
Gain on divestments of shares 0.1
Change in fair value 0.4 0.2
Net exchange rate differences 4.0
Net other financial items 1.5 2.3
69.8 50.4
Financial expenses
Interest expenses –17.8 –11.6
Change in fair value –11.7 –13.0
Net exchange rate differences –4.6
Impairment losses –1.2
Net other financial items –6.3 –1.8
–41.6 –26.4
Income from associated companies 0.1
Total 28.2 24.1
Disclosures on how large a portion of income and expenses in net financial items comes
from financial instruments are presented in Note 6, “Financial instruments.”
Net interest itemsIn 2007, net interest items amounted to EUR 49.9 M (32.3). Interest income improved by
EUR 23.9 M to EUR 67.8 M (43.9), as a consequence of higher average interest rates dur-
ing 2007 as well as higher net financial items related to defined-benefit pension plans.
Interest expenses meanwhile increased by EUR –6.3 M to EUR –17.8 M (–11.6). One rea-
son for this was higher average interest rates on borrowing.
Interest income was received at an average interest rate of 3.63 (2.81) percent. Inter-
est expenses, excluding interest on pension liability, were paid at an average interest rate
of 3.73 (3.74) percent. During 2007, consolidated interest expenses of EUR –6.6 M (–3.7)
were capitalized.
Change in fair valueDerivatives as well as certain other assets and liabilities have been carried at fair value
in compliance with IAS 39, “Financial Instruments: Recognition and Measurement.”
The item consists mainly of negative interest rate differences on hedging of Infrastruc-
ture Development investments in Latin America as well as on currency hedging of
equity in U.S. dollars.
Net other financial itemsIn 2007 these items included various financial fees, mainly related to Skanska
Latin America. In 2006 the item consisted of financial fees in Skanska Latin America
and a loan redemption discount.

Skanska Review of 2007 Notes, including accounting and valuation principles 101
Tax assets and tax liabilities
2007 2006
Tax assets 43.5 36.5
Tax liabilities 94.3 80.5
Net liability 50.8 44.0
Tax assets and tax liabilities refer to the difference between estimated income tax
for the year and preliminary tax paid as well as income taxes for prior years that have
not yet been settled.
Deferred tax assets and deferred tax liabilities
2007 2006
Assets: Deferred tax liabilities/deferred tax assets according to the balance sheet 101.2 218.5
Liabilities: Deferred tax liabilities/deferred tax assets according to the balance sheet 219.0 319.8
Net deferred taxes 117.8 101.3
2007 2006
Deferred tax assets for loss carry-forwards 7.7 7.1
Deferred tax assets for shares and participations 0.0 4.8
Deferred tax assets for other assets 35.2 28.2
Deferred tax assets for provisions for pensions 46.7 64.0
Deferred tax assets for ongoing projects 20.8 25.5
Other deferred tax assets 110.1 88.9
Total 220.6 218.5
2007 2006
Deferred tax liabilities for shares and participations 32.7 34.2
Deferred tax liabilities for other non-current assets 41.2 39.2
Deferred tax liabilities for other current assets 35.2 38.7
Deferred tax liabilities for ongoing projects 133.9 113.9
Other deferred tax liabilities 95.4 93.9
Total 338.3 319.8
Net deferred tax liabilities 117.8 101.3
Change in deferred taxes
2007 2006
Net deferred tax liabilities, January 1 101.3 58.5
Recognized in equity 2.6 23.0
Deferred tax expenses 14.3 14.7
Deferred taxes, acquisitions of companies 1.4 –0.4
Deferred taxes, divestments of companies 2.1 –0.3
Exchange rate differences –3.8 5.9
Net deferred tax liabilities, December 31 117.8 101.3
Deferred tax assets for loss carry-forwards are expected to be mainly utilized to offset
deferred tax liabilities.
Deferred tax assets other than for loss carry-forwards refer to temporary differences
between carrying amounts for tax purposes and carrying amounts recognized in the
balance sheet. These differences arise, among other things, when the Group’s valuation
principles diverge from those applied locally by a subsidiary. These deferred tax assets
are mostly realized within five years.
Temporary differences and loss carry-forwards that are not recognized as deferred tax assets
2007 2006
Loss carry-forwards that expire within one year 8.3
Loss carry-forwards that expire in more than one year but within three years 19.9 38.0
Loss carry-forwards that expire in more than three years 214.2 195.8
Total 234.1 242.1
The loss carry-forwards are found in a number of different countries. These loss carry-
forwards are not recognized as deferred tax assets because the right to offset them
against other income is limited or current earnings generation in some of these coun-
tries makes it impossible to assess the likelihood that a loss carry-forward can be utilized.
Deferred tax assets arise, for example, when a recognized depreciation/amortization/
impairment loss on assets becomes deductible for tax purposes only in a later period,
when eliminating intra-Group profits, when the provisions for defined-benefit pen-
sions differ between local rules and IAS 19, when the required provisions become tax-
deductible in a later period and when advance payments to ongoing projects are taxed
according to the cash principle.
Deferred tax liabilities on other assets and other deferred tax liabilities refer to tem-
porary differences between carrying amounts for tax purposes and carrying amounts in
the balance sheet. These differences arise, among other things, when the Group’s valu-
ation principles diverge from those applied locally by a subsidiary. These deferred tax
liabilities are mostly realized within five years.
For example, deferred tax liabilities arise when depreciation/amortization for tax
purposes in the current period is larger than the required economic depreciation/amor-
tization and when accrued profits in ongoing projects are taxed only when the project
is completed.
Temporary differences attributable to investments in subsidiaries, branches, associ-
ated companies and joint ventures for which deferred tax liabilities were not recognized
totaled EUR 0 M (0). In Sweden and a number of other countries, divestments of hold-
ings in limited companies are tax-exempt under certain circumstances. Temporary dif-
ferences thus do not normally exist for shareholdings by the Group’s companies in these
countries.
Note 16 Continued

102 Notes, including accounting and valuation principles Skanska Review of 2007
Note 17 Property, plant and equipment
Property, plant and equipment by asset class
2007 2006
Property 198.2 186.9
Plant and equipment 419.6 398.4
Property, plant and equipment under construction 14.3 18.2
Total 632.1 603.5
Impairment losses/reversals of impairment losses on property. plant and equipment
During 2007. net reversals of impairment losses in the amount of EUR +0.3 M were
recognized. In 2006. net impairment losses of EUR –2.5 M were recognized.
Property
Plant andequipment
Impairment losses/reversals of impairment losses by function 2007 2006 2007 2006
Cost of sales
Impairment losses –1.8 –1.1 –2.3 –2.4
Reversals of impairment losses1 1.2 1.8 3.2 0.3
Selling and administration
Impairment losses –0.6 –0.5
Total –0.6 1.0 1.0 –2.6
Property Plant andequipment
Amount of impairment losses/reversals is based on 2007 2006 2007 2006
Net realizable value1 0.4 2.2 –1.4
Value in use –0.6 –0.3 –1.2 –1.2
Total –0.6 0.1 1.0 –2.6
1 The amount includes EUR 2.2 M in reversals of impairment losses on plant and equipment in Czech operations divested during the year.
Depreciation of property, plant and equipment by asset class and function
Cost of sales
Selling andadministration Total
2007 2006 2007 2006 2007 2006
Property –4.8 –5.7 –1.0 –1.8 –5.7 –7.6
Plant and equipment –103.7 –93.1 –18.2 –15.2 –121.8 –108.3
Total –108.4 –98.8 –19.1 –17.1 –127.6 –115.9
Property, plant and equipment are reported in compliance with IAS 16, “Property, Plant
and Equipment”, see Note 1, “Accounting and valuation principles.”
Office buildings and other buildings used in the Group’s business are recognized as
property, plant and equipment. Machinery and equipment are recognized as a single
item (“Plant and equipment”).

Skanska Review of 2007 Notes, including accounting and valuation principles 103
Information about cost. accumulated depreciation. accumulated revaluations and accumulated impairment losses
Property
Plant and equipmentProperty. plant and equipment
under construction
2007 2006 2007 2006 2007 2006
Accumulated cost
January 1 316.0 297.1 1,336.2 1,281.1 18.2 10.9
Transferred from assets classified as held for sale 0.1 5.1 0.2
Investments 24.8 21.0 173.4 155.5 7.2 12.4
Acquisitions of companies 1.8 5.8 0.2 0.5
Divestments of companies –0.6 –9.8 –5.2
Divestments –25.1 –16.2 –45.8 –87.0 –5.1
Reclassifications 12.0 3.5 40.3 –5.9 –11.5 –0.9
Exchange rate differences for the year 0.1 5.4 –39.0 –7.9 0.3 0.7
329.6 316.0 1,455.5 1,336.2 14.3 18.2
Accumulated depreciation
January 1 –94.1 –90.5 –935.0 –904.0
Transferred from assets classified as held for sale –0.6
Divestments of companies 0.3 3.1 1.2
Divestments and disposals 4.1 2.4 29.9 67.4
Reclassifications –0.3 2.3 –35.1 8.0
Depreciation for the year –5.7 –7.7 –121.8 –108.2
Exchange rate differences for the year 0.8 –0.9 25.1 1.2
–95.2 –94.1 –1,033.8 –935.0
Accumulated impairment losses
January 1 –34.9 –34.7 –2.9 –1.6
Transferred from assets classified as held for sale –1.2
Divestments 1.1 0.2 1.2
Reclassifications 0.1 1.2
Impairments losses/ reversals of impairment losses for the year –0.6 0.1 1.0 –2.6
Exchange rate differences for the year –1.7 –0.6 –0.2 0.1
–36.1 –34.9 –2.1 –2.9
Carrying amount, December 31 198.2 186.9 419.6 398.4 14.3 18.2
Carrying amount, January 1 186.9 171.8 398.4 375.5 18.2 10.9
Other mattersInformation about capitalized interest is presented in Note 15. “Borrowing costs.”
For information about finance leases. see Note 40. “Leases.”
Skanska has obligations to acquire property. plant and equipment in the amount of EUR 0 M (3.8).
Skanska did not receive any compensation from third parties for property. plant and equipment that was damaged or lost. either in 2007 or 2006.
Note 17 Continued

104 Notes, including accounting and valuation principles Skanska Review of 2007
Note 18 Goodwill
Goodwill value by business unit
2007 2006Change during
the year
of which exchange rate
differences
of which acquisition
of companies 1
of which divestment
activities
Construction
Norway 110.9 108.3 2.6 3.5 –0.9
Finland 42.0 41.0 1.0 0.8
Poland 2.1 2.0 0.1 0.1
Czech Republic 50.6 44.9 5.7 1.6 4.1
United Kingdom 198.6 217.5 –18.9 –18.9
USA Building 27.6 30.9 –3.2 –3.2
USA Civil 2.4 2.8 –0.3 –0.3
Residential Development
Nordic countries 50.8 49.2 1.6 1.6
Total 485.1 496.6 –11.4 –15.7 4.9 –0.9
of which acquisition goodwill in Group financial statements
2007 2006
Construction
Norway 109.3 106.0
Finland 16.5 16.5
Czech Republic 41.8 40.4
United Kingdom 138.7 152.0
Residential Development
Nordic countries 49.7 48.2
Total 356.1 363.0
1 See Note 7, “Business combinations.”
Norway FinlandCzech
Republic United
Kingdom
ResidentialDevelopment
Nordic
Carrying amount, 100 100 100 100 100 100
Recoverable amount in relation to carrying amount 955 1,369 533 661 545
Interest rate, percent 8.9 9.2 10.3 9.1 6.8
Recoverable amount in case of increase in interest rate
+ 1 percentage point 836 1,204 477 572 413
+ 5 percentage point 557 812 337 362 153
Goodwill is recognized in compliance with IFRS 3, “Business Combinations.”
See Note 1, “Accounting and valuation principles.” For key judgments, see Note 2.
Goodwill according to the balance sheet amounted to EUR 485.1 M (496.6) and
was mainly attributable to acquisitions during 2000, when Skanska acquired goodwill
through acquisitions of businesses in Norway, the U.K. and the Czech Republic. During
2007, goodwill increased by EUR 4.9 M (59.1) through acquisitions of two small units in
Slovakia and Finland. See Note 7, “Business combinations.”
The goodwill acquisition in 2006 was due to the acquisition of McNicholas in the U.K.
Other changes can be seen in the table below.
In Construction and Residential Development, the goodwill recoverable amount is
based exclusively on value in use. Goodwill value together with other non-current asset
values are tested annually.
Expected cash flows are based on forecasts for each submarket in the countries
where the Group has operations. For Construction, these forecasts include such vari-
ables as demand, cost of input goods, labor costs and the competitive situation. Resi-
dential Development establishes forecasts for the various segments of its operations.
Important variables taken into account include demographic and interest rate trends.
The forecasts are based on previous experience, Skanska’s own judgments and exter-
nal sources of information. The forecast period encompasses three years. The growth
rate that is used to extrapolate cash flow forecasts beyond the period covered by the
three-year forecasts is the normal growth rate for the industry in each respective
country. Normally, two percent has been used.
Each unit uses a unique discount factor based on weighted average cost of capital
(WACC). Parameters that affect the WACC are: interest rates for borrowing, market risks
and the ratio between borrowed funds and equity.
For Construction units, a WACC is stated on the basis of capital employed consist-
ing 100 percent of equity. In Residential Development, the WACC is based on capital
employed consisting of 50 percent equity and 50 percent borrowed funds. The WACC
interest rate is stated before taxes.
The following table shows how the recoverable amount relates to the carrying amount
for the respective business units for Skanska’s largest goodwill items, which are tested
at the Group level. The carrying amount is expressed as 100. The tests are based on the
three-year business plan that was established during the autumn of 2007.

Skanska Review of 2007 Notes, including accounting and valuation principles 105
Note 19 Intangible assets
Note 18 Continued
Information about cost and accumulated impairment losses Goodwill
2007 2006
Accumulated cost
January 1 511.6 458.5
Acquisitions of companies 4.9 59.4
Divestments of companies –3.6
Exchange rate differences for the year –16.5 –2.7
499.9 511.6
Accumulated impairment losses
January 1 –15.0 –16.2
Impairment losses for the year –0.9
Exchange rate differences for the year 1.1 1.1
–14.8 –15.0
Carrying amount, December 31 485.1 496.6
Carrying amount, January 1 496.6 442.3
Intangible assets and useful life applied
2007 2006Useful life
applied
Expressway concession 45.9 49.9 26 years
Other intangible assets, externally acquired 23.7 32.0 3–50 years
Total 69.6 81.8
of which amortization of internally
generated assets
Amortization by function 2007 2006 2007 2006
Cost of sales –5.1 –3.7 –1.3
Selling and administration –6.5 –4.4
Total –11.6 –8.1 0.0 –1.3
Impairment loss/reversals of impairment losses on other intangible assetsDuring 2007, impairment losses/reversals of impairment losses on other intangible
assets were recognized in the amount of EUR –1.6 M (0). The impairment losses were
attributable to the Construction business stream and were based on the value in
use of the assets.
Information about cost. accumulated amortization and accumulated impairment losses
Expresswayconcession
Other intangibleassets.
externally acquired
Intangible assets
internally generated 1
2007 2006 2007 2006 2007 2006
Accumulated cost
January 1 53.1 58.8 61.7 25.1 7.1 6.8
Acquisitions of companies 0.6 12.1
Other investments 0.2 4.0 4.0
Divestments –0.2 –0.2
Reclassifications 0.1 21.9
Exchange rate differences for the year –2.2 –6.0 –2.8 –1.2 –0.3 0.3
50.9 53.1 63.4 61.7 6.8 7.1
Accumulated amortization
January 1 –3.2 –1.3 –29.5 –15.1 –7.1 –5.5
Reclassifications 0.1 –10.4
Amortization for the year –1.9 –1.9 –9.5 –4.9 –1.3
Exchange rate differences for the year 0.2 –0.1 1.2 0.8 0.3 –0.2
–5.0 –3.2 –37.9 –29.5 –6.8 –7.1
Accumulated impairment losses
January 1 –0.2 –0.2
Impairment losses for the year –1.6
Exchange rate differences for the year 0.0 0.0
0 0 –1.8 –0.2 0 0
Carrying amount, December 31 45.9 49.9 23.7 32.0 0.0 0.0
Carrying amount, January 1 49.9 57.5 32.0 9.8 0.0 1.3
1 Internally generated intangible assets consisted of computer software.
Other mattersInformation about capitalized interest is presented in Note 15. “Borrowing costs.”
Direct research and development expenses amounted to EUR 8.1 M (7.8).
Goodwill impairment losses During 2007, the Group recognized goodwill impairment losses of EUR –0.9 M (–0).
The year’s goodwill impairment losses were related to impairment losses in a small
unit in Norway and were based on a calculation of value in use. The impairment loss was
recognized as selling and administrative expenses in the income statement.
Intangible assets are recognized in compliance with IAS 38,
“Intangible Assets.” See “Accounting and valuation principles,” Note 1.
The Group has no remaining carrying amount for intangible assets that were internally
generated. The expressway concession in Santiago, Chile has been in full operation since
2006 and will be amortized over the concession period.
“Other tangible assets, externally acquired” includes EUR 0.6 M for a patent acquired
in 2007. See Note 7, “Business combinations.” It also includes acquired service contracts
in the United Kingdom, extraction rights for gravel pits and rock quarries in Sweden and
utilization rights for computer software. Extraction rights for rock quarries and gravel
pits are amortized as material is extracted. Computer software is amortized in 3–5 years.
The acquired service contracts are being amortized over a period of 3–6 years and the
patent acquired in 2007 is being amortized over 10 years.
Amortization of other intangible assets by functionAll intangible assets were amortized, because they have a limited useful life.

106 Notes, including accounting and valuation principles Skanska Review of 2007
Note 20 Investments in joint ventures and associated companies
2007 2006
Share of income in joint ventures according to the equity method 1 28.2 22.2
Share of income in associated companies according to the equity method 1 0.9 1.9
Divestments of joint ventures 12.1 12.8
Transfers of intra-Group profits in Infrastructure Development during useful life 1.9 1.7
Transfers of intra-Group profits in Infrastructure Development through divestments 0.3 0.8
Total 43.5 39.3
1) When calculating the income of joint ventures and associated companies according to the equity method. the Group’s share of taxes is recognized on the ”Taxation” line in the income statement. The Group’s share of taxes in joint ventures amounted to EUR –5.3 M (0.3) and its share of taxes in associated companies amounted to EUR –0.2 M (–0.1). See also Note 16. ”Income taxes.”
Carrying amount according to the balance sheet and the change that occurred during 2007 can be seen in the following table.
Joint venturesAssociatedcompanies Total
January 1 205.2 4.3 209.5
Investments 7.5 7.5
Divestments –13.1 –13.1
Reclassifications 0.3 –1.5 –1.2
Exchange rate differences
for the year –0.6 0.0 –0.6
The year's provision for intra-Group profit on contracting work –1.3 –1.3
Exchange rate differences for the
year, derivatives –0.3 –0.3
The year's change in share of income in associated companies and joint ventures after subtracting dividends received 4.6 0.8 5.4
Carrying amount, December 31 202.2 3.6 205.8
Investments in joint ventures and associated companies are reported according to the
equity method of accounting. Income from joint ventures and associated companies is
reported on a separate line in operating income. This income consists of the Group’s share
of the income in joint venture and associated companies after financial items, adjusted for
any impairment losses in goodwill on consolidated and intra-Group profits.
Income from joint ventures and associated companies is presented in the following table.
Joint venturesJoint ventures are reported in compliance with IAS 31. “Interests in Joint Ventures.”
See “Accounting and valuation principles.” Note 1.
The Group has holdings in joint ventures with a carrying amount of EUR 202.2 M
(205.2).
Infrastructure Development included a carrying amount in joint ventures totaling
EUR 214.8 M (220.1). The value of these companies in the consolidated accounts was
reduced by intra-Group profits of EUR –43.2 M (–43.7). which arose due to contracting
work for these joint ventures. among other things.
Income from joint ventures
Share of income in joint ventures is reported in the income statement. because these
holdings are an element of Skanska’s business.
Share of income in joint ventures according to the equity method comes mainly from
Infrastructure Development operations.
Infrastructure Development
Infrastructure Development specializes in identifying. developing and investing in
privately financed infrastructure projects. such as roads. hospitals and power generating
plants. The business stream focuses on creating new project opportunities in the markets
where the Group has operations.
Income from holdings in joint ventures in Infrastructure Development improved
during 2007. This was entirely due to increased contribution to earnings from roads.
Skanska’s largest project. and at present its only market risk project − the Autopista
Central toll expressway in Chile − continued to show a very favorable trend of traffic
volume and revenue as well as lower expenses. Revenue increased by a total of 37 percent
compared to 2006.
During the fourth quarter Skanska sold its holding in Maputo Port Mozambique.
The gain on the divestment amounted to EUR 8.2 M in the consolidated financial
statements during December. Skanska also signed a contract to sell its holding in
Ponte de Pedra. The transaction was conditional upon approval by the appropriate pub-
lic agencies, which was received during the first quarter of 2008, when the transaction
was also recognized in the financial statements.

Skanska Review of 2007 Notes, including accounting and valuation principles 107
Note 20 Continued
Specification of major holdings of shares and participations in joint ventures
Consolidated carrying amount 1
Company Operations CountryPercentage of share capital
Percentage of voting power Currency 2007 2006
Joint ventures in Infrastructure Development
Autopista Central S.A. 1 Highway Chile 48 48 CLP 67.3 70.2
Breitener Energetica S/A Power plant Brazil 35 35 BRL 19.2 19.4
Bristol PFI Development Ltd Education U.K. 50 50 GBP 0.0 0.0
Bristol PFI (Holdings) Ltd Education U.K. 61 46 GBP 0.0 0.0
Bristol PFI Ltd Education U.K. 61 46 GBP 4.9 6.6
Capital Hospitals (Holdings) Ltd Healthcare U.K. 38 38 GBP 8.5 10.2
Central Nottinghamshire Hospital (Holdings) Ltd Healthcare U.K. 50 50 GBP 0.0 0.1
Derby Healthcare Holdings Ltd Healthcare U.K. 25 50 GBP 3.4 -2.0
Gdansk Transport Company S.A Highway Poland 30 30 PLN 4.1 1.8
Investors in Community (Bexley Schools) Ltd Education U.K. 50 50 GBP 1.9 3.5
Midlothian Schools Holdings Ltd Education U.K. 50 50 GBP 3.5 0.2
Orkdalsvegen AS Highway Norway 50 50 NOK 1.3 1.2
Ponte de Pedra Energetica S/A Power plant Brazil 50 50 BRL 41.8 38.7
The Coventry and Rugby Hospital Comp. Ltd Healthcare U.K. 25 50 GBP 6.7 14.0
The Walsall Hospital Company Plc Hospital U.K. 50 50 GBP 0.0
Tieyhtiö Nelostie Oy Highway Finland 50 41 EUR 4.1 4.2
Tieyhtiö Ykköstie Oy Highway Finland 41 41 EUR 5.1 2.9
171.7 171.1
Sold in 2007
LLC Nordvod Wastewater Russia 14 14 EUR 2.9
Portus Indico S.A. Port Mozambique 24 24 EUR 2.4
5.3
Other joint ventures 30.6 28.8
Total 202.2 205.2
1 There is also an investment in a concession fee. Its carrying amount was EUR 45.9 M (49.9). See Note 19. “Intangible assets.”
Information on the Group’s share of the income statements and balance sheets of joint ventures reported according to the equity method
The amounts include Infrastructure
Development operations totaling
Income statement 2007 2006 2007 2006
Revenue 423.5 472.0 330.3 388.8
Operating expenses –362.8 –431.6 –289.8 –364.3
Operating income 60.8 40.3 40.5 24.5
Financial items –32.5 –18.2 –29.7 –15.3
Income after financial items 28.2 22.2 10.8 9.2
Taxes –5.3 0.3 –0.4 3.1
Profit for the year 22.9 22.5 10.4 12.3
Balance sheet
Non-current assets 1,383.3 1,187.2 1,364.8 1,168.7
Current assets 798.3 945.5 704.1 846.4
Total assets 2,181.6 2,132.7 2,068.9 2,015.0
Equity attributable to equity holders 1 245.1 247.1 214.5 218.5
Minority 0.6 1.8
Non-current liabilities 1,744.1 1,697.6 1 673.7 1,639.7
Current liabilities 191.8 186.2 180.7 156.8
Total equity and liabilities 2,181.6 2,132.7 2,068.9 2,015.0
1 Equity exceeded the carrying amount of shares in joint ventures by consolidated intra-Group profits on contracting work for Infrastructure Development, which was not charged to income in these operations and was thus not reported in the table.
Reconciliation with shares in joint ventures 2007 2006
Skanska’s portion of equity in joint ventures,
adjusted for surplus value and goodwill 245,1 247,1
– Intra-Group profit in consolidated financial statements –43,2 –43,7
+ losses in Infrastructure Development not posted because Skanska’s portion is already zero 0,3 1,8
Carrying amount of shares 202,2 205,2
Assets pledgedShares in joint ventures pledged as collateral for loans and other obligations amounted
to EUR 150.0 M (148.6)).
Other mattersSkanska’s portion of the total investment obligations of partly owned joint ventures
amounted to EUR 1,006.3 M (1,090.7).
Skanska has undertaken to invest an additional EUR 117.3 M (101.0) in Infrastructure
Development in the form of equity holdings and loans. The remaining portion is expected
to be financed mainly in the form of bank loans or bond loans in the respective joint
ventures and in the form of participations and loans from other co-owners.
Contingent liabilities for joint ventures amounted to EUR 68.9 M (74.5).

108 Notes, including accounting and valuation principles Skanska Review of 2007
Note 20 Continued Note 21 Financial assets
Information on the Group’s share of revenue, income, assets, liabilities and equity in associated companies
2007 2006
Revenue 4.3 12.4
Income 0.8 1.6
Assets 8.5 25.0
Equity 1 –111.2 –115.7
Liabilities 119.7 140.7
8.5 25.0
1 Reconciliation between equity and carrying amount of holdings according to the equity method of accounting.
2007 2006
Equity in associated companies –111.2 –115.7
Adjustments for losses not recognized 114.8 120.0
Carrying amount according to balance sheet 3.6 4.3
Information on losses in associated companies not posted because the carrying amount of Skanska’s holding “is already zero”
Group 2007 2006
Loss for the year 0.0 0.0
Losses in prior years –114.8 –120.0
The losses occurred in partly owned limited partnerships that previously carried out
aircraft leasing, for which the Group has no obligation to provide additional capital.
Other mattersThe associate companies have no liabilities or contingent liabilities which the Group may
become responsible for paying. Nor are there any obligations for further investments.
Financial non-current assets
2007 2006
Financial investments
Financial assets at fair value through profit or loss
Derivatives 0.2 0.9
Held-to-maturity investments 0.3
Financial assets available for sale 1 50.5 106.0
51.0 106.8
Financial receivables, interest-bearing
Receivable from associated companies 1.3
Receivable from joint ventures 2.6 0.6
Restricted cash 16.9 41.0
Other interest-bearing receivables 6.5 16.1
26.0 59.1
Total 77.0 165.9
of which interest-bearing financial non-current assets 67.1 158.5
of which non-interest-bearing financial non-current assets 9.9 7.4
Financial current assets
2007 2006
Financial investments
Financial assets at fair value through profit or loss
Securities 22.3
Derivatives 8.6 2.8
Derivatives to which hedge accounting is applied 3.5 10.1
Held-to-maturity investments 62.3 72.4
Financial assets available for sale 43.4 82.6
117.8 190.2
Financial receivables, interest-bearing
Receivable from associated companies 1.1
Restricted cash 212.5 78.3
Discounted operating receivables 2 110.2 37.6
Other interest-bearing receivables 55.5 41.6
378.1 158.6
Total 495.9 348.8
of which interest-bearing financial current assets 483.9 336.0
of which non-interest-bearing current financial assets 12.1 12.8
Total carrying amount, financial assets 573.0 514.7
of which financial assets excluding shares 563.2 508.2
1 Including EUR 9.7 M (6.5) in shares carried at cost. During 2007. shareholdings were affected by impairment losses of EUR –1.2 M (0). Of these losses. EUR –0.4 M was charged to the Construction business stream and EUR –0.8 M to the Residential Investment business stream. The impairment losses were charged to financial items. See Note 14. “Net financial items.” Of the total impair ment losses. EUR –1.2 M. EUR –1.1 M was based on net realizable value and EUR –0.1 M on value in use.
2 The amount included EUR 74.8 M (0) discounted receivables on properties divested in the property business. The remainder consisted of EUR 35.3 M (37.6) in discounting of operating receivables in Czech operations.
Financial investments, financial receivables and shareholdings where ownership is less
than 20 percent and the Group has no significant influence are recognized as financial
non-current assets.
Financial investments and financial receivables are recognized as financial current
assets.
See also Note 6, “Financial instruments.”
Associated companiesAssociated companies are reported in compliance with IAS 28, “Investments in Associates.”
See “Accounting and valuation principles,” Note 1.
The carrying amount of associated companies was EUR 3.6 M (4.3).

Skanska Review of 2007 Notes, including accounting and valuation principles 109
Note 22 Current-asset properties/Project development
Balance sheet item Business stream 2007 2006
Commercial Development Commercial Development 662.5 617.5
Other commercial properties Construction 79.2 105.7
Residential Development Residential Development 655.1 584.8
Total 1,396.8 1,308.0
Divestments of current-asset properties
2007 2006
Divestment proceeds
Commercial Development 302.2 320.5
Other commercial properties 73.0 42.1
Residential Development 583.0 481.5
958.2 844.2
Carrying amount
Commercial Development –185.5 –180.0
Other commercial properties -49.5 –31.4
Residential Development –463.0 –369.4
–698.0 –580.9
Gross income
Commercial Development 116.7 140.5
Other commercial properties 23.5 10.7
Residential Development 120.0 112.1
260.2 263.3
Breakdown of divestments by Commercial Development between completed projects and properties under construction/development properties
Completedproperties
Properties under construction and development
properties Total
2007 2006 2007 2006 2007 2006
Divestment proceeds 148.3 217.2 153.9 103.3 302.2 320.5
Carrying amount –90.7 –99.0 –94.8 –81.1 –185.5 –180.0
Gross income 57.6 118.2 59.1 22.3 116.7 140.5
Impairment losses Reversals of
impairment losses Total
2007 2006 2007 2006 2007 2006
Commercial Development –3.8 –3.8 0.0
Other commercial properties –7.8 0.0 –7.8
Residential Development –5.7 –1.3 5.1 0.8 –0.6 –0.5
Total –9.5 –9.1 5.1 0.8 –4.4 –8.3
Current-asset properties are reported in compliance with IAS 2, “Inventories.”
See “Accounting and valuation principles,” Note 1.
The allocation of balance sheet items among the various business streams
can be seen below.
For a further description of the respective business streams, see Note 4,
“Segment reporting.”
Income from current-asset properties comes mainly from Commercial Development
and Residential Development.
Completed properties, properties under construction and development properties
are all reported as current-asset properties.
Impairment losses/reversals of impairment lossesCurrent-asset properties are valued in compliance with IAS 2, “Inventories,” and are this
carried at cost or net realizable value, whichever is lower. Adjustments to net realizable
value via an impairment loss are recognized, as are reversals of previous impairment
losses, in the income statement under “Cost of sales.”
Net realizable value is affected by the type and location of the property and by the
yield requirement in the market.
The following table shows that during 2007, impairment losses totaling EUR 5.1 M
(0.8) were reversed. The reason for this was the net realizable value increased during
the year.

110 Notes, including accounting and valuation principles Skanska Review of 2007
Note 22 Continued
Cost Net realizable value Total
2007 2006 2007 2006 2007 2006
Commercial Development 644.1 598.9 18.4 18.6 662.5 617.5
Other commercial properties 76.1 104.1 3.1 1.7 79.2 105.7
Residential Development 648.5 576.1 6.6 8.7 655.1 584.8
Total 1,368.7 1,279.0 28.0 29.0 1,396.8 1,308.0
Fair value of current-asset propertiesThe estimated market value of completed commercial properties on December 31, 2007,
partly carried out in collaboration with external appraisers, was EUR 0.34 billion (0.39),
including partly owned property, with a corresponding carrying amount of
EUR 0.23 billion (0.28).
Including projects recognized as completed on January 1, 2008, estimated total
market value was about EUR 0.38 billion (0.45), with a corresponding carrying amount
of EUR 0.28 billion (0.32).
Assets pledgedCurrent-asset properties used as collateral for loans and other obligations totaled
EUR 0.5 M (0.6). See Note 33, “Assets pledged, contingent liabilities and contingent
assets.”
Other mattersInformation on capitalized interest is reported in Note 15, “Borrowing costs.”
Skanska has committed itself to investing EUR 91.3 M (75.9) in current-asset properties.
Carrying amount
Completed properties Properties
under construction Development properties Total
current-asset properties
2007 2006 2007 2006 2007 2006 2007 2006
Commercial Development 237.0 279.3 264.7 135.6 160.9 202.6 662.5 617.5
Other commercial properties 12.8 10.9 11.5 6.0 54.8 88.8 79.2 105.7
Residential Development 36.1 21.5 93.8 89.6 525.2 473.8 655.1 584.8
Total 285.9 311.7 370.0 231.1 740.9 765.2 1,396.8 1,308.0
Commercial Development Other
commercial properties Residential Development Total
current-asset properties
2007 2006 2007 2006 2007 2006 2007 2006
Carrying amount
January 1 617.5 618.0 105.7 148.6 584.8 349.4 1,308.0 1,116.1
Acquisitions of companies 0.4 0.4
Divestments of companies –0.4 –16.6 –0.4 –16.6
Investments 255.3 177.1 36.5 29.4 538.6 556.9 830.5 763.4
Divestments –185.5 –180.0 –49.5 –31.4 –463.0 –369.4 –698.0 –580.9
Impairment losses/reversals
of impairment losses –3.8 –7.8 –0.6 –0.5 –4.4 –8.3
The year’s provision for intra-Group
profits in contracting work –9.3 –6.3 –9.3 –6.3
Reclassifications 10.2 –8.5 –11.7 –36.6 –2.2 60.8 –3.7 15.7
Exchange rate differences for the year, derivatives 0.1 –0.4 0.1 –0.4
Exchange rate differences for the year –22.0 17.6 –1.9 3.6 –2.6 4.2 –26.5 25.4
December 31 662.5 617.5 79.2 105.7 655.1 584.8 1,396.8 1,308.0
The carrying amount of current-asset properties is allocated between properties carried
at cost and properties carried at net realizable value, as shown in the following table:
Commercial DevelopmentEUR M Market value Dec 31, 2007
Completed projects 385.8
Undeveloped land and development properties 214.8
Ongoing projects 1 264.6
Total 865.2
1 Market value refers to accrued market value.

Skanska Review of 2007 Notes, including accounting and valuation principles 111
Note 23 Inventories etc.
2007 2006
Raw materials and supplies 58.1 33.3
Products being manufactured 19.6 16.5
Finished products and merchandise 3.7 3.8
Total 81.4 53.5
There were no significant difference between the carrying amount for inventories and
their fair value.
No portion of inventories was adjusted due to an increase in net realizable value.
No merchandise was used as collateral for loans and other obligations.
Note 24 Trade and other receivables
Note 25 Cash equivalents
Note 26 Equity/Earnings per share
2007 2006
Trade accounts receivable from joint ventures 29.2 20.3
Other trade accounts receivable 2,109.7 2,100.8
Other operating receivables from associated companies 0.1
Other operating receivables from joint ventures 1.7 5.2
Other operating receivables 374.9 273.4
Prepaid expenses and accrued income 148.1 173.0
Total 2,663.6 2,572.8
of which financial instruments reported in Note 6, “Financial instruments”Trade accounts receivable 2,139.0 2,121.1
Other operating receivables including accrued interest income 20.2 25.3
2,159.2 2,146.4
of which non-financial instruments 504.4 426.3
During the year, equity changed as follows:
2007 2006
Opening balance 2,138.6 1,979.0
Attributable to equity holders
Dividend –373.3 –294.1
Translation differences –25.4 5.1
Effect of actuarial gains and losses on pensions 7.4 54.1
Effect of share-based payment 3.0 1.9
Effect of cash flow hedges–6.6 –1.9
Change in minority interest 4.1 –0.6
Profit for the year attributable to
Equity holders 442.8 392.8
Minority 2.7 2.2
Equity
2,193.2 2,138.6
Equity attributable to equity holders is allocated as follows:2007 2006
Share capital 139.9 139.9
Paid-in capital 34.8 34.8
Reserves 63.7 95.7
Retained earnings 1,931.9 1,852.0
Total 2,170.2 2,122.4
The following reserves are found in the consolidated financial statements:
2007 2006
Translation reserve 62.2 87.6
Cash flow hedge reserve 1.5 8.1
Fair value reserve 0.0 0.0
Total 63.7 95.7
Paid-in capitalPaid-in capital in excess of quota (par) value from historical issues of new shares is
recognized as “Paid-in capital.”
Retained earningsRetained earnings include the profit for the year plus undistributed Group profits earned
in prior years. The statutory reserve is part of retained earnings, along with actuarial gains
and losses on pensions, which in compliance with IAS 19 was recognized directly in equity
in the amount of EUR 7.4 M (54.1). In compliance with IFRS 2, the year’s change in share-
based payment was recognized directly in equity in the amount of EUR 3.0 M (1.9). See
below.
Translation reserveThe translation reserve consists of accumulated translation differences from the
translation of local financial statements to the presentation currency. The translation
reserve also includes exchange rate differences that have arisen when hedging net
investments in operations outside Sweden. The translation reserve was reset at zero
upon the transition to IFRSs on January 1, 2004. Translation difference for the year
amounted to EUR–48.4 M (–13.9) and consisted of positive translation differences in
NOK, PLN and CZK as well as negative translation differences in USD, SEK and GBP (for
currency abbreviations, see Note 34, “Effect of changes in exchange rates”).
During the year, the translation reserve was affected by exchange rate differences
of EUR 23.0 M (19.0) due to currency hedges. The Group has currency hedges against
SEK, which is the functional currency of the Parent Company, related to net investments
mainly in USD, EUR, BRL and CLP. In all, the Group was affected by USD currency hedges
in the amount of EUR +0.02 billion. In 2006, the Group was affected by currency hedges
in USD and CLP amounting to EUR +0.01 billion each.
Inventories are reported in compliance with IAS 2, “Inventories.” See “Accounting and
valuation principles,” Note 1.
In the consolidated financial statements, equity is allocated between equity attributable
to equity holders (shareholders) and minority interest.
Minority interest accounts for about one percent of total equity.
Non-interest-bearing business receivables are reported as “Trade and other
receivables.” Trade and other receivables are part of the Group’s operating cycle
and are recognized as current assets.
Investments with an insignificant risks of fluctuations in value and which can easily be
transformed into cash are reported as cash equivalents. Their maturity from the
acquisition date is three months or shorter.
Cash equivalents amounted to EUR 55.1 M (235.7) and consisted entirely of finan-
cial instruments in the category “Financial assets available for sale.” See also Note 6,
“Financial instruments.”

112 Notes, including accounting and valuation principles Skanska Review of 2007
Note 26 Continued
Cash flow hedge reserveRecognized in the hedge reserve are unrealized gains and losses on hedging instruments
when applying hedge accounting with regard to forecasted cash flows.
Hedge accounting is applied for transaction exposure to foreign currencies, mainly
for operations in Poland.
The change during 2007 amounted to EUR –6.7 M (–1.9), and the closing balance of
the reserve totaled EUR 1.5 M (8.1).
Fair value reserveThe fair value reserve includes the accumulated net change in the fair value of financial
assets available for sale until the asset is derecognized from the balance sheet.
IFRS 2, “Share-based Payment”The share incentive program (“Share Award Plan”) introduced during 2005 is recognized
as share-based payment, which is settled with an equity instrument in compliance with
IFRS 2. This implies that fair value is calculated on the basis of estimated fulfillment of
financial targets during a measurement period. After the close of the measurement
period, fair value is established.
This value is allocated over the four-year vesting period. There is no reappraisal after
fair value is established during the remainder of the vesting period, aside from changes
in the number of shares because the condition of continued employment during the
vesting period is no longer met.
DividendAfter the balance sheet date, the Board of Directors proposed a regular dividend of
SEK 5.25 (4.75) per share (corresponding to EUR 0.56 [0.53] per share) plus an extra
dividend of SEK 3.00 (3.50) per share (corresponding to EUR 0.32 (0.39) per share).
The dividend was approved by the Annual Shareholders’ Meeting on April 3, 2008.
The overall proposed dividend is:
2007 2006
Regular dividend 232.5 219.9
Extra dividend 132.9 162.0
Total 365.4 381.9
Dilution effectIn the Share Award Plan introduced during 2005, the number of potential ordinary
shares is calculated during the measurement period based on the estimated number
of shares that will be issued due to the fulfillment of the established targets. After the
end of the measurement period, Skanska establishes the number of shares that may
be issued, provided that the conditions regarding continued employment are met. The
number of potential ordinary shares thus calculated is then reduced by the difference
between the payment Skanska is expected to receive and the average share price during
the period.
The Share Award Plan introduced in 2005, with allocations for 2005, 2006 and 2007,
has been estimated to have a dilution effect during 2007 of 527,392 shares or 0.13 percent
of shares outstanding.
The maximum dilution effect at the close of the vesting period in 2010 amounts to
1,244,860 shares or 0.30 percent.
Capital managementCapital requirement vary between business streams. Skanska’s construction projects are
mainly based on customer funding. As a result, in its Construction business stream, the
Company can operate with negative working capital. However, the equity requirement
for a construction company is substantial and is related to large business volume and to
the risks inherent in the various types of construction assignments carried out. Skanska
must also take into account the financing of goodwill and the performance guarantees
required in publicly procured projects in the U.S. market.
In the Board’s judgment, during 2008 Group equity needs to total about
SEK 17 billion (corresponding to about EUR 1.8 billion). The ambition is to use the net
cash surplus to expand investments in the Group’s development business streams − Resi-
dential, Commercial and Infrastructure Development. Cash and cash equivalents that
are not being utilized are invested in short-term instruments such as government securi-
ties, bank-issued or corporate bonds with a credit rating no lower than BBB+.
Other mattersDisclosures on income and expenses from financial instruments recognized directly in
equity are presented in Note 6, “Financial instruments.”
Number of shares2007 2006
Average number of shares
before dilution 418,553,072 418,553,072
after dilution 419,080,464 418,827,470
Total number of shares 418,553,072 418,553,072
The number of shares amounted to 418,553,072, divided into 22,464,731
(22,502,851) Series A shares and 396,088,341 (396,050,221) Series B shares). In addi-
tion, there are 4,500,000 Series D shares in Skanska’s own custody.
During 2007, 38,120 (51,212) Series A shares were redeemed for a corresponding
number of Series B shares.
Each Series A share carries 10 votes and each Series B and Series D share carries one
vote. D shares do not entitle the holder to a dividend from earnings. Series B shares
are listed on the OMX Nordic Exchange Stockholm

Skanska Review of 2007 Notes, including accounting and valuation principles 113
Note 26 Continued
Equity attributable to equity holders
Share capital Paid-in capital Reserves Retained earnings Total Minority interest Total equity
Equity, January 1, 2006 138.5 34.8 92.5 1,698.5 1,964.3 14.7 1,979.0
Change in translation reserve for the year 5.1 5.1 –0.2 4.9
Change in cash flow hedge reserve for the year –2.4 –2.4 –2.4
Change in share-based payment for the year 1.9 1.9 1.9
Change in actuarial gains and losses on pensions for the year 1 77.6 77.6 77.6
Other transfers of assets recognized directly in equity 2 –0.1 –0.1
Taxes attributable to items recognized directly in equity 3 0.4 –23.5 –23.0 –23.0
Changes in assets recognized directly in equity, excluding transactions with the Company’s owners 0.0 0.0 3.2 56.1 59.3 –0.3 58.9
Profit for the year 392.8 392.8 2.2 395.0
Total changes in assets, excluding transactions with the Company’s owners 0.0 0.0 3.2 448.9 452.1 1.8 453.9
Issue of Series D shares 1.4 1.4 1.4
Repurchase of Series D shares –1.4 –1.4 –1.4
Dividend –294.1 –294.1 –0.3 –294.4
Equity, December 31, 2006/ Equity, January 1, 2007 139.9 34.8 95.7 1,852.0 2,122.4 16.2 2,138.6
Change in translation reserve for the year –25.4 –25.4 1.2 –24.2
Change in cash flow hedge reserve for the year –8.1 –8.1 –8.1
Change in share-based payment for the year 3.0 3.0 3.0
Change in actuarial gains and losses on pensions for the year 1 11.5 11.5 11.5
Other transfers of assets recognized
directly in equity 2 0.0 3.6 3.6
Taxes attributable to items recognized directly in equity 3 1.5 –4.1 –2.6 –2.6
Changes in assets recognized directly in equity, excluding transactions with the Company’s owners 0.0 0.0 –32.0 10.4 –21.6 4.8 –16.9
Profit for the year 442.8 442.8 2.7 445.5
Total changes in assets, excluding transactions with the Company’s owners
0.0 0.0 –32.0 453.1 421.1 7.5 428.6
Dividend –373.3 –373.3 –0.6 –373.9
Equity, December 31, 2007 139.9 34.8 63.7 1,931.9 2,170.2 23.0 2,193.2
1 Includes social insurance contributions in the amount of EUR –1.0 M (7.2).2 Reported as “Other transfers of assets recognized directly in equity” was EUR +3.6 M (–0.1) in minority interest. Of this amount, EUR +4.1 M (0) was related to reclassification,
EUR –0.5 M (–1.2) to purchases from minority interest, EUR 0 M (+1.5) to contributions from minority interest and EUR 0 (–0.4) to divestment of Group companies with minority interest.3 The amount recognized among reserves, EUR 1.5 M (0.4), was related to the cash flow hedge reserve. The amount recognized in retained earnings, EUR –4.1 M (–23.5) was related to
the year’s change in actuarial gains and losses on pensions.

114 Notes, including accounting and valuation principles Skanska Review of 2007
Note 26 Continued
Specification of reserves included in “Equity attributable to equity holders”
2007 2006
Translation reserve
January 1 87.6 82.5
Translation differences for the year –48.4 –13.9
Less hedging of currency risks in operations outside Sweden 23.0 19.0
62.2 87.6
Cash flow hedge reserve
January 1 8.1 10.0
Cash flow hedges:
Recognized directly in equity 0.5 2.5
Transferred to income statement –8.6 –4.9
Taxes attributable to hedging for the year 1.5 0.4
1.5 8.1
Total reserves 63.7 95.7
Fair value reserve
The fair value reserve amounted to EUR 0 M.
Note 27 Financial liabilities
Financial non-current liabilities 2007 2006
Financial liabilities at fair value through profit or loss
Derivatives 0.7
Other financial liabilities
Bond loans 73.5
Liabilities to credit institutions 78.4 99.6
Other liabilities 22.6 51.6
Total 101.1 225.5
of which interest-bearing financial non-current liabilities 101.1 224.8
of which non-interest-bearing financial non-current
liabilities
0.0 0.7
Financial current liabilities 2007 2006
Financial liabilities at fair value through profit or loss
Derivatives 3.0 4.2
Derivatives to which hedge accounting is applied 6.5 2.4
Other financial liabilitiesBond loans 71.8 30.4
Liabilities to credit institutions 45.0 34.6
Liabilities to joint ventures 0.3 1.1
Discounted liabilities 1 155.4 76.8
Other liabilities 4.2 4.9
Total 286.1 154.4
of which interest-bearing financial current liabilities 276.6 147.8
of which non-interest-bearing financial current liabilities 9.4 6.6
Total carrying amount for financial liabilities 387.1 379.9
1 Of the total amount, EUR 155.4 M (76.8), EUR 46.5 M (0) consisted of discounted advance payments from customers, of which EUR 42.1 M was reclassified during the year from “Other operating liabilities.” The amount also included EUR 63.1 M (32.3) in discounted liabilities in property operations consisting of discounted liabilities on purchases of current-asset properties. The remaining amount, EUR 45.8 M (44.5) consisted of discounted operating liabilities in the Czech Republic.
Financial liabilities are allocated between non-current and current liabilities. Normally, a
maturity date within one year is required if a liability is to be treated as current. This does
not apply to discounted operating liabilities, which are part of Skanska’s operating cycle
and are consequently recognized as current liabilities regardless of their maturity date.
Regarding financial risks and financial policies, see Note 6, “Financial instruments.”
Note 28 Pensions
Provisions for pensions are reported in compliance with IAS 19, “Employee Benefits.”
See “Accounting and valuation principles,” Note 1.
Pension liability according to the balance sheetAccording to the balance sheet, interest-bearing pension liability amounts to
EUR 121.6 M (172.1).
Skanska has defined-benefit pension plans in Sweden, Norway, the U.K. and the U.S.
The pension in these plans is mainly based on final salary. The plans include a large number
of employees, but Skanska also has defined-contribution plans in these countries. Group
subsidiaries in other countries mainly have defined-contribution plans.
Defined-benefit plansThe pension plans mainly consist of retirement pensions. Each respective employer usually
has obligation to pay a lifetime pension. Benefits are based on the number of years of
employment. The employee must belong to the plan for a certain number of years to
earn a full retirement pension entitlement. For each year, the employee earns increased
pension entitlements, which are reported as pension earned during the period plus an
increase in pension obligation.
Pension plans are funded by securing pension obligations with assets in pension
funds and provisions in the balance sheet. The plans are funded by payments from the
respective Group companies and in some cases the employees.
The plan assets in each pension plan are smaller than the pension obligation. For this
reason, the difference is recognized as a liability in the balance sheet. The ceiling rule
that, in some cases, limits the value of these assets in the balance sheet does not apply
when plan assets are smaller than pension obligations.
On the balance sheet date, the pension obligation amounted to EUR 1,180.8 M
(1,204.2). The increased obligation for pensions earned during the period was partly off-
set by higher long-term interest rates and thus higher discount rates, which reduced the
obligation. Plan assets amounted to EUR 1,059.2 M (1,032.1).
Actuarial gains and losses may be recognized directly in equity in the balance sheet,
according to the alternative rule in IAS 19. Skanska applies this alternative method.
Actuarial gains and losses amounted to a net gain of EUR 12.4 M in 2007, compared to a
net gain of EUR 70.4, M in 2006. The accumulated net loss amounted to EUR –140.4 M
(–152.8), which is included in recognized pension liability. The accumulated net loss was
mainly due to actuarial losses from lower discount rates and was offset to some extent
by actuarial gains on plan assets.
The return on plan assets recognized in the income statement amounted to
EUR 61.5 M (50.8), while actual return amounted to EUR 54.6 M (70.7). The divergence
was attributable to pension plans in the United Kingdom.
The plan assets consisted mainly of equities, interest-bearing securities and mutual
fund units. No assets were used in Skanska’s operations. The number of directly owned
shares in Skanska AB totaled 250,000 (0). There was also an insignificant percentage of
indirectly owned shares in Skanska AB via investments in various mutual funds.
The defined-benefit plans in the U.S. are closed and have been replaced by defined-
contribution plans. The closed plans are expected to be settled during 2008.
Plan assetsSweden Norway
UnitedKingdom
UnitedStates
2007
Equities 26% 33% 50% 22%
Interest-bearing securities 52% 56% 48% 78%
Alternative investments 22% 11% 2% 0%
Expected return 5.00% 5.75% 6.25% 7.00%
Actual return 6.10% 6.50% 3.50% 6.80%
2006
Equities 35% 37% 56% 39%
Interest-bearing securities 47% 50% 44% 61%
Alternative investments 18% 13% 0% 0%
Expected return 4.75% 5.75% 6.00% 6.25%
Actual return 7.60% 9.20% 6.20% 9.90%

Skanska Review of 2007 Notes, including accounting and valuation principles 115
Note 28 Continued
Obligations related to employee benefits, defined-benefit plans
2007 2006 2005
Pension obligations, funded plans, present value on December 31
1,180.8 1,204.2 1,143.3
Plan assets, fair value, December 31 -1,059.2 –1,032.1 –887.0
Net liability according to balance sheet 121.6 172.1 256.3
Pension obligations and plan assets by country
Sweden NorwayUnited
KingdomUnitedStates Total
2007
Pension obligations 442.0 222.7 460.0 56.1 1 180.8
Plan assets –356.8 –216.5 –439.9 –45.9 –1 059.2
Net liability according to balance sheet 85.2 6.1 20.1 10.2 121.6
2006
Pension obligations 435.3 216.4 485.8 66.6 1,204.2
Plan assets –354.9 –184.9 –441.2 –51.1 –1,032.1
Net liability according to balance sheet 80.4 31.5 44.7 15.5 172.1
Total pension expenses in the income statement
2007 2006
Pensions earned during the year –61.2 –58.1
Less: Funds contributed by employees 3.2 2.7
Interest on obligations –51.6 –48.3
Expected return on plan assets 61.5 50.8
Curtailments and settlements 9.5
Pension expenses, defined-benefit plans –48.0 –43.4
Pension expenses, defined-contribution plans –79.1 –69.7
Social insurance contributions, defined-benefit and defined-contribution plans 1
–9.8 –7.3
Total pension expenses –137.0 –120.5
1 Refers to special payroll tax in Sweden and employer fee in Norway.
Actuarial gains and losses recognized directly in equity
2007 2006 2005 2004
January 1 –152.8 –223.2 –64.7 0.0
Actuarial gains and losses, pension obligations 1 19.3 50.5 –226.1 –83.9
Difference between expected and actual return on plan assets –6.9 19.9 67.6 19.3
Accumulated –140.4 –152.8 –223.2 –64.7
1 In 2007 (2006), changed assumptions amounted to EUR 51.2 M (32.0) and experience-based changes EUR –31.9 M (18.5).
See also “Consolidated statement of recognized income and expenses,” which shows
the tax portion and social insurance contributions recognized directly in equity.
Pension obligations
2007 2006
January 1 1,204.2 1,143.3
Transferred from liabilities classified as held for sale 0.9
Pensions earned during the year 61.2 58.1
Interest on obligations 51.6 48.3
Benefits paid by employers –16.9 –16.2
Benefits paid by plan assets –19.7 –17.9
Acquisitions of companies 37.1
Divestments of companies –1.5
Reclassifications –3.6
Actuarial gains (–), losses (+) for the year –19.3 –50.5
Curtailments and settlements –15.3 –9.5
Exchange rate differences –61.3 12.1
Pension obligations, present value 1,180.8 1,204.2
Plan assets
2007 2006
January 1 1,032.1 887.0
Expected return on plan assets 61.5 50.8
Funds contributed by employers 51.8 44.2
Funds contributed by employees 3.2 2.7
Benefits paid –19.7 –17.9
Acquisitions of companies 34.5
Divestments of companies –1.0
Reclassifications 7.8
Actuarial gains (+), losses (–) during the year –6.9 19.9
Curtailments and settlements –15.3
Exchange rate differences –55.3 11.9
Plan assets, fair value 1,059.2 1,032.1
Funds contributed are expected to total about EUR 50 M during 2008
through payments to funds in Norway and the United Kingdom.
Reconciliation of interest-bearing pension liability
2007 2006
Pension liabilities, January 1 172.1 256.3
Transferred from/to liabilities classified as held for sale 0.9
Pension expenses 48.0 53.0
Benefits paid by employers –16.9 –16.2
Funds contributed by employers –51.8 –44.2
Acquisitions of companies 2.6
Divestments of companies –0.5
Reclassifications –11.4
Actuarial gains (–), losses (+) for the year –12.4 –70.4
Curtailments and settlements –9.5
Exchange rate differences –6.1 0.2
Net liability according to balance sheet 121.6 172.1
Allocation of pension expenses in the income statement
2007 2006
Cost of sales –111.2 –95.0
Selling and administrative expenses –35.7 –28.0
Financial items 9.9 2.5
Total pension expenses –137.0 –120.5
The ITP 2 occupational pension plan in Sweden is a defined-benefit plan. A small portion
is secured by insurance from the retirement insurance company Alecta. This is a multi-
employer insurance plan, and there is insufficient information to report these obligations
as a defined-benefit plan. Pensions secured by insurance from Alecta are therefore
reported as a defined-contribution plan.
Trade union-sponsored plans in the United States are defined-benefit plans that often
cover multiple employers. Since there is insufficient information to report these obliga-
tions as defined benefit plans, they are reported as defined-contribution plans.
Defined-contribution plansThese plans mainly cover retirement pension, disability pension and family pension.
The premiums are paid regularly during the year by the respective Group company to
separate legal entities, for example insurance companies. The size of the premium is
based on salary. The pension expense for the period is included in the income statement.

116 Notes, including accounting and valuation principles Skanska Review of 2007
Note 28 Continued
Actuarial assumptions
Sweden NorwayUnited
Kingdom United
States 1
2007
Discount rate, January 1 3.75% 4.25% 5.00% 4.75%
Discount rate, December 31 4.25% 4.75% 5.50% 4.75%
Expected return on plan assets for the year 5.00% 5.75% 6.25% 7.00%
of which equities 6.75% 7.75% 7.50% 8.25%
of which interest-bearing securities 3.25% 4.25% 4.50% 5.25%
Expected pay increase, December 31 3.50% 3.75% 4.50% –
Expected inflation, December 31 2.00% 2.50% 3.00% 3.00%
2006
Discount rate, January 1 3.50% 4.00% 4.75% 5.25%
Discount rate, December 31 3.75% 4.25% 5.00% 4.75%
Expected return on plan assets for the year 4.75% 5.75% 6.00% 6.25%
of which equities 6.50% 7.50% 7.25% 7.75%
of which interest-bearing securities 3.00% 4.00% 4.25% 4.75%
Expected pay increase, December 31 3.25% 3.50% 4.50% –
Expected inflation, December 31 2.00% 2.50% 2.75% 3.00%
1 U.S. defined-benefit pension plans were replaced by defined-contribution plans. Obligations will be settled during 2008, with an expected discount rate amounting to 4.75 percent. Expected future pay increase is consequently not included in the calculation.
Sweden Norway United
KingdomUnitedStates
Life expectancy after age 65, men 20 years 18 years 22 years 19 years
Life expectancy after age 65, women 23 years 21 years 25 years 22 years
Life expectancy table 1 DUS06 K2005 PA92 GAR94
1 Life expectancy is based on local life expectancy tables in each respective country. If life expectancy increases by one year, pension obligation is expected to increase by about 4 percent.
Sensitivity of pension obligation to change in discount rate
Sweden NorwayUnited
KingdomUnitedStates Total
Pension obligations, December 31, 2007 442.0 222.7 460.0 56.1 1,180.8
Discount rate increase of 0.25 percent 1 –15 –10 –20 – –45
Discount rate decrease of 0.25 percent 1 15 10 20 – 45
1 Estimated change in pension obligation/liability if the discount rate changes. If pension liability increases, the Group’s equity is reduced by about 75 percent of the increase in pension liability, after taking into account deferred tax and social insurance contributions.
Expected return on interest-bearing securities is established on the basis of market
interest rates on the balance sheet date for high-grade long-term corporate bonds or
government bonds in each respective country, adjusted for current holdings in each
respective portfolio.
For the equities market as a whole, a risk premium of 3 percent is added. This pre-
mium is adjusted for the risk profile of each respective equities market.

Skanska Review of 2007 Notes, including accounting and valuation principles 117
Note 29 Provisions
Note 30 Trade and other payables
2007 2006
Non-current provisions
Interest-bearing 10.2 13.2
Current provisions
Interest-bearing 2.1 2.2
Non-interest-bearing 383.7 382.2
Total 396.0 397.6
The amount for interest-bearing provisions included EUR 8.3 M (10.9) in provision to the
employee fund in Sweden.
Non-interest-bearing liabilities in business operations are recognized as “Trade and
other payables.” Such liabilities are part of the Group’s operating cycle and are
consequently recognized as current liabilities.
2007 2006
Accounts payable to associated companies 0.2
Accounts payable to joint ventures 0.3 0.4
Other trade payables 1,577.5 1,533.0
Accrued expenses and prepaid income 948.7 811.0
Other operating liabilities 750.0 797.1
Total 3,276.5 3,141.7
of which financial instruments reported in Note 6, “Financial instruments”
Accounts payable 1,577.8 1,533.6
Other operating liabilities including accrued interest expenses 186.4 155.9
1,764.2 1,689.6
of which non-financial instruments 1,512.3 1,452.1
“Other operating liabilities” included EUR 95.6 M (95.8) for checks issued but not yet
cash in the U.S. and the U.K.
See “Accounting and valuation principles,” Note 1.
Specification of “Other provisions”
2007 2006
Restructuring measures 8.8 10.4
Project risks 6.0 4.8
Employee fund, Sweden 8.3 10.9
Employee-related provisions 59.9 47.1
Environmental obligations 9.9 9.8
Provision for social insurance contributions on pensions 17.1 13.5
Miscellaneous provisions 36.4 56.8
Total 146.5 153.4
Normal cycle time for “Other provisions” is about 1–3 years.
Provisions for warranty obligations refer to expenses that may arise during the war-
ranty period.
Such provisions in Construction are mainly based on individual assessments of each
project or on average experience-based cost, expressed as a percentage of sales during
a five-year period. The expenses are charged to each project on a continuous basis.
Provisions for warranty obligations in other business streams are based on individual
assessments of each project. The change in 2007 was mainly related to Construction.
Provisions for legal disputes refer to provisions in the Construction business stream
for projects that have been completed.
Provisions for restructuring refer to the expenses of adapting operations to the
projected market and in accordance with the Group’s strategic plan. Expenses were
paid for such items as closing down operations and phasing out employees.
The provision to the employee fund in Sweden refers to a refund of surplus funds
from the retirement insurance company SPP, now Alecta. The provision is used in
consultation with trade union representatives to enable employees with reduced work
capacity to remain employed on a part-time basis. The employee is compensated for
loss of income and loss of future pension benefits.
Employee-related provisions included such items as the cost of profit-sharing, certain
bonus programs and other obligations to employees.
Among provisions for environmental obligations are the costs of restoring gravel pits
to their natural state in Swedish operations.
Provisions are reported in compliance with IAS 37, “Provisions, Contingent Liabilities
and Contingent Assets.”
See “Accounting and valuation principles,” Note 1.
Provisions are allocated in the balance sheet between non-current liabilities and current
liabilities. Provisions are both interest-bearing and non-interest-bearing. Provisions that
are part of Skanska’s operating cycle are recognized as current. Interest-bearing provisions
that fall due within a year are treated as current.
The change in provisions, allocated among the reserve for legal disputes, provision for warranty obligations and other provisions can be seen in the following table.
Legal disputes Warranty obligations Other provisions Total
2007 2006 2007 2006 2007 2006 2007 2006
January 1 94.8 95.6 149.4 112.6 153.4 147.7 397.6 355.9
Acquisitions of companies 0.6 0.6
Divestments of companies –0.1 –0.1
Provisions for the year 44.0 31.8 26.7 65.5 43.5 54.5 114.1 151.7
Provisions utilized –18.5 –16.6 –20.8 –25.9 –36.5 –41.3 –75.8 –83.9
Unutilized amounts that were reversed, change in value –16.8 –15.7 –4.8 –3.6 –7.4 –13.7 –28.9 –33.0
Exchange rate differences –1.4 1.1 –0.8 2.2 –4.8 1.8 –7.0 5.1
Reclassifications –8.5 –1.4 6.2 –1.9 –1.7 4.4 –4.1 1.1
December 31 93.6 94.8 156.0 149.4 146.5 153.4 396.0 397.6

118 Notes, including accounting and valuation principles Skanska Review of 2007
Note 31 Specification of interest-bearing receivables per asset and liability
2007 2006
Interest- bearing
Non-interest-bearing Total
Interest- bearing
Non-interest-bearing Total
ASSETS
Non-current assets
Property, plant and equipment 632.1 632.1 603.5 603.5
Goodwill 485.1 485.1 496.6 496.6
Other intangible assets 69.6 69.6 81.8 81.8
Investments in joint ventures and associated companies 205.8 205.8 209.5 209.5
Financial non-current assets 67.1 9.9 77.0 158.5 7.4 165.9
Deferred tax assets 101.2 101.2 218.5 218.5
Total non-current assets 67.1 1,503.9 1,571.0 158.5 1,617.3 1,775.8
Current assets
Current-asset properties 1,396.8 1,396.8 1,308.0 1,308.0
Inventories 81.4 81.4 53.5 53.5
Financial current assets 483.9 12.1 495.9 336.0 12.8 348.8
Tax assets 43.5 43.5 36.5 36.5
Gross amount due from customers for contract work 598.6 598.6 577.5 577.5
Trade and other receivables 2,663.6 2,663.6 2,572.8 2,572.8
Cash equivalents 55.1 55.1 235.7 235.7
Cash 1,448.6 1,448.6 977.5 977.5
Total current assets 1,987.6 4,795.9 6,783.5 1,549.2 4,561.2 6,110.4
TOTAL ASSETS 2,054.7 6,299.7 8,354.4 1,707.7 6,178.5 7,886.2
LIABILITIES
Non-current liabilities
Financial non-current liabilities 101.1 0.0 101.1 224.8 0.7 225.5
Pensions 121.6 121.6 172.1 172.1
Deferred tax liabilities 219.0 219.0 319.8 319.8
Non-current provisions 10.2 10.2 13.2 13.2
Total non-current liabilities 232.8 219.0 451.8 410.1 320.5 730.6
Current liabilities
Financial current liabilities 276.6 6.3 283.0 147.8 6.6 154.4
Tax liabilities 94.3 94.3 80.5 80.5
Current provisions 2.1 383.7 385.9 2.2 382.2 384.4
Gross amount due to customers for contract work 1,666.6 1,666.6 1,256.0 1,256.0
Trade and other payables 3,276.5 3,276.5 3,141.7 3,141.7
Total current liabilities 278.8 5,427.6 5,706.3 150.0 4,867.1 5,017.0
TOTAL LIABILITIES 511.6 5,646.5 6,158.1 560.1 5,187.6 5,747.6
Interest-bearing net receivable 1,543.1 1,147.6
The following table allocates financial current and non-current assets as well as
liabilities between interest-bearing and non-interest-bearing items.

Skanska Review of 2007 Notes, including accounting and valuation principles 119
Note 32 Expected recovery periods of assets and liabilities
2007 2006
Amounts expected to be recoveredWithin
12 months12 months
or longer TotalWithin
12 months12 months
or longer Total
ASSETS
Non-current assets
Property, plant and equipment 1 124.9 507.2 632.1 118.3 485.2 603.5
Goodwill 1 485.1 485.1 496.6 496.6
Other intangible assets 1 11.3 58.3 69.6 10.7 71.1 81.8
Investments in joint ventures and associated companies 2 205.8 205.8 209.5 209.5
Financial non-current assets 77.0 77.0 165.9 165.9
Deferred tax assets 3 101.2 101.2 218.5 218.5
Total non-current assets 136.2 1,434.8 1,571.0 129.1 1,646.8 1,775.8
Current assets
Current-asset properties 4 751.4 645.4 1,396.8 669.1 638.9 1,308.0
Inventories 73.7 7.7 81.4 50.1 3.4 53.5
Financial current assets 495.9 495.9 305.6 43.2 348.8
Tax assets 43.5 43.5 36.5 36.5
Gross amount due from customers for contract work 5 566.4 32.2 598.6 543.2 34.3 577.5
Trade and other receivables 5 2,560.3 103.3 2,663.6 2,515.3 57.5 2,572.8
Cash and cash equivalents 55.1 55.1 235.7 235.7
Cash 1,448.6 1,448.6 977.5 977.5
Total current assets 5,994.9 788.5 6,783.5 5,333.0 777.4 6,110.4
TOTAL ASSETS 6,131.1 2,223.3 8,354.4 5,462.1 2,424.1 7,886.2
LIABILITIES
Non-current liabilities
Financial non-current liabilities 101.1 101.1 4.3 221.2 225.5
Pensions 6 24.4 97.2 121.6 44.2 127.8 172.1
Deferred tax liabilities 219.0 219.0 319.8 319.8
Non-current provisions 10.2 10.2 0.4 12.7 13.2
Total non-current liabilities 24.4 427.3 451.8 49.0 681.6 730.6
Current liabilities
Financial current liabilities 191.9 94.2 286.1 88.8 65.6 154.4
Tax liabilities 94.3 94.3 80.5 80.5
Current provisions 279.4 106.5 385.9 226.3 158.2 384.4
Gross amount due to customers for contract work 1,533.0 133.7 1,666.6 1,194.9 61.2 1,256.0
Trade and other payables 3,223.9 52.6 3,276.5 2,998.2 143.4 3,141.7
Total current liabilities 5,322.5 386.9 5,709.4 4,588.7 428.3 5,017.0
TOTAL LIABILITIES 5,346.9 814.3 6,161.2 4,637.7 1,109.9 5,747.6
1 In case of amounts expected to be recovered within twelve months, expected annual depreciation/amortization has been recognized.2 Allocation cannot be estimated.3 Deferred tax assets are expected to be recovered in their entirety in more than twelve months.4 Recovery within one year on current-asset properties is based on a historical assessment from the past three years.5 Current receivables that fall due in more than twelve months are part of the operating cycle and are thus recognized as current.6 “Within 12 months” refers to expected benefit payments.

120 Notes, including accounting and valuation principles Skanska Review of 2007
Note 33 Assets pledged, contingent liabilities and contingent assets
Contingent liabilities 2007 2006
Contingent liabilities related to construction consortia 355.5 477.0
Contingent liabilities related to joint ventures 68.9 74.5
Other contingent liabilities 110.2 143.8
Total 534.6 695.3
The Group’s contingent liabilities related to construction consortia totaled about
EUR 0.36 billion (0.48).
This amount referred to the portion of the joint and several liability for the obligations
of construction consortia affecting consortium members outside the Group. Such liabil-
ity is often required by the customer. To the extent it is deemed likely that Skanska will be
subject to liability claims, the obligation is reported as a liability in the balance sheet.
Contingent liabilities related to joint ventures refer mainly to guarantees issued when
joint ventures belonging to the Residential Development and Infrastructure Development
business streams have raised loans.
Most of the Group’s other contingent liabilities, EUR 0.11 billion (0.14), were related
to obligations attributable to the operations of Residential Development Nordic.
In the Swedish Competition Authority’s suit requesting infringement fines, including
EUR 60.2 M against Skanska, Stockholm City Court issued a ruling in July 2007. The
infringement fine in Skanska’s case was set at EUR 18.4 M, which was recognized as an
expense during 2007.
Skanska and another company have been sued by a number of Swedish municipalities
that maintain that they have suffered damage in procurements alleged to have been the
object of collusive cartels between the contractors. Skanska has been sued for a total of
EUR 6.0 M. Skanska denies the allegations.
In Finland, the Market Court issued a ruling in December 2007 in the Finnish Competition
Authority’s suit against a number of companies in the civil construction and asphalt
sectors, among them Skanska, concerning alleged collusive anti-competitive activities.
The Market Court ordered Skanska to pay the equivalent of EUR 1.4 M in infringement
fines. The Competition Authority had sued for about EUR 10.8 M. The ruling has been
appealed to a higher court.
In October 2006, Slovakia’s competition authority decided to fine six companies that
had participated in tendering for a road project. Skanska was part of a joint venture led
by a local Slovakian company. The fine in Skanska’s case was the equivalent of EUR 7.2 M
and was charged to 2006 earnings. Skanska denied the Authority’s allegations and has
requested that the decision be reviewed by a court of law. The court case is underway.
No provisions have been made for the above litigation, other than those in which
a court ruling has been issued, since the outcome of these cases is characterized by
great uncertainty. In accordance with the accounting principles applied by Skanska,
the amounts requested have not been included in the table of the Group’s contingent
liabilities either.
Contingent assetsThe Group has no contingent assets of significant importance in assessing the position
of the Group.
See “Accounting principles and valuation principles,” Note 1.
Contingent liabilitiesContingent liabilities are reported in compliance with IAS 37, “Provisions, Contingent
Liabilities and Contingent Assets.” See “Accounting and valuation principles,” Note 1.
Assets pledged
2007 2006
Mortgages, current-asset properties 0.5 0.6
Shares and participations 150.0 148.6
Receivables 47.2 42.6
Total 197.7 191.8
The use of shares and participations as assets pledged refers to shares in joint ventures
belonging to Infrastructure Development. These assets are pledged as collateral when
obtaining outside lending for these joint ventures.
Assets pledged for liabilities
Property mortgages Shares and receivables Total
2007 2006 2007 2006 2007 2006
Own obligations
Liabilities to credit
institutions 0.1 0.1 0.1 0.1
Other liabilities 47.2 42.6 47.2 42.6
Total own obligations 0.1 0.1 47.2 42.6 47.3 42.7
Other obligations 0.4 0.4 150.0 148.6 150.4 149.1
Total 0.5 0.6 197.2 191.2 197.7 191.8

Skanska Review of 2007 Notes, including accounting and valuation principles 121
Note 34 Effect of changes in foreign exchange rates
Exchange rate at balance sheet date Change in percent
Currency Country/zone 2007 2006 2005 2006–2007 2005–2006
ARS Argentina 0.2163 0.2472 0.2792 –12 –11
CZK Czech Republic 0.0376 0.0364 0.0345 3 6
DKK Denmark 0.1309 0.1342 0.1341 –2 0
GBP United Kingdom 1.3599 1.4897 1.4555 –9 2
NOK Norway 0.1253 0.1213 0.1250 3 –3
PLN Poland 0.2776 0.2608 0.2589 6 1
SEK Sweden 0.1058 0.1106 0.1065 –4 4
USD United States 0.6802 0.7588 0.8451 –10 –10
Average exchange rate Change in percent
Currency Country/zone 2007 2006 2005 2006–2007 2005–2006
ARS Argentina 0.2346 0.2588 0.2754 –9 –6
CZK Czech Republic 0.0361 0.0353 0.0336 2 5
DKK Denmark 0.1343 0.1340 0.1341 0 0
GBP United Kingdom 1.4615 1.4666 1.4621 0 0
NOK Norway 0.1247 0.1243 0.1249 0 0
PLN Poland 0.2646 0.2569 0.2489 3 3
SEK Sweden 0.1081 0.1081 0.1077 0 0
USD United States 0.7305 0.7971 0.8041 –8 –1
Effect of changes in exchange rates on the income statement compared to the previous yearIn the following table, the 2007 income statement is translated at the exchange rates prevailing in 2006. The 2006 income statement
is translated at 2005 exchange rates. The change, or currency rate effect, for each currency is stated in EUR M and in percent.
Currency rate effect by respective currency
2007 SEK USD GBP NOK CZK PLN Others Total
Revenue 0.7 –375.5 –6.7 5.2 27.1 24.9 –17.1 –341.4
Operating income 0.0 –7.9 –0.1 0.2 1.3 1.2 –0.9 –6.2
Income after financial items 0.0 –9.5 –0.2 0.3 1.3 1.3 0.2 –6.6
Profit for the year 0.0 –5.4 –0.1 0.2 0.9 1.1 0.8 –2.5
2006 USD EUR GBP NOK CZK PLN Others Total
Revenue 8.6 –35.6 4.2 –5.8 61.2 23.0 3.3 58.9
Operating income 0.7 –0.7 0.1 –0.3 2.1 0.9 –1.5 1.3
Income after financial items 0.7 –0.8 0.2 –0.3 2.0 1.1 –1.5 1.4
Profit for the year 0.6 –0.5 0.1 –0.2 1.4 0.9 –1.1 1.2
Income statement Income statement Currency rate effect, EUR M Currency rate effect, percent
2007, at 2006 rates 1 2007
2006, at2005 rates 2 2006 2007 2006 2007 2006
Revenue 15,343.1 15,001.7 13,515.4 13,574.3 –341.4 58.9 –2.2% 0.4%
Operating income 590.6 584.4 513.3 514.6 –6.2 1.3 –1.0% 0.3%
Income after financial items 619.2 612.6 537.3 538.7 –6.6 1.4 –1.1% 0.3%
Profit for the year 448.0 445.5 393.8 395.0 –2.5 1.2 –0.6% 0.3%
1 2007 figures translated to the exchange rates prevailing in 2006.2 2006 figures translated to the exchange rates prevailing in 2005.
Exchange rates are dealt with in compliance with IAS 21, “The Effect of Changes in Foreign Exchange Rates.” See “Accounting and valuation principles,” Note 1.
Exchange ratesDuring 2007 USD, GBP, ARS and SEK weakened against the euro. Other currencies used in the Group, mainly NOK, PLN and CZK, strengthened against
the euro, primarily late in the year. This had an impact on the balance sheet but only to a minor extent in the income statement.
The weakening of USD had an impact on the Group’s income statement, causing the total currency rate effect to be negative in the consolidated financial
statements.
The weakening of GBP occurred only late in the year and never affected the average exchange rate during the year, with the result that its impact
on the income statement was negligible. The effect in the balance sheet, however, was to decrease total assets by EUR 0.11 billion.

122 Notes, including accounting and valuation principles Skanska Review of 2007
Note 34 Continued
EUR billion +/–10%of which USD
+/–10%
Revenue +/–1.38 +/–0.41
Operating income +/–0.05 +/–0.01
Equity 1 +/–0.19 +/–0.02
1 Refers to amount before currency hedging.
“Plus” means a weakening of the Euro. “Plus” for USD thus means increased value
against EUR.
Effect on the Group of change in EUR against other currencies and change in USD against EURThe following sensitivity analysis, based on the 2007 income statement and balance
sheet, shows the sensitivity of the Group to a unilateral 10 percent change in EUR
against all currencies as well as a unilateral 10 percent change in USD against EUR.
Effects of changes in exchange rates on the balance sheet compared to the previous year
EUR billion 2007 2006
Assets
Property, plant and equipment –0.02 –0.01
Intangible assets –0.01 0.00
Shares and participations 0.00 –0.02
Interest-bearing receivables –0.06 0.00
Current-asset properties –0.03 0.03
Non-interest-bearing receivables –0.13 –0.07
Cash and cash equivalents –0.08 0.01
Total –0.33 –0.06
Equity and liabilities
Equity attributable to equity holders –0.03 0.01
Minority 0.00 0.00
Interest-bearing liabilities –0.08 –0.02
Non-interest-bearing liabilities –0.22 –0.05
Total –0.33 –0.06
Effect of exchange rate differences on theGroup’s interest-bearing net receivable –0.06 0.03
Of the total exchange rate difference on the Group’s assets, EUR -0.20 billion was due
to USD, EUR -0.12 billion to SEK, EUR -0.11 billion to GBP, EUR +0.04 billion to NOK,
EUR +0.03 billion to CZK and EUR +0.03 billion to PLN. Of the total effect in 2006,
EUR -0.17 billion was due to USD, EUR -0.03 billion to NOK, EUR +0.10 billion to SEK,
EUR +0.04 billion to CZK, EUR +0.03 billion to GBP and EUR -0.03 billion to CLP.

Skanska Review of 2007 Notes, including accounting and valuation principles 123
Note 34 Continued
Consolidated balance sheet by currency, EUR billion
2007 USD GBP EUR NOK CZK PLN DKK
Other foreigncurrencies 1
Hedge loans 2 SEK Total
Assets
Property. plant and equipment 0.12 0.03 0.03 0.06 0.15 0.04 0.01 0.05 0.14 0.63
Intangible assets 0.03 0.21 0.04 0.16 0.05 0.00 0.00 0.04 0.01 0.55
Shares and participations 0.00 0.03 0.02 0.01 0.00 0.00 0.00 0.13 0.02 0.21
Interest-bearing receivables 0.29 0.43 0.30 0.33 0.23 0.24 0.14 –1.59 0.18 0.55
Current-asset properties 0.00 0.00 0.29 0.16 0.06 0.00 0.15 0.02 0.72 1.40
Non-interest-bearing receivables 0.95 0.41 0.17 0.44 0.31 0.20 0.06 0.32 0.63 3.50
Cash and cash equivalents 0.34 0.01 0.00 0.02 0.05 0.00 0.00 0.03 1.05 1.50
Total 1.73 1.13 0.85 1.19 0.86 0.49 0.36 –0.99 2.75 8.35
Equity and liabilities
Equity attributable to equity holders 3 0.37 0.11 0.52 0.36 0.30 0.13 0.11 0.20 0.08 2.17
Minority 0.00 0.00 0.01 0.00 0.01 0.00 0.00 0.00 0.00 0.02
Interest-bearing liabilities 0.02 0.19 0.04 0.07 0.04 0.04 0.13 –1.51 0.24 1.24 0.51
Non-interest-bearing liabilities 1.33 0.84 0.28 0.75 0.51 0.32 0.13 0.32 1.19 5.65
Total 1.73 1.13 0.85 1.19 0.86 0.49 0.36 –0.99 0.24 2.51 8.35
2006 USD GBP EUR NOK CZK PLN DKK
Other foreigncurrencies 1
Hedgeloans 2 SEK Total
Assets
Property, plant and equipment 0.12 0.03 0.03 0.04 0.14 0.03 0.02 0.04 0.13 0.61
Intangible assets 0.04 0.23 0.04 0.15 0.06 0.00 0.00 0.03 0.01 0.58
Shares and participations 0.00 0.04 0.02 0.01 0.00 0.00 0.00 0.14 –0.01 0.21
Interest-bearing receivables 0.18 0.31 0.32 0.25 0.20 0.21 0.14 –1.40 0.29 0.50
Current-asset properties 0.00 0.00 0.22 0.11 0.06 0.00 0.15 0.03 0.73 1.31
Non-interest-bearing receivables 0.90 0.48 0.20 0.40 0.36 0.18 0.11 0.25 0.60 3.47
Cash and cash equivalents 0.24 0.00 0.00 0.01 0.00 0.02 0.00 0.03 0.91 1.22
Total 1.48 1.09 0.84 0.98 0.82 0.44 0.43 -0.86 2.65 7.89
Equity and liabilities
Equity attributable to equity holders 3 0.35 0.10 0.49 0.29 0.25 0.09 0.10 0.23 0.22 2.12
Minority 0.00 0.00 0.01 0.00 0.01 0.00 0.00 –0.01 0.00 0.01
Interest-bearing liabilities 0.02 0.20 0.04 0.11 0.06 0.06 0.13 –1.27 0.19 1.03 0.56
Non-interest-bearing liabilities 1.11 0.80 0.30 0.59 0.50 0.30 0.20 0.19 1.22 5.19
Total 1.48 1.09 0.84 0.98 0.82 0.44 0.43 –0.86 0.19 2.47 7.89
1 Including elimination of intra-Group receivables and liabilities.2 Aside from hedge loans in EUR. USD. GBP and NOK (EUR and GBP). Skanska hedged equity in currencies other than SEK forward contracts.
which meant that equity in each respective currency amounted to EUR 0.53 billion (0.56) in USD (0.24). EUR (0.14). CLP (0.09) and BRL (0.06).3 The respective currencies are calculated including Group goodwill and the net amount of Group surpluses after subtracting deferred taxes.
Other mattersFor information on the translation reserve in equity on January 1 and December 31, which is recognized directly in equity, see Note 26, “Equity.”

124 Notes, including accounting and valuation principles Skanska Review of 2007
Note 35 Cash flow statement
Information about assets and liabilities in divested Group companies
2007 2006
Assets
Property, plant and equipment –6.7 –4.3
Intangible assets –3.6
Shares and participations –0.1
Interest-bearing receivables –0.5 0.0
Current-asset properties –0.4 –16.6
Non-interest-bearing receivables –1.6 –17.8
Cash and cash equivalents 0.0 –1.5
Total –9.4 –43.9
Equity and liabilities
Income from divestments of Group companies –0.1 –6.8
Minority –0.4
Interest-bearing liabilities –2.5
Non-interest-bearing liabilities 11.5 –17.5
Total 11.4 –27.2
Purchase price paid 20,8 16,6
Cash and cash equivalents in divested companies 0,0 –1,5
Effect on cash and cash equivalents, divestment 20,8 15,1
Information on interest and dividends
2007 2006
Interest income received during the year 66.5 42.9
Interest payments made during the year –27.5 –8.2
Dividends received during the year 20.1 10.7
2007 2006
Cash 1,448.6 977.5
Cash equivalents 55.1 235.7
Total 1,503.8 1,213.2
Information about assets and liabilities in acquired Group companies2007 2006
Assets
Property, plant and equipment 2.1 6.4
Intangible assets 5.5 71.5
Non-interest-bearing receivables 8.0 67.4
Interest-bearing receivables 1.1 5.1
Current-asset properties 0.4
Cash and cash equivalents 1.3
Total 17.1 151.7
Liabilities
Minority –0.5 –1.2
Interest-bearing liabilities 0.1 5.1
Non-interest-bearing liabilities 9.5 72.7
Total 9.1 76.6
Purchase price paid –8.0 –75.1
Cash and cash equivalents in acquired companies 0.0 1.3
Effect on cash and cash equivalents, investment –8.0 –73.8
Acquired Group companies are described in Note 7, “Business combination.”
Adjustments for items not included in cash flow
2007 2006
Depreciation/amortization and impairment losses/reversals of impairment losses 145.7 134.8
Income from divestments of property. plant and equipment and current-asset properties –291.9 –286.5
Income after financial items from joint ventures and associated companies –31.0 –25.8
Dividends from joint ventures and associated companies 20.1 10.7
Provision for the year. intra-Group profits on contracting work 10.6 17.0
Pensions recognized as expenses but not related to payments 24.8 9.4
Other items that have not affected cash flow from operating activities 0.6 2.2
Total –121.1 –138.3
Taxes paid
Taxes paid are divided into operating activities, investing activities and financing activities.
Total taxes paid for the Group during the year amounted to EUR –129.4 M (–115.3).
Cash and cash equivalentsCash and cash equivalents in the cash flow statement consist of cash plus cash
equivalents. The definition of cash and cash equivalents in the balance sheet can be
seen in Note 1, “Accounting and valuation principles.”
The same rule that has been used in determining cash and cash equivalents in the
balance sheet has been used in determining cash and cash equivalents according to the
cash flow statement. Only amounts that can be used without restrictions are recognized
as cash and cash equivalents.
Aside from the cash flow statement prepared in compliance with IAS 7, “Cash Flow
Statements,” Skanska is preparing a cash flow statement based on the operations car-
ried out by the respective business streams. This is called the “Consolidated operating
cash flow statement.” The connection between the respective cash flow statements is
explained below.
Divestments of Group companies in 2007 almost exclusively involved the discontinua-
tion of portions of Skanska’s Danish operations.
Other divestments were attributable to two small phase-outs, one in Finland and one
in Russia.
The income in 2006 originated from the divestment of a portion of Russian opera-
tions as well as the divestment of small operations in Sweden and Norway.
Other mattersThe Group’s unutilized credit facilities amounted to EUR 774.5 M (694.1) at year-end.

Skanska Review of 2007 Notes, including accounting and valuation principles 125
Note 35 Continued
2007 2006
Cash flow from business operations according to operating cash flow statement 839.6 251.4
less investments in property, plant and equipment and intangible assets 140.1 147.1
less tax payments on property, plant and equipment and intangible assets divested 3.9 3.2
Cash flow from operating activities 983.6 401.7
Cash flow from strategic investments according to operating cash flow statement 10.9 –57.5
Net investments in property, plant and equipment and intangible assets –140.1 –147.1
Increase and decrease in interest-bearing receivables –131.3 –138.0
Taxes paid on property, plant and equipment and intan-gible assets divested –3.9 –3.2
Cash flow from investing activities –264.4 –345.8
Cash flow from financing operations according tooperating cash flow statement 13.0 6.8
Increase and decrease in interest-bearing liabilities –38.5 –22.8
Dividend etc. –373.8 –293.1
Cash flow from financing activities –399.3 –309.1
Cash flow for the year 319.9 –253.2
2007 2006
Operations − Investments
Intangible assets –4.1 –4.1
Property, plant and equipment –204.7 –186.8
Assets in Infrastructure Development –7.9 –30.9
Shares –4.3 –0.3
Current-asset properties –830.5 –763.4
of which Residential Development –538.6 –556.9
of which Commercial Development –255.3 –177.1
of which other commercial properties –36.5 –29.4
–1,051.6 –985.5
Operations − Divestments
Intangible assets 0.2 0.2
Property, plant and equipment 54.8 53.6
Assets in Infrastructure Development 19.2 20.8
Shares 6.7 0.4
Current-asset properties 958.2 844.2
of which Residential Development 583.0 481.5
of which Commercial Development 302.2 320.5
of which other commercial properties 73.0 42.1
1,039.1 919.2
Net investments in operations –12.4 –66.4
Strategic investments
Acquisitions of businesses –8.0 –73.8
–8.0 –73.8
Strategic divestments
Divestments of businesses 20.8 15.1
Shares 0.0 1.2
20.8 16.3
Net strategic investments 12.8 –57.5
Total investments 0.3 –123.9
2007 2006
Net investments in operating activities 159.2 124.8
Net investments in investing activities –127.3 –204.6
31.9 –79.8
less cash flow adjustments, net investments –31.6 –44.1
Total net investments 0.3 –123.9
The consolidated operating cash flow statement recognizes net investments divided
into net investments in operations and strategic net investments as follows.
Relation between the Group’s investments in the cash flow statement and investments in the operating cash flow statement
Total net investments are recognized in the cash flow statement divided into operating
activities and investing activities, taking into account the settlement of payments for
investments and divestments.
Purchases and divestments of current-asset properties are recognized under operat-
ing activities, while other net investments are recognized under investing activities.
Relation between consolidated operating cash flow and consolidated cash flow statement
The difference between the consolidated operating cash flow statement and the con-
solidated cash flow statement in compliance with IAS 7, “Cash Flow Statements,”
is presented below.
The consolidated cash flow statement that was prepared in compliance with IAS 7
recognizes cash flow divided into:
Cash flow from operating activities
Cash flow from investing activities
Cash flow from financing activities
The consolidated operating cash flow statement recognizes cash flow divided into:
Cash flow from business operations
Cash flow from financing operations
Cash flow from strategic investments
Dividend etc.
Change in interest-bearing receivables and liabilities
The consolidated operating cash flow statement refers to operating activities as “busi-
ness operations.” Unlike the cash flow statement in compliance with IAS 7, “business
operations” also includes net investments, which are regarded as an element of busi-
ness operations together with tax payments on these. Such net investments are net
investments in property, plant and equipment and intangible non-current assets as well
as net investments in Infrastructure Development.
Investments of a strategic nature are recognized under cash flow from strategic
investments.
Under cash flow from financing activities, the operating cash flow statement recog-
nizes only interest and other financial items as well as taxes paid on the same. Dividends
are recognized separately. Loans provided and repayment of loans are also recognized
separately along with changes in interest-bearing receivables at the bottom of the oper-
ating cash flow statement, resulting in a subtotal in that statement that shows cash flow
before changes in interest-bearing receivables and liabilities.

126 Notes, including accounting and valuation principles Skanska Review of 2007
Note 36 Personnel
Wages, salaries, other remuneration and social insurance contributions
2007 2006
Wages, salaries and other remuneration
Board members, Presidents, Executive Vice Presidents and other executive team members 1 58.3 45.0
of which bonuses 25.2 14.8
Other employees 2,086.2 1,849.8
Total wages, salaries and other remuneration 2,144.4 1,894.7
Social insurance contributions 550.4 521.9
of which pension expenses 147.0 124.0
1 The amount related to Board members, Presidents, Executive Vice Presidents and other executive team members included remuneration to former Board members, Presidents and Executive Vice Presidents during the financial year.
Average number of employees
Personnel is calculated as the average number of employees.
See “Accounting and valuation principles,” Note 1.
2007 2006
Sweden 10,963 10,631
Norway 4,779 4,395
Denmark 1,460 1,733
Finland 3,212 3,136
United Kingdom 5,451 3,685
Poland 5,399 4,776
Czech Republic 5,998 6,242
Slovakia 1,128 1,020
United States 7,952 7,808
Argentina 4,817 4,386
Brazil 4,509 3,516
Peru 1,887 1,527
Other countries 2,880 3,230
Total 60,435 56,085Of the Group’s total pension expenses, EUR 8.0 M (7.6) was related to the category
“Board members, Presidents, Executive Vice Presidents and other executive team mem-
bers.” The amount included remuneration to former Board members, Presidents and
Executive Vice Presidents.
The expense for a provision to the employee profit-sharing foundation in Sweden
totaled EUR 21.8 M (16.5).
Other mattersNo loans, assets pledged or contingent liabilities have been provided on behalf of any
Board member or President in the Group.

Skanska Review of 2007 Notes, including accounting and valuation principles 127
Note 37 Remuneration to senior executives and Board members
Targets for variable salary elements
Measure of earnings Starting point “Outperform” Outcome Fulfillment level
Construction Operating margin 2.4% 3.3% 3.4% 100%
Residential Development Operating margin 8.6% 10.0% 9.4% 57%
ROCE 14.3% 18.0% 14.9% 16%
Commercial Development ROCE 1 3.9% 9.6% 16.0% 100%
Infrastructure Development ROCE 2 10.0% 20.0% 58% 100%
Group target, SEK M Operating income 3 3,132 4,128 5,491 100%
Corresponding to EUR M 331.5 436.9 581.1 100%
1 Return on capital employed (ROCE), including unrealized development gains and changes in market value. The “Outperform” targets for a given year are related to an ROCE measure over a 9-year economic cycle, which in 2007 amounts to 15 percent. The outcome over this period is 16 percent. Targets and outcomes according to the 9-year economic cycle are not shown in the above table.
2 Return on capital employed (ROCE), including unrealized development gains and changes in market value but excluding effects of changes in currencies and long-term market interest rates. 3 Outcome in SEK is calculated excluding currency rate effects. The figures shown in SEK are calculated using outcome in local currency with exchange rates on September 30, 2006, which were used in
calculating targets. The Outperform target at Group level is 90 percent of the total Outperform targets of the business streams. Corresponding figures in euros are calculated using the exchange rate on December 31, 2007.
This note is based on the composition of the Senior Executive Team on December 31,
2007. At the Annual Shareholders’ Meeting on April 3, 2008, Stuart Graham stepped
down as President and CEO and was succeeded by Johan Karlström.
A Preparation and decision-making processes Principles for remuneration to senior executives are established annually by the
Annual Shareholders’ Meeting. The salary and other benefits of the President and
CEO are established by the Board of Skanska AB, following recommendations from
the Board’s Compensation Committee based on the decision of the Annual Meeting.
The Committee sets limits on the salaries, bonuses and other benefits of Executive
Vice Presidents, heads of Group staff units and heads of business units.
During 2007, from the statutory Board meeting in April and onward, the Com-
pensation Committee consisted of Sverker Martin-Löf, Chairman of the Board; and
Cart Källströmer and Lars Pettersson, Board members. The Compensation Committee
met five times during the year.
The Annual Shareholders’ Meeting approves the total amount of directors’ fees for
members of the Board, following a recommendation from the Nomination Committee.
B1 Principles for remuneration to the Senior Executive Team The Senior Executive Team includes the President and Executive Vice Presidents of
Skanska AB. The Team consisted of seven persons during 2007.
Principles for salary and other remuneration to senior executives, approved by the Annual Shareholders’ Meeting in 2007 Remuneration to the CEO and other senior executives shall consist of fixed salary, vari-
able remuneration if any, other customary benefits and pension. The other senior execu-
tives include the CFO and other Executive Vice Presidents. The combined remuneration
for each executive must be competitive in the labor market in which the executive is
active, and distinguished performance shall be reflected in the total remuneration.
Fixed salary and variable remuneration shall be related to the senior executive’s respon-
sibility and authority. The variable remuneration shall be payable in cash
and/or shares and it shall be capped and related to the fixed salary. Distribution of shares
shall have a vesting period of three years and be part of a long-term incentive program.
The variable remuneration must be based on results in relation to targets and must be
aligned with the interests of the shareholders.
In case of employment termination, the normal period of notice is six months. Sever-
ance pay may correspond to a maximum of 24 months of fixed salary, with the exception
of the CEO, to whom a maximum of 30 months of severance pay is payable.
Pension benefits should be either defined-benefit or defined-contribution schemes,
or a combination of these, and should entitle the executive to the right to receive a pen-
sion from the age of 65. However, a pension age of earliest 60 years may be granted
under special circumstances. For defined-benefit plans, years of service required for fully
earned benefits shall normally correspond to the years of service required for general
pension plans in the same jurisdiction. Variable salary shall not be included in pension-
able salary except when it follows from the rules under a general pension plan (like
Sweden’s ITP plan).
The Board of Directors may under special circumstances deviate from these principles
in individual cases. Matters related to remuneration to senior executives are decided by
the Compensation Committee and, when it comes to the CEO, are decided by the Board
of Directors.
B2 Targets and performance related to variable salary elements Variable salary elements may consist of two parts: variable salary, which is cash-based,
and the share incentive program (“Share Award Plan”), which provides compensation
in the form of shares. The Share Award Plan is presented under section E of this note.
Section F describes the new long-term Employee Ownership Program. The Outperform
targets stated below are common to both parts of variable salary, while “starting point”
is only relevant to annual variable salary. The connection between annual variable salary
and the Outperform targets means that under the new three-year business plan, the
Board of Directors will establish stepwise Outperform targets, moving toward the 2010
targets, which have been published by the Company. The table below presents, by busi-
ness stream, what starting point for each Outperform target was decided for 2007.
In addition to the above financial performance factors, each person in the Senior Execu-
tive Team has non-financial targets that may reduce final outcome. These non-financial
targets concern health and safety, the environment, business ethics and management
development. A reduction occurs if, depending on the target, the person has not shown
clear improvements or if any deviation has occurred (for example the environment,
where the target is not to have any environmental incidents).
For the President and CEO, the target has been the same as the operating income
of the Group according to the above table. The President and CEO has also had non-
financial targets. The 50 percent maximum variable salary of the President and CEO
(i.e. excluding the Share Award Program) was earned in full, based on the financial
target, but was reduced by 4 percentage points because one non-financial target was
only partially met. The outcome for the President and CEO was thus 46 percent of fixed
salary.
For the other members of the Senior Executive Team, annual variable salary is either
100 percent tied to the Group target and/or to the business units they are directly respon-
sible for. The non-financial targets are related to the business units certain individuals in
the Senior Executive Team are responsible for. The outcome for the other members of the
Senior Executive Team averaged 87 percent fulfillment of financial targets and 84 percent
after subtracting for non-financial targets.

128 Notes, including accounting and valuation principles Skanska Review of 2007
Note 37 Continued
C Benefits to the Board and Senior Executive Team
Remuneration and benefits recognized as expenses 2007
EUR thousandDirector’s fee/ basic
salary Variable salary1
Allocated valueof Share
Award Plan2 Other
benefits Pension expense Total
Chairman of the BoardSverker Martin-Löf 164.8 164.8
Other Board members
Finn Jonsson 54.0 54.0
Curt Källströmer 51.3 51.3
Anders Nyrén 67.6 67.6
Lars Pettersson 51.3 51.3
Matti Sundberg 59.5 59.5
Jane Garvey 45.9 45.9
Sir Adrian Montague 59.5 59.5
Board 554.0 554.0
President and CEOStuart Graham 1,003.4 405.1 243.0 193.8 453.6 2,298.9
Other senior executives (6 persons) 2,512.7 2,015.1 607.7 198.8 1,550.9 6,885.2
Total 4,070.0 2,420.3 850.7 392.6 2,004.4 9,738.1
1 Variable salary element including the incentive program related to the 2007 financial year will be finally fixed and disbursed after a follow-up of the outcome in the first quarter of 2008. The amounts included under the heading “Variable salary element” in the above table refer to the 2007 financial year. During 2007, variable salary elements attributable to the 2006 financial year were paid in the amount of EUR 1,979,400 of which EUR 343,600 was related to the President and CEO. The amount was recognized as an expense in 2006 and is not included in the above table.
2 The value stated refers to the full allotment for 2007. In order to receive shares, an additional three years of service are required. The fraction of allocated value recognized as an expense during 2007 was 4/16. During 2007, share awards attributable to the 2006 financial year were allocated in a total value of EUR 702,600, of which EUR 202,200 was related to the President and CEO. This amount is not included in the above table.
All remuneration and benefits were charged to Skanska AB, except EUR 356,600 to
Stuart Graham and EUR 221,200 to other members of the Senior Executive Team, which
were charged to other Group companies.
In 2007, outstanding pension obligations to Presidents and CEOs including for-
mer Presidents and CEOs amounted to EUR 10,389,100. Outstanding obligations
to other current and former members of the Senior Executive Team amounted to
EUR 11,002,300. For Board members appointed by the employees, no disclosures are
made concerning salaries and remuneration as well as pensions, since they do not
receive these in their capacity as Board members. For Board members who previously,
before the beginning of the financial year, were employees of the Company, disclosures
are made concerning pension obligations in their former role as employees.
C1 Directors’ fees The 2007 Annual Shareholders’ Meeting decided that fees would be paid to those
members of the Board of Directors who are not employed by the Company, totaling
EUR 459,400, plus a special appropriation for committee work. The Annual Meeting
decided that the fee to the Chairman of the Board shall amount to EUR 137,800. The
Annual Meeting also decided that the members elected by the Annual Meeting shall
receive EUR 45,900 each and that the special appropriation for committee work shall
be paid to each committee member elected by the Annual Meeting, in the amount of
EUR 13 ,500 for serving on the Project Review Committee, EUR 8,100 for serving on the
Audit Committee and EUR 5,400 for serving on the Compensation Committee.
C2 Chairman of the Board During 2007 the Chairman of the Board, Sverker Martin-Löf, received a director’s fee of
EUR 137,800 and EUR 27,000 related to committee work, altogether EUR 164,800.
C3 Members of the Board Other members of the Board did not receive any remuneration beyond their regular
directors’ fees and remuneration for committee work.
C4 The President and CEO During 2006 the President and CEO, Stuart Graham, received a salary, fees and other
remuneration from Group companies in the amount of EUR 1,003,400 plus a variable
salary element of EUR 405,100 based on financial targets achieved, which was equiva-
lent to 46 percent target fulfillment. The variable salary element may amount to a maxi-
mum of 50 percent of his fixed annual salary. In addition, the President and CEO is
included in the Group’s 2007 share incentive program, with an allocation of share
awards, defined under section E of this note, amounting to about 27 percent of his fixed
salary, where 30 percent is the maximum possible allocation. The variable salary ele-
ment plus the outcome of the share incentive program for the 2007 financial year will be
finally fixed and disbursed after a follow-up of outcome during the first quarter of 2008.
During 2007 the President and CEO was entitled to a free residence in Sweden. In 2007
the Company compensated him for his residence in the amount of EUR 142,000 . The
President and CEO resided in Stockholm during 2007. In December 2007 the President
and CEO sold to Skanska AB the cooperative ownership right that was acquired when he
moved to Sweden. The sale occurred without a profit.
The President and CEO has had so-called expert tax status, which ceased in Sep-
tember 2005. Because of this, during 2005 an agreement was reached on special
compensation amounting to a total of no more than EUR 1,124,200 with disbursement
allocated over a future three-year period. Neither variable salary elements nor pension
are affected by this.
The President and CEO is entitled to a pension from age 62 at the earliest. Full pension
will be received at age 65. The total pension amounts to USD 500,000 (corresponding to
about EUR 340,000) including his share of Skanska USA’s general pension plan. His pension
entitlement has been indexed from the beginning of his employment in 2002 to an Ameri-
can inflation index, but with annual index increase limited to a maximum of 3 percent. This
is a defined-benefit pension, and the expense during the year amounted to EUR 453,600.
The pension entitlement is earned on a straight-line basis during his employment period
and will be disbursed during the remainder of his life. The pension is conditional upon
future employment.
In addition, the President and CEO will receive a nonrecurring amount of
USD 180,000 (corresponding to about EUR 122,000) at age 65. This amount was vested
earlier in the United States and was reported as an expense during prior years.
In case of termination by the Company, the President and CEO is entitled to his salary
and other employment benefits during a six month notice period, then 30 months of
severance payments equivalent to his fixed salary on the date of termination.
C5 New President and CEOOn the day of the Annual General Meeting in 2008, Johan Karlström became the new
President and CEO. His fixed annual salary amounts to USD 1,400,300. His variable sala-
ry element may total a maximum of 50 percent of fixed annual salary. His participation
in Skanska’s long-term share ownership program will occur under the same conditions
as other high-level managers in the Skanska Group.For further information, see the
Report of the Directors. The President and CEO will be eligible for a pension from age 60
at the earliest. Annual pension provisions will total 40 percent of fixed annual
salary. A mutual notice period of 24 months will apply, with retention of fixed salary and
benefits excluding bonuses. No severance pay will be disbursed in case of termination.

Skanska Review of 2007 Notes, including accounting and valuation principles 129
Note 37 Continued
D Other members of the Senior Executive Team
During 2007, the other members of the Senior Executive Team totaled six persons. Mem-
bers of the Senior Executive Team received a fixed salary and a variable salary element
based on the Group’s earnings. In addition, senior executives of Skanska were covered by
the Group’s 2007 share incentive program, with an allocation of share awards, defined
under section E of this note, amounting to about 27 percent of their fixed salary. The vari-
able salary element plus the outcome of the Share Award Plan for the 2007 financial year
will be finally fixed and disbursed after a follow-up of the outcome during the first quarter
of 2008.
D1 Pension benefits Members of the Senior Executive Team are normally entitled to pension benefits according
to defined-benefit pension systems. Premium-based pension packages occur in exceptional
cases and, in terms of cost, are mainly equivalent to the ITP occupational pension plan. The
retirement age for members of the Senior Executive Team is 60–65 years. The ITP plan is a
defined-benefit plan and guarantees a lifetime pension from age 65. The pension amount
is a certain percentage of final salary and the service period to qualify for a full pension is
30 years. The pension entitlement is 10 percent for portions of salary up to EUR 37,200 per
year (7.5 base amounts as defined by Swedish social insurance rules), 65 percent for portions
of salary between EUR 37,200 and EUR 99,200 (20 base amounts) and 32.5 percent for por-
tions of salary up to EUR 148,800 (30 base amounts).
In addition, this group is covered by a supplementary pension entitlement for por-
tions of salary exceeding 30 base amounts. This is a defined-contribution pension
entitlement and the premium is 20 percent of pensionable salary exceeding 30 base
amounts.
D2 Notice periods etc. In case of termination by the Company, notice periods range from six months to twelve
months. Salary and other remuneration are disbursed without reduction during the notice
period. After the notice period, severance pay is disbursed for 12–18 months. When pay-
ments are disbursed after the notice period, other income must normally be subtracted
from the amount payable.
E Skanska Share Award Plan Skanska’s 2005 Annual Meeting decided to introduce a share incentive program (the
Skanska Share Award Plan, or “the Plan”) for executive officers and other key employees
of the Skanska Group. The Plan comprises up to 300 employees in the Group, including
the President and CEO, the Chief Financial Officer, the Executive Vice Presidents, other
members of the Senior Executive Team and staff units, the Presidents of business units
and their executive teams.
The Plan means that employees have been offered the opportunity to be granted
“share awards” entitling the holder to receive Series B shares in the Company free of
charge, provided that certain targets are met. The maximum yearly allocation for each
participant is equivalent to 30 percent of the value of the participant’s annual base salary
in Series B shares, based on their average market price during the two-week period start-
ing one week after the publication of the Year-end Report. Each participant’s allocation
of share awards is dependent upon the fulfillment of a number of established earnings-
and performance-related conditions, which are based on the “Outperform” targets
approved by the Board of Directors. The “Outperform” targets consist of (i) financial
targets at the Group level as well as at the business unit level and (ii) non-financial tar-
gets attributable to the respective business unit, including improvements in health and
safety, environment, business ethics and management development. In order to receive
the shares, three years of employment are required after the end of the measurement
period.
The “Outperform” targets for 2007 were adopted by Skanska’s Board of Directors in
2006 and are shown in section B2 of this note. The published “Outperform” targets for
2007 are intended to correspond to the “Outperform” targets for the Plan. Based on
the achievement of these targets, the number of share awards to be allocated will be
determined after the close of each financial year. If the financial “Outperform” targets
are achieved, the allocation of share awards may still be reduced by up to a half, to the
extent that the non-financial targets are not met.
The Group’s financial “Outperform” targets are the sum of the financial “Outper-
form” targets for each business unit. In order for an employee in a business unit to
receive an allocation, the requirement is for the business unit to achieve its financial
“Outperform” targets. For an employee at Group level to receive an allocation, the
requirement is that the Group achieves 90 percent of the level of the Group’s financial
“Outperform” target.
Furthermore, there are two other conditions which must be met in order for any allocation
to be made under the Plan. These are both closely tied to Skanska’s consolidated earnings:
(i) that Skanska’s dividend capacity is intact and (ii) that consolidated operating income
must exceed certain thresholds that have been approved by the Board of Directors. The
threshold for 2007 was equivalent to the starting point for the Group target, i.e. EUR 338.6 M.
The outcome of the Plan for 2007 is estimated to be that 169 individuals have
received share awards with a total value of about EUR 7,100,000. In addition, the Com-
pany will be charged the related social insurance expenses. The average allocation, in
relation to fixed annual salary, to the group of employees encompassed by the Plan is
about 18 percent.
The principles for recognition of the costs of the Plan are presented in “Accounting
and valuation principles,” Note 1, and comply with IFRS 2, “Share-based Payment.”
Skanska Share Award Plan, 2005–2007
Share awards allocated 1Number of
share awards
Outstanding, January 1
2005 allocation 374,140
2006 allocation 2 451,977
Total outstanding 826,117
Forfeited/expired during the period –122,241
Allocation related to 2007
during the year 3 540,984
Total outstanding at year-end 1,244,860
Employee-related expenses for Share Awards 2
Total preliminary cost for the Plan 17.7
Recognized as expense, January 1 –4.2
Cost during the year –4.2
Total recognized as expense, December 31 –8.4
Exchange rate differences 0.1
Remaining to be recognized as expense through 2011 9.3
of which expense to be recognized in
2008 4.3
2009 3.4
2010 1.6
Total 9.3
Dilution, 2007 %
Share awards earned through 2007, totaling 527,392 0.13
Maximum dilution at end of Plan period, 1,244,860 0.3
1 In compliance with IFRS 2, “Share-based Payment.”2 Preliminary allocation was established by the Board of Directors in April 2007. 3 Preliminary allocation will be established by the Board of Directors in April 2008.
F1 New long-term employee ownership programIn November 2007, an Extraordinary Shareholders’ Meeting approved the introduction of
a long-term share ownership program for all permanent employees of the Skanska Group.
The program replaces the three-year share incentive program for senor executives
and other key individuals, which the Annual Shareholders’ Meeting in 2005 decided to
introduce and which expired during 2007. The share ownership program also replaces
the Profit-Sharing Foundation for the employees of the Swedish companies in the Skanska
Group and the incentive program for certain employees active in Skanska’s American
operations.
The purpose of the program is to strengthen the Group’s ability to retain and recruit
qualified personnel and to align employees more closely to the Company and its
shareholders.
The program gives employees the opportunity to invest in Skanska shares while
receiving incentives in the form of possible allocation of additional share awards.
This allocation is predominantly performance-based.
For further information, see the Financial Review.
F2 Local incentive programs Salaries and other remuneration are adopted with reference to prevailing conditions in
the rest of the construction industry and customary practices in each local market. The
Skanska Group applies a remuneration model for the affected executives and managers
that consists of a fixed annual salary plus a variable salary element which is based on
financial targets achieved.

130 Notes, including accounting and valuation principles Skanska Review of 2007
Note 38 Fees and other remuneration to auditors
Note 39 Related party disclosures
2007 2006
KPMG
Audit assignments 6.3 5.6
Other audit-related assignments 0.6 0.6
Tax advisory services 1.0 1.0
Total 7.9 7.2
Transactions with joint ventures 2007 2006
Sales to joint ventures 760.0 620.1
Purchases from joint ventures 15.8 9.8
Interest income from joint ventures 0.1
Dividends from joint ventures 20.1 10.7
Receivables from joint ventures 33.5 26.1
Liabilities to joint ventures 0.6 1.5
Contingent liabilities for joint ventures 68.9 74.5
Transactions with associated companies 20071 2006
Sales to associated companies 11.3
Purchases from associated companies 1.6
Receivables from associated companies 2.4
Liabilities to associated companies 0.2
1 During 2007, the Group had no transactions with associated companies.
Skanska’s pension fund directly owns 250,000 Series B shares in Skanska. There is also
an insignificant holding of indirectly owned shares via investments in various mutual
funds.
“Audit assignments” refers to examination of the annual accounts as well as the
administration by the Board of Directors and the President, as well as other tasks that
are incumbent upon the Company’s auditors to perform. “Other audit-related assign-
ments” refers to advisory services related to accounting issues and advisory services
concerning the disposal and acquisition of businesses.
Through its ownership and percentage of voting power, AB Industrivärden has a signifi-
cant influence, as defined in compliance with IAS 24, “Related Party Disclosures.” All
transactions have occurred on market terms.
Skanska sells administrative services to pension funds that manage assets intended to
cover the Group’s pension obligations.
Associated companies and joint ventures are companies related to Skanska. Informa-
tion on transactions with these is presented in the following tables.
Information on remuneration and transactions with senior executives is found in
Note 36, “Personnel,” and Note 37, “Remuneration to senior executives and Board
members.”
Note 40 Leases
Finance leases, carrying amount 2007 2006
Property, plant and equipment
Property 0.5 4.0
Plant and equipment 21.6 16.7
Total 22.1 20.7
Cost 34.7 31.1
Depreciation for the year –5.3 –0.6
Accumulated depreciation, January 1 –7.3 –9.8
Carrying amount 22.1 20.7
Future minimum lease payments
Present value of future minimum
lease payments
Expenses, due dates 2007 2006 2007 2006
Within one year –6.7 –6.1 –5.4 –5.4
Later than one year but within five years –7.4 –7.0 –5.5 –5.4
Later than five years –5.3 –6.2 –4.2 –4.6
Total –19.4 –19.2 –15.1 –15.5
Expenses, due dates 2007 2006
Within one year –44.8 –48.9
Later than one year but within five years –99.5 –106.1
Later than five years –48.0 –61.9
Total –192.3 –216.9
Of this amount, EUR 0.2 M (3.2) was related to properties that were subleased.
Reconciliation, future minimum lease payments and their present value 2007 2006
Future minimum lease payments –19.4 –19.2
Less interest charges 4.2 3.8
Present value of future minimum lease payments –15.1 –15.5
Skanska is a lessee in both finance and operating leases.
When Skanska is a lessee, finance lease assets are recognized as a non-current asset
in the balance sheet, while the future obligation to the lessor is recognized as a liability
in the balance sheet.
As a financial lessor, Skanska recognizes the present value of its claim on the lessee as
a financial receivable.
As an operating lessor, Skanska leases properties to tenants via its Commercial
Development operations.
A. Skanska as a lesseeFinance leases
Leased property plant and equipment including buildings and land (“Property”) as well
as machinery and equipment (“Plant and equipment”) are recognized in the consoli-
dated financial statements as finance leases.
Of the amount in the balance sheet for finance leases, most is related to car leases in
Sweden. Agreements with lease companies in other countries are operating leases.
Variable fees for finance leases included in 2007 income amounted to EUR –0.3 M (–0.4).
No property leased to Skanska has been subleased to others.
Future minimum lease payments and their present value can be seen in the following table.
Operating leases
Most of the amounts for future minimum lease payments are related to leased cars
and office space for operations in the United Kingdom. Also included are site leasehold
agreements, especially in Stockholm.
The Group’s leasing expenses related to operating leases in 2007 amounted to
EUR –66.5 M (–58.4), of which EUR –59.0 M (–53.2) was related to minimum lease pay-
ments and EUR –7.5 M (–5.2) was related to variable payments.
The Group had EUR 0.5 M (0.5) in leasing income related to subleasing on operating
leases.
The due dates of future minimum lease payments for noncancellable operating
leases were distributed as follows:

Skanska Review of 2007 Notes, including accounting and valuation principles 131
Note 41 Events after the balance sheet date
2007 2006
Gross investment in finance leases 1.2 1.4
Unearned financial income –0.1 –0.2
Net investment in finance leases 1.1 1.2
Non-guaranteed residual value belonging to the lessor –0.3 –0.4
Present value of claim related to future minimum lease payments 0.7 0.8
Income, due dates 2007 2006
Within one year 49.8 33.7
Later than one year but within five years 143.7 72.2
Later than five years 77.2 27.8
Total 270.7 133.7
The carrying amount of current-asset properties in Commercial Development totaled
EUR 662.5 M (617.5).
B. Skanska as a lessorFinance leases
Skanska owns a property in Sweden that is leased to a customer under a finance lease.
The present value of the claim related to future minimum lease payments is recog-
nized in the balance sheet as a financial non-current asset. At the balance sheet date,
it amounted to:
Reserves for doubtful receivables related to minimum lease payments amounted to
EUR 0 M (0).
The variable portion of lease payments included in 2007 income amounted to
EUR 0 M (0).
Operating leasesCommercial Development carries out Skanska’s operating lease business. These
properties are recognized as current assets in the balance sheet. For a description
of the Commercial Development business stream, see Note 4, “Segment reporting.”
In 2007, Commercial Development’s lease income amounted to EUR 33.8 M (35.3).
In 2007, the Group’s variable lease income related to operating leases amounted to
EUR 0.9 M (1.2).
The due dates of future minimum lease payments for noncancellable operating leases
were distributed as follows:
The statutory annual report was signed on February 6, 2008 and was adopted by the
Annual Shareholders’ Meeting of Skanska AB on April 3, 2008.
Late in 2007 Skanska signed an agreement to sell its 50 percent holding in the Ponte
de Pedra hydropower plant in Brazil.
The sale price for these shares totals about EUR 110 M, and the gain on the sale is
about EUR 60 M.
The transaction was conditional upon approval by the appropriate public agencies,
which was received during the first quarter of 2008, when the transaction was also rec-
ognized in the financial statements.
At its meeting on February 6, 2008, the Board of Directors of Skanska AB appointed
Johan Karlström as the new President and CEO of Skanska.
He will succeed Stuart Graham, who had previously notified the Board that he is step-
ping down as President and CEO during 2008.
Mr. Karlström assumed his new position on April 3, 2008 in conjunction with the
Annual Shareholders’ Meeting of Skanska.
Note 40 Continued
The due dates of the gross investment and the present value of future minimum lease
payments were distributed as follows:
Gross investment in finance leases
Present value of claims related to future
minimum lease payments
Income, due dates 2007 2006 2007 2006
Within one year 0.3 0.3 0.3 0.2
Later than one year but within five years 0.8 1.1 0.4 0.6
Later than five years 0.0 0.0 0.0 0.0
Total 1.2 1.4 0.7 0.8

132 Notes, including accounting and valuation principles Skanska Review of 2007
Note 42 Consolidated quarterly results
2007 2006
EUR M Q4 Q3 Q2 Q1 Q4 Q3 Q2 Q1
Order bookings 3,933.3 3,276.2 4,323.2 4,323.7 3,750.5 3,102.9 4,735.3 2,935.4
Income
Revenue 4,135.4 3,931.5 3,831.5 3,103.4 3,800.0 3,456.4 3,451.2 2,866.6
Cost of sales –3,734.4 –3,572.2 –3,457.6 –2,835.1 -3,485.1 -3,162.5 -3,072.3 -2,624.2
Gross income 401.0 359.3 373.9 268.2 315.0 293.9 378.9 242.5
Selling and administrative expenses –237.4 –200.1 –231.7 –192.3 –202.3 –194.1 –180.1 –178.4
Income from joint ventures and associated companies 12.7 10.6 11.4 8.8 13.1 13.8 11.3 1.2
Operating income 176.3 169.7 153.5 84.8 125.8 113.6 210.0 65.2
Interest income 23.1 15.9 11.9 17.0 15.8 11.4 8.8 7.9
Interest expenses –6.8 –3.8 –3.1 –4.1 –4.5 –2.5 –1.8 –2.8
Change in fair value –3.0 –2.8 –2.6 –2.8 –3.6 –4.0 –4.4 –0.7
Other financial items –3.7 –1.6 –3.0 –2.2 –0.1 –0.1 2.9 1.8
Net financial items 9.6 7.7 3.1 7.8 7.6 4.8 5.5 6.2
Income after financial items 185.9 177.4 156.6 92.6 133.4 118.3 215.5 71.4
Taxes –51.9 –43.1 –45.3 –26.8 –40.8 –31.1 –53.2 –18.6
Profit for the period 134.0 134.3 111.3 65.8 92.7 87.2 162.3 52.8
Profit for the period attributable to
Equity holders 133.2 133.7 110.6 65.3 91.7 86.9 161.4 52.8
Minority 0.8 0.6 0.8 0.5 1.0 0.3 0.9 0.0
Order backlog 15,469.0 16,024.2 16,823.9 16,099.8 14,950.1 14,530.3 14,928.1 13,767.4
Capital employed 2,704.8 2,557.7 2,437.6 2,702.1 2,698.6 2,557.8 2,459.2 2,301.1
Interest-bearing net receivable 1,543.1 829.7 820.3 1,129.3 1,147.6 1,090.0 988.0 1,133.8
Debt/equity ratio –0.7 –0.4 –0.4 –0.5 –0.5 –0.5 –0.5 –0.6
Return on capital employed, % 25.1 22.9 20.5 23.0 22.6 23.5 23.9 21.1
Cash flow
Cash flow from operating activities 846.3 53.8 57.7 25.8 136.4 108.9 193.9 –37.4
Cash flow from investing activities –21.0 –125.2 –94.3 –23.8 –122.1 –38.8 –130.9 –54.0
Cash flow from financing activities 15.7 –5.1 –415.2 5.3 10.7 6.1 –274.5 –51.4
Cash flow for the period 840.9 –76.5 –451.9 7.3 24.9 76.2 –211.4 –142.9
Business streams
Order bookings
Construction 3,919.7 3,260.3 4,322.8 4,319.6 3,746.3 3,100.3 4,714.7 2,934.0
Central and eliminations 13.6 15.9 0.4 4.1 4.2 2.7 20.6 1.4
Total 3,933.3 3,276.2 4,323.2 4,323.7 3,750.5 3,102.9 4,735.3 2,935.4
Revenue
Construction 3,937.7 3,766.6 3,623.2 2,994.8 3,628.5 3,373.2 3,118.3 2,709.4
Residential Development 222.5 189.1 196.3 222.2 229.4 149.2 188.0 167.0
Commercial Development 106.1 82.3 121.1 28.8 46.8 30.7 217.6 75.1
Infrastructure Development 7.8 1.6 2.3 0.9 2.5 2.5 8.7 2.6
Central and eliminations –138.7 –108.1 –111.4 –143.3 –107.2 –99.1 –81.4 –87.4
Total 4,135.4 3,931.5 3,831.5 3,103.4 3,800.0 3,456.5 3,451.1 2,866.6
Operating income
Construction 136.7 147.3 124.3 72.3 104.5 110.0 94.6 51.4
Residential Development 23.2 13.3 15.1 26.8 37.0 17.6 21.6 15.9
Commercial Development 26.7 25.2 38.2 8.3 5.3 3.3 100.2 21.9
Infrastructure Development 1.3 –0.4 –2.0 –10.4 –4.7 2.8 6.6 –5.6
Central –10.6 –11.4 –25.1 –13.4 –10.5 –12.7 –16.6 –15.8
Eliminations –0.9 –4.1 3.0 1.3 –5.8 –7.4 3.5 –2.7
Total 176.3 169.7 153.5 84.8 125.8 113.6 210.0 65.2

Skanska Review of 2007 Notes, including accounting and valuation principles 133
Note 43 Five-year Group financial summary
In compliance with IFRSsIn compliancewith SWGAAP
Income statements, EUR M 2007 2006 2005 2004 2003
Revenue 15,001.7 13,574.3 13,432.5 13,289.1 14,563.7
Cost of sales –13,599.3 –12,344.1 –12,218.7 –12,241.8 –13,150.7
Gross income 1,402.4 1,230.2 1,213.8 1,047.3 1,413.0
Selling and administrative expenses –861.5 –754.9 –720.4 –761.8 –926.5
Income from disposal of discontinued operations – – 19.8 173.9 1.5
Income from joint ventures and associated companies 43.5 39.3 25.5 18.4 8.7
Operating income 584.4 514.6 538.7 477.9 496.7
Net financial items 28.2 24.1 12.9 –3.7 –50.4
Income after financial items 612.6 538.7 551.7 474.2 446.3
Taxes –167.1 –143.7 –132.5 –125.0 –142.8
Profit for the year 445.5 395.0 419.1 349.2 303.5
Profit for the year attributable to
Equity holders 442.8 392.8 418.0 347.7 302.6
Minority 2.7 2.2 1.2 1.4 0.9
Cash flow
Cash flow from operating activities 983.6 401.7 722.7 714.4 1,212.4
Cash flow from investing activities –264.4 –345.8 –34.8 132.2 –132.3
Cash flow from financing activities –399.3 –309.1 –295.9 –636.1 –873.2
Cash flow for the year 319.9 –253.2 392.0 210.5 206.9

134 Notes, including accounting and valuation principles Skanska Review of 2007
Note 43 Continued
In compliance with IFRSs In compliance
with SWGAAP
Balance sheets EUR M Dec 31, 2007 Dec 31, 2006 Dec 31, 2005 Jan 1,1 2005 Dec 31, 2004 Jan 1,1 2004 Dec 31, 2003
ASSETS
Non-current assets
Property, plant and equipment 632.1 603.5 558.2 553.3 612.1 738.6 741.9
Goodwill 485.1 496.6 442.3 433.4 433.4 469.5 469.5
Intangible assets 69.6 81.8 68.6 59.5 59.5 59.8 50.6
Investments in joint ventures and associated companies 205.8 209.5 195.3 95.8 95.8 151.5 151.5
Financial non-current assets 2, 4 77.0 165.9 131.6 139.3 126.4 224.0 224.0
Deferred tax assets 101.2 218.5 243.0 180.1 181.5 160.8 169.7
Total non-current assets 1,571.0 1,775.8 1,638.9 1,461.3 1,508.6 1,804.2 1,807.2
Current assets
Current-asset properties 3 1,396.8 1,308.0 1,116.1 1,326.6 1,328.0 1,528.6 1,509.6
Inventories 81.4 53.5 53.3 53.7 67.8 91.3 91.3
Financial current assets 4 495.9 348.8 240.6 308.0 276.8 137.6 137.6
Tax assets 43.5 36.5 35.1 29.9 29.9 45.8 45.8
Gross amount due from customers for contract work 598.6 577.5 597.3 406.0 397.8 525.6 530.7
Trade and other receivables 2,663.6 2,572.8 2,447.3 2,398.5 2,416.8 2,459.4 2,459.4
Cash equivalents 55.1 235.7 329.5 339.3 339.3 24.0 24.0
Cash 1,448.6 977.5 1,126.8 644.0 646.3 751.7 751.7
Assets classified as held for sale 7.7 96.6
Total current assets 6,783.5 6,110.4 5,953.8 5,602.5 5,502.7 5,564.0 5,550.1
TOTAL ASSETS 8,354.4 7,886.2 7,592.7 7,063.8 7,011.3 7,368.2 7,357.3
of which interest-bearing 2,054.7 1,707.7 1,807.4 1,380.6 1,380.6 1,129.0 1,129.0
EQUITY
Equity attributable to equity holders 2,171.0 2,122.3 1,964.9 1,805.0 1,806.3 1,598.6 1,562.0
Minority interest 22.2 16.3 14.2 13.0 13.0 22.0 22.0
Total equity 2,193.2 2,138.6 1,979.0 1,818.1 1,819.3 1,620.7 1,584.1
LIABILITIES
Non-current liabilities
Financial non-current liabilities 4 101.1 225.5 258.1 366.8 338.6 629.9 791.8
Pensions 121.6 172.1 256.3 123.2 123.6 195.2 226.9
Deferred tax liabilities 219.0 319.8 301.4 301.0 305.0 348.8 342.2
Non-current provisions 10.2 13.2 15.2 15.0 15.0 19.2 19.3
Total non-current liabilities 451.8 730.6 831.0 805.9 782.1 1,193.1 1,380.1
Current liabilities
Financial current liabilities 4 286.1 154.4 115.0 133.0 111.8 251.0 89.1
Tax liabilities 94.3 80.5 63.4 110.5 110.9 62.9 62.9
Current provisions 385.9 384.4 340.7 304.0 304.5 336.2 336.8
Gross amount due to customers for contract work 1,666.6 1,256.0 1,254.5 1,163.8 1,159.1 1,026.5 1,026.5
Trade and other payables 3,276.5 3,141.7 3,004.7 2,692.5 2,723.6 2,877.7 2,877.9
Liabilities classified as held for sale 0.0 0.0 4.5 36.0 0.0 0.0 0.0
Total current liabilities 5,709.4 5,017.0 4,782.7 4,439.8 4,409.9 4,554.4 4,393.1
TOTAL EQUITY AND LIABILITIES 8,354.4 7,886.2 7,592.7 7,063.8 7,011.3 7,368.2 7,357.3
of which interest-bearing 511.6 560.1 624.4 577.1 577.1 1,080.8 1,112.4
1 In addition to the balance sheets on December 31 of each year, the tables present the opening balance in compliance with IFRSs on January 1, 2004 as well as the transition to IAS 39 and IFRS 5 on January 1, 2005.
2 of which shares 9.7 6.5 6.3 8.2 8.2 8.4 8.4
3 Current-asset properties Commercial Development Other commercial properties Residential Development
662.579.2
655.1
617.5105.7584.8
618.0148.6349.4
821.9141.4363.2
823.4141.4363.2
1,038.6115.9374.2
1,019.6115.9374.2
1,396.8 1,308.0 1,116.1 1,326.6 1,328.0 1,528.6 1,509.6
4 Items related to non-interest-bearing unrealized changes in value of derivatives/securities are included in the following amounts: Financial non-current assets Financial current assets Financial non-current liabilities Financial current liabilities
0.212.1
9.4
0.912.8
0.76.6
11.43.72.3
20.9
12.931.228.221.5

Skanska Review of 2007 Notes, including accounting and valuation principles 135
Note 43 Continued
Financial ratios etc 5In compliance with IFRSs
In compliance
with SWGAAP
Dec 31 2007 Dec 31 2006 Dec 31 2005 Jan 1 2005 Dec 31 2004 Jan 1 2004 Dec 31 2003
Order bookings 15,856.4 14,524.2 12,616.9 13,359.2 13,275.8
Order backlog 15,469.0 14,950.1 13,707.7 12,642.0 12,832.2
Average number of employees 60,435 56,085 53,806 53,803 69,669
Regular dividend per share, SEK 5.25 4.75 4.50 4.00 3.00
Corresponding to a regular dividend per share of EUR 0.56 0.53 0.48 0.44 0.33
Extra dividend per share, SEK 3.00 3.50 2.00
Corresponding to an extra dividend per share of EUR 0.32 0.39 0.21
Earnings per share, EUR 1.06 0.94 1.00 0.83 0.72
Capital employed 2,704.8 2,698.6 2,603.4 2,395.1 2,396.4 2,701.5 2,696.5
Interest-bearing net receivable (+)/net debt (–) 1,543.1 1,147.6 1,183.0 803.5 803.5 48.2 16.5
Equity per share, EUR 5.19 5.07 4.69 4.31 4.32 3.82 3.74
Equity/assets ratio, % 26.3 27.1 26.1 25.7 25.9 22.0 21.5
Debt/equity ratio –0.7 –0.5 –0.6 –0.4 –0.4 0.0 0.0
Interest cover –15.9 –21.3 –37.4 122.8 16.8
Return on equity, %6 21.1 20.5 22.0 20.7 20.5
Return on capital employed, % 25.1 22.6 23.3 19.9 17.1
Total number of shares 418,553,072 418,553,072 418,553,072 418,553,072 418,553,072 418,553,072 418,553,072
Average number of shares
Before dilution 418,553,072 418,553,072 418,553,072 418,553,072 418,553,072 418,553,072 418,553,072
After dilution 419,080,464 418,827,470 418,561,923
Number of own shares held 4,500,000 4,500,000
5 For definitions, see Note 44.6 Average equity calculated at five measuring points. Comparative figures have been recalculated.

136 Notes, including accounting and valuation principles Skanska Review of 2007
Note 44 Definitions
Average capital employed Calculated on the basis of five measuring points: half of capital employed on January 1 plus capital employed at the end of the first, second and third quarters plus half of capital employed at year-end, divided by four.
Average visible equity Calculated on the basis of five measuring points: half of equity attributable to equity holders on January 1 plus equity attributable to equity holders at the end of the first, second and third quarters plus half of equity attributable to equity holders at year-end, divided by four.
Capital employed in business streams, markets and business/reporting units
Total assets minus tax assets and deposits in Skanska’s treasury unit minus non-interest-bearing liabilities minus provisions for taxes and tax liabilities.
Consolidated capital employed Total assets minus non-interest-bearing liabilities.
Consolidated operating cash flow In the consolidated operating cash flow statement, which includes taxes paid, investments are recognized both in cash flow from business operations and in cash flow from strategic investments. See also Note 35.
Consolidated return on capital employed Operating income plus financial income as a percentage of average capital employed.
Debt/equity ratio Interest-bearing net debt divided by visible equity including minority interest.
Earnings per share Profit for the year attributable to equity holders divided by the average number of shares.
Equity/assets ratio Visible equity including minority interest as a percentage of total assets.
Equity per share Visible equity attributable to equity holders divided by the number of shares.
Interest-bearing net receivable Interest-bearing assets minus interest-bearing liabilities.
Interest cover Operating income and financial income plus depreciation/amortization divided by net interest items.
Net working capital Net non-interest-bearing receivables and liabilities including taxes.
Operating cash flow Cash flow from operations before taxes and before financial activities. See also Note 36.
Operating net on properties Rental income and interest subsidies minus operating, maintenance and administrative expenses as well as real estate tax. Site leasehold rent is included in operating expenses.
Order backlog Contracting assignments: The difference between order bookings for the period and accrued revenue (accrued project costs plus accrued project income adjusted for loss provisions) plus order backlog at the beginning of the period. Services: The difference between order bookings and accrued revenue plus order backlog at the beginning of the period.
Order bookings Contracting assignments: Upon written order confirmation or signed contract. Also includes orders from Residential Development and Commercial Development.Services: For fixed-price assignments, upon signing of contract. For cost-plus assignments, order bookings coincide with revenue. No order bookings are reported for Residential Development and Commercial Development.
Return on capital employed in business streams, markets and business/reporting units
Operating income plus financial income minus interest income from Skanska’s treasury unit and other financial items as a percentage of average capital employed.
Return on equity Profit attributable to equity holders as a percentage of average visible equity attributable to equity holders.
Yield on properties Operating net divided by year-end carrying amount.

Skanska Review of 2007 Notes, including accounting and valuation principles 137
Skanska AB (publ), Swedish corporate identification number 556000–4615, is the Parent
Company of the Skanska Group.
The Company has its registered office in Solna, Stockholm County and is a limited
company as provided by Swedish legislation. Its headquarters is located in Solna, Stock-
holm County.
Address:
Skanska AB
SE-169 83 Solna, Sweden
Tel: +46-8-504 350 00
Fax: +46-8-755 71 26
www.skanska.com
For questions concerning financial information, please contact:
Skanska AB, Investor Relations, SE-169 83 Solna, Sweden
Tel: +46-8-753 88 00.
Fax: +46-8-755 12 56
E-mail: [email protected]
Note 45 Supplementary information

138 Statement of the President and Chief Executive Officer Skanska Review of 2007
Statement of the President and Chief Executive Officer
These financial statements have been prepared in accordance with the interna-tional accounting standards referred to in Regulation (EC) No 1606/2002 of the European Parliament and of the Council of July 19, 2002 on the application of international accounting standards and give a true and fair view of the Group’s financial position and results.
Stockholm, April 3, 2008
Johan Karlström
President and Chief Executive Officer

Skanska Review of 2007 Independent Auditor’s Report 139
To the Board of Directors of Skanska AB (publ.)Corporate identity number 556000-4615
We have audited the consolidated financial statements of Skanska AB (publ.) on pages 67–137, which comprise the balance sheet as at December 31, 2007, and the income statement, statement of recognized income and expenses and cash flow statement for the year then ended, and a summary of significant accounting policies and other explanatory notes.
Management’s Responsibility for the Financial StatementsManagement is responsible for the preparation and fair presentation of these financial statements in accordance with International Financial Reporting Stan-dards as adopted by the EU. This responsibility includes: designing, implementing and maintaining internal control relevant to the preparation and fair presentation of financial statements that are free from material misstatement, whether due to fraud or error; selecting and applying appropriate accounting policies; and making accounting estimates that are reasonable in the circumstances.
Auditor’s ResponsibilityOur responsibility is to express an opinion on these financial statements based on our audit. We conducted our audit in accordance with International Standards on Auditing. Those standards require that we comply with ethical requirements and plan and perform the audit to obtain reasonable assurance whether the financial statements are free from material misstatement. An audit involves performing procedures to obtain audit evidence about the amounts and disclosures in the financial statements. The procedures selected depend on the auditor’s judgement, including the assessment of the risks of mate-rial misstatement of the financial statements, whether due to fraud or error. In making those risk assessments, the auditor considers internal control relevant to the entity’s preparation and fair presentation of the financial statements in order to design audit procedures that are appropriate in the circumstances, but not for the purpose of expressing an opinion on the effectiveness of the entity’s internal con-trol. An audit also includes evaluating the appropriateness of accounting policies used and the reasonableness of accounting estimates made by management, as well as evaluating the overall presentation of the financial statements. We believe that the audit evidence we have obtained is sufficient and appropri-ate to provide bases for our audit opinion.
OpinionIn our opinion, the financial statements give a true and fair view of the financial position of Skanska AB (publ.) as of December 31, 2007, and of its financial perfor-mance and its cash flows for the year then ended in accordance with International Financial Reporting Standards as adopted by the EU.
Stockholm, May 16, 2008KPMG Bohlins AB
Caj NackstadAuthorized Public Accountant
Independent Auditor’s Report

140 Notes, including accounting and valuation principles Skanska Review of 2007

Skanska Review of 2007 Corporate governance report 141
Corporate governance report of Skanska AB (publ) for 2007 and the Board of Directors’ report on internal control
Corporate governance reportThis corporate governance report for 2007 plus the Board of Directors’ report on internal control have not been reviewed by the Company’s external audi-tors. The reports are not part of the formal financial statements.
Corporate governanceSkanska AB is a Swedish public limited company. Skanska’s Series B shares are listed on the OMX Nordic Exchange Stockholm. Skanska AB and the Skanska Group are governed in accordance with Skanska AB’s Articles of Association, the Swedish Companies Act, the listing agree-ment with the OMX Nordic Exchange Stockholm and other applicable Swedish and foreign laws and ordinances. Skanska applies the Swedish Code of Corporate Governance (“the Code”). Skanska is reporting departures from the Code for 2007 as noted below under “Departures from the Code.”
Articles of AssociationThe Articles of Association are adopted by the shareholders’ meeting and shall con-tain a number of mandatory disclosures of a more fundamental nature for the Com-pany. Among other things, they shall state what operations the Company shall con-duct, the size and registered office of the Board of Directors, the size of the share capital, any regulations on different types of shares, the number of shares and how notice of a Shareholders’ Meeting shall be provided. The complete Articles of Asso-ciation are available on Skanska’s website, www.skanska.com/investors, under the heading “Corporate Governance.”
Shareholders’ meetingAt the shareholders’ meeting, the highest decision-making body, the shareholders of Skanska decide on central issues, such as the adoption of the income statement and balance sheet, the dividend to the shareholders, the composition of the Board, discharging the members of the Board of Directors and the President from liability for the financial year, amend-ments to the Articles of Association,
election of auditors and principles of remuneration to senior executives. Share-holders who are listed in the register of shareholders on the record date and who notify the Company of their intention to participate in the meeting are entitled to attend it, either personally or by proxy through a representative or substitute. Every shareholder is entitled to have an item of business dealt with by the share-holders’ meeting. Well before notice of the meeting is issued, the Company’s website provides information on how sharehold-ers shall proceed in order to have an item of business dealt with.
The 2007 Annual Shareholders’ MeetingThe Annual Shareholders’ Meeting was held on April 3, 2007 in Stockholm. At the Meeting, a total of 557 sharehold-ers were present personally or through proxy, representing about 54.1 percent of the total voting power in the Com-pany. The Meeting elected Jane Garvey, Stuart Graham, Finn Johnsson, Curt Källströmer, Sverker Martin-Löf, Sir Adrian Montague, Anders Nyrén, Lars Pettersson and Matti Sundberg as members of the Board of Directors. The employees were represented on the Board by Inge Johansson, Gunnar Larsson and Alf Svensson as members with Richard Hörstedt, Jessica Karlsson and Ann-Christin Kutzner as deputy members. The meeting re-elected
Governance structure
Remuneration Committee
Project Review Committee
Shareholders
Board of Directors
Group staff units and support units
CEO andSenior Executive Team
InfrastructureDevelopment
Commercial Development
Residential Development
Construction
Nomination Committee Auditors
Internal Audit and Compliance
Audit Committee
Sverker Martin-Löf as Chairman of the Board. The Meeting also approved a dividend to the shareholders totaling EUR 0.89 per share. All members of the Board and the Company’s auditors were present at the Annual Shareholders’ Meeting. Complete information about the 2007 Annual Shareholders’ Meeting is available on Skanska’s website, www.skanska.com.
Extra Shareholders’ meetingOn November 29, an extraordinary share-holders’ meeting was held in Solna. The meeting decided to introduce a new long term share ownership program. The pro-gram is described in the Annual Report, page 131.
The 2008 Annual Shareholders’ MeetingThe Annual Shareholders’ Meeting of Skanska AB was held on April 3, 2008 in Stockholm, Sweden.
The Nomination CommitteeAmong the tasks of the Nomination Committee is to propose candidates for election as members of the Board of Directors. The 2007 Annual Sharehold-ers’ Meeting gave the Chairman of the Board a mandate to allow the three to five largest shareholders in terms of voting power each to appoint a repre-sentative to comprise, together with the Chairman, a Nomination Commit-

142 Corporate governance report Skanska Review of 2007
Corp
orat
e go
vern
ance
rep
ort
tee in preparation for the 2008 Annual Shareholders’ Meeting. The Nomination Committee has the following composi-tion: Carl-Olof By, AB Industrivärden, Chairman of the Nomination Committee; Håkan Sandberg, Svenska Handels banken AB and the Handelsbanken pension funds; Peter Lindell, AMF Pension; KG Lindvall, Swedbank Robur mutual funds; and Sverker Martin-Löf, Chairman of the Board, Skanska AB. Information has been provided on Skanska’s website on how shareholders can submit their own proposals to the Nomination Committee by sending an e-mail to [email protected] proposal of the Nomination Commit-tee will be published in the notice of the 2008 Annual Shareholders’ Meeting. At the same time, the Nomination Commit-
tee’s report on how it has pursued its work will be available on Skanska’s website, at www.skanska.com/investors.
The Board of DirectorsThe Board of Directors makes decisions concerning overall issues about the Par-ent Company and the Group, such as Group strategy, publication of interim and annual reports, major construction projects, investments and divestments, appointment of the President and CEO as well as the organizational structure of the Group. The Board has established three special committees: • The Audit Committee• The Compensation Committee • The Project Review Committee. These committees are described in detail below.
The members of the BoardThe Board of Directors consists of nine members elected by the Annual Share-holders’ Meeting without deputies plus three members and three deputy members appointed by the employees. The President and CEO is a member of the Board. At the 2007 Annual Shareholders’ Meet-ing, Board members Roger Flanagan and Ulrika Francke resigned. Sir Adrian Montague and Matti Sundberg were newly elected to the Board. For more detailed information about Board members and deputy members, see page 156 of the Annual Report. Eight of the Board members elected by the Shareholders’ Meeting are inde-pendent in relation to the Company and its management. Of these, six members are also deemed independent of the Company’s largest shareholders. Only one member (the President and CEO) is active in the management of the Company.
The work of the Board in 2007The work of the Board of Directors fol-lows a yearly agenda, which is stipulated in the Board’s Procedural Rules. In prepa-ration for each Board meeting, the Board receives supporting documentation com-
The members and deputy members of the Board Member
Position
Born
Nationality
Year elected
Audit Committee
Compensation Committee
Project Review Committee
Independent in relation to Company and company management
Independent in relation to major shareholders
Sverker Martin-Löf Chairman 1943 Sweden 2001 • • • Yes No
Jane F. Garvey Member 1944 U.S.A. 2003 Yes Yes
Stuart E. Graham President and CEO 1946 U.S.A. 2003 • No Yes
Finn Johnsson Member 1946 Sweden 1998 • Yes No
Curt Källströmer Member 1941 Sweden 2006 • Yes Yes
Sir Adrian Montague Member 1948 U.K. 2007 • Yes Yes
Anders Nyrén Member 1954 Sweden 2002 • • Yes No
Lars Pettersson Member 1954 Sweden 2006 • Yes Yes
Matti Sundberg Member 1942 Finland 2007 • Yes Yes
Richard Hörstedt Employee Rep. (Deputy) 1963 Sweden 2007 - -
Inge Johansson Employee Representative 1951 Sweden 1999 • - -
Jessica Karlsson Employee Rep. (Deputy) 1975 Sweden 2005 - -
Ann-Christin Kutzner Employee Rep. (Deputy) 1947 Sweden 2004 - -
Gunnar Larsson Employee Representative 1953 Sweden 2002 - -
Alf Svensson Employee Representative 1960 Sweden 2007 - -
• = Chairman • = Member
The Nomination Committee, 2008
Members of the NominationCommittee, 2008
Representing
December 31, 2007 % of voting power
Carl-Olof By AB Industrivärden 26.9
Håkan Sandberg Svenska Handelsbanken AB and the Handelsbanken pension funds 4.6
Peter Lindell AMF Pension 3.3
KG Lindvall Swedbank Robur mutual funds 2.3
Sverker Martin-Löf Chairman of the Board, Skanska AB –

Skanska Review of 2007 Corporate governance report 143
piled according to established procedures. These procedures are aimed at ensuring that the Board receives relevant informa-tion and documentation for decision making before all its meetings. All docu-mentation is formulated in the English language. During the year, the Board held eight meetings including its statutory meet-ing. In addition, one meeting has been held per capsulam. At its September 2007 meeting, the Board visited the Skanska Finland business unit and received information about Skanska’s activities in Finland. The Board also discussed the new strategy plan. In conjunction with this meeting, the Board carried out two work site visits. Among the more impor-tant issues that the Board dealt with dur-ing the year were Group strategy, internal control, governance of operations, risk management and employee health and safety. During the year, the Board exam-ined the relevance and timeliness of all legally mandated instructions.
The committees of the BoardIn its Procedural Rules, the Board has specified the duties and decision making powers that the Board has delegated to the
Committees. All committees report orally to the Board at each meeting in accor-dance with the mechanisms that are stipu-lated in the Procedural Rules. Minutes of all Committee meetings are provided to the Board.
Audit CommitteeThe main task of the Audit Commit-tee is to assist the Board in overseeing financial reporting, report procedures and accounting principles as well as monitoring the auditing of the accounts for the Parent Company and the Group. The Committee also evaluates the Group’s internal control and studies the reports and opinions of the Company’s external auditors. The Company’s external audi-tors are present at all meetings of the Audit Committee. In this way, the Com-mittee safeguards the quality of financial reporting, whose contents have been established by the Board in its Procedural Rules. The Committee prepares propos-als regarding elections of auditors in the years such elections will occur. The Audit Committee consists of Anders Nyrén (Chairman), Finn Johnsson and Sverker Martin-Löf. During 2007, the committee held five meetings.
Compensation CommitteeThe main task of the Compensation Com-mittee is to prepare the Board’s decisions concerning employment of the President and CEO and other members of the Senior Executive Team, as well as the President and CEO’s and the Senior Executive Team’s compensation, pensions and other terms of employment. The committee prepares the Board’s decisions on general incentive pro-grams and examines the outcomes of flex-ible salary elements. The Compensation Committee consists of Sverker Martin-Löf (Chairman), Curt Källströmer and Lars Pettersson. During 2007, the commit-tee held five meetings.
Project Review CommitteeThe Project Review Committee has the Board’s mandate to make decisions on its behalf regarding individual construction and real estate projects, investments and divestments in infrastructure projects and certain project financing packages. Projects that include especially high or unusual risks or other special circum stances may be referred to the Board for its decision. The Project Review Com-mittee consists of Sverker Martin-Löf (Chairman), Stuart Graham,
“The work of the Board is evaluated yearly through a systematic and structured process, among other things aimed at gathering good supporting documentation for improvements in the Board’s own work”.
Attendance at meetings and remuneration to the board
Board member
Board
Audit
CommitteeCompensation
Committee
Project Review
Committee
Remuneration,
Board, EUR
Remuneration, Audit
Committee, EUR
Remuneration, Compensation
Committee, EUR
Remuneration, Project Review
Committee, EUR
Total remuneration,
EUR
Number of meetings 8 5 5 11
Sverker Martin-Löf 8 5 5 11 137,823 8,107 5,405 13,512 164,847
Jane F. Garvey 6 45,941 45,941
Stuart E. Graham 8 9
Finn Johnsson 7 41 45,941 8,107 54,048
Curt Källströmer 8 5 45,941 5,405 51,346
Sir Adrian Montague1 7 81 45,941 13,512 59,453
Anders Nyrén 7 5 9 45,941 8,107 13,512 67,560
Lars Pettersson 7 4 45,941 5,405 51,346
Matti Sundberg1 7 61 45,941 13,512 59,453
Richard Hörstedt 8
Inge Johansson 8 81
Jessica Karlsson 8
Ann-Christin Kutzner 8
Gunnar Larsson 8
Alf Svensson 8
Total 459,410 24,322 16,214 54,048 553,9941 Starting in April 2007

144 Corporate governance report Skanska Review of 2007
Corp
orat
e go
vern
ance
rep
ort
Anders Nyrén, Sir Adrian Montague, Matti Sundberg and Inge Johansson. During 2007, the committee held eleven meetings.
Evaluation of the work of the BoardThe work of the Board is evaluated yearly through a systematic and structured pro-cess, among other things aimed at gather-ing good supporting documentation for improvements in the Board’s own work. External resources are not utilized in this evaluation. The evaluation also provides the Chairman of the Board with informa-tion about how the members of the Board perceive the effectiveness of the Board. The Chairman of the Board informs the Nomination Committee of the results of this evaluation.
Fees to the Board of DirectorsTotal fees to the Board members elected
by the shareholders’ meeting were approved by the 2007 Annual Share-holders’ Meeting in the amount of EUR 553,994. The Chairman of the Board received EUR 137,823 in fees and other Board members EUR 45,941 each. Mem-bers elected by the Shareholders’ meeting and serving on the Board’s committees received EUR 5,405 each on the Com-pensation Committee, EUR 8,107 on the Audit Committee and EUR 13,512 on the Project Review Committee.
The Board’s communication with the Company’s auditorsAs mentioned above, the Company’s external auditors participate in all meet-ings of the Audit Committee. According to the Procedural Rules, the Board of Directors meets with the auditors twice a year. On these occasions, the auditors orally present the findings of their audit-
Skanska’s management structure
Skanska Commercial Develop ment Nordic
Skanska UKSkanska USA Building
Skanska Sweden Skanska Financial Services
Skanska Czech Republic
Claes LarssonThomas AlmJohan KarlströmPetter Eiken Tor Krusell Hans Biörck
Skanska PolandSkanska Infrastructure Development
Green ConstructionSkanska Finland CorporateFinance
HumanResources (HR)
Skanska Commercial Develop ment Europe
SkanskaLatin America
Skanska USA CivilSkanska Norway ControllingCommunications
InformationTechnology (IT)
Skanska Project Support
Internal Audit and Compliance
Legal Affairs
Purchasing
ReportingSustainability
Skanska Residential Development Nordic
Investor Relations (IR)
President and CEO Stuart GrahamSenior Executive Team
ing work. At least once per year, the Board meets the auditors without senior execu-tives being present.
Operative management and internal controlThe CEO and the Senior Executive TeamThe President and Chief Executive Offi-cer (CEO) is responsible for day-to-day management and oversight of the Group’s operations. The work of the CEO is spe-cially evaluated at one meeting each year at which no senior executives are pres-ent. The CEO and the six Executive Vice Presidents form the Senior Executive Team (SET). In the Procedural Rules it is stipulated that if the CEO can not fulfill his duties, the duties of the CEO devolve on the CFO, or in his or her absence the Executive Vice President with the longest period of service as Executive Vice Presi-dent. Information on the CEO and the
Business unit
Group staff unit

Skanska Review of 2007 Corporate governance report 145
Senior Executive Team is found on page 155 of the Annual Report. The President and CEO has no business dealings of any significance with Skanska AB or its Group companies. The Annual Report, page 128, provides information about the transac-tions carried out between Skanska and the CEO. He owns no shares in companies that have significant business dealings with companies in the Skanska Group.
Group staff units and support unitsAt Skanska Group headquarters in Solna, there are twelve Group staff units plus two support units, Skanska Financial Services and Skanska Project Support. On Decem-ber 1, a new Group Staff Unit, Green Construction, was established to focus on developing Skanska’s expertise in environ-mentally friendly construction. The Group staff units and support units assist the CEO and the Senior Executive Team on matters concerning Groupwide functions, coordination and controls. In addition, they provide sup-port to the business units. The head of each Group staff unit, aside from the head of Internal Audit and Compliance, reports directly to a member of the Senior Executive Team. The head of Internal Audit and Compliance reports to the Audit Committee. A presentation of the Group staff units and support units is found on page 155 of the Annual Report.
The business units and their governanceThe organizational structure of the Skanska Group is characterized by clear decentralization and a large measure of delegation of authority and responsibility to the business units. Each business unit is headed by a President and has its own staff units and other resources in order to conduct its operations effectively. Aside from day-to-day operations of the business units, there are matters related to the strategic development of the units as well as matters concerning their strategic investments and divestments. These items of business are prepared by the management team at each respective unit and are then submitted to the Senior Executive Team or Skanska AB’s Board of
Directors for approval, depending on the size of the item of business. The Boards of Directors of the business units consist of representatives of Skanska AB, individu-als from other business units as well as of the respective business unit’s management team. In each business unit, the Chairman of the Board is a member of the Senior Executive Team. Where appropriate, employee representatives are included. Each business unit follows a struc-tured, step-by-step risk management process. Depending among other things on the size, type and geographic location of projects, a structured risk management report to the proper decision-making level is required before decisions on the projects are made.
Governing documentsAs part of the governance of Group opera-tions, Skanska AB’s Board of Directors has adopted a number of policy documents. In addition, the Senior Executive Team has adopted more detailed guidelines for the Group. These policies and guide-lines are available to all business units on Skanska’s intranet and are updated regular-ly to reflect changes in operations and new requirements. Among the more important governing documents are the Board’s Pro-cedural Rules, the Group’s Financial Policy, Information Policy, Risk Management System and the Code of Conduct. The Board’s Procedural Rules state what items of business shall be decided by the Board of Skanska AB, by the CEO/Senior Executive Team or at the business unit level. The threshold levels for decisions stated in the Procedural Rules are further broken down in the business units’ own decision-making rules. The business units provide regular, systematic feedback on compli-ance with the more important governing documents, such as the Financial Policy and the Code of Conduct, to the Senior Executive Team.
Remuneration for senior executivesThe 2007 Annual Shareholders’ Meeting approved principles for remuneration and other terms of employment for senior executives. These principles, as well as the
Board’s proposal for new principles to be approved at the 2008 Annual Sharehold-ers’ Meeting, are available on Skanska’s website, www.skanska.com. Information about salaries and other remuneration to the President and CEO and the other members of the Senior Executive Team as well as share award and share-related incentive programs outstanding are found in Note 37 of the Annual Report, page 129.
The Company’s auditorsThe 2005 Annual Shareholders’ Meeting selected the accounting firm of KPMG Bohlins AB as auditor of Skanska AB. This assignment runs until the 2009 Annual Shareholders’ Meeting. The auditor in charge is Caj Nackstad, Autho-rized Public Accountant. For informa-tion on fees and other remuneration to KPMG Bohlins AB, see the table below.
Fees and other remuneration to the auditors
EUR M 2007 2006
Audit assignments 6.3 5.6
Other audit-related assignments 0.6 0.6
Tax advisory services 1.0 1.0
Total 7.9 7.2
Departures from the CodeAs a departure from the Code’s rule 3.8.2 there is no member of the Audit Committee who is independent of the Company’s major shareholders. The explanation behind this departure is the following. The members of the Commit-tee – Anders Nyrén, Sverker Martin-Löf and Finn Johnsson – are dependent on AB Industrivärden. All of them have a long experience of economic and financial reporting issues from Swedish and inter-national industry. The demands on mem-bers of the Audit Committee are especially high in a company such as Skanska with decentralized global operations in a risky, project-oriented industry. The Board’s assessment is that the present committee members are the most suitable for the assignment.
“The organizational structure of the Skanska Group is characterized by clear decentralization and a large measure of delegation of authority and responsibility to the business units.”

146 Corporate governance report Skanska Review of 2007
Corp
orat
e go
vern
ance
rep
ort
reporting and/or have an impact on the Company’s results. This work is limited to risks that may individually have an effect of EUR 1.1 M or more. The Company has then made certain that there are policies and procedures in the Group to ensure that these risks are managed effectively. During 2007, all business units plus Skanska Financial Services carried out self-evaluations to assess whether Group policies and procedures are being fol-lowed. These self-evaluations have been reviewed by Skanska’s internal auditors.
Information and communicationEssential guidelines, manuals and other documents of importance to financial reporting are updated and communicated regularly to the affected employees. There are several information channels to the Senior Executive Team and the Board of Directors for essential information from employees. For external communication, there is an information policy document that ensures that the Company lives up to the existing requirements for correct information to the market.
The Board of Directors’ report on internal controlAccording to the Swedish Companies Act and the Swedish Code of Corporate Governance, the Board of Directors is responsible for internal control. This report has been drafted in compliance with the Swedish Code of Corporate Governance, section 3.7.2, taking into account the Swedish Corporate Gover-nance Board’s application instruction of September 5, 2006, and is thus limited to internal control dealing with financial reporting.
Control environmentThe Board of Directors’ Procedural Rules and instructions for the President and CEO and the committees of the Board ensure a clear division of roles and responsibilities in order to foster effective management of business risks. The Board has also adopted a number of fundamental guidelines of importance to the internal control task. Examples of these guidelines are the Company’s risk management system, financial policy and Code of Conduct. All these guidelines are available to all business units on Skanska’s intranet. The Senior Executive Team reports regularly to the Board on the basis of established procedures. In addition, the Audit Committee presents reports on its work. The Senior Executive Team is responsible for the system of internal controls required to manage significant risks in operating activities. Among other things, this includes guidelines for vari-ous employees to ensure that they will understand and realize the importance of their respective roles in the maintenance of good internal control. Risk assessment and control activitiesSkanska has identified the material risks in its operations that may, if not man-aged correctly, lead to errors in financial
MonitoringThe Board of Directors continually evaluates the information supplied by the Senior Executive Team and the Audit Committee. Of particular importance is the Audit Committee’s work in monitor-ing the effectiveness of the Senior Execu-tive Team’s work with internal control. This work includes ensuring that steps are taken concerning shortcomings and proposed actions that have emerged from internal and external auditing. Internal Audit and ComplianceThe Group staff Unit Internal Audit and Compliance, established in 2006, is responsible for monitoring and evaluat-ing risk management and internal con-trol work. This task includes examining compliance with Skanska’s guidelines. The Group staff unit is independent of the Senior Executive Team and reports directly to the Board of Directors via its Audit Committee. Internal Audit and Compliance plans its work in consultation with the Audit Committee and regularly reports the findings of its examinations to the Committee. The unit communicates continuously with Skanska’s external auditors on matters concerning internal control. During 2007, the Internal Audit and Compliance unit concentrated its activi-ties on auditing the material risks that has been identified in the business. These audits have been conducted in projects as well as in the central support functions. A total of about 60 audits were conducted during the year. These audits were carried out in accordance with a uniform audit methodology.
Solna, February 2008
The Board of Directors, Skanska AB (publ)
”The Senior Executive Team is responsible for the system of internal controls required to manage significant risks in operating activities.”
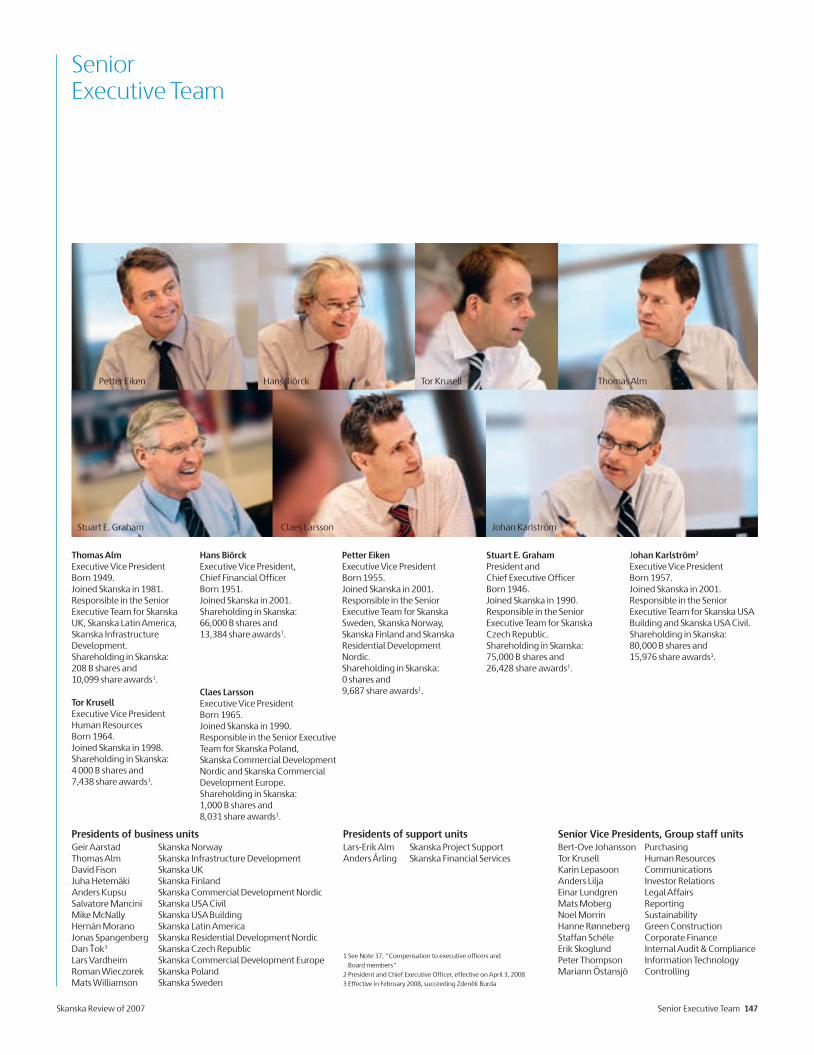
Skanska Review of 2007 Senior Executive Team 147
Presidents of business unitsGeir Aarstad Skanska NorwayThomas Alm Skanska Infrastructure DevelopmentDavid Fison Skanska UKJuha Hetemäki Skanska FinlandAnders Kupsu Skanska Commercial Development NordicSalvatore Mancini Skanska USA CivilMike McNally Skanska USA BuildingHernán Morano Skanska Latin AmericaJonas Spangenberg Skanska Residential Development NordicDan Ťok3 Skanska Czech RepublicLars Vardheim Skanska Commercial Development EuropeRoman Wieczorek Skanska PolandMats Williamson Skanska Sweden
Senior Executive Team
Petter Eiken Hans Biörck Tor Krusell Thomas Alm
Stuart E. Graham Claes Larsson Johan Karlström
Senior Vice Presidents, Group staff unitsBert-Ove Johansson PurchasingTor Krusell Human ResourcesKarin Lepasoon CommunicationsAnders Lilja Investor RelationsEinar Lundgren Legal AffairsMats Moberg ReportingNoel Morrin SustainabilityHanne Rønneberg Green ConstructionStaffan Schéle Corporate FinanceErik Skoglund Internal Audit & CompliancePeter Thompson Information TechnologyMariann Östansjö Controlling
Presidents of support unitsLars-Erik Alm Skanska Project SupportAnders Årling Skanska Financial Services
Thomas AlmExecutive Vice PresidentBorn 1949.Joined Skanska in 1981.Responsible in the Senior Executive Team for Skanska UK, Skanska Latin America, Skanska Infrastructure Development. Shareholding in Skanska: 208 B shares and 10,099 share awards1.
Hans BiörckExecutive Vice President, Chief Financial OfficerBorn 1951.Joined Skanska in 2001.Shareholding in Skanska: 66,000 B shares and 13,384 share awards1.
Petter EikenExecutive Vice PresidentBorn 1955.Joined Skanska in 2001.Responsible in the Senior Executive Team for Skanska Sweden, Skanska Norway, Skanska Finland and Skanska Residential Development Nordic.Shareholding in Skanska:0 shares and 9,687 share awards1.
Stuart E. GrahamPresident and Chief Executive OfficerBorn 1946.Joined Skanska in 1990.Responsible in the Senior Executive Team for Skanska Czech Republic.Shareholding in Skanska: 75,000 B shares and 26,428 share awards1.
Johan Karlström2
Executive Vice PresidentBorn 1957.Joined Skanska in 2001.Responsible in the Senior Executive Team for Skanska USA Building and Skanska USA Civil.Shareholding in Skanska: 80,000 B shares and 15,976 share awards1.
Tor KrusellExecutive Vice President Human ResourcesBorn 1964.Joined Skanska in 1998.Shareholding in Skanska: 4 000 B shares and 7,438 share awards1.
Claes LarssonExecutive Vice PresidentBorn 1965.Joined Skanska in 1990.Responsible in the Senior Executive Team for Skanska Poland, Skanska Commercial Development Nordic and Skanska Commercial Development Europe.Shareholding in Skanska: 1,000 B shares and 8,031 share awards1.
1 See Note 37, “Compensation to executive officers and Board members”
2 President and Chief Executive Officer, effective on April 3, 20083 Effective in February 2008, succeeding Zdeněk Burda

148 Board of Directors Skanska Review of 2007
Boar
d o
f D
irec
tors Board of
Directors
Sverker Martin-LöfChairman of the BoardStockholm, born 1943Elected 2001Shareholding in Skanska8,000 B shares
Other Board assignments• Svenska Cellulosa Aktiebolaget SCA, Chairman • AB Industrivärden, Vice Chairman • SSAB Svenskt Stål AB, Chairman • Telefonaktiebolaget LM Ericsson, Vice Chairman • Svenska Handelsbanken AB, Board member • Svenskt Näringsliv, Vice Chairman Education• MSc Engineering, Royal Institute of Technology,
Stockholm • Doctor of Technology, Royal Institute of Technology,
Stockholm • Honorary PhD, Mid-Sweden University, Sundsvall Work experience• Swedish Pulp and Paper Research Institute • President, MoDo Chemetics • Technical Director, Mo och Domsjö AB • President, Sunds Defibrator AB • President, Svenska Cellulosa Aktiebolaget SCA Dependency relationship in accordance with Code of Corporate Governance• Independent in relation to company and company
management • Dependent in relation to major shareholders
Jane F. GarveyExecutive Vice President APCO Worldwide, U.S.A. Kennebunkport, Maine, U.S.A, born 1944 Elected 2003 Shareholding in Skanska0 shares
Other Board assignments• MITRE Corporation • Sentient Jet, Inc. • Spectra Sensors, Inc. • ANPC (resigning in June 2008)• Reveal Imaging (resigning in June 2008)• Bombardier Inc. Education• Masters degree in U.S. Work experience• Director, Logan Airport, Boston, MA, U.S.A. • Deputy Administrator, Federal Highway Administration,
U.S.A. • Administrator of Federal Aviation Administration, U.S.A. • Executive Vice President, APCO Worldwide, U.S.A. Dependency relationship in accordance with Code of Corporate Governance• Independent in relation to company and company
management • Independent in relation to major shareholders
Stuart E. GrahamPresident and CEO of Skanska ABStockholm, born 1946Elected 2003 Shareholding in Skanska75,000 B shares
Other Board assignments• Securitas AB, Board member Education• Bachelor of Science in Economics, U.S.A. Work experience• President, Sordoni Construction Company, U.S.A. • President, Sordoni Skanska, U.S.A. • President, Skanska USA Civil, U.S.A.• President, Skanska (USA) Inc., U.S.A. • Executive Vice President, Skanska AB• President and CEO, Skanska AB Dependency relationship in accordance with Code of Corporate Governance• Dependent in relation to company and company
management • Independent in relation to major shareholders
Finn JohnssonGothenburg, born 1946Elected 1998Shareholding in Skanska11,000 B shares
Other Board assignments• AB Volvo, Chairman • Thomas Concrete Group AB, Chairman • Unomedical A/S, Chairman • KappAhl AB, Chairman • Luvata Oy, Chairman • City Airline, Chairman • EFG European Furniture Group AB, Chairman• AB Industrivärden, Board member Education• MBA, Stockholm School of EconomicsWork experience• President, Tarkett AB • Vice President, Stora AB • President, Euroc AB • President, United Distillers Ltd and
Vice President, Guinness • President, Mölnlycke Health Care AB Dependency relationship in accordance with Code of Corporate Governance• Independent in relation to company and company
management • Dependent in relation to major shareholders
Curt KällströmerStockholm, born 1941Elected 2006Shareholding in Skanska1,500 B shares
Other Board assignments• Handelsbanken Spain, Chairman• Umeå School of Economics, Chairman• Handelsbanken Pension Foundation, Handelsbanken
Personnel Foundation and Handelsbanken Pension Fund, Vice Chairman • Holmen AB, Board member
• Indutrade AB, Board member (until April 2008)• SBC AB Swedens BostadsrättsCentrum, Board member• SSE-MBA, Board member • Stockholmsmässan AB,
Board member • Thomas Concrete Group AB, Board member (until March 2008) • Wikström Foundation, Board member • Wåhlin Fastigheter, Board member
Education• Advanced banking degree Work experience• Manager of various Handelsbanken branch offices • Operations Manager, Eastern Sweden Regional Bank,
Handelsbanken • Regional Bank Manager, Northern Region and Central Sweden Region, Handelsbanken
• Vice President, Handelsbanken • Chairman, Stadshypotek AB• Head of Chairman’s Secretariat, Handelsbanken Dependency relationship in accordance with Code of Corporate Governance• Independent in relation to company and company
management • Independent in relation to major shareholders
Anders NyrénPresident, AB IndustrivärdenBromma, born 1954Elected 2002Shareholding in Skanska2,000 B shares
Other Board assignments• Association of Exchange-listed Companies, Chairman • Association for Generally Accepted Principles in the
Securities Market, Chairman • AB Industrivärden, Board member• Svenska Handelsbanken AB, Vice Chairman • Sandvik AB, Vice Chairman • Svenska Cellulosa
Aktiebolaget SCA, Board member • SSAB Svenskt Stål AB, Board member • Ernströmgruppen AB, Board member
Education• MBA, University of California Los Angeles• Master’s degree, Stockholm School of Economics Work experience• Executive, AB Wilhelm Becker • Executive Vice President
and CFO, STC AB • President, STC Venture AB • President, OM International AB • Executive Vice President and CFO, Securum AB • Senior Vice President, member of Group Management in
charge of Markets and Corporate Finance, Nordbanken • Executive Vice President and CFO, Skanska AB• President, AB Industrivärden Dependency relationship in accordance with Code of Corporate Governance• Indpendent in relation to company and company
management • Dependent in relation to major shareholders

Skanska Review of 2007 Board of Directors 149
Sir Adrian MontagueUnited Kingdom, born 1948Elected 2007Shareholding in Skanska0 shares
Other Board assignments• British Energy Group Plc, Chairman • Friends Provident Plc, Chairman • Infrastructure Investors Ltd, Chairman • Michael Page International, Chairman • CellMark Holdings AB, Director • London First, Director Education• Law Society Qualifying Exam Part II • MA Law, Trinity Hall, Cambridge Work experience• Senior International Adviser, Société Générale • Chief Executive, HM Treasury Taskforce • Co-head, Global Project Finance, Dresdner Kleinwort
Benson • Head of Projects Group, Linklaters & Paines, Solicitors Dependency relationship in accordance with Code of Corporate Governance• Independent in relation to company and company
management • Independent in relation to major shareholders
Lars PetterssonPresident, Sandvik AB Sandviken, born 1954Elected 2006Shareholding in Skanska• 2,000 B shares
Other Board assignments• Sandvik AB, Board member • Association of Swedish Engineering Industries,
Board member • Royal Institute of Technology, Board member Education• Msc Engineering Physics, Uppsala University • Dr. (h.c.) Work experience• President, AB Sandvik Coromant • President, Sandvik Tooling • President, Sandvik Speciality Steels • President, Sandvik AB Dependency relationship in accordance with Code of Corporate Governance• Independent in relation to company and company
management • Independent in relation to major shareholders
Matti SundbergFinland, born 1942Elected 2007Shareholding in Skanska3,000 B shares
Other Board assignments• Scania Sweden AB, Chairman • Oy Scan-Auto Ab, Finland,
Chairman • Norsk Scania AS, Chairman • Scania Danmark A/S, Chairman • Boliden AB, Board member
• SSAB Svenskt Stål AB, Board member Education• Mining Counsellor • M.Sc. (Econ.), Åbo Akademi University, Finland • D.Sc. (Econ.) h.c., University of Vaasa, Finland • Ph.D. h.c., University of Jyväskylä, Finland Work experience• Regional Director, Scania Northern European Region • CEO, Metso Corporation (Valmet-Rauma Corporation) Dependency relationship in accordance with Code of Corporate Governance• Independent in relation to company and company
management • Independent in relation to major shareholders
Inge JohanssonConcrete workerHuddinge, born 1951Swedish Building Workers’ Union, appointed 1999Shareholding in Skanska0 shares
Gunnar LarssonAsphalt works operator Kalix, born 1953Union for Service and Communication (SEKO), appointed 2002Shareholding in Skanska216 B shares
AuditorsKPMG Bohlins AB, Auditor in charge: Caj Nackstad, Stockholm, born 1945, Authorized Public Accountant Auditor for Skanska since 2001
Ann-Christin KutznerHuman Resources AdministratorMalmö, born 1947Swedish Union of Clerical and Technical Employees in Industry (SIF), appointed 2004Deputy Board memberShareholding in Skanska332 shares
Richard HörstedtBorn 1963Swedish Building Workers’ Union, appointed 2007Deputy Board memberShareholding in Skanska0 shares
Alf SvenssonProduction managerSölvesborg, born 1960Swedish Association of Supervisors (Ledarna), appointed 2007Shareholding in Skanska 0 shares
Jessica KarlssonGothenburg, born 1975Industrial Workers’ & Metal Workers’ Union (IF Metall), appointed 2005Deputy Board memberShareholding in Skanska0 shares

150 Report from Annual Shareholders’ Meeting Skanska Review of 2007
Oth
er in
form
atio
n Report from Annual Shareholders’ Meeting
Financial information
The Skanska Group’s interim reports for 2008 will be published on the following dates:
Three Month Report May 7, 2008
Six Month Report July 24, 2008
Nine Nonth Report November 4, 2008
Year-end ReportFebruary 6, 2009
The quarterly reports will be available via Skanska’s website, www.skanska.com/investors, and can also be ordered from Skanska AB, Investor Relations.
If you have questions, please contact: Skanska AB, Investor RelationsSE-169 83 Solna, Sweden Telephone: +46 8 753 88 00Fax: +46 8 730 41 69E-mail: [email protected]
More information about the Skanska Group is available at: www.skanska.com
The following decisions were made at Skanska AB’s Annual Shareholders’ Meeting in Stockholm, April 3, 2008:
The dividend for 2007 was approved in accordance with the Board’s proposal of SEK 5.25 per share (preceding year SEK 4.75) (corresponding to EUR 0.56 [0.53] per share) and an extraordinary dividend of SEK 3.00 per share (3.50) (corresponding to EUR 0.32 [0.39] per share). The record date for the dividend was April 8, 2008.
Sverker Martin-Löf, Jane F. Garvey, Finn Johnsson, Sir Adrian Montague, Lars Pettersson and Matti Sundberg were reelected members of the Board of Directors.
Johan Karlström and Bengt Kjell were elected new members. Stuart Graham, Anders Nyrén and Curt Källströmer declined reelection.
Bengt Kjell is Executive Vice President of AB Industrivärden. Johan Karlström is the President and CEO of Skanska as of April 3. Sverker Martin-Löf was reelected Chairman of the Board.
The Annual Shareholders’ Meeting resolved to authorize the Board during the period until the next Annual Shareholders’ Meeting to acquire a maximum of 4,500,000 own B shares. The purpose to secure shares to participants in the Skanska Employee Ownership Program decided at the Extraordinary Shareholders’ Meeting held in November 2007.
Departing President and CEO Stuart Graham was thanked at the Meeting for his contribution to the company.

Skanska Review of 2007 More information about Skanska 151
More information about Skanska
The HubThe Hub is a news service that offers personalized news about Skanska, its competitors and its industry. It provides brief, fast news items, often linked to additional information on the Internet. You can subscribe to receive them via e-mail, mobile phone (SMS) or fax. All items are available in English and Swedish. You can subscribe on the website www.skanska.com/thehub or by sending an e-mail to [email protected]
Did you know this about Skanska?
WorldwideThe Skanska Group publishes the magazine Worldwide, containing features and news items from the Group’s operations around the world. The magazine appears in English four times per year. A subscription is free of charge and can be ordered at the fol-lowing address:
Skanska Worldwidec/o Strömberg Distribution SE-120 88 StockholmTelephone: +46 8 449 88 00 Fax: +46 8 449 88 10E-mail: [email protected]
More information about Skanska’s business streamsFurther information about Skanska’s Residential Development and Commercial Development business streams can be downloaded from Skanska’s website, www.skanska.com/investors. The reports can also be ordered from Skanska AB, Investor Relations.
A selection of Skanska news items from 2007
1/9/2007Skanska awarded environmental assign-ment in U.S.A. for USD 67.5 M, approxi-mately SEK 500 MSkanska has been awarded the assign-ment to upgrade a water pollution control plant in Eastern USA. The total contract amount is USD 150 M, SEK 1,105 M, of which Skanska’s share is 45 percent.
1/10/2007Skanska secures bridge contract in New York City worth USD 86.5 M, about SEK 635 M Skanska has secured the contract to refur-bish the Roosevelt Island Bridge in New York City. The contract amount, totaling USD 86.5 M, approximately SEK 635 M, is included in order bookings for the fourth quarter of 2006. The customer is the New York City Department of Transportation.
1/12/2007Skanska secures GBP 64 M, SEK 870 M, con-tract for commercial office development in London, U.K.Skanska has secured a contract to con-struct a commercial office building at Crown Place in central London. The client is Greycoat Crown Place Partnership.
1/26/2007Skanska wins biggest ever U.S. order: USD 998 M for new New York Giants/Jets Stadium – takes on construction of first-of-its kind NFL facilitySkanska’s American units have been awarded the design/build contract for the new Meadowlands NFL Football Stadium in New Jersey. The customer is Meadow-lands NFL Football Stadium LLC.
2/7/2007Skanska to build Thermoelectric Power Plant in Brazil for USD 136 M, SEK 950 MSkanska has been awarded a contract to build a thermoelectric power plant in Cubatão, 60 km from São Paulo, Brazil.
Skanska’s Annual Report 2007As the functional currency of the Parent Company is SEK (Swedish kronor), Skanska’s statutory Annual Report including the consolidated financial statements and the financial statements of the Parent Company has been prepared using Swedish kronor (SEK) as the presentation currency.The Annual Report 2007 can be ordered from:Strömberg DistributionSE-120 88 Stockholm, SwedenTelephone: +46 8 449 88 10, fax: +46 8 449 88 10E-mail: [email protected] is also possible to download the Annual Report from Skanska’s website www.skanska.com

152 More information about Skanska Skanska Review of 2007
Oth
er in
form
atio
n
2/14/2007Skanska to construct underwater parking garage in Oslo for about SEK 880 M, NOK 800 M Skanska has secured a contract to con-struct a multistory parking garage, which will be located under water in central Oslo. The customer is Tjuvholmen Utvikling AS, a development company that is jointly owned by the Selvaag and Aspelin Ramm Groups.
2/23/2007Skanska to build railway in Norway for about SEK 550 M, NOK 498 MSkanska has been contracted to build a new section of railway in Norway. The customer is the Norwe-gian National Rail Administration (Jernbaneverket).
3/15/2007Skanska to build casino in the U.S. for USD 120 M, about SEK 840 MSkanska has been contracted to build a casino in Snoqualmie, Washington in the U.S. for the Snoqualmie Indian Tribe.
3/22/2007Skanska awarded roadway project in California for SEK 790 M, USD 113 MSkanska has secured the contract to widen State Route 60 in California. The customer is the California Depart-ment of Transportation (CalTrans).
3/22/2007Skanska to construct first phase of new subway line in New York for USD 337 M of which Skanska’s share amounts to USD 126 M, SEK 885 MSkanska has been contracted to manage and carry out construction of the new Second Avenue Subway Line project in New York City on Manhattan’s East Side. The contract amount is USD 337 M, about SEK 2.3 billion, of which Skanska’s share is 37.5 percent. The customer is MTA/New York City Transit, which is receiving Federal fund-ing for the project.
3/22/2007Skanska in Fortune’s list of world’s most admired companiesIn Fortune’s annual ranking of the world’s most admired companies, Skanska places second among construction companies and has the second highest ranking among Nordic companies, after Nokia.
3/23/2007Skanska awarded U.S. contract amounting to USD 132 M – SEK 925 MSkanska has been awarded a contract to build a combined shopping and office complex in the U.S.
3/28/2007Skanska signs contract with Skandia for new offices at Lindhagensterrassen – Skanska investing SEK 850 MSkanska continues to develop new prem-ises for major corporations at Lindhagen-sterrassen in Stockholm. A new office building comprising 30,000 sq. m is now being developed and built by Skanska.
4/2/2007Skanska secures major office project in London for GBP 50 M, SEK 686 MSkanska has been contracted to renovate and expand an office building in London. The customer is the Land Securities property company.
4/10/2007Skanska to build office development in London for SEK 933 MSkanska has been awarded a contract to construct an office building in London. The customer is Hermes Real Estate.
4/12/2007Skanska to construct propane plant in Brazil for USD 76.3 M, about SEK 535 MSkanska has secured a contract to build a propane production unit at Presidente Getúlio Vargas Refinery (REPAR) in Brazil. The total contract value is USD 109 M. Skanska’s share is 70 percent.
4/12/2007Skanska secures construction contract in Stavanger for NOK 400 M, SEK 460 MSkanska has been contracted to build a combined office and housing project in Stavanger, Norway for Øvre Straen AS.
4/24/2007Skanska starts three commercial projects in Poland and Czech Republic totaling about SEK 620 MSkanska is starting three new commercial development projects in Central Europe.
5/7/2007Skanska sells property portfolio in Sweden to Oppenheim for SEK 500 M, with capital gain of SEK 184 MSkanska is selling five properties in Gothenburg, Mölndal, Malmö and Lund for SEK 500 M to the German property investment company Oppenheim Immo-bilien KAG, belonging to the IVG Group.
5/10/2007Skanska to build facilities at Aitik Mine in Sweden for about SEK 460 MSkanska has been contracted to expand facilities at the Boliden’s copper mine at Aitik in Northern Sweden.
5/11/2007Skanska in social responsibility index FTSE has confirmed that this year, Skan-ska has once again met the requirements for inclusion in the FTSE4Good Index, a list of companies that take social respon-sibility. FTSE, which is jointly owned by the Financial Times and the London Stock Exchange, is a company that manages and develops globally recognized indexes.
5/14/2007Skanska to construct drinking water plant in New York for more than USD 1 billion, about SEK 7.2 billionSkanska has landed its largest order in the U.S. to date, for the Croton Water Filtra-tion Plant in New York City. The contract amount is USD 1.3 billion, about SEK 9.1 billion, of which Skanska has 80 percent.

Skanska Review of 2007 More information about Skanska 153
5/23/2007Skanska to develop and build offices in Sundbyberg – invests a total of about SEK 300 MSkanska is developing new office premises in Sundbyberg in northern Stockholm. The office property, which comprises 10,000 square meters of rentable floor space, is scheduled for completion in spring 2009.
6/26/2007Skanska awarded design-build road con-tract in U.K. for GBP 40 M, SEK 545 MSkanska has been awarded a contract to design and construct the A354 Weymouth Relief Road in the United Kingdom. The customer is Dorset County Council.
6/29/2007Skanska secures two U.S. contracts totaling approximately SEK 1.2 billion, USD 169 MSkanska has been awarded two construc-tion management assignments in the U.S.
7/2/2007Skanska to construct hotel and retail project in the U.S. for approximately SEK 2.4 billion, USD 350 MSkanska has been awarded the construc-tion contract for the expansion of the hotel, retail and dining area and the office build-ing at a casino in Uncasville, Connecticut, in the U.S.
7/2/2007Skanska extends Docklands Light Railway in London for GBP 33.5 M, about SEK 460 MSkanska has secured another project that is part of the extension of the Docklands Light Railway (DLR) in London, UK. The customer is Transport for London.
7/4/2007Skanska launches first Finnish commercial development project – investment amounts to SEK 290 MSkanska is now launching commercial projects in Finland. In Helsinki, Skanska is developing a new office property with 10,000 sq. m of floor space.
7/30/2007Skanska selected as construction manager for the renovation of the United Nations headquarters in New York, expected value USD 1 billion, SEK 6.9 billionSkanska has been selected by the UN to serve as construction manager for its Capital Master Plan (CMP) renovation and upgrading of the international orga-nization’s headquarters in New York City. Skanska expects to perform the project on a phased basis through 2014.
8/8/2007Skanska awarded SEK 2 billion contract in LondonSkanska has been awarded the contract to construct the Walbrook office and retail development in central London for the U.K. property company Minerva.
9/4/2007Skanska to expand refinery in Brazil for USD 55 M, about SEK 380 MSkanska has been contracted to build two new refinery units at the Presidente Bernardes Refinery (RPBC), in Cubatão, 60 km from São Paulo, Brazil. The contract total value amounts to USD 84 M, of which Skanska’s share is 65 percent. 9/17/2007Skanska to construct tower building in Jacksonville, Florida, for USD 50 M, about SEK 345 MSkanska has been contracted to build a 38-story condominium tower in Jackson-ville, Florida. The contract is included in order bookings for the third quarter of 2007. The customer is the Arch Insurance Company jointly with the XL Insurance Company.
9/20/2007Skanska to build steam pipeline in Brazil for USD 113 M, about SEK 780 M Skanska has secured the contract to build a steam pipeline in northeast Brazil.
9/24/2007Skanska to build cancer hospital in Florida for USD 150 M, approximately SEK 1 billionSkanska has been contracted to build a new cancer hospital at the University of Florida’s Gainesville campus for Shands HealthCare at the University of Florida.
10/4/2007Skanska invests SEK 565 M in four new logistics projects in Sweden and DenmarkSkanska has signed leases for four new logistics facilities – in Gothenburg, Linköping and Burlöv (Sunnanå), Sweden; and Stilling, Denmark. The con-tracts, which are separate from each other, involve 50,000 sq. m in all and were signed with Scan, TransFargo, Freja Transport & Logistics and an unnamed tenant.
10/4/2007Skanska to build data center in U.S. for USD 179 M, about SEK 1.2 billionSkanska has been contracted to build a data center in the northeastern U.S. The customer is a leading New York-based financial services firm.
10/9/2007Skanska to construct detention centers at Kumla, Hall and Saltvik valued at SEK 420 MSkanska has been contracted to extend the Swedish Prison and Probation Service’s facilities at Kumla, Hall and Saltvik in Härnösand, Sweden.
10/19/2007Skanska to build central utility plant in California for USD 181 M, about SEK 1.2 billionSkanska has been awarded a design-build contract for a central utility plant in Sacramento, California. The customer is the State of California.
10/30/2007Skanska sells office property in Stockholm for SEK 455 M, with a gain of SEK 160 MSkanska is selling the Årstaäng 4 office property, transferred with leasehold

154 More information about Skanska Skanska Review of 2007
Oth
er in
form
atio
n
right for SEK 455 M to a company jointly owned by Balder and GE Real Estate. 10/30/2007Skanska initiates new office project in central WarsawSkanska is currently developing and con-structing Atrium City, a new office project along the main street Al Jana Pawla in central Warsaw. The building will comprise about 20,000 square meters of rentable floor space. The total investment amounts to EUR 73.5 M, or SEK 680 M.
10/31/2007Skanska sells its shareholding in MaputoSkanska is divesting its remaining 12 per-cent shareholding in the Maputo harbor project in Mozambique for SEK 105 M. The gain on the sale, which amounts to approximately SEK 70 M, will be included in the fourth quarter. The buyer is the South African company Grindrod.
10/31/2007Skanska to build Heron Tower in LondonSkanska has been awarded the contract to construct Heron Tower in the City of Lon-don by the trustees of the Heron Tower Property Unit Trust. The contract value is around GBP 242 M, about SEK 3.3 billion.
11/5/2007Skanska secures additional order for envi-ronmental project in New York for USD 89 M, approximately SEK 610 MSkanska has secured yet another assign-ment for the upgrade of water treatment systems at Newtown Creek in New York. The customer is the New York City Department of Environmental Protection.
11/12/2007Skanska to build for pharmaceutical com-pany in New Jersey for USD 60.5 M, about SEK 410 MSkanska has been chosen as construction manager for expansion of a pharmaceuti-cal facility in New Jersey. The customer is one of Skanska’s repeat customers within the pharmaceuti-cal industry.
11/13/2007Skanska to build Marriott hotel in Stockholm for SEK 410 MSkanska has been contracted to build a Marriott hotel in Kungsholmen, central Stockholm.
11/14/2007Financing secured for Walsall Hospital PFI Healthcare scheme – Skanska invests GBP 8.2 million, about SEK 110 million, and receives construction contract worth GBP 174 million, about SEK 2.4 billionSkanska has reached financial close for the delivery of a 33-year PFI scheme to design, build, finance and operate a major healthcare development – Manor Hospi-tal for the Walsall Hospitals NHS Trust in Walsall, U.K.
11/20/2007Skanska develops and sells office and residential project in Stockholm for about SEK 450 MSkanska is developing and selling a com-bined office and residential project in Hammarby Sjöstad in Stockholm.
11/21/2007Skanska signs contract for previously announced subway project in New York for USD 400 M, about SEK 2.75 billionThe contract covering construction of the extension of the No. 7 Subway Line has now been signed by S3 Tunnel Contrac-tors, a joint venture including Skanska. The contract amounts to USD 1.14 bil-lion, approximately SEK 7.8 billion, of which Skanska’s share is 35 percent. The customer is MTA New York City Transit.
12/4/2007Skanska to build shopping center in Nor-way for SEK 460 MSkanska has been contracted to build one of Norway’s largest shopping centers, Amfi Steinkjer, outside Trondheim. The customers are Amfi Bygg Steinkjer AS and Coop Steinkjer BA.
12/14/2007Skanska develops new media building for MTG in Stockholm and invests SEK 520 MSkanska is developing a new office and media building in Stockholm for the media group MTG, Modern Times Group.
12/14/2007Skanska sells holding in Brazilian PPP project at a gain of SEK 550 MSkanska has signed an agreement to sell its 50 percent equity interest in the Ponte de Pedra hydroelectric power plant in Brazil. The price is approximately SEK 1 billion, with a capital gain of SEK 550 M. The purchaser is the French-Belgian energy company Suez-Tractebel, which is also acquiring Impregilo’s 50 percent interest.
12/20/2007Skanska selling ongoing office project in BudapestSkanska is selling the Nepliget Center office project in Budapest for EUR 72.2 M, about SEK 670 M. The buyer is an international real estate fund that will take over the prop-erty in pace with its completion. Only a small portion of the project is leased out. Skanska is responsible for leasing of the project for two years after completion. The final development gain depends to a great extent on the success of the leasing activity.
12/21/2007Skanska starts second phase of Grunwaldz-ki Center office project in WrocawSkanska is now developing and construct-ing the second phase of Grunwaldzki Center, an office project in the center of Wroclaw in southern Poland. The project will comprise a total of about 27,000 sq. m of leasable floor space, of which about 16,000 sq. m in the second stage. The total investment for the second stage amounts to EUR 36.2 M, about SEK 335 M.

Skanska Review of 2007 More information about Skanska 155
Definitions and abbreviations
Average capital employed – Calculated on the basis of five measuring points: half of capital employed on January 1 plus capital employed at the end of the first, second and third quarters plus half of capital employed at year-end, divided by four.
Average visible equity – Calculated on the basis of five measuring points: half of equity attributable to equity holders (shareholders) on January 1 plus equity attributable to equity holders at the end of the first, second and third quarters plus half of equity attributable to equity holders at year-end, divided by four.
BOT – Build Own/Operate Transfer (privately financed infrastructure products)
Capital employed in business streams, markets and business/reporting units –Total assets minus tax assets and deposits in Skanska’s treasury unit minus non-interest-bearing liabilities minus provisions for taxes and tax liabilities.
Consolidated capital employed – Total as-sets minus non-interest-bearing liabilities.
Consolidated operating cash flow – In the consolidated operating cash flow statement, which includes taxes paid, investments are recognized both in cash flow from business operations and in cash flow from strategic investments. See also Note 35.
Consolidated return on capital employed –Operating income plus financial income as a percentage of average capital employed.
Debt/equity ratio – Interest-bearing net debt divided by visible equity including minority interest.
Earnings per share – Profit for the year attributable to equity holders divided by the average number of shares.
Equity/assets ratio – Visible equity including minority interest as a percentage of total assets.
Equity per share – Visible equity attributable to equity holders divided by the number of shares.
GDP – Gross domestic product
Interest-bearing net receivable – Inter-est-bearing assets minus interest-bearing liabilities.
Interest cover – Operating income and finan-cial income plus depreciation/amortization divided by net interest items.
LEED – Leadership in Energy and Environ-mental Development (American certification standard). Net working capital – Net non-interest-bear-ing receivables and liabilities including taxes.
Operating cash flow – Cash flow from operations before taxes and before financial activities. See also Note 35.
Operating net on properties – Rental income and interest subsidies minus operating, maintenance and administrative expenses as well as real estate tax. Site leasehold rent is included in operating expenses.
ORA – Operational Risk Assessment (Skanska’s risk management model)
Order backlog – Contracting assignments: The difference between order bookings for the period and accrued revenue (accrued project costs plus accrued project income adjusted for loss provisions) plus order backlog at the beginning of the period.Services: The difference between order book-ings and accrued revenue plus order backlog at the beginning of the period.
Order bookings – Contracting assignments:Upon written order confirmation or signed contract. Also includes orders from Residential Development and Commercial Development.Services: For fixed-price assignments, upon signing of contract. For cost-plus assignments, order bookings coincide with revenue.No order bookings are reported for Residential Development and Commercial Development.
P3 – Public-Private Partnership (privately financed infrastructure projects, used in the U.S.)
PFI – Private Finance Initiative (privately financed infrastructure projects, used in the U.K.)
PPP – Public-Private Partnership (privately financed infrastructure projects)
Return on capital employed in business streams, markets and business/report-ing units – Operating income plus financial income minus interest income from Skanska’s treasury unit and other financial items as a percentage of average capital employed.
Return on equity – Profit attributable to eq-uity holders as a percentage of average visible equity attributable to equity holders.
SEOP – Skanska Employee Ownership Program
SET – Senior Executive Team (Skanska’s corpo-rate management team)
SFS – Skanska Financial Services
SPS – Skanska Project Support
STAP – Skanska Tender Approval Procedure
Yield on properties – Operating net divided by year-end carrying amount.

United Nations headquarters, New York
Skanska has been selected for the prestigious assignment of serving as construction manager for the renovation of the United Nations headquarters in New York City. The project, with a total expected value of USD 1 billion, is the UN’s largest-ever investment. The renovation will take place in phases.
Production:Skanska AB, Investor Relations in collaboration with Addira, Carl Johan Hane Designkontor ab and IMS Marketing Communications Group plc.Translation: Victor Kayfetz, Scan Edit, Oakland, CA.Repro and printing: Arkpressen, Västerås, Sweden, 2008.Photos: Skanska, and outside photographers; Per-Anders Pettersson: p. 6, 8, 18 and 20. Petra Svensson: p. 33. Torben Åndahl, p. 39. Scanpix: p. 55. Joakim Folke: p. 151–154.

About Skanska
Skanska in 2007
Commercial Development a record year, with 23 new projects started and with leases signed for more than 300,000 sq. m (3.23 million sq. ft.) of space. investors are showing continued good demand for completed projects. Read more on page 34
Infrastructure Developmentvalue growth was good, and unrealized develop-ment gains increased by eUR 286 M. Read more on page
42
Skanska is one of the world’s largest construction companies, with a leading position in a number of home markets in Europe, the United States and Latin America. Skanska also carries out project development in selected geographic markets in the residential and commercial property fields, as well as in infrastructure by means of public-private partnerships. By combining international expertise with a local presence, Skanska acts as a local company with global strength. The Skanska Group has 60,000 employees, and in 2007 its revenue totaled EUR 15.0 billion.
4
The President and CEO: ”we have set bold new financial targets and challenged ourselves to lead the industry in developing economical solutions to enable our customers to reduce Co2 consumption.” Read more on page
18
Constructionimproved earnings in nine markets out of ten. operating income increased by 33 percent. operating margin reached 3.4 percent, which means that it surpassed the “outperform” target for this business stream.Read more on page
Residential Development Despite a downturn primarily in the Danish and norwegian markets, the business stream ended the year close to its financial targets.Read more on page
28
Addresses
Skanska ABse-169 83 solnaswedenstreet address: Råsundavägen 2Tel: +46 8 753 88 00fax: +46 8 755 12 56www.skanska.com
Skanska Swedense-169 83 solnaswedenstreet address: Råsundavägen 2Tel: +46 8 504 350 00 fax: +46 8 755 63 17Customer service: 020-30 30 40(from inside sweden only)www.skanska.se
Skanska NorwayP.o. Box 1175 sentrumno-0107 oslonorwaystreet address: Drammensveien 60Tel: +47 40 00 64 00 fax: +47 23 27 17 30 www.skanska.no
Skanska DenmarkBaltorpvej 158Dk-2750 BallerupDenmarkTel: +45 44 77 99 99 fax: +45 44 77 98 99www.skanska.dk
Skanska FinlandP.o.Box 114fi-00101 Helsinkifinlandstreet address: Paciuksenkatu 25Tel: +358 20 719 211 fax: +358 20 719 2271 www.skanska.fi
Skanska Poland ul. Gen. J. Zajaczka 9PL-01-518 warsawPolandTel: +48 22 561 30 00fax: +48 22 561 30 01www.skanska.pl
Skanska Czech Republic kubánské námestí 1391/11CZ-100 05 Prague 10 - vrsoviceCzech RepublicTel: +420 267 310 476fax: +420 267 310 644www.skanska.cz
Skanska UK Maple Cross HouseDenham way, Maple CrossRickmansworthHertfordshire wD3 9swUnited kingdomTel: +44 1923 776 666 fax: +44 1923 423 900www.skanska.co.uk
Skanska USA Building1633 Littleton RoadParsippany, nJ 07054U.s.a.Tel: +1 973 753 3500fax: +1 973 753 3499www.usa.skanska.com
Skanska USA Civil16-16 whitestone expresswaywhitestone nY 11357 U.s.a.Tel: +1 718 747 34 54 fax: +1 718 747 34 58 www.usa.skanska.com
Skanska Latin Americaavenida del Libertador 2442 – Piso 5B1636DsR olivos, Buenos airesargentina Tel: +54 11 4341 7000 fax: +54 11 4341 7355 www.skanska.com.ar
Skanska Residential Development Nordicse-169 83 solnaswedenstreet address: Råsundavägen 2Tel: +46 8 504 350 00fax: +46 8 504 361 99www.skanska.com/residentialnordic
Skanska Commercial Development Nordicse-169 83 solnaswedenstreet address: Råsundavägen 2Tel: +46 8 504 350 00 fax: +46 8 504 361 99www.skanska.se/fastigheter
Skanska Commercial Development Europese-169 83 solnaswedenstreet address: Råsundavägen 2Tel: +46 8 504 350 00 fax: +46 8 504 361 99www.skanska.com/property
Skanska Infrastructure Developmentse-169 83 solnaswedenstreet address: Råsundavägen 2Tel: +46 8 504 350 00 fax: +46 8 755 13 96www.skanska.com/id
Skanska Financial Servicesse-169 83 solnaswedenstreet address: Råsundavägen 2Tel: +46 8 504 350 00 fax: +46 8 753 18 52www.skanska.com
Skanska Project Supportse-169 83 solnaswedenstreet address: Råsundavägen 2Tel: +46 8 504 350 00fax: +46 8 753 48 42www.skanska.com/projectsupport
For other addresses:www.skanska.com

ska
nsk
a R
eview
of 2
00
7 – eU
R v
eRsio
n
Review of 2007EUR version
Skanska ABwww.skanska.com
Råsundavägen 2se-169 83 solnaswedenTel: +46 8 753 88 00fax: +46 8 755 12 56