REVIEW Monitoring of CO2 exchange and carbon pools in vegetation and soil
20
REVIEW Monitoring of CO 2 exchange and carbon pools in vegetation and soil Rakesh Pandey • Vijay Paul • Vinay Kumar Sehgal • Madan Pal Singh • Kalikinkar Bandyopadhyay Received: 3 July 2012 / Accepted: 12 March 2013 / Published online: 6 August 2013 Ó Indian Society for Plant Physiology 2013 Abstract Global efforts to reduce the emissions require proper monitoring and understanding of the carbon inputs and outputs by the terrestrial ecosystems i.e. vegetation and soil. Photosynthesis and net primary productivity can be used as indicators of carbon exchange and their estimate can be made through traditional approaches as well as other approaches e.g. mechanistic photosynthesis models and the light use efficiency with satellite data. Advancements have taken place for monitoring the CO 2 exchange at different scales viz. leaf, stand-, landscape levels, vertical carbon column- and satellite observations. There are methods to partition the fluxes based on discrimination of isotopes of carbon by terrestrial ecosystem processes. The soil is a vast reservoir of carbon and has a great potential for atmo- spheric carbon sequestration. Monitoring of carbon and fluxes in soil is therefore an essential aspect in the era of changing climate. The root systems are monitored mostly in a destructive manner but many non-destructive methods have also been devised. Similarly, soil carbon estimation with traditional chemical method can be replaced by reflectance spectroscopy for rapid and large area estima- tions. Measurement of soil respiration and its partitioning also helps in verifying the capacity of soil as a net source or net sink. Monitoring of the pools and fluxes therefore uses multi-technique and -disciplinary approaches. Uncertain- ties in the estimates occur due to the multi-factorial effects and have implications on carbon trading. Therefore more effective monitoring and reduction of the uncertainties is needed. Keywords Carbon cycle Carbon sequestration Carbon trading Climate change Eddy covariance Net primary productivity Photosynthesis Respiration Soil organic carbon Satellite remote sensing Introduction The increase in greenhouse gases (GHGs) is primarily responsible for the recent global warming (Henderson- Sellers 2012). Therefore the goal of reducing the emissions as mandated by different international agencies (e.g. IPCC) is now on global priority. Special mechanisms for emission reduction under Kyoto Protocol include joint implementa- tion, clean development mechanism and emission trading. Besides this, nations need to maintain and update the GHG emission inventories and category on land use change and forestry. Among these GHGs, the atmospheric CO 2 accounts for about 60 % of global warming potential and by 2050 its level will increase to nearly 450 lmol mol -1 (Karl et al. 2009; IPCC report 2007). However, monitoring of GHGs is still inadequate in terms of number of sites, large geographic gaps or spatial resolution (Manning 2011) and requires a multi-technique approach Canadell et al. (2000). Moreover, the response of global carbon cycle to climate change is one of the greatest sources of uncertainty (Balantyne et al. 2012). Houghton (2005) also mentioned that estimation of components of the global carbon cycle is still not accurate. Durant et al. (2011) have emphasized the need for enhancement of measurement infrastructure to reduce uncertainty in global carbon balance and estimated R. Pandey (&) V. Paul M. P. Singh Division of Plant Physiology, Indian Agricultural Research Institute, New Delhi 110012, India e-mail: [email protected] V. K. Sehgal K. Bandyopadhyay Division of Agricultural Physics, Indian Agricultural Research Institute, New Delhi 110012, India 123 Ind J Plant Physiol. (April–June 2013) 18(2):98–117 DOI 10.1007/s40502-013-0016-0
Transcript of REVIEW Monitoring of CO2 exchange and carbon pools in vegetation and soil
REVIEW
Monitoring of CO2 exchange and carbon pools in vegetationand soil
Rakesh Pandey • Vijay Paul • Vinay Kumar Sehgal •
Madan Pal Singh • Kalikinkar Bandyopadhyay
Received: 3 July 2012 / Accepted: 12 March 2013 / Published online: 6 August 2013
� Indian Society for Plant Physiology 2013
Abstract Global efforts to reduce the emissions require
proper monitoring and understanding of the carbon inputs
and outputs by the terrestrial ecosystems i.e. vegetation and
soil. Photosynthesis and net primary productivity can be
used as indicators of carbon exchange and their estimate
can be made through traditional approaches as well as other
approaches e.g. mechanistic photosynthesis models and the
light use efficiency with satellite data. Advancements have
taken place for monitoring the CO2 exchange at different
scales viz. leaf, stand-, landscape levels, vertical carbon
column- and satellite observations. There are methods to
partition the fluxes based on discrimination of isotopes of
carbon by terrestrial ecosystem processes. The soil is a vast
reservoir of carbon and has a great potential for atmo-
spheric carbon sequestration. Monitoring of carbon and
fluxes in soil is therefore an essential aspect in the era of
changing climate. The root systems are monitored mostly
in a destructive manner but many non-destructive methods
have also been devised. Similarly, soil carbon estimation
with traditional chemical method can be replaced by
reflectance spectroscopy for rapid and large area estima-
tions. Measurement of soil respiration and its partitioning
also helps in verifying the capacity of soil as a net source or
net sink. Monitoring of the pools and fluxes therefore uses
multi-technique and -disciplinary approaches. Uncertain-
ties in the estimates occur due to the multi-factorial effects
and have implications on carbon trading. Therefore more
effective monitoring and reduction of the uncertainties is
needed.
Keywords Carbon cycle � Carbon sequestration �Carbon trading � Climate change � Eddy covariance �Net primary productivity � Photosynthesis �Respiration � Soil organic carbon � Satellite remote
sensing
Introduction
The increase in greenhouse gases (GHGs) is primarily
responsible for the recent global warming (Henderson-
Sellers 2012). Therefore the goal of reducing the emissions
as mandated by different international agencies (e.g. IPCC)
is now on global priority. Special mechanisms for emission
reduction under Kyoto Protocol include joint implementa-
tion, clean development mechanism and emission trading.
Besides this, nations need to maintain and update the GHG
emission inventories and category on land use change and
forestry. Among these GHGs, the atmospheric CO2
accounts for about 60 % of global warming potential and
by 2050 its level will increase to nearly 450 lmol mol-1
(Karl et al. 2009; IPCC report 2007). However, monitoring
of GHGs is still inadequate in terms of number of sites,
large geographic gaps or spatial resolution (Manning 2011)
and requires a multi-technique approach Canadell et al.
(2000). Moreover, the response of global carbon cycle to
climate change is one of the greatest sources of uncertainty
(Balantyne et al. 2012). Houghton (2005) also mentioned
that estimation of components of the global carbon cycle is
still not accurate. Durant et al. (2011) have emphasized the
need for enhancement of measurement infrastructure to
reduce uncertainty in global carbon balance and estimated
R. Pandey (&) � V. Paul � M. P. Singh
Division of Plant Physiology, Indian Agricultural Research
Institute, New Delhi 110012, India
e-mail: [email protected]
V. K. Sehgal � K. Bandyopadhyay
Division of Agricultural Physics, Indian Agricultural Research
Institute, New Delhi 110012, India
123
Ind J Plant Physiol. (April–June 2013) 18(2):98–117
DOI 10.1007/s40502-013-0016-0
that even 5 % of unreported emissions can cost US$20
billion each year by 2050. Therefore, monitoring of global
carbon exchange processes and the dynamics of carbon
pools has immense importance for determining how global
environment is changing, what drives these changes, its
potential impacts and for developing sound policy deci-
sions on mitigation and adaptation strategies.
As plant researchers, mostly our thinking in relation to
measurements of photosynthesis and carbon accumulation
visualizes the spatial level of leaf and plant only. But to
understand the ecosystem responses, the isolated plant
studies will not yield proper understanding. It is not a simple
and routine task. The need is to take an integrated approach
of plant community, soil processes and the climatic factors
which constitute key components of land ecosystems. The
objective of the present review is therefore to highlight the
monitoring approaches for the CO2 fluxes and the carbon
pools in vegetation and soil and how they affect global car-
bon cycle. The review therefore includes various processes
and components of the carbon cycle at different scales viz.
photosynthesis, respiration, growth of aboveground parts,
root growth, net primary productivity (NPP), vegetation
responses to elevated CO2, soil carbon dynamics, partition-
ing of the fluxes and their interactions. These aspects have
been highlighted for a better understanding about the com-
plexities and uncertainties in monitoring, role of monitoring
in providing accuracy in carbon cycle and how carbon cycle
is affected by climate change and how it affects the regional
and global climate. This will provide a holistic understand-
ing of the role of vegetation and soils under changing cli-
mate. It will therefore be useful for plant-, crop scientists,
environmentalists, climatologists, modelers, planners and
ecosystem managers.
Sources and sinks of carbon and the carbon cycle
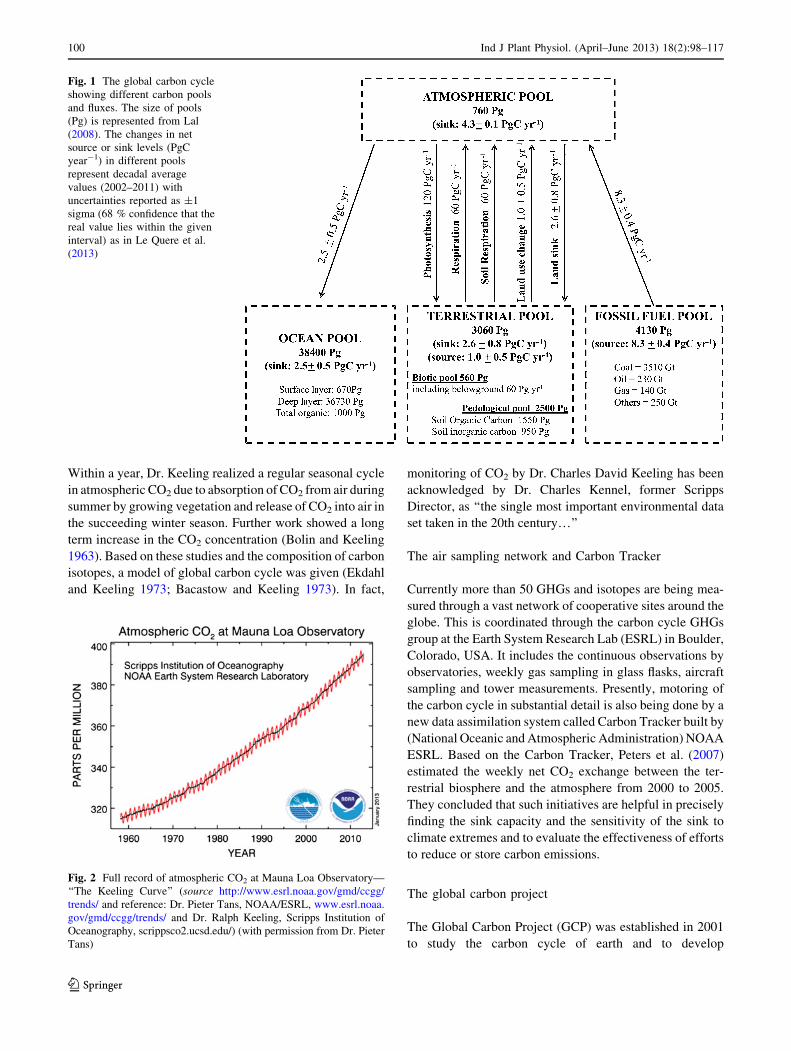
The earth’s land, atmosphere, ocean human spheres can be
integrated in a global carbon cycle (Fig. 1) in which the
carbon pools are linked with the exchange of CO2 gas. When
photosynthesis is greater than respiration and fossil fuel
combustion, the land biosphere serves as a sink for carbon
whereas when the carbon losses are greater than photosyn-
thesis the land acts as a carbon source. The source and sinks
of carbon have changed over the past 200 years (Schimel
2004). About 295 GtC has been released from land out of
which 265 GtC is due to fossil fuel emission and 30 GtC is
due to land use change. It has been captured by the atmo-
sphere (180 GtC) and oceans (115 GtC). The sinks of carbon
associated with carbon cycle consist of atmospheric
absorption of 4.3 ± 0.1 PgC year-1, land 2.6 ± 0.8 PgC
year-1 and ocean 2.5 ± 0.5 PgC year-1 (Fig. 1) as per the
decadal average 2002-2011 given by Le Quere et al. (2013)
(1 Pg = 1015 g = 1 Gt = 1 billion metric tonnes; where Pg
refers to Petagram and Gt refers to Gigaton). Thus about half
(45 %) of the total emissions are being absorbed by atmo-
sphere, 26 % by ocean and about 29 % by land ecosystems
(Le Quere et al. 2009). A strong terrestrial carbon sink was
found in the temperate latitudes of the Northern Hemisphere
in 1992 and 1993, the magnitude of which is roughly half of
the global fossil fuel emission of those years (Ciais et al.
1995). Sabine et al. (2004) estimated an annual accumulation
of 0.2–1.4 Pg carbon in the terrestrial biosphere which has
slowed down the rate of rise in the atmospheric CO2.
The source of carbon consists of 8.3 ± 0.4 PgC year-1
from fossil fuel combustion and cement manufacture and 1.0
± 0.5 PgC year-1 from deforestation, biomass burning and
soil cultivation (based on decadal average 2002–2011 values
taken from Le Quere et al. (2013)). Globally, soil contain
approximately 1,500 Pg of organic carbon (Batjes 1996),
which is roughly three times the amount of carbon in vege-
tation and twice the amount in the atmosphere. It is the
largest source of CO2 from terrestrial ecosystems to the
atmosphere (IPCC 2001). However, the soils can act as sinks
if carbon sequestration can be done into long-lived pools of
carbon (Bhattacharyya et al. 2012). Soil carbon sequestration
is defined as the net removal of CO2 from the atmosphere into
long-lived pools of carbon in soil. Besides removing atmo-
spheric CO2 it helps in improving productivity, soil health
and quality of environment and therefore carbon sequestra-
tion is a ‘win–win’ strategy (Lal 2001). The world soils have
a potential of carbon sequestration of 0.4–1.2 GtC year-1.
The potential of C sequestration for cropland soil is 0.4–0.8
GtC year-1, range- and grasslands 0.01–0.03 GtC year-1,
irrigated soil 0.01–0.03 GtC year-1, degraded and deserti-
fied soil 0.2–0.4 Gt year-1 and overall world soil has a car-
bon sequestration potential of 0.4–1.2 GtC year-1 (Lal
2004a, b). For agricultural lands, West et al. (2010) made a
global comparative analysis of carbon stock versus crop
yields and showed that for each unit of land cleared, the
tropics lose nearly two times as much carbon (*120
vs. *63 t ha-1) and produce less than one-half the annual
crop yield compared with temperate regions (1.71 vs. 3.84 t
ha-1 year-1).
Monitoring of the global atmospheric CO2 and carbon
cycle
The Keeling curve
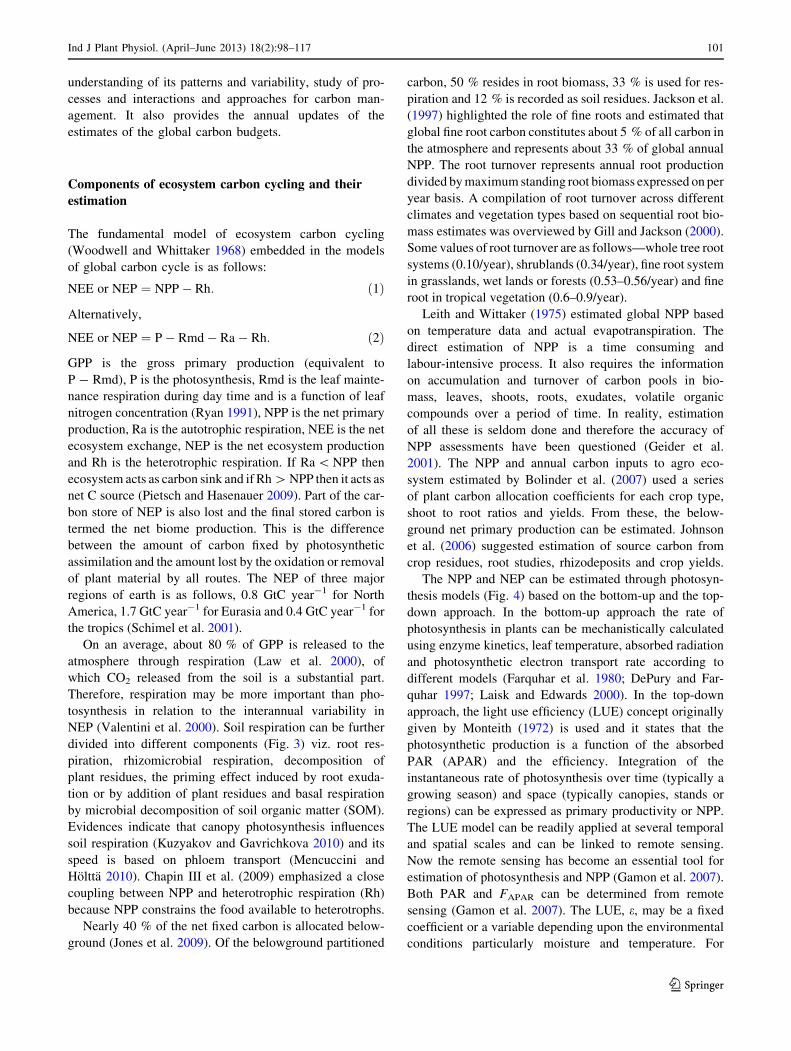
The ‘Keeling curve’ has become a standard icon and evi-
dence of the impact of humankind on the global atmosphere.
This time-series CO2 record of atmosphere (Fig. 2) is a result
of sustained work initiated by Dr. Charles David Keeling
(1928–2005) at Mauna Loa Observatory (USA) since 1957.
Ind J Plant Physiol. (April–June 2013) 18(2):98–117 99
123
Within a year, Dr. Keeling realized a regular seasonal cycle
in atmospheric CO2 due to absorption of CO2 from air during
summer by growing vegetation and release of CO2 into air in
the succeeding winter season. Further work showed a long
term increase in the CO2 concentration (Bolin and Keeling
1963). Based on these studies and the composition of carbon
isotopes, a model of global carbon cycle was given (Ekdahl
and Keeling 1973; Bacastow and Keeling 1973). In fact,
monitoring of CO2 by Dr. Charles David Keeling has been
acknowledged by Dr. Charles Kennel, former Scripps
Director, as ‘‘the single most important environmental data
set taken in the 20th century…’’
The air sampling network and Carbon Tracker
Currently more than 50 GHGs and isotopes are being mea-
sured through a vast network of cooperative sites around the
globe. This is coordinated through the carbon cycle GHGs
group at the Earth System Research Lab (ESRL) in Boulder,
Colorado, USA. It includes the continuous observations by
observatories, weekly gas sampling in glass flasks, aircraft
sampling and tower measurements. Presently, motoring of
the carbon cycle in substantial detail is also being done by a
new data assimilation system called Carbon Tracker built by
(National Oceanic and Atmospheric Administration) NOAA
ESRL. Based on the Carbon Tracker, Peters et al. (2007)
estimated the weekly net CO2 exchange between the ter-
restrial biosphere and the atmosphere from 2000 to 2005.
They concluded that such initiatives are helpful in precisely
finding the sink capacity and the sensitivity of the sink to
climate extremes and to evaluate the effectiveness of efforts
to reduce or store carbon emissions.
The global carbon project
The Global Carbon Project (GCP) was established in 2001
to study the carbon cycle of earth and to develop
Fig. 1 The global carbon cycle
showing different carbon pools
and fluxes. The size of pools
(Pg) is represented from Lal
(2008). The changes in net
source or sink levels (PgC
year-1) in different pools
represent decadal average
values (2002–2011) with
uncertainties reported as ±1
sigma (68 % confidence that the
real value lies within the given
interval) as in Le Quere et al.
(2013)
Fig. 2 Full record of atmospheric CO2 at Mauna Loa Observatory—
‘‘The Keeling Curve’’ (source http://www.esrl.noaa.gov/gmd/ccgg/
trends/ and reference: Dr. Pieter Tans, NOAA/ESRL, www.esrl.noaa.
gov/gmd/ccgg/trends/ and Dr. Ralph Keeling, Scripps Institution of
Oceanography, scrippsco2.ucsd.edu/) (with permission from Dr. Pieter
Tans)
100 Ind J Plant Physiol. (April–June 2013) 18(2):98–117
123
understanding of its patterns and variability, study of pro-
cesses and interactions and approaches for carbon man-
agement. It also provides the annual updates of the
estimates of the global carbon budgets.
Components of ecosystem carbon cycling and their
estimation
The fundamental model of ecosystem carbon cycling
(Woodwell and Whittaker 1968) embedded in the models
of global carbon cycle is as follows:
NEE or NEP ¼ NPP� Rh: ð1Þ
Alternatively,
NEE or NEP ¼ P� Rmd� Ra� Rh: ð2Þ
GPP is the gross primary production (equivalent to
P - Rmd), P is the photosynthesis, Rmd is the leaf mainte-
nance respiration during day time and is a function of leaf
nitrogen concentration (Ryan 1991), NPP is the net primary
production, Ra is the autotrophic respiration, NEE is the net
ecosystem exchange, NEP is the net ecosystem production
and Rh is the heterotrophic respiration. If Ra \ NPP then
ecosystem acts as carbon sink and if Rh [ NPP then it acts as
net C source (Pietsch and Hasenauer 2009). Part of the car-
bon store of NEP is also lost and the final stored carbon is
termed the net biome production. This is the difference
between the amount of carbon fixed by photosynthetic
assimilation and the amount lost by the oxidation or removal
of plant material by all routes. The NEP of three major
regions of earth is as follows, 0.8 GtC year-1 for North
America, 1.7 GtC year-1 for Eurasia and 0.4 GtC year-1 for
the tropics (Schimel et al. 2001).
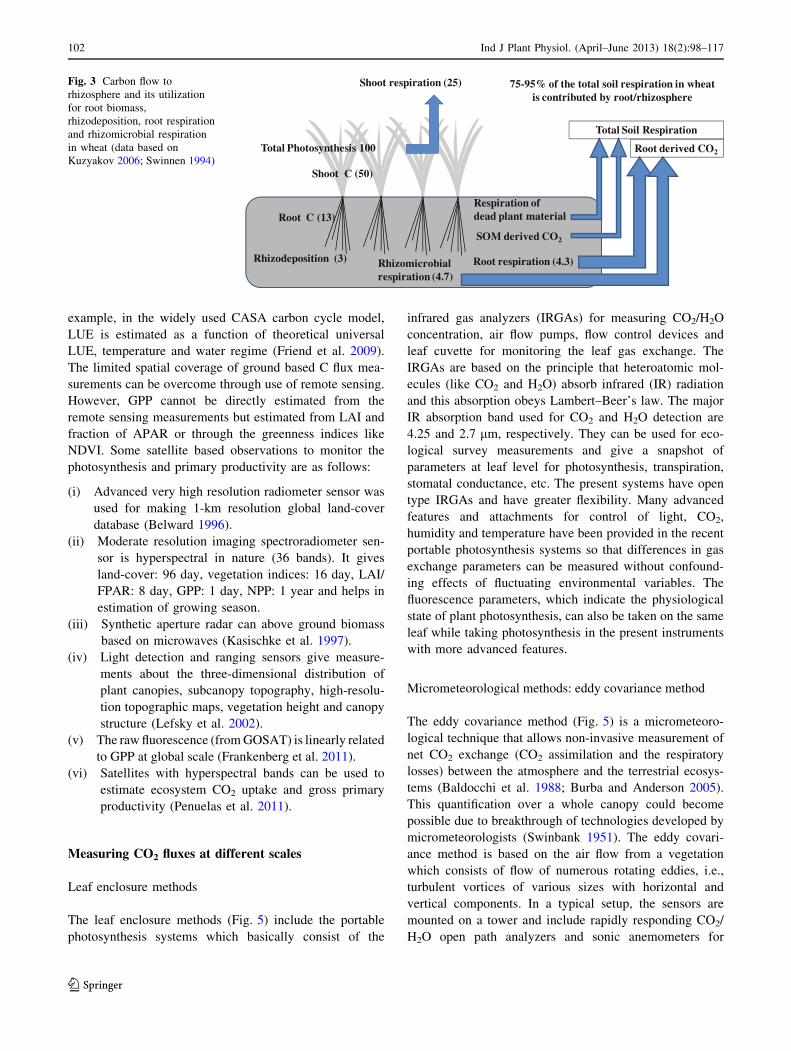
On an average, about 80 % of GPP is released to the
atmosphere through respiration (Law et al. 2000), of
which CO2 released from the soil is a substantial part.
Therefore, respiration may be more important than pho-
tosynthesis in relation to the interannual variability in
NEP (Valentini et al. 2000). Soil respiration can be further
divided into different components (Fig. 3) viz. root res-
piration, rhizomicrobial respiration, decomposition of
plant residues, the priming effect induced by root exuda-
tion or by addition of plant residues and basal respiration
by microbial decomposition of soil organic matter (SOM).
Evidences indicate that canopy photosynthesis influences
soil respiration (Kuzyakov and Gavrichkova 2010) and its
speed is based on phloem transport (Mencuccini and
Holtta 2010). Chapin III et al. (2009) emphasized a close
coupling between NPP and heterotrophic respiration (Rh)
because NPP constrains the food available to heterotrophs.
Nearly 40 % of the net fixed carbon is allocated below-
ground (Jones et al. 2009). Of the belowground partitioned
carbon, 50 % resides in root biomass, 33 % is used for res-
piration and 12 % is recorded as soil residues. Jackson et al.
(1997) highlighted the role of fine roots and estimated that
global fine root carbon constitutes about 5 % of all carbon in
the atmosphere and represents about 33 % of global annual
NPP. The root turnover represents annual root production
divided by maximum standing root biomass expressed on per
year basis. A compilation of root turnover across different
climates and vegetation types based on sequential root bio-
mass estimates was overviewed by Gill and Jackson (2000).
Some values of root turnover are as follows—whole tree root
systems (0.10/year), shrublands (0.34/year), fine root system
in grasslands, wet lands or forests (0.53–0.56/year) and fine
root in tropical vegetation (0.6–0.9/year).
Leith and Wittaker (1975) estimated global NPP based
on temperature data and actual evapotranspiration. The
direct estimation of NPP is a time consuming and
labour-intensive process. It also requires the information
on accumulation and turnover of carbon pools in bio-
mass, leaves, shoots, roots, exudates, volatile organic
compounds over a period of time. In reality, estimation
of all these is seldom done and therefore the accuracy of
NPP assessments have been questioned (Geider et al.
2001). The NPP and annual carbon inputs to agro eco-
system estimated by Bolinder et al. (2007) used a series
of plant carbon allocation coefficients for each crop type,
shoot to root ratios and yields. From these, the below-
ground net primary production can be estimated. Johnson
et al. (2006) suggested estimation of source carbon from
crop residues, root studies, rhizodeposits and crop yields.
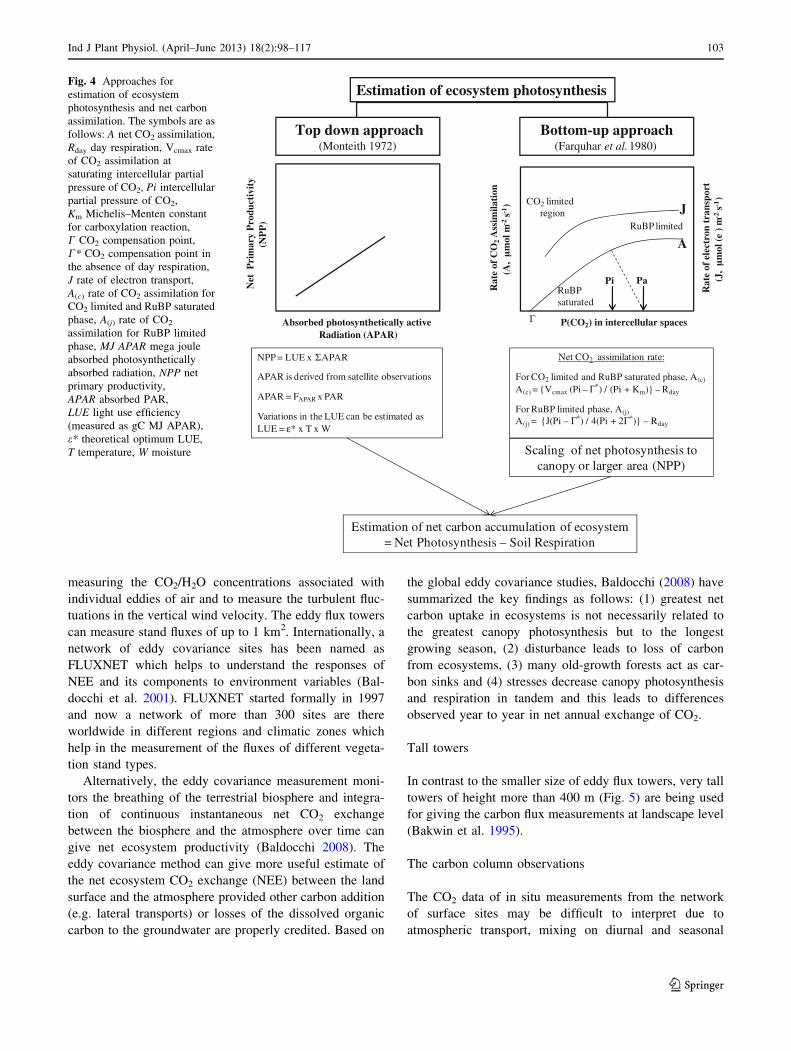
The NPP and NEP can be estimated through photosyn-
thesis models (Fig. 4) based on the bottom-up and the top-
down approach. In the bottom-up approach the rate of
photosynthesis in plants can be mechanistically calculated
using enzyme kinetics, leaf temperature, absorbed radiation
and photosynthetic electron transport rate according to
different models (Farquhar et al. 1980; DePury and Far-
quhar 1997; Laisk and Edwards 2000). In the top-down
approach, the light use efficiency (LUE) concept originally
given by Monteith (1972) is used and it states that the
photosynthetic production is a function of the absorbed
PAR (APAR) and the efficiency. Integration of the
instantaneous rate of photosynthesis over time (typically a
growing season) and space (typically canopies, stands or
regions) can be expressed as primary productivity or NPP.
The LUE model can be readily applied at several temporal
and spatial scales and can be linked to remote sensing.
Now the remote sensing has become an essential tool for
estimation of photosynthesis and NPP (Gamon et al. 2007).
Both PAR and FAPAR can be determined from remote
sensing (Gamon et al. 2007). The LUE, e, may be a fixed
coefficient or a variable depending upon the environmental
conditions particularly moisture and temperature. For
Ind J Plant Physiol. (April–June 2013) 18(2):98–117 101
123
example, in the widely used CASA carbon cycle model,
LUE is estimated as a function of theoretical universal
LUE, temperature and water regime (Friend et al. 2009).
The limited spatial coverage of ground based C flux mea-
surements can be overcome through use of remote sensing.
However, GPP cannot be directly estimated from the
remote sensing measurements but estimated from LAI and
fraction of APAR or through the greenness indices like
NDVI. Some satellite based observations to monitor the
photosynthesis and primary productivity are as follows:
(i) Advanced very high resolution radiometer sensor was
used for making 1-km resolution global land-cover
database (Belward 1996).
(ii) Moderate resolution imaging spectroradiometer sen-
sor is hyperspectral in nature (36 bands). It gives
land-cover: 96 day, vegetation indices: 16 day, LAI/
FPAR: 8 day, GPP: 1 day, NPP: 1 year and helps in
estimation of growing season.
(iii) Synthetic aperture radar can above ground biomass
based on microwaves (Kasischke et al. 1997).
(iv) Light detection and ranging sensors give measure-
ments about the three-dimensional distribution of
plant canopies, subcanopy topography, high-resolu-
tion topographic maps, vegetation height and canopy
structure (Lefsky et al. 2002).
(v) The raw fluorescence (from GOSAT) is linearly related
to GPP at global scale (Frankenberg et al. 2011).
(vi) Satellites with hyperspectral bands can be used to
estimate ecosystem CO2 uptake and gross primary
productivity (Penuelas et al. 2011).
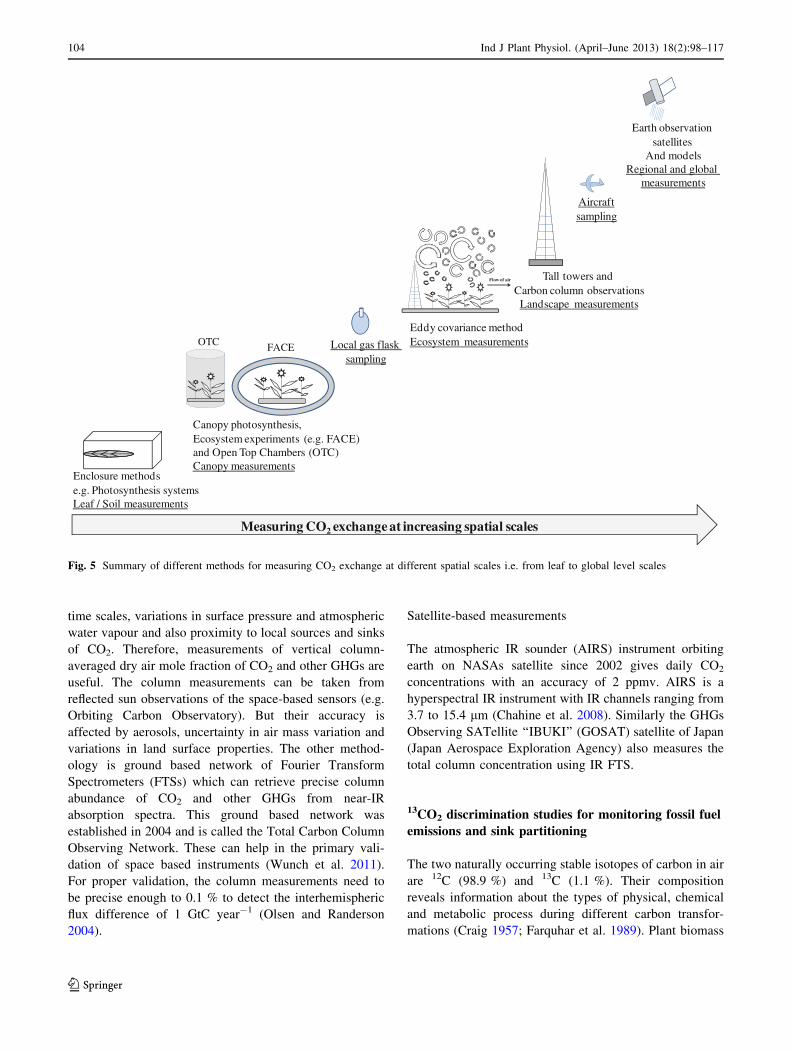
Measuring CO2 fluxes at different scales
Leaf enclosure methods
The leaf enclosure methods (Fig. 5) include the portable
photosynthesis systems which basically consist of the
infrared gas analyzers (IRGAs) for measuring CO2/H2O
concentration, air flow pumps, flow control devices and
leaf cuvette for monitoring the leaf gas exchange. The
IRGAs are based on the principle that heteroatomic mol-
ecules (like CO2 and H2O) absorb infrared (IR) radiation
and this absorption obeys Lambert–Beer’s law. The major
IR absorption band used for CO2 and H2O detection are
4.25 and 2.7 lm, respectively. They can be used for eco-
logical survey measurements and give a snapshot of
parameters at leaf level for photosynthesis, transpiration,
stomatal conductance, etc. The present systems have open
type IRGAs and have greater flexibility. Many advanced
features and attachments for control of light, CO2,
humidity and temperature have been provided in the recent
portable photosynthesis systems so that differences in gas
exchange parameters can be measured without confound-
ing effects of fluctuating environmental variables. The
fluorescence parameters, which indicate the physiological
state of plant photosynthesis, can also be taken on the same
leaf while taking photosynthesis in the present instruments
with more advanced features.
Micrometeorological methods: eddy covariance method
The eddy covariance method (Fig. 5) is a micrometeoro-
logical technique that allows non-invasive measurement of
net CO2 exchange (CO2 assimilation and the respiratory
losses) between the atmosphere and the terrestrial ecosys-
tems (Baldocchi et al. 1988; Burba and Anderson 2005).
This quantification over a whole canopy could become
possible due to breakthrough of technologies developed by
micrometeorologists (Swinbank 1951). The eddy covari-
ance method is based on the air flow from a vegetation
which consists of flow of numerous rotating eddies, i.e.,
turbulent vortices of various sizes with horizontal and
vertical components. In a typical setup, the sensors are
mounted on a tower and include rapidly responding CO2/
H2O open path analyzers and sonic anemometers for
Total Photosynthesis 100
Shoot C (50)
Shoot respiration (25)
Root C (13)
Rhizodeposition (3) Root respiration (4.3)Rhizomicrobial respiration (4.7)
Respiration of dead plant material
SOM derived CO2
Total Soil Respiration
75-95% of the total soil respiration in wheat is contributed by root/rhizosphere
Root derived CO2
Fig. 3 Carbon flow to
rhizosphere and its utilization
for root biomass,
rhizodeposition, root respiration
and rhizomicrobial respiration
in wheat (data based on
Kuzyakov 2006; Swinnen 1994)
102 Ind J Plant Physiol. (April–June 2013) 18(2):98–117
123
measuring the CO2/H2O concentrations associated with
individual eddies of air and to measure the turbulent fluc-
tuations in the vertical wind velocity. The eddy flux towers
can measure stand fluxes of up to 1 km2. Internationally, a
network of eddy covariance sites has been named as
FLUXNET which helps to understand the responses of
NEE and its components to environment variables (Bal-
docchi et al. 2001). FLUXNET started formally in 1997
and now a network of more than 300 sites are there
worldwide in different regions and climatic zones which
help in the measurement of the fluxes of different vegeta-
tion stand types.
Alternatively, the eddy covariance measurement moni-
tors the breathing of the terrestrial biosphere and integra-
tion of continuous instantaneous net CO2 exchange
between the biosphere and the atmosphere over time can
give net ecosystem productivity (Baldocchi 2008). The
eddy covariance method can give more useful estimate of
the net ecosystem CO2 exchange (NEE) between the land
surface and the atmosphere provided other carbon addition
(e.g. lateral transports) or losses of the dissolved organic
carbon to the groundwater are properly credited. Based on
the global eddy covariance studies, Baldocchi (2008) have
summarized the key findings as follows: (1) greatest net
carbon uptake in ecosystems is not necessarily related to
the greatest canopy photosynthesis but to the longest
growing season, (2) disturbance leads to loss of carbon
from ecosystems, (3) many old-growth forests act as car-
bon sinks and (4) stresses decrease canopy photosynthesis
and respiration in tandem and this leads to differences
observed year to year in net annual exchange of CO2.
Tall towers
In contrast to the smaller size of eddy flux towers, very tall
towers of height more than 400 m (Fig. 5) are being used
for giving the carbon flux measurements at landscape level
(Bakwin et al. 1995).
The carbon column observations
The CO2 data of in situ measurements from the network
of surface sites may be difficult to interpret due to
atmospheric transport, mixing on diurnal and seasonal
NPP = LUE x APAR
Estimation of ecosystem photosynthesis
Bottom-up approach(Farquhar et al. 1980)
Top down approach (Monteith 1972)
Net
Pri
mar
y P
rodu
ctiv
ity
(NP
P)
Absorbed photosynthetically active Radiation (APAR)
NPP = LUE x APARΣ
APAR is derived from satellite observations
APAR = FAPAR x PAR
Variations in the LUE can be estimated asLUE = ε* x T x W
NPP = LUE x APAR
J
A
Rat
e of
CO
2A
ssim
ilati
on(A
, µ
mol
m-2
s-1)
P(CO2) in intercellular spaces
CO2 limited region
RuBP saturated
RuBP limited
PaPi
Rat
e of
ele
ctro
n tr
ansp
ort
(J,
µm
ol (
e )
m-2
s-1)
Γ
Net CO2 assimilation rate:
For CO2 limited and RuBP saturated phase, A(c)
A(c) = {Vcmax (Pi – Γ*) / (Pi + Km)} – Rday
For RuBP limited phase, A(j)
A(j) = {J(Pi – Γ*) / 4(Pi + 2Γ*)} – Rday
Scaling of net photosynthesis to canopy or larger area (NPP)
Estimation of net carbon accumulation of ecosystem= Net Photosynthesis – Soil Respiration
Fig. 4 Approaches for
estimation of ecosystem
photosynthesis and net carbon
assimilation. The symbols are as
follows: A net CO2 assimilation,
Rday day respiration, Vcmax rate
of CO2 assimilation at
saturating intercellular partial
pressure of CO2, Pi intercellular
partial pressure of CO2,
Km Michelis–Menten constant
for carboxylation reaction,
C CO2 compensation point,
C* CO2 compensation point in
the absence of day respiration,
J rate of electron transport,
A(c) rate of CO2 assimilation for
CO2 limited and RuBP saturated
phase, A(j) rate of CO2
assimilation for RuBP limited
phase, MJ APAR mega joule
absorbed photosynthetically
absorbed radiation, NPP net
primary productivity,
APAR absorbed PAR,
LUE light use efficiency
(measured as gC MJ APAR),
e* theoretical optimum LUE,
T temperature, W moisture
Ind J Plant Physiol. (April–June 2013) 18(2):98–117 103
123
time scales, variations in surface pressure and atmospheric
water vapour and also proximity to local sources and sinks
of CO2. Therefore, measurements of vertical column-
averaged dry air mole fraction of CO2 and other GHGs are
useful. The column measurements can be taken from
reflected sun observations of the space-based sensors (e.g.
Orbiting Carbon Observatory). But their accuracy is
affected by aerosols, uncertainty in air mass variation and
variations in land surface properties. The other method-
ology is ground based network of Fourier Transform
Spectrometers (FTSs) which can retrieve precise column
abundance of CO2 and other GHGs from near-IR
absorption spectra. This ground based network was
established in 2004 and is called the Total Carbon Column
Observing Network. These can help in the primary vali-
dation of space based instruments (Wunch et al. 2011).
For proper validation, the column measurements need to
be precise enough to 0.1 % to detect the interhemispheric
flux difference of 1 GtC year-1 (Olsen and Randerson
2004).
Satellite-based measurements
The atmospheric IR sounder (AIRS) instrument orbiting
earth on NASAs satellite since 2002 gives daily CO2
concentrations with an accuracy of 2 ppmv. AIRS is a
hyperspectral IR instrument with IR channels ranging from
3.7 to 15.4 lm (Chahine et al. 2008). Similarly the GHGs
Observing SATellite ‘‘IBUKI’’ (GOSAT) satellite of Japan
(Japan Aerospace Exploration Agency) also measures the
total column concentration using IR FTS.
13CO2 discrimination studies for monitoring fossil fuel
emissions and sink partitioning
The two naturally occurring stable isotopes of carbon in air
are 12C (98.9 %) and 13C (1.1 %). Their composition
reveals information about the types of physical, chemical
and metabolic process during different carbon transfor-
mations (Craig 1957; Farquhar et al. 1989). Plant biomass
Flow of air
Enclosure methodse.g. Photosynthesis systemsLeaf / Soil measurements
Canopy photosynthesis,Ecosystem experiments (e.g. FACE)and Open Top Chambers (OTC)Canopy measurements
Eddy covariance methodEcosystem measurements
Tall towers and Carbon column observationsLandscape measurements
Earth observation satellites
And modelsRegional and global
measurements
Measuring CO2 exchange at increasing spatial scales
FACEOTC Local gas flask sampling
Aircraftsampling
Fig. 5 Summary of different methods for measuring CO2 exchange at different spatial scales i.e. from leaf to global level scales
104 Ind J Plant Physiol. (April–June 2013) 18(2):98–117
123
shows lesser abundance of 13C as compared to atmosphere
and therefore carbon isotope discrimination occurs during
photosynthesis. Rubisco has higher ability to discriminate13CO2 (d or carbon isotope discrimination values of about
-27 %) as compared to C4 (-5.7 %) plant where the first
fixation of CO2 occours via PEP carboxylase enzyme. The
study of 13C has advantage that all the carbon pools of
plant are labeled, it is non intrusive method and there is
easy handling due to non-radioactivity. Studies on carbon
isotope composition of atmosphere and the ecosystem
carbon isotope discrimination were pioneered by Keeling
(1958, 1960, 1961). These studies revealed that during
daytime, the concentration of 12CO2 are reduced faster
compared to 13CO2 due to isotopic discrimination by
plants. This leads to enrichment of 13CO2 in air during
daytime and during night 12CO2 concentration of air is
increased. Also CO2 concentration and isotope composi-
tion in forest air undergo a regular daily cycle that reflects
the influence of photosynthesis, respiration and atmo-
spheric mixing. Based on this, estimate of the isotope
composition of the respired air can be made using a clas-
sical graphical approach now called as ‘Keeling Plot’. It
has become a standard tool in ecosystem physiology. The
isotopic composition in air is being monitored in the
NOAA/CMDL cooperative sampling network since 1991.
There is global d13CO2 observation network e.g. NOAA/
ESRL which helps in partitioning of the fluxes at finer
spatial and temporal scales (Balantyne et al. 2011).
The carbon isotope discrimination studies have also
provided evidence of the increased atmospheric CO2 due
to burning of fossil fuels. Study of Antarctic ice cores by
Francey et al. (1999) showed a rapid decline of d13C in
the modern era compared with the preindustrial area.
Also, Ciais et al. (1995) were able to locate a large
Northern Hemisphere terrestrial CO2 sink. Battle et al.
(2000) also observed general agreement of the variability
of global carbon sinks with atmospheric CO2 and d13C
values. Based on the studies it has also emerged that the
global flux weighted estimate of discrimination by ter-
restrial biosphere is highly sensitive to total annual pre-
cipitation amount and to a lesser extent to mean annual
temperature (Pataki et al. 2003). Carbon isotope discrim-
ination studies have also been used to partition the net
CO2 uptake between land and oceans. This is based on the
preferential uptake of 12C by the land relative to oceans.
The partitioning of sink activity on the earth surface into
terrestrial and oceanic components is because land dis-
criminates against 13C by about 18 % whereas uptake by
oceans discriminates by about only 2 %. However, earlier
studies have also indicated that temporal variations in
isotope discrimination may occur within a season and
between years in a given biome and this dynamics may
also need to be considered in the partitioning of
atmospheric CO2 between terrestrial biosphere and ocean
(Ciais et al. 1995; Flanagan et al. 1997).
Monitoring roots, soil organic carbon and soil CO2
partitioning
The knowledge of the root system is limited. The effects of
human activities on the belowground zone of earth’s
‘‘critical zone’’ have also not been well quantified (Richter
and Mobley 2009). The contribution of plant roots to soil
and atmospheric carbon is significant and difficult to sur-
vey accurately. The traditional methods are destructive,
labour intensive and limited by soil volume or surface area
to be assessed (Bohm 1979), however, several advances in
the root studies have lead to a better understanding of root
growth, architecture and behavior (Mancuso 2012). Some
methods for measuring root biomass, length, architecture
and functioning are as follows:
(i) Soil core sampling helps in measuring root length
density and surface area parameters.
(ii) Trench profile wall method helps in tracing root
distribution in the soil profile.
(iii) Minirhizotrons allow frequent root observation and
estimation of root production and root longevity.
(iv) High-throughput imaging systems can be used for
studying the root architecture (French et al. 2012).
(v) Ground penetrating radar or microwaves can be
used for estimating the root length, coarse woody
roots, biomass, root diameter and spatial distribution
of roots non-destructively (Hruska et al. 1999;
Butnor et al. 2001).
(vi) Electrical impedance spectroscopy is based on
correlation between electrical capacitance and resis-
tance of roots with root biomass and morphology
e.g., surface area (Repo et al. 2012).
(vii) Multi-electrode resistivity imaging is based on
relationships between root biomass and electrical
resistivity of soils. It helps in visualizing the
distribution of soil volumes with different root
densities rapidly and with minimum disturbance
(Amato et al. 2012).
The measurements of long term soil carbon stock
changes are important but it is difficult and requires
intensive sampling. Moreover it is also needed to gener-
alize the linking of the pool changes with environmental
changes. Several methods have been provided for assess-
ment of soil carbon and in situ soil carbon measurement
(Lal et al. 2001; Gehl and Rice 2007). Also, there is a need
of devising proper sampling strategy and replications for
monitoring carbon stocks in the soil profile (Kravchenko
and Robertson 2011). Some methods e.g. soil reflectance
Ind J Plant Physiol. (April–June 2013) 18(2):98–117 105
123
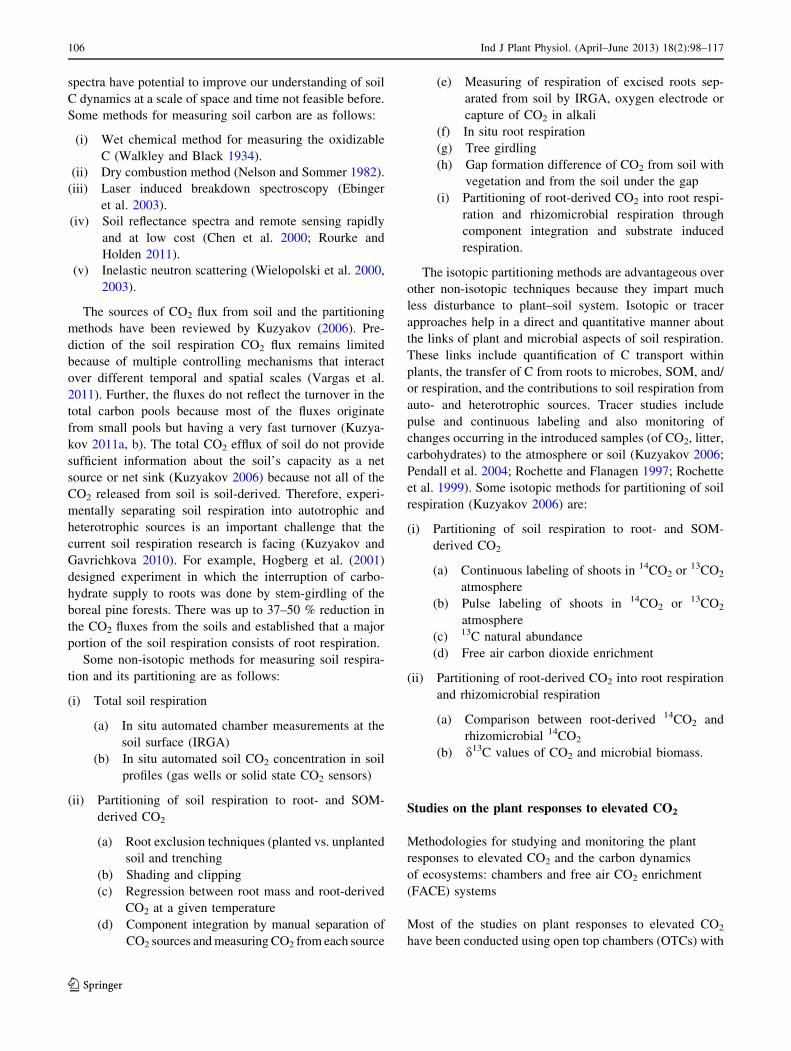
spectra have potential to improve our understanding of soil
C dynamics at a scale of space and time not feasible before.
Some methods for measuring soil carbon are as follows:
(i) Wet chemical method for measuring the oxidizable
C (Walkley and Black 1934).
(ii) Dry combustion method (Nelson and Sommer 1982).
(iii) Laser induced breakdown spectroscopy (Ebinger
et al. 2003).
(iv) Soil reflectance spectra and remote sensing rapidly
and at low cost (Chen et al. 2000; Rourke and
Holden 2011).
(v) Inelastic neutron scattering (Wielopolski et al. 2000,
2003).
The sources of CO2 flux from soil and the partitioning
methods have been reviewed by Kuzyakov (2006). Pre-
diction of the soil respiration CO2 flux remains limited
because of multiple controlling mechanisms that interact
over different temporal and spatial scales (Vargas et al.
2011). Further, the fluxes do not reflect the turnover in the
total carbon pools because most of the fluxes originate
from small pools but having a very fast turnover (Kuzya-
kov 2011a, b). The total CO2 efflux of soil do not provide
sufficient information about the soil’s capacity as a net
source or net sink (Kuzyakov 2006) because not all of the
CO2 released from soil is soil-derived. Therefore, experi-
mentally separating soil respiration into autotrophic and
heterotrophic sources is an important challenge that the
current soil respiration research is facing (Kuzyakov and
Gavrichkova 2010). For example, Hogberg et al. (2001)
designed experiment in which the interruption of carbo-
hydrate supply to roots was done by stem-girdling of the
boreal pine forests. There was up to 37–50 % reduction in
the CO2 fluxes from the soils and established that a major
portion of the soil respiration consists of root respiration.
Some non-isotopic methods for measuring soil respira-
tion and its partitioning are as follows:
(i) Total soil respiration
(a) In situ automated chamber measurements at the
soil surface (IRGA)
(b) In situ automated soil CO2 concentration in soil
profiles (gas wells or solid state CO2 sensors)
(ii) Partitioning of soil respiration to root- and SOM-
derived CO2
(a) Root exclusion techniques (planted vs. unplanted
soil and trenching
(b) Shading and clipping
(c) Regression between root mass and root-derived
CO2 at a given temperature
(d) Component integration by manual separation of
CO2 sources and measuring CO2 from each source
(e) Measuring of respiration of excised roots sep-
arated from soil by IRGA, oxygen electrode or
capture of CO2 in alkali
(f) In situ root respiration
(g) Tree girdling
(h) Gap formation difference of CO2 from soil with
vegetation and from the soil under the gap
(i) Partitioning of root-derived CO2 into root respi-
ration and rhizomicrobial respiration through
component integration and substrate induced
respiration.
The isotopic partitioning methods are advantageous over
other non-isotopic techniques because they impart much
less disturbance to plant–soil system. Isotopic or tracer
approaches help in a direct and quantitative manner about
the links of plant and microbial aspects of soil respiration.
These links include quantification of C transport within
plants, the transfer of C from roots to microbes, SOM, and/
or respiration, and the contributions to soil respiration from
auto- and heterotrophic sources. Tracer studies include
pulse and continuous labeling and also monitoring of
changes occurring in the introduced samples (of CO2, litter,
carbohydrates) to the atmosphere or soil (Kuzyakov 2006;
Pendall et al. 2004; Rochette and Flanagen 1997; Rochette
et al. 1999). Some isotopic methods for partitioning of soil
respiration (Kuzyakov 2006) are:
(i) Partitioning of soil respiration to root- and SOM-
derived CO2
(a) Continuous labeling of shoots in 14CO2 or 13CO2
atmosphere
(b) Pulse labeling of shoots in 14CO2 or 13CO2
atmosphere
(c) 13C natural abundance
(d) Free air carbon dioxide enrichment
(ii) Partitioning of root-derived CO2 into root respiration
and rhizomicrobial respiration
(a) Comparison between root-derived 14CO2 and
rhizomicrobial 14CO2
(b) d13C values of CO2 and microbial biomass.
Studies on the plant responses to elevated CO2
Methodologies for studying and monitoring the plant
responses to elevated CO2 and the carbon dynamics
of ecosystems: chambers and free air CO2 enrichment
(FACE) systems
Most of the studies on plant responses to elevated CO2
have been conducted using open top chambers (OTCs) with
106 Ind J Plant Physiol. (April–June 2013) 18(2):98–117
123
diameter of 2–3 m and height of about 2–3 m. The OTCs
with open circular top are made of aluminum frame lined
with transparent PVC sheets. The enclosures/OTCs alter
the canopy microclimate and thus influence transpiration.
However, FACE technology provides natural environment
in terms of crop microclimate. Thus, FACE provides a
better understanding and measurements of stomatal
responses to elevated CO2, canopy evapotranspiration and
soil moisture as compared to enclosure studies. The CO2
exchange dynamics in the vegetation and soil requires use
of ecosystem experimental setups as FACE (Fig. 6). FACE
experiments have provided valuable insight about the
cycling and storage of carbon in the terrestrial ecosystems
(Ainsworth and Long 2005; Norby and Zak 2011). FACE
systems cover large diameter up to 30 m and can accom-
modate trees up to 20 m tall. FACE has therefore, advan-
tage of larger size, longer experimental duration and no
undesirable artifacts due to chamber walls as compared to
OTCs (Hendrey et al. 1999). For example, reports on sto-
matal conductance of trees in growth chambers ranged
from a 5 % increase to a 25 % decrease (Curtis and Wang
1998), whereas in FACE experiments, a 16–23 % decrease
was observed (Ainsworth and Rogers 2007). FACE studies
help in the integration of processes and complexities of the
ecosystems and thus their results can be more interpretable
in relation to the carbon cycle. These ecosystem experi-
ments help in monitoring the response of plant community
or stand, soil, larger and older trees, NPP, etc. which is not
possible from OTCs. Thus FACE studies are useful for
validation of ecosystem models (Leakey et al. 2012). The
study of the impacts of elevated CO2 concentration on
plant responses under changing climate and monitoring of
the carbon fluxes will provide a holistic understanding of
the role of global carbon cycle (Fig. 7).
Plant responses to elevated CO2
Plants growing under elevated atmospheric CO2 are usually
larger due to availability of additional photosynthates
because the present levels of CO2 are lesser than that required
for saturation particularly in C3 plants. The magnitude of
growth stimulation varies depending upon photosynthetic
pathway strategies (Abrol et al. 1991). In FACE experi-
ments, an average increase of 17 % for the aboveground, and
more than 30 % for the belowground portions of plants has
been reported (Ainsworth and Long 2005; de Graaff et al.
2006). The yield of crops also increased by 12–14 % under
elevated CO2 in FACE experiments (Ainsworth 2008; Long
et al. 2006). The increased growth responses may occur
directly due to the increased substrate supply e.g. sucrose or
due to the role of sucrose as a chemical signal by mediating
cyclin activity and thereby promoting cell division (Riou-
Khamlichi et al. 2000). The impact of elevated CO2 would
depend mainly on the acclimation or adjustment to the long
term elevated level of CO2 (Ghildiyal and Sharma-Natu
2000). Comparison of photosynthesis rate in various species
at same level of internal CO2 concentration shows that there
is either an increase or decrease in the photosynthetic
capacity. Therefore the impact of elevated CO2 on crop
production will depend upon the responsiveness of photo-
synthesis in terms of its up regulation or down regulation.
The key determinants of photosynthetic regulation are
growth behaviour and biochemical partitioning of assimi-
lates to starch and sugars. The diagrammatic representation
(Fig. 8) of photosynthetic acclimation to elevated CO2 in is
presented below. Various reviews show the meta analysis of
the plant responses to elevated CO2 (Norby and Zak 2011;
Robinson et al. 2012; Reddy et al. 2010; Pinkard et al. 2010).
It is to be noted that many responses may not upscale from
the leaf level to the plant stand or community (Norby and Zak
2011). A summary of the plant responses to elevated CO2
from reviews and case studies are given in Table 1.
Uncertainties in monitoring and implications
The uncertainties can occur due to discrepancies in the
estimation methods (Houghton 2003; Wang et al. 2009).
For instance, the CO2 concentration near the ground is
affected by the asymmetric transport phenomenon in the
atmosphere and cyclones. The uncertainties can be resolved
through detailed historical reconstructions where data are
available and can be obtained from systematic monitoring
of land use changes with satellite data. Le Quere et al.
(2010) also mentioned role of sophisticated monitoring
mechanisms and development of methods for full GHG
accounting. However, other important aspects also need to
be considered such as—the methods, their rapidity, scala-
bility, non invasiveness, cost effectiveness and accuracy.
The verifiability depends upon the stringency of the meth-
odology. More stringency can cost prohibitively at national
level and least stringency can lead to use of default values.
Intermediate scheme can be of more practical use and
require use of remote sensing, use of controlled experiments
or benchmark sites and models (Smith 2004). The highest
degrees of uncertainty in estimates occur in the source and
sink estimates of the land ecosystem as compared to the
atmosphere, ocean and fossil fuel (Le Quere et al. 2009).
The extent or estimates of these uncertainties (represented
by ±values) have been shown in Fig. 1.
Complexity in ecosystems and climate carbon cycle
feedbacks
The terrestrial CO2 exchange processes and carbon balance
depends upon multiple factors or their interactive effects
Ind J Plant Physiol. (April–June 2013) 18(2):98–117 107
123
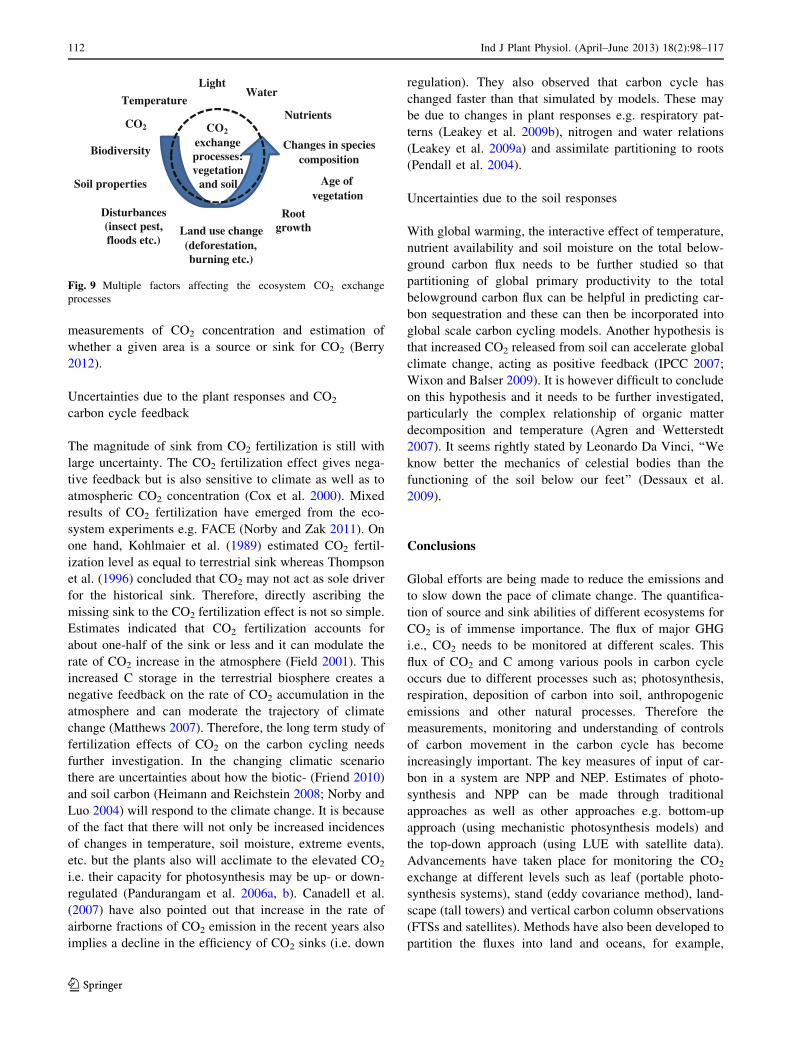
(Fig. 9) leading to complexity of the terrestrial ecosystems
and difficulties in disentangling their effects. The climate
carbon cycle feedbacks involve changes in the rate of
photosynthesis and respiration due to changes in tempera-
ture and soil moisture (Harvey 2012). Coupled atmo-
sphere–biosphere models are necessary for interpreting
A
Plenum for CO2
entry and circular distribution of CO2 into OTC
Transparent PVC sheet
Open top
B
Ring for CO2 supply and circular distribution of CO2 into the crop canopy
Supports for holding the rings above the ground
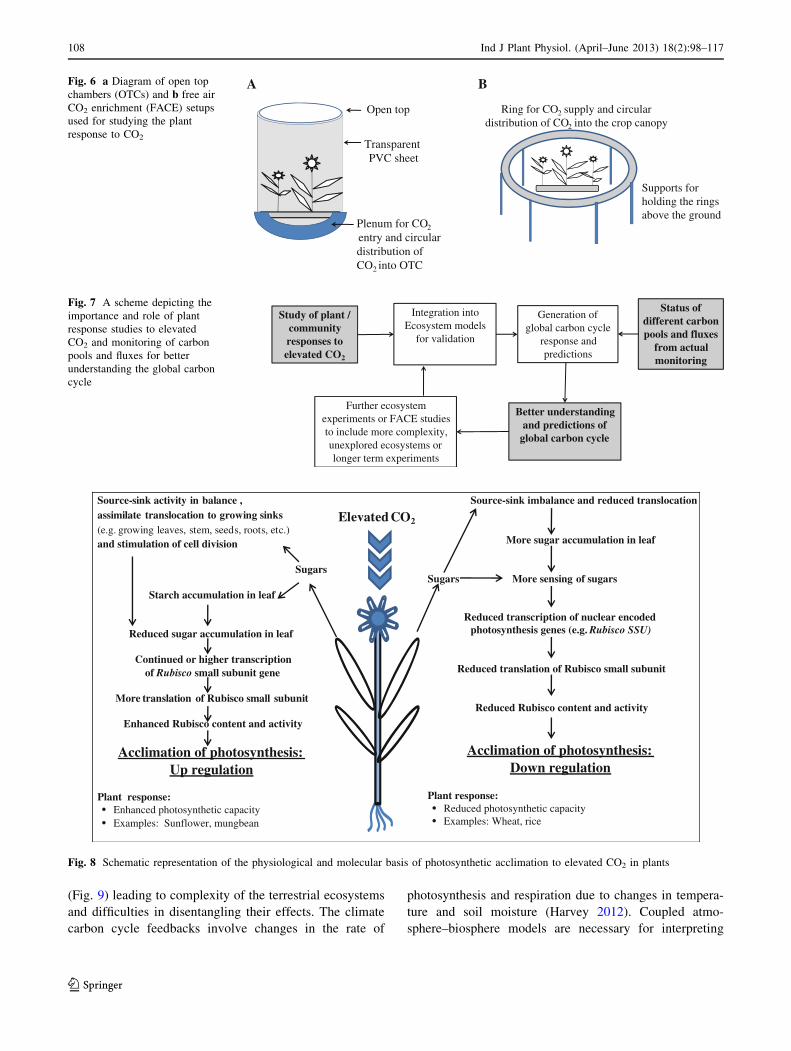
Fig. 6 a Diagram of open top
chambers (OTCs) and b free air
CO2 enrichment (FACE) setups
used for studying the plant
response to CO2
Study of plant / community responses to elevated CO2
Integration into Ecosystem models
for validation
Generation of global carbon cycle
response and predictions
Status of different carbon pools and fluxes
from actual monitoring
Better understanding and predictions of
global carbon cycle
Further ecosystem experiments or FACE studies to include more complexity, unexplored ecosystems or longer term experiments
Fig. 7 A scheme depicting the
importance and role of plant
response studies to elevated
CO2 and monitoring of carbon
pools and fluxes for better
understanding the global carbon
cycle
Source-sink activity in balance , assimilate translocation to growing sinks(e.g. growing leaves, stem, seeds, roots, etc.)and stimulation of cell division
Sugars
Starch accumulation in leaf
Reduced sugar accumulation in leaf
Continued or higher transcriptionof Rubisco small subunit gene
More translation of Rubisco small subunit
Enhanced Rubisco content and activity
Acclimation of photosynthesis: Up regulation
Plant response: • Enhanced photosynthetic capacity• Examples: Sunflower, mungbean
Elevated CO2
Source-sink imbalance and reduced translocation
More sugar accumulation in leaf
Sugars More sensing of sugars
Reduced transcription of nuclear encodedphotosynthesis genes (e.g. Rubisco SSU)
Reduced translation of Rubisco small subunit
Reduced Rubisco content and activity
Acclimation of photosynthesis: Down regulation
Plant response: • Reduced photosynthetic capacity• Examples: Wheat, rice
Fig. 8 Schematic representation of the physiological and molecular basis of photosynthetic acclimation to elevated CO2 in plants
108 Ind J Plant Physiol. (April–June 2013) 18(2):98–117
123
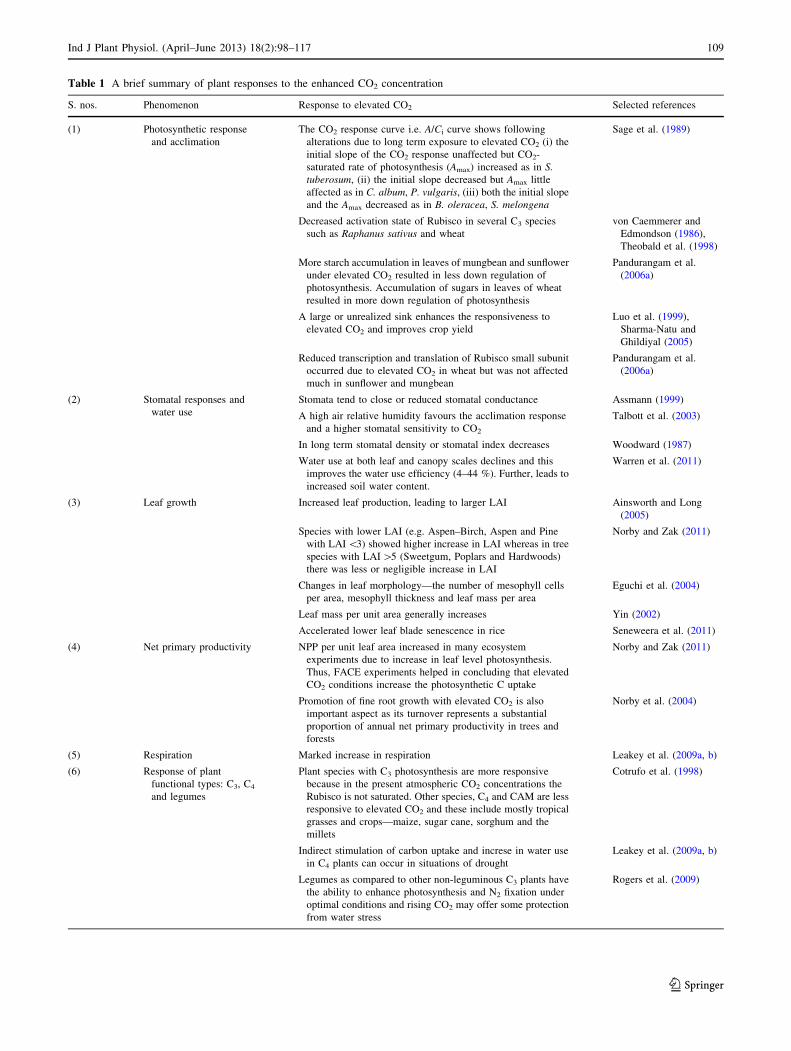
Table 1 A brief summary of plant responses to the enhanced CO2 concentration
S. nos. Phenomenon Response to elevated CO2 Selected references
(1) Photosynthetic response
and acclimation
The CO2 response curve i.e. A/Ci curve shows following
alterations due to long term exposure to elevated CO2 (i) the
initial slope of the CO2 response unaffected but CO2-
saturated rate of photosynthesis (Amax) increased as in S.
tuberosum, (ii) the initial slope decreased but Amax little
affected as in C. album, P. vulgaris, (iii) both the initial slope
and the Amax decreased as in B. oleracea, S. melongena
Sage et al. (1989)
Decreased activation state of Rubisco in several C3 species
such as Raphanus sativus and wheat
von Caemmerer and
Edmondson (1986),
Theobald et al. (1998)
More starch accumulation in leaves of mungbean and sunflower
under elevated CO2 resulted in less down regulation of
photosynthesis. Accumulation of sugars in leaves of wheat
resulted in more down regulation of photosynthesis
Pandurangam et al.
(2006a)
A large or unrealized sink enhances the responsiveness to
elevated CO2 and improves crop yield
Luo et al. (1999),
Sharma-Natu and
Ghildiyal (2005)
Reduced transcription and translation of Rubisco small subunit
occurred due to elevated CO2 in wheat but was not affected
much in sunflower and mungbean
Pandurangam et al.
(2006a)
(2) Stomatal responses and
water use
Stomata tend to close or reduced stomatal conductance Assmann (1999)
A high air relative humidity favours the acclimation response
and a higher stomatal sensitivity to CO2
Talbott et al. (2003)
In long term stomatal density or stomatal index decreases Woodward (1987)
Water use at both leaf and canopy scales declines and this
improves the water use efficiency (4–44 %). Further, leads to
increased soil water content.
Warren et al. (2011)
(3) Leaf growth Increased leaf production, leading to larger LAI Ainsworth and Long
(2005)
Species with lower LAI (e.g. Aspen–Birch, Aspen and Pine
with LAI \3) showed higher increase in LAI whereas in tree
species with LAI [5 (Sweetgum, Poplars and Hardwoods)
there was less or negligible increase in LAI
Norby and Zak (2011)
Changes in leaf morphology—the number of mesophyll cells
per area, mesophyll thickness and leaf mass per area
Eguchi et al. (2004)
Leaf mass per unit area generally increases Yin (2002)
Accelerated lower leaf blade senescence in rice Seneweera et al. (2011)
(4) Net primary productivity NPP per unit leaf area increased in many ecosystem
experiments due to increase in leaf level photosynthesis.
Thus, FACE experiments helped in concluding that elevated
CO2 conditions increase the photosynthetic C uptake
Norby and Zak (2011)
Promotion of fine root growth with elevated CO2 is also
important aspect as its turnover represents a substantial
proportion of annual net primary productivity in trees and
forests
Norby et al. (2004)
(5) Respiration Marked increase in respiration Leakey et al. (2009a, b)
(6) Response of plant
functional types: C3, C4
and legumes
Plant species with C3 photosynthesis are more responsive
because in the present atmospheric CO2 concentrations the
Rubisco is not saturated. Other species, C4 and CAM are less
responsive to elevated CO2 and these include mostly tropical
grasses and crops—maize, sugar cane, sorghum and the
millets
Cotrufo et al. (1998)
Indirect stimulation of carbon uptake and increse in water use
in C4 plants can occur in situations of drought
Leakey et al. (2009a, b)
Legumes as compared to other non-leguminous C3 plants have
the ability to enhance photosynthesis and N2 fixation under
optimal conditions and rising CO2 may offer some protection
from water stress
Rogers et al. (2009)
Ind J Plant Physiol. (April–June 2013) 18(2):98–117 109
123
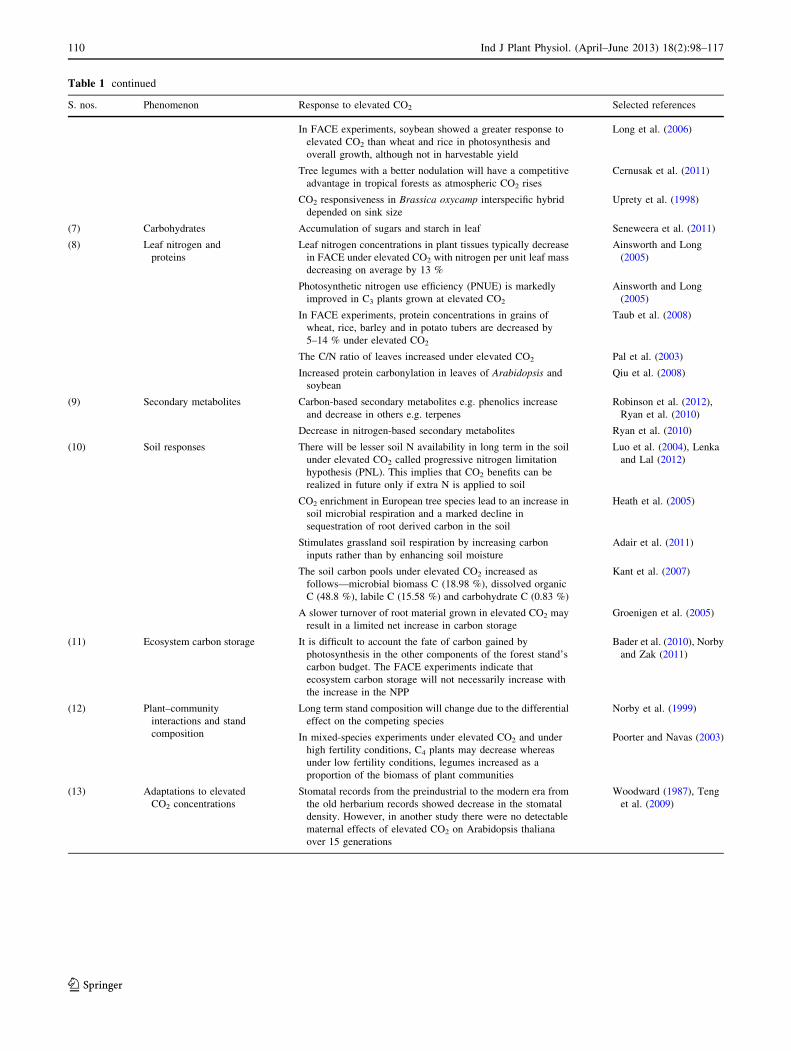
Table 1 continued
S. nos. Phenomenon Response to elevated CO2 Selected references
In FACE experiments, soybean showed a greater response to
elevated CO2 than wheat and rice in photosynthesis and
overall growth, although not in harvestable yield
Long et al. (2006)
Tree legumes with a better nodulation will have a competitive
advantage in tropical forests as atmospheric CO2 rises
Cernusak et al. (2011)
CO2 responsiveness in Brassica oxycamp interspecific hybrid
depended on sink size
Uprety et al. (1998)
(7) Carbohydrates Accumulation of sugars and starch in leaf Seneweera et al. (2011)
(8) Leaf nitrogen and
proteins
Leaf nitrogen concentrations in plant tissues typically decrease
in FACE under elevated CO2 with nitrogen per unit leaf mass
decreasing on average by 13 %
Ainsworth and Long
(2005)
Photosynthetic nitrogen use efficiency (PNUE) is markedly
improved in C3 plants grown at elevated CO2
Ainsworth and Long
(2005)
In FACE experiments, protein concentrations in grains of
wheat, rice, barley and in potato tubers are decreased by
5–14 % under elevated CO2
Taub et al. (2008)
The C/N ratio of leaves increased under elevated CO2 Pal et al. (2003)
Increased protein carbonylation in leaves of Arabidopsis and
soybean
Qiu et al. (2008)
(9) Secondary metabolites Carbon-based secondary metabolites e.g. phenolics increase
and decrease in others e.g. terpenes
Robinson et al. (2012),
Ryan et al. (2010)
Decrease in nitrogen-based secondary metabolites Ryan et al. (2010)
(10) Soil responses There will be lesser soil N availability in long term in the soil
under elevated CO2 called progressive nitrogen limitation
hypothesis (PNL). This implies that CO2 benefits can be
realized in future only if extra N is applied to soil
Luo et al. (2004), Lenka
and Lal (2012)
CO2 enrichment in European tree species lead to an increase in
soil microbial respiration and a marked decline in
sequestration of root derived carbon in the soil
Heath et al. (2005)
Stimulates grassland soil respiration by increasing carbon
inputs rather than by enhancing soil moisture
Adair et al. (2011)
The soil carbon pools under elevated CO2 increased as
follows—microbial biomass C (18.98 %), dissolved organic
C (48.8 %), labile C (15.58 %) and carbohydrate C (0.83 %)
Kant et al. (2007)
A slower turnover of root material grown in elevated CO2 may
result in a limited net increase in carbon storage
Groenigen et al. (2005)
(11) Ecosystem carbon storage It is difficult to account the fate of carbon gained by
photosynthesis in the other components of the forest stand’s
carbon budget. The FACE experiments indicate that
ecosystem carbon storage will not necessarily increase with
the increase in the NPP
Bader et al. (2010), Norby
and Zak (2011)
(12) Plant–community
interactions and stand
composition
Long term stand composition will change due to the differential
effect on the competing species
Norby et al. (1999)
In mixed-species experiments under elevated CO2 and under
high fertility conditions, C4 plants may decrease whereas
under low fertility conditions, legumes increased as a
proportion of the biomass of plant communities
Poorter and Navas (2003)
(13) Adaptations to elevated
CO2 concentrations
Stomatal records from the preindustrial to the modern era from
the old herbarium records showed decrease in the stomatal
density. However, in another study there were no detectable
maternal effects of elevated CO2 on Arabidopsis thaliana
over 15 generations
Woodward (1987), Teng
et al. (2009)
110 Ind J Plant Physiol. (April–June 2013) 18(2):98–117
123
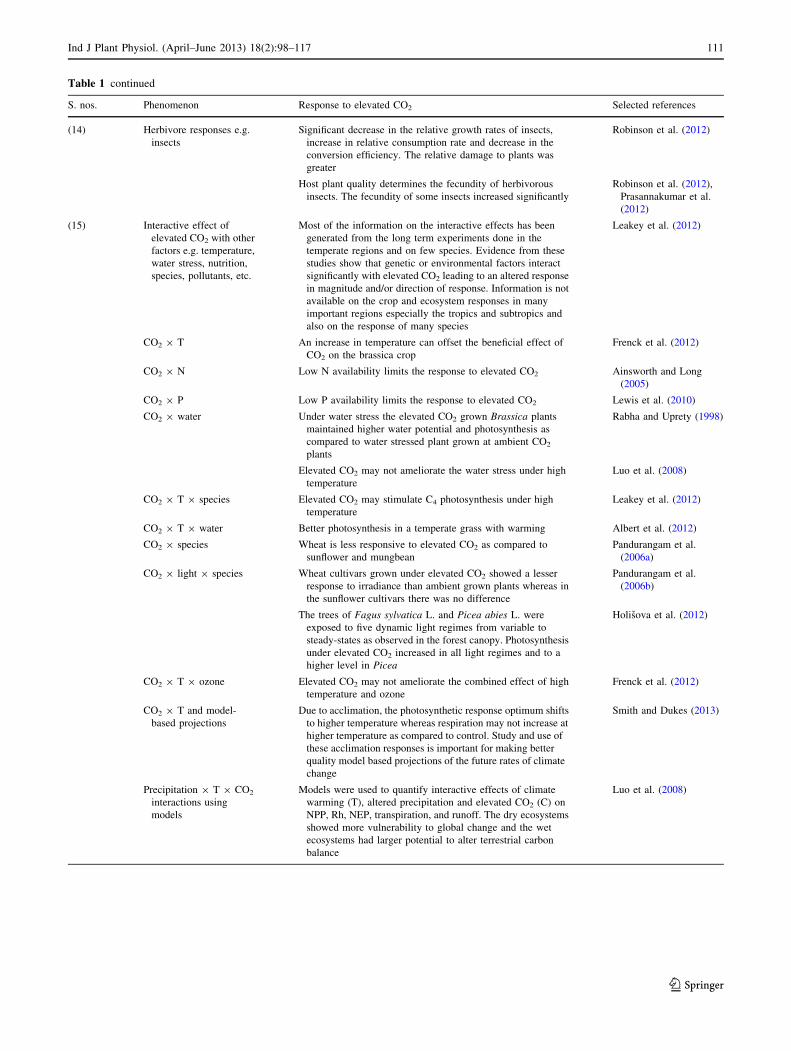
Table 1 continued
S. nos. Phenomenon Response to elevated CO2 Selected references
(14) Herbivore responses e.g.
insects
Significant decrease in the relative growth rates of insects,
increase in relative consumption rate and decrease in the
conversion efficiency. The relative damage to plants was
greater
Robinson et al. (2012)
Host plant quality determines the fecundity of herbivorous
insects. The fecundity of some insects increased significantly
Robinson et al. (2012),
Prasannakumar et al.
(2012)
(15) Interactive effect of
elevated CO2 with other
factors e.g. temperature,
water stress, nutrition,
species, pollutants, etc.
Most of the information on the interactive effects has been
generated from the long term experiments done in the
temperate regions and on few species. Evidence from these
studies show that genetic or environmental factors interact
significantly with elevated CO2 leading to an altered response
in magnitude and/or direction of response. Information is not
available on the crop and ecosystem responses in many
important regions especially the tropics and subtropics and
also on the response of many species
Leakey et al. (2012)
CO2 9 T An increase in temperature can offset the beneficial effect of
CO2 on the brassica crop
Frenck et al. (2012)
CO2 9 N Low N availability limits the response to elevated CO2 Ainsworth and Long
(2005)
CO2 9 P Low P availability limits the response to elevated CO2 Lewis et al. (2010)
CO2 9 water Under water stress the elevated CO2 grown Brassica plants
maintained higher water potential and photosynthesis as
compared to water stressed plant grown at ambient CO2
plants
Rabha and Uprety (1998)
Elevated CO2 may not ameliorate the water stress under high
temperature
Luo et al. (2008)
CO2 9 T 9 species Elevated CO2 may stimulate C4 photosynthesis under high
temperature
Leakey et al. (2012)
CO2 9 T 9 water Better photosynthesis in a temperate grass with warming Albert et al. (2012)
CO2 9 species Wheat is less responsive to elevated CO2 as compared to
sunflower and mungbean
Pandurangam et al.
(2006a)
CO2 9 light 9 species Wheat cultivars grown under elevated CO2 showed a lesser
response to irradiance than ambient grown plants whereas in
the sunflower cultivars there was no difference
Pandurangam et al.
(2006b)
The trees of Fagus sylvatica L. and Picea abies L. were
exposed to five dynamic light regimes from variable to
steady-states as observed in the forest canopy. Photosynthesis
under elevated CO2 increased in all light regimes and to a
higher level in Picea
Holisova et al. (2012)
CO2 9 T 9 ozone Elevated CO2 may not ameliorate the combined effect of high
temperature and ozone
Frenck et al. (2012)
CO2 9 T and model-
based projections
Due to acclimation, the photosynthetic response optimum shifts
to higher temperature whereas respiration may not increase at
higher temperature as compared to control. Study and use of
these acclimation responses is important for making better
quality model based projections of the future rates of climate
change
Smith and Dukes (2013)
Precipitation 9 T 9 CO2
interactions using
models
Models were used to quantify interactive effects of climate
warming (T), altered precipitation and elevated CO2 (C) on
NPP, Rh, NEP, transpiration, and runoff. The dry ecosystems
showed more vulnerability to global change and the wet
ecosystems had larger potential to alter terrestrial carbon
balance
Luo et al. (2008)
Ind J Plant Physiol. (April–June 2013) 18(2):98–117 111
123
measurements of CO2 concentration and estimation of
whether a given area is a source or sink for CO2 (Berry
2012).
Uncertainties due to the plant responses and CO2
carbon cycle feedback
The magnitude of sink from CO2 fertilization is still with
large uncertainty. The CO2 fertilization effect gives nega-
tive feedback but is also sensitive to climate as well as to
atmospheric CO2 concentration (Cox et al. 2000). Mixed
results of CO2 fertilization have emerged from the eco-
system experiments e.g. FACE (Norby and Zak 2011). On
one hand, Kohlmaier et al. (1989) estimated CO2 fertil-
ization level as equal to terrestrial sink whereas Thompson
et al. (1996) concluded that CO2 may not act as sole driver
for the historical sink. Therefore, directly ascribing the
missing sink to the CO2 fertilization effect is not so simple.
Estimates indicated that CO2 fertilization accounts for
about one-half of the sink or less and it can modulate the
rate of CO2 increase in the atmosphere (Field 2001). This
increased C storage in the terrestrial biosphere creates a
negative feedback on the rate of CO2 accumulation in the
atmosphere and can moderate the trajectory of climate
change (Matthews 2007). Therefore, the long term study of
fertilization effects of CO2 on the carbon cycling needs
further investigation. In the changing climatic scenario
there are uncertainties about how the biotic- (Friend 2010)
and soil carbon (Heimann and Reichstein 2008; Norby and
Luo 2004) will respond to the climate change. It is because
of the fact that there will not only be increased incidences
of changes in temperature, soil moisture, extreme events,
etc. but the plants also will acclimate to the elevated CO2
i.e. their capacity for photosynthesis may be up- or down-
regulated (Pandurangam et al. 2006a, b). Canadell et al.
(2007) have also pointed out that increase in the rate of
airborne fractions of CO2 emission in the recent years also
implies a decline in the efficiency of CO2 sinks (i.e. down
regulation). They also observed that carbon cycle has
changed faster than that simulated by models. These may
be due to changes in plant responses e.g. respiratory pat-
terns (Leakey et al. 2009b), nitrogen and water relations
(Leakey et al. 2009a) and assimilate partitioning to roots
(Pendall et al. 2004).
Uncertainties due to the soil responses
With global warming, the interactive effect of temperature,
nutrient availability and soil moisture on the total below-
ground carbon flux needs to be further studied so that
partitioning of global primary productivity to the total
belowground carbon flux can be helpful in predicting car-
bon sequestration and these can then be incorporated into
global scale carbon cycling models. Another hypothesis is
that increased CO2 released from soil can accelerate global
climate change, acting as positive feedback (IPCC 2007;
Wixon and Balser 2009). It is however difficult to conclude
on this hypothesis and it needs to be further investigated,
particularly the complex relationship of organic matter
decomposition and temperature (Agren and Wetterstedt
2007). It seems rightly stated by Leonardo Da Vinci, ‘‘We
know better the mechanics of celestial bodies than the
functioning of the soil below our feet’’ (Dessaux et al.
2009).
Conclusions
Global efforts are being made to reduce the emissions and
to slow down the pace of climate change. The quantifica-
tion of source and sink abilities of different ecosystems for
CO2 is of immense importance. The flux of major GHG
i.e., CO2 needs to be monitored at different scales. This
flux of CO2 and C among various pools in carbon cycle
occurs due to different processes such as; photosynthesis,
respiration, deposition of carbon into soil, anthropogenic
emissions and other natural processes. Therefore the
measurements, monitoring and understanding of controls
of carbon movement in the carbon cycle has become
increasingly important. The key measures of input of car-
bon in a system are NPP and NEP. Estimates of photo-
synthesis and NPP can be made through traditional
approaches as well as other approaches e.g. bottom-up
approach (using mechanistic photosynthesis models) and
the top-down approach (using LUE with satellite data).
Advancements have taken place for monitoring the CO2
exchange at different levels such as leaf (portable photo-
synthesis systems), stand (eddy covariance method), land-
scape (tall towers) and vertical carbon column observations
(FTSs and satellites). Methods have also been developed to
partition the fluxes into land and oceans, for example,
Biodiversity Changes in species composition
Nutrients
Disturbances (insect pest, floods etc.)
Land use change (deforestation, burning etc.)
WaterTemperature
Light
Age of vegetation
CO2 CO2
exchange processes: vegetation
and soilSoil properties
Root growth
Fig. 9 Multiple factors affecting the ecosystem CO2 exchange
processes
112 Ind J Plant Physiol. (April–June 2013) 18(2):98–117
123
discrimination of isotope of carbon (13C) by terrestrial
ecosystem processes. The CO2 exchange dynamics in the
vegetation and soil can be investigated with OTCs and
FACE. These studies help in integration of processes and
complexities of ecosystems and are useful for validation of
ecosystem models, particularly FACE. The impacts of
elevated CO2 concentration on plant responses under
changing climate and monitoring of carbon fluxes will
provide a holistic understanding of the roles of ecosystems
in global carbon cycle. Similarly, soil is a vast reservoir of
carbon and has a great potential for carbon sequestration as
well as source of emissions. Monitoring of roots, soil
carbon and CO2 fluxes from soil is therefore an essential
aspect in the era of changing climate, particularly with non-
destructive methods for rapid and large area estimations.
The uncertainties in the estimates need understanding of
the multi-factorial effects on carbon exchange processes,
plant acclimation responses and feedback response from
changing climate. Monitoring therefore needs concerted
efforts, enhancement of infrastructure for measurement at
different scales, use of multi-techniques and -disciplinary
approaches so that more constrained and better estimates
can be made. This has immense importance for determin-
ing how global environment is changing, what drives these
changes, its potential impacts and also for developing
sound policy decisions on mitigation and adaptation
strategies.
References
Abrol Y. P., Govindjee, Wattal P. N., Ort D. R., Gnanam, A., &
Terramura A. H. (Eds.) (1991). Impact of global climate changes
on photosynthesis and productivity. In Proceeding of the Indo-
US Workshop (p. 824), Jan 8–12, 1991. New Delhi: Oxford and
IBH Publishing Co. Pvt. Ltd.
Adair, E. C., Reich, P. B., Trost, J. J., & Hobbie, S. E. (2011).
Elevated CO2 stimulates grassland soil respiration by increasing
carbon inputs rather than by enhancing soil moisture. Global
Change Biology, 17, 3546–3563.
Agren, G. I., & Wetterstedt, J. A. M. (2007). What determines the
temperature response of soil organic matter decomposition? Soil
Biology and Biochemistry, 39, 1794–1798.
Ainsworth, E. A. (2008). Rice production in a changing climate: A
meta-analysis of responses to elevated carbon dioxide and
elevated ozone concentration. Global Change Biology, 14,
1642–1650.
Ainsworth, E. A., & Long, S. P. (2005). What have we learned from
15 years of free-air CO2 enrichment (FACE)? A meta-analytic
review of the responses of photosynthesis, canopy. New Phytol-
ogist, 165, 351–371.
Ainsworth, E. A., & Rogers, A. (2007). The response of photosyn-
thesis and stomatal conductance to rising [CO2]: mechanisms
and environmental interactions. Plant, Cell Environment, 30,
258–270.
Albert, K. R., Ro-Poulsen, H., Mikkelsen, T. N., Michelsen, A., van
der Linden, L., & Beier, C. (2012). Interactive effects of elevated
CO2, warming, and drought on photosynthesis of Deschampsia
flexuosa in a temperate heath ecosystem. Journal of Experimen-
tal Botany, 62, 4253–4266.
Amato, M., Lapenna, V., Rossi, R., & Bitella, G. (2012). Multi-
electrode resistivity imaging. In S. Mancusa (Ed.), Measuring
roots an updated approach (pp. 189–211). Berlin: Springer.
Assmann, S. M. (1999). The cellular basis of guard cell sensing of
rising CO2. Plant, Cell and Environment, 22, 629–637.
Bacastow, R., & Keeling, C. D. (1973). Atmospheric carbon dioxide
and radiocarbon in the natural carbon cycle: II. Changes from
AD 1700 to 2070 as deduced from a geochemical model. In G.
M. Woodwell & E. V. Pecan (Eds.), Carbon and the Biosphere,
Proceedings of the 24th Brookhaven Symposium in Biology (pp.
86–135). New York: Upton.
Bader, M. K. F., Siegwolf, R., & Korner, C. (2010). Sustained
enhancement of photosynthesis in mature deciduous forest trees
after 8 years of free air CO2 enrichment. Planta, 232,
1115–1125.
Bakwin, P. S., Zhao, C., Ussler, W., I. I. I., Tans, P. P., & Quesnell, E.
(1995). Measurements of carbon dioxide on a very tall tower.
Tellus, 47B, 535–549.
Balantyne, A. P., Alden, C. B., Miller, J. B., Tans, P. P., & White, J.
W. C. (2012). Increase in observed net carbon dioxide uptake by
land and ocean during the past 50 years. Nature, 488, 70–72.
Balantyne, A. P., Miller, J. B., Baker, I. T., Tans, P. P., & White, J.
W. C. (2011). Novel applications of carbon isotopes in
atmospheric CO2: What can atmospheric measurements teach
us about processes in the biosphere. Biogeosciences Discussion,
8, 4603–4631.
Baldocchi, D. D. (2008). Breathing of the terrestrial biosphere:
Lessons learned from a global network of carbon dioxide flux
measurement systems. Australian Journal of Botany, 56, 1–26.
Baldocchi, D. D., Falge, E., Gu, L. H., Olson, R., Hollinger, D.,
Running, S., et al. (2001). FLUXNET: A new tool to study the
temporal and spatial variability of ecosystem-scale carbon
dioxide, water vapor, and energy flux densities. Bulletin of the
American Meteorological Society, 82, 2415–2434.
Baldocchi, D. D., Hicks, B. B., & Meyer, T. P. (1988). Measuring
biosphere atmosphere exchange of biologically related gases
with micrometeorological methods. Ecology, 69, 1331–1340.
Batjes, N. H. (1996). Total carbon and nitrogen in the soils of the
world. European Journal of Soil Science, 47, 151–163.
Battle, M., Bender, M. L., Tans, P. P., White, J. W. C., Ellis, J. T.,
Conway, T., et al. (2000). Global carbon sinks and their
variability inferred from atmospheric O2 and 13C. Science, 287,
2467–2470.
Belward, A. (1996). The IGBP-DIS global 1 km land cover data set
(DISCover): Proposal and implementation plans. IGBP-DIS
Working Paper 13. Toulouse: International Geosphere-Biosphere
Programme Data and Information System Office.
Berry, J. A. (2012). There ought to be an equation for that. Annual
Review of Plant Biology, 63, 1–17.
Bhattacharyya, R., Tuti, M. D., Kundu, S., Bisht, J. K., & Bhatt, J. C.
(2012). Conservation tillage impacts on soil aggregation and
carbon pools in a sandy clay loam soil of the Indian Himalayas.
Soil Science Society of America Journal, 76, 617–627.
Bohm, W. (1979). Methods of studying root systems. Berlin: Springer.
Bolin, B., & Keeling, C. D. (1963). Large scale atmospheric mixing
as deduced from the seasonal and meridional variations of
carbon dioxide. Journal of Geophysical Research, 68,
3899–3920.
Bolinder, M. A., Janzen, H. H., Gregorich, E. G., Angers, D. A., &
VandenByaart, A. J. (2007). An approach for estimating net
primary productivity and annual carbon inputs to soil for
common crops in Canada. Agriculture, Ecosystems and Envi-
ronment, 118, 29–42.
Ind J Plant Physiol. (April–June 2013) 18(2):98–117 113
123
Burba, G., & Anderson, D. (2005). A brief practical guide to eddy
covariance flux measurements (p. 213). Lincoln: LI-COR Inc.
Butnor, J. R., Doolittle, J. A., Kress, L., Cohen, S., & Johnsen, K. H.
(2001). Use of ground-penetrating radar to study tree roots in the
southeastern United States. Tree Physiology, 21, 1269–1278.
Canadell, J. G., Le Quere, C., Raupach, M. R., Field, C. B.,
Buitenhuis, E. T., Ciais, P., et al. (2007). Contributions to
accelerating atmospheric CO2 growth from economic activity,
carbon intensity, and efficiency of natural sinks. Proceedings of
the National Academy of Sciences of USA, 104, 18866–18870.
Canadell, J. G., Mooney, H. A., Baldocchi, D. D., Berry, J. A.,
Ehleringer, J. R., Field, C. B., et al. (2000). Carbon metabolism
of the terrestrial biosphere: A multitechnique approach for
improved understanding. Ecosystems, 3, 115–130.
Cernusak, L. A., Winter, K., Martınez, C., Correa, E., Aranda, J.,
Garcia, M., et al. (2011). Responses of legume versus nonlegume
tropical tree seedlings to elevated CO2 concentration. Plant
Physiology, 157, 372–385.
Chahine, M. T., Chen, L., Dinotakis, P., Jiang, X., Li, Q., Olsen, E. T.,
et al. (2008). Satellite remote sounding of mid troposphere CO2.
Geophysical Research Letters, 35, LI7807.
Chen, F., Kissel, D. E., West, L. T., & Adkins, W. (2000). Field-scale
mapping of surface soil organic carbon using remotely sensed
imagery. Soil Science Society of America Journal, 64, 746–753.
Ciais, P., Tans, P. P., Trolier, M., White, J. W. C., & Francey, R. J.
(1995). A large Northern Hemisphere terrestrial CO2 sink
indicated by the 13C/12C ratio of atmospheric CO2. Science,
269, 1098–1102.
Cotrufo, M. F., Ineson, P., & Scott, Y. (1998). Elevated CO2 reduces
the nitrogen concentration of plant tissues. Global Change
Biology, 4, 43–54.
Cox, P. M., Betts, R. A., Jones, C. D., Spall, S. A., & Totterdell, I. J.
(2000). Acceleration of global warming due to carbon cycle
feedbacks in a coupled climate model. Nature, 408, 184–187.
Craig, H. (1957). Isotopic standards for carbon and oxygen and
correction factors for mass-spectrometric analysis of carbon
dioxide. Geochimica et Cosmochimica Acta, 12, 133–149.
Curtis, P. S., & Wang, X. (1998). A meta-analysis of elevated CO2
effects on woody plant mass, form, and physiology. Oecologia,
113, 299–313.
de Graaff, M. A., Van Groenigen, K., Six, J., & van Kessel, C. (2006).
Interactions between plant growth and soil nutrient cycling under
elevated CO2: A meta-analysis. Global Change Biology, 12,
2077–2091.
DePury, D. D. G., & Farquhar, G. D. (1997). Simple scaling of
photosynthesis from leaves to canopies without the errors of big-
leaf models. Plant, Cell and Environment, 20, 537–557.
Dessaux, Y., Hinsinger, P., & Lemanceau, P. (2009). Rhizosphere: So
many achievements and even more challenges. Plant and Soil,
321, 1–3.
Durant, A. J., Le Quere, C., Hope, C., & Friend, A. D. (2011).
Economic value of improved quantification in global sources and
sinks of carbon dioxide. Philosophical Transactions, Series A,
369, 1967–1979.
Ebinger, M. H., Norfleet, M. L., Breshears, D. D., Cremers, D. A.,
Ferris, M. J., Unkefer, P. J., et al. (2003). Extending the
applicability of laser-induced breakdown spectroscopy for total
soil carbon measurement. Soil Science Society of America
Journal, 67, 1616–1619.
Eguchi, N., Fukatsu, E., Funada, R., Tobita, H., Kitao, M., Maruyama,
Y., et al. (2004). Changes in morphology, anatomy and
photosynthetic capacity of needles of Japanese larch (Larix
kaempferi) seedlings grown in high CO2 concentrations. Photo-
synthetica, 42, 173–178.
Ekdahl, C. A., & Keeling, C. D. (1973). Atmospheric carbon dioxide
and radiocarbon in the natural carbon cycle: I. Quantitative
deductions from the records of Mauna Loa Observatory and at
the South Pole. In G. M. Woodwell & E. V. Pecan (Eds.),
Carbon and the Biosphere, Proceedings of the 24th Brookhaven
Symposium in Biology (pp. 51–85). New York: Upton.
Farquhar, G. D., Ehleringer, J. R., & Hubick, K. T. (1989). Carbon
isotope discrimination and photosynthesis. Annual Review of
Plant Physiology and Plant Molecular Biology, 40, 503–537.
Farquhar, G. D., von Caemmerer, S., & Berry, J. A. (1980). A
biochemical model of photosynthetic CO2 assimilation in leaves
of C3 species. Planta, 149, 78–90.
Field, C. B. (2001). Plant physiology of the ‘‘missing’’ carbon sink.
Plant Physiology, 125, 25–28.
Flanagan, L. B., Brooks, J. R., Varney, G. T., & Ehleringer, J. R.
(1997). Discrimination against (18O/16O) during photosynthesis
and oxygen isotope ratio of respired CO2 in boreal ecosystems.
Global Biochemical Cycles, 18, 83–98.
Francey, R. J., Allison, C. E., Etheridge, D. M., Trudinger, C. M.,
Enting, I. G., Leuenberger, M., et al. (1999). A 1000-year high
precision record of d13C in atmospheric CO2. Tellus, 51,
170–193.
Frankenberg, C., Fisher, J. B., Worden, J., Badgley, G., Saatchi, S. S.,
Lee, J. E., et al. (2011). New global observations of the terrestrial
carbon cycle from GOSAT: Patterns of plant fluorescence with
gross primary productivity. Geophysical Research Letters, 38,
L17706.
French, A., Wells, D., Everitt, N., & Pridmore, T. (2012). High-
throughput quantification of root growth. In M. Stefano (Ed.),
Measuring roots an updated approach (pp. 109–126). Berlin:
Springer.
Frenck, G., van der Linden, L., Mikkelsen, T. N., Brix, H., &
Jørgensen, R. B. (2012). Increased [CO2] does not compensate
for negative effects on yield caused by higher temperature and
[O3] in Brassica napus L. The European Journal of Agronomy,
35, 127–134.
Friend, A. D. (2010). Terrestrial plant production and climate change.
Journal of Experimental Botany, 61, 1293–1309.
Friend, A. D., Geider, R. J., Behrenfeld, M. J., & Still, C. J. (2009).
Photosynthesis in global-scale models. In A. Laisk, L. Nedbal, &
Govindjee (Eds.), Photosynthesis in silico: Understanding
complexity from molecules to ecosystems (pp. 465–497). Berlin:
Springer Science.
Gamon, J. A., Qiu, H. L., & Sanchez-Azofeifa, A. (2007). Ecological
applications of remote sensing at multiple scales. In F. I. Pug-
naine & F. Valladares (Eds.), Functional plant ecology (pp.
655–683). Boca Raton, FL: CRC Press-Taylor and Francis.
Gehl, R. J., & Rice, C. W. (2007). Emerging technologies for in situ
measurement of soil carbon. Climatic Change, 80, 43–54.
Geider, R. J., Delucia, E. H., Falkowski, P. G., Finzi, A. C., Grime, J.
P., Grace, J., et al. (2001). Primary productivity of planet earth
biological determinations and physical constraints in terrestrial
and aquatic habitats. Global Change Biology, 7, 849–882.
Ghildiyal, M. C., & Sharma-Natu, P. (2000). Photosynthetic accli-
mation to rising atmospheric carbon dioxide concentration.
Indian Journal of Experimental Biology, 38, 961–966.
Gill, R. A., & Jackson, R. B. (2000). Global patterns of root turnover
for terrestrial ecosystems. New Phytologist, 147, 13–31.
Groenigen, K. J., Gorissen, A., Six, J., Harris, D., Kuikman, P. J.,
Groenigen, J. W., et al. (2005). Decomposition of 14C labeled
roots in a pasture soil exposed to 10 years of elevated CO2. Soil
Biology and Biochemistry, 37, 497–506.
Harvey, D. (2012). Fast and slow feedbacks in future climates. In, A.
Henderson-Sellers & K. McGuffie (Eds.), The future of world’s
climate (pp. 99–139). Amsterdam: Elsevier.
Heath, J., Ayres, E., Possel, M., Bardgett, R. D., Black, H. I. J., Grant,
H., et al. (2005). Rising atmospheric CO2 reduces sequestration
of root derived soil carbon. Science, 309, 1711–1713.
114 Ind J Plant Physiol. (April–June 2013) 18(2):98–117
123
Heimann, M., & Reichstein, M. (2008). Terrestrial ecosystem carbon
dynamics and climate feedbacks. Nature, 451, 289–292.
Henderson-Sellers, A. (2012). Seeing further: The futurology of
climate. In A. Henderson-Sellers & K. McGuffie (Eds.), The
future of world’s climate (pp. 3–25). Amsterdam: Elsevier.
Hendrey, G. R., Ellsworth, D. S., Lewin, K. F., & Nagy, J. (1999). A
free-air CO2 enrichment system for exposing tall forest vegeta-
tion to elevated atmospheric CO2. Global Change Biology, 5,
293–309.
Hogberg, P., Nordgren, A., Buchmann, N., Taylor, A. F. S., Ekblad,
A., Hogberg, M. N., et al. (2001). Large scale forest girdling
shows that current photosynthesis drives soil respiration. Nature,
411, 789–792.
Holisova, P., Zitova, M., Klem, K., & Urban, O. (2012). Effect of
elevated carbon dioxide concentration on carbon assimilation
under fluctuating light. Journal of Environmental Quality, 41,
1931–1938. doi:10.2134/jeq2012.0113.
Houghton, R. A. (2003). Why are estimates of the terrestrial carbon
balance so different? Global Change Biology, 9, 500–509.
Houghton, R. A. (2005). Aboveground forest biomass and the global
carbon balance. Global Change Biology, 11, 945–958.
Hruska, J., Cermak, J., & Sustek, S. (1999). Mapping tree root
systems with ground-penetrating radar. Tree Physiology, 19,
125–130.
IPCC. (2001). Climate change (2001): The scientific basis. In J.
T. Houghton, Y. Ding, D. J. Griggs, M. Noguer, P. G. van der
Linden, X. Dai, K. Maskell, & C. A. Johnson (Eds.), Contribu-
tion of Working Group I to the Third Assessment Report of the
Intergovernmental Panel on Climate Change. Cambridge:
Cambridge University Press.
IPCC. 2007. Intergovernmental Panel on Climate Change. Summary
Report of the Working Group of IPCC, Paris, February, 2007.
Jackson, R. B., Mooney, H. A., & Schulze, E. D. (1997). A global
budget for fine root biomass, surface area, and nutrient contents.
Proceedings of the National Academy of Sciences of USA, 94,
7362–7366.
Johnson, J. M. F., Allmaras, R. R., & Reicosky, D. C. (2006).
Estimating source carbon from crop residues, root and rhizode-
posits using the national grain-yield database. Agronomy Jour-
nal, 98, 622–636.
Jones, D. L., Nguyen, C., & Finlay, R. D. (2009). Carbon flow in the
rhizosphere: Carbon trading at the soil–root interface. Plant and
Soil, 321, 5–5.
Kant, P. C. B., Bhadraray, S., Purakayastha, T. J., Jain, V., Pal, M., &
Datta, S. C. (2007). Active carbon-pools in rhizosphere of wheat
(Triticum aestivum L.) grown under elevated atmospheric carbon
dioxide concentration in a Typic Haplustept in sub-tropical
India. Environmental Pollution, 147, 273–281.
Karl, T. R., Melillo, J. M., & Peterson, T. C. (Eds.). (2009). Global
climate change impacts in the United States. New York:
Cambridge University Press.
Kasischke, E. S., Melack, J. M., & Dobson, M. C. (1997). The use of
imaging radars for ecological applications—a review. Remote
Sensing of Environment, 59, 141–156.
Keeling, C. D. (1958). The concentration and isotopic abundances of
atmospheric carbon dioxide in rural areas. Geochimica et
Cosmochimica Acta, 13, 322–334.
Keeling, C. D. (1960). The concentration and isotopic abundances of
carbon dioxide in the atmosphere. Tellus, 12, 200–203.
Keeling, C. D. (1961). The concentration and isotopic abundances of
carbon dioxide in rural and marine air. Geochimica et Cosmo-
chimica Acta, 24, 277–298.
Kohlmaier, G. H., Sire, E. O., Janecek, A., Keeling, C. D., Piper, S.
C., & Revelle, R. (1989). Modelling the seasonal contribution of
a CO2-fertilization effect of the terrestrial vegetation to the
amplitude increase in atmospheric CO2 at Mauna Loa Observa-
tory. Tellus, 41, 487–510.
Kravchenko, A. N., & Robertson, A. N. (2011). Whole-profile soil
carbon stocks: The danger of assuming too much from analyses
of too little. Soil Science Society of America Journal, 75,
235–240.
Kuzyakov, Y. (2006). Sources of CO2 efflux from soil and review of
partitioning methods. Soil Biology and Biochemistry, 38,
425–448.
Kuzyakov, Y. (2011a). How to link soil C pools with CO2 fluxes?
Biogeosciences, 8, 1523–1537.
Kuzyakov, Y. (2011b). Prime time for microbes. Nature Climate
Change, 1, 295–297.
Kuzyakov, Y., & Gavrichkova, O. (2010). Time lag between
photosynthesis and carbon dioxide efflux from soil: A review
of mechanisms and controls. Global Change Biology, 16,
3386–3406.
Laisk, A., & Edwards, G. E. (2000). A mathematical model of C4
photosynthesis. The mechanisms of concentrating CO2 in NADP
malic enzyme type species. Photosynthesis Research, 66,
199–224.
Lal, R. (2001). World cropland soils as a source or sink for
atmospheric carbon. Advances in Agronomy, 71, 145–190.
Lal, R. (2004a). Soil carbon sequestration impacts on global climate
change and food security. Science, 304, 1623–1627.
Lal, R. (2004b). Soil carbon sequestration to mitigate climate change.
Geoderma, 123, 1–22.
Lal, R. (2008). Carbon Sequestration. Philosophical Transactions
Royal Society B, 363, 815–830.
Lal, R., Kimble, J. M., Follett, R. F., & Stewart, B. A. (Eds.). (2001).
Assessment methods for soil carbon. Boca Raton, FL: CRC
Press.
Law, B. E., Waring, R. H., Anthoni, P. M., & Abers, J. D. (2000).
Measurements of gross and net ecosystem productivity and water
vapour exchange of a Pinus ponderosa ecosystem and an
evaluation of two generalized models. Global Change Biology,
6, 155–168.
Le Quere, C., Andres, R. J., Boden, T., Conway, T., Houghton, R. A.,
House, J. I., Marland, G., Peters, G. P., van der Werf, G. R.,
Ahlstrom, A., Andrew, R. M., Bopp, L., Canadell, J. G., Ciais,
P., Doney, S. C., Enright, C., Friedlingstein, P., Huntingford, C.,
Jain, A. K., Jourdain, C., Kato, E., Keeling, R. F., Klein
Goldewijk, K., Levis, S., Levy, P., Lomas, M., Poulter, B.,
Raupach, M. R., Schwinger, J., Sitch, S., Stocker, B. D., Viovy,
N., Zaehle, S., & Zeng, N. (2013). The global carbon budget
1959–2011. Earth System Science Data, 5, 165–185.
Le Quere, C., Canadell, J. G., Ciais, P., Dhakal, S., Patwardhan, A.,
Raupach, M. R., et al. (2010). An international carbon office to
assist policy-based science. Current Opinion in Environmental
Sustainability, 2, 1–4.
Le Quere, C., Raupach, M. R., Canadell, J. G., Marland, G., Bopp, L.,
Ciais, P., et al. (2009). Trends in the sources and sinks of carbon
dioxide. Nature Geoscience, 2, 831–836.
Leakey, A. D. B., Ainsworth, E. A., Bernacchi, C. J., Rogers, A.,
Long, S. P., & Ort, D. R. (2009a). Elevated CO2 effects on plant
carbon, nitrogen, and water relations: Six important lessons from
FACE. Journal of Experimental Botany, 60, 2859–2876.
Leakey, A. D., Bishop, K. A., & Ainsworth, E. A. (2012). A multi-
biome gap in understanding of crop and ecosystem responses to
elevated CO2. Current Opinion in Plant Biology, 15, 228–236.
Leakey, A. D. B., Xua, F., Gillespiea, K. M., McGratha, J. M.,
Ainsworth, E. A., & Ort, D. R. (2009b). Genomic basis for
stimulated respiration by plants growing under elevated carbon
dioxide. Proceedings of the National Academy of the Sciences of
USA, 106, 3597–3602.
Ind J Plant Physiol. (April–June 2013) 18(2):98–117 115
123
Lefsky, M. A., Cohen, W. B., Parker, G. G., & Harding, D. J. (2002).
LIDAR remote sensing for ecosystem studies. Bioscience, 52,
19–30.
Leith, H., & Wittaker, R. H. (1975). Primary productivity of the
biosphere. New York: Springer.
Lenka, N. K., & Lal, R. (2012). Soil-related constraints to the carbon
dioxide fertilization effect. Critical Reviews in Plant Sciences,
31, 342–357.
Lewis, J. D., Ward, J. K., & Tissue, D. T. (2010). Phosphorus supply
drives nonlinear responses of cottonwood (Populus deltoides) to
increases in CO2 concentration from glacial to future concen-
trations. New Phytologist, 187, 438–448.
Long, S. P., Ainsworth, E. A., Leakey, A. D. B., Nosberger, J., & Ort,
D. R. (2006). Food for thought: Lower-than-expected crop yield
stimulation with rising CO2 concentrations. Science, 312,
1918–1921.
Luo, Y., Gerten, D., LeMaire, G., Parton, W. J., Weng, E., Zhou, Xi.,
et al. (2008). Modeled interactive effects of precipitation,
temperature, and [CO2] on ecosystem carbon and water dynam-
ics in different climatic zones. Global Change Biology, 14, 1–14.
Luo, Y., Reynolds, J., Wang, Y., & Wolfe, D. (1999). A search for
predictive understanding of plant responses to elevated [CO2].
Global Change Biology, 5, 143–156.
Luo, Y., Su, B., Currie, W. S., Dukes, J. S., Finzi, A. C., et al. (2004).
Progressive nitrogen limitation of ecosystem responses to rising
atmospheric carbon dioxide. Bioscience, 54, 731–739.
Mancuso, S. (2012). Measuring roots an updated approach. Berlin:
Springer.
Manning, A. J. (2011). The challenge of estimating regional trace gas
emissions from atmospheric observations. Philosophical Trans-
actions of the Royal Society of America, 369, 1943–1954.
Matthews, H. D. (2007). Implications of CO2 fertilization for future
climate change in a coupled climate-carbon model. Global
Change Biology, 13, 1068–1078.
Mencuccini, M., & Holtta, T. (2010). The significance of phloem
transport for the speed with which canopy photosynthesis and
belowground respiration are linked. New Phytologist, 185,
189–203.
Monteith, J. L. (1972). Solar radiation and productivity in tropical
ecosystems. Journal of Applied Ecology, 9, 747–766.
Nelson, D. W., & Sommer, L. E. (1982). Total carbon, organic
carbon, and organic matter. In A. L. Page (Ed.) Methods of soil
analysis (2nd Ed., pp. 539–579). ASA Monographs 9(2).
Madison, WI: American Society of Agronomy.
Norby, R. J., Ledford, J., Reilly, C. D., Miller, N. E., & O’Neill, E. G.
(2004). Fine-root production dominates response of a deciduous
forest to atmospheric CO2 enrichment. Proceedings of the
National Academy of Sciences of the USA, 101, 9689–9693.
Norby, R. J., & Luo, Y. (2004). Evaluating ecosystem responses to
rising atmospheric CO2 and global warming in a multi-factor
world. New Phytologist, 162, 281–293.
Norby, R. J., Wullschleger, S. D., Gunderson, C. A., Johnson, D. W.,
& Ceulemans, R. (1999). Tree responses to rising CO2 in field
experiments: Implications for the future forest. Plant, Cell and
Environment, 22, 683–714.
Norby, R. J., & Zak, D. R. (2011). Ecological lessons from free-air
CO2 enrichment (FACE) experiments. Annual Review of Ecol-
ogy Evolution and Systematics, 42, 181–203.
Olsen, S. C., & Randerson, J. T. (2004). Differences between surface
and column atmospheric CO2 and implications for carbon cycle
research. Journal of Geophysical Research, 109, D02301.
Pal M., Rao L.S., Srivastava A.C., Jain V. and Sengupta U.K. (2003/4).
Impact of CO2 enrichment and variable nitrogen supplies on
composition and partitioning of essential nutrients in wheat.
Biologia Plantarum 47: 227-231.
Pandurangam, V., Sharma-Natu, P., Sreekanth, B., & Ghildiyal, M. C.
(2006a). Photosynthetic acclimation to elevated CO2 in relation
to rubisco gene expression in three C3 species. Indian Journal of
Experimental Biology, 44, 408–415.
Pandurangam, V., Sharma-Natu, P., Sreekanth, B., & Ghildiyal, M. C.
(2006b). Photosynthetic response of wheat and sunflower
cultivars to long-term exposure of elevated carbon dioxide
concentration. Photosynthetica, 44, 586–590.
Pataki, D. E., Bowling, D. R., & Ehleringer, J. R. (2003). Seasonal
cycle of carbon dioxide and its isotopic composition in an urban
atmosphere: Anthropogenic and biogenic effects. Journal of
Geophysical Research, 108(D23), 4735.
Pendall, E., Bridgham, S., Hanson, P. J., Hungate, B., Kicklighter, D.
W., Johnson, D. W., et al. (2004). Below-ground process
responses to elevated CO2 and temperature: A discussion of
observations, measurement methods and models. New Phytolo-
gist, 162, 311–322.
Penuelas, J., Garbulsky, M. F., & Filessa, I. (2011). Photochemical
reflectance index (PRI) and remote sensing of plant CO2 uptake.
New Phytologist, 191, 596–599.
Peters, W., Jacobson, A. R., Sweeney, C., Andrews, A. E., Conway,
T. J., Masarie, K., et al. (2007). An atmospheric perspective on
North American carbon dioxide exchange: CarbonTracker.
Proceedings of the National Academy of Sciences of USA, 104,
18925–18930.
Pietsch, S. A., & Hasenauer, H. (2009). Photosynthesis with large
scale ecosystem models. In A. Laisk, L. Nedbal, & Govindjee
(Eds.), Photosynthesis in silico: Understanding complexity from
molecules to ecosystems (pp. 441–464). Wien: Springer Science.
Pinkard, E. A., Beadle, C. L., Mendham, D. S., Carter, J., & Glen, M.
(2010). Determining photosynthetic responses of forest species
to elevated CO2: Alternatives to FACE. Forest Ecology and
Management, 260, 1251–1261.
Poorter, H., & Navas, M. L. (2003). Plant growth and competition at
elevated CO2: On winners, losers and functional groups. New
Phytologist, 157, 175–198.
Prasannakumar, N. R., Chander, S., & Pal, M. (2012). Assessment of
impact of climate change with reference to elevated CO2 on rice
brown planthopper, Nilaparvata lugens (Stal.) and crop yield.
Current Science, 103, 1201–1205.
Qiu, Q. S., Huber, J. L., Booker, F. L., Jain, V., Leakey, A. D., Fiscus,
E. L., et al. (2008). Increased protein carbonylation in leaves of
Arabidopsis and soybean in response to elevated [CO2].
Photosynthesis Research, 97, 155–166.
Rabha, B. K., & Uprety, D. C. (1998). Effects of elevated CO2 and
moisture stress on Brassica juncea. Photosynthetica, 35,
597–602.
Reddy, A. R., Rasineni, G. K., & Raghavendra, A. S. (2010). The
impact of global elevated CO2 concentration on photosynthesis
and plant productivity. Current Science, 99, 46–57.
Repo, T., Cao, Y., Silvennoinen, R., & Ozier-Lafontaine, H. (2012).
Electrical impedance spectroscopy and roots. In S. Mancuso
(Ed.), Measuring roots an updated approach (pp. 25–49). Berlin:
Springer.
Richter, D. D., & Mobley, M. L. (2009). Monitoring earth’s critical
zone. Science, 326, 1067–1068.
Riou-Khamlichi, C., Menges, M., Healy, S. J. M., & Murray, J. A. H.
(2000). Sugar control of the plant cell cycle: Differential
regulation of Arabidopsis d-type cyclin gene expression.
Molecular and Cellular Biology, 20, 4513–4521.
Robinson, E. A., Ryan, G. D., & Newman, J. A. (2012). A meta-
analytical review of the effects of elevated CO2 on plant–
arthropod interactions highlights the importance of interacting
environmental and biological variables. New Phytologist,.
doi:10.1111/j.1469-8137.2012.04074.x.
116 Ind J Plant Physiol. (April–June 2013) 18(2):98–117
123
Rochette, P., Flanagan, L. B., & Gregorich, E. G. (1999). Separating
soil respiration into plant and soil components using analysis of
the natural abundance of carbon-13. Soil Science Society of
America Journal, 63, 1207–1213.
Rochette, P., & Flanagan, L. B. (1997). Quantifying rhizosphere
respiration in a corn crop under filed conditions. Soil Science
Society of America Journal, 61, 466–474.
Rogers, A., Ainsworth, E. A., & Leakey, A. D. B. (2009). Will
elevated carbon dioxide concentration amplify the benefits of
nitrogen fixation in legumes? Plant Physiology, 151, 1009–1016.
Rourke, O. S. M., & Holden, N. H. (2011). Optical sensing and
chemometric analysis of soil organic carbon - a cost effective
alternative to conventional laboratory methods? Soil Use Man-
agement, 27, 143–155.
Ryan, M. G. (1991). A simple method for estimating gross carbon
budgets for vegetation in forest ecosystems. Tree Physiology, 9,
255–266.
Ryan, G. D., Rasmussen, S., & Newman, J. A. (2010). Global
atmospheric change and trophic interactions: Are there any
general responses? In F. Baluska & V. Ninkovic (Eds.), Plant
communication from an ecological perspective (pp. 179–214).
Berlin: Springer.
Sabine, C. L., Heimann, M., Artaxo, P., Bakker, D. C. E., Chen, C.
T. A., Field, C. B. N., et al. (2004). Current status and part trends
of the global carbon cycle. In C. B. Field & M. R. Raupach
(Eds.), The global carbon cycle (pp. 17–44). Washington, DC:
Islands Press.
Sage, R. F., Sharkey, T. D., & Seemann, J. R. (1989). Acclimation of
photosynthesis to elevated CO2 in five C3 species. Plant
Physiology, 89, 590–596.
Schimel, D. S., House, J. I., Hibbard, K. A., Bousquet, P., Gais, P.,
Peylin, P., et al. (2001). Recent patterns and mechanisms of
carbon exchange by terrestrial ecosystems. Nature, 414,
169–172.
Schmiel, D. (2004). Photosynthesis and the global carbon cycle. In M.
D. Archer & J. Barber (Eds.), Molecular to global photosynthesis
(pp. 613–626). Singapore: World Scientific Publishing Company.
Seneweera, S., Makino, A., Hirotsu, N., Norton, R., & Suzuki, Y.
(2011). New insight into photosynthetic acclimation to elevated
CO2: The role of leaf nitrogen and ribulose-1,5-bisphosphate
carboxylase/oxygenase content in rice leaves. Environmental
and Experimental Botany, 71, 128–136.
Sharma-Natu, P., & Ghildiyal, M. (2005). Potential targets for
improving photosynthesis and crop yield. Current Science, 88,
1918–1928.
Smith, P. (2004). Carbon sequestration in crop lands: The potential in
Europe and the global context. European Journal of Agronomy,
20, 229–236.
Smith, N. G., & Dukes, J. S. (2013). Plant respiration and
photosynthesis in global-scale models: Incorporating acclimation
to temperature and CO2. Global Change Biology, 19, 45–63.
Swinbank, W. C. (1951). The measurement of vertical transfer of heat
and water vapour by eddies in the lower atmosphere. Journal of
Meteorology, 8, 135–145.
Swinnen, J. (1994). Evaluation of the use of a model rhizodeposition
technique to separate root and microbial respiration in soil. Plant
and Soil, 165, 89–101.
Talbott, L. D., Rahveh, E., & Zeiger, E. (2003). Relative humidity is a
key factor in the acclimation of the stomatal response to CO2.
Journal of Experimental Botany, 54, 2141–2147.
Taub, D. R., & Wang, X. Z. (2008). Why are nitrogen concentrations
in plant tissues lower under elevated CO2? A critical examina-
tion of the hypotheses. Journal of Integrative Plant Biology, 50,
1365–1374.
Teng, N., Jin, B., Wang, Q., Hao, H., Ceulemans, R., et al. (2009). No
detectable maternal effects of elevated CO2 on Arabidopsis
thaliana over 15 generations. PLoS ONE, 4(6), e6035. doi:10.
1371/journal.pone.0006035.
Theobald, J. C., Mitchell, R. A. C., Parry, M. A. J., & Lawlor, D. W.
(1998). Estimating the excess investment in Ribulose 1–5
bisphosphate carboxylase/oxygenase in leaves of spring wheat
under elevated CO2. Plant Physiology, 118, 945–955.
Thompson, M. V., Randerson, J. T., Malmstrm, C. M., & Field, C. B.
(1996). Change in net primary production and heterotrophic
respiration: How much is necessary to sustain the terrestrial
carbon sink? Global Biogeochemical Cycles, 10, 711–726.
Uprety, D. C., Dwivedi, N., & Mohan, R. (1998). Characterization of
CO2 responsiveness in Brassica oxycamp interspecific hybrid.
Journal of Agronomy and Crop Science, 180, 149–153.
Valentini, R., Matteucci, G., Dolman, A. J., Schulze, E.-D., Rebmann,
C., Moors, E. J., et al. (2000). Respiration as the main
determinant of carbon balance in European forests. Nature,
404, 861–865.
Vargas, R., Baldocchi, D. D., Bahn, M., Hanson, P. J., Hosman, K. P.,
Kulmala, L., et al. (2011). On the multi-temporal correlation
between photosynthesis and soil CO2 efflux: Reconciling lags
and observations. New Phytologist, 191, 1006–1017.
von Caemmerer, S., & Edmondson, D. L. (1986). Relationship
between steady state gas-exchange, in vivo ribulose bisphos-
phate carboxylase activity and some carbon-reduction cycle
intermediates in Raphanus sativus. Australian Journal of Plant
Physiology, 13, 669–688.
Walkley, A., & Black, I. A. (1934). An examination of Degtjareff
method for determining soil organic matter and a proposed
modification of the chromic acid titration method. Soil Science,
37, 29–37.
Wang, L., Okin, G. S., Caylor, K. K., & Macko, S. A. (2009). Spatial
heterogeneity and sources of soil carbon in southern African
savannas. Geoderma, 149, 402–408.
Warren, J. M., Norby, R. J., & Wullschleger, S. D. (2011). Elevated
CO2 enhances leaf senescence during extreme drought in a
temperate forest. Tree Physiology, 31, 117–130.
West, P. C., Gibbs, H. K., Monfreda, C., Waquer, J., Bradford, C. C.,
Carpenter, S. R., et al. (2010). Trading carbon for food: Global
comparison of carbon stocks vs. crop yields on agricultural land.
Proceedings of the National Academy of Sciences of USA, 107,
19645–19648.
Wielopolski, L., Mitra, S., Hendrey, G., Rogers, H., Torbert, A., &
Prior, S. (2003). Non-destructive in situ soil carbon analysis:
Principles and results. In Proceedings of 2nd National Confer-
ence on Carbon Sequestration: Developing and Validating the
Technology Base to Reduce Carbon Intensity, 5–8 May 2003,
Alexandria, VA.
Wielopolski, L., Orion, I., Hendrey, G., & Rogers, H. (2000). Soil
carbon measurements using inelastic neutron scattering. IEEE
Transactions on Nuclear Science, 47, 914–917.
Wixon, D. L., & Balser, T. C. (2009). Complexity, climate change and
soil carbon: A systems approach to microbial temperature
response. Systems Research and Behavioral Science, 26, 601–620.
Woodward, F. I. (1987). Stomatal numbers are sensitive to increases
in CO2 from pre-industrial levels. Nature, 327, 617–618.
Woodwell, G. M., & Whittaker, R. H. (1968). Primary production in
terrestrial communities. American Zoologist, 8, 19–30.
Wunch, D., Toon, G. C., Blavier, J. F. L., Washenfelder, R. A.,
Notholt, J., Connor, B. J., et al. (2011). The total carbon column
observing network. Philosophical Transactions of Royal Society
of America, 369, 2087–2112.
Yin, X. (2002). Responses of leaf nitrogen concentration and specific
leaf area to atmospheric CO2 enrichment: A retrospective
synthesis across 62 species. Global Change Biology, 8, 631–642.
Ind J Plant Physiol. (April–June 2013) 18(2):98–117 117
123