Review 2011 - BGS Geomagnetism
50
Geomagnetism Review 2011
-
Upload
khangminh22 -
Category
Documents
-
view
4 -
download
0
Transcript of Review 2011 - BGS Geomagnetism

GeomagnetismReview2011

To contents page
The National Grid and other Ordnance Survey data are used with the permission of the Controller of Her Majesty’s Stationery Office. Ordnance Survey licence number 100017897/2011
Key words
Geomagnetism.
Front cover
Making observations at South Georgia magnetic observatory, at King Edward Point.
Bibliographical reference
THOMSON, A.W.P. ET AL 2012. Geomagnetism Review 2011. British Geological Survey Open Report, OR/12/056
48pp.
Geomagnetism
Review 2011
Alan W P Thomson (editor)
Contributors:
Orsi Baillie, Ciarán Beggan, Ellen Clarke, Ewan Dawson, Brian Hamilton, Ted Harris, Gemma Kelly, Susan Macmillan, Sarah Reay, Tom Shanahan, Alan Thomson, Christopher Turbitt
© NERC 2012 Edinburgh British Geological Survey 2012

To contents page
To contents page
1
Contents
Contents ..................................................................................................... 1
Introduction ............................................................................................... 2
Who We Are and What We Do ...................................................................................... 2
Looking Ahead to 2012 .................................................................................................. 4
Technical, Observatory and Field Operations ......................................... 8
UK and Overseas Observatories ................................................................................... 8
King Edward Point Geomagnetic Observatory ............................................................ 10
Ingredients for Successful Real-Time Data Services ................................................... 12
World Data Centre for Geomagnetism......................................................................... 14
The BGS Contribution to INTERMAGNET ................................................................... 16
Science ..................................................................................................... 18
Separation of the Large-Scale Crustal Magnetic Field Using Slepian Functions ........ 18
Near Real-Time Magnetospheric Models from Swarm Satellite Data .......................... 20
Extreme Geomagnetic Activity ..................................................................................... 22
European Risk from Geomagnetically Induced Currents ............................................. 24
International Science Conferences ............................................................................. 26
Student and Research Associate Activities ................................................................. 28
Applications ............................................................................................. 30
Oil Industry .................................................................................................................. 30
Space Weather Applications and Services .................................................................. 32
Outreach and Knowledge Exchange ...................................................... 34
Publications, Presentations, Posters and Other Outputs ............................................. 34
Unusual Enquiries ....................................................................................................... 39
Acknowledgements ................................................................................. 40
Selected Glossary, Acronyms and Links ............................................... 41

To contents page
2
The magnetic field of the Earth (image courtesy of NASA, Goddard Space Flight Center).
Introduction
Who We Are and What We Do
The Geomagnetism team measures, records, models and interprets variations in the Earth’s natural magnetic fields, across the world and over time. Our data and expertise help to develop scientific understanding of the evolution of the solid Earth and its atmospheric, ocean and space environments. We also provide geomagnetic products and services to industry and academics and we use our knowledge to inform and educate the public, government and the private sector.
The British Geological Survey (BGS) is the main Earth Science research centre for the UK and is a research centre of the Natural Environment Research Council (NERC).
Geomagnetism is represented in BGS as a science team within the Earth Hazards and Systems (EHS) theme, alongside Earthquake Seismology and Volcanology. EHS is, in turn, part of the Geoscience Survey and Monitoring Directorate.
EHS is one of ten BGS science themes that deliver the BGS science strategy. Science strategy in BGS is supported by the Information and Knowledge Exchange (IKE), Science Facilities, and Resources and Operations programmes. We also receive additional support locally from BGS Edinburgh Business Support, Business Administration and System and Network Services.
The Geomagnetism team is based in Edinburgh and in 2011 numbered twenty-three full and part-time staff. In addition in 2011 we had one Post-Doctorate Research Assistant (shared with University of Liverpool), two PhD students and one MSc student.
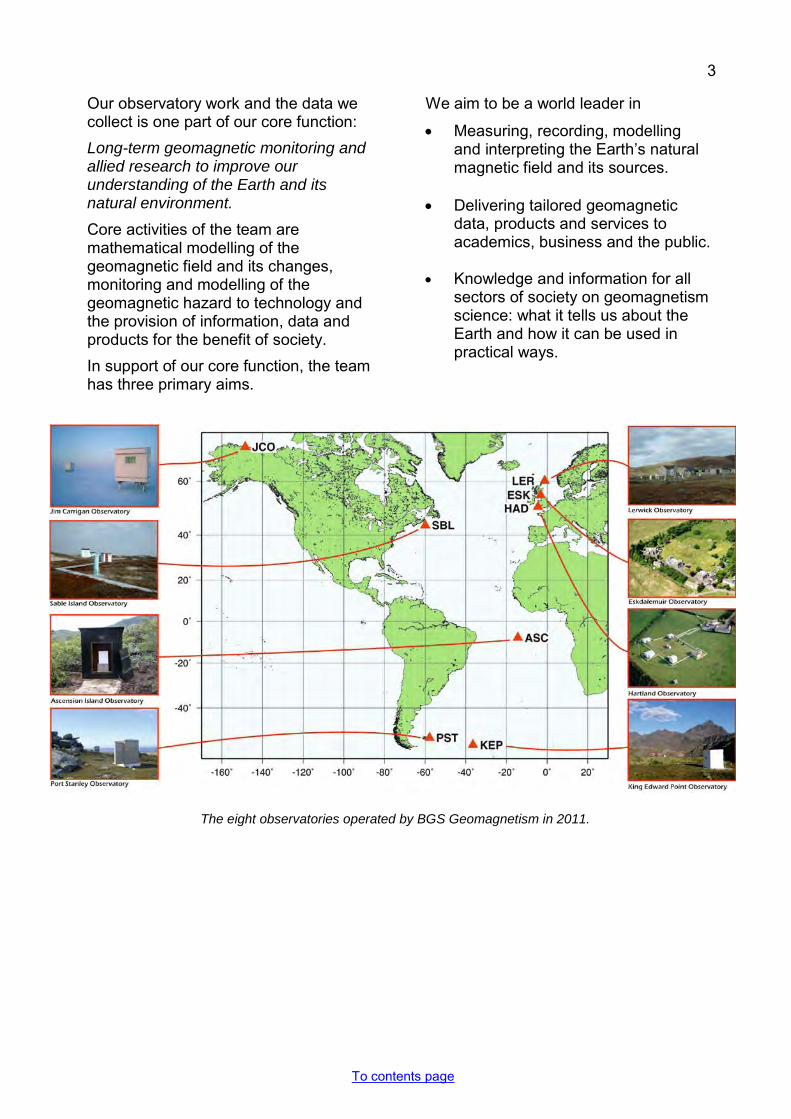
For the purposes of continuous geomagnetic monitoring in the UK BGS operates three magnetic observatories. These are located (see main figure opposite) at Lerwick (Shetland), Eskdalemuir (Scottish Borders) and Hartland (North Devon).
We also operate magnetic observatories overseas on Ascension Island, at Port Stanley (Falkland Islands), King Edward Point (South Georgia) and Sable Island (Nova Scotia, Canada). We also oversee and maintain magnetic observatory operations at Prudhoe Bay, Alaska (USA).
To contents page
3
Our observatory work and the data we collect is one part of our core function:
Long-term geomagnetic monitoring and allied research to improve our understanding of the Earth and its natural environment.
Core activities of the team are mathematical modelling of the geomagnetic field and its changes, monitoring and modelling of the geomagnetic hazard to technology and the provision of information, data and products for the benefit of society.
In support of our core function, the team has three primary aims.
We aim to be a world leader in
• Measuring, recording, modelling and interpreting the Earth’s natural magnetic field and its sources.
• Delivering tailored geomagnetic
data, products and services to academics, business and the public.
• Knowledge and information for all
sectors of society on geomagnetism science: what it tells us about the Earth and how it can be used in practical ways.
The eight observatories operated by BGS Geomagnetism in 2011.
To contents page
4
Introduction:
The Year in Perspective
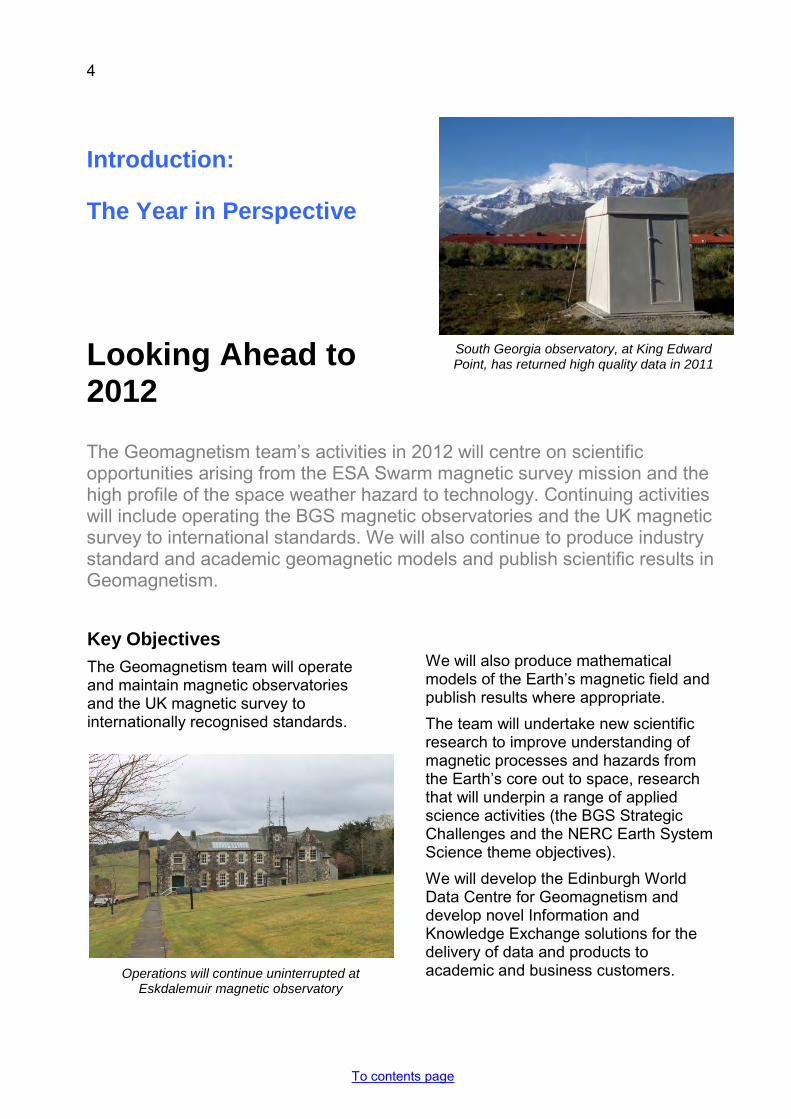
Looking Ahead to 2012
The Geomagnetism team’s activities in 2012 will centre on scientific opportunities arising from the ESA Swarm magnetic survey mission and the high profile of the space weather hazard to technology. Continuing activities will include operating the BGS magnetic observatories and the UK magnetic survey to international standards. We will also continue to produce industry standard and academic geomagnetic models and publish scientific results in Geomagnetism.
Key Objectives The Geomagnetism team will operate and maintain magnetic observatories and the UK magnetic survey to internationally recognised standards.
We will also produce mathematical models of the Earth’s magnetic field and publish results where appropriate.
The team will undertake new scientific research to improve understanding of magnetic processes and hazards from the Earth’s core out to space, research that will underpin a range of applied science activities (the BGS Strategic Challenges and the NERC Earth System Science theme objectives).
We will develop the Edinburgh World Data Centre for Geomagnetism and develop novel Information and Knowledge Exchange solutions for the delivery of data and products to academic and business customers.
South Georgia observatory, at King Edward Point, has returned high quality data in 2011
Operations will continue uninterrupted at Eskdalemuir magnetic observatory
To contents page
5
We will represent BGS externally, including on scientific bodies such as INTERMAGNET and IAGA, and exert influence through leadership roles in UK and international scientific projects and through professional bodies.
We will contribute to BGS and NERC goals, e.g. on geo-science knowledge, resources, whole-Earth processes, and Earth hazards and provide National Capability in environmental geomagnetic monitoring.
Team outputs, including global and national geomagnetic field models and space weather hazard products, will be supported by Government and the private sector (e.g. MOD, NATO, the hydrocarbons sector, National Grid, ESA and EU).
Main Deliverables Our specific deliverables for 2012 will be:
• An INTERMAGNET-standard UK observatory network and annual re-survey of sites in the UK magnetic repeat station network.
• Publication of observatory data and data products online, in the Monthly Bulletins series and in the Observatory Yearbooks series.
• Supply of observatory data to INTERMAGNET, according to the timetable set by the INTERMAGNET organisation.
• Supply of magnetic index products to the International Service for Geomagnetic Indices (ISGI), according to the timetable set by ISGI.
• Annual revisions of the UK and global geomagnetic field models.
• Operation of the World Data Centre for Geomagnetism (Edinburgh), including an annual ‘call for data’ and associated quality control activities.
• Pursuing of new scientific collaborations that address BGS challenges and NERC themes.
• Collaboration on existing international geomagnetic observatory (INDIGO) and survey programmes (MagNetE).
• Active participation (through presentations and organisation of sessions) in at least one major international scientific conference.
• Publication of two or more first-author papers in scientific and professional journals, the writing of articles and dissemination of data products.
• Publication of a Geomagnetism team Annual Report.
• Provision of information and other data through the Geomagnetism and main BGS websites and by email as appropriate. The supply of real-time observatory data products, solar and geomagnetic activity index forecasts and nowcasts to European Space Agency (ESA) for the Space Weather
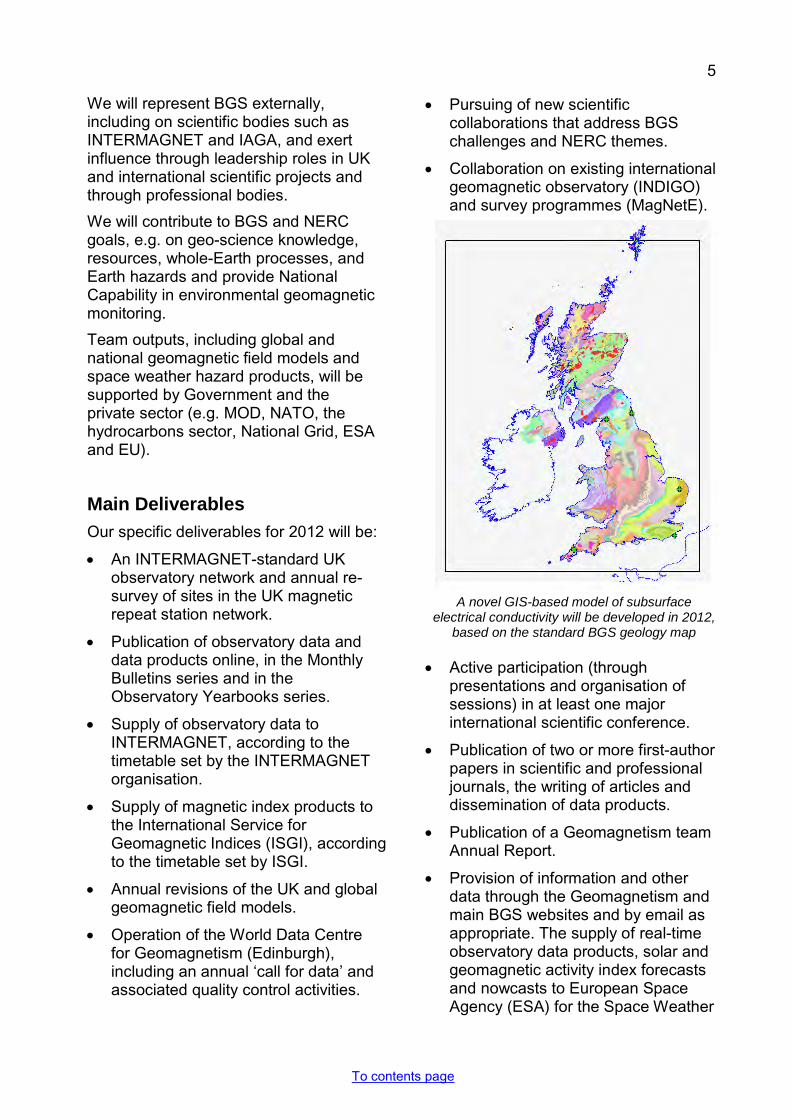
A novel GIS-based model of subsurface electrical conductivity will be developed in 2012,
based on the standard BGS geology map

To contents page
6
Network (SWENET). Also supplied are real-time one-minute data from Hartland to NOAA Space Weather Prediction Centre (SWPC) and real-time magnetograms, local and planetary magnetic indices and daily forecasts to UK Met Office.
• Improve and implement magnetic satellite data selection program and along-track external field noise filter for Swarm data.
• Build and test models of the UK power grid and electrical conductivity (in association with the EURISGIC project).
• Develop improved models of the UK high voltage grid and of the sub-surface conductivity of the UK. Testing of models in respect of hypothetical worst cases and historical storms.
• Develop and implement Swarm satellite ‘level 2’ fast-track magnetospheric model, quick-look products for level 1b data, and validation of level 2 products. Integrate products and systems with ESA level 2 delivery system.
• Develop and deliver geomagnetic data products to support directional drilling worldwide, as per customer requests, including a new on-line In-Field Referencing data calculator.
• Operate INTERMAGNET-standard non-UK observatory network.
• Carry out geomagnetic data collection and processing ahead of World Magnetic Model revision in 2014-2015.
• Produce the annual update of the BGGM, using satellite and other geomagnetic data, including data from all BGS operated observatories.
• Deliver geomagnetic observatory data and magnetic field products including daily geomagnetic activity
forecasts, to support geophysical survey companies and directional drilling operations. Also, provide observatory facilities for calibration and testing of instruments.
• Perform re-survey of 10 UK magnetic survey sites. Derive 2012 UK national magnetic model and deliver customer report.
• Delivery of Hartland observatory one-minute mean data to USGS, as per delivery schedule agreed with USGS.
• Upgrade the Monitoring and Analysis of GIC (MAGIC) webtool, as per agreement with National Grid. Analyse UK grid response to hypothetical worst case scenarios, with National Grid, for DECC and Cabinet Office.
• Deliver share of 16 lectures to 4th year undergraduates at Edinburgh University, set and mark exam questions, run tutorials, set and supervise student projects.
Modelled magnetic (top left), electric (bottom left) and geomagnetically induced currents (main picture) during
a hypothetical worst case space weather event
To contents page
7
• Continuation of the scanning programme of UK observatory paper magnetograms, yearbooks and other records and further development of the on-line database for academic and public research (http://www.bgs.ac.uk/data/Magnetograms/home.html).
Some Key Results from 2011
Elsewhere in this report we provide further detail on some of our major outputs and activities for 2011.
Here, in brief, are some key numbers, which help to put in perspective the team’s outputs as a whole for 2011.
• Reaching a milestone of 255,133 scanned magnetograms (out of a total of 301,348 in the archive).
• 100% (>99%) UK (overseas) observatory data coverage.
• 97 Ordnance Survey map compass references.
• 94 magnetic bulletins published.
• 37 field set-ups for IIFR/IFR services and 38 customer reports.
• 7 journal papers, 5 book chapters, 14 scientific meetings, 25 presentations/posters.
• 6 articles on space weather for RIN ‘Navigation News’.
• 6 positions on scientific and technical geomagnetism bodies.
• 1 Television, 4 radio interviews and >5 newspaper and web articles.
• 2 Twitter services launched, 1 YouTube video, 1 South Atlantic blog, 1 podcast.
• 2 PhD students.
• 2 geomagnetic models (UK reference model and BGGM).
• 1 MSc student.
• 1 new on-line historical yearbook archive (for both the UK and ‘colonial’ observatories).
• 1 new magnetic observatory (KEP – South Georgia).
• 1 ‘MAGIC’ website, delivering monitoring and modeling data for assessing the space weather hazard to the UK power grid.
• 1 World Magnetic Model web service.
• 1 NERC grant bid awarded (NERC new investigators grant).
• 1 visit by UK science minister, The Rt Hon David Willetts.
.

To contents page
8
Technical, Observatory and Field Operations
UK and Overseas Observatories
BGS operates three absolute magnetic observatories in the UK and five overseas. These observatories supply the high quality, real-time measurements that support our research and services. BGS also takes a leading role in expanding the global observatory network, both for improved global modelling and for local application of the data. The Geomagnetism Team achieved 100% data coverage from the UK observatories in 2011.
UK Magnetic Observatories
To continually maintain 100% data coverage, BGS must ensure that there is redundancy in essential instrumentation and telemetry at the observatories to manage planned outages and unforeseen disturbance or failure. During 2011, additional measures were put into place at all three UK observatories to address site-specific redundancy issues.
The electricity supply at Hartland was supplemented by an uninterruptable system to support the off-site data processing mirror and web server which is relied on whenever the main Edinburgh-based systems are offline.
In Lerwick, to prepare for the imminent move of the Met Office building, BGS has implemented measures such as an independent GSM internet connection, to preserve real-time telemetry during building works. Although planned for spring 2011, the Met Office has now postponed the move until spring 2012 at the earliest.
A third instrument site at Eskdalemuir has been prepared to further distribute
monitoring around the observatory, which will help to identify and correct for any external magnetic disturbance.
A second bid to acquire land adjacent to Hartland Observatory was set-back by the current owner. Nonetheless, this bid remains open as BGS believe it is of interest to have a say in local land use to ensure long-term monitoring at Hartland, as well as preserving the observatory as a calibration and training resource. A course in magnetic surveying was provided to the Royal Navy prior to their 2011/12 South Atlantic campaign and Hartland is regularly used by a magnetometer manufacturer.
UK Repeat Station Network
During summer 2011, absolute magnetic measurements were carried out at 11 repeat station sites. At eight of the sites, differential GPS was used to determine true north information as a more convenient alternative to the standard north seeking gyroscope. Using UK observatory data to remove external field sources, the final data were made
Jim Carrigan Observatory located on the Arctic tundra of the Northern Alaskan oil fields
To contents page
9
available for inclusion in the regional model, used to provide grid magnetic angle data to the Ordnance Survey.
Overseas Observatories
Having undergone two years of uncertainty due to the lack of IIFR income in the area, BGS has negotiated a contract with Environment Canada and agreed to fund the running costs for Sable Island Observatory in order that data can continue to be used for global modelling. The observatory may also be considered for application to the INTERMAGNET network in the near future.
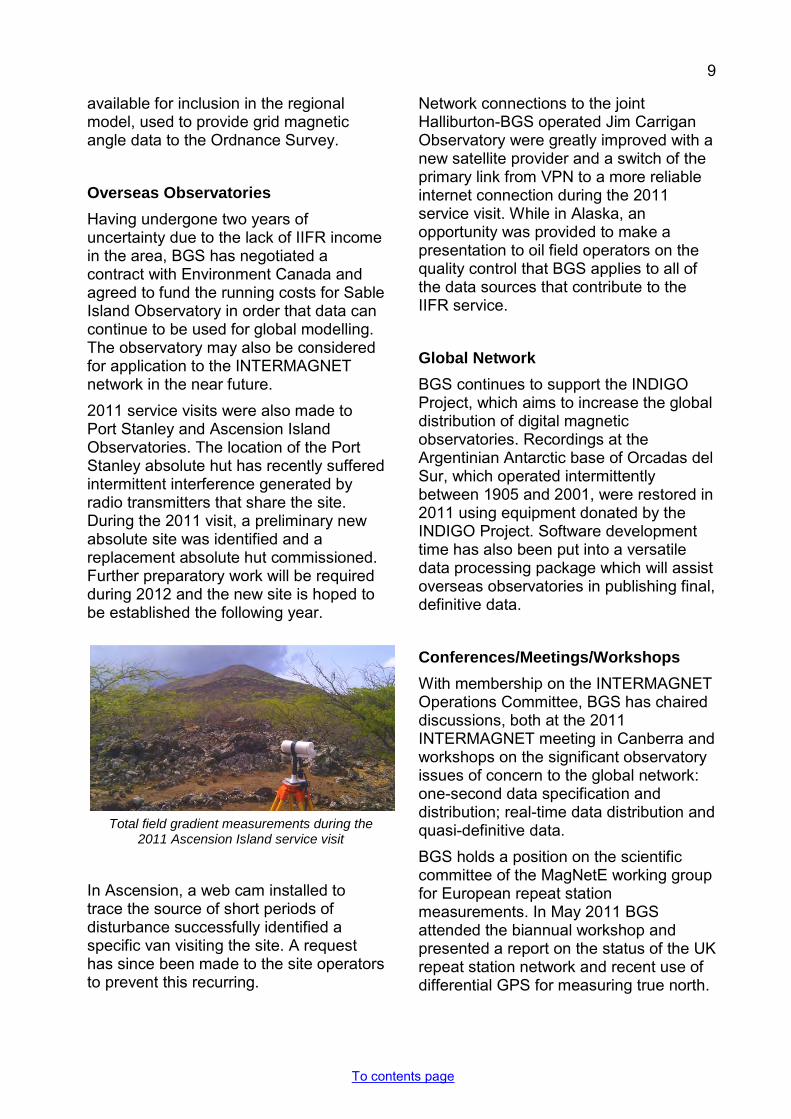
2011 service visits were also made to Port Stanley and Ascension Island Observatories. The location of the Port Stanley absolute hut has recently suffered intermittent interference generated by radio transmitters that share the site. During the 2011 visit, a preliminary new absolute site was identified and a replacement absolute hut commissioned. Further preparatory work will be required during 2012 and the new site is hoped to be established the following year.
In Ascension, a web cam installed to trace the source of short periods of disturbance successfully identified a specific van visiting the site. A request has since been made to the site operators to prevent this recurring.
Network connections to the joint Halliburton-BGS operated Jim Carrigan Observatory were greatly improved with a new satellite provider and a switch of the primary link from VPN to a more reliable internet connection during the 2011 service visit. While in Alaska, an opportunity was provided to make a presentation to oil field operators on the quality control that BGS applies to all of the data sources that contribute to the IIFR service.
Global Network
BGS continues to support the INDIGO Project, which aims to increase the global distribution of digital magnetic observatories. Recordings at the Argentinian Antarctic base of Orcadas del Sur, which operated intermittently between 1905 and 2001, were restored in 2011 using equipment donated by the INDIGO Project. Software development time has also been put into a versatile data processing package which will assist overseas observatories in publishing final, definitive data.
Conferences/Meetings/Workshops
With membership on the INTERMAGNET Operations Committee, BGS has chaired discussions, both at the 2011 INTERMAGNET meeting in Canberra and workshops on the significant observatory issues of concern to the global network: one-second data specification and distribution; real-time data distribution and quasi-definitive data.
BGS holds a position on the scientific committee of the MagNetE working group for European repeat station measurements. In May 2011 BGS attended the biannual workshop and presented a report on the status of the UK repeat station network and recent use of differential GPS for measuring true north.
Total field gradient measurements during the 2011 Ascension Island service visit
To contents page
10
Technical, Observatory and Field Operations
King Edward Point Geomagnetic Observatory
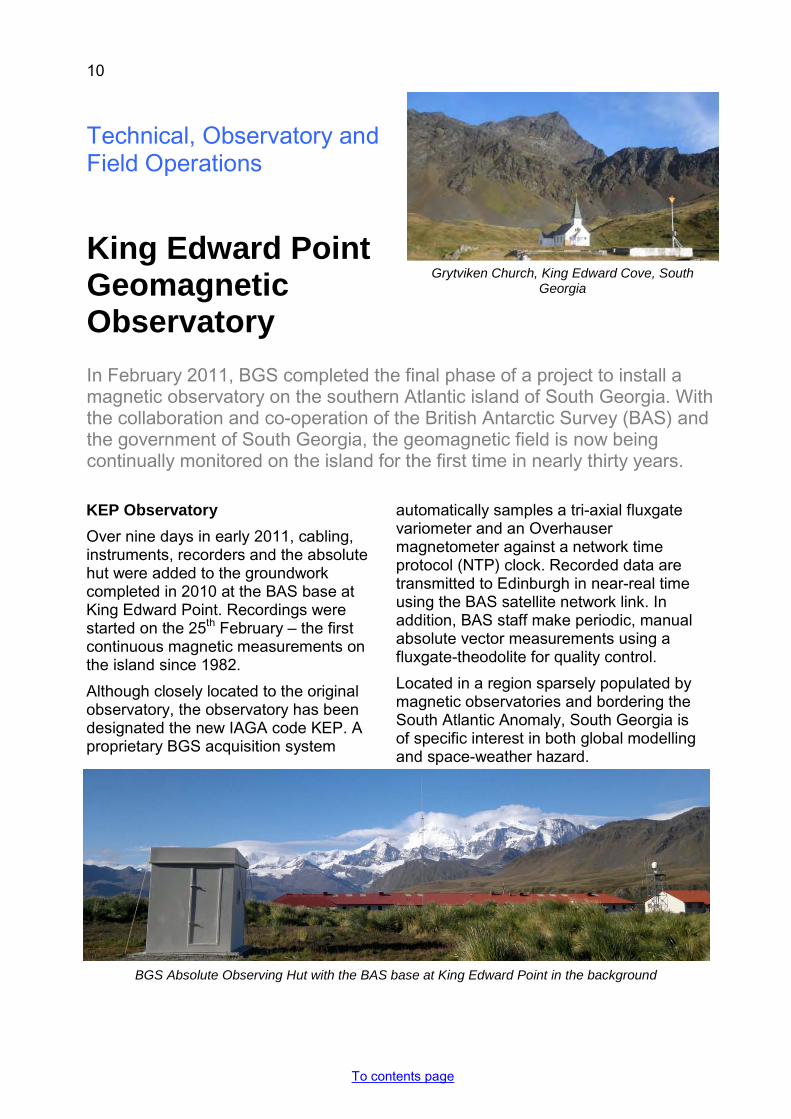
In February 2011, BGS completed the final phase of a project to install a magnetic observatory on the southern Atlantic island of South Georgia. With the collaboration and co-operation of the British Antarctic Survey (BAS) and the government of South Georgia, the geomagnetic field is now being continually monitored on the island for the first time in nearly thirty years. KEP Observatory
Over nine days in early 2011, cabling, instruments, recorders and the absolute hut were added to the groundwork completed in 2010 at the BAS base at King Edward Point. Recordings were started on the 25th February – the first continuous magnetic measurements on the island since 1982.
Although closely located to the original observatory, the observatory has been designated the new IAGA code KEP. A proprietary BGS acquisition system
automatically samples a tri-axial fluxgate variometer and an Overhauser magnetometer against a network time protocol (NTP) clock. Recorded data are transmitted to Edinburgh in near-real time using the BAS satellite network link. In addition, BAS staff make periodic, manual absolute vector measurements using a fluxgate-theodolite for quality control.
Located in a region sparsely populated by magnetic observatories and bordering the South Atlantic Anomaly, South Georgia is of specific interest in both global modelling and space-weather hazard.
Grytviken Church, King Edward Cove, South Georgia
BGS Absolute Observing Hut with the BAS base at King Edward Point in the background
To contents page
11
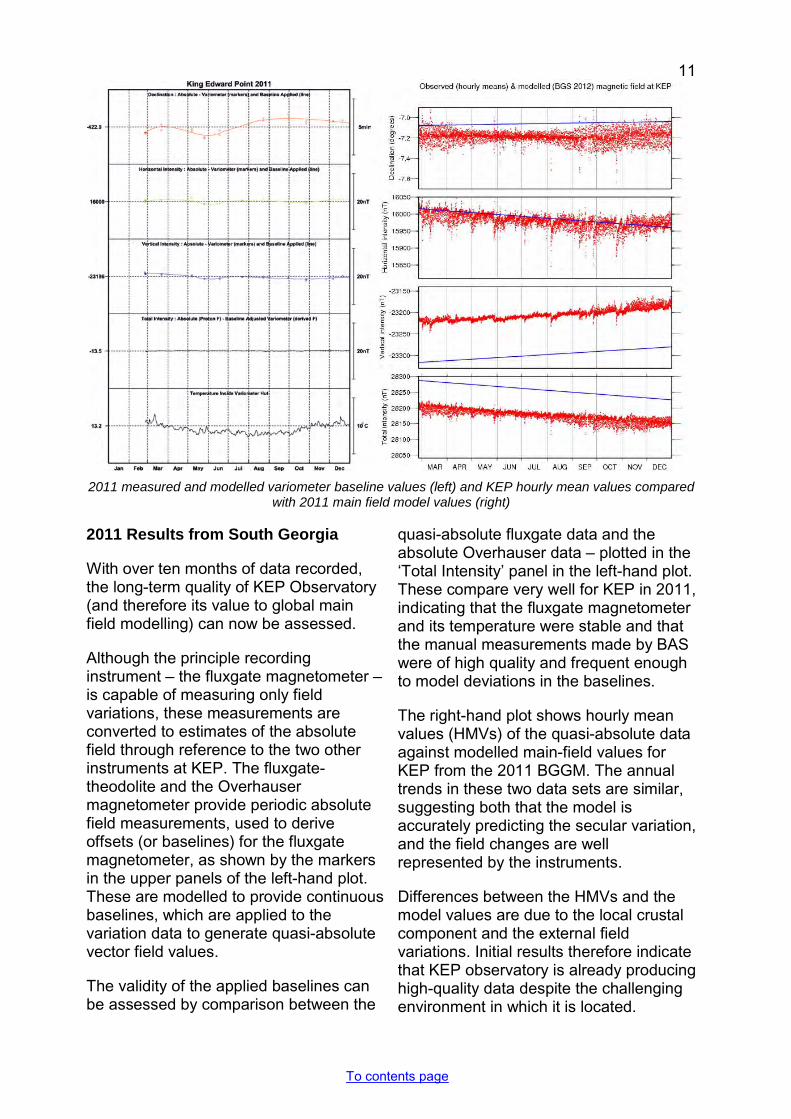
2011 Results from South Georgia
With over ten months of data recorded, the long-term quality of KEP Observatory (and therefore its value to global main field modelling) can now be assessed.
Although the principle recording instrument – the fluxgate magnetometer – is capable of measuring only field variations, these measurements are converted to estimates of the absolute field through reference to the two other instruments at KEP. The fluxgate-theodolite and the Overhauser magnetometer provide periodic absolute field measurements, used to derive offsets (or baselines) for the fluxgate magnetometer, as shown by the markers in the upper panels of the left-hand plot. These are modelled to provide continuous baselines, which are applied to the variation data to generate quasi-absolute vector field values.
The validity of the applied baselines can be assessed by comparison between the
quasi-absolute fluxgate data and the absolute Overhauser data – plotted in the ‘Total Intensity’ panel in the left-hand plot. These compare very well for KEP in 2011, indicating that the fluxgate magnetometer and its temperature were stable and that the manual measurements made by BAS were of high quality and frequent enough to model deviations in the baselines.
The right-hand plot shows hourly mean values (HMVs) of the quasi-absolute data against modelled main-field values for KEP from the 2011 BGGM. The annual trends in these two data sets are similar, suggesting both that the model is accurately predicting the secular variation, and the field changes are well represented by the instruments.
Differences between the HMVs and the model values are due to the local crustal component and the external field variations. Initial results therefore indicate that KEP observatory is already producing high-quality data despite the challenging environment in which it is located.
2011 measured and modelled variometer baseline values (left) and KEP hourly mean values compared with 2011 main field model values (right)

To contents page
12
Technical, Observatory and Field Operations
Ingredients for Successful Real-Time Data Services
A successful, operational data service needs to provide 24/7 access to good quality data and information, with a high level of reliability. To do this it needs to be resilient, with built in redundancy at all possible critical points of failure. Near real-time data products are often required by stakeholders, based on real-time measurements from a variety of instruments at various locations. This adds to the complexity of maintaining such a service.
Observatory Data Processing
In the operation of its magnetic observatories, and in order to support a variety of data services, BGS has developed infrastructure, systems and operations to optimise the real-time delivery of accurate data and data products. From this basis, reliable and resilient services are provided, for example in space weather monitoring, and in interpolated in-field referencing, described elsewhere in this annual review.
The BGS operates three observatories in the UK. Each observatory has three identical systems with vector (fluxgate) and scalar (proton precession) magnetometers recording the magnetic field direction (at 1Hz) and magnitude (at 0.1Hz) respectively.
Quality Control
Real-time data from the BGS observatories are an important component of the BGS data services. The configuration of observatory instrumentation allows us to do the
Reliability of data delivery in 2011
The primary and back-up GDAS systems at Hartland Observatory, North Devon
To contents page
13
following in real-time to ensure high quality data:
• Reliably identify instrument problems or interference in the data by comparing recordings from vector and scalar instruments.
• Replace corrupt data with data from an unaffected system.
• Detect timing errors.
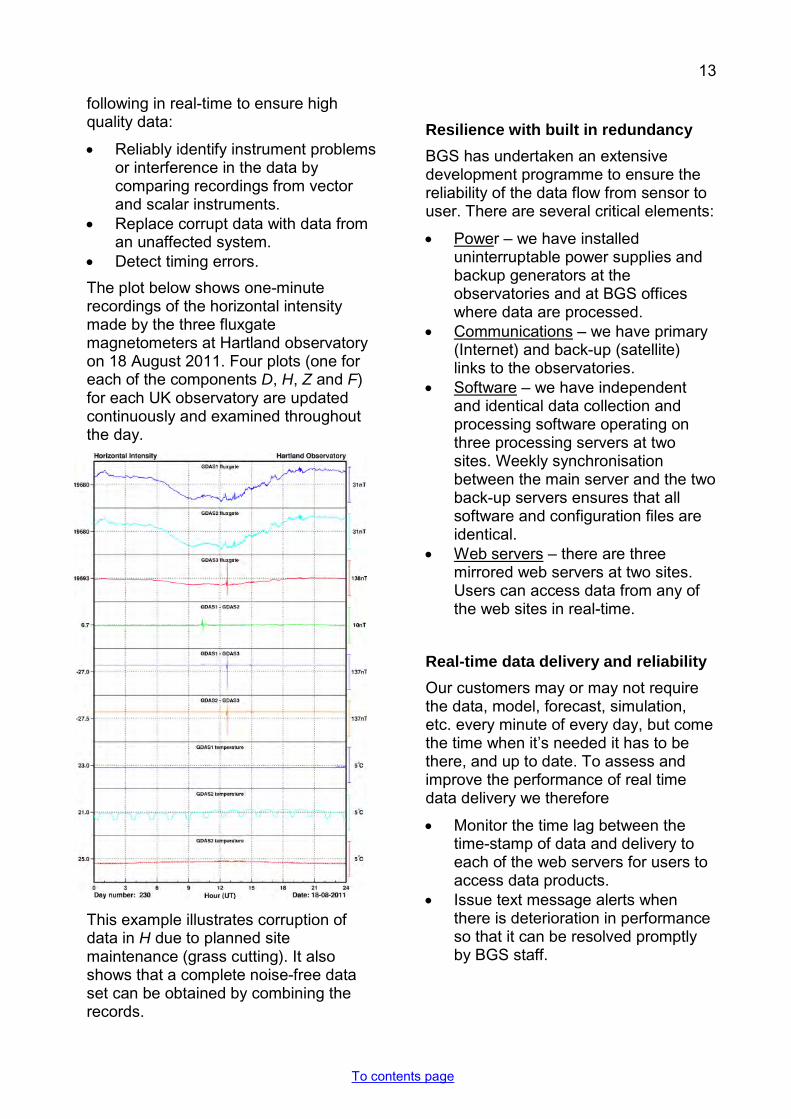
The plot below shows one-minute recordings of the horizontal intensity made by the three fluxgate magnetometers at Hartland observatory on 18 August 2011. Four plots (one for each of the components D, H, Z and F) for each UK observatory are updated continuously and examined throughout the day.
This example illustrates corruption of data in H due to planned site maintenance (grass cutting). It also shows that a complete noise-free data set can be obtained by combining the records.
Resilience with built in redundancy
BGS has undertaken an extensive development programme to ensure the reliability of the data flow from sensor to user. There are several critical elements:
• Power – we have installed uninterruptable power supplies and backup generators at the observatories and at BGS offices where data are processed.
• Communications – we have primary (Internet) and back-up (satellite) links to the observatories.
• Software – we have independent and identical data collection and processing software operating on three processing servers at two sites. Weekly synchronisation between the main server and the two back-up servers ensures that all software and configuration files are identical.
• Web servers – there are three mirrored web servers at two sites. Users can access data from any of the web sites in real-time.
Real-time data delivery and reliability
Our customers may or may not require the data, model, forecast, simulation, etc. every minute of every day, but come the time when it’s needed it has to be there, and up to date. To assess and improve the performance of real time data delivery we therefore
• Monitor the time lag between the time-stamp of data and delivery to each of the web servers for users to access data products.
• Issue text message alerts when there is deterioration in performance so that it can be resolved promptly by BGS staff.
To contents page
14
Technical, Observatory and Field Operations
World Data Centre for Geomagnetism
New data continue to be actively solicited, checked and added to the holdings of the World Data Centre for Geomagnetism (Edinburgh). In 2011 BGS submitted an application to become part of the new International Council for Science World Data System and participated in its inaugural conference in Kyoto. A project to identify and reduce differences in data held at the Edinburgh and Kyoto World Data Centres was also initiated during the visit to Japan. Preparatory work was undertaken at the Edinburgh World Data Centre to provide vital support to the ESA Swarm satellite mission.
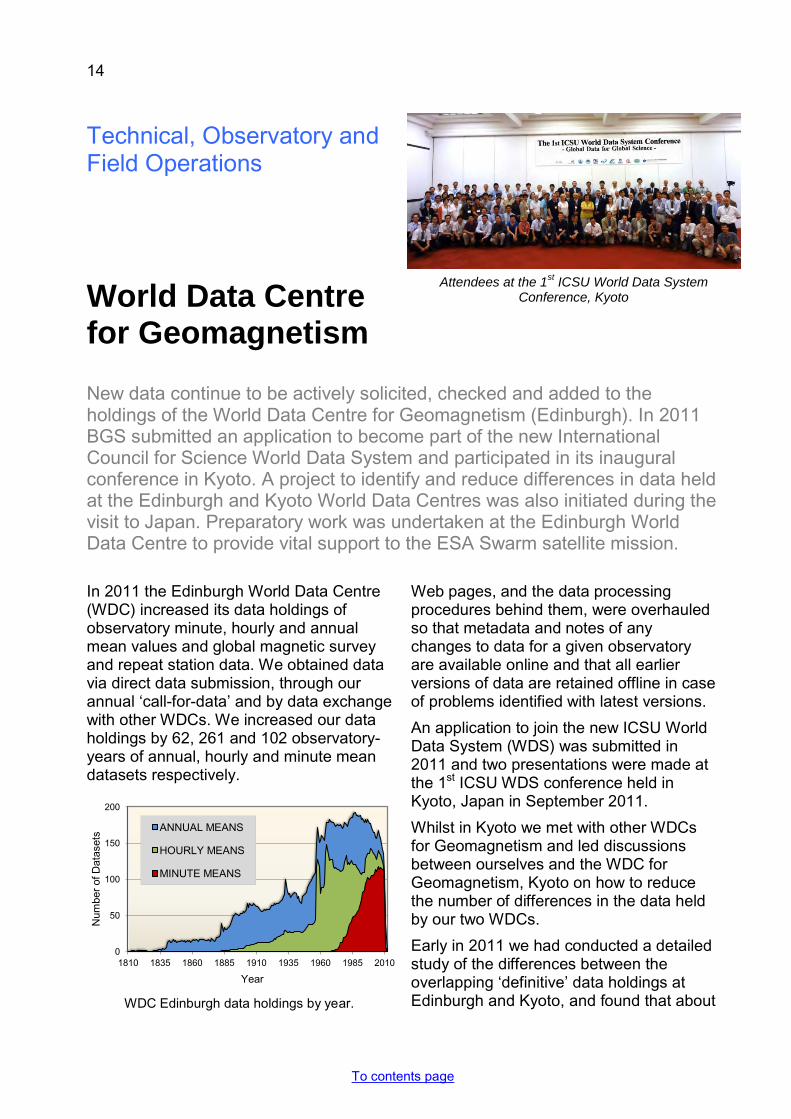
In 2011 the Edinburgh World Data Centre (WDC) increased its data holdings of observatory minute, hourly and annual mean values and global magnetic survey and repeat station data. We obtained data via direct data submission, through our annual ‘call-for-data’ and by data exchange with other WDCs. We increased our data holdings by 62, 261 and 102 observatory-years of annual, hourly and minute mean datasets respectively.
WDC Edinburgh data holdings by year.
Web pages, and the data processing procedures behind them, were overhauled so that metadata and notes of any changes to data for a given observatory are available online and that all earlier versions of data are retained offline in case of problems identified with latest versions.
An application to join the new ICSU World Data System (WDS) was submitted in 2011 and two presentations were made at the 1st ICSU WDS conference held in Kyoto, Japan in September 2011.
Whilst in Kyoto we met with other WDCs for Geomagnetism and led discussions between ourselves and the WDC for Geomagnetism, Kyoto on how to reduce the number of differences in the data held by our two WDCs.
Early in 2011 we had conducted a detailed study of the differences between the overlapping ‘definitive’ data holdings at Edinburgh and Kyoto, and found that about
0
50
100
150
200
1810 1835 1860 1885 1910 1935 1960 1985 2010
Num
ber
of D
atas
ets
Year
ANNUAL MEANS
HOURLY MEANS
MINUTE MEANS
Attendees at the 1st ICSU World Data System Conference, Kyoto
To contents page
15
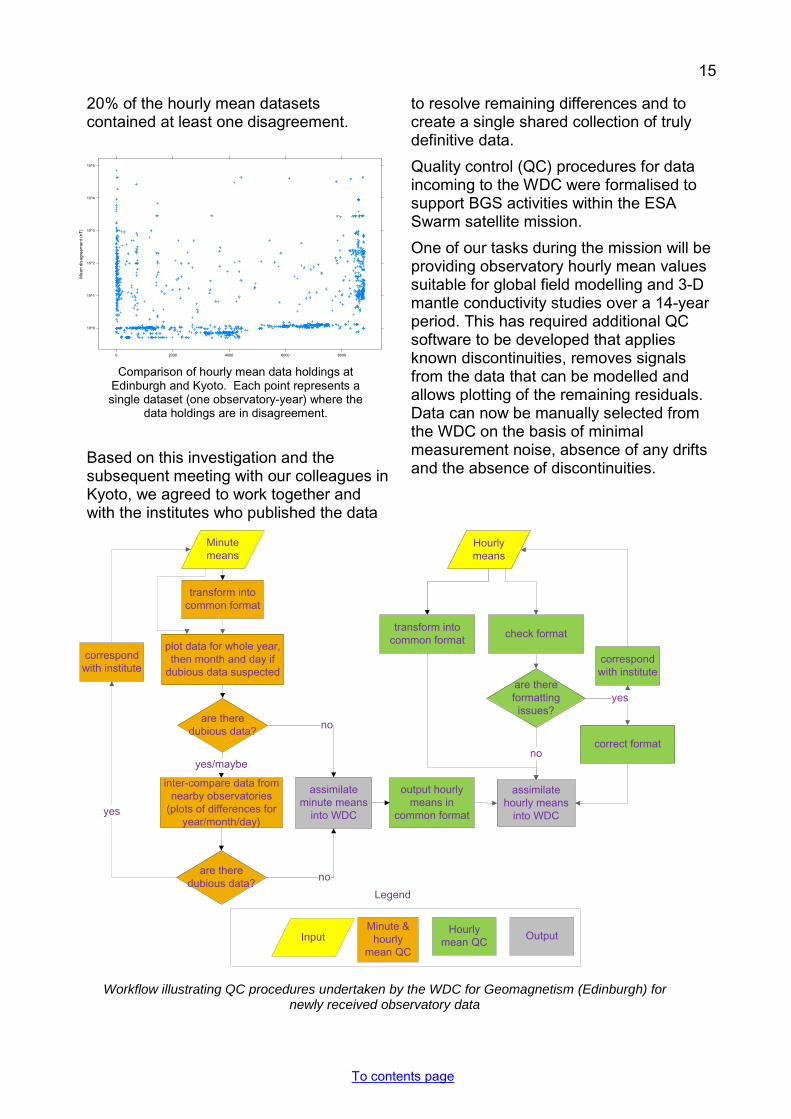
20% of the hourly mean datasets contained at least one disagreement.
Based on this investigation and the subsequent meeting with our colleagues in Kyoto, we agreed to work together and with the institutes who published the data
to resolve remaining differences and to create a single shared collection of truly definitive data.
Quality control (QC) procedures for data incoming to the WDC were formalised to support BGS activities within the ESA Swarm satellite mission.
One of our tasks during the mission will be providing observatory hourly mean values suitable for global field modelling and 3-D mantle conductivity studies over a 14-year period. This has required additional QC software to be developed that applies known discontinuities, removes signals from the data that can be modelled and allows plotting of the remaining residuals. Data can now be manually selected from the WDC on the basis of minimal measurement noise, absence of any drifts and the absence of discontinuities.
Number of disagreements
Mea
n di
sagr
eem
ent (
nT)
10^0
10^1
10^2
10^3
10^4
10^5
0 2000 4000 6000 8000
Comparison of hourly mean data holdings at Edinburgh and Kyoto. Each point represents a single dataset (one observatory-year) where the
data holdings are in disagreement.
Minute means
transform into common format
inter-compare data from nearby observatories
(plots of differences for year/month/day)
plot data for whole year, then month and day if
dubious data suspected
are there dubious data?
are there dubious data?
correspond with institute
yes/maybe
assimilate minute means
into WDC
no
no
output hourly means in
common format
Hourly means
transform into common format
are there formatting issues?
correspond with institute
assimilate hourly means
into WDC
check format
yes
Legend
no
Minute & hourly
mean QC
Hourly mean QCInput Output
correct format
yes
Workflow illustrating QC procedures undertaken by the WDC for Geomagnetism (Edinburgh) for newly received observatory data
To contents page
16
Technical, Observatory and Field Operations
The BGS Contribution to INTERMAGNET
INTERMAGNET sets standards for the operation of modern geomagnetic observatories and provides assistance to them. It also operates centres for the exchange of provisional geomagnetic data in near real time and provides a method for archiving and distribution of definitive observatory data.
Representation on INTERMAGNET
BGS has had strong representation on INTERMAGNET since its foundation in 1987, including having held the chairs of the Executive Council and the Operations Committee. BGS currently has one member on the INTERMAGNET Executive Council and two members on the Operations Committee, who also chair subcommittees on observatory membership and data management.
Quasi-Definitive Data
INTERMAGNET has set standards for 'quasi-definitive' data, that is, full-field data which is produced soon after recording and is very close to definitive. The idea here is to encourage observatories to produce data that is suitable for modelling the
core field much more promptly than has previously been the case. This is particularly important in relation to satellite missions such as the upcoming Swarm three-satellite mini-constellation, where the observatory data will be used both to improve the spatial resolution of some models and to validate the data from the satellite.
BGS has coordinated the changes needed to collect and distribute quasi-definitive data at the INTERMAGNET data centres. We are now starting the process of guiding and encouraging observatories to produce this new data product.
High Resolution Data
BGS is active in two areas of the drive towards high resolution data. First we are leading the task to set standards
www.intermagnet.org

To contents page
17
for producing observatory data at higher resolution in time and amplitude than is recorded today. INTERMAGNET’s main provisional data is sampled once a minute at 100pT resolution. The new standards will describe data that is sampled once a second to 1pT resolution.
Observatories will be encouraged (though not required) to move to the new standards, with help and advice given where it is required.
Some observatories are already able to produce high resolution data (though not necessarily to the standards that INTERMAGNET will set). BGS has led the drive to update the infrastructure that will gather and distribute this data. Data are being collected from many observatories as part of a drive to test INTERMAGNET’s ability to exchange high resolution data in near real time.
This data will soon be available for download by users and will help in the study of a number of geomagnetic phenomena, such as pulsations (waves propagating in the Earth’s
magnetic field that are produced by processes in the magnetosphere and solar wind – see Figure below).
Other areas of work
BGS continues to play a major role in the INDIGO project, a scheme to provide low cost, high quality digital observing systems to developing countries. (This project was fully described in the 2010 annual report.)
One of the major products that INTERMAGNET produces is an annual CD or DVD containing definitive data from all INTERMAGNET observatories. The first CD was produce in 1991, containing data from 38 observatories. The most recent DVD (2008) contains data from 102 observatories (reflecting the growth in INTERMAGNET’s membership). As well as playing a part in the quality control of this data, BGS also wrote and continues to maintain the software that allows users to access and visualise this large archive of observatory data and metadata.
Example of pulsations in Hartland data (approx.09:25 to 09:32)

To contents page
18
Science
Separation of the Large-Scale Crustal Magnetic Field Using Slepian Functions
Magnetic field models are typically expressed in terms of global spherical harmonics and Gauss coefficients. Slepian functions are a form of wavelets that we can use to manipulate spherical harmonic models and coefficients to represent the magnetic field in separate regions of the globe. Slepian functions are suitable for optimally decomposing spherical harmonic models into different parts. We use Slepian functions to examine the differences between the oceanic and continental crust by decomposing the global lithospheric magnetic field model ‘MF7’ into two regions, one localised on the continents and the other, its complement, localised in the oceans.
Spherical harmonic models are excellent global representations of the magnetic field. However, they cannot be used to represent individual regions of the Earth, as their useful mathematical properties break down. In contrast, Slepian functions are designed to maintain their mathematical properties whether representing global or regional magnetic fields.
The Earth’s continental crust consists of a number of ancient blocks with varying magnetic properties while the oceanic crust is relatively young, thinner and appears much more homogeneous.
In a novel paper (Saarimäki, J., Beggan, C., Whaler, K. and F. Simons, 2012), we investigated what differences there are
between the magnetic field in the ocean basins and on the continents by examining the lithospheric field model MF7 (see Figure above). This model is based on CHAMP satellite measurements down to wavelengths of 550km. We chose the continent/ocean boundary by examining maps of offshore topography (green line, above).
To separate the global model into two regions, firstly a Slepian basis for the continents was calculated. The Gauss coefficients were projected into the Slepian basis, separated into two parts and then projected back into the spherical harmonic basis, where they can be analysed using standard tools.
MF7 input model of the Earth’s crustal magnetic radial field with wavelengths between 550-
2500km. Green line shows the ocean/continent crustal boundary.

To contents page
19
The Figures top left and top right respectively shows the spatial decomposition of continental and oceanic signals. The signal outside each chosen area is very small, though in neither case does it vanish completely.
The lower Figure shows the power spectrum within each region. Two observations can be made about these results. First, the spectrum of the continental region shows much more variability than the oceanic signal. Overall, the power from the continental region is significantly greater than the power of the oceanic region.
Second, the continental field carries more than twice as much power as the oceanic field, although its area is only 40% of the surface. This can be explained by its larger volume, although
this is counter-balanced to an extent by extrusive oceanic basaltic layers with strong magnetisations.
The oceanic signal contains approximately equal power at all degrees, probably arising from a combination of processes, some natural and some inherent in the data processing, such as randomly timed reversals of magnetic poles, non-uniform plate motions and the smoothing effect of the satellite measurements from which MF7 is derived.
This research is a product of BGS collaboration with the University of Edinburgh and University of Princeton.
Saarimäki, J., Beggan, C., Whaler, K. and F. Simons (2012), Spectral and spatial decomposition of core and lithospheric magnetic field models using Slepian functions, Geophysical Journal International, in review
The radial component of the MF7 crustal magnetic field data decomposed into (a) continental and (b) oceanic parts and (c) the spectra from each area.
(c)

To contents page
20
Science
Near Real-Time Magnetospheric Models from Swarm Satellite Data
BGS is developing a model of the large scale magnetospheric field for the upcoming ESA Swarm mission, scheduled for launch in October 2012. The automated software package will ingest Swarm magnetic data each day and produce a time-series of models of the largest scale features of the external field. Acting like a satellite-based proxy for the storm disturbance index (Dst) the BGS model is designed to be of use to both solid Earth scientists and the space weather community. BGS is part of the SCARF consortium tasked by ESA to produce products from the data returned by the ESA Swarm mission (see inset, right). One of BGS’s work packages is to develop a software processing system to rapidly produce models of the large scale magnetospheric field (degree 1 spherical harmonic coefficients). Each model represents an average of the fields over approximately one orbital period of the Swarm satellites. When operational, the models will be released daily.
The magnetospheric field is the product of many current systems. These current systems are driven primarily by the interaction of the Earth’s internally generated magnetic field with the solar wind. Consequently, these sources are strongly influenced by solar activity and can fluctuate unpredictably
Schematic of Swarm mission orbits (image courtesy of ESA)
ESA Swarm mission
• An ESA Earth Explorer Mission. • Expected launch: October 2012
from Plesetsk in northern Russia • Planned operational lifetime: 48
months. • Three identical satellites • Orbit altitude: 450-530 km • Two satellites fly in close
formation, the third follows a separate higher orbit
• 90 minute orbit period • Scalar and vector magnetic
instruments

To contents page
21
on timescales down to seconds. It is therefore of great importance for those studying space weather, or for researchers wishing to remove the magnetic field signal from their own models (including other products of the Swarm mission), that they are able to characterise the magnetospheric field. For space weather applications, in particular, it is vital to provide this information in near-real-time.
The BGS model was designed jointly by BGS and Vincent Lesur at GeoForschungsZentrum (GFZ) in Postdam. The processing chain (see inset, right) is able to process one day’s worth of Swarm data in minutes and the entire mission lifetime in under a day.
This ability to quickly re-process large amounts of data is also required because the models may have to be regenerated when retrospective recalibrations are made to the satellite data or new reference models (used in step 3, see inset right) become available.
As well as complementing the Dst index by providing a satellite based product, it will also improve on some aspects of Dst by maintaining a realistic baseline based on models of the other sources rather than simple polynomial subtraction.
Rapid Magnetospheric Modelling
• Collect new day’s worth of Swarm satellites’ data from ESA.
• Reject data from high geomagnetic latitudes to avoid contamination from field-aligned currents.
• Remove estimates of unwanted signals: core, lithospheric, and ionospheric field sources from the data using existing models.
• Average processed data over each orbit to produce a time-series of magnetospheric models.
• Separate the model into two time-series: the component generated in the magnetosphere and also the component from currents it induces in the mantle.
• Deliver new models to ESA.
Dominant component of the Fast-Track magnetospheric model (aligned with geomagnetic dipole) derived from one year of ESA Swarm mission simulated data (based on real observatory data). The magnetospheric field has an average steady component of ~25 nT but is highly variable. Peaks in the
model highlight particularly active periods where the magnetospheric field was enhanced.

To contents page
22
Science
Extreme Geomagnetic Activity
Understanding the extremes in geomagnetic activity is an important part of understanding just how severe conditions can become in the terrestrial space environment. Extreme activity also has consequences for technological systems. On the ground, extreme geomagnetic behaviour has an impact on navigation and position accuracy and on the operation of power grids and pipeline networks. A rapidly changing geomagnetic field constitutes a natural hazard to grounded power grids and pipeline networks and to precise navigation. To understand this hazard we have continuous magnetic measurements across the world for typically less than 100 years. Much of the older data is in analogue paper form, or is only available digitally as hourly or daily means, or as magnetic indices. So it is not yet clear what the true extremes in geomagnetic variation are, particularly on time scales - seconds to minutes - that are relevant in estimating the hazard from space weather.
Within Europe many magnetic observatories have produced digital data at a sampling rate of one minute or better for over two decades. In this time a number of severe magnetic storms have occurred, for example on 13th March 1989 and 30th October 2003. However we know that larger storms have occurred in the past, most notably the ‘Carrington event’ of September 1859 and for which only limited
information is available. How does ‘Carrington’ fit within the range of activity we could expect?
Extreme value statistics (EVS) is a technique that has been used in studies into extreme atmospheric weather and climate. EVS relies on the ‘extremal types theorem’, which shows that extreme data follow one of three types of distribution and that inference may be made of extremes outside the data set by fitting observed data to a generalised distribution function.
EVS has previously been applied to geomagnetic data, but only to magnetic indices. However geomagnetic activity, as measured by indices, misses important fine-scale detail that may be relevant. For example, in terms of the hazard to power systems, the time rate-of-change of the field is the most relevant quantity.
In a recently published paper (Thomson, Reay and Dawson, Space Weather, 2011) we applied EVS to digital one-
Data from 28 European magnetic observatories were used to determine
extreme activity levels for Europe

To contents page
23
minute data from 28 European observatories to assess the range of variations that may be observed in single storms every 100 and 200 years.
The Figures (right) and the Table (below) summarise the range of extremes found in the analysis (based on 95% confidence limits). For example at mid European latitudes (55-60 degrees geomagnetic north), once every 100 (200) years the change in compass variation is estimated to exceed 3-8 (4-11) degrees per minute, and horizontal field changes may exceed 1000-4000 (1000-6000) nT/min.
The predicted magnitudes increase with latitude, as would be expected, but there is also some interesting structure in the data between about 53 and 62 degrees north (geomagnetic), as the auroral electrojet moves south from its more ‘normal’ position between 65 and 75 degrees north.
These numbers can only be considered as guide values, as the ranges observed within the Figures demonstrate. The data for Valentia (Ireland) also seem anomalous, compared with other mid-latitude observatories, for reasons unknown. The Table therefore also includes a statistical summary, where Valentia is excluded (as the results in parentheses).
The results shown in both the Table and Figures apply under the assumption that
the local time or longitude of any enhanced auroral currents driving the extreme conditions is not significant, in comparison with the time scales (100/200 years) between the extreme storms.
The measured maximum for each observatory (top), and estimated 100-year (middle) and 200-year (bottom) return-levels, for dH/dt, in nT/min,
as a function of geomagnetic latitude. 95% confidence limits are shown.
As for Figure above but showing dD/dt, in degrees/min
H (nT)
dH/dt (nT/min)
D (deg)
dD/dt (deg/min)
100 Year
2000-5000
(4000-5000)
1000-4000
(1500-4000)
4-15
(7-15)
3-8
(5-8)
200 Year
3000-6500
(4500-6500)
1000-6000
(2000-6000)
5-20
(10-20)
4-11
(7-11)
To contents page
24
Science
European Risk from Geomagnetically Induced Currents
Solar storms cause large and rapid magnetic variations that can induce potentially damaging electrical currents in power systems across the world. In 1989 the Hydro-Quebec grid blacked out when protective measures were tripped by space weather, and the same storm caused transformer damage in Britain’s grid. Now a consortium of European scientists including researchers from the Geomagnetism team have come together to study this risk, in the EU Framework funded programme ‘European Risk from Geomagnetically Induced Currents’ (EURISGIC).
Geomagnetically induced currents (GIC), occurring during magnetic storms, pose a natural hazard to the reliable operation of electric power transmission grids, a European critical infrastructure as defined by EU Council Directive 2008/114/EC.
The EURISGIC project is a scientific response to the threat to the European high voltage system. EURISGIC will run from 2011 to 2014 and is a consortium of BGS, FMI (Finland), GGRI (Hungary), IRF Lund, Neurospace (both Sweden), PGI (Russia) and NASA/CUA (USA).
The project will produce the first European-wide real-time prototype forecast service of GIC in power systems, based on in-situ solar wind observations and comprehensive simulations of the Earth's magnetosphere. By utilising geomagnetic recordings, the project will also derive the first map of the statistical risk of large GIC throughout Europe.
Because the most intense geomagnetic storms constitute the most remarkable threat, with a risk of power grid blackouts and destruction of transformers, the project team will investigate worst-case GIC scenarios based on historical data. The project will also exploit the knowledge and advanced modelling methods developed in Europe and North America.
Close communication throughout the project with an industry stakeholder advisory group will help to direct the research and outreach appropriately.
The results of the project will be disseminated to stakeholders via the web and through published papers. Project outcomes should therefore help in the future design of more robust and secure protection against GIC in power transmission grids in Europe, which are anticipated to become increasingly interconnected and geographically wider.
The EURISGIC project logo
To contents page
25
BGS will contribute to EURISGIC through:
• An upgraded detailed UK model of the high voltage grid.
• A novel GIS-based model of UK subsurface conductivity.
• A database of GIC related data on behalf of the project team.
• Worst case scenario analysis. • Forecasting model assessment. • Provision of measured GIC data in the
UK grid. • Outreach.
In the first year of EURISGIC BGS has:
• Published a scientific paper on extreme geomagnetic statistics.
• Examined potential worst case scenarios in the UK system.
• Upgraded the UK power grid model with the assistance of National Grid.
• Commenced the revision of the UK conductivity model.
• Prepared GIC and other databases. • Produced BGS reports on upgraded
models.
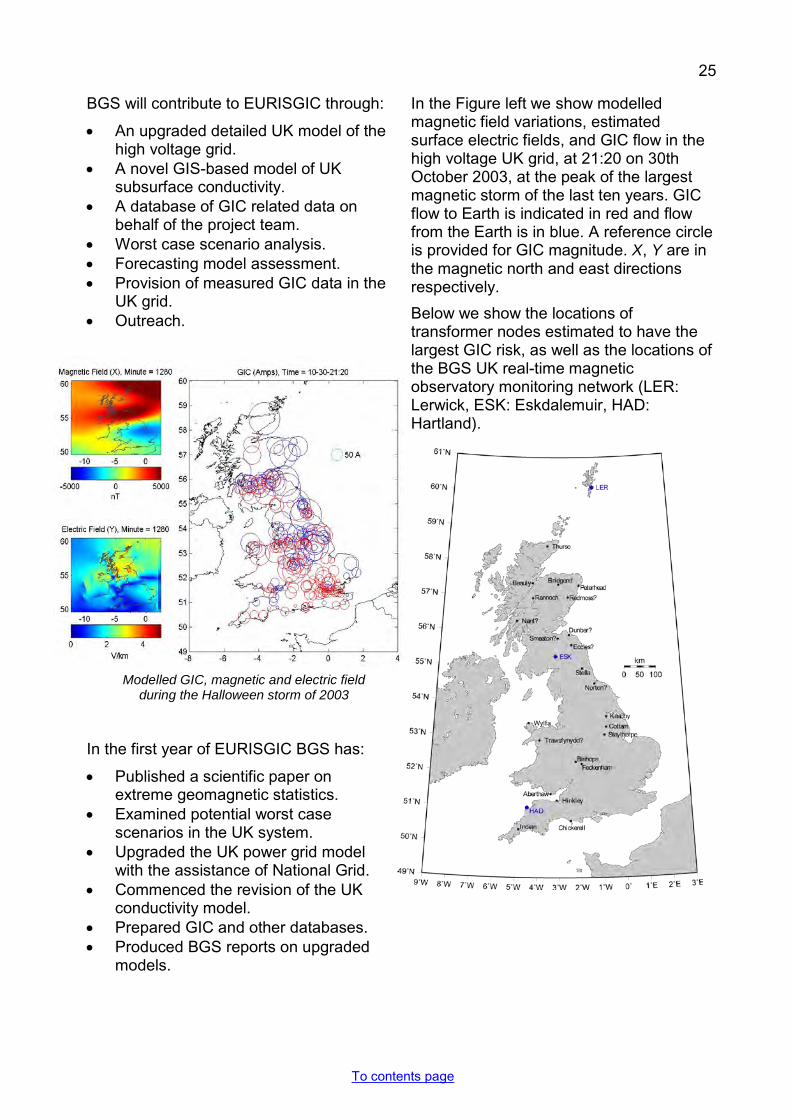
In the Figure left we show modelled magnetic field variations, estimated surface electric fields, and GIC flow in the high voltage UK grid, at 21:20 on 30th October 2003, at the peak of the largest magnetic storm of the last ten years. GIC flow to Earth is indicated in red and flow from the Earth is in blue. A reference circle is provided for GIC magnitude. X, Y are in the magnetic north and east directions respectively.
Below we show the locations of transformer nodes estimated to have the largest GIC risk, as well as the locations of the BGS UK real-time magnetic observatory monitoring network (LER: Lerwick, ESK: Eskdalemuir, HAD: Hartland).
Modelled GIC, magnetic and electric field during the Halloween storm of 2003
To contents page
26
Science
International Science Conferences
During 2011, BGS staff attended a number of UK and international science conferences delivering presentations, poster sessions and contributing to their organisation, administration and promotion of inter-disciplinary collaboration between institutes.
Scientific outputs from the Geomagnetism team at BGS span a large range of subjects and are presented in various forums. Here we note some of the team’s major conference and meeting activities in 2011.
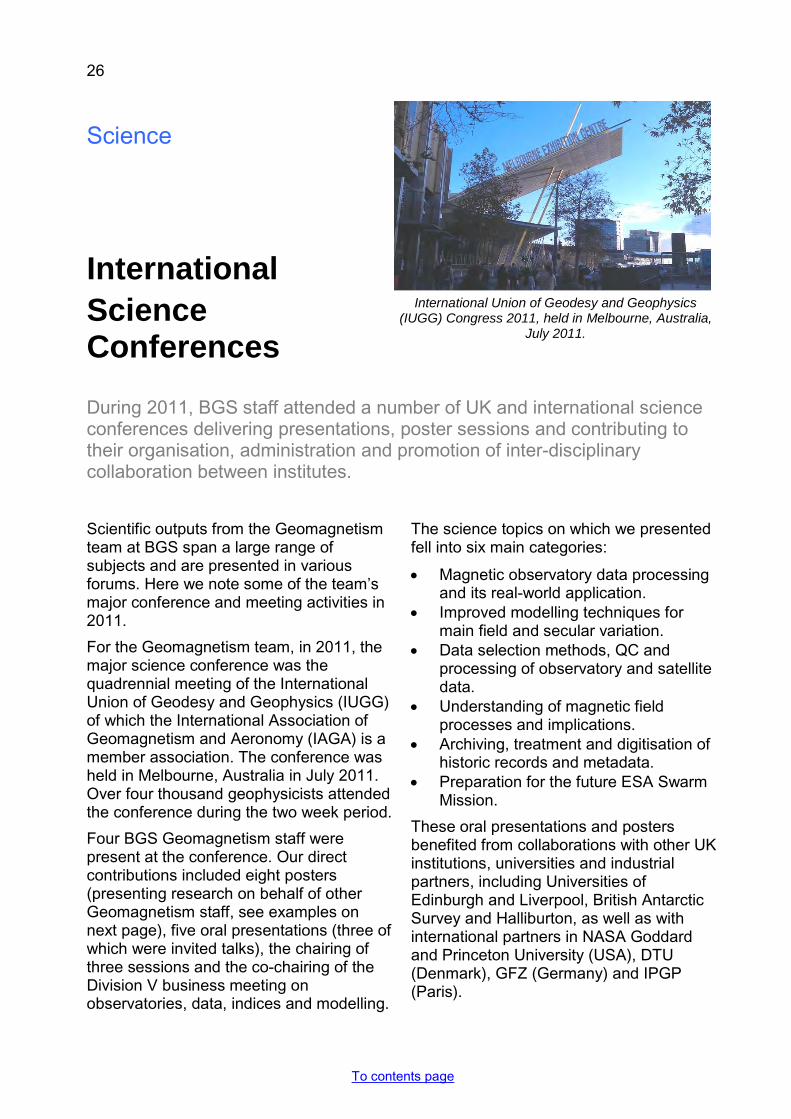
For the Geomagnetism team, in 2011, the major science conference was the quadrennial meeting of the International Union of Geodesy and Geophysics (IUGG) of which the International Association of Geomagnetism and Aeronomy (IAGA) is a member association. The conference was held in Melbourne, Australia in July 2011. Over four thousand geophysicists attended the conference during the two week period.
Four BGS Geomagnetism staff were present at the conference. Our direct contributions included eight posters (presenting research on behalf of other Geomagnetism staff, see examples on next page), five oral presentations (three of which were invited talks), the chairing of three sessions and the co-chairing of the Division V business meeting on observatories, data, indices and modelling.
The science topics on which we presented fell into six main categories:
• Magnetic observatory data processing and its real-world application.
• Improved modelling techniques for main field and secular variation.
• Data selection methods, QC and processing of observatory and satellite data.
• Understanding of magnetic field processes and implications.
• Archiving, treatment and digitisation of historic records and metadata.
• Preparation for the future ESA Swarm Mission.
These oral presentations and posters benefited from collaborations with other UK institutions, universities and industrial partners, including Universities of Edinburgh and Liverpool, British Antarctic Survey and Halliburton, as well as with international partners in NASA Goddard and Princeton University (USA), DTU (Denmark), GFZ (Germany) and IPGP (Paris).
International Union of Geodesy and Geophysics (IUGG) Congress 2011, held in Melbourne, Australia,
July 2011.

To contents page
27
BGS staff were also been involved in presenting research at Royal Astronomical Society (RAS) Specialist Meetings on Deep Earth Processes in London during October 2011.
We have been active in presenting our work at tri-monthly meetings of the ESA Swarm Consortium which have been held in Copenhagen, Potsdam (Berlin), Paris, Delft and Frascati (Rome).
Other meetings attended included the UK National Astronomy Meeting, the US Space Weather Workshop (Colorado),
the European Space Weather Week (Belgium), 1st ICSU World Data System Conference (Kyoto) and various space weather networking meetings in the UK and the USA, the latter sponsored by the Foreign and Commonwealth Office.
Research to which the BGS Geomagnetism team contributed to was presented at the Fall Meeting of the American Geophysical Union in San Francisco.
Examples of posters presented at IUGG 2011 based on research by
BGS Geomagnetism staff

To contents page
28
Science
Student and Research Associate Activities
Gemma Kelly, Rob Shore, Chandika Rijal-Lamichhane and Virginie Penquerc’h made significant contributions to the scientific and IT developments of the Geomagnetism Team in 2011. Here we summarise what they studied and produced in the past year.
Gemma Kelly is in the final year of her PhD studentship. She is based at the University of Liverpool and is part funded by BUFI and by NERC.
Gemma is studying the characteristics of polar and auroral external magnetic fields, with the intention to improve our models of the internal field of the Earth in these regions.
Gemma has devised a set of data selection criteria that minimise external field signals but allow more vector measurements of the field by satellites to be used in global field modelling. She has also applied these techniques to global data sets and is investigating the impact on the quality of internal field models. Full vector data at high latitudes should give better models of the core field at high latitudes.
Satellite data (three vector components) selected using a filter based on the standard deviation of residuals. ‘Traditional’ selection methods would only select data from lower latitudes. Here most latitudes are represented – better for field models.
Gemma Kelly demonstrates the improvements to a core field model when
using new selection criteria.

To contents page
29
Rob Shore is based at the University of Edinburgh. Rob is in the third year of his PhD research into global magnetic modelling with Swarm satellite data. Rob is part funded by BUFI and NERC.
This project focuses on improving our capabilities in quantifying the sources of the Earth’s magnetic field from mini-constellations of satellites, in particular the F-region ionospheric field at low and mid latitudes. This region is at 140 -1000 km altitude and Rob has been inferring zonal current density by applying Ampère’s integral law to magnetic data from near-simultaneous overflights of the Ørsted and CHAMP satellites.
Six years of vector magnetic data from both satellites provides two sets of overflights spanning all local times. Current density in the range ±0.3 µA/m2 is resolved. The distribution of current shows reasonable agreement with current density predictions made by the Coupled Thermosphere-Ionosphere-Plasmasphere (CTIP) model.
Chandika Rijal-Lamichhane is an MSc student at Robert Gordon University in Aberdeen, studying Computing & Information Engineering. She is undertaking her nine-month industrial placement at BGS.
Chandika is building web service software which will enable our database of observatory annual mean (OAM) records to be more easily managed, and will allow users greater ease and flexibility in how they access this dataset.
Our database of OAM records is an extremely valuable resource for the study of the long-term secular variation of the core field, the data span more than 500 observatories and 200 years.
The web service software allows the annual mean and observatory information in the database to be accessed in a variety of formats, such as HTML and XML, allowing for easier integration of the data with other software systems. The software also provides an intuitive web-based interface
for BGS staff to add and update records in the database.
Virginie Penquerc’h is a Post Doctorate Research Associate at the University of Liverpool, shared with BGS and funded through a NERC National Centre for Earth Observation grant (2010-2012).
Virginie is developing and applying new methodologies for the modelling of the internal geomagnetic field, particularly to account for errors arising from external (magnetospheric and ionospheric) field contributions.
Values of current density from application of Ampère’s integral to Ørsted and CHAMP
magnetic data (“constellation”) and from the CTIP model. Local time is ~10 am.
Chandika Rijal-Lamichhane and Ewan Dawson discuss web services software development.

To contents page
30
Applications
Oil Industry
Navigating underground when drilling for oil and gas is now more challenging as companies try to hit smaller targets in reservoirs already congested with existing wells. One widely applied method involves using magnetic survey tools to direct the drill head. At the BGS an innovative approach has been taken to provide accurate values of the Earth’s magnetic field at the drilling site, with verifiable estimates of uncertainty. This work helps survey management companies mitigate the risk of collision or missed targets. Deriving the values requires a subtle combination of local and global observations of the Earth’s magnetic field, and modelling work. Underground navigation relies on either gyroscopic tools or magnetic survey tools. Gyro surveys are generally considered to be more accurate than surveys using magnetic tools but they are expensive as the gyro tools are delicate and can require a pause in the drilling to make a measurement. Less expensive magnetic surveys can be done while drilling but rely on precise estimates of the direction and strength of the Earth’s magnetic field at points of measurement.
Techniques have been developed to accurately estimate the Earth’s magnetic field so that the accuracy from magnetic surveys can be improved to match that of gyro surveys. The testing ground for these techniques was the North Sea in the mid-1990s, with much of the groundwork done by the British Geological Survey and Sperry Sun (now Halliburton Sperry Drilling).
These techniques aim to make estimates of the local magnetic field direction and strength to within 0.1° and 50 nT of the true values and are now applied by many companies throughout the world.
The magnetic field is made up of three main sources. The most important of these is the dynamo process in the liquid outer core of the Earth. The BGS Global Geomagnetic Model (BGGM) provides estimates of this source, along with the quiet night-time large-scale magnetospheric field. This model is updated annually.
The second source is the Earth’s crust. The crustal magnetic field arises mostly from ferrous minerals in the underlying rocks. It can be considered as a static offset to values derived from the BGGM and is significant for directional drilling.
Airborne and ship-borne magnetic surveys are used to assess the local crustal field
Directional drilling (image courtesy of Baker Hughes INTEQ)

To contents page
31
but observations generally comprise only measurements of the strength of the field. However, because of the predictable pattern of magnetic fields outside their sources, these scalar data can be used to obtain directional information at depth.
Superimposed on the core and crustal fields are daily and more rapid variations in time. Their source region is in the ionosphere and magnetosphere and they are driven by the Sun. For drilling locations in the North Sea the variations are interpolated using data from several
observatories and magnetic stations in the surrounding countries, and they are combined with estimates of the core field and crustal field to provide a real-time web-based data service.
In 2011 BGS completed 38 reports describing the work to set up geomagnetic referencing services incorporating the crustal field for drilling locations all round the world. We supplied crustal magnetic data for over 600 wells, around two thirds of which also used real time services.
Offshore drilling operations

To contents page
32
Applications
Space Weather Applications and Services
Research into space weather and the geomagnetic hazard finds application in a number of data products and services to academic and commercial users. Developments in 2011 have included a new geomagnetic monitoring and analysis service for National Grid and geomagnetic activity data and forecasts for the UK Met Office and the US Space Weather Prediction Centre.
In 2011, BGS together with National Grid investigated worst case scenarios for the UK high voltage power network, at the request of the government’s Cabinet Office and Department of Environment and Climate Change.
Following on from this, in October, National Grid employed BGS to provide a geomagnetic monitoring and analysis service. By developing a web based tool called MAGIC (‘Monitoring and Analysis of GIC’), BGS now provides National Grid
with a near real time data supply of UK magnetic data, automatic detection of shock arrivals in the solar wind, a daily activity forecast and a model of GIC flow in the grid, based on recent magnetic
activity. A number of improvements to MAGIC are planned to be phased in as 2012 progresses.
Through the development of the Natural Hazards Partnership – a grouping of UK
BGS provides geomagnetic data for monitoring the geomagnetic hazard to
technology
The ‘MAGIC’ website front page Near real time geomagnetic monitoring data available through MAGIC

To contents page
33
research institutes and centres, together with Met Office – BGS provide daily three-day geomagnetic activity forecasts, for inclusion in the daily hazard report to government and other stakeholders. Met Office and BGS are also developing research of common interest and BGS provides monitoring data and products to Met Office via a secure website.
BGS and the US National Oceanographic and Atmospheric Administration’s Space Weather Prediction Centre (SWPC), in Colorado, agreed a memorandum of understanding in 2011, to develop data exchange in support of space weather services. BGS provides Hartland observatory geomagnetic data and near real time estimates of planetary magnetic activity indices, such as Kp, to SWPC.
NERC established a series of ‘Pathfinder’ projects to encourage closer collaboration amongst the research centres it funds to carry out research on the natural environment. BGS and the British Antarctic Survey (BAS) now collaborate through Pathfinder on space weather issues.
Currently BGS supply BAS with a near real time estimate of the Kp magnetic index. BAS use this as an input parameter in their SPACECAST radiation belt code (http://www.fp7-spacecast.eu/). SPACECAST is a three year project which runs until 28 Feb 2014 and provides a forecast of high energy electron fluxes and an associated risk index, primarily for
satellite operators, designers and insurers. In future SPACECAST will also provide a forecast of low energy electrons, modelling of Solar Energetic Particles and an alert service.
The impact of BGS space weather research was particularly strong in 2011. Some of the related activities we became involved in include:
• Invitations to present on the space weather hazard to power systems at US Annual Space Weather Week (April) and at European Space Weather Week (November).
• Information on space weather activities supplied to DECC/GO-Science to update government Chief Scientist on UK space weather developments (July).
• Evidence given to House of Commons Defence Select Committee inquiry into ‘Developing Threats to Electronic Infrastructure’ (October).
• Participation in the Foreign Office sponsored US-UK space weather workshop in Colorado (October).
• Installation of a British Antarctic Survey VLF monitor at Eskdalemuir Observatory (October).
• Member of a 33-institute proposal submitted under FP7-INFRASTRUCTURES-2012-1, titled “Space weather: research infrastructure for Europe's ground-based assets”, to better coordinate ground based geophysics and space physics facilities in Europe for space weather research.
• Membership of the Royal Academy of Engineering commission on ‘Space Weather: Impacts on UK Systems, Infrastructure and Society’.
• Discussions with NERC Natural Hazard Theme Leader, to include space weather in future Theme Action Plans.
Figure illustrating purpose of SPACECAST. © British Antarctic Survey (NERC)
To contents page
34
Outreach and Knowledge Exchange
Publications, Presentations, Posters and Other Outputs
Geomagnetism is a very active research area in Earth and space science. The Geomagnetism team has been active in both research and in communicating exciting new developments and why they matter.
Our outreach and IKE activities take the form of talks, presentations, demonstrations, observatory ‘tours’, university teaching, web-articles and, of course, paper and poster publications at national and international scientific meetings.
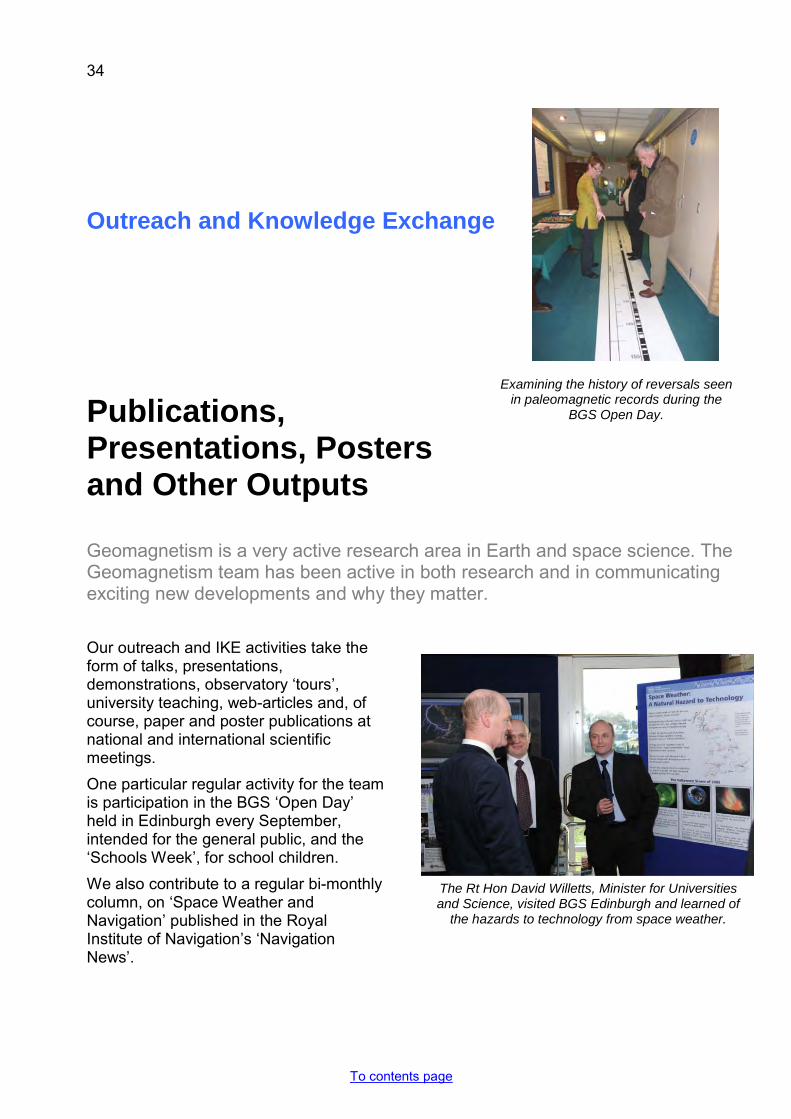
One particular regular activity for the team is participation in the BGS ‘Open Day’ held in Edinburgh every September, intended for the general public, and the ‘Schools Week’, for school children.
We also contribute to a regular bi-monthly column, on ‘Space Weather and Navigation’ published in the Royal Institute of Navigation’s ‘Navigation News’.
Examining the history of reversals seen in paleomagnetic records during the
BGS Open Day.
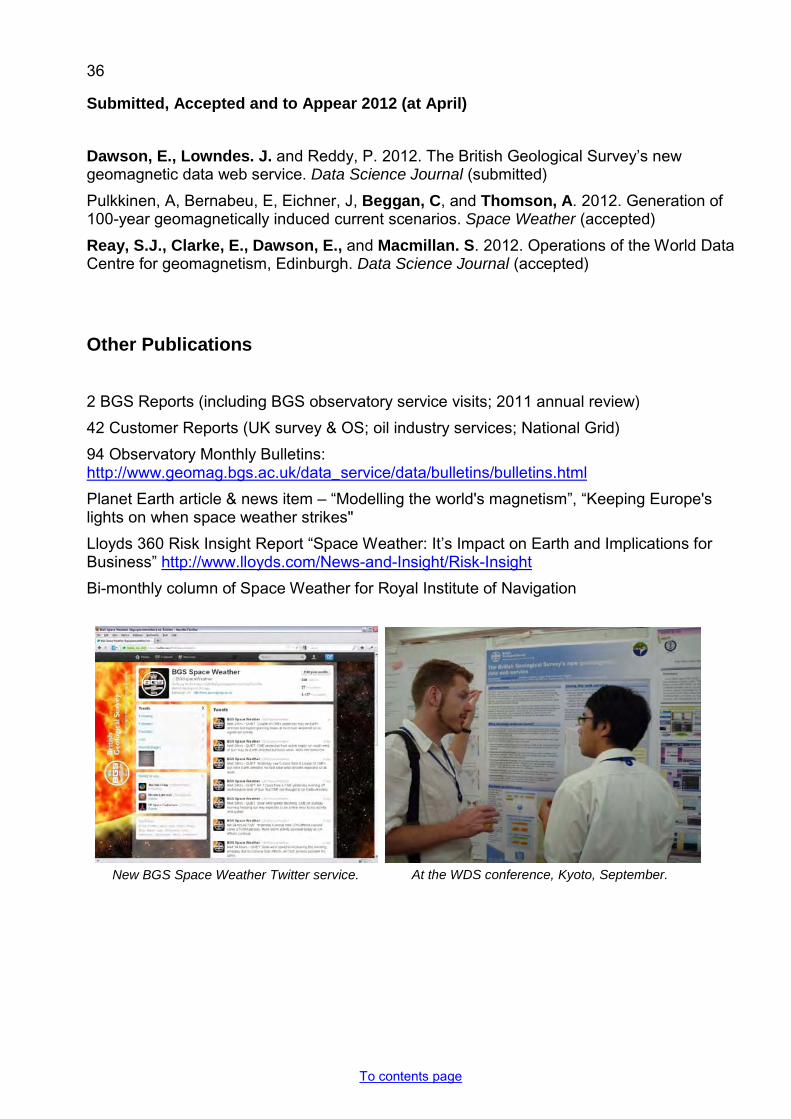
The Rt Hon David Willetts, Minister for Universities and Science, visited BGS Edinburgh and learned of
the hazards to technology from space weather.

To contents page
35
Scientific Journal Publications
Published 2011
Borodin, P., Brenes, J., Daudi, E., Efendi, N., Flower, S., Hidayat, M., Husni, M., Kampine, M., Kusonski, O., Lang, A., Monge, I., Mucussete, A., Nhatsave, A., Santika, I., Rasson, J., Riddick, J., Suharyadi, D., Turbitt, C., Yusuf, M., 2011 INDIGO: better geomagnetic observatories where we need them. Data Science Journal, 10. IAGA91-IAGA94.
Lesur, V. B. F., Olsen, N. and Thomson, A.W.P., 2011. Geomagnetic core field models in the satellite era, In: Mandea M, Korte M (eds) Geomagnetic Observations and Models, IAGA Special Sopron Book Series 5, DOI 10.1007/978-90-481-9858-0_11
Macmillan, S. 2011 Geomagnetic field, global pattern. In: Gupta, Harsh K., (ed.) Encyclopedia of solid earth geophysics. Springer, 7pp.
Macmillan, S. and Clarke E., 2011. Resolving issues concerning Eskdalemuir geomagnetic hourly values, Ann. Geophys., 29, 283–288, 10.5194/angeo-29-283-2011
Macmillan, S., and Finlay, C., 2011. The International Geomagnetic Reference Field, In: Mandea M, Korte M (eds) Geomagnetic Observations and Models, IAGA Special Sopron Book Series 5, DOI 10.1007/978-90-481-9858-0_10
Reay, S.J., Clarke, E., and Hamilton, B. 2011. First Steps towards K Indices from South Atlantic Observatories: Port Stanley Observatory, Data Science Journal 10. IAGA117-IAGA129
Reay S.J., Herzog D.C., Alex S., Kharin E., McLean S., Nosé M. and Sergeyeva N., 2011. Magnetic Observatory Data and Metadata: Types and Availability. In: Mandea M, Korte M (eds) Geomagnetic Observations and Models, IAGA Special Sopron Book Series 5, DOI 10.1007/978-90-481-9858-0_7 pp149-181
Reda, J., Fouassier, D., Isac, A., Linthe, H-J., Matzka, J., and Turbitt C.W., 2011. Improvements in Geomagnetic Observatory Data Quality, In: Mandea M, Korte M (eds) Geomagnetic Observations and Models, IAGA Special Sopron Book Series 5, DOI 10.1007/978-90-481-9858-0_6
Thomson, A.W.P., Dawson E.B., and Reay, S.J., 2011. Quantifying extreme behaviour in geomagnetic activity. Space Weather, 9, S10001. 10.1029/2011SW000696
Turbitt, C., Baillie, O., Kerridge, D. and Clarke, E., 2011. An investigation Into techniques for Isolating noise in observatory data . Data Science Journal, 10. IAGA174-IAGA182.
Whitley, T., Füllekrug, M., Rycroft, M., Bennett, A., Wyatt, F., Elliott, D., Heinson, G., Hitchman, A., Lewis, A., Sefako, R., Fourie, P., Dyers, J., Thomson, A., and Flower. S., 2011. Worldwide extremely low frequency magnetic field sensor network for sprite studies. Radio Sci., 46, RS4007, doi:10.1029/2010RS004523
To contents page
36
Submitted, Accepted and to Appear 2012 (at April)
Dawson, E., Lowndes. J. and Reddy, P. 2012. The British Geological Survey’s new geomagnetic data web service. Data Science Journal (submitted)
Pulkkinen, A, Bernabeu, E, Eichner, J, Beggan, C, and Thomson, A. 2012. Generation of 100-year geomagnetically induced current scenarios. Space Weather (accepted)
Reay, S.J., Clarke, E., Dawson, E., and Macmillan. S. 2012. Operations of the World Data Centre for geomagnetism, Edinburgh. Data Science Journal (accepted)
Other Publications
2 BGS Reports (including BGS observatory service visits; 2011 annual review)
42 Customer Reports (UK survey & OS; oil industry services; National Grid)
94 Observatory Monthly Bulletins: http://www.geomag.bgs.ac.uk/data_service/data/bulletins/bulletins.html
Planet Earth article & news item – “Modelling the world's magnetism”, “Keeping Europe's lights on when space weather strikes"
Lloyds 360 Risk Insight Report “Space Weather: It’s Impact on Earth and Implications for Business” http://www.lloyds.com/News-and-Insight/Risk-Insight
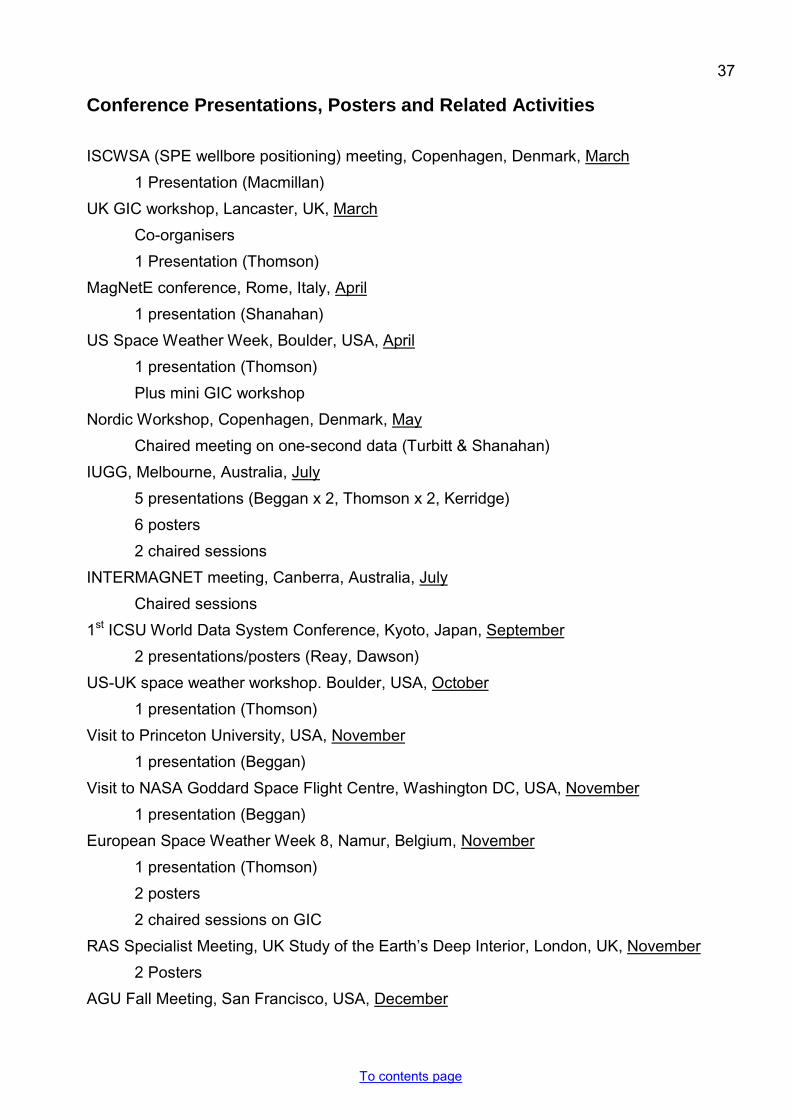
Bi-monthly column of Space Weather for Royal Institute of Navigation
New BGS Space Weather Twitter service. At the WDS conference, Kyoto, September.
To contents page
37
Conference Presentations, Posters and Related Activities
ISCWSA (SPE wellbore positioning) meeting, Copenhagen, Denmark, March
1 Presentation (Macmillan)
UK GIC workshop, Lancaster, UK, March
Co-organisers
1 Presentation (Thomson)
MagNetE conference, Rome, Italy, April
1 presentation (Shanahan)
US Space Weather Week, Boulder, USA, April
1 presentation (Thomson)
Plus mini GIC workshop
Nordic Workshop, Copenhagen, Denmark, May
Chaired meeting on one-second data (Turbitt & Shanahan)
IUGG, Melbourne, Australia, July
5 presentations (Beggan x 2, Thomson x 2, Kerridge)
6 posters
2 chaired sessions
INTERMAGNET meeting, Canberra, Australia, July
Chaired sessions
1st ICSU World Data System Conference, Kyoto, Japan, September
2 presentations/posters (Reay, Dawson)
US-UK space weather workshop. Boulder, USA, October
1 presentation (Thomson)
Visit to Princeton University, USA, November
1 presentation (Beggan)
Visit to NASA Goddard Space Flight Centre, Washington DC, USA, November
1 presentation (Beggan)
European Space Weather Week 8, Namur, Belgium, November
1 presentation (Thomson)
2 posters
2 chaired sessions on GIC
RAS Specialist Meeting, UK Study of the Earth’s Deep Interior, London, UK, November
2 Posters
AGU Fall Meeting, San Francisco, USA, December

To contents page
38
1 Poster
Geomagnetism Team seminars, Edinburgh
18 Presentations throughout the year
Some Other Notable Outputs
IAGA Division 5 chair is now Alan Thomson and the IAGA division 5 website is now hosted by BGS
The Rt Hon David Willetts, Minister for Universities and Science, visited BGS Edinburgh on 10th February
Edinburgh University Undergraduate Lecture Series (September-December)
4th Year Honours Course on ‘Geomagnetism’, by Ciaran Beggan
Public Lectures, Presentations and Demonstrations
Educational and training activities. including presentations given at BGS Open Day, Institute of Engineering and Technology (IET), seminar to Glasgow University
On-line archive of digitised historical UK & British colonial observatory yearbooks
http://www.geomag.bgs.ac.uk/data_service/data/yearbooks/yearbooks.html
Two twitter services launched
@BGSspaceWeather – daily space weather forecasts
@BGSauroraAlert – occasional aurora alerts
Media interest during space weather events
15th -18th February, 9th June and 4th August
Interviews on BBC TV World Service, BBC Radio 4 “Material World”, BBC Radio 5 Live, BBC Radio Scotland. Press mentions in BBC News online, Guardian, Telegraph, Channel 4 news, Metro etc.
New World Magnetic Model web service
http://www.geomag.bgs.ac.uk/data_service/models_compass/wmm_calc.html
South Atlantic blog
Tony Swan blogged on Facebook their 4-week journey to and from King Edward Point to install a new magnetic observatory
YouTube video on BGS Geomagnetism; NERC ‘Planet Earth’ podcast

To contents page
39
Outreach and Knowledge Exchange
Unusual Enquiries
Many enquiries concerning magnetic fields are received and dealt with promptly by BGS geomagnetism staff through each year.
In 2011 a couple of unusual ones were received. One concerned a legal boundary dispute, where the boundary was considered to be defined by a magnetic bearing at a particular point of time in the past. BGS computed the difference between magnetic north and map north using a model and provided advice to the enquirer.
The other enquiry concerned a tsunami-like event in the South West of England during which people’s hair was reported to be standing on end. See
http://www.bgs.ac.uk/research/highlights/2011/tsunamiSWEngland2011.html
for more details.
No seismic activity was recorded at the time so the event has been termed a meteo-tsunami. Curiously, short period oscillations in the magnetic field were observed at all the BGS observatories at the same time as the meteo-tsunami. On looking at equivalent 1-second magnetic data from an observatory in South Africa close to the conjugate point for Hartland observatory (i.e. colloquially-speaking at the other end of the same magnetic field line) the same oscillations were observed. This confirmed classical micropulsation activity and suggests an accidental coincidence of events rather than any cause and effect.
To contents page
40
Acknowledgements
The Geomagnetism team would like to acknowledge the support of team stakeholders, such as the Geomagnetism Advisory Group, BGS management and the Natural Environment Research Council.
Alan Thomson would like to thank Gemma Kelly and Ellen Clarke for their comments on this review. He also thanks the Geomagnetism team as a whole for their enthusiasm, dedication and hard work in 2011.
Geomagnetic and other data provided by scientific institutes and scientific bodies around the world are gratefully acknowledged.
This report is published with the approval of the Executive Director of the British Geological Survey (NERC).

To contents page
41
Selected Glossary, Acronyms and Links AGU American Geophysical Union (http://www.agu.org/)
BAS British Antarctic Survey. (http://www.antarctica.ac.uk/)
BBC British Broadcasting Corporation (http://www.bbc.co.uk/)
BGGM BGS Global Geomagnetic Model (http://www.geomag.bgs.ac.uk/bggm.html)
BGS British Geological Survey (http://www.bgs.ac.uk/)
BUFI BGS-Universities Funding Initiative. (http://www.bgs.ac.uk/research/who.html)
Cabinet Office (http://www.cabinetoffice.gov.uk/)
CHAMP German magnetic survey satellite. (http://www-app2.gfz-potsdam.de/pb1/op/champ/)
CUA Catholic University of America (http://www.cua.edu/)
DECC Department of Energy and Climate Change (http://www.decc.gov.uk/)
DST Disturbance Storm Time index used to assess the severity of magnetic storms.
DTU Danish Technical University. (http://www.space.dtu.dk/English.aspx)
EHS Earth Hazards and Systems, a science area within BGS
ESA European Space Agency (http://www.esa.int/esaCP/index.html)
ESWW European Space Weather Week. (http://sidc.oma.be/esww8/)
EU European Union (http://europa.eu/)
EURISGIC European Risk from Geomagnetically Induced Currents (http://www.eurisgic.eu/)
EVS Extreme value statistics
FMI Finnish Meteorological Institute (http://en.ilmatieteenlaitos.fi/)
GDAS Geomagnetic Data Acquisition System (http://www.geomag.bgs.ac.uk/documents/gdas2002complete.pdf)
GFZ Helmholtz centre, Potsdam, Germany, (http://www.gfz-potsdam.de)
GGRI Geodetic and Geophysics Institute, Hungary (http://www.ggki.hu/en/)
GIC Geomagnetically induced currents (a natural hazard to power systems and pipeline networks).
GIS Geographic information system
GO-SCIENCE - UK government office for science (http://www.bis.gov.uk/go-science)
GPS Global Positioning System. (http://www.gps.gov/)
HTML HyperText Markup Language
IAGA International Association of Geomagnetism and Aeronomy (http://www.iugg.org/IAGA/iaga_pages/index.html)
ICSU International Council for Science (http://www.icsu.org/)
IIFR/IFR Interpolated In-Field Referencing/In-Field Referencing. (http://www.geomag.bgs.ac.uk/documents/estec_iifr.pdf)
IKE Information and Knowledge Exchange
INTERMAGNET - International magnetometer network: a global network of magnetic observatories operating to common standards. (http://www.intermagnet.org/)

To contents page
42
INDIGO (http://pubs.usgs.gov/of/2009/1226/)
IPGP Institut de Physique du Globe de Paris (http://www.ipgp.fr/index2.php?langue=1)
IRF Swedish Space Science Institute (http://www.irf.se/)
ISCWSA The Industry Steering Committee on Wellbore Survey Accuracy. (http://iscwsa.org/)
ISGI International Service for Geomagnetic Indices (http://www.icsu-fags.org/ps06isgi.htm)
IUGG International Union of Geodesy and Geophysics. (http://www.iugg.org/)
MAGIC “Monitoring and Analysis of GIC”. A service for National Grid.
MagNetE European magnetic repeat station network (http://space.fmi.fi/MagNetE2009/).
Met Office UK meteorological office. (http://www.metoffice.gov.uk/)
Micropulsation - Narrow frequency band oscillations in the magnetic field due to magnetospheric sources (also called ‘pulsations’)
MOD Ministry of Defence (http://www.mod.uk/)
NASA National Aeronautic and Space Administration (http://www.nasa.gov/)
NATO North Atlantic Treaty Organization (http://www.nato.int/)
NERC Natural Environment Research Council (http://www.nerc.ac.uk/)
Neurospace Space weather consultants (http://www.neurospace.se/)
NG National Grid plc (http://www.nationalgrid.com/)
NOAA/NGDC National Oceanic and Atmospheric Administration/National Geophysical Data Center (http://www.ngdc.noaa.gov/).
OAM Observatory annual means
Ørsted/Oersted - Danish magnetic survey satellite. (http://web.dmi.dk/projects/oersted/)
OS Ordnance Survey. (http://www.ordnancesurvey.co.uk/oswebsite/)
PGI Polar Geophysics Institute, Russia (http://pgia.ru/)
QC Quality Control
RIN Royal Institute of Navigation. (http://www.rin.org.uk/)
RAS Royal Astronomical Society. (http://www.ras.org.uk/)
SCARF Satellite Constellation Application and Research Facility
SPACECAST (http://www.fp7-spacecast.eu/)
SPE Society of Petroleum Engineers (http://www.spe.org/spe-app/spe/index.jsp)
Swarm Three-satellite ‘mini-constellation’ for magnetic field surveying. (http://www.esa.int/esaLP/LPswarm.html)
SWENET Space weather network (ESA) (http://www.esa-spaceweather.net/swenet/index.html)
SWPC Space Weather Prediction Centre (http://www.swpc.noaa.gov/)
USGS United States Geological Survey (http://www.usgs.gov/)
VLF Very low frequency
WDC World Data Centre http://www.wdc.rl.ac.uk/wdcmain/europe/edinburgh.html)
WDS. World Data System (http://www.icsu-wds.org/)
XML Extensible Markup Language

To contents page
43
The Geomagnetism Team in 2011
Orsi Baillie Geomagnetic Research and Data Processing
Dr Ciaràn Beggan Geomagnetic Research
Brian Bainbridge IT and Software Support
Ellen Clarke Geomagnetic Research and Data Processing
Ewan Dawson Geomagnetic Research and Data Processing
Paul Dickson Geomagnetism Business Account Support
Jane Exton IT and Software Support
Simon Flower Technical, Observatory Operations and IKE
Dr Brian Hamilton Geomagnetic Research
Thomas Humphries Geomagnetic Data Processing
Ted Harris Geomagnetic Data Processing and IKE
Sandy Henderson Geomagnetic Data Processing
Gemma Kelly 3rd Year Student (PhD - Liverpool)
Dr David Kerridge Geomagnetic Research and
Head of Science, Earth Hazards & Systems
Dr Susan Macmillan Geomagnetic Research
Colin Pringle Manager, Eskdalemuir Observatory
Virginie Penquerc’h Post Doctorate Research Associate (Liverpool)
Sarah Reay Geomagnetic Research and Data Processing
Chandika Rijal-Lamichhane Student (MSc – Robert-Gordon University, Aberdeen)
David Scott IT and Software Support
Tom Shanahan Technical, Observatory Operations & Field Survey
Rob Shore 2nd Year Student (PhD - Edinburgh)
Tony Swan Technical, Observatory Operations & Field Survey
Dr Alan Thomson Geomagnetic Research and
Geomagnetism Team Leader
Stephen Tredwin Manager, Hartland Observatory
Chris Turbitt Technical, Observatory Operations & Field Surve

To contents page
This page intentionally blank
44

To contents page
This page intentionally blank
45

To contents page
This page intentionally blank
46

Contact Details
Dr Alan ThomsonTel: +44 (0)131 667 1000Direct dial: +44 (0)131 650 0257Email: [email protected]
GeomagnetismEarth Hazards and SystemsBritish Geological SurveyMurchison HouseWest Mains RoadEdinburgh EH9 3LAUK
www.geomag.bgs.ac.uk
Magnetic Observations being made at Cumberland Bay, South Georgia with the BAS King Edward Point research station in the background