Retail banking PFs: Appendix 2 - GOV.UK
49
Retail banking market investigation: provisional findings report Appendix 2 Appendix 2.1: Market participants Appendix 2.2: Financial performance
-
Upload
khangminh22 -
Category
Documents
-
view
1 -
download
0
Transcript of Retail banking PFs: Appendix 2 - GOV.UK

Retail banking market investigation: provisional findings report
Appendix 2
Appendix 2.1: Market participants
Appendix 2.2: Financial performance
A2.1-1
APPENDIX 2.1
Market participants
Contents Page
Introduction ................................................................................................................ 1
Overview of retail banking .......................................................................................... 2
Larger UK banks with a national presence ................................................................. 2
Northern Ireland-focused banks (AIB, BoI and Danske)........................................... 21
Other banks .............................................................................................................. 22
Building societies (Coventry, Nationwide, Skipton, Leeds and Yorkshire)................ 25
Other alternative finance providers .......................................................................... 26
Introduction
This appendix provides an overview of the main market participants in the UK
retail banking sector.1 The appendix is structured as follows:
(a) Overview of retail banking.
(b) Larger established banks with national presence: Barclays, HSBCG, LBG,
RBSG and Santander.
(c) Northern Ireland-focused banks: AIB, BoI and Danske2.
(d) Other banks, including new entrants and banks with more limited
geographical coverage or which focus on particular product, customer
segment and/or distribution channels. These include: Co-op, Clydesdale,
TSB, Handelsbanken, Metro Bank, Post Office Money, Tesco Bank, Virgin
Money, Aldermore and other small banks.
(e) Building Societies including Nationwide, Yorkshire, Coventry, Skipton and
Leeds.
(f) Other alternative finance providers.
1 Where branch numbers are quoted in this appendix they exclude Isle of Man and Channel Islands. Further details of branch numbers are in Appendix 10.2. 2 Ulster Bank also operates in Northern Ireland and is wholly owned by RBSG.
A2.1-2
Overview of retail banking
Retail banking generally refers to the provision of products and services that
banks provide to personal customers and businesses, including SMEs,
through a variety of channels including branches, telephony, internet and
mobile technology.
The term ‘retail banking’ is generally used to distinguish these banking
services from investment banking or wholesale banking. Many large UK
banks have separate retail banking divisions or business units, with their own
management and reporting structures, although there are differences in the
way these banks define, organise and describe their retail activities.
Larger UK banks with a national presence
The following includes background information, the recent financial results
and key performance metrics of the five largest UK retail banks during the
period 2012 to 2014.
Barclays plc
Barclays plc is a British multinational banking and financial services company
headquartered in London. It is a full-service bank with operations in retail,
wholesale and investment banking, as well as wealth management, mortgage
lending and credit cards. It has operations in over 50 countries and territories,
and has around 48 million customers worldwide.
Barclays traces its origins in the UK back to1690. Its first major expansion
came in 1896 when a number of UK banks amalgamated under the name of
Barclays and Co. Further major expansion occurred between1905 and 1936
with further acquisitions and mergers of a number of English and overseas
banks. Since the 1930s there have been a number of further acquisitions and
divestments.
Today Barclays operates its UK business as a single market brand, ‘Barclays’.
It had 1,488 branches in the UK at the end of 2014.
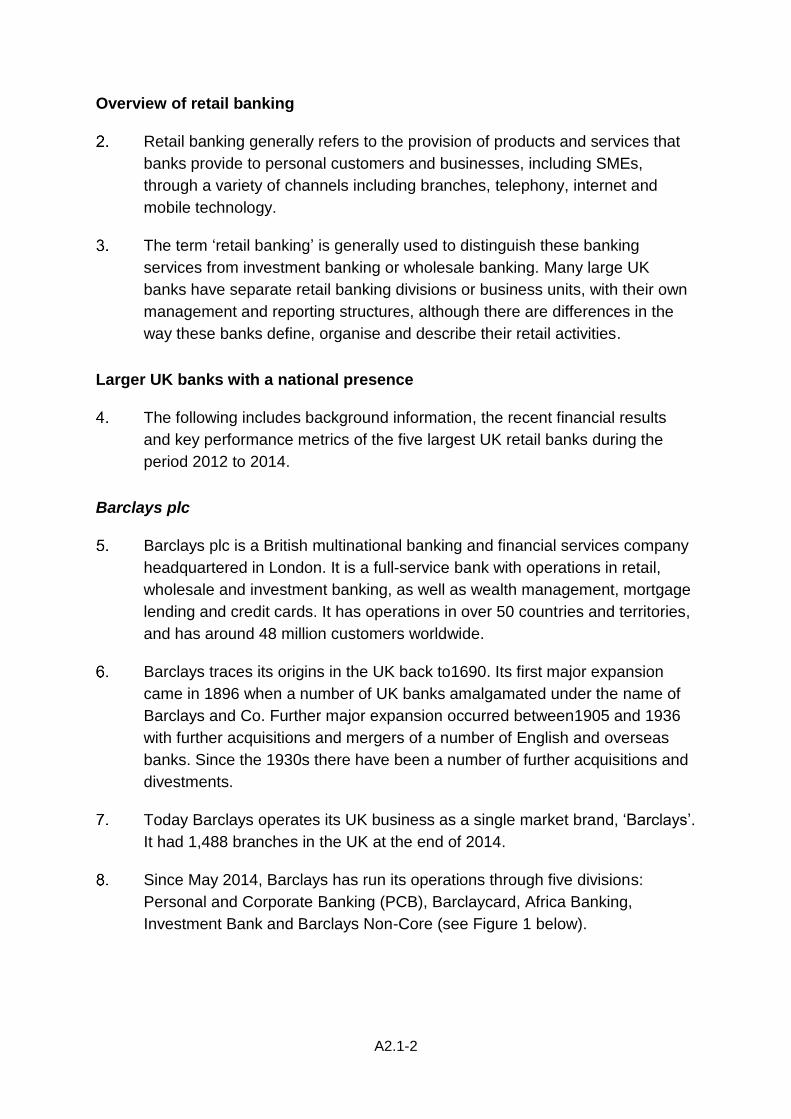
Since May 2014, Barclays has run its operations through five divisions:
Personal and Corporate Banking (PCB), Barclaycard, Africa Banking,
Investment Bank and Barclays Non-Core (see Figure 1 below).
A2.1-3
Figure 1: Barclays divisional structure3
Source: Barclays plc 2014 Annual Report.
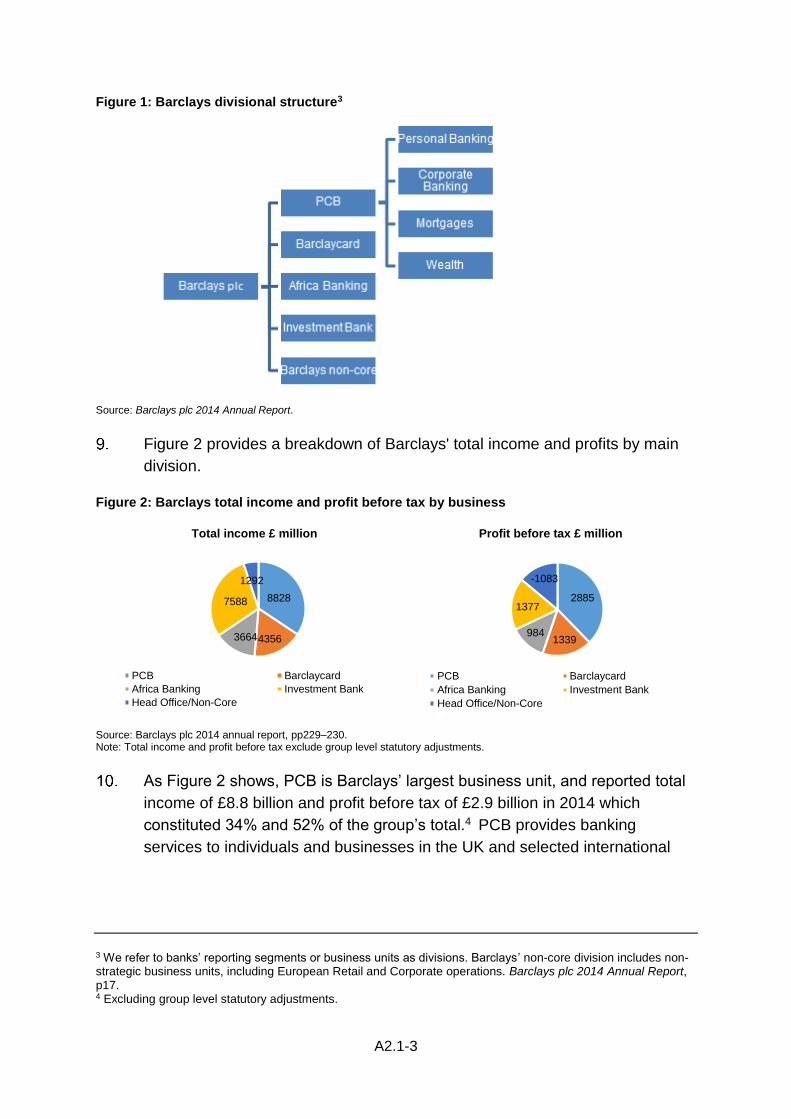
Figure 2 provides a breakdown of Barclays' total income and profits by main
division.
Figure 2: Barclays total income and profit before tax by business
Total income £ million Profit before tax £ million
Source: Barclays plc 2014 annual report, pp229–230. Note: Total income and profit before tax exclude group level statutory adjustments.
As Figure 2 shows, PCB is Barclays’ largest business unit, and reported total
income of £8.8 billion and profit before tax of £2.9 billion in 2014 which
constituted 34% and 52% of the group’s total.4 PCB provides banking
services to individuals and businesses in the UK and selected international
3 We refer to banks’ reporting segments or business units as divisions. Barclays’ non-core division includes non-strategic business units, including European Retail and Corporate operations. Barclays plc 2014 Annual Report, p17. 4 Excluding group level statutory adjustments.
8828
43563664
7588
1292
PCB Barclaycard
Africa Banking Investment Bank
Head Office/Non-Core
2885
1339984
1377
-1083
PCB Barclaycard
Africa Banking Investment Bank
Head Office/Non-Core
A2.1-4
markets, and is subdivided into four main businesses: Personal Banking,
Mortgages, Corporate Banking and Wealth.5
Personal Banking customers, including PCA customers, are served by the
Personal Banking division. Barclays has recently brought together its former
Business Banking and Corporate Banking businesses into one unit, which
now sits within the Corporate Banking division of the PCB. Until recently:
(a) Business Banking dealt with businesses with turnover typically of up to
£5 million (and sat within Barclays Retail and Business Banking); and
(b) Corporate Banking dealt with businesses with turnover typically exceeding
£5 million.
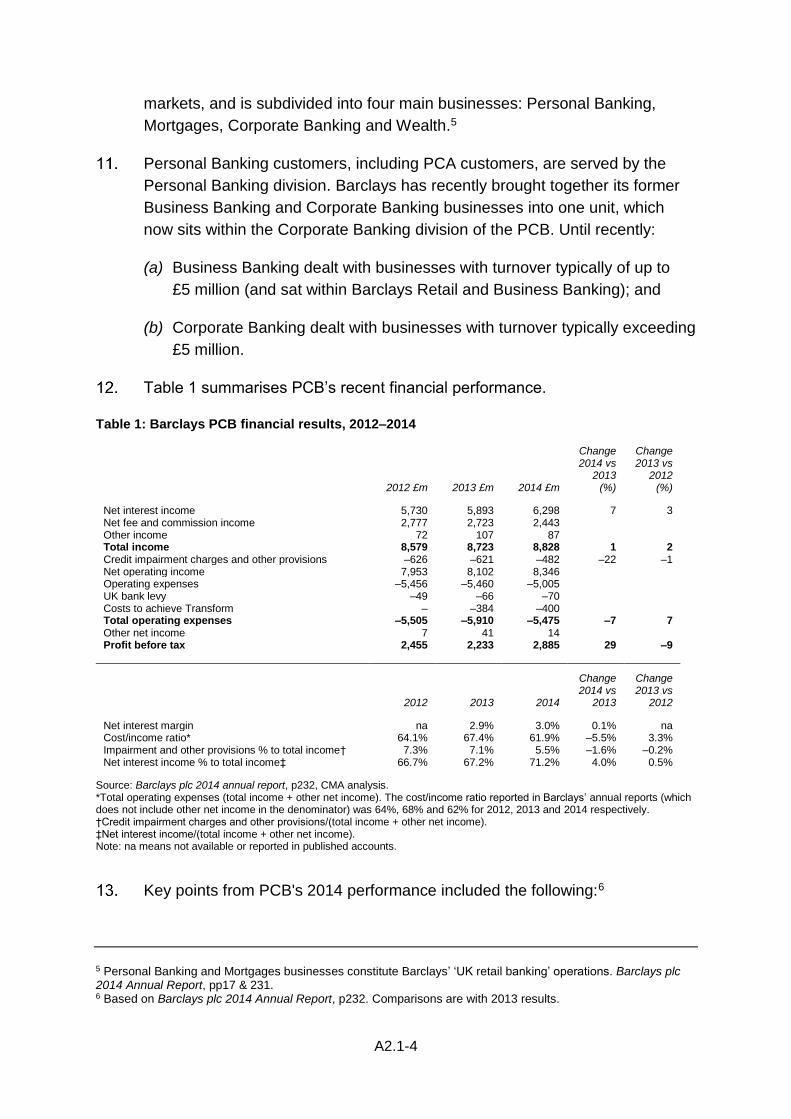
Table 1 summarises PCB’s recent financial performance.
Table 1: Barclays PCB financial results, 2012–2014
2012 £m 2013 £m 2014 £m
Change 2014 vs
2013 (%)
Change 2013 vs
2012 (%)
Net interest income 5,730 5,893 6,298 7 3 Net fee and commission income 2,777 2,723 2,443 Other income 72 107 87 Total income 8,579 8,723 8,828 1 2 Credit impairment charges and other provisions –626 –621 –482 –22 –1 Net operating income 7,953 8,102 8,346 Operating expenses –5,456 –5,460 –5,005 UK bank levy –49 –66 –70 Costs to achieve Transform – –384 –400 Total operating expenses –5,505 –5,910 –5,475 –7 7 Other net income 7 41 14 Profit before tax 2,455 2,233 2,885 29 –9
2012 2013 2014
Change 2014 vs
2013
Change 2013 vs
2012
Net interest margin na 2.9% 3.0% 0.1% na Cost/income ratio* 64.1% 67.4% 61.9% –5.5% 3.3% Impairment and other provisions % to total income† 7.3% 7.1% 5.5% –1.6% –0.2% Net interest income % to total income‡ 66.7% 67.2% 71.2% 4.0% 0.5%
Source: Barclays plc 2014 annual report, p232, CMA analysis. *Total operating expenses (total income + other net income). The cost/income ratio reported in Barclays’ annual reports (which does not include other net income in the denominator) was 64%, 68% and 62% for 2012, 2013 and 2014 respectively. †Credit impairment charges and other provisions/(total income + other net income). ‡Net interest income/(total income + other net income). Note: na means not available or reported in published accounts.
Key points from PCB's 2014 performance included the following:6
5 Personal Banking and Mortgages businesses constitute Barclays’ ‘UK retail banking’ operations. Barclays plc 2014 Annual Report, pp17 & 231. 6 Based on Barclays plc 2014 Annual Report, p232. Comparisons are with 2013 results.

A2.1-5
(a) Profit before tax grew 29%, which was driven by growth in personal
banking income, lower impairments due to the improving economic
environment in the UK, and the continued reduction in operating
expenses due to progress on the Transform strategy.7
(b) Net interest income increased 7% to £6.3 billion driven by lending and
deposit growth and margin improvement. Net interest income made up
around 71% of total income (the rest was accounted for mainly by fees
and commission income).
(c) Net interest margin (NIM) improved 9 basis points to 3% primarily due to
the launch of a revised overdraft proposition. This recognised the majority
of overdraft income as net interest income as opposed to fee income, and
higher saving margins with personal banking and wealth.
(d) Credit impairments and other provisions were 5.5% of total income
(compared to 7.1% reported in 2013), due to the improving economic
environment in the UK. This particularly impacted Corporate Banking,
which benefited from one-off releases and lower defaults from large UK
corporate clients.
(e) Cost/income ratio was lower, at 62% in 2014, compared to 67% reported
in 2013. This reflected savings in total operating expenses realised from
restructuring of the branch network, and technology improvements to
increase automation.
HSBC Group (HSBCG)
HSBCG is a British multinational banking and financial services company
headquartered in London. HSBCG has over 6,100 offices in 73 countries and
territories across Middle East and Northern Africa, Asia, Europe, North
America and Latin America. It has around 51 million customers.
HSBC Bank plc is a wholly owned subsidiary of HSBCG. The business ranges
from traditional personal finance and commercial banking, to private banking,
consumer finance as well as corporate and investment banking.
HSBCG acquired a 14.9% equity interest in Midland Bank in 1987. In 1989
Midland Bank launched First Direct. In 1992, HSBCG acquired full ownership
of Midland Bank (including First Direct). Midland Bank was renamed HSBC
Bank in 1999 as part of the adoption of the HSBC brand throughout the
7 Barclays launched its ‘Transform’ programme in 2013 to generate sustainable returns and to meet the needs of all its stakeholders – Barclays plc 2014 Annual Report, p8.
A2.1-6
HSBCG. In 2004, Marks and Spencer Bank became a wholly owned
subsidiary of HSBC but with its own banking licence and a profit sharing
agreement with Mark and Spencer plc. HSBC currently, therefore, trades
across three brands: HSBC, First Direct and M&S Bank.
At the end of 2014 HSBC had 1,108 branches (including M&S Bank branded
branches) in the UK.
HSBC Bank plc is structured into four divisions: Retail Banking and Wealth
Management (RBWM), Commercial Banking (CMB), Global Banking and
Markets (GB&M) and Global Private Banking (GPB).
The RBWM division takes deposits and provides transactional banking
services to customers in the UK and Europe.8 Its main types of services
include personal banking, HSBC Premier, HSBC Advance and Wealth
Solutions & Financial Planning.9
The CMB division provides a broad range of banking and financial services to
business customers ranging from small businesses to large corporates
operating both in the UK and internationally.
HSBC’s GB&M division is a global business that provides wholesale capital
markets and transaction banking services to major governments, corporate
and institutional clients.10
The GPB division provides private banking, investment and wealth
management services to high net worth individuals.11
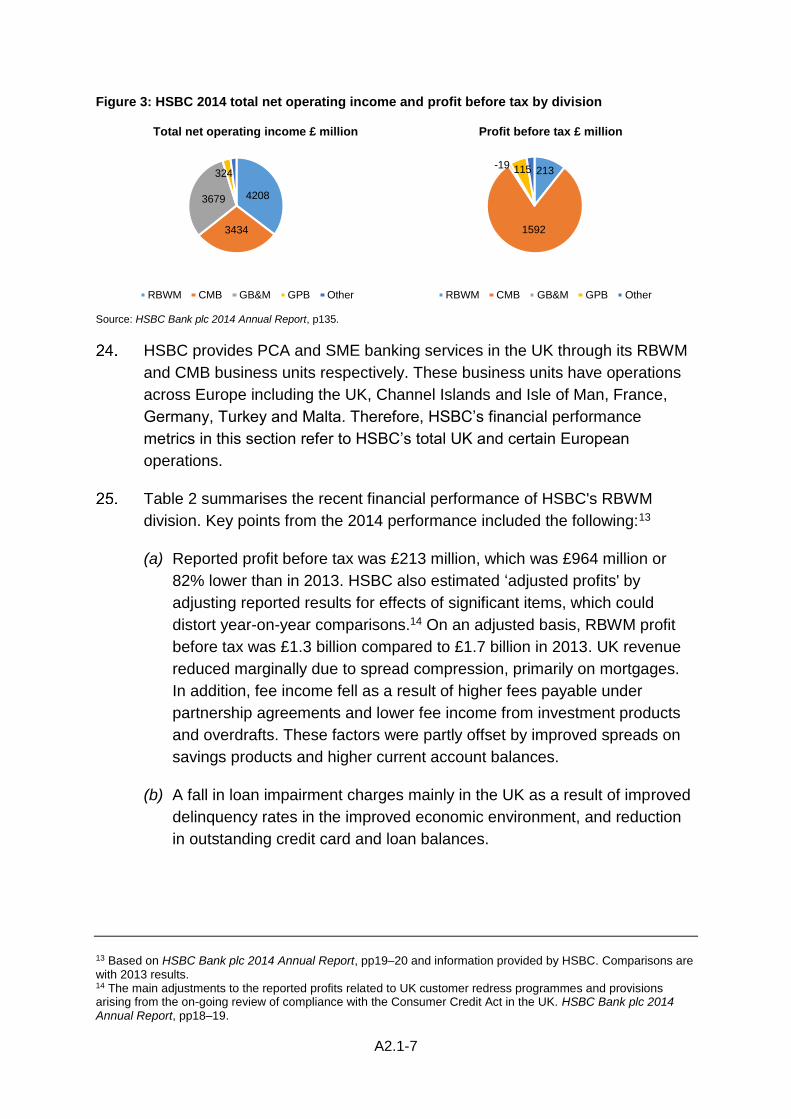
Figure 3 shows HSBC's 2014 net operating income12 and profit before tax by
division. As can be seen, RBWM, CMB and GB&M are HSBC’s largest
divisions by revenue.
8 HSBC Bank plc 2014 Annual Report, p5. 9 HSBC Premier provides a dedicated relationship manager to its mass affluent personal customers. HSBC Advance offers its emerging affluent customers access to range of preferential products, rates and terms. HSBC Bank plc 2014 Annual Report, p5. 10 ibid, p6. 11 ibid, p7. 12 Net operating income before loan impairment charges and other credit provisions.
A2.1-7
Figure 3: HSBC 2014 total net operating income and profit before tax by division
Total net operating income £ million Profit before tax £ million
Source: HSBC Bank plc 2014 Annual Report, p135.
HSBC provides PCA and SME banking services in the UK through its RBWM
and CMB business units respectively. These business units have operations
across Europe including the UK, Channel Islands and Isle of Man, France,
Germany, Turkey and Malta. Therefore, HSBC’s financial performance
metrics in this section refer to HSBC’s total UK and certain European
operations.
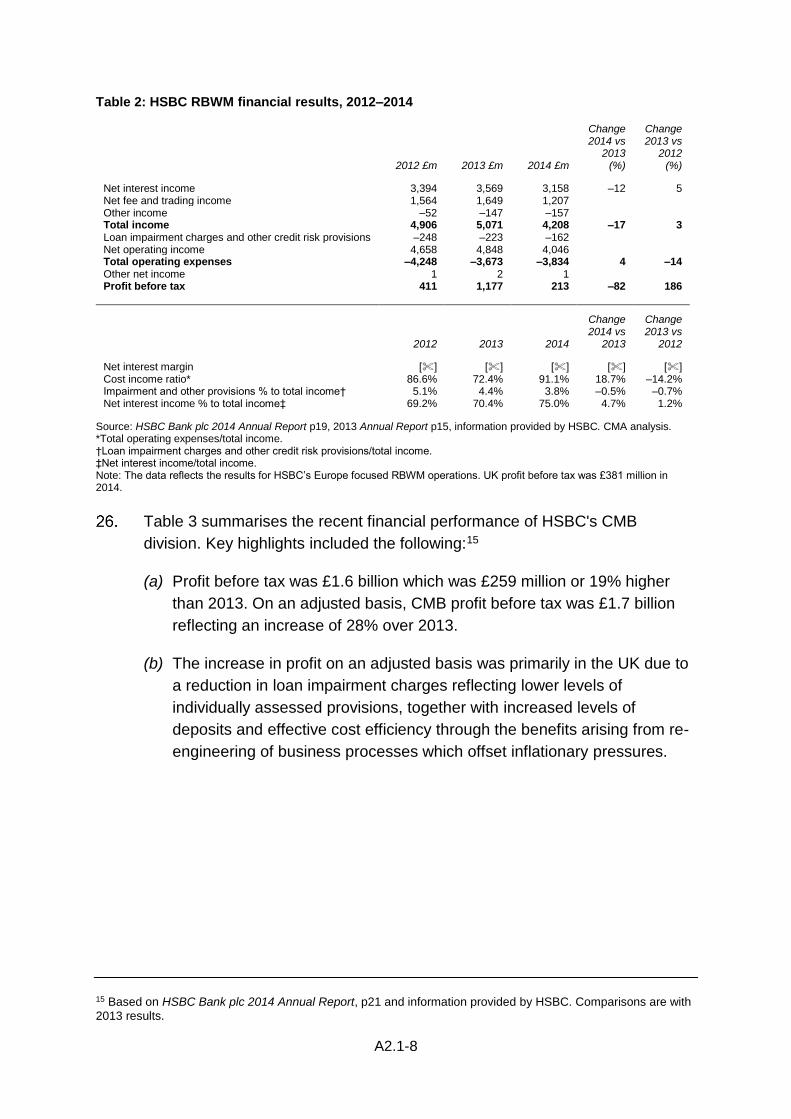
Table 2 summarises the recent financial performance of HSBC's RBWM
division. Key points from the 2014 performance included the following:13
(a) Reported profit before tax was £213 million, which was £964 million or
82% lower than in 2013. HSBC also estimated ‘adjusted profits' by
adjusting reported results for effects of significant items, which could
distort year-on-year comparisons.14 On an adjusted basis, RBWM profit
before tax was £1.3 billion compared to £1.7 billion in 2013. UK revenue
reduced marginally due to spread compression, primarily on mortgages.
In addition, fee income fell as a result of higher fees payable under
partnership agreements and lower fee income from investment products
and overdrafts. These factors were partly offset by improved spreads on
savings products and higher current account balances.
(b) A fall in loan impairment charges mainly in the UK as a result of improved
delinquency rates in the improved economic environment, and reduction
in outstanding credit card and loan balances.
13 Based on HSBC Bank plc 2014 Annual Report, pp19–20 and information provided by HSBC. Comparisons are with 2013 results. 14 The main adjustments to the reported profits related to UK customer redress programmes and provisions arising from the on-going review of compliance with the Consumer Credit Act in the UK. HSBC Bank plc 2014 Annual Report, pp18–19.
4208
3434
3679
324
RBWM CMB GB&M GPB Other
213
1592
-19 115
RBWM CMB GB&M GPB Other
A2.1-8
Table 2: HSBC RBWM financial results, 2012–2014
2012 £m 2013 £m 2014 £m
Change 2014 vs
2013 (%)
Change 2013 vs
2012 (%)
Net interest income 3,394 3,569 3,158 –12 5 Net fee and trading income 1,564 1,649 1,207 Other income –52 –147 –157 Total income 4,906 5,071 4,208 –17 3 Loan impairment charges and other credit risk provisions –248 –223 –162 Net operating income 4,658 4,848 4,046 Total operating expenses –4,248 –3,673 –3,834 4 –14 Other net income 1 2 1 Profit before tax 411 1,177 213 –82 186
2012 2013 2014
Change 2014 vs
2013
Change 2013 vs
2012
Net interest margin [] [] [] [] [] Cost income ratio* 86.6% 72.4% 91.1% 18.7% –14.2% Impairment and other provisions % to total income† 5.1% 4.4% 3.8% –0.5% –0.7% Net interest income % to total income‡ 69.2% 70.4% 75.0% 4.7% 1.2%
Source: HSBC Bank plc 2014 Annual Report p19, 2013 Annual Report p15, information provided by HSBC. CMA analysis. *Total operating expenses/total income. †Loan impairment charges and other credit risk provisions/total income. ‡Net interest income/total income. Note: The data reflects the results for HSBC’s Europe focused RBWM operations. UK profit before tax was £381 million in 2014.
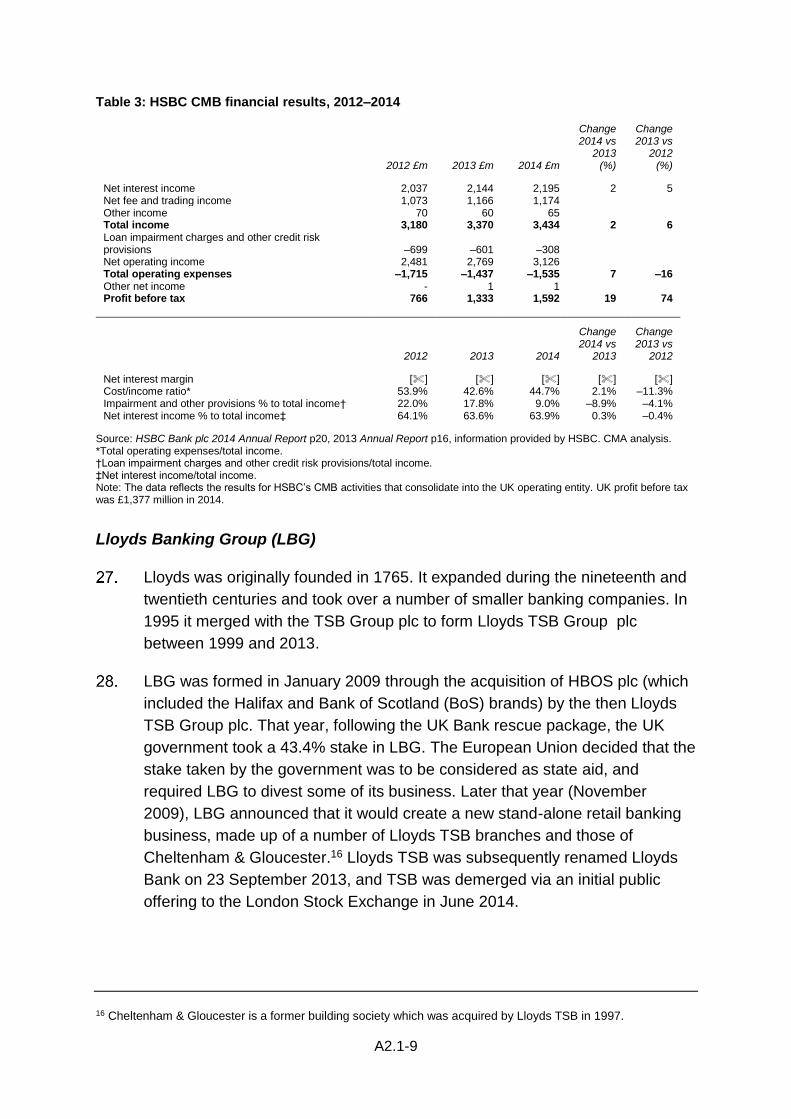
Table 3 summarises the recent financial performance of HSBC's CMB
division. Key highlights included the following:15
(a) Profit before tax was £1.6 billion which was £259 million or 19% higher
than 2013. On an adjusted basis, CMB profit before tax was £1.7 billion
reflecting an increase of 28% over 2013.
(b) The increase in profit on an adjusted basis was primarily in the UK due to
a reduction in loan impairment charges reflecting lower levels of
individually assessed provisions, together with increased levels of
deposits and effective cost efficiency through the benefits arising from re-
engineering of business processes which offset inflationary pressures.
15 Based on HSBC Bank plc 2014 Annual Report, p21 and information provided by HSBC. Comparisons are with
2013 results.
A2.1-9
Table 3: HSBC CMB financial results, 2012–2014
2012 £m 2013 £m 2014 £m
Change 2014 vs
2013 (%)
Change 2013 vs
2012 (%)
Net interest income 2,037 2,144 2,195 2 5 Net fee and trading income 1,073 1,166 1,174 Other income 70 60 65 Total income 3,180 3,370 3,434 2 6 Loan impairment charges and other credit risk provisions –699 –601 –308 Net operating income 2,481 2,769 3,126 Total operating expenses –1,715 –1,437 –1,535 7 –16 Other net income - 1 1 Profit before tax 766 1,333 1,592 19 74
2012 2013 2014
Change 2014 vs
2013
Change 2013 vs
2012
Net interest margin [] [] [] [] [] Cost/income ratio* 53.9% 42.6% 44.7% 2.1% –11.3% Impairment and other provisions % to total income† 22.0% 17.8% 9.0% –8.9% –4.1% Net interest income % to total income‡ 64.1% 63.6% 63.9% 0.3% –0.4%
Source: HSBC Bank plc 2014 Annual Report p20, 2013 Annual Report p16, information provided by HSBC. CMA analysis. *Total operating expenses/total income. †Loan impairment charges and other credit risk provisions/total income. ‡Net interest income/total income. Note: The data reflects the results for HSBC’s CMB activities that consolidate into the UK operating entity. UK profit before tax was £1,377 million in 2014.
Lloyds Banking Group (LBG)
Lloyds was originally founded in 1765. It expanded during the nineteenth and
twentieth centuries and took over a number of smaller banking companies. In
1995 it merged with the TSB Group plc to form Lloyds TSB Group plc
between 1999 and 2013.
LBG was formed in January 2009 through the acquisition of HBOS plc (which
included the Halifax and Bank of Scotland (BoS) brands) by the then Lloyds
TSB Group plc. That year, following the UK Bank rescue package, the UK
government took a 43.4% stake in LBG. The European Union decided that the
stake taken by the government was to be considered as state aid, and
required LBG to divest some of its business. Later that year (November
2009), LBG announced that it would create a new stand-alone retail banking
business, made up of a number of Lloyds TSB branches and those of
Cheltenham & Gloucester.16 Lloyds TSB was subsequently renamed Lloyds
Bank on 23 September 2013, and TSB was demerged via an initial public
offering to the London Stock Exchange in June 2014.
16 Cheltenham & Gloucester is a former building society which was acquired by Lloyds TSB in 1997.
A2.1-10
Following the divestment of TSB, there are no Lloyds Bank branches in
Scotland, and no BoS branches in England and Wales. LBG has recently
opened three Halifax branches in Scotland. As a result, at the end of 2014
LBG had 1,290 Lloyds Bank branches in England and Wales, 665 Halifax
branches (of which 16 were in Northern Ireland and 3 in Scotland), and 293
BoS branches in Scotland – totaling 2,248 branches.
LBG is predominately UK-focused, and operates through four business
divisions: Retail, Commercial Banking, Consumer Finance and Insurance.17
Its Retail, Commercial Banking and Consumer Finance divisions provide retail
banking services within the CMA's terms of reference:
(a) Retail is responsible for providing PCAs, savings accounts, personal
loans and mortgages. It also distributes insurance, protection and credit
cards, as well as serving retail business banking (RBB) customers.
(b) Commercial Banking supports business clients (SMEs through to large
corporates) with their banking, financing and risk management
requirements. SME Banking is part of Commercial Banking and serves
SMEs with an estimated annual turnover of between £1 million and
£25 million or borrowing more than £50,000 and clients with more
complex and broader needs (eg multiple products).
(c) The Consumer Finance division is divided into the following business
units: Asset Finance, Consumer and Commercial Cards, and European
Online. Asset Finance is subdivided into LBG's Black Horse (motor
finance loans) and Lex Autolease (vehicle leasing and fleet management
services) brands.
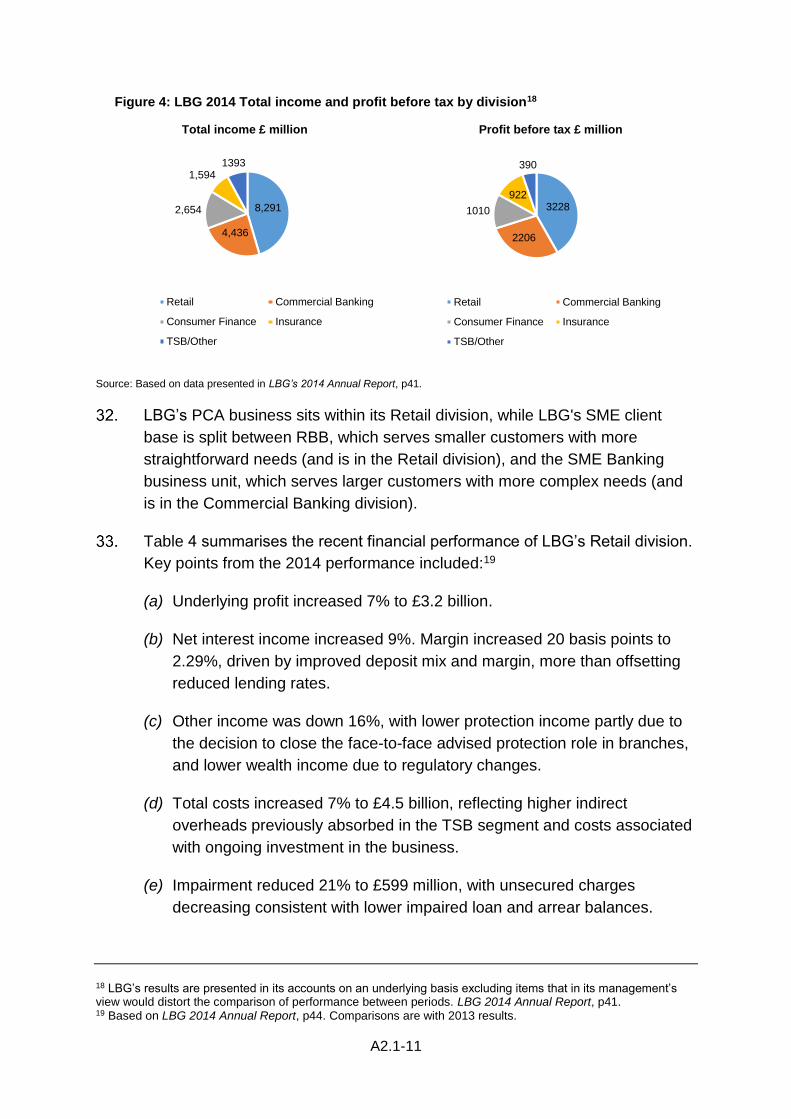
Figure 4 provides a breakdown of LBG’s total income and profit before tax in
2014 by main business divisions. Retail was the largest division, contributing
£8.3 billion (45% of LBG total) of revenue and £3.2 billion (42% of LBG total)
of profits.
17 In addition, it also separately reports financial results for Central Items/Run-offs. LBG describes these divisions as follows. Central Items: includes assets held outside the main operating divisions, including exposures relating to Group Corporate Treasury which holds the Group’s liquidity portfolio and Group Operations. Run-offs: includes
assets that are outside of the Group’s risk appetite, and were previously classified as non‑core. TSB is a stand-
alone multi‑channel retail banking business – it serves retail and small business customers, providing a full range
of retail banking products. LBG 2014 Annual Report, p109.
A2.1-11
Figure 4: LBG 2014 Total income and profit before tax by division18
Total income £ million Profit before tax £ million
Source: Based on data presented in LBG’s 2014 Annual Report, p41.
LBG’s PCA business sits within its Retail division, while LBG's SME client
base is split between RBB, which serves smaller customers with more
straightforward needs (and is in the Retail division), and the SME Banking
business unit, which serves larger customers with more complex needs (and
is in the Commercial Banking division).
Table 4 summarises the recent financial performance of LBG’s Retail division.
Key points from the 2014 performance included:19
(a) Underlying profit increased 7% to £3.2 billion.
(b) Net interest income increased 9%. Margin increased 20 basis points to
2.29%, driven by improved deposit mix and margin, more than offsetting
reduced lending rates.
(c) Other income was down 16%, with lower protection income partly due to
the decision to close the face-to-face advised protection role in branches,
and lower wealth income due to regulatory changes.
(d) Total costs increased 7% to £4.5 billion, reflecting higher indirect
overheads previously absorbed in the TSB segment and costs associated
with ongoing investment in the business.
(e) Impairment reduced 21% to £599 million, with unsecured charges
decreasing consistent with lower impaired loan and arrear balances.
18 LBG’s results are presented in its accounts on an underlying basis excluding items that in its management’s view would distort the comparison of performance between periods. LBG 2014 Annual Report, p41. 19 Based on LBG 2014 Annual Report, p44. Comparisons are with 2013 results.
8,291
4,436
2,654
1,594 1393
Retail Commercial Banking
Consumer Finance Insurance
TSB/Other
3228
2206
1010
922
390
Retail Commercial Banking
Consumer Finance Insurance
TSB/Other

A2.1-12
Secured coverage strengthened to 37%, resulting in a 13% increase to
the impairment charge.
Table 4: LBG Retail financial results, 2012–2014
2012 £m 2013 £m 2014 £m
Change 2014 vs
2013 (%)
Change 2013 vs
2012 (%)
Net interest income 6,037 6,500 7,079 9 8 Other income 1,406 1,435 1,212 Total income 7,443 7,935 8,291 4 7 Total costs –4,236 –4,160 –4,464 7 –2 Impairment –914 –760 –599 –21 –17 Underlying profit 2,293 3,015 3,228 7 31
2012 2013 2014
Change 2014 vs
2013
Change 2013 vs
2012
Net interest margin [] 2.1% 2.3% 0.2% [] Cost/income ratio* 56.9% 52.4% 53.8% 1.4% –4.5% Impairment and other provisions % to total income† 12.3% 9.6% 7.2% –2.4% –2.7% Net interest income % to total income‡ 81.1% 81.9% 85.4% 3.5% 0.8%
Source: LBG 2014 annual report, p45, p204-205, CMA analysis. *Total costs/total income. †Impairment/total income. ‡Net interest income/total income. Note: Retail is responsible for providing PCAs, savings accounts, personal loans and mortgages. It also distributes insurance, protection and credit cards, as well as serving RBB customers (ie SMEs with an estimated annual turnover of less than £1 million and borrowing less than £50,000; start-ups; and customers with straightforward banking needs).
Table 5 summarises the recent financial performance of LBG’s Commercial
Banking division. Key highlights of the 2014 performance included:20
(a) Underlying profit of £2.2 billion was 17% higher than in 2013, driven by
income growth in SME, mid-markets and financial institutions and lower
impairments.
(b) Income increased by 1% to £4.4 billion as a result of increased net
interest income in all client segments offset by declining performance in
other income reflecting challenging market conditions and lower income
from Lloyds Development Capital.
(c) Net interest margin increased by 46 basis points to 2.67% as a result of
pricing of new lending, customer repricing in deposits and a reduction in
funding costs helped by the increase in Global Transaction Banking
Deposits.
(d) Other income decreased by 13% driven by lower client income in Debt
Capital Markets and Financial Markets due to the continued low interest
20 Based on LBG 2014 Annual Report, p48. Comparisons are with 2013 results.
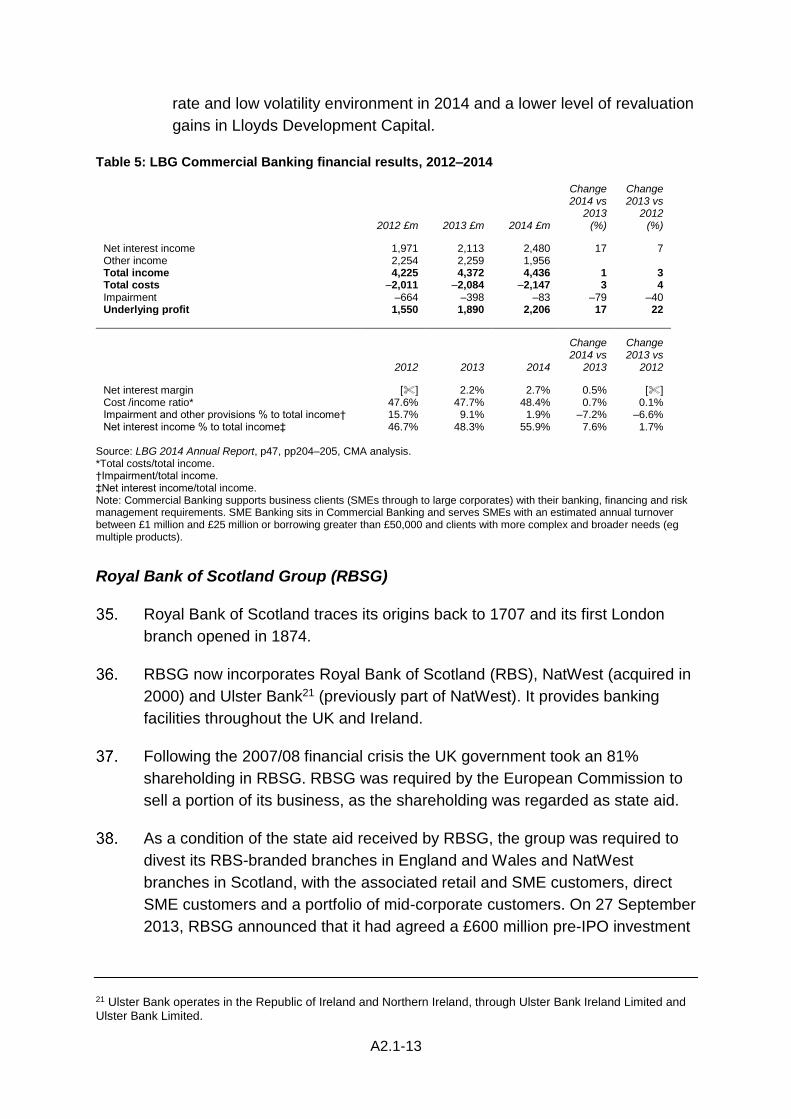
A2.1-13
rate and low volatility environment in 2014 and a lower level of revaluation
gains in Lloyds Development Capital.
Table 5: LBG Commercial Banking financial results, 2012–2014
2012 £m 2013 £m 2014 £m
Change 2014 vs
2013 (%)
Change 2013 vs
2012 (%)
Net interest income 1,971 2,113 2,480 17 7 Other income 2,254 2,259 1,956 Total income 4,225 4,372 4,436 1 3 Total costs –2,011 –2,084 –2,147 3 4 Impairment –664 –398 –83 –79 –40 Underlying profit 1,550 1,890 2,206 17 22
2012 2013 2014
Change 2014 vs
2013
Change 2013 vs
2012
Net interest margin [] 2.2% 2.7% 0.5% [] Cost /income ratio* 47.6% 47.7% 48.4% 0.7% 0.1% Impairment and other provisions % to total income† 15.7% 9.1% 1.9% –7.2% –6.6% Net interest income % to total income‡ 46.7% 48.3% 55.9% 7.6% 1.7%
Source: LBG 2014 Annual Report, p47, pp204–205, CMA analysis. *Total costs/total income. †Impairment/total income. ‡Net interest income/total income. Note: Commercial Banking supports business clients (SMEs through to large corporates) with their banking, financing and risk management requirements. SME Banking sits in Commercial Banking and serves SMEs with an estimated annual turnover between £1 million and £25 million or borrowing greater than £50,000 and clients with more complex and broader needs (eg multiple products).
Royal Bank of Scotland Group (RBSG)
Royal Bank of Scotland traces its origins back to 1707 and its first London
branch opened in 1874.
RBSG now incorporates Royal Bank of Scotland (RBS), NatWest (acquired in
2000) and Ulster Bank21 (previously part of NatWest). It provides banking
facilities throughout the UK and Ireland.
Following the 2007/08 financial crisis the UK government took an 81%
shareholding in RBSG. RBSG was required by the European Commission to
sell a portion of its business, as the shareholding was regarded as state aid.
As a condition of the state aid received by RBSG, the group was required to
divest its RBS-branded branches in England and Wales and NatWest
branches in Scotland, with the associated retail and SME customers, direct
SME customers and a portfolio of mid-corporate customers. On 27 September
2013, RBSG announced that it had agreed a £600 million pre-IPO investment
21 Ulster Bank operates in the Republic of Ireland and Northern Ireland, through Ulster Bank Ireland Limited and Ulster Bank Limited.

A2.1-14
in its Williams & Glyn business with a consortium of investors led by global
financial services specialists Corsair Capital and Centerbridge Partners.
Williams and Glynn is anticipated to be separated from RBS in 2016 and fully
divested by RBS by the end of 2017. Following completion of the operational
and legal separation of the business into a stand-alone bank to be branded
Williams & Glyn, RBSG would pursue an IPO, and the announced investment
would be exchangeable for a significant minority interest in Williams & Glyn at
the time of its IPO.
At the end of 2014 RBSG had 1,923 branches in the UK (including 74 Ulster
Bank branches).
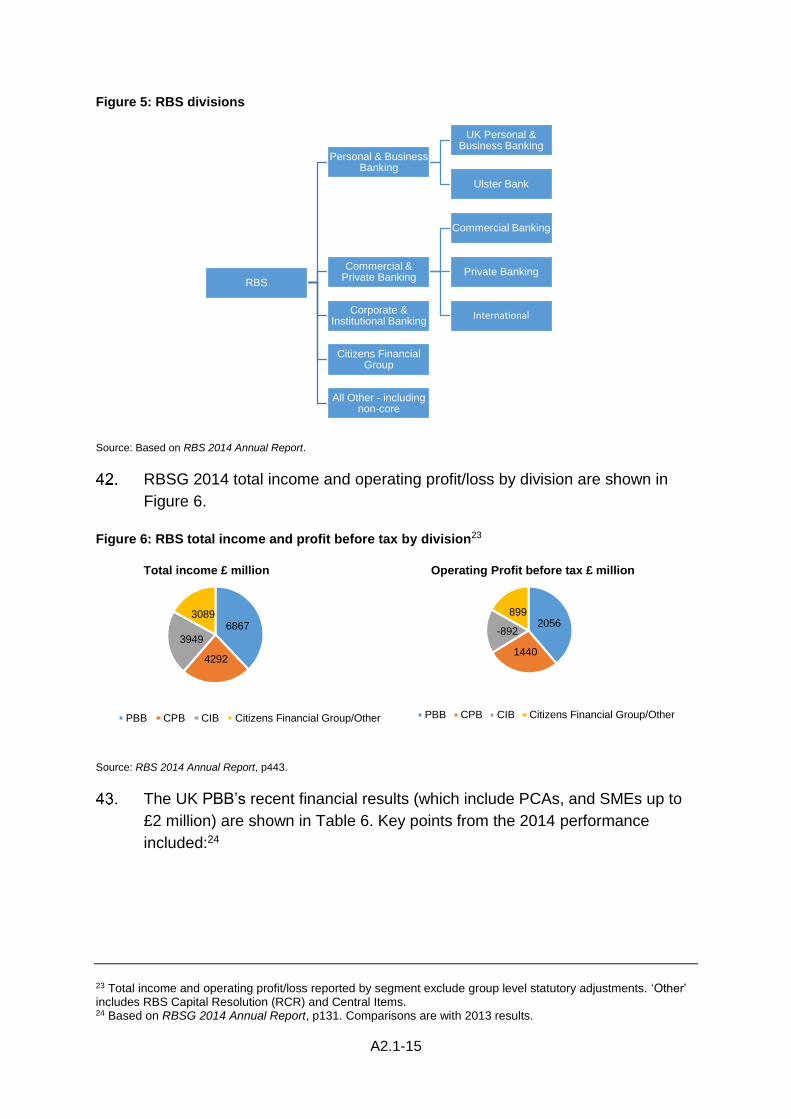
Since a group restructure in February 2014, RBSG has the following divisions:
(a) Personal and Business Banking (PBB) – provides a range of banking
products to personal and private banking customers and smaller
businesses with an annual turnover of £2 million or less. It includes UK
PBB and Ulster Bank. In 2014, PBB contributed 38% of RBS’s total
income and 59% of its statutory operating profit before tax.
(b) Commercial and Private Banking (CPB) – serves all of RBS’s commercial
and corporate customers other than the smaller business customers
(£2 million or less turnover) and the very largest corporates, which are
served by Corporate and Institutional Banking. In 2014, Commercial and
Private Banking contributed 23% (as per RBS’s accounts) of RBS’s total
income, and 41% of its statutory operating profit before tax.
(c) Corporate and Institutional Banking (CIB) – the wholesale banking
business. Contains two businesses: Markets and Transaction Services,
which both provide a range of banking services to large UK and
international corporates and financial institutions.
(d) Citizens Financial Group – engaged in retail and corporate banking
activities in the United States.
In 2014, RBSG implemented a new organisational design for a more UK-
centred bank with focused international capabilities.22 Its divisional structure is
shown in Figure 5.
22 RBSG 2014 Annual Report, p3.
A2.1-15
Figure 5: RBS divisions
Source: Based on RBS 2014 Annual Report.
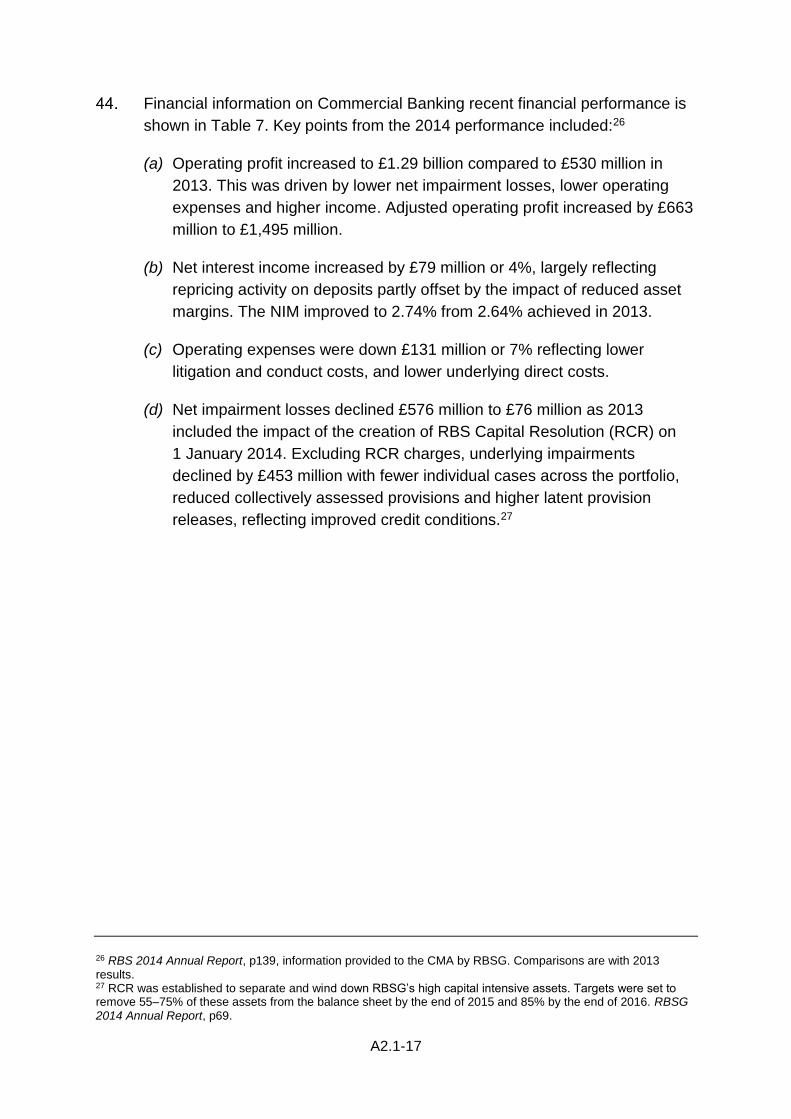
RBSG 2014 total income and operating profit/loss by division are shown in
Figure 6.
Figure 6: RBS total income and profit before tax by division23
Total income £ million Operating Profit before tax £ million
Source: RBS 2014 Annual Report, p443.
The UK PBB’s recent financial results (which include PCAs, and SMEs up to
£2 million) are shown in Table 6. Key points from the 2014 performance
included:24
23 Total income and operating profit/loss reported by segment exclude group level statutory adjustments. ‘Other’ includes RBS Capital Resolution (RCR) and Central Items. 24 Based on RBSG 2014 Annual Report, p131. Comparisons are with 2013 results.
RBS
Personal & Business Banking
UK Personal & Business Banking
Ulster Bank
Commercial & Private Banking
Commercial Banking
Private Banking
InternationalCorporate & Institutional Banking
Citizens Financial Group
All Other - including non-core
6867
4292
3949
3089
PBB CPB CIB Citizens Financial Group/Other
2056
1440
-892
899
PBB CPB CIB Citizens Financial Group/Other

A2.1-16
(a) Operating profit of £1.45 billion increased by £631 million, while adjusted
operating profit (excluding restructuring and conduct costs) totalled £2.47
billion compared with £1.906 billion in 2013.
(b) Increase in net interest income of £193 million or 4%, which was driven by
improvement in NIM of 12 basis points, and volume growth.
(c) Decrease in operating expenses of £174 million or 4%, reflecting lower
restructuring and litigation and conduct costs. This resulted in an
improved cost income ratio of 72% as against 77% reported in 2013.25
(d) Net impairment charge was down 47% to £268 million driven by a further
decrease in new default charges together with release of provisions and
recoveries on previously written off debt.
Table 6: UK PBB financial results, 2012–2014
2012 £m 2013 £m 2014 £m
Change 2014 vs
2013 (%)
Change 2013 vs
2012 (%)
Net interest income 4,532 4,490 4,683 4 –1 Net fees and commissions 1,349 1,309 1,287 Other non-interest income 3 14 67 Total income 5,884 5,813 6,037 4 –1 Direct expenses
- staff costs –998 –928 –892 - other costs –284 –524 –380
Indirect expenses –1861 –1954 –2027 Restructuring costs
- direct –140 –118 –10 - indirect –104 –109 –92
Litigation and conduct costs –1,085 –860 –918 Operating expenses –4,472 –4,493 –4,319 –4 – Profit before impairment losses 1,412 1,320 1,718 30 –7 Impairment losses –741 –501 –268 Operating profit 671 819 1,450 77 22 Operating expenses – adjusted –3,143 –3,406 –3,299 Operating profit – adjusted 2,000 1,906 2,470
2012 2013 2014
Change 2014 vs
2013
Change 2013 vs
2012
Net interest margin 3.57% 3.56% 3.68% 0.12% –0.01% Cost/income ratio* 76% 77% 72% –5% 1% Impairment and other provisions % to total income† 12.6% 8.6% 4.4% –4.2% –4.0% Net interest income % to total income‡ 77.0% 77.2% 77.6% 0.3% 0.2%
Source: RBS 2014 Annual Report, pp130–131, CMA analysis. *Operating expenses/total income. †Impairment losses/total income. ‡Net interest income/total income. Note: Adjusted operating expenses and adjusted operating profit exclude restructuring costs and litigation and conduct costs.
25 On an adjusted basis, reported cost income ratio in 2014 was 55% compared to 59% in 2013.
A2.1-17
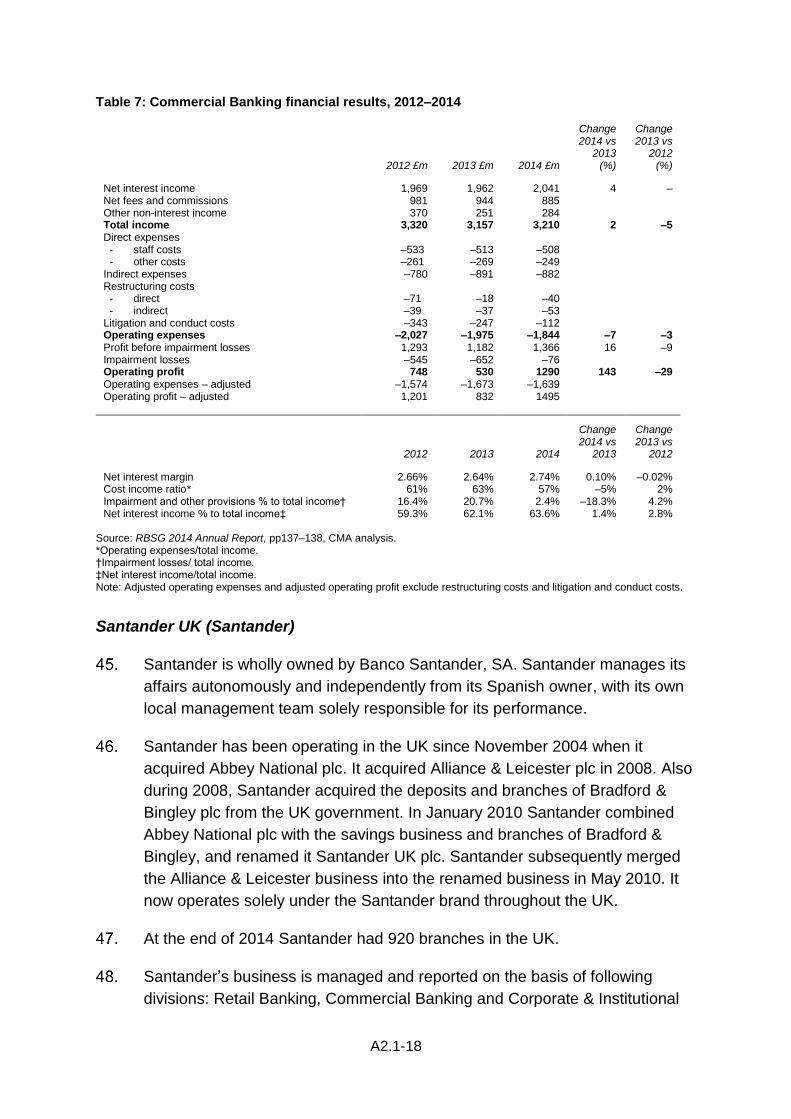
Financial information on Commercial Banking recent financial performance is
shown in Table 7. Key points from the 2014 performance included:26
(a) Operating profit increased to £1.29 billion compared to £530 million in
2013. This was driven by lower net impairment losses, lower operating
expenses and higher income. Adjusted operating profit increased by £663
million to £1,495 million.
(b) Net interest income increased by £79 million or 4%, largely reflecting
repricing activity on deposits partly offset by the impact of reduced asset
margins. The NIM improved to 2.74% from 2.64% achieved in 2013.
(c) Operating expenses were down £131 million or 7% reflecting lower
litigation and conduct costs, and lower underlying direct costs.
(d) Net impairment losses declined £576 million to £76 million as 2013
included the impact of the creation of RBS Capital Resolution (RCR) on
1 January 2014. Excluding RCR charges, underlying impairments
declined by £453 million with fewer individual cases across the portfolio,
reduced collectively assessed provisions and higher latent provision
releases, reflecting improved credit conditions.27
26 RBS 2014 Annual Report, p139, information provided to the CMA by RBSG. Comparisons are with 2013 results. 27 RCR was established to separate and wind down RBSG’s high capital intensive assets. Targets were set to remove 55–75% of these assets from the balance sheet by the end of 2015 and 85% by the end of 2016. RBSG 2014 Annual Report, p69.
A2.1-18
Table 7: Commercial Banking financial results, 2012–2014
2012 £m 2013 £m 2014 £m
Change 2014 vs
2013 (%)
Change 2013 vs
2012 (%)
Net interest income 1,969 1,962 2,041 4 – Net fees and commissions 981 944 885 Other non-interest income 370 251 284 Total income 3,320 3,157 3,210 2 –5 Direct expenses
- staff costs –533 –513 –508 - other costs –261 –269 –249
Indirect expenses –780 –891 –882 Restructuring costs
- direct –71 –18 –40 - indirect –39 –37 –53
Litigation and conduct costs –343 –247 –112 Operating expenses –2,027 –1,975 –1,844 –7 –3 Profit before impairment losses 1,293 1,182 1,366 16 –9 Impairment losses –545 –652 –76 Operating profit 748 530 1290 143 –29 Operating expenses – adjusted –1,574 –1,673 –1,639 Operating profit – adjusted 1,201 832 1495
2012 2013 2014
Change 2014 vs
2013
Change 2013 vs
2012
Net interest margin 2.66% 2.64% 2.74% 0.10% –0.02% Cost income ratio* 61% 63% 57% –5% 2% Impairment and other provisions % to total income† 16.4% 20.7% 2.4% –18.3% 4.2% Net interest income % to total income‡ 59.3% 62.1% 63.6% 1.4% 2.8%
Source: RBSG 2014 Annual Report, pp137–138, CMA analysis. *Operating expenses/total income. †Impairment losses/ total income. ‡Net interest income/total income. Note: Adjusted operating expenses and adjusted operating profit exclude restructuring costs and litigation and conduct costs.
Santander UK (Santander)
Santander is wholly owned by Banco Santander, SA. Santander manages its
affairs autonomously and independently from its Spanish owner, with its own
local management team solely responsible for its performance.
Santander has been operating in the UK since November 2004 when it
acquired Abbey National plc. It acquired Alliance & Leicester plc in 2008. Also
during 2008, Santander acquired the deposits and branches of Bradford &
Bingley plc from the UK government. In January 2010 Santander combined
Abbey National plc with the savings business and branches of Bradford &
Bingley, and renamed it Santander UK plc. Santander subsequently merged
the Alliance & Leicester business into the renamed business in May 2010. It
now operates solely under the Santander brand throughout the UK.
At the end of 2014 Santander had 920 branches in the UK.
Santander’s business is managed and reported on the basis of following
divisions: Retail Banking, Commercial Banking and Corporate & Institutional
A2.1-19
Banking. Indirect income, expenses and charges which cannot be allocated to
those segments are reported under the ‘Corporate Centre’ reporting segment.
Retail Banking’s main products are residential mortgage loans, savings and
current accounts, credit cards, personal loans and insurance policies as well
as Santander Consumer Finance (predominantly a vehicle finance business).
The PCA business, and a part of the SME business (SMEs with annual
turnover of up to around £250,000), is included in Retail Banking. Retail
Banking is Santander’s main business, and contributed 82% of its total
income and 94% of profit before tax in 2014.
Commercial Banking division provides banking services to businesses with a
turnover of between around £250,000 and £500 million per year.28 Its
products include loans, bank accounts, deposits, treasury services, invoice
discounting, cash transmission and asset finance.
Corporate and Institutional Banking is a financial markets business, which
provides services to large corporates – with an annual turnover above
£500 million – and financial institutions.29
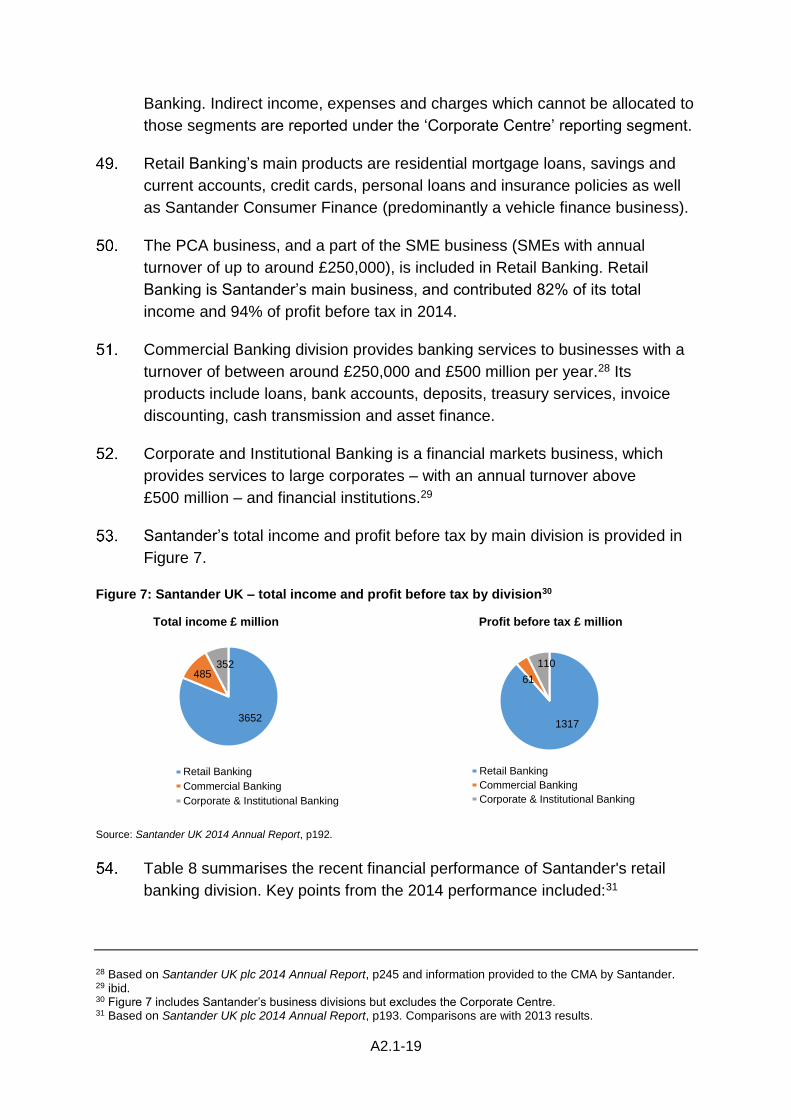
Santander’s total income and profit before tax by main division is provided in
Figure 7.
Figure 7: Santander UK – total income and profit before tax by division30
Total income £ million Profit before tax £ million
Source: Santander UK 2014 Annual Report, p192.
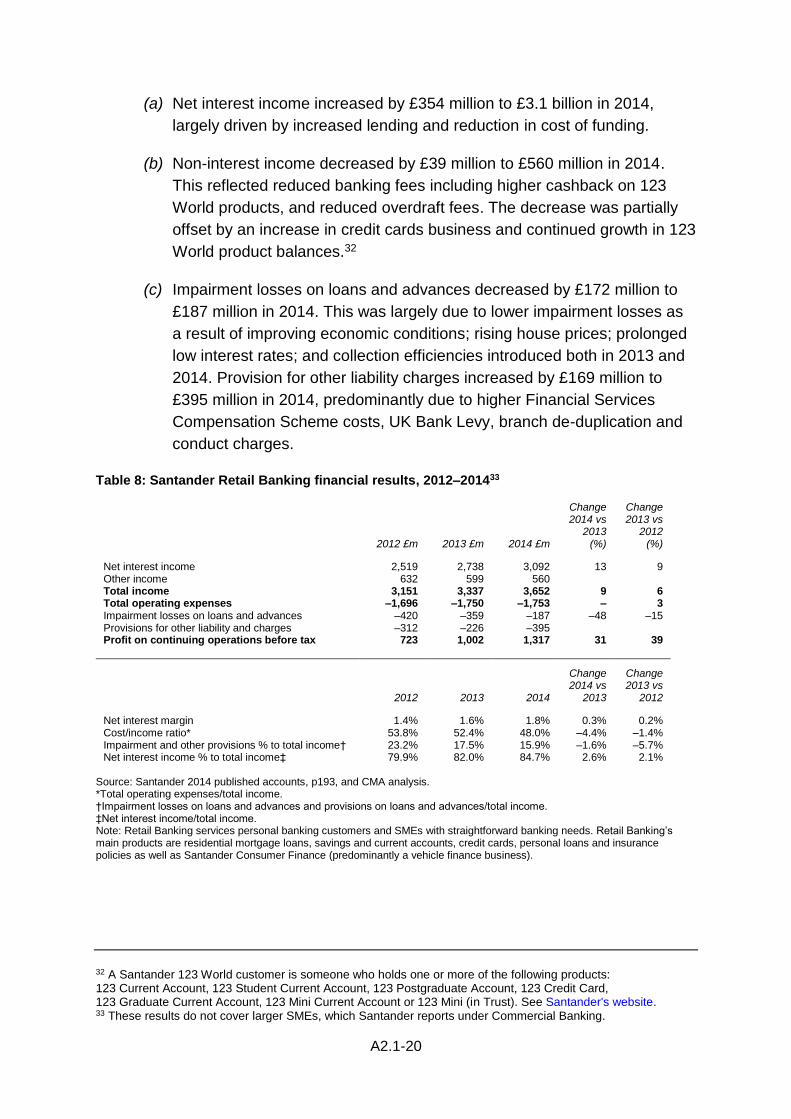
Table 8 summarises the recent financial performance of Santander's retail
banking division. Key points from the 2014 performance included:31
28 Based on Santander UK plc 2014 Annual Report, p245 and information provided to the CMA by Santander. 29 ibid. 30 Figure 7 includes Santander’s business divisions but excludes the Corporate Centre. 31 Based on Santander UK plc 2014 Annual Report, p193. Comparisons are with 2013 results.
3652
485352
Retail Banking
Commercial Banking
Corporate & Institutional Banking
1317
61
110
Retail Banking
Commercial Banking
Corporate & Institutional Banking
A2.1-20
(a) Net interest income increased by £354 million to £3.1 billion in 2014,
largely driven by increased lending and reduction in cost of funding.
(b) Non-interest income decreased by £39 million to £560 million in 2014.
This reflected reduced banking fees including higher cashback on 123
World products, and reduced overdraft fees. The decrease was partially
offset by an increase in credit cards business and continued growth in 123
World product balances.32
(c) Impairment losses on loans and advances decreased by £172 million to
£187 million in 2014. This was largely due to lower impairment losses as
a result of improving economic conditions; rising house prices; prolonged
low interest rates; and collection efficiencies introduced both in 2013 and
2014. Provision for other liability charges increased by £169 million to
£395 million in 2014, predominantly due to higher Financial Services
Compensation Scheme costs, UK Bank Levy, branch de-duplication and
conduct charges.
Table 8: Santander Retail Banking financial results, 2012–201433
2012 £m 2013 £m 2014 £m
Change 2014 vs
2013 (%)
Change 2013 vs
2012 (%)
Net interest income 2,519 2,738 3,092 13 9 Other income 632 599 560 Total income 3,151 3,337 3,652 9 6 Total operating expenses –1,696 –1,750 –1,753 – 3 Impairment losses on loans and advances –420 –359 –187 –48 –15 Provisions for other liability and charges –312 –226 –395 Profit on continuing operations before tax 723 1,002 1,317 31 39
2012 2013 2014
Change 2014 vs
2013
Change 2013 vs
2012
Net interest margin 1.4% 1.6% 1.8% 0.3% 0.2% Cost/income ratio* 53.8% 52.4% 48.0% –4.4% –1.4% Impairment and other provisions % to total income† 23.2% 17.5% 15.9% –1.6% –5.7% Net interest income % to total income‡ 79.9% 82.0% 84.7% 2.6% 2.1%
Source: Santander 2014 published accounts, p193, and CMA analysis. *Total operating expenses/total income. †Impairment losses on loans and advances and provisions on loans and advances/total income. ‡Net interest income/total income. Note: Retail Banking services personal banking customers and SMEs with straightforward banking needs. Retail Banking’s main products are residential mortgage loans, savings and current accounts, credit cards, personal loans and insurance policies as well as Santander Consumer Finance (predominantly a vehicle finance business).
32 A Santander 123 World customer is someone who holds one or more of the following products: 123 Current Account, 123 Student Current Account, 123 Postgraduate Account, 123 Credit Card, 123 Graduate Current Account, 123 Mini Current Account or 123 Mini (in Trust). See Santander's website. 33 These results do not cover larger SMEs, which Santander reports under Commercial Banking.

A2.1-21
Northern Ireland-focused banks (AIB, BoI and Danske)
AIB Group (UK) Plc (AIB)
AIB Group (UK) Plc (AIB) is a subsidiary of Allied Irish Banks plc in the
Republic of Ireland, and trades under the name First Trust Bank in Northern
Ireland. First Trust Bank offers a full service to business and personal
customers, across the range of customer segments, including personal
customers, SMEs, and the corporate sector.
At the end of 2014 First Trust Bank had 30 branches in Northern Ireland
providing services to PCA and BCA customers.
For the year ended 31 December 2014, for its operations in the UK, AIB
Group (UK) plc reported turnover of €239 million and a loss of €57 million.34
Bank of Ireland UK (BOI)
Bank of Ireland UK (BoI) is owned by Bank of Ireland of the Republic of
Ireland.
It provides PCAs and SME banking services in Northern Ireland. It also
provides banking services for the Post Office in the UK.
At the end of 2014, BoI had 37 branches in Northern Ireland.
For the year ended 31 December 2014, BoI reported an operating income of
£545 million and an underlying profit before tax of £103 million for its UK
operations.35
Danske Bank
Danske Bank (the trading name of Northern Bank Limited) operates in
Northern Ireland and is part of the Danske Bank Group, which is
headquartered in Denmark. Danske Bank provides PCAs, loans, mortgages,
savings products and wealth planning to personal customers. For business
customers, it provides BCAs, financing, trade finance, savings, treasury
services and cash management services.
34 Allied Irish Bank Group Country by Country Reporting – for the year ended 31 December 2014. 35 Bank of Ireland Annual Report – for the year ended 31 December 2014.
A2.1-22
At the end of 2014 Danske had 46 branches in Northern Ireland.
For the year ended 31 December 2014, for its Northern Ireland operations,
Danske Bank Group reported total income of £223.6 million and profit before
tax of £117.5 million.36
Other banks
Descriptions of Metro, Tesco, Virgin Money and TSB are in Appendix 10.2 in
our case studies on entry and expansion.
Aldermore was established in 2009 and is an SME-focused bank, which
provides financial services to SMEs, homeowners and savers. Aldermore
specialises in secured lending to SMEs and homeowners in four market
segments. These are:
(a) Asset finance: Aldermore offers asset finance loans on single transactions
between £5,000 and £1 million in value primarily to fund capital
investment in assets including plant and machinery, commercial vehicles,
cars, IT equipment and business equipment. As at 30 June 2015 it had
net loans of £1.2 billion and an estimated 3% share of the total UK asset
finance market.
(b) Invoice finance: Aldermore provides working capital for SMEs by lending
against outstanding invoices. At 30 June 2015 it had net loans of around
£0.2 billion, which it estimated represented 0.9% of the total UK invoice
finance market.
(c) SME commercial mortgages: Aldermore offers SME commercial
mortgages of up to a maximum of £2 million on a single property and
£5 million on multiple properties. At 30 June 2015 it had net loans of £1.1
billion, an estimated 0.9% of the total UK SME commercial mortgage
market.
(d) Residential mortgages: Aldermore offers residential mortgages of up to
£1 million and as at 30 June 2015 had net loans of £2.9 billion or 0.6% of
the UK residential mortgage market.
Aldermore also offers a range of SME and personal savings products
including deposit-based easy access, notice accounts and fixed-term bonds
36 Danske Bank in Northern Ireland: Financial results – 12 months to end December 2014.
A2.1-23
which it launched in 2012. In November 2013, it launched its Customised
Fixed Rate Business Savings Account.
It listed on the London Stock Exchange in March 2015. For the year ended 31
December 2014 it reported total operating incomes of £165 million and profit
before tax of £56.3 million.37
The Co-operative Bank plc (Co-op)
The Co-operative Bank plc provides a full range of banking services to retail
and SME customers.
Up until 2013, the Co-op was wholly owned by the Co-operative Group.
However, in 2013 and 2014, the Co-op was the subject of liability
management and capital raising exercises to address a capital shortfall. As a
result, the Co-operative Group became only a minority shareholder, holding
just over a 20% stake in the bank. The remaining approximately 80% was
held by strategic investors and other recipients of shares from the liability
management exercise.
At the end of 2014 the Co-op operated 222 branches in the UK and seven
business banking centres.
Clydesdale Bank plc (Clydesdale)
Clydesdale Bank plc (Clydesdale) operates under the Clydesdale and the
Yorkshire brands in the UK. It is owned by National Australia Bank Limited
(NAB), which acquired it from the Midland Bank in 1987. Clydesdale provides
PCAs and SME banking services.
NAB has announced its intention to pursue a demerger and IPO of
Clydesdale. This would be via a demerger of 70–80% of shares to existing
NAB shareholders and an IPO of approximately 20–30% of its shares to other
institutional investors.
At the end of 2014 Clydesdale had 294 retail branches in the UK. Clydesdale
also had a further 40 Business & Private Banking Centres (including 23 sites
co-located with its retail branches). It does not have any branches in Northern
Ireland.
37 Aldermore Annual Report and Accounts 2014. Tax excludes IPO costs of £6 million.
A2.1-24
Handelsbanken
Handelsbanken is the trading name of Svenska Handelsbanken AB (publ),
incorporated in Sweden. It has 201 branches in the UK and provides private
and corporate customers with a range of services. Services for personal
customers include: PCAs, mortgages, personal loans, savings and wealth
management services. Services for corporate customers include: asset and
trade finance, cash management, mortgages, loans, invoice discounting and
BCAs.
Post Office Money
The Post Office provides credit cards, current accounts, insurance products,
mortgages and personal loans through the Post Office Money brand which
was launched in 2015. Most Post Office Money branded products are
provided by Bank of Ireland (UK) plc with Post Office Ltd acting as an
appointed representative and credit broker.
Personal banking services are offered on behalf of a number of other banks.
Although different services are available on behalf of different institutions,
these may include: cash withdrawals, paying-in cash and cheques, balance
enquiries and cheque encashment. Some post offices also have cash
machines, mainly provided by Bank of Ireland. Business banking services are
also offered, mainly through Santander UK.
The Post Office has around 11,500 branches in the UK.
Other smaller banks
Other smaller banks include:
(a) Paragon Bank: Paragon bank is a wholly owned subsidiary of The
Paragon Group of companies, one of the UK’s largest specialist lenders.
The Group was established in 1985 and offers buy-to-let mortgages,
consumer and SME loans, together with a range of savings accounts
available online through Paragon Bank.
(b) Shawbrook is a specialist lending and savings bank which offers lending
services to SMEs and property investors whose needs cannot be met by
the main high street banks. It offers online personal and business savings
accounts.
(c) SecureTrust Bank was established in 1952 and provides a range of
lending and deposit services as well as a fee-based current account to
A2.1-25
personal and business customers. It does not have any branches,
although customers can pay money in at Barclays’ branches.
Building societies (Coventry, Nationwide, Skipton, Leeds and Yorkshire)
We provide details here on the five largest building societies in the UK.38
Coventry Building Society
Coventry Building Society is the third largest building society in the UK. It
provides a range of personal accounts, including PCAs, mortgages,
insurance, and savings and investments. It has 70 branches and 22
agencies39 in the UK.
Nationwide Building Society
Nationwide is the UK’s largest building society as well as one of the largest
savings providers and the second largest provider of mortgages in the UK. It
offers a range of financial products, including:
(a) Personal products: PCAs, residential mortgages, personal savings,
personal financial planning, insurance products, personal lending, and
other general personal banking services.
(b) Other products: commercial lending.
At the end of 2014 Nationwide had 696 branches in the UK serving personal
customers. It does not provide BCAs.
For the year ended 4 April 2015, Nationwide generated underlying income of
£3,152 million and underlying profit of £1,216 million.40
Skipton Building Society
Skipton Building Society is the fourth largest building society in the UK. It
provides savings, mortgages, investments and insurance products but does
not provide PCAs. It has over 90 branches in England and Scotland.
38 By assets as at 31 December 2014 (as at 4 April 2015 for Nationwide). 39 For example, in estate agents. 40 Nationwide Building Society Preliminary Results year ending 4 April 2015.
A2.1-26
Leeds Building Society
Leeds Building Society is the fifth largest building society in the UK and
provides PCAs, savings, mortgages, investments and insurance products. It
has over 60 branches, mostly in England.
Yorkshire Building Society
The YBS Group includes Yorkshire Building Society and its brands Barnsley
Building Society, Chelsea Building Society and Norwich & Peterborough
Building Society, and its subsidiary companies including Accord Mortgages.
PCAs are only offered under the Norwich and Peterborough Building Society
brand. YBS Group provides mortgages, savings accounts, and insurance
products. It has 230 branches and 96 associated agencies in the UK.
Other market participants
Crowdfunding
Crowdfunding is the raising of funds for a project, venture or initiative by
seeking contributions from a wide range and usually large number of
contributors. It is typically internet-based and comprises a proposal or project
idea, those that wish to provide funds to support it, and is usually facilitated by
an intermediary website. Funds are usually raised for specific projects.
There are a number of different types of crowdfunding, including equity-
based, donation-based, rewards-based, and revenue/profit sharing crowd-
funding, depending on the expected type of return on investors. Market
participants include Indiegogo (launched 2008) which has funded more than
275,000 campaigns, and Kickstarter (launched 2009) which has funded
around 100,000 projects globally.41
Peer-to-peer lending
This is a variant of crowdfunding where an intermediary matches investors
with those looking for loans and usually spreads investments across a large
number of borrowers. Funds invested in a peer-to-peer company usually
receive a guaranteed percentage return but are not usually protected by the
FSCS.42 Some peer-to-peer lenders offer the option to bid to invest on specific
projects at a rate chosen by the investor, whereas others have simpler models
41 Kickstarter website. 42 Financial Services Compensation Scheme.
A2.1-27
offering a fixed rate of return based on the lending period. Market participants
include Zopa (launched 2005), Crowdcube (launched 2009), Funding Circle
(launched 2010), Rate Setter (also launched 2010) and Thincats (launched
2011)
Invoice trading/finance
Firms sell their invoices or receivables to a pool of individual or institutional
investors, which is similar to invoice discounting offered by banks. Market
participants include Bibby (founded 1982, with around £500 million of lending
per year), Market Invoice (launched 2011 with £450 million of invoice finance
to date) and Platform Black (launched 2011 with £100 million of invoice
finance to date).
Community shares
This is a form of share capital that can only be issued by co-operative
societies, community benefit societies and charitable community benefit
societies. It is used for community purposes such as financing shops, pubs,
community buildings, renewable energy initiatives, local food schemes, along
with other community-based ventures.43
Pension-led funding
This allows SME owners/directors to use their accumulated pension funds in
order to re-invest in their own businesses. Intellectual property can also be
used as collateral.
Debt-based securities
Lenders receive a non-collateralised debt obligation typically paid back over
an extended period of time. This is similar to purchasing a bond, but with
different rights and obligations.
43 Community shares.
A2.2-1
APPENDIX 2.2
Financial performance
Contents Page
Introduction ................................................................................................................ 1
Retail banking financial performance ......................................................................... 1
Background ............................................................................................................. 1
Key financial metrics – UK retail banks ................................................................... 5
Annex A: Impact of regulation on profitability ........................................................... 20
Annex B: ROE, 2004 to 2011: UK retail and small business banking ...................... 21
Introduction
1. This appendix provides details on the financial performance of the UK retail
banking sector. It includes some background information, and an analysis of
the recent financial results and key performance metrics of the five largest UK
retail banks during the period 2012 to 2014.1
Retail banking financial performance
2. In this section, we have relied upon selected research reports and banks’
annual reports to provide an overview of the financial performance of UK retail
banks during the period 2012 to 2014.
Background
3. Retail banking generally refers to the provision of products and services that
banks provide to personal customers and businesses, including SMEs,
through a variety of channels including branches, internet and mobile
technology.
4. Many large UK retail banks have separate retail banking divisions or business
units, with their own management and reporting structures, although there are
differences in the way these banks define, organise and describe their retail
activities – see Box 1 below.
1 The information and data we gathered was from the published annual reports and accounts of Barclays plc, HSBC Bank plc, Lloyds Banking Group plc (LBG plc), Royal Bank of Scotland Group plc (RBSG plc) and Santander UK plc.
A2.2-2
Box 1: Examples of description of retail banking activities by UK banks2
Source: Banks’ 2014 annual reports, CMA research.
5. We reviewed selected industry publications, reports by equity analysts and
consulting firms to understand key profitability drivers of the retail banks in the
UK, as well as emerging trends from their recent financial performance. Key
findings from these are discussed below.
6. In a 2014 report on European retail and business banking, Oliver Wyman
noted that:
…despite 2013 profits being slightly lower compared to 2012
profits, we see a good return on equity (ROE) – after adjusting for
the many one-off Profit and Loss (P&L) impacts and regulator
fines – in the retail and business banking market as a whole, and
opportunities for further improvement. We also observe widening
2 These examples do not constitute an exhaustive list of retail activities or divisions of these banks, but are meant to provide a sample of the information provided by these banks in their 2014 annual reports about their retail businesses.
Barclays: Personal & Corporate Banking (PCB) provides banking services which fulfil the
fundamental banking needs of individuals and businesses: storing, receiving and paying monies
in a safe, reliable and regulated manner. PCB is subdivided into four main units, bringing
together its Personal, Mortgages, Corporate and Wealth businesses.
HSBC: Retail Banking and Wealth Management (RBWM) takes deposits and provides
transactional banking services to enable customers to manage their day-to-day finances and
save for the future. It offers credit facilities to assist customers in their short or longer-term
borrowing requirements, and provides financial advisory, broking, insurance and investment
services to help them to manage and protect their financial futures.
LBG: Retail Banking offers a broad range of financial service products, including current
accounts, savings, personal loans and mortgages, to UK personal customers, including Wealth
and small business customers. It is also a distributor of insurance, protection and credit cards,
and a range of long-term savings and investment products.
RBS: UK Personal & Business Banking (UK PBB) offers a comprehensive range of banking
products and related financial services to the personal and small business market.
Santander: Retail Banking offers a wide range of products and financial services to individuals
and small businesses, through a network of branches and ATMs, as well as through telephony,
digital, mobile and intermediary channels. Retail Banking’s main products are residential
mortgage loans, savings and current accounts, credit cards and personal loans as well as
insurance policies.
A2.2-3
differences across markets, ranging from rising returns in the UK
and Swedish markets to weakening returns in Spain and Italy.3,4
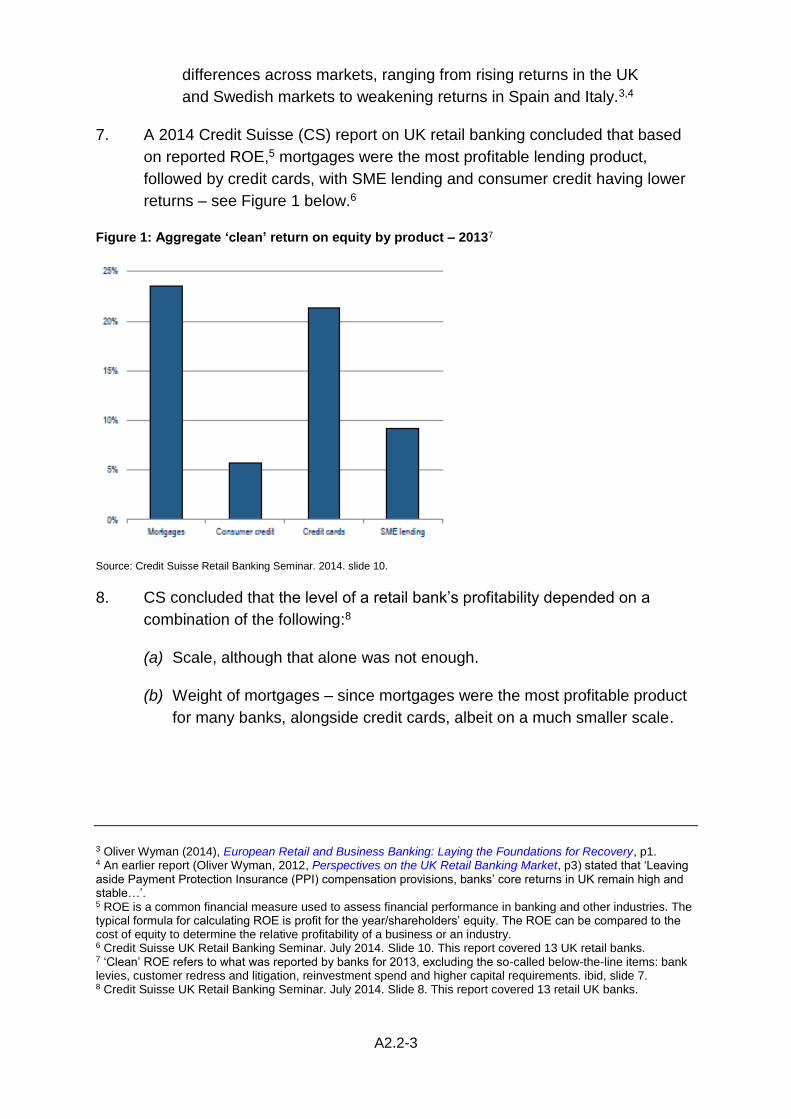
7. A 2014 Credit Suisse (CS) report on UK retail banking concluded that based
on reported ROE,5 mortgages were the most profitable lending product,
followed by credit cards, with SME lending and consumer credit having lower
returns – see Figure 1 below.6
Figure 1: Aggregate ‘clean’ return on equity by product – 20137
Source: Credit Suisse Retail Banking Seminar. 2014. slide 10.
8. CS concluded that the level of a retail bank’s profitability depended on a
combination of the following:8
(a) Scale, although that alone was not enough.
(b) Weight of mortgages – since mortgages were the most profitable product
for many banks, alongside credit cards, albeit on a much smaller scale.
3 Oliver Wyman (2014), European Retail and Business Banking: Laying the Foundations for Recovery, p1. 4 An earlier report (Oliver Wyman, 2012, Perspectives on the UK Retail Banking Market, p3) stated that ‘Leaving aside Payment Protection Insurance (PPI) compensation provisions, banks’ core returns in UK remain high and stable…’. 5 ROE is a common financial measure used to assess financial performance in banking and other industries. The typical formula for calculating ROE is profit for the year/shareholders’ equity. The ROE can be compared to the cost of equity to determine the relative profitability of a business or an industry. 6 Credit Suisse UK Retail Banking Seminar. July 2014. Slide 10. This report covered 13 UK retail banks. 7 ‘Clean’ ROE refers to what was reported by banks for 2013, excluding the so-called below-the-line items: bank levies, customer redress and litigation, reinvestment spend and higher capital requirements. ibid, slide 7. 8 Credit Suisse UK Retail Banking Seminar. July 2014. Slide 8. This report covered 13 retail UK banks.

A2.2-4
(c) Funding structure – having a proportion of low interest bearing accounts
was an advantage, as well as having a purely deposit-funded retail
banking franchise.
9. A 2012 report by the Association of British Insurers (ABI) pointed out that
retail banking profitability was a function of (i) product mix, including the
secured nature of mortgage lending versus the unsecured nature of credit
card lending, (ii) efficiency ratios, and (iii) charges and provisions (eg PPI
claims).9
10. According to a 2014 Deutsche Bank (DB) report, the key drivers of the retail
banking profitability in the UK were mortgages and customer deposits, the
former of which consumed fairly little capital and delivered fairly stable returns
over time.10 Based on its analysis, DB concluded that UK retail banking was a
‘high return, stable industry’, which produced an underlying Return on
Tangible Equity (ROTE) of 22% over the 14 years 2000-2013.11 12 13 DB
stated that since 2009, retail banks’ returns had been lower, producing an
average underlying ROTE of 17% between 2009 and 2013.14 It also reported
that the actual ROTE for the sector including PPI and re-structuring costs was
much lower at 10% between 2009 and 2013.15
11. KPMG, in an analysis of the 2014 financial results of five UK headquartered
banks (Barclays, HSBC, LBG, RBSG and Standard Chartered Bank (SCB)),
stated that while these banks were organisationally very different,16 there
were a few general themes emerging from their recent financial performance.
These included the following:17
(a) some signs of improvement in net interest margins (NIMs);
(b) continuing effect of customer remediation and conduct charges; and
(c) reduction in impairment charges, as a result of strengthening economic
conditions.
9 ABI (2012), Investibility of UK Banks, p16. 10 UK Retail Banking 2014: Bank to the Future, Deutsche Bank Equity Research, September 2014. p8. 11 In general terms, ROTE is computed using profit attributable to shareholders and shareholder equity less intangible assets. ROTE typically is higher than ROE. 12 UK Retail Banking 2014: Bank to the Future, Deutsche Bank Equity Research, September 2014. p5. 13 ibid. Deutsche Bank defined ROTE (based on historical capital) as Underlying Profit before tax ÷ (Risk
Weighted Assets X Core Tier 1 capital ratio average that year) or an estimate of equity base. Underlying Profit before tax excludes exceptional items such as PPI and restructuring costs, p5. 14 ibid, p5. 15 ibid DB did not state a benchmark cost of tangible equity in its report. 16 KPMG (2015), A paradox of forces. Banking results: What do they mean for you?, p17. 17 ibid, pp11–13.
A2.2-5
12. A T Kearney, in a recent report on retail banking in Europe, concluded that
although profitability was rebounding as retail banks recovered from the
financial crisis, the future success depended on building a banking model that
captured new revenues and increased cost efficiency.18 It also stated that
tightened regulations were likely to continue to drive up equity requirements
and the cost of doing business while limiting revenues.19 Further, the report
noted that persistent low interest rates, slow economic growth together with
deflationary pressures could continue to limit profits, even as banks’ risk
provisions declined from the 2012 historical highs.20 A T Kearney pointed out
that retail banks in the UK still struggled due to spread compression, primarily
on mortgages.21
13. According to A T Kearney, UK retail banks faced a competitive market and
growing regulatory intensity, resulting in the lowest income per customer in
the Western Europe region, about €300 in 2014.22
14. Based on the reports we looked at, UK retail banking performance and
outlook paints a mixed picture. The reports suggest that although banks
appear to be gaining from improved economic conditions, lower impairments
and improved NIM, they continue to face high customer remediation and
conduct costs, which has an adverse impact on profitability. They are also
becoming more reliant on net interest income rather than fees to increase
their total income. Mortgages appear to be the most profitable business
segment within UK retail banking, although it faces some pressure on
margins.
Key financial metrics – UK retail banks
15. In this section, we present some data and metrics on the recent financial
performance of the five largest UK retail banks, using their most recent
published annual reports and accounts.23,24 Although using data from
published reports and accounts has the advantage of having been reviewed
by the banks’ management, and being largely based on audited financial
information, it also has many limitations, including the following:
18 A T Kearney, The 2015 Retail Banking Radar: Time to Reinvent Your Banking Model, cover page. 19 A T Kearney, The 2015 Retail Banking Radar: Time to Reinvent Your Banking Model, p1. See Annex A for A T Kearney summary of the effect of regulation on profitability in Europe’s retail banking sector. 20 A T Kearney, The 2015 Retail Banking Radar: Time to Reinvent Your Banking Model, p1. 21 ibid p4. 22 ibid p8. 23 The information and data we gathered was from the published annual reports and accounts of Barclays plc, HSBC Bank plc, LBG plc, RBSG plc and Santander UK plc. 24 Appendix 2.1 provides a summary of the recent financial performance of the retail banking divisions in scope of our analysis.
A2.2-6
(a) Each bank is organised differently, and there is no common definition of
retail banking followed. Banks’ divisions include businesses that are not
relevant, or exclude the ones, which are relevant to understand financial
performance of their UK retail banking operations.
(b) Some banks allocate their common/central costs to their main business
divisions or units, while others keep them in a central division.
(c) Where banks have undergone organisational changes, they have not
always reported or re-stated prior years’ financial data at a divisional level.
(d) Lastly, reported results are affected by the accounting policies and
definitions of metrics, each bank follows; some banks present profits and
financial metrics net of what their management considers exceptional or
non-recurring items, while others do not.25
16. Due to these limitations, financial data and metrics reported in annual reports
and accounts are not be directly comparable between banks. That said,
financial accounts provide a useful overview of the banks’ performance,
especially of the evolution of a bank’s financial metrics over time. For our
analysis, we present financial data for three years 2012 to 2014.26
Divisional structures
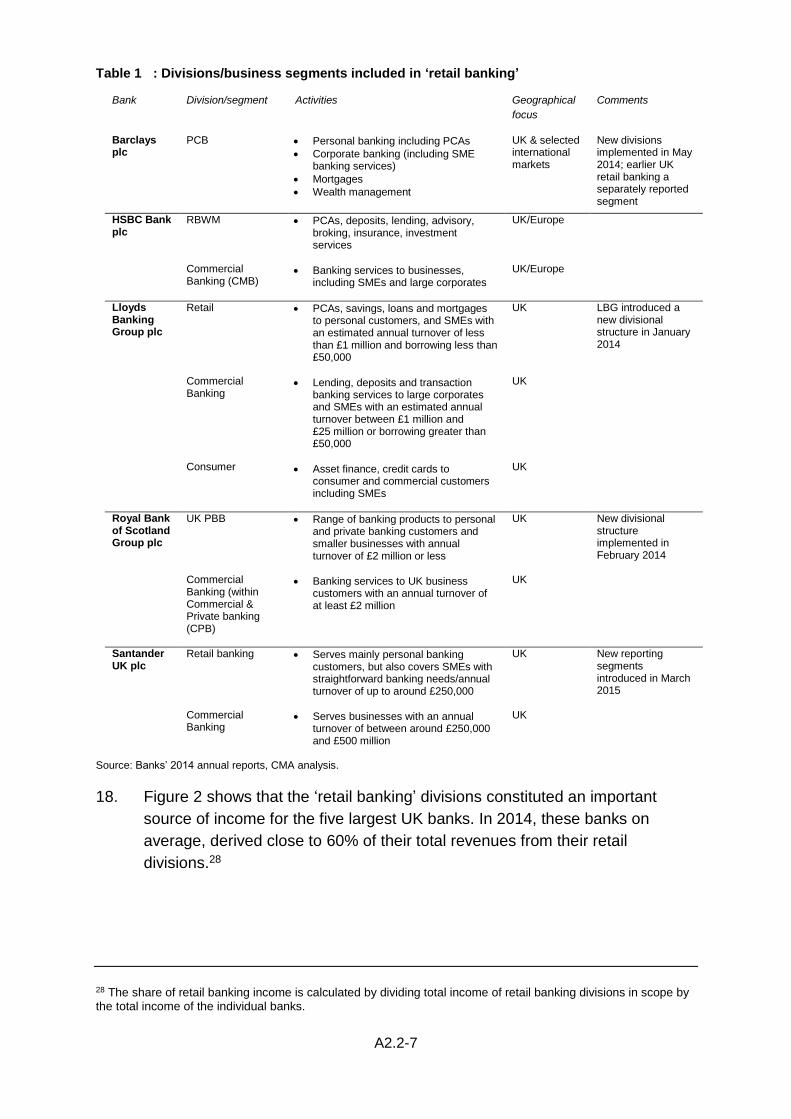
17. Table 1 shows the business divisions or segments of the five largest UK
banks that provide retail banking services, including PCA and SME banking. It
shows that banks’ divisional structures vary considerably, and do not align
with the definitions of PCA and SME banking services in our terms of
reference. For our analysis, we report results of the main banking divisions in
Table 1 that provide retail banking services in the UK.27
25 These exceptional items can be large (eg PPI remediation), thus increasing the difficulty in comparing financial results across banks. 26 We would have liked to present data across a wider time period/full economic cycle, but this was not possible due to the lack of comparability between years and banks due to changes in the banks’ reporting structure, as the time period increases. 27 From the divisions listed in Table 1, we exclude from our analysis, LBG’s consumer division and Santander’s commercial banking division. These divisions contribute a relatively lower proportion of these banks’ total income.
A2.2-7
Table 1 : Divisions/business segments included in ‘retail banking’
Bank Division/segment Activities Geographical
focus
Comments
Barclays plc
PCB Personal banking including PCAs
Corporate banking (including SME banking services)
Mortgages
Wealth management
UK & selected international markets
New divisions implemented in May 2014; earlier UK retail banking a separately reported segment
HSBC Bank plc
RBWM Commercial Banking (CMB)
PCAs, deposits, lending, advisory, broking, insurance, investment services
Banking services to businesses, including SMEs and large corporates
UK/Europe UK/Europe
Lloyds Banking Group plc
Retail Commercial Banking Consumer
PCAs, savings, loans and mortgages to personal customers, and SMEs with an estimated annual turnover of less than £1 million and borrowing less than £50,000
Lending, deposits and transaction banking services to large corporates and SMEs with an estimated annual turnover between £1 million and £25 million or borrowing greater than £50,000
Asset finance, credit cards to consumer and commercial customers including SMEs
UK UK UK
LBG introduced a new divisional structure in January 2014
Royal Bank of Scotland Group plc
UK PBB Commercial Banking (within Commercial & Private banking (CPB)
Range of banking products to personal and private banking customers and smaller businesses with annual turnover of £2 million or less
Banking services to UK business customers with an annual turnover of at least £2 million
UK UK
New divisional structure implemented in February 2014
Santander UK plc
Retail banking Commercial Banking
Serves mainly personal banking customers, but also covers SMEs with straightforward banking needs/annual turnover of up to around £250,000
Serves businesses with an annual turnover of between around £250,000 and £500 million
UK UK
New reporting segments introduced in March 2015
Source: Banks’ 2014 annual reports, CMA analysis.
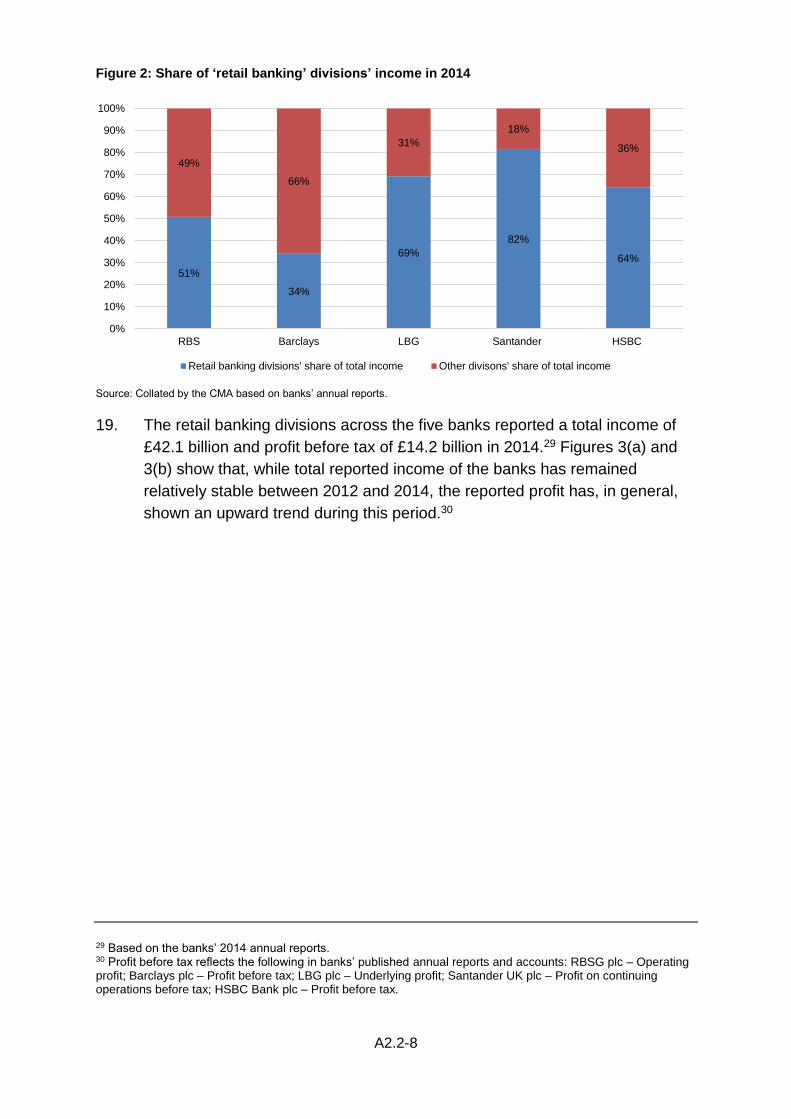
18. Figure 2 shows that the ‘retail banking’ divisions constituted an important
source of income for the five largest UK banks. In 2014, these banks on
average, derived close to 60% of their total revenues from their retail
divisions.28
28 The share of retail banking income is calculated by dividing total income of retail banking divisions in scope by the total income of the individual banks.
A2.2-8
Figure 2: Share of ‘retail banking’ divisions’ income in 2014
Source: Collated by the CMA based on banks’ annual reports.
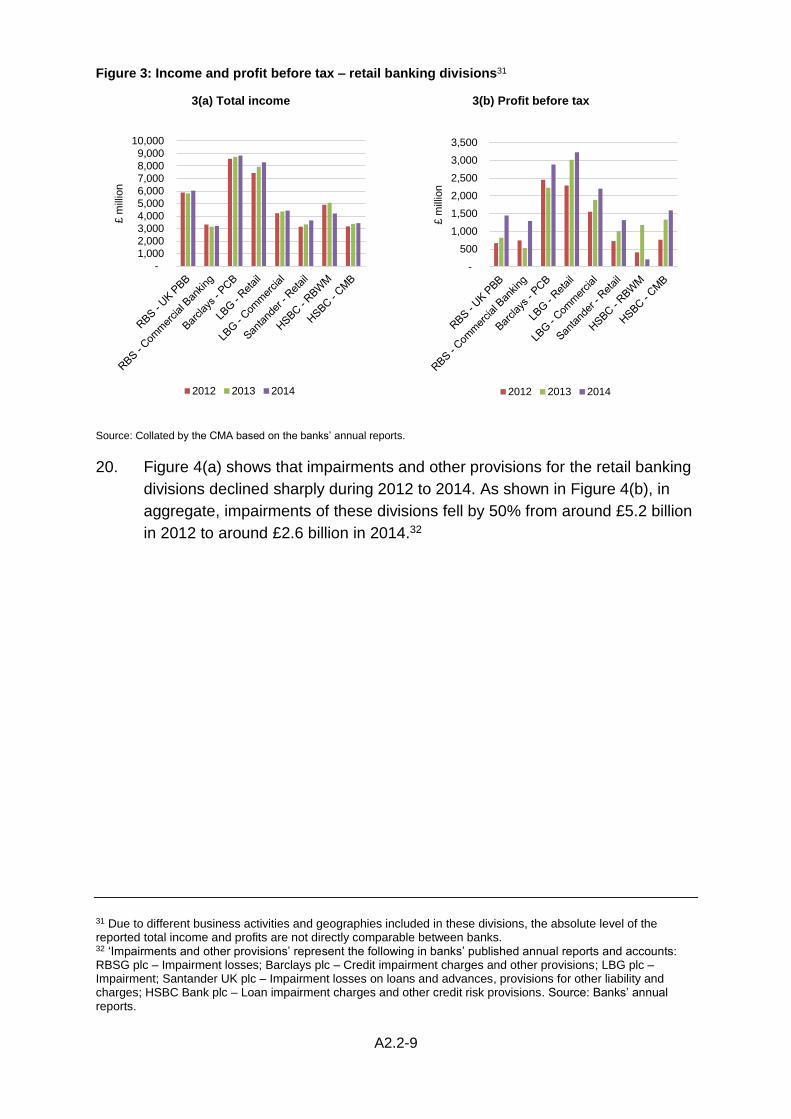
19. The retail banking divisions across the five banks reported a total income of
£42.1 billion and profit before tax of £14.2 billion in 2014.29 Figures 3(a) and
3(b) show that, while total reported income of the banks has remained
relatively stable between 2012 and 2014, the reported profit has, in general,
shown an upward trend during this period.30
29 Based on the banks’ 2014 annual reports. 30 Profit before tax reflects the following in banks’ published annual reports and accounts: RBSG plc – Operating profit; Barclays plc – Profit before tax; LBG plc – Underlying profit; Santander UK plc – Profit on continuing operations before tax; HSBC Bank plc – Profit before tax.
51%
34%
69%
82%
64%
49%
66%
31%
18%
36%
0%
10%
20%
30%
40%
50%
60%
70%
80%
90%
100%
RBS Barclays LBG Santander HSBC
Retail banking divisions' share of total income Other divisons' share of total income
A2.2-9
Figure 3: Income and profit before tax – retail banking divisions31
3(a) Total income 3(b) Profit before tax
Source: Collated by the CMA based on the banks’ annual reports.
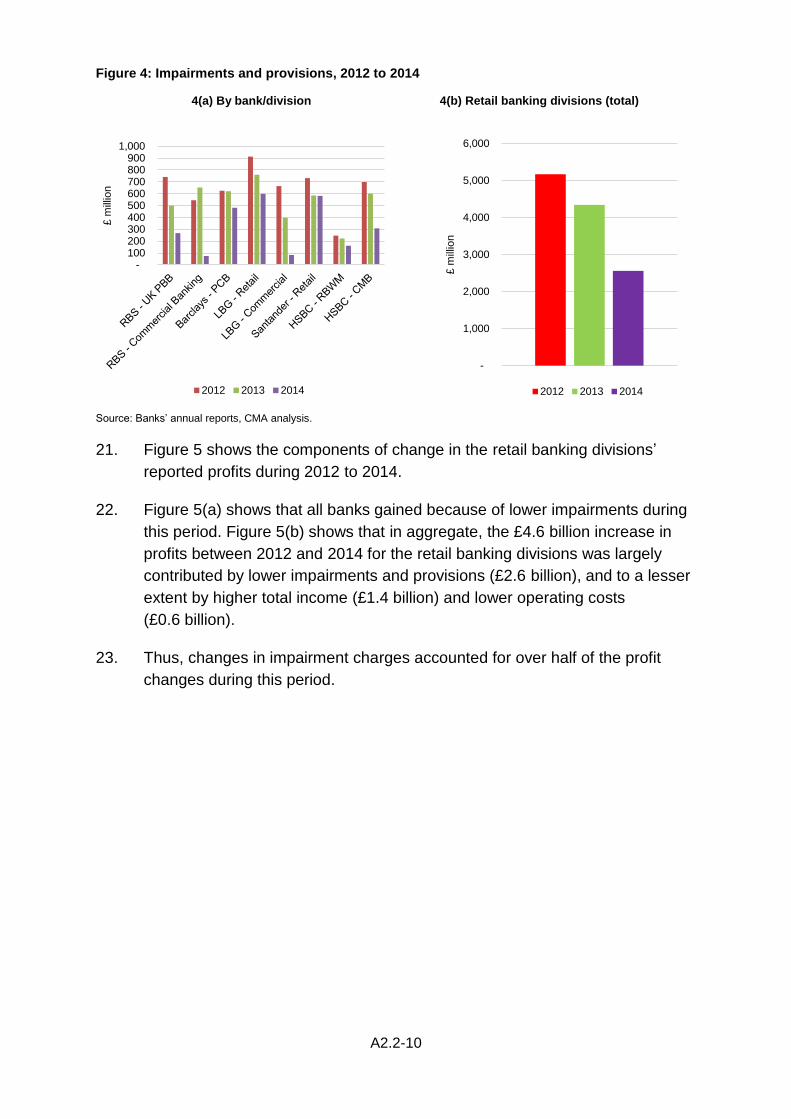
20. Figure 4(a) shows that impairments and other provisions for the retail banking
divisions declined sharply during 2012 to 2014. As shown in Figure 4(b), in
aggregate, impairments of these divisions fell by 50% from around £5.2 billion
in 2012 to around £2.6 billion in 2014.32
31 Due to different business activities and geographies included in these divisions, the absolute level of the reported total income and profits are not directly comparable between banks. 32 ‘Impairments and other provisions’ represent the following in banks’ published annual reports and accounts: RBSG plc – Impairment losses; Barclays plc – Credit impairment charges and other provisions; LBG plc – Impairment; Santander UK plc – Impairment losses on loans and advances, provisions for other liability and charges; HSBC Bank plc – Loan impairment charges and other credit risk provisions. Source: Banks’ annual reports.
- 1,000 2,000 3,000
4,000 5,000 6,000 7,000 8,000
9,000 10,000
£ m
illio
n
2012 2013 2014
-
500
1,000
1,500
2,000
2,500
3,000
3,500
£ m
illio
n
2012 2013 2014
A2.2-10
Figure 4: Impairments and provisions, 2012 to 2014
4(a) By bank/division 4(b) Retail banking divisions (total)
Source: Banks’ annual reports, CMA analysis.
21. Figure 5 shows the components of change in the retail banking divisions’
reported profits during 2012 to 2014.
22. Figure 5(a) shows that all banks gained because of lower impairments during
this period. Figure 5(b) shows that in aggregate, the £4.6 billion increase in
profits between 2012 and 2014 for the retail banking divisions was largely
contributed by lower impairments and provisions (£2.6 billion), and to a lesser
extent by higher total income (£1.4 billion) and lower operating costs
(£0.6 billion).
23. Thus, changes in impairment charges accounted for over half of the profit
changes during this period.
- 100 200 300 400 500 600 700 800 900
1,000
£ m
illio
n
2012 2013 2014
-
1,000
2,000
3,000
4,000
5,000
6,000
£ m
illio
n
2012 2013 2014
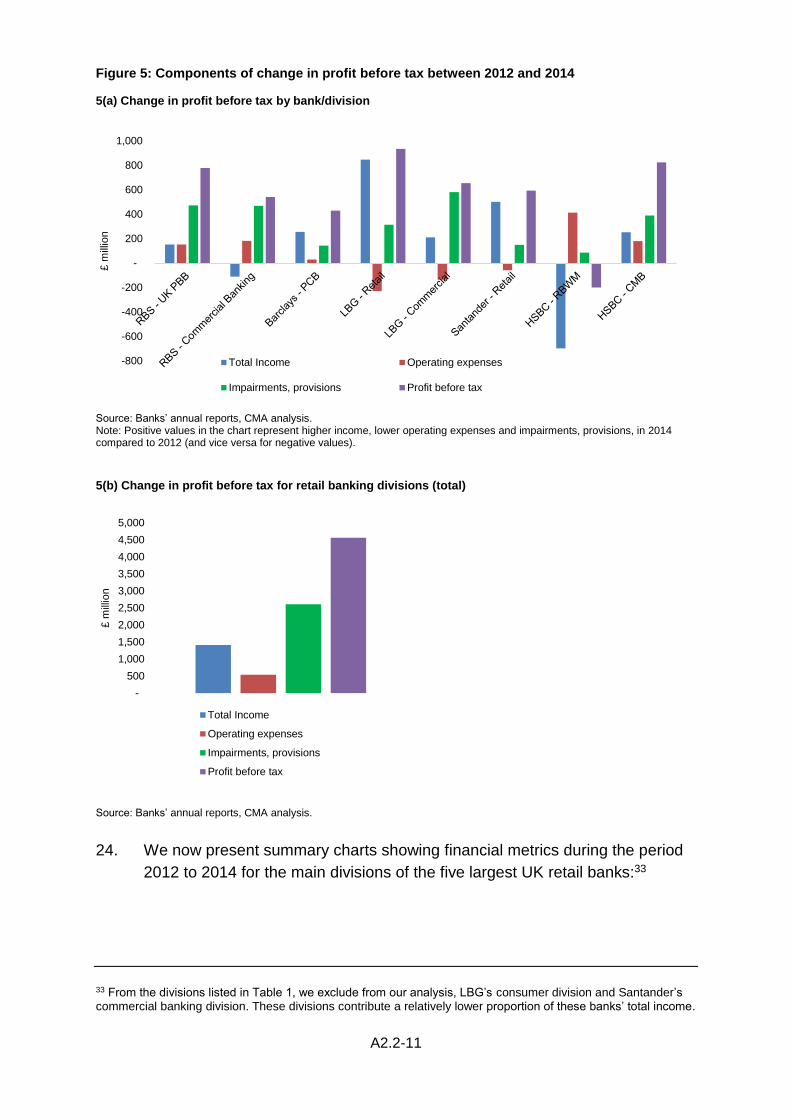
A2.2-11
Figure 5: Components of change in profit before tax between 2012 and 2014
5(a) Change in profit before tax by bank/division
Source: Banks’ annual reports, CMA analysis. Note: Positive values in the chart represent higher income, lower operating expenses and impairments, provisions, in 2014 compared to 2012 (and vice versa for negative values).
5(b) Change in profit before tax for retail banking divisions (total)
Source: Banks’ annual reports, CMA analysis.
24. We now present summary charts showing financial metrics during the period
2012 to 2014 for the main divisions of the five largest UK retail banks:33
33 From the divisions listed in Table 1, we exclude from our analysis, LBG’s consumer division and Santander’s commercial banking division. These divisions contribute a relatively lower proportion of these banks’ total income.
-800
-600
-400
-200
-
200
400
600
800
1,000
£ m
illio
n
Total Income Operating expenses
Impairments, provisions Profit before tax
-
500
1,000
1,500
2,000
2,500
3,000
3,500
4,000
4,500
5,000
£ m
illio
n
Total Income
Operating expenses
Impairments, provisions
Profit before tax
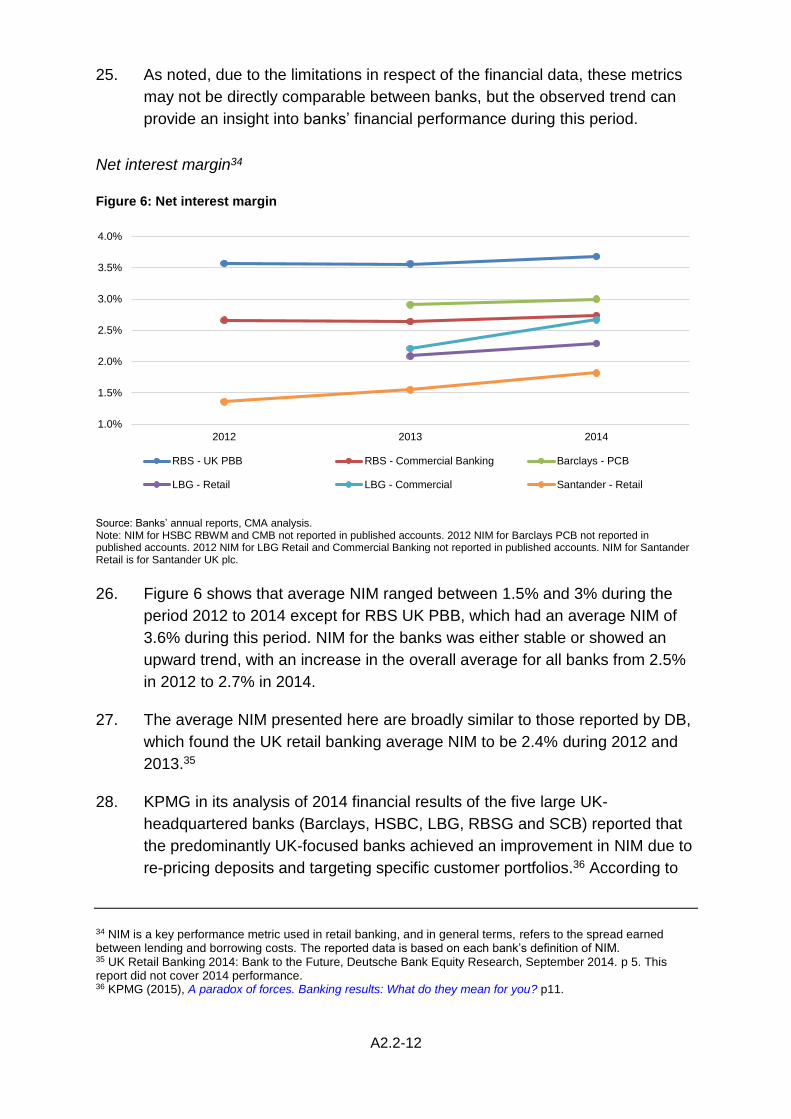
A2.2-12
25. As noted, due to the limitations in respect of the financial data, these metrics
may not be directly comparable between banks, but the observed trend can
provide an insight into banks’ financial performance during this period.
Net interest margin34
Figure 6: Net interest margin
Source: Banks’ annual reports, CMA analysis. Note: NIM for HSBC RBWM and CMB not reported in published accounts. 2012 NIM for Barclays PCB not reported in published accounts. 2012 NIM for LBG Retail and Commercial Banking not reported in published accounts. NIM for Santander Retail is for Santander UK plc.
26. Figure 6 shows that average NIM ranged between 1.5% and 3% during the
period 2012 to 2014 except for RBS UK PBB, which had an average NIM of
3.6% during this period. NIM for the banks was either stable or showed an
upward trend, with an increase in the overall average for all banks from 2.5%
in 2012 to 2.7% in 2014.
27. The average NIM presented here are broadly similar to those reported by DB,
which found the UK retail banking average NIM to be 2.4% during 2012 and
2013.35
28. KPMG in its analysis of 2014 financial results of the five large UK-
headquartered banks (Barclays, HSBC, LBG, RBSG and SCB) reported that
the predominantly UK-focused banks achieved an improvement in NIM due to
re-pricing deposits and targeting specific customer portfolios.36 According to
34 NIM is a key performance metric used in retail banking, and in general terms, refers to the spread earned between lending and borrowing costs. The reported data is based on each bank’s definition of NIM. 35 UK Retail Banking 2014: Bank to the Future, Deutsche Bank Equity Research, September 2014. p 5. This report did not cover 2014 performance. 36 KPMG (2015), A paradox of forces. Banking results: What do they mean for you? p11.
1.0%
1.5%
2.0%
2.5%
3.0%
3.5%
4.0%
2012 2013 2014
RBS - UK PBB RBS - Commercial Banking Barclays - PCB
LBG - Retail LBG - Commercial Santander - Retail
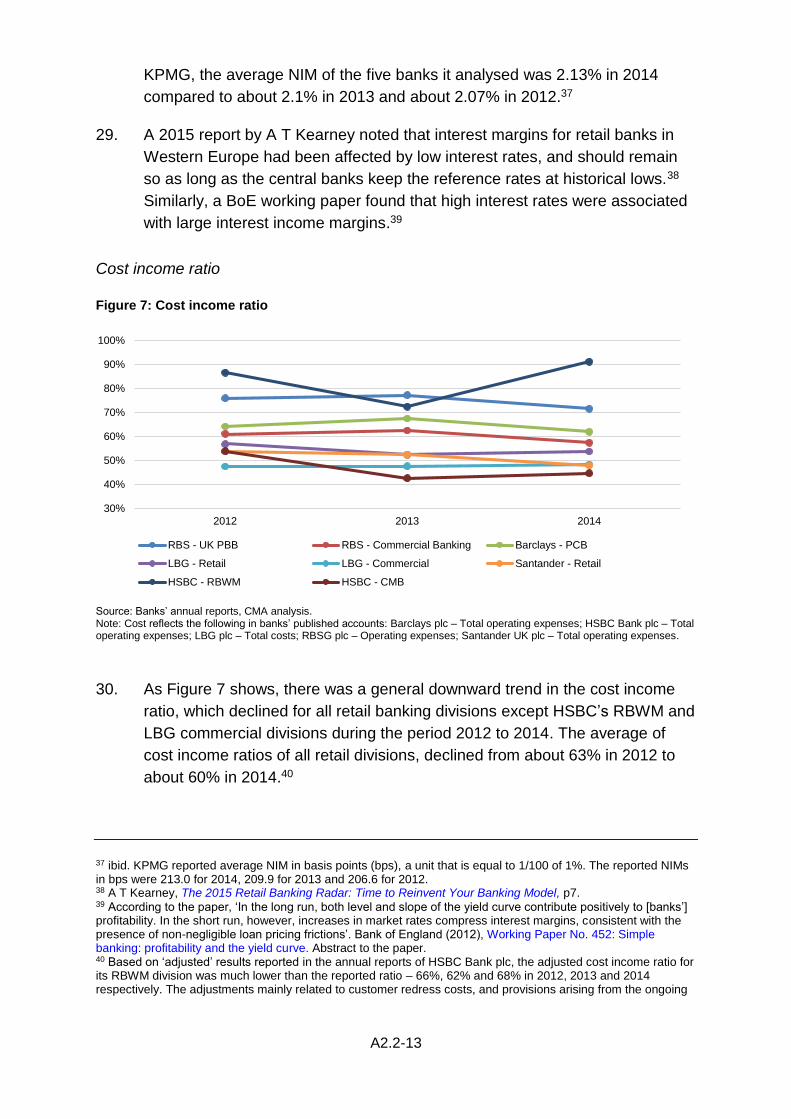
A2.2-13
KPMG, the average NIM of the five banks it analysed was 2.13% in 2014
compared to about 2.1% in 2013 and about 2.07% in 2012.37
29. A 2015 report by A T Kearney noted that interest margins for retail banks in
Western Europe had been affected by low interest rates, and should remain
so as long as the central banks keep the reference rates at historical lows.38
Similarly, a BoE working paper found that high interest rates were associated
with large interest income margins.39
Cost income ratio
Figure 7: Cost income ratio
Source: Banks’ annual reports, CMA analysis. Note: Cost reflects the following in banks’ published accounts: Barclays plc – Total operating expenses; HSBC Bank plc – Total operating expenses; LBG plc – Total costs; RBSG plc – Operating expenses; Santander UK plc – Total operating expenses.
30. As Figure 7 shows, there was a general downward trend in the cost income
ratio, which declined for all retail banking divisions except HSBC’s RBWM and
LBG commercial divisions during the period 2012 to 2014. The average of
cost income ratios of all retail divisions, declined from about 63% in 2012 to
about 60% in 2014.40
37 ibid. KPMG reported average NIM in basis points (bps), a unit that is equal to 1/100 of 1%. The reported NIMs in bps were 213.0 for 2014, 209.9 for 2013 and 206.6 for 2012. 38 A T Kearney, The 2015 Retail Banking Radar: Time to Reinvent Your Banking Model, p7. 39 According to the paper, ‘In the long run, both level and slope of the yield curve contribute positively to [banks’] profitability. In the short run, however, increases in market rates compress interest margins, consistent with the presence of non-negligible loan pricing frictions’. Bank of England (2012), Working Paper No. 452: Simple banking: profitability and the yield curve. Abstract to the paper. 40 Based on ‘adjusted’ results reported in the annual reports of HSBC Bank plc, the adjusted cost income ratio for its RBWM division was much lower than the reported ratio – 66%, 62% and 68% in 2012, 2013 and 2014 respectively. The adjustments mainly related to customer redress costs, and provisions arising from the ongoing
30%
40%
50%
60%
70%
80%
90%
100%
2012 2013 2014
RBS - UK PBB RBS - Commercial Banking Barclays - PCB
LBG - Retail LBG - Commercial Santander - Retail
HSBC - RBWM HSBC - CMB
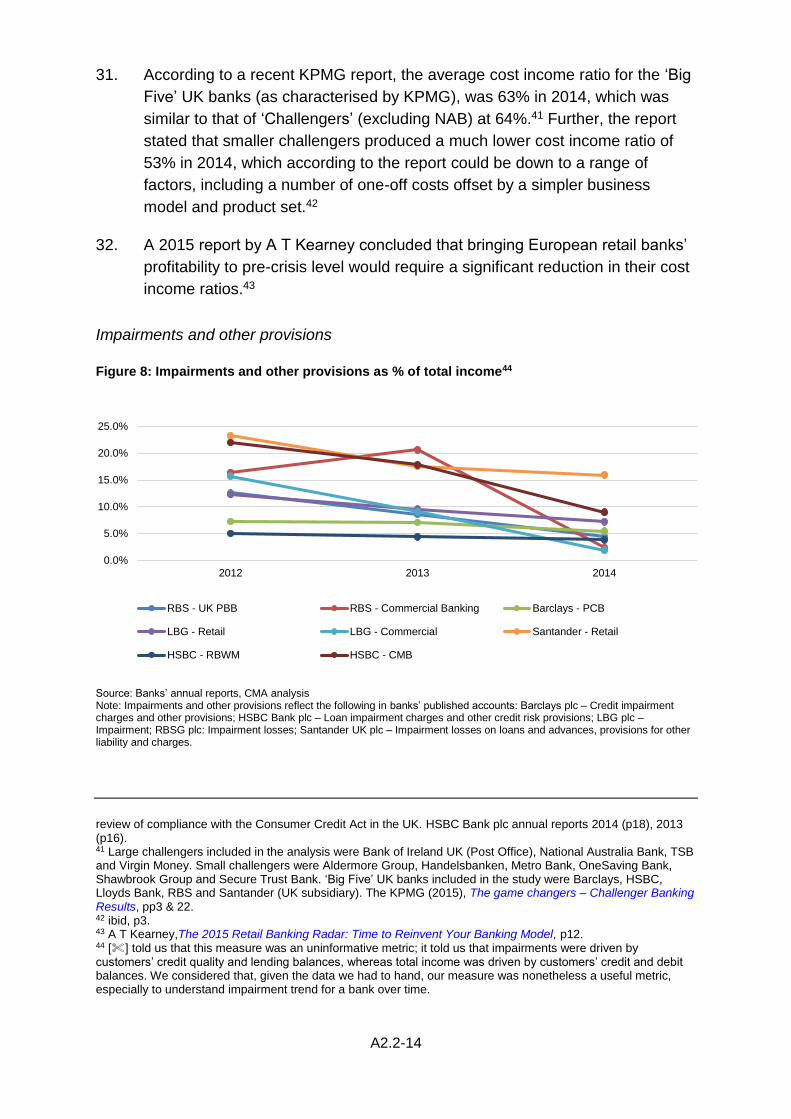
A2.2-14
31. According to a recent KPMG report, the average cost income ratio for the ‘Big
Five’ UK banks (as characterised by KPMG), was 63% in 2014, which was
similar to that of ‘Challengers’ (excluding NAB) at 64%.41 Further, the report
stated that smaller challengers produced a much lower cost income ratio of
53% in 2014, which according to the report could be down to a range of
factors, including a number of one-off costs offset by a simpler business
model and product set.42
32. A 2015 report by A T Kearney concluded that bringing European retail banks’
profitability to pre-crisis level would require a significant reduction in their cost
income ratios.43
Impairments and other provisions
Figure 8: Impairments and other provisions as % of total income44
Source: Banks’ annual reports, CMA analysis Note: Impairments and other provisions reflect the following in banks’ published accounts: Barclays plc – Credit impairment charges and other provisions; HSBC Bank plc – Loan impairment charges and other credit risk provisions; LBG plc – Impairment; RBSG plc: Impairment losses; Santander UK plc – Impairment losses on loans and advances, provisions for other liability and charges.
review of compliance with the Consumer Credit Act in the UK. HSBC Bank plc annual reports 2014 (p18), 2013 (p16). 41 Large challengers included in the analysis were Bank of Ireland UK (Post Office), National Australia Bank, TSB and Virgin Money. Small challengers were Aldermore Group, Handelsbanken, Metro Bank, OneSaving Bank, Shawbrook Group and Secure Trust Bank. ‘Big Five’ UK banks included in the study were Barclays, HSBC, Lloyds Bank, RBS and Santander (UK subsidiary). The KPMG (2015), The game changers – Challenger Banking Results, pp3 & 22. 42 ibid, p3. 43 A T Kearney,The 2015 Retail Banking Radar: Time to Reinvent Your Banking Model, p12. 44 [] told us that this measure was an uninformative metric; it told us that impairments were driven by customers’ credit quality and lending balances, whereas total income was driven by customers’ credit and debit balances. We considered that, given the data we had to hand, our measure was nonetheless a useful metric, especially to understand impairment trend for a bank over time.
0.0%
5.0%
10.0%
15.0%
20.0%
25.0%
2012 2013 2014
RBS - UK PBB RBS - Commercial Banking Barclays - PCB
LBG - Retail LBG - Commercial Santander - Retail
HSBC - RBWM HSBC - CMB
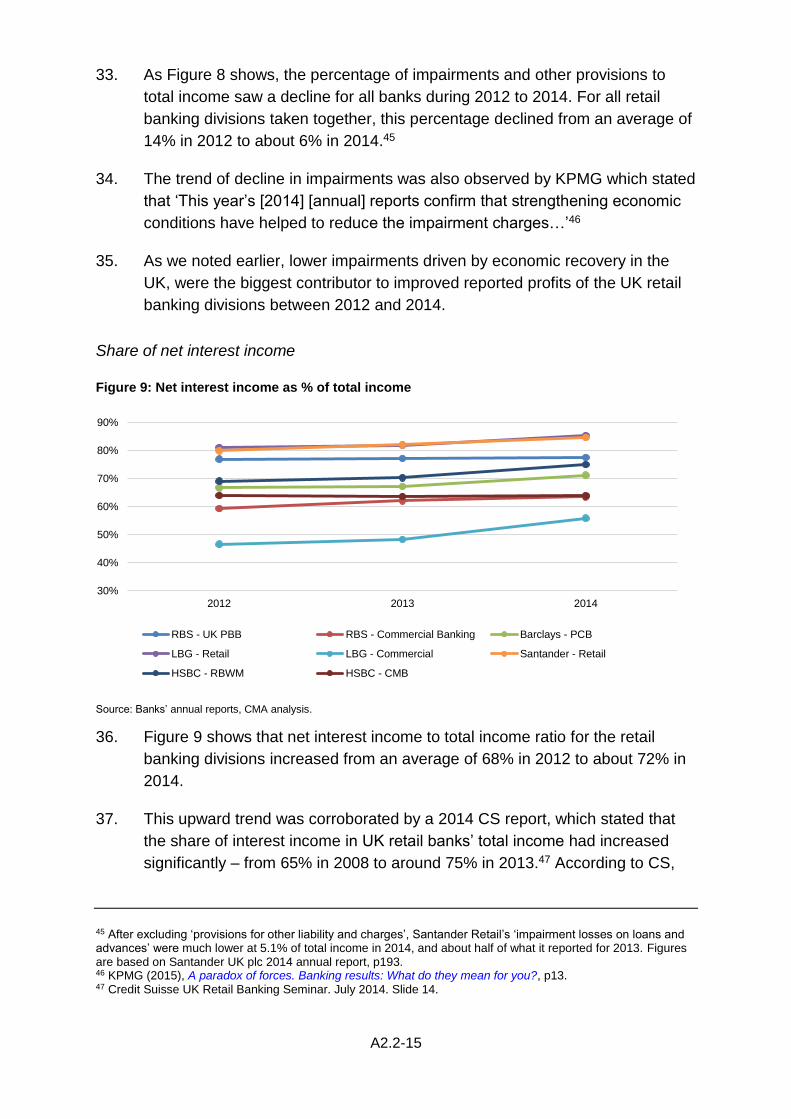
A2.2-15
33. As Figure 8 shows, the percentage of impairments and other provisions to
total income saw a decline for all banks during 2012 to 2014. For all retail
banking divisions taken together, this percentage declined from an average of
14% in 2012 to about 6% in 2014.45
34. The trend of decline in impairments was also observed by KPMG which stated
that ‘This year’s [2014] [annual] reports confirm that strengthening economic
conditions have helped to reduce the impairment charges…’46
35. As we noted earlier, lower impairments driven by economic recovery in the
UK, were the biggest contributor to improved reported profits of the UK retail
banking divisions between 2012 and 2014.
Share of net interest income
Figure 9: Net interest income as % of total income
Source: Banks’ annual reports, CMA analysis.
36. Figure 9 shows that net interest income to total income ratio for the retail
banking divisions increased from an average of 68% in 2012 to about 72% in
2014.
37. This upward trend was corroborated by a 2014 CS report, which stated that
the share of interest income in UK retail banks’ total income had increased
significantly – from 65% in 2008 to around 75% in 2013.47 According to CS,
45 After excluding ‘provisions for other liability and charges’, Santander Retail’s ‘impairment losses on loans and advances’ were much lower at 5.1% of total income in 2014, and about half of what it reported for 2013. Figures are based on Santander UK plc 2014 annual report, p193. 46 KPMG (2015), A paradox of forces. Banking results: What do they mean for you?, p13. 47 Credit Suisse UK Retail Banking Seminar. July 2014. Slide 14.
30%
40%
50%
60%
70%
80%
90%
2012 2013 2014
RBS - UK PBB RBS - Commercial Banking Barclays - PCB
LBG - Retail LBG - Commercial Santander - Retail
HSBC - RBWM HSBC - CMB
A2.2-16
beyond cyclical trends, ‘there has been a more structural shift in the industry’s
ability to generate peripheral revenues beyond pure interest-related income.’48
38. A T Kearney made a similar point in a recent report, noting that the share of
net interest income relative to total income for European retail banks
continued to be above pre-financial crisis level, as banks struggled to increase
fee-based revenues.49 It stated that ‘Different regulations, such as free current
accounts, lending fee limitations, and caps on interchange fees, have
impacted (and will continue to impact) banks’ ability to generate fee-based
revenues.’50
Return on equity
39. ROE is a commonly used performance metric used by many retail banks in
the UK. However, the methodology used to calculate the ROE, and the
disclosure of ROE at divisional level in the published accounts varies across
banks. Some banks report ROE only at the group rather than divisional level.
Some banks report ROE on a statutory basis, while others also report ROE
after making adjustments for exceptional or non-recurring items. As a result,
there are comparability issues regarding the ROE reported by banks.51
40. Despite these limitations, the trend of ROE can provide an insight into banks’
financial performance over a given period. In Figure 10, we present ROE of
the five largest UK retail banks during 2012 to 2014, as reported in their
annual reports. The reported ROE is for the retail banking divisions where
available, or for the bank as a whole.52
48 ibid. 49 A T Kearney,The 2015 Retail Banking Radar: Time to Reinvent Your Banking Model, p4. 50 ibid. 51 We also note that ROE is an accounting based performance measure, and only one of the indicators of the banks’ underlying profitability. 52 We present data as presented by banks in published annual reports, which reflects their definition and calculation methodology. Barclays ROE reflects PCB’s ‘Return on average equity’, Barclays plc 2014 annual report, p233. HSBC ROE reflects HSBC Bank plc’s ‘Return on average shareholders’ equity of the parent company’, HSBC Bank plc 2014/2013 annual reports, p1. LBG ROE reflects LBG plc’s ‘Underlying return on required equity’, LBG plc 2014 annual report, p39. RBS ROE reflects respective division’s ‘Return on equity’, RBSG plc 2014 annual report, pp130, 138. Santander ROE reflects Santander UK plc’s ‘Return on ordinary shareholders’ funds’, Santander UK plc 2014 annual report, p355.

A2.2-17
Figure 10: Return on equity
Source: Banks’ annual reports. Note: LBG ROE for 2012 not available in published accounts.
41. Figure 10 shows that reported ROE for retail banking divisions improved
during 2012 to 2014. The average reported ROE for all divisions increased
from 7.5% in 2012 to 11.8% in 2014.
42. We also looked at estimates of ROE in selected industry and analyst reports.
These are discussed below.
43. According to Oliver Wyman, the ROE for retail and business banking in the
UK (after excluding PPI redress costs) in 2013 was 20.9%, which was higher
than ROE of 19.6% in 2012.53 54 Oliver Wyman reported that there were
notable differences between the ROE for ‘individuals’ and ‘small business’
segments within retail banking; in the UK, the 2013 ROE (excluding PPI
redress) for these segments was 24% and 15% respectively.55 Oliver Wyman
stated that cost reduction provided the main lever for profit improvement in the
near term in many markets.56
44. According to CS, the ‘Adjusted’ ROE of UK retail banks was approximately
9.9% in 2013 compared to the reported ‘clean’ ROE of 13.2%, after including
53 Oliver Wyman defined ROE as total profit after tax divided by equity. ROE was normalised with capital calculated as a percentage of risk-weighted assets, represented by the average of the Top 5 banks Core Tier 1 ratio. Oliver Wyman (2014), European Retail and Business Banking: Laying the Foundations for Recovery, pp3–4, p24. 54 In a 2012 report, Perspectives on the UK Retail Banking Markett, Oliver Wyman stated that major, full-service retail banking providers were returning about 20% on equity (when removing exceptional charges), p4. Annex B provides ROE from 2004 to 2011 as calculated by Oliver Wyman for UK retail and small business banking. 2011. 55 Oliver Wyman (2014), European Retail and Business Banking: Laying the Foundations for Recovery, p5. 56 ibid, p4.
7.5%8.2%
11.8%
0%
2%
4%
6%
8%
10%
12%
14%
16%
18%
20%
2012 2013 2014
RBS - UK PBB RBS - Commercial Banking Barclays - PCB
LBG Santander UK plc HSBC Bank plc
Average
A2.2-18
the below-the-line items of which a significant portion had become a more
recurrent feature of UK retail banking.57
45. KPMG in its analysis of 2014 financial results of five UK-headquartered banks
stated that although profitability of the five banks had increased in 2014
compared to 2013 driven by lower loan impairments and conduct costs, none
of the banks achieved a ROE of higher than 8%. It also pointed out that costs
remained high on the agenda for UK banks, and that banks were going
through optimisation programmes.58
46. According to a recent (2015) report by EY, UK bankers anticipate that the
industry will report an average ROE of 9.5% in 2015, which would lead the UK
banks to cover their cost of equity (approximately 9.1%) for the first time in six
years.59,60
47. Thus, the ROE estimates in different reports we referred to, varied
substantially. The 2014 Oliver Wyman report stated that the retail banking
industry in the UK has earned high (around 20%) ROE in the recent years
after excluding exceptional items such as PPI redress costs. Estimates
provided by other reports (eg EY, CS and KPMG) were relatively lower, in the
range of about 8% to 13%.61 Some of the reasons for the differences between
these estimates could be due to a combination of the following:
(a) Treatment of conduct penalties and charges; for example Oliver Wyman’s
report excluded PPI redress, while KPMG used the reported results of the
banks, which would have included the effect of conduct penalties and
charges.
(b) Coverage: for example CS’s report covered 13 UK retail banks, while
Oliver Wyman’s report covered ‘the total retail and small business banking
activity [in the UK]…provided by both local and foreign banks’ in a
country.62
(c) Methodology: for example, Oliver Wyman reported ROEs ‘normalised’
with capital calculated as a percentage of risk-weighted assets,
57 These items included bank levies, customer redress and litigation, reinvestment spend and higher capital requirements. Credit Suisse UK Retail Banking Seminar. 14 July 2014. Slides 6 & 7. 58 The ROE represented return on average shareholder’s equity for all banks except for RBS, which represented return on tangible equity, Lloyds which reported return on required equity and SCB, which reported ROE on an underlying basis, KPMG (2015), A paradox of forces. Banking results: What do they mean for you?, pp9–10. 59 EY (2015), European Banking Barometer. 60 A report by the ABI in 2012 had suggested that the cost of equity for retail banking business was in the range of 8% to 10%. ABI (2012), Investibility of UK Banks, p6. 61 Our analysis (Figure 10) showed that UK retail banks’ average reported ROE during 2012 to 2014 was about 9%. 62 Oliver Wyman (2014), European Retail and Business Banking: Laying the Foundations for Recovery, p23.
A2.2-19
represented by the average of the Top 5 banks Core Tier 1 ratio in each
country; other reports did not appear to make a similar adjustment.
48. Due to the differences in definitions and methodology to calculate the banks’
ROE in different reports, we cannot make any definitive conclusions about the
relative profitability of the retail banks in the UK from the data presented here.
However, we note from our analysis, that overall, the retail banks’ reported
ROE (and therefore profitability) has improved during 2012 to 2014, as banks
continued to recover from the financial crisis and gained from lower
impairments.
Conclusion on retail banking financial performance
49. Overall, the general highlights of the financial performance of the retail
banking divisions of the largest five UK banks during 2012 to 2014 were:
(a) stable total income;
(b) stable or increasing NIM;
(c) declining cost income ratio and impairments;
(d) improving profits and returns; and
(e) declining share of non-interest income in banks’ total income.
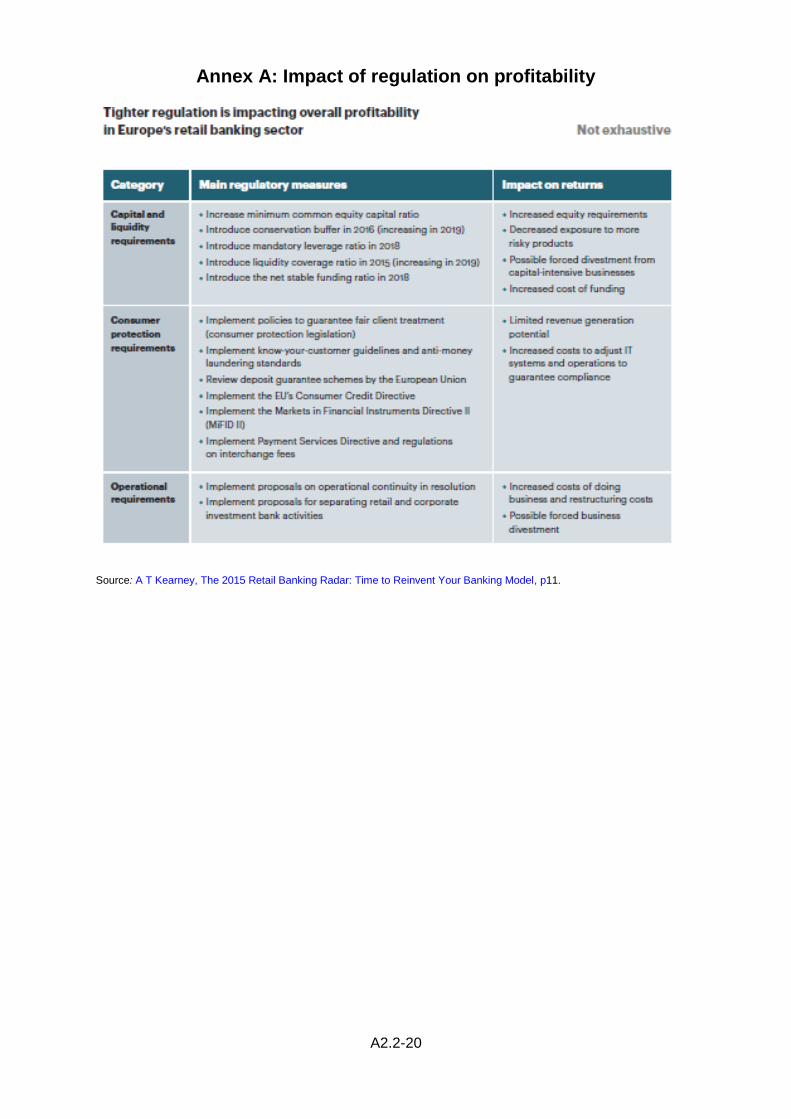
A2.2-20
Annex A: Impact of regulation on profitability
Source: A T Kearney, The 2015 Retail Banking Radar: Time to Reinvent Your Banking Model, p11.

A2.2-21
Annex B: ROE, 2004 to 2011: UK retail and small business banking
Figure 1: Average UK retail banking returns*,†
Source: Oliver Wyman (2012), Perspectives on the UK Retail Banking Market, p3. *Market ROE weighted across banks by asset size. ROEs normalised with capital calculated as 11% of risk-weighted assets and tax rate of 30%. Institutions included: A&L, Barclays, B&B, Co-operative Bank (pre-Verde), HBOS, HSBC, LBG, Nationwide, Northern Rock, Northern Rock Asset Management, RBS, Santander, Tesco, YBS. Note that different banks report on different bases, therefore inclusion and definition of small business banking dependent upon institution specific reporting structures. †Excludes exceptional items and charges (eg PPI charges).