RESULTS AND ACTIVITIES - Enova
142
1 RESULTS AND ACTIVITIES
-
Upload
khangminh22 -
Category
Documents
-
view
1 -
download
0
Transcript of RESULTS AND ACTIVITIES - Enova

1
RESULTS AND ACTIVITIES
2
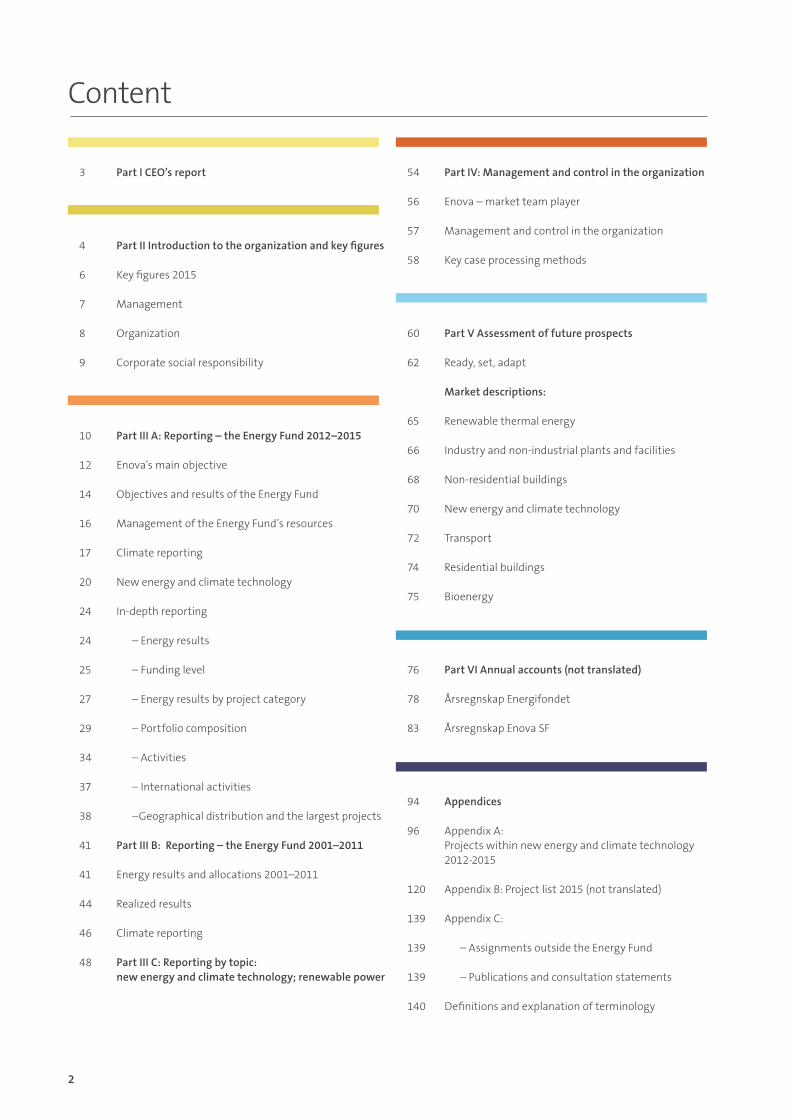
Content
94 Appendices
96 Appendix A: Projects within new energy and climate technology 2012-2015
120 Appendix B: Project list 2015 (not translated) 139 Appendix C:
139 – Assignments outside the Energy Fund
139 – Publications and consultation statements 140 Definitions and explanation of terminology
4 PartIIIntroductiontotheorganizationandkeyfigures
6 Key figures 2015
7 Management
8 Organization
9 Corporate social responsibility
3 PartICEO’sreport
10 PartIIIA:Reporting–theEnergyFund2012–2015
12 Enova’s main objective
14 Objectives and results of the Energy Fund
16 Management of the Energy Fund’s resources
17 Climate reporting
20 New energy and climate technology
24 In-depth reporting
24 – Energy results
25 – Funding level
27 – Energy results by project category
29 – Portfolio composition
34 – Activities
37 – International activities
38 –Geographical distribution and the largest projects
41 PartIIIB:Reporting–theEnergyFund2001–2011
41 Energy results and allocations 2001–2011
44 Realized results
46 Climate reporting
48 PartIIIC:Reportingbytopic: newenergyandclimatetechnology;renewablepower
54 PartIV:Managementandcontrolintheorganization
56 Enova – market team player
57 Management and control in the organization
58 Key case processing methods
60 PartVAssessmentoffutureprospects
62 Ready, set, adapt
Marketdescriptions:
65 Renewable thermal energy
66 Industry and non-industrial plants and facilities
68 Non-residential buildings
70 New energy and climate technology
72 Transport
74 Residential buildings
75 Bioenergy
76 PartVIAnnualaccounts(nottranslated)
78 Årsregnskap Energifondet
83 Årsregnskap Enova SF
3
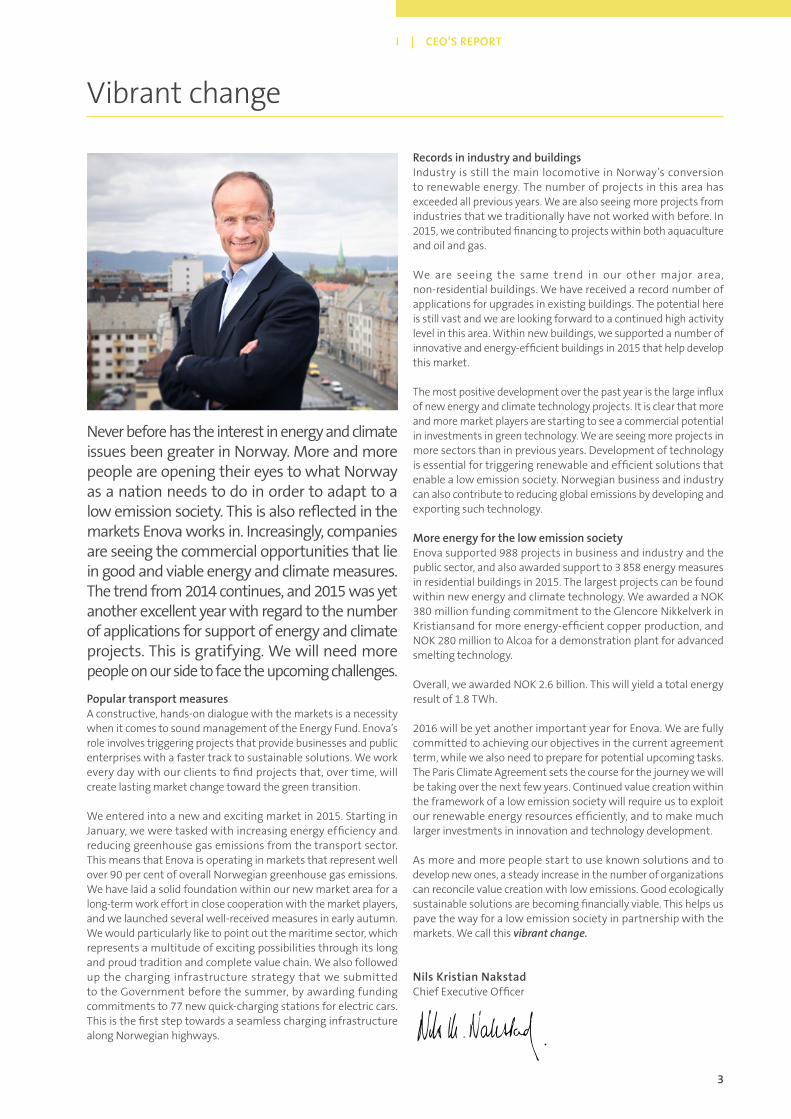
I | CEO’S REPORT
Never before has the interest in energy and climate issues been greater in Norway. More and more people are opening their eyes to what Norway as a nation needs to do in order to adapt to a low emission society. This is also reflected in the markets Enova works in. Increasingly, companies are seeing the commercial opportunities that lie in good and viable energy and climate measures. The trend from 2014 continues, and 2015 was yet another excellent year with regard to the number of applications for support of energy and climate projects. This is gratifying. We will need more people on our side to face the upcoming challenges.
PopulartransportmeasuresA constructive, hands-on dialogue with the markets is a necessity when it comes to sound management of the Energy Fund. Enova’s role involves triggering projects that provide businesses and public enterprises with a faster track to sustainable solutions. We work every day with our clients to find projects that, over time, will create lasting market change toward the green transition.
We entered into a new and exciting market in 2015. Starting in January, we were tasked with increasing energy efficiency and reducing greenhouse gas emissions from the transport sector. This means that Enova is operating in markets that represent well over 90 per cent of overall Norwegian greenhouse gas emissions. We have laid a solid foundation within our new market area for a long-term work effort in close cooperation with the market players, and we launched several well-received measures in early autumn. We would particularly like to point out the maritime sector, which represents a multitude of exciting possibilities through its long and proud tradition and complete value chain. We also followed up the charging infrastructure strategy that we submitted to the Government before the summer, by awarding funding commitments to 77 new quick-charging stations for electric cars. This is the first step towards a seamless charging infrastructure along Norwegian highways.
RecordsinindustryandbuildingsIndustry is still the main locomotive in Norway’s conversion to renewable energy. The number of projects in this area has exceeded all previous years. We are also seeing more projects from industries that we traditionally have not worked with before. In 2015, we contributed financing to projects within both aquaculture and oil and gas.
We are seeing the same trend in our other major area, non-residential buildings. We have received a record number of applications for upgrades in existing buildings. The potential here is still vast and we are looking forward to a continued high activity level in this area. Within new buildings, we supported a number of innovative and energy-efficient buildings in 2015 that help develop this market.
The most positive development over the past year is the large influx of new energy and climate technology projects. It is clear that more and more market players are starting to see a commercial potential in investments in green technology. We are seeing more projects in more sectors than in previous years. Development of technology is essential for triggering renewable and efficient solutions that enable a low emission society. Norwegian business and industry can also contribute to reducing global emissions by developing and exporting such technology.
MoreenergyforthelowemissionsocietyEnova supported 988 projects in business and industry and the public sector, and also awarded support to 3 858 energy measures in residential buildings in 2015. The largest projects can be found within new energy and climate technology. We awarded a NOK 380 million funding commitment to the Glencore Nikkelverk in Kristiansand for more energy-efficient copper production, and NOK 280 million to Alcoa for a demonstration plant for advanced smelting technology.
Overall, we awarded NOK 2.6 billion. This will yield a total energy result of 1.8 TWh.
2016 will be yet another important year for Enova. We are fully committed to achieving our objectives in the current agreement term, while we also need to prepare for potential upcoming tasks. The Paris Climate Agreement sets the course for the journey we will be taking over the next few years. Continued value creation within the framework of a low emission society will require us to exploit our renewable energy resources efficiently, and to make much larger investments in innovation and technology development.
As more and more people start to use known solutions and to develop new ones, a steady increase in the number of organizations can reconcile value creation with low emissions. Good ecologically sustainable solutions are becoming financially viable. This helps us pave the way for a low emission society in partnership with the markets. We call this vibrant change.
NilsKristianNakstadChief Executive Officer
Vibrant change

4

5
PartIIIntroduction to the organization and key figures
4 PartIIIntroductiontotheorganizationandkeyfigures
6 Key figures 2015
7 Management
8 Organization
9 Corporate social responsibility

6
Key figures 2015
Fylker
ProjectsdistributedaccordingtosizeinGWh
In 2015, Enova supported projects with a total energy result of 1.8 TWh through the Energy Fund, distributed among energy efficiency measures, conversion and increased utilization of renewable energy.
136 GWh
45 GWh
47 GWh
26 GWh
79 GWh
65 GWh
31 GWh
76 GWh
105 GWh
36 GWh4 GWh
9 GWh
68 GWh100 GWh
153 GWh
53 GWh
96 GWh
284 GWh
169 GWh
1
5
13
9
17
3
7
1 11
2 12
3 13
4 14
5 15
6 16
7 17
8 18
9 19
10 20
15
11
19
2
6
14
10
18
4
8
16
12
Did you know that...1.8 TWh corresponds to
the electricity consumption of every household in
Vestfold County.
NEW ENERGY AND CLIMATE TECHNOLOGY
RESIDENTIAL BUILDINGS
NON-RESIDENTIAL BUILDINGS
RENEWABLE HEATING
TRANSPORT
INDUSTRY AND NON-INDUSTRIAL PLANTS AND FACILITIES
The energy result is distributed among the markets by per cent.
5 GWh
20
1-10GWh
10-50GWh
50-100GWh
> 100GWh
< 1GWh
23%
3%
20%
35%
9%
10%
Finnmark Rogaland
Troms Vest-Agder
Nordland Aust-Agder
Nord-Trøndelag Telemark
Sør-Trøndelag Buskerud
MøreogRomsdal Vestfold
Hedmark Østfold
Oppland Oslo
SognogFjordane Akershus
Hordaland Svalbard
In 2015, 54 projects were granted funding commitments from Enova
In 2015, 198 projects and more than 3800 energy measures in residential buildings were granted support from Enova
In 2015, 24 projects were granted support from Enova
In 2015, 225 projects were granted support from Enova
In 2015, 33 projects were granted support from Enova
In 2015, 454 projects were granted support from Enova
723projects
228projects
26projects
3projects
1projects
157
645
546
244
143
* Support was granted to nationwide projects (two or more counties) with an overall energy result of 83 GWh, as well as projects on the continental shelf with an overall energy result of 63 GWh.

7
II | INTRODUCTION TO THE ORGANIZATION AND KEY FIGURES
Management
Nils Kristian Nakstad has been the CEO of Enova since 2008. He is a chartered engineer from the Norwegian University of Science and Technology (NTNU) and has extensive experience from research and industry, including from Sintef, Hydro, ReVolt Technology and participation in the seed capital and venture environment. Nakstad was a member of the Energy Committee that delivered the “Energy Report – value creation, security of supply and the environment” in 2012. He holds multiple board positions, e.g. as a board member in NTNU and deputy chair of the Norwegian Ski Federation’s cross-country committee.
Kvam has been the Marketing Director since 2013. She has an MBA in business administration from Pacific Lutheran University in the US. Kvam was hired by Enova as the Director of the Energy Efficiency Department in August 2010. She has experience as the VP Strategy and Marketing in Powel ASA, and worked as an information director in Trondheim Energi and managing director of Trondheim Energiverk Kraftsalg AS. She is a board member of Energi 21.
Widding has been the Director of Enterprise Management since 2013. She is a chartered economist from the Bodø Graduate School of Business (HHB). She also has a number of courses from the university colleges in Sør-Trøndelag, Bodø and Lillehammer. Widding has previous experience from management positions in the travel industry, project management and several executive positions in EVRY.
Leistad has been the Programme Director since 2013. He has an educational background in resource economics, financing and investment from the Agricultural University of Norway. Leistad was hired by Enova as a senior adviser in 2005. From 2007-2012, he was the Director of the Energy Production Department in Enova. Leistad has experience from the Ministry of Petroleum and Energy, where he worked with administration of various policy instruments related to stationary energy supply and renewable energy, and energy efficiency in particular. He is a member of the programme board for ENERGIX in the Research Council of Norway.
NilsKristianNakstad
Chief Executive Officer
AudhildKvam
Marketing Director
GunnJorunWidding Director of Enterprise Management
ØyvindLeistad Programme Director
8
Organization
Enova’s foremost asset is the expertise of each employee, and the way in which we make use of this through good teamwork.
As an organization, we want to support the individual’s strengths and their desire to do their best. Our values (clear, inspiring, responsible and market-oriented) set guidelines for how we want to conduct ourselves, both within the organization and externally. We exercise value-based management, which means that we seek to integrate these values into all parts of the workday, related to decisions, how we act, prioritization and involvement. We shall stand out as being credible, competent and professional in the market. Important preconditions for achieving this include clear role distribution, delegation of responsibility and close cooperation between the different units in the organization.
Our annual employee survey confirms our good working environment. The employees largely identify with Enova’s values and goals, and we have passionate employees who want to contribute to continuous learning and development. We develop each employee’s expertise through exciting tasks, the chance to work across the organization and through external opportunities. Every employee has an individual development plan. We believe that a good working environment and good relationships with colleagues are important for each person’s development, which is why we facilitate various social measures. We want competent
managers who are good role models in exercising our values. We continuously work on management development based on
exercising values, and developing the strengths of each manager and employee.
Enova aims to have a flexible organization to ensure that we are well-equipped to further develop and expand our mandate. In 2015, we launched the Enova Subsidy, a rights-based programme for households, and we took over Transnova’s tasks of making transport climate-friendly. A majority of Transnova’s employees chose to continue their work in Enova, which we found very positive. Their expertise combined with Enova’s experience from other sectors has contributed to reinvigorated efforts in more climate-friendly transport.
In the transition to 2016, we have started preparing the organization for a new agreement term starting in 2017, through several development projects.
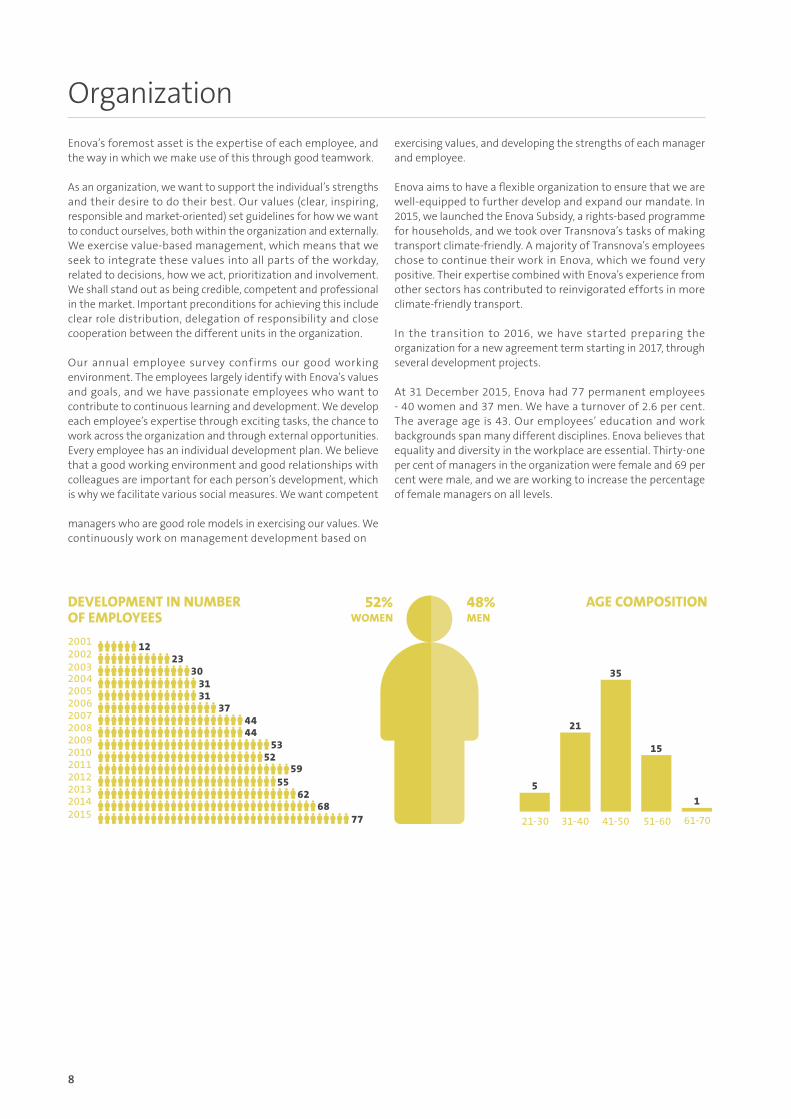
At 31 December 2015, Enova had 77 permanent employees - 40 women and 37 men. We have a turnover of 2.6 per cent. The average age is 43. Our employees’ education and work backgrounds span many different disciplines. Enova believes that equality and diversity in the workplace are essential. Thirty-one per cent of managers in the organization were female and 69 per cent were male, and we are working to increase the percentage of female managers on all levels.
AGE COMPOSITION48%MEN
52%WOMEN
12
53
2330
3131
374444
5259
5562
6877
2001
2009
2002200320042005200620072008
20102011
20132012
20142015
51-60
15
41-50
35
31-40
21
21-30
5
1
61-70
DEVELOPMENT IN NUMBER OF EMPLOYEES
9
II | INTRODUCTION TO THE ORGANIZATION AND KEY FIGURES
Enova creates vibrant change. We will create lasting changes in the availability of and demand for efficient and renewable energy and climate solutions, strengthen the security of supply and contribute to reducing greenhouse gas emissions. With our support, more private and public enterprises can fulfil their social responsibility by making sustainable environmental and climate decisions.
Enova promotes increased knowledge in society about the possibilities of using energy-efficient, environmentally and climate-friendly solutions. We work to change attitudes among both businesses and individuals. We implement measures with the goal of influencing the next generation’s decisions regarding energy and climate. The two most important measures are Nasjonal innovasjonscamp (national innovation camp) in cooperation with Ungt Entreprenørskap for students in upper secondary school and Enova’s Energy Challenge, a learning tool for the intermediate grades in primary and lower secondary school.
Enova works purposefully towards applying our ethical guidelines and values as a guide for ethically responsible behaviour. This is a key element in our organizational and management development. Enova’s procurement processes stipulate requirements for ethical
trade and to prevent social dumping. Enova also facilitates trainee positions for people with special follow-up needs.
Enova works to minimize the company’s impact on the external environment. Enova has offices with low energy consumption and renewable energy sources. In 2015, we worked towards BREEAM certification of our offices, and are cooperating with the property owner regarding measures within energy use, water consumption and waste recycling. We encourage employees to choose environmentally friendly transport to and from work. This reduces our negative impact on the environment.
There were no reported whistleblower cases or other incidents involving breach of sound business practices in 2015. Enova takes an active approach to ensure our work is transparent and open. Ethical business conduct is a fundamental practice for Enova.
Enova will continue its work on corporate social responsibility, ethics and exercise of values in 2016, integrated in objectives, strategies, management of the enterprise and in the management and organizational development. We will work to clarify and exercise this in our work leading up to the new agreement term.
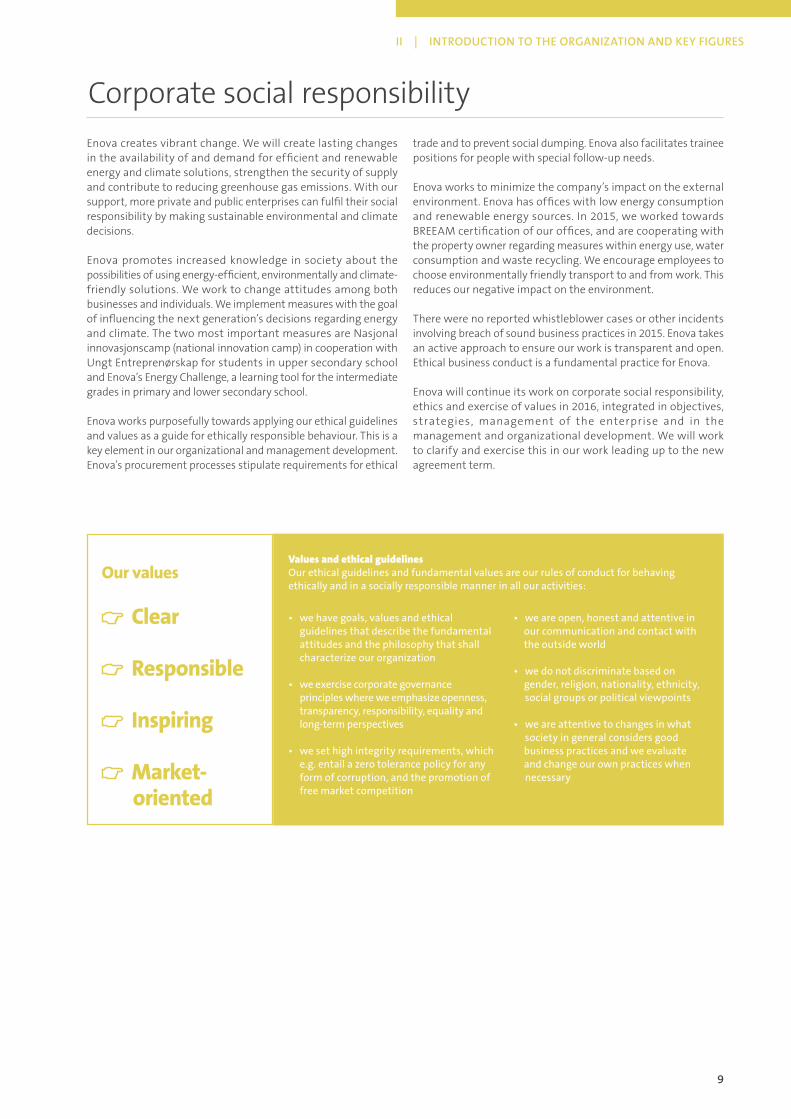
• we have goals, values and ethical guidelines that describe the fundamental attitudes and the philosophy that shall characterize our organization
• we exercise corporate governance principles where we emphasize openness, transparency, responsibility, equality and long-term perspectives
• we set high integrity requirements, which e.g. entail a zero tolerance policy for any form of corruption, and the promotion of free market competition
• we are open, honest and attentive in our communication and contact with the outside world
• we do not discriminate based on gender, religion, nationality, ethnicity,
social groups or political viewpoints
• we are attentive to changes in what society in general considers good
business practices and we evaluate and change our own practices when
necessary
Values and ethical guidelinesOur ethical guidelines and fundamental values are our rules of conduct for behaving ethically and in a socially responsible manner in all our activities:
Our values
Clear
Responsible
Inspiring
Market- oriented
Corporate social responsibility

10

11
PartIIIActivities and results from the year
10 PartIIIA:Reporting–theEnergyFund2012–2015
12 Enova’s main objective
14 Objectives and results of the Energy Fund
16 Management of the Energy Fund’s resources
17 Climate reporting
20 New energy and climate technology
24 In-depth reporting
24 – Energy results
25 – Funding level
27 – Energy results by project category
29 – Portfolio composition
34 – Activities
37 – International activities
38 –Geographical distribution and the largest projects
41 PartIIIB:Reporting–theEnergyFund2001–2011
41 Energy results and allocations 2001–2011
44 Realized results
46 Climate reporting
48 PartIIIC:Reportingbytopic: newenergyandclimatetechnology;renewablepower
12
Enova’s main objective
The objective is described as follows in the agreement between the Ministry of Petroleum and Energy (MPE) and Enova for the period 2012-2016:
The objective of Enova and the Energy Fund is to promote environmentally friendly restructuring of energy end-use and energy production, as well as development of energy and climate technology.
The mandate was expanded from 2015 to include the transport sector.
The objective is elaborated in seven main objectives:
• Development and introduction of new energy and climate
technologies in the market.
• More efficient and flexible use of energy.
• Increased use of other energy carriers than electricity, natural
gas and fuel oil for heating.
• Increased use of new energy resources, including through
energy recovery and bioenergy.
• More well-functioning markets for energy efficient,
environmentally and climate-friendly solutions.
• Increased awareness in society regarding the possibilities of
utilizing energy efficient, environmentally and climate-friendly
solutions.
• Reduced greenhouse gas emissions in the transport sector.
The four first main objectives cover the areas where quantifiable energy results are natural. The main objectives overlap to some extent and cannot be added up to a total sum. The energy result from management of the Energy Fund for the period 2012 to the end of 2016 must constitute at least 7 TWh. The primary goal of investments in new energy and climate technology is that it will contribute to reducing greenhouse gas emissions and support the development of restructuring energy end-use and energy production in the long term by developing and utilizing technologies and new solutions that can contribute to this. The main objective relating to reduced greenhouse gas emissions in the transport sector is new from 2015. Results from transport (climate results) are credited during the agreement term as contributions towards achieving the result goal of 7 TWh.
Mainobjective1:Developmentandintroductionofnewenergyandclimatetechnologiesinthemarket.
This main objective is a direct result of the Climate Agreement in the Storting in 2012. Development of new energy and climate technology is very important in order to solve the global climate challenges. However, these new technologies must reach the market in order to have the desired impact.
With its capital base and proximity to the market, Enova can bring technology initiatives from the pilot phase and over to market
introduction. This is a critical phase for the projects, where they will demonstrate to the market that the technology functions under normal conditions. This is also a capital-intensive phase.
Making it through the critical introduction phase is no guarantee for success in the market. Some technologies succeed and gain a foothold which can be built upon. However, for many technologies, the first encounter with the market will reveal a need to test new approaches and concepts, which may entail having to take one or more steps backwards in the innovation chain. Other technologies are weighed and found wanting in the competition with other technological solutions. When Enova awards support to technology projects, this is with the expectation that many of them will be successful, but not all. Enova cannot pick out the winners in advance. Our role is allowing the technologies to be tested in the market, and then the market can determine the winners.
Enova supported technology development within the industry, non-residential buildings, residential buildings, non-industrial plants and facilities, renewable power, renewable heating and transport markets in 2015. A total of 54 technology projects were granted support. Overall, this amounted to NOK 1.4 billion.
Mainobjective2:Moreefficientandflexibleuseofenergy.
More efficient and flexible use of energy is key in order to strengthen the security of supply in the short and long term, both through reducing peak loads and by increasing the ability to swap energy source based on price and availability.
Improved energy efficiency projects, within buildings and industry in particular, help us achieve this main objective. The choices made with regard to building structure and production processes will determine energy end-use for many years to come. If we do not take advantage of the possibilities available in choosing energy-efficient solutions, we will be bound to unnecessarily high energy consumption for many years in the future. In the same way, many of the choices we make today influence how flexible and robust the energy system will be in the next decades.
Projects within Enova’s support programmes for energy efficiency are fulfilling this main objective. In 2015, Enova supported energy efficiency projects with an energy result of 1 170 GWh. This corresponds to the electricity consumption of every household in Kristiansand and Fredrikstad put together.
Facilitation for use of other energy carriers than electricity, for example through installation of water-borne heating and increased use of district heating, also contributes to increased flexibility in energy systems. This is discussed further below.
Part III A: Reporting – the Energy Fund 2012–2015

13
III A | REPORTING – THE ENERGY FUND 2012–2015
Mainobjective3: Increaseduseofotherenergycarriersthanelectricity,naturalgasandfueloilforheating.
Renewable water-borne heating contributes to increased utilization of energy carriers other than electricity and fossil fuels for heating. This provides increased energy flexibility and more options for efficient utilization of our renewable energy resources. Less use of fossil energy carriers results in a direct climate gain in the form of reduced greenhouse gas emissions. Use of more energy carriers also provides increased energy flexibility and more options for efficient utilization of renewable energy resources. Furthermore, increased use of energy carriers for heating such as bioenergy and district heating will reduce pressure on the power balance during dry and cold years.
Enova’s programmes for district heating and heating plants are particularly aimed at this main objective. In 2015, Enova supported projects with renewable heating corresponding to 367 GWh, of which about 40 per cent was related to conversion. This corresponds to the energy consumption of about 22 000 households.
Mainobjective4:Increaseduseofnewenergyresources,includingthroughenergyrecoveryandbioenergy.
Norway holds a unique position globally with regard to the high percentage of hydropower, and the electricity certificate system will further increase the access to renewable power in Norway. We also have considerable potential for increased energy production from energy resources that are not covered under this system. Conversion to renewable energy resources yields direct climate results. Bioenergy and heat recovery from industry are examples of such resources.
Enova has programmes within industry, heating, non-residential buildings and residential buildings that support this main objective. In 2015, Enova supported projects that, overall, provide 588 GWh in increased utilization of renewable energy sources and carriers. This energy volume corresponds to the energy consumption of the entire city of Drammen.
Mainobjective5:Morewell-functioningmarketsforenergy-efficient,environmentallyandclimate-friendlysolutions.
Enova will make the efficient and environmentally energy options the preferred solutions in the market. By supporting innovators and early users, we create a market development where the good solutions become more competitive as a result of increased demand and reduced unit costs.
Enova has several instruments that will create better markets for future-oriented energy, environmentally and climate-friendly
solutions. Through the subsidy programmes, we increase demand for future-oriented energy solutions in the professional market. Furthermore, we help develop the supply side by testing and making products available to the market. Through energy measures in residences, we are stimulating demand in private households. We are also familiarizing consumers with the good solutions already in the market.
Mainobjective6:Increasedawarenessinsocietyofthepossibilitiesofutilizingenergy-efficient,environmentallyandclimate-friendlysolutions.
Information and knowledge impact our attitudes and our behaviour. Enova therefore pursues systematic and targeted communication measures to increase use of efficient and environmentally friendly energy solutions, through both marketing and visibility in the media. We give advice to households and the professional market to increase awareness regarding environmentally friendly energy solutions, highlight possibilities and trigger measures. Much of this learning takes place through implementation of projects. Enova offers professional advisory services through application processing and client gatherings. In 2015, more than 4 500 private individuals received subsidies after implementing energy measures. Enova targets children and young people through energy and climate learning tools that are used in school. Enova also has a website and a nationwide information and advisory service that reaches a diverse audience through telephone, email and Facebook.
Mainobjective7:Reducedgreenhousegasemissionsinthetransportsector.
Enova’s work within environmentally friendly transport will contribute to reduced greenhouse gas emissions through more environmentally friendly use of energy, more energy-efficient forms of transport and a reduced transport scope. Enova has grouped the transport sector into three parts: land-based passenger transport, land-based freight transport and maritime transport.
Enova established subsidy programmes within all transport groups in 2015. Among other things, Enova supports development of charging infrastructure and onshore power, biofuel production and development of new transport-related energy and climate technology. Currently, Enova does not have a system which enables recording results in greenhouse gas emissions from all transport projects. Energy and climate results have been calculated for transport projects that received funding commitments in 2015, with the exception of projects in the Support for charging infrastructure programme. Overall, these projects contribute 32 ktonnes of CO
2
equivalents in annual reduced greenhouse gas emissions. This volume of greenhouse gases corresponds to about 500 passenger cars that drive to and from Oslo-Trondheim every day.

14
Figure 3.1: The figure shows accumulated energy results distributed by market in the agreement term 2012-2016. The figures are corrected for cancelled and final reported projects.
FIGURE 3.1 OBJECTIVESANDRESULTSOFTHEENERGYFUND
Transport
Industry and non-industrial plants and facilities
Non-residential buildings and residential buildings
Renewable heating and renewable power0
1
2
3
4
5
6
7Goal 2016: 7 TWh
2012 2013 2014 2015 2016
TWh
Objectives and results of the Energy Fund
In 2015, Enova signed project contracts with a total energy result of 1.8 TWh, distributed between 1 348 GWh for ordinary energy projects and 409 GWh for projects within new energy and climate technology. In total, Enova allocated NOK 2.8 billion, of which NOK 1.2 billion went to ordinary energy projects and NOK 1.4 billion went to projects within new energy and climate technology. Compared with 2014, the energy result is seven per cent higher, while financial support declined by 16 per cent. An important reason for this is that the technology projects supported in 2015 yielded higher energy results per krone than in 2014.
The activity level in 2015 was high. Approximately 1 000 projects received funding commitments. Starting in 2015, Enova took over responsibility for transport, in addition to stationary energy consumption. A total of 32 transport-related projects received funding commitments in 2015. The Enova Subsidy is another important programme, which gives homeowners the right to partial reimbursement of their expenses when investing in energy-smart solutions in their residence. About 3 800 homeowners received subsidies in 2015.
Industry delivered good results in 2015. Like the previous year, industry projects contributed the largest energy results in 2015. Industry projects pledged 765 GWh. The ten largest industry projects have double the energy result of the other 211 industry projects. About 40 per cent of Enova’s overall energy results in 2015 came from industry.
The energy result for non-residential buildings showed slight progress compared to the previous year, with 360 GWh pledged. The number of projects increased somewhat in relation to 2014, and market players are showing steady interest. About 20 per cent of Enova’s overall energy results in 2015 came from non-residential buildings.
Transport was a new focus area for Enova in 2015. The first six months were spent preparing new transport strategies and new programmes were launched in the market in the second half of the year. Following a slow start to the year in relation to the number of applications, development was positive throughout the autumn and 260 GWh was pledged in 2015.
Within renewable heating, Enova signed contracts with projects with a total energy result of 176 GWh. The number of projects has dropped, and the energy result is lower than in 2014. The low power prices result in lower profitability in the district heating market and affect the willingness to invest. At the same time, district heating plants in the largest cities have been fully developed, and the applications we receive now are related to expansion and densification.
Enova is seeing increased interest from the market for renewable power, where five projects totalling 34 GWh received support for introduction of new technology in 2015.
The projects within non-industrial plants and facilities contributed 65 GWh in 2015, twice as much as in 2014. The largest supported project is 40 GWh, and constitutes more than 60 per cent of the contractual energy result for non-industrial plants and facilities.
Residential buildings delivered an energy result of 97 GWh in 2015. This market is characterized by many small projects. We also carried out a competition for projects that can map the effect from various communication solutions from digital electricity meters (AMS) on power consumption in Norwegian households. All electricity customers will receive new meters by 2019. These projects represent 54 GWh.
15
III A | REPORTING – THE ENERGY FUND 2012–2015
___________________________
1 Sources: Statistics Norway Economic analyses 4/2015, Statistics Norway’s economic barometer for industry and mines, 4th quarter 2015, Thompson Reuter Datastream, NHO Economic overview 3/2015.
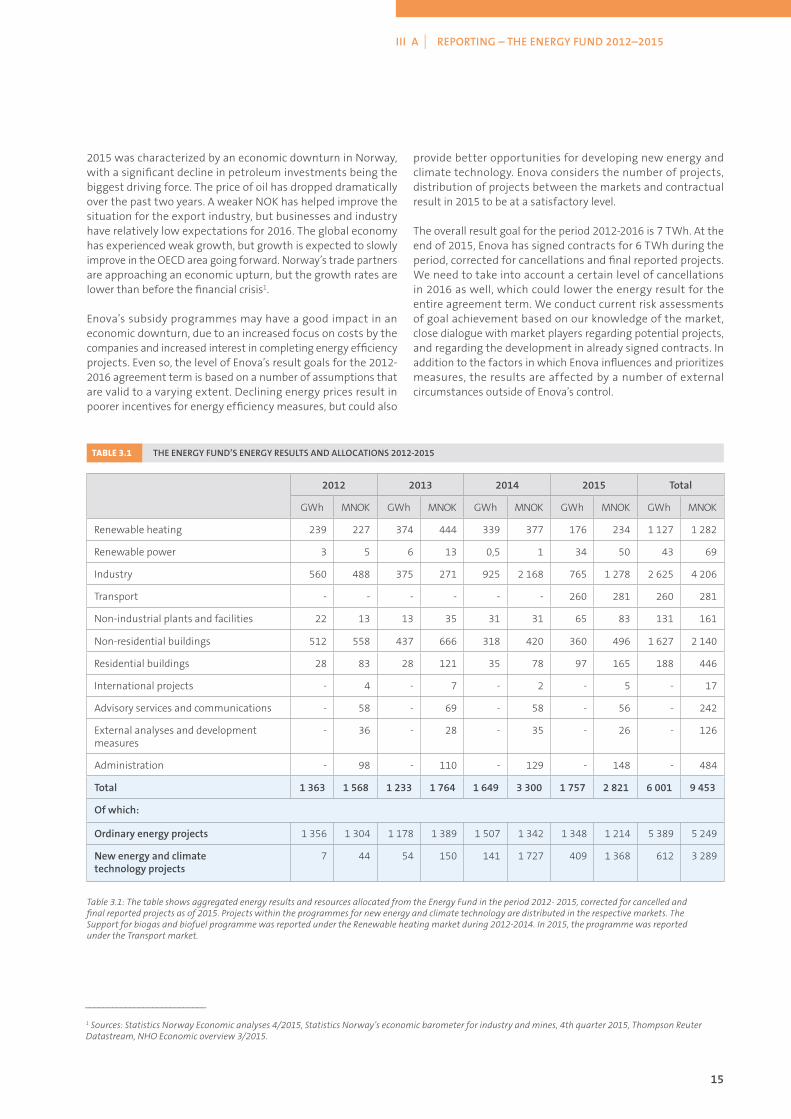
TABLE 3.1 THEENERGYFUND’SENERGYRESULTSANDALLOCATIONS2012-2015
Table 3.1: The table shows aggregated energy results and resources allocated from the Energy Fund in the period 2012- 2015, corrected for cancelled and final reported projects as of 2015. Projects within the programmes for new energy and climate technology are distributed in the respective markets. The Support for biogas and biofuel programme was reported under the Renewable heating market during 2012-2014. In 2015, the programme was reported under the Transport market.
2012 2013 2014 2015 Total
GWh MNOK GWh MNOK GWh MNOK GWh MNOK GWh MNOK
Renewable heating 239 227 374 444 339 377 176 234 1 127 1 282
Renewable power 3 5 6 13 0,5 1 34 50 43 69
Industry 560 488 375 271 925 2 168 765 1 278 2 625 4 206
Transport - - - - - - 260 281 260 281
Non-industrial plants and facilities 22 13 13 35 31 31 65 83 131 161
Non-residential buildings 512 558 437 666 318 420 360 496 1 627 2 140
Residential buildings 28 83 28 121 35 78 97 165 188 446
International projects - 4 - 7 - 2 - 5 - 17
Advisory services and communications - 58 - 69 - 58 - 56 - 242
External analyses and development measures
- 36 - 28 - 35 - 26 - 126
Administration - 98 - 110 - 129 - 148 - 484
Total 1363 1568 1233 1764 1649 3300 1757 2821 6001 9453
Ofwhich:
Ordinaryenergyprojects 1 356 1 304 1 178 1 389 1 507 1 342 1 348 1 214 5 389 5 249
Newenergyandclimatetechnologyprojects
7 44 54 150 141 1 727 409 1 368 612 3 289
2015 was characterized by an economic downturn in Norway, with a significant decline in petroleum investments being the biggest driving force. The price of oil has dropped dramatically over the past two years. A weaker NOK has helped improve the situation for the export industry, but businesses and industry have relatively low expectations for 2016. The global economy has experienced weak growth, but growth is expected to slowly improve in the OECD area going forward. Norway’s trade partners are approaching an economic upturn, but the growth rates are lower than before the financial crisis1. Enova’s subsidy programmes may have a good impact in an economic downturn, due to an increased focus on costs by the companies and increased interest in completing energy efficiency projects. Even so, the level of Enova’s result goals for the 2012-2016 agreement term is based on a number of assumptions that are valid to a varying extent. Declining energy prices result in poorer incentives for energy efficiency measures, but could also
provide better opportunities for developing new energy and climate technology. Enova considers the number of projects, distribution of projects between the markets and contractual result in 2015 to be at a satisfactory level.
The overall result goal for the period 2012-2016 is 7 TWh. At the end of 2015, Enova has signed contracts for 6 TWh during the period, corrected for cancellations and final reported projects. We need to take into account a certain level of cancellations in 2016 as well, which could lower the energy result for the entire agreement term. We conduct current risk assessments of goal achievement based on our knowledge of the market, close dialogue with market players regarding potential projects, and regarding the development in already signed contracts. In addition to the factors in which Enova influences and prioritizes measures, the results are affected by a number of external circumstances outside of Enova’s control.
16
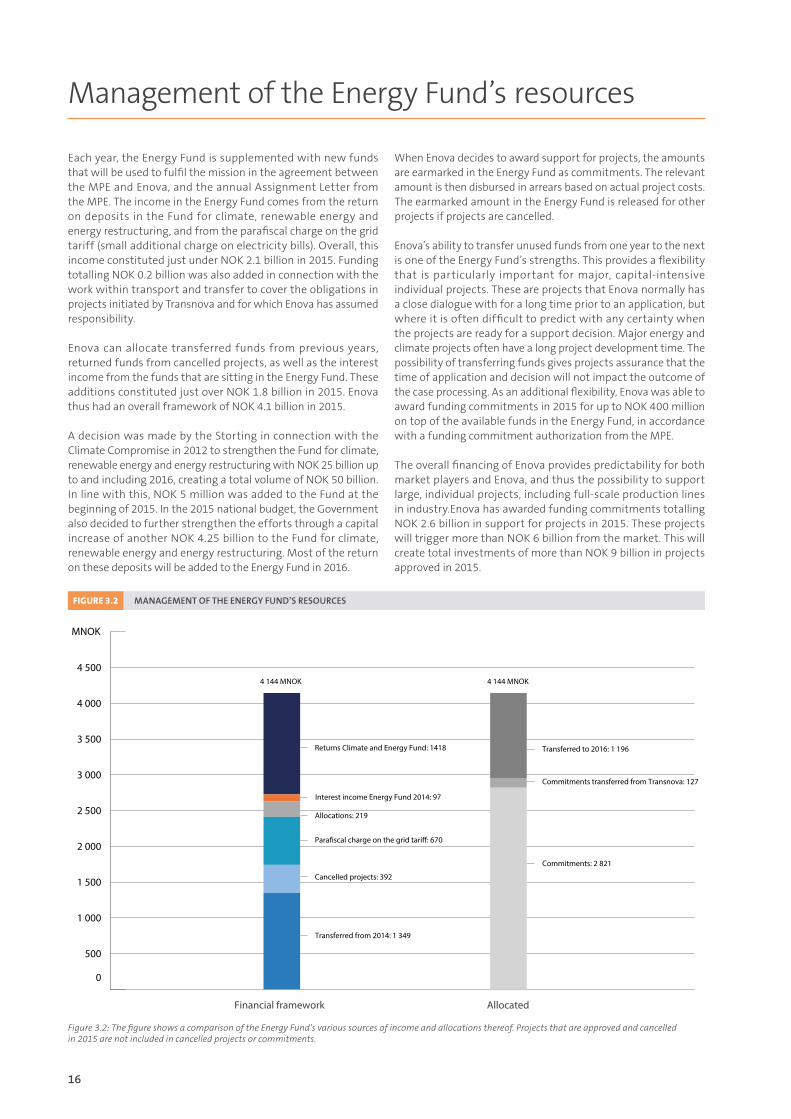
Figure 3.2: The figure shows a comparison of the Energy Fund’s various sources of income and allocations thereof. Projects that are approved and cancelled in 2015 are not included in cancelled projects or commitments.
FIGURE 3.2 MANAGEMENTOFTHEENERGYFUND’SRESOURCES
Financial framework Allocated
0
500
1 000
1 500
2 000
2 500
3 000
3 500
4 000
4 5004 144 MNOK 4 144 MNOK
Returns Climate and Energy Fund: 1418
Allocations: 219
Para�scal charge on the grid tari�: 670
Cancelled projects: 392
Interest income Energy Fund 2014: 97
Transferred from 2014: 1 349
Transferred to 2016: 1 196
Commitments transferred from Transnova: 127
Commitments: 2 821
MNOK
Management of the Energy Fund’s resources
Each year, the Energy Fund is supplemented with new funds that will be used to fulfil the mission in the agreement between the MPE and Enova, and the annual Assignment Letter from the MPE. The income in the Energy Fund comes from the return on deposits in the Fund for climate, renewable energy and energy restructuring, and from the parafiscal charge on the grid tariff (small additional charge on electricity bills). Overall, this income constituted just under NOK 2.1 billion in 2015. Funding totalling NOK 0.2 billion was also added in connection with the work within transport and transfer to cover the obligations in projects initiated by Transnova and for which Enova has assumed responsibility.
Enova can allocate transferred funds from previous years, returned funds from cancelled projects, as well as the interest income from the funds that are sitting in the Energy Fund. These additions constituted just over NOK 1.8 billion in 2015. Enova thus had an overall framework of NOK 4.1 billion in 2015.
A decision was made by the Storting in connection with the Climate Compromise in 2012 to strengthen the Fund for climate, renewable energy and energy restructuring with NOK 25 billion up to and including 2016, creating a total volume of NOK 50 billion. In line with this, NOK 5 million was added to the Fund at the beginning of 2015. In the 2015 national budget, the Government also decided to further strengthen the efforts through a capital increase of another NOK 4.25 billion to the Fund for climate, renewable energy and energy restructuring. Most of the return on these deposits will be added to the Energy Fund in 2016.
When Enova decides to award support for projects, the amounts are earmarked in the Energy Fund as commitments. The relevant amount is then disbursed in arrears based on actual project costs. The earmarked amount in the Energy Fund is released for other projects if projects are cancelled.
Enova’s ability to transfer unused funds from one year to the next is one of the Energy Fund’s strengths. This provides a flexibility that is particularly important for major, capital-intensive individual projects. These are projects that Enova normally has a close dialogue with for a long time prior to an application, but where it is often difficult to predict with any certainty when the projects are ready for a support decision. Major energy and climate projects often have a long project development time. The possibility of transferring funds gives projects assurance that the time of application and decision will not impact the outcome of the case processing. As an additional flexibility, Enova was able to award funding commitments in 2015 for up to NOK 400 million on top of the available funds in the Energy Fund, in accordance with a funding commitment authorization from the MPE.
The overall financing of Enova provides predictability for both market players and Enova, and thus the possibility to support large, individual projects, including full-scale production lines in industry.Enova has awarded funding commitments totalling NOK 2.6 billion in support for projects in 2015. These projects will trigger more than NOK 6 billion from the market. This will create total investments of more than NOK 9 billion in projects approved in 2015.
17
III A | REPORTING – THE ENERGY FUND 2012–2015
Climate reporting
So far, Enova has mainly supported energy projects, but these projects also have climate results. Either because the project entails reduction in fossil fuel consumption, or because the resources released and the technologies developed can replace fossil emissions in other areas. Enova supports technology projects that could, over time, be key in achieving the climate goals in Norway and globally, through spread of the technology. This section presents greenhouse gas accounts for projects supported by Enova in the period 2012-2015.
The climate accounts take a basis in the pledged energy result (kWh) figures for each project and emission factors for the various energy carriers. The results are reported in CO
2 equivalents,
which indicate the combined effect of CO2, as well as other
types of greenhouse gases2. Enova supports measures within the categories: improving energy efficiency, restructuring from electricity and fossil energy sources to renewable energy sources and production/distribution of energy from renewable energy sources. Information about which energy source(s) are replaced in the greenhouse gas accounts is used for restructuring projects. For projects involving development of new production and distribution capacity, we make an assumption regarding which energy source(s) would be used if the project was not carried out. The assumption regarding alternative energy source(s) in the projects is based on price assumptions for electricity and fuel oil3. As an assumption regarding replaced energy is used, there is uncertainty associated with calculation of the climate result in these projects. For 2015, these projects correspond to 63 per cent of the total energy result.
Some of our projects, particularly within the new technology programmes, can contribute to greenhouse gas reductions as a
result of processes that are independent of the pledged kWh. One example is reduction of process emissions, which is reported in Appendix A. Projects within new energy and climate technology 2012-2015.
MethodandassumptionsThe method, scope and assumptions used as a basis for the climate accounts are essential for the calculations and the result achieved. There is a difference if the calculation takes into account a lifecycle perspective where emissions in all project phases are included (construction, operations, realization), or if the calculation only includes emissions related to the operations phase in the projects. Our calculations only take into account changes in greenhouse gas emissions related to the operations phase in the projects. This provides us with an easy way to assess projects, and is quite similar to the national climate accounts.
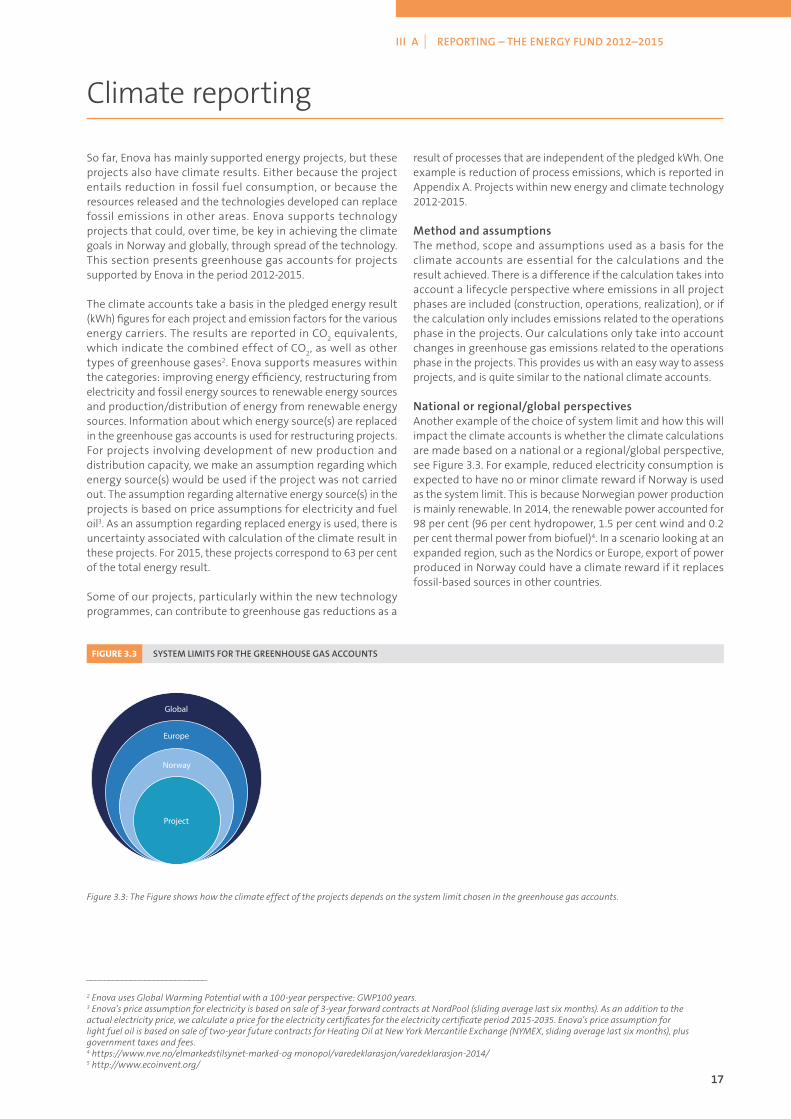
Nationalorregional/globalperspectivesAnother example of the choice of system limit and how this will impact the climate accounts is whether the climate calculations are made based on a national or a regional/global perspective, see Figure 3.3. For example, reduced electricity consumption is expected to have no or minor climate reward if Norway is used as the system limit. This is because Norwegian power production is mainly renewable. In 2014, the renewable power accounted for 98 per cent (96 per cent hydropower, 1.5 per cent wind and 0.2 per cent thermal power from biofuel)4. In a scenario looking at an expanded region, such as the Nordics or Europe, export of power produced in Norway could have a climate reward if it replaces fossil-based sources in other countries.
___________________________
2 Enova uses Global Warming Potential with a 100-year perspective: GWP100 years.3 Enova’s price assumption for electricity is based on sale of 3-year forward contracts at NordPool (sliding average last six months). As an addition to the actual electricity price, we calculate a price for the electricity certificates for the electricity certificate period 2015-2035. Enova’s price assumption for light fuel oil is based on sale of two-year future contracts for Heating Oil at New York Mercantile Exchange (NYMEX, sliding average last six months), plus government taxes and fees.4 https://www.nve.no/elmarkedstilsynet-marked-og monopol/varedeklarasjon/varedeklarasjon-2014/5 http://www.ecoinvent.org/
Figure 3.3: The Figure shows how the climate effect of the projects depends on the system limit chosen in the greenhouse gas accounts.
FIGURE 3.3 SYSTEMLIMITSFORTHEGREENHOUSEGASACCOUNTS
Global
Europe
Norway
Project

18
Enova estimates that the project portfolio from 2015 will contribute to reducing greenhouse gas emissions by about 120 kilotonnes of CO
2 equivalents, while the result so far in the
agreement term is 370 kilotonnes of CO2 equivalents. The results
in Table 3.2 only include reductions in greenhouse gas emissions for measures that reduce fossil fuel consumption. Other effects, for example changes in process emissions triggered through the projects, have not been included, but are reported in Appendix A. Projects within new energy and climate technology 2012-2015.
The industry and transport markets achieve the best climate results in connection with reduced fossil fuel consumption in 2015. Non-residential buildings and renewable heating are next. The results within residential buildings have declined compared
to 2014 as a result of fewer contractual results in connection with phase-out of oil boilers over the past year.
ProjectsfromenterprisessubjecttoquotasintheEU’squotasystemAccording to the Norwegian Environment Agency, 140 Norwegian enterprises in offshore oil and gas, industry and aviation in the EU/EEA area are subject to the EU’s quota system6. About half of Norwegian greenhouse gas emissions come from companies that are part of the quota system. Table 3.3 shows that Enova has supported 39 projects from enterprises subject to quotas in 2015. These projects contributed to reducing greenhouse gas emissions by about 40 kilotonnes of CO
2 equivalents.
___________________________
5 http://www.ecoinvent.org/
Table 3.2: The table shows climate results, measured in CO2 equivalents, achieved in each market for measures that relate to improved energy efficiency in
fossil energy sources or conversion from fossil to renewable energy.
TABLE 3.2 CLIMATERESULTFROMREDUCTIONOFFOSSILFUELSFORPROJECTSAPPROVEDIN2012-2015
Market2015 2012-2015
ktonnes CO2 -eqv. ktonnes CO
2 -eqv.
Renewable heating 13 113
Renewable power - -
Industry 57 154
Transport 32 32
Non-industrial plants and facilities 1 8
Non-residential buildings 16 54
Residential buildings 2 8
Total 120 370
EnergyversusclimateresultsThe projects supported by Enova contribute to achieving the objective of increased security of supply and/or reduced greenhouse gas emissions. For some projects, contributions toward one objective may have a negative impact on the other objective. One example is the projects that involve conversion from electricity to a heating plant with fossil fuels in the energy mix to cover peak loads. Enova only supports the renewable share of the project, but overall, the project will contribute to increased domestic greenhouse gas emissions.
ClimateresultfrommoreefficientfossilfuelconsumptionTable 3.2 shows the estimated volume reduction of greenhouse gas emissions as a result of measures that contribute to direct reductions in consumption of fossil fuels such as coal, oil and natural gas, distributed by market. The calculations were based on the two measures improving efficiency of fossil sources and conversion from fossil to renewable energy. The emission coefficients for the various energy carriers in calculations for the 2012-2015 period came from the Ecoinvent database5.
19
III A | REPORTING – THE ENERGY FUND 2012–2015
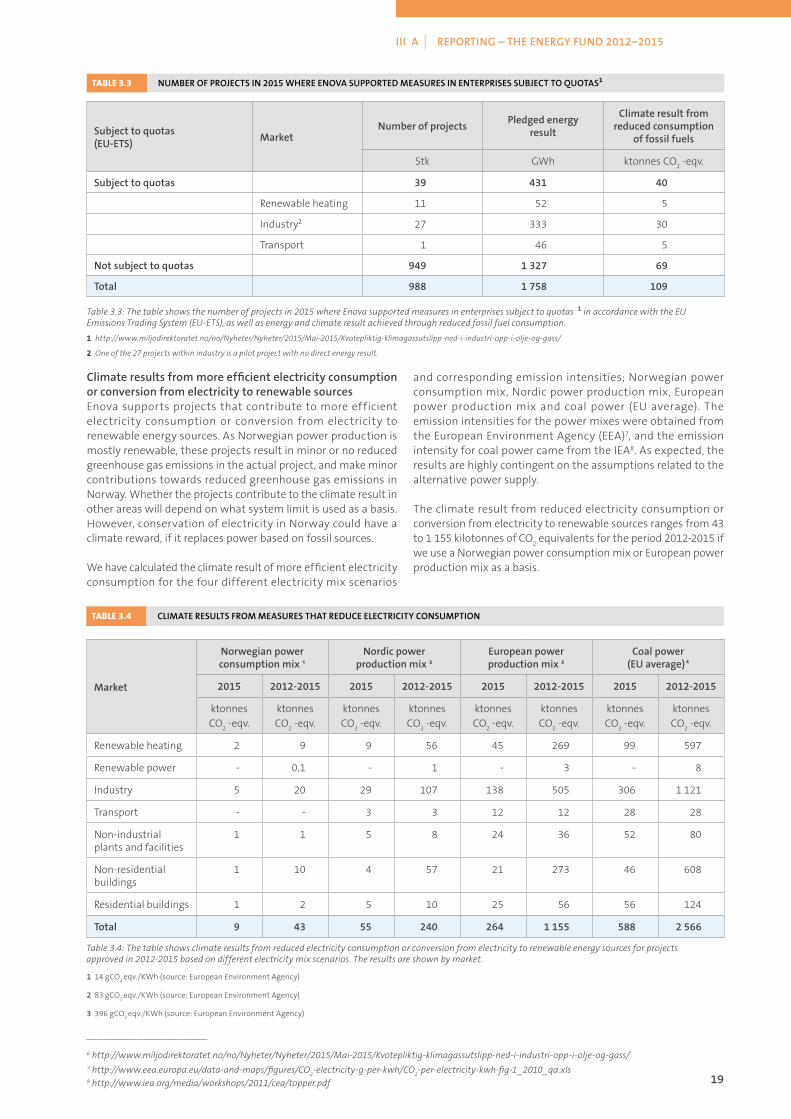
ClimateresultsfrommoreefficientelectricityconsumptionorconversionfromelectricitytorenewablesourcesEnova supports projects that contribute to more efficient electricity consumption or conversion from electricity to renewable energy sources. As Norwegian power production is mostly renewable, these projects result in minor or no reduced greenhouse gas emissions in the actual project, and make minor contributions towards reduced greenhouse gas emissions in Norway. Whether the projects contribute to the climate result in other areas will depend on what system limit is used as a basis. However, conservation of electricity in Norway could have a climate reward, if it replaces power based on fossil sources.
We have calculated the climate result of more efficient electricity consumption for the four different electricity mix scenarios
and corresponding emission intensities; Norwegian power consumption mix, Nordic power production mix, European power production mix and coal power (EU average). The emission intensities for the power mixes were obtained from the European Environment Agency (EEA)7, and the emission intensity for coal power came from the IEA8. As expected, the results are highly contingent on the assumptions related to the alternative power supply.
The climate result from reduced electricity consumption or conversion from electricity to renewable sources ranges from 43 to 1 155 kilotonnes of CO
2 equivalents for the period 2012-2015 if
we use a Norwegian power consumption mix or European power production mix as a basis.
Table 3.3: The table shows the number of projects in 2015 where Enova supported measures in enterprises subject to quotas 1 in accordance with the EU Emissions Trading System (EU-ETS), as well as energy and climate result achieved through reduced fossil fuel consumption.
1http://www.miljodirektoratet.no/no/Nyheter/Nyheter/2015/Mai-2015/Kvotepliktig-klimagassutslipp-ned-i-industri-opp-i-olje-og-gass/
2One of the 27 projects within industry is a pilot project with no direct energy result.
TABLE 3.3 NUMBEROFPROJECTSIN2015WHEREENOVASUPPORTEDMEASURESINENTERPRISESSUBJECTTOQUOTAS1
Subjecttoquotas(EU-ETS)
MarketNumberofprojects
Pledgedenergyresult
Climateresultfromreducedconsumption
offossilfuels
Stk GWh ktonnes CO2 -eqv.
Subjecttoquotas 39 431 40
Renewable heating 11 52 5
Industry2 27 333 30
Transport 1 46 5
Notsubjecttoquotas 949 1327 69
Total 988 1758 109
___________________________
6 http://www.miljodirektoratet.no/no/Nyheter/Nyheter/2015/Mai-2015/Kvotepliktig-klimagassutslipp-ned-i-industri-opp-i-olje-og-gass/7 http://www.eea.europa.eu/data-and-maps/figures/CO
2-electricity-g-per-kwh/CO
2-per-electricity-kwh-fig-1_2010_qa.xls
8 http://www.iea.org/media/workshops/2011/cea/topper.pdf
Table 3.4: The table shows climate results from reduced electricity consumption or conversion from electricity to renewable energy sources for projects approved in 2012-2015 based on different electricity mix scenarios. The results are shown by market.
TABLE 3.4 CLIMATERESULTSFROMMEASURESTHATREDUCEELECTRICITYCONSUMPTION
114 gCO2
eqv./KWh (source: European Environment Agency)
283 gCO2
eqv./KWh (source: European Environment Agency)
3396 gCO2
eqv./KWh (source: European Environment Agency)
Market
Norwegianpowerconsumptionmix¹
Nordicpowerproductionmix²
Europeanpowerproductionmix³
Coalpower(EUaverage) 4
2015 2012-2015 2015 2012-2015 2015 2012-2015 2015 2012-2015
ktonnes CO
2 -eqv.
ktonnes CO
2 -eqv.
ktonnes CO
2 -eqv.
ktonnes CO
2 -eqv.
ktonnes CO
2 -eqv.
ktonnes CO
2 -eqv.
ktonnes CO
2 -eqv.
ktonnes CO
2 -eqv.
Renewable heating 2 9 9 56 45 269 99 597
Renewable power - 0,1 - 1 - 3 - 8
Industry 5 20 29 107 138 505 306 1 121
Transport - - 3 3 12 12 28 28
Non-industrial plants and facilities
1 1 5 8 24 36 52 80
Non-residential buildings
1 10 4 57 21 273 46 608
Residential buildings 1 2 5 10 25 56 56 124
Total 9 43 55 240 264 1155 588 2566

20
TABLE 3.5 SUPPORTFORNEWENERGYANDCLIMATETECHNOLOGY2012-2015
2015 2012-2015
Market ProgrammeNumber
ofprojectssupported
Contractualenergyresult
Contractualsupport
Numberofprojectssupported
Contractualenergyresult
Contractualsupport
Stk GWh MNOK Stk GWh MNOK
Renewableheating 1 0,2 3 4 3 17
Support for introduction of new technology
1 0,2 3 4 3 17
Renewablepower 5 34 50 11 43 69
Support for introduction of new technology
5 34 50 11 43 69
Industry 10 209 958 26 374 2659
Support for introduction of new technology
1 0,1 0,3 6 2 16
Support for new energy and climate technology
4 209 921 15 371 2 607
Pre-project support new energy and climate technology
5 - 36 5 - 36
Transport 8 94 167 8 94 167
Support for introduction of new technology
4 8 18 4 8 18
Support for new energy and climate technology
4 86 149 4 86 149
Non-industrialplantsandfacilities 1 1 15 3 8 45
Support for introduction of new technology
1 0,5 15 3 8 45
Non-residentialbuildings 21 17 116 41 35 271
Support for introduction of new technology
- - - 4 2 26
Support for introduction of new technology in the buildings of the future
7 1 8 14 4 60
Support for energy-efficient new buildings
14 16 108 23 29 185
Residentialbuildings 8 54 60 9 54 60
Support for energy-efficient new buildings (private)
1 0,01 0,1 2 0,03 0,2
Communication solutions from AMS
7 54 60 7 54 60
Total 54 409 1368 102 612 3289
Table 3.5: The table shows energy results and allocations within new energy aand climate technology in 2015 and 2012-2015 distrubuted by market.
New energy and climate technology
New technology in general, and energy and climate technology in the industry in particular, were the subjects of increased focus through the agreement between the MPE and Enova. The goal of the technology projects is to harvest experience that will contribute to expertise development, innovation and spread of the technology both nationally and internationally. Together with the market, Enova contributes to reducing greenhouse gas emissions and supporting broad-based energy restructuring development.
The agreement with the MPE stipulates that at least 10 per cent of the annual available funds in the Energy Fund be earmarked for technology projects within the agreement term. Enova has
a programme for technology projects in every market in order to follow up this aspect of the agreement. NOK 1.4 billion in support was granted to 54 projects in 2015. This support constitutes more than half of the allocated funds in 2015.
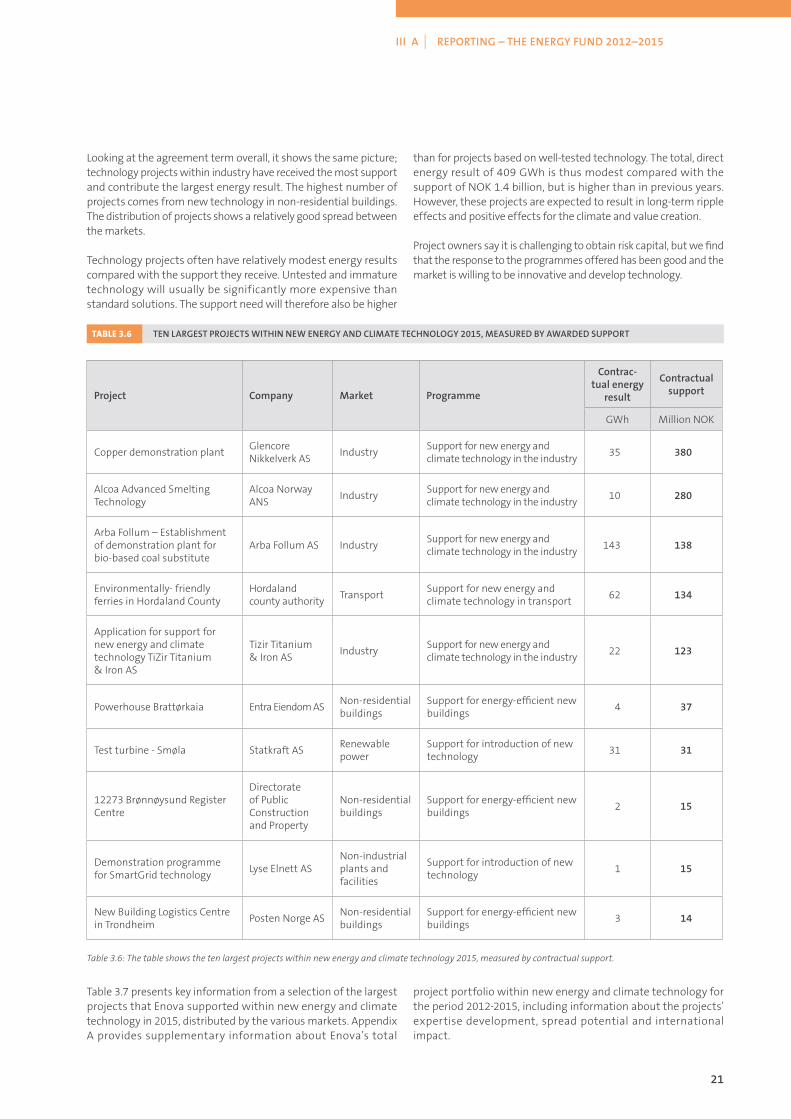
A higher number of technology projects received support in 2015 compared to 2014, and the distribution of projects shows a good spread between markets. The largest projects within new technology came from industry, and this market received the most support and contributed the highest energy result. Non-residential buildings contributed the highest number of projects.
21
III A | REPORTING – THE ENERGY FUND 2012–2015
Looking at the agreement term overall, it shows the same picture; technology projects within industry have received the most support and contribute the largest energy result. The highest number of projects comes from new technology in non-residential buildings. The distribution of projects shows a relatively good spread between the markets.
Technology projects often have relatively modest energy results compared with the support they receive. Untested and immature technology will usually be significantly more expensive than standard solutions. The support need will therefore also be higher
than for projects based on well-tested technology. The total, direct energy result of 409 GWh is thus modest compared with the support of NOK 1.4 billion, but is higher than in previous years. However, these projects are expected to result in long-term ripple effects and positive effects for the climate and value creation.
Project owners say it is challenging to obtain risk capital, but we find that the response to the programmes offered has been good and the market is willing to be innovative and develop technology.
TABLE 3.6 TENLARGESTPROJECTSWITHINNEWENERGYANDCLIMATETECHNOLOGY2015,MEASUREDBYAWARDEDSUPPORT
Project Company Market Programme
Contrac-tualenergy
result
Contractualsupport
GWh Million NOK
Copper demonstration plantGlencore Nikkelverk AS
IndustrySupport for new energy and climate technology in the industry
35 380
Alcoa Advanced Smelting Technology
Alcoa Norway ANS
IndustrySupport for new energy and climate technology in the industry
10 280
Arba Follum – Establishment of demonstration plant for bio-based coal substitute
Arba Follum AS IndustrySupport for new energy and climate technology in the industry
143 138
Environmentally- friendly ferries in Hordaland County
Hordaland county authority
TransportSupport for new energy and climate technology in transport
62 134
Application for support for new energy and climate technology TiZir Titanium & Iron AS
Tizir Titanium & Iron AS
IndustrySupport for new energy and climate technology in the industry
22 123
Powerhouse Brattørkaia Entra Eiendom ASNon-residential buildings
Support for energy-efficient new buildings
4 37
Test turbine - Smøla Statkraft ASRenewable power
Support for introduction of new technology
31 31
12273 Brønnøysund Register Centre
Directorateof Public Construction and Property
Non-residential buildings
Support for energy-efficient new buildings
2 15
Demonstration programme for SmartGrid technology
Lyse Elnett ASNon-industrial plants and facilities
Support for introduction of new technology
1 15
New Building Logistics Centre in Trondheim
Posten Norge ASNon-residential buildings
Support for energy-efficient new buildings
3 14
Table 3.6: The table shows the ten largest projects within new energy and climate technology 2015, measured by contractual support.
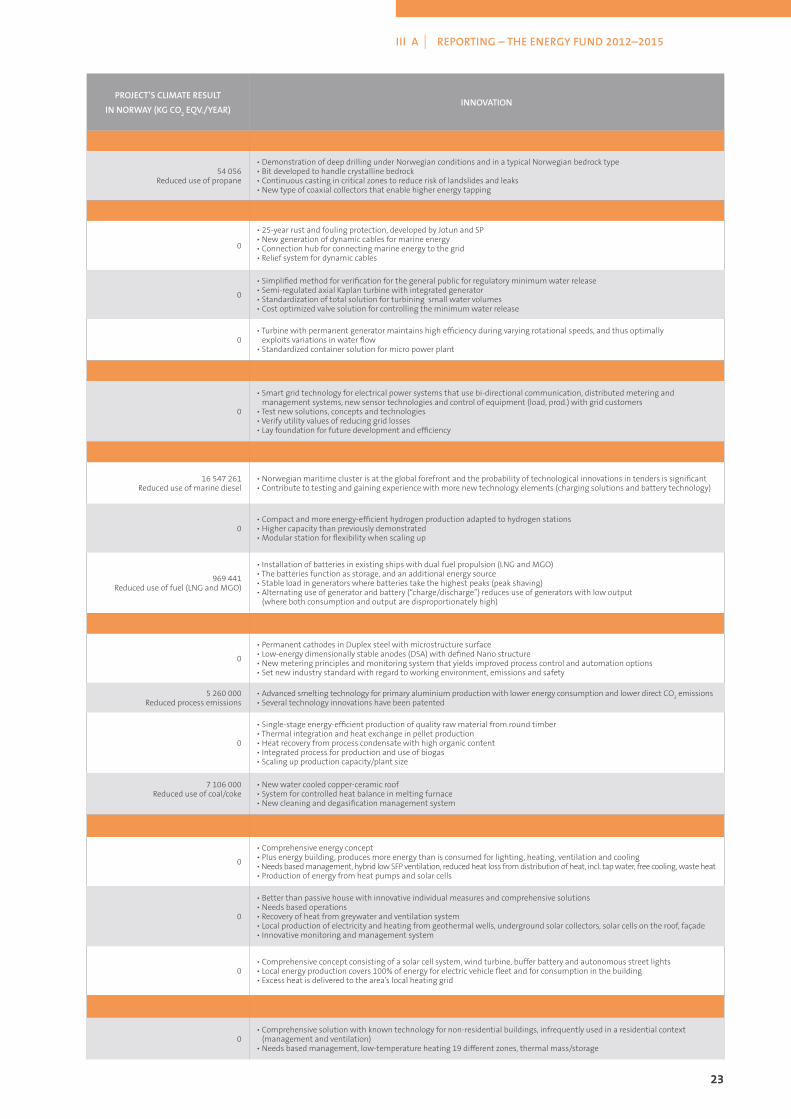
Table 3.7 presents key information from a selection of the largest projects that Enova supported within new energy and climate technology in 2015, distributed by the various markets. Appendix A provides supplementary information about Enova’s total
project portfolio within new energy and climate technology for the period 2012-2015, including information about the projects’ expertise development, spread potential and international impact.
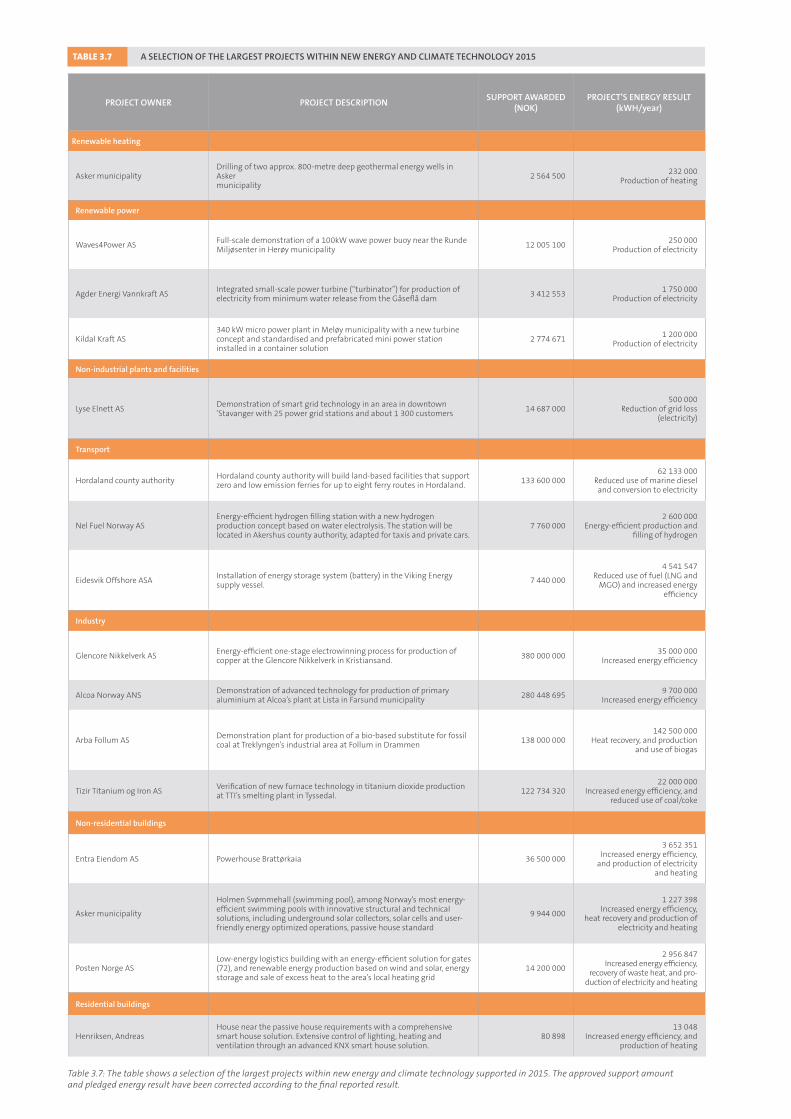
PROJECTOWNER PROJECTDESCRIPTIONSUPPORTAWARDED
(NOK)PROJECT’SENERGYRESULT
(kWH/year)
Renewableheating
Asker municipalityDrilling of two approx. 800-metre deep geothermal energy wells in Asker municipality
2 564 500232 000
Production of heating
Renewablepower
Waves4Power ASFull-scale demonstration of a 100kW wave power buoy near the Runde Miljøsenter in Herøy municipality
12 005 100250 000
Production of electricity
Agder Energi Vannkraft ASIntegrated small-scale power turbine (“turbinator”) for production of electricity from minimum water release from the Gåseflå dam
3 412 553 1 750 000
Production of electricity
Kildal Kraft AS340 kW micro power plant in Meløy municipality with a new turbine concept and standardised and prefabricated mini power station installed in a container solution
2 774 6711 200 000
Production of electricity
Non-industrialplantsandfacilities
Lyse Elnett ASDemonstration of smart grid technology in an area in downtown ’Stavanger with 25 power grid stations and about 1 300 customers
14 687 000500 000
Reduction of grid loss(electricity)
Transport
Hordaland county authorityHordaland county authority will build land-based facilities that support zero and low emission ferries for up to eight ferry routes in Hordaland.
133 600 00062 133 000
Reduced use of marine diesel and conversion to electricity
Nel Fuel Norway ASEnergy-efficient hydrogen filling station with a new hydrogen production concept based on water electrolysis. The station will be located in Akershus county authority, adapted for taxis and private cars.
7 760 0002 600 000
Energy-efficient production and filling of hydrogen
Eidesvik Offshore ASAInstallation of energy storage system (battery) in the Viking Energy supply vessel.
7 440 000
4 541 547Reduced use of fuel (LNG and
MGO) and increased energy efficiency
Industry
Glencore Nikkelverk ASEnergy-efficient one-stage electrowinning process for production of copper at the Glencore Nikkelverk in Kristiansand.
380 000 00035 000 000
Increased energy efficiency
Alcoa Norway ANSDemonstration of advanced technology for production of primary aluminium at Alcoa’s plant at Lista in Farsund municipality
280 448 6959 700 000
Increased energy efficiency
Arba Follum ASDemonstration plant for production of a bio-based substitute for fossil coal at Treklyngen’s industrial area at Follum in Drammen
138 000 000142 500 000
Heat recovery, and production and use of biogas
Tizir Titanium og Iron ASVerification of new furnace technology in titanium dioxide production at TTI’s smelting plant in Tyssedal.
122 734 32022 000 000
Increased energy efficiency, and reduced use of coal/coke
Non-residentialbuildings
Entra Eiendom AS Powerhouse Brattørkaia 36 500 000
3 652 351Increased energy efficiency,
and production of electricity and heating
Asker municipality
Holmen Svømmehall (swimming pool), among Norway’s most energy-efficient swimming pools with innovative structural and technical solutions, including underground solar collectors, solar cells and user-friendly energy optimized operations, passive house standard
9 944 000
1 227 398Increased energy efficiency,
heat recovery and production of electricity and heating
Posten Norge ASLow-energy logistics building with an energy-efficient solution for gates (72), and renewable energy production based on wind and solar, energy storage and sale of excess heat to the area’s local heating grid
14 200 000
2 956 847Increased energy efficiency,
recovery of waste heat, and pro-duction of electricity and heating
Residentialbuildings
Henriksen, AndreasHouse near the passive house requirements with a comprehensive smart house solution. Extensive control of lighting, heating and ventilation through an advanced KNX smart house solution.
80 89813 048
Increased energy efficiency, and production of heating
Table 3.7: The table shows a selection of the largest projects within new energy and climate technology supported in 2015. The approved support amount and pledged energy result have been corrected according to the final reported result.
TABLE 3.7 ASELECTIONOFTHELARGESTPROJECTSWITHINNEWENERGYANDCLIMATETECHNOLOGY2015
23
III A | REPORTING – THE ENERGY FUND 2012–2015
23
PROJECT’SCLIMATERESULT
INNORWAY(KGCO2EQV./YEAR)
INNOVATION
54 056Reduced use of propane
• Demonstration of deep drilling under Norwegian conditions and in a typical Norwegian bedrock type• Bit developed to handle crystalline bedrock• Continuous casting in critical zones to reduce risk of landslides and leaks• New type of coaxial collectors that enable higher energy tapping
0
• 25-year rust and fouling protection, developed by Jotun and SP• New generation of dynamic cables for marine energy• Connection hub for connecting marine energy to the grid• Relief system for dynamic cables
0
• Simplified method for verification for the general public for regulatory minimum water release• Semi-regulated axial Kaplan turbine with integrated generator• Standardization of total solution for turbining small water volumes• Cost optimized valve solution for controlling the minimum water release
0• Turbine with permanent generator maintains high efficiency during varying rotational speeds, and thus optimally exploits variations in water flow• Standardized container solution for micro power plant
0
• Smart grid technology for electrical power systems that use bi-directional communication, distributed metering and management systems, new sensor technologies and control of equipment (load, prod.) with grid customers• Test new solutions, concepts and technologies• Verify utility values of reducing grid losses• Lay foundation for future development and efficiency
16 547 261Reduced use of marine diesel
• Norwegian maritime cluster is at the global forefront and the probability of technological innovations in tenders is significant• Contribute to testing and gaining experience with more new technology elements (charging solutions and battery technology)
0• Compact and more energy-efficient hydrogen production adapted to hydrogen stations• Higher capacity than previously demonstrated• Modular station for flexibility when scaling up
969 441Reduced use of fuel (LNG and MGO)
• Installation of batteries in existing ships with dual fuel propulsion (LNG and MGO)• The batteries function as storage, and an additional energy source• Stable load in generators where batteries take the highest peaks (peak shaving)• Alternating use of generator and battery (“charge/discharge”) reduces use of generators with low output (where both consumption and output are disproportionately high)
0
• Permanent cathodes in Duplex steel with microstructure surface • Low-energy dimensionally stable anodes (DSA) with defined Nano structure• New metering principles and monitoring system that yields improved process control and automation options • Set new industry standard with regard to working environment, emissions and safety
5 260 000Reduced process emissions
• Advanced smelting technology for primary aluminium production with lower energy consumption and lower direct CO2 emissions
• Several technology innovations have been patented
0
• Single-stage energy-efficient production of quality raw material from round timber• Thermal integration and heat exchange in pellet production• Heat recovery from process condensate with high organic content• Integrated process for production and use of biogas• Scaling up production capacity/plant size
7 106 000Reduced use of coal/coke
• New water cooled copper-ceramic roof• System for controlled heat balance in melting furnace• New cleaning and degasification management system
0
• Comprehensive energy concept• Plus energy building, produces more energy than is consumed for lighting, heating, ventilation and cooling• Needs based management, hybrid low SFP ventilation, reduced heat loss from distribution of heat, incl. tap water, free cooling, waste heat• Production of energy from heat pumps and solar cells
0
• Better than passive house with innovative individual measures and comprehensive solutions• Needs based operations• Recovery of heat from greywater and ventilation system• Local production of electricity and heating from geothermal wells, underground solar collectors, solar cells on the roof, façade• Innovative monitoring and management system
0• Comprehensive concept consisting of a solar cell system, wind turbine, buffer battery and autonomous street lights• Local energy production covers 100% of energy for electric vehicle fleet and for consumption in the building• Excess heat is delivered to the area’s local heating grid
0• Comprehensive solution with known technology for non-residential buildings, infrequently used in a residential context (management and ventilation)• Needs based management, low-temperature heating 19 different zones, thermal mass/storage
24
In-depth reporting
Energyresults
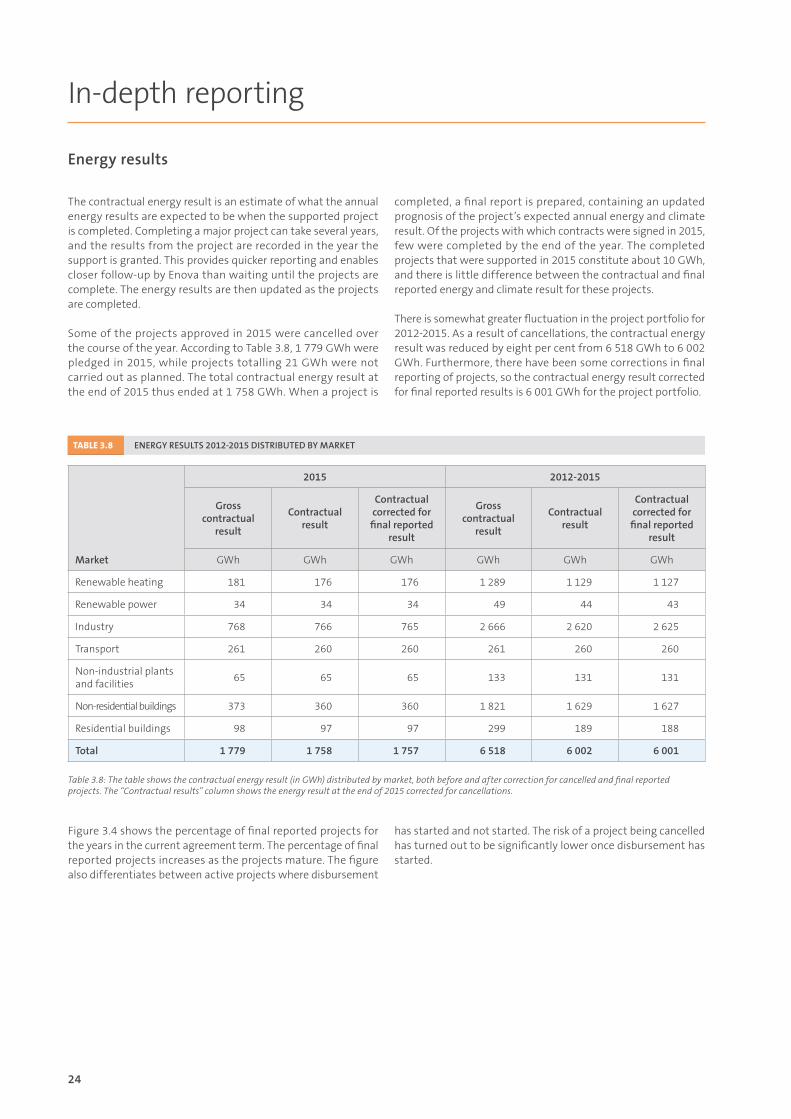
The contractual energy result is an estimate of what the annual energy results are expected to be when the supported project is completed. Completing a major project can take several years, and the results from the project are recorded in the year the support is granted. This provides quicker reporting and enables closer follow-up by Enova than waiting until the projects are complete. The energy results are then updated as the projects are completed.
Some of the projects approved in 2015 were cancelled over the course of the year. According to Table 3.8, 1 779 GWh were pledged in 2015, while projects totalling 21 GWh were not carried out as planned. The total contractual energy result at the end of 2015 thus ended at 1 758 GWh. When a project is
completed, a final report is prepared, containing an updated prognosis of the project’s expected annual energy and climate result. Of the projects with which contracts were signed in 2015, few were completed by the end of the year. The completed projects that were supported in 2015 constitute about 10 GWh, and there is little difference between the contractual and final reported energy and climate result for these projects.
There is somewhat greater fluctuation in the project portfolio for 2012-2015. As a result of cancellations, the contractual energy result was reduced by eight per cent from 6 518 GWh to 6 002 GWh. Furthermore, there have been some corrections in final reporting of projects, so the contractual energy result corrected for final reported results is 6 001 GWh for the project portfolio.
Figure 3.4 shows the percentage of final reported projects for the years in the current agreement term. The percentage of final reported projects increases as the projects mature. The figure also differentiates between active projects where disbursement
has started and not started. The risk of a project being cancelled has turned out to be significantly lower once disbursement has started.
Table 3.8: The table shows the contractual energy result (in GWh) distributed by market, both before and after correction for cancelled and final reported projects. The “Contractual results” column shows the energy result at the end of 2015 corrected for cancellations.
TABLE 3.8 ENERGYRESULTS2012-2015DISTRIBUTEDBYMARKET
2015 2012-2015
Grosscontractual
result
Contractualresult
Contractualcorrectedforfinalreported
result
Grosscontractual
result
Contractualresult
Contractualcorrectedforfinalreported
result
Market GWh GWh GWh GWh GWh GWh
Renewable heating 181 176 176 1 289 1 129 1 127
Renewable power 34 34 34 49 44 43
Industry 768 766 765 2 666 2 620 2 625
Transport 261 260 260 261 260 260
Non-industrial plants and facilities
65 65 65 133 131 131
Non-residential buildings 373 360 360 1 821 1 629 1 627
Residential buildings 98 97 97 299 189 188
Total 1779 1758 1757 6518 6002 6001

25
III A | REPORTING – THE ENERGY FUND 2012–2015
Fundinglevel
An important precondition for use of investment support is that the instrument is cost-effective. Enova should derive maximum value in the form of kWh for the support it provides. The funding level is measured as support per energy result (NOK/kWh). For energy projects in particular, the funding level is an important assessment criterion for Enova. For new energy and climate technology projects, the goal of the support is that the projects will contribute to reducing greenhouse gas emissions and support the development of restructuring of energy end-use and energy production in the long term, through developing and utilizing new technologies and new solutions that can contribute to this. For technology projects, expertise development, potential dissemination and innovation are highly relevant assessment criteria.
Funding for a project is calculated based on what is necessary to ensure the project is completed. If the project is considered profitable, it does not need support to be implemented. If the project is very unprofitable, it will need a high funding level. Enova prioritizes projects that require the least possible support per energy result, and ensures cost efficiency by rejecting the most unprofitable projects.
Overall, the funding level for energy projects in 2015 is in line with the previous year, with NOK 0.89/kWh. Structural changes in the project portfolio in 2015 help maintain a stable funding level. For comparable projects, the cost level has been stable and increasing in recent years.
The funding level for transport projects is at a low level compared to the other markets. The funding level of NOK 0.62/kWh helps keep the total funding level low. On average, industry projects
have received NOK 0.57/kWh in funding in 2015. This is among the most cost-effective levels we have seen since 2012, and caused the average funding level for industry projects starting in 2012 to drop to NOK 0.69/kWh.
The funding level for renewable heating projects increased in 2015. The energy result generally consists of district heating projects, where the largest and most cost-effective projects have already been developed. A rising support percentage is therefore natural in this area. Since the energy result percentage is declining, the increase has a relatively minor impact on the overall funding level.
The funding level per project within non-industrial plants and facilities generally increased in 2015. For residential buildings, the Enova Subsidy in particular results in a higher funding level in 2015 compared with previous years. Both markets have relatively modest energy results, and the increases therefore have a minor impact on the overall funding level.
Projects within non-residential buildings have a relatively high funding level and relatively high energy results. This combination means that the non-residential buildings market has the greatest impact on the overall funding level. The funding level in 2015 was NOK 1.11/kWh. This is a modest increase from 2014, but still pulls down the average funding level for the period 2012-2015.
For the entire portfolio overall, there is a minor decline in the funding level from NOK 1.01/kWh from the 2012-2014 portfolio to NOK 0.97/kWh in the 2012-2015 portfolio.
Figure 3.4: The figure shows the percentage of final reported and active projects at the end of 2015, distributed by approval year. The figure also shows the percentage of active projects where disbursement has started.
FIGURE 3.4 PERCENTAGEOFFINALREPORTEDPROJECTSAPPROVEDDURINGTHEPERIOD2012-2015
0%
10%
20%
30%
40%
50%
60%
70%
80%
90%
100%
Final reported 2012-2014
Final reported 2015
Active projects – disbursement has started
Active projects – disbursement has not started
2012 2013 2014 2015
26
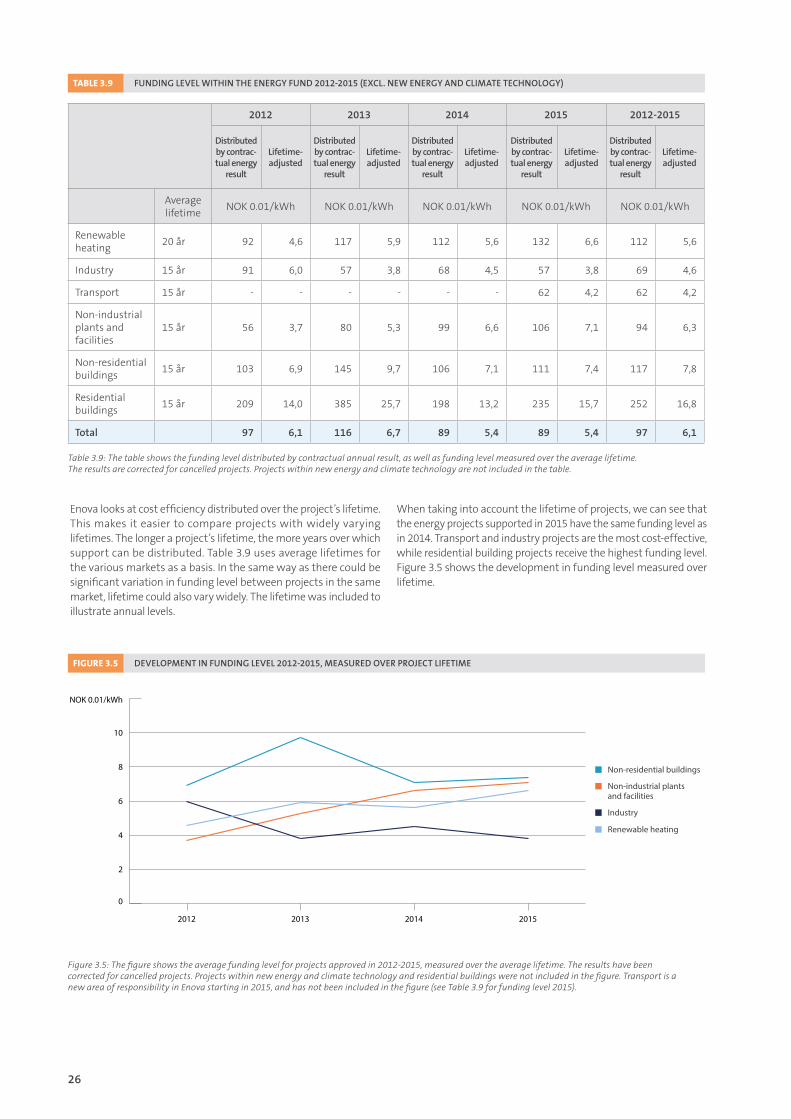
Enova looks at cost efficiency distributed over the project’s lifetime. This makes it easier to compare projects with widely varying lifetimes. The longer a project’s lifetime, the more years over which support can be distributed. Table 3.9 uses average lifetimes for the various markets as a basis. In the same way as there could be significant variation in funding level between projects in the same market, lifetime could also vary widely. The lifetime was included to illustrate annual levels.
When taking into account the lifetime of projects, we can see that the energy projects supported in 2015 have the same funding level as in 2014. Transport and industry projects are the most cost-effective, while residential building projects receive the highest funding level. Figure 3.5 shows the development in funding level measured over lifetime.
Table 3.9: The table shows the funding level distributed by contractual annual result, as well as funding level measured over the average lifetime. The results are corrected for cancelled projects. Projects within new energy and climate technology are not included in the table.
TABLE 3.9 FUNDINGLEVELWITHINTHEENERGYFUND2012-2015(EXCL.NEWENERGYANDCLIMATETECHNOLOGY)
2012 2013 2014 2015 2012-2015
Distributedbycontrac-tualenergy
result
Lifetime-adjusted
Distributedbycontrac-tualenergy
result
Lifetime-adjusted
Distributedbycontrac-tualenergy
result
Lifetime-adjusted
Distributedbycontrac-tualenergy
result
Lifetime-adjusted
Distributedbycontrac-tualenergy
result
Lifetime-adjusted
Average lifetime
NOK 0.01/kWh NOK 0.01/kWh NOK 0.01/kWh NOK 0.01/kWh NOK 0.01/kWh
Renewable heating
20 år 92 4,6 117 5,9 112 5,6 132 6,6 112 5,6
Industry 15 år 91 6,0 57 3,8 68 4,5 57 3,8 69 4,6
Transport 15 år - - - - - - 62 4,2 62 4,2
Non-industrial plants and facilities
15 år 56 3,7 80 5,3 99 6,6 106 7,1 94 6,3
Non-residential buildings
15 år 103 6,9 145 9,7 106 7,1 111 7,4 117 7,8
Residential buildings
15 år 209 14,0 385 25,7 198 13,2 235 15,7 252 16,8
Total 97 6,1 116 6,7 89 5,4 89 5,4 97 6,1
Figure 3.5: The figure shows the average funding level for projects approved in 2012-2015, measured over the average lifetime. The results have been corrected for cancelled projects. Projects within new energy and climate technology and residential buildings were not included in the figure. Transport is a new area of responsibility in Enova starting in 2015, and has not been included in the figure (see Table 3.9 for funding level 2015).
FIGURE 3.5 DEVELOPMENTINFUNDINGLEVEL2012-2015,MEASUREDOVERPROJECTLIFETIME
0
2
4
6
8
10
NOK 0.01/kWh
Renewable heating
Industry
Non-residential buildings
Non-industrial plants and facilities
2012 2013 2014 2015
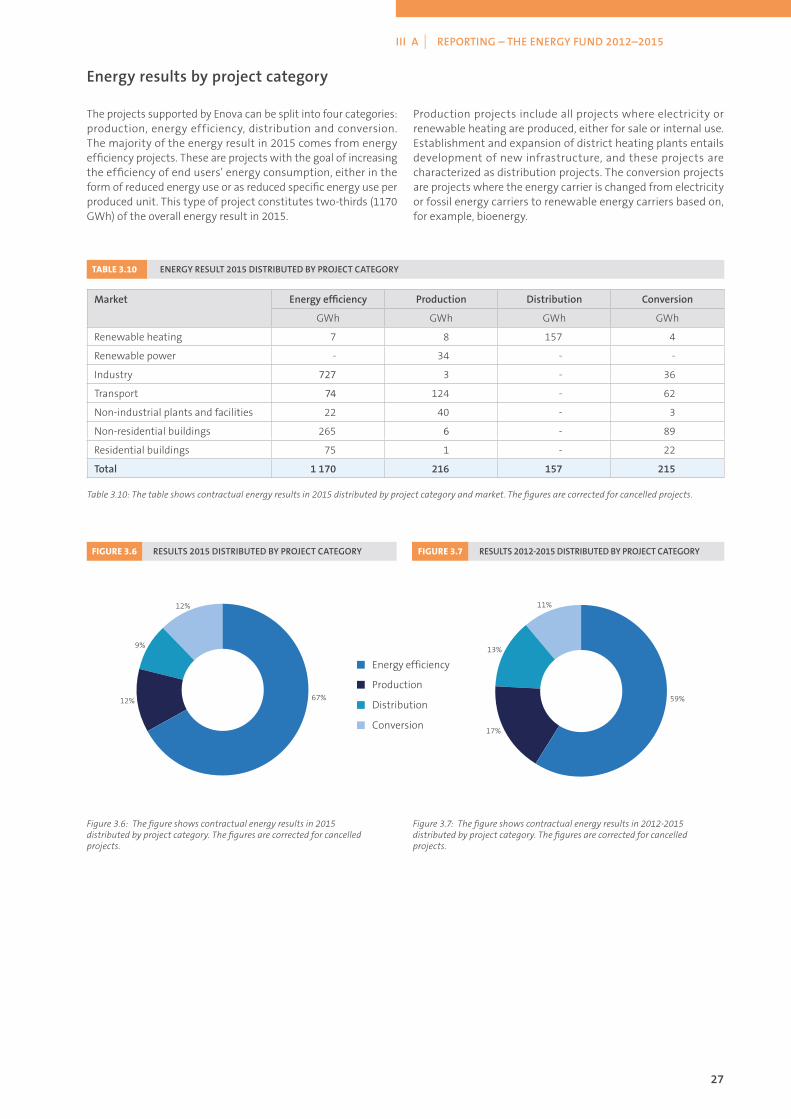
27
III A | REPORTING – THE ENERGY FUND 2012–2015
Energyresultsbyprojectcategory
The projects supported by Enova can be split into four categories: production, energy efficiency, distribution and conversion. The majority of the energy result in 2015 comes from energy efficiency projects. These are projects with the goal of increasing the efficiency of end users’ energy consumption, either in the form of reduced energy use or as reduced specific energy use per produced unit. This type of project constitutes two-thirds (1170 GWh) of the overall energy result in 2015.
Production projects include all projects where electricity or renewable heating are produced, either for sale or internal use. Establishment and expansion of district heating plants entails development of new infrastructure, and these projects are characterized as distribution projects. The conversion projects are projects where the energy carrier is changed from electricity or fossil energy carriers to renewable energy carriers based on, for example, bioenergy.
Table 3.10: The table shows contractual energy results in 2015 distributed by project category and market. The figures are corrected for cancelled projects.
Market Energyefficiency Production Distribution Conversion
GWh GWh GWh GWh
Renewable heating 7 8 157 4
Renewable power - 34 - -
Industry 727 3 - 36
Transport 74 124 - 62
Non-industrial plants and facilities 22 40 - 3
Non-residential buildings 265 6 - 89
Residential buildings 75 1 - 22
Total 1170 216 157 215
TABLE 3.10 ENERGYRESULT2015DISTRIBUTEDBYPROJECTCATEGORY
Figure 3.6: The figure shows contractual energy results in 2015 distributed by project category. The figures are corrected for cancelled projects.
FIGURE 3.6 RESULTS2015DISTRIBUTEDBYPROJECTCATEGORY
Figure 3.7: The figure shows contractual energy results in 2012-2015 distributed by project category. The figures are corrected for cancelled projects.
FIGURE 3.7 RESULTS2012-2015DISTRIBUTEDBYPROJECTCATEGORY
Production
Distribution
Energy efficiency
Conversion
12%
9%
12% 67%
11%
13%
17%
59%

28
Energy efficiency has accounted for more than half of the energy result every year since 2012 and has also been on the rise. The scope of production projects was high (34 per cent) in 2012, but the shares for production, distribution and conversion evened out in the following years. The scope of distribution projects fell to nine per cent in 2015, which is related to the lower scope of district heating projects.
Figure 3.6 and Figure 3.7 show that the share from energy efficiency was high in 2015. Otherwise, the distributions are relatively similar. As the project portfolio increases year by year, these shares tend to stabilize. The distribution of the aggregated portfolio does not change much from year to year. The trend has been a rising share from energy efficiency, and a declining share for production and distribution.
Resultsdistributedbyrenewableenergysources/carriersTable 3.11 shows the energy result within production, distribution and conversion, distributed by energy carrier. Overall, the energy result is 588 GWh. This is a decline of 137 GWh in relation to
2014, and is related to the fact that a high share of the energy result in 2015 consists of energy efficiency measures that are not distributed among energy carriers. Increased use of bioenergy represents the largest share in 2015, with 209 GWh. After this comes use of heat pumps with 96 GWh and waste heat with 79 GWh.
Compared with 2014, the use of bioenergy, waste incineration and waste heat dropped, while the other categories increased. Bioenergy and waste incineration in particular, but also waste heat, are used in production and distribution of district heating, and the decline correlates with Enova supporting fewer district heating projects in 2015 than in 2014.
The energy result from conversion to heat pumps increased to 96 GWh in 2015, a 12 per cent increase from 2014. The use of solar energy and geothermal energy appears modest compared with the other energy carriers, but both grew significantly in 2014. Geothermal energy increased from 0.5 to 7 GWh from 2014 to 2015.
Table 3.11: The figure shows energy results within production, distribution and conversion distributed by energy carrier.
TABLE 3.11 ENERGYRESULTSWITHINPRODUCTION,DISTRIBUTIONANDCONVERSIONDISTRIBUTEDBYENERGYCARRIER
EnergycarrierContractualenergyresult
GWh
Bioenergy, 209
Biomass 93
Chips 70
Pellets 17
Other bio 29
Heat pump 96
Waste heat 79
Electricity 72
Energy from waste incineration 60
Wind power 31
District heating 22
Geothermal 7
Solar 3
Other renewable 8
Total 588

29
III A | REPORTING – THE ENERGY FUND 2012–2015
Portfoliocomposition
In 2015, the project portfolio is more balanced than in previous years, both as regards the number of projects, contractual energy result and contractual support. The distribution of these three amounts for the portfolio of projects that were granted funding commitments in 2015 is shown in Figure 3.8.
Enova supported a higher number of medium-sized projects (between 1 and 50 GWh) in 2015, compared with 2014. More than two-thirds of Enova’s energy result comes from this group of projects. The total number of projects supported in 2015 is lower than in 2014, but the decline mainly relates to projects with a contractual energy result of less than 1 GWh. These projects constitute about three-fourths of the total number of projects, but less than 10 per cent of the energy result. The majority of these projects were within residential buildings. There were also 3 800 subsidies granted for energy measures in residences. By themselves, the energy results are relatively small, but they are important for allowing individuals to get involved and channel a
joint effort to conserve energy and contribute toward solving the climate challenge we are facing.
The single project of more than 100 GWh is very significant for the total energy result. This project has an energy result that approximately corresponds to all projects with a contractual energy result of less than 1 GWh.
Generally, contractual support is closely aligned with the distribution of contractual energy results, but the funding profile is affected by the technology projects. Expertise development, dissemination potential and innovation are all weighty assessment criteria for these projects, in addition to the direct energy results. Some of these projects are therefore awarded considerable support even though the contractual energy results are not necessarily comparable. The opposite effect is seen in certain energy management projects with relatively substantial energy results in relation to the funding level.
Figure 3.8: The figure shows distribution of projects entered into in 2015 grouped by project size in GWh. The Enova Subsidy is not included in this overview.
FIGURE 3.8 PROJECTS2015DISTRIBUTEDBYSIZE
0
200
400
600
800
1 000
> 100 GWh50-100 GWh10-50 GWh1 - 10 GWh< 1 GWh
Number GWh
NOK million
Number of projects supported [no.]
Contractual result [GWh]
Contractual support [NOK million]
723
157
272228
645
993
26
546
909
3
244206
143
1
138

30
Figure 3.9: The figure shows distribution of projects entered into in 2012-2015 grouped by project size in GWh. The Enova Subsidy and Energy measures in residences (2012-2014) are not included in this overview. Support for energy advisory service was included in the Enova Subsidy starting in 2015. The projects that applied for this programme during 2013-2014 were removed from the overview.
FIGURE 3.9 PROJECTSDISTRIBUTEDBYSIZE2012-2015
0
500
1 000
1 500
2 000
2 500
> 100 GWh50-100 GWh10-50 GWh1 - 10 GWh< 1 GWh
Number GWh
NOK million
2 503
520
969
679
2 117
2 526
85
1 794
2 035
12
812
2 189
4
686644
Number of projects supported [no.]
Contractual result [GWh]
Contractual support [NOK million]
Figure 3.9 illustrates the same portfolio distributions when looking at every project during the period 2012-2015. The distribution profiles for the number of projects and contractual energy result are relatively similar from year to year, and this is reflected in the total project portfolio. The distribution for contractual support varies more from year to year, depending on the scope of technology projects with a higher funding intensity. The very largest projects were the most cost-efficient during the period 2012-2015.
There is a correlation between the size of the projects and implementation time. Small projects have a significantly shorter implementation time than major projects. Small projects are typically related to energy management and minor measures in residences, non-residential buildings and industry, while larger projects involve extensive engineering and investments in major physical measures. These naturally take longer to complete.
The small projects have an expected end date averaging one year after the approval date. Overall, 87 per cent of the projects approved in 2015 are expected to be finalized by the end of 2017.
These constitute about 70 per cent of this year’s contractual energy result and more than 50 per cent of this year’s allocated support.
If we consider the entire project portfolio for 2012-2015, 95 per cent of the projects are expected to be finalized by the end of 2017. These projects constitute 82 per cent of the energy result and 77 per cent of allocated support.
Enova wants the supported projects to be carried out as quickly and efficiently as possible. Rapid implementation reduces the risk of external factors changing with a resulting negative impact on the projects, thereby reducing the risk of the project not being implemented.
Starting in 2015, Enova assumed responsibility for disbursement, monitoring and reporting of Transnova’s project portfolio. The number of active projects at the takeover date was 164, with a total commitment of NOK 167.8 million. Final reports were submitted for 113 projects in 2015.

31
III A | REPORTING – THE ENERGY FUND 2012–2015
Figure 3.10: The figure shows distribution of projects entered into in 2015 distributed by the project’s contractual final date. The Enova Subsidy is not included in this overview.
FIGURE 3.10 PROJECTS2015DISTRIBUTEDBYCONTRACTUALFINALDATE
0
200
400
600
800
1 000
2019-20222018201720162015
177
100
196
477
602 597
206
512 495
93
186
260
32
335
969
Number GWh
NOK million
Number of projects supported [no.]
Contractual result [GWh]
Contractual support [NOK million]
Figure 3.11: The figure shows distribution of projects entered into in 2012- 2015 distributed by the projects’ contractual final date. The Enova Subsidy and Energy measures in residences (2012-2014) are not included in this overview. Support for energy advisory service was included in the Enova Subsidy starting in 2015. The projects that applied for this programme during 2013-2014 were removed from the overview.
FIGURE 3.11 PROJECTS2012-2015DISTRIBUTEDBYCONTRACTUALFINALDATE
0
500
1 000
1 500
2 000
2 500
3 000
2018-2022201720162015201420132012
6610 11
289
91 82
604
352 321
995
13701431
841
16621719
331
1396
2885
1045
1911
169
Number GWh
NOK million
Number of projects supported [no.]
Contractual result [GWh]
Contractual support [NOK million]
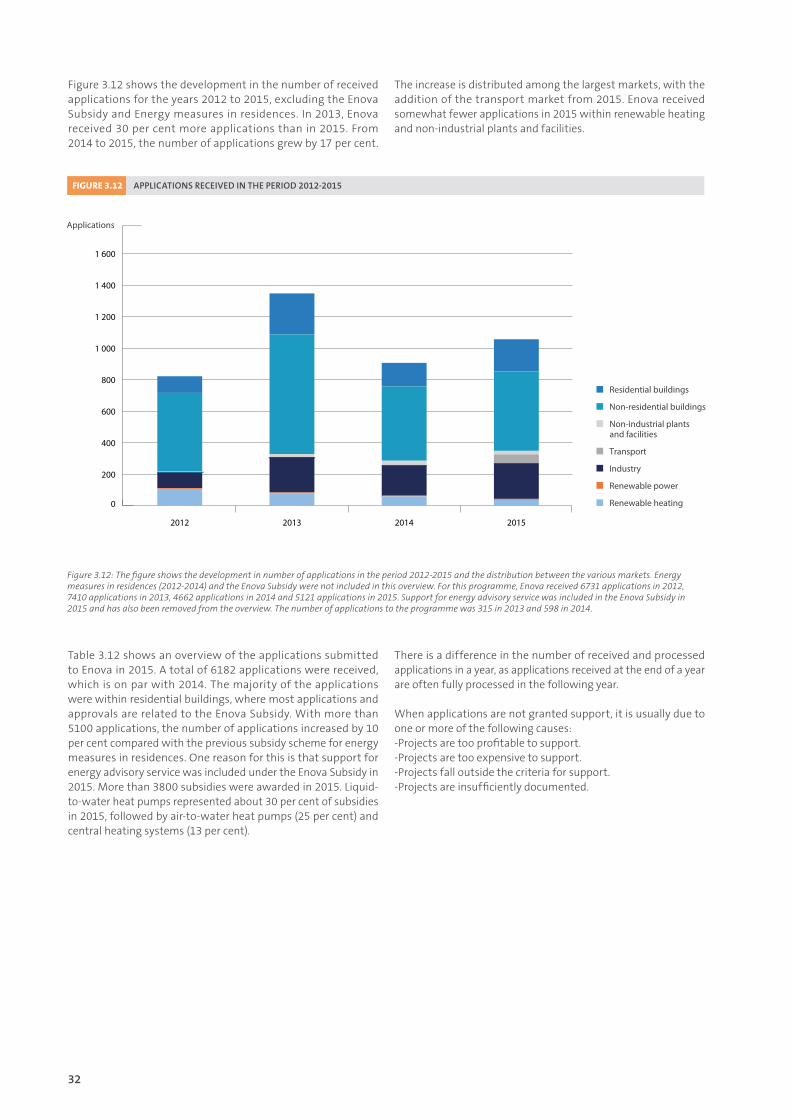
32
Figure 3.12 shows the development in the number of received applications for the years 2012 to 2015, excluding the Enova Subsidy and Energy measures in residences. In 2013, Enova received 30 per cent more applications than in 2015. From 2014 to 2015, the number of applications grew by 17 per cent.
The increase is distributed among the largest markets, with the addition of the transport market from 2015. Enova received somewhat fewer applications in 2015 within renewable heating and non-industrial plants and facilities.
Table 3.12 shows an overview of the applications submitted to Enova in 2015. A total of 6182 applications were received, which is on par with 2014. The majority of the applications were within residential buildings, where most applications and approvals are related to the Enova Subsidy. With more than 5100 applications, the number of applications increased by 10 per cent compared with the previous subsidy scheme for energy measures in residences. One reason for this is that support for energy advisory service was included under the Enova Subsidy in 2015. More than 3800 subsidies were awarded in 2015. Liquid-to-water heat pumps represented about 30 per cent of subsidies in 2015, followed by air-to-water heat pumps (25 per cent) and central heating systems (13 per cent).
There is a difference in the number of received and processed applications in a year, as applications received at the end of a year are often fully processed in the following year.
When applications are not granted support, it is usually due to one or more of the following causes:-Projects are too profitable to support.-Projects are too expensive to support.-Projects fall outside the criteria for support.-Projects are insufficiently documented.
Figure 3.12: The figure shows the development in number of applications in the period 2012-2015 and the distribution between the various markets. Energy measures in residences (2012-2014) and the Enova Subsidy were not included in this overview. For this programme, Enova received 6731 applications in 2012, 7410 applications in 2013, 4662 applications in 2014 and 5121 applications in 2015. Support for energy advisory service was included in the Enova Subsidy in 2015 and has also been removed from the overview. The number of applications to the programme was 315 in 2013 and 598 in 2014.
FIGURE 3.12 APPLICATIONSRECEIVEDINTHEPERIOD2012-2015
Renewable heating
Industry
Renewable power
Non-industrial plants and facilities
Non-residential buildings
Residential buildings
Transport
0
200
400
600
800
1 000
1 200
1 400
1 600
2015201420132012
Applications
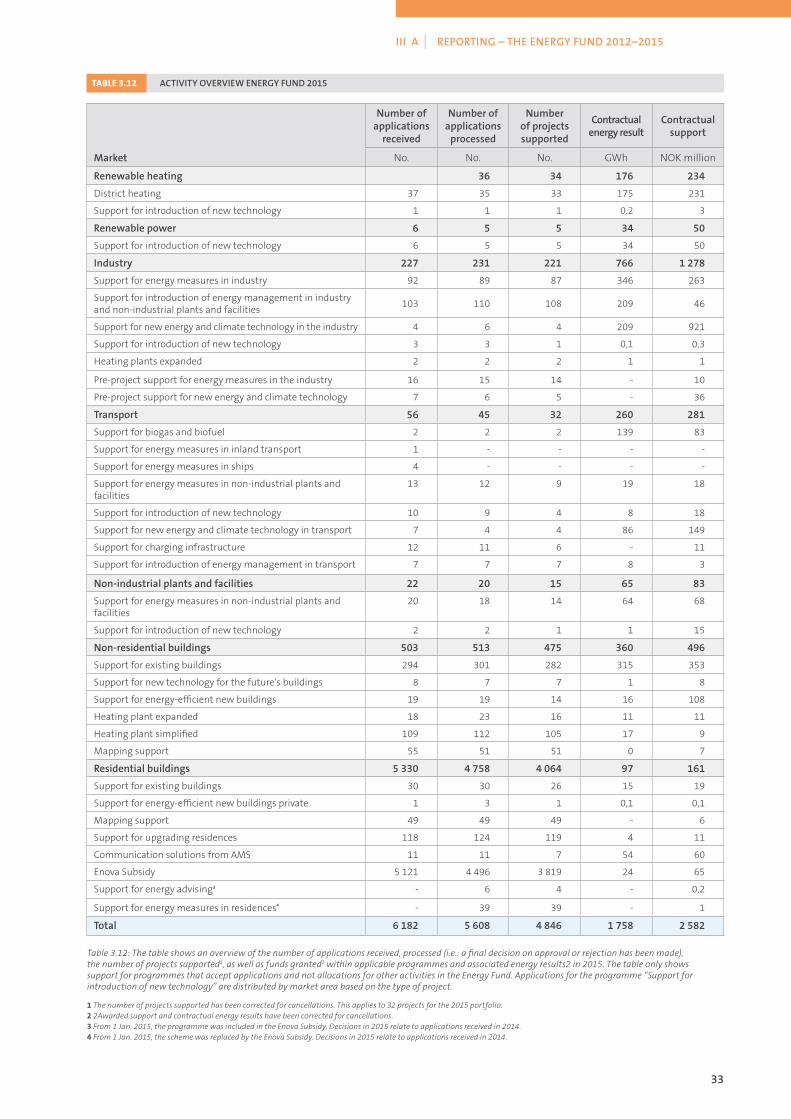
33
III A | REPORTING – THE ENERGY FUND 2012–2015
Table 3.12: The table shows an overview of the number of applications received, processed (i.e.: a final decision on approval or rejection has been made), the number of projects supported1, as well as funds granted2 within applicable programmes and associated energy results2 in 2015. The table only shows support for programmes that accept applications and not allocations for other activities in the Energy Fund. Applications for the programme “Support for introduction of new technology” are distributed by market area based on the type of project.
TABLE 3.12 ACTIVITYOVERVIEWENERGYFUND2015
1 The number of projects supported has been corrected for cancellations. This applies to 32 projects for the 2015 portfolio.2 2Awarded support and contractual energy results have been corrected for cancellations.3 From 1 Jan. 2015, the programme was included in the Enova Subsidy. Decisions in 2015 relate to applications received in 2014.4 From 1 Jan. 2015, the scheme was replaced by the Enova Subsidy. Decisions in 2015 relate to applications received in 2014.
Numberofapplications
received
Numberofapplications
processed
Numberofprojectssupported
Contractualenergyresult
Contractualsupport
Market No. No. No. GWh NOK million
Renewableheating 36 34 176 234
District heating 37 35 33 175 231
Support for introduction of new technology 1 1 1 0.2 3
Renewablepower 6 5 5 34 50
Support for introduction of new technology 6 5 5 34 50
Industry 227 231 221 766 1278
Support for energy measures in industry 92 89 87 346 263
Support for introduction of energy management in industry and non-industrial plants and facilities
103 110 108 209 46
Support for new energy and climate technology in the industry 4 6 4 209 921
Support for introduction of new technology 3 3 1 0,1 0,3
Heating plants expanded 2 2 2 1 1
Pre-project support for energy measures in the industry 16 15 14 - 10
Pre-project support for new energy and climate technology 7 6 5 - 36
Transport 56 45 32 260 281
Support for biogas and biofuel 2 2 2 139 83
Support for energy measures in inland transport 1 - - - -
Support for energy measures in ships 4 - - - -
Support for energy measures in non-industrial plants and facilities
13 12 9 19 18
Support for introduction of new technology 10 9 4 8 18
Support for new energy and climate technology in transport 7 4 4 86 149
Support for charging infrastructure 12 11 6 - 11
Support for introduction of energy management in transport 7 7 7 8 3
Non-industrialplantsandfacilities 22 20 15 65 83
Support for energy measures in non-industrial plants and facilities
20 18 14 64 68
Support for introduction of new technology 2 2 1 1 15
Non-residentialbuildings 503 513 475 360 496
Support for existing buildings 294 301 282 315 353
Support for new technology for the future's buildings 8 7 7 1 8
Support for energy-efficient new buildings 19 19 14 16 108
Heating plant expanded 18 23 16 11 11
Heating plant simplified 109 112 105 17 9
Mapping support 55 51 51 0 7
Residentialbuildings 5330 4758 4064 97 161
Support for existing buildings 30 30 26 15 19
Support for energy-efficient new buildings private 1 3 1 0,1 0,1
Mapping support 49 49 49 - 6
Support for upgrading residences 118 124 119 4 11
Communication solutions from AMS 11 11 7 54 60
Enova Subsidy 5 121 4 496 3 819 24 65
Support for energy advising³ - 6 4 - 0,2
Support for energy measures in residences4 - 39 39 - 1
Total 6182 5608 4846 1758 2582
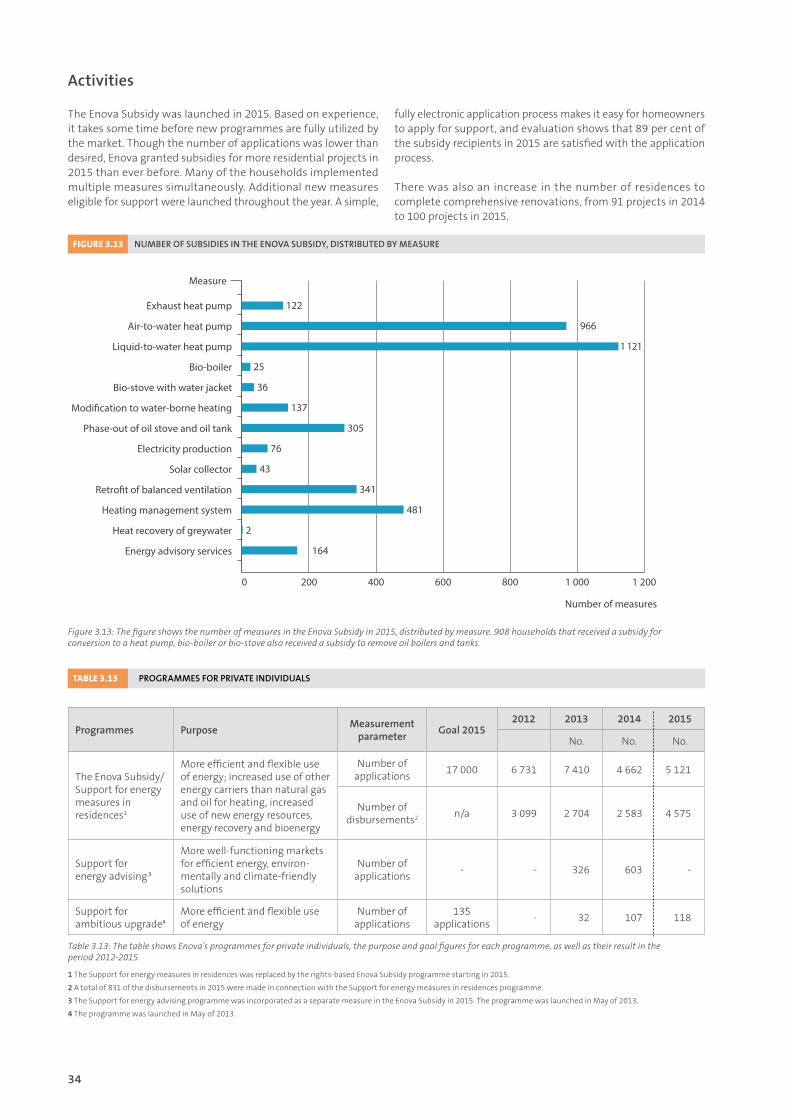
34
Activities
The Enova Subsidy was launched in 2015. Based on experience, it takes some time before new programmes are fully utilized by the market. Though the number of applications was lower than desired, Enova granted subsidies for more residential projects in 2015 than ever before. Many of the households implemented multiple measures simultaneously. Additional new measures eligible for support were launched throughout the year. A simple,
fully electronic application process makes it easy for homeowners to apply for support, and evaluation shows that 89 per cent of the subsidy recipients in 2015 are satisfied with the application process.
There was also an increase in the number of residences to complete comprehensive renovations, from 91 projects in 2014 to 100 projects in 2015.
Figure 3.13: The figure shows the number of measures in the Enova Subsidy in 2015, distributed by measure. 908 households that received a subsidy for conversion to a heat pump, bio-boiler or bio-stove also received a subsidy to remove oil boilers and tanks.
FIGURE 3.13 NUMBEROFSUBSIDIESINTHEENOVASUBSIDY,DISTRIBUTEDBYMEASURE
Exhaust heat pump
Number of measures
Measure
Air-to-water heat pump
Liquid-to-water heat pump
Bio-boiler
Bio-stove with water jacket
Modi�cation to water-borne heating
200
122
966
1 121
25
36
137
305
76
43
341
481
2
164
400 600 800 1 000 1 2000
Phase-out of oil stove and oil tank
Electricity production
Retro�t of balanced ventilation
Heating management system
Heat recovery of greywater
Energy advisory services
Solar collector
TABLE 3.13 PROGRAMMESFORPRIVATEINDIVIDUALS
Programmes PurposeMeasurement
parameterGoal2015
2012 2013 2014 2015
No. No. No.
The Enova Subsidy/Support for energy measures in residences1
More efficient and flexible use of energy; increased use of other energy carriers than natural gas and oil for heating, increased use of new energy resources, energy recovery and bioenergy
Number of applications
17 000 6 731 7 410 4 662 5 121
Number of disbursements2 n/a 3 099 2 704 2 583 4 575
Support for energy advising 3
More well-functioning markets for efficient energy, environ-mentally and climate-friendly solutions
Number of applications
- - 326 603 -
Support for ambitious upgrade4
More efficient and flexible use of energy
Number of applications
135 applications
- 32 107 118
Table 3.13: The table shows Enova’s programmes for private individuals, the purpose and goal figures for each programme, as well as their result in the period 2012-2015.
1The Support for energy measures in residences was replaced by the rights-based Enova Subsidy programme starting in 2015.
2A total of 831 of the disbursements in 2015 were made in connection with the Support for energy measures in residences programme.
3The Support for energy advising programme was incorporated as a separate measure in the Enova Subsidy in 2015. The programme was launched in May of 2013.
4The programme was launched in May of 2013.
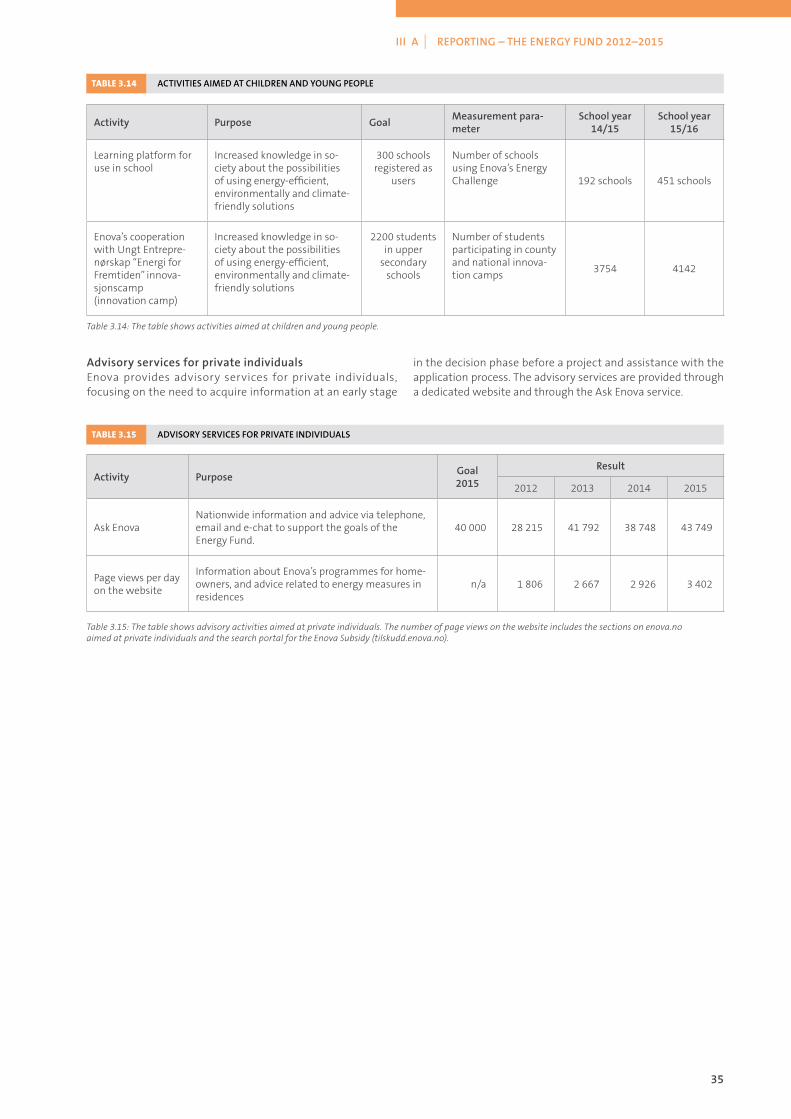
35
III A | REPORTING – THE ENERGY FUND 2012–2015
TABLE 3.14 ACTIVITIESAIMEDATCHILDRENANDYOUNGPEOPLE
Table 3.14: The table shows activities aimed at children and young people.
Activity Purpose GoalMeasurementpara-meter
Schoolyear14/15
Schoolyear15/16
Learning platform for use in school
Increased knowledge in so-ciety about the possibilities of using energy-efficient, environmentally and climate-friendly solutions
300 schools registered as
users
Number of schools using Enova’s Energy Challenge 192 schools 451 schools
Enova’s cooperation with Ungt Entrepre-nørskap “Energi for Fremtiden” innova-sjonscamp (innovation camp)
Increased knowledge in so-ciety about the possibilities of using energy-efficient, environmentally and climate-friendly solutions
2200 students in upper
secondary schools
Number of students participating in county and national innova-tion camps
3754 4142
TABLE 3.15 ADVISORYSERVICESFORPRIVATEINDIVIDUALS
Table 3.15: The table shows advisory activities aimed at private individuals. The number of page views on the website includes the sections on enova.no aimed at private individuals and the search portal for the Enova Subsidy (tilskudd.enova.no).
Activity PurposeGoal2015
Result
2012 2013 2014 2015
Ask EnovaNationwide information and advice via telephone, email and e-chat to support the goals of the Energy Fund.
40 000 28 215 41 792 38 748 43 749
Page views per day on the website
Information about Enova’s programmes for home-owners, and advice related to energy measures in residences
n/a 1 806 2 667 2 926 3 402
AdvisoryservicesforprivateindividualsEnova provides advisory services for private individuals, focusing on the need to acquire information at an early stage
in the decision phase before a project and assistance with the application process. The advisory services are provided through a dedicated website and through the Ask Enova service.
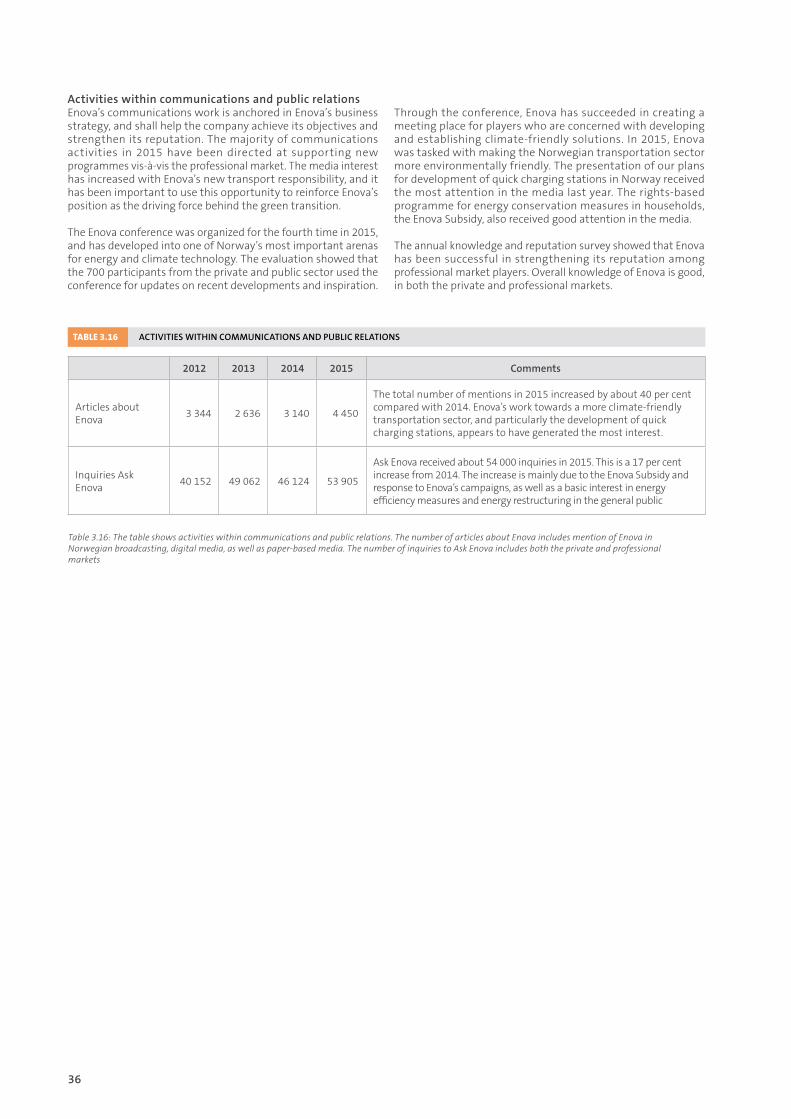
36
ActivitieswithincommunicationsandpublicrelationsEnova’s communications work is anchored in Enova’s business strategy, and shall help the company achieve its objectives and strengthen its reputation. The majority of communications activities in 2015 have been directed at supporting new programmes vis-à-vis the professional market. The media interest has increased with Enova’s new transport responsibility, and it has been important to use this opportunity to reinforce Enova’s position as the driving force behind the green transition.
The Enova conference was organized for the fourth time in 2015, and has developed into one of Norway’s most important arenas for energy and climate technology. The evaluation showed that the 700 participants from the private and public sector used the conference for updates on recent developments and inspiration.
Through the conference, Enova has succeeded in creating a meeting place for players who are concerned with developing and establishing climate-friendly solutions. In 2015, Enova was tasked with making the Norwegian transportation sector more environmentally friendly. The presentation of our plans for development of quick charging stations in Norway received the most attention in the media last year. The rights-based programme for energy conservation measures in households, the Enova Subsidy, also received good attention in the media.
The annual knowledge and reputation survey showed that Enova has been successful in strengthening its reputation among professional market players. Overall knowledge of Enova is good, in both the private and professional markets.
TABLE 3.16 ACTIVITIESWITHINCOMMUNICATIONSANDPUBLICRELATIONS
Table 3.16: The table shows activities within communications and public relations. The number of articles about Enova includes mention of Enova in Norwegian broadcasting, digital media, as well as paper-based media. The number of inquiries to Ask Enova includes both the private and professional markets
2012 2013 2014 2015 Comments
Articles about Enova
3 344 2 636 3 140 4 450
The total number of mentions in 2015 increased by about 40 per cent compared with 2014. Enova’s work towards a more climate-friendly transportation sector, and particularly the development of quick charging stations, appears to have generated the most interest.
Inquiries Ask Enova
40 152 49 062 46 124 53 905
Ask Enova received about 54 000 inquiries in 2015. This is a 17 per cent increase from 2014. The increase is mainly due to the Enova Subsidy and response to Enova’s campaigns, as well as a basic interest in energy efficiency measures and energy restructuring in the general public
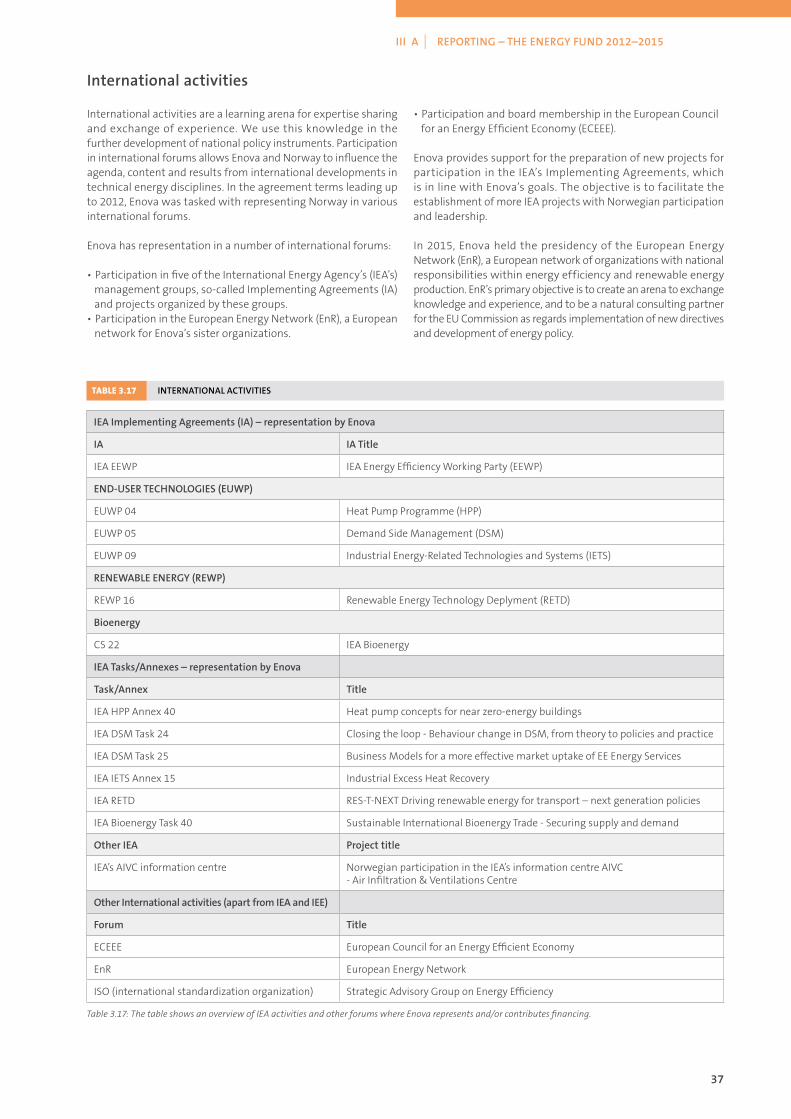
37
III A | REPORTING – THE ENERGY FUND 2012–2015
Internationalactivities
International activities are a learning arena for expertise sharing and exchange of experience. We use this knowledge in the further development of national policy instruments. Participation in international forums allows Enova and Norway to influence the agenda, content and results from international developments in technical energy disciplines. In the agreement terms leading up to 2012, Enova was tasked with representing Norway in various international forums.
Enova has representation in a number of international forums:
• Participation in five of the International Energy Agency’s (IEA’s) management groups, so-called Implementing Agreements (IA) and projects organized by these groups.• Participation in the European Energy Network (EnR), a European network for Enova’s sister organizations.
• Participation and board membership in the European Council for an Energy Efficient Economy (ECEEE).
Enova provides support for the preparation of new projects for participation in the IEA’s Implementing Agreements, which is in line with Enova’s goals. The objective is to facilitate the establishment of more IEA projects with Norwegian participation and leadership.
In 2015, Enova held the presidency of the European Energy Network (EnR), a European network of organizations with national responsibilities within energy efficiency and renewable energy production. EnR’s primary objective is to create an arena to exchange knowledge and experience, and to be a natural consulting partner for the EU Commission as regards implementation of new directives and development of energy policy.
TABLE 3.17 INTERNATIONALACTIVITIES
Table 3.17: The table shows an overview of IEA activities and other forums where Enova represents and/or contributes financing.
IEAImplementingAgreements(IA)–representationbyEnova
IA IATitle
IEA EEWP IEA Energy Efficiency Working Party (EEWP)
END-USERTECHNOLOGIES(EUWP)
EUWP 04 Heat Pump Programme (HPP)
EUWP 05 Demand Side Management (DSM)
EUWP 09 Industrial Energy-Related Technologies and Systems (IETS)
RENEWABLEENERGY(REWP)
REWP 16 Renewable Energy Technology Deplyment (RETD)
Bioenergy
CS 22 IEA Bioenergy
IEATasks/Annexes–representationbyEnova
Task/Annex Title
IEA HPP Annex 40 Heat pump concepts for near zero-energy buildings
IEA DSM Task 24 Closing the loop - Behaviour change in DSM, from theory to policies and practice
IEA DSM Task 25 Business Models for a more effective market uptake of EE Energy Services
IEA IETS Annex 15 Industrial Excess Heat Recovery
IEA RETD RES-T-NEXT Driving renewable energy for transport – next generation policies
IEA Bioenergy Task 40 Sustainable International Bioenergy Trade - Securing supply and demand
OtherIEA Projecttitle
IEA’s AIVC information centre Norwegian participation in the IEA’s information centre AIVC - Air Infiltration & Ventilations Centre
OtherInternationalactivities(apartfromIEAandIEE)
Forum Title
ECEEE European Council for an Energy Efficient Economy
EnR European Energy Network
ISO (international standardization organization) Strategic Advisory Group on Energy Efficiency
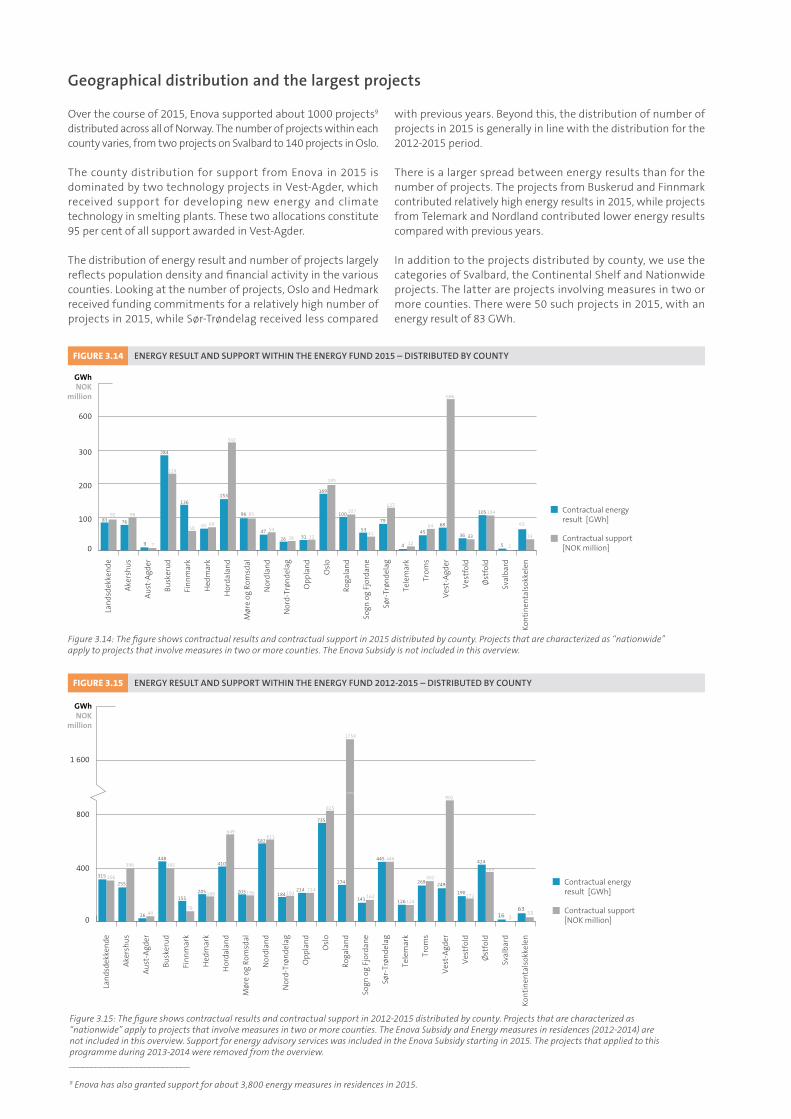
Geographicaldistributionandthelargestprojects
Over the course of 2015, Enova supported about 1000 projects9
distributed across all of Norway. The number of projects within each county varies, from two projects on Svalbard to 140 projects in Oslo.
The county distribution for support from Enova in 2015 is dominated by two technology projects in Vest-Agder, which received support for developing new energy and climate technology in smelting plants. These two allocations constitute 95 per cent of all support awarded in Vest-Agder.
The distribution of energy result and number of projects largely reflects population density and financial activity in the various counties. Looking at the number of projects, Oslo and Hedmark received funding commitments for a relatively high number of projects in 2015, while Sør-Trøndelag received less compared
with previous years. Beyond this, the distribution of number of projects in 2015 is generally in line with the distribution for the 2012-2015 period.
There is a larger spread between energy results than for the number of projects. The projects from Buskerud and Finnmark contributed relatively high energy results in 2015, while projects from Telemark and Nordland contributed lower energy results compared with previous years.
In addition to the projects distributed by county, we use the categories of Svalbard, the Continental Shelf and Nationwide projects. The latter are projects involving measures in two or more counties. There were 50 such projects in 2015, with an energy result of 83 GWh.
___________________________
9 Enova has also granted support for about 3,800 energy measures in residences in 2015.
Figure 3.14: The figure shows contractual results and contractual support in 2015 distributed by county. Projects that are characterized as “nationwide” apply to projects that involve measures in two or more counties. The Enova Subsidy is not included in this overview.
FIGURE 3.14 ENERGYRESULTANDSUPPORTWITHINTHEENERGYFUND2015–DISTRIBUTEDBYCOUNTY
Figure 3.15: The figure shows contractual results and contractual support in 2012-2015 distributed by county. Projects that are characterized as “nationwide” apply to projects that involve measures in two or more counties. The Enova Subsidy and Energy measures in residences (2012-2014) are not included in this overview. Support for energy advisory services was included in the Enova Subsidy starting in 2015. The projects that applied to this programme during 2013-2014 were removed from the overview.
FIGURE 3.15 ENERGYRESULTANDSUPPORTWITHINTHEENERGYFUND2012-2015–DISTRIBUTEDBYCOUNTY
0
100
200
300
600
GWhNOK
million
Osl
o
Land
sdek
kend
e
Aker
shus
Aust
-Agd
er
Busk
erud
Finn
mar
k
Hed
mar
k
Hor
dala
nd
Mør
e og
Rom
sdal
Nor
d-Tr
ønde
lag
Opp
land
Roga
land
Sogn
og
Fjor
dane
Sør-
Trøn
dela
g
Tele
mar
k
Trom
s
Vest
-Agd
er
Vest
fold
Øst
fold
Sval
bard
Kont
inen
tals
okke
len
Nor
dlan
d
Contractual energy result [GWh]
Contractual support [NOK million]
83 769892
9 7
284
229
136
58 65 69
96 95
47 54
26 28 31 32
100 107
5341
79
127
4 12
4564
36 33
105 104
5 1
63
33
68
696
169
195
153
342
Land
sdek
kend
e
Aker
shus
Aust
-Agd
er
Busk
erud
Finn
mar
k
Hed
mar
k
Hor
dala
nd
Mør
e og
Rom
sdal
Nor
d-Tr
ønde
lag
Opp
land
Osl
o
Roga
land
Sogn
og
Fjor
dane
Sør-
Trøn
dela
g
Tele
mar
k
Trom
s
Vest
-Agd
er
Vest
fold
Øst
fold
Sval
bard
Kont
inen
tals
okke
len
Nor
dlan
d
0
400
800
1 600
315255
396
306
26 40
448395
155
78
205 188 203 196
582611
184 193214 214
274
1759
141 162
445 446
126 124
269302
190172
424369
16 363
33
249
902
735
825
410
649
GWhNOK
million
Contractual energy result [GWh]
Contractual support [NOK million]
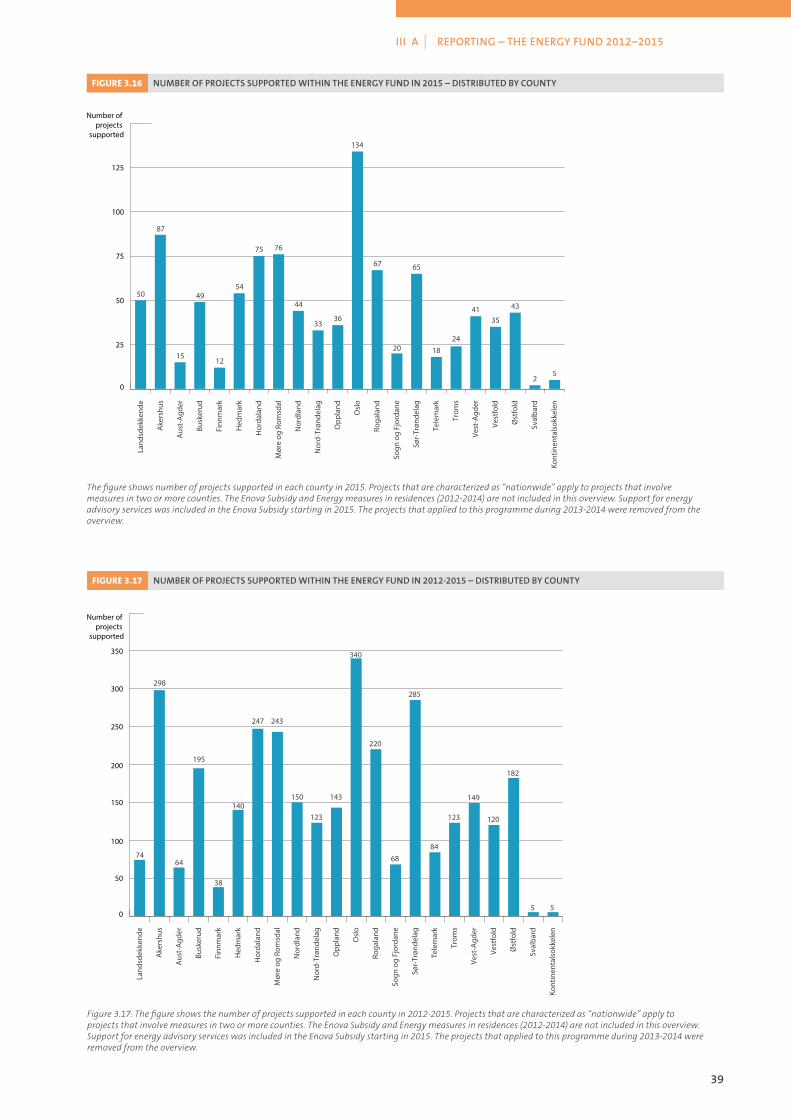
39
III A | REPORTING – THE ENERGY FUND 2012–2015
The figure shows number of projects supported in each county in 2015. Projects that are characterized as “nationwide” apply to projects that involve measures in two or more counties. The Enova Subsidy and Energy measures in residences (2012-2014) are not included in this overview. Support for energy advisory services was included in the Enova Subsidy starting in 2015. The projects that applied to this programme during 2013-2014 were removed from the overview.
FIGURE 3.16 NUMBEROFPROJECTSSUPPORTEDWITHINTHEENERGYFUNDIN2015–DISTRIBUTEDBYCOUNTY
Land
sdek
kend
e
Ake
rshu
s
Aus
t-A
gder
Busk
erud
Finn
mar
k
Hed
mar
k
50
87
1512
54
75 76
44
3336
134
67
20
65
1824
4135
43
25
49
Hor
dala
nd
Mør
e og
Rom
sdal
Nor
d-Tr
ønde
lag
Opp
land
Osl
o
Roga
land
Sogn
og
Fjor
dane
Sør-
Trøn
dela
g
Tele
mar
k
Trom
s
Vest
-Agd
er
Vest
fold
Øst
fold
Kont
inen
tals
okke
len
Sval
bard
Nor
dlan
d
0
25
50
75
100
125
Number of projects
supported
Figure 3.17: The figure shows the number of projects supported in each county in 2012-2015. Projects that are characterized as “nationwide” apply to projects that involve measures in two or more counties. The Enova Subsidy and Energy measures in residences (2012-2014) are not included in this overview. Support for energy advisory services was included in the Enova Subsidy starting in 2015. The projects that applied to this programme during 2013-2014 were removed from the overview.
FIGURE 3.17 NUMBEROFPROJECTSSUPPORTEDWITHINTHEENERGYFUNDIN2012-2015–DISTRIBUTEDBYCOUNTY
Number of projects
supported
Land
sdek
kend
e
Ake
rshu
s
Aus
t-A
gder
Busk
erud
Finn
mar
k
Hed
mar
k
74
298
64
38
140
247 243
150
123
143
340
220
68
285
84
123
149
120
182
5 5
195
Hor
dala
nd
Mør
e og
Rom
sdal
Nor
d-Tr
ønde
lag
Opp
land
Osl
o
Roga
land
Sogn
og
Fjor
dane
Sør-
Trøn
dela
g
Tele
mar
k
Trom
s
Vest
-Agd
er
Vest
fold
Øst
fold
Kont
inen
tals
okke
len
Sval
bard
Nor
dlan
d
0
50
100
150
200
250
300
350

40
Table 3.19: The table shows the ten largest projects in 2015 measured by contractual energy result
TABLE 3.19 TOP10IN2015–PROJECTSWITHTHEHIGHESTENERGYRESULT
Market Projectdescription Applicant
Contractualenergyresult
Contractualsupport
GWh NOK million
IndustryEstablishment of a demonstration plant for a bio-based coal substitute
Arba Follum AS 143 138
Transport Upgrade plant for biogas at Veas Vestfjorden Avløpsselskap (VEAS) 93 31
Industry Installation of electrochlorinator Statoil Petroleum AS Melkøya 89 41
Transport Environmentally friendly ferries in Hordaland Hordaland county authority 62 134
Transport Biogas project at Norske Skog Saugbrugs Norske Skog Saugbrugs AS 46 52
IndustryIntroduction of Energy Management at Gullfaks
Statoil Petroleum AS Gullfaks 43 1
Non-industrial plants and facilities
Increased district heating deliveries Oslo – Forbrenningslinje 3 – Heat pump project 2015-2016
Klemetsrudanlegget AS 40 42
Industry Copper demonstration plant Glencore Nikkelverk AS 35 380
Renewable heating
District heating Finnsnes Finnsnes Fjernvarme AS 34 52
Renewable power
Test turbine – Smøla Statkraft AS 31 31
TABLE 3.18 TOP10IN2015–PROJECTSWITHTHEHIGHESTAWARDEDFUNDINGLEVEL
Table 3.18: The table shows the ten largest projects in 2015 measured by contractual funding level
Market Projectdescription Applicant
Contractualenergyresult
Contractualsupport
GWh NOK million
Industry Copper demonstration plant Glencore Nikkelverk AS 35 380
Industry Alcoa Advanced Smelting Technology Alcoa Norway ANS 10 280
IndustryEstablishment of a demonstration plant for a bio-based coal substitute
Arba Follum AS 143 138
Transport Environmentally friendly ferries in Hordaland Hordaland County Authority 62 134
IndustryApplication for support for new energy and climate technology
Tizir Titanium og Iron AS 22 123
Renewable heating
District heating Finnsnes Finnsnes Fjernvarme AS 34 52
Transport Biogas project at Norske Skog Saugbrugs Norske Skog Saugbrugs AS 46 52
Non-industrial plants and facilities
Increased district heating deliveries Oslo – Forbrenningslinje 3 – Heat pump project 2015-2016
Klemetsrudanlegget AS 40 42
Industry Installation of electrochlorinatorStatoil Petroleum AS Melkøya
89 41
Non-residential buildings
Powerhouse Brattørkaia Entra Eiendom AS 4 37

41
III B | REPORTING – THE ENERGY FUND 2001–2011
Del III B: Reporting – the Energy Fund 2001–2011
Energy results and allocations 2001–2011
Table 3.20 shows the allocation of funds from the Energy Fund and total energy results during the 2001-2011 period, updated at the end of 2015, distributed by market and year. This table takes a basis in the year the funds were allocated, not the year the framework was awarded. Cancelled projects must be corrected for energy results for the year the contract was originally signed and recorded. The contractual support amount will be released and returned to the Energy Fund so it can be put into new projects. The fact that cancellations are corrected with retroactive effect, results in released funds and transfer of resources between years.
Enova awarded about NOK 8 billion in support for energy projects during the 2001-2011 period. The total investments which the support will trigger amount to more than NOK 40 billion. Enova’s support percentage varies from market to market. In building, heating and industry projects, the support averaged less than 20 per cent of the projects’ total investments during the agreement period. Within new technology projects, the support constituted between 25 and 50 per cent of investments.
Table 3.20: The table shows aggregated energy results and funds allocated from the Energy Fund in the period 2001-2011, corrected for cancelled and final reported projects as of 2015. Funds for the NVE projects from 2001 (NOK 385 million) have not been distributed in the various markets. The associated energy result has been distributed by market and totals 820 GWh.
1 For the 2001-2011 portfolio, non-residential buildings also includes non-industrial plants and facilities.
2 The household subsidy programme for electricity conservation was incorporated in the Energy Fund from 1 July 2011, and the results are recorded from this time.
TABLE 3.20 ENERGYRESULTSANDALLOCATIONS2001-2011
2001 2002 2003 2004 2005 2006 2007 2008 2009 2010 2011 Total
GW
h
MN
OK
GW
h
MN
OK
GW
h
MN
OK
GW
h
MN
OK
GW
h
MN
OK
GW
h
MN
OK
GW
h
MN
OK
GW
h
MN
OK
GW
h
MN
OK
GW
h
MN
OK
GW
h
MN
OK
GW
h
MN
OK
Renewable heating 328 - 173 49 233 31 135 69 167 64 572 278 367 161 684 345 663 511 562 282 368 297 4 251 2 087
Biofuel production - - - - 154 3 255 14 162 6 100 4 167 5 67 3 - 2 - - - - 906 38
Renewable power 120 - 80 35 127 27 441 186 334 137 - - - - 55 80 453 1 041 498 916 - - 2 107 2 422
Industry 300 - 157 19 136 16 360 56 248 34 556 92 573 106 206 42 807 317 183 69 84 39 3 610 789
New technology 28 - 1 19 - - - 9 - 2 2 7 8 71 1 13 2 45 15 51 7 20 64 236
Non-residential buildings1 44 - 147 56 300 65 265 65 556 112 363 101 188 67 351 132 252 489 184 156 504 484 3 154 1 729
Residential buildings2 - - - - - 12 - 12 - 14 - 36 10 45 - 56 - 62 - 72 42 106 52 416
Analyses, development and strategy
- - - 7 - 7 - 6 - 5 - 8 - 11 - 9 - 9 - 17 - 28 - 107
International work - - - 6 - 7 - 7 - 12 - 11 - 6 - 4 - 9 - 8 - 7 - 75
Communications and public relations
- - - 112 - 40 - 26 - 47 - 19 - 21 - 44 - 25 - 24 - 56 - 413
Administration - - - 42 - 36 - 41 - 45 - 47 - 61 - 75 - 100 - 93 - 95 - 635
NVE contracts (2001)* - 385 - - - - - - - - - - - - - - - - - - - - - 385
Total 820 385 557 346 949 244 1456 491 1468 478 1593 602 1313 553 1364 803 2177 2609 1442 1688 1004 1132 14145 9331
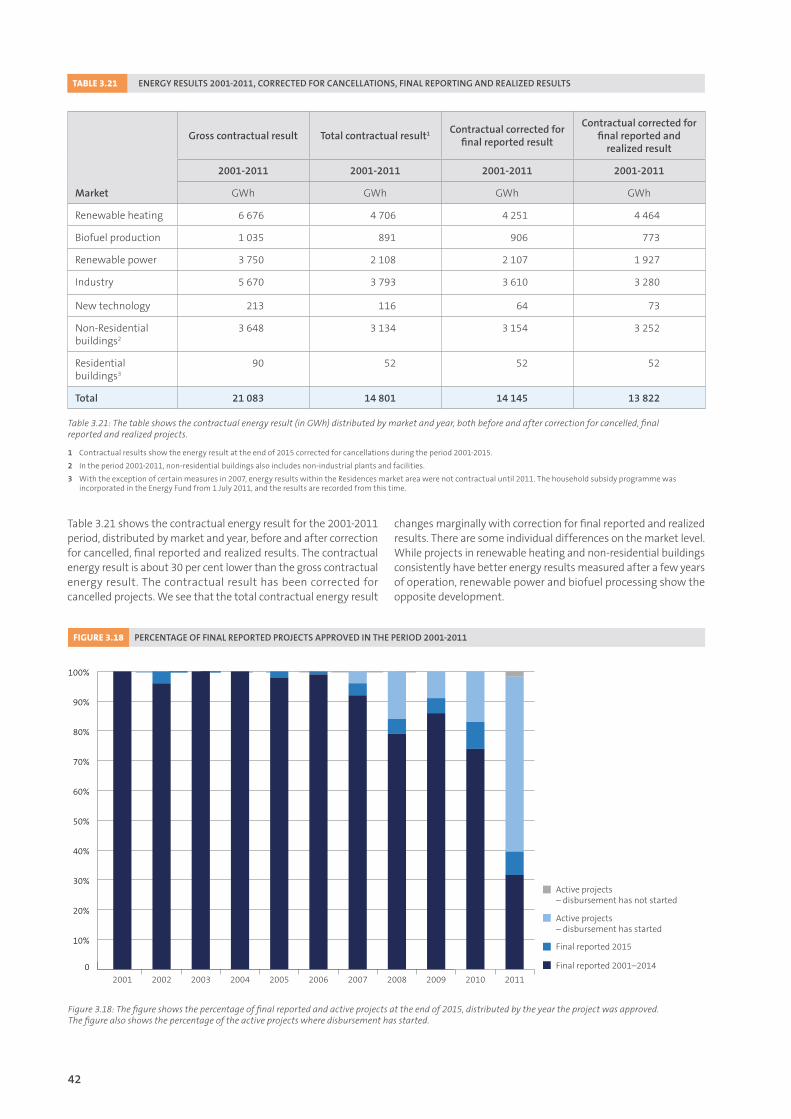
42
Table 3.21: The table shows the contractual energy result (in GWh) distributed by market and year, both before and after correction for cancelled, final reported and realized projects.
TABLE 3.21 ENERGYRESULTS2001-2011,CORRECTEDFORCANCELLATIONS,FINALREPORTINGANDREALIZEDRESULTS
1 Contractual results show the energy result at the end of 2015 corrected for cancellations during the period 2001-2015.
2 In the period 2001-2011, non-residential buildings also includes non-industrial plants and facilities.
3 With the exception of certain measures in 2007, energy results within the Residences market area were not contractual until 2011. The household subsidy programme was incorporated in the Energy Fund from 1 July 2011, and the results are recorded from this time.
Grosscontractualresult Totalcontractualresult1 Contractualcorrectedforfinalreportedresult
Contractualcorrectedforfinalreportedand
realizedresult
2001-2011 2001-2011 2001-2011 2001-2011
Market GWh GWh GWh GWh
Renewable heating 6 676 4 706 4 251 4 464
Biofuel production 1 035 891 906 773
Renewable power 3 750 2 108 2 107 1 927
Industry 5 670 3 793 3 610 3 280
New technology 213 116 64 73
Non-Residential buildings2
3 648 3 134 3 154 3 252
Residential buildings3
90 52 52 52
Total 21083 14801 14145 13822
Table 3.21 shows the contractual energy result for the 2001-2011 period, distributed by market and year, before and after correction for cancelled, final reported and realized results. The contractual energy result is about 30 per cent lower than the gross contractual energy result. The contractual result has been corrected for cancelled projects. We see that the total contractual energy result
changes marginally with correction for final reported and realized results. There are some individual differences on the market level. While projects in renewable heating and non-residential buildings consistently have better energy results measured after a few years of operation, renewable power and biofuel processing show the opposite development.
Figure 3.18: The figure shows the percentage of final reported and active projects at the end of 2015, distributed by the year the project was approved. The figure also shows the percentage of the active projects where disbursement has started.
FIGURE 3.18 PERCENTAGEOFFINALREPORTEDPROJECTSAPPROVEDINTHEPERIOD2001-2011
2001 2002 2003 2004 2005 2006 2007 2008 2009 2010 20110
10%
20%
30%
40%
50%
60%
70%
80%
90%
100%
Final reported 2001–2014
Final reported 2015
Active projects – disbursement has started
Active projects – disbursement has not started
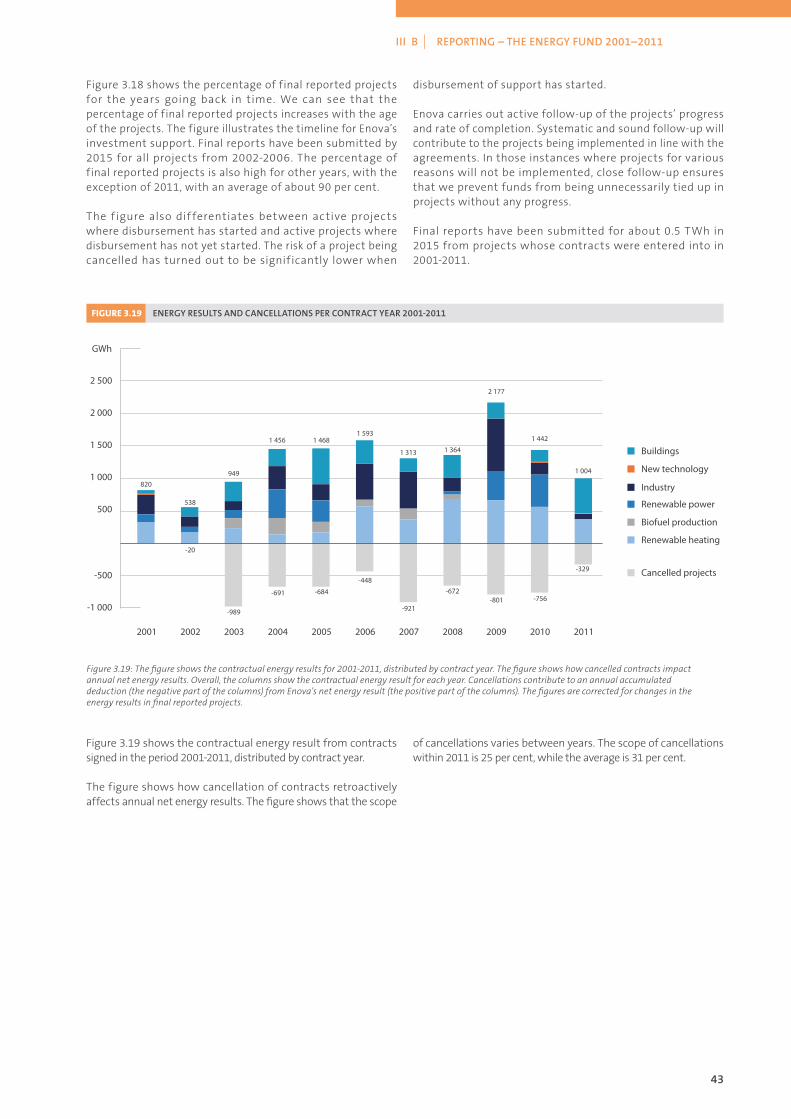
43
III B | REPORTING – THE ENERGY FUND 2001–2011
Figure 3.19: The figure shows the contractual energy results for 2001-2011, distributed by contract year. The figure shows how cancelled contracts impact annual net energy results. Overall, the columns show the contractual energy result for each year. Cancellations contribute to an annual accumulated deduction (the negative part of the columns) from Enova’s net energy result (the positive part of the columns). The figures are corrected for changes in the energy results in final reported projects.
FIGURE 3.19 ENERGYRESULTSANDCANCELLATIONSPERCONTRACTYEAR2001-2011
820
538
-20
-989
-691 -684
-921
-672-801 -756
-329
-448
949
1 456 1 4681 593
1 313 1 364
2 177
1 442
1 004
500
1 000
-1 000
-500
1 500
2 000
2 500
GWh
Industry
Renewable power
Biofuel production
Renewable heating
Cancelled projects
Buildings
New technology
2001 2002 2003 2004 2005 2006 2007 2008 2009 2010 2011
Figure 3.18 shows the percentage of final reported projects for the years going back in time. We can see that the percentage of final reported projects increases with the age of the projects. The figure illustrates the timeline for Enova’s investment support. Final reports have been submitted by 2015 for all projects from 2002-2006. The percentage of final reported projects is also high for other years, with the exception of 2011, with an average of about 90 per cent.
The f igure also dif ferentiates between active projects where disbursement has started and active projects where disbursement has not yet started. The risk of a project being cancelled has turned out to be significantly lower when
disbursement of support has started.
Enova carries out active follow-up of the projects’ progress and rate of completion. Systematic and sound follow-up will contribute to the projects being implemented in line with the agreements. In those instances where projects for various reasons will not be implemented, close follow-up ensures that we prevent funds from being unnecessarily tied up in projects without any progress.
Final reports have been submitted for about 0.5 TWh in 2015 from projects whose contracts were entered into in 2001-2011.
Figure 3.19 shows the contractual energy result from contracts signed in the period 2001-2011, distributed by contract year.
The figure shows how cancellation of contracts retroactively affects annual net energy results. The figure shows that the scope
of cancellations varies between years. The scope of cancellations within 2011 is 25 per cent, while the average is 31 per cent.
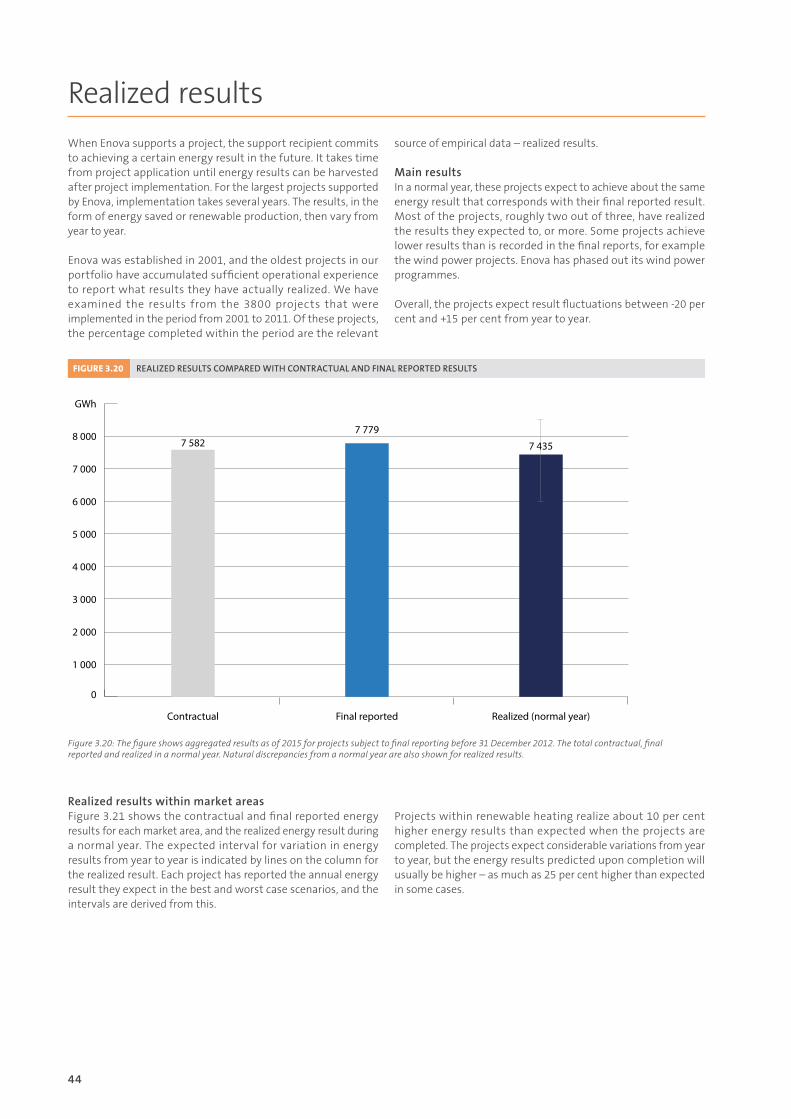
44
Realized results
When Enova supports a project, the support recipient commits to achieving a certain energy result in the future. It takes time from project application until energy results can be harvested after project implementation. For the largest projects supported by Enova, implementation takes several years. The results, in the form of energy saved or renewable production, then vary from year to year.
Enova was established in 2001, and the oldest projects in our portfolio have accumulated sufficient operational experience to report what results they have actually realized. We have examined the results from the 3800 projects that were implemented in the period from 2001 to 2011. Of these projects, the percentage completed within the period are the relevant
source of empirical data – realized results.
MainresultsIn a normal year, these projects expect to achieve about the same energy result that corresponds with their final reported result. Most of the projects, roughly two out of three, have realized the results they expected to, or more. Some projects achieve lower results than is recorded in the final reports, for example the wind power projects. Enova has phased out its wind power programmes.
Overall, the projects expect result fluctuations between -20 per cent and +15 per cent from year to year.
RealizedresultswithinmarketareasFigure 3.21 shows the contractual and final reported energy results for each market area, and the realized energy result during a normal year. The expected interval for variation in energy results from year to year is indicated by lines on the column for the realized result. Each project has reported the annual energy result they expect in the best and worst case scenarios, and the intervals are derived from this.
Projects within renewable heating realize about 10 per cent higher energy results than expected when the projects are completed. The projects expect considerable variations from year to year, but the energy results predicted upon completion will usually be higher – as much as 25 per cent higher than expected in some cases.
Figure 3.20: The figure shows aggregated results as of 2015 for projects subject to final reporting before 31 December 2012. The total contractual, final reported and realized in a normal year. Natural discrepancies from a normal year are also shown for realized results.
FIGURE 3.20 REALIZEDRESULTSCOMPAREDWITHCONTRACTUALANDFINALREPORTEDRESULTS
0
1 000
2 000
3 000
4 000
5 000
6 000
7 000
8 000
GWh
Realized (normal year)Final reportedContractual
7 5827 779
7 435
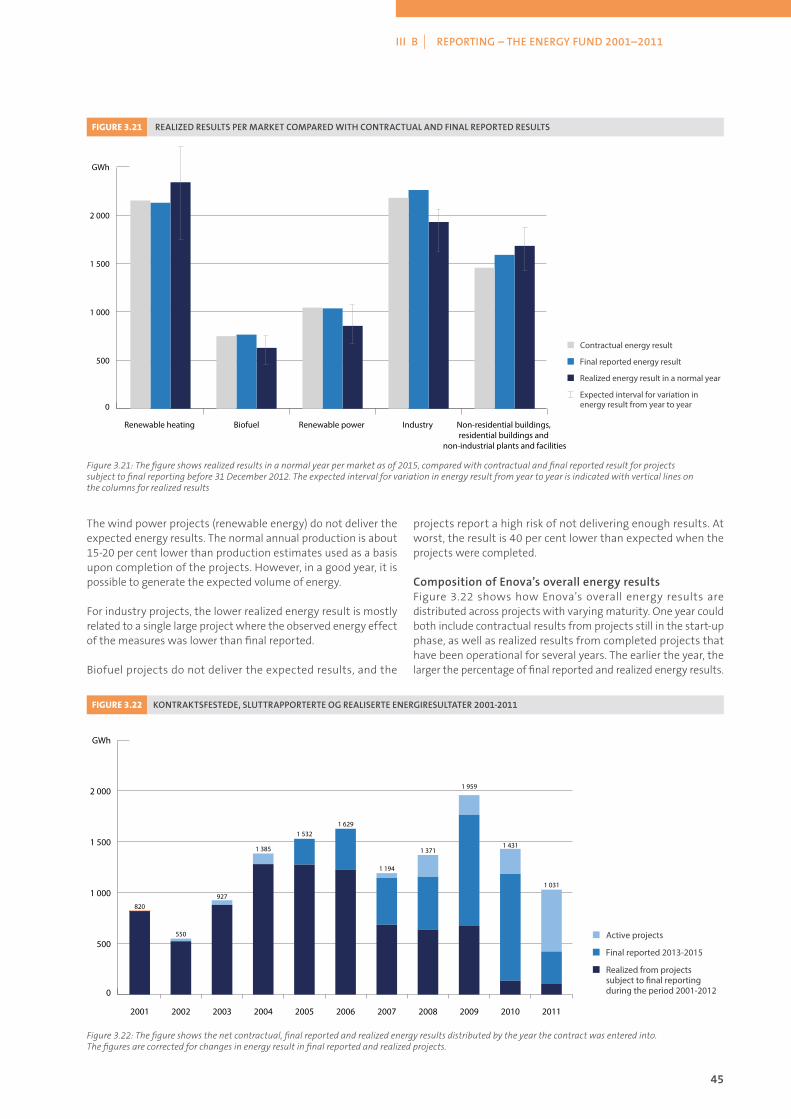
45
III B | REPORTING – THE ENERGY FUND 2001–2011
The wind power projects (renewable energy) do not deliver the expected energy results. The normal annual production is about 15-20 per cent lower than production estimates used as a basis upon completion of the projects. However, in a good year, it is possible to generate the expected volume of energy.
For industry projects, the lower realized energy result is mostly related to a single large project where the observed energy effect of the measures was lower than final reported.
Biofuel projects do not deliver the expected results, and the
projects report a high risk of not delivering enough results. At worst, the result is 40 per cent lower than expected when the projects were completed.
CompositionofEnova’soverallenergyresultsFigure 3.22 shows how Enova’s overall energy results are distributed across projects with varying maturity. One year could both include contractual results from projects still in the start-up phase, as well as realized results from completed projects that have been operational for several years. The earlier the year, the larger the percentage of final reported and realized energy results.
Figure 3.21: The figure shows realized results in a normal year per market as of 2015, compared with contractual and final reported result for projects subject to final reporting before 31 December 2012. The expected interval for variation in energy result from year to year is indicated with vertical lines on the columns for realized results
FIGURE 3.21 REALIZEDRESULTSPERMARKETCOMPAREDWITHCONTRACTUALANDFINALREPORTEDRESULTS
0
500
1 000
1 500
2 000
GWh
Non-residential buildings, residential buildings and
non-industrial plants and facilities
Industry Renewable power BiofuelRenewable heating
Contractual energy result
Final reported energy result
Realized energy result in a normal year
Expected interval for variation in energy result from year to year
Figure 3.22: The figure shows the net contractual, final reported and realized energy results distributed by the year the contract was entered into. The figures are corrected for changes in energy result in final reported and realized projects.
FIGURE 3.22 KONTRAKTSFESTEDE,SLUTTRAPPORTERTEOGREALISERTEENERGIRESULTATER2001-2011
Active projects
Final reported 2013-2015
Realized from projects subject to �nal reporting during the period 2001-20120
500
1 000
1 500
2 000
GWh
20112010200920082007200620052004200320022001
820927
1 385
1 5321 629
1 194
1 371
1 959
1 431
1 031
550

46
Climate reporting
This chapter summarizes the estimated volume of annual greenhouse gas emission reductions from Enova’s project portfolio for the 2001-2011 period.
In 2012, Enova further developed its database to show the energy and climate result for each project. The climate accounts for the agreement period 2012-2016 take a basis in the figures for contractual energy result (kWh) in Enova’s database and corresponding emission factors (for example CO
2 equivalents/
kWh) for the various energy carriers in the project. The climate accounts for the period 2001-2011, however, are based on a template assessment of the volume of oil reduction achieved for each market. It is assumed that half of the energy result from projects within renewable heating will replace oil and half will replace electricity. Each kWh in energy result from industry leads to an estimated reduction in oil consumption of about 34 per cent on average for the period 2001-2011. The energy results from renewable power and new technology are presumed to
have a 100 per cent impact via electricity as an energy carrier. That is why the reduction in oil consumption is estimated as zero in these areas. Projects within buildings are expected to result in a proportionately smaller reduction in oil consumption, about 12 per cent.
As a result of the above, there is significant uncertainty associated with estimated climate results for the project portfolio from 2001-2011. For example, Enova has supported projects that include conversion from or improved energy efficiency of other fossil fuels than oil, such as natural gas, etc. The climate impact of such measures has not been taken into consideration here, only the impact of estimated greenhouse gas reductions from improving the efficiency of oil consumption.
With a basis in energy results for 2001-2011, we estimate that projects supported by Enova during this period have a climate result of about 1 133 kilotonnes of CO
2 equivalents.
TABLE 3.22CLIMATERESULTFROMESTIMATEDREDUCTIONSINOILCONSUMPTIONFORPROJECTSSUPPORTEDBYENOVADURINGTHEPERIOD2001-2011
Table 3.22: The table shows the total energy result and the estimated reduction in greenhouse gas emissions as a result of reduced oil consumption from projects approved during the period 2001-2011. Biofuel production is not included in this table.
1 In the period 2001-2011, non-residential buildings also includes non-industrial plants and facilities.
2 With the exception of one measure in 2007, energy results within the Residential buildings market area were not made contractual until 2011.
The subsidy programme for electricity conservation in households was incorporated in the Energy Fund from 1 July 2011, and the results are recorded from this time.
MarketareaEnergyresult
Climateresultfromreducedoilconsumption
GWh ktonnes CO2 -eqv.
Renewable heating 4 251 644
Renewable power 2 107 -
Industry 3 610 372
New technology 64 -
Non-residential buildings1 3 154 115
Residential buildings2 52 2
Total 13238 1133
ClimateresultfromestimatedimprovedoilconsumptionefficiencyTable 3.22 shows the energy result distributed by market, and the corresponding estimated reduction in greenhouse gas emissions as a result of measures that have helped reduce oil consumption. The emission coefficients for oil were taken from the Ecoinvent database10.
Renewable heating and industry achieve the biggest reductions in greenhouse gas emissions, and correspondingly have the largest percentage of energy result from reduced oil consumption.
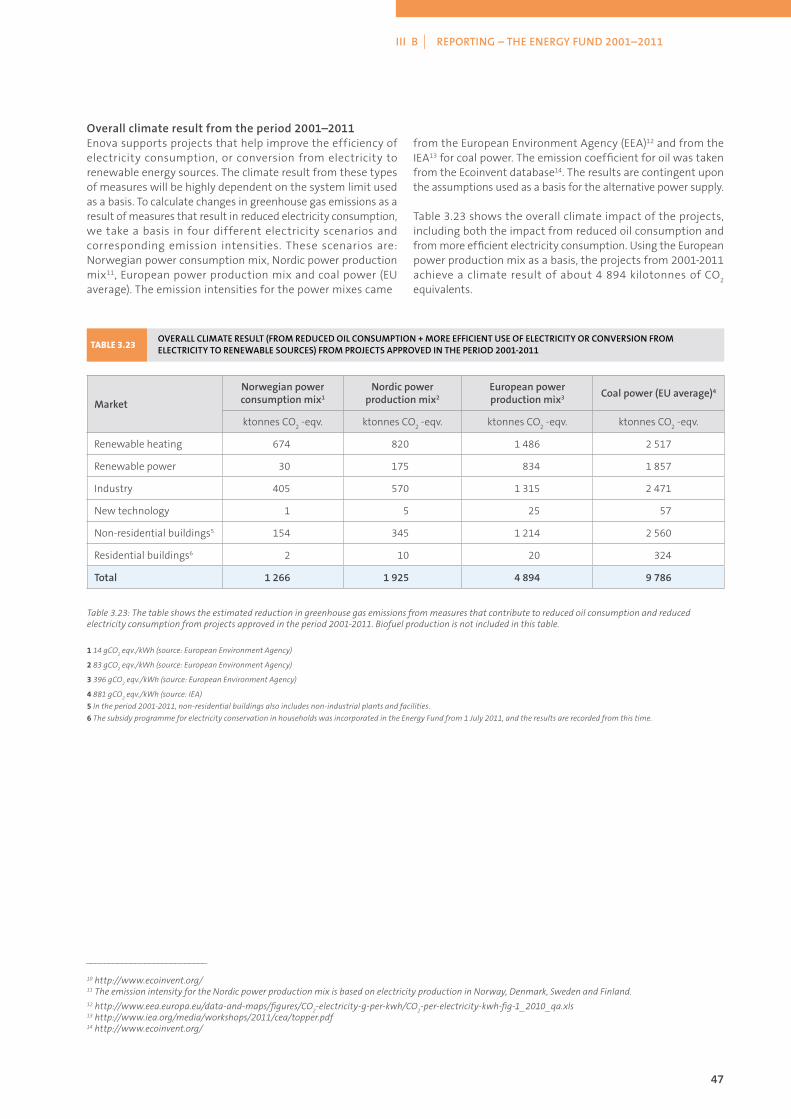
47
III B | REPORTING – THE ENERGY FUND 2001–2011
Overallclimateresultfromtheperiod2001–2011Enova supports projects that help improve the efficiency of electricity consumption, or conversion from electricity to renewable energy sources. The climate result from these types of measures will be highly dependent on the system limit used as a basis. To calculate changes in greenhouse gas emissions as a result of measures that result in reduced electricity consumption, we take a basis in four different electricity scenarios and corresponding emission intensities. These scenarios are: Norwegian power consumption mix, Nordic power production mix11, European power production mix and coal power (EU average). The emission intensities for the power mixes came
from the European Environment Agency (EEA)12 and from the IEA13 for coal power. The emission coefficient for oil was taken from the Ecoinvent database14. The results are contingent upon the assumptions used as a basis for the alternative power supply.
Table 3.23 shows the overall climate impact of the projects, including both the impact from reduced oil consumption and from more efficient electricity consumption. Using the European power production mix as a basis, the projects from 2001-2011 achieve a climate result of about 4 894 kilotonnes of CO
2
equivalents.
___________________________
10 http://www.ecoinvent.org/11 The emission intensity for the Nordic power production mix is based on electricity production in Norway, Denmark, Sweden and Finland. 12 http://www.eea.europa.eu/data-and-maps/figures/CO
2-electricity-g-per-kwh/CO
2-per-electricity-kwh-fig-1_2010_qa.xls
13 http://www.iea.org/media/workshops/2011/cea/topper.pdf14 http://www.ecoinvent.org/
OVERALLCLIMATERESULT(FROMREDUCEDOILCONSUMPTION+MOREEFFICIENTUSEOFELECTRICITYORCONVERSIONFROM ELECTRICITYTORENEWABLESOURCES)FROMPROJECTSAPPROVEDINTHEPERIOD2001-2011
Table 3.23: The table shows the estimated reduction in greenhouse gas emissions from measures that contribute to reduced oil consumption and reduced electricity consumption from projects approved in the period 2001-2011. Biofuel production is not included in this table.
1 14 gCO2 eqv./kWh (source: European Environment Agency)
2 83 gCO2 eqv./kWh (source: European Environment Agency)
3 396 gCO2 eqv./kWh (source: European Environment Agency)
4 881 gCO2 eqv./kWh (source: IEA)
5 In the period 2001-2011, non-residential buildings also includes non-industrial plants and facilities.
6 The subsidy programme for electricity conservation in households was incorporated in the Energy Fund from 1 July 2011, and the results are recorded from this time.
TABLE 3.23
Market
Norwegianpowerconsumptionmix1
Nordicpowerproductionmix2
Europeanpowerproductionmix3 Coalpower(EUaverage)4
ktonnes CO2 -eqv. ktonnes CO
2 -eqv. ktonnes CO
2 -eqv. ktonnes CO
2 -eqv.
Renewable heating 674 820 1 486 2 517
Renewable power 30 175 834 1 857
Industry 405 570 1 315 2 471
New technology 1 5 25 57
Non-residential buildings5 154 345 1 214 2 560
Residential buildings6 2 10 20 324
Total 1266 1925 4894 9786
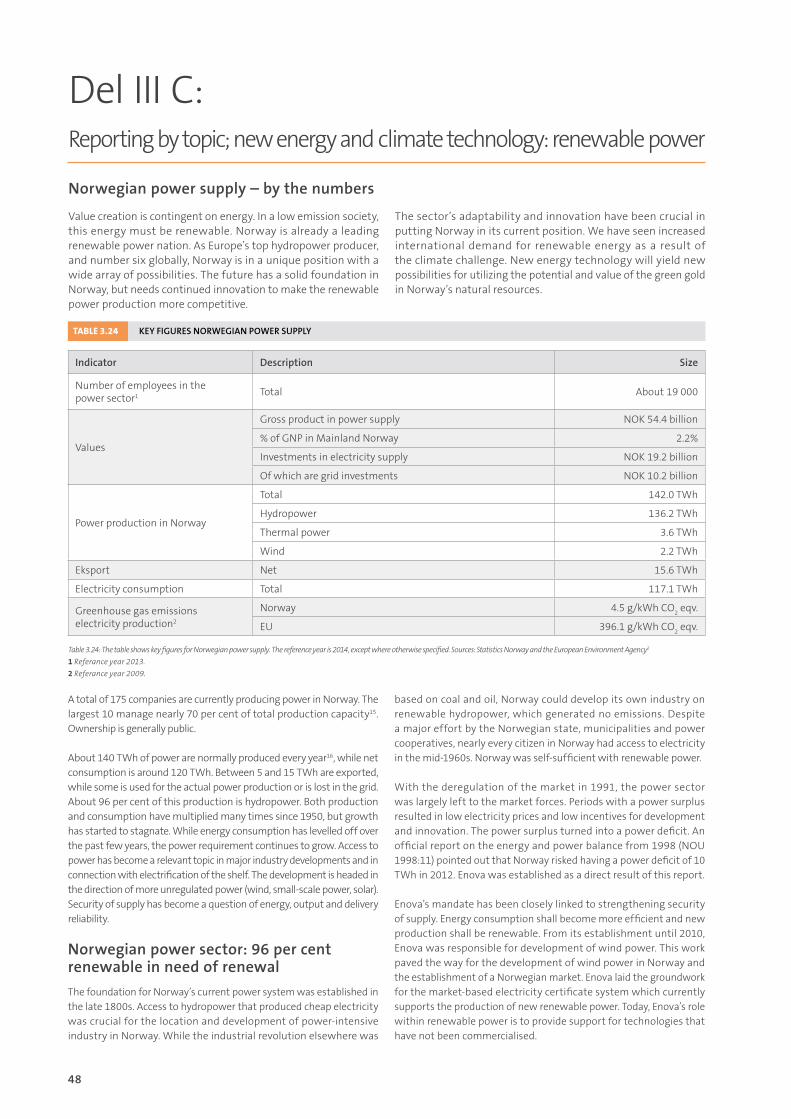
48
A total of 175 companies are currently producing power in Norway. The largest 10 manage nearly 70 per cent of total production capacity15. Ownership is generally public.
About 140 TWh of power are normally produced every year16, while net consumption is around 120 TWh. Between 5 and 15 TWh are exported, while some is used for the actual power production or is lost in the grid. About 96 per cent of this production is hydropower. Both production and consumption have multiplied many times since 1950, but growth has started to stagnate. While energy consumption has levelled off over the past few years, the power requirement continues to grow. Access to power has become a relevant topic in major industry developments and in connection with electrification of the shelf. The development is headed in the direction of more unregulated power (wind, small-scale power, solar). Security of supply has become a question of energy, output and delivery reliability.
Norwegianpowersector:96percentrenewableinneedofrenewal
The foundation for Norway’s current power system was established in the late 1800s. Access to hydropower that produced cheap electricity was crucial for the location and development of power-intensive industry in Norway. While the industrial revolution elsewhere was
based on coal and oil, Norway could develop its own industry on renewable hydropower, which generated no emissions. Despite a major effort by the Norwegian state, municipalities and power cooperatives, nearly every citizen in Norway had access to electricity in the mid-1960s. Norway was self-sufficient with renewable power.
With the deregulation of the market in 1991, the power sector was largely left to the market forces. Periods with a power surplus resulted in low electricity prices and low incentives for development and innovation. The power surplus turned into a power deficit. An official report on the energy and power balance from 1998 (NOU 1998:11) pointed out that Norway risked having a power deficit of 10 TWh in 2012. Enova was established as a direct result of this report.
Enova’s mandate has been closely linked to strengthening security of supply. Energy consumption shall become more efficient and new production shall be renewable. From its establishment until 2010, Enova was responsible for development of wind power. This work paved the way for the development of wind power in Norway and the establishment of a Norwegian market. Enova laid the groundwork for the market-based electricity certificate system which currently supports the production of new renewable power. Today, Enova’s role within renewable power is to provide support for technologies that have not been commercialised.
TABLE 3.24 KEYFIGURESNORWEGIANPOWERSUPPLY
Table 3.24: The table shows key figures for Norwegian power supply. The reference year is 2014, except where otherwise specified. Sources: Statistics Norway and the European Environment Agency2
1 Referance year 2013.
2 Referance year 2009.
Indicator Description Size
Number of employees in the power sector1 Total About 19 000
Values
Gross product in power supply NOK 54.4 billion
% of GNP in Mainland Norway 2.2%
Investments in electricity supply NOK 19.2 billion
Of which are grid investments NOK 10.2 billion
Power production in Norway
Total 142.0 TWh
Hydropower 136.2 TWh
Thermal power 3.6 TWh
Wind 2.2 TWh
Eksport Net 15.6 TWh
Electricity consumption Total 117.1 TWh
Greenhouse gas emissions electricity production2
Norway 4.5 g/kWh CO2 eqv.
EU 396.1 g/kWh CO2 eqv.
Del III C: Reporting by topic; new energy and climate technology: renewable power
Norwegianpowersupply–bythenumbers
Value creation is contingent on energy. In a low emission society, this energy must be renewable. Norway is already a leading renewable power nation. As Europe’s top hydropower producer, and number six globally, Norway is in a unique position with a wide array of possibilities. The future has a solid foundation in Norway, but needs continued innovation to make the renewable power production more competitive.
The sector’s adaptability and innovation have been crucial in putting Norway in its current position. We have seen increased international demand for renewable energy as a result of the climate challenge. New energy technology will yield new possibilities for utilizing the potential and value of the green gold in Norway’s natural resources.

49
III C | REPORTING BY TOPIC
___________________________
15 Source: http://energilink.tu.no/leksikon/kraftprodusent.aspx16 Source: http://publikasjoner.nve.no/rapport/2013/rapport2013_58.pdf17 Source: NVE. Obtained from ”Fakta 2015. Energi og vannressurser” (MPE, 2015)
The current market conditions for investments in new renewable power production in Norway are challenging. This is because of a power surplus that yields low power prices, and a surplus of electricity certificates, which has in turn lowered their price. In the longer term, there is reason to believe that increasing value creation in mainland Norway within the framework of a low emission society will generate a substantially increased need for renewable energy.
RenewablepowerpotentialinNorway
Norway has a major untouched potential in its energy resources. The Norwegian Water Resources and Energy Directorate (NVE) estimates that the hydropower potential is 214 TWh, where nearly 34 TWh is remaining potential that has not been developed or is protected from hydropower development. According to calculations, the technical Norwegian wind power potential is three times larger than hydropower. The offshore power production potential is also significant, with a technical potential of more than 10.000 TWh.
The grid and transmission capacity sets the premises for the power market. A strengthening of the domestic transmission and distribution grid is required. Smart grids and storage technology
can also free up the potential that lies in optimizing the interaction between production and consumption. Development of international transmission capacity increases security of supply, and will allow Norway to export renewable power.
Innovationandtechnologydevelopmentwithinrenewablepower–statusandexpecteddevelopmentThe technologies within renewable power vary with regard to technology and market maturity, see Figure 3.23 and the fact box below. Sorted by maturity, we can split the various energy sources into three groups:1. Mature market and mature technology that is already commercialized or close to commercial: hydropower, onshore wind power.2. Expected commercialization of the technology in a ten-year perspective (2015-2025): solar power, partially offshore wind.3. Immature market and technology and high cost level, not expected to be ready for market introduction/commercialization within a ten-year perspective; wave power, tidal power, etc.
FIGURE 3.23 EXPECTEDDEVELOPMENTINTECHNOLOGYMATURITYANDCOSTSFORRENEWABLEPOWERTECHNOLOGIES
Figure 3.23 – A general assessment of expected development in costs (LCOE (levelized cost of electricity) shown in 2015 NOK 0.01/kWh) and maturity (TRL and CRI) for different types of renewable power production. Note that the figure has used the exchange rate from 2014 as a basis, and thus has not taken into account the substantial weakening of the NOK against the USD and Euro. In practice, this entails that the cost level is somewhat lower than what is the case in early 2016 for the technologies where a large share of the cost consists of imported components. An empty circle means that historic cost development has not been assessed for the period 2005-2015, due to limited data access and uncertainty. Source: Rambøll.
2005 NOK 0.01/kWh
2015 NOK 0.01/kWh
2025 NOK 0.01/kWh
Onshore wind power
Offshore wind power
Hydropower refurbishment and upgrading
Small-scale power
Residential solar power
Industrial solar power
Wave power Tidal power Biopower and CHP
Geothermal power
CRI CRI CRI CRI CRI CRI CRI CRI CRI CRI
6 6 6 6 6 6 6 6 6 6
5 5 5 5 5 5 5 5 5 5
4 4 4 4 4 4 4 4 4 4
TRL 3 TRL 3 TRL 3 TRL 3 TRL 3 TRL 3 TRL 3 TRL 3 TRL 3 TRL 3
9
2
9
2
9
2
9
2
9
2
9
2
9
2
9
2
9
2
9
28 8 8 8 8 8 8 8 8 8
7 7 7 7 7 7 7 7 7 7
6
1
6
1
6
1
6
1
6
1
6
1
6
1
6
1
6
1
6
1
5 5 5 5 5 5 5 5 5 5
4 4 4 4 4 4 4 4 4 4
3 3 3 3 3 3 3 3 3 3
2 2 2 2 2 2 2 2 2 2
1 1 1 1 1 1 1 1 1 1
37
220 193
3030
50
653 765
100
30
35
123 97
2005-20252015-2025
130
483 391
165
328202 150
159
252
90
Technology Readiness Level (TRL) is a widely used method for analyzing technology
maturity. The method involves dividing technology development into a scale from
one to nine, where the levels reflect the various development stages a technology
must undergo on the way from basic research, via lab testing and demonstration,
until the technology is introduced in the market. At the same time, different
technologies can be verified and ready for commercialization, but have varying points
of departure for competing on commercial market terms with regard to costs and
market maturity. This can be highlighted by supplementing the TRL rating with a
Commercial Readiness Index (CRI). CRI provides an overall and broader assessment of
the technology’s maturity, the strength of the cost assessment and financial terms, as
well as the market maturity in relation to the market player and competition situation
on the supply and demand side. The Correlation between TRL and CRI is shown in
the figure. Projects with a CRI 1 level are typically supported by the Research Council
of Norway. The limit is for CRI 2 (TRL 7), which is full-scale projects that are financed
through a combination of equity and government subsidies, for example Enova or
Innovation Norway.
Technology Readiness Level (TRL) and Commercial Readiness Index (CRI)
CRI
6 Market-based and bankable
5 Market competition, widespread use
4 Multiple commercial applications
TRL 3 Commercial scale-up
Commercial technology 9
2 Commercial trialMarket introduction 8
Demo and pilot 7
Experimental development6
1 Hypothetical commercial proposition
5
Research and development
4
3
2
1
Source: Rambøll

50
Hydropower, wind power and solar power are expected to be the largest and most rapidly growing power technologies over the next ten years. Technology and market development are also expected within wave power, tidal power and geothermal power, while further technology development within biopower and osmotic power in particular is expected to be limited.
Currently, offshore wind power and solar power are considered equally commercially mature, with a Commercial Readiness Index (CRI, see fact box) of 2. Offshore wind is currently in the market introduction stage. Commercialization leading up to 2025 will require further cost and maturity development. The other marine technologies and geothermal power are lower on the CRI scale and are not expected to reach a commercial level by 2025. These technologies face considerable challenges in connection with high wear on the facility components. This results in a high need for maintenance and significant downtime, which means low availability and a short lifetime. In combination with high investment costs, these are considered the largest barriers for significant cost reductions going forward.
The figure shows that solar power is expected to see the most rapid development in both technology and market maturity, and thus also cost level. For solar power in commercial buildings, costs are expected to drop by half in relation to the current level leading up to 2025. The market competition situation is currently characterized by many small players. This, along with tendencies toward under-pricing/price-dumping of deliveries from China, could mean that the current cost level is artificially low.
Driversandbarriersforinnovationinrenewablepower
Security of supply has been the key driving force for development of renewable power. The climate challenge has become another reason for further development. In the EU, emissions from energy supply constitute about one-fourth of all greenhouse gas emissions18, which has resulted in goals to reduce greenhouse gas emissions and increase renewables. Norway has joined this mission. The electricity certificate market is essential for the power sector to achieve a renewables percentage of 67.5 by 2020.
The forecasts indicating that the current low power prices will persist in the short and medium term provide little incentive for large-scale development of new power production. Distributed and unregulated power production from new technology challenges the grid and power system model with regard to the quality of electricity and reliability of supply. This creates a need for new and smart technology that enables consumption management and bi-directional communication between the grid and so-called prosumers (end-users who also produce power). In turn, smart grids will create possibilities for grid owners through optimization of grid utilization.
For prosumers, savings in the grid tariff when producing for their own consumption constitute indirect added income. In practice, this means that the technologies are competing in a market where the prices (income) are higher than for large-scale power plants. When also developing technologies that can fulfil multiple functions simultaneously, for example solar cell technology that is integrated into the building structure, the
costs will be distributed between the building and energy. New business models such as this yield improved profitability for new technology for distributed power production.
Norway has several comparative advantages for technology development. Norway is a large and important energy nation, with leading expert energy and climate research environments, a high level of industrial expertise from oil and gas, process and power industry. The Norwegian company culture also facilitates exploiting the generally high expertise level in the labour force. Norway has extensive expertise in the power production sector, within both renewable power production and marine operations. Overall, this makes Norway well-positioned for a leading role in the development of new energy and climate technology.
The objective of the electricity certificate market is to promote development of the most profitable renewable projects. However, a market-based instrument such as this is not suited for realizing new immature technologies, where the projects have high technology risk and high capital needs during the first installations up to commercialization and large-scale development.
A lack of risk-willing capital and willingness to invest have been challenges in the technology projects that Enova has supported within renewable power. The renewables percentage is already near 100, and power prices are low. The consequence of this is that several projects with promising technology have been unsuccessful in obtaining the necessary capital in the market. One example of this is the Flumill tidal technology that Enova supported in 2012, but which has not yet been realized.
The innovative players in the power market range from entrepreneurial start-ups to established power companies. The actual risk scenario differs, and the players’ risk assessments vary widely. Larger companies have financial strength and organizational capacity, but are often unwilling to take risks. Small companies with one or few facilities and a small operating organization can be risk averse as a result of the vulnerability to lost income from downtime and lack of repeated experience with building and modifying power plants. Entrepreneurs are often optimistic about their own solutions and are unable to fully acknowledge the need for testing the technology in several stages. Based on experience, Enova has learned that it is crucial to reduce the technology risk before investing significant capital. Successful testing will increase the probability of attracting investors. If the testing provides unsatisfactory results, the project can be concluded before considerable costs have been incurred.
Successstories
Since 2012, Enova has awarded support to 1219 plants for power production. Enova has awarded support to projects within wind (onshore and offshore), hydropower (small-scale power), wave, tidal, solar, bio, biogas from waste processing plants and osmotic power. There are also 21 projects that include production of power from solar, with the objective of testing new solar cell technologies, installation systems and storage technologies.
___________________________
18 Emissions from production of electricity and district heating amounted to 27 per cent in 2012 within EU-27. Source: http://ec.europa.eu/eurostat/statisticsexplained/index.php/Greenhouse_gas_emissions_by _industries_and_households#Greenhouse_gas_emissions19 This figure also includes two power production projects from waste water and waste, as well as a funding commitment to support a tidal power project that was cancelled before development.
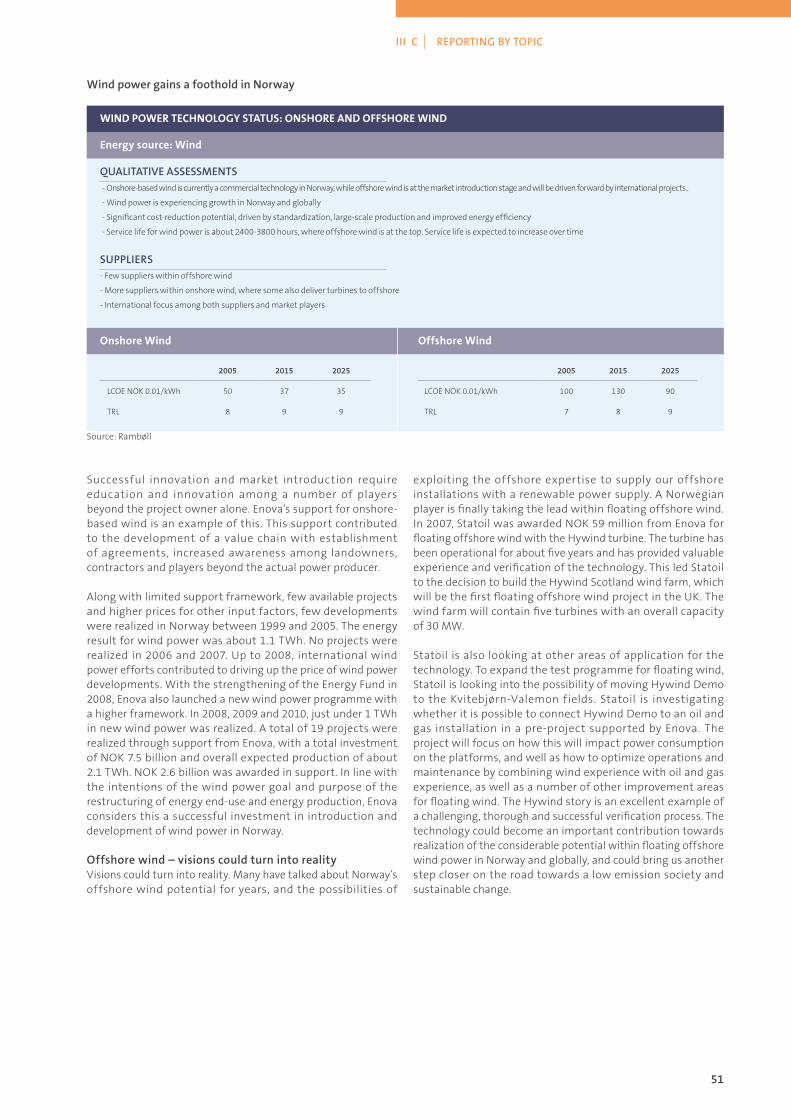
51
III C | REPORTING BY TOPIC
WindpowergainsafootholdinNorway
- Onshore-based wind is currently a commercial technology in Norway, while offshore wind is at the market introduction stage and will be driven forward by international projects..
- Wind power is experiencing growth in Norway and globally
- Significant cost-reduction potential, driven by standardization, large-scale production and improved energy efficiency
- Service life for wind power is about 2400-3800 hours, where offshore wind is at the top. Service life is expected to increase over time
- Few suppliers within offshore wind
- More suppliers within onshore wind, where some also deliver turbines to offshore
- International focus among both suppliers and market players
QUALITATIVEASSESSMENTS
SUPPLIERS
Energy source: Wind
WIND POWER TECHNOLOGY STATUS: ONSHORE AND OFFSHORE WIND
Onshore Wind Offshore Wind
2005 2015 2025
LCOE NOK 0.01/kWh 50 37 35
TRL 8 9 9
2005 2015 2025
LCOE NOK 0.01/kWh 100 130 90
TRL 7 8 9
Source: Rambøll
Successful innovation and market introduction require education and innovation among a number of players beyond the project owner alone. Enova’s support for onshore-based wind is an example of this. This support contributed to the development of a value chain with establishment of agreements, increased awareness among landowners, contractors and players beyond the actual power producer.
Along with limited support framework, few available projects and higher prices for other input factors, few developments were realized in Norway between 1999 and 2005. The energy result for wind power was about 1.1 TWh. No projects were realized in 2006 and 2007. Up to 2008, international wind power efforts contributed to driving up the price of wind power developments. With the strengthening of the Energy Fund in 2008, Enova also launched a new wind power programme with a higher framework. In 2008, 2009 and 2010, just under 1 TWh in new wind power was realized. A total of 19 projects were realized through support from Enova, with a total investment of NOK 7.5 billion and overall expected production of about 2.1 TWh. NOK 2.6 billion was awarded in support. In line with the intentions of the wind power goal and purpose of the restructuring of energy end-use and energy production, Enova considers this a successful investment in introduction and development of wind power in Norway.
Offshorewind–visionscouldturnintorealityVisions could turn into reality. Many have talked about Norway’s offshore wind potential for years, and the possibilities of
exploiting the offshore expertise to supply our offshore installations with a renewable power supply. A Norwegian player is finally taking the lead within floating offshore wind. In 2007, Statoil was awarded NOK 59 million from Enova for floating offshore wind with the Hywind turbine. The turbine has been operational for about five years and has provided valuable experience and verification of the technology. This led Statoil to the decision to build the Hywind Scotland wind farm, which will be the first floating offshore wind project in the UK. The wind farm will contain five turbines with an overall capacity of 30 MW.
Statoil is also looking at other areas of application for the technology. To expand the test programme for floating wind, Statoil is looking into the possibility of moving Hywind Demo to the Kvitebjørn-Valemon fields. Statoil is investigating whether it is possible to connect Hywind Demo to an oil and gas installation in a pre-project supported by Enova. The project will focus on how this will impact power consumption on the platforms, and well as how to optimize operations and maintenance by combining wind experience with oil and gas experience, as well as a number of other improvement areas for floating wind. The Hywind story is an excellent example of a challenging, thorough and successful verification process. The technology could become an important contribution towards realization of the considerable potential within floating offshore wind power in Norway and globally, and could bring us another step closer on the road towards a low emission society and sustainable change.
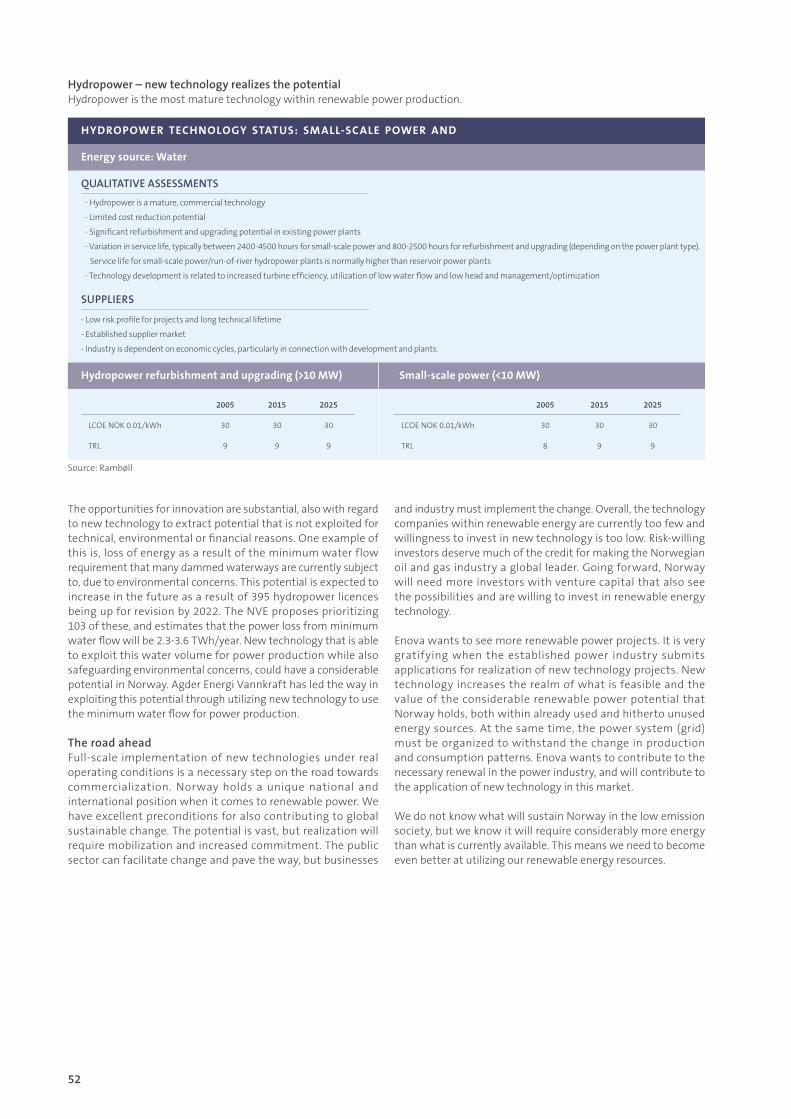
52
- Hydropower is a mature, commercial technology
- Limited cost reduction potential
- Significant refurbishment and upgrading potential in existing power plants
- Variation in service life, typically between 2400-4500 hours for small-scale power and 800-2500 hours for refurbishment and upgrading (depending on the power plant type).
Service life for small-scale power/run-of-river hydropower plants is normally higher than reservoir power plants
- Technology development is related to increased turbine efficiency, utilization of low water flow and low head and management/optimization
- Low risk profile for projects and long technical lifetime
- Established supplier market
- Industry is dependent on economic cycles, particularly in connection with development and plants.
QUALITATIVEASSESSMENTS
SUPPLIERS
Energy source: Water
HYDROPOWER TECHNOLOGY STATUS: SMALL-SCALE POWER AND
Hydropower refurbishment and upgrading (>10 MW) Small-scale power (<10 MW)
2005 2015 2025
LCOE NOK 0.01/kWh 30 30 30
TRL 9 9 9
2005 2015 2025
LCOE NOK 0.01/kWh 30 30 30
TRL 8 9 9
Source: Rambøll
The opportunities for innovation are substantial, also with regard to new technology to extract potential that is not exploited for technical, environmental or financial reasons. One example of this is, loss of energy as a result of the minimum water flow requirement that many dammed waterways are currently subject to, due to environmental concerns. This potential is expected to increase in the future as a result of 395 hydropower licences being up for revision by 2022. The NVE proposes prioritizing 103 of these, and estimates that the power loss from minimum water flow will be 2.3-3.6 TWh/year. New technology that is able to exploit this water volume for power production while also safeguarding environmental concerns, could have a considerable potential in Norway. Agder Energi Vannkraft has led the way in exploiting this potential through utilizing new technology to use the minimum water flow for power production.
TheroadaheadFull-scale implementation of new technologies under real operating conditions is a necessary step on the road towards commercialization. Norway holds a unique national and international position when it comes to renewable power. We have excellent preconditions for also contributing to global sustainable change. The potential is vast, but realization will require mobilization and increased commitment. The public sector can facilitate change and pave the way, but businesses
and industry must implement the change. Overall, the technology companies within renewable energy are currently too few and willingness to invest in new technology is too low. Risk-willing investors deserve much of the credit for making the Norwegian oil and gas industry a global leader. Going forward, Norway will need more investors with venture capital that also see the possibilities and are willing to invest in renewable energy technology.
Enova wants to see more renewable power projects. It is very gratifying when the established power industry submits applications for realization of new technology projects. New technology increases the realm of what is feasible and the value of the considerable renewable power potential that Norway holds, both within already used and hitherto unused energy sources. At the same time, the power system (grid) must be organized to withstand the change in production and consumption patterns. Enova wants to contribute to the necessary renewal in the power industry, and will contribute to the application of new technology in this market.
We do not know what will sustain Norway in the low emission society, but we know it will require considerably more energy than what is currently available. This means we need to become even better at utilizing our renewable energy resources.
Hydropower–newtechnologyrealizesthepotentialHydropower is the most mature technology within renewable power production.
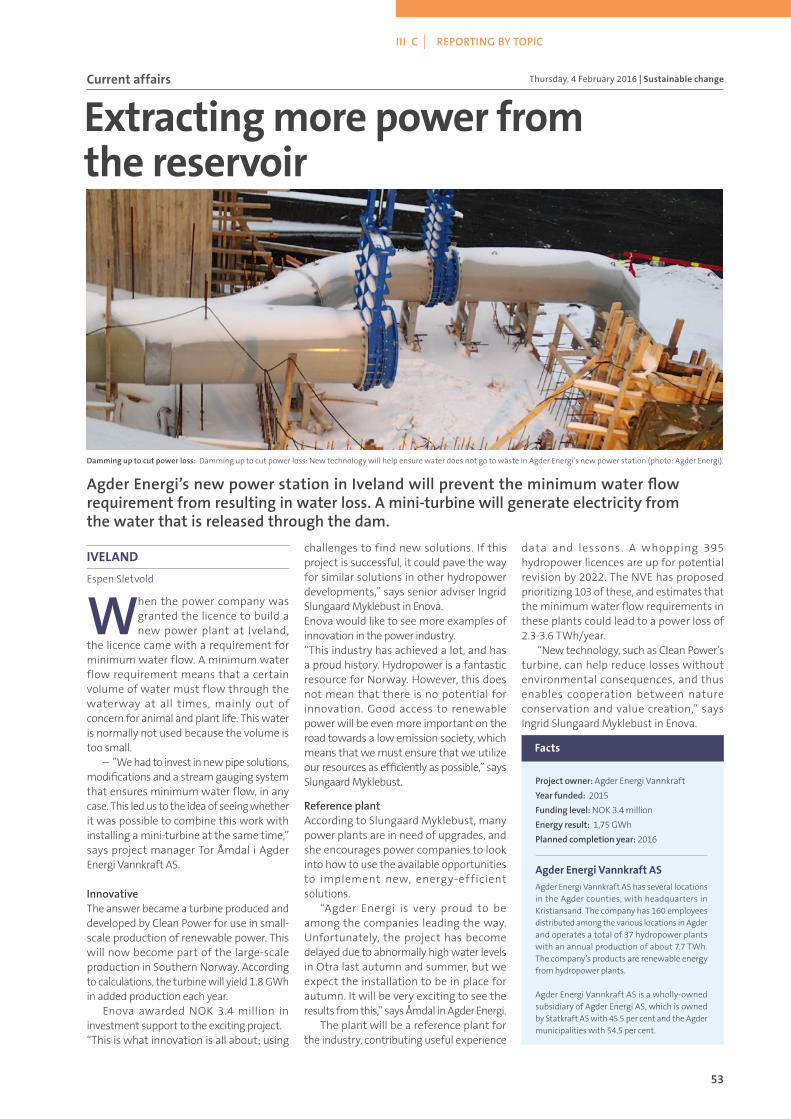
53
III C | REPORTING BY TOPIC
IVELAND
Espen Sletvold
When the power company was granted the licence to build a new power plant at Iveland,
the licence came with a requirement for minimum water flow. A minimum water flow requirement means that a certain volume of water must flow through the waterway at all times, mainly out of concern for animal and plant life. This water is normally not used because the volume is too small. – ”We had to invest in new pipe solutions, modifications and a stream gauging system that ensures minimum water flow, in any case. This led us to the idea of seeing whether it was possible to combine this work with installing a mini-turbine at the same time,” says project manager Tor Åmdal i Agder Energi Vannkraft AS.
InnovativeThe answer became a turbine produced and developed by Clean Power for use in small-scale production of renewable power. This will now become part of the large-scale production in Southern Norway. According to calculations, the turbine will yield 1.8 GWh in added production each year. Enova awarded NOK 3.4 million in investment support to the exciting project.“This is what innovation is all about; using
challenges to find new solutions. If this project is successful, it could pave the way for similar solutions in other hydropower developments,” says senior adviser Ingrid Slungaard Myklebust in Enova.Enova would like to see more examples of innovation in the power industry.“This industry has achieved a lot, and has a proud history. Hydropower is a fantastic resource for Norway. However, this does not mean that there is no potential for innovation. Good access to renewable power will be even more important on the road towards a low emission society, which means that we must ensure that we utilize our resources as efficiently as possible,” says Slungaard Myklebust.
ReferenceplantAccording to Slungaard Myklebust, many power plants are in need of upgrades, and she encourages power companies to look into how to use the available opportunities to implement new, energy-efficient solutions. “Agder Energi is very proud to be among the companies leading the way. Unfortunately, the project has become delayed due to abnormally high water levels in Otra last autumn and summer, but we expect the installation to be in place for autumn. It will be very exciting to see the results from this,” says Åmdal in Agder Energi. The plant will be a reference plant for the industry, contributing useful experience
data and lessons. A whopping 395 hydropower licences are up for potential revision by 2022. The NVE has proposed prioritizing 103 of these, and estimates that the minimum water flow requirements in these plants could lead to a power loss of 2.3-3.6 TWh/year. “New technology, such as Clean Power’s turbine, can help reduce losses without environmental consequences, and thus enables cooperation between nature conservation and value creation,” says Ingrid Slungaard Myklebust in Enova.
Extracting more power from the reservoir
AgderEnergi’snewpowerstationinIvelandwillpreventtheminimumwaterflowrequirementfromresultinginwaterloss.Amini-turbinewillgenerateelectricityfromthewaterthatisreleasedthroughthedam.
Thursday, 4 February 2016 | Sustainable changeCurrent affairs
Agder Energi Vannkraft AS has several locations in the Agder counties, with headquarters in Kristiansand. The company has 160 employees distributed among the various locations in Agder and operates a total of 37 hydropower plants with an annual production of about 7.7 TWh. The company’s products are renewable energy from hydropower plants.
Agder Energi Vannkraft AS is a wholly-owned subsidiary of Agder Energi AS, which is owned by Statkraft AS with 45.5 per cent and the Agder municipalities with 54.5 per cent.
Projectowner:Agder Energi Vannkraft
Yearfunded: 2015
Fundinglevel: NOK 3.4 million
Energyresult: 1,75 GWh
Plannedcompletionyear: 2016
Agder Energi Vannkraft AS
Facts
Damminguptocutpowerloss: Damming up to cut power loss: New technology will help ensure water does not go to waste in Agder Energi’s new power station (photo: Agder Energi).

54

55
PartIVManagement and control in the organization
54 PartIV:Managementandcontrolintheorganization
56 Enova – market team player
57 Management and control in the organization
58 Key case processing methods

56
Enova shall cultivate necessary changes to create a sustainable society based on green energy and low greenhouse gas emissions. In order to achieve this, we need to interact with the market, meet with market players and listen to their challenges.
LongtermeffectsinthemarketEnova’s goal is to promote an environmentally friendly energy restructuring that contributes to increased security of supply and reduced greenhouse gas emissions. The markets in which Enova operates will look different in the future than they would have otherwise, as a result of Enova’s activities.
An assessment of potentials and barriers forms the foundation when Enova develops strategies to create its support programmes for the market. With this basis, Enova stipulates goals for which market changes we will contribute towards and what programmes will stimulate this change. The extent of the potential and which barriers exist will vary between different markets.
There are often several barriers that must be overcome to create lasting change in a market. Barriers and market failure are found
both on the supply and demand sides. Some challenges can be solved simultaneously, while others must be solved in a specific sequence.
As an example, it could hurt the market to stimulate a growth in demand without there being sufficient capacity on the supply side.
Changing markets usually takes a long time, and there is uncertainty related to how long it takes to counteract specific barriers to achieve lasting change. As a policy instrument player, Enova needs to be very familiar with the market, use the opportunities at its disposal and target the instruments so that they trigger the desired market changes. The challenge is sensing the market’s maturity level at all times and also at what time it is appropriate to enter or exit the market, or change the services offered to the market. If we stop too soon, with time or money, we risk having the market return to its original state. This would be a wasted effort. Staying too long also comes at a cost, but it could be worthwhile to over-invest to ensure the change is permanent.
Some barriers are always present. Within technology development for example, the innovator will never be able to
prevent the rest of the market from gaining access to all or parts of the new knowledge. The innovation therefore loses some of its value for the individual market player, while the value increases for society. The consequence is that each market player invests less than is optimal for society. Government support will always play a role in this connection.
FinancingEnova’s foremost instrument is investment support for projects, whether they are large industrial projects or smaller measures in households. Enova shall manage Norway’s funds so they yield the greatest possible benefit for society. These funds are what enable Enova to promote good energy and climate projects that would not otherwise have been realized without government aid. Enova does this by covering a portion of the added costs incurred by the market by choosing more energy and climate-friendly solutions. The support increases profitability and reduces risk for the project owner, and thus strengthens the good energy and climate projects.
AdvisoryservicesThe other essential instrument in Enova’s portfolio is advisory services. In small projects, we provide advice through a telephone service, and through information and guidance on our website. In large projects, Enova works closely with applicants over time to improve the project with regard to technical solutions and implementation, as well as making the projects more financially robust. Through this dialogue, projects benefits from our advisers’ expertise and the experience Enova has gained through managing a portfolio of several thousand projects.
CooperationOne of the goals of public policy instruments is that more ideas will reach the market. The path from a good idea to application of a finished solution can be long, and the need for public support will change along the way. For Enova, expedient division of labour and sound cooperation with other public policy instrument players is essential.
Figure 4.1: The figure shows the phases of market change.
FIGURE 4.1 MARKETCHANGEBARRIERS–WHENTOSTOPINFLUENCINGTHEMARKET?
Third push Even larger change Small setback
First push Small change Setback
Second push Larger change Smaller setback
Fourth push The market takes o�
Market change
Enova – market team player

57
IV | MANAGEMENT AND CONTROL IN THE ORGANIZATION
Enova manages the Norwegian state’s resources on behalf of the society. Enova’s tasks must be performed in an orderly and professional manner, and the management of the Energy Fund must take place in accordance with objective and transparent criteria. Enova sets requirements for its employees’ integrity and business morals through value-based management and ethical guidelines. There are, for example, routine legal competence and impartiality assessments in connection with new applications.
ManagementofgoalsandresultsEnova follows a goal management model which will help Enova achieve its strategic goals. The model is used in addition to traditional accounting and financial management. The model lists goals and key figures concerning results and processes within four perspectives: results/economy, customer/market, internal processes/case processing and organization/working environment.
The system was further developed in 2015 with close follow-up of results and risk and action plans in all units are assessed in relation to the goals on a quarterly basis. This process promotes learning and continuous improvement in the organization.Enova completes systematic evaluations of all policy instruments. The support programmes are evaluated both during the early phase and at a later stage in the programme’s lifetime. The results from these evaluations allow for adjustments, thereby increasing the probability of achieving the desired result.
InternalcontrolandriskmanagementThe work distribution in Enova is considered to be expedient for ensuring good internal control. Enova also has an Appropriations Committee that is independent of the line organization, in addition to verifications that are incorporated in the case processing systems and routines. The committee comprises employees that have not participated in the case processing, but that quality-assure, process and make decisions in appropriation cases in accordance with delegated authorizations.
Enova has various internal control functions with specialized responsibilities within follow-up of the project portfolio, allocations over the Energy Fund and operation of the company. A dedicated function also has overall responsibility for risk management and internal control in the company. Enova conducts regular external quality assurances of numbers and reporting of results in relation to the goals.
Agreed-upon verification assignments are carried out by an external auditor when necessary for objective and independent assessment of the company. The results of these agreed-upon verifications are included in our work on continuous development and improving efficiency.
In order to prepare Enova for a new agreement term, a mapping project was carried out in 2015 to describe Enova’s core process. This provided a good overview of the overall risk scenario and basis for prioritizing further development measures in 2016.Enova conducts regular risk mapping to assess risk in relation to goal achievement, efficient operations, reliable reporting and compliance with statutes and rules. An annual comprehensive risk assessment is submitted to the MPE in accordance with
requirements in the Assignment Letter.
In 2015, Enova received a clean auditor’s report for both management of the Energy Fund and for Enova SF. No significant nonconformities were identified in connection with the internal control in 2015. Based on the results from external controls over time and follow-up from Enova’s own internal controls, Enova is considered to have an expedient internal control process for ensuring responsible and efficient management and operations. Enova’s values and ethical guidelines are clearly communicated by management and are well-anchored in the company culture. Enova’s control environment thus provides a solid foundation for efficient internal control.
Up to 2014, the Energy Fund was audited by the Office of the Auditor General, while Enova SF was audited by an external auditor. The Office of the Auditor General has decided to phase out auditing of funds that are managed by companies starting in the 2015 accounting year. Enova therefore entered into an agreement with the auditor for Enova SF to also audit the Energy Fund. The Office of the Auditor General will still be responsible for performance auditing and audit of corporate governance.
SupportsystemandtoolsEnova processes and follows up an ever-growing number of projects, while society is becoming increasingly digitalized. This increases the need to focus on data security, which requires sound control over IT systems, and increasing the awareness of employees in the company. For example, Enova participates annually in the Nasjonal Sikkerhetsmåned (national security month), where employees participate in an e-learning class focusing on information security.
Enova has started using StartTLS, a solution recommended by the Norwegian National Security Authority for securing e-mail. This ensures secure exchange of e-mail if both parties use the solution, and requires no effort on the part of users.
Enova works continuously and systematically to further develop and improve our case processing and support systems. We want to reduce paper-based processes, and therefore digitized internal support processes for human resources management and travel expenses in 2015. In 2016, we will review work processes for application processing with the goal of further development and increased efficiency.
Enova has an up-to-date and flexible financial management system which supports the management of the Energy Fund.
Management and control in the organization

58
Key case processing methods
Enova’s project portfolio is growing, with a significant portion of active projects in progress. The projects supported by Enova range from simple household measures to major, complex technology development projects in various industries. The reporting and accounting of results increase in scope and complexity every year, in line with the portfolio.
PerformancemonitoringanddocumentationmethodWhen applying for subsidies from Enova, the applicant must describe the energy result the project expects to achieve upon completion. Enova quality-assures the estimated energy result as part of the case processing procedure. If established standards exist, they are used. For example, we use Standardisert metodikk for beregning av energibruk i bygg (standardized method for calculating energy consumption in buildings) as a basis for estimated energy results for support programmes within the building sector. In order cases, Enova uses empirical data from our extensive project portfolio. In some cases, particularly in connection with large projects, we use a third party assessment to verify the expected energy result.
The support recipient must report energy results at three stages; upon entering into the contract, upon final reporting to Enova and generally three years after the final report is submitted. Upon Enova’s request, the subsidy recipient shall cooperate with Enova on performance monitoring and evaluation of the project for a period of up to ten years after the final report is submitted.
The projects supported by Enova may yield climate results. The climate accounts are based on the energy result from each project and standardized emission factors for the various energy carriers. The results are reported in CO
2 equivalents, which indicate the
combined effect of CO2 and other types of greenhouse gases.
Through the process from entering into a contract until evaluation and completed project, Enova operates with three different methods for recording energy results: contractual, final reported and realized energy result.
Contractual energy result:Upon entering into a contract, the support recipient pledges that the project will achieve a future energy result. This pledge, a contractual energy result, is listed in the funding commitment letter. The contractual energy result is an estimate of the expected annual energy result after the project is completed.
Completing a project can take several years, and the results from the project are recorded in the year the support is granted. This provides quicker reporting and enables closer follow-ups from Enova, rather than waiting until the projects are complete. The energy results are then updated as the projects are completed.
Enova follows up all projects closely. If the project follows the progress plan, support is disbursed in arrears in accordance with incurred costs. Material deviations from the agreement could result in Enova demanding repayment of all or parts of the support amount.
Final reported energy result: When the project is completed, the project owner must submit a final report. The final report summarizes the project and contains an up-to-date prognosis of expected realized annual energy and climate result.
The final report is enclosed with documentation of project costs. Documentation requirements are contingent on the size of the subsidy. If the subsidy exceeds NOK 1 million, the final progress and accounting report must be confirmed by an auditor. The auditor must confirm that audit procedures have been completed. The report shall be certified by the person responsible for finances in the subsidy recipient’s organization, and signed by the subsidy recipient’s representative.
Enova assesses whether the final reported energy result is reasonable, and whether documentation is sufficient. The final support amount is disbursed when the final report is approved, if all terms and conditions have been met.
Realized energy result:Final reported projects are followed up with measurement and verification of energy results. This takes place after the fact, and is carried out three years after the final report has been delivered. The project owner will deliver the final report through Enova’s digital application and reporting centre. Enova uses third party assessment for certain large projects to verify the quality of the reported result.
Realized energy results are measurements or estimates of achieved energy results after a measure has been completed, and its effects can be observed. Unlike contractual and final reported energy result, the realized energy result is based on observations, not expectations.
MethodformeasurementofsupportandtriggeringfundinglevelTo ensure the most efficient utilization of Norway’s resources, it is crucial that Enova’s support programmes effectively handle barriers, and also trigger projects using the smallest support amounts necessary.
Two main principles form the basis for our assessment of the funding level in projects; the support must be necessary to trigger the project in question, and the support must be sufficient. These two criteria reflect the requirements in the guidelines for state aid.
• Necessary support:A fundamental principle for subsidizing projects through various types of support is that support changes behaviour. For our projects, this entails that the project owner will choose a more energy or climate-friendly project with the benefit of support than the project owner would choose without support. This means that Enova cannot support measures that the project owner will or must carry out for other reasons, such as regulation. This also means that we cannot support projects that have already been implemented. As a steward of
59
IV | MANAGEMENT AND CONTROL IN THE ORGANIZATION
Norway’s resources, we have an important responsibility for managing these resources so they yield the greatest possible benefit for society. It is important to avoid granting support to projects that would have been implemented in any case. In such cases, the support from the Energy Fund is not necessary to trigger the project.
• Sufficient support:The support must be sufficient to trigger changed behaviour, but no more. This entails that, after Enova has determined support is necessary to implement the project, we need to assess how much support is needed to trigger the project.
If the funding level is too low, the project will not be carried out and the support was insufficient. If the funding level is too high, the project received more than necessary to change behaviour.
MethodforassessingprofitabilityThe basis for assessing necessary and sufficient support is a profitability assessment of the projects. The method used for the assessment is a standard net present value assessment, where the project-specific risk is reflected in the cash flows while the return requirement must reflect the applicant’s market risk.
This approach forms the basis for all ordinary support measurement in Enova, but the application will vary somewhat depending on the market and project size.
Information asymmetryWhen assessing necessary and sufficient support, either through a present value assessment or otherwise, Enova and the project owner will always have different information. This applies to technical and financial details in the project, as well as knowledge about the market in which the project takes place. Enova aims to minimize this information asymmetry as much as possible during the case processing by obtaining information from the project, and also sharing knowledge that Enova has gained in connection with the project.
Even if the information basis is as equal as possible, Enova and the project could assess this information differently. This means that, in some cases, Enova will consider the projects more attractive than the project owner, and occasionally the other way around.
Template versus project-specific assessmentObtaining and assessing details and comprehensive information about technical and financial factors related to individual projects is very costly for both the project owner and Enova. In some markets, such as the buildings market, the potential volume of measures is significant, but each measure is relatively small. This can make it relatively expensive for the project owner to obtain enough information for Enova to conduct a sound, project-specific assessment.
For certain project types, having programmes that are based on standardized assessments is more expedient. This makes it easier for the market to use the programmes, and reduces the costs related to documentation as a barrier. In these cases,
the profitability assessments and evaluation of necessary and sufficient support are based on standardized values for a broad set of measures.
For projects where standardized assessments are not suitable, Enova will carry out project-specific assessments. This largely applies to industrial projects, technology projects and major construction/building projects.
Reasonable returnsIn order to ensure the support is sufficient for the projects to be completed, the project owner must consider the gains of the project to be higher than the costs. In a present value assessment, this is reflected by the present value in the project being positive, given the company’s required rate of return. The required rate of return thus affects the level of funding needed to trigger projects – high rates of return require significant support.
To assess whether the funding level is sufficient, Enova must therefore also assess whether the required rate of return used by the project owner as a basis is reasonable. Enova uses a third party assessment of the normal rate of return in various sectors to conduct this evaluation. As different sectors are associated with varying degrees of risk, a reasonable required rate of return could vary between sectors.
There is often a difference between what returns you can expect within a sector after the fact, and what is necessary to trigger a new investment decision. Enova and the state aid regulations therefore allow approval of a different required rate of return for the project owner, if this can be sufficiently documented. Special required rates of return can either be project or company-specific. The state aid regulations and ESA guidelines for state aid for energy and the environment provide key premises for Enova’s activities.
Major projectsFor the largest projects, typically within industry and new technology, Enova carries out very thorough analyses of the project economy. This involves sensitivity analyses, assessment of market position and potential strategic assets in the projects.
Third party assessments of critical factors for the project economy are also obtained for major projects. This includes considerations regarding future price development for intermediate goods and products, and, as previously mentioned, a reasonability assessment of the energy result.
Projects that receive support exceeding EUR 7.5 million must be approved by EFTA’s Surveillance Authority, ESA. Starting on 1 January 2016, the limit for most projects will be EUR 15 million. The criteria used as a basis in the ESA’s assessment and Enova’s assessment in the case processing must correspond. The ESA evaluates the projects’ environmental effect against the negative impact on competition in the European market.
All projects supported by Enova with an amount exceeding the limit for special approval by the ESA have been approved.

60

61
DelVAssessment of future prospects
60 PartVAssessmentoffutureprospects
62 Ready, set, adapt
Marketdescriptions:
65 Renewable thermal energy
66 Industry and non-industrial plants and facilities
68 Non-residential buildings
70 New energy and climate technology
72 Transport
74 Residential buildings
75 Bioenergy
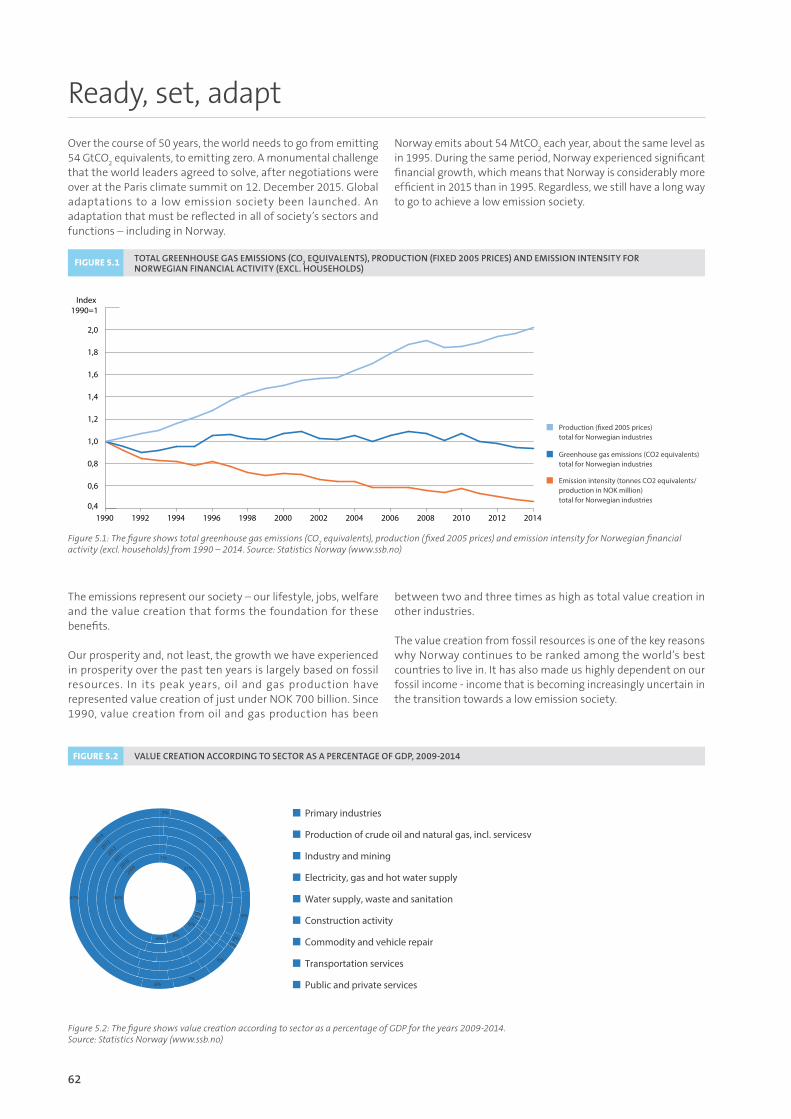
62
Ready, set, adapt
Over the course of 50 years, the world needs to go from emitting 54 GtCO
2 equivalents, to emitting zero. A monumental challenge
that the world leaders agreed to solve, after negotiations were over at the Paris climate summit on 12. December 2015. Global adaptations to a low emission society been launched. An adaptation that must be reflected in all of society’s sectors and functions – including in Norway.
Norway emits about 54 MtCO2 each year, about the same level as
in 1995. During the same period, Norway experienced significant financial growth, which means that Norway is considerably more efficient in 2015 than in 1995. Regardless, we still have a long way to go to achieve a low emission society.
The emissions represent our society – our lifestyle, jobs, welfare and the value creation that forms the foundation for these benefits.
Our prosperity and, not least, the growth we have experienced in prosperity over the past ten years is largely based on fossil resources. In its peak years, oil and gas production have represented value creation of just under NOK 700 billion. Since 1990, value creation from oil and gas production has been
between two and three times as high as total value creation in other industries.
The value creation from fossil resources is one of the key reasons why Norway continues to be ranked among the world’s best countries to live in. It has also made us highly dependent on our fossil income - income that is becoming increasingly uncertain in the transition towards a low emission society.
Figure 5.1: The figure shows total greenhouse gas emissions (CO2 equivalents), production (fixed 2005 prices) and emission intensity for Norwegian financial
activity (excl. households) from 1990 – 2014. Source: Statistics Norway (www.ssb.no)
TOTALGREENHOUSEGASEMISSIONS(CO2EQUIVALENTS),PRODUCTION(FIXED2005PRICES)ANDEMISSIONINTENSITYFOR
NORWEGIANFINANCIALACTIVITY(EXCL.HOUSEHOLDS)FIGURE 5.1
0,4
0,6
0,8
1,0
1,2
1,4
1,6
1,8
2,0
Index 1990=1
Greenhouse gas emissions (CO2 equivalents)total for Norwegian industries
Production (�xed 2005 prices) total for Norwegian industries
Emission intensity (tonnes CO2 equivalents/production in NOK million) total for Norwegian industries
1990 1992 1994 1996 1998 2000 2002 2004 2006 2008 2010 2012 2014
Figure 5.2: The figure shows value creation according to sector as a percentage of GDP for the years 2009-2014.Source: Statistics Norway (www.ssb.no)
FIGURE 5.2 VALUECREATIONACCORDINGTOSECTORASAPERCENTAGEOFGDP,2009-2014
Primary industries
Public and private services6%7%
6%
1%2%
8%
22%
2%
1%
21%
8%
2%1%
6%
8%6%
47% 46%
Production of crude oil and natural gas, incl. servicesv
Industry and mining
Electricity, gas and hot water supply
Water supply, waste and sanitation
Construction activity
Commodity and vehicle repair
Transportation services
200920102011201220132014
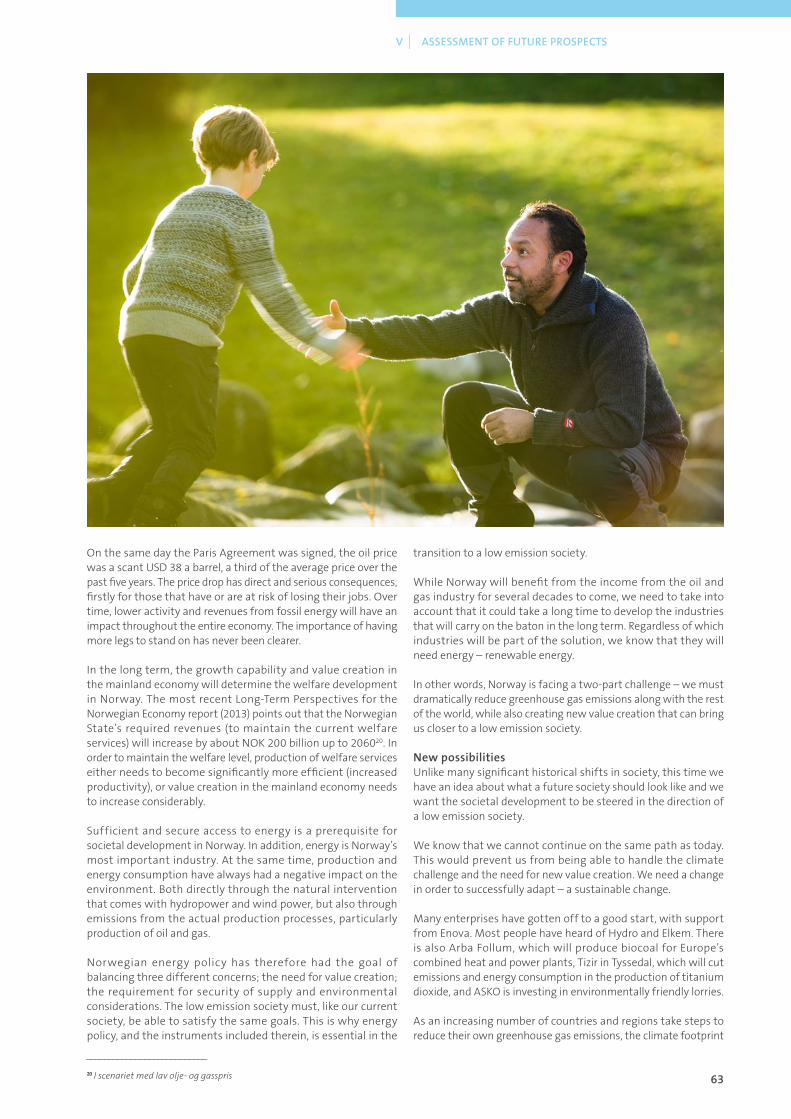
63
V | ASSESSMENT OF FUTURE PROSPECTS
On the same day the Paris Agreement was signed, the oil price was a scant USD 38 a barrel, a third of the average price over the past five years. The price drop has direct and serious consequences, firstly for those that have or are at risk of losing their jobs. Over time, lower activity and revenues from fossil energy will have an impact throughout the entire economy. The importance of having more legs to stand on has never been clearer.
In the long term, the growth capability and value creation in the mainland economy will determine the welfare development in Norway. The most recent Long-Term Perspectives for the Norwegian Economy report (2013) points out that the Norwegian State’s required revenues (to maintain the current welfare services) will increase by about NOK 200 billion up to 206020. In order to maintain the welfare level, production of welfare services either needs to become significantly more efficient (increased productivity), or value creation in the mainland economy needs to increase considerably.
Sufficient and secure access to energy is a prerequisite for societal development in Norway. In addition, energy is Norway’s most important industry. At the same time, production and energy consumption have always had a negative impact on the environment. Both directly through the natural intervention that comes with hydropower and wind power, but also through emissions from the actual production processes, particularly production of oil and gas.
Norwegian energy policy has therefore had the goal of balancing three different concerns; the need for value creation; the requirement for security of supply and environmental considerations. The low emission society must, like our current society, be able to satisfy the same goals. This is why energy policy, and the instruments included therein, is essential in the
transition to a low emission society.
While Norway will benefit from the income from the oil and gas industry for several decades to come, we need to take into account that it could take a long time to develop the industries that will carry on the baton in the long term. Regardless of which industries will be part of the solution, we know that they will need energy – renewable energy.
In other words, Norway is facing a two-part challenge – we must dramatically reduce greenhouse gas emissions along with the rest of the world, while also creating new value creation that can bring us closer to a low emission society.
NewpossibilitiesUnlike many significant historical shifts in society, this time we have an idea about what a future society should look like and we want the societal development to be steered in the direction of a low emission society.
We know that we cannot continue on the same path as today. This would prevent us from being able to handle the climate challenge and the need for new value creation. We need a change in order to successfully adapt – a sustainable change.
Many enterprises have gotten off to a good start, with support from Enova. Most people have heard of Hydro and Elkem. There is also Arba Follum, which will produce biocoal for Europe’s combined heat and power plants, Tizir in Tyssedal, which will cut emissions and energy consumption in the production of titanium dioxide, and ASKO is investing in environmentally friendly lorries.
As an increasing number of countries and regions take steps to reduce their own greenhouse gas emissions, the climate footprint
___________________________
20 I scenariet med lav olje- og gasspris
64
will become a more important argument. Energy-efficient and climate-friendly solutions will be a competitive advantage – green products will win out in the future.
Borregaard is a pioneer within this field, with its work on developing new biomass products that can replace fossil-based products. We need more bold innovators.
Norway is well-positioned for this competition, with good access to cheap and renewable energy, a high expertise level and stable political conditions. However, we know that Norwegian competitiveness could be significantly improved if we utilized the opportunities available to us more efficiently.
Back in 2010, Enova pointed out the considerable potential for improved competitiveness through increasing energy consumption efficiency in Norwegian industry. Though the figures are a few years old and some companies have taken significant steps since then, there is still plenty of room to reduce production costs by several billion kroner through further energy efficiency measures and reduced greenhouse gas emissions.
In addition to a growing market for green products, investments in renewable energy solutions have become considerable and must grow significantly if we want to achieve the ambitions in the Paris Agreement.
About USD 328 billion were invested in renewable energy globally in 2015 (Bloomberg New Energy Finance). Over the past years, investments in renewable energy have declined in Europe (down 18 per cent from 2014 to 2015), in part due to changes in and uncertainty related to existing subsidy schemes. China is currently the largest market, with 17 per cent growth from 2014 to 2015.
Based on figures from Rystad Energy and Bloomberg New Energy Finance, Export Credit Norway has estimated that the market for renewable energy technology is about USD 350 billion annually, the same size as the offshore oil and gas market (exploration and production). The major difference between the renewable and non-renewable technology markets is Norway’s market share. Our market share within offshore oil and gas (development and production) is 8.5 per cent, while the market share within renewable technology is 0.3 per cent. In other words, substantial room for improvement, if we are bold enough to commit.
In 2014, renewable energy contributed 45 per cent of the growth in global power production. Over the next few years, the International Energy Agency, IEA, expects that two-thirds of growth will come from renewable energy sources.
In addition to increased use of renewable energy, carbon capture and storage (CCS) is essential for achieving the climate ambitions in the Paris Agreement. This will reduce emissions from use of fossil energy carriers and eventually allow us to achieve negative emissions through CCS related to use of bioenergy. Norway has the expertise, resources and infrastructure needed to take part in the CCS development. ChangerequiresinnovationWe need to find new solutions, in addition to those we are already aware of but do not use, in order to succeed in the transition to a low emission society and contribute to new value creation within the framework of the low emission society.
Innovation is unlike research and idea generation as it covers the entire path from an idea to successful market introduction. The innovation white paper “Et nyskapende og bærekraftig Norge” (an innovative and sustainable Norway) from 2008 provides the following definition of innovation: “a new product, a new service, a new production process, application or organizational method that has been launched in the market or used in the production to generate financial value.”
This means that innovation is more than new technologies. It is also about structural elements in society such as where and how we live, the infrastructure we choose and how we interact as people. And it is about how innovations on a structural, technological and human level mutually affect each other. Some of the most important innovations over the past decade have been in connection with how technology is used, for example smartphones, to develop new methods of cooperation, for example car sharing, which could in turn affect the need for cars and road infrastructure.
Innovation is a prerequisite for new value creation. We need to help ensure that more new solutions that can increase value creation, improve security of supply and reduce environmental impact are offered and demanded in the market.
If the market dares to invest in radical ideas, ground-breaking technologies and new talents, Enova will help ensure the path from idea to market is as short as possible. We can do this by meeting the projects at an earlier stage in the innovation chain, being more flexible as regards how we reduce risk and contributing capital for major advances.
All value creation requires energy – and the path to future value creation will be built on green energy.

65
V | ASSESSMENT OF FUTURE PROSPECTS
Renewable thermal energy21
District heating expansions stimulate continued growth in the heating market
Market,potentialandgoalsRenewable thermal energy includes both heating and cooling, based on renewable energy sources or waste heat and waste cooling. Heating and cooling are used in commercial buildings, residential buildings, businesses and industry. Thermal energy can be produced locally with a dedicated heating plant for each building, connected between multiple buildings in local heating systems, or through larger district heating grids with large, central heating plants.
In addition to supplying buildings and industry with heating and cooling, the renewable thermal energy market plays a crucial role in the overall power system. Utilizing waste heat and other low-value energy sources for thermal heating increases the flexibility and optimization of the energy system. This also reduces greenhouse gas emissions from heating production, and frees up electricity for other purposes than heating, with a greater climate benefit.
The total thermal energy market within industry, residential buildings and non-residential buildings in Norway constituted 83.1 TWh in 2013. Of this, about half (42.9 TWh) is related to industry purposes22.
Enova supports renewable thermal energy through programmes adapted to various types of market players, such as district heating companies, building owners and industrial companies. Enova’s goal is to help increase flexibility in the energy system by supporting the construction of production capacity and infrastructure for distribution of renewable heating and cooling.
MarketsituationDistrict heating is an important part of the renewable thermal energy market. In Norway, most of the large infrastructure investments in new district heating plants and heating plants have already been made. Most Norwegian cities and towns currently have district heating infrastructure.
The market basis for district heating is defined by the development in heating need and how many end users facilitate use of renewable heating. The price of electricity governs the price of district heating and the low price level over multiple years has influenced the rate of investments. In 2014, investments in district heating plants amounted to around NOK 1.5 billion. This is only 40 per cent of the level in 2010. 4.4 TWh of district heating were delivered to consumers in 2014, compared to 4.7 TWh in 2013. The decline was caused by temperature differences between the years23.
The market for small heating plants has remained stable over the past few years, due to the requirement for a renewables share in the building regulations for new buildings and more conversions from fossil fuel in existing buildings. For larger heating plants, the market is smaller and there are fewer projects. The largest barrier against more widespread use of renewable thermal energy for heating and cooling is the lack of internal distribution systems in buildings. And the most important barrier against water-borne heating in buildings is the costs, both in new buildings and existing buildings.
ProspectsEnova considers renewable thermal energy to be a robust solution to several of the energy challenges in the future. Functional and well-developed infrastructure is necessary to optimize resource use and develop an overall efficient energy system. Increasing requirements for energy-efficient new buildings reduce the need for thermal energy to heat individual buildings, but population growth and consumption that is contingent on temperature entail that we will also have a considerable thermal energy demand in the future. Furthermore, the need for cooling is expected to increase, and need for tap water heating will increase with population growth. In other words, there will be a substantial demand for thermal energy for a long time to come.
For district heating, the opportunities for continued growth primarily lie within expansions and compaction of existing infrastructure. The majority of residential development and industrial development going forward will take place in large cities and communities where district heating infrastructure already exists. The infrastructure is a costly basic investment, and when it has been put into place, the primary focus for market players is to increase the volume, as the marginal cost is very low, and cost efficiency increases in line with the volume.
Other heating plants belong in the flexible thermal energy system, preferably where the heating density and overall volume does not justify district heating development. Stand-alone heat pumps can contribute cooling in the summer. This need is expected to increase in the future. The prohibition against using fossil oil for heating in buildings will enter into force in 2020, and will provide an increased focus on changing heating sources for renewable alternatives for the buildings that still use fossil oil.
Energy efficient buildings and energy-plus houses may have a need for improved interaction between existing infrastructure and individual buildings, to ensure optimal energy transfer. In turn, this creates a need to develop technical components such as improved heat exchangers and management systems, to better exploit existing resources, infrastructure and inter-operable zones.
Renewable heating in general and district heating in particular will be part of the solution for a low emission society. The flexibility in the district heating grid will enable optimal resource utilization, as excess heating or cooling can be delivered in the grid and extracted by the consumers who need it.
The sector has also undergone a consolidation process over the past few years. There have been multiple sales and acquisitions, of both individual plants and companies. A reduction of the number of players in the market could improve profitability and result in a more professional industry.
Enova will continue its work in the area, with the goal of renewable thermal energy becoming the preferred heating and cooling method. Apart from continued development of infrastructure to increase the percentage of buildings that convert from full electrical heating to flexible thermal systems, innovation and introduction of new technology are important areas for Enova to stimulate. Increased use of new technology is important for making thermal energy more competitive.
___________________________
21 Read more at www.Enova.no: Market development 2015. Key trends in Enova’s focus areas.22 Source: Statistics Norway – The energy balance 2013.23 Statistics Norway – District heating, 2014: https://www.ssb.no/energi-og-industri/statistikker/fjernvarme/aar/2015-10-02

66
Industry and non-industrial plants and facilities24
More energy measures in industry
Market,potentialandgoalsFor Enova, industry has traditionally been synonymous with mainland industry, which includes small and large companies, everything from small plants with no employees to process facilities with several hundred employees. Recently, Enova has also directed its focus towards the oil and gas sector. The non-industrial plants and facilities market includes roads, onshore power, water, sewage and waste plants, etc.
Overall, industry and oil and gas represent nearly half of all energy consumption and greenhouse gas emissions in Norway25. The mainland industry is characterized by relatively few power-intensive enterprises being responsible for a large share of energy consumption; around 100 market players are responsible for 80 per cent of the total consumption. Studies show a potential for improving energy efficiency in the mainland industry by 10-15 TWh up to 202026. Enova’s goal is to contribute to a more energy-efficient mainland industry that is supplied with renewable energy to the greatest extent possible.
There is a clear perception in the oil and gas industry that the potential for energy efficiency and reduction of greenhouse gas emissions is considerable. Enova wants to contribute to this energy efficiency.
The non-industrial plants and facilities market comprises a number of different segments, and there are no studies showing the total energy efficiency potential. However, we know that the possibilities for energy efficiency and transition from fossil to renewable energy sources are significant, for example in the aquaculture industry.
Through advisory services and financing, we reduce the market players’ risk and increase the pace of restructuring of energy end-use and energy production in mainland industry, offshore and in non-industrial plants and facilities. Enova’s goal is to contribute to a more climate-friendly and energy-efficient industry based on renewable energy.
MarketsituationEnergy consumption in mainland industry has remained stable for several years, while the value of production has increased27.
Specific energy consumption has continuously improved over the years and the core processes have become more energy-efficient28. This is because some industries have reduced capacity, and others have increased activity in parallel with steady development and implementation of improved energy and climate technology.
Investments in mainland industry are at about NOK 20 billion a year. There are significant variations within the various segments. Investments are often competing for limited resources, such as capacity and capital. This also applies to energy and climate projects, where low energy and carbon quotas contribute to weakening profitability. Enova has noticed this as more funding
is required to trigger projects, and there is an increased risk that approved projects will not be completed.
On a positive note, through our projects, Enova has detected a considerable interest among international companies to invest in Norway. One reason for this is Norway’s stable and predictable framework conditions, which are essential when it comes to making long-term investment decisions29.
Energy consumption and emissions have stabilized within oil and gas over the past few years as a result of somewhat lower production. This means that the energy and emission intensity has increased during the same period30. For the first time in a long time, the market is experiencing a downturn due to the low oil price. This results in a lower willingness to invest, but we are also seeing greater interest in energy efficiency measures for existing fields.
ProspectsNorway has natural advantages when it comes to energy in the form of good access to renewable power. Along with our productive and highly competent industry, this provides Norway with a unique basis for further development of energy and climate-friendly industry where we could have a global impact leading up to a low emission society. Increased energy efficiency in industry will strengthen security of supply and facilitate new industry and value creation. This will help building a more robust, competitive and sustainable economy.
In a global market, Norwegian industry must reduce its costs to ensure it is still competitive. Increased competition has a negative effect, making earnings lower and future investment budgets smaller. At the same time, this does have a positive contribution through increased efforts within developing new energy and climate technology. Long-term climate and innovation strategies are becoming more common among large market players, while more and more smaller industry players are starting energy and climate measures. The fact that more non-industrial plants and facilities players are now establishing energy management means that we are also expecting more energy projects within non-industrial plants and facilities in upcoming years.
Oil and gas has become a more prioritized focus area for Enova in recent years, and we are starting to see the results. Looking towards a low emission society, it will be important to also use the expertise and knowledge developed offshore, and turn this into sustainable activity and industry on shore.
The industry of tomorrow will depend on new technology to contribute to increased value creation while also reducing emissions on the path towards a low emission society. Enova will therefore place particular emphasis on stimulating increased innovation in our industry efforts, thereby contributing to the desired change.
___________________________
24 Read more at www.Enova.no: Market development 2015. Key trends in Enova’s focus areas
25 Statistics Norway: Energy accounts and energy balance
26 Enova (2009): Potential for increased energy efficiency in Norwegian land-based industry. The Climate and Pollution Agency Norwegian Environment Agency (2010): Measures and instruments to reduce greenhouse gas emissions from Norwegian industry
27 Statistics Norway 2015: Energy consumption in industry 2014
28 Enova’s Industry Network. Statistics Norway (2015): Energy consumption in industry 2014
29 Carbon Limits (2014): Consequences of low quota prices in EU ETS
30 Norwegian Oil and Gas (2015):Environmental report 2015
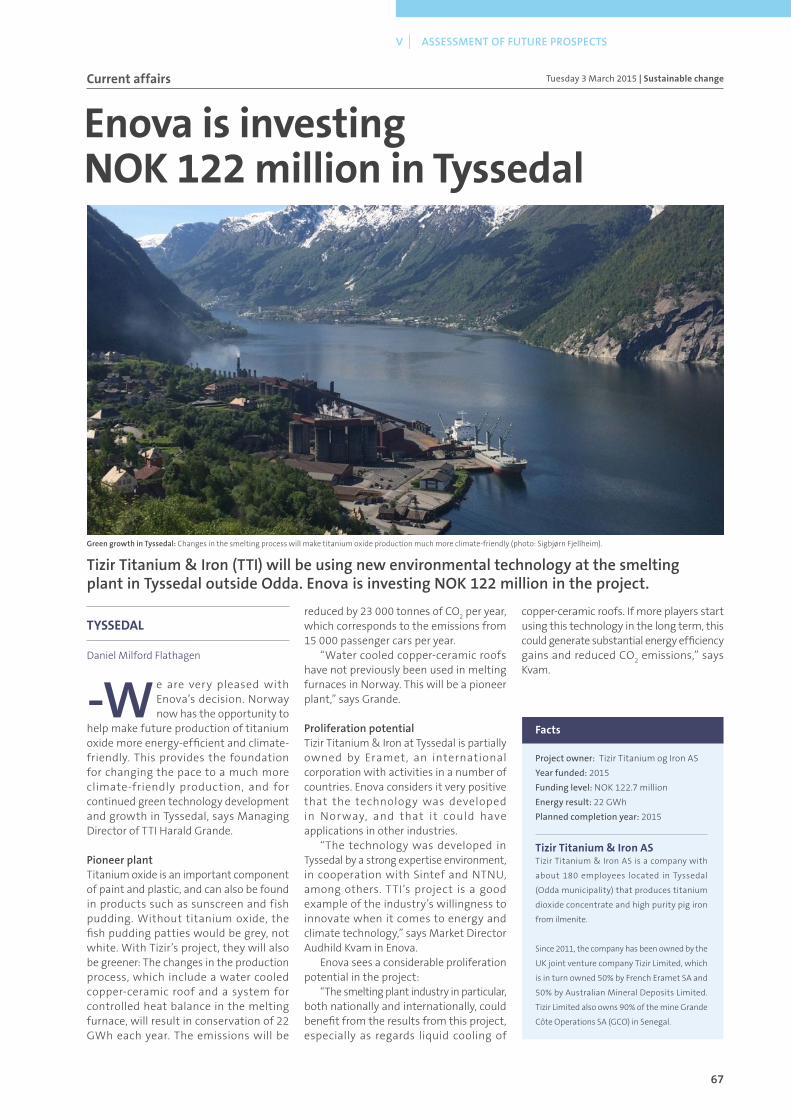
67
V | ASSESSMENT OF FUTURE PROSPECTS
TYSSEDAL
Daniel Milford Flathagen
-We are very pleased with Enova’s decision. Norway now has the opportunity to
help make future production of titanium oxide more energy-efficient and climate-friendly. This provides the foundation for changing the pace to a much more climate-friendly production, and for continued green technology development and growth in Tyssedal, says Managing Director of TTI Harald Grande.
PioneerplantTitanium oxide is an important component of paint and plastic, and can also be found in products such as sunscreen and fish pudding. Without titanium oxide, the fish pudding patties would be grey, not white. With Tizir’s project, they will also be greener: The changes in the production process, which include a water cooled copper-ceramic roof and a system for controlled heat balance in the melting furnace, will result in conservation of 22 GWh each year. The emissions will be
reduced by 23 000 tonnes of CO2 per year,
which corresponds to the emissions from 15 000 passenger cars per year. “Water cooled copper-ceramic roofs have not previously been used in melting furnaces in Norway. This will be a pioneer plant,” says Grande.
ProliferationpotentialTizir Titanium & Iron at Tyssedal is partially owned by Eramet, an international corporation with activities in a number of countries. Enova considers it very positive that the technology was developed in Nor way, and that it could have applications in other industries. “The technology was developed in Tyssedal by a strong expertise environment, in cooperation with Sintef and NTNU, among others. TTI’s project is a good example of the industry’s willingness to innovate when it comes to energy and climate technology,” says Market Director Audhild Kvam in Enova. Enova sees a considerable proliferation potential in the project: “The smelting plant industry in particular, both nationally and internationally, could benefit from the results from this project, especially as regards liquid cooling of
copper-ceramic roofs. If more players start using this technology in the long term, this could generate substantial energy efficiency gains and reduced CO
2 emissions,” says
Kvam.
Enova is investing NOK 122 million in Tyssedal
TizirTitanium&Iron(TTI)willbeusingnewenvironmentaltechnologyatthesmeltingplantinTyssedaloutsideOdda.EnovaisinvestingNOK122millionintheproject.
Tuesday 3 March 2015 | Sustainable changeCurrent affairs
Tizir Titanium & Iron AS is a company with
about 180 employees located in Tyssedal
(Odda municipality) that produces titanium
dioxide concentrate and high purity pig iron
from ilmenite.
Since 2011, the company has been owned by the
UK joint venture company Tizir Limited, which
is in turn owned 50% by French Eramet SA and
50% by Australian Mineral Deposits Limited.
Tizir Limited also owns 90% of the mine Grande
Côte Operations SA (GCO) in Senegal.
Project owner: Tizir Titanium og Iron AS
Year funded: 2015
Funding level: NOK 122.7 million
Energy result: 22 GWh
Planned completion year: 2015
Tizir Titanium & Iron AS
Facts
GreengrowthinTyssedal:Changes in the smelting process will make titanium oxide production much more climate-friendly (photo: Sigbjørn Fjellheim).

68
Non-residential buildings31 Green wave in the property sector
Market,potentialandgoalsThe construction industry is one of Norway’s largest and most complex industries, with many diverse players of varying sizes. Enova defines the market for non-residential buildings as all buildings that are not residential buildings, divided into two main sectors; the private sector with a majority of office buildings, commercial buildings, hotel buildings and warehouses, and the public sector with schools, day care centres, care facilities, culture buildings, hospitals and sports facilities.
Total energy consumption in the private and public sector is approx. 35 TWh. Studies from 2012 showed that the energy efficiency potential in existing buildings is around 7.5 TWh up to 202032.
Investments in building and construction activities have remained at a stable and high level in recent years. Investments in new non-residential buildings amounted to NOK 75.7 billion in 2014. This is up 2.4% from 201333. NOK 73.1 billion were invested in ROT (renovation, reconstruction and additions) of non-residential buildings in the same year, up 5 per cent from 201334.
The goal of Enova’s work within non-residential buildings is to increase the efficiency of energy consumption in the real estate sector to release renewable energy for other purposes, for example within industry and transport.
MarketsituationFrom lessors, business property agents and developers, there are reports of increased interest in investments in energy-efficient buildings and more companies are realising that their reputation can be impacted by the energy and environmental profile of the building they work in. However, energy is not the primary focus for many property owners. One reason for this is that the energy-related costs constitute a relatively small portion of the total housing costs. In the private sector, it is challenging that the lessee pays for energy expenses, and often have short leases that make it less expedient to make long-term investments in the building. For the building owner, it is correspondingly less attractive to implement measures with no financial gains, because only the lessee sees these gains. This, which is often called the own/rent dilemma, also applies to a number of public players, due to separate budgets for investments and operation.
Enova is attempting to break down this barrier, for instance by providing investment support for building owners and lessees who want to upgrade their buildings. We can also see that an important driver for investing in green buildings is long-term and strategic considerations based on a belief that it is easier to rent green buildings than other buildings. This is generating investments in energy and climate measures, and we are seeing some positive trends: new buildings are increasingly getting better, while more and more market players are using Enova’s programmes for existing buildings. The EPC (Energy Performance Contracting) model, where the municipality hires a contractor who guarantees energy results, has accelerated savings in municipal buildings.
Many new buildings are now being constructed with a better energy
quality than what is required by technical regulations. Enova is also seeing that already ambitious energy efficiency projects are becoming increasingly ambitious.
Most spearhead efforts are seen in the public sector. Public building owners, such as municipalities, generally have high ambitions, in both new buildings and existing buildings, but follow-through is inconsistent. Enova has seen that within existing municipal buildings, the EPC model triggers more ambitious projects that are completed in less time.
ProspectsThe green wave in the real estate sector can best be seen in new buildings35, where Enova supports the spearhead efforts that forge ahead in the market. Based on Enova’s driver survey, we expect the green wave to get stronger in the future, where the most energy-efficient buildings are getting even better, and new solutions are put to use. While these buildings are getting better, Enova sees a market that is becoming polarized; the large building owners are investing in green buildings to be competitive in the future rental market. The smaller players do not have the same long-term view as regards green buildings, but are still investing in certain measures within existing buildings. The economic downturn will also influence the property market. A major drop in the oil price over the past year and a very low interest rate level indicates tighter times in business and industry36. There is a risk that the investment level in the private sector will be reduced in 2016 when it comes to energy efficiency measures, both within new buildings and existing buildings. In addition, a low energy price over time has negatively influenced the willingness to implement energy measures. Enova believes that the trend of perceiving green buildings as attractive will continue and somewhat balance the scenario.
Enova assumes that the investment level in the public sector will increase in 2016, in part as a result of political measures to curb unemployment. The national budget contains earmarked funds for public maintenance of existing buildings37 and this could also mean an increased number of applications for Enova. Many EPC projects are expected going forward, and increased activity is also expected within new buildings in the public sector.
Buildings cannot waste energy in a low emission society. This is why innovation is also important within the construction market. Over the past few years, we have promoted several innovative individual buildings that help drive technology development forward. In upcoming years, Enova will also attempt to support projects that combine multiple buildings and areas. At the same time, Enova will continue its work to realize more of the energy efficiency potential in existing buildings. We can see that the changes made to our programmes are also causing more small players to implement energy measures in existing buildings.
Going forward, Enova will work to get even more real estate players to join the green wave that is driving the market in the right direction. We will still stimulate the players that are taking the lead and focus on new energy and climate-friendly technology and innovative solutions.
___________________________
31 Read more at www.Enova.no: Market development 2015. Key trends in Enova’s focus areas
32 Enova report 2012:01 Study of the potential and barriers: energy efficiency in Norwegian buildings.
33 Prognosesenteret, 2015. New non-residential buildings
34 Prognosesenteret, 2015. ROT Non-residential buildings
35 TNS Gallup 2015: Enova’s driver survey for energy measures in existing buildings
36 Prognosesenteret 2015: Macro Norway and the world
37 National Budget 2016: http://www.statsbudsjettet.no/Statsbudsjettet-2016/
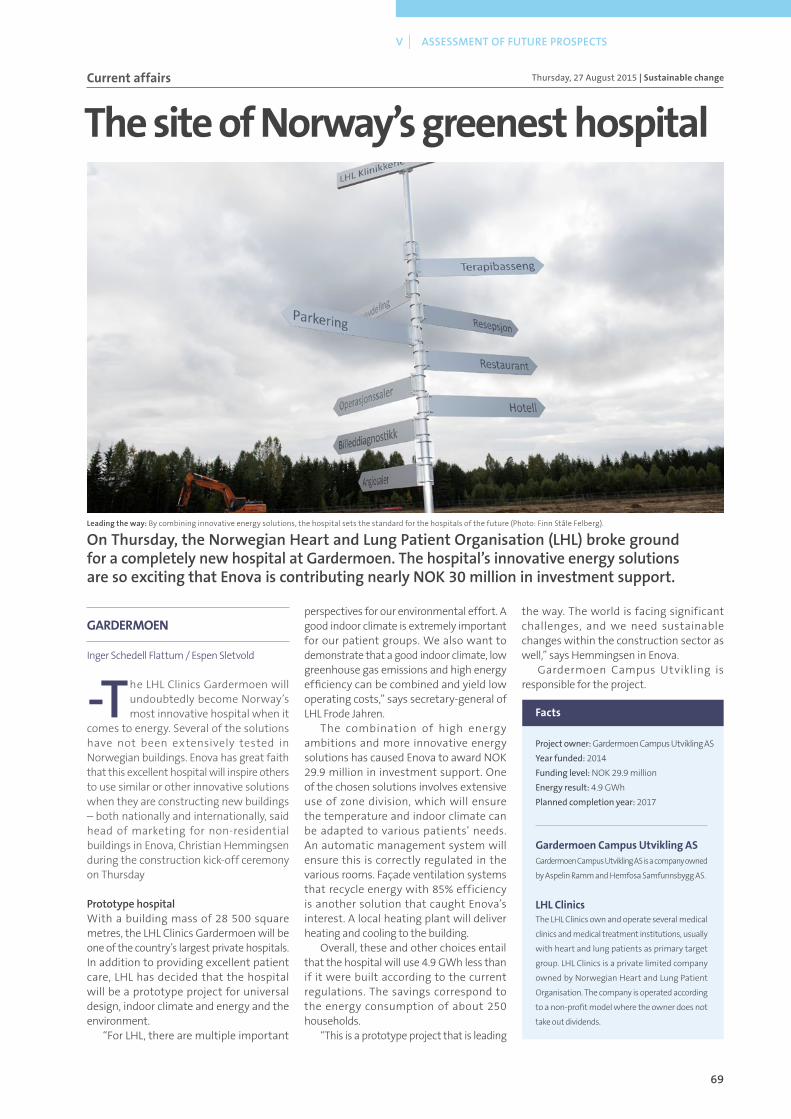
69
V | ASSESSMENT OF FUTURE PROSPECTS
GARDERMOEN
Inger Schedell Flattum / Espen Sletvold
-The LHL Clinics Gardermoen will undoubtedly become Norway’s most innovative hospital when it
comes to energy. Several of the solutions have not been extensively tested in Norwegian buildings. Enova has great faith that this excellent hospital will inspire others to use similar or other innovative solutions when they are constructing new buildings – both nationally and internationally, said head of marketing for non-residential buildings in Enova, Christian Hemmingsen during the construction kick-off ceremony on Thursday
PrototypehospitalWith a building mass of 28 500 square metres, the LHL Clinics Gardermoen will be one of the country’s largest private hospitals. In addition to providing excellent patient care, LHL has decided that the hospital will be a prototype project for universal design, indoor climate and energy and the environment. “For LHL, there are multiple important
perspectives for our environmental effort. A good indoor climate is extremely important for our patient groups. We also want to demonstrate that a good indoor climate, low greenhouse gas emissions and high energy efficiency can be combined and yield low operating costs,” says secretary-general of LHL Frode Jahren. The combination of high energy ambitions and more innovative energy solutions has caused Enova to award NOK 29.9 million in investment support. One of the chosen solutions involves extensive use of zone division, which will ensure the temperature and indoor climate can be adapted to various patients’ needs. An automatic management system will ensure this is correctly regulated in the various rooms. Façade ventilation systems that recycle energy with 85% efficiency is another solution that caught Enova’s interest. A local heating plant will deliver heating and cooling to the building. Overall, these and other choices entail that the hospital will use 4.9 GWh less than if it were built according to the current regulations. The savings correspond to the energy consumption of about 250 households. “This is a prototype project that is leading
the way. The world is facing significant challenges, and we need sustainable changes within the construction sector as well,” says Hemmingsen in Enova. Gardermoen Campus Utvikling is responsible for the project.
The site of Norway’s greenest hospital
OnThursday,theNorwegianHeartandLungPatientOrganisation(LHL)brokegroundforacompletelynewhospitalatGardermoen.Thehospital’sinnovativeenergysolutionsaresoexcitingthatEnovaiscontributingnearlyNOK30millionininvestmentsupport.
Thursday, 27 August 2015 | Sustainable changeCurrent affairs
Gardermoen Campus Utvikling AS is a company owned
by Aspelin Ramm and Hemfosa Samfunnsbygg AS.
The LHL Clinics own and operate several medical
clinics and medical treatment institutions, usually
with heart and lung patients as primary target
group. LHL Clinics is a private limited company
owned by Norwegian Heart and Lung Patient
Organisation. The company is operated according
to a non-profit model where the owner does not
take out dividends.
Project owner: Gardermoen Campus Utvikling AS
Year funded: 2014
Funding level: NOK 29.9 million
Energy result: 4.9 GWh
Planned completion year: 2017
Gardermoen Campus Utvikling AS
LHL Clinics
Facts
Leadingtheway:By combining innovative energy solutions, the hospital sets the standard for the hospitals of the future (Photo: Finn Ståle Felberg).
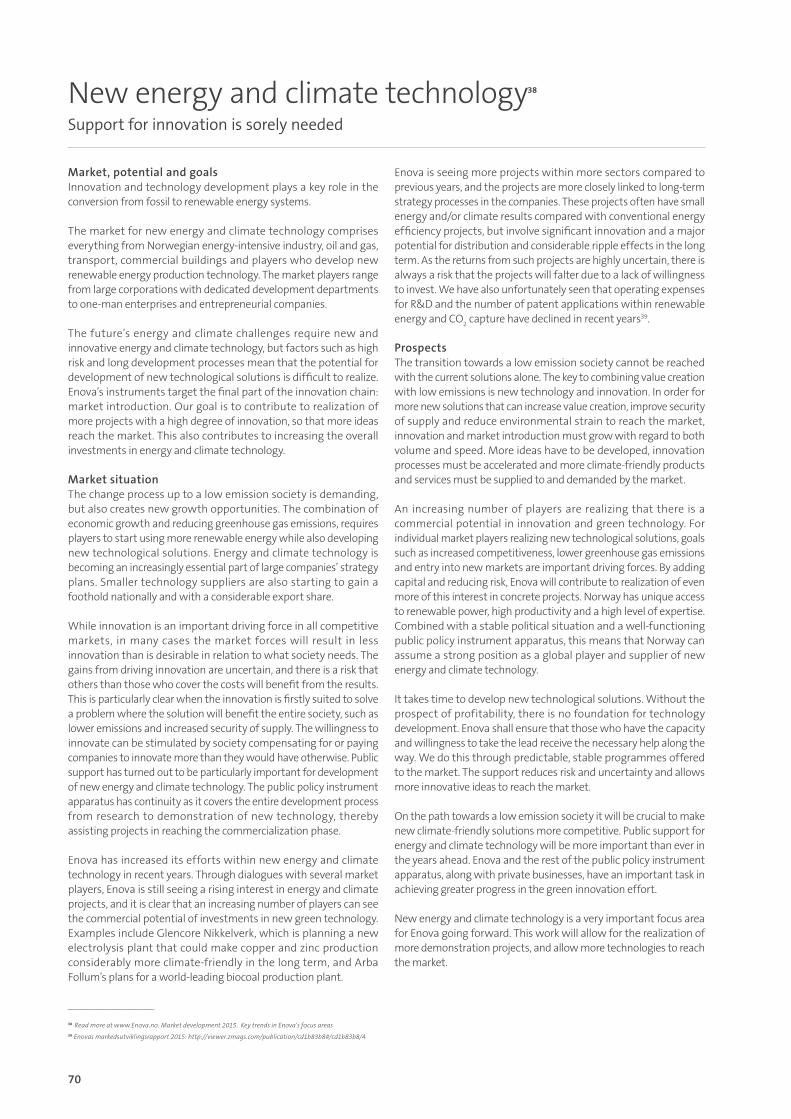
70
New energy and climate technology38 Support for innovation is sorely needed
Market,potentialandgoalsInnovation and technology development plays a key role in the conversion from fossil to renewable energy systems.
The market for new energy and climate technology comprises everything from Norwegian energy-intensive industry, oil and gas, transport, commercial buildings and players who develop new renewable energy production technology. The market players range from large corporations with dedicated development departments to one-man enterprises and entrepreneurial companies.
The future’s energy and climate challenges require new and innovative energy and climate technology, but factors such as high risk and long development processes mean that the potential for development of new technological solutions is difficult to realize. Enova’s instruments target the final part of the innovation chain: market introduction. Our goal is to contribute to realization of more projects with a high degree of innovation, so that more ideas reach the market. This also contributes to increasing the overall investments in energy and climate technology.
MarketsituationThe change process up to a low emission society is demanding, but also creates new growth opportunities. The combination of economic growth and reducing greenhouse gas emissions, requires players to start using more renewable energy while also developing new technological solutions. Energy and climate technology is becoming an increasingly essential part of large companies’ strategy plans. Smaller technology suppliers are also starting to gain a foothold nationally and with a considerable export share.
While innovation is an important driving force in all competitive markets, in many cases the market forces will result in less innovation than is desirable in relation to what society needs. The gains from driving innovation are uncertain, and there is a risk that others than those who cover the costs will benefit from the results. This is particularly clear when the innovation is firstly suited to solve a problem where the solution will benefit the entire society, such as lower emissions and increased security of supply. The willingness to innovate can be stimulated by society compensating for or paying companies to innovate more than they would have otherwise. Public support has turned out to be particularly important for development of new energy and climate technology. The public policy instrument apparatus has continuity as it covers the entire development process from research to demonstration of new technology, thereby assisting projects in reaching the commercialization phase.
Enova has increased its efforts within new energy and climate technology in recent years. Through dialogues with several market players, Enova is still seeing a rising interest in energy and climate projects, and it is clear that an increasing number of players can see the commercial potential of investments in new green technology. Examples include Glencore Nikkelverk, which is planning a new electrolysis plant that could make copper and zinc production considerably more climate-friendly in the long term, and Arba Follum’s plans for a world-leading biocoal production plant.
Enova is seeing more projects within more sectors compared to previous years, and the projects are more closely linked to long-term strategy processes in the companies. These projects often have small energy and/or climate results compared with conventional energy efficiency projects, but involve significant innovation and a major potential for distribution and considerable ripple effects in the long term. As the returns from such projects are highly uncertain, there is always a risk that the projects will falter due to a lack of willingness to invest. We have also unfortunately seen that operating expenses for R&D and the number of patent applications within renewable energy and CO
2 capture have declined in recent years39.
ProspectsThe transition towards a low emission society cannot be reached with the current solutions alone. The key to combining value creation with low emissions is new technology and innovation. In order for more new solutions that can increase value creation, improve security of supply and reduce environmental strain to reach the market, innovation and market introduction must grow with regard to both volume and speed. More ideas have to be developed, innovation processes must be accelerated and more climate-friendly products and services must be supplied to and demanded by the market.
An increasing number of players are realizing that there is a commercial potential in innovation and green technology. For individual market players realizing new technological solutions, goals such as increased competitiveness, lower greenhouse gas emissions and entry into new markets are important driving forces. By adding capital and reducing risk, Enova will contribute to realization of even more of this interest in concrete projects. Norway has unique access to renewable power, high productivity and a high level of expertise. Combined with a stable political situation and a well-functioning public policy instrument apparatus, this means that Norway can assume a strong position as a global player and supplier of new energy and climate technology.
It takes time to develop new technological solutions. Without the prospect of profitability, there is no foundation for technology development. Enova shall ensure that those who have the capacity and willingness to take the lead receive the necessary help along the way. We do this through predictable, stable programmes offered to the market. The support reduces risk and uncertainty and allows more innovative ideas to reach the market.
On the path towards a low emission society it will be crucial to make new climate-friendly solutions more competitive. Public support for energy and climate technology will be more important than ever in the years ahead. Enova and the rest of the public policy instrument apparatus, along with private businesses, have an important task in achieving greater progress in the green innovation effort.
New energy and climate technology is a very important focus area for Enova going forward. This work will allow for the realization of more demonstration projects, and allow more technologies to reach the market.
___________________________
38 Read more at www.Enova.no: Market development 2015. Key trends in Enova’s focus areas
39 Enovas markedsutviklingsrapport 2015: http://viewer.zmags.com/publication/cd1b83b8#/cd1b83b8/4

71
V | ASSESSMENT OF FUTURE PROSPECTS
OSLO
Ben Holan /Espen Sletvold
-B iocoal can become a ver y important contribution towards reducing global CO
2 emissions by
replacing fossil coal. This makes it a future-oriented form of energy that can also give the Norwegian forestry industry a much needed boost, says General Manager of Treklyngen AS, Rolf Jarle Aaberg. The biocoal is made from 100 per cent wood and has virtually the same properties as fossil coal. This means it is possible to replace fossil coal with renewable biocoal, without the coal power plants having to make major modifications. “We need more legs to stand on. The green shift provides new opportunities for the forestry industry. It is therefore excellent news that the biocoal plant is receiving support. Good framework conditions and support from the public policy instrument apparatus entails that the project is now one step closer to realization,” says Minister of Trade and Industry Monica Mæland (H).
SignificantpotentialViken Skog acquired Follum paper mill from Norske Skog ASA in 2012 to establish new forestry industry on the site and the chairman of Viken Skog, Olav Breivik, is very positive about the opportunities that the plant could create. “The production plant will create new jobs at Follum and is a boost for the forestry industry, which will deliver 500 000 cubic metres of forest raw material. It is important to use the wood from the forest which does not yet have a market in the industry, and to exploit the sidestreams in the sawmill industry. I believe it will inspire everyone who wants concrete examples of Norway creating new and green industry,” says Breivik. Arbaflame has already produced more than 100 000 tonnes of biocoal in a dedicated test plant at Kongsvinger. However, the production technology that will be used at Follum will become much more energy-efficient, which is the reason why Enova had decided to grant NOK 138 million in investment support for the project. Like all funding commitments of this size, the funding commitment is subject to approval by EFTA’s Surveillance Authority, ESA.
“This project has significant potential. In order to face the climate challenge, we need to make renewable energy solutions more competitive. Making biocoal production more energy-efficient is an important contribution,” says head of the industry market in Enova, Oskar Gärdeman.
NOK 138 million investment in biocoal plant
EnovaisinvestingNOK138millioninaworld-leadingbiocoalproductionplantatFollum.Theplantwillhaveaproductioncapacityofupto200000tonnesayear,whichwillreduceglobalCO
2emissionsby400000tonnesayear.
Tuesday, 10 November 2015 | Sustainable changeCurrent affairs
The Arba Follum company was founded with the
purpose of establishing demonstration plants for
production of bio-based substitutes for fossil
coal, Arbapellets, based on the Arbaflames
company’s production technology. Arba Follum
is owned by Statsskog (20 per cent), Viken Skog
(40 per cent) and Arbaflame (40 per cent).
Project owner: Arba Follum AS
Year funded: 2015
Funding level: NOK 138 million
Energy result: 142.5 GWh
Planned completion year: 2017
Arba Follum AS
Facts
Causeforcake:The Enova funding commitment was celebrated with cake. From the left: Olav Brevik (Viken skog), Bjørn Knappskog (Arbaflame), Oskar Gärderman (Enova), Rolf Jarle Aaberg (Treklyngen) and Espen Lahnstein (Norges skogeierforbund) (Photo: Viken Skog).

72
Transport40
The transport industry goes electric
Market,potentialandgoalsThe transport sector represents a third of total Norwegian emissions, and is the sector with the greatest potential for reducing Norwegian greenhouse gas emissions. The emissions from the sector have increased from 13.3 million tonnes of CO
2
equivalents in 1990 to 17.1 million tonnes in 2013. Emissions have remained stable over the past four years41.
In 2015, Enova was tasked with reducing greenhouse gas emissions from the transport sector. Our goals within the sector are to contribute to more environmentally friendly energy consumption, more climate-efficient methods of transport and a reduction in the scope of transport.
MarketsituationElectrification of the transport sector is well under way. The passenger car market has come far, and every fifth new car sold is electric. Beneficial advantages such as free parking and tolls, and well as a VAT exemption have been important drivers. In addition, more and more infrastructure is being developed for charging and quick charging, but the range of the cars is still a barrier42.
Electrification has not progressed as far for larger vehicles and vessels, and technology development is still required. However, the market is on the move; Stavanger’s first battery-electric buses are driving regular routes, and Asko is planning to roll out the nation’s three first electric lorries in 2016. The world’s first electric smack was constructed and tested in Norway, and the fully electric car ferry Ampere is running regular routes in Sognefjorden.
Production and consumption of biogas is on the rise, while the access to good quality liquid biofuel is low in Norway so far, due to limited production. Hydrogen may play a part both for phasing out fossil energy from the transport sector, and as a storage capacity and effect buffer in the electric energy system. As an energy carrier in transport, hydrogen is still just starting out. There are some filling stations in Eastern Norway and still a limited number of available cars globally.
ProspectsProjections from CenSES43 indicate strong growth in all transport, well exceeding population growth, particularly on roads. Energy consumption in transport may increase gradually to 80 TWh in 2050, where road transport constitutes about half. Though the transport need is increasing, analyses from the Norwegian Environment Agency show that emissions from the transport sector will stabilize at 18 million tonnes of CO
2 equivalents from 2030 and beyond44.
Energy efficiency measures and more energy-efficient methods of transport will become necessary to reduce the greenhouse gas emissions from the transport sector. In addition, near zero emission solutions must be phased in to all methods of transport. This is contingent upon significant technological development
within e.g. batteries, hydrogen and biofuel production. Much of this development could take place in Norway.
The need for innovation relates to the entire value chain, including charging technology, battery and vehicle development, and for hydrogen also infrastructure, production and storage.
In order speed up development in the sector, Enova established dedicated support programmes that cover energy measures in both sea and inland transport. Enova supports development of charging infrastructure and onshore power, biofuel production and development of new energy and climate technology.
The electrification will accelerate. More people will switch from a combustion engine to an electric engine and battery, thanks to continued development of battery technology. Enova’s work on charging stations along the main roads will help make it easier to use electric cars for long trips. For freight transportation, we are expecting electrification of local distribution of goods.
For sea transport, it is likely that batteries and power electronics between diesel engines and electric engines will become the norm in various types of vessels. Many vessels could also have charging options so they can run either purely on batteries or when they are near a harbour. Enova wants to help ensure more harbours and vessels are facilitated for onshore power and battery operation, so that engines and generators can be turned off in harbours. Enova will also push energy efficiency measures in the general maritime sector, with support for those who reduce energy consumption.
Alternative fuels such as hydrogen can become important on the road towards emission-free transport. Efficient production and distribution will be important to accelerate the hydrogen market, and filling stations and means of transportation are in the pipeline on land and at sea. It is likely that transport segments that are less suitable for electrification, such as heavy transport over long distances, will start using hydrogen in the future. Enova supports innovative hydrogen projects to bring the market forward.
In 2015, more market players started distributing and selling biofuel to passenger cars and long-haul transport, and both in Norway and abroad, many have started large-scale industrial biofuel production. More production plants can be realized with support from Enova, which will increase the availability of biofuel and lower the costs down to the level of fossil fuel. Biofuel can be used in both inland transport, at sea and in aviation, but should be prioritized in the sectors where use of electrification and hydrogen are challenging.
In a low emission society, the transport sector must be innovative, energy-efficient and virtually emission-free. Enova will also contribute to a green shift in the transport sector going forward, through supporting more environmentally friendly energy consumption.
___________________________
40 Read more at www.Enova.no: Market development 2015. Key trends in Enova’s focus areas
41 Statistics Norway (2015). Greenhouse gases, by source (activity), energy product, component, time and statistical variable
42 NAF/Osloeconomics (2015): The electric car’s competitiveness in Norway.
43 CenSES (2014). Energy projections up to 2050.
44 Norwegian Environment Agency (2014). Knowledge basis for low emission development

73
V | ASSESSMENT OF FUTURE PROSPECTS
BØMLO
Daniel Milford Flathagen
-B attery solutions in the maritime sec tor could signif icantly r e d u c e g r e e n h o u s e g a s
emissions going forward, and we are excited to contribute to the realization of Eidesvik’s project. The shipping company has worked with a focus on energy and climate solutions for years, and are among those staking out a new course for the maritime industry, says Enova transport market manager Petter Hersleth.
ReducingemissionsThe use of batteries on board reduces Viking Energy’s annual energy consumption by 4.5 GWh, which corresponds to the consumption of more than 200 Norwegian households. The installation is a cooperation with Statoil, which recently extended its agreement with Eidesvik. “The energy
storage system reduces fuel consumption and emissions as the generators on board can operate with a more even and optimal load. We have seen that Statoil is increasingly interested in these types of solutions. The battery installation was probably a contributing factor to the extension of the agreement, says CEO Jan Fredrik Meling in Eidesvik Offshore.
EnovasupportisatriggerEidesvik believes the support from Enova was essential for getting the battery solution into place. “This makes it possible for us to use our environmental work in good commercial solutions in a challenging market. We have enjoyed a good dialogue with Enova, who were key in helping make this happen,” says Meling. Enova hopes more shipping companies will follow in Eidesvik Offshore’s tracks: “Batteries can and should be more widely used at sea. Different types of vessels have significant variations in the propulsion system, operational profile and which
operations they perform, so even if there are already several vessels with battery systems on board, we still see a need for more projects so that systems like this will become the standard solution,” says Hersleth.
Installing batteries on board
EnovaiscontributingNOK7.44milliontoEidesvikOffshore’sinstallationofabatterysystemintheVikingEnergysupplyvessel.
Tuesday, 17 November 2015 | Sustainable changeCurrent affairs
Eidesvik Offshore ASA is an offshore shipping
company, and operates vessels within supply,
seismic and subsea.
Eidesvik has approx. 600 permanent employees, as
well as long-term contracting of international crews
(approx. 250 people). The shipping company is run
from Langevåg at Bømlo. Eidesvik owns and operates
a total of 26 ships which operate all over the globe.
Project owner: Eidesvik Offshore ASA
Year funded: 2015
Funding level: NOK 7.4 million
Energy result: 4.5 GWh
Planned completion year: 2016
Eidesvik Offshore ASA
Facts
Smoothsailingahead:With Enova’s support, Eidesvik Offshore can implement their environmental work in good commercial solutions (Photo: Eidesvik Offshore).
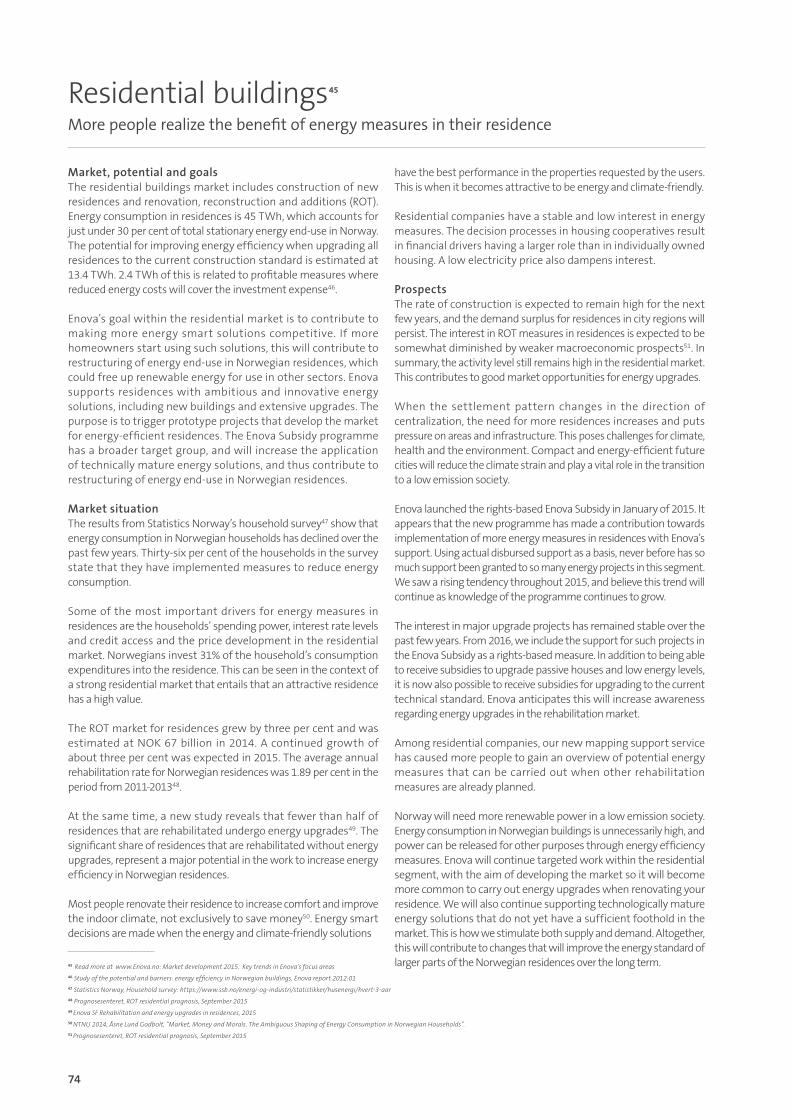
74
Residential buildings45
More people realize the benefit of energy measures in their residence
Market,potentialandgoalsThe residential buildings market includes construction of new residences and renovation, reconstruction and additions (ROT). Energy consumption in residences is 45 TWh, which accounts for just under 30 per cent of total stationary energy end-use in Norway. The potential for improving energy efficiency when upgrading all residences to the current construction standard is estimated at 13.4 TWh. 2.4 TWh of this is related to profitable measures where reduced energy costs will cover the investment expense46.
Enova’s goal within the residential market is to contribute to making more energy smart solutions competitive. If more homeowners start using such solutions, this will contribute to restructuring of energy end-use in Norwegian residences, which could free up renewable energy for use in other sectors. Enova supports residences with ambitious and innovative energy solutions, including new buildings and extensive upgrades. The purpose is to trigger prototype projects that develop the market for energy-efficient residences. The Enova Subsidy programme has a broader target group, and will increase the application of technically mature energy solutions, and thus contribute to restructuring of energy end-use in Norwegian residences.
MarketsituationThe results from Statistics Norway’s household survey47 show that energy consumption in Norwegian households has declined over the past few years. Thirty-six per cent of the households in the survey state that they have implemented measures to reduce energy consumption.
Some of the most important drivers for energy measures in residences are the households’ spending power, interest rate levels and credit access and the price development in the residential market. Norwegians invest 31% of the household’s consumption expenditures into the residence. This can be seen in the context of a strong residential market that entails that an attractive residence has a high value.
The ROT market for residences grew by three per cent and was estimated at NOK 67 billion in 2014. A continued growth of about three per cent was expected in 2015. The average annual rehabilitation rate for Norwegian residences was 1.89 per cent in the period from 2011-201348.
At the same time, a new study reveals that fewer than half of residences that are rehabilitated undergo energy upgrades49. The significant share of residences that are rehabilitated without energy upgrades, represent a major potential in the work to increase energy efficiency in Norwegian residences.
Most people renovate their residence to increase comfort and improve the indoor climate, not exclusively to save money50. Energy smart decisions are made when the energy and climate-friendly solutions
have the best performance in the properties requested by the users. This is when it becomes attractive to be energy and climate-friendly.
Residential companies have a stable and low interest in energy measures. The decision processes in housing cooperatives result in financial drivers having a larger role than in individually owned housing. A low electricity price also dampens interest.
ProspectsThe rate of construction is expected to remain high for the next few years, and the demand surplus for residences in city regions will persist. The interest in ROT measures in residences is expected to be somewhat diminished by weaker macroeconomic prospects51. In summary, the activity level still remains high in the residential market. This contributes to good market opportunities for energy upgrades.
When the settlement pattern changes in the direction of centralization, the need for more residences increases and puts pressure on areas and infrastructure. This poses challenges for climate, health and the environment. Compact and energy-efficient future cities will reduce the climate strain and play a vital role in the transition to a low emission society.
Enova launched the rights-based Enova Subsidy in January of 2015. It appears that the new programme has made a contribution towards implementation of more energy measures in residences with Enova’s support. Using actual disbursed support as a basis, never before has so much support been granted to so many energy projects in this segment. We saw a rising tendency throughout 2015, and believe this trend will continue as knowledge of the programme continues to grow.
The interest in major upgrade projects has remained stable over the past few years. From 2016, we include the support for such projects in the Enova Subsidy as a rights-based measure. In addition to being able to receive subsidies to upgrade passive houses and low energy levels, it is now also possible to receive subsidies for upgrading to the current technical standard. Enova anticipates this will increase awareness regarding energy upgrades in the rehabilitation market.
Among residential companies, our new mapping support service has caused more people to gain an overview of potential energy measures that can be carried out when other rehabilitation measures are already planned.
Norway will need more renewable power in a low emission society. Energy consumption in Norwegian buildings is unnecessarily high, and power can be released for other purposes through energy efficiency measures. Enova will continue targeted work within the residential segment, with the aim of developing the market so it will become more common to carry out energy upgrades when renovating your residence. We will also continue supporting technologically mature energy solutions that do not yet have a sufficient foothold in the market. This is how we stimulate both supply and demand. Altogether, this will contribute to changes that will improve the energy standard of larger parts of the Norwegian residences over the long term.
___________________________
45 Read more at www.Enova.no: Market development 2015. Key trends in Enova’s focus areas
46 Study of the potential and barriers: energy efficiency in Norwegian buildings, Enova report 2012:01
47 Statistics Norway, Household survey: https://www.ssb.no/energi-og-industri/statistikker/husenergi/hvert-3-aar
48 Prognosesenteret, ROT residential prognosis, September 2015
49 Enova SF Rehabilitation and energy upgrades in residences, 2015
50 NTNU 2014, Åsne Lund Godbolt, “Market, Money and Morals. The Ambiguous Shaping of Energy Consumption in Norwegian Households”.
51 Prognosesenteret, ROT residential prognosis, September 2015
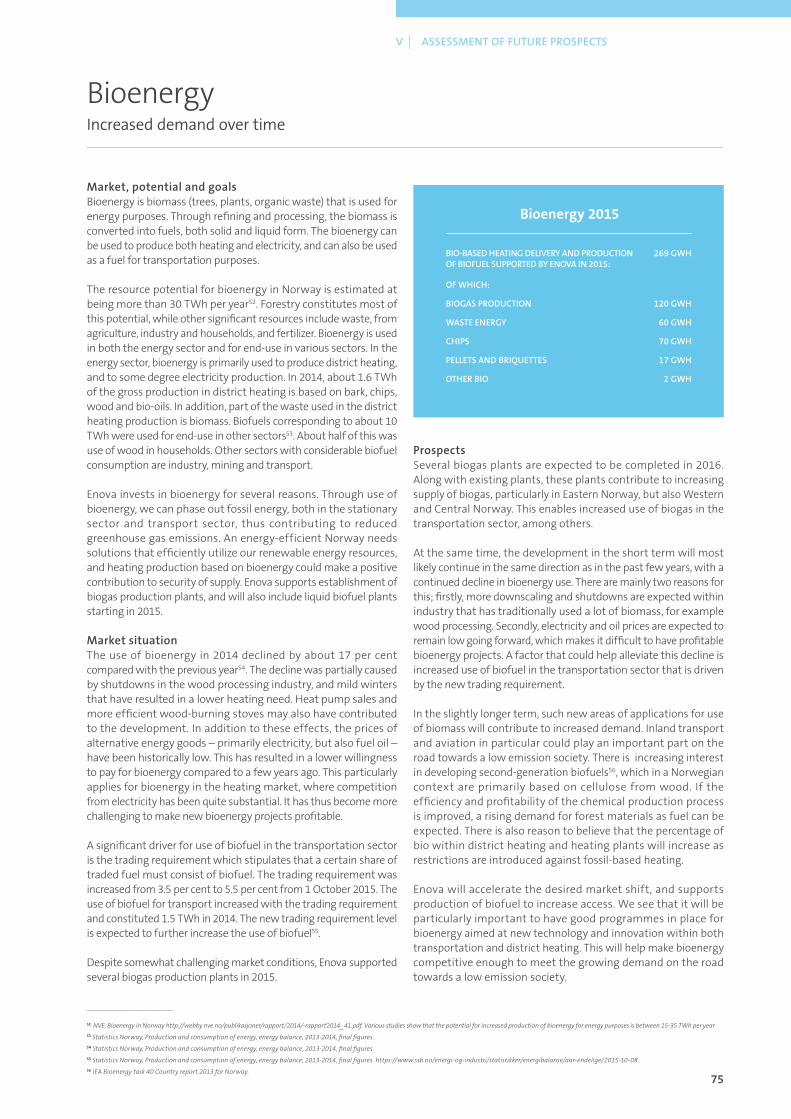
75
V | ASSESSMENT OF FUTURE PROSPECTS
BioenergyIncreased demand over time
Market,potentialandgoalsBioenergy is biomass (trees, plants, organic waste) that is used for energy purposes. Through refining and processing, the biomass is converted into fuels, both solid and liquid form. The bioenergy can be used to produce both heating and electricity, and can also be used as a fuel for transportation purposes.
The resource potential for bioenergy in Norway is estimated at being more than 30 TWh per year52. Forestry constitutes most of this potential, while other significant resources include waste, from agriculture, industry and households, and fertilizer. Bioenergy is used in both the energy sector and for end-use in various sectors. In the energy sector, bioenergy is primarily used to produce district heating, and to some degree electricity production. In 2014, about 1.6 TWh of the gross production in district heating is based on bark, chips, wood and bio-oils. In addition, part of the waste used in the district heating production is biomass. Biofuels corresponding to about 10 TWh were used for end-use in other sectors53. About half of this was use of wood in households. Other sectors with considerable biofuel consumption are industry, mining and transport.
Enova invests in bioenergy for several reasons. Through use of bioenergy, we can phase out fossil energy, both in the stationary sector and transport sector, thus contributing to reduced greenhouse gas emissions. An energy-efficient Norway needs solutions that efficiently utilize our renewable energy resources, and heating production based on bioenergy could make a positive contribution to security of supply. Enova supports establishment of biogas production plants, and will also include liquid biofuel plants starting in 2015.
MarketsituationThe use of bioenergy in 2014 declined by about 17 per cent compared with the previous year54. The decline was partially caused by shutdowns in the wood processing industry, and mild winters that have resulted in a lower heating need. Heat pump sales and more efficient wood-burning stoves may also have contributed to the development. In addition to these effects, the prices of alternative energy goods – primarily electricity, but also fuel oil – have been historically low. This has resulted in a lower willingness to pay for bioenergy compared to a few years ago. This particularly applies for bioenergy in the heating market, where competition from electricity has been quite substantial. It has thus become more challenging to make new bioenergy projects profitable.
A significant driver for use of biofuel in the transportation sector is the trading requirement which stipulates that a certain share of traded fuel must consist of biofuel. The trading requirement was increased from 3.5 per cent to 5.5 per cent from 1 October 2015. The use of biofuel for transport increased with the trading requirement and constituted 1.5 TWh in 2014. The new trading requirement level is expected to further increase the use of biofuel55.
Despite somewhat challenging market conditions, Enova supported several biogas production plants in 2015.
ProspectsSeveral biogas plants are expected to be completed in 2016. Along with existing plants, these plants contribute to increasing supply of biogas, particularly in Eastern Norway, but also Western and Central Norway. This enables increased use of biogas in the transportation sector, among others.
At the same time, the development in the short term will most likely continue in the same direction as in the past few years, with a continued decline in bioenergy use. There are mainly two reasons for this; firstly, more downscaling and shutdowns are expected within industry that has traditionally used a lot of biomass, for example wood processing. Secondly, electricity and oil prices are expected to remain low going forward, which makes it difficult to have profitable bioenergy projects. A factor that could help alleviate this decline is increased use of biofuel in the transportation sector that is driven by the new trading requirement.
In the slightly longer term, such new areas of applications for use of biomass will contribute to increased demand. Inland transport and aviation in particular could play an important part on the road towards a low emission society. There is increasing interest in developing second-generation biofuels56, which in a Norwegian context are primarily based on cellulose from wood. If the efficiency and profitability of the chemical production process is improved, a rising demand for forest materials as fuel can be expected. There is also reason to believe that the percentage of bio within district heating and heating plants will increase as restrictions are introduced against fossil-based heating.
Enova will accelerate the desired market shift, and supports production of biofuel to increase access. We see that it will be particularly important to have good programmes in place for bioenergy aimed at new technology and innovation within both transportation and district heating. This will help make bioenergy competitive enough to meet the growing demand on the road towards a low emission society.
___________________________
52 NVE, Bioenergy in Norway http://webby.nve.no/publikasjoner/rapport/2014/-rapport2014_41.pdf. Various studies show that the potential for increased production of bioenergy for energy purposes is between 15-35 TWh per year
53 Statistics Norway, Production and consumption of energy, energy balance, 2013-2014, final figures.
54 Statistics Norway, Production and consumption of energy, energy balance, 2013-2014, final figures.
55 Statistics Norway, Production and consumption of energy, energy balance, 2013-2014, final figures. https://www.ssb.no/energi-og-industri/statistikker/energibalanse/aar-endelige/2015-10-08
56 IEA Bioenergy task 40 Country report 2013 for Norway.
Bioenergy 2015
BIO-BASEDHEATINGDELIVERYANDPRODUCTIONOFBIOFUELSUPPORTEDBYENOVAIN2015:
269GWH
OFWHICH:
BIOGASPRODUCTION 120GWH
WASTEENERGY 60GWH
CHIPS 70GWH
PELLETSANDBRIQUETTES 17GWH
OTHERBIO 2GWH

76

77
DelVIÅrsregnskap
Not translated to english.
76 DelVIÅrsregnskap
78 Årsregnskap Energifondet
83 Årsregnskap Enova SF

78
Innledning Energifondet skal være en forutsigbar og langsiktig finans-ieringskilde for arbeidet med å fremme en miljøvennlig omlegging av energibruk og energiproduksjon, samt utvikling av energi- og klimateknologi. Midlene skal bidra til å styrke forsyningssikkerheten og redusere utslippene av klimagasser. Enova SF forvalter Energifondet. Årsregnskapet for Energifondet er ført etter kontantprinsippet og viser innbetalinger og utbetalinger til/fra Energifondet i 2015, samt fondskapitalen pr 31.12.2015. Regnskapet viser et overskudd på 889 millioner kroner. Overskuddet er i sin helhet overført til fondskapitalen. Overføringtilfondet Energifondets inntek ter i 2015 er på 2 386 millioner kroner. Energifondets inntekter består av overføringer fra statsbudsjettet, renteinntekter og inntekter fra påslag på nettariffen.
Overføringer fra statsbudsjettet er avkasting fra grunnfond for klima, fornybar energi og energi- omlegging. I tillegg en overføring av ubrukte midler fra Samferdselsdepartementet i forbindelse med prosjek ter over tat t fra Transnova. Renteinntektene kommer fra Energifondets midler i Norges Bank. Påslaget på nettariffen er en avgift som pålegges uttak av kraft i distribusjonsnettet. I 2015 er påslaget for elektrisitetsbruk i husholdningene 1 øre per kWh. Alle andre sluttbrukere betaler 800 kroner pr år per Målepunkt-ID.
Tilskudd Total utbetalt tilskudd i 2015 er på 1 256 millioner kroner Tilskudd fra Energifondet utbetales etterskuddsvis i tråd med påløpte kostnader i prosjektene som har fått tilsagn om støtte. Enova har støtteprogrammer rettet mot private, næringslivet og offentlig sektor, innenfor energiproduksjon, energisparing og ny energi- og klimateknologi. Utbetaling til ikke finansielle foretak på 958 millioner kroner utgjorde majoriteten av utbetalingene i 2015.
Avtalefestedeaktiviteter Det er i 2015 utbetalt 94 millioner kroner til avtalefestede aktiviteter. I tråd med avtale med Olje- og energidepartementet f inansierer fondsmidlene et landsdekkende tilbud av informasjons- og rådgivningstjenester som bygger opp under og legger til rette for at målene i avtalen nås.
Administrasjonavfondet I henhold til vedtektene for Energifondet skal administrasjon knyttet til forvaltningen av midlene fra Energifondet dekkes av fondet. I 2015 var utbetaling av administrasjonshonorar 147,9 millioner kroner til Enova SF. Balanse Energifondets kapital var pr 31.12.2015 på 8 265 millioner kroner. Midlene er plassert i Norges Bank på en konto som er en del av statens konsernkontoordning. Energifondets kapital skal til en hver tid dekke Energifondets forpliktelser. I tillegg har Energifondet tilsagnsfullmakt til å forplikte 400 millioner kroner utover fondskapitalen. Forpliktelser Pr 31.12.2015 er netto forpliktelser på Energifondet 6 988 millioner kroner. Beløpet omfatter inngåtte forpliktelser redusert med gjennomførte utbetalinger. Revisjonsordning Riksrevisjonen har besluttet å avvikle revisjonen av fond som forvaltes av selskaper. Revisjon av Energifondet er fra 2015 overført til Deloitte som er Enovas valgte revisor. Revisoruttalselsen vedlegges årsregnskapet og bekrefter framlagt regnskap for fondet overfor Olje- og energidepartementet. Avslutning Årsregnskapet er avlagt i henhold bestemmelser om økonomi-styring i staten, rundskriv fra Finansdepartementet og krav fra overordnet departement. Enova har ført et fullstendig og separat regnskap over alle inntekter og utgifter for Energifondet herunder tilsagn/forpliktelser. Dette gir etter styrets vurdering et dekkene bilde av Energifondets resultat og økonomiske situasjon i 2015.
Ledelseskommentarer
Tore Holm
Styrets leder
Hege G. Wiggen
Styremedlem
Elizabeth Baumann Ofstad
Styrets nestleder
Dina Elverum Aune
Styremedlem
Tor Brekke
Styremedlem
Eirik Gaard Kristiansen
Styremedlem
Einar Håndlykken
Styremedlem
Konrad Pütz
Styremedlem
Nils Kristian Nakstad
Administrerende direktør
Olav Hasaas
Styremedlem
Katharina Thøgersen Bramslev
Styremedlem
Trondheim18.februar2016
Årsregnskap Energifondet

79
VI | ÅRSREGNSKAP
Beholdningerrapportertilikvidrapport Note Regnskap2015
Inngående saldo på oppgjørskonto i Norges Bank 7 346 797 800
Endringer i perioden 918 356 960
SumutgåendesaldooppgjørskontoiNorgesBank 8265154760
Beholdningerrapporterttilkapitalregnskapet(31.12)
Konto Tekst Note 2015 2014 Endring
64.18.01 Ordinære fond (eiendeler) 8 265 154 760 7 346 797 800 918 356 960
81.18.02 Beholdninger på konto i Norges Bank 8 265 154 760 7 346 797 800 918 356 960
NoteATildelingeravmidlerforEnergifondetiregnskapsåret2015
Utgiftskapittel Kapittelnavn Post Posttekst Åretstildelinger
1825 Energiomlegging, energi- og klimateknologi 50 Overføring til Energifondet 1 496 209 671
Bevilgningsrapportering
Resultatregnskap for Energifondet 2015
Note 2015 2014
Overføringtilfondet
Inntekter fra påslag på nettariffen 669 615 846 648 449 474
Overføring over statsbudsjettet 1 636 925 671 1 215 506 883
Renter på innskudd i Norges Bank 78 985 915 96 707 361
Sumoverføringertilfondet 1 2385527431 1960663718
Overføringerfrafondet
Tilskudd til kommuner 139 426 177 93 564 947
Tilskudd til fylkeskommuner 13 313 752 15 436 910
Tilskudd til ikke-finansielle foretak 957 690 507 755 120 982
Tilskudd til finansielle foretak 1 179 905 143 110
Tilskudd til husholdninger 87 669 777 50 143 599
Tilskudd til ideelle organisasjoner 17 818 512 12 692 436
Tilskudd til statsforvaltningen 39 200 796 47 674 082
Sumtilskudd 2 1256299425 974776067
Avtalefestede aktiviteter 3 94 050 402 98 780 519
Administrasjon av fondet 4 147 860 476 128 500 000
Sumoverføringerfrafondet 1498210303 1202056586
Finansinntekter
Innskuddsrenter Danske bank/SMN 1 774 671 2 766 072
Renteinntekter nettariff 55 673 67 381
Nettofinansinntekter 5 1830344 2833453
Årsresultat 6 889147473 761440586
Disponeringavårsresultat
Overføringavperiodensresultattilopptjentfondskapital 889147473 761440586

80
Balanse for Energifondet 2015
Note1Energifondets inntekter i 2015 skriver seg fra påslag på nettariffen, bevilgninger over statsbudsjettet og opptjente renter fra Norges Bank.
Note2 Beløpene representerer utbetalinger i tilknytning til støtteprosjekter vedtatt av Enova SF på vegne av Energifondet, redusert med tilbakebetalt støtte i forbindelse med kansellerte tilsagn. Nye forpliktelser som er inngått av Enova SF på vegne av Energifondet i 2015 beløper seg til kr. 2 970 390 449.
Gjenstående forpliktelse total pr. 31.12.2015 er på kr 6 988 446 797 og fremkommer på følgende måte:
Note3Beløpene representerer utbetalinger i forbindelse med pålagte oppgaver i avtale med OED, som i hovedsak omfatter landsdekkende svartjeneste, markedskommunikasjon, holdningsskapende arbeid, internasjonalt arbeid, analysevirksomhet og kunnskapsgenerering. Note4Utbetalt administrasjonshonorar til Enova SF beløper seg til 147 860 476 inkl mva, som utgjør kr 118 360 476 eks.mva. Reelle administrasjonskostnader for Energifondet i 2015 var på kr 113 804 761. Note5Innbetalte renter skriver seg fra renter opptjent i Energifondets konto i Danske bank/SMN og renter fra nettselskapene i forbindelse med for sent innbetalt nettariff.
Note6Årsresultatet i 2015 viser et overskudd på kr 889 147 473. Overskuddet er forskjellen mellom inn- og utbetalinger på Energifondets konto i Norges Bank i 2015.
Note7Beløpene viser Energifondets kapital pr 31.12.2015, som består av innestående i Norges Bank.
Note 2015 2014
Innestående Norges bank 8 265 154 760 7 346 797 800
Kortsiktig fordring OED - 29 209 487
Sumeiendeler 7 8265154760 7376007287
Energifondets kapital 8 265 154 760 7 376 007 287
Sumfondskapitaloggjeld 7 8265154760 7376007287
Forpliktelse Energifondet 01.01.2015 5 930 689 362
Nye forpliktelser i 2015 2 841 010 712
Forpliktelse overtatt Transnova 2015 129 379 737
Kansellerte forpliktelser 2015 -414 423 298
Sum utbetalt fra fondet 2015 -1 498 209 715
Forpliktelse Energifondet 31.12.2015 6 988 446 797
Innestående Norges Bank 31.12.2015 8 265 154 760
Sum overført til 2016 -1 276 707 963
Sum overført 2016 består av:
Ikke disponerte midler pr 31.12.2015 -1 197 722 048
Renteinntekter Norges Bank 31.12.2015 -78 985 915
Sum overført til 2016 -1 276 707 963
81
VI | ÅRSREGNSKAP

82
83
VI | ÅRSREGNSKAP
Styrets årsberetning 2015Enova SF
Enova SF (Enova) er et statsforetak eid av Olje- og energidepartementet (OED). Enova ble stiftet 22. juni 2001, og er lokalisert i Trondheim.
Enova forvalter flere oppdrag, med Energifondet som det desidert største. Energifondet er et statlig fond hvor de viktigste finansieringskildene er påslag på nettariffen og avkastning fra Fondet for klima, fornybar energi og energiomlegging. Enova sitt oppdrag for forvaltning av Energifondet er regulert gjennom vedtektene, samt gjennom rullerende avtaler med OED. Gjeldende avtale for 2012-2016 reflekterer at Enova både skal være et viktig verktøy for å realisere miljø- og klimavennlig energiomlegging, og fremme utvikling av ny energi- og klimateknologi.
Sentraleforhold2015Enovas visjon er ”Livskraftig forandring”. Ved å gjøre det enklere for næringslivet og privatpersoner å ta livskraftige valg bidrar vi til et fremtidig lavutslippssamfunn. I tillegg til å jobbe for markedsendring og nå resultatmål i gjeldende avtale, har det i 2015 vært lagt vekt på utarbeidelse av strategier og forberedelse av organisasjonen frem mot ny avtaleperiode.
I 2015 kontraktsfestet Enova forpliktelser på vegne av Energifondet på 2,8 milliarder kroner. Det ga et energiresultat på 1,8 TWh. Det er i 2015 satt ny rekord i antall søknader om støtte til energi- og klimaprosjekter. Ved utgangen av året er akkumulert netto energiresultat for perioden 2012-2015 på 6 TWh.
Det viktigste virkemidlet i Enova er finansiering i form av støtte til prosjekter i ulike markeder. Industrien utgjør en vesentlig del av vår aktivitet. Enova har i 2015 støttet en stor bredde av industriprosjekter som forsterker inntrykket av at det grønne skiftet brer om seg. Innenfor yrkesbygg har det også vært rekordmange søknader.
Et tydelig trekk i 2015 er at stadig flere aktører ser mulighetene ved å investere i ny energi- og klimateknologi. Utvikling av teknologi er helt avgjørende for å få frem fornybare og effektive løsninger som muliggjør lavutslippssamfunnet. Ved å utvikle og eksportere slik teknologi kan støtte fra Enova bidra til å redusere globale utslipp.
Fra 1.1.2015 fikk Enova utvidet ansvarsområdet til å omfatte effekti-visering av energibruken og redusere klimagassutslippene fra transportsektoren. Enova opererer nå i markeder som samlet sett står for over 90 % av de norske klimagassutslippene. Gjennom året er det utviklet strategier og lansert en rekke tiltak rettet mot transportsektoren.
Ved starten av året lanserte Enova en ny rettighetsbasert ordning for husholdningene, Enovatilskuddet. Søknadstilgangen har vært betydelig lavere enn målet for året, men det er utbetalt støtte til flere bolig prosjekter i 2015 enn noen gang tidligere. Det tar tid å innarbeide et nytt tilbud i markedet, og det har vært en positiv utvikling gjennom året. Det henvises til Enovas resultat- og aktivitetsrapport for ytterligere informasjon om forvaltningen av Energifondet.
RedegjørelseforårsregnskapetEnova har i all hovedsak driftsinntekter gjennom administrasjonshonorar for forvaltning av Energifondet. Administrasjons honoraret fastsettes av OED.
Samlet driftsinntekt i 2015 var kr. 118 417 436 (eks mva), hvorav kr. 118 360 476 (eks mva) var administrasjonshonorar knyttet til forvaltning av Energifondet.
Resultat for 2015 viser et overskudd på kr 4 605 716. Lavere kostnader enn planlagt for 2015 er i det vesentligste et resultat av lavere lønns- og reisekostnader, samt at vi har valgt å utsette noen utviklingsprosjekter til neste år.
Selskapets totalkapital per 31.12.15 var kr 37 225 934 og egen kapitalen var kr 14 117 360. Dette gir en egenkapitalandel på 38 %. Selskapet hadde ved årsslutt en annen egenkapital på kr 9 117 360. Likviditetsbeholdning utgjorde kr 31 745 223 som ansees som god likviditet.
RisikofaktorerogrisikostyringEnova er eksponert for ulike former for risiko, og styret følger utviklingen innenfor de ulike risikoområdene. Det utarbeides en årlig risikovurdering til OED. Følgende risikokategorier er gjenstand for vurdering: • Risiko i forhold til oppnåelse av hovedmål og innenfor de ulike markedene • Omdømmerisiko • Risiko knyttet til interne forhold (prosesser, nøkkelpersoner og verktøy) • Risiko for mislighold/brudd på lover og regler
Risikovurderinger utføres også løpende som en integrert del i resultatledelse, saksbehandling, oppfølging av tilsagn og intern prosjektgjennomføring. Det er gjennom året jobbet systematisk med risikoreduserende tiltak innenfor alle deler av virksomheten.
ArbeidsmiljøogpersonalEnovas fremste aktivum er den enkelte medarbeiders kompetanse og hvordan vi får nyttiggjort denne gjennom godt samspill. Enova arbeider målrettet for å være en attraktiv arbeidsplass og søker å underbygge den enkeltes styrker og ønsker om å yte sitt beste. Verdiene (tydelig, inspirerende, ansvarlig og markedsnær) legger føringer for hvordan den enkelte forventes å opptre. Selskapet utøver verdibasert ledelse, og jobber med å integrere verdiene i alle deler av arbeidshverdagen, knyttet til beslutninger, væremåte, prioriteringer og medvirkning. Alle ansatte har individuelle utviklingsplaner i tråd med dette.
Den enkeltes kompetanse utvikles gjennom å utfordre på oppgaver, mulighet for å jobbe på tvers i organisasjonen og gjennom eksterne tilbud. Den årlige medarbeiderundersøkelsen viste fortsatt stabilt svært gode resultater. Den bekrefter at medarbeiderne i stor grad identifiserer seg med Enova sine verdier og mål, og at arbeidsmiljøet oppleves som godt.
Selskapet har en innarbeidet policy om at det ikke skal forekomme forskjellsbehandling grunnet kjønn eller etnisk bakgrunn. Enova hadde 77 fast ansatte medarbeidere pr 31.12.15, fordelt på 40 kvinner og 37 menn. Ledere i virksomheten fordelte seg med 31 % kvinner og 69 % menn. Det arbeides med å øke andelen kvinnelige ledere på alle nivå. Gjennomsnittsalderen er 43 år. Utdannings- og erfaringsbakgrunnen til medarbeiderne varierer innen mange fagområder. Enova mener det er helt
Årsregnskap Enova SF

84
avgjørende med likestilling og mangfold på arbeidsplassen.
Det samlede sykefraværet for 2015 var på 3,86 %. Herav utgjorde sykdom med sykemelding 2,31 %, egenmeldt sykefravær 1,11 % og barns sykdom 0,44 %. Det er ikke rapportert om arbeidsuhell eller ulykker i løpet av 2015. Enova er en IA bedrift og jobber systematisk for å tilrettelegge arbeidssituasjonen for sykemeldte.
Arbeidsmiljøutvalget i Enova har avholdt 4 møter i 2015. Det er behandlet 10 saker i tillegg til lovpålagte rapporteringer. Referat fra møtene er tilgjengeliggjort for de ansatte.
SamfunnsansvarEnova skaper livskraftig forandring gjennom støtte slik at flere private og offentlige aktører kan ta sitt samfunnsansvar ved bærekraftige miljø- og klimavalg.
Enova fremmer også økt kunnskap i samfunnet om mulighetene for å ta i bruk energieffektive og miljø- og klimavennlige løsninger. Enova jobber med holdningsskapende arbeid overfor næringsliv og privat personer, og iverksetter tiltak for å påvirke neste generasjons beslutninger innen energi og klima. De to viktigste tiltakene er Nasjonal innovasjonscamp i samarbeid med Ungt Entreprenørskap for elever i videregående skole, og Enovas Energiutfordring, et læringsverktøy for mellomtrinnet i grunnskolen.
Enovas ledelse arbeider målrettet for at etiske retningslinjer sammen med verdiene, fungerer som en rettesnor for å opptre etisk forsvarlig. Dette står sentralt i organisasjons- og lederutviklingen. Enovas innkjøpsprosesser stiller krav om etisk handel og å unngå sosial dumping. Enova tilrettelegger også for praksisplasser for personer med spesielle oppfølgingsbehov.
Enova forsøker å minimere bedriftens påvirkning på det ytre miljø. Enova har kontorlokaler med lavt energiforbruk og fornybare energikilder. Vi har i 2015 jobbet for BREEAM-sertifisering av våre kontorlokaler, og samarbeider med huseier om tiltak innen energibruk, vannforbruk og avfallssortering. Vi oppfordrer ansatte til å velge miljøvennlig transport til og fra jobb.
Ingen varslingssaker eller andre hendelser knyttet til brudd på god forretningsskikk er rapportert i 2015. Enova har en aktiv tilnærming til at det vi gjør skal være transparent og åpent. Etisk forretningsførsel er et grunnleggende prinsipp for oss.
Enova vil i 2016 fortsette arbeidet med samfunnsansvar, etikk og verdiutøvelse, integrert i mål, strategier, styringen av virksomheten, og i leder- og organisasjonsutviklingen.
RetningslinjerforfastsettelseavlønnogannengodtgjørelsetilledendeansatteFor å tiltrekke og beholde dyktige og kompetente medarbeidere er Enova
opptatt av å tilby konkurransedyktige vilkår, uten å være lønnsledende. Dette gjelder for alle ansatte uavhengig av organisatorisk nivå.
Lønn og annen godtgjørelse til ledende ansatte i Enova SF består av tre deler: • Ordinær lønn • Annen godtgjørelse • Kjøregodtgjørelse • Forsikringer (gruppeliv, reise og ulykke) • Elektronisk kommunikasjon (telefon og bredbånd) • En fri avis til hjemmeadresse • Pensjon
Ledende ansatte har samme vilkår for godtgjørelser og pensjon som øvrige ansatte i selskapet. Unntaket er fast kjøregodtgjørelse til admini strerende direktør.
Enova SF har ikke avtaler om etterlønn, bonuser eller aksjer og opsjoner.
Styret erklærer at den lederlønnspolitikk og de retningslinjer for lederlønns-fastsettelse som foretaksmøtet 19.06.15 sluttet seg til, har blitt etterlevd i 2015 innenfor de rammer retningslinjene gir.
FramtidsutsikterFondet for klima, fornybar energi og energiomlegging økes frem til 2016 til total 62,75 milliarder, som gjennom økt avkastning utvider den finansielle rammen for Energifondet. Gjennom reforhandlet avtale gjeldende fra 1.1.2015 fikk Enova et utvidet oppdrag og en bredere plattform for virksomheten. Avtalen i klimatoppmøtet i Paris 12. desember 2015 gir økt oppmerksomhet om klimautfordringene. Klimagassutslipp kommer som et resultat av aktivitet som samfunnet er avhengig av. All verdiskaping er avhengig av energi, og energi representerer i seg selv et betydelig potensial for verdiskapning. I ny avtaleperiode for 2017-2020 forventes Enova fortsatt å være et sentralt virkemiddel i framtidens energisystem og lavutslippssamfunn.
FortsattdriftÅrsoppgjøret er avlagt under forutsetning om fortsatt drift. Til grunn for antagelsen ligger et solid og langsiktig økonomisk grunnlag gjennom vedtektene for Energifondet og stiftelsesdokumentet for selskapet, samt at selskapet har en god likviditet og soliditet.
ÅrsresultatogdisponeringerEnova SF hadde i 2015 et årsresultat på kr 4 605 716. Styret foreslår følgende disponering av årsoverskuddet i Enova SF:
Overføres annen egenkapital kr 4 605 716
Styret takker de ansatte for god innsats i 2015.
Trondheim18.februar2016
Tore Holm
Styrets leder
Hege G. Wiggen
Styremedlem
Elizabeth Baumann Ofstad
Styrets nestleder
Dina Elverum Aune
Styremedlem
Tor Brekke
Styremedlem
Eirik Gaard Kristiansen
Styremedlem
Einar Håndlykken
Styremedlem
Konrad Pütz
Styremedlem
Nils Kristian Nakstad
Administrerende direktør
Olav Hasaas
Styremedlem
Katharina Thøgersen Bramslev
Styremedlem

85
VI | ÅRSREGNSKAP
Resultatregnskap
Note 2015 2014
DRIFTSINNTEKTEROGDRIFTSKOSTNADER
Driftsinntekter
Administrasjonshonorar 1,2 118 367 436 102 851 441
Gevinst ved salg av driftsmidler 50 000 -
Sumdriftsinntekter 118417436 102851441
Driftskostnader
Lønnskostnad 4,7 79 898 098 68 331 853
Avskrivning på varige driftsmidler 3 561 999 71 223
Annen driftskostnad 33 840 795 35 606 658
Sumdriftskostnader 114300892 104009733
DRIFTSRESULTAT 4116544 -1158292
FINANSINNTEKTEROGFINANSKOSTNADER
Finansinntekter
Annen renteinntekt 532 941 580 659
Annen finansinntekt - 1 546
Sumfinansinntekter 532941 582205
Finanskostnader
Annen rentekostnad 6 950 7 051
Annen finanskostnad 36 819 5 348
Sumfinanskostnader 43769 12400
NETTOFINANSPOSTER 489172 569805
ORDINÆRTRESULTATFØRSKATTEKOSTNAD 4605716 -588487
Skattekostnad på ordinært resultat - -
ORDINÆRTRESULTAT 4605716 -588487
ÅRSRESULTAT 4605716 -588487
OVERFØRINGEROGDISPONERINGER
Overføringer annen egenkapital 6 4 605 716 -588 487
SUMOVERFØRINGEROGDISPONERINGER 4605716 -588487
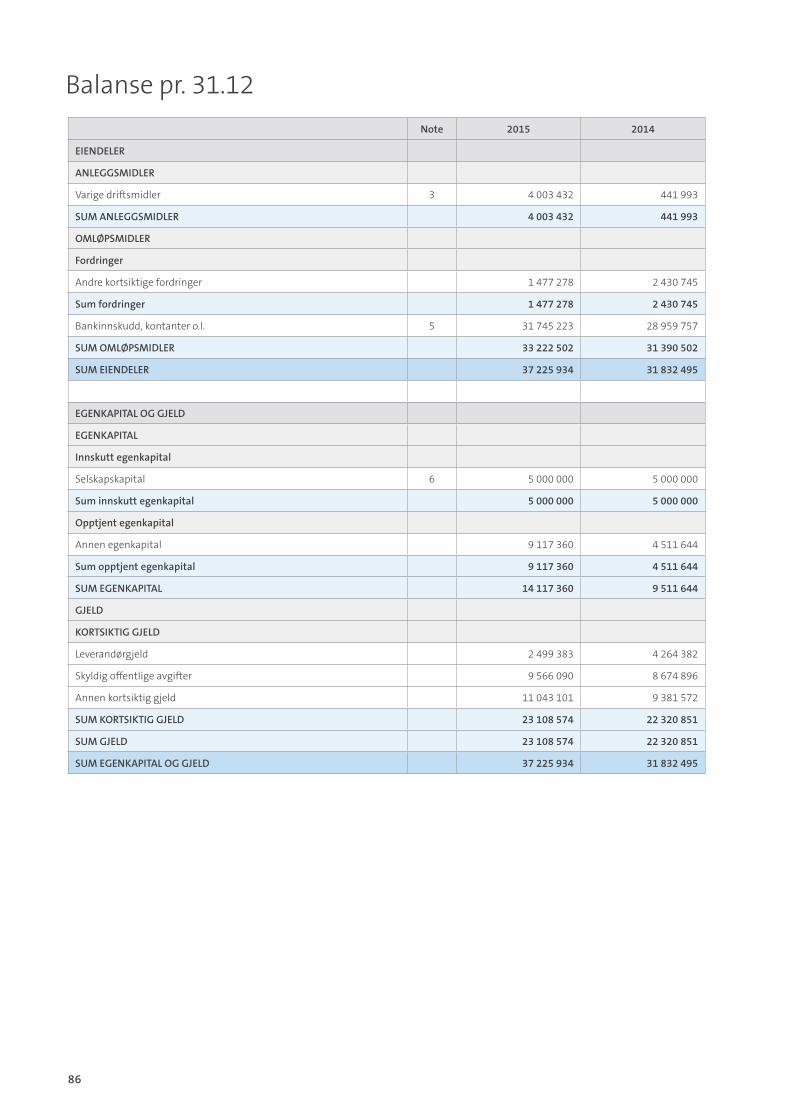
86
Balanse pr. 31.12
Note 2015 2014
EIENDELER
ANLEGGSMIDLER
Varige driftsmidler 3 4 003 432 441 993
SUMANLEGGSMIDLER 4003432 441993
OMLØPSMIDLER
Fordringer
Andre kortsiktige fordringer 1 477 278 2 430 745
Sumfordringer 1477278 2430745
Bankinnskudd, kontanter o.l. 5 31 745 223 28 959 757
SUMOMLØPSMIDLER 33222502 31390502
SUMEIENDELER 37225934 31832495
EGENKAPITALOGGJELD
EGENKAPITAL
Innskuttegenkapital
Selskapskapital 6 5 000 000 5 000 000
Suminnskuttegenkapital 5000000 5000000
Opptjentegenkapital
Annen egenkapital 9 117 360 4 511 644
Sumopptjentegenkapital 9117360 4511644
SUMEGENKAPITAL 14117360 9511644
GJELD
KORTSIKTIGGJELD
Leverandørgjeld 2 499 383 4 264 382
Skyldig offentlige avgifter 9 566 090 8 674 896
Annen kortsiktig gjeld 11 043 101 9 381 572
SUMKORTSIKTIGGJELD 23108574 22320851
SUMGJELD 23108574 22320851
SUMEGENKAPITALOGGJELD 37225934 31832495
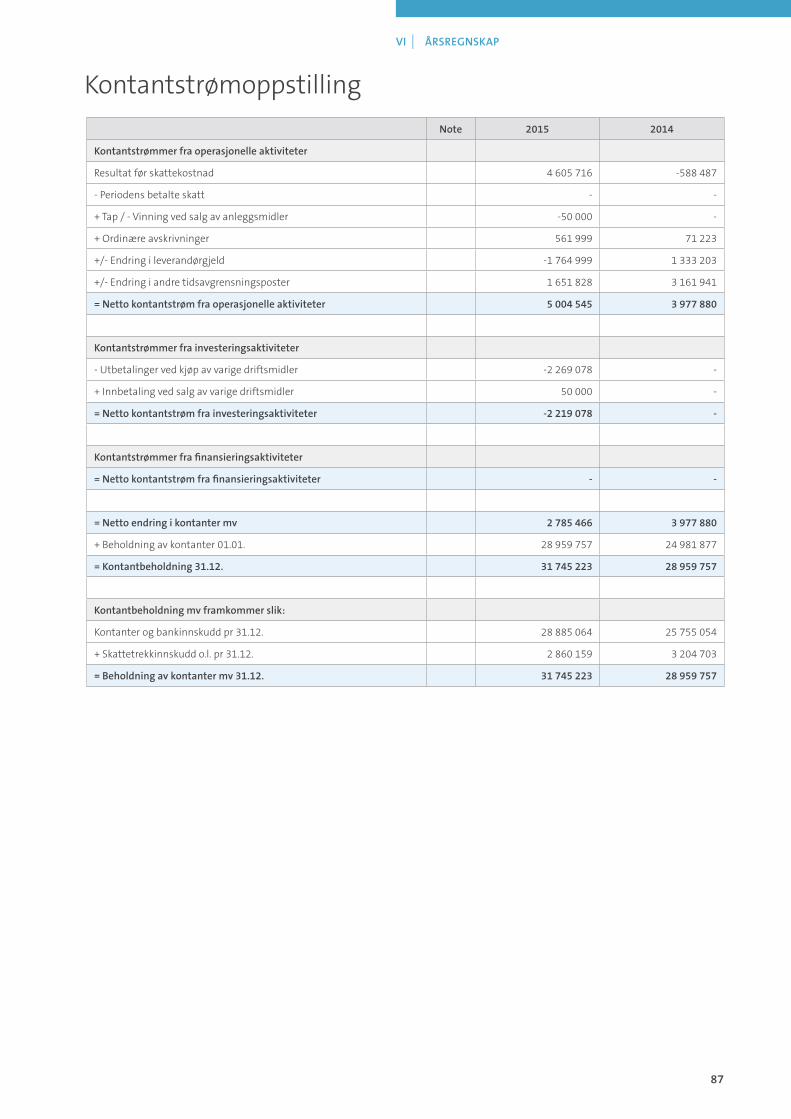
87
VI | ÅRSREGNSKAP
Kontantstrømoppstilling
Note 2015 2014
Kontantstrømmerfraoperasjonelleaktiviteter
Resultat før skattekostnad 4 605 716 -588 487
- Periodens betalte skatt - -
+ Tap / - Vinning ved salg av anleggsmidler -50 000 -
+ Ordinære avskrivninger 561 999 71 223
+/- Endring i leverandørgjeld -1 764 999 1 333 203
+/- Endring i andre tidsavgrensningsposter 1 651 828 3 161 941
=Nettokontantstrømfraoperasjonelleaktiviteter 5004545 3977880
Kontantstrømmerfrainvesteringsaktiviteter
- Utbetalinger ved kjøp av varige driftsmidler -2 269 078 -
+ Innbetaling ved salg av varige driftsmidler 50 000 -
=Nettokontantstrømfrainvesteringsaktiviteter -2219078 -
Kontantstrømmerfrafinansieringsaktiviteter
=Nettokontantstrømfrafinansieringsaktiviteter - -
=Nettoendringikontantermv 2785466 3977880
+ Beholdning av kontanter 01.01. 28 959 757 24 981 877
=Kontantbeholdning31.12. 31745223 28959757
Kontantbeholdningmvframkommerslik:
Kontanter og bankinnskudd pr 31.12. 28 885 064 25 755 054
+ Skattetrekkinnskudd o.l. pr 31.12. 2 860 159 3 204 703
=Beholdningavkontantermv31.12. 31745223 28959757
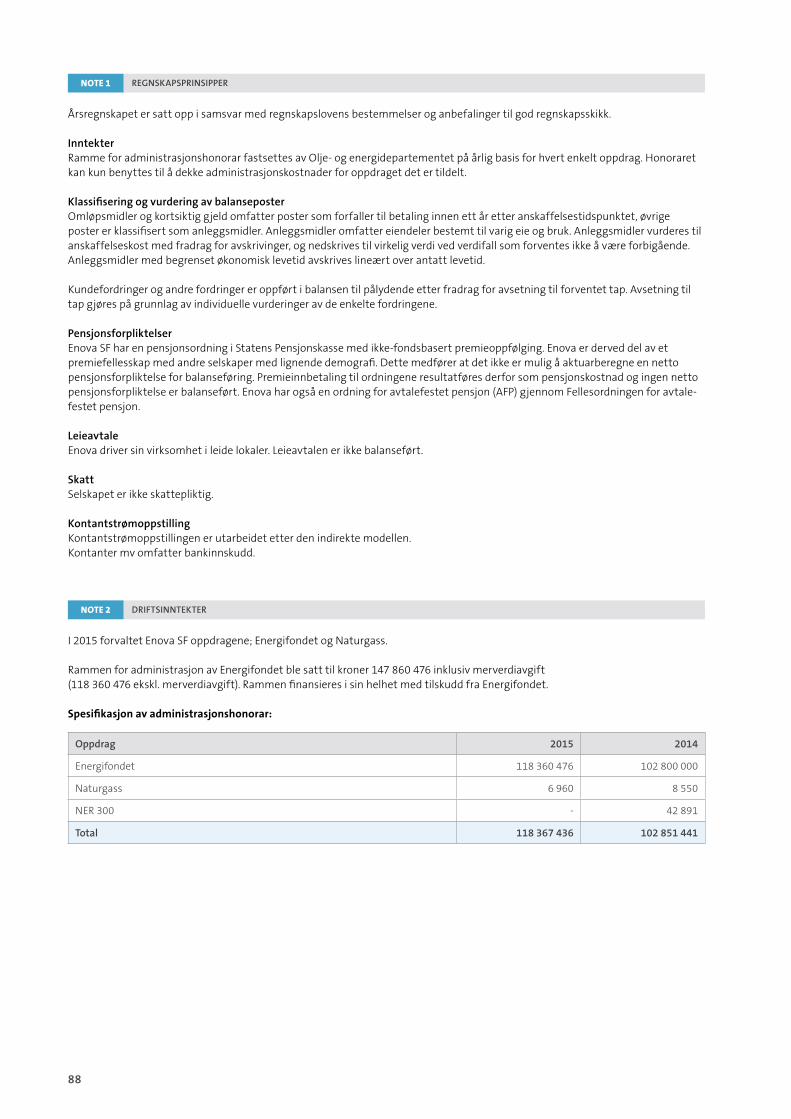
88
Årsregnskapet er satt opp i samsvar med regnskapslovens bestemmelser og anbefalinger til god regnskapsskikk.
InntekterRamme for administrasjonshonorar fastsettes av Olje- og energidepartementet på årlig basis for hvert enkelt oppdrag. Honoraret kan kun benyttes til å dekke administrasjonskostnader for oppdraget det er tildelt.
KlassifiseringogvurderingavbalanseposterOmløpsmidler og kortsiktig gjeld omfatter poster som forfaller til betaling innen ett år etter anskaffelsestidspunktet, øvrige poster er klassifisert som anleggsmidler. Anleggsmidler omfatter eiendeler bestemt til varig eie og bruk. Anleggsmidler vurderes til anskaffelseskost med fradrag for avskrivinger, og nedskrives til virkelig verdi ved verdifall som forventes ikke å være forbigående. Anleggsmidler med begrenset økonomisk levetid avskrives lineært over antatt levetid.
Kundefordringer og andre fordringer er oppført i balansen til pålydende etter fradrag for avsetning til forventet tap. Avsetning til tap gjøres på grunnlag av individuelle vurderinger av de enkelte fordringene.
PensjonsforpliktelserEnova SF har en pensjonsordning i Statens Pensjonskasse med ikke-fondsbasert premieoppfølging. Enova er derved del av et premiefellesskap med andre selskaper med lignende demografi. Dette medfører at det ikke er mulig å aktuarberegne en netto pensjonsforpliktelse for balanseføring. Premieinnbetaling til ordningene resultatføres derfor som pensjonskostnad og ingen netto pensjonsforpliktelse er balanseført. Enova har også en ordning for avtalefestet pensjon (AFP) gjennom Fellesordningen for avtale-festet pensjon.
LeieavtaleEnova driver sin virksomhet i leide lokaler. Leieavtalen er ikke balanseført.
SkattSelskapet er ikke skattepliktig.
KontantstrømoppstillingKontantstrømoppstillingen er utarbeidet etter den indirekte modellen.Kontanter mv omfatter bankinnskudd.
NOTE 1 REGNSKAPSPRINSIPPER
Spesifikasjon av administrasjonshonorar:
Oppdrag 2015 2014
Energifondet 118 360 476 102 800 000
Naturgass 6 960 8 550
NER 300 - 42 891
Total 118367436 102851441
I 2015 forvaltet Enova SF oppdragene; Energifondet og Naturgass.
Rammen for administrasjon av Energifondet ble satt til kroner 147 860 476 inklusiv merverdiavgift(118 360 476 ekskl. merverdiavgift). Rammen finansieres i sin helhet med tilskudd fra Energifondet.
NOTE 2 DRIFTSINNTEKTER
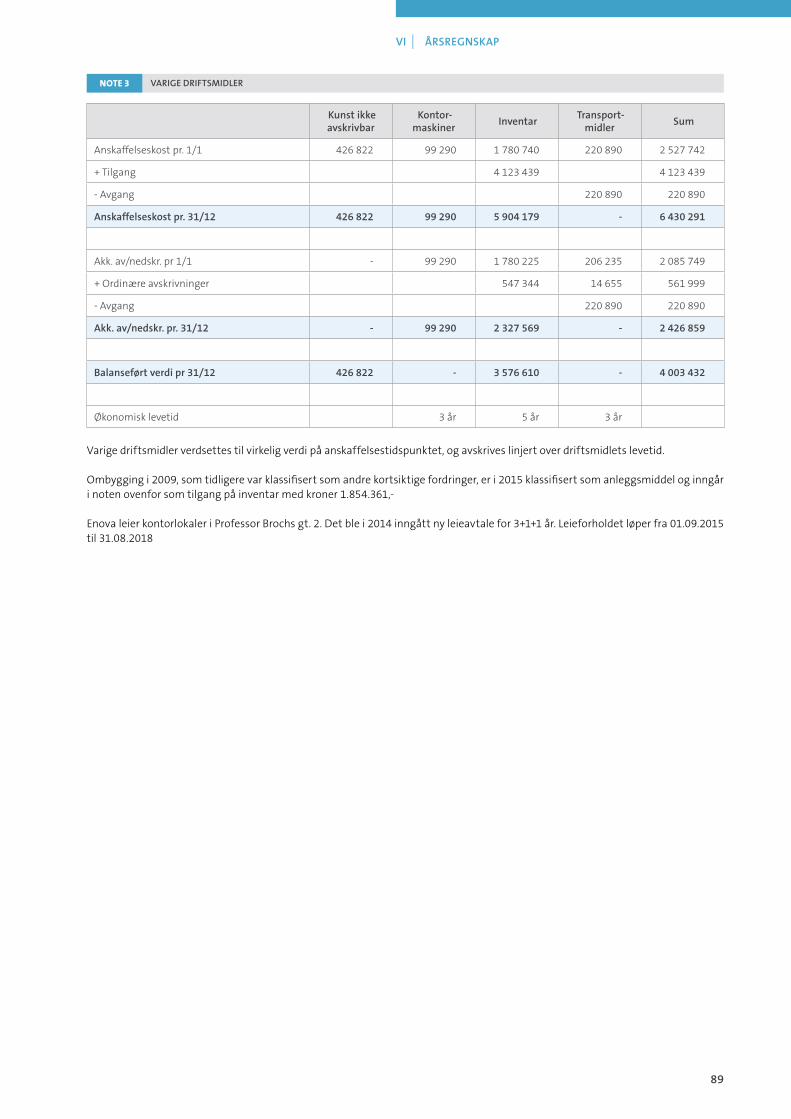
89
VI | ÅRSREGNSKAP
Varige driftsmidler verdsettes til virkelig verdi på anskaffelsestidspunktet, og avskrives linjert over driftsmidlets levetid.
Ombygging i 2009, som tidligere var klassifisert som andre kortsiktige fordringer, er i 2015 klassifisert som anleggsmiddel og inngår i noten ovenfor som tilgang på inventar med kroner 1.854.361,-
Enova leier kontorlokaler i Professor Brochs gt. 2. Det ble i 2014 inngått ny leieavtale for 3+1+1 år. Leieforholdet løper fra 01.09.2015 til 31.08.2018
NOTE 3 VARIGEDRIFTSMIDLER
Kunstikkeavskrivbar
Kontor-maskiner
InventarTransport-
midlerSum
Anskaffelseskost pr. 1/1 426 822 99 290 1 780 740 220 890 2 527 742
+ Tilgang 4 123 439 4 123 439
- Avgang 220 890 220 890
Anskaffelseskostpr.31/12 426822 99290 5904179 - 6430291
Akk. av/nedskr. pr 1/1 - 99 290 1 780 225 206 235 2 085 749
+ Ordinære avskrivninger 547 344 14 655 561 999
- Avgang 220 890 220 890
Akk.av/nedskr.pr.31/12 - 99290 2327569 - 2426859
Balanseførtverdipr31/12 426822 - 3576610 - 4003432
Økonomisk levetid 3 år 5 år 3 år

90
Riksrevisjonen har besluttet å avvikle revisjonen av fond som forvaltes av selskaper. Revisjon av Energifondet er fra 2015 overført til Enova SF valgte revisor.
Frem til 31.12.2014 ble utbetaling av styrehonorar delt i forskudd og avregning på ulike år. Det er endret prinsipp i 2015 hvor selskapet går bort fra forskuddsbetaling. Utbetaling i 2015 er styrehonorar for 2015 fratrukket forskudd utbetalt i 2014.
GODTGJØRELSETILSTYRET-UTBETALTI2015
GODTGJØRELSETILREVISOR
2015 2014
Revisjonshonorar Enova SF 60 000 84 251
Revisjonshonorar Energifondet 60 000
Avtalte kontrollhandlinger forvaltningsoppdrag 5 000 130 898
Andre tjenester 77 500 44 661
Sum 202500 259810
Navn Rolle Styrehonorar
Tore Holm Styrets leder 225 000
Elizabeth Baumann Ofstad Styrets nestleder 121 000
Eirik Gaard Kristiansen Styremedlem 108 500
Olav Hasaas Styremedlem 108 500
Dina Elverum Aune Styremedlem 108 500
Einar Håndlykken Styremedlem 108 500
Katharina Thøgersen Bramslev Styremedlem 108 500
Håvard Solem Styremedlem 108 500
Marit Sandbakk Styremedlem 108 500
Selskapet har sysselsatt i gjennomsnitt 75,9 årsverk i regnskapsåret.
YTELSERTILLEDENDEPERSONER
* Sluttet 30.09.15 Det eksisterer ingen avtaler om etterlønn.
NOTE 4 LØNNSKOSTNADER,ANTALLANSATTEOGGODTGJØRELSETILREVISOR
Spesifikasjonavlønnskostnader 2015 2014
Lønn 60 579 594 51 789 465
Arbeidsgiveravgift 9 976 355 8 302 195
Pensjonskostnader 7 555 084 6 415 891
Andre lønnsrelaterte ytelser 1 787 065 1 824 302
Total 79898098 68331853
Navn Stilling LønnAnnen
godtgjørelsePensjons-kostnader
Samletgodtgjørelse
Nils Kristian Nakstad Administrerende direktør 1 684 694 105 680 126 985 1 917 359
Øyvind Leistad Direktør for programutvikling og drift 1 301 551 6 786 126 985 1 435 322
Audhild Kvam Markedsdirektør 1 297 682 6 708 126 985 1 431 375
Geir Nysetvold* Direktør for strategi og kommunikasjon 1 118 372 10 351 92 959 1 221 682
Gunn Jorun Widding Direktør for virksomhetsstyring 1 288 408 6 786 126 985 1 422 179

91
VI | ÅRSREGNSKAP
Enova SF har innskutt egenkapital på kr. 5 000 000. Enova SF eies av den norske stat ved Olje og Energidepartementet
Aksjekapital/selskapskapital
Annenegenkapital
Sumegenkapital
Pr 1.1. 5 000 000 4 511 644 9 511 644
Overført årets resultat 4 605 716
Pr31.12. 5000000 9117360 14117360
Enova har pensjonsordning som tilfredsstiller lov om obligatorisk tjenestepensjon.Pensjonsordningen omfatter i alt 81 personer. Den er basert på at pensjonsalderen i foretaket er 67 år og at samlet kompensa-sjonsgrad ikke skal overstige 66 % av lønnen, begrenset opp til 12G. Ordningene gir rett til definerte fremtidige ytelser, avhengig av antall opptjeningsår, lønnsnivå ved oppnådd pensjonsalder og størrelsen på ytelsene fra folketrygden. Pensjonsordningen ivaretas av foretakets medlemskap i Statens Pensjonskasse.
I tillegg har Enova en AFP-ordning. Dette er en tilleggspensjonsordning som gir ansatte som fyller kravene i ordningen rett til å gå av med AFP fra fylte 62 år. Ordningen ivaretas av Fellesordningen for avtalefestet pensjon.
NOTE 5 BANKINNSKUDD,KONTANTERO.L.
NOTE 6 EGENKAPITAL
NOTE 7 PENSJON
2015 2014
Sum bankinnskudd 31.12. 31 745 223 28 959 757
Herav skattetrekkinnskudd 31.12. 2 860 159 3 204 703

92
93
VI | ÅRSREGNSKAP

94

95
Appendices
94 Appendices
96 Appendix A: Projects within new energy and climate technology 2012-2015
120 Appendix B: Project list 2015 (not translated to english) 139 Appendix C:
139 – Assignments outside the Energy Fund
139 – Publications and consultation statements 140 Definitions and explanation of terminology
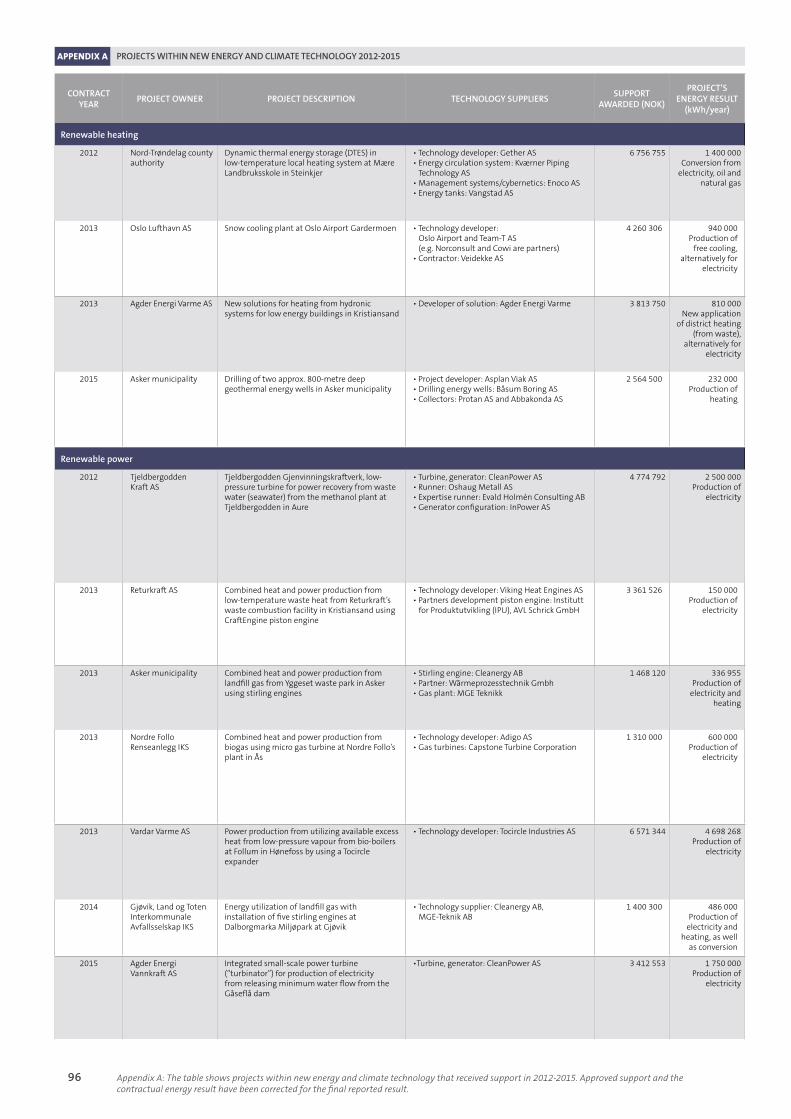
Appendix A: The table shows projects within new energy and climate technology that received support in 2012-2015. Approved support and the contractual energy result have been corrected for the final reported result.
APPENDIX A PROJECTS WITHIN NEW ENERGY AND CLIMATE TECHNOLOGY 2012-2015
96
CONTRACTYEAR
PROJECTOWNER PROJECTDESCRIPTION TECHNOLOGYSUPPLIERSSUPPORT
AWARDED(NOK)
PROJECT’SENERGYRESULT
(kWh/year)
Renewableheating
2012 Nord-Trøndelag county authority
Dynamic thermal energy storage (DTES) in low-temperature local heating system at Mære Landbruksskole in Steinkjer
• Technology developer: Gether AS• Energy circulation system: Kværner Piping Technology AS• Management systems/cybernetics: Enoco AS• Energy tanks: Vangstad AS
6 756 755 1 400 000Conversion from
electricity, oil and natural gas
2013 Oslo Lufthavn AS Snow cooling plant at Oslo Airport Gardermoen • Technology developer: Oslo Airport and Team-T AS (e.g. Norconsult and Cowi are partners)• Contractor: Veidekke AS
4 260 306 940 000Production of
free cooling, alternatively for
electricity
2013 Agder Energi Varme AS New solutions for heating from hydronic systems for low energy buildings in Kristiansand
• Developer of solution: Agder Energi Varme 3 813 750 810 000New application
of district heating (from waste),
alternatively for electricity
2015 Asker municipality Drilling of two approx. 800-metre deep geothermal energy wells in Asker municipality
• Project developer: Asplan Viak AS• Drilling energy wells: Båsum Boring AS• Collectors: Protan AS and Abbakonda AS
2 564 500 232 000Production of
heating
Renewablepower
2012 Tjeldbergodden Kraft AS
Tjeldbergodden Gjenvinningskraftverk, low-pressure turbine for power recovery from waste water (seawater) from the methanol plant at Tjeldbergodden in Aure
• Turbine, generator: CleanPower AS• Runner: Oshaug Metall AS• Expertise runner: Evald Holmén Consulting AB• Generator configuration: InPower AS
4 774 792 2 500 000Production of
electricity
2013 Returkraft AS Combined heat and power production from low-temperature waste heat from Returkraft’s waste combustion facility in Kristiansand using CraftEngine piston engine
• Technology developer: Viking Heat Engines AS• Partners development piston engine: Institutt for Produktutvikling (IPU), AVL Schrick GmbH
3 361 526 150 000 Production of
electricity
2013 Asker municipality Combined heat and power production from landfill gas from Yggeset waste park in Asker using stirling engines
• Stirling engine: Cleanergy AB• Partner: Wãrmeprozesstechnik Gmbh• Gas plant: MGE Teknikk
1 468 120 336 955 Production of
electricity and heating
2013 Nordre Follo Renseanlegg IKS
Combined heat and power production from biogas using micro gas turbine at Nordre Follo’s plant in Ås
• Technology developer: Adigo AS • Gas turbines: Capstone Turbine Corporation
1 310 000 600 000 Production of
electricity
2013 Vardar Varme AS Power production from utilizing available excess heat from low-pressure vapour from bio-boilers at Follum in Hønefoss by using a Tocircle expander
• Technology developer: Tocircle Industries AS 6 571 344 4 698 268 Production of
electricity
2014 Gjøvik, Land og Toten Interkommunale Avfallsselskap IKS
Energy utilization of landfill gas with installation of five stirling engines at Dalborgmarka Miljøpark at Gjøvik
• Technology supplier: Cleanergy AB, MGE-Teknik AB
1 400 300 486 000 Production of
electricity and heating, as well
as conversion
2015 Agder Energi Vannkraft AS
Integrated small-scale power turbine (“turbinator”) for production of electricity from releasing minimum water flow from the Gåseflå dam
•Turbine, generator: CleanPower AS 3 412 553 1 750 000 Production of
electricity
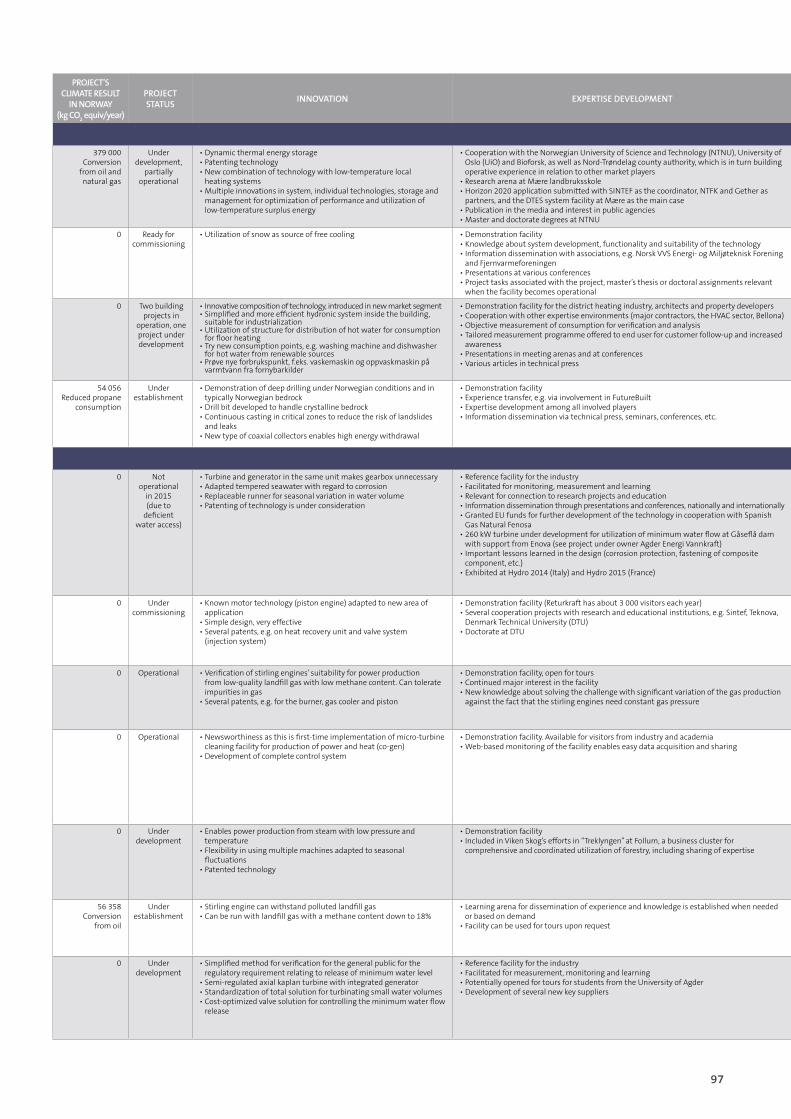
97
PROJECT’SCLIMATERESULT
INNORWAY(kgCO
2equiv/year)
PROJECTSTATUS
INNOVATION EXPERTISEDEVELOPMENT REALIZEDDISSEMINATIONOFTECHNOLOGY FURTHERDEVELOPMENTANDDISSEMINATION
379 000 Conversion
from oil and natural gas
Under development,
partially operational
• Dynamic thermal energy storage• Patenting technology• New combination of technology with low-temperature local heating systems• Multiple innovations in system, individual technologies, storage and management for optimization of performance and utilization of low-temperature surplus energy
• Cooperation with the Norwegian University of Science and Technology (NTNU), University of Oslo (UiO) and Bioforsk, as well as Nord-Trøndelag county authority, which is in turn building operative experience in relation to other market players• Research arena at Mære landbruksskole• Horizon 2020 application submitted with SINTEF as the coordinator, NTFK and Gether as partners, and the DTES system facility at Mære as the main case• Publication in the media and interest in public agencies• Master and doctorate degrees at NTNU
• First implementation of full-scale facility in Norway and globally• Development cooperation with the University of Oslo with regard to further cooperation at the Natural History Museum in Tøyen. Two minor special contracts at the UiO Natural History Museum related to management system
• Particularly suited for buildings with glass/atriums, historical buildings, energy efficiency for buildings on small lots, cooling in supermarkets• Technology supplier estimates potential spread to several thousand plants in Norway.• National potential for reduced greenhouse gas emissions• International potential for spread that can result in conversion to renewable energy and reduced greenhouse gas emissions
0 Ready for commissioning
• Utilization of snow as source of free cooling • Demonstration facility• Knowledge about system development, functionality and suitability of the technology• Information dissemination with associations, e.g. Norsk VVS Energi- og Miljøteknisk Forening and Fjernvarmeforeningen• Presentations at various conferences• Project tasks associated with the project, master’s thesis or doctoral assignments relevant when the facility becomes operational
• First snow-cooling plant in Norway• Implemented in one hospital in Sweden
• Suitable for meeting cooling needs in buildings and facilities in areas with snow and frost in the winter and large areas available for snow harvesting and storage.• International potential for dissemination in areas with similar climatic conditions, which can yield greater use of renewable energy for cooling and reduced greenhouse gas emissions.
0 Two building projects in
operation, one project under development
• Innovative composition of technology, introduced in new market segment• Simplified and more efficient hydronic system inside the building, suitable for industrialization• Utilization of structure for distribution of hot water for consumption for floor heating• Try new consumption points, e.g. washing machine and dishwasher for hot water from renewable sources• Prøve nye forbrukspunkt, f.eks. vaskemaskin og oppvaskmaskin på varmtvann fra fornybarkilder
• Demonstration facility for the district heating industry, architects and property developers• Cooperation with other expertise environments (major contractors, the HVAC sector, Bellona)• Objective measurement of consumption for verification and analysis• Tailored measurement programme offered to end user for customer follow-up and increased awareness• Presentations in meeting arenas and at conferences• Various articles in technical press
• Parallel development courses underway through Enova’s competition for simplified heating solutions.• A building with only a tap water structure, where floor heating is taken from the tap water, planned construction start-up: Spring 2015 • A new building with 70 apartments under construction with new solution• Industrialized production at LK system’s plant in Sweden
• Suitable in buildings with very low energy consumption, cf. TEK15 • Industrialization makes the solution suitable for water-borne facilities throughout Norway.• Relevant for major contractors, associations and the industry• Several equipment producers want to participate, planning multiple prototypes of integrated cabinet solutions in the near future• In negotiations with developer to test and further develop the solution with hot tap water as the energy carrier
54 056Reduced propane
consumption
Under establishment
• Demonstration of deep drilling under Norwegian conditions and in typically Norwegian bedrock• Drill bit developed to handle crystalline bedrock• Continuous casting in critical zones to reduce the risk of landslides and leaks• New type of coaxial collectors enables high energy withdrawal
• Demonstration facility• Experience transfer, e.g. via involvement in FutureBuilt• Expertise development among all involved players• Information dissemination via technical press, seminars, conferences, etc.
• First full-scale implementation of the technology in Norway• There are energy wells of a corresponding depth abroad, but with different subsurface conditions.
• Suitable in city neighbourhoods where area usage and energy price are decisive• Asker municipality is considering energy wells for a specific development area (Føyka/Elvely)• Technology supplier estimates that the spread potential is for geothermal drilling projects in city neighbourhoods, where multiple shallow wells can be replaced with one deeper well. The potential in Norway is expected to be about 1000 wells a year.• National potential for spread that could contribute to increased renewable energy production and reduced greenhouse gas emissions
0 Not operational
in 2015 (due to
deficient water access)
• Turbine and generator in the same unit makes gearbox unnecessary• Adapted tempered seawater with regard to corrosion• Replaceable runner for seasonal variation in water volume• Patenting of technology is under consideration
• Reference facility for the industry• Facilitated for monitoring, measurement and learning• Relevant for connection to research projects and education• Information dissemination through presentations and conferences, nationally and internationally• Granted EU funds for further development of the technology in cooperation with Spanish Gas Natural Fenosa• 260 kW turbine under development for utilization of minimum water flow at Gåseflå dam with support from Enova (see project under owner Agder Energi Vannkraft)• Important lessons learned in the design (corrosion protection, fastening of composite component, etc.)• Exhibited at Hydro 2014 (Italy) and Hydro 2015 (France)
• Pilot in the Nea watercourse is operational every summer (Statkraft)• Sales agent agreement with company in Puerto Rico (covers the Caribbean, Central America, and northern South America)• Sales agreement with company in Turkey (covers Turkey)
• Transferable to utilization of mandatory minimum release in watercourse. Increasing focus in Europe with implementation of the EU’s Water Directive• Transferable to water canals and dams connected to irrigation/water supply• Technology supplier estimates spread potential at around 20 industry plants in Norway, with comparable water consumption• Approved two SkatteFunn (Tax Deduction Scheme) applications for further development of the technology• Gas Natural Fenosa indicates a potential for 100 additional facilities following successful pilot installation in Spain• International potential for spread that can yield improved utilization of waste water for power production and reduced greenhouse gas emissions
0 Under commissioning
• Known motor technology (piston engine) adapted to new area of application• Simple design, very effective• Several patents, e.g. on heat recovery unit and valve system (injection system)
• Demonstration facility (Returkraft has about 3 000 visitors each year)• Several cooperation projects with research and educational institutions, e.g. Sintef, Teknova, Denmark Technical University (DTU)• Doctorate at DTU
• First implementation globally• Developer signed agreement with BE Aerospace, the first test machines have been delivered• Two test machines delivered to Caterpillar in the US/Germany (exhaust heat)• One test machine delivered to Mitsui in Japan (geothermal)
• Suitable for other energy sources: solar thermal, biomass and geothermal energy• Technology supplier estimates own spread potential to 2000 units globally by 2016, increasing to 4000 units total by 2017• International potential for spread that can yield increased production of electricity from renewable energy and energy recovery, and reduced greenhouse gas emissions
0 Operational • Verification of stirling engines’ suitability for power production from low-quality landfill gas with low methane content. Can tolerate impurities in gas• Several patents, e.g. for the burner, gas cooler and piston
• Demonstration facility, open for tours• Continued major interest in the facility• New knowledge about solving the challenge with significant variation of the gas production against the fact that the stirling engines need constant gas pressure
• Norway: Two orders for corresponding facilities• Internationally: There are currently facilities in the UK, Germany, Poland, Slovenia
• Suitable for landfill facilities and methane gas plants. In Norway: 62 landfills in operation and 85 methane gas facilities• International potential for dissemination that can yield increased production of electricity and reduced greenhouse gas emissions
0 Operational • Newsworthiness as this is first-time implementation of micro-turbine cleaning facility for production of power and heat (co-gen)• Development of complete control system
• Demonstration facility. Available for visitors from industry and academia• Web-based monitoring of the facility enables easy data acquisition and sharing
• First implementation in Norway• Implemented in several facilities internationally, e.g. in the US and Europe
• Suitable for biogas plants, landfill facilities and facilities for handling food and other waste. • In Norway there are 20 biogas facilities which treat drain mud from cleaning plants in Norway. 62 waste disposal sites in operation and 85 methane gas plants. • Primarily relevant for medium-sized facilities.
• Suitable for large greenhouse facilities which need power, heating and CO2.
• Project owner is experiencing major interest from the market• International potential for spread that can yield increased production of electricity from renewable energy and energy recovery, and reduced greenhouse gas emissions
0 Under development
• Enables power production from steam with low pressure and temperature• Flexibility in using multiple machines adapted to seasonal fluctuations• Patented technology
• Demonstration facility• Included in Viken Skog’s efforts in “Treklyngen” at Follum, a business cluster for comprehensive and coordinated utilization of forestry, including sharing of expertise
• The project is a second-time implementation of a full-scale facility• Turbine previously implemented at Senja Avfall IK
• The project creates a platform for further dissemination of steam expanders in the Nordic countries, and then internationally.• Repetition of expander production and run-time enables roll-out of other energy solutions with similar technology, e.g. ORC systems• Technology supplier estimates spread potential at about 20 district heating plants in Norway, and 90 plants in the rest of the Nordic countries• International potential for dissemination that can yield increased production of electricity from waste heat, and reduced greenhouse gas emissions.
56 358Conversion
from oil
Under establishment
• Stirling engine can withstand polluted landfill gas• Can be run with landfill gas with a methane content down to 18%
• Learning arena for dissemination of experience and knowledge is established when needed or based on demand• Facility can be used for tours upon request
• Second-time implementation of technology in this application area in Norway
• Suitable for biogas, natural gas and a mix of natural and biogas• Further spread of the technology could take place through information on the project’s owners website and tours of the facility• National and international potential for dissemination that can yield increased production of electricity and reduced greenhouse gas emissions
0 Under development
• Simplified method for verification for the general public for the regulatory requirement relating to release of minimum water level• Semi-regulated axial kaplan turbine with integrated generator• Standardization of total solution for turbinating small water volumes• Cost-optimized valve solution for controlling the minimum water flow release
• Reference facility for the industry• Facilitated for measurement, monitoring and learning• Potentially opened for tours for students from the University of Agder• Development of several new key suppliers
• First full-scale turbinator installed at Tjeldbergodden Gjenvinningskraftverk, with support from Enova• Pilot in the Nea watercourse is operational every summer (Statkraft)
• Suitable for utilization of minimum water flow in watercourses• Suitable for industry with sizable water flows• Transferable to water channels and dams connected to irrigation/water supply• Technology support estimates spread potential at about 50 plants in Norway in a 10-year perspective• Increasing focus on turbining minimum water flow release in Europe• International potential for dissemination that can yield increased use of water resources for power production and reduced greenhouse gas emissions

98
PROJECT’SCLIMATERESULT
INNORWAY(kgCO
2equiv/year)
PROJECTSTATUS
INNOVATION EXPERTISEDEVELOPMENT REALIZEDDISSEMINATIONOFTECHNOLOGY FURTHERDEVELOPMENTANDDISSEMINATION
379 000 Conversion
from oil and natural gas
Under development,
partially operational
• Dynamic thermal energy storage• Patenting technology• New combination of technology with low-temperature local heating systems• Multiple innovations in system, individual technologies, storage and management for optimization of performance and utilization of low-temperature surplus energy
• Cooperation with the Norwegian University of Science and Technology (NTNU), University of Oslo (UiO) and Bioforsk, as well as Nord-Trøndelag county authority, which is in turn building operative experience in relation to other market players• Research arena at Mære landbruksskole• Horizon 2020 application submitted with SINTEF as the coordinator, NTFK and Gether as partners, and the DTES system facility at Mære as the main case• Publication in the media and interest in public agencies• Master and doctorate degrees at NTNU
• First implementation of full-scale facility in Norway and globally• Development cooperation with the University of Oslo with regard to further cooperation at the Natural History Museum in Tøyen. Two minor special contracts at the UiO Natural History Museum related to management system
• Particularly suited for buildings with glass/atriums, historical buildings, energy efficiency for buildings on small lots, cooling in supermarkets• Technology supplier estimates potential spread to several thousand plants in Norway.• National potential for reduced greenhouse gas emissions• International potential for spread that can result in conversion to renewable energy and reduced greenhouse gas emissions
0 Ready for commissioning
• Utilization of snow as source of free cooling • Demonstration facility• Knowledge about system development, functionality and suitability of the technology• Information dissemination with associations, e.g. Norsk VVS Energi- og Miljøteknisk Forening and Fjernvarmeforeningen• Presentations at various conferences• Project tasks associated with the project, master’s thesis or doctoral assignments relevant when the facility becomes operational
• First snow-cooling plant in Norway• Implemented in one hospital in Sweden
• Suitable for meeting cooling needs in buildings and facilities in areas with snow and frost in the winter and large areas available for snow harvesting and storage.• International potential for dissemination in areas with similar climatic conditions, which can yield greater use of renewable energy for cooling and reduced greenhouse gas emissions.
0 Two building projects in
operation, one project under development
• Innovative composition of technology, introduced in new market segment• Simplified and more efficient hydronic system inside the building, suitable for industrialization• Utilization of structure for distribution of hot water for consumption for floor heating• Try new consumption points, e.g. washing machine and dishwasher for hot water from renewable sources• Prøve nye forbrukspunkt, f.eks. vaskemaskin og oppvaskmaskin på varmtvann fra fornybarkilder
• Demonstration facility for the district heating industry, architects and property developers• Cooperation with other expertise environments (major contractors, the HVAC sector, Bellona)• Objective measurement of consumption for verification and analysis• Tailored measurement programme offered to end user for customer follow-up and increased awareness• Presentations in meeting arenas and at conferences• Various articles in technical press
• Parallel development courses underway through Enova’s competition for simplified heating solutions.• A building with only a tap water structure, where floor heating is taken from the tap water, planned construction start-up: Spring 2015 • A new building with 70 apartments under construction with new solution• Industrialized production at LK system’s plant in Sweden
• Suitable in buildings with very low energy consumption, cf. TEK15 • Industrialization makes the solution suitable for water-borne facilities throughout Norway.• Relevant for major contractors, associations and the industry• Several equipment producers want to participate, planning multiple prototypes of integrated cabinet solutions in the near future• In negotiations with developer to test and further develop the solution with hot tap water as the energy carrier
54 056Reduced propane
consumption
Under establishment
• Demonstration of deep drilling under Norwegian conditions and in typically Norwegian bedrock• Drill bit developed to handle crystalline bedrock• Continuous casting in critical zones to reduce the risk of landslides and leaks• New type of coaxial collectors enables high energy withdrawal
• Demonstration facility• Experience transfer, e.g. via involvement in FutureBuilt• Expertise development among all involved players• Information dissemination via technical press, seminars, conferences, etc.
• First full-scale implementation of the technology in Norway• There are energy wells of a corresponding depth abroad, but with different subsurface conditions.
• Suitable in city neighbourhoods where area usage and energy price are decisive• Asker municipality is considering energy wells for a specific development area (Føyka/Elvely)• Technology supplier estimates that the spread potential is for geothermal drilling projects in city neighbourhoods, where multiple shallow wells can be replaced with one deeper well. The potential in Norway is expected to be about 1000 wells a year.• National potential for spread that could contribute to increased renewable energy production and reduced greenhouse gas emissions
0 Not operational
in 2015 (due to
deficient water access)
• Turbine and generator in the same unit makes gearbox unnecessary• Adapted tempered seawater with regard to corrosion• Replaceable runner for seasonal variation in water volume• Patenting of technology is under consideration
• Reference facility for the industry• Facilitated for monitoring, measurement and learning• Relevant for connection to research projects and education• Information dissemination through presentations and conferences, nationally and internationally• Granted EU funds for further development of the technology in cooperation with Spanish Gas Natural Fenosa• 260 kW turbine under development for utilization of minimum water flow at Gåseflå dam with support from Enova (see project under owner Agder Energi Vannkraft)• Important lessons learned in the design (corrosion protection, fastening of composite component, etc.)• Exhibited at Hydro 2014 (Italy) and Hydro 2015 (France)
• Pilot in the Nea watercourse is operational every summer (Statkraft)• Sales agent agreement with company in Puerto Rico (covers the Caribbean, Central America, and northern South America)• Sales agreement with company in Turkey (covers Turkey)
• Transferable to utilization of mandatory minimum release in watercourse. Increasing focus in Europe with implementation of the EU’s Water Directive• Transferable to water canals and dams connected to irrigation/water supply• Technology supplier estimates spread potential at around 20 industry plants in Norway, with comparable water consumption• Approved two SkatteFunn (Tax Deduction Scheme) applications for further development of the technology• Gas Natural Fenosa indicates a potential for 100 additional facilities following successful pilot installation in Spain• International potential for spread that can yield improved utilization of waste water for power production and reduced greenhouse gas emissions
0 Under commissioning
• Known motor technology (piston engine) adapted to new area of application• Simple design, very effective• Several patents, e.g. on heat recovery unit and valve system (injection system)
• Demonstration facility (Returkraft has about 3 000 visitors each year)• Several cooperation projects with research and educational institutions, e.g. Sintef, Teknova, Denmark Technical University (DTU)• Doctorate at DTU
• First implementation globally• Developer signed agreement with BE Aerospace, the first test machines have been delivered• Two test machines delivered to Caterpillar in the US/Germany (exhaust heat)• One test machine delivered to Mitsui in Japan (geothermal)
• Suitable for other energy sources: solar thermal, biomass and geothermal energy• Technology supplier estimates own spread potential to 2000 units globally by 2016, increasing to 4000 units total by 2017• International potential for spread that can yield increased production of electricity from renewable energy and energy recovery, and reduced greenhouse gas emissions
0 Operational • Verification of stirling engines’ suitability for power production from low-quality landfill gas with low methane content. Can tolerate impurities in gas• Several patents, e.g. for the burner, gas cooler and piston
• Demonstration facility, open for tours• Continued major interest in the facility• New knowledge about solving the challenge with significant variation of the gas production against the fact that the stirling engines need constant gas pressure
• Norway: Two orders for corresponding facilities• Internationally: There are currently facilities in the UK, Germany, Poland, Slovenia
• Suitable for landfill facilities and methane gas plants. In Norway: 62 landfills in operation and 85 methane gas facilities• International potential for dissemination that can yield increased production of electricity and reduced greenhouse gas emissions
0 Operational • Newsworthiness as this is first-time implementation of micro-turbine cleaning facility for production of power and heat (co-gen)• Development of complete control system
• Demonstration facility. Available for visitors from industry and academia• Web-based monitoring of the facility enables easy data acquisition and sharing
• First implementation in Norway• Implemented in several facilities internationally, e.g. in the US and Europe
• Suitable for biogas plants, landfill facilities and facilities for handling food and other waste. • In Norway there are 20 biogas facilities which treat drain mud from cleaning plants in Norway. 62 waste disposal sites in operation and 85 methane gas plants. • Primarily relevant for medium-sized facilities.
• Suitable for large greenhouse facilities which need power, heating and CO2.
• Project owner is experiencing major interest from the market• International potential for spread that can yield increased production of electricity from renewable energy and energy recovery, and reduced greenhouse gas emissions
0 Under development
• Enables power production from steam with low pressure and temperature• Flexibility in using multiple machines adapted to seasonal fluctuations• Patented technology
• Demonstration facility• Included in Viken Skog’s efforts in “Treklyngen” at Follum, a business cluster for comprehensive and coordinated utilization of forestry, including sharing of expertise
• The project is a second-time implementation of a full-scale facility• Turbine previously implemented at Senja Avfall IK
• The project creates a platform for further dissemination of steam expanders in the Nordic countries, and then internationally.• Repetition of expander production and run-time enables roll-out of other energy solutions with similar technology, e.g. ORC systems• Technology supplier estimates spread potential at about 20 district heating plants in Norway, and 90 plants in the rest of the Nordic countries• International potential for dissemination that can yield increased production of electricity from waste heat, and reduced greenhouse gas emissions.
56 358Conversion
from oil
Under establishment
• Stirling engine can withstand polluted landfill gas• Can be run with landfill gas with a methane content down to 18%
• Learning arena for dissemination of experience and knowledge is established when needed or based on demand• Facility can be used for tours upon request
• Second-time implementation of technology in this application area in Norway
• Suitable for biogas, natural gas and a mix of natural and biogas• Further spread of the technology could take place through information on the project’s owners website and tours of the facility• National and international potential for dissemination that can yield increased production of electricity and reduced greenhouse gas emissions
0 Under development
• Simplified method for verification for the general public for the regulatory requirement relating to release of minimum water level• Semi-regulated axial kaplan turbine with integrated generator• Standardization of total solution for turbinating small water volumes• Cost-optimized valve solution for controlling the minimum water flow release
• Reference facility for the industry• Facilitated for measurement, monitoring and learning• Potentially opened for tours for students from the University of Agder• Development of several new key suppliers
• First full-scale turbinator installed at Tjeldbergodden Gjenvinningskraftverk, with support from Enova• Pilot in the Nea watercourse is operational every summer (Statkraft)
• Suitable for utilization of minimum water flow in watercourses• Suitable for industry with sizable water flows• Transferable to water channels and dams connected to irrigation/water supply• Technology support estimates spread potential at about 50 plants in Norway in a 10-year perspective• Increasing focus on turbining minimum water flow release in Europe• International potential for dissemination that can yield increased use of water resources for power production and reduced greenhouse gas emissions

99
102 projects in 2012-2015
New energy and climate technology is essential for adaptation to a low emission society. Enova’s work within new energy and climate technology will help reduce greenhouse gas emissions and support the development of restructuring of energy end-use and energy production in the long term through developing and utilizing technologies and new solutions that can contribute towards this.
In the 2012-2015 period, Enova supported a total of 102 new energy and climate technology projects with a total of NOK 3.3 billion.
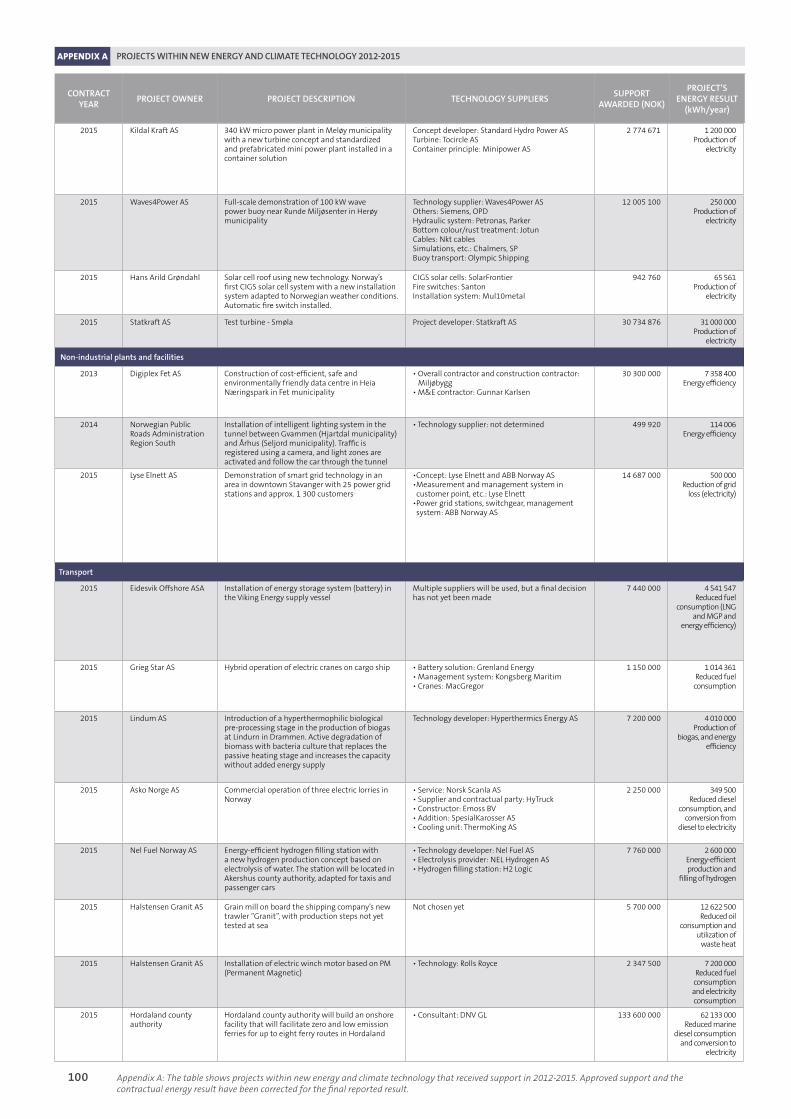
Appendix A: The table shows projects within new energy and climate technology that received support in 2012-2015. Approved support and the contractual energy result have been corrected for the final reported result.
APPENDIX A PROJECTS WITHIN NEW ENERGY AND CLIMATE TECHNOLOGY 2012-2015
100
CONTRACTYEAR
PROJECTOWNER PROJECTDESCRIPTION TECHNOLOGYSUPPLIERSSUPPORT
AWARDED(NOK)
PROJECT’SENERGYRESULT
(kWh/year)
2015 Kildal Kraft AS 340 kW micro power plant in Meløy municipality with a new turbine concept and standardized and prefabricated mini power plant installed in a container solution
Concept developer: Standard Hydro Power ASTurbine: Tocircle ASContainer principle: Minipower AS
2 774 671 1 200 000Production of
electricity
2015 Waves4Power AS Full-scale demonstration of 100 kW wave power buoy near Runde Miljøsenter in Herøy municipality
Technology supplier: Waves4Power ASOthers: Siemens, OPDHydraulic system: Petronas, ParkerBottom colour/rust treatment: JotunCables: Nkt cablesSimulations, etc.: Chalmers, SPBuoy transport: Olympic Shipping
12 005 100 250 000Production of
electricity
2015 Hans Arild Grøndahl Solar cell roof using new technology. Norway’s first CIGS solar cell system with a new installation system adapted to Norwegian weather conditions. Automatic fire switch installed.
CIGS solar cells: SolarFrontier Fire switches: Santon Installation system: Mul10metal
942 760 65 561Production of
electricity
2015 Statkraft AS Test turbine - Smøla Project developer: Statkraft AS 30 734 876 31 000 000Production of
electricity
2013 Digiplex Fet AS Construction of cost-efficient, safe and environmentally friendly data centre in Heia Næringspark in Fet municipality
• Overall contractor and construction contractor: Miljøbygg• M&E contractor: Gunnar Karlsen
30 300 000 7 358 400Energy efficiency
2014 Norwegian Public Roads Administration Region South
Installation of intelligent lighting system in the tunnel between Gvammen (Hjartdal municipality) and Århus (Seljord municipality). Traffic is registered using a camera, and light zones are activated and follow the car through the tunnel
• Technology supplier: not determined 499 920 114 006Energy efficiency
2015 Lyse Elnett AS Demonstration of smart grid technology in an area in downtown Stavanger with 25 power grid stations and approx. 1 300 customers
•Concept: Lyse Elnett and ABB Norway AS•Measurement and management system in customer point, etc.: Lyse Elnett•Power grid stations, switchgear, management system: ABB Norway AS
14 687 000 500 000Reduction of grid
loss (electricity)
Transport
2015 Eidesvik Offshore ASA Installation of energy storage system (battery) in the Viking Energy supply vessel
Multiple suppliers will be used, but a final decision has not yet been made
7 440 000 4 541 547Reduced fuel
consumption (LNG and MGP and
energy efficiency)
2015 Grieg Star AS Hybrid operation of electric cranes on cargo ship • Battery solution: Grenland Energy• Management system: Kongsberg Maritim• Cranes: MacGregor
1 150 000 1 014 361Reduced fuel
consumption
2015 Lindum AS Introduction of a hyperthermophilic biological pre-processing stage in the production of biogas at Lindurn in Drammen. Active degradation of biomass with bacteria culture that replaces the passive heating stage and increases the capacity without added energy supply
Technology developer: Hyperthermics Energy AS 7 200 000 4 010 000Production of
biogas, and energy efficiency
2015 Asko Norge AS Commercial operation of three electric lorries in Norway
• Service: Norsk Scanla AS• Supplier and contractual party: HyTruck• Constructor: Emoss BV• Addition: SpesialKarosser AS• Cooling unit: ThermoKing AS
2 250 000 349 500Reduced diesel
consumption, and conversion from
diesel to electricity
2015 Nel Fuel Norway AS Energy-efficient hydrogen filling station with a new hydrogen production concept based on electrolysis of water. The station will be located in Akershus county authority, adapted for taxis and passenger cars
• Technology developer: Nel Fuel AS• Electrolysis provider: NEL Hydrogen AS• Hydrogen filling station: H2 Logic
7 760 000 2 600 000Energy-efficient production and
filling of hydrogen
2015 Halstensen Granit AS Grain mill on board the shipping company’s new trawler “Granit”, with production steps not yet tested at sea
Not chosen yet 5 700 000 12 622 500Reduced oil
consumption and utilization of
waste heat
2015 Halstensen Granit AS Installation of electric winch motor based on PM (Permanent Magnetic)
• Technology: Rolls Royce 2 347 500 7 200 000Reduced fuel
consumption and electricity consumption
2015 Hordaland county authority
Hordaland county authority will build an onshore facility that will facilitate zero and low emission ferries for up to eight ferry routes in Hordaland
• Consultant: DNV GL 133 600 000 62 133 000Reduced marine
diesel consumption and conversion to
electricity
Non-industrialplantsandfacilities

101
0 Under development
• Turbine with permanent generator maintains high performance over varying rotational speeds, and thus optimally exploits variations in water level• Standardized container solution for micro power plant
• Cooperate with Østfold University College for engineering of the container solution – completed bachelor’s thesis with related scientific theory and method• Cooperation with various cutting-edge environments for development of system solution and standardization solutions
• First-time global implementation of the turbine technology for hydropower production• The turbine technology is a further development of turbine technology based on gas and vapour, implemented at Senja Avfall IK in Lenvik and Vardar Varme in Hønefoss, with support from Enova• The system solution is a composition of existing technology in a new application
• The technology is primarily suited for micro power plants of < 1 MW – multiple containers can be installed and operated in parallel and thus increase capacity• Technology supplier estimates that spread potential is 50-100 facilities in Norway under 1 MW. Furthermore, the supplier estimates a major international spread potential – several hundred over a few years• International potential for spread that can yield increased production of renewable power and reduced greenhouse gas emissions
0 Under development
• 25-year rust and anti-fouling protection, developed by Jotun and SP• New generation of dynamic cables for marine energy• Connection hub for connecting marine energy to the grid• Relief system for dynamic cables
• Coordinated cooperation and exchange of experience between involved players and expert environments through the development of the wave power plant’s technology elements. Extensive verification of technologies• Development of simulation models and testing of cable strain in cooperation with Chalmers Tekniska Högskola, Technical Research Institute of Sweden • Media coverage• Sharing technical solutions with the marine energy industry
• First implementation in Norway and globally • The technology is suited for input to the grid, or for remote areas or installations far from the grid, e.g. electrification of aquaculture facilities, offshore installations, etc.• Technology supplier estimates a significant spread potential along the Norwegian coastline up to 2020, as well as about a hundred buoys outside the UK within 2017/2018• International potential for spread that could yield increased production of renewable power and reduced greenhouse gas emissions
0 Near completion and
operational
• CIGS technology is new in Norway• New installation system
• Empirical data from the project determines spread, particularly assessment of new CIGS technology with new installation system in relation to normal crystalline solar cells• IFE Kjeller will use the facility for research• Information meeting with Øvre Romerike fire and rescue
• First national installation of new CIGS technology • Already national interest (TV2) in the solar cell industry and among potential buyers• International potential for areas with a Nordic climate
0
0 Commissioning • Use of evaporation/adiabatic cooling units• Use of the building as a local route for ventilation air
• Company network established• Participating contractor is building expertise• Execution of tests at the University of Leeds to optimise the rack design to reduce PUE
• First-time implementation in Norwegian data centres• Implemented in Sweden• Corresponding technology will be used in ongoing development of Digiplex data centre in Sweden
• Several construction steps are under consideration• Potential unclarified, but growing Norwegian industry and several establishments are expected• Transferable to Nordic data centres• International potential for spread that can yield improved energy efficiency and reduced greenhouse gas emissions
0 Under establishment
• Connection of two familiar technologies; AID cameras and dimming system for LED lighting systems• Light level in the tunnel controlled based on need using AID cameras, where lighting zones are activated when there is traffic and follow the car through the tunnel• The lighting level will be reduced to 10% when there is no traffic
• Prestigious project where a future-oriented and energy conservation profile is selected• Project owner assumes expertise development and spread both internally and externally
• First-time implementation of the combination of AID cameras and lighting management in Norway and globally
• Project owner estimates a future national potential for improved energy efficiency of 3 GWh/year, based on the Norwegian Public Roads Administration’s manual (N500)• International potential for spread that can yield improved energy efficiency
0 Under establishment
• Smart grid technology for electric power systems that use bidirectional communication, distributed measurement and management systems, new sensor technologies and management of equipment (load, prod.) with grid customers• Test new solutions, concepts and technologies• Verify useful values of reducing grid losses• Lay foundation for future development and efficiency
• Demonstration project• Goal to establish industry standard• Project under Demo Norge via the Smart Grid Centre in Norway• Communication via industry network• Continuous measurement and documentation• Made available to research institutions upon completion, including Sintef and others
• First-time implementation of the total concept globally• Certain parts of the technology have previously been demonstrated internationally, but this is the first time in Norway
• Transferable to Lyse Elnett’s other grids and facilities• Significant international potential for the smart grid concept, including switchgear, power grid stations, measurement and management systems, etc. with smart grid functionality• Technology supplier estimates a substantial spread potential; 20-50% of the 130 000 power grid stations in Norway are expected to have a form of smart grid technology over the next ten years. The potential for export of the solutions is expected to cover all the 60 countries to which they currently deliver switchgears and power grid stations• National and international potential for spread that results in reduced grid losses and increased possibility for handling local power production and power-intensive equipment
969 441Reduced fuel consumption
(LNG and MGO)
Under establishment
• Installation of batteries in existing vessels with dual fuel propulsion (LNG and MGO)• Batteries function as storage and additional energy source• Stable load for generators where the batteries will handle the high peaks (peak-shaving)• Alternating use of generator and battery (“charge/discharge”) reduces use of generators with low output (where both consumption and emission are disproportionately high)
• Contribute to use of battery technology achieving broader market introduction• The first such facilities will create a reference for cost and gains for other corresponding projects• Participating sub-suppliers are developing knowledge (Kongsberg Maritime, Westcon Power & Automation, ZEM, Electro Automation Austevoll, etc.)
• Second-time implementation in Norway in a ship with dual fuel operation (LNG and MGO)
• Eidesvik wants to use corresponding technology on as many of their supply vessels as possible (own and operate 26 ships)• The technology is also transferable to other companies’ supply vessels, as well as to vessels within related vessel groups such as anchor handling vessels, construction vessels, etc. – both nationally and internationally• International potential for spread that could result in reduced use of fossil fuels and reduced greenhouse gas emissions
270 145Reduced diesel consumption/
LSMGO (Low Sulfur Maritime Gas Oil)
Under establishment
• Installation of battery system for operation of electric cranes on cargo ships • The cranes produce electricity when the load is lowered• More optimised crane operation and reduced energy and fuel consumption
• Development and lab testing for verification of associated control system• Verification of the solution under real operating conditions• Quantify emission reductions and fuel savings
• First installation of such a system on board a ship in a global scale • Could potentially be installed in all of Grieg Star’s newer ships• The technology is transferable to corresponding ships with electric cranes, which are starting to become a standard• International potential for spread that could yield reduced consumption of fossil fuel and reduced greenhouse gas emissions
1 054 627Production
replaces diesel
Under establishment
• Patented hyperthermophilic bacteria break down biomass very quickly in phase 1 in a biogas plant• Biological generation of heat during the process reduces the energy need for pre-processing• Biological hydrogen generation as added effect
• Expertise development surrounding multiphase biogas process internally at Lindum’s two plants in Norway and in the company’s R&D department• Experience from the project is shared in several research and development projects• Expertise transfer to other players in the waste industry through a biological work group in Avfall Norge
• First full-scale implementation of the technology in Norway and globally
• Suitable for implementation when producing biogas from waste and other biological material• Technology supplier sees a possibility for implementation in the company’s other focus areas, such as fish sludge from aquaculture and fertilizer from agriculture• Technology supplier estimates that spread potential is approx. 30 plants in Norway, 250 plants in Scandinavia and 7500 plants in Germany• International potential for spread that could result in increased biogas production with reduced energy consumption, conversion to renewable energy and reduced greenhouse gas emissions
141 016Reduced diesel
consumption, and conversion from
diesel to electricity
Under establishment
• Electric lorries will replace traditional diesel lorries 1-1• New combination of lorry and cooling unit
• Better experience basis• Knowledge sharing with other players• Expertise development for electric vehicles among service and maintenance suppliers• Test reach and battery capacity in a winter climate
• First electric lorries in commercial operation in Norway• Electric lorries are already operational in other European countries, but only in a pilot scale
• Potential for larger scale phase-in of electric lorries in ASKO’s fleet• National and international potential for phase-in of electric lorries for city distribution in other transportation enterprises
0 Under establishment
• Compact and more energy-efficient hydrogen production adapted to hydrogen stations• Higher capacity than previously demonstrated• Modular station for flexibility when scaling up
• Demonstration facility• Internal expertise development, as well as expertise development with associated partners• Information dissemination through conferences, seminars and inspections
• First implementation of the technology solutions (pressure electrolysis in filling station) globally• First hydrogen station in Norway aimed at the passenger car segment with robustness and capacity for commercial operations
• National and international potential for energy-efficient hydrogen production and simple, modular hydrogen solutions that could result in increased use of hydrogen as fuel
3 824 618Reduced oil
consumption
Under establishment
• Integration of new production stages that exploit waste heat and waste for production of new products• Considerable improvement in specific energy per produced good• Exploitation of everything from the fish that is collected from the ocean, including valuable fish oils
• Increased expertise and experience regarding the equipment’s functionality on board during movement
• First-time implementation of the technology in Norway and globally • Potential for spread to other trawlers with rights for production processes on board, nationally and globally• There is currently a high demand for the products that are produced on board the vessel due to the high degree of freshness• Large volumes of available residual raw material that can be used in the new technology
2 181 600Reduced fuel consumption
Under establishment
• The new winch will yield higher fishing capacity (reduced trawling operation)• The winch is operated by a motor with no gears• Better performance and regenerative effect• Energy consumption reduced by about 25 per cent
• Employees who operate the equipment will gain new experience• Learning about the winch motor’s interaction with existing deck machinery
• First-time implementation of complete outfitting in Norway and globally
• The winches are designed for both trawlers and anchor handling vessels. Large markets may open up that could lead to more energy-efficient vessels in various sectors
16 547 261Reduced marine
diesel consumption
Under establishment
• Norwegian maritime cluster is at the global forefront and the probability of technological innovations in tenders is significant• Contribute to testing and gaining experience with more new technology elements (charging solutions and battery technology)
• Involved partners will considerably increase their expertise regarding battery solutions in ferries, which will provide an important head start in further development and sale of such solutions
• Norway only has one fully electric car ferry, this project will result in more fully electric ferries and plug-in hybrids• The project will provide an important experience basis for further implementation of battery technology in ferries and other vessel types
• The project will help lower prices of several key components• Large market for ferry operations in Norway and significant potential for transition to more electrical operations• The project will stimulate new technology and advance the industry• The project will lead to more tenders with more stringent requirements for reduced energy consumption and reduced greenhouse
PROJECT’SCLIMATERESULT
INNORWAY(kgCO
2equiv/year)
PROJECTSTATUS
INNOVATION EXPERTISEDEVELOPMENT REALIZEDDISSEMINATIONOFTECHNOLOGY FURTHERDEVELOPMENTANDDISSEMINATION
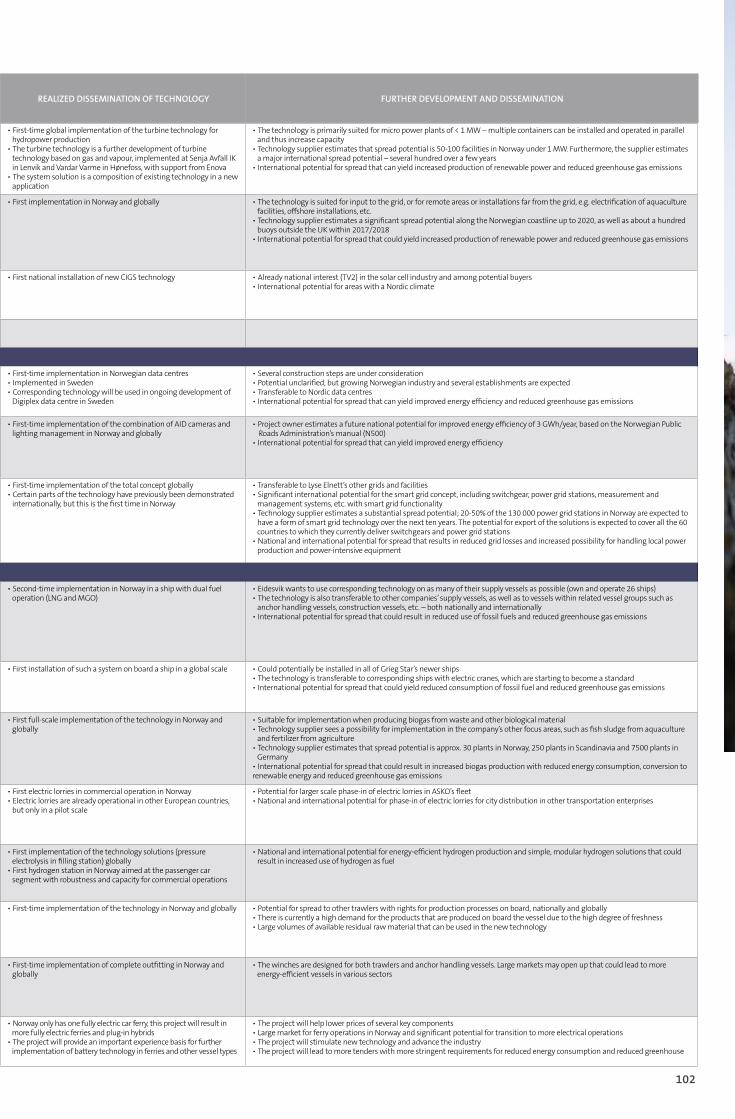
102
0 Under development
• Turbine with permanent generator maintains high performance over varying rotational speeds, and thus optimally exploits variations in water level• Standardized container solution for micro power plant
• Cooperate with Østfold University College for engineering of the container solution – completed bachelor’s thesis with related scientific theory and method• Cooperation with various cutting-edge environments for development of system solution and standardization solutions
• First-time global implementation of the turbine technology for hydropower production• The turbine technology is a further development of turbine technology based on gas and vapour, implemented at Senja Avfall IK in Lenvik and Vardar Varme in Hønefoss, with support from Enova• The system solution is a composition of existing technology in a new application
• The technology is primarily suited for micro power plants of < 1 MW – multiple containers can be installed and operated in parallel and thus increase capacity• Technology supplier estimates that spread potential is 50-100 facilities in Norway under 1 MW. Furthermore, the supplier estimates a major international spread potential – several hundred over a few years• International potential for spread that can yield increased production of renewable power and reduced greenhouse gas emissions
0 Under development
• 25-year rust and anti-fouling protection, developed by Jotun and SP• New generation of dynamic cables for marine energy• Connection hub for connecting marine energy to the grid• Relief system for dynamic cables
• Coordinated cooperation and exchange of experience between involved players and expert environments through the development of the wave power plant’s technology elements. Extensive verification of technologies• Development of simulation models and testing of cable strain in cooperation with Chalmers Tekniska Högskola, Technical Research Institute of Sweden • Media coverage• Sharing technical solutions with the marine energy industry
• First implementation in Norway and globally • The technology is suited for input to the grid, or for remote areas or installations far from the grid, e.g. electrification of aquaculture facilities, offshore installations, etc.• Technology supplier estimates a significant spread potential along the Norwegian coastline up to 2020, as well as about a hundred buoys outside the UK within 2017/2018• International potential for spread that could yield increased production of renewable power and reduced greenhouse gas emissions
0 Near completion and
operational
• CIGS technology is new in Norway• New installation system
• Empirical data from the project determines spread, particularly assessment of new CIGS technology with new installation system in relation to normal crystalline solar cells• IFE Kjeller will use the facility for research• Information meeting with Øvre Romerike fire and rescue
• First national installation of new CIGS technology • Already national interest (TV2) in the solar cell industry and among potential buyers• International potential for areas with a Nordic climate
0
0 Commissioning • Use of evaporation/adiabatic cooling units• Use of the building as a local route for ventilation air
• Company network established• Participating contractor is building expertise• Execution of tests at the University of Leeds to optimise the rack design to reduce PUE
• First-time implementation in Norwegian data centres• Implemented in Sweden• Corresponding technology will be used in ongoing development of Digiplex data centre in Sweden
• Several construction steps are under consideration• Potential unclarified, but growing Norwegian industry and several establishments are expected• Transferable to Nordic data centres• International potential for spread that can yield improved energy efficiency and reduced greenhouse gas emissions
0 Under establishment
• Connection of two familiar technologies; AID cameras and dimming system for LED lighting systems• Light level in the tunnel controlled based on need using AID cameras, where lighting zones are activated when there is traffic and follow the car through the tunnel• The lighting level will be reduced to 10% when there is no traffic
• Prestigious project where a future-oriented and energy conservation profile is selected• Project owner assumes expertise development and spread both internally and externally
• First-time implementation of the combination of AID cameras and lighting management in Norway and globally
• Project owner estimates a future national potential for improved energy efficiency of 3 GWh/year, based on the Norwegian Public Roads Administration’s manual (N500)• International potential for spread that can yield improved energy efficiency
0 Under establishment
• Smart grid technology for electric power systems that use bidirectional communication, distributed measurement and management systems, new sensor technologies and management of equipment (load, prod.) with grid customers• Test new solutions, concepts and technologies• Verify useful values of reducing grid losses• Lay foundation for future development and efficiency
• Demonstration project• Goal to establish industry standard• Project under Demo Norge via the Smart Grid Centre in Norway• Communication via industry network• Continuous measurement and documentation• Made available to research institutions upon completion, including Sintef and others
• First-time implementation of the total concept globally• Certain parts of the technology have previously been demonstrated internationally, but this is the first time in Norway
• Transferable to Lyse Elnett’s other grids and facilities• Significant international potential for the smart grid concept, including switchgear, power grid stations, measurement and management systems, etc. with smart grid functionality• Technology supplier estimates a substantial spread potential; 20-50% of the 130 000 power grid stations in Norway are expected to have a form of smart grid technology over the next ten years. The potential for export of the solutions is expected to cover all the 60 countries to which they currently deliver switchgears and power grid stations• National and international potential for spread that results in reduced grid losses and increased possibility for handling local power production and power-intensive equipment
969 441Reduced fuel consumption
(LNG and MGO)
Under establishment
• Installation of batteries in existing vessels with dual fuel propulsion (LNG and MGO)• Batteries function as storage and additional energy source• Stable load for generators where the batteries will handle the high peaks (peak-shaving)• Alternating use of generator and battery (“charge/discharge”) reduces use of generators with low output (where both consumption and emission are disproportionately high)
• Contribute to use of battery technology achieving broader market introduction• The first such facilities will create a reference for cost and gains for other corresponding projects• Participating sub-suppliers are developing knowledge (Kongsberg Maritime, Westcon Power & Automation, ZEM, Electro Automation Austevoll, etc.)
• Second-time implementation in Norway in a ship with dual fuel operation (LNG and MGO)
• Eidesvik wants to use corresponding technology on as many of their supply vessels as possible (own and operate 26 ships)• The technology is also transferable to other companies’ supply vessels, as well as to vessels within related vessel groups such as anchor handling vessels, construction vessels, etc. – both nationally and internationally• International potential for spread that could result in reduced use of fossil fuels and reduced greenhouse gas emissions
270 145Reduced diesel consumption/
LSMGO (Low Sulfur Maritime Gas Oil)
Under establishment
• Installation of battery system for operation of electric cranes on cargo ships • The cranes produce electricity when the load is lowered• More optimised crane operation and reduced energy and fuel consumption
• Development and lab testing for verification of associated control system• Verification of the solution under real operating conditions• Quantify emission reductions and fuel savings
• First installation of such a system on board a ship in a global scale • Could potentially be installed in all of Grieg Star’s newer ships• The technology is transferable to corresponding ships with electric cranes, which are starting to become a standard• International potential for spread that could yield reduced consumption of fossil fuel and reduced greenhouse gas emissions
1 054 627Production
replaces diesel
Under establishment
• Patented hyperthermophilic bacteria break down biomass very quickly in phase 1 in a biogas plant• Biological generation of heat during the process reduces the energy need for pre-processing• Biological hydrogen generation as added effect
• Expertise development surrounding multiphase biogas process internally at Lindum’s two plants in Norway and in the company’s R&D department• Experience from the project is shared in several research and development projects• Expertise transfer to other players in the waste industry through a biological work group in Avfall Norge
• First full-scale implementation of the technology in Norway and globally
• Suitable for implementation when producing biogas from waste and other biological material• Technology supplier sees a possibility for implementation in the company’s other focus areas, such as fish sludge from aquaculture and fertilizer from agriculture• Technology supplier estimates that spread potential is approx. 30 plants in Norway, 250 plants in Scandinavia and 7500 plants in Germany• International potential for spread that could result in increased biogas production with reduced energy consumption, conversion to renewable energy and reduced greenhouse gas emissions
141 016Reduced diesel
consumption, and conversion from
diesel to electricity
Under establishment
• Electric lorries will replace traditional diesel lorries 1-1• New combination of lorry and cooling unit
• Better experience basis• Knowledge sharing with other players• Expertise development for electric vehicles among service and maintenance suppliers• Test reach and battery capacity in a winter climate
• First electric lorries in commercial operation in Norway• Electric lorries are already operational in other European countries, but only in a pilot scale
• Potential for larger scale phase-in of electric lorries in ASKO’s fleet• National and international potential for phase-in of electric lorries for city distribution in other transportation enterprises
0 Under establishment
• Compact and more energy-efficient hydrogen production adapted to hydrogen stations• Higher capacity than previously demonstrated• Modular station for flexibility when scaling up
• Demonstration facility• Internal expertise development, as well as expertise development with associated partners• Information dissemination through conferences, seminars and inspections
• First implementation of the technology solutions (pressure electrolysis in filling station) globally• First hydrogen station in Norway aimed at the passenger car segment with robustness and capacity for commercial operations
• National and international potential for energy-efficient hydrogen production and simple, modular hydrogen solutions that could result in increased use of hydrogen as fuel
3 824 618Reduced oil
consumption
Under establishment
• Integration of new production stages that exploit waste heat and waste for production of new products• Considerable improvement in specific energy per produced good• Exploitation of everything from the fish that is collected from the ocean, including valuable fish oils
• Increased expertise and experience regarding the equipment’s functionality on board during movement
• First-time implementation of the technology in Norway and globally • Potential for spread to other trawlers with rights for production processes on board, nationally and globally• There is currently a high demand for the products that are produced on board the vessel due to the high degree of freshness• Large volumes of available residual raw material that can be used in the new technology
2 181 600Reduced fuel consumption
Under establishment
• The new winch will yield higher fishing capacity (reduced trawling operation)• The winch is operated by a motor with no gears• Better performance and regenerative effect• Energy consumption reduced by about 25 per cent
• Employees who operate the equipment will gain new experience• Learning about the winch motor’s interaction with existing deck machinery
• First-time implementation of complete outfitting in Norway and globally
• The winches are designed for both trawlers and anchor handling vessels. Large markets may open up that could lead to more energy-efficient vessels in various sectors
16 547 261Reduced marine
diesel consumption
Under establishment
• Norwegian maritime cluster is at the global forefront and the probability of technological innovations in tenders is significant• Contribute to testing and gaining experience with more new technology elements (charging solutions and battery technology)
• Involved partners will considerably increase their expertise regarding battery solutions in ferries, which will provide an important head start in further development and sale of such solutions
• Norway only has one fully electric car ferry, this project will result in more fully electric ferries and plug-in hybrids• The project will provide an important experience basis for further implementation of battery technology in ferries and other vessel types
• The project will help lower prices of several key components• Large market for ferry operations in Norway and significant potential for transition to more electrical operations• The project will stimulate new technology and advance the industry• The project will lead to more tenders with more stringent requirements for reduced energy consumption and reduced greenhouse
PROJECT’SCLIMATERESULT
INNORWAY(kgCO
2equiv/year)
PROJECTSTATUS
INNOVATION EXPERTISEDEVELOPMENT REALIZEDDISSEMINATIONOFTECHNOLOGY FURTHERDEVELOPMENTANDDISSEMINATION

103
New energy and climate technology will be a crucial contribution towards solving the energy challenges of the future. However, introduction of new technologies is demanding, in part due to the increased risk compared with conventional technology and reduced profitability.
Enova’s support programmes in this area will contribute to the introduction of new energy and climate technology in the market, by reducing risk and increasing profitability for those who are the first to use a new technology.
Wehavefivesupportprogrammesfornewtechnology:- Pre-project support – new energy and climate technology in industry- Support for new energy and climate technology in industry- Support for new technology for the buildings of the future- Support for new energy and climate technology in transport- Support for introduction of new technology
Enova’s support programmes for new technology
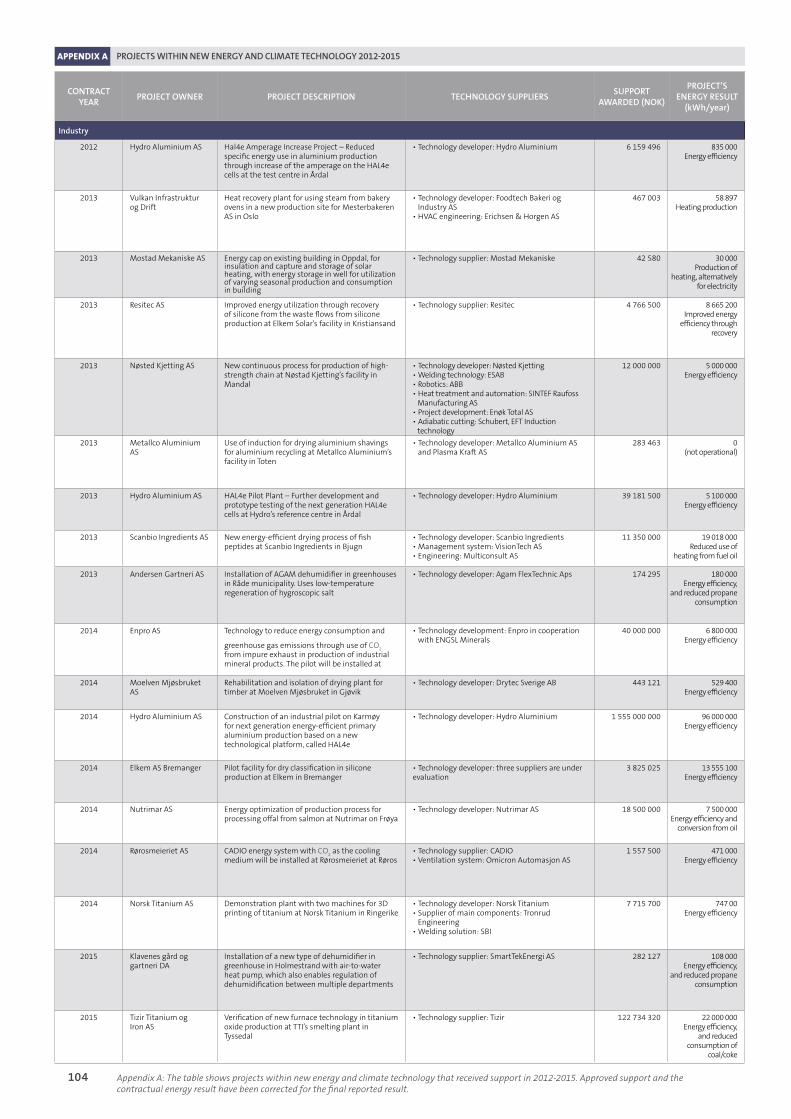
Appendix A: The table shows projects within new energy and climate technology that received support in 2012-2015. Approved support and the contractual energy result have been corrected for the final reported result.
APPENDIX A PROJECTS WITHIN NEW ENERGY AND CLIMATE TECHNOLOGY 2012-2015
104
CONTRACTYEAR
PROJECTOWNER PROJECTDESCRIPTION TECHNOLOGYSUPPLIERSSUPPORT
AWARDED(NOK)
PROJECT’SENERGYRESULT
(kWh/year)
Industry
2012 Hydro Aluminium AS Hal4e Amperage Increase Project – Reduced specific energy use in aluminium production through increase of the amperage on the HAL4e cells at the test centre in Årdal
• Technology developer: Hydro Aluminium 6 159 496 835 000Energy efficiency
2013 Vulkan Infrastruktur og Drift
Heat recovery plant for using steam from bakery ovens in a new production site for Mesterbakeren AS in Oslo
• Technology developer: Foodtech Bakeri og Industry AS• HVAC engineering: Erichsen & Horgen AS
467 003 58 897 Heating production
2013 Mostad Mekaniske AS Energy cap on existing building in Oppdal, for insulation and capture and storage of solar heating, with energy storage in well for utilization of varying seasonal production and consumption in building
• Technology supplier: Mostad Mekaniske 42 580 30 000Production of
heating, alternatively for electricity
2013 Resitec AS Improved energy utilization through recovery of silicone from the waste flows from silicone production at Elkem Solar’s facility in Kristiansand
• Technology supplier: Resitec 4 766 500 8 665 200Improved energy
efficiency through recovery
2013 Nøsted Kjetting AS New continuous process for production of high-strength chain at Nøstad Kjetting’s facility in Mandal
• Technology developer: Nøsted Kjetting• Welding technology: ESAB• Robotics: ABB• Heat treatment and automation: SINTEF Raufoss Manufacturing AS• Project development: Enøk Total AS• Adiabatic cutting: Schubert, EFT Induction technology
12 000 000 5 000 000Energy efficiency
2013 Metallco Aluminium AS
Use of induction for drying aluminium shavings for aluminium recycling at Metallco Aluminium’s facility in Toten
• Technology developer: Metallco Aluminium AS and Plasma Kraft AS
283 463 0(not operational)
2013 Hydro Aluminium AS HAL4e Pilot Plant – Further development and prototype testing of the next generation HAL4e cells at Hydro’s reference centre in Årdal
• Technology developer: Hydro Aluminium 39 181 500 5 100 000Energy efficiency
2013 Scanbio Ingredients AS New energy-efficient drying process of fish peptides at Scanbio Ingredients in Bjugn
• Technology developer: Scanbio Ingredients• Management system: VisionTech AS• Engineering: Multiconsult AS
11 350 000 19 018 000Reduced use of
heating from fuel oil
2013 Andersen Gartneri AS Installation of AGAM dehumidifier in greenhouses in Råde municipality. Uses low-temperature regeneration of hygroscopic salt
• Technology developer: Agam FlexTechnic Aps 174 295 180 000Energy efficiency,
and reduced propane consumption
2014 Enpro AS Technology to reduce energy consumption and
greenhouse gas emissions through use of CO2
from impure exhaust in production of industrial mineral products. The pilot will be installed at
• Technology development: Enpro in cooperation with ENGSL Minerals
40 000 000 6 800 000Energy efficiency
2014 Moelven Mjøsbruket AS
Rehabilitation and isolation of drying plant for timber at Moelven Mjøsbruket in Gjøvik
• Technology developer: Drytec Sverige AB 443 121 529 400Energy efficiency
2014 Hydro Aluminium AS Construction of an industrial pilot on Karmøy for next generation energy-efficient primary aluminium production based on a new technological platform, called HAL4e
• Technology developer: Hydro Aluminium 1 555 000 000 96 000 000Energy efficiency
2014 Elkem AS Bremanger Pilot facility for dry classification in silicone production at Elkem in Bremanger
• Technology developer: three suppliers are under evaluation
3 825 025 13 555 100Energy efficiency
2014 Nutrimar AS Energy optimization of production process for processing offal from salmon at Nutrimar on Frøya
• Technology developer: Nutrimar AS 18 500 000 7 500 000Energy efficiency and
conversion from oil
2014 Rørosmeieriet AS CADIO energy system with CO2 as the cooling
medium will be installed at Rørosmeieriet at Røros• Technology supplier: CADIO• Ventilation system: Omicron Automasjon AS
1 557 500 471 000Energy efficiency
2014 Norsk Titanium AS Demonstration plant with two machines for 3D printing of titanium at Norsk Titanium in Ringerike
• Technology developer: Norsk Titanium• Supplier of main components: Tronrud Engineering• Welding solution: SBI
7 715 700 747 00Energy efficiency
2015 Klavenes gård og gartneri DA
Installation of a new type of dehumidifier in greenhouse in Holmestrand with air-to-water heat pump, which also enables regulation of dehumidification between multiple departments
• Technology supplier: SmartTekEnergi AS 282 127 108 000Energy efficiency,
and reduced propane consumption
2015 Tizir Titanium og Iron AS
Verification of new furnace technology in titanium oxide production at TTI’s smelting plant in Tyssedal
• Technology supplier: Tizir 122 734 320 22 000 000Energy efficiency,
and reduced consumption of
coal/coke

105
39 000Reduced process
emissions
Commissioning • Improved anode production technology• Next level process management and operating procedures
• Included in Hydro’s reference centre in Årdal• Increasing expertise in Hydro’s technology environment and with external partners such as the Norwegian University of Science and Technology (NTNU) and SINTEF• Related projects have several doctorates in subjects highly relevant to the project• Experience with improved production technology and use of next level procedures• Expecting to publish important operating results after a verification period
• First implementation of the technology in Norway and globally• Technology forms the basis for the Karmøy Technology Pilot project
• Part of an internal technology development course, for use in Hydro’s future plants in Norway and globally• Some spin-off potential for transfer to Hydro’s existing plants• National and international potential for dissemination which could improve energy efficiency and reduce greenhouse gas emissions
0 Operational • Verification of possible achievable energy recovery and energy utilization • Demonstration facility• Case study for the industry must be prepared to communicate and highlight the possibilities• Relevant to provide experience data to SINTEF’s project INTERACT (supported by NFR)• Meetings with the bakery industry and technology supplier to present operating results that will arise over time
• First implementation of the technology in Norway• Previously tested in Germany
• Suitable for implementation in all industrial bakeries and restaurants• Technology’s profitability increases with the size of the bakery/installation• Expansion of the installation is under way to see if it is possible to increase the energy result with new implementations• Technology supplier estimates dissemination to 30-40 facilities in Norway• International potential for dissemination which could provide increased utilization of waste heat and reduced greenhouse gas emissions• Using the technology in new projects is being considered due to the project results
0 Under commissioning
• Embedding hydronic heating pipes for solar heating on roofs. • The heating system is connected to energy storage in existing well• It is being investigated whether the method can be patented
• Tailored measurement and follow-up forms the basis for further development and optimization• Planned publication of results in professional journal• Company is open to student theses, and other connections from expertise environments
• First implementation in Norway• Not aware of any other corresponding system solutions internationally
• Suitable for large existing and new buildings with a heating demand and energy storage possibilities (e.g. large business buildings, shopping centres, storage buildings, public buildings, industry buildings and agricultural buildings)• National potential for increased utilization of renewable energy
3 320 000Reduced process
emissions
Under development,
partially operational
• Use of known separation methods applied in a new way to clean waste flows from silicone production and upgrading it to silicone powder with a high value and more applications• Added substance to prevent oxidation for cuttings• Separation and cleaning of very fine-grained powder in several stages• Safe drying of fine-grained powder
• Close cooperation with the Eyde network, e.g. in the “zero waste” project• Cooperation with Sintef and others, where results from this project will be shared and used further• Implemented publication at EuroPM2015 in Reims, France• Technology and results are shared through work in Cabriss, which is a Horizon 2020 project with 15 European partners
• First facility is being installed and commissioned in Norway • Suitable for implementation in connection with solar cell silicone production and kerf• Work is ongoing at the R&D stage with multiple potential sources where the technology can be used on concrete installations in Europe• There is a larger market for this in Asia• International potential for dissemination which could increase efficiency and increased material utilization and reduce greenhouse gas emissions
30 000Reduced use of
fuel oil
Under commissioning
• Reducing number of production steps from 19 to 10 steps, of which the number of heating steps is reduced from five to two• Transition from production machines to integrated process. There is no commercial equipment for this
• Important lessons are energy management, new processes with reduced resource consumption, energy and raw material utilization• Collaboration with the University of Agder (UiA) and Umoe: Establishment of centre for innovative design for smart production• Expertise sharing between the involved expertise suppliers through an extensive test programme• Two Master’s degrees completed (UiA)
• First implementation of the technology in Norway and globally • Project owner estimates a dissemination potential to own production, as well as globally to about 100 installations (of which five are in Scandinavia, 20 in Europe)• National potential for reduced greenhouse gas emissions• International potential for dissemination which can increase efficiency, as well as reduce consumption of raw materials (steel), and reduce greenhouse gas emissions
0(not operational)
Completed, not operational
• Verification of suitability for use of induction for drying metal• Increased material and energy utilization• Combustion of undesirable organic elements on ingoing materials
• Building expertise through experience with testing and operation• Planned development of contract network with various expertise and certification environments in the industry• Experience from the pilot project will be used towards a full-scale installation• When the facility is operational, it will be published and attempts will be made to sell the facility to other users• Have verified the technology
• First implementation of the technology in Norway and globally • The technology can be transferred to industry that uses drying technology on semi-conductive materials• Suitable for combustion of several types of organic elements (lacquer, hydrocarbons) on inbound material in the same process• Project owner estimates that the technology could be implemented throughout its entire production• Technology supplier estimates an international dissemination potential, focusing on aluminium producers in Russia, the EU and US/CND• National potential for reduced greenhouse gas emissions• International potential for dissemination which can increase energy efficiency and reduce use of propane, and reduce greenhouse gas emissions
510 000Reduced process
emissions
Under development
• Innovative cathode and anode solutions• Next level procedures for process management and operation
• Included in Hydro’s reference centre in Årdal• Increasing expertise in Hydro’s technological environment and with external partners such as the Norwegian University of Science and Technology (NTNU) and SINTEF• Related to technology programme supported by Innovation Norway, where Sintef is among the participants• Related projects have several doctorates in subjects highly relevant to the project
• First implementation of the technology in Norway and globally• Technology forms the basis for the Karmøy Technology Pilot project
• Included as part of the technology development course in Hydro Aluminium, very significant for future facilities• Spin-off potential for transferring to Hydro’s existing facility• National potential for reduced greenhouse gas emissions• International potential for dissemination which can increase energy efficiency and reduce greenhouse gas emissions
5 762 000Reduced use of fuel oil (diesel)
Under commissioning
• New specially designed evaporator• New system for washing with extraction substance• Regeneration of electricity in one of the process systems• Patenting of process is under evaluation
• Possibility to licence the technology to others in the same sector in Norway and abroad, alternatively enter into a joint venture with the partners that want to use the technology
• First implementation of the technology in Norway and globally • Suitable for all drying processes where proteins are involved, both marine (for example by-products from aquaculture) and animal (for example slaughterhouse waste), etc.• Project owner/technology developer estimates a dissemination potential to their facilities nationally and internationally• National potential for reduced greenhouse gas emissions• International potential for dissemination which could reduce use of fossil fuels, and reduce greenhouse gas emissions
19 000Reduced use of
propane
Operational • Reduces energy consumption for dehumidification by 25% due to energy-efficient low-temperature regeneration of hygroscopic salt
• Company network established• Continuous measurement and documentation ongoing• Publication in a scientific periodical is under assessment
• First implementation in Norway• Implemented abroad (Denmark and Israel)• Installation of eight identical machines due to good results after a short time in operation
• Suitable for implementation in greenhouses• Project owner estimates that technology is relevant for 60% of all Norwegian greenhouses• National potential for reduced greenhouse gas emissions
14 400 000Reduced emissions
compared with best available
technology
Under establishment
• Use of CO2 from industrial exhaust with a concentration of 4-5%
• No other impurities than CO2 are collected during the process
• Production of superior mineral products• Known elements individually, composed in a new way
• Expertise development related to process efficiency, CO2 utilization in value chain, production of
“green” minerals and chemicals• Verification of the technology in an industrial scale• Detailed results from the facility will be given to the ISO 14000 series (lifecycle analysis) and thus contribute to the best practice database globally
• First implementation on a commercial scale globally• Technology tested in a downscaled size in Abu Dhabi
• Technology is suitable for stationary CO2 emission sources with access to saltwater
• Spread potential is global, but with a primary focus on developing geographical areas, where consumption of end-products is major
• Expansion facility, which is three times larger, planned in the same area with the same CO2 source
• National potential for energy efficiency and reduced greenhouse gas emissions
0 Operational • New method for maintenance of timber dryer with concrete structures• New type of insulation (polyurethane) is sprayed on all external walls/roof of the dryer followed by flexible sealing layer
• Cooperation with the Norwegian Institute of Wood Technology with a large contact network within wood processing in Norway, the expertise will be developed and spread in this environment• The durability of this technology will be evaluated in 5-10 years
• First implementation in Norway• Previously tested in Sweden
• Suitable for timber mills that are isolated in the “traditional” manner• National potential for more implementation is considered great (there are many timber dryers consisting of concrete/concrete elements)• International potential for dissemination which could provide increased energy efficiency and reduced greenhouse gas emissions
7 000 000Reduced process
emissions
Under establishment
• New design of technological platform for aluminium production with low energy consumption, high production efficiency and low environmental impact• New principles for cathode design• Several technology elements have been patented• Larger cells and increase in electricity strength and productivity
• Demonstration project for verification of technology• Expertise development internally in Hydro and external expertise environments in Norway• Project is part of Hydro’s long-term vision for development of the electrolysis technology• Related projects have several doctorates on topics that are highly relevant to the project
• First implementation in Norway and globally• Technology platform has been tested at Hydro’s reference centre in Årdal
• Possibility for spread of the technology beyond Hydro’s own smelting plants• Installation of test cells with the goal of further developing the technology• National potential for energy efficiency and reduced greenhouse gas emissions• International potential for dissemination which could provide increased energy efficiency and reduced greenhouse gas emissions
0 Under establishment
• Verification of technology for dry classification of silicone products• Energy use is reduced in relation to delivered end product per produced unit• Opens for a superior product, and more new products
• Suitable for removing barriers in further roll-out of the technology• Cooperation with Sintef/NTNU and Comex AS• Expertise dissemination internally in the Elkem system
• First implementation in Norway and globally• Small-scale tests and trials have been carried out
• Interesting and relevant for players also outside the process industry• Goal to build an industrial-scale plant based on the pilot• National potential for energy efficiency • International potential for dissemination which could provide increased energy efficiency and reduced greenhouse gas emissions
2 272 500Conversion from
oil to LPG gas
Under development
• Known technologies are put together and used in new ways to optimize the production process• Production of more superior end-products
• Learning about system development and the suitability of the technology• Sharing expertise with Pescatech, Entro, among others• NTNU will be contacted regarding project and master’s theses connected to the project
• First implementation in Norway and globally • Transferable to other industries• The technology developer considers the spread potential major, both nationally and internationally• Nutrimar will continue development and investment in the technology in connection with the industry’s further development• National and international potential for increased energy efficiency and reduced greenhouse gas emissions
142 713Reduction of oil
Under establishment,
partially in commissioning
• New type of facility with CO2 as the working medium; in addition to
cooling, hot water can also be delivered
• CO2 provides the opportunity to achieve a temperature difference on the hot side
• In combination with propane, the facility will also be efficient at high
• Training of employees. Cadio will train employees that will operate the system• Project owner is positive to establishment of arena to share knowledge• Facility will be open for tours
• First implementation in Norway and globally• Carried out testing for more than two years
• Potential for application in the food industry, other process industry, hotels and housing cooperatives• Technology supplier estimates construction of two facilities per year in a ten-year period• Technology supplier will develop market activities in cooperation with relevant partners• National and international potential for increased energy efficiency and reduced greenhouse gas emissions
0 Under development
• Reduced use of titanium and need for machining• Goal for pilot to become the first commercial 3D printer for major, complex titanium components• Enables local production with few process steps, as well as lower energy use through less waste• Several patents related to the concept
• Dissemination of expertise internally in the company• One of the goals of the project is to establish an arena to spread experience and knowledge, as well as training for future commercial production units• Further develop machines and software for new generation machines and more efficient production
• First implementation in a commercial scale in Norway and globally• Multiple-year test production and development of prototype and pilot machines• Production of (a considerable volume) of components for qualification of the technology vis-à-vis aviation
• This facility will form the basis for construction of more production units• Very relevant for the aviation industry, which is experiencing major growth• Could eventually become relevant for the automobile industry, defence, oil/gas, maritime and other areas• Potential for increased use of titanium in new areas when the cost of production of titanium components is reduced• National and international potential for spread that could increase energy efficiency
13 090Reduced propane
consumption
Commissioning • Testing of new type of dehumidifier for reducing costs related to dehumidification in greenhouses• The solution is based on known technology put together in a new way• The system benefits from flexible air and heat distribution
• Demonstration facility• Experience that shows operational stability has been gained • Dehumidification capacity, operating conditions and energy consumption are registered• Publication in scientific periodicals and conferences• Cooperation with Norsk Landbruksrådgivning, Covent, Silicia companies in Forskningsparken Vestfold, etc.
• First implementation in Norway • The technology is suitable for dehumidification in greenhouses• The technology is transferable to the industry for dehumidification and drying for a number of purposes• The technology supplier estimates that the technology is relevant for about 40% of the national greenhouse industry, with a considerable international spread potential• National and international potential for spread that could increase energy efficiency, reduce fossil fuel consumption and reduce greenhouse gas emissions
7,106 000Reduced use of
coal/coke
Under development
• New water-cooled copper ceramic roof• System for controlled heating balance in melting furnace• New cleaning and degasification handling system
• Technology spread in the Eramet system through “Challenge Initiative”, the research centre in Trappes and the corporate department Industrial Management• Information dissemination in the industry through participation in Ferrolegeringsindustriens Forskningsforening (FFF)• PhD study within the Gassmaks research programme
• First implementation nationally and internationally • Considerable spread potential in transfer to Eramet’s other facilities• Parts of the technology are transferable to the smelting plant industry in general and Ferro, Ferrosilicone and silicone production in particular. Nationally and internationally• International potential for spread that could increase energy efficiency, reduce fossil fuel consumption and reduce greenhouse gas emissions
PROJECT’SCLIMATERESULT
INNORWAY(kgCO
2equiv/year)
PROJECTSTATUS
INNOVATION EXPERTISEDEVELOPMENT REALIZEDDISSEMINATIONOFTECHNOLOGY FURTHERDEVELOPMENTANDDISSEMINATION

106
39 000Reduced process
emissions
Commissioning • Improved anode production technology• Next level process management and operating procedures
• Included in Hydro’s reference centre in Årdal• Increasing expertise in Hydro’s technology environment and with external partners such as the Norwegian University of Science and Technology (NTNU) and SINTEF• Related projects have several doctorates in subjects highly relevant to the project• Experience with improved production technology and use of next level procedures• Expecting to publish important operating results after a verification period
• First implementation of the technology in Norway and globally• Technology forms the basis for the Karmøy Technology Pilot project
• Part of an internal technology development course, for use in Hydro’s future plants in Norway and globally• Some spin-off potential for transfer to Hydro’s existing plants• National and international potential for dissemination which could improve energy efficiency and reduce greenhouse gas emissions
0 Operational • Verification of possible achievable energy recovery and energy utilization • Demonstration facility• Case study for the industry must be prepared to communicate and highlight the possibilities• Relevant to provide experience data to SINTEF’s project INTERACT (supported by NFR)• Meetings with the bakery industry and technology supplier to present operating results that will arise over time
• First implementation of the technology in Norway• Previously tested in Germany
• Suitable for implementation in all industrial bakeries and restaurants• Technology’s profitability increases with the size of the bakery/installation• Expansion of the installation is under way to see if it is possible to increase the energy result with new implementations• Technology supplier estimates dissemination to 30-40 facilities in Norway• International potential for dissemination which could provide increased utilization of waste heat and reduced greenhouse gas emissions• Using the technology in new projects is being considered due to the project results
0 Under commissioning
• Embedding hydronic heating pipes for solar heating on roofs. • The heating system is connected to energy storage in existing well• It is being investigated whether the method can be patented
• Tailored measurement and follow-up forms the basis for further development and optimization• Planned publication of results in professional journal• Company is open to student theses, and other connections from expertise environments
• First implementation in Norway• Not aware of any other corresponding system solutions internationally
• Suitable for large existing and new buildings with a heating demand and energy storage possibilities (e.g. large business buildings, shopping centres, storage buildings, public buildings, industry buildings and agricultural buildings)• National potential for increased utilization of renewable energy
3 320 000Reduced process
emissions
Under development,
partially operational
• Use of known separation methods applied in a new way to clean waste flows from silicone production and upgrading it to silicone powder with a high value and more applications• Added substance to prevent oxidation for cuttings• Separation and cleaning of very fine-grained powder in several stages• Safe drying of fine-grained powder
• Close cooperation with the Eyde network, e.g. in the “zero waste” project• Cooperation with Sintef and others, where results from this project will be shared and used further• Implemented publication at EuroPM2015 in Reims, France• Technology and results are shared through work in Cabriss, which is a Horizon 2020 project with 15 European partners
• First facility is being installed and commissioned in Norway • Suitable for implementation in connection with solar cell silicone production and kerf• Work is ongoing at the R&D stage with multiple potential sources where the technology can be used on concrete installations in Europe• There is a larger market for this in Asia• International potential for dissemination which could increase efficiency and increased material utilization and reduce greenhouse gas emissions
30 000Reduced use of
fuel oil
Under commissioning
• Reducing number of production steps from 19 to 10 steps, of which the number of heating steps is reduced from five to two• Transition from production machines to integrated process. There is no commercial equipment for this
• Important lessons are energy management, new processes with reduced resource consumption, energy and raw material utilization• Collaboration with the University of Agder (UiA) and Umoe: Establishment of centre for innovative design for smart production• Expertise sharing between the involved expertise suppliers through an extensive test programme• Two Master’s degrees completed (UiA)
• First implementation of the technology in Norway and globally • Project owner estimates a dissemination potential to own production, as well as globally to about 100 installations (of which five are in Scandinavia, 20 in Europe)• National potential for reduced greenhouse gas emissions• International potential for dissemination which can increase efficiency, as well as reduce consumption of raw materials (steel), and reduce greenhouse gas emissions
0(not operational)
Completed, not operational
• Verification of suitability for use of induction for drying metal• Increased material and energy utilization• Combustion of undesirable organic elements on ingoing materials
• Building expertise through experience with testing and operation• Planned development of contract network with various expertise and certification environments in the industry• Experience from the pilot project will be used towards a full-scale installation• When the facility is operational, it will be published and attempts will be made to sell the facility to other users• Have verified the technology
• First implementation of the technology in Norway and globally • The technology can be transferred to industry that uses drying technology on semi-conductive materials• Suitable for combustion of several types of organic elements (lacquer, hydrocarbons) on inbound material in the same process• Project owner estimates that the technology could be implemented throughout its entire production• Technology supplier estimates an international dissemination potential, focusing on aluminium producers in Russia, the EU and US/CND• National potential for reduced greenhouse gas emissions• International potential for dissemination which can increase energy efficiency and reduce use of propane, and reduce greenhouse gas emissions
510 000Reduced process
emissions
Under development
• Innovative cathode and anode solutions• Next level procedures for process management and operation
• Included in Hydro’s reference centre in Årdal• Increasing expertise in Hydro’s technological environment and with external partners such as the Norwegian University of Science and Technology (NTNU) and SINTEF• Related to technology programme supported by Innovation Norway, where Sintef is among the participants• Related projects have several doctorates in subjects highly relevant to the project
• First implementation of the technology in Norway and globally• Technology forms the basis for the Karmøy Technology Pilot project
• Included as part of the technology development course in Hydro Aluminium, very significant for future facilities• Spin-off potential for transferring to Hydro’s existing facility• National potential for reduced greenhouse gas emissions• International potential for dissemination which can increase energy efficiency and reduce greenhouse gas emissions
5 762 000Reduced use of fuel oil (diesel)
Under commissioning
• New specially designed evaporator• New system for washing with extraction substance• Regeneration of electricity in one of the process systems• Patenting of process is under evaluation
• Possibility to licence the technology to others in the same sector in Norway and abroad, alternatively enter into a joint venture with the partners that want to use the technology
• First implementation of the technology in Norway and globally • Suitable for all drying processes where proteins are involved, both marine (for example by-products from aquaculture) and animal (for example slaughterhouse waste), etc.• Project owner/technology developer estimates a dissemination potential to their facilities nationally and internationally• National potential for reduced greenhouse gas emissions• International potential for dissemination which could reduce use of fossil fuels, and reduce greenhouse gas emissions
19 000Reduced use of
propane
Operational • Reduces energy consumption for dehumidification by 25% due to energy-efficient low-temperature regeneration of hygroscopic salt
• Company network established• Continuous measurement and documentation ongoing• Publication in a scientific periodical is under assessment
• First implementation in Norway• Implemented abroad (Denmark and Israel)• Installation of eight identical machines due to good results after a short time in operation
• Suitable for implementation in greenhouses• Project owner estimates that technology is relevant for 60% of all Norwegian greenhouses• National potential for reduced greenhouse gas emissions
14 400 000Reduced emissions
compared with best available
technology
Under establishment
• Use of CO2 from industrial exhaust with a concentration of 4-5%
• No other impurities than CO2 are collected during the process
• Production of superior mineral products• Known elements individually, composed in a new way
• Expertise development related to process efficiency, CO2 utilization in value chain, production of
“green” minerals and chemicals• Verification of the technology in an industrial scale• Detailed results from the facility will be given to the ISO 14000 series (lifecycle analysis) and thus contribute to the best practice database globally
• First implementation on a commercial scale globally• Technology tested in a downscaled size in Abu Dhabi
• Technology is suitable for stationary CO2 emission sources with access to saltwater
• Spread potential is global, but with a primary focus on developing geographical areas, where consumption of end-products is major
• Expansion facility, which is three times larger, planned in the same area with the same CO2 source
• National potential for energy efficiency and reduced greenhouse gas emissions
0 Operational • New method for maintenance of timber dryer with concrete structures• New type of insulation (polyurethane) is sprayed on all external walls/roof of the dryer followed by flexible sealing layer
• Cooperation with the Norwegian Institute of Wood Technology with a large contact network within wood processing in Norway, the expertise will be developed and spread in this environment• The durability of this technology will be evaluated in 5-10 years
• First implementation in Norway• Previously tested in Sweden
• Suitable for timber mills that are isolated in the “traditional” manner• National potential for more implementation is considered great (there are many timber dryers consisting of concrete/concrete elements)• International potential for dissemination which could provide increased energy efficiency and reduced greenhouse gas emissions
7 000 000Reduced process
emissions
Under establishment
• New design of technological platform for aluminium production with low energy consumption, high production efficiency and low environmental impact• New principles for cathode design• Several technology elements have been patented• Larger cells and increase in electricity strength and productivity
• Demonstration project for verification of technology• Expertise development internally in Hydro and external expertise environments in Norway• Project is part of Hydro’s long-term vision for development of the electrolysis technology• Related projects have several doctorates on topics that are highly relevant to the project
• First implementation in Norway and globally• Technology platform has been tested at Hydro’s reference centre in Årdal
• Possibility for spread of the technology beyond Hydro’s own smelting plants• Installation of test cells with the goal of further developing the technology• National potential for energy efficiency and reduced greenhouse gas emissions• International potential for dissemination which could provide increased energy efficiency and reduced greenhouse gas emissions
0 Under establishment
• Verification of technology for dry classification of silicone products• Energy use is reduced in relation to delivered end product per produced unit• Opens for a superior product, and more new products
• Suitable for removing barriers in further roll-out of the technology• Cooperation with Sintef/NTNU and Comex AS• Expertise dissemination internally in the Elkem system
• First implementation in Norway and globally• Small-scale tests and trials have been carried out
• Interesting and relevant for players also outside the process industry• Goal to build an industrial-scale plant based on the pilot• National potential for energy efficiency • International potential for dissemination which could provide increased energy efficiency and reduced greenhouse gas emissions
2 272 500Conversion from
oil to LPG gas
Under development
• Known technologies are put together and used in new ways to optimize the production process• Production of more superior end-products
• Learning about system development and the suitability of the technology• Sharing expertise with Pescatech, Entro, among others• NTNU will be contacted regarding project and master’s theses connected to the project
• First implementation in Norway and globally • Transferable to other industries• The technology developer considers the spread potential major, both nationally and internationally• Nutrimar will continue development and investment in the technology in connection with the industry’s further development• National and international potential for increased energy efficiency and reduced greenhouse gas emissions
142 713Reduction of oil
Under establishment,
partially in commissioning
• New type of facility with CO2 as the working medium; in addition to
cooling, hot water can also be delivered
• CO2 provides the opportunity to achieve a temperature difference on the hot side
• In combination with propane, the facility will also be efficient at high
• Training of employees. Cadio will train employees that will operate the system• Project owner is positive to establishment of arena to share knowledge• Facility will be open for tours
• First implementation in Norway and globally• Carried out testing for more than two years
• Potential for application in the food industry, other process industry, hotels and housing cooperatives• Technology supplier estimates construction of two facilities per year in a ten-year period• Technology supplier will develop market activities in cooperation with relevant partners• National and international potential for increased energy efficiency and reduced greenhouse gas emissions
0 Under development
• Reduced use of titanium and need for machining• Goal for pilot to become the first commercial 3D printer for major, complex titanium components• Enables local production with few process steps, as well as lower energy use through less waste• Several patents related to the concept
• Dissemination of expertise internally in the company• One of the goals of the project is to establish an arena to spread experience and knowledge, as well as training for future commercial production units• Further develop machines and software for new generation machines and more efficient production
• First implementation in a commercial scale in Norway and globally• Multiple-year test production and development of prototype and pilot machines• Production of (a considerable volume) of components for qualification of the technology vis-à-vis aviation
• This facility will form the basis for construction of more production units• Very relevant for the aviation industry, which is experiencing major growth• Could eventually become relevant for the automobile industry, defence, oil/gas, maritime and other areas• Potential for increased use of titanium in new areas when the cost of production of titanium components is reduced• National and international potential for spread that could increase energy efficiency
13 090Reduced propane
consumption
Commissioning • Testing of new type of dehumidifier for reducing costs related to dehumidification in greenhouses• The solution is based on known technology put together in a new way• The system benefits from flexible air and heat distribution
• Demonstration facility• Experience that shows operational stability has been gained • Dehumidification capacity, operating conditions and energy consumption are registered• Publication in scientific periodicals and conferences• Cooperation with Norsk Landbruksrådgivning, Covent, Silicia companies in Forskningsparken Vestfold, etc.
• First implementation in Norway • The technology is suitable for dehumidification in greenhouses• The technology is transferable to the industry for dehumidification and drying for a number of purposes• The technology supplier estimates that the technology is relevant for about 40% of the national greenhouse industry, with a considerable international spread potential• National and international potential for spread that could increase energy efficiency, reduce fossil fuel consumption and reduce greenhouse gas emissions
7,106 000Reduced use of
coal/coke
Under development
• New water-cooled copper ceramic roof• System for controlled heating balance in melting furnace• New cleaning and degasification handling system
• Technology spread in the Eramet system through “Challenge Initiative”, the research centre in Trappes and the corporate department Industrial Management• Information dissemination in the industry through participation in Ferrolegeringsindustriens Forskningsforening (FFF)• PhD study within the Gassmaks research programme
• First implementation nationally and internationally • Considerable spread potential in transfer to Eramet’s other facilities• Parts of the technology are transferable to the smelting plant industry in general and Ferro, Ferrosilicone and silicone production in particular. Nationally and internationally• International potential for spread that could increase energy efficiency, reduce fossil fuel consumption and reduce greenhouse gas emissions
PROJECT’SCLIMATERESULT
INNORWAY(kgCO
2equiv/year)
PROJECTSTATUS
INNOVATION EXPERTISEDEVELOPMENT REALIZEDDISSEMINATIONOFTECHNOLOGY FURTHERDEVELOPMENTANDDISSEMINATION

107
In the property business, “green buildings” has become an established term for buildings with environmental qualities. Now, Drammen will get its own solar smaragd. In the seven-floor office building currently being erected by Union Eiendomsutvikling AS, green solar cells will become an integrated part of the façade. Enova is supporting the technological innovation with NOK 1.5 million.
However, the solar cells are only one of several energy and climate-friendly solutions chosen for the building, which will be named “EnergiBygget” (the energy building). The dialogue with Enova has caused the property company to increase its energy ambitions for the jewel several times during the project.
Drammen adorns itself with solar smaragd
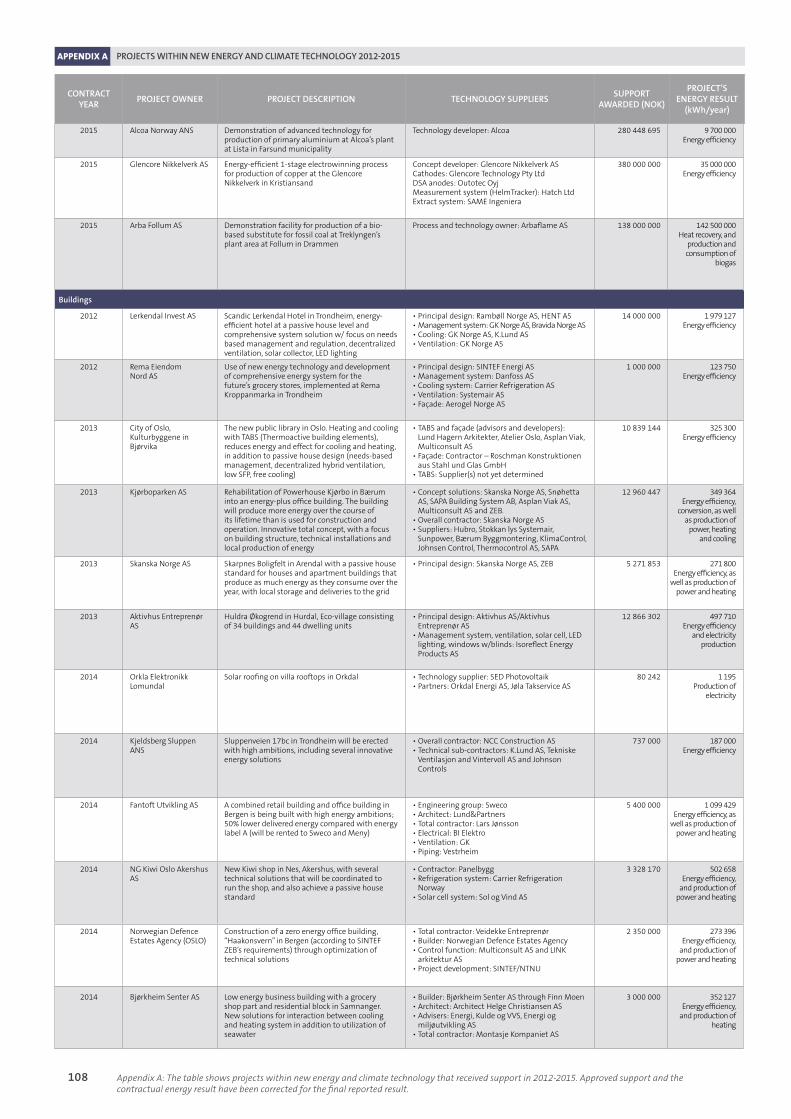
Appendix A: The table shows projects within new energy and climate technology that received support in 2012-2015. Approved support and the contractual energy result have been corrected for the final reported result.
APPENDIX A PROJECTS WITHIN NEW ENERGY AND CLIMATE TECHNOLOGY 2012-2015
108
CONTRACTYEAR
PROJECTOWNER PROJECTDESCRIPTION TECHNOLOGYSUPPLIERSSUPPORT
AWARDED(NOK)
PROJECT’SENERGYRESULT
(kWh/year)
2015 Alcoa Norway ANS Demonstration of advanced technology for production of primary aluminium at Alcoa’s plant at Lista in Farsund municipality
Technology developer: Alcoa 280 448 695 9 700 000Energy efficiency
2015 Glencore Nikkelverk AS Energy-efficient 1-stage electrowinning process for production of copper at the Glencore Nikkelverk in Kristiansand
Concept developer: Glencore Nikkelverk ASCathodes: Glencore Technology Pty LtdDSA anodes: Outotec OyjMeasurement system (HelmTracker): Hatch LtdExtract system: SAME Ingeniera
380 000 000 35 000 000Energy efficiency
2015 Arba Follum AS Demonstration facility for production of a bio-based substitute for fossil coal at Treklyngen’s plant area at Follum in Drammen
Process and technology owner: Arbaflame AS 138 000 000 142 500 000Heat recovery, and
production and consumption of
biogas
Buildings
2012 Lerkendal Invest AS Scandic Lerkendal Hotel in Trondheim, energy-efficient hotel at a passive house level and comprehensive system solution w/ focus on needs based management and regulation, decentralized ventilation, solar collector, LED lighting
• Principal design: Rambøll Norge AS, HENT AS• Management system: GK Norge AS, Bravida Norge AS• Cooling: GK Norge AS, K.Lund AS• Ventilation: GK Norge AS
14 000 000 1 979 127 Energy efficiency
2012 Rema Eiendom Nord AS
Use of new energy technology and development of comprehensive energy system for the future’s grocery stores, implemented at Rema Kroppanmarka in Trondheim
• Principal design: SINTEF Energi AS• Management system: Danfoss AS• Cooling system: Carrier Refrigeration AS• Ventilation: Systemair AS• Façade: Aerogel Norge AS
1 000 000 123 750Energy efficiency
2013 City of Oslo, Kulturbyggene in Bjørvika
The new public library in Oslo. Heating and cooling with TABS (Thermoactive building elements), reduces energy and effect for cooling and heating, in addition to passive house design (needs-based management, decentralized hybrid ventilation, low SFP, free cooling)
• TABS and façade (advisors and developers): Lund Hagern Arkitekter, Atelier Oslo, Asplan Viak, Multiconsult AS• Façade: Contractor – Roschman Konstruktionen aus Stahl und Glas GmbH• TABS: Supplier(s) not yet determined
10 839 144 325 300 Energy efficiency
2013 Kjørboparken AS Rehabilitation of Powerhouse Kjørbo in Bærum into an energy-plus office building. The building will produce more energy over the course of its lifetime than is used for construction and operation. Innovative total concept, with a focus on building structure, technical installations and local production of energy
• Concept solutions: Skanska Norge AS, Snøhetta AS, SAPA Building System AB, Asplan Viak AS, Multiconsult AS and ZEB. • Overall contractor: Skanska Norge AS• Suppliers: Hubro, Stokkan lys Systemair, Sunpower, Bærum Byggmontering, KlimaControl, Johnsen Control, Thermocontrol AS, SAPA
12 960 447 349 364Energy efficiency,
conversion, as well as production of
power, heating and cooling
2013 Skanska Norge AS Skarpnes Boligfelt in Arendal with a passive house standard for houses and apartment buildings that produce as much energy as they consume over the year, with local storage and deliveries to the grid
• Principal design: Skanska Norge AS, ZEB 5 271 853 271 800Energy efficiency, as
well as production of power and heating
2013 Aktivhus Entreprenør AS
Huldra Økogrend in Hurdal, Eco-village consisting of 34 buildings and 44 dwelling units
• Principal design: Aktivhus AS/Aktivhus Entreprenør AS• Management system, ventilation, solar cell, LED lighting, windows w/blinds: Isoreflect Energy Products AS
12 866 302 497 710Energy efficiency
and electricity production
2014 Orkla Elektronikk Lomundal
Solar roofing on villa rooftops in Orkdal • Technology supplier: SED Photovoltaik• Partners: Orkdal Energi AS, Jøla Takservice AS
80 242 1 195Production of
electricity
2014 Kjeldsberg Sluppen ANS
Sluppenveien 17bc in Trondheim will be erected with high ambitions, including several innovative energy solutions
• Overall contractor: NCC Construction AS• Technical sub-contractors: K.Lund AS, Tekniske Ventilasjon and Vintervoll AS and Johnson Controls
737 000 187 000Energy efficiency
2014 Fantoft Utvikling AS A combined retail building and office building in Bergen is being built with high energy ambitions; 50% lower delivered energy compared with energy label A (will be rented to Sweco and Meny)
• Engineering group: Sweco• Architect: Lund&Partners• Total contractor: Lars Jønsson• Electrical: BI Elektro• Ventilation: GK• Piping: Vestrheim
5 400 000 1 099 429Energy efficiency, as
well as production of power and heating
2014 NG Kiwi Oslo Akershus AS
New Kiwi shop in Nes, Akershus, with several technical solutions that will be coordinated to run the shop, and also achieve a passive house standard
• Contractor: Panelbygg• Refrigeration system: Carrier Refrigeration Norway• Solar cell system: Sol og Vind AS
3 328 170 502 658Energy efficiency,
and production of power and heating
2014 Norwegian Defence Estates Agency (OSLO)
Construction of a zero energy office building, “Haakonsvern” in Bergen (according to SINTEF ZEB’s requirements) through optimization of technical solutions
• Total contractor: Veidekke Entreprenør• Builder: Norwegian Defence Estates Agency• Control function: Multiconsult AS and LINK arkitektur AS• Project development: SINTEF/NTNU
2 350 000 273 396Energy efficiency,
and production of power and heating
2014 Bjørkheim Senter AS Low energy business building with a grocery shop part and residential block in Samnanger. New solutions for interaction between cooling and heating system in addition to utilization of seawater
• Builder: Bjørkheim Senter AS through Finn Moen• Architect: Architect Helge Christiansen AS• Advisers: Energi, Kulde og VVS, Energi og miljøutvikling AS• Total contractor: Montasje Kompaniet AS
3 000 000 352 127Energy efficiency,
and production of heating
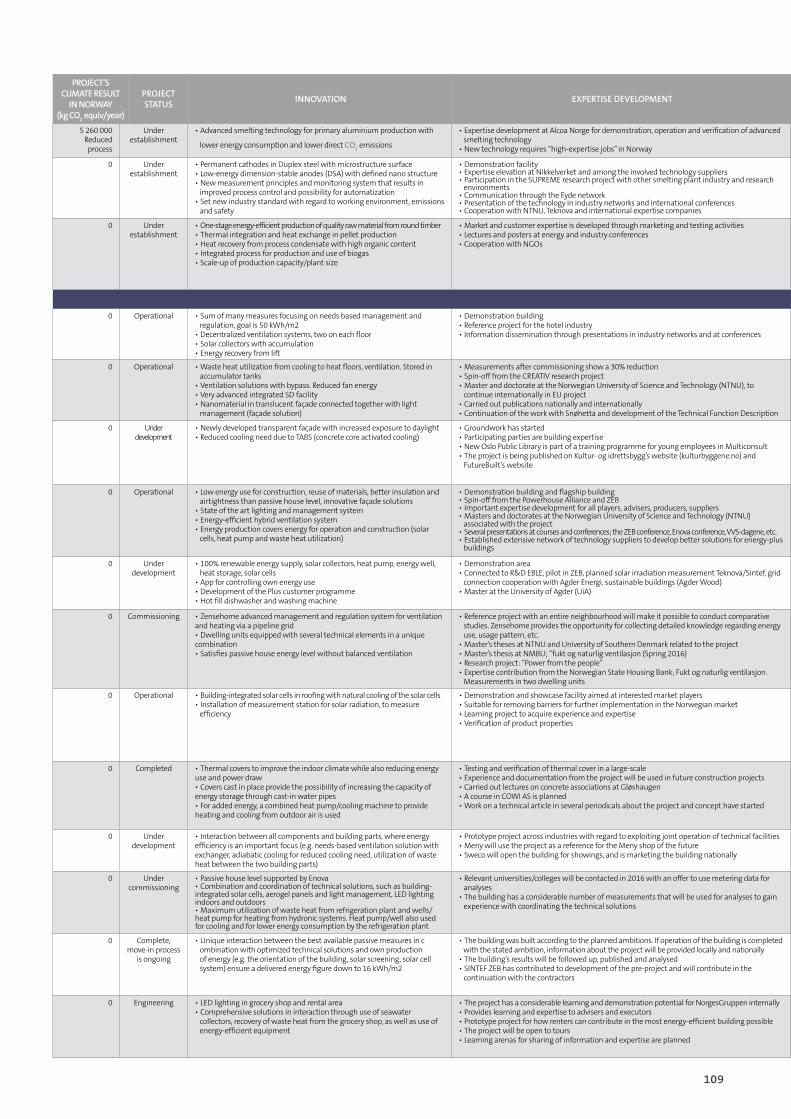
109
5 260 000Reduced process
Under establishment
• Advanced smelting technology for primary aluminium production with
lower energy consumption and lower direct CO2 emissions
• Expertise development at Alcoa Norge for demonstration, operation and verification of advanced smelting technology• New technology requires “high-expertise jobs” in Norway
• First implementation of the technology in Norway and globally • Design and installation of multiple furnaces/cells in Norway for further development and commercialization of the technology• National and international potential for spread which could increase energy efficiency and reduce greenhouse gas emissions
0 Under establishment
• Permanent cathodes in Duplex steel with microstructure surface• Low-energy dimension-stable anodes (DSA) with defined nano structure• New measurement principles and monitoring system that results in improved process control and possibility for automatization• Set new industry standard with regard to working environment, emissions and safety
• Demonstration facility• Expertise elevation at Nikkelverket and among the involved technology suppliers• Participation in the SUPREME research project with other smelting plant industry and research environments• Communication through the Eyde network• Presentation of the technology in industry networks and international conferences• Cooperation with NTNU, Teknova and international expertise companies
• First full-scale implementation of the total concept which results in record-low electricity consumption, in Norway and globally• Some individual elements have been implemented at plants in the US and Chile. None in Norway
• Considerable spread potential in transfer to production of copper through electrolysis• Elements of the technology have a spread potential for general production of copper, as well as zinc and nickel• Technology supplier estimates that spread potential within copper and zinc production is 6-7 TWh• International potential for spread which could increase energy efficiency and reduce greenhouse gas emissions
0 Under establishment
• One-stage energy-efficient production of quality raw material from round timber• Thermal integration and heat exchange in pellet production• Heat recovery from process condensate with high organic content• Integrated process for production and use of biogas• Scale-up of production capacity/plant size
• Market and customer expertise is developed through marketing and testing activities• Lectures and posters at energy and industry conferences• Cooperation with NGOs
• Arbaflame has installed a pilot plant at Grasmo in Eidskog• First full-scale demonstration of use of the product in Thunder Bay, Canada• Knowledge of technology and product is spread through technical sales and marketing, and through full-scale testing with customers
• Suitable as a co-incineration fuel or complete substitute for fossil coal in power production with very low investment requirements at the customer stage• Suitable as replacement for fossil coal in metallurgical industry; carbon source and reduction agent• Suitable as energy carrier for production of next generation biofuel• Technology supplier estimates that spread potential is 5 million tonnes of Arbapellets annually over a 5-10 year period• National and international potential for spread through energy-efficient production of a renewable energy carrier, which can contribute to increased renewable energy production and reduced greenhouse gas emissions
0 Operational • Sum of many measures focusing on needs based management and regulation, goal is 50 kWh/m2• Decentralized ventilation systems, two on each floor• Solar collectors with accumulation• Energy recovery from lift
• Demonstration building• Reference project for the hotel industry• Information dissemination through presentations in industry networks and at conferences
• First implementation in Norway• Not aware of any other corresponding system solutions internationally
• Comprehensive concept relevant for hotels in Norway• All or parts of concept interesting internationally• International potential for dissemination which could increase energy efficiency and reduce greenhouse gas emissions• Due to reduced construction activity, multiple planned projects where parts of the solutions would be used have been postponed
0 Operational • Waste heat utilization from cooling to heat floors, ventilation. Stored in accumulator tanks• Ventilation solutions with bypass. Reduced fan energy• Very advanced integrated SD facility• Nanomaterial in translucent façade connected together with light management (façade solution)
• Measurements after commissioning show a 30% reduction • Spin-off from the CREATIV research project• Master and doctorate at the Norwegian University of Science and Technology (NTNU), to continue internationally in EU project• Carried out publications nationally and internationally• Continuation of the work with Snøhetta and development of the Technical Function Description
• First implementation in Norway• No identical projects tested internationally, but elements are being tested in Switzerland and Germany• Elements have been utilized in own shops
• Suitable for implementation in other grocery stores, several chains have now started using all or parts of the concept solution• Several of the solutions and technologies are suitable for other types of non-residential buildings• Technology developer indicates that they want to implement the technology and solution in the EU• International potential for dissemination which could increase energy efficiency and reduce greenhouse gas emissions
0 Under development
• Newly developed transparent façade with increased exposure to daylight• Reduced cooling need due to TABS (concrete core activated cooling)
• Groundwork has started• Participating parties are building expertise• New Oslo Public Library is part of a training programme for young employees in Multiconsult• The project is being published on Kultur- og idrettsbygg’s website (kulturbyggene.no) and FutureBuilt’s website
• First implementation of TABS in Norway. Has been implemented abroad• First implementation of façade solution in Norway and globally
• Suitable for implementation in several types of non-residential buildings• Technology indicates an international potential for selling the façade solution• International potential for dissemination which could increase energy efficiency and reduce greenhouse gas emissions
0 Operational • Low energy use for construction, reuse of materials, better insulation and airtightness than passive house level, innovative façade solutions• State of the art lighting and management system• Energy-efficient hybrid ventilation system• Energy production covers energy for operation and construction (solar cells, heat pump and waste heat utilization)
• Demonstration building and flagship building• Spin-off from the Powerhouse Alliance and ZEB• Important expertise development for all players, advisers, producers, suppliers• Masters and doctorates at the Norwegian University of Science and Technology (NTNU) associated with the project• Several presentations at courses and conferences; the ZEB conference, Enova conference, VVS-dagene, etc.• Established extensive network of technology suppliers to develop better solutions for energy-plus buildings
• The world’s first rehabilitation to an energy-plus house in a lifetime perspective globally, first Norwegian which incl. bound energy
• Relevant for all future Norwegian rehabilitation and new buildings• Particularly interesting for rehabilitation in cold areas• International potential for dissemination which can increase energy efficiency and conversion, and reduce greenhouse gas emissions• Nationally and internationally recognised demonstration project, has completed a substantial number of tours• The solutions are followed up in the operations phase. Relevant technology suppliers are involved
0 Under development
• 100% renewable energy supply, solar collectors, heat pump, energy well, heat storage, solar cells• App for controlling own energy use• Development of the Plus customer programme• Hot fill dishwasher and washing machine
• Demonstration area• Connected to R&D EBLE, pilot in ZEB, planned solar irradiation measurement Teknova/Sintef, grid connection cooperation with Agder Energi, sustainable buildings (Agder Wood)• Master at the University of Agder (UiA)
• First implementation in Norway• No identical projects tested internationally, but elements have been tested• Reduced scope due to deficient sales
• Testing of various production methods (buildings), as well as technical solutions• Relevant for future residential area development• International potential for dissemination which could increase energy efficiency and conversion and reduce greenhouse gas emissions
0 Commissioning • Zensehome advanced management and regulation system for ventilation and heating via a pipeline grid• Dwelling units equipped with several technical elements in a unique combination• Satisfies passive house energy level without balanced ventilation
• Reference project with an entire neighbourhood will make it possible to conduct comparative studies. Zensehome provides the opportunity for collecting detailed knowledge regarding energy use, usage pattern, etc.• Master’s theses at NTNU and University of Southern Denmark related to the project• Master’s thesis at NMBU; “fukt og naturlig ventilasjon (Spring 2016)• Research project: “Power from the people”• Expertise contribution from the Norwegian State Housing Bank; Fukt og naturlig ventilasjon. Measurements in two dwelling units
• First combination of the technologies in Norway and globally • Relevant for housing development• Project owner and technology developer indicate a potential in further development locally, as well as nationally in Finnmark County• The active house concept combined with eco-society models have a considerable potential as sustainable local communities• Deliveries are planned in other construction projects and stages. Boligtun 2-5 in Hurdal is currently in the engineering phase
0 Operational • Building-integrated solar cells in roofing with natural cooling of the solar cells• Installation of measurement station for solar radiation, to measure efficiency
• Demonstration and showcase facility aimed at interested market players• Suitable for removing barriers for further implementation in the Norwegian market• Learning project to acquire experience and expertise• Verification of product properties
• First implementation in Norway and Scandinavia (previously implemented in Austria)
• Relevant for the building materials of the future, the market potential here is nearly unlimited (estimated 250 million m2 residential area in Norway)• Solar roofing can replace ordinary roofing on all types of roofs, which makes the project interesting in projects where roofing is being replaced• National potential for increased production from renewable energy• International potential for dissemination which could result in increased production of electricity from renewable energy, as well as reduced greenhouse gas emissions
0 Completed • Thermal covers to improve the indoor climate while also reducing energy use and power draw• Covers cast in place provide the possibility of increasing the capacity of energy storage through cast-in water pipes• For added energy, a combined heat pump/cooling machine to provide heating and cooling from outdoor air is used
• Testing and verification of thermal cover in a large-scale• Experience and documentation from the project will be used in future construction projects• Carried out lectures on concrete associations at Gløshaugen• A course in COWI AS is planned• Work on a technical article in several periodicals about the project and concept have started
• First implementation of TABS system in Norway, but has been used somewhat on the Continent
• The builder considers such a concept to be the solution of the future• Thermal covers are being used to an increasing extent in Europe• National potential for reduced energy consumption• The concept is under consideration in other places by Uponor• The results of Sluppenvegen 17bc can impact sales/the market’s interest in chosen solutions
0 Under development
• Interaction between all components and building parts, where energy efficiency is an important focus (e.g. needs-based ventilation solution with exchanger, adiabatic cooling for reduced cooling need, utilization of waste heat between the two building parts)
• Prototype project across industries with regard to exploiting joint operation of technical facilities• Meny will use the project as a reference for the Meny shop of the future• Sweco will open the building for showings, and is marketing the building nationally
• Interaction between these components has not been previously tested in Norway
• Relevant for the entire construction industry• National potential for increased energy efficiency, and increased utilization of renewable energy• International potential for dissemination which could increase energy efficiency, increased utilization of renewable energy sources and reduce greenhouse gas emissions
0 Under commissioning
• Passive house level supported by Enova• Combination and coordination of technical solutions, such as building-integrated solar cells, aerogel panels and light management, LED lighting indoors and outdoors• Maximum utilization of waste heat from refrigeration plant and wells/heat pump for heating from hydronic systems. Heat pump/well also used for cooling and for lower energy consumption by the refrigeration plant
• Relevant universities/colleges will be contacted in 2016 with an offer to use metering data for analyses• The building has a considerable number of measurements that will be used for analyses to gain experience with coordinating the technical solutions
• Kiwi Auli has been a source of inspiration for new projects in NorgesGruppen (under realization and planning), and has helped elevate the level of ambition for the new projects• Continuing certain technologies with both the same and new suppliers to test various producers and gain experience with other suppliers
• Kiwi has already started constructing a new environmental shop where parts of the technical solutions have been continued/ further developed. Additional shops are under consideration.• Kiwi is considering whether to incorporate several of the technical solutions in Kiwi’s technical standard, which could have consequences for both existing shops and new shop projects. In connection with redesign of Kiwi’s grocery shop, the environment was also assigned greater significance than before, and one of the concepts will continue some of the technologies from Kiwi Auli• International potential for spread which could increase energy efficiency and production, and reduce greenhouse gas emissions
0 Complete, move-in process
is ongoing
• Unique interaction between the best available passive measures in c ombination with optimized technical solutions and own production of energy (e.g. the orientation of the building, solar screening, solar cell system) ensure a delivered energy figure down to 16 kWh/m2
• The building was built according to the planned ambitions. If operation of the building is completed with the stated ambition, information about the project will be provided locally and nationally• The building’s results will be followed up, published and analysed• SINTEF ZEB has contributed to development of the pre-project and will contribute in the continuation with the contractors
• First implementation of the comprehensive interaction in Norway • If the energy goals are reached, the solutions could contribute premises for new building regulations• The project could be a template for other projects in the Norwegian Defence Estates Agency and others who are interested• International potential for spread which could increase energy efficiency and production, and reduce greenhouse gas emissions
0 Engineering • LED lighting in grocery shop and rental area• Comprehensive solutions in interaction through use of seawater collectors, recovery of waste heat from the grocery shop, as well as use of energy-efficient equipment
• The project has a considerable learning and demonstration potential for NorgesGruppen internally• Provides learning and expertise to advisers and executors• Prototype project for how renters can contribute in the most energy-efficient building possible• The project will be open to tours• Learning arenas for sharing of information and expertise are planned
• Known technologies, but the comprehensive solution is very newsworthy• First implementation of such a comprehensive solution in Norway
• Major national grocery retail players are involved, as well as advisers who work nationally• Such a comprehensive concept will be of great value for future solutions• National potential that could improve energy efficiency• International potential for spread which could result in reduced energy use, as well as reduced greenhouse gas emissions
PROJECT’SCLIMATERESULT
INNORWAY(kgCO
2equiv/year)
PROJECTSTATUS
INNOVATION EXPERTISEDEVELOPMENT REALIZEDDISSEMINATIONOFTECHNOLOGY FURTHERDEVELOPMENTANDDISSEMINATION
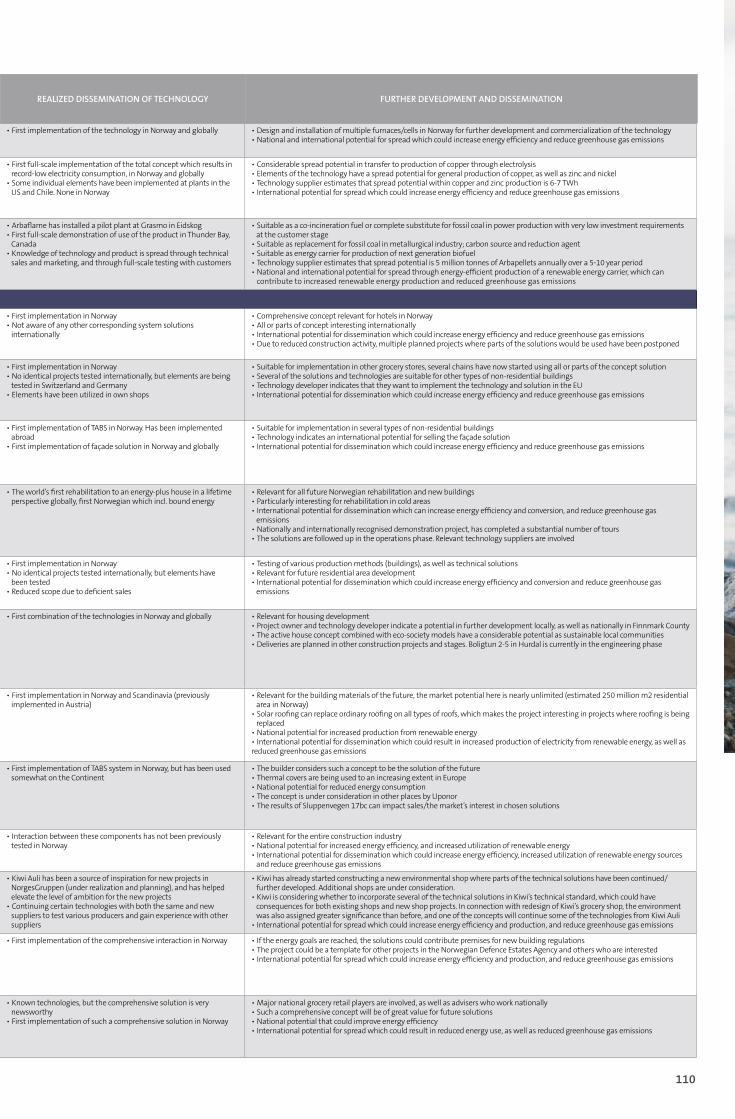
110
5 260 000Reduced process
Under establishment
• Advanced smelting technology for primary aluminium production with
lower energy consumption and lower direct CO2 emissions
• Expertise development at Alcoa Norge for demonstration, operation and verification of advanced smelting technology• New technology requires “high-expertise jobs” in Norway
• First implementation of the technology in Norway and globally • Design and installation of multiple furnaces/cells in Norway for further development and commercialization of the technology• National and international potential for spread which could increase energy efficiency and reduce greenhouse gas emissions
0 Under establishment
• Permanent cathodes in Duplex steel with microstructure surface• Low-energy dimension-stable anodes (DSA) with defined nano structure• New measurement principles and monitoring system that results in improved process control and possibility for automatization• Set new industry standard with regard to working environment, emissions and safety
• Demonstration facility• Expertise elevation at Nikkelverket and among the involved technology suppliers• Participation in the SUPREME research project with other smelting plant industry and research environments• Communication through the Eyde network• Presentation of the technology in industry networks and international conferences• Cooperation with NTNU, Teknova and international expertise companies
• First full-scale implementation of the total concept which results in record-low electricity consumption, in Norway and globally• Some individual elements have been implemented at plants in the US and Chile. None in Norway
• Considerable spread potential in transfer to production of copper through electrolysis• Elements of the technology have a spread potential for general production of copper, as well as zinc and nickel• Technology supplier estimates that spread potential within copper and zinc production is 6-7 TWh• International potential for spread which could increase energy efficiency and reduce greenhouse gas emissions
0 Under establishment
• One-stage energy-efficient production of quality raw material from round timber• Thermal integration and heat exchange in pellet production• Heat recovery from process condensate with high organic content• Integrated process for production and use of biogas• Scale-up of production capacity/plant size
• Market and customer expertise is developed through marketing and testing activities• Lectures and posters at energy and industry conferences• Cooperation with NGOs
• Arbaflame has installed a pilot plant at Grasmo in Eidskog• First full-scale demonstration of use of the product in Thunder Bay, Canada• Knowledge of technology and product is spread through technical sales and marketing, and through full-scale testing with customers
• Suitable as a co-incineration fuel or complete substitute for fossil coal in power production with very low investment requirements at the customer stage• Suitable as replacement for fossil coal in metallurgical industry; carbon source and reduction agent• Suitable as energy carrier for production of next generation biofuel• Technology supplier estimates that spread potential is 5 million tonnes of Arbapellets annually over a 5-10 year period• National and international potential for spread through energy-efficient production of a renewable energy carrier, which can contribute to increased renewable energy production and reduced greenhouse gas emissions
0 Operational • Sum of many measures focusing on needs based management and regulation, goal is 50 kWh/m2• Decentralized ventilation systems, two on each floor• Solar collectors with accumulation• Energy recovery from lift
• Demonstration building• Reference project for the hotel industry• Information dissemination through presentations in industry networks and at conferences
• First implementation in Norway• Not aware of any other corresponding system solutions internationally
• Comprehensive concept relevant for hotels in Norway• All or parts of concept interesting internationally• International potential for dissemination which could increase energy efficiency and reduce greenhouse gas emissions• Due to reduced construction activity, multiple planned projects where parts of the solutions would be used have been postponed
0 Operational • Waste heat utilization from cooling to heat floors, ventilation. Stored in accumulator tanks• Ventilation solutions with bypass. Reduced fan energy• Very advanced integrated SD facility• Nanomaterial in translucent façade connected together with light management (façade solution)
• Measurements after commissioning show a 30% reduction • Spin-off from the CREATIV research project• Master and doctorate at the Norwegian University of Science and Technology (NTNU), to continue internationally in EU project• Carried out publications nationally and internationally• Continuation of the work with Snøhetta and development of the Technical Function Description
• First implementation in Norway• No identical projects tested internationally, but elements are being tested in Switzerland and Germany• Elements have been utilized in own shops
• Suitable for implementation in other grocery stores, several chains have now started using all or parts of the concept solution• Several of the solutions and technologies are suitable for other types of non-residential buildings• Technology developer indicates that they want to implement the technology and solution in the EU• International potential for dissemination which could increase energy efficiency and reduce greenhouse gas emissions
0 Under development
• Newly developed transparent façade with increased exposure to daylight• Reduced cooling need due to TABS (concrete core activated cooling)
• Groundwork has started• Participating parties are building expertise• New Oslo Public Library is part of a training programme for young employees in Multiconsult• The project is being published on Kultur- og idrettsbygg’s website (kulturbyggene.no) and FutureBuilt’s website
• First implementation of TABS in Norway. Has been implemented abroad• First implementation of façade solution in Norway and globally
• Suitable for implementation in several types of non-residential buildings• Technology indicates an international potential for selling the façade solution• International potential for dissemination which could increase energy efficiency and reduce greenhouse gas emissions
0 Operational • Low energy use for construction, reuse of materials, better insulation and airtightness than passive house level, innovative façade solutions• State of the art lighting and management system• Energy-efficient hybrid ventilation system• Energy production covers energy for operation and construction (solar cells, heat pump and waste heat utilization)
• Demonstration building and flagship building• Spin-off from the Powerhouse Alliance and ZEB• Important expertise development for all players, advisers, producers, suppliers• Masters and doctorates at the Norwegian University of Science and Technology (NTNU) associated with the project• Several presentations at courses and conferences; the ZEB conference, Enova conference, VVS-dagene, etc.• Established extensive network of technology suppliers to develop better solutions for energy-plus buildings
• The world’s first rehabilitation to an energy-plus house in a lifetime perspective globally, first Norwegian which incl. bound energy
• Relevant for all future Norwegian rehabilitation and new buildings• Particularly interesting for rehabilitation in cold areas• International potential for dissemination which can increase energy efficiency and conversion, and reduce greenhouse gas emissions• Nationally and internationally recognised demonstration project, has completed a substantial number of tours• The solutions are followed up in the operations phase. Relevant technology suppliers are involved
0 Under development
• 100% renewable energy supply, solar collectors, heat pump, energy well, heat storage, solar cells• App for controlling own energy use• Development of the Plus customer programme• Hot fill dishwasher and washing machine
• Demonstration area• Connected to R&D EBLE, pilot in ZEB, planned solar irradiation measurement Teknova/Sintef, grid connection cooperation with Agder Energi, sustainable buildings (Agder Wood)• Master at the University of Agder (UiA)
• First implementation in Norway• No identical projects tested internationally, but elements have been tested• Reduced scope due to deficient sales
• Testing of various production methods (buildings), as well as technical solutions• Relevant for future residential area development• International potential for dissemination which could increase energy efficiency and conversion and reduce greenhouse gas emissions
0 Commissioning • Zensehome advanced management and regulation system for ventilation and heating via a pipeline grid• Dwelling units equipped with several technical elements in a unique combination• Satisfies passive house energy level without balanced ventilation
• Reference project with an entire neighbourhood will make it possible to conduct comparative studies. Zensehome provides the opportunity for collecting detailed knowledge regarding energy use, usage pattern, etc.• Master’s theses at NTNU and University of Southern Denmark related to the project• Master’s thesis at NMBU; “fukt og naturlig ventilasjon (Spring 2016)• Research project: “Power from the people”• Expertise contribution from the Norwegian State Housing Bank; Fukt og naturlig ventilasjon. Measurements in two dwelling units
• First combination of the technologies in Norway and globally • Relevant for housing development• Project owner and technology developer indicate a potential in further development locally, as well as nationally in Finnmark County• The active house concept combined with eco-society models have a considerable potential as sustainable local communities• Deliveries are planned in other construction projects and stages. Boligtun 2-5 in Hurdal is currently in the engineering phase
0 Operational • Building-integrated solar cells in roofing with natural cooling of the solar cells• Installation of measurement station for solar radiation, to measure efficiency
• Demonstration and showcase facility aimed at interested market players• Suitable for removing barriers for further implementation in the Norwegian market• Learning project to acquire experience and expertise• Verification of product properties
• First implementation in Norway and Scandinavia (previously implemented in Austria)
• Relevant for the building materials of the future, the market potential here is nearly unlimited (estimated 250 million m2 residential area in Norway)• Solar roofing can replace ordinary roofing on all types of roofs, which makes the project interesting in projects where roofing is being replaced• National potential for increased production from renewable energy• International potential for dissemination which could result in increased production of electricity from renewable energy, as well as reduced greenhouse gas emissions
0 Completed • Thermal covers to improve the indoor climate while also reducing energy use and power draw• Covers cast in place provide the possibility of increasing the capacity of energy storage through cast-in water pipes• For added energy, a combined heat pump/cooling machine to provide heating and cooling from outdoor air is used
• Testing and verification of thermal cover in a large-scale• Experience and documentation from the project will be used in future construction projects• Carried out lectures on concrete associations at Gløshaugen• A course in COWI AS is planned• Work on a technical article in several periodicals about the project and concept have started
• First implementation of TABS system in Norway, but has been used somewhat on the Continent
• The builder considers such a concept to be the solution of the future• Thermal covers are being used to an increasing extent in Europe• National potential for reduced energy consumption• The concept is under consideration in other places by Uponor• The results of Sluppenvegen 17bc can impact sales/the market’s interest in chosen solutions
0 Under development
• Interaction between all components and building parts, where energy efficiency is an important focus (e.g. needs-based ventilation solution with exchanger, adiabatic cooling for reduced cooling need, utilization of waste heat between the two building parts)
• Prototype project across industries with regard to exploiting joint operation of technical facilities• Meny will use the project as a reference for the Meny shop of the future• Sweco will open the building for showings, and is marketing the building nationally
• Interaction between these components has not been previously tested in Norway
• Relevant for the entire construction industry• National potential for increased energy efficiency, and increased utilization of renewable energy• International potential for dissemination which could increase energy efficiency, increased utilization of renewable energy sources and reduce greenhouse gas emissions
0 Under commissioning
• Passive house level supported by Enova• Combination and coordination of technical solutions, such as building-integrated solar cells, aerogel panels and light management, LED lighting indoors and outdoors• Maximum utilization of waste heat from refrigeration plant and wells/heat pump for heating from hydronic systems. Heat pump/well also used for cooling and for lower energy consumption by the refrigeration plant
• Relevant universities/colleges will be contacted in 2016 with an offer to use metering data for analyses• The building has a considerable number of measurements that will be used for analyses to gain experience with coordinating the technical solutions
• Kiwi Auli has been a source of inspiration for new projects in NorgesGruppen (under realization and planning), and has helped elevate the level of ambition for the new projects• Continuing certain technologies with both the same and new suppliers to test various producers and gain experience with other suppliers
• Kiwi has already started constructing a new environmental shop where parts of the technical solutions have been continued/ further developed. Additional shops are under consideration.• Kiwi is considering whether to incorporate several of the technical solutions in Kiwi’s technical standard, which could have consequences for both existing shops and new shop projects. In connection with redesign of Kiwi’s grocery shop, the environment was also assigned greater significance than before, and one of the concepts will continue some of the technologies from Kiwi Auli• International potential for spread which could increase energy efficiency and production, and reduce greenhouse gas emissions
0 Complete, move-in process
is ongoing
• Unique interaction between the best available passive measures in c ombination with optimized technical solutions and own production of energy (e.g. the orientation of the building, solar screening, solar cell system) ensure a delivered energy figure down to 16 kWh/m2
• The building was built according to the planned ambitions. If operation of the building is completed with the stated ambition, information about the project will be provided locally and nationally• The building’s results will be followed up, published and analysed• SINTEF ZEB has contributed to development of the pre-project and will contribute in the continuation with the contractors
• First implementation of the comprehensive interaction in Norway • If the energy goals are reached, the solutions could contribute premises for new building regulations• The project could be a template for other projects in the Norwegian Defence Estates Agency and others who are interested• International potential for spread which could increase energy efficiency and production, and reduce greenhouse gas emissions
0 Engineering • LED lighting in grocery shop and rental area• Comprehensive solutions in interaction through use of seawater collectors, recovery of waste heat from the grocery shop, as well as use of energy-efficient equipment
• The project has a considerable learning and demonstration potential for NorgesGruppen internally• Provides learning and expertise to advisers and executors• Prototype project for how renters can contribute in the most energy-efficient building possible• The project will be open to tours• Learning arenas for sharing of information and expertise are planned
• Known technologies, but the comprehensive solution is very newsworthy• First implementation of such a comprehensive solution in Norway
• Major national grocery retail players are involved, as well as advisers who work nationally• Such a comprehensive concept will be of great value for future solutions• National potential that could improve energy efficiency• International potential for spread which could result in reduced energy use, as well as reduced greenhouse gas emissions
PROJECT’SCLIMATERESULT
INNORWAY(kgCO
2equiv/year)
PROJECTSTATUS
INNOVATION EXPERTISEDEVELOPMENT REALIZEDDISSEMINATIONOFTECHNOLOGY FURTHERDEVELOPMENTANDDISSEMINATION
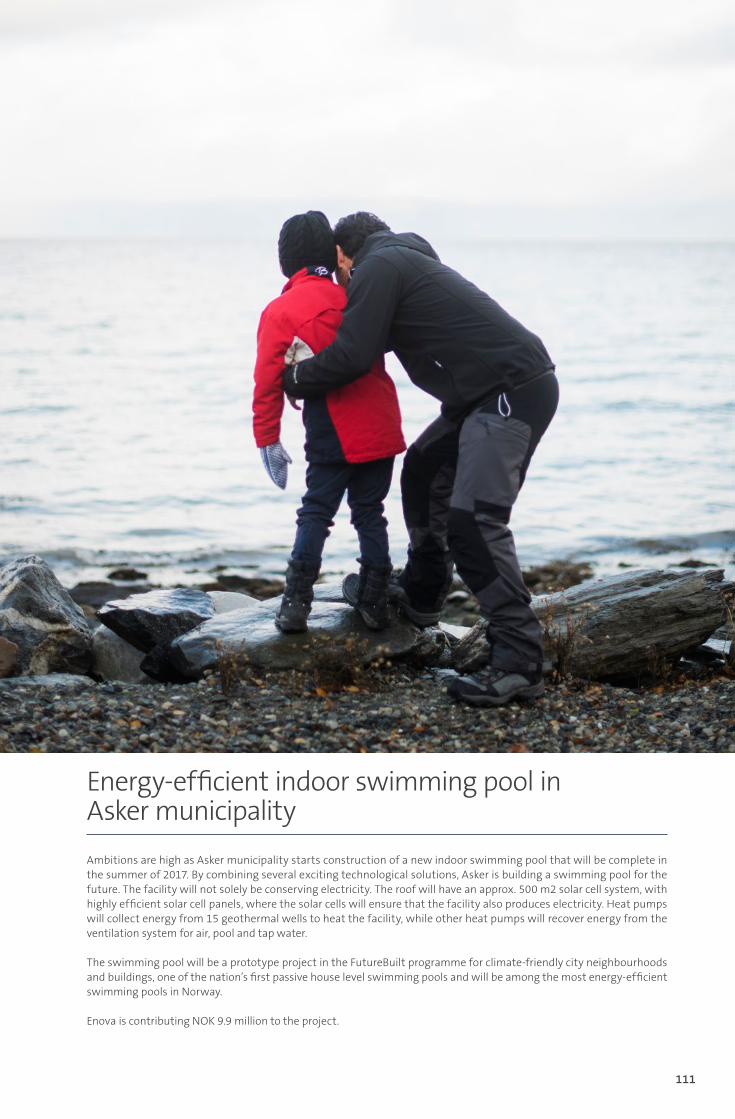
111
Ambitions are high as Asker municipality starts construction of a new indoor swimming pool that will be complete in the summer of 2017. By combining several exciting technological solutions, Asker is building a swimming pool for the future. The facility will not solely be conserving electricity. The roof will have an approx. 500 m2 solar cell system, with highly efficient solar cell panels, where the solar cells will ensure that the facility also produces electricity. Heat pumps will collect energy from 15 geothermal wells to heat the facility, while other heat pumps will recover energy from the ventilation system for air, pool and tap water.
The swimming pool will be a prototype project in the FutureBuilt programme for climate-friendly city neighbourhoods and buildings, one of the nation’s first passive house level swimming pools and will be among the most energy-efficient swimming pools in Norway.
Enova is contributing NOK 9.9 million to the project.
Energy-efficient indoor swimming pool in Asker municipality
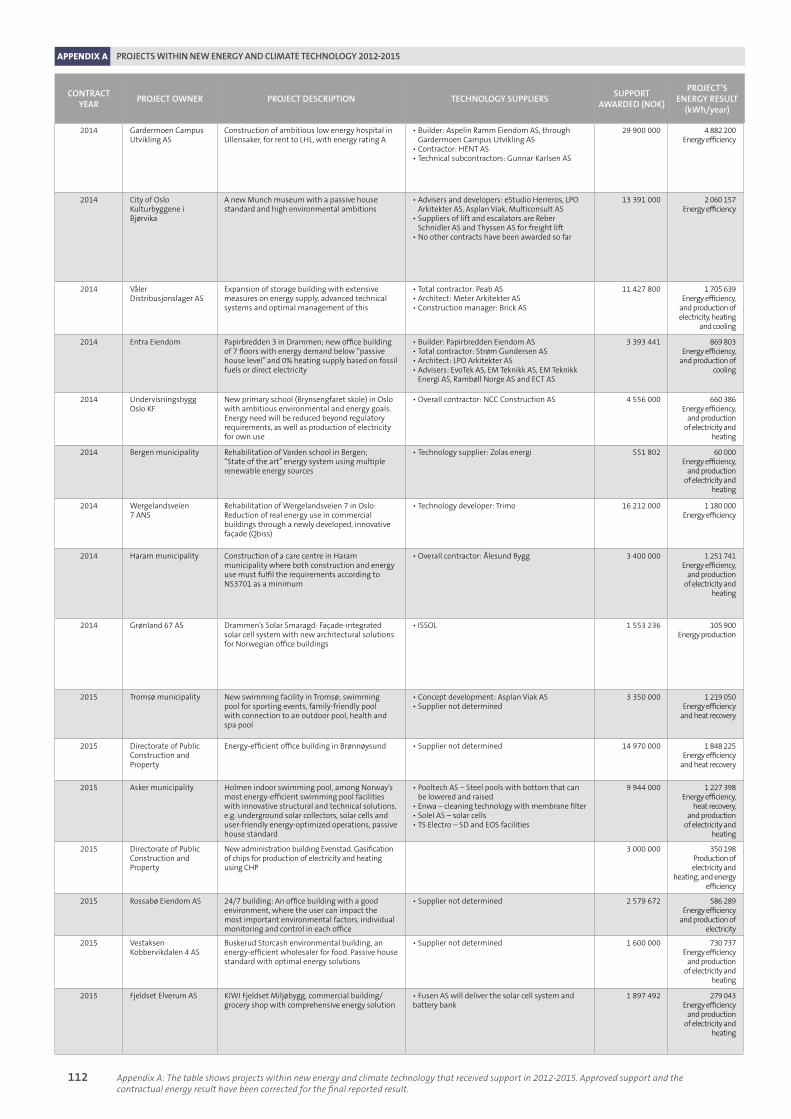
Appendix A: The table shows projects within new energy and climate technology that received support in 2012-2015. Approved support and the contractual energy result have been corrected for the final reported result.
APPENDIX A PROJECTS WITHIN NEW ENERGY AND CLIMATE TECHNOLOGY 2012-2015
112
CONTRACTYEAR
PROJECTOWNER PROJECTDESCRIPTION TECHNOLOGYSUPPLIERSSUPPORT
AWARDED(NOK)
PROJECT’SENERGYRESULT
(kWh/year)
2014 Gardermoen Campus Utvikling AS
Construction of ambitious low energy hospital in Ullensaker, for rent to LHL, with energy rating A
• Builder: Aspelin Ramm Eiendom AS, through Gardermoen Campus Utvikling AS• Contractor: HENT AS• Technical subcontractors: Gunnar Karlsen AS
29 900 000 4 882 200Energy efficiency
2014 City of Oslo Kulturbyggene i Bjørvika
A new Munch museum with a passive house standard and high environmental ambitions
• Advisers and developers: eStudio Herreros, LPO Arkitekter AS, Asplan Viak, Multiconsult AS• Suppliers of lift and escalators are Reber Schnidler AS and Thyssen AS for freight lift• No other contracts have been awarded so far
13 391 000 2 060 157Energy efficiency
2014 Våler Distribusjonslager AS
Expansion of storage building with extensive measures on energy supply, advanced technical systems and optimal management of this
• Total contractor: Peab AS• Architect: Meter Arkitekter AS• Construction manager: Brick AS
11 427 800 1 705 639Energy efficiency,
and production of electricity, heating
and cooling
2014 Entra Eiendom Papirbredden 3 in Drammen; new office building of 7 floors with energy demand below “passive house level” and 0% heating supply based on fossil fuels or direct electricity
• Builder: Papirbredden Eiendom AS• Total contractor: Strøm Gundersen AS• Architect: LPO Arkitekter AS• Advisers: EvoTek AS, EM Teknikk AS, EM Teknikk Energi AS, Rambøll Norge AS and ECT AS
3 393 441 869 803Energy efficiency,
and production of cooling
2014 Undervisningsbygg Oslo KF
New primary school (Brynsengfaret skole) in Oslo with ambitious environmental and energy goals. Energy need will be reduced beyond regulatory requirements, as well as production of electricity for own use
• Overall contractor: NCC Construction AS 4 556 000 660 386Energy efficiency,
and production of electricity and
heating
2014 Bergen municipality Rehabilitation of Varden school in Bergen; “State of the art” energy system using multiple renewable energy sources
• Technology supplier: Zolas energi 551 802 60 000Energy efficiency,
and production of electricity and
heating
2014 Wergelandsveien 7 ANS
Rehabilitation of Wergelandsveien 7 in Oslo: Reduction of real energy use in commercial buildings through a newly developed, innovative façade (Qbiss)
• Technology developer: Trimo 16 212 000 1 180 000Energy efficiency
2014 Haram municipality Construction of a care centre in Haram municipality where both construction and energy use must fulfil the requirements according to NS3701 as a minimum
• Overall contractor: Ålesund Bygg 3 400 000 1 251 741Energy efficiency,
and production of electricity and
heating
2014 Grønland 67 AS Drammen’s Solar Smaragd: Façade-integrated solar cell system with new architectural solutions for Norwegian office buildings
• ISSOL 1 553 236 105 900Energy production
2015 Tromsø municipality New swimming facility in Tromsø; swimming pool for sporting events, family-friendly pool with connection to an outdoor pool, health and spa pool
• Concept development: Asplan Viak AS• Supplier not determined
3 350 000 1 219 050Energy efficiency
and heat recovery
2015 Directorate of Public Construction and Property
Energy-efficient office building in Brønnøysund • Supplier not determined 14 970 000 1 848 225Energy efficiency
and heat recovery
2015 Asker municipality Holmen indoor swimming pool, among Norway’s most energy-efficient swimming pool facilities with innovative structural and technical solutions, e.g. underground solar collectors, solar cells and user-friendly energy-optimized operations, passive house standard
• Pooltech AS – Steel pools with bottom that can be lowered and raised• Enwa – cleaning technology with membrane filter• Solel AS – solar cells• TS Electro – SD and EOS facilities
9 944 000 1 227 398Energy efficiency,
heat recovery, and production
of electricity and heating
2015 Directorate of Public Construction and Property
New administration building Evenstad. Gasification of chips for production of electricity and heating using CHP
3 000 000 350 198Production of electricity and
heating, and energy efficiency
2015 Rossabø Eiendom AS 24/7 building: An office building with a good environment, where the user can impact the most important environmental factors, individual monitoring and control in each office
• Supplier not determined 2 579 672 586 289Energy efficiency
and production of electricity
2015 Vestaksen Kobbervikdalen 4 AS
Buskerud Storcash environmental building, an energy-efficient wholesaler for food. Passive house standard with optimal energy solutions
• Supplier not determined 1 600 000 730 737Energy efficiency
and production of electricity and
heating
2015 Fjeldset Elverum AS KIWI Fjeldset Miljøbygg, commercial building/ grocery shop with comprehensive energy solution
• Fusen AS will deliver the solar cell system and battery bank
1 897 492 279 043Energy efficiency
and production of electricity and
heating
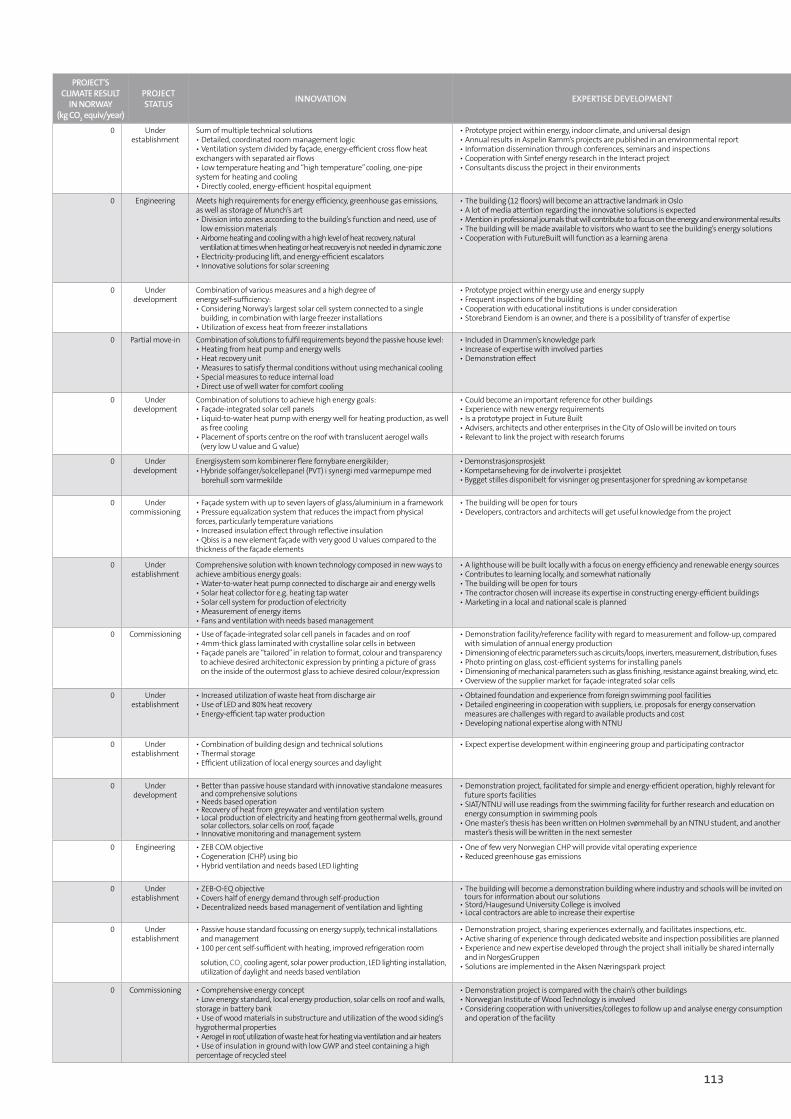
113
0 Under establishment
Sum of multiple technical solutions • Detailed, coordinated room management logic• Ventilation system divided by façade, energy-efficient cross flow heat exchangers with separated air flows• Low temperature heating and “high temperature” cooling, one-pipe system for heating and cooling• Directly cooled, energy-efficient hospital equipment
• Prototype project within energy, indoor climate, and universal design• Annual results in Aspelin Ramm’s projects are published in an environmental report• Information dissemination through conferences, seminars and inspections• Cooperation with Sintef energy research in the Interact project• Consultants discuss the project in their environments
• Solutions are unknown in connection with construction of a hospital in Norway and globally
• Relevant for the industry, but interest beyond this industry is also assumed• The project will have significant media coverage regarding detailed engineering, recruitment of other renters and during the development phase• International potential for spread that could increase energy efficiency and production, and reduce greenhouse gases
0 Engineering Meets high requirements for energy efficiency, greenhouse gas emissions, as well as storage of Munch’s art• Division into zones according to the building’s function and need, use of low emission materials• Airborne heating and cooling with a high level of heat recovery, natural ventilation at times when heating or heat recovery is not needed in dynamic zone• Electricity-producing lift, and energy-efficient escalators• Innovative solutions for solar screening
• The building (12 floors) will become an attractive landmark in Oslo• A lot of media attention regarding the innovative solutions is expected• Mention in professional journals that will contribute to a focus on the energy and environmental results• The building will be made available to visitors who want to see the building’s energy solutions• Cooperation with FutureBuilt will function as a learning arena
• Parts of the solution have previously been tested• First implementation of the solutions within the category Kulturbygg
• Cooperation with FutureBuilt can function as a dissemination arena nationally and internationally• National potential for energy efficiency• International potential for spread which could result in energy efficiency and reduced greenhouse gas emissions
0 Under development
Combination of various measures and a high degree of energy self-sufficiency:• Considering Norway’s largest solar cell system connected to a single building, in combination with large freezer installations• Utilization of excess heat from freezer installations
• Prototype project within energy use and energy supply• Frequent inspections of the building• Cooperation with educational institutions is under consideration• Storebrand Eiendom is an owner, and there is a possibility of transfer of expertise
• First implementation of the solution in a warehouse in Norway • Demonstrasjonseffekt gjennom de involverte aktørene • Potensiale nasjonalt for energieffektivisering, og økt utnyttelse av fornybar energi
0 Partial move-in Combination of solutions to fulfil requirements beyond the passive house level:• Heating from heat pump and energy wells• Heat recovery unit• Measures to satisfy thermal conditions without using mechanical cooling• Special measures to reduce internal load• Direct use of well water for comfort cooling
• Included in Drammen’s knowledge park• Increase of expertise with involved parties• Demonstration effect
• First implementation of an office building with this combination of technical solutions in Norway
• Experience from the project could be continued as general knowledge in the long term• Helps develop the Drammen area as an expertise and innovation area• National potential for energy efficiency• International potential for spread which could result in energy efficiency and reduced greenhouse gas emissions
0 Under development
Combination of solutions to achieve high energy goals:• Façade-integrated solar cell panels• Liquid-to-water heat pump with energy well for heating production, as well as free cooling• Placement of sports centre on the roof with translucent aerogel walls (very low U value and G value)
• Could become an important reference for other buildings• Experience with new energy requirements• Is a prototype project in Future Built• Advisers, architects and other enterprises in the City of Oslo will be invited on tours• Relevant to link the project with research forums
• First implementation of a school with façade-integrated solar cells • Solution is considered to have a major potential for spread/ripple effects• National potential for energy efficiency and increased production from renewable energy• International potential for spread which could result in energy efficiency, increased utilization of renewable energy and reduced greenhouse gas emissions
0 Under development
Energisystem som kombinerer flere fornybare energikilder; • Hybride solfanger/solcellepanel (PVT) i synergi med varmepumpe med borehull som varmekilde
• Demonstrasjonsprosjekt • Kompetanseheving for de involverte i prosjektet • Bygget stilles disponibelt for visninger og presentasjoner for spredning av kompetanse
• First implementation of the technology in Norway, there are fully developed products from e.g. Sweden, the Netherlands and Germany
• Considered to have major ripple effects• Relevant for large buildings where a compromise between the available area and desired energy production is necessary• National potential for energy efficiency and increased production from renewable energy• International potential for spread which could increase energy efficiency, particularly in southern areas with considerable sunlight
0 Under commissioning
• Façade system with up to seven layers of glass/aluminium in a framework• Pressure equalization system that reduces the impact from physical forces, particularly temperature variations• Increased insulation effect through reflective insulation• Qbiss is a new element façade with very good U values compared to the thickness of the façade elements
• The building will be open for tours• Developers, contractors and architects will get useful knowledge from the project
• First implementation in Norway. The solution with façade-integrated solar cells with printing to achieve the desired impression has not previously been used in Norway or elsewhere before this project• Press coverage from multiple media, and the building has been visited by numerous interested parties
• National potential• Project owner describes potential for using solar cell panels as façade panelling in all new and existing buildings• International potential for spread in corresponding climate zones, which could increase energy efficiency and production, and reduce greenhouse gas emissions
0 Under establishment
Comprehensive solution with known technology composed in new ways to achieve ambitious energy goals:• Water-to-water heat pump connected to discharge air and energy wells• Solar heat collector for e.g. heating tap water• Solar cell system for production of electricity• Measurement of energy items• Fans and ventilation with needs based management
• A lighthouse will be built locally with a focus on energy efficiency and renewable energy sources• Contributes to learning locally, and somewhat nationally• The building will be open for tours• The contractor chosen will increase its expertise in constructing energy-efficient buildings• Marketing in a local and national scale is planned
• No care facilities in Norway with corresponding energy ambitions • National potential for spread which could result in energy efficiency• International potential for spread which could result in energy efficiency and reduced greenhouse gas emissions• Major interest among local contractors
0 Commissioning • Use of façade-integrated solar cell panels in facades and on roof• 4mm-thick glass laminated with crystalline solar cells in between• Façade panels are “tailored” in relation to format, colour and transparency to achieve desired architectonic expression by printing a picture of grass on the inside of the outermost glass to achieve desired colour/expression
• Demonstration facility/reference facility with regard to measurement and follow-up, compared with simulation of annual energy production• Dimensioning of electric parameters such as circuits/loops, inverters, measurement, distribution, fuses• Photo printing on glass, cost-efficient systems for installing panels• Dimensioning of mechanical parameters such as glass finishing, resistance against breaking, wind, etc.• Overview of the supplier market for façade-integrated solar cells
• First implementation in Norway. The solution with façade-integrated solar cells with printing to achieve the desired impression has not previously been used in Norway or elsewhere before this project• Press coverage from multiple media, and the building has been visited by numerous interested parties
• National potential• Project owner describes potential for using solar cell panels as façade panelling in all new and existing buildings• International potential for spread in corresponding climate zones, which could increase energy efficiency and production, and reduce greenhouse gas emissions
0 Under establishment
• Increased utilization of waste heat from discharge air• Use of LED and 80% heat recovery• Energy-efficient tap water production
• Obtained foundation and experience from foreign swimming pool facilities• Detailed engineering in cooperation with suppliers, i.e. proposals for energy conservation measures are challenges with regard to available products and cost• Developing national expertise along with NTNU
• One of the first facilities in Norway with a comprehensive energy concept
• The technology is transferable to corresponding facilities
0 Under establishment
• Combination of building design and technical solutions• Thermal storage• Efficient utilization of local energy sources and daylight
• Expect expertise development within engineering group and participating contractor • One of few facilities in Northern Norway • The technology is transferable to corresponding building types in the same climate
0 Under development
• Better than passive house standard with innovative standalone measures and comprehensive solutions• Needs based operation• Recovery of heat from greywater and ventilation system• Local production of electricity and heating from geothermal wells, ground solar collectors, solar cells on roof, façade• Innovative monitoring and management system
• Demonstration project, facilitated for simple and energy-efficient operation, highly relevant for future sports facilities• SIAT/NTNU will use readings from the swimming facility for further research and education on energy consumption in swimming pools• One master’s thesis has been written on Holmen svømmehall by an NTNU student, and another master’s thesis will be written in the next semester
• Either the first or second implementation of several of the individual measures in Norway
• Major national potential, reference for indoor swimming pools in Norway, innovative structural and technical energy solutions that will yield savings of several million kroner a year• Potential for corresponding buildings in corresponding climates
0 Engineering • ZEB COM objective• Cogeneration (CHP) using bio• Hybrid ventilation and needs based LED lighting
• One of few very Norwegian CHP will provide vital operating experience• Reduced greenhouse gas emissions
• One of the first facilities in Norway • National potential• Depending on price, this could become interesting technology in locations with substantial forestry
0 Under establishment
• ZEB-O-EQ objective• Covers half of energy demand through self-production• Decentralized needs based management of ventilation and lighting
• The building will become a demonstration building where industry and schools will be invited on tours for information about our solutions• Stord/Haugesund University College is involved• Local contractors are able to increase their expertise
• One of the first facilities in Norway, the first in Western Norway • Local potential
0 Under establishment
• Passive house standard focussing on energy supply, technical installations and management• 100 per cent self-sufficient with heating, improved refrigeration room
solution, CO2 cooling agent, solar power production, LED lighting installation,
utilization of daylight and needs based ventilation
• Demonstration project, sharing experiences externally, and facilitates inspections, etc. • Active sharing of experience through dedicated website and inspection possibilities are planned• Experience and new expertise developed through the project shall initially be shared internally and in NorgesGruppen• Solutions are implemented in the Aksen Næringspark project
• One of the first facilities in Norway • National potential
0 Commissioning • Comprehensive energy concept• Low energy standard, local energy production, solar cells on roof and walls, storage in battery bank• Use of wood materials in substructure and utilization of the wood siding’s hygrothermal properties• Aerogel in roof, utilization of waste heat for heating via ventilation and air heaters• Use of insulation in ground with low GWP and steel containing a high percentage of recycled steel
• Demonstration project is compared with the chain’s other buildings• Norwegian Institute of Wood Technology is involved• Considering cooperation with universities/colleges to follow up and analyse energy consumption and operation of the facility
• Use of wood building materials and a battery bank have been considered for future projects in KIMI and NorgesGruppen
• National potential• Too early to determine further spread without gaining operating experience
PROJECT’SCLIMATERESULT
INNORWAY(kgCO
2equiv/year)
PROJECTSTATUS
INNOVATION EXPERTISEDEVELOPMENT REALIZEDDISSEMINATIONOFTECHNOLOGY FURTHERDEVELOPMENTANDDISSEMINATION

114
0 Under establishment
Sum of multiple technical solutions • Detailed, coordinated room management logic• Ventilation system divided by façade, energy-efficient cross flow heat exchangers with separated air flows• Low temperature heating and “high temperature” cooling, one-pipe system for heating and cooling• Directly cooled, energy-efficient hospital equipment
• Prototype project within energy, indoor climate, and universal design• Annual results in Aspelin Ramm’s projects are published in an environmental report• Information dissemination through conferences, seminars and inspections• Cooperation with Sintef energy research in the Interact project• Consultants discuss the project in their environments
• Solutions are unknown in connection with construction of a hospital in Norway and globally
• Relevant for the industry, but interest beyond this industry is also assumed• The project will have significant media coverage regarding detailed engineering, recruitment of other renters and during the development phase• International potential for spread that could increase energy efficiency and production, and reduce greenhouse gases
0 Engineering Meets high requirements for energy efficiency, greenhouse gas emissions, as well as storage of Munch’s art• Division into zones according to the building’s function and need, use of low emission materials• Airborne heating and cooling with a high level of heat recovery, natural ventilation at times when heating or heat recovery is not needed in dynamic zone• Electricity-producing lift, and energy-efficient escalators• Innovative solutions for solar screening
• The building (12 floors) will become an attractive landmark in Oslo• A lot of media attention regarding the innovative solutions is expected• Mention in professional journals that will contribute to a focus on the energy and environmental results• The building will be made available to visitors who want to see the building’s energy solutions• Cooperation with FutureBuilt will function as a learning arena
• Parts of the solution have previously been tested• First implementation of the solutions within the category Kulturbygg
• Cooperation with FutureBuilt can function as a dissemination arena nationally and internationally• National potential for energy efficiency• International potential for spread which could result in energy efficiency and reduced greenhouse gas emissions
0 Under development
Combination of various measures and a high degree of energy self-sufficiency:• Considering Norway’s largest solar cell system connected to a single building, in combination with large freezer installations• Utilization of excess heat from freezer installations
• Prototype project within energy use and energy supply• Frequent inspections of the building• Cooperation with educational institutions is under consideration• Storebrand Eiendom is an owner, and there is a possibility of transfer of expertise
• First implementation of the solution in a warehouse in Norway • Demonstrasjonseffekt gjennom de involverte aktørene • Potensiale nasjonalt for energieffektivisering, og økt utnyttelse av fornybar energi
0 Partial move-in Combination of solutions to fulfil requirements beyond the passive house level:• Heating from heat pump and energy wells• Heat recovery unit• Measures to satisfy thermal conditions without using mechanical cooling• Special measures to reduce internal load• Direct use of well water for comfort cooling
• Included in Drammen’s knowledge park• Increase of expertise with involved parties• Demonstration effect
• First implementation of an office building with this combination of technical solutions in Norway
• Experience from the project could be continued as general knowledge in the long term• Helps develop the Drammen area as an expertise and innovation area• National potential for energy efficiency• International potential for spread which could result in energy efficiency and reduced greenhouse gas emissions
0 Under development
Combination of solutions to achieve high energy goals:• Façade-integrated solar cell panels• Liquid-to-water heat pump with energy well for heating production, as well as free cooling• Placement of sports centre on the roof with translucent aerogel walls (very low U value and G value)
• Could become an important reference for other buildings• Experience with new energy requirements• Is a prototype project in Future Built• Advisers, architects and other enterprises in the City of Oslo will be invited on tours• Relevant to link the project with research forums
• First implementation of a school with façade-integrated solar cells • Solution is considered to have a major potential for spread/ripple effects• National potential for energy efficiency and increased production from renewable energy• International potential for spread which could result in energy efficiency, increased utilization of renewable energy and reduced greenhouse gas emissions
0 Under development
Energisystem som kombinerer flere fornybare energikilder; • Hybride solfanger/solcellepanel (PVT) i synergi med varmepumpe med borehull som varmekilde
• Demonstrasjonsprosjekt • Kompetanseheving for de involverte i prosjektet • Bygget stilles disponibelt for visninger og presentasjoner for spredning av kompetanse
• First implementation of the technology in Norway, there are fully developed products from e.g. Sweden, the Netherlands and Germany
• Considered to have major ripple effects• Relevant for large buildings where a compromise between the available area and desired energy production is necessary• National potential for energy efficiency and increased production from renewable energy• International potential for spread which could increase energy efficiency, particularly in southern areas with considerable sunlight
0 Under commissioning
• Façade system with up to seven layers of glass/aluminium in a framework• Pressure equalization system that reduces the impact from physical forces, particularly temperature variations• Increased insulation effect through reflective insulation• Qbiss is a new element façade with very good U values compared to the thickness of the façade elements
• The building will be open for tours• Developers, contractors and architects will get useful knowledge from the project
• First implementation in Norway. The solution with façade-integrated solar cells with printing to achieve the desired impression has not previously been used in Norway or elsewhere before this project• Press coverage from multiple media, and the building has been visited by numerous interested parties
• National potential• Project owner describes potential for using solar cell panels as façade panelling in all new and existing buildings• International potential for spread in corresponding climate zones, which could increase energy efficiency and production, and reduce greenhouse gas emissions
0 Under establishment
Comprehensive solution with known technology composed in new ways to achieve ambitious energy goals:• Water-to-water heat pump connected to discharge air and energy wells• Solar heat collector for e.g. heating tap water• Solar cell system for production of electricity• Measurement of energy items• Fans and ventilation with needs based management
• A lighthouse will be built locally with a focus on energy efficiency and renewable energy sources• Contributes to learning locally, and somewhat nationally• The building will be open for tours• The contractor chosen will increase its expertise in constructing energy-efficient buildings• Marketing in a local and national scale is planned
• No care facilities in Norway with corresponding energy ambitions • National potential for spread which could result in energy efficiency• International potential for spread which could result in energy efficiency and reduced greenhouse gas emissions• Major interest among local contractors
0 Commissioning • Use of façade-integrated solar cell panels in facades and on roof• 4mm-thick glass laminated with crystalline solar cells in between• Façade panels are “tailored” in relation to format, colour and transparency to achieve desired architectonic expression by printing a picture of grass on the inside of the outermost glass to achieve desired colour/expression
• Demonstration facility/reference facility with regard to measurement and follow-up, compared with simulation of annual energy production• Dimensioning of electric parameters such as circuits/loops, inverters, measurement, distribution, fuses• Photo printing on glass, cost-efficient systems for installing panels• Dimensioning of mechanical parameters such as glass finishing, resistance against breaking, wind, etc.• Overview of the supplier market for façade-integrated solar cells
• First implementation in Norway. The solution with façade-integrated solar cells with printing to achieve the desired impression has not previously been used in Norway or elsewhere before this project• Press coverage from multiple media, and the building has been visited by numerous interested parties
• National potential• Project owner describes potential for using solar cell panels as façade panelling in all new and existing buildings• International potential for spread in corresponding climate zones, which could increase energy efficiency and production, and reduce greenhouse gas emissions
0 Under establishment
• Increased utilization of waste heat from discharge air• Use of LED and 80% heat recovery• Energy-efficient tap water production
• Obtained foundation and experience from foreign swimming pool facilities• Detailed engineering in cooperation with suppliers, i.e. proposals for energy conservation measures are challenges with regard to available products and cost• Developing national expertise along with NTNU
• One of the first facilities in Norway with a comprehensive energy concept
• The technology is transferable to corresponding facilities
0 Under establishment
• Combination of building design and technical solutions• Thermal storage• Efficient utilization of local energy sources and daylight
• Expect expertise development within engineering group and participating contractor • One of few facilities in Northern Norway • The technology is transferable to corresponding building types in the same climate
0 Under development
• Better than passive house standard with innovative standalone measures and comprehensive solutions• Needs based operation• Recovery of heat from greywater and ventilation system• Local production of electricity and heating from geothermal wells, ground solar collectors, solar cells on roof, façade• Innovative monitoring and management system
• Demonstration project, facilitated for simple and energy-efficient operation, highly relevant for future sports facilities• SIAT/NTNU will use readings from the swimming facility for further research and education on energy consumption in swimming pools• One master’s thesis has been written on Holmen svømmehall by an NTNU student, and another master’s thesis will be written in the next semester
• Either the first or second implementation of several of the individual measures in Norway
• Major national potential, reference for indoor swimming pools in Norway, innovative structural and technical energy solutions that will yield savings of several million kroner a year• Potential for corresponding buildings in corresponding climates
0 Engineering • ZEB COM objective• Cogeneration (CHP) using bio• Hybrid ventilation and needs based LED lighting
• One of few very Norwegian CHP will provide vital operating experience• Reduced greenhouse gas emissions
• One of the first facilities in Norway • National potential• Depending on price, this could become interesting technology in locations with substantial forestry
0 Under establishment
• ZEB-O-EQ objective• Covers half of energy demand through self-production• Decentralized needs based management of ventilation and lighting
• The building will become a demonstration building where industry and schools will be invited on tours for information about our solutions• Stord/Haugesund University College is involved• Local contractors are able to increase their expertise
• One of the first facilities in Norway, the first in Western Norway • Local potential
0 Under establishment
• Passive house standard focussing on energy supply, technical installations and management• 100 per cent self-sufficient with heating, improved refrigeration room
solution, CO2 cooling agent, solar power production, LED lighting installation,
utilization of daylight and needs based ventilation
• Demonstration project, sharing experiences externally, and facilitates inspections, etc. • Active sharing of experience through dedicated website and inspection possibilities are planned• Experience and new expertise developed through the project shall initially be shared internally and in NorgesGruppen• Solutions are implemented in the Aksen Næringspark project
• One of the first facilities in Norway • National potential
0 Commissioning • Comprehensive energy concept• Low energy standard, local energy production, solar cells on roof and walls, storage in battery bank• Use of wood materials in substructure and utilization of the wood siding’s hygrothermal properties• Aerogel in roof, utilization of waste heat for heating via ventilation and air heaters• Use of insulation in ground with low GWP and steel containing a high percentage of recycled steel
• Demonstration project is compared with the chain’s other buildings• Norwegian Institute of Wood Technology is involved• Considering cooperation with universities/colleges to follow up and analyse energy consumption and operation of the facility
• Use of wood building materials and a battery bank have been considered for future projects in KIMI and NorgesGruppen
• National potential• Too early to determine further spread without gaining operating experience
PROJECT’SCLIMATERESULT
INNORWAY(kgCO
2equiv/year)
PROJECTSTATUS
INNOVATION EXPERTISEDEVELOPMENT REALIZEDDISSEMINATIONOFTECHNOLOGY FURTHERDEVELOPMENTANDDISSEMINATION
115
Lyse Elnett will receive NOK 15 million in investment support from Enova for a project that will build and test the power grid of the future. A total of 30 power grid stations in downtown Stavanger and Sandnes will be made fully automatic through use of new technology.
Smartgrid is the name used for power grids that are more “intelligent” through the use of instrumentation and communication technology. This is the first time the smartgrid technology has been tested on this scale in Norway.
Lyse’s goal and ambition is to achieve energy savings partially directly in the power grid, in part through reduced losses in the grid and indirectly through facilitating increased interaction with customers and application of new technology to manage electricity consumption. Another important goal is further increasing security of supply.
Millions awarded to the power grid of the future
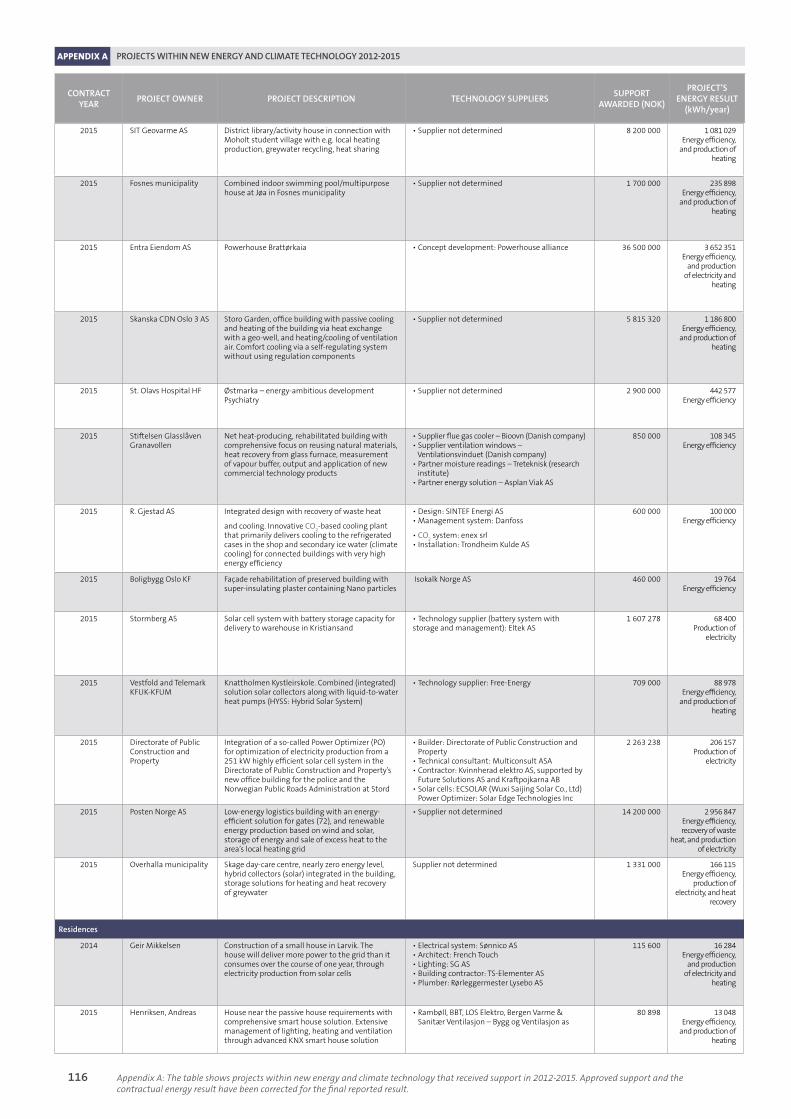
Appendix A: The table shows projects within new energy and climate technology that received support in 2012-2015. Approved support and the contractual energy result have been corrected for the final reported result.
APPENDIX A PROJECTS WITHIN NEW ENERGY AND CLIMATE TECHNOLOGY 2012-2015
116
CONTRACTYEAR
PROJECTOWNER PROJECTDESCRIPTION TECHNOLOGYSUPPLIERSSUPPORT
AWARDED(NOK)
PROJECT’SENERGYRESULT
(kWh/year)
2015 SIT Geovarme AS District library/activity house in connection with Moholt student village with e.g. local heating production, greywater recycling, heat sharing
• Supplier not determined 8 200 000 1 081 029Energy efficiency,
and production of heating
2015 Fosnes municipality Combined indoor swimming pool/multipurpose house at Jøa in Fosnes municipality
• Supplier not determined 1 700 000 235 898Energy efficiency,
and production of heating
2015 Entra Eiendom AS Powerhouse Brattørkaia • Concept development: Powerhouse alliance 36 500 000 3 652 351Energy efficiency,
and production of electricity and
heating
2015 Skanska CDN Oslo 3 AS Storo Garden, office building with passive cooling and heating of the building via heat exchange with a geo-well, and heating/cooling of ventilation air. Comfort cooling via a self-regulating system without using regulation components
• Supplier not determined 5 815 320 1 186 800Energy efficiency,
and production of heating
2015 St. Olavs Hospital HF Østmarka – energy-ambitious development Psychiatry
• Supplier not determined 2 900 000 442 577Energy efficiency
2015 Stiftelsen Glasslåven Granavollen
Net heat-producing, rehabilitated building with comprehensive focus on reusing natural materials, heat recovery from glass furnace, measurement of vapour buffer, output and application of new commercial technology products
• Supplier flue gas cooler – Bioovn (Danish company)• Supplier ventilation windows – Ventilationsvinduet (Danish company)• Partner moisture readings – Treteknisk (research institute)• Partner energy solution – Asplan Viak AS
850 000 108 345Energy efficiency
2015 R. Gjestad AS Integrated design with recovery of waste heat
and cooling. Innovative CO2-based cooling plant
that primarily delivers cooling to the refrigerated cases in the shop and secondary ice water (climate cooling) for connected buildings with very high energy efficiency
• Design: SINTEF Energi AS• Management system: Danfoss
• CO2 system: enex srl
• Installation: Trondheim Kulde AS
600 000 100 000Energy efficiency
2015 Boligbygg Oslo KF Façade rehabilitation of preserved building with super-insulating plaster containing Nano particles
Isokalk Norge AS 460 000 19 764Energy efficiency
2015 Stormberg AS Solar cell system with battery storage capacity for delivery to warehouse in Kristiansand
• Technology supplier (battery system with storage and management): Eltek AS
1 607 278 68 400Production of
electricity
2015 Vestfold and Telemark KFUK-KFUM
Knattholmen Kystleirskole. Combined (integrated) solution solar collectors along with liquid-to-water heat pumps (HYSS: Hybrid Solar System)
• Technology supplier: Free-Energy 709 000 88 978Energy efficiency,
and production of heating
2015 Directorate of Public Construction and Property
Integration of a so-called Power Optimizer (PO) for optimization of electricity production from a 251 kW highly efficient solar cell system in the Directorate of Public Construction and Property’s new office building for the police and the Norwegian Public Roads Administration at Stord
• Builder: Directorate of Public Construction and Property• Technical consultant: Multiconsult ASA• Contractor: Kvinnherad elektro AS, supported by Future Solutions AS and Kraftpojkarna AB• Solar cells: ECSOLAR (Wuxi Saijing Solar Co., Ltd) Power Optimizer: Solar Edge Technologies Inc
2 263 238 206 157Production of
electricity
2015 Posten Norge AS Low-energy logistics building with an energy-efficient solution for gates (72), and renewable energy production based on wind and solar, storage of energy and sale of excess heat to the area’s local heating grid
• Supplier not determined 14 200 000 2 956 847Energy efficiency, recovery of waste
heat, and production of electricity
2015 Overhalla municipality Skage day-care centre, nearly zero energy level, hybrid collectors (solar) integrated in the building, storage solutions for heating and heat recovery of greywater
Supplier not determined 1 331 000 166 115Energy efficiency,
production of electricity, and heat
recovery
Residences
2014 Geir Mikkelsen Construction of a small house in Larvik. The house will deliver more power to the grid than it consumes over the course of one year, through electricity production from solar cells
• Electrical system: Sønnico AS• Architect: French Touch• Lighting: SG AS• Building contractor: TS-Elementer AS• Plumber: Rørleggermester Lysebo AS
115 600 16 284Energy efficiency,
and production of electricity and
heating
2015 Henriksen, Andreas House near the passive house requirements with comprehensive smart house solution. Extensive management of lighting, heating and ventilation through advanced KNX smart house solution
• Rambøll, BBT, LOS Elektro, Bergen Varme & Sanitær Ventilasjon – Bygg og Ventilasjon as
80 898 13 048Energy efficiency,
and production of heating

117
0 Under development
• Comprehensive energy solution• Energy-efficient building structure, solar collectors, delivers energy to neighbouring buildings, waste heat from greywater, free cooling, heat storage• Façade air aggregates, room management logic for solar screening, air volumes, energy-efficient cross exchangers 85%
• Expect expertise development among the engineering group and participating contractor • One of the first facilities in Norway • National potential
0 Under establishment
• Comprehensive energy solution• Passive house level, bottom of pool can be raised and lowered, needs based circulation of pool water, LED lighting, needs based ventilation, economy showers and free cooling via wells• Local production 109 261 kWh from heat pump with geo-well, solar heating, recovery of heat from ventilation system and bleed water exchanger
• Demonstration project• Cooperation with NTNU – SIAT• The project is followed up in the construction and operating phase to verify performance and function over time. Results will be published as Bachelor’s and Master’s theses, and articles and presentations at conferences
• One of the first facilities in Norway, and first in the region • Local and national potential
0 Under establishment
• Comprehensive energy concept• Energy plus building, produces more energy than is consumed for lighting, heating, ventilation and cooling, material use, construction and future rehabilitation• Needs based management, hybrid low SFP ventilation, reduced heat loss from distribution of heating and tap water, free cooling, waste heat• Production of energy from heat pumps and solar cells
• Demonstration project• Part of the Powerhouse alliance is in close cooperation with NTNU/SINTEF• Expect multiple master and project theses• National and international publication
• Realization of the first newly built energy plus office building in Norway
• Major national potential for all or parts of the solutions• International potential for spread that could increase energy efficient and production and reduce greenhouse gas emissions
0 Engineering • Energy-efficient and environmentally friendly cooling/pre-heating solution for ventilation in office building without cooling compressor• Passive cooling solution through underground storage system, seasonal storage of heating• Integrated cooling and heating system, increased well diameter (14 cm)
• The facility will be facilitated for demonstration• The result is verified via detailed measurements• Expertise development among suppliers regarding geo-wells (changed dimensioning conditions), aggregate suppliers (changed system solution), and supplier of cooling/air conditioning system internally in the building (changed dimensioning conditions, system solution)
• Components in the system are known in Norway today, system solution is not common, challenges involve dimensioning the facility so necessary cooling/heating capacity can be extracted from the system at the correct temperature
• National potential• Skanska CDN intends to use the technology in several of its construction projects, where a cooling need exceeding a certain limit is expected +M92
0 Under establishment
• Passive house solutions and products security building with the requirements that apply for physical load, self-harm, installations cannot be used as “weapons”, management of installations (e.g. lighting, sun screening) in relation to people with psychological illnesses
• Demonstration building, could spread to e.g. psychiatric buildings, hospitals, prisons• Cooperation with St. Olavs Hospital, NTNU, Sykehusbygg HF, engineers, contractors, etc.
• National potential• Project owner lists major spread potential for own and other buildings
0 Under development
• Demonstration facility (first in Norway with recovery of small-scale heat recovery of glass furnace)
• Demonstration facility (first in Norway with recovery of small-scale heat recovery of glass furnace)• Build knowledge about system structure, functionality and suitability for technology interaction• Presentations at meeting forums and various conferences• Measurement of and recovery/consumption for verification and analysis• The facility can be opened for tours• Cooperation with Treteknisk and Asplan Viak
• First building in Norway with heat recovery from small-scale glass furnace• Corresponding heat recovery projects known in Denmark• There are currently some rehabilitated buildings in Norway with net heat delivery• Projects with a total focus on sustainable rehabilitated buildings ( energy solutions and use of natural materials) are still considered ground-breaking
• Small-scale heat recovery from glass furnaces can be added to existing and new establishment of small-scale glass production• Experience from using hybrid ventilation solution, particularly in combination with use of natural materials, can be used in buildings with corresponding internal load sizes• Quantification of “indoor climate effect” from buffering of moisture in untreated wood panel with support increased use of wood in buildings
Commissioning • Comprehensive design
• Integration of a parallel compression CO2 cooling unit with three
temperature levels (AC-cool-freeze) in a multipurpose building
• Demonstration facility with detailed measurement of energy consumption• Further development after Rema Kroppanmarka• Follow-up of SINTEF/NTNU, several master’s degree students involved• Reference project for the grocery industry (KPN-INTERACT)
• First implementation in Norway• About 20 installations implemented globally +1.83
• Potentially a concept that should be used in multipurpose buildings (with grocery shop) that need climate cooling, heating of tap water and general heating• Transferable to multipurpose buildings with high energy consumption for heating and cooling, also without grocery shops• Project estimates that spread potential is 1000 facilities in Norway, globally, this system could be used in most grocery shops
Under development
• Lime plaster with super-insulating properties• Enables new insulation of preserved buildings, as it can be approved by the preservation authorities• Contribute to energy efficiency and improved indoor climate
• Demonstration facility with measurements• Also builds expertise among
• First implementation in Norway, result will determine future investment in the product
• National potential for new insulation of preserved brick buildings with plaster• Internationally interesting for buildings in corresponding climate zones
0 Under establishment
• Sum of multiple technical solutions;• New energy storage solution• Compact current transducer that is bi-directional between the grid and batteries• New technology for management system that predicts and optimizes interaction between power production, energy storage and consumption
• Measurement programme for documentation and exchange of experience• Development of experience from use of various solar cell technologies (mono and polycrystalline) placed on the roof and south-facing wall of the building• Internal and external expertise development• Information dissemination through conferences, seminars and inspections• Development of experience from use of bi-directional current transducer in zero building as a plus customer
• First implementation of corresponding facilities in Norway today • Particular spread potential for commercial buildings that need to store excess production• Technology supplier estimates a spread potential for all new power grid stations in the distribution grid, telecom base stations, energy-plus houses, etc.
Under establishment
• Norwegian-developed combined/integrated solution for solar collectors with liquid-to-water heat pumps• Integrated design results in high performance for the heat pump system (SCOP on 6-8)
• Demonstration facility with measurement/software for documentation of energy result/energy follow-up• Increased expertise within good integration of heat pumps vis-à-vis other energy systems and optimization with regard to heating need in building• Communication during engineering/execution phase to installers/contractors• Active marketing and publication in technical periodicals (Teknisk Ukeblad, Kulde, VVS)
• First Norwegian installations, apart from three test facilities • National potential Norwegian-developed solution• Project owner estimates major national potential, relevant in e.g. day-care centres, schools, sports facilities, office buildings, etc. in areas with the possibility for well drilling/ground loops• Less suitable for small houses• Potential for other countries with a Nordic climate
0 Under establishment
• Innovative system solution with highly efficient PV panels with integrated Power Optimizer for each panel, connected to two accumulator tanks (hot and cold) for storage of excess production during summer
• Demonstration facility• Empirical data from solar power production in the south-western region of Norway• Expanded measurement programme for documentation and exchange of experience• Building experience for alternative system solution for battery bank• Internal expertise development• Information dissemination through conferences, seminars and inspections
• First implementation in Norway • Particular spread potential for commercial buildings that need heating and cooling at the same time• Project owner is building experience, and will consider the solution’s suitability for future new buildings• National potential for spread that could yield increased production of renewable power
0 Under establishment
• Comprehensive concept consisting of a solar cell system, wind turbine, buffer battery and autonomous streetlights• Local energy production covers 100% of energy for electric fleet of vehicles and for use in the building• Excess heat is delivered to the area’s joint local heating grid
• Demonstration facility is expected to receive major local/national attention• Experience from local renewable energy production vs. energy storage of electricity and supply of electric car fleet, energy exchange in the area and partially also the quick gate solution• Touring facility for solution with self-production of electricity for a dedicated fleet of electric vehicles
• First implementation in Norway• No known corresponding projects within this building category with corresponding solutions for energy production and energy exchange with other buildings in the area
• National potential• Applicant is planning more corresponding buildings
0 Under establishment
• Comprehensive concept• Very well insulated building structure, rotating heat recovery units in series 92-5%, needs based ventilation/lighting, low-temperature heating from hydronic systems• Combination of solar cells and thermal solar collector in same module with energy storage in wells• Greywater recycling
• Local/regional demonstration project• Local/regional expertise development
• Considered on a national level as one of the most ambitious day-c are centres in relation to net energy demand and own renewable energy production
• Local/regional potential
0 Commissioning • Familiar technology is put together in new ways• Ventilation system with heat pump for heating ventilation air and tap water. Pre-warming of supply air via ventilation duct in the ground. This will also provide “free” cooling in the summer
• Touring and reference residence for Sønnico and builder• Experience will be shared on the project website• Established contact with the electrician study programme at Thor Heyerdal Upper Secondary School• Article about the project in local paper, and Teknisk Ukeblad TU
• No corresponding buildings in Vestfold, one of the first energy-plus houses in Norway
• Relevant for players that are constructing new buildings or implementing energy measures• Focus on constructing energy-efficient residences without costs being too high, and increased comfort• Want to increase focus on solar power
0 Commissioning • Comprehensive solution with familiar technology for commercial buildings, infrequently used in a residential connection (management and ventilation)• Needs based management, low-temperature heating 19 different zones, thermal mass/storage
• Extensive measurement and instrumentation of all energy flow• Expertise development among involved local/regional contractors, major national adviser• Stipulates requirements for close cooperation between electrician, plumber and ventilation and to optimize the smart house functions
• Few known residences in Bergen/Hordaland with such extensive management and regulation
• National potential
PROJECT’SCLIMATERESULT
INNORWAY(kgCO
2equiv/year)
PROJECTSTATUS
INNOVATION EXPERTISEDEVELOPMENT REALIZEDDISSEMINATIONOFTECHNOLOGY FURTHERDEVELOPMENTANDDISSEMINATION
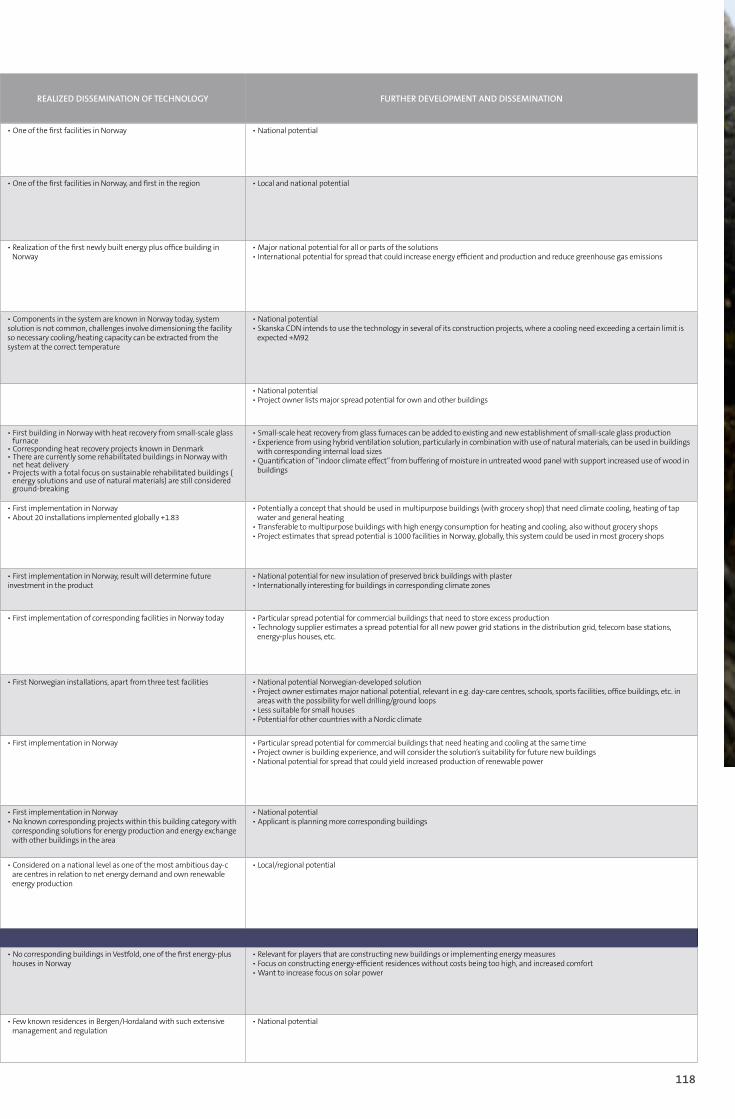
118
0 Under development
• Comprehensive energy solution• Energy-efficient building structure, solar collectors, delivers energy to neighbouring buildings, waste heat from greywater, free cooling, heat storage• Façade air aggregates, room management logic for solar screening, air volumes, energy-efficient cross exchangers 85%
• Expect expertise development among the engineering group and participating contractor • One of the first facilities in Norway • National potential
0 Under establishment
• Comprehensive energy solution• Passive house level, bottom of pool can be raised and lowered, needs based circulation of pool water, LED lighting, needs based ventilation, economy showers and free cooling via wells• Local production 109 261 kWh from heat pump with geo-well, solar heating, recovery of heat from ventilation system and bleed water exchanger
• Demonstration project• Cooperation with NTNU – SIAT• The project is followed up in the construction and operating phase to verify performance and function over time. Results will be published as Bachelor’s and Master’s theses, and articles and presentations at conferences
• One of the first facilities in Norway, and first in the region • Local and national potential
0 Under establishment
• Comprehensive energy concept• Energy plus building, produces more energy than is consumed for lighting, heating, ventilation and cooling, material use, construction and future rehabilitation• Needs based management, hybrid low SFP ventilation, reduced heat loss from distribution of heating and tap water, free cooling, waste heat• Production of energy from heat pumps and solar cells
• Demonstration project• Part of the Powerhouse alliance is in close cooperation with NTNU/SINTEF• Expect multiple master and project theses• National and international publication
• Realization of the first newly built energy plus office building in Norway
• Major national potential for all or parts of the solutions• International potential for spread that could increase energy efficient and production and reduce greenhouse gas emissions
0 Engineering • Energy-efficient and environmentally friendly cooling/pre-heating solution for ventilation in office building without cooling compressor• Passive cooling solution through underground storage system, seasonal storage of heating• Integrated cooling and heating system, increased well diameter (14 cm)
• The facility will be facilitated for demonstration• The result is verified via detailed measurements• Expertise development among suppliers regarding geo-wells (changed dimensioning conditions), aggregate suppliers (changed system solution), and supplier of cooling/air conditioning system internally in the building (changed dimensioning conditions, system solution)
• Components in the system are known in Norway today, system solution is not common, challenges involve dimensioning the facility so necessary cooling/heating capacity can be extracted from the system at the correct temperature
• National potential• Skanska CDN intends to use the technology in several of its construction projects, where a cooling need exceeding a certain limit is expected +M92
0 Under establishment
• Passive house solutions and products security building with the requirements that apply for physical load, self-harm, installations cannot be used as “weapons”, management of installations (e.g. lighting, sun screening) in relation to people with psychological illnesses
• Demonstration building, could spread to e.g. psychiatric buildings, hospitals, prisons• Cooperation with St. Olavs Hospital, NTNU, Sykehusbygg HF, engineers, contractors, etc.
• National potential• Project owner lists major spread potential for own and other buildings
0 Under development
• Demonstration facility (first in Norway with recovery of small-scale heat recovery of glass furnace)
• Demonstration facility (first in Norway with recovery of small-scale heat recovery of glass furnace)• Build knowledge about system structure, functionality and suitability for technology interaction• Presentations at meeting forums and various conferences• Measurement of and recovery/consumption for verification and analysis• The facility can be opened for tours• Cooperation with Treteknisk and Asplan Viak
• First building in Norway with heat recovery from small-scale glass furnace• Corresponding heat recovery projects known in Denmark• There are currently some rehabilitated buildings in Norway with net heat delivery• Projects with a total focus on sustainable rehabilitated buildings ( energy solutions and use of natural materials) are still considered ground-breaking
• Small-scale heat recovery from glass furnaces can be added to existing and new establishment of small-scale glass production• Experience from using hybrid ventilation solution, particularly in combination with use of natural materials, can be used in buildings with corresponding internal load sizes• Quantification of “indoor climate effect” from buffering of moisture in untreated wood panel with support increased use of wood in buildings
Commissioning • Comprehensive design
• Integration of a parallel compression CO2 cooling unit with three
temperature levels (AC-cool-freeze) in a multipurpose building
• Demonstration facility with detailed measurement of energy consumption• Further development after Rema Kroppanmarka• Follow-up of SINTEF/NTNU, several master’s degree students involved• Reference project for the grocery industry (KPN-INTERACT)
• First implementation in Norway• About 20 installations implemented globally +1.83
• Potentially a concept that should be used in multipurpose buildings (with grocery shop) that need climate cooling, heating of tap water and general heating• Transferable to multipurpose buildings with high energy consumption for heating and cooling, also without grocery shops• Project estimates that spread potential is 1000 facilities in Norway, globally, this system could be used in most grocery shops
Under development
• Lime plaster with super-insulating properties• Enables new insulation of preserved buildings, as it can be approved by the preservation authorities• Contribute to energy efficiency and improved indoor climate
• Demonstration facility with measurements• Also builds expertise among
• First implementation in Norway, result will determine future investment in the product
• National potential for new insulation of preserved brick buildings with plaster• Internationally interesting for buildings in corresponding climate zones
0 Under establishment
• Sum of multiple technical solutions;• New energy storage solution• Compact current transducer that is bi-directional between the grid and batteries• New technology for management system that predicts and optimizes interaction between power production, energy storage and consumption
• Measurement programme for documentation and exchange of experience• Development of experience from use of various solar cell technologies (mono and polycrystalline) placed on the roof and south-facing wall of the building• Internal and external expertise development• Information dissemination through conferences, seminars and inspections• Development of experience from use of bi-directional current transducer in zero building as a plus customer
• First implementation of corresponding facilities in Norway today • Particular spread potential for commercial buildings that need to store excess production• Technology supplier estimates a spread potential for all new power grid stations in the distribution grid, telecom base stations, energy-plus houses, etc.
Under establishment
• Norwegian-developed combined/integrated solution for solar collectors with liquid-to-water heat pumps• Integrated design results in high performance for the heat pump system (SCOP on 6-8)
• Demonstration facility with measurement/software for documentation of energy result/energy follow-up• Increased expertise within good integration of heat pumps vis-à-vis other energy systems and optimization with regard to heating need in building• Communication during engineering/execution phase to installers/contractors• Active marketing and publication in technical periodicals (Teknisk Ukeblad, Kulde, VVS)
• First Norwegian installations, apart from three test facilities • National potential Norwegian-developed solution• Project owner estimates major national potential, relevant in e.g. day-care centres, schools, sports facilities, office buildings, etc. in areas with the possibility for well drilling/ground loops• Less suitable for small houses• Potential for other countries with a Nordic climate
0 Under establishment
• Innovative system solution with highly efficient PV panels with integrated Power Optimizer for each panel, connected to two accumulator tanks (hot and cold) for storage of excess production during summer
• Demonstration facility• Empirical data from solar power production in the south-western region of Norway• Expanded measurement programme for documentation and exchange of experience• Building experience for alternative system solution for battery bank• Internal expertise development• Information dissemination through conferences, seminars and inspections
• First implementation in Norway • Particular spread potential for commercial buildings that need heating and cooling at the same time• Project owner is building experience, and will consider the solution’s suitability for future new buildings• National potential for spread that could yield increased production of renewable power
0 Under establishment
• Comprehensive concept consisting of a solar cell system, wind turbine, buffer battery and autonomous streetlights• Local energy production covers 100% of energy for electric fleet of vehicles and for use in the building• Excess heat is delivered to the area’s joint local heating grid
• Demonstration facility is expected to receive major local/national attention• Experience from local renewable energy production vs. energy storage of electricity and supply of electric car fleet, energy exchange in the area and partially also the quick gate solution• Touring facility for solution with self-production of electricity for a dedicated fleet of electric vehicles
• First implementation in Norway• No known corresponding projects within this building category with corresponding solutions for energy production and energy exchange with other buildings in the area
• National potential• Applicant is planning more corresponding buildings
0 Under establishment
• Comprehensive concept• Very well insulated building structure, rotating heat recovery units in series 92-5%, needs based ventilation/lighting, low-temperature heating from hydronic systems• Combination of solar cells and thermal solar collector in same module with energy storage in wells• Greywater recycling
• Local/regional demonstration project• Local/regional expertise development
• Considered on a national level as one of the most ambitious day-c are centres in relation to net energy demand and own renewable energy production
• Local/regional potential
0 Commissioning • Familiar technology is put together in new ways• Ventilation system with heat pump for heating ventilation air and tap water. Pre-warming of supply air via ventilation duct in the ground. This will also provide “free” cooling in the summer
• Touring and reference residence for Sønnico and builder• Experience will be shared on the project website• Established contact with the electrician study programme at Thor Heyerdal Upper Secondary School• Article about the project in local paper, and Teknisk Ukeblad TU
• No corresponding buildings in Vestfold, one of the first energy-plus houses in Norway
• Relevant for players that are constructing new buildings or implementing energy measures• Focus on constructing energy-efficient residences without costs being too high, and increased comfort• Want to increase focus on solar power
0 Commissioning • Comprehensive solution with familiar technology for commercial buildings, infrequently used in a residential connection (management and ventilation)• Needs based management, low-temperature heating 19 different zones, thermal mass/storage
• Extensive measurement and instrumentation of all energy flow• Expertise development among involved local/regional contractors, major national adviser• Stipulates requirements for close cooperation between electrician, plumber and ventilation and to optimize the smart house functions
• Few known residences in Bergen/Hordaland with such extensive management and regulation
• National potential
PROJECT’SCLIMATERESULT
INNORWAY(kgCO
2equiv/year)
PROJECTSTATUS
INNOVATION EXPERTISEDEVELOPMENT REALIZEDDISSEMINATIONOFTECHNOLOGY FURTHERDEVELOPMENTANDDISSEMINATION
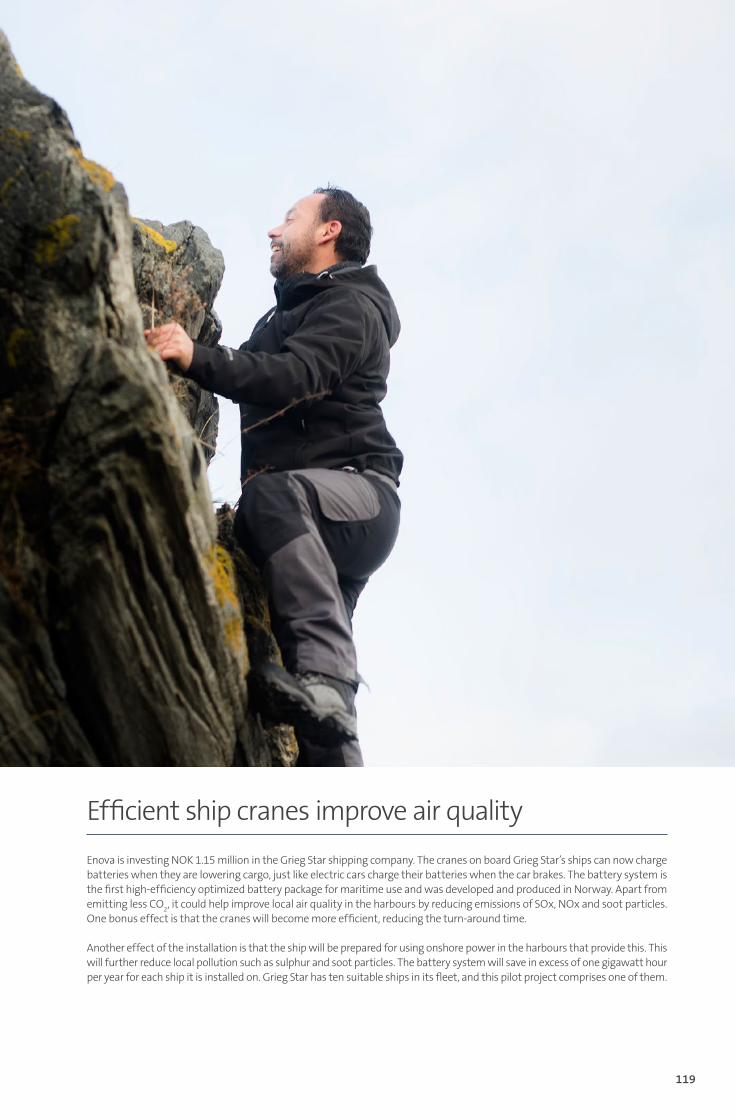
119
Enova is investing NOK 1.15 million in the Grieg Star shipping company. The cranes on board Grieg Star’s ships can now charge batteries when they are lowering cargo, just like electric cars charge their batteries when the car brakes. The battery system is the first high-efficiency optimized battery package for maritime use and was developed and produced in Norway. Apart from emitting less CO
2, it could help improve local air quality in the harbours by reducing emissions of SOx, NOx and soot particles.
One bonus effect is that the cranes will become more efficient, reducing the turn-around time.
Another effect of the installation is that the ship will be prepared for using onshore power in the harbours that provide this. This will further reduce local pollution such as sulphur and soot particles. The battery system will save in excess of one gigawatt hour per year for each ship it is installed on. Grieg Star has ten suitable ships in its fleet, and this pilot project comprises one of them.
Efficient ship cranes improve air quality
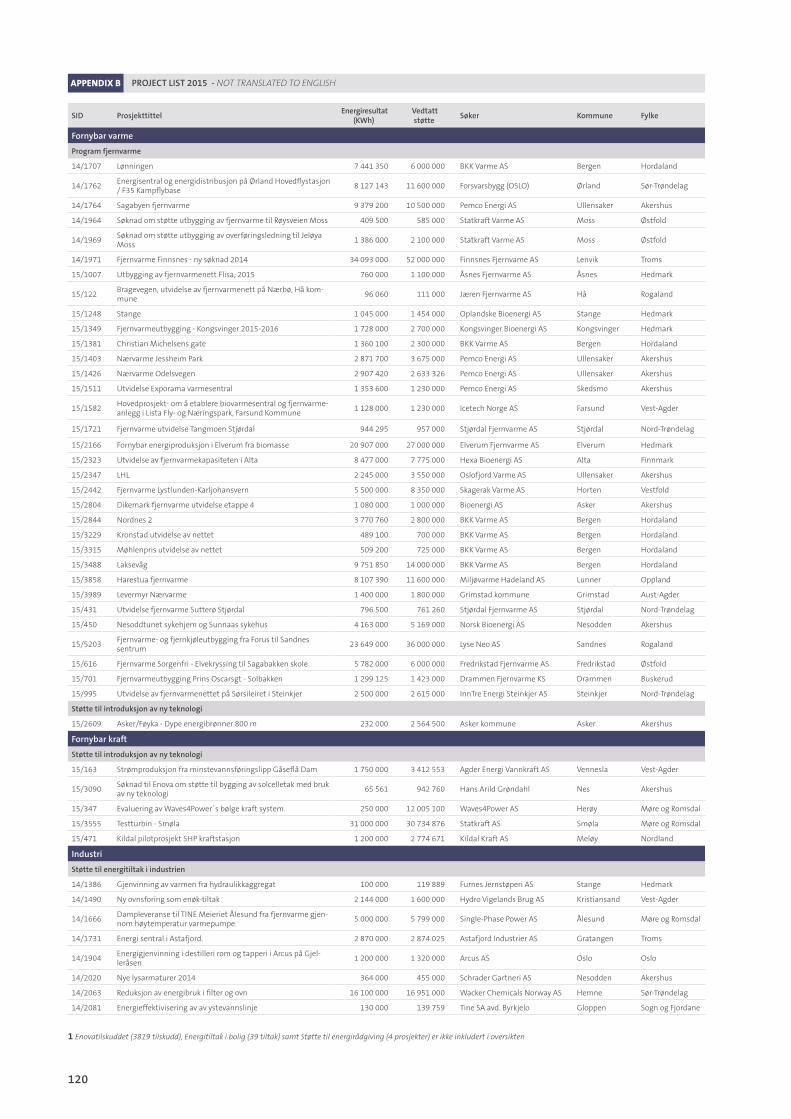
120
APPENDIX B PROJECT LIST 2015 - NOT TRANSLATED TO ENGLISH
SID ProsjekttittelEnergiresultat
(KWh)Vedtattstøtte
Søker Kommune Fylke
Fornybarvarme
Programfjernvarme
14/1707 Lønningen 7 441 350 6 000 000 BKK Varme AS Bergen Hordaland
14/1762Energisentral og energidistribusjon på Ørland Hovedflystasjon / F35 Kampflybase
8 127 143 11 600 000 Forsvarsbygg (OSLO) Ørland Sør-Trøndelag
14/1764 Sagabyen fjernvarme 9 379 200 10 500 000 Pemco Energi AS Ullensaker Akershus
14/1964 Søknad om støtte utbygging av fjernvarme til Røysveien Moss 409 500 585 000 Statkraft Varme AS Moss Østfold
14/1969Søknad om støtte utbygging av overføringsledning til Jeløya Moss
1 386 000 2 100 000 Statkraft Varme AS Moss Østfold
14/1971 Fjernvarme Finnsnes - ny søknad 2014 34 093 000 52 000 000 Finnsnes Fjernvame AS Lenvik Troms
15/1007 Utbygging av fjernvarmenett Flisa, 2015 760 000 1 100 000 Åsnes Fjernvarme AS Åsnes Hedmark
15/122Bragevegen, utvidelse av fjernvarmenett på Nærbø, Hå kom-mune
96 060 111 000 Jæren Fjernvarme AS Hå Rogaland
15/1248 Stange 1 045 000 1 454 000 Oplandske Bioenergi AS Stange Hedmark
15/1349 Fjernvarmeutbygging - Kongsvinger 2015-2016 1 728 000 2 700 000 Kongsvinger Bioenergi AS Kongsvinger Hedmark
15/1381 Christian Michelsens gate 1 360 100 2 300 000 BKK Varme AS Bergen Hordaland
15/1403 Nærvarme Jessheim Park 2 871 700 3 675 000 Pemco Energi AS Ullensaker Akershus
15/1426 Nærvarme Odelsvegen 2 907 420 2 633 326 Pemco Energi AS Ullensaker Akershus
15/1511 Utvidelse Exporama varmesentral 1 353 600 1 230 000 Pemco Energi AS Skedsmo Akershus
15/1582Hovedprosjekt- om å etablere biovarmesentral og fjernvarme-anlegg i Lista Fly- og Næringspark, Farsund Kommune
1 128 000 1 230 000 Icetech Norge AS Farsund Vest-Agder
15/1721 Fjernvarme utvidelse Tangmoen Stjørdal 944 295 957 000 Stjørdal Fjernvarme AS Stjørdal Nord-Trøndelag
15/2166 Fornybar energiproduksjon i Elverum fra biomasse 20 907 000 27 000 000 Elverum Fjernvarme AS Elverum Hedmark
15/2323 Utvidelse av fjernvarmekapasiteten i Alta 8 477 000 7 775 000 Hexa Bioenergi AS Alta Finnmark
15/2347 LHL 2 245 000 3 550 000 Oslofjord Varme AS Ullensaker Akershus
15/2442 Fjernvarme Lystlunden-Karljohansvern 5 500 000 8 350 000 Skagerak Varme AS Horten Vestfold
15/2804 Dikemark fjernvarme utvidelse etappe 4 1 080 000 1 000 000 Bioenergi AS Asker Akershus
15/2844 Nordnes 2 3 770 760 2 800 000 BKK Varme AS Bergen Hordaland
15/3229 Kronstad utvidelse av nettet 489 100 700 000 BKK Varme AS Bergen Hordaland
15/3315 Møhlenpris utvidelse av nettet 509 200 725 000 BKK Varme AS Bergen Hordaland
15/3488 Laksevåg 9 751 850 14 000 000 BKK Varme AS Bergen Hordaland
15/3858 Harestua fjernvarme 8 107 390 11 600 000 Miljøvarme Hadeland AS Lunner Oppland
15/3989 Levermyr Nærvarme 1 400 000 1 800 000 Grimstad kommune Grimstad Aust-Agder
15/431 Utvidelse fjernvarme Sutterø Stjørdal 796 500 761 260 Stjørdal Fjernvarme AS Stjørdal Nord-Trøndelag
15/450 Nesoddtunet sykehjem og Sunnaas sykehus 4 163 000 5 169 000 Norsk Bioenergi AS Nesodden Akershus
15/5203Fjernvarme- og fjernkjøleutbygging fra Forus til Sandnes sentrum
23 649 000 36 000 000 Lyse Neo AS Sandnes Rogaland
15/616 Fjernvarme Sorgenfri - Elvekryssing til Sagabakken skole 5 782 000 6 000 000 Fredrikstad Fjernvarme AS Fredrikstad Østfold
15/701 Fjernvarmeutbygging Prins Oscarsgt - Solbakken 1 299 125 1 423 000 Drammen Fjernvarme KS Drammen Buskerud
15/995 Utvidelse av fjernvarmenettet på Sørsileiret i Steinkjer 2 500 000 2 615 000 InnTre Energi Steinkjer AS Steinkjer Nord-Trøndelag
Støttetilintroduksjonavnyteknologi
15/2609 Asker/Føyka - Dype energibrønner 800 m 232 000 2 564 500 Asker kommune Asker Akershus
Fornybarkraft
Støttetilintroduksjonavnyteknologi
15/163 Strømproduksjon fra minstevannsføringslipp Gåseflå Dam 1 750 000 3 412 553 Agder Energi Vannkraft AS Vennesla Vest-Agder
15/3090Søknad til Enova om støtte til bygging av solcelletak med bruk av ny teknologi
65 561 942 760 Hans Arild Grøndahl Nes Akershus
15/347 Evaluering av Waves4Power´s bølge kraft system. 250 000 12 005 100 Waves4Power AS Herøy Møre og Romsdal
15/3555 Testturbin - Smøla 31 000 000 30 734 876 Statkraft AS Smøla Møre og Romsdal
15/471 Kildal pilotprosjekt SHP kraftstasjon 1 200 000 2 774 671 Kildal Kraft AS Meløy Nordland
Industri
Støttetilenergitiltakiindustrien
14/1386 Gjenvinning av varmen fra hydraulikkaggregat 100 000 119 889 Furnes Jernstøperi AS Stange Hedmark
14/1490 Ny ovnsforing som enøk-tiltak 2 144 000 1 600 000 Hydro Vigelands Brug AS Kristiansand Vest-Agder
14/1666Dampleveranse til TINE Meieriet Ålesund fra fjernvarme gjen-nom høytemperatur varmepumpe.
5 000 000 5 799 000 Single-Phase Power AS Ålesund Møre og Romsdal
14/1731 Energi sentral i Astafjord. 2 870 000 2 874 025 Astafjord Industrier AS Gratangen Troms
14/1904Energigjenvinning i destilleri rom og tapperi i Arcus på Gjel-leråsen
1 200 000 1 320 000 Arcus AS Oslo Oslo
14/2020 Nye lysarmaturer 2014 364 000 455 000 Schrader Gartneri AS Nesodden Akershus
14/2063 Reduksjon av energibruk i filter og ovn 16 100 000 16 951 000 Wacker Chemicals Norway AS Hemne Sør-Trøndelag
14/2081 Energieffektivisering av av ystevannslinje 130 000 139 759 Tine SA avd. Byrkjelo Gloppen Sogn og Fjordane
1 Enovatilskuddet (3819 tilskudd), Energitiltak i bolig (39 tiltak) samt Støtte til energirådgiving (4 prosjekter) er ikke inkludert i oversikten
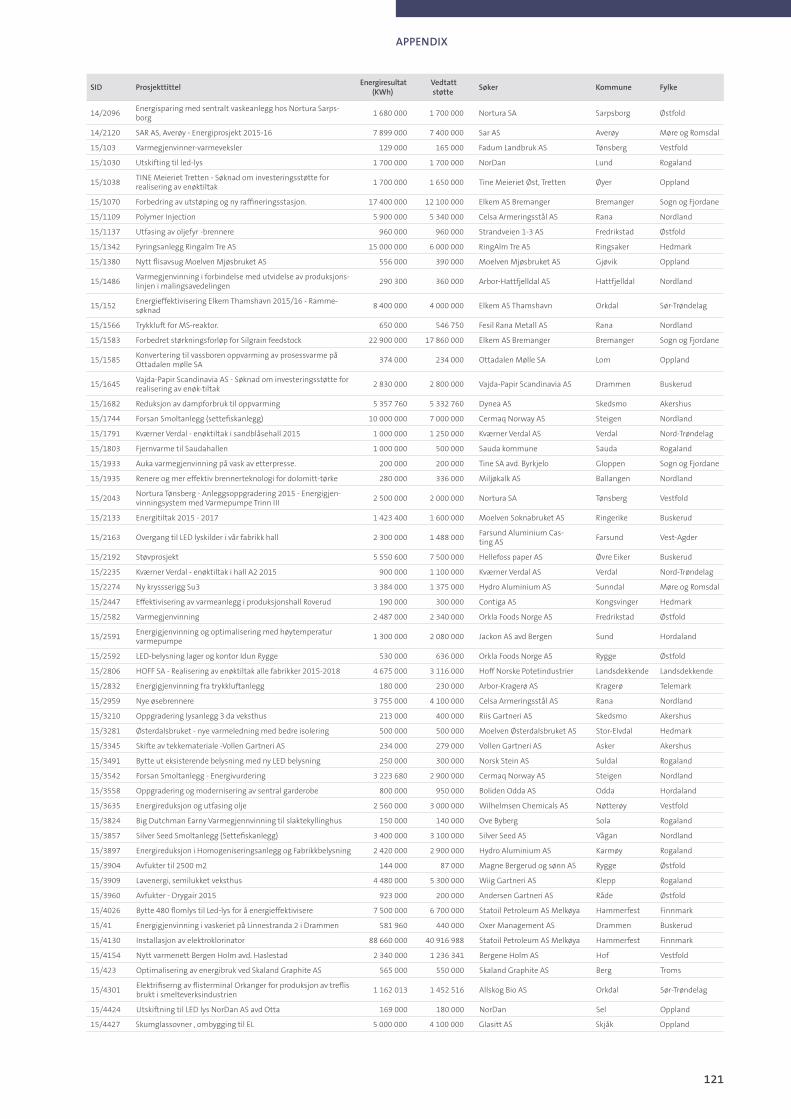
121
APPENDIX
14/2096Energisparing med sentralt vaskeanlegg hos Nortura Sarps-borg
1 680 000 1 700 000 Nortura SA Sarpsborg Østfold
14/2120 SAR AS, Averøy - Energiprosjekt 2015-16 7 899 000 7 400 000 Sar AS Averøy Møre og Romsdal
15/103 Varmegjenvinner-varmeveksler 129 000 165 000 Fadum Landbruk AS Tønsberg Vestfold
15/1030 Utskifting til led-lys 1 700 000 1 700 000 NorDan Lund Rogaland
15/1038TINE Meieriet Tretten - Søknad om investeringsstøtte for realisering av enøktiltak
1 700 000 1 650 000 Tine Meieriet Øst, Tretten Øyer Oppland
15/1070 Forbedring av utstøping og ny raffineringsstasjon. 17 400 000 12 100 000 Elkem AS Bremanger Bremanger Sogn og Fjordane
15/1109 Polymer Injection 5 900 000 5 340 000 Celsa Armeringsstål AS Rana Nordland
15/1137 Utfasing av oljefyr -brennere 960 000 960 000 Strandveien 1-3 AS Fredrikstad Østfold
15/1342 Fyringsanlegg Ringalm Tre AS 15 000 000 6 000 000 RingAlm Tre AS Ringsaker Hedmark
15/1380 Nytt flisavsug Moelven Mjøsbruket AS 556 000 390 000 Moelven Mjøsbruket AS Gjøvik Oppland
15/1486Varmegjenvinning i forbindelse med utvidelse av produksjons-linjen i malingsavedelingen
290 300 360 000 Arbor-Hattfjelldal AS Hattfjelldal Nordland
15/152Energieffektivisering Elkem Thamshavn 2015/16 - Ramme-søknad
8 400 000 4 000 000 Elkem AS Thamshavn Orkdal Sør-Trøndelag
15/1566 Trykkluft for MS-reaktor. 650 000 546 750 Fesil Rana Metall AS Rana Nordland
15/1583 Forbedret størkningsforløp for Silgrain feedstock 22 900 000 17 860 000 Elkem AS Bremanger Bremanger Sogn og Fjordane
15/1585Konvertering til vassboren oppvarming av prosessvarme på Ottadalen mølle SA
374 000 234 000 Ottadalen Mølle SA Lom Oppland
15/1645Vajda-Papir Scandinavia AS - Søknad om investeringsstøtte for realisering av enøk-tiltak
2 830 000 2 800 000 Vajda-Papir Scandinavia AS Drammen Buskerud
15/1682 Reduksjon av dampforbruk til oppvarming 5 357 760 5 332 760 Dynea AS Skedsmo Akershus
15/1744 Forsan Smoltanlegg (settefiskanlegg) 10 000 000 7 000 000 Cermaq Norway AS Steigen Nordland
15/1791 Kværner Verdal - enøktiltak i sandblåsehall 2015 1 000 000 1 250 000 Kværner Verdal AS Verdal Nord-Trøndelag
15/1803 Fjernvarme til Saudahallen 1 000 000 500 000 Sauda kommune Sauda Rogaland
15/1933 Auka varmegjenvinning på vask av etterpresse. 200 000 200 000 Tine SA avd. Byrkjelo Gloppen Sogn og Fjordane
15/1935 Renere og mer effektiv brennerteknologi for dolomitt-tørke 280 000 336 000 Miljøkalk AS Ballangen Nordland
15/2043Nortura Tønsberg - Anleggsoppgradering 2015 - Energigjen-vinningsystem med Varmepumpe Trinn III
2 500 000 2 000 000 Nortura SA Tønsberg Vestfold
15/2133 Energitiltak 2015 - 2017 1 423 400 1 600 000 Moelven Soknabruket AS Ringerike Buskerud
15/2163 Overgang til LED lyskilder i vår fabrikk hall 2 300 000 1 488 000 Farsund Aluminium Cas-ting AS
Farsund Vest-Agder
15/2192 Støvprosjekt 5 550 600 7 500 000 Hellefoss paper AS Øvre Eiker Buskerud
15/2235 Kværner Verdal - enøktiltak i hall A2 2015 900 000 1 100 000 Kværner Verdal AS Verdal Nord-Trøndelag
15/2274 Ny kryssserigg Su3 3 384 000 1 375 000 Hydro Aluminium AS Sunndal Møre og Romsdal
15/2447 Effektivisering av varmeanlegg i produksjonshall Roverud 190 000 300 000 Contiga AS Kongsvinger Hedmark
15/2582 Varmegjenvinning 2 487 000 2 340 000 Orkla Foods Norge AS Fredrikstad Østfold
15/2591Energigjenvinning og optimalisering med høytemperatur varmepumpe
1 300 000 2 080 000 Jackon AS avd Bergen Sund Hordaland
15/2592 LED-belysning lager og kontor Idun Rygge 530 000 636 000 Orkla Foods Norge AS Rygge Østfold
15/2806 HOFF SA - Realisering av enøktiltak alle fabrikker 2015-2018 4 675 000 3 116 000 Hoff Norske Potetindustrier Landsdekkende Landsdekkende
15/2832 Energigjenvinning fra trykkluftanlegg 180 000 230 000 Arbor-Kragerø AS Kragerø Telemark
15/2959 Nye øsebrennere 3 755 000 4 100 000 Celsa Armeringsstål AS Rana Nordland
15/3210 Oppgradering lysanlegg 3 da veksthus 213 000 400 000 Riis Gartneri AS Skedsmo Akershus
15/3281 Østerdalsbruket - nye varmeledning med bedre isolering 500 000 500 000 Moelven Østerdalsbruket AS Stor-Elvdal Hedmark
15/3345 Skifte av tekkemateriale -Vollen Gartneri AS 234 000 279 000 Vollen Gartneri AS Asker Akershus
15/3491 Bytte ut eksisterende belysning med ny LED belysning 250 000 300 000 Norsk Stein AS Suldal Rogaland
15/3542 Forsan Smoltanlegg - Energivurdering 3 223 680 2 900 000 Cermaq Norway AS Steigen Nordland
15/3558 Oppgradering og modernisering av sentral garderobe 800 000 950 000 Boliden Odda AS Odda Hordaland
15/3635 Energireduksjon og utfasing olje 2 560 000 3 000 000 Wilhelmsen Chemicals AS Nøtterøy Vestfold
15/3824 Big Dutchman Earny Varmegjennvinning til slaktekyllinghus 150 000 140 000 Ove Byberg Sola Rogaland
15/3857 Silver Seed Smoltanlegg (Settefiskanlegg) 3 400 000 3 100 000 Silver Seed AS Vågan Nordland
15/3897 Energireduksjon i Homogeniseringsanlegg og Fabrikkbelysning 2 420 000 2 900 000 Hydro Aluminium AS Karmøy Rogaland
15/3904 Avfukter til 2500 m2 144 000 87 000 Magne Bergerud og sønn AS Rygge Østfold
15/3909 Lavenergi, semilukket veksthus 4 480 000 5 300 000 Wiig Gartneri AS Klepp Rogaland
15/3960 Avfukter - Drygair 2015 923 000 200 000 Andersen Gartneri AS Råde Østfold
15/4026 Bytte 480 flomlys til Led-lys for å energieffektivisere 7 500 000 6 700 000 Statoil Petroleum AS Melkøya Hammerfest Finnmark
15/41 Energigjenvinning i vaskeriet på Linnestranda 2 i Drammen 581 960 440 000 Oxer Management AS Drammen Buskerud
15/4130 Installasjon av elektroklorinator 88 660 000 40 916 988 Statoil Petroleum AS Melkøya Hammerfest Finnmark
15/4154 Nytt varmenett Bergen Holm avd. Haslestad 2 340 000 1 236 341 Bergene Holm AS Hof Vestfold
15/423 Optimalisering av energibruk ved Skaland Graphite AS 565 000 550 000 Skaland Graphite AS Berg Troms
15/4301Elektrifiserng av flisterminal Orkanger for produksjon av treflis brukt i smelteverksindustrien
1 162 013 1 452 516 Allskog Bio AS Orkdal Sør-Trøndelag
15/4424 Utskiftning til LED lys NorDan AS avd Otta 169 000 180 000 NorDan Sel Oppland
15/4427 Skumglassovner , ombygging til EL 5 000 000 4 100 000 Glasitt AS Skjåk Oppland
SID ProsjekttittelEnergiresultat
(KWh)Vedtattstøtte
Søker Kommune Fylke
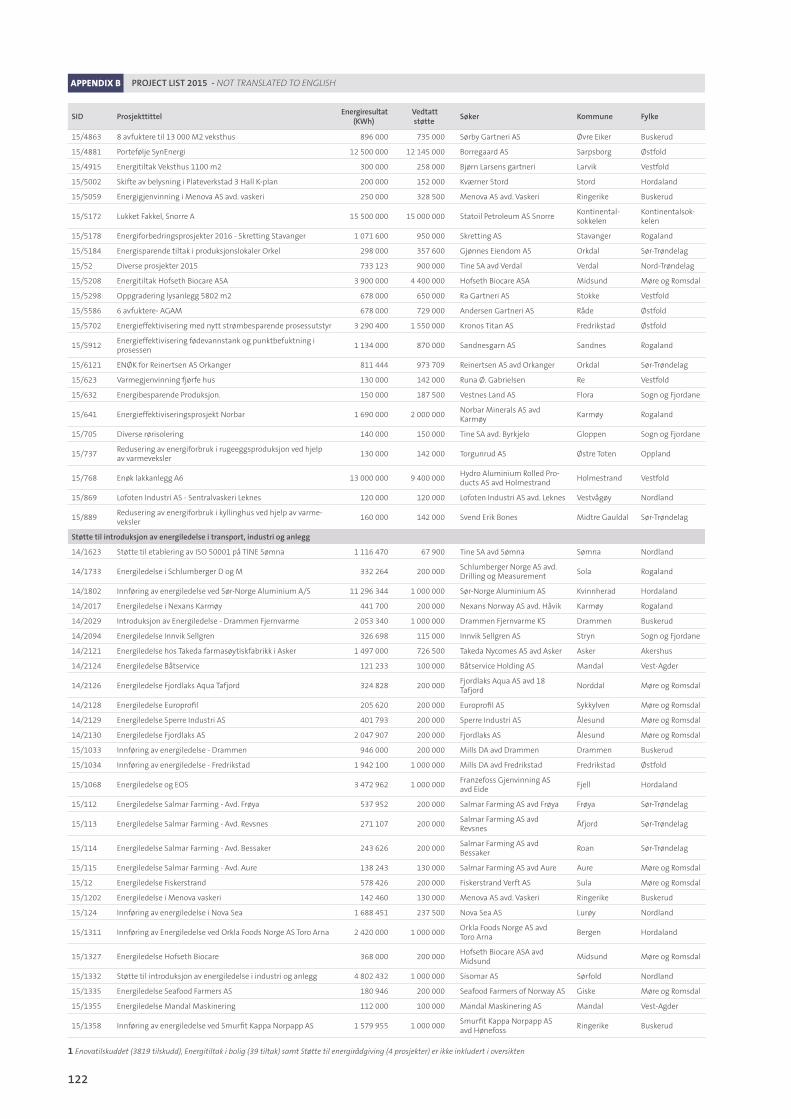
122
APPENDIX B PROJECT LIST 2015 - NOT TRANSLATED TO ENGLISH
15/4863 8 avfuktere til 13 000 M2 veksthus 896 000 735 000 Sørby Gartneri AS Øvre Eiker Buskerud
15/4881 Portefølje SynEnergi 12 500 000 12 145 000 Borregaard AS Sarpsborg Østfold
15/4915 Energitiltak Veksthus 1100 m2 300 000 258 000 Bjørn Larsens gartneri Larvik Vestfold
15/5002 Skifte av belysning i Plateverkstad 3 Hall K-plan 200 000 152 000 Kværner Stord Stord Hordaland
15/5059 Energigjenvinning i Menova AS avd. vaskeri 250 000 328 500 Menova AS avd. Vaskeri Ringerike Buskerud
15/5172 Lukket Fakkel, Snorre A 15 500 000 15 000 000 Statoil Petroleum AS SnorreKontinental-sokkelen
Kontinentalsok-kelen
15/5178 Energiforbedringsprosjekter 2016 - Skretting Stavanger 1 071 600 950 000 Skretting AS Stavanger Rogaland
15/5184 Energisparende tiltak i produksjonslokaler Orkel 298 000 357 600 Gjønnes Eiendom AS Orkdal Sør-Trøndelag
15/52 Diverse prosjekter 2015 733 123 900 000 Tine SA avd Verdal Verdal Nord-Trøndelag
15/5208 Energitiltak Hofseth Biocare ASA 3 900 000 4 400 000 Hofseth Biocare ASA Midsund Møre og Romsdal
15/5298 Oppgradering lysanlegg 5802 m2 678 000 650 000 Ra Gartneri AS Stokke Vestfold
15/5586 6 avfuktere- AGAM 678 000 729 000 Andersen Gartneri AS Råde Østfold
15/5702 Energieffektivisering med nytt strømbesparende prosessutstyr 3 290 400 1 550 000 Kronos Titan AS Fredrikstad Østfold
15/5912Energieffektivisering fødevannstank og punktbefuktning i prosessen
1 134 000 870 000 Sandnesgarn AS Sandnes Rogaland
15/6121 ENØK for Reinertsen AS Orkanger 811 444 973 709 Reinertsen AS avd Orkanger Orkdal Sør-Trøndelag
15/623 Varmegjenvinning fjørfe hus 130 000 142 000 Runa Ø. Gabrielsen Re Vestfold
15/632 Energibesparende Produksjon. 150 000 187 500 Vestnes Land AS Flora Sogn og Fjordane
15/641 Energieffektiviseringsprosjekt Norbar 1 690 000 2 000 000 Norbar Minerals AS avd Karmøy
Karmøy Rogaland
15/705 Diverse rørisolering 140 000 150 000 Tine SA avd. Byrkjelo Gloppen Sogn og Fjordane
15/737Redusering av energiforbruk i rugeeggsproduksjon ved hjelp av varmeveksler
130 000 142 000 Torgunrud AS Østre Toten Oppland
15/768 Enøk lakkanlegg A6 13 000 000 9 400 000 Hydro Aluminium Rolled Pro-ducts AS avd Holmestrand
Holmestrand Vestfold
15/869 Lofoten Industri AS - Sentralvaskeri Leknes 120 000 120 000 Lofoten Industri AS avd. Leknes Vestvågøy Nordland
15/889Redusering av energiforbruk i kyllinghus ved hjelp av varme-veksler
160 000 142 000 Svend Erik Bones Midtre Gauldal Sør-Trøndelag
Støttetilintroduksjonavenergiledelseitransport,industrioganlegg
14/1623 Støtte til etablering av ISO 50001 på TINE Sømna 1 116 470 67 900 Tine SA avd Sømna Sømna Nordland
14/1733 Energiledelse i Schlumberger D og M 332 264 200 000 Schlumberger Norge AS avd. Drilling og Measurement
Sola Rogaland
14/1802 Innføring av energiledelse ved Sør-Norge Aluminium A/S 11 296 344 1 000 000 Sør-Norge Aluminium AS Kvinnherad Hordaland
14/2017 Energiledelse i Nexans Karmøy 441 700 200 000 Nexans Norway AS avd. Håvik Karmøy Rogaland
14/2029 Introduksjon av Energiledelse - Drammen Fjernvarme 2 053 340 1 000 000 Drammen Fjernvarme KS Drammen Buskerud
14/2094 Energiledelse Innvik Sellgren 326 698 115 000 Innvik Sellgren AS Stryn Sogn og Fjordane
14/2121 Energiledelse hos Takeda farmasøytiskfabrikk i Asker 1 497 000 726 500 Takeda Nycomes AS avd Asker Asker Akershus
14/2124 Energiledelse Båtservice 121 233 100 000 Båtservice Holding AS Mandal Vest-Agder
14/2126 Energiledelse Fjordlaks Aqua Tafjord 324 828 200 000 Fjordlaks Aqua AS avd 18 Tafjord
Norddal Møre og Romsdal
14/2128 Energiledelse Europrofil 205 620 200 000 Europrofil AS Sykkylven Møre og Romsdal
14/2129 Energiledelse Sperre Industri AS 401 793 200 000 Sperre Industri AS Ålesund Møre og Romsdal
14/2130 Energiledelse Fjordlaks AS 2 047 907 200 000 Fjordlaks AS Ålesund Møre og Romsdal
15/1033 Innføring av energiledelse - Drammen 946 000 200 000 Mills DA avd Drammen Drammen Buskerud
15/1034 Innføring av energiledelse - Fredrikstad 1 942 100 1 000 000 Mills DA avd Fredrikstad Fredrikstad Østfold
15/1068 Energiledelse og EOS 3 472 962 1 000 000 Franzefoss Gjenvinning AS avd Eide
Fjell Hordaland
15/112 Energiledelse Salmar Farming - Avd. Frøya 537 952 200 000 Salmar Farming AS avd Frøya Frøya Sør-Trøndelag
15/113 Energiledelse Salmar Farming - Avd. Revsnes 271 107 200 000 Salmar Farming AS avd Revsnes
Åfjord Sør-Trøndelag
15/114 Energiledelse Salmar Farming - Avd. Bessaker 243 626 200 000 Salmar Farming AS avd Bessaker
Roan Sør-Trøndelag
15/115 Energiledelse Salmar Farming - Avd. Aure 138 243 130 000 Salmar Farming AS avd Aure Aure Møre og Romsdal
15/12 Energiledelse Fiskerstrand 578 426 200 000 Fiskerstrand Verft AS Sula Møre og Romsdal
15/1202 Energiledelse i Menova vaskeri 142 460 130 000 Menova AS avd. Vaskeri Ringerike Buskerud
15/124 Innføring av energiledelse i Nova Sea 1 688 451 237 500 Nova Sea AS Lurøy Nordland
15/1311 Innføring av Energiledelse ved Orkla Foods Norge AS Toro Arna 2 420 000 1 000 000 Orkla Foods Norge AS avd Toro Arna
Bergen Hordaland
15/1327 Energiledelse Hofseth Biocare 368 000 200 000 Hofseth Biocare ASA avd Midsund
Midsund Møre og Romsdal
15/1332 Støtte til introduksjon av energiledelse i industri og anlegg 4 802 432 1 000 000 Sisomar AS Sørfold Nordland
15/1335 Energiledelse Seafood Farmers AS 180 946 200 000 Seafood Farmers of Norway AS Giske Møre og Romsdal
15/1355 Energiledelse Mandal Maskinering 112 000 100 000 Mandal Maskinering AS Mandal Vest-Agder
15/1358 Innføring av energiledelse ved Smurfit Kappa Norpapp AS 1 579 955 1 000 000 Smurfit Kappa Norpapp AS avd Hønefoss
Ringerike Buskerud
SID ProsjekttittelEnergiresultat
(KWh)Vedtattstøtte
Søker Kommune Fylke
1 Enovatilskuddet (3819 tilskudd), Energitiltak i bolig (39 tiltak) samt Støtte til energirådgiving (4 prosjekter) er ikke inkludert i oversikten
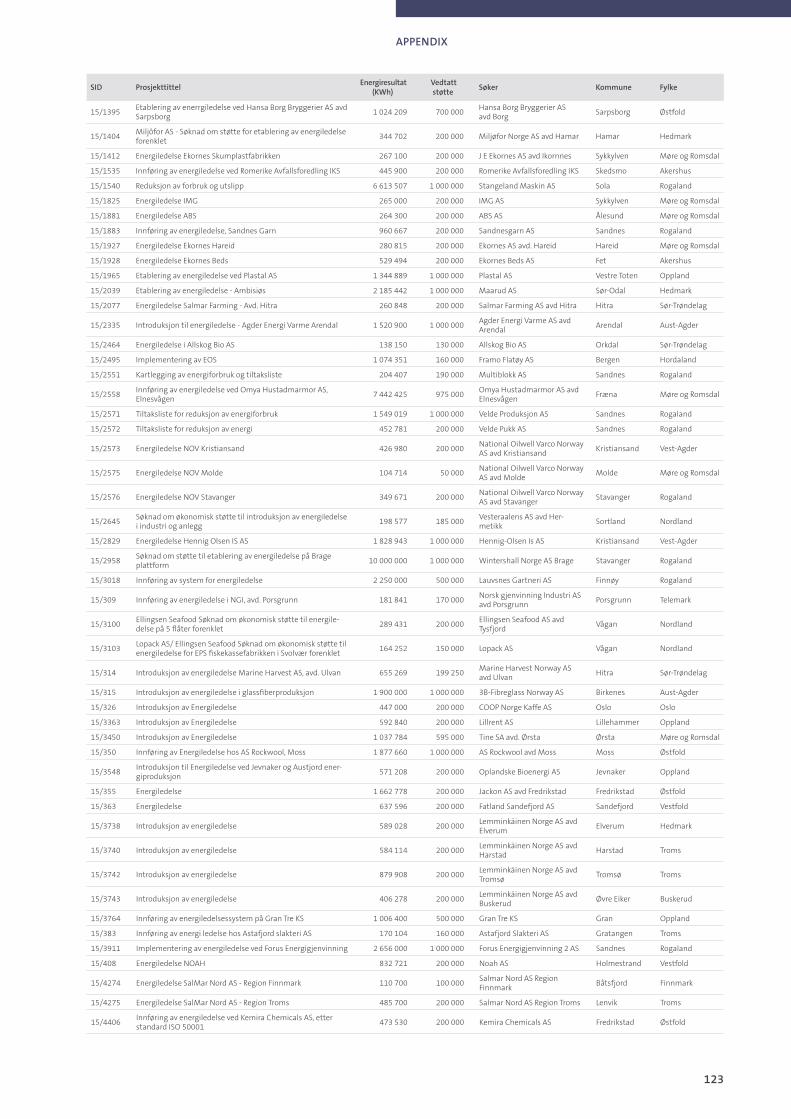
123
APPENDIX
15/1395Etablering av enerrgiledelse ved Hansa Borg Bryggerier AS avd Sarpsborg
1 024 209 700 000 Hansa Borg Bryggerier AS avd Borg
Sarpsborg Østfold
15/1404Miljôfor AS - Søknad om støtte for etablering av energiledelse forenklet
344 702 200 000 Miljøfor Norge AS avd Hamar Hamar Hedmark
15/1412 Energiledelse Ekornes Skumplastfabrikken 267 100 200 000 J E Ekornes AS avd Ikornnes Sykkylven Møre og Romsdal
15/1535 Innføring av energiledelse ved Romerike Avfallsforedling IKS 445 900 200 000 Romerike Avfallsforedling IKS Skedsmo Akershus
15/1540 Reduksjon av forbruk og utslipp 6 613 507 1 000 000 Stangeland Maskin AS Sola Rogaland
15/1825 Energiledelse IMG 265 000 200 000 IMG AS Sykkylven Møre og Romsdal
15/1881 Energiledelse ABS 264 300 200 000 ABS AS Ålesund Møre og Romsdal
15/1883 Innføring av energiledelse, Sandnes Garn 960 667 200 000 Sandnesgarn AS Sandnes Rogaland
15/1927 Energiledelse Ekornes Hareid 280 815 200 000 Ekornes AS avd. Hareid Hareid Møre og Romsdal
15/1928 Energiledelse Ekornes Beds 529 494 200 000 Ekornes Beds AS Fet Akershus
15/1965 Etablering av energiledelse ved Plastal AS 1 344 889 1 000 000 Plastal AS Vestre Toten Oppland
15/2039 Etablering av energiledelse - Ambisiøs 2 185 442 1 000 000 Maarud AS Sør-Odal Hedmark
15/2077 Energiledelse Salmar Farming - Avd. Hitra 260 848 200 000 Salmar Farming AS avd Hitra Hitra Sør-Trøndelag
15/2335 Introduksjon til energiledelse - Agder Energi Varme Arendal 1 520 900 1 000 000 Agder Energi Varme AS avd Arendal
Arendal Aust-Agder
15/2464 Energiledelse i Allskog Bio AS 138 150 130 000 Allskog Bio AS Orkdal Sør-Trøndelag
15/2495 Implementering av EOS 1 074 351 160 000 Framo Flatøy AS Bergen Hordaland
15/2551 Kartlegging av energiforbruk og tiltaksliste 204 407 190 000 Multiblokk AS Sandnes Rogaland
15/2558Innføring av energiledelse ved Omya Hustadmarmor AS, Elnesvågen
7 442 425 975 000 Omya Hustadmarmor AS avd Elnesvågen
Fræna Møre og Romsdal
15/2571 Tiltaksliste for reduksjon av energiforbruk 1 549 019 1 000 000 Velde Produksjon AS Sandnes Rogaland
15/2572 Tiltaksliste for reduksjon av energi 452 781 200 000 Velde Pukk AS Sandnes Rogaland
15/2573 Energiledelse NOV Kristiansand 426 980 200 000 National Oilwell Varco Norway AS avd Kristiansand
Kristiansand Vest-Agder
15/2575 Energiledelse NOV Molde 104 714 50 000 National Oilwell Varco Norway AS avd Molde
Molde Møre og Romsdal
15/2576 Energiledelse NOV Stavanger 349 671 200 000 National Oilwell Varco Norway AS avd Stavanger
Stavanger Rogaland
15/2645Søknad om økonomisk støtte til introduksjon av energiledelse i industri og anlegg
198 577 185 000 Vesteraalens AS avd Her-metikk
Sortland Nordland
15/2829 Energiledelse Hennig Olsen IS AS 1 828 943 1 000 000 Hennig-Olsen Is AS Kristiansand Vest-Agder
15/2958Søknad om støtte til etablering av energiledelse på Brage plattform
10 000 000 1 000 000 Wintershall Norge AS Brage Stavanger Rogaland
15/3018 Innføring av system for energiledelse 2 250 000 500 000 Lauvsnes Gartneri AS Finnøy Rogaland
15/309 Innføring av energiledelse i NGI, avd. Porsgrunn 181 841 170 000 Norsk gjenvinning Industri AS avd Porsgrunn
Porsgrunn Telemark
15/3100Ellingsen Seafood Søknad om økonomisk støtte til energile-delse på 5 flåter forenklet
289 431 200 000 Ellingsen Seafood AS avd Tysfjord
Vågan Nordland
15/3103Lopack AS/ Ellingsen Seafood Søknad om økonomisk støtte til energiledelse for EPS fiskekassefabrikken i Svolvær forenklet
164 252 150 000 Lopack AS Vågan Nordland
15/314 Introduksjon av energiledelse Marine Harvest AS, avd. Ulvan 655 269 199 250 Marine Harvest Norway AS avd Ulvan
Hitra Sør-Trøndelag
15/315 Introduksjon av energiledelse i glassfiberproduksjon 1 900 000 1 000 000 3B-Fibreglass Norway AS Birkenes Aust-Agder
15/326 Introduksjon av Energiledelse 447 000 200 000 COOP Norge Kaffe AS Oslo Oslo
15/3363 Introduksjon av Energiledelse 592 840 200 000 Lillrent AS Lillehammer Oppland
15/3450 Introduksjon av Energiledelse 1 037 784 595 000 Tine SA avd. Ørsta Ørsta Møre og Romsdal
15/350 Innføring av Energiledelse hos AS Rockwool, Moss 1 877 660 1 000 000 AS Rockwool avd Moss Moss Østfold
15/3548Introduksjon til Energiledelse ved Jevnaker og Austjord ener-giproduksjon
571 208 200 000 Oplandske Bioenergi AS Jevnaker Oppland
15/355 Energiledelse 1 662 778 200 000 Jackon AS avd Fredrikstad Fredrikstad Østfold
15/363 Energiledelse 637 596 200 000 Fatland Sandefjord AS Sandefjord Vestfold
15/3738 Introduksjon av energiledelse 589 028 200 000 Lemminkäinen Norge AS avd Elverum
Elverum Hedmark
15/3740 Introduksjon av energiledelse 584 114 200 000 Lemminkäinen Norge AS avd Harstad
Harstad Troms
15/3742 Introduksjon av energiledelse 879 908 200 000 Lemminkäinen Norge AS avd Tromsø
Tromsø Troms
15/3743 Introduksjon av energiledelse 406 278 200 000 Lemminkäinen Norge AS avd Buskerud
Øvre Eiker Buskerud
15/3764 Innføring av energiledelsessystem på Gran Tre KS 1 006 400 500 000 Gran Tre KS Gran Oppland
15/383 Innføring av energi ledelse hos Astafjord slakteri AS 170 104 160 000 Astafjord Slakteri AS Gratangen Troms
15/3911 Implementering av energiledelse ved Forus Energigjenvinning 2 656 000 1 000 000 Forus Energigjenvinning 2 AS Sandnes Rogaland
15/408 Energiledelse NOAH 832 721 200 000 Noah AS Holmestrand Vestfold
15/4274 Energiledelse SalMar Nord AS - Region Finnmark 110 700 100 000 Salmar Nord AS Region Finnmark
Båtsfjord Finnmark
15/4275 Energiledelse SalMar Nord AS - Region Troms 485 700 200 000 Salmar Nord AS Region Troms Lenvik Troms
15/4406Innføring av energiledelse ved Kemira Chemicals AS, etter standard ISO 50001
473 530 200 000 Kemira Chemicals AS Fredrikstad Østfold
SID ProsjekttittelEnergiresultat
(KWh)Vedtattstøtte
Søker Kommune Fylke
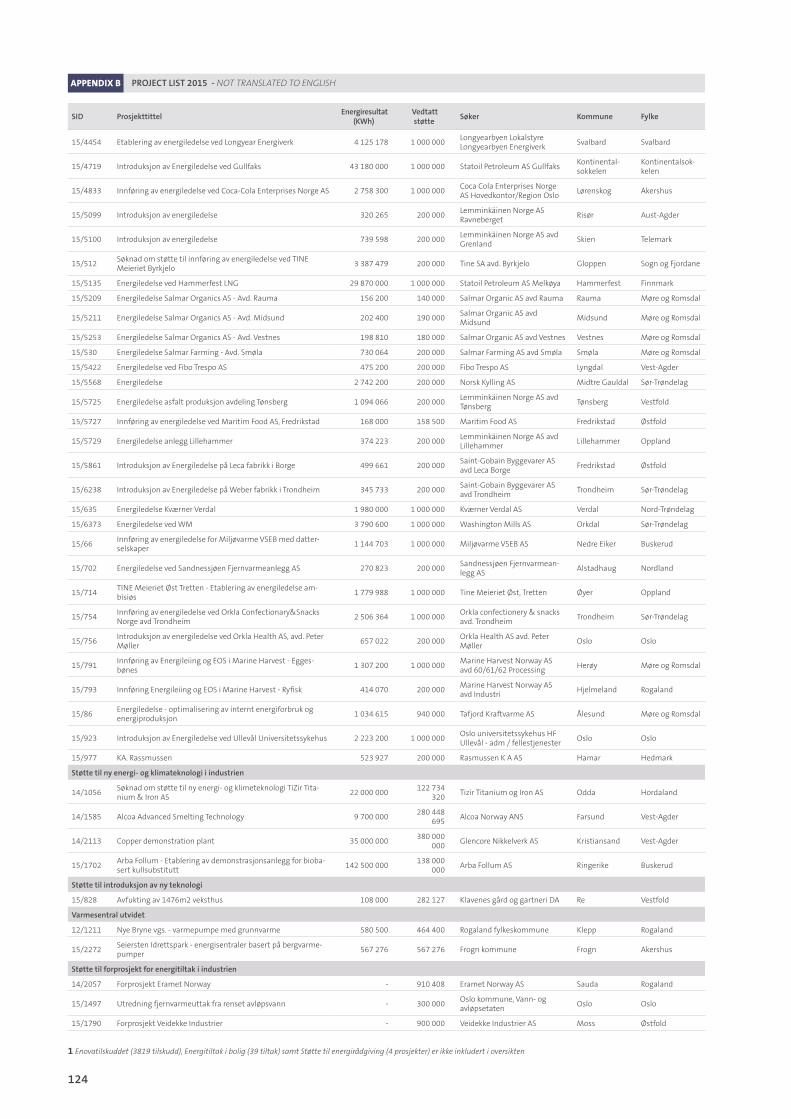
124
APPENDIX B PROJECT LIST 2015 - NOT TRANSLATED TO ENGLISH
15/4454 Etablering av energiledelse ved Longyear Energiverk 4 125 178 1 000 000 Longyearbyen Lokalstyre Longyearbyen Energiverk
Svalbard Svalbard
15/4719 Introduksjon av Energiledelse ved Gullfaks 43 180 000 1 000 000 Statoil Petroleum AS GullfaksKontinental-sokkelen
Kontinentalsok-kelen
15/4833 Innføring av energiledelse ved Coca-Cola Enterprises Norge AS 2 758 300 1 000 000 Coca Cola Enterprises Norge AS Hovedkontor/Region Oslo
Lørenskog Akershus
15/5099 Introduksjon av energiledelse 320 265 200 000 Lemminkäinen Norge AS Ravneberget
Risør Aust-Agder
15/5100 Introduksjon av energiledelse 739 598 200 000 Lemminkäinen Norge AS avd Grenland
Skien Telemark
15/512Søknad om støtte til innføring av energiledelse ved TINE Meieriet Byrkjelo
3 387 479 200 000 Tine SA avd. Byrkjelo Gloppen Sogn og Fjordane
15/5135 Energiledelse ved Hammerfest LNG 29 870 000 1 000 000 Statoil Petroleum AS Melkøya Hammerfest Finnmark
15/5209 Energiledelse Salmar Organics AS - Avd. Rauma 156 200 140 000 Salmar Organic AS avd Rauma Rauma Møre og Romsdal
15/5211 Energiledelse Salmar Organics AS - Avd. Midsund 202 400 190 000 Salmar Organic AS avd Midsund
Midsund Møre og Romsdal
15/5253 Energiledelse Salmar Organics AS - Avd. Vestnes 198 810 180 000 Salmar Organic AS avd Vestnes Vestnes Møre og Romsdal
15/530 Energiledelse Salmar Farming - Avd. Smøla 730 064 200 000 Salmar Farming AS avd Smøla Smøla Møre og Romsdal
15/5422 Energiledelse ved Fibo Trespo AS 475 200 200 000 Fibo Trespo AS Lyngdal Vest-Agder
15/5568 Energiledelse 2 742 200 200 000 Norsk Kylling AS Midtre Gauldal Sør-Trøndelag
15/5725 Energiledelse asfalt produksjon avdeling Tønsberg 1 094 066 200 000 Lemminkäinen Norge AS avd Tønsberg
Tønsberg Vestfold
15/5727 Innføring av energiledelse ved Maritim Food AS, Fredrikstad 168 000 158 500 Maritim Food AS Fredrikstad Østfold
15/5729 Energiledelse anlegg Lillehammer 374 223 200 000 Lemminkäinen Norge AS avd Lillehammer
Lillehammer Oppland
15/5861 Introduksjon av Energiledelse på Leca fabrikk i Borge 499 661 200 000 Saint-Gobain Byggevarer AS avd Leca Borge
Fredrikstad Østfold
15/6238 Introduksjon av Energiledelse på Weber fabrikk i Trondheim 345 733 200 000 Saint-Gobain Byggevarer AS avd Trondheim
Trondheim Sør-Trøndelag
15/635 Energiledelse Kværner Verdal 1 980 000 1 000 000 Kværner Verdal AS Verdal Nord-Trøndelag
15/6373 Energiledelse ved WM 3 790 600 1 000 000 Washington Mills AS Orkdal Sør-Trøndelag
15/66Innføring av energiledelse for Miljøvarme VSEB med datter-selskaper
1 144 703 1 000 000 Miljøvarme VSEB AS Nedre Eiker Buskerud
15/702 Energiledelse ved Sandnessjøen Fjernvarmeanlegg AS 270 823 200 000 Sandnessjøen Fjernvarmean-legg AS
Alstadhaug Nordland
15/714TINE Meieriet Øst Tretten - Etablering av energiledelse am-bisiøs
1 779 988 1 000 000 Tine Meieriet Øst, Tretten Øyer Oppland
15/754Innføring av energiledelse ved Orkla Confectionary&Snacks Norge avd Trondheim
2 506 364 1 000 000 Orkla confectionery & snacks avd. Trondheim
Trondheim Sør-Trøndelag
15/756Introduksjon av energiledelse ved Orkla Health AS, avd. Peter Møller
657 022 200 000 Orkla Health AS avd. Peter Møller
Oslo Oslo
15/791Innføring av Energileiing og EOS i Marine Harvest - Egges-bønes
1 307 200 1 000 000 Marine Harvest Norway AS avd 60/61/62 Processing
Herøy Møre og Romsdal
15/793 Innføring Energileiing og EOS i Marine Harvest - Ryfisk 414 070 200 000 Marine Harvest Norway AS avd Industri
Hjelmeland Rogaland
15/86Energiledelse - optimalisering av internt energiforbruk og energiproduksjon
1 034 615 940 000 Tafjord Kraftvarme AS Ålesund Møre og Romsdal
15/923 Introduksjon av Energiledelse ved Ullevål Universitetssykehus 2 223 200 1 000 000 Oslo universitetssykehus HF Ullevål - adm / fellestjenester
Oslo Oslo
15/977 KA. Rassmussen 523 927 200 000 Rasmussen K A AS Hamar Hedmark
Støttetilnyenergi-ogklimateknologiiindustrien
14/1056Søknad om støtte til ny energi- og klimeteknologi TiZir Tita-nium & Iron AS
22 000 000 122 734
320 Tizir Titanium og Iron AS Odda Hordaland
14/1585 Alcoa Advanced Smelting Technology 9 700 000 280 448
695 Alcoa Norway ANS Farsund Vest-Agder
14/2113 Copper demonstration plant 35 000 000 380 000
000 Glencore Nikkelverk AS Kristiansand Vest-Agder
15/1702Arba Follum - Etablering av demonstrasjonsanlegg for bioba-sert kullsubstitutt
142 500 000 138 000
000 Arba Follum AS Ringerike Buskerud
Støttetilintroduksjonavnyteknologi
15/828 Avfukting av 1476m2 veksthus 108 000 282 127 Klavenes gård og gartneri DA Re Vestfold
Varmesentralutvidet
12/1211 Nye Bryne vgs. - varmepumpe med grunnvarme 580 500 464 400 Rogaland fylkeskommune Klepp Rogaland
15/2272Seiersten Idrettspark - energisentraler basert på bergvarme-pumper
567 276 567 276 Frogn kommune Frogn Akershus
Støttetilforprosjektforenergitiltakiindustrien
14/2057 Forprosjekt Eramet Norway - 910 408 Eramet Norway AS Sauda Rogaland
15/1497 Utredning fjernvarmeuttak fra renset avløpsvann - 300 000 Oslo kommune, Vann- og avløpsetaten
Oslo Oslo
15/1790 Forprosjekt Veidekke Industrier - 900 000 Veidekke Industrier AS Moss Østfold
1 Enovatilskuddet (3819 tilskudd), Energitiltak i bolig (39 tiltak) samt Støtte til energirådgiving (4 prosjekter) er ikke inkludert i oversikten
SID ProsjekttittelEnergiresultat
(KWh)Vedtattstøtte
Søker Kommune Fylke
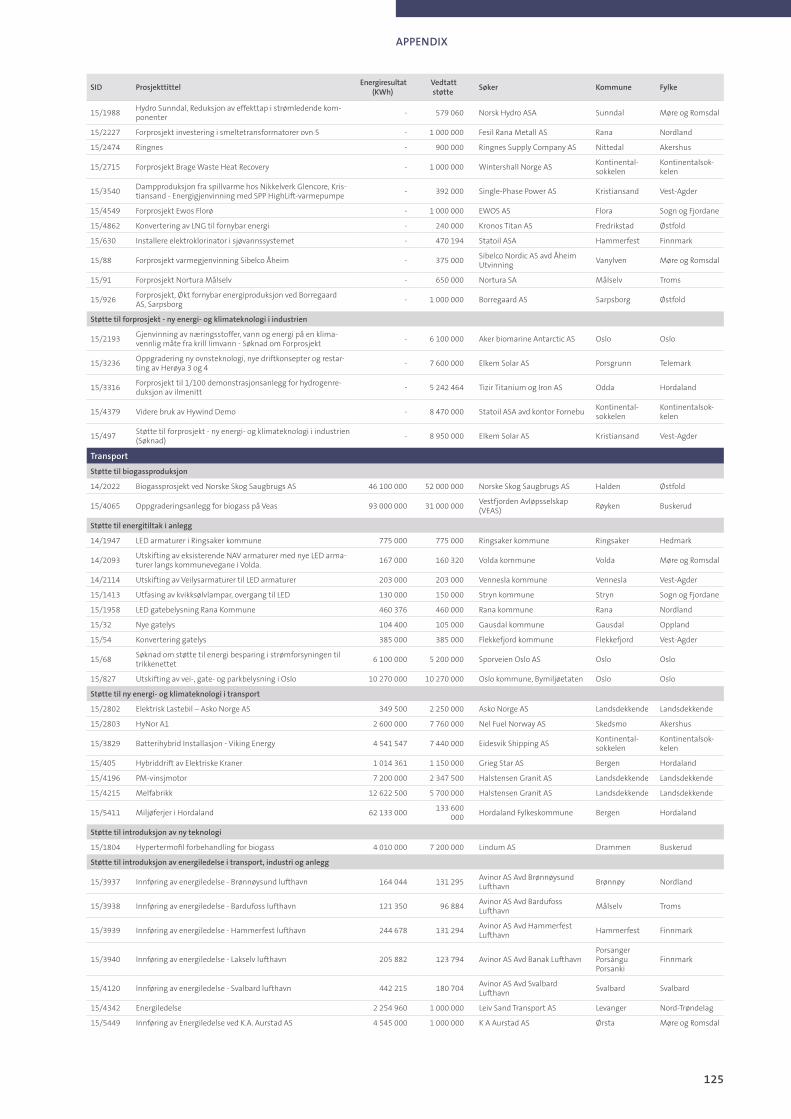
125
APPENDIX
15/1988Hydro Sunndal, Reduksjon av effekttap i strømledende kom-ponenter
- 579 060 Norsk Hydro ASA Sunndal Møre og Romsdal
15/2227 Forprosjekt investering i smeltetransformatorer ovn 5 - 1 000 000 Fesil Rana Metall AS Rana Nordland
15/2474 Ringnes - 900 000 Ringnes Supply Company AS Nittedal Akershus
15/2715 Forprosjekt Brage Waste Heat Recovery - 1 000 000 Wintershall Norge ASKontinental-sokkelen
Kontinentalsok-kelen
15/3540Dampproduksjon fra spillvarme hos Nikkelverk Glencore, Kris-tiansand - Energigjenvinning med SPP HighLift-varmepumpe
- 392 000 Single-Phase Power AS Kristiansand Vest-Agder
15/4549 Forprosjekt Ewos Florø - 1 000 000 EWOS AS Flora Sogn og Fjordane
15/4862 Konvertering av LNG til fornybar energi - 240 000 Kronos Titan AS Fredrikstad Østfold
15/630 Installere elektroklorinator i sjøvannssystemet - 470 194 Statoil ASA Hammerfest Finnmark
15/88 Forprosjekt varmegjenvinning Sibelco Åheim - 375 000 Sibelco Nordic AS avd Åheim Utvinning
Vanylven Møre og Romsdal
15/91 Forprosjekt Nortura Målselv - 650 000 Nortura SA Målselv Troms
15/926Forprosjekt, Økt fornybar energiproduksjon ved Borregaard AS, Sarpsborg
- 1 000 000 Borregaard AS Sarpsborg Østfold
Støttetilforprosjekt-nyenergi-ogklimateknologiiindustrien
15/2193Gjenvinning av næringsstoffer, vann og energi på en klima-vennlig måte fra krill limvann - Søknad om Forprosjekt
- 6 100 000 Aker biomarine Antarctic AS Oslo Oslo
15/3236Oppgradering ny ovnsteknologi, nye driftkonsepter og restar-ting av Herøya 3 og 4
- 7 600 000 Elkem Solar AS Porsgrunn Telemark
15/3316Forprosjekt til 1/100 demonstrasjonsanlegg for hydrogenre-duksjon av ilmenitt
- 5 242 464 Tizir Titanium og Iron AS Odda Hordaland
15/4379 Videre bruk av Hywind Demo - 8 470 000 Statoil ASA avd kontor FornebuKontinental-sokkelen
Kontinentalsok-kelen
15/497Støtte til forprosjekt - ny energi- og klimateknologi i industrien (Søknad)
- 8 950 000 Elkem Solar AS Kristiansand Vest-Agder
Transport
Støttetilbiogassproduksjon
14/2022 Biogassprosjekt ved Norske Skog Saugbrugs AS 46 100 000 52 000 000 Norske Skog Saugbrugs AS Halden Østfold
15/4065 Oppgraderingsanlegg for biogass på Veas 93 000 000 31 000 000 Vestfjorden Avløpsselskap (VEAS)
Røyken Buskerud
Støttetilenergitiltakianlegg
14/1947 LED armaturer i Ringsaker kommune 775 000 775 000 Ringsaker kommune Ringsaker Hedmark
14/2093Utskifting av eksisterende NAV armaturer med nye LED arma-turer langs kommunevegane i Volda.
167 000 160 320 Volda kommune Volda Møre og Romsdal
14/2114 Utskifting av Veilysarmaturer til LED armaturer 203 000 203 000 Vennesla kommune Vennesla Vest-Agder
15/1413 Utfasing av kvikksølvlampar, overgang til LED 130 000 150 000 Stryn kommune Stryn Sogn og Fjordane
15/1958 LED gatebelysning Rana Kommune 460 376 460 000 Rana kommune Rana Nordland
15/32 Nye gatelys 104 400 105 000 Gausdal kommune Gausdal Oppland
15/54 Konvertering gatelys 385 000 385 000 Flekkefjord kommune Flekkefjord Vest-Agder
15/68Søknad om støtte til energi besparing i strømforsyningen til trikkenettet
6 100 000 5 200 000 Sporveien Oslo AS Oslo Oslo
15/827 Utskifting av vei-, gate- og parkbelysning i Oslo 10 270 000 10 270 000 Oslo kommune, Bymiljøetaten Oslo Oslo
Støttetilnyenergi-ogklimateknologiitransport
15/2802 Elektrisk Lastebil – Asko Norge AS 349 500 2 250 000 Asko Norge AS Landsdekkende Landsdekkende
15/2803 HyNor A1 2 600 000 7 760 000 Nel Fuel Norway AS Skedsmo Akershus
15/3829 Batterihybrid Installasjon - Viking Energy 4 541 547 7 440 000 Eidesvik Shipping ASKontinental-sokkelen
Kontinentalsok-kelen
15/405 Hybriddrift av Elektriske Kraner 1 014 361 1 150 000 Grieg Star AS Bergen Hordaland
15/4196 PM-vinsjmotor 7 200 000 2 347 500 Halstensen Granit AS Landsdekkende Landsdekkende
15/4215 Melfabrikk 12 622 500 5 700 000 Halstensen Granit AS Landsdekkende Landsdekkende
15/5411 Miljøferjer i Hordaland 62 133 000 133 600
000 Hordaland Fylkeskommune Bergen Hordaland
Støttetilintroduksjonavnyteknologi
15/1804 Hypertermofil forbehandling for biogass 4 010 000 7 200 000 Lindum AS Drammen Buskerud
Støttetilintroduksjonavenergiledelseitransport,industrioganlegg
15/3937 Innføring av energiledelse - Brønnøysund lufthavn 164 044 131 295 Avinor AS Avd Brønnøysund Lufthavn
Brønnøy Nordland
15/3938 Innføring av energiledelse - Bardufoss lufthavn 121 350 96 884 Avinor AS Avd Bardufoss Lufthavn
Målselv Troms
15/3939 Innføring av energiledelse - Hammerfest lufthavn 244 678 131 294 Avinor AS Avd Hammerfest Lufthavn
Hammerfest Finnmark
15/3940 Innføring av energiledelse - Lakselv lufthavn 205 882 123 794 Avinor AS Avd Banak LufthavnPorsanger Porsángu Porsanki
Finnmark
15/4120 Innføring av energiledelse - Svalbard lufthavn 442 215 180 704 Avinor AS Avd Svalbard Lufthavn
Svalbard Svalbard
15/4342 Energiledelse 2 254 960 1 000 000 Leiv Sand Transport AS Levanger Nord-Trøndelag
15/5449 Innføring av Energiledelse ved K.A. Aurstad AS 4 545 000 1 000 000 K A Aurstad AS Ørsta Møre og Romsdal
SID ProsjekttittelEnergiresultat
(KWh)Vedtattstøtte
Søker Kommune Fylke

126
APPENDIX B PROJECT LIST 2015 - NOT TRANSLATED TO ENGLISH
Støttetilladeinfrastruktur
15/5254 E18 Oslo-Grenland-Kristiansand - 489 000 Fortum Markets AS Landsdekkende Landsdekkende
15/5256 E6 Oslo-Trondheim - 1 230 000 Fortum Markets AS Landsdekkende Landsdekkende
15/5260 RV3 Kolomoen-Ulsberg - 4 700 000 Fortum Markets AS Landsdekkende Landsdekkende
15/5261 E16 Sandvika-Bergen - 1 725 000 Fortum Markets AS Landsdekkende Landsdekkende
15/5272 RV7 Hønefoss-Gol og RV52 Gol-Borlaug - 740 000 Fortum Markets AS Landsdekkende Landsdekkende
15/5274 E39 Kristiansand-Stavanger - 1 650 000 Fortum Markets AS Landsdekkende Landsdekkende
Anlegg
Støttetilenergitiltakianlegg
14/2000 Norsk Bio - Byggvarme fra fast biobrensel 1 480 000 1 240 000 Norsk Bio AS Landsdekkende Landsdekkende
15/1052 Undervarmeprosjektet på Korsvollbanen 400 000 450 000 Korsvoll Idrettslag Oslo Oslo
15/1954 Nytt varmeanlegg hos Skardalen Settefisk 1 080 000 800 000 Skardalen Settefisk ASGáivuotna Kåfjord
Troms
15/2042 Landstrømanlegg for oppdrettsanlegg 8 400 000 10 000 000 Salmar Farming AS Frøya Sør-Trøndelag
15/2443 Utskiftning av lys 700 000 840 000 Sapa Profiler Magnor AS Eidskog Hedmark
15/2445 Landstrøm på fôrflåter på Kleiva, Bjørnstein og i Gregusvika 754 500 390 000 Gratanglaks AS Gratangen Troms
15/2501 Energieffektivisering ventilasjon Stiftelsen Trondheim Pirbad 1 305 000 1 400 000 Stiftelsen Trondheim Pirbad Trondheim Sør-Trøndelag
15/2559 Landstrøm Ystevika 260 000 257 073 Trollvika Drift AS Skånland Troms
15/294 Lefdal Mine Datacenter AS - Investering i kjølesystem 6 200 000 7 000 000 Lefdal Mine Datacenter AS Eid Sogn og Fjordane
15/3232 Lørenbanen 1 658 000 1 658 000 Sporveien Oslo AS Oslo Oslo
15/3691Klemetsrudanlegget AS - Økning fjernvarmeleveranser Oslo - Forbrenningslinje 3 - Varmepumpeprosjekt 2015-2016
40 000 000 42 000 000 Klemetsrudanlegget AS Oslo Oslo
15/3931 Undervarme Røa kunstgress 400 000 480 000 Røa Allianseidrettslag Oslo Oslo
15/4277 Støtte til energibruk til anlegg 408 000 490 000 Kristiansund kommune Kristiansund Møre og Romsdal
15/964 Røyken Svømmehall 1 010 000 940 000 Røyken Eiendom AS Røyken Buskerud
Støtte til introduksjon av ny teknologi
15/498 Demonstrasjonsprogram for SmartGrid-teknologi 500 000 14 687 000 Lyse Elnett AS Stavanger Rogaland
Yrkesbygg
Støttetileksisterendebygg
14/1239 Nordlandet ungdomsskole - Rehabilitering 48 600 - Kristiansund kommune Kristiansund Møre og Romsdal
14/1939 Energieffektiv drift 379 310 474 138 Follum Eiendom AS Ringerike Buskerud
14/1965 Rehabilitering av blokkajordet barnehage 173 162 164 168 Omsorgsbygg Oslo KF Oslo Oslo
14/1978 Årstad vgs, A-bygget 1 222 205 1 527 757 Hordaland Fylkeskommune Bergen Hordaland
14/1981 Enøk-tiltak i og rundt Treskeveien 5 4043 Hafrfjord 459 949 489 637 Revheim Eiendom AS Stavanger Rogaland
14/2006 Varmepumpe 339 312 273 165 Ringsaker kommune Ringsaker Hedmark
14/2010 IKM-Mekaniske, Nærbø 58 920 73 651 Bjorhaugsletta 22-85 AS Stavanger Rogaland
14/2018 Energibesparelser byggevarehus nesmoen 190 240 128 000 Beia Eiendom AS Nes Buskerud
14/2021 Oppgradering eksisterende kontorlokaler Vestre Braarudgate 2 132 304 165 380 Kompetansehuset AS Horten Vestfold
14/2025 Snarøyveien 34 175 064 204 009 Sethia Nordic AS Ås Akershus
14/2041 Magnus Poulssons vei 7 479 164 598 956 NPJ AS Bærum Akershus
14/2043Toppsystem for bygg, Sliperiet, Plateverkstedet og Fritzøe Brygge
406 594 508 244 Fritzøe Eiendom AS Larvik Vestfold
14/2044 Stamas Solutions AS, Hammaren 9A 138 052 76 773 Stamas Solutions AS Stavanger Rogaland
14/2048 Tankbåtvegen 1, rehabilitering 214 467 268 085 Tankbåtveien 1 AS Stavanger Rogaland
14/2049 Kulturbygget AS 295 023 365 338 Hemne Prosjekt AS Hemne Sør-Trøndelag
14/2079 Energibesparelser i eksisterende bygg 2014 1 300 327 1 625 409 Trelleborg Offshore Norway AS Nedre Eiker Buskerud
14/2112 Rissa EPC Fase 2, del 2 resterende bygg 1 547 977 1 053 575 Rissa kommune Rissa Sør-Trøndelag
14/2117 Energibesparende tiltak skolebygg Sandnes kommune 3 267 678 3 502 523 Sandnes kommune Sandnes Rogaland
15/102 Energieffektivisering av bygg 149 025 172 301 Eskoleia AS Kongsvinger Hedmark
15/1031Sykkylven kommune arbeider med energikartlegging av sine bygninger og ønsker å komme i gang med investeringer som reduserer energiforbruket.
2 527 012 2 649 530 Sykkylven kommune Sykkylven Møre og Romsdal
15/1035 Oppgradering Varden skole, Bygg A 421 030 526 288 Bergen kommune Bergen Hordaland
15/1037 Kirkegaten 15 - ombygging 5.-9. etg inkl fellesarealer 825 152 1 031 440 Kirkegaten 15 DA Oslo Oslo
15/1039Søknad Lillo Studenthus Sandakerveien 99 Oslo, revidert søknad
902 364 949 524 Studentsamskipnaden i Oslo og Akershus
Oslo Oslo
15/1051 Bulandet Fiskeindustri A/S, utviding 2015. 178 350 120 000 Bulandet Eigedom AS Askvoll Sogn og Fjordane
15/1069 Energieffektiv SPAR Grandsenteret 249 637 312 047 NG Spar Innland AS Hamar Hedmark
15/11 EPC Gausdal kommune 4 103 077 4 988 101 Gausdal kommune Gausdal Oppland
15/1121 Enøk Traktor Eiendom AS 142 054 134 918 Traktor Eiendom AS Kristiansand Vest-Agder
15/1159 dhusgaten 1-3 348 815 265 193 Rådhusgaten 1-3 Eiendom AS Oslo Oslo
15/118 Bugården, Sandefjord og Sandar kirker 645 367 432 396 Sandefjord kommune Sandefjord Vestfold
1 Enovatilskuddet (3819 tilskudd), Energitiltak i bolig (39 tiltak) samt Støtte til energirådgiving (4 prosjekter) er ikke inkludert i oversikten
SID ProsjekttittelEnergiresultat
(KWh)Vedtattstøtte
Søker Kommune Fylke

127
APPENDIX
15/120 Rehabilitering forretningsbygg 1 109 370 1 237 438 Båtmannsgt 4 AS Trondheim Sør-Trøndelag
15/1205 Utbyttelse av overskuddsvarme Asko Kalbakken 2 917 143 2 758 512 Asko Norge AS Oslo Oslo
15/1211 Strandvegen 32, Brumunddal 208 049 163 986 Tema Eiendom AS Ringsaker Hedmark
15/1221 Rehabiliteringsprosjekt Skodje - redusert miljøpåvirkning 398 034 446 299 Nordic Supply AS Ålesund Møre og Romsdal
15/1287 Oslo Konserthus 620 065 192 272 Oslo Konserthus AS Oslo Oslo
15/1289 Tollbugata 8 1 315 402 1 205 870 T8 Holding AS Oslo Oslo
15/1290 Energitiltak Rådhusteateret 37 532 46 915 Kongsvinger kommune Kongsvinger Hedmark
15/132 Utfasing av olje som grunnlast 2 430 686 1 657 200 Statsbygg Landsdekkende Landsdekkende
15/1324 Varmepumpe Borglia barnehage 41 592 26 400 Frosta kommune Frosta Nord-Trøndelag
15/1325 EPC Flesberg 746 909 897 384 Flesberg Kommune Flesberg Buskerud
15/1341 Enøktiltak PTS1 1 165 104 1 456 380 Stiftelsen SINTEF Trondheim Sør-Trøndelag
15/140 Energiledelse og enøktiltak Vestby kommune 5 851 030 5 946 014 Vestby kommune Vestby Akershus
15/1411 Energieffektivisering av Omsorgsbygg sine sykehjem 4 921 114 6 133 993 Omsorgsbygg Oslo KF Oslo Oslo
15/1419 Lys og ventilasjon Schenker Kristiansand 100 334 125 418 Schenker AS Kristiansand Vest-Agder
15/1433Rehabilitering Baker Østbysvei - Kontorer, Tesla verksted og salgsareal
1 351 525 1 689 407 Baker Østbyes vei 5-13 AS Bærum Akershus
15/146 Enøktiltak Pharmaq Overhalla 528 461 413 526 Pharmaq Holding AS Overhalla Nord-Trøndelag
15/150 Energitiltak Omsorgsenter og Ungdomsskole 1 071 245 1 307 070 Lindesnes kommune Kristiansand Vest-Agder
15/1563 Galleri Oslo 2 575 130 2 633 157 Sameiet Galleriet Oslo Oslo
15/1567 Kirkegate 25-27 Lillestrøm 24 793 18 197 Nordiske Eiendommer Ås Akershus
15/1581 Fauske Helsetun 413 524 201 424 Fauske Eiendom KF Fauske Nordland
15/159 IKM-Mekaniske bygg2, Nærbø 23 474 29 344 Bjorhaugsletta 22-85 AS Hå Rogaland
15/1606 Energitiltak eksisterende bygg NMR 144 625 144 597 Universitetet i Bergen Eien-dom AS
Bergen Hordaland
15/162Skedsmo kommune - Gjennomføring av tiltak i EPC-prosjekt (pakke 1)
6 106 151 7 126 221 Skedsmo kommune Skedsmo Akershus
15/1626Energieffektiviseringstiltak for Jordfagbygget på Norges miljø- og biovitenskapelige universitet
348 364 363 997 Norges Miljø- og biovitenskap-lige universitet
Ås Akershus
15/1646Holbergsgate 21 - Enøkprosjekt og overgang fra elektrisk energi
1 038 093 856 729 Eiendomsspar AS Oslo Oslo
15/1678 Dronning Mauds gate 11 1 430 655 1 788 319 Vestre Vika DA Oslo Oslo
15/1683 Sol - varme og strøm - campinganlegg 48 941 40 863 Lyngstrand Camping Selj Søndre Land Oppland
15/1684 Diakonhjemmet sykehus 399 273 499 092 Diakonhjemmet sykehus AS Oslo Oslo
15/1685 Lysaker Torg 6-12 - energieffektivisering 1 918 531 2 398 164 Lysaker Torg 6-12 ANS Oslo Oslo
15/1687 PBM - Teknisk oppgradering - Portefølje av bygg 942 958 950 017 Pareto Business Manage-ment AS
Landsdekkende Landsdekkende
15/1703 Rehabilitering Østerlide 67 896 84 870 Stavanger Røde Kors Stavanger Rogaland
15/1716Jevnaker kommune - gjennomføring av energitiltak (fase 2) i EPC-prosjekt
2 358 629 2 543 506 Jevnaker kommune Jevnaker Oppland
15/1749Oslo Areal - byggportefølje rehabilitering til mer energief-fektive bygg
1 892 636 1 338 138 Oslo Areal AS Landsdekkende Landsdekkende
15/1771 Rehabilitering tekniske anlegg 1 043 303 1 103 280 Fjell kommune eigedom Fjell Hordaland
15/1776 Rehabilitering fase 3 - Grieghallen 264 049 330 062 Grieghallen AS Bergen Hordaland
15/1806 Rehabilitering av Vonheim 71 340 48 000 Kodal Ungdomslag Andebu Vestfold
15/1813 Energisparing eksisterende kommunale bygg 1 947 039 2 159 300 Tynset kommune Tynset Hedmark
15/1841 Enøktiltak for Bjerkely folkehøyskole 155 970 99 000 Bjerkely Folkehøgskole Åsnes Hedmark
15/1878 Enova søknad 2 305 749 222 398 KA Kirkelig Arbeidsgiver- og interesseorganisasjon
Landsdekkende Landsdekkende
15/1879 Breivika Utvikling AS 980 332 1 225 415 Breivika Utvikling AS Tromsø Troms
15/1880 Energisparing hos Fjordlaks Aqua AS (Eksisterende Bygg) 1 596 537 1 995 672 Fjordlaks aqua AS Ålesund Møre og Romsdal
15/1887 E-kutt 1 i Norsk Butikkdrift AS 2 151 812 2 689 765 Coop Norge SA Oslo Oslo
15/191 Energitiltak Den Lille dyrehagen 570 758 354 520 Heia-Eiendom AS Gjerstad Aust-Agder
15/1929 Berg gård - Omsorgsboliger, dagsenter og barnehage 1 366 837 1 291 511 Omsorgsbygg Oslo KF Oslo Oslo
15/1990 Energireduksjon Rødmyrlia 39 351 196 438 996 Bama Storkjøkken Telemark AS Skien Telemark
15/2000 ROM for ENØK - ENOVA prosjekt 1 (2015-2018) 4 444 355 5 418 194 Rom Eiendom AS Landsdekkende Landsdekkende
15/2036 Nygårdsporten G, F og D-blokk 2 534 329 2 383 531 Odfjell Eiendom AS Bergen Hordaland
15/2040 Oppgradering Hå Rådhus 396 523 359 700 Hå kommune Hå Rogaland
15/2076 Scandic Vadsø - nytt ventilasjonsanlegg 403 169 327 636 Rica Eiendom Holding AS Alta Finnmark
15/2108 Enova søknad 3 129 254 113 225 KA Kirkelig Arbeidsgiver- og interesseorganisasjon
Landsdekkende Landsdekkende
15/2118 DNB klimavennlig 319 656 306 890 Måløy eiendomsutvikling Vågsøy Sogn og Fjordane
15/2119Nytt varmeanlegg ved Hunn skole samt enøktiltak med ventilasjonen.
875 126 493 000 Overhalla kommune Overhalla Nord-Trøndelag
15/2134 Renovering og rehabilitering av Narvik Rådhus 1 418 897 1 613 684 Narvik kommune Narvik Nordland
15/2140 Iveland Skole 262 250 261 933 Iveland kommune teknisk etat Iveland Aust-Agder
15/2164 Fønix, Ekte treningsglede ny ventilasjon. 240 948 239 578 Brumunddal Næringspark AS Ringsaker Hedmark
SID ProsjekttittelEnergiresultat
(KWh)Vedtattstøtte
Søker Kommune Fylke
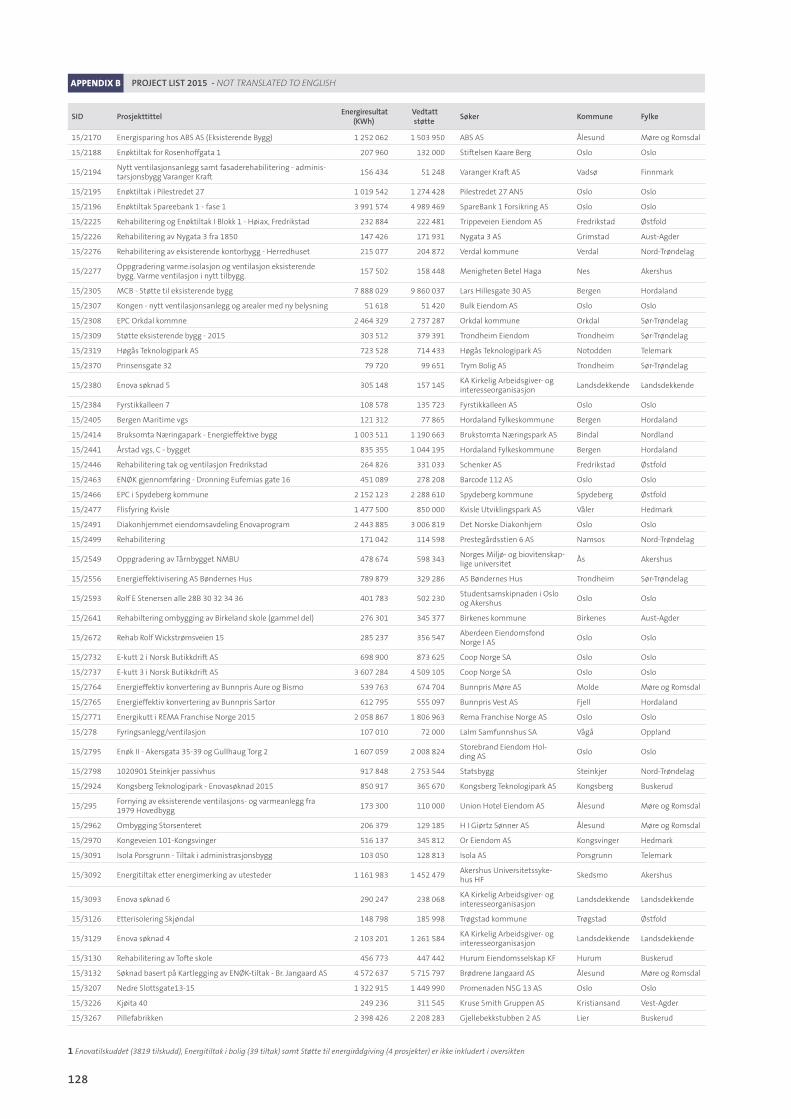
128
APPENDIX B PROJECT LIST 2015 - NOT TRANSLATED TO ENGLISH
15/2170 Energisparing hos ABS AS (Eksisterende Bygg) 1 252 062 1 503 950 ABS AS Ålesund Møre og Romsdal
15/2188 Enøktiltak for Rosenhoffgata 1 207 960 132 000 Stiftelsen Kaare Berg Oslo Oslo
15/2194Nytt ventilasjonsanlegg samt fasaderehabilitering - adminis-tarsjonsbygg Varanger Kraft
156 434 51 248 Varanger Kraft AS Vadsø Finnmark
15/2195 Enøktiltak i Pilestredet 27 1 019 542 1 274 428 Pilestredet 27 ANS Oslo Oslo
15/2196 Enøktiltak Spareebank 1 - fase 1 3 991 574 4 989 469 SpareBank 1 Forsikring AS Oslo Oslo
15/2225 Rehabilitering og Enøktiltak I Blokk 1 - Høiax, Fredrikstad 232 884 222 481 Trippeveien Eiendom AS Fredrikstad Østfold
15/2226 Rehabilitering av Nygata 3 fra 1850 147 426 171 931 Nygata 3 AS Grimstad Aust-Agder
15/2276 Rehabilitering av eksisterende kontorbygg - Herredhuset 215 077 204 872 Verdal kommune Verdal Nord-Trøndelag
15/2277Oppgradering varme.isolasjon og ventilasjon eksisterende bygg. Varme ventilasjon i nytt tilbygg.
157 502 158 448 Menigheten Betel Haga Nes Akershus
15/2305 MCB - Støtte til eksisterende bygg 7 888 029 9 860 037 Lars Hillesgate 30 AS Bergen Hordaland
15/2307 Kongen - nytt ventilasjonsanlegg og arealer med ny belysning 51 618 51 420 Bulk Eiendom AS Oslo Oslo
15/2308 EPC Orkdal kommne 2 464 329 2 737 287 Orkdal kommune Orkdal Sør-Trøndelag
15/2309 Støtte eksisterende bygg - 2015 303 512 379 391 Trondheim Eiendom Trondheim Sør-Trøndelag
15/2319 Høgås Teknologipark AS 723 528 714 433 Høgås Teknologipark AS Notodden Telemark
15/2370 Prinsensgate 32 79 720 99 651 Trym Bolig AS Trondheim Sør-Trøndelag
15/2380 Enova søknad 5 305 148 157 145 KA Kirkelig Arbeidsgiver- og interesseorganisasjon
Landsdekkende Landsdekkende
15/2384 Fyrstikkalleen 7 108 578 135 723 Fyrstikkalleen AS Oslo Oslo
15/2405 Bergen Maritime vgs 121 312 77 865 Hordaland Fylkeskommune Bergen Hordaland
15/2414 Bruksomta Næringapark - Energieffektive bygg 1 003 511 1 190 663 Brukstomta Næringspark AS Bindal Nordland
15/2441 Årstad vgs, C - bygget 835 355 1 044 195 Hordaland Fylkeskommune Bergen Hordaland
15/2446 Rehabilitering tak og ventilasjon Fredrikstad 264 826 331 033 Schenker AS Fredrikstad Østfold
15/2463 ENØK gjennomføring - Dronning Eufemias gate 16 451 089 278 208 Barcode 112 AS Oslo Oslo
15/2466 EPC i Spydeberg kommune 2 152 123 2 288 610 Spydeberg kommune Spydeberg Østfold
15/2477 Flisfyring Kvisle 1 477 500 850 000 Kvisle Utviklingspark AS Våler Hedmark
15/2491 Diakonhjemmet eiendomsavdeling Enovaprogram 2 443 885 3 006 819 Det Norske Diakonhjem Oslo Oslo
15/2499 Rehabilitering 171 042 114 598 Prestegårdsstien 6 AS Namsos Nord-Trøndelag
15/2549 Oppgradering av Tårnbygget NMBU 478 674 598 343 Norges Miljø- og biovitenskap-lige universitet
Ås Akershus
15/2556 Energieffektivisering AS Bøndernes Hus 789 879 329 286 AS Bøndernes Hus Trondheim Sør-Trøndelag
15/2593 Rolf E Stenersen alle 28B 30 32 34 36 401 783 502 230 Studentsamskipnaden i Oslo og Akershus
Oslo Oslo
15/2641 Rehabiltering ombygging av Birkeland skole (gammel del) 276 301 345 377 Birkenes kommune Birkenes Aust-Agder
15/2672 Rehab Rolf Wickstrømsveien 15 285 237 356 547 Aberdeen Eiendomsfond Norge I AS
Oslo Oslo
15/2732 E-kutt 2 i Norsk Butikkdrift AS 698 900 873 625 Coop Norge SA Oslo Oslo
15/2737 E-kutt 3 i Norsk Butikkdrift AS 3 607 284 4 509 105 Coop Norge SA Oslo Oslo
15/2764 Energieffektiv konvertering av Bunnpris Aure og Bismo 539 763 674 704 Bunnpris Møre AS Molde Møre og Romsdal
15/2765 Energieffektiv konvertering av Bunnpris Sartor 612 795 555 097 Bunnpris Vest AS Fjell Hordaland
15/2771 Energikutt i REMA Franchise Norge 2015 2 058 867 1 806 963 Rema Franchise Norge AS Oslo Oslo
15/278 Fyringsanlegg/ventilasjon 107 010 72 000 Lalm Samfunnshus SA Vågå Oppland
15/2795 Enøk II - Akersgata 35-39 og Gullhaug Torg 2 1 607 059 2 008 824 Storebrand Eiendom Hol-ding AS
Oslo Oslo
15/2798 1020901 Steinkjer passivhus 917 848 2 753 544 Statsbygg Steinkjer Nord-Trøndelag
15/2924 Kongsberg Teknologipark - Enovasøknad 2015 850 917 365 670 Kongsberg Teknologipark AS Kongsberg Buskerud
15/295Fornying av eksisterende ventilasjons- og varmeanlegg fra 1979 Hovedbygg
173 300 110 000 Union Hotel Eiendom AS Ålesund Møre og Romsdal
15/2962 Ombygging Storsenteret 206 379 129 185 H I Giørtz Sønner AS Ålesund Møre og Romsdal
15/2970 Kongeveien 101-Kongsvinger 516 137 345 812 Or Eiendom AS Kongsvinger Hedmark
15/3091 Isola Porsgrunn - Tiltak i administrasjonsbygg 103 050 128 813 Isola AS Porsgrunn Telemark
15/3092 Energitiltak etter energimerking av utesteder 1 161 983 1 452 479 Akershus Universitetssyke-hus HF
Skedsmo Akershus
15/3093 Enova søknad 6 290 247 238 068 KA Kirkelig Arbeidsgiver- og interesseorganisasjon
Landsdekkende Landsdekkende
15/3126 Etterisolering Skjøndal 148 798 185 998 Trøgstad kommune Trøgstad Østfold
15/3129 Enova søknad 4 2 103 201 1 261 584 KA Kirkelig Arbeidsgiver- og interesseorganisasjon
Landsdekkende Landsdekkende
15/3130 Rehabilitering av Tofte skole 456 773 447 442 Hurum Eiendomsselskap KF Hurum Buskerud
15/3132 Søknad basert på Kartlegging av ENØK-tiltak - Br. Jangaard AS 4 572 637 5 715 797 Brødrene Jangaard AS Ålesund Møre og Romsdal
15/3207 Nedre Slottsgate13-15 1 322 915 1 449 990 Promenaden NSG 13 AS Oslo Oslo
15/3226 Kjøita 40 249 236 311 545 Kruse Smith Gruppen AS Kristiansand Vest-Agder
15/3267 Pillefabrikken 2 398 426 2 208 283 Gjellebekkstubben 2 AS Lier Buskerud
1 Enovatilskuddet (3819 tilskudd), Energitiltak i bolig (39 tiltak) samt Støtte til energirådgiving (4 prosjekter) er ikke inkludert i oversikten
SID ProsjekttittelEnergiresultat
(KWh)Vedtattstøtte
Søker Kommune Fylke
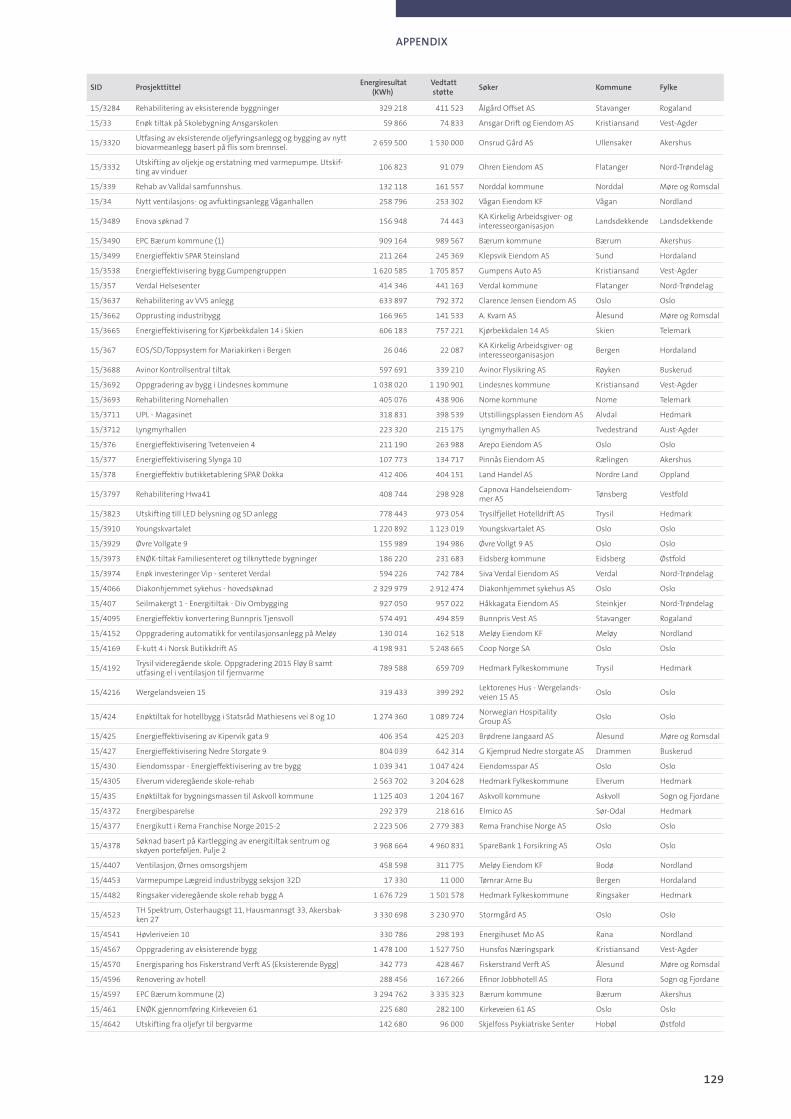
129
APPENDIX
15/3284 Rehabilitering av eksisterende byggninger 329 218 411 523 Ålgård Offset AS Stavanger Rogaland
15/33 Enøk tiltak på Skolebygning Ansgarskolen 59 866 74 833 Ansgar Drift og Eiendom AS Kristiansand Vest-Agder
15/3320Utfasing av eksisterende oljefyringsanlegg og bygging av nytt biovarmeanlegg basert på flis som brennsel.
2 659 500 1 530 000 Onsrud Gård AS Ullensaker Akershus
15/3332Utskifting av oljekje og erstatning med varmepumpe. Utskif-ting av vinduer
106 823 91 079 Ohren Eiendom AS Flatanger Nord-Trøndelag
15/339 Rehab av Valldal samfunnshus. 132 118 161 557 Norddal kommune Norddal Møre og Romsdal
15/34 Nytt ventilasjons- og avfuktingsanlegg Våganhallen 258 796 253 302 Vågan Eiendom KF Vågan Nordland
15/3489 Enova søknad 7 156 948 74 443 KA Kirkelig Arbeidsgiver- og interesseorganisasjon
Landsdekkende Landsdekkende
15/3490 EPC Bærum kommune (1) 909 164 989 567 Bærum kommune Bærum Akershus
15/3499 Energieffektiv SPAR Steinsland 211 264 245 369 Klepsvik Eiendom AS Sund Hordaland
15/3538 Energieffektivisering bygg Gumpengruppen 1 620 585 1 705 857 Gumpens Auto AS Kristiansand Vest-Agder
15/357 Verdal Helsesenter 414 346 441 163 Verdal kommune Flatanger Nord-Trøndelag
15/3637 Rehabilitering av VVS anlegg 633 897 792 372 Clarence Jensen Eiendom AS Oslo Oslo
15/3662 Opprusting industribygg 166 965 141 533 A. Kvam AS Ålesund Møre og Romsdal
15/3665 Energieffektivisering for Kjørbekkdalen 14 i Skien 606 183 757 221 Kjørbekkdalen 14 AS Skien Telemark
15/367 EOS/SD/Toppsystem for Mariakirken i Bergen 26 046 22 087 KA Kirkelig Arbeidsgiver- og interesseorganisasjon
Bergen Hordaland
15/3688 Avinor Kontrollsentral tiltak 597 691 339 210 Avinor Flysikring AS Røyken Buskerud
15/3692 Oppgradering av bygg i Lindesnes kommune 1 038 020 1 190 901 Lindesnes kommune Kristiansand Vest-Agder
15/3693 Rehabilitering Nomehallen 405 076 438 906 Nome kommune Nome Telemark
15/3711 UPL - Magasinet 318 831 398 539 Utstillingsplassen Eiendom AS Alvdal Hedmark
15/3712 Lyngmyrhallen 223 320 215 175 Lyngmyrhallen AS Tvedestrand Aust-Agder
15/376 Energieffektivisering Tvetenveien 4 211 190 263 988 Arepo Eiendom AS Oslo Oslo
15/377 Energieffektivisering Slynga 10 107 773 134 717 Pinnås Eiendom AS Rælingen Akershus
15/378 Energieffektiv butikketablering SPAR Dokka 412 406 404 151 Land Handel AS Nordre Land Oppland
15/3797 Rehabilitering Hwa41 408 744 298 928 Capnova Handelseiendom-mer AS
Tønsberg Vestfold
15/3823 Utskifting till LED belysning og SD anlegg 778 443 973 054 Trysilfjellet Hotelldrift AS Trysil Hedmark
15/3910 Youngskvartalet 1 220 892 1 123 019 Youngskvartalet AS Oslo Oslo
15/3929 Øvre Vollgate 9 155 989 194 986 Øvre Vollgt 9 AS Oslo Oslo
15/3973 ENØK-tiltak Familiesenteret og tilknyttede bygninger 186 220 231 683 Eidsberg kommune Eidsberg Østfold
15/3974 Enøk investeringer Vip - senteret Verdal 594 226 742 784 Siva Verdal Eiendom AS Verdal Nord-Trøndelag
15/4066 Diakonhjemmet sykehus - hovedsøknad 2 329 979 2 912 474 Diakonhjemmet sykehus AS Oslo Oslo
15/407 Seilmakergt 1 - Energitiltak - Div Ombygging 927 050 957 022 Håkkagata Eiendom AS Steinkjer Nord-Trøndelag
15/4095 Energieffektiv konvertering Bunnpris Tjensvoll 574 491 494 859 Bunnpris Vest AS Stavanger Rogaland
15/4152 Oppgradering automatikk for ventilasjonsanlegg på Meløy 130 014 162 518 Meløy Eiendom KF Meløy Nordland
15/4169 E-kutt 4 i Norsk Butikkdrift AS 4 198 931 5 248 665 Coop Norge SA Oslo Oslo
15/4192Trysil videregående skole. Oppgradering 2015 Fløy B samt utfasing el i ventilasjon til fjernvarme
789 588 659 709 Hedmark Fylkeskommune Trysil Hedmark
15/4216 Wergelandsveien 15 319 433 399 292 Lektorenes Hus - Wergelands-veien 15 AS
Oslo Oslo
15/424 Enøktiltak for hotellbygg i Statsråd Mathiesens vei 8 og 10 1 274 360 1 089 724 Norwegian Hospitality Group AS
Oslo Oslo
15/425 Energieffektivisering av Kipervik gata 9 406 354 425 203 Brødrene Jangaard AS Ålesund Møre og Romsdal
15/427 Energieffektivisering Nedre Storgate 9 804 039 642 314 G Kjemprud Nedre storgate AS Drammen Buskerud
15/430 Eiendomsspar - Energieffektivisering av tre bygg 1 039 341 1 047 424 Eiendomsspar AS Oslo Oslo
15/4305 Elverum videregående skole-rehab 2 563 702 3 204 628 Hedmark Fylkeskommune Elverum Hedmark
15/435 Enøktiltak for bygningsmassen til Askvoll kommune 1 125 403 1 204 167 Askvoll kommune Askvoll Sogn og Fjordane
15/4372 Energibesparelse 292 379 218 616 Elmico AS Sør-Odal Hedmark
15/4377 Energikutt i Rema Franchise Norge 2015-2 2 223 506 2 779 383 Rema Franchise Norge AS Oslo Oslo
15/4378Søknad basert på Kartlegging av energitiltak sentrum og skøyen porteføljen. Pulje 2
3 968 664 4 960 831 SpareBank 1 Forsikring AS Oslo Oslo
15/4407 Ventilasjon, Ørnes omsorgshjem 458 598 311 775 Meløy Eiendom KF Bodø Nordland
15/4453 Varmepumpe Lægreid industribygg seksjon 32D 17 330 11 000 Tømrar Arne Bu Bergen Hordaland
15/4482 Ringsaker videregående skole rehab bygg A 1 676 729 1 501 578 Hedmark Fylkeskommune Ringsaker Hedmark
15/4523TH Spektrum, Osterhaugsgt 11, Hausmannsgt 33, Akersbak-ken 27
3 330 698 3 230 970 Stormgård AS Oslo Oslo
15/4541 Høvleriveien 10 330 786 298 193 Energihuset Mo AS Rana Nordland
15/4567 Oppgradering av eksisterende bygg 1 478 100 1 527 750 Hunsfos Næringspark Kristiansand Vest-Agder
15/4570 Energisparing hos Fiskerstrand Verft AS (Eksisterende Bygg) 342 773 428 467 Fiskerstrand Verft AS Ålesund Møre og Romsdal
15/4596 Renovering av hotell 288 456 167 266 Efinor Jobbhotell AS Flora Sogn og Fjordane
15/4597 EPC Bærum kommune (2) 3 294 762 3 335 323 Bærum kommune Bærum Akershus
15/461 ENØK gjennomføring Kirkeveien 61 225 680 282 100 Kirkeveien 61 AS Oslo Oslo
15/4642 Utskifting fra oljefyr til bergvarme 142 680 96 000 Skjelfoss Psykiatriske Senter Hobøl Østfold
SID ProsjekttittelEnergiresultat
(KWh)Vedtattstøtte
Søker Kommune Fylke
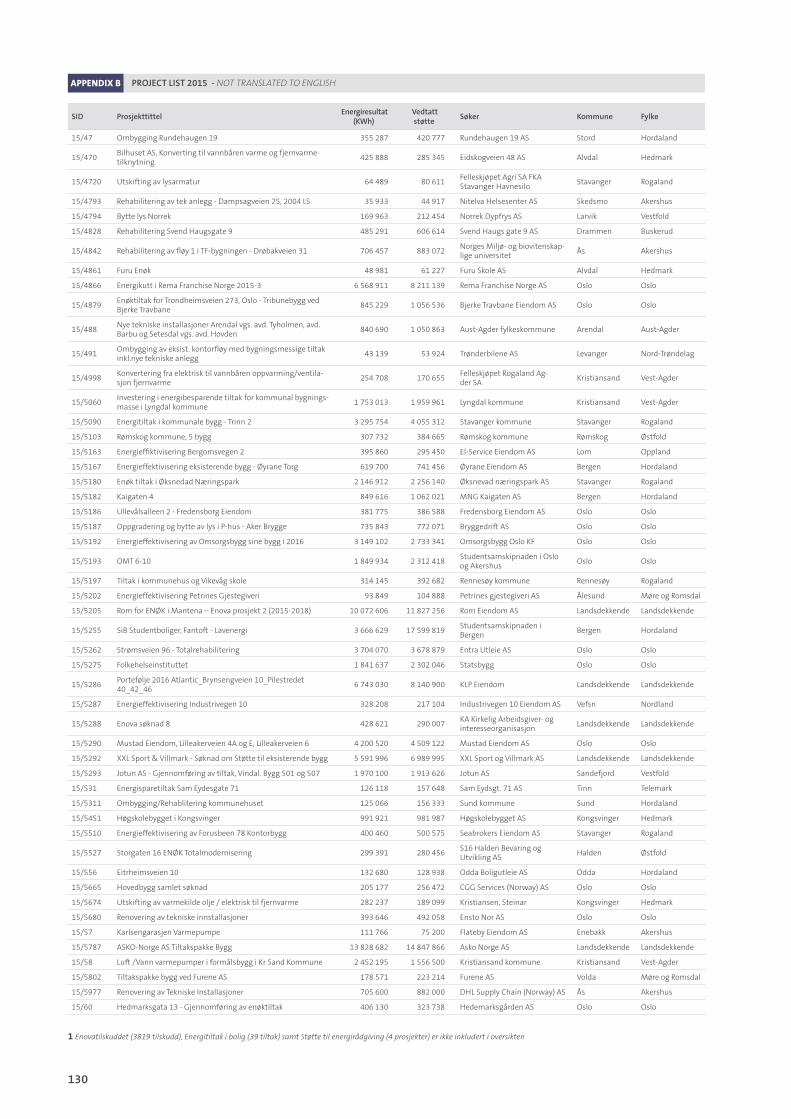
130
APPENDIX B PROJECT LIST 2015 - NOT TRANSLATED TO ENGLISH
15/47 Ombygging Rundehaugen 19 355 287 420 777 Rundehaugen 19 AS Stord Hordaland
15/470Bilhuset AS, Konverting til vannbåren varme og fjernvarme-tilknytning
425 888 285 345 Eidskogveien 48 AS Alvdal Hedmark
15/4720 Utskifting av lysarmatur 64 489 80 611 Felleskjøpet Agri SA FKA Stavanger Havnesilo
Stavanger Rogaland
15/4793 Rehabilitering av tek anlegg - Dampsagveien 25, 2004 LS 35 933 44 917 Nitelva Helsesenter AS Skedsmo Akershus
15/4794 Bytte lys Norrek 169 963 212 454 Norrek Dypfrys AS Larvik Vestfold
15/4828 Rehabilitering Svend Haugsgate 9 485 291 606 614 Svend Haugs gate 9 AS Drammen Buskerud
15/4842 Rehabilitering av fløy 1 i TF-bygningen - Drøbakveien 31 706 457 883 072 Norges Miljø- og biovitenskap-lige universitet
Ås Akershus
15/4861 Furu Enøk 48 981 61 227 Furu Skole AS Alvdal Hedmark
15/4866 Energikutt i Rema Franchise Norge 2015-3 6 568 911 8 211 139 Rema Franchise Norge AS Oslo Oslo
15/4879Enøktiltak for Trondheimsveien 273, Oslo - Tribunebygg ved Bjerke Travbane
845 229 1 056 536 Bjerke Travbane Eiendom AS Oslo Oslo
15/488Nye tekniske installasjoner Arendal vgs. avd. Tyholmen, avd. Barbu og Setesdal vgs. avd. Hovden
840 690 1 050 863 Aust-Agder fylkeskommune Arendal Aust-Agder
15/491Ombygging av eksist. kontorfløy med bygningsmessige tiltak inkl.nye tekniske anlegg
43 139 53 924 Trønderbilene AS Levanger Nord-Trøndelag
15/4998Konvertering fra elektrisk til vannbåren oppvarming/ventila-sjon fjernvarme
254 708 170 655 Felleskjøpet Rogaland Ag-der SA
Kristiansand Vest-Agder
15/5060Investering i energibesparende tiltak for kommunal bygnings-masse i Lyngdal kommune
1 753 013 1 959 961 Lyngdal kommune Kristiansand Vest-Agder
15/5090 Energitiltak i kommunale bygg - Trinn 2 3 295 754 4 055 312 Stavanger kommune Stavanger Rogaland
15/5103 Rømskog kommune, 5 bygg 307 732 384 665 Rømskog kommune Rømskog Østfold
15/5163 Energieffiktivisering Bergomsvegen 2 395 860 295 450 El-Service Eiendom AS Lom Oppland
15/5167 Energieffektivisering eksisterende bygg - Øyrane Torg 619 700 741 456 Øyrane Eiendom AS Bergen Hordaland
15/5180 Enøk tiltak i Øksnedad Næringspark 2 146 912 2 256 140 Øksnevad næringspark AS Stavanger Rogaland
15/5182 Kaigaten 4 849 616 1 062 021 MNG Kaigaten AS Bergen Hordaland
15/5186 Ullevålsalleen 2 - Fredensborg Eiendom 381 775 386 588 Fredensborg Eiendom AS Oslo Oslo
15/5187 Oppgradering og bytte av lys i P-hus - Aker Brygge 735 843 772 071 Bryggedrift AS Oslo Oslo
15/5192 Energieffektivisering av Omsorgsbygg sine bygg i 2016 3 149 102 2 733 341 Omsorgsbygg Oslo KF Oslo Oslo
15/5193 OMT 6-10 1 849 934 2 312 418 Studentsamskipnaden i Oslo og Akershus
Oslo Oslo
15/5197 Tiltak i kommunehus og Vikevåg skole 314 145 392 682 Rennesøy kommune Rennesøy Rogaland
15/5202 Energieffektivisering Petrines Gjestegiveri 93 849 104 888 Petrines gjestegiveri AS Ålesund Møre og Romsdal
15/5205 Rom for ENØK i Mantena – Enova prosjekt 2 (2015-2018) 10 072 606 11 827 256 Rom Eiendom AS Landsdekkende Landsdekkende
15/5255 SiB Studentboliger, Fantoft - Lavenergi 3 666 629 17 599 819 Studentsamskipnaden i Bergen
Bergen Hordaland
15/5262 Strømsveien 96 - Totalrehabilitering 3 704 070 3 678 879 Entra Utleie AS Oslo Oslo
15/5275 Folkehelseinstituttet 1 841 637 2 302 046 Statsbygg Oslo Oslo
15/5286Portefølje 2016 Atlantic_Brynsengveien 10_Pilestredet 40_42_46
6 743 030 8 140 900 KLP Eiendom Landsdekkende Landsdekkende
15/5287 Energieffektivisering Industrivegen 10 328 208 217 104 Industrivegen 10 Eiendom AS Vefsn Nordland
15/5288 Enova søknad 8 428 621 290 007 KA Kirkelig Arbeidsgiver- og interesseorganisasjon
Landsdekkende Landsdekkende
15/5290 Mustad Eiendom, Lilleakerveien 4A og E, Lilleakerveien 6 4 200 520 4 509 122 Mustad Eiendom AS Oslo Oslo
15/5292 XXL Sport & Villmark - Søknad om Støtte til eksisterende bygg 5 591 996 6 989 995 XXL Sport og Villmark AS Landsdekkende Landsdekkende
15/5293 Jotun AS - Gjennomføring av tiltak, Vindal. Bygg 501 og 507 1 970 100 1 913 626 Jotun AS Sandefjord Vestfold
15/531 Energisparetiltak Sam Eydesgate 71 126 118 157 648 Sam Eydsgt. 71 AS Tinn Telemark
15/5311 Ombygging/Rehablitering kommunehuset 125 066 156 333 Sund kommune Sund Hordaland
15/5451 Høgskolebygget i Kongsvinger 991 921 981 987 Høgskolebygget AS Kongsvinger Hedmark
15/5510 Energieffektivisering av Forusbeen 78 Kontorbygg 400 460 500 575 Seabrokers Eiendom AS Stavanger Rogaland
15/5527 Storgaten 16 ENØK Totalmodernisering 299 391 280 456 S16 Halden Bevaring og Utvikling AS
Halden Østfold
15/556 Eitrheimsveien 10 132 680 128 938 Odda Boligutleie AS Odda Hordaland
15/5665 Hovedbygg samlet søknad 205 177 256 472 CGG Services (Norway) AS Oslo Oslo
15/5674 Utskifting av varmekilde olje / elektrisk til fjernvarme 282 237 189 099 Kristiansen, Steinar Kongsvinger Hedmark
15/5680 Renovering av tekniske innstallasjoner 393 646 492 058 Ensto Nor AS Oslo Oslo
15/57 Karlsengarasjen Varmepumpe 111 766 75 200 Flateby Eiendom AS Enebakk Akershus
15/5787 ASKO-Norge AS Tiltakspakke Bygg 13 828 682 14 847 866 Asko Norge AS Landsdekkende Landsdekkende
15/58 Luft /Vann varmepumper i formålsbygg i Kr Sand Kommune 2 452 195 1 556 500 Kristiansand kommune Kristiansand Vest-Agder
15/5802 Tiltakspakke bygg ved Furene AS 178 571 223 214 Furene AS Volda Møre og Romsdal
15/5977 Renovering av Tekniske Installasjoner 705 600 882 000 DHL Supply Chain (Norway) AS Ås Akershus
15/60 Hedmarksgata 13 - Gjennomføring av enøktiltak 406 130 323 738 Hedemarksgården AS Oslo Oslo
1 Enovatilskuddet (3819 tilskudd), Energitiltak i bolig (39 tiltak) samt Støtte til energirådgiving (4 prosjekter) er ikke inkludert i oversikten
SID ProsjekttittelEnergiresultat
(KWh)Vedtattstøtte
Søker Kommune Fylke
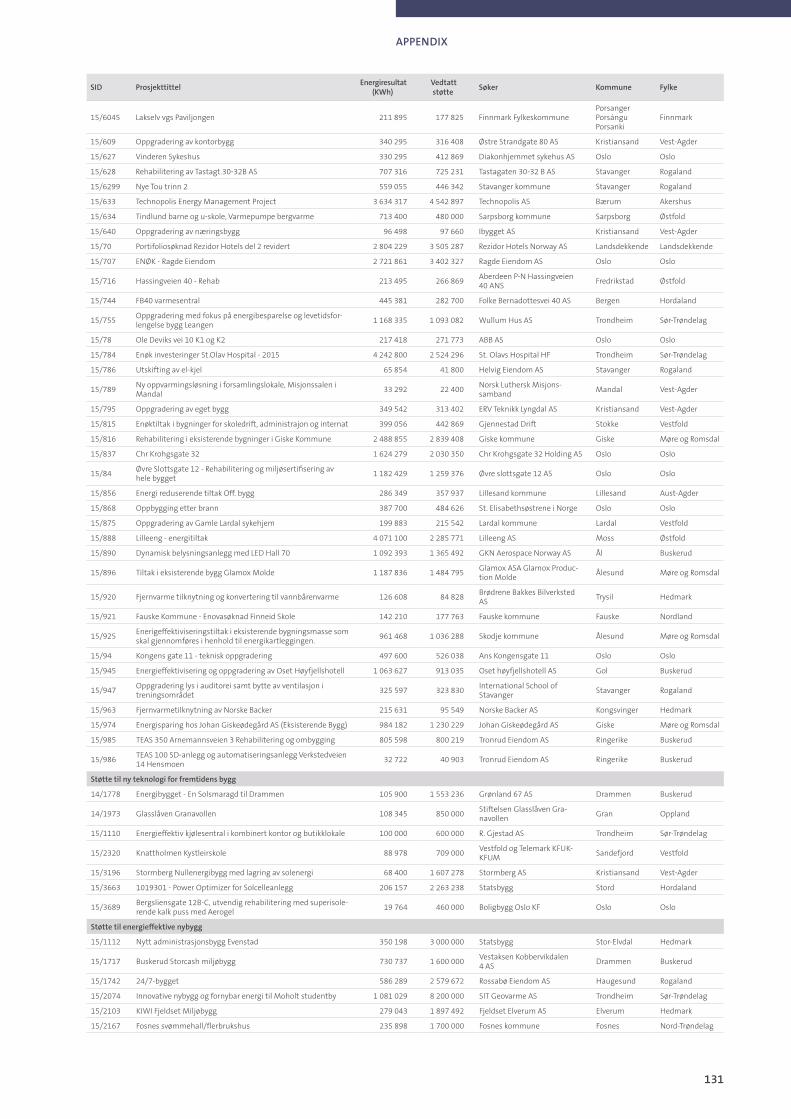
131
APPENDIX
15/6045 Lakselv vgs Paviljongen 211 895 177 825 Finnmark FylkeskommunePorsanger Porsángu Porsanki
Finnmark
15/609 Oppgradering av kontorbygg 340 295 316 408 Østre Strandgate 80 AS Kristiansand Vest-Agder
15/627 Vinderen Sykeshus 330 295 412 869 Diakonhjemmet sykehus AS Oslo Oslo
15/628 Rehabilitering av Tastagt.30-32B AS 707 316 725 231 Tastagaten 30-32 B AS Stavanger Rogaland
15/6299 Nye Tou trinn 2 559 055 446 342 Stavanger kommune Stavanger Rogaland
15/633 Technopolis Energy Management Project 3 634 317 4 542 897 Technopolis AS Bærum Akershus
15/634 Tindlund barne og u-skole, Varmepumpe bergvarme 713 400 480 000 Sarpsborg kommune Sarpsborg Østfold
15/640 Oppgradering av næringsbygg 96 498 97 660 Ibygget AS Kristiansand Vest-Agder
15/70 Portifoliosøknad Rezidor Hotels del 2 revidert 2 804 229 3 505 287 Rezidor Hotels Norway AS Landsdekkende Landsdekkende
15/707 ENØK - Ragde Eiendom 2 721 861 3 402 327 Ragde Eiendom AS Oslo Oslo
15/716 Hassingveien 40 - Rehab 213 495 266 869 Aberdeen P-N Hassingveien 40 ANS
Fredrikstad Østfold
15/744 FB40 varmesentral 445 381 282 700 Folke Bernadottesvei 40 AS Bergen Hordaland
15/755Oppgradering med fokus på energibesparelse og levetidsfor-lengelse bygg Leangen
1 168 335 1 093 082 Wullum Hus AS Trondheim Sør-Trøndelag
15/78 Ole Deviks vei 10 K1 og K2 217 418 271 773 ABB AS Oslo Oslo
15/784 Enøk investeringer St.Olav Hospital - 2015 4 242 800 2 524 296 St. Olavs Hospital HF Trondheim Sør-Trøndelag
15/786 Utskifting av el-kjel 65 854 41 800 Helvig Eiendom AS Stavanger Rogaland
15/789Ny oppvarmingsløsning i forsamlingslokale, Misjonssalen i Mandal
33 292 22 400 Norsk Luthersk Misjons-samband
Mandal Vest-Agder
15/795 Oppgradering av eget bygg 349 542 313 402 ERV Teknikk Lyngdal AS Kristiansand Vest-Agder
15/815 Enøktiltak i bygninger for skoledrift, administrajon og internat 399 056 442 869 Gjennestad Drift Stokke Vestfold
15/816 Rehabilitering i eksisterende bygninger i Giske Kommune 2 488 855 2 839 408 Giske kommune Giske Møre og Romsdal
15/837 Chr Krohgsgate 32 1 624 279 2 030 350 Chr Krohgsgate 32 Holding AS Oslo Oslo
15/84Øvre Slottsgate 12 - Rehabilitering og miljøsertifisering av hele bygget
1 182 429 1 259 376 Øvre slottsgate 12 AS Oslo Oslo
15/856 Energi reduserende tiltak Off. bygg 286 349 357 937 Lillesand kommune Lillesand Aust-Agder
15/868 Oppbygging etter brann 387 700 484 626 St. Elisabethsøstrene i Norge Oslo Oslo
15/875 Oppgradering av Gamle Lardal sykehjem 199 883 215 542 Lardal kommune Lardal Vestfold
15/888 Lilleeng - energitiltak 4 071 100 2 285 771 Lilleeng AS Moss Østfold
15/890 Dynamisk belysningsanlegg med LED Hall 70 1 092 393 1 365 492 GKN Aerospace Norway AS Ål Buskerud
15/896 Tiltak i eksisterende bygg Glamox Molde 1 187 836 1 484 795 Glamox ASA Glamox Produc-tion Molde
Ålesund Møre og Romsdal
15/920 Fjernvarme tilknytning og konvertering til vannbårenvarme 126 608 84 828 Brødrene Bakkes Bilverksted AS
Trysil Hedmark
15/921 Fauske Kommune - Enovasøknad Finneid Skole 142 210 177 763 Fauske kommune Fauske Nordland
15/925Enerigeffektiviseringstiltak i eksisterende bygningsmasse som skal gjennomføres i henhold til energikartleggingen.
961 468 1 036 288 Skodje kommune Ålesund Møre og Romsdal
15/94 Kongens gate 11 - teknisk oppgradering 497 600 526 038 Ans Kongensgate 11 Oslo Oslo
15/945 Energieffektivisering og oppgradering av Oset Høyfjellshotell 1 063 627 913 035 Oset høyfjellshotell AS Gol Buskerud
15/947Oppgradering lys i auditorei samt bytte av ventilasjon i treningsområdet
325 597 323 830 International School of Stavanger
Stavanger Rogaland
15/963 Fjernvarmetilknytning av Norske Backer 215 631 95 549 Norske Backer AS Kongsvinger Hedmark
15/974 Energisparing hos Johan Giskeødegård AS (Eksisterende Bygg) 984 182 1 230 229 Johan Giskeødegård AS Giske Møre og Romsdal
15/985 TEAS 350 Arnemannsveien 3 Rehabilitering og ombygging 805 598 800 219 Tronrud Eiendom AS Ringerike Buskerud
15/986TEAS 100 SD-anlegg og automatiseringsanlegg Verkstedveien 14 Hensmoen
32 722 40 903 Tronrud Eiendom AS Ringerike Buskerud
Støttetilnyteknologiforfremtidensbygg
14/1778 Energibygget - En Solsmaragd til Drammen 105 900 1 553 236 Grønland 67 AS Drammen Buskerud
14/1973 Glasslåven Granavollen 108 345 850 000 Stiftelsen Glasslåven Gra-navollen
Gran Oppland
15/1110 Energieffektiv kjølesentral i kombinert kontor og butikklokale 100 000 600 000 R. Gjestad AS Trondheim Sør-Trøndelag
15/2320 Knattholmen Kystleirskole 88 978 709 000 Vestfold og Telemark KFUK-KFUM
Sandefjord Vestfold
15/3196 Stormberg Nullenergibygg med lagring av solenergi 68 400 1 607 278 Stormberg AS Kristiansand Vest-Agder
15/3663 1019301 - Power Optimizer for Solcelleanlegg 206 157 2 263 238 Statsbygg Stord Hordaland
15/3689Bergsliensgate 12B-C, utvendig rehabilitering med superisole-rende kalk puss med Aerogel
19 764 460 000 Boligbygg Oslo KF Oslo Oslo
Støttetilenergieffektivenybygg
15/1112 Nytt administrasjonsbygg Evenstad 350 198 3 000 000 Statsbygg Stor-Elvdal Hedmark
15/1717 Buskerud Storcash miljøbygg 730 737 1 600 000 Vestaksen Kobbervikdalen 4 AS
Drammen Buskerud
15/1742 24/7-bygget 586 289 2 579 672 Rossabø Eiendom AS Haugesund Rogaland
15/2074 Innovative nybygg og fornybar energi til Moholt studentby 1 081 029 8 200 000 SIT Geovarme AS Trondheim Sør-Trøndelag
15/2103 KIWI Fjeldset Miljøbygg 279 043 1 897 492 Fjeldset Elverum AS Elverum Hedmark
15/2167 Fosnes svømmehall/flerbrukshus 235 898 1 700 000 Fosnes kommune Fosnes Nord-Trøndelag
SID ProsjekttittelEnergiresultat
(KWh)Vedtattstøtte
Søker Kommune Fylke

132
APPENDIX B PROJECT LIST 2015 - NOT TRANSLATED TO ENGLISH
15/2643 Powerhouse Brattørkaia 3 652 351 36 500 000 Entra Eiendom AS Trondheim Sør-Trøndelag
15/3505 Storo Garden 1 186 800 5 815 320 Skanska CDN Oslo 3 AS Oslo Oslo
15/3869 Nybygg Logistikksenter i Trondheim 2 956 847 14 200 000 Posten Norge AS Trondheim Sør-Trøndelag
15/3930 Østmarka - energiambisiøs utbygging Psykiatri 442 577 2 900 000 St. Olavs Hospital HF Trondheim Sør-Trøndelag
15/554 Tromsøbadet 1 219 050 3 350 000 Tromsø kommune Tromsø Troms
15/5616 Skage barnehage 166 115 1 331 000 Overhalla kommune Overhalla Nord-Trøndelag
15/683 12273 Brønnøysundregistrene 1 848 225 14 970 000 Statsbygg Brønnøy Nordland
15/978 Holmen Svømmehall 1 227 398 9 944 000 Asker kommune Asker Akershus
Varmesentralutvidet
14/1837 OBUS Ungdomskolen og basseng nytt varmeanlegg 400 000 400 000 Overhalla kommune Overhalla Nord-Trøndelag
14/2015 Brødrene Karlsen Eiendom AS- Ny fiskeribedrift 368 036 368 036 Brødrene Karlsen Eiendom AS Tromsø Troms
14/2023Energisentral med varmepumpe for oppvarming og varmtvann til Boligsameiet Kollen
656 205 656 205 Boligsameiet Kollen Bærum Akershus
14/2122 Ny energisentral Selvik skole 206 622 206 622 Sande kommune Sande Vestfold
15/1550 Nærvarmeanlegg Vensmoen 865 674 865 674 Vensmoen Eiendom AS Saltdal Nordland
15/2557 Varmepumpe anlegg med bergvarmepumper 325 521 325 521 Fredheim Borettslag Bergen Hordaland
15/2642 Blaker bo- og omsorgssenter - felles varmesentral 361 102 361 102 Sørum Kommunale Eiendoms-selskap KF
Sørum Akershus
15/3323Prosjekt 1216, Ny energisentral for bygg i Rådhus- og Sivdam- området
2 100 000 2 100 000 Time kommune Time Rogaland
15/346 Spikkestad ungdomskole 559 349 559 349 Røyken Eiendom AS Røyken Buskerud
15/3936 Nærvarmeanlegg Eikertun (SID 15/3638 -Revidert søknad) 1 374 930 1 374 930 Øvre Eiker kommune Øvre Eiker Buskerud
15/4170 Biofyr RCMI 250 000 250 000 Røros Container og Miljø AS Røros Sør-Trøndelag
15/4452 Varmepumpeanlegg Moan 401 472 401 472 Balsfjord kommune Tromsø Troms
15/4994 Geoenergianlegg - Døli pleie- og omsorgssenter 553 500 553 500 Nittedal kommunale eien-domsforetak
Nittedal Akershus
15/535 Nye varmepumper i varmesentral 1 432 854 1 432 854 Storgården Borettslag Oslo Oslo
15/547 Varmepumpe med brønnpark - Postens terminaler Alnabru 343 170 343 170 Posten Eiendom Alnabru Utvikling AS
Oslo Oslo
15/6232 Strandpromenaden 50 - Sjøvannsbasert CO2-varmepumpe 775 427 775 427 Kongsberg Næringsbygg 2 AS Horten Vestfold
Varmesentralforenklet
14/1189 Verksted Frya 363 465 199 500 Erling Rolstad AS Ringebu Oppland
14/1980 Ny Rygge USK - grunnvarme varmepumpe 147 410 77 500 Rygge kommune Rygge Østfold
14/2003 Montering av vann- vann varmepumpe på Nes driftstasjon 19 021 12 800 Ringsaker kommune Ringsaker Hedmark
14/2007 Varmepumpe Krokstad Senter 259 989 165 000 Sektor Krokstad Eiendom AS Nedre Eiker Buskerud
14/2042 Ny varmepumpe Remo 64 131 35 200 OK Vedlikehold AS Averøy Møre og Romsdal
14/2115 Væske-vann varmepumpe 71 328 48 000 Borettslaget Etterstad I Oslo Oslo
15/1139 Søknad om støtte til nytt flisfyringsanlegg 398 925 200 000 Ola Olderøyås Snekkerifa-brikk AS
Trondheim Sør-Trøndelag
15/1160 Økernveien 9 varmepumpe 235 723 149 600 Økernveien 9 Eiendom AS Oslo Oslo
15/1161 Luft/vann varmepumpe 36 398 23 100 Handelstandens Aldersboliger Haugesund Rogaland
15/1329Skogbygda skole - konvertering fra oljefyring til bergvarme-pumpe
190 207 128 000 Nes kommune Nes Akershus
15/1330Fenstad skole - konvertering fra oljefyring til borehullsvarme-pumpe
190 207 128 000 Nes kommune Nes Akershus
15/1331 Framtun skole- konvertering fra olje til bergvarmepumpe 190 207 128 000 Nes kommune Nes Akershus
15/1354 Flisfyrt Varmesentral 177 300 102 000 Hoffart Magne Sigdal Buskerud
15/1417 Luft vann varmepumpe 25 999 16 500 Frosta Innkjøpslag SA Frosta Nord-Trøndelag
15/1489 Væske / vann varmepumpe 54 685 36 800 Sameiet Generalbirchs gate 20 Oslo Oslo
15/1490 Veske-veske varmepumpe (Bergvarme) 97 481 60 800 Catch Eiendom AS Ås Akershus
15/1492 Nedre Bøbakkane 133 145 70 000 Å&Ø Utvikling AS Førde Sogn og Fjordane
15/1496 Væske / vann varmepumpe 47 552 32 000 Sameiet General Birchs gate 26
Oslo Oslo
15/1532 Væske-vann varmepumpe 142 655 96 000 Sameiet Ullevålsveien 109 Oslo Oslo
15/1551 Prosjekt Rådhuskvartalet 161 676 85 000 Nittedal kommune Nittedal Akershus
15/1589 Væske-væske varmepumpe 399 435 200 000 Blekebakkvegen 5 Eiendom AS Skien Telemark
15/1630 Væske-væske varmepumpe 42 797 28 800 Mari Østbye Eidsvoll Akershus
15/1714 Væske - Væske varme pumpe. Skal bore etter jordvarme 55 160 29 000 Porsgrunn Eiendom AS Porsgrunn Telemark
15/1741 Bergpumpe 38 042 20 000 Dammen Eiendom AS Nedre Eiker Buskerud
15/1745 Væske - væske varmepumpe 38 041 25 600 Jørn Røe Øystre Slidre Oppland
15/1772 Prosjekt Dokka 28 531 19 200 Auctus Eiendom AS Nordre Land Oppland
15/1788 Væske-vann varmepumpe danfoss ca. 90kw med brønnpark 213 983 144 000 Skattebo Eiendom AS Nord-Aurdal Oppland
15/1802 Væske-væske varmepumpe 47 552 32 000 Øgle Eiendom AS Røros Sør-Trøndelag
1 Enovatilskuddet (3819 tilskudd), Energitiltak i bolig (39 tiltak) samt Støtte til energirådgiving (4 prosjekter) er ikke inkludert i oversikten
SID ProsjekttittelEnergiresultat
(KWh)Vedtattstøtte
Søker Kommune Fylke
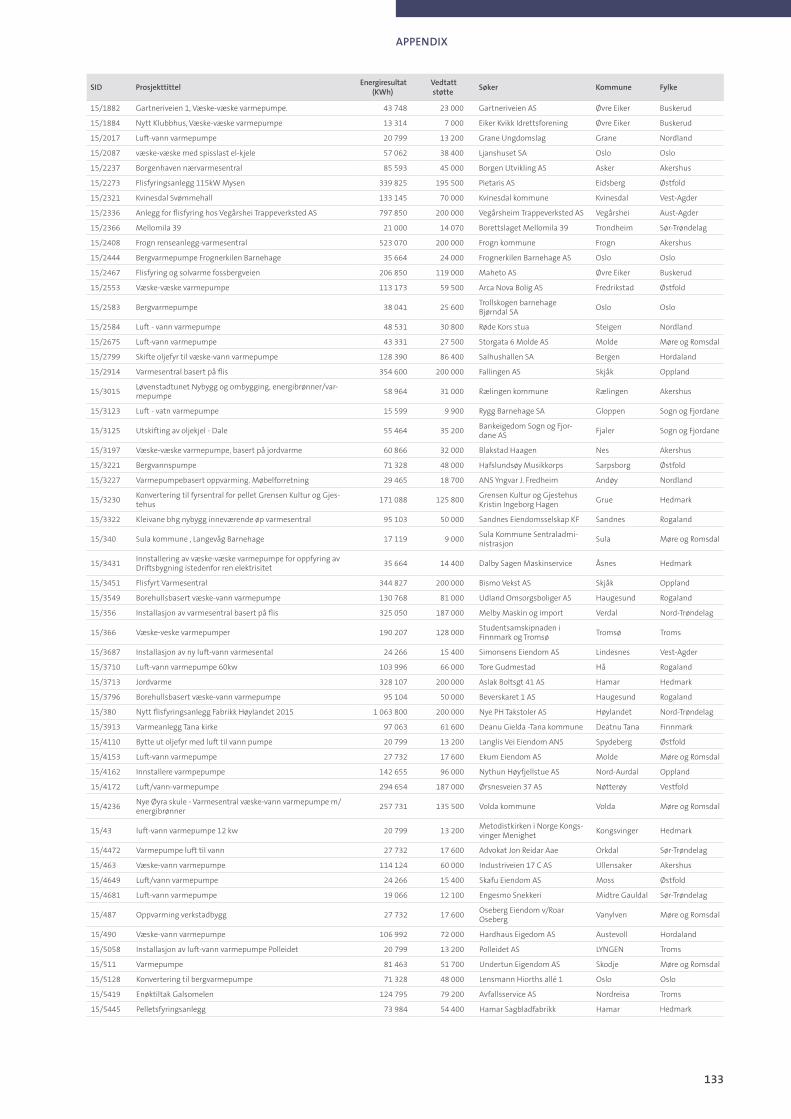
133
APPENDIX
15/1882 Gartneriveien 1, Væske-væske varmepumpe. 43 748 23 000 Gartneriveien AS Øvre Eiker Buskerud
15/1884 Nytt Klubbhus, Væske-væske varmepumpe 13 314 7 000 Eiker Kvikk Idrettsforening Øvre Eiker Buskerud
15/2017 Luft-vann varmepumpe 20 799 13 200 Grane Ungdomslag Grane Nordland
15/2087 væske-væske med spisslast el-kjele 57 062 38 400 Ljanshuset SA Oslo Oslo
15/2237 Borgenhaven nærvarmesentral 85 593 45 000 Borgen Utvikling AS Asker Akershus
15/2273 Flisfyringsanlegg 115kW Mysen 339 825 195 500 Pietaris AS Eidsberg Østfold
15/2321 Kvinesdal Svømmehall 133 145 70 000 Kvinesdal kommune Kvinesdal Vest-Agder
15/2336 Anlegg for flisfyring hos Vegårshei Trappeverksted AS 797 850 200 000 Vegårsheim Trappeverksted AS Vegårshei Aust-Agder
15/2366 Mellomila 39 21 000 14 070 Borettslaget Mellomila 39 Trondheim Sør-Trøndelag
15/2408 Frogn renseanlegg-varmesentral 523 070 200 000 Frogn kommune Frogn Akershus
15/2444 Bergvarmepumpe Frognerkilen Barnehage 35 664 24 000 Frognerkilen Barnehage AS Oslo Oslo
15/2467 Flisfyring og solvarme fossbergveien 206 850 119 000 Maheto AS Øvre Eiker Buskerud
15/2553 Væske-væske varmepumpe 113 173 59 500 Arca Nova Bolig AS Fredrikstad Østfold
15/2583 Bergvarmepumpe 38 041 25 600 Trollskogen barnehage Bjørndal SA
Oslo Oslo
15/2584 Luft - vann varmepumpe 48 531 30 800 Røde Kors stua Steigen Nordland
15/2675 Luft-vann varmepumpe 43 331 27 500 Storgata 6 Molde AS Molde Møre og Romsdal
15/2799 Skifte oljefyr til væske-vann varmepumpe 128 390 86 400 Salhushallen SA Bergen Hordaland
15/2914 Varmesentral basert på flis 354 600 200 000 Fallingen AS Skjåk Oppland
15/3015Løvenstadtunet Nybygg og ombygging, energibrønner/var-mepumpe
58 964 31 000 Rælingen kommune Rælingen Akershus
15/3123 Luft - vatn varmepumpe 15 599 9 900 Rygg Barnehage SA Gloppen Sogn og Fjordane
15/3125 Utskifting av oljekjel - Dale 55 464 35 200 Bankeigedom Sogn og Fjor-dane AS
Fjaler Sogn og Fjordane
15/3197 Væske-væske varmepumpe, basert på jordvarme 60 866 32 000 Blakstad Haagen Nes Akershus
15/3221 Bergvannspumpe 71 328 48 000 Hafslundsøy Musikkorps Sarpsborg Østfold
15/3227 Varmepumpebasert oppvarming. Møbelforretning 29 465 18 700 ANS Yngvar J. Fredheim Andøy Nordland
15/3230Konvertering til fyrsentral for pellet Grensen Kultur og Gjes-tehus
171 088 125 800 Grensen Kultur og Gjestehus Kristin Ingeborg Hagen
Grue Hedmark
15/3322 Kleivane bhg nybygg inneværende øp varmesentral 95 103 50 000 Sandnes Eiendomsselskap KF Sandnes Rogaland
15/340 Sula kommune , Langevåg Barnehage 17 119 9 000 Sula Kommune Sentraladmi-nistrasjon
Sula Møre og Romsdal
15/3431Innstallering av væske-væske varmepumpe for oppfyring av Driftsbygning istedenfor ren elektrisitet
35 664 14 400 Dalby Sagen Maskinservice Åsnes Hedmark
15/3451 Flisfyrt Varmesentral 344 827 200 000 Bismo Vekst AS Skjåk Oppland
15/3549 Borehullsbasert væske-vann varmepumpe 130 768 81 000 Udland Omsorgsboliger AS Haugesund Rogaland
15/356 Installasjon av varmesentral basert på flis 325 050 187 000 Melby Maskin og import Verdal Nord-Trøndelag
15/366 Væske-veske varmepumper 190 207 128 000 Studentsamskipnaden i Finnmark og Tromsø
Tromsø Troms
15/3687 Installasjon av ny luft-vann varmesental 24 266 15 400 Simonsens Eiendom AS Lindesnes Vest-Agder
15/3710 Luft-vann varmepumpe 60kw 103 996 66 000 Tore Gudmestad Hå Rogaland
15/3713 Jordvarme 328 107 200 000 Aslak Boltsgt 41 AS Hamar Hedmark
15/3796 Borehullsbasert væske-vann varmepumpe 95 104 50 000 Beverskaret 1 AS Haugesund Rogaland
15/380 Nytt flisfyringsanlegg Fabrikk Høylandet 2015 1 063 800 200 000 Nye PH Takstoler AS Høylandet Nord-Trøndelag
15/3913 Varmeanlegg Tana kirke 97 063 61 600 Deanu Gielda -Tana kommune Deatnu Tana Finnmark
15/4110 Bytte ut oljefyr med luft til vann pumpe 20 799 13 200 Langlis Vei Eiendom ANS Spydeberg Østfold
15/4153 Luft-vann varmepumpe 27 732 17 600 Ekum Eiendom AS Molde Møre og Romsdal
15/4162 Innstallere varmpepumpe 142 655 96 000 Nythun Høyfjellstue AS Nord-Aurdal Oppland
15/4172 Luft/vann-varmepumpe 294 654 187 000 Ørsnesveien 37 AS Nøtterøy Vestfold
15/4236Nye Øyra skule - Varmesentral væske-vann varmepumpe m/ energibrønner
257 731 135 500 Volda kommune Volda Møre og Romsdal
15/43 luft-vann varmepumpe 12 kw 20 799 13 200 Metodistkirken i Norge Kongs-vinger Menighet
Kongsvinger Hedmark
15/4472 Varmepumpe luft til vann 27 732 17 600 Advokat Jon Reidar Aae Orkdal Sør-Trøndelag
15/463 Væske-vann varmepumpe 114 124 60 000 Industriveien 17 C AS Ullensaker Akershus
15/4649 Luft/vann varmepumpe 24 266 15 400 Skafu Eiendom AS Moss Østfold
15/4681 Luft-vann varmepumpe 19 066 12 100 Engesmo Snekkeri Midtre Gauldal Sør-Trøndelag
15/487 Oppvarming verkstadbygg 27 732 17 600 Oseberg Eiendom v/Roar Oseberg
Vanylven Møre og Romsdal
15/490 Væske-vann varmepumpe 106 992 72 000 Hardhaus Eigedom AS Austevoll Hordaland
15/5058 Installasjon av luft-vann varmepumpe Polleidet 20 799 13 200 Polleidet AS LYNGEN Troms
15/511 Varmepumpe 81 463 51 700 Undertun Eigendom AS Skodje Møre og Romsdal
15/5128 Konvertering til bergvarmepumpe 71 328 48 000 Lensmann Hiorths allé 1 Oslo Oslo
15/5419 Enøktiltak Galsomelen 124 795 79 200 Avfallsservice AS Nordreisa Troms
15/5445 Pelletsfyringsanlegg 73 984 54 400 Hamar Sagbladfabrikk Hamar Hedmark
SID ProsjekttittelEnergiresultat
(KWh)Vedtattstøtte
Søker Kommune Fylke
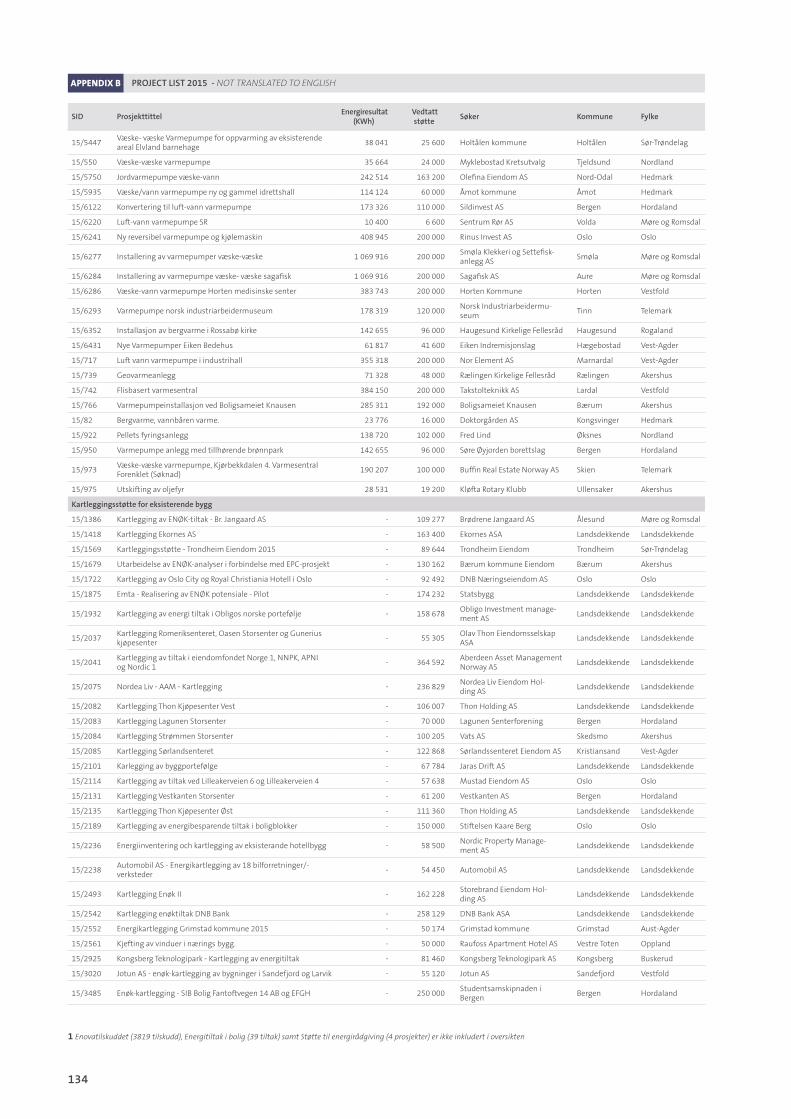
134
APPENDIX B PROJECT LIST 2015 - NOT TRANSLATED TO ENGLISH
15/5447Væske- væske Varmepumpe for oppvarming av eksisterende areal Elvland barnehage
38 041 25 600 Holtålen kommune Holtålen Sør-Trøndelag
15/550 Væske-væske varmepumpe 35 664 24 000 Myklebostad Kretsutvalg Tjeldsund Nordland
15/5750 Jordvarmepumpe væske-vann 242 514 163 200 Olefina Eiendom AS Nord-Odal Hedmark
15/5935 Væske/vann varmepumpe ny og gammel idrettshall 114 124 60 000 Åmot kommune Åmot Hedmark
15/6122 Konvertering til luft-vann varmepumpe 173 326 110 000 Sildinvest AS Bergen Hordaland
15/6220 Luft-vann varmepumpe SR 10 400 6 600 Sentrum Rør AS Volda Møre og Romsdal
15/6241 Ny reversibel varmepumpe og kjølemaskin 408 945 200 000 Rinus Invest AS Oslo Oslo
15/6277 Installering av varmepumper væske-væske 1 069 916 200 000 Smøla Klekkeri og Settefisk-anlegg AS
Smøla Møre og Romsdal
15/6284 Installering av varmepumpe væske- væske sagafisk 1 069 916 200 000 Sagafisk AS Aure Møre og Romsdal
15/6286 Væske-vann varmepumpe Horten medisinske senter 383 743 200 000 Horten Kommune Horten Vestfold
15/6293 Varmepumpe norsk industriarbeidermuseum 178 319 120 000 Norsk Industriarbeidermu-seum
Tinn Telemark
15/6352 Installasjon av bergvarme i Rossabø kirke 142 655 96 000 Haugesund Kirkelige Fellesråd Haugesund Rogaland
15/6431 Nye Varmepumper Eiken Bedehus 61 817 41 600 Eiken Indremisjonslag Hægebostad Vest-Agder
15/717 Luft vann varmepumpe i industrihall 355 318 200 000 Nor Element AS Marnardal Vest-Agder
15/739 Geovarmeanlegg 71 328 48 000 Rælingen Kirkelige Fellesråd Rælingen Akershus
15/742 Flisbasert varmesentral 384 150 200 000 Takstolteknikk AS Lardal Vestfold
15/766 Varmepumpeinstallasjon ved Boligsameiet Knausen 285 311 192 000 Boligsameiet Knausen Bærum Akershus
15/82 Bergvarme, vannbåren varme. 23 776 16 000 Doktorgården AS Kongsvinger Hedmark
15/922 Pellets fyringsanlegg 138 720 102 000 Fred Lind Øksnes Nordland
15/950 Varmepumpe anlegg med tillhørende brønnpark 142 655 96 000 Søre Øyjorden borettslag Bergen Hordaland
15/973Væske-væske varmepumpe, Kjørbekkdalen 4. Varmesentral Forenklet (Søknad)
190 207 100 000 Buffin Real Estate Norway AS Skien Telemark
15/975 Utskifting av oljefyr 28 531 19 200 Kløfta Rotary Klubb Ullensaker Akershus
Kartleggingsstøtteforeksisterendebygg
15/1386 Kartlegging av ENØK-tiltak - Br. Jangaard AS - 109 277 Brødrene Jangaard AS Ålesund Møre og Romsdal
15/1418 Kartlegging Ekornes AS - 163 400 Ekornes ASA Landsdekkende Landsdekkende
15/1569 Kartleggingsstøtte - Trondheim Eiendom 2015 - 89 644 Trondheim Eiendom Trondheim Sør-Trøndelag
15/1679 Utarbeidelse av ENØK-analyser i forbindelse med EPC-prosjekt - 130 162 Bærum kommune Eiendom Bærum Akershus
15/1722 Kartlegging av Oslo City og Royal Christiania Hotell i Oslo - 92 492 DNB Næringseiendom AS Oslo Oslo
15/1875 Emta - Realisering av ENØK potensiale - Pilot - 174 232 Statsbygg Landsdekkende Landsdekkende
15/1932 Kartlegging av energi tiltak i Obligos norske portefølje - 158 678 Obligo Investment manage-ment AS
Landsdekkende Landsdekkende
15/2037Kartlegging Romeriksenteret, Oasen Storsenter og Gunerius kjøpesenter
- 55 305 Olav Thon Eiendomsselskap ASA
Landsdekkende Landsdekkende
15/2041Kartlegging av tiltak i eiendomfondet Norge 1, NNPK, APNI og Nordic 1
- 364 592 Aberdeen Asset Management Norway AS
Landsdekkende Landsdekkende
15/2075 Nordea Liv - AAM - Kartlegging - 236 829 Nordea Liv Eiendom Hol-ding AS
Landsdekkende Landsdekkende
15/2082 Kartlegging Thon Kjøpesenter Vest - 106 007 Thon Holding AS Landsdekkende Landsdekkende
15/2083 Kartlegging Lagunen Storsenter - 70 000 Lagunen Senterforening Bergen Hordaland
15/2084 Kartlegging Strømmen Storsenter - 100 205 Vats AS Skedsmo Akershus
15/2085 Kartlegging Sørlandsenteret - 122 868 Sørlandssenteret Eiendom AS Kristiansand Vest-Agder
15/2101 Karlegging av byggportefølge - 67 784 Jaras Drift AS Landsdekkende Landsdekkende
15/2114 Kartlegging av tiltak ved Lilleakerveien 6 og Lilleakerveien 4 - 57 638 Mustad Eiendom AS Oslo Oslo
15/2131 Kartlegging Vestkanten Storsenter - 61 200 Vestkanten AS Bergen Hordaland
15/2135 Kartlegging Thon Kjøpesenter Øst - 111 360 Thon Holding AS Landsdekkende Landsdekkende
15/2189 Kartlegging av energibesparende tiltak i boligblokker - 150 000 Stiftelsen Kaare Berg Oslo Oslo
15/2236 Energiinventering och kartlegging av eksisterande hotellbygg - 58 500 Nordic Property Manage-ment AS
Landsdekkende Landsdekkende
15/2238Automobil AS - Energikartlegging av 18 bilforretninger/-verksteder
- 54 450 Automobil AS Landsdekkende Landsdekkende
15/2493 Kartlegging Enøk II - 162 228 Storebrand Eiendom Hol-ding AS
Landsdekkende Landsdekkende
15/2542 Kartlegging enøktiltak DNB Bank - 258 129 DNB Bank ASA Landsdekkende Landsdekkende
15/2552 Energikartlegging Grimstad kommune 2015 - 50 174 Grimstad kommune Grimstad Aust-Agder
15/2561 Kjefting av vinduer i nærings bygg. - 50 000 Raufoss Apartment Hotel AS Vestre Toten Oppland
15/2925 Kongsberg Teknologipark - Kartlegging av energitiltak - 81 460 Kongsberg Teknologipark AS Kongsberg Buskerud
15/3020 Jotun AS - enøk-kartlegging av bygninger i Sandefjord og Larvik - 55 120 Jotun AS Sandefjord Vestfold
15/3485 Enøk-kartlegging - SIB Bolig Fantoftvegen 14 AB og EFGH - 250 000 Studentsamskipnaden i Bergen
Bergen Hordaland
1 Enovatilskuddet (3819 tilskudd), Energitiltak i bolig (39 tiltak) samt Støtte til energirådgiving (4 prosjekter) er ikke inkludert i oversikten
SID ProsjekttittelEnergiresultat
(KWh)Vedtattstøtte
Søker Kommune Fylke
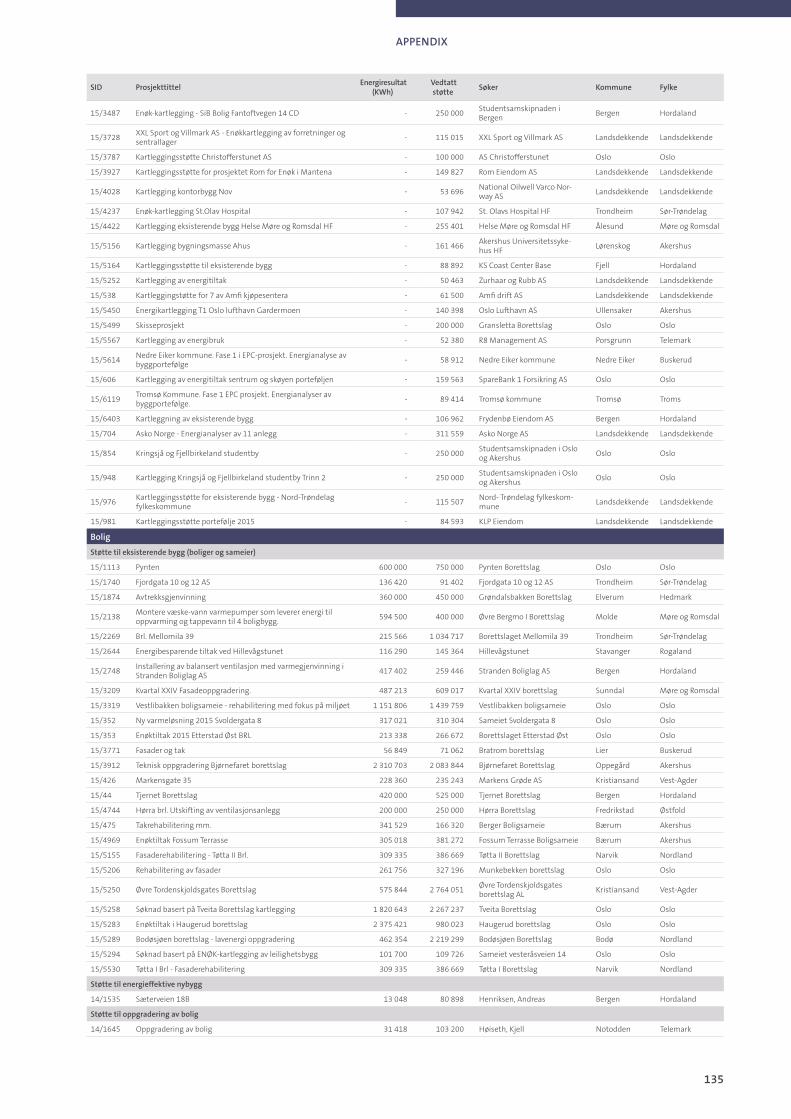
135
APPENDIX
15/3487 Enøk-kartlegging - SiB Bolig Fantoftvegen 14 CD - 250 000 Studentsamskipnaden i Bergen
Bergen Hordaland
15/3728XXL Sport og Villmark AS - Enøkkartlegging av forretninger og sentrallager
- 115 015 XXL Sport og Villmark AS Landsdekkende Landsdekkende
15/3787 Kartleggingsstøtte Christofferstunet AS - 100 000 AS Christofferstunet Oslo Oslo
15/3927 Kartleggingsstøtte for prosjektet Rom for Enøk i Mantena - 149 827 Rom Eiendom AS Landsdekkende Landsdekkende
15/4028 Kartlegging kontorbygg Nov - 53 696 National Oilwell Varco Nor-way AS
Landsdekkende Landsdekkende
15/4237 Enøk-kartlegging St.Olav Hospital - 107 942 St. Olavs Hospital HF Trondheim Sør-Trøndelag
15/4422 Kartlegging eksisterende bygg Helse Møre og Romsdal HF - 255 401 Helse Møre og Romsdal HF Ålesund Møre og Romsdal
15/5156 Kartlegging bygningsmasse Ahus - 161 466 Akershus Universitetssyke-hus HF
Lørenskog Akershus
15/5164 Kartleggingsstøtte til eksisterende bygg - 88 892 KS Coast Center Base Fjell Hordaland
15/5252 Kartlegging av energitiltak - 50 463 Zurhaar og Rubb AS Landsdekkende Landsdekkende
15/538 Kartleggingstøtte for 7 av Amfi kjøpesentera - 61 500 Amfi drift AS Landsdekkende Landsdekkende
15/5450 Energikartlegging T1 Oslo lufthavn Gardermoen - 140 398 Oslo Lufthavn AS Ullensaker Akershus
15/5499 Skisseprosjekt - 200 000 Gransletta Borettslag Oslo Oslo
15/5567 Kartlegging av energibruk - 52 380 R8 Management AS Porsgrunn Telemark
15/5614Nedre Eiker kommune. Fase 1 i EPC-prosjekt. Energianalyse av byggportefølge
- 58 912 Nedre Eiker kommune Nedre Eiker Buskerud
15/606 Kartlegging av energitiltak sentrum og skøyen porteføljen - 159 563 SpareBank 1 Forsikring AS Oslo Oslo
15/6119Tromsø Kommune. Fase 1 EPC prosjekt. Energianalyser av byggportefølge.
- 89 414 Tromsø kommune Tromsø Troms
15/6403 Kartleggning av eksisterende bygg - 106 962 Frydenbø Eiendom AS Bergen Hordaland
15/704 Asko Norge - Energianalyser av 11 anlegg - 311 559 Asko Norge AS Landsdekkende Landsdekkende
15/854 Kringsjå og Fjellbirkeland studentby - 250 000 Studentsamskipnaden i Oslo og Akershus
Oslo Oslo
15/948 Kartlegging Kringsjå og Fjellbirkeland studentby Trinn 2 - 250 000 Studentsamskipnaden i Oslo og Akershus
Oslo Oslo
15/976Kartleggingsstøtte for eksisterende bygg - Nord-Trøndelag fylkeskommune
- 115 507 Nord- Trøndelag fylkeskom-mune
Landsdekkende Landsdekkende
15/981 Kartleggingsstøtte portefølje 2015 - 84 593 KLP Eiendom Landsdekkende Landsdekkende
Bolig
Støttetileksisterendebygg(boligerogsameier)
15/1113 Pynten 600 000 750 000 Pynten Borettslag Oslo Oslo
15/1740 Fjordgata 10 og 12 AS 136 420 91 402 Fjordgata 10 og 12 AS Trondheim Sør-Trøndelag
15/1874 Avtrekksgjenvinning 360 000 450 000 Grøndalsbakken Borettslag Elverum Hedmark
15/2138Montere væske-vann varmepumper som leverer energi til oppvarming og tappevann til 4 boligbygg.
594 500 400 000 Øvre Bergmo I Borettslag Molde Møre og Romsdal
15/2269 Brl. Mellomila 39 215 566 1 034 717 Borettslaget Mellomila 39 Trondheim Sør-Trøndelag
15/2644 Energibesparende tiltak ved Hillevågstunet 116 290 145 364 Hillevågstunet Stavanger Rogaland
15/2748Installering av balansert ventilasjon med varmegjenvinning i Stranden Boliglag AS
417 402 259 446 Stranden Boliglag AS Bergen Hordaland
15/3209 Kvartal XXIV Fasadeoppgradering. 487 213 609 017 Kvartal XXIV borettslag Sunndal Møre og Romsdal
15/3319 Vestlibakken boligsameie - rehabilitering med fokus på miljøet 1 151 806 1 439 759 Vestlibakken boligsameie Oslo Oslo
15/352 Ny varmeløsning 2015 Svoldergata 8 317 021 310 304 Sameiet Svoldergata 8 Oslo Oslo
15/353 Enøktiltak 2015 Etterstad Øst BRL 213 338 266 672 Borettslaget Etterstad Øst Oslo Oslo
15/3771 Fasader og tak 56 849 71 062 Bratrom borettslag Lier Buskerud
15/3912 Teknisk oppgradering Bjørnefaret borettslag 2 310 703 2 083 844 Bjørnefaret Borettslag Oppegård Akershus
15/426 Markensgate 35 228 360 235 243 Markens Grøde AS Kristiansand Vest-Agder
15/44 Tjernet Borettslag 420 000 525 000 Tjernet Borettslag Bergen Hordaland
15/4744 Hørra brl. Utskifting av ventilasjonsanlegg 200 000 250 000 Hørra Borettslag Fredrikstad Østfold
15/475 Takrehabilitering mm. 341 529 166 320 Berger Boligsameie Bærum Akershus
15/4969 Enøktiltak Fossum Terrasse 305 018 381 272 Fossum Terrasse Boligsameie Bærum Akershus
15/5155 Fasaderehabilitering - Tøtta II Brl. 309 335 386 669 Tøtta II Borettslag Narvik Nordland
15/5206 Rehabilitering av fasader 261 756 327 196 Munkebekken borettslag Oslo Oslo
15/5250 Øvre Tordenskjoldsgates Borettslag 575 844 2 764 051 Øvre Tordenskjoldsgates borettslag AL
Kristiansand Vest-Agder
15/5258 Søknad basert på Tveita Borettslag kartlegging 1 820 643 2 267 237 Tveita Borettslag Oslo Oslo
15/5283 Enøktiltak i Haugerud borettslag 2 375 421 980 023 Haugerud borettslag Oslo Oslo
15/5289 Bodøsjøen borettslag - lavenergi oppgradering 462 354 2 219 299 Bodøsjøen Borettslag Bodø Nordland
15/5294 Søknad basert på ENØK-kartlegging av leilighetsbygg 101 700 109 726 Sameiet vesteråsveien 14 Oslo Oslo
15/5530 Tøtta I Brl - Fasaderehabilitering 309 335 386 669 Tøtta I Borettslag Narvik Nordland
Støttetilenergieffektivenybygg
14/1535 Sæterveien 18B 13 048 80 898 Henriksen, Andreas Bergen Hordaland
Støttetiloppgraderingavbolig
14/1645 Oppgradering av bolig 31 418 103 200 Høiseth, Kjell Notodden Telemark
SID ProsjekttittelEnergiresultat
(KWh)Vedtattstøtte
Søker Kommune Fylke
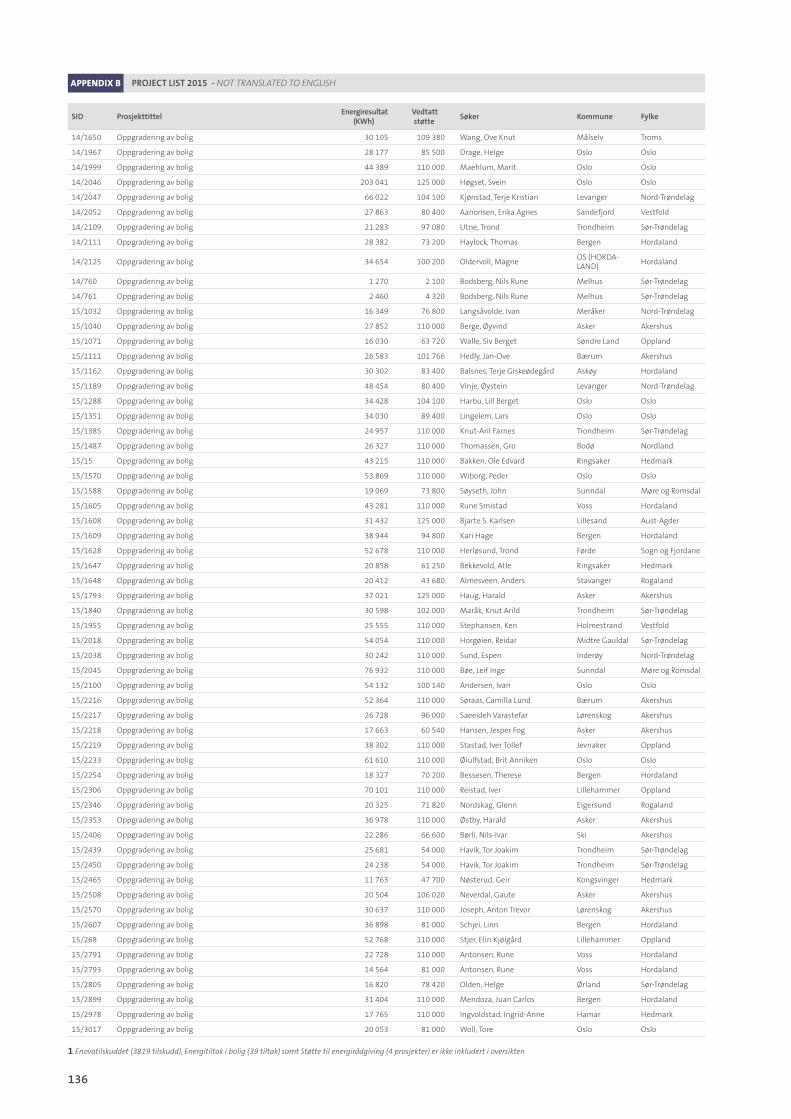
136
APPENDIX B PROJECT LIST 2015 - NOT TRANSLATED TO ENGLISH
14/1650 Oppgradering av bolig 30 105 109 380 Wang, Ove Knut Målselv Troms
14/1967 Oppgradering av bolig 28 177 85 500 Drage, Helge Oslo Oslo
14/1999 Oppgradering av bolig 44 389 110 000 Maehlum, Marit Oslo Oslo
14/2046 Oppgradering av bolig 203 041 125 000 Høgset, Svein Oslo Oslo
14/2047 Oppgradering av bolig 66 022 104 100 Kjønstad, Terje Kristian Levanger Nord-Trøndelag
14/2052 Oppgradering av bolig 27 863 80 400 Aanonsen, Erika Agnes Sandefjord Vestfold
14/2109 Oppgradering av bolig 21 283 97 080 Utne, Trond Trondheim Sør-Trøndelag
14/2111 Oppgradering av bolig 28 382 73 200 Haylock, Thomas Bergen Hordaland
14/2125 Oppgradering av bolig 34 654 100 200 Oldervoll, MagneOS (HORDA-LAND)
Hordaland
14/760 Oppgradering av bolig 1 270 2 100 Bodsberg, Nils Rune Melhus Sør-Trøndelag
14/761 Oppgradering av bolig 2 460 4 320 Bodsberg, Nils Rune Melhus Sør-Trøndelag
15/1032 Oppgradering av bolig 16 349 76 800 Langsåvolde, Ivan Meråker Nord-Trøndelag
15/1040 Oppgradering av bolig 27 852 110 000 Berge, Øyvind Asker Akershus
15/1071 Oppgradering av bolig 16 030 63 720 Walle, Siv Berget Søndre Land Oppland
15/1111 Oppgradering av bolig 26 583 101 766 Hedly, Jan-Ove Bærum Akershus
15/1162 Oppgradering av bolig 30 302 83 400 Balsnes, Terje Giskeødegård Askøy Hordaland
15/1189 Oppgradering av bolig 48 454 80 400 Vinje, Øystein Levanger Nord-Trøndelag
15/1288 Oppgradering av bolig 34 428 104 100 Harbu, Lill Berget Oslo Oslo
15/1351 Oppgradering av bolig 34 030 89 400 Lingelem, Lars Oslo Oslo
15/1385 Oppgradering av bolig 24 957 110 000 Knut-Aril Farnes Trondheim Sør-Trøndelag
15/1487 Oppgradering av bolig 26 327 110 000 Thomassen, Gro Bodø Nordland
15/15 Oppgradering av bolig 43 215 110 000 Bakken, Ole Edvard Ringsaker Hedmark
15/1570 Oppgradering av bolig 53 869 110 000 Wiborg, Peder Oslo Oslo
15/1588 Oppgradering av bolig 19 069 73 800 Søyseth, John Sunndal Møre og Romsdal
15/1605 Oppgradering av bolig 43 281 110 000 Rune Smistad Voss Hordaland
15/1608 Oppgradering av bolig 31 432 125 000 Bjarte S. Karlsen Lillesand Aust-Agder
15/1609 Oppgradering av bolig 38 944 94 800 Kari Hage Bergen Hordaland
15/1628 Oppgradering av bolig 52 678 110 000 Herløsund, Trond Førde Sogn og Fjordane
15/1647 Oppgradering av bolig 20 858 61 250 Bekkevold, Atle Ringsaker Hedmark
15/1648 Oppgradering av bolig 20 412 43 680 Almesveen, Anders Stavanger Rogaland
15/1793 Oppgradering av bolig 37 021 125 000 Haug, Harald Asker Akershus
15/1840 Oppgradering av bolig 30 598 102 000 Maråk, Knut Arild Trondheim Sør-Trøndelag
15/1955 Oppgradering av bolig 25 555 110 000 Stephansen, Ken Holmestrand Vestfold
15/2018 Oppgradering av bolig 54 054 110 000 Horgøien, Reidar Midtre Gauldal Sør-Trøndelag
15/2038 Oppgradering av bolig 30 242 110 000 Sund, Espen Inderøy Nord-Trøndelag
15/2045 Oppgradering av bolig 76 932 110 000 Bøe, Leif Inge Sunndal Møre og Romsdal
15/2100 Oppgradering av bolig 54 132 100 140 Andersen, Ivan Oslo Oslo
15/2216 Oppgradering av bolig 52 364 110 000 Søraas, Camilla Lund Bærum Akershus
15/2217 Oppgradering av bolig 26 728 96 000 Saeeideh Varastefar Lørenskog Akershus
15/2218 Oppgradering av bolig 17 663 60 540 Hansen, Jesper Fog Asker Akershus
15/2219 Oppgradering av bolig 38 302 110 000 Stastad, Iver Tollef Jevnaker Oppland
15/2233 Oppgradering av bolig 61 610 110 000 Øiulfstad, Brit Anniken Oslo Oslo
15/2254 Oppgradering av bolig 18 327 70 200 Bessesen, Therese Bergen Hordaland
15/2306 Oppgradering av bolig 70 101 110 000 Reistad, Iver Lillehammer Oppland
15/2346 Oppgradering av bolig 20 325 71 820 Nordskag, Glenn Eigersund Rogaland
15/2353 Oppgradering av bolig 36 978 110 000 Østby, Harald Asker Akershus
15/2406 Oppgradering av bolig 22 286 66 600 Børli, Nils-Ivar Ski Akershus
15/2439 Oppgradering av bolig 25 681 54 000 Havik, Tor Joakim Trondheim Sør-Trøndelag
15/2450 Oppgradering av bolig 24 238 54 000 Havik, Tor Joakim Trondheim Sør-Trøndelag
15/2465 Oppgradering av bolig 11 763 47 700 Nøsterud, Geir Kongsvinger Hedmark
15/2508 Oppgradering av bolig 20 504 106 020 Neverdal, Gaute Asker Akershus
15/2570 Oppgradering av bolig 30 637 110 000 Joseph, Anton Trevor Lørenskog Akershus
15/2607 Oppgradering av bolig 36 898 81 000 Schjei, Linn Bergen Hordaland
15/268 Oppgradering av bolig 52 768 110 000 Stjer, Elin Kjølgård Lillehammer Oppland
15/2791 Oppgradering av bolig 22 728 110 000 Antonsen, Rune Voss Hordaland
15/2793 Oppgradering av bolig 14 564 81 000 Antonsen, Rune Voss Hordaland
15/2805 Oppgradering av bolig 16 820 78 420 Olden, Helge Ørland Sør-Trøndelag
15/2899 Oppgradering av bolig 31 404 110 000 Mendoza, Juan Carlos Bergen Hordaland
15/2978 Oppgradering av bolig 17 765 110 000 Ingvoldstad, Ingrid-Anne Hamar Hedmark
15/3017 Oppgradering av bolig 20 053 81 000 Woll, Tore Oslo Oslo
1 Enovatilskuddet (3819 tilskudd), Energitiltak i bolig (39 tiltak) samt Støtte til energirådgiving (4 prosjekter) er ikke inkludert i oversikten
SID ProsjekttittelEnergiresultat
(KWh)Vedtattstøtte
Søker Kommune Fylke

137
APPENDIX
15/3097 Oppgradering av bolig 19 298 81 000 Rønning, Lars Erik Steinkjer Nord-Trøndelag
15/316 Oppgradering av bolig 70 194 110 000 Eggen, Jørund Halvdan Verdal Nord-Trøndelag
15/3194 Oppgradering av bolig 46 832 125 000 Ekre, Bente Elisabeth Hen-riksen
Nord-Fron Oppland
15/3208 Oppgradering av bolig 46 649 110 000 Reknes, Sandra Veddeng Sula Møre og Romsdal
15/3217 Oppgradering av bolig 31 805 125 000 Krodemansch, Gert Kvænangen Troms
15/3218 Oppgradering av bolig 27 178 66 240 Lindahl, Hans Øyvind Bærum Akershus
15/3222 Oppgradering av bolig 53 773 110 000 Nes, Thuy-Anh Le Leikanger Sogn og Fjordane
15/3223 Oppgradering av bolig 38 346 78 000 Hustad, Anniken Bærum Akershus
15/3234 Oppgradering av bolig 28 117 77 400 Alyas, Dani Toma Alyas Oslo Oslo
15/3282 Oppgradering av bolig 50 889 85 200 Skarsbø, Terje Gjemnes Møre og Romsdal
15/330 Oppgradering av bolig 28 024 110 000 Rannem, Kenneth Trondheim Sør-Trøndelag
15/3346 Oppgradering av bolig 40 669 94 200 Svindseth, Mads Trondheim Sør-Trøndelag
15/3394 Oppgradering av bolig 70 344 110 000 Solvang, Torodd Karmøy Rogaland
15/348 Oppgradering av bolig 18 818 81 600 Strøm, Joar Horten Vestfold
15/3484 Oppgradering av bolig 71 919 110 000 Seeland, Bjørn Bærum Akershus
15/349 Oppgradering av bolig 38 256 104 400 Hope, Hege Bergen Hordaland
15/3553 Oppgradering av bolig 34 025 100 800 Blålid, Silje Sandefjord Vestfold
15/3569 Oppgradering av bolig 56 515 110 000 Sletten, Rajamohan Mani Oslo Oslo
15/3603 Oppgradering av bolig 29 954 106 200 Vangsnes, Erik Loland Kristiansand Vest-Agder
15/3636 Oppgradering av bolig 43 049 107 100 Overå, Lene Bjørlo Ålesund Møre og Romsdal
15/3730 Oppgradering av bolig 14 635 110 000 Hagen, Erik Øyer Oppland
15/3777 Oppgradering av bolig 24 861 66 000 Sæterhaug, Bjørnar Bodø Nordland
15/3830 Oppgradering av bolig 59 596 125 000 Wiggen, Magne Magler Bærum Akershus
15/3856 Oppgradering av bolig 34 393 110 000 Thompsen, Kjell Inge Oslo Oslo
15/3882 Oppgradering av bolig 47 188 100 980 Småbrekke, Berit Bergen Hordaland
15/4129 Oppgradering av bolig 76 653 110 000 Stokke, Randi Johanne Gjemnes Møre og Romsdal
15/4252 Oppgradering av bolig 17 955 61 500 Langseid, Rune Skien Telemark
15/4264 Oppgradering av bolig 34 073 125 000 Pedersen, Anne Elverum Hedmark
15/4314 Oppgradering av bolig 35 723 88 800 Olsen, Roger Stavanger Rogaland
15/432 Oppgradering av bolig 17 897 110 000 Dokken, Henning Nittedal Akershus
15/436 Oppgradering av bolig 27 189 125 000 Gjertsås, Hans-Petter Lierne Nord-Trøndelag
15/4503 Oppgradering av bolig 19 342 79 800 Gullaksen, Kristian Hole Buskerud
15/4534 Oppgradering av bolig 27 826 95 220 Engeland, Anders Oslo Oslo
15/462 Oppgradering av bolig 15 596 47 100 Berge, Ole Raimund Sund Hordaland
15/4754 Oppgradering av bolig 37 648 57 000 Sandberg, Jens Helge Østre Toten Oppland
15/4829 Oppgradering av bolig 62 380 110 000 Sørlie, Morten Trondheim Sør-Trøndelag
15/4908 Oppgradering av bolig 23 891 93 030 Kjeldsen, Ole Dybro Selbu Sør-Trøndelag
15/4944 Oppgradering av bolig 52 649 110 000 Bjerkan, Ola Melhus Sør-Trøndelag
15/4964 Oppgradering av bolig 14 084 71 400 Grytten, Sigurd Oslo Oslo
15/4987 Oppgradering av bolig 33 499 85 200 Røkenes, Kjersti Trondheim Sør-Trøndelag
15/5048 Oppgradering av bolig 53 747 110 000 Sandberg, Timo T M Haugesund Rogaland
15/5154 Oppgradering av bolig 18 692 56 400 Stenehjem, Jo Steinson Oslo Oslo
15/546 Oppgradering av bolig 31 718 110 000 Overå, Kristian Stranda Møre og Romsdal
15/549 Oppgradering av bolig 31 015 104 340 Fetveit,Arne Oslo Oslo
15/5615 Oppgradering av bolig 27 657 109 440 Eikrem, Sindre Sula Møre og Romsdal
15/5694 Oppgradering av bolig 29 213 109 900 Haugen, Stian Grimstad Aust-Agder
15/5906 Oppgradering av bolig 54 288 110 000 Høy, Martin Oslo Oslo
15/5923 Oppgradering av bolig 25 636 102 120 Eriksen, Dan Peder Oslo Oslo
15/6095 Oppgradering av bolig 12 483 55 530 Lindeberg, Eivind Oslo Oslo
15/6096 Oppgradering av bolig 12 033 53 220 Jordahl, Magnus Oslo Oslo
15/6115 Oppgradering av bolig 28 010 110 000 Kvalsund, Tor-Martin Stavanger Rogaland
15/626 Oppgradering av bolig 26 285 109 900 Bertelsen, Joachim F. Nittedal Akershus
15/631 Oppgradering av bolig 15 949 91 500 Carlstedt, Andreas Elstadt Kongsberg Buskerud
15/757 Oppgradering av bolig 56 240 110 000 Jacobsen-Ellegård, Astri Kragerø Telemark
15/785 Oppgradering av bolig 24 787 110 000 Sommerseth, Vanja BØ (N.) Nordland
15/787 Oppgradering av bolig 25 517 110 000 Paulsen, Christopher Kristiansand Vest-Agder
15/952 Oppgradering av bolig 22 616 110 000 Selseng, Robert Stavanger Rogaland
15/959 Oppgradering av bolig 40 044 79 200 Gjersdal, Rune Klepp Rogaland
Kartleggingsstøttebolig
15/1260 Energirådgivning - 50 000 Sørbytunet Sameie Re Vestfold
15/1402 Bodøsjøen Borettslag - 250 000 Bodøsjøen Borettslag Bodø Nordland
SID ProsjekttittelEnergiresultat
(KWh)Vedtattstøtte
Søker Kommune Fylke

138
APPENDIX B PROJECT LIST 2015 - NOT TRANSLATED TO ENGLISH
15/1494 Bodøsjøen Borettslag - Ankerveien 2 - 50 000 Bodøsjøen Borettslag Bodø Nordland
15/1510 Karivold Borettslag - Reduserte fyringskostnader - 50 000 Karivold Borettslag Fredrikstad Østfold
15/1568 Energimerking av boliger og tiltak for grønnere energibruk - 50 000 Eugeniesgate 23 A Sameie Oslo Oslo
15/1610 Fasaderehabilitering - 29 440 Borettslaget Nardo Søndre Trondheim Sør-Trøndelag
15/1743 Kartlegging av enøktiltak - 41 540 Sameiet Krusesgate 13 Oslo Oslo
15/1824Kartlegge aktuelle investeringer i energitiltak for Puddefjorden borettslag
- 150 000 Puddefjorden Borettslag Bergen Hordaland
15/1869 Vestlibakken Boligsameie - rehabilitering med fokus på miljøet - 95 000 Vestlibakken boligsameie Oslo Oslo
15/1975 ENØK-kartlegging av leilighetsbygg - 21 695 Sameiet vesteråsveien 14 Oslo Oslo
15/1976 Energitiltak Sameiet Gamletorget - 50 000 Sameiet Gamletorget Sandnes Rogaland
15/2132 Etterisolering av yttervegger og utskifting av vinduer - 50 000 Borettslaget Bendixensvei 1-9 Bergen Hordaland
15/2197 Rehabilitering av Solheimslien Borettslag - 250 000 Solheimslien Borettslag Bergen Hordaland
15/2407 Rehabilitering - 100 000 Granåsvegen Borettslag Trondheim Sør-Trøndelag
15/2506 Kvartal XXIV Fasadeoppgradering - 100 000 Kvartal XXIV borettslag Sunndal Møre og Romsdal
15/2507 Hovsvegen Borettslag - Fasaderehabilitering - 50 000 Hovsvegen borettslag Sunndal Møre og Romsdal
15/2554 Energikartlegging Bjørnefaret borettslag - 250 000 Bjørnefaret Borettslag Rælingen Akershus
15/279 Utskiftning av varmekilder - 150 000 Vesleenga Borettslag Skedsmo Akershus
15/3317 Oppgradering av varme og ventilasjonsanlegg, - 150 000 Kvartal XV Borettslag AL Sunndal Møre og Romsdal
15/3666 3416 Brl Kristianslyst 3 - 150 000 Kristianslyst III Borettslag Stavanger Rogaland
15/3772 Energikartlegging - 50 000 Fjordparken borettslag Drammen Buskerud
15/3881 Kartlegging av aktuelle energitiltak i boligblokk - 50 000 Sameiet Hjemly Ås Akershus
15/4210 Energi optimalisering av Ulsmåg borettslag - 250 000 Ulsmåg Borettslag Bergen Hordaland
15/4211 Oppgradering Øvre Grønlivei - 50 000 Sameiet Øvre Grønlivei 16 Lørenskog Akershus
15/4347 Oppgradering av Månebakken Borettslag - 50 000 Månebakken Borettslag Trondheim Sør-Trøndelag
15/437 Enøkanalyse 2015, ny varmeløsning - 150 000 Snarøya Sameie Bærum Akershus
15/451 Kartlegging energitiltak sameiets boliger - 50 000 Sameiet Stakkevollveien 33 Tromsø Troms
15/4648 Skissprosjekt - 100 000 Sameiet Søndre Nes Ås Akershus
15/4671 Kartlegging varmeanlegg - 250 000 Manglerudjordet Borettslag Oslo Oslo
15/468 Kartlegging av enøktiltak Åsen Terrasse B/L II - 24 866 Åsen Terrasse II Borettslag Horten Vestfold
15/4960 Forprosjekt våtrom - 50 000 Borettslaget Sørmarkå Stavanger Rogaland
15/4963Brl Hundvåg Ring 1 – Rehabilitering av ventilasjonsanlegg - blokker
- 250 000 Hundvåg Ring I Borettslag Stavanger Rogaland
15/499 Termografering i Fjordgata 26-28 - 50 000 Sameiet Fjordgata 26-28 Trondheim Sør-Trøndelag
15/5170Klarlegging av årsaker til taklekkasjer og forslag til utbedrende tiltak
- 50 000 Bekkensten Boligsameie Oslo Oslo
15/5173 Kartlegging av energitiltak i Midtre Ravnåsen Borettslag - 50 000 Midtre Ravnåsen Borettslag Oslo Oslo
15/5247 Enøk Kartlegging - SiB Bolig Øyjordsveien 11 og Hatleveien 5 F - 150 000 Studentsamskipnaden i Bergen
Bergen Hordaland
15/5249 Enøk Kartlegging - SiB Bolig Hatleveien 5 AB og CDE - 250 000 Studentsamskipnaden i Bergen
Bergen Hordaland
15/5263 Energikartlegging Borettslaget Vestre Lavblokker - 250 000 Borettslaget Vestre Bergen Hordaland
15/5264 Energikartlegging Borettslaget Vestre Høyblokk - 150 000 Borettslaget Vestre Bergen Hordaland
15/5267 Energikartlegging Vadmyra Borettslag Lavblokker - 200 000 Vadmyra Borettslag Bergen Hordaland
15/5270 Energikartlegging Vadmyra Borettslag Høyblokker - 250 000 Vadmyra Borettslag Bergen Hordaland
15/5677 Myrheim III - 50 000 Myrheim III Borettslag Tromsø Troms
15/5843 Energikartlegging - 50 000 Sameiet Oksevollen Øst Mandal Vest-Agder
15/6027 Energibesparende tiltak - 200 000 Aamodthagen Boligsameie Rælingen Akershus
15/6192Disen Borettslag AL, Kartlegging av energitiltak i eksisterende bygg
- 250 000 AL Disen Borettslag Oslo Oslo
15/629 Tveita Borettslag kartlegging - 114 925 Tveita Borettslag Oslo Oslo
15/636 Sparetiltak Seilduksgata 5 - 50 000 Borettslaget Seilduksgaten 5 Oslo Oslo
15/852 Rehabilitering Olav Engelbrektssons Alle 51-57 - 15 460 Olav Engelbrektsons Alle 51-57 AS
Trondheim Sør-Trøndelag
15/962 Rehabilitering Sørhellinga Borettslag - 100 000 Sørhellinga Borettslag Oslo Oslo
FormidlingsløsningerfraAMS
15/6099 Smarte målere - Smarte forbrukere - Fjordkraft 3 826 486 6 300 000 Fjordkraft AS Landsdekkende Landsdekkende
15/6104 Smarte målere - Smarte forbrukere - Lyse 18 011 891 13 317 784 Lyse Energisalg AS Stavanger Rogaland
15/6105 Smarte målere - Smarte forbrukere - Eidsiva 3 765 840 6 393 866 Eidsiva Marked AS Alvdal Hedmark
15/6107 Smarte målere - smartere forbrukere - Follo 11 288 935 9 995 750 Follo Energi AS Fredrikstad Østfold
15/6109 Smarte målere - smartere forbrukere - NTE 7 155 000 7 496 503 NTE Marked AS Flatanger Nord-Trøndelag
15/6111 Smarte målere - smartere forbrukere - EB Strøm 3 176 000 6 803 125 EB Strøm AS Drammen Buskerud
15/6112 Smarte målere - Smarte forbrukere - Ringeriks-Kraft 6 776 000 9 436 867 Ringeriks-kraft strøm AS Ål Buskerud
1 Enovatilskuddet (3819 tilskudd), Energitiltak i bolig (39 tiltak) samt Støtte til energirådgiving (4 prosjekter) er ikke inkludert i oversikten
SID ProsjekttittelEnergiresultat
(KWh)Vedtattstøtte
Søker Kommune Fylke

139
APPENDIX
Appendix CAssignments outside the Energy Fund
NaturalgasOn behalf of the Ministry of Petroleum and Energy (MPE), Enova has administered the funds of the support programme for natural gas infrastructure during the 2003-2009 period. The last allocation over the national budget was in 2009.
The objective of this arrangement was to facilitate increased domestic use of natural gas, and particular emphasis has been placed on ensuring that the use of natural gas has a positive impact on the environment. Conversion from heavier fuels in industry, shipping and transport were prioritized market areas.
Any remaining funds following completion of the projects must be returned to the public purse.
At year-end 2015, only one ongoing project remains with a residual commitment of NOK 38.5 million.
Publications and consultation statements
Publications
Enovas Resultat- og Aktivitetsrapport 2014 Enovarapport2015:1
Enova Annual Report 2014 – Results and ActivitiesEnovarapport2015:2
Råd om energimerking av varmepumpe for boligeiereEnovarapport2015:3
Kjøpsveileder solcellerEnovarapport2015:4
Kjøpsveileder varmegjenvinning av gråvann Enovarapport2015:5
Kjøpsveileder avtrekksvarmepumpe Enovarapport2015:6
Teknologikartlegging kraftgjenvinning fra lavtemperatur spillvarmeEnovarapport2015:7
Analyse av feltmålinger av varmepumper i boligerEnovarapport2015:8
Markedsutviklingen 2015. Hovedtrender i Enovas satsingsområderEnovarapport2015:9
Rehabilitering og energioppgradering av boliger. Drøfting av begreper og måling av omfangEnovarapport2015:10
Consultationstatements
The invitation from Direktoratet for byggkvalitet to submit a consultation statement on: Nye energikrav til bygg. Forslag til endringer i tekniske krav til byggverk (byggteknisk forskrift) av 26.mars 2010 nr. 489.
The invitation from The Norwegian Water Recourses and Energy Directorate to submit a consultation statement on: Tariffer for uttak i distribusjonsnettet.
The invitation from The Ministry of Trade, Industry and Fisheries to submit a consultation statement on: Innføring av et register for offentlig støtte.
The invitation from The Ministry of Petroleum and Energy to submit a consultation statement on: Forslag til endring av lov om elsertifikater.

140
Definitions and explanation of terminology
CO2equivalent
Unit that corresponds to the effect a volume of CO2 has on global
warming over a certain period, normally 100 years. Emission of other greenhouse gases is converted to CO
2 equivalents according
to their global warming potential.
ClimateresultA climate result is calculated for each project supported by Enova. This calculation corresponds to the change in greenhouse gas emissions as a result of various measures in the project (energy efficiency measures, conversion, production or distribution). The calculation takes a basis in the project’s energy result (kWh) and emission coefficients for various energy carriers. The climate result is measured in CO
2 equivalents.
ContractualenergyresultContractual energy result is the annual energy result a project is expected to realize in the future. The energy result is included as part of the contractual basis between the support recipient and Enova. All decisions within a calendar year are included in the calculation of gross contractual energy result for the year in question.
CostefficiencyOne of the objectives when establishing Enova was to achieve a more cost-effective effort in renewable energy and efficient energy end use. Enova prioritizes projects based on the size of the support need in relation to the energy result (NOK/kWh), given the project’s lifetime and the goals stated in the agreement with the MPE.
ESAESA is the abbreviation for the EFTA Surveillance Authority. The EFTA Surveillance Authority ensures that the EFTA nations, Iceland, Lichtenstein and Norway comply with their obligations under the EEA Agreement.
The EFTA Surveillance Authority also enforces the general ban against state aid, and assesses national support programmes vis-à-vis the EEA rules and has the authority to demand that illegal support be returned.
EnergyrestructuringThe contract between the MPE and Enova stipulates that the Energy Fund will be used to promote an environmentally friendly restructuring of energy end-use, energy production and development of energy and climate technology. The energy restructuring is a long-term effort in the development of the market for efficient and environmentally friendly energy solutions that help strengthen the security of energy supply and reduce greenhouse gas emissions.
EnergyresultThe energy result is a goal (in kWh) for what the projects we support will deliver (per year) through more efficient energy consumption, increased production and increased use of renewable energy.
FinalreportedenergyresultThe final reported energy result is an updated forecast of a project’s expected realized annual energy result. Enova assesses whether the project’s final reported energy result is reasonable when the final report is submitted.
LifetimeA key issue related to new production of energy and reduced energy end-use is how long we will reap benefits from the results. Here one can differentiate between technical and economic life. The technical life is connected to how long the equipment can function with normal maintenance, while economic life is related to how long it will take before it will be more profitable to replace the equipment with new and improved technology. Enova bases its lifetime consideration on economic life. This is also reflected in Enova’s investment analysis. In addition to the importance of project lifetime as a parameter in the assessment of the support need, it also expresses how long we will benefit from the energy result provided by the project. The project’s lifetime multiplied by annual energy result [year*kWh] will express the project’s total energy result over its lifetime. Similarly, the energy cost is also expressed over the lifetime [NOK/[year*kWh]].
Passivehouses/buildingsPassive houses/buildings are buildings which require very little heating. Norwegian standards have been established both for passive residences (NS3700) and passive commercial buildings (NS3701), adapted to Norwegian climatic conditions.
ProgrammesEnova has chosen to focus the use of policy instruments through programmes. A programme is an instrument directed towards one or more specific target groups, with set application deadlines and application criteria.
RealizedenergyresultRealized energy results are measurements or estimates of achieved energy results after a measure has been completed, and its effects can be observed. It takes time from when the measures are implemented until realized results can be reported.
RenewableenergyEnova uses the same definition of renewable energy used in the EU’s Renewables Directive (2001/77/EC). In the directive, renewable energy is defined as renewable, non-fossil energy sources (wind, solar, geothermal energy, tidal energy, hydropower, biomass, gas from treatment plants, gas from cleaning facilities and biogases). Biomass is furthermore defined as biologically degradable fractions of products, waste and agricultural remnants (plant or animal-based), forestry and associated industries, in addition to biologically degradable fractions from industrial and municipal waste.
141
TheEnergyFundThe purpose of the Energy Fund is to be a predictable and long-term source of financing for the environmentally friendly restructuring of energy end-use and energy production and development of energy and climate technology.
The Energy Fund is based on Section 4.4 of the Act relating to amendment of Act No. 60 of 29 June 1990 relating to the generation, conversion, transmission, trading, distribution and use of energy, etc. (Energy Act), cf. Odelsting Proposition No. 35 (2000-2001) and Recommendation to the Storting No. 59 (2000-2001). The Ministry of Petroleum and Energy (MPE) determines the statutes for the Energy Fund.
The Energy Fund is financed through grants in the national budget and a parafiscal charge on the grid tariff for withdrawing power in the distribution grid.
The grants to the Energy Fund mainly consist of returns from the Fund for climate, renewable energy and energy restructuring. At year-end 2015, the capital in this fund was NOK 53.5 billion. In connection with the Climate Compromise in 2012, a decision was made to strengthen the Fund for climate, renewable energy and energy restructuring with a capital contribution of NOK 25 billion
over the period from 2013-2016. In the revised national budget for 2014 (Storting White Paper No. 2 (2013-2014), Recommendation to the Storting No. 260 S (2013-2014)), a decision was made to increase capital in the Fund by NOK 4.25 billion beyond the contribution approved in the Climate Compromise. This was also continued for 2015. An additional increase of NOK 5 billion was approved for the 2016 national budget. It is not certain that the entire returns from these new contributions will be added to the Energy Fund.
TriggeringeffectAs an administrator of public resources, it is important for Enova to ensure that the resources we manage are used in the best possible manner. This principle is stipulated in the agreement between Enova and the MPE in that support must contribute to realizing projects that would not have been realized otherwise. Projects with a low cost per generated or reduced kWh will often be profitable by themselves, and therefore do not require support from the Energy Fund. Support is also considered to be triggering if it advances a project in time, or if a project has a larger scope than it otherwise would have had.
Thisyear’sreportbearstheNordicEcolabel(theSwan)
Number printed: 150Format: A4Paper cover: 300g Scandia 2000 naturalPaper contents: 150g Scandia 2000 natural

142
Enova is a government agency which promotes environmentally friendly restructuring of energy end-use, renewable energy production and new energy and climate technology. Our goal is to create lasting changes in the supply of and demand for efficient and renewable energy and climate solutions.
Enova’s reports can be found at www.enova.no
For more information, contact:AskEnova,tel.08049/[email protected]
Enova report: 2016:1 ISBN 978-82-92502-99-0
Enova SFProfessor Brochs gt. 2N-7030 Trondheim