Responses of neurons in primary and inferior temporal visual cortices to natural scenes
10
Responses of neurons in primary and inferior temporal visual cortices to natural scenes ROLAND BADDELEY 1,2 , L.F. ABBOTT 3 , MICHAEL C.A. BOOTH 1 , FRANK SENGPIEL 2 , TOBE FREEMAN 2 , EDWARD A. WAKEMAN 1 , AND EDMUND T. ROLLS 1 1 Department of Experimental Psychology, University of Oxford, Oxford OX1 3UD, UK 2 University Laboratory of Physiology, University of Oxford, Oxford OX1 3PT, UK 3 Volen Center and Department of Biology, Brandeis University,Waltham, MA 02254, USA SUMMARY The primary visual cortex (V1) is the ¢rst cortical areato receive visual input, and inferior temporal (IT) areas are among the last along the ventral visual pathway. We recorded, in areaV1 of anaesthetized cats and area ITof awake macaque monkeys, responses of neurons to videos of natural scenes. Responses were analysed to test various hypotheses concerning the nature of neural coding in these two regions. A variety of spike-train statistics were measured including spike-count distributions, interspike interval distributions, coe/cients of variation, power spectra, Fano factors and di¡erent sparseness measures. All statistics showed non-Poisson characteristics and several revealed self-similarity of the spike trains. Spike-count distributions were approximately exponential in both visual areas for eight di¡erent videos and for counting windows ranging from 50 ms to 5 seconds. The results suggest that the neurons maximize their information carrying capacity while maintaining a ¢xed long-term-average ¢ring rate, or equivalently, minimize their average ¢ring rate for a ¢xed information carrying capacity. 1. INTRODUCTION It has been suggested that visual representations are optimized to transmit the maximum information about the images encountered in everyday life (Uttley 1973; Linsker 1987; Barlow 1989). This simple assump- tion has proven su/cient to account for the characteristics of large monopolar cells in the £y (Srinivasan et al. 1982; Van Hateren 1992; Laughlin 1981), the temporal characteristics of retinal ganglion cells (Dong & Atick 1995), human spatial frequency thresholds (Atick & Redlich 1992; Van Hateren 1993), and the psychophysics of orientation perception for short presentation times (Baddeley & Hancock 1991). Maximization of information is a powerful theore- tical principle that leads to testable predictions about the ¢ring patterns of neurons. However, to generate speci¢c predictions we must make some assumptions about the nature of the neural code and the type of constraint that limits its information carrying capacity. To apply information maximization to neuronal spike trains, we must identify which of their characteristics carry information. In our analysis, we will consider two possibilities: that ¢ring rates, or more precisely, spike counts over discrete intervals of time, are the information carrying elements; or that interspike inter- vals play this role. Without any constraints on the rate or precision of neuronal spiking, the information carrying capacity of a spike train is in¢nite. Thus, constraints play a crucial role in any information maxi- mization procedure.We will consider three possibilities, constraints on the maximum ¢ring rate, the average ¢ring rate, or a quantity known as the sparseness of the ¢ring-rate distribution. Identifying the nature of the constraint that limits information carrying capacity has important implications for the biophysical mechan- isms that underlie neural coding. Assuming the ¢ring rates carry information, Laughlin (1981) proposed a constraint on the maximum ¢ring rate for neurons in the insect eye, and noted that the optimal ¢ring-rate distribution in this case is £at (¢gure 1 a). A di¡erent proposal, that the distribution of ¢ring rates should be sparse (Field 1994; Olshausen & Field 1996), has led to predictions for the receptive ¢eld properties of neurons in V1 similar to those seen in the data (Olshausen & Field 1996). An example of a sparse distribution is shown in ¢gure 1 b. Here, the number of ‘active’ neurons, neurons with signi¢cantly elevated ¢ring rates, is small. A third proposed constraint is that the average ¢ring rate of the neuron is held ¢xed while the information carrying capacity is maximized (Levy & Baxter 1996; Baddeley 1996). If information is carried by ¢ring rates, this predicts that the distribution of ¢ring rates should be exponential as in ¢gure 1 c (Shannon & Weaver 1949; Levy & Baxter 1996; Rieke et al 1997). If, instead, Proc. R. Soc. Lond. B (1997) 264, 1775^1783 1775 & 1997 The Royal Society Printed in Great Britain
-
Upload
independent -
Category
Documents
-
view
2 -
download
0
Transcript of Responses of neurons in primary and inferior temporal visual cortices to natural scenes

Responses of neurons in primary and inferiortemporal visual cortices to natural scenes
ROLAND BADDELEY1, 2, L.F. ABBOTT3, MICHAEL C.A. BOOTH1,FRANK SENGPIEL2, TOBE FREEMAN2, EDWARD A. WAKEMAN1,AND EDMUND T. ROLLS1
1Department of Experimental Psychology, University of Oxford, Oxford OX1 3UD, UK2University Laboratory of Physiology, University of Oxford, Oxford OX1 3PT, UK3Volen Center and Department of Biology, Brandeis University,Waltham, MA 02254, USA
SUMMARY
The primary visual cortex (V1) is the ¢rst cortical area to receive visual input, and inferior temporal (IT)areas are among the last along the ventral visual pathway. We recorded, in areaV1 of anaesthetized catsand area ITof awake macaque monkeys, responses of neurons to videos of natural scenes. Responses wereanalysed to test various hypotheses concerning the nature of neural coding in these two regions. A varietyof spike-train statistics were measured including spike-count distributions, interspike interval distributions,coe¤cients of variation, power spectra, Fano factors and di¡erent sparseness measures. All statisticsshowed non-Poisson characteristics and several revealed self-similarity of the spike trains. Spike-countdistributions were approximately exponential in both visual areas for eight di¡erent videos and forcounting windows ranging from 50ms to 5 seconds. The results suggest that the neurons maximize theirinformation carrying capacity while maintaining a ¢xed long-term-average ¢ring rate, or equivalently,minimize their average ¢ring rate for a ¢xed information carrying capacity.
1. INTRODUCTION
It has been suggested that visual representations areoptimized to transmit the maximum informationabout the images encountered in everyday life (Uttley1973; Linsker 1987; Barlow 1989). This simple assump-tion has proven su¤cient to account for thecharacteristics of large monopolar cells in the £y(Srinivasan et al. 1982; Van Hateren 1992; Laughlin1981), the temporal characteristics of retinal ganglioncells (Dong & Atick 1995), human spatial frequencythresholds (Atick & Redlich 1992; Van Hateren 1993),and the psychophysics of orientation perception forshort presentation times (Baddeley & Hancock 1991).Maximization of information is a powerful theore-
tical principle that leads to testable predictions aboutthe ¢ring patterns of neurons. However, to generatespeci¢c predictions we must make some assumptionsabout the nature of the neural code and the type ofconstraint that limits its information carrying capacity.To apply information maximization to neuronal spiketrains, we must identify which of their characteristicscarry information. In our analysis, we will considertwo possibilities: that ¢ring rates, or more precisely,spike counts over discrete intervals of time, are theinformation carrying elements; or that interspike inter-vals play this role. Without any constraints on the rateor precision of neuronal spiking, the information
carrying capacity of a spike train is in¢nite. Thus,constraints play a crucial role in any information maxi-mization procedure.We will consider three possibilities,constraints on the maximum ¢ring rate, the average¢ring rate, or a quantity known as the sparseness ofthe ¢ring-rate distribution. Identifying the nature ofthe constraint that limits information carrying capacityhas important implications for the biophysical mechan-isms that underlie neural coding.Assuming the ¢ring rates carry information,
Laughlin (1981) proposed a constraint on themaximum ¢ring rate for neurons in the insect eye, andnoted that the optimal ¢ring-rate distribution in thiscase is £at (¢gure 1a). A di¡erent proposal, that thedistribution of ¢ring rates should be sparse (Field1994; Olshausen & Field 1996), has led to predictionsfor the receptive ¢eld properties of neurons in V1similar to those seen in the data (Olshausen & Field1996). An example of a sparse distribution is shown in¢gure 1b. Here, the number of active' neurons, neuronswith signi¢cantly elevated ¢ring rates, is small. A thirdproposed constraint is that the average ¢ring rate of theneuron is held ¢xed while the information carryingcapacity is maximized (Levy & Baxter 1996; Baddeley1996). If information is carried by ¢ring rates, thispredicts that the distribution of ¢ring rates should beexponential as in ¢gure 1c (Shannon & Weaver 1949;Levy & Baxter 1996; Rieke et al 1997). If, instead,
Proc. R. Soc. Lond. B (1997) 264, 1775^1783 1775 & 1997 The Royal SocietyPrinted in Great Britain

information is encoded by interspike intervals, thisconstraint predicts an exponential distribution of inter-spike intervals, that is, a Poisson distribution (DeWeese1996; Rieke et al 1997). Simulation results suggest thatmaximizing information transmission for a ¢xedaverage ¢ring rate also leads to receptive ¢elds qualita-tively similar to those found in V1 (Harpur & Prager1996).To investigate the nature of the constraints relevant
for neural coding, we measured ¢ring-rate distributionsand other spike-train statistics of neurons in two visualareas. We chose visual areas at opposite ends of thecortical visual processing stream, V1 and IT, tocompare coding strategies. Since the distribution of theimages used to generate the spike trains a¡ects thestatistical properties we study, we used videos thatresemble, as nearly as possible, the normal visual envir-onments of the animals from which the neurons werebeing recorded.
2 . METHODS AND STIMULI
To stimulate the natural visual environment of a cat asclosely as possible, we recorded three videos by `walking' avideo camera 30 cm above the ground in locations wherecats are commonly found. The mixed video contained bothnatural and man-made features (length of video, 10 minutes;number of cells, 22). The natural video consisted almostentirely of natural vegetation (10min, 6 cells), and the indoorvideo was shot in the laboratory and contained only man-made features (5min, 4 cells). For comparison, a subset ofthe neurons was also tested with high contrast white-noisestimuli generated by removing the video input form thevideo player (10min, 16 cells). The stimuli were recordedusing a high quality video camera, using VHS format anddisplayed on a black and white monitor (14 inch for the V1cells, 20 inch for the ITcells).
While recording from two macaques, we presented threedi¡erent videos: a laboratory video (5min, 26 cells), a colonyvideo taken of a wild monkey colony (5min, 4 cells), and anarti¢cial video of a popular Australian soap opera (5min, 2cells). Again for comparison we recorded cells while themonkeys were watching a blankscreen (5min, 19 cells).
Details of the recording and anaesthesia (for the cats) canbe found elsewhere for cat V1 (Sengpiel et al. 1994), and formacaque IT (Rolls & Tovee 1995). After characterizing theneurons using standard techniques (optimal orientation,
spatial frequency, and direction tuning forV1; face and objectselectivity for IT), the monitor was positioned 57 cm awayfrom the cats and 1m away from the monkeys, and spikeswere recorded while a given video sequence representative ofnatural scenes was played. Data were collected from threecats, and two macaques. The cats were anaesthetized and themacaques were awake and free viewing. Only visually respon-sive cells were used.
(a) Calculating spike-count distributions
We computed spike-count distributions by sliding awindow of size T along the recorded spike trains, in steps ofT=6 (to minimize the e¡ects of window boundaries), andcounting how many spikes occurred within the temporalwindow for each window position. The normalized spike-count frequency distribution provides an estimate of the prob-ability distribution of spike counts for a given window size.This is equivalent to a ¢ring-rate distribution up to a factorof T. To facilitate comparison of cells with di¡erent average¢ring rates and to assure that all cells were analysed with thesame resolution, many of the results shown used a window sizeadjusted so that the average number of spikes per window was¢xed.To do this we used a window size of N=f , where N is thedesired average number of spikes per window, and f is theaverage ¢ring rate of the cell.
3. ANALYSIS AND RESULTS(a) Firing rates
We ¢rst measured the average ¢ring rates of the cells.ForV1 of the anaesthetized cats, the ¢ring rates for thevideo-stimulated neurons were low (mean�3.96Hz,s.d.�3.61Hz). This was lower than has been previouslyreported (Legendy & Salcman 1985) for theunanaesthetized cat (mean�8.9Hz, s.d.�7.0Hz), butwas signi¢cantly higher than when the cells were stimu-lated with high contrast white noise (mean�2.45Hz,s.d.�2.18Hz). It is proposed that the low average rateswere partly due to the e¡ect of the anaesthetic (whichcould be tested by systematically varying its level). Forthe macaque ITcells, generally in the upper bank of thesuperior temporal sulcus at sites similar to those in(Rolls & Tovee 1995), the average rate was higher forboth video stimulation (mean�18Hz, s.d.�10.3Hz),and blank screen viewing (mean�14Hz, s.d.�8.3Hz.
1776 R. Baddeley and others Responses of neurons in primary and ITV1to natural scenes
Proc. R. Soc. Lond. B (1997)
0 5 100 5 1010 –3
10 –2
10 –1
0 5 10firing rate
prob
abili
ty
firing rate firing rate
(a) (b) (c)
Figure 1. Three proposals for optimal ¢ring-rate distributions. All distributions are plotted on log-linear axes so that anexponential distribution appears as a straight line. (a) If the maximum ¢ring rate is constrained, the information carryingcapacity of ¢ring rates is maximum for a £at distribution. (b) An example of a sparse distribution. (c) If the constraint is onthe average ¢ring rate, the optimal distribution is exponential.

These rates are low compared to the ¢ring ratesobserved when these cells are stimulated with optimalstimuli. For instance, when theV1 neurons were stimu-lated with optimally oriented high contrast sinusoidalgratings the ¢ring rates were on average 37.0Hz(s.d.�33.9Hz). The low ¢ring rates observed are prob-ably attributable to the fact that natural videosequences rarely contain visual structures that areoptimal for activating the cells, and also due to theinhibitory e¡ects that arise when cells respond tocomplex natural scenes (Gallant 1996).
(b) Spike-count distributions
Examples of the spike-count distributions computedwith a window size of T � 250ms, are shown in ¢gure2. Like the neurons shown, the majority of neuronsmeasured had spike-count distributions that wereapproximately exponential. The graphs in ¢gure 2 uselog-linear axes so an exponential appears as a straightline.An exponential distribution was found for the
majority of cells when rate was computed using a250ms time window. To test the generality of thisresult, we calculated spike-count distributions whilevarying the window size over one order of magnitude.Figure 3 shows the spike-count distributions, averagedover all neurons, for window sizes chosen for each cellso that there were an average of one, two, or ten spikesper window. Choosing the window size correspondingto a ¢xed average number of spikes rather than a ¢xedtime, allowed us to average results from cells withdi¡erent ¢ring rates. Except for the low spike-countregions of the distributions corresponding to ten spikes
per window, all the distributions are well approximatedby an exponential. The fact that the same distributionapplies for a wide range of window sizes, except for achange of scale, indicates `self-similarity' (Teich 1989;Teich et al 1997). This is not a property of most distribu-tions, for instance the shape of the Poisson spike-countdistribution is highly dependent on the time scale.Next, we investigated whether the distribution
depended on which video sequence was used to elicitthe responses. Figure 4 shows that the form of thedistribution was essentially independent of the parti-cular video used to stimulate the neuron. Indeed,exponential distributions even appeared for the whitenoise and blank screen viewing conditions, eventhough they resulted in lower average ¢ring rates. Thesimilarity of the distributions for video and non-videoviewing conditions might suggest that the neuronswere not responding to speci¢c features of the videos.However, a study of the neural responses in relation tothe video images showed that this was not the case. Forexample, IT neurons known to respond to face images,¢red vigorously when a face appeared in the video.
(c) Interspike intervals
In addition to spike-count distributions, a number ofother statistics provide information about the nature ofneural coding. The ¢rst is the distribution of interspikeintervals (ISIs) which can be used to identify a Poissondistribution, for example. We computed the ISI distri-bution (shown in ¢gure 5a,b after normalizing to themean interspike interval for each cell and averagingacross cells). The ISI distributions do not appear to bePoisson and are described better by a power-law
Responses of neurons in primary and ITV1to natural scenes R. Baddeley and others 1777
Proc. R. Soc. Lond. B (1997)
0 1010
-3
10-2
10-1
5
0 5 1010
-3
10-2
10-1
0 10 20 30
0 5 100 5 10
0 5 10
prob
abili
typr
obab
ility
spikes in 250 ms spikes in 250 ms spikes in 250 ms
(a)
(d) (e)
(b) (c)
( f )
Figure 2. A representative collection of ¢ring-rate distributions. The spike-count probability distributions for six di¡erentcells computed using a sliding window of 250ms. (a), (b) and (c) show three cat V1 cells, and (d), (e) and (f ) three macaqueIT cells. The thick lines correspond to di¡erent replays of the same natural video sequence. The thin lines are for responses toeither high contrast white noise (V1) or a blank screen (IT). The vertical axis is logarithmic. Other than the noise conditionfor (d ) and (f ), the results are well approximated by exponential distributions.

relation.This is indicated in ¢gure 5a,b by the approxi-mately straight lines appearing on a log^log plot.The coe¤cient of variation, CV, measures the
normalized variability of interspike intervals, and hasbeen the subject of much theoretical interest (see, forinstance, Softky & Koch 1993; Holt et al. 1996). Thismeasure can be used to identify a stationary Poissonprocess for which CV � 1. CV for N interspike inter-vals of duration Tj is given by
CV � �
hTi , (1)
where
hTi � 1N
XNj�1
Tj, (2)
and
� ���������������������������������������������1
N ÿ 1
XNj�1
(Tj ÿ hTi)2vuut : (3)
Using this measure, neither the V1 nor the IT spiketrains are well characterized by a Poisson process. Thecoe¤cients of variation were, on average, 1.91 for V1cells (s.d.�0.42, p(CV41) < 0:005)) in the videocondition. For IT neurons the mean CV was 1.84(s.d.�0.49, p(CV41) < 0:005)).CV is most useful if the spike train is stationary, but
this is not the case for most in vivo recordings. A localversion of CV , CVn, has been proposed in this case, to
determine whether groups of n spikes can be describedas arising from a Poisson process (Holt et al. 1996). Tocompute CVn, we de¢ne the mean ISI between inter-spike interval i and interspike interval i� n as
hTini �1n
Xi�nÿ1j�i
Tj, (4)
and the local standard deviation as:
�ni �����������������������������������������������1
nÿ 1
Xi�nÿ1j�i
(Tj ÿ hTini )2vuut : (5)
The local coe¤cient of variation is then
CVn � Kn
XNÿn�1i�1
�nihTini
, (6)
where Kn is a value chosen so that CVn is equal to onefor a Poisson process. The computed values of CVn as afunction of n are shown in ¢gure 5c. The values arealways greater than one. CVn values for the IT spiketrains with small n are closer to the Poisson value,which may re£ect the persistence time of the imagesIT is sensitive to (faces, objects). Images that make V1neurons respond vigorously (oriented lines at particularlocations) are likely to have shorter persistence times inthe videos.The relationship between CVn and n appearsapproximately power law implying that it does notde¢ne any particular spike or time-scale.An additional non-Poisson feature we found was
positive correlation between successive interspike
1778 R. Baddeley and others Responses of neurons in primary and ITV1to natural scenes
Proc. R. Soc. Lond. B (1997)
0 10 2010
-4
10-3
10-2
10-1
0 10 2010
-4
10-3
10-2
10-1
0 5 10 1510
-4
10-3
10-2
10-1
0 5 1010
-4
10-3
10-2
10-1
0 20 40 6010-5
10-3
10-1
0 20 40 6010
-5
10-3
10-1
spike count
prob
abili
typr
obab
ility
spike count spike count
(a) (b) (c)
(d) (e) ( f )
Figure 3. The average spike-count distributions for the V1 (a, b, c) and IT (d, e, f ) neurons is relatively insensitive to thewindow size used to calculate the rate. To display the average distributions for all the video-stimulated cells (each with adi¡erent average ¢ring rate), we used a window size adjusted so that the average number of spikes per window was the samefor all the cells, either one (a, d ) two (b, e) ten (c, f ) spikes per window. Error bars are standard errors. Spike-count distribu-tions for six di¡erent video conditions and two noise conditions. In each case the window size was chosen so that the averagenumber of spikes per window was one. Near exponential spike count distributions were found for all three video conditions:mixed (a), natural (b), indoor (c), laboratory (e), colony (f ) and arti¢cial (g). More surprisingly, the white noise (d), and blankscreen (h) conditions also produced approximately exponential distributions. Error bars correspond to standard errors.

intervals. Pearson's product moment correlations, r,between adjacent interspike intervals took averagevalues for the V1 cells under video conditions of 0.11(s.d.�0.1, p(r40) < 0:005), and, under noise condi-tions, 0.08 (s.d.�0.12, p(r40) < 0:025). For IT thecorrelation for the video conditions was 0.194(s.d.�0.050, p(r40) < 0:001).
(d) Power spectra
ISI distributions only characterize pairwise relationsin ¢ring patterns. A more powerful measure is theFourier power spectrum of the spike train. Powerspectra were computed using a sampling frequency of100Hz (with a resulting Nyquist frequency of 50Hz),based on overlapping samples of 2.56 s, afterwindowing with a Bartlett window (Press et al. 1992).The results for three V1 cells and three ITcells, shownin ¢gure 6, are reasonably typical of the entire collec-tion of neurons. For a Poisson process, the powerspectrum is £at, but this was found for only four of the99 cells. The vast majority of cells (92/99) had thegreatest power at low frequencies (0^5Hz), with thepower decreasing monotonically for higher frequencies.
For three cells the peak power was not at the lowfrequency end. For 52 out of the 99 cells, the plot ofpower for frequencies between 1 and 10Hz was straighton log^log scales, another indication of self-similarity.This low frequency bias contrasts with lateralgeniculate-nucleus cells stimulated with natural scenes(Dan et al. 1996), and may re£ect a di¡erence in thecorrelation times of the objects coded for (e¤cientlycoded intensity versus the presence of faces and linesegments).
(e) Fano factor analysis
Fano factors (Teich et al 1997) provide a convenientstatistic for describing spike count variability over arange of di¡erent time scales. The Fano factor, F(T) isthe ratio of the variance to the mean of the spike-countdistribution computed using a window of size T.For a Poisson process, F(T) � 1 for all T, and if the
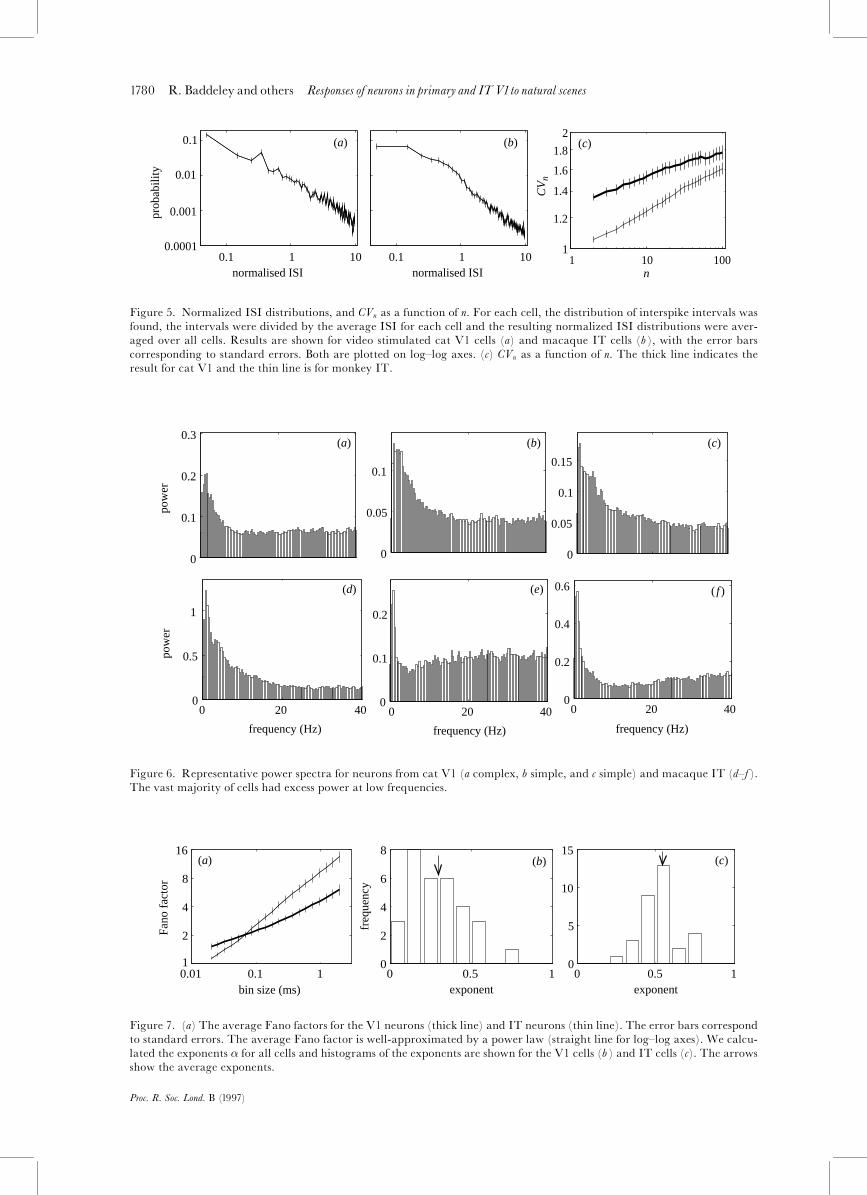
system is fractal, the Fano factor is a power-law func-tion of T , F(T) / T�, where � is the fractal orscaling exponent (Teich et al 1997). Fano factors for ourdata are shown in ¢gure 7a. None of the cells appearedPoisson. Instead, a power law provides a very goodapproximation for the average Fano factors indicatingthe fractal nature of the ¢ring patterns. The exponentsfor the ITcells (¢gure 7c) are consistently higher thanthose for the V1 cells (¢gure 7b), indicating more lowfrequency variation and con¢rming the analysis usingCVn. For V1 cells, the average � was 0.29 (s.d.�0.165),and, for IT neurons, 0.53 (s.d.�0.12).
(f) Sparseness
BothV1 and IT neurons had sparse ¢ring-rate distri-butions as measured using Olshausen & Field'sde¢nition (Olshausen & Field 1996). A possible inter-pretation of the sparseness idea is that successivelysparser representations should be generated at higherlevels of the visual pathway. Indeed, the raw input isless sparse than the representation in LGN, which inturn is less sparse then in V1 (Field 1994). We ¢nd noevidence for increasing sparseness as we move from therepresentations in V1 to IT. As seen in ¢gure 8, thedegree of sparseness is not dramatically di¡erent forthe two cortical areas and which area has the highersparseness depends on the particular measure used.
4 . DISCUSSION(a) The empirical ¢ndings
The main empirical contribution of this study is toextend various statistical analyses of neural spike-traindata performed on arti¢cially stimulated neurons, toneurons stimulated with naturalistic video sequences.Our main results are:
1. The average ¢ring rates of the cells were lowcompared to those typically reported for neuronsresponding to optimal stimuli. Low ¢ring rates havepreviously been reported for naturally stimulated cells
Responses of neurons in primary and ITV1to natural scenes R. Baddeley and others 1779
Proc. R. Soc. Lond. B (1997)
0 5 10 1510-4
10-3
10-2
10-1
10-4
10-3
10-2
10-1
10-4
10-3
10-2
10-1
10-4
10-3
10-2
10-1
0 5 10 15
V1
spike count
ITpr
obab
ility
prob
abili
typr
obab
ility
prob
abili
ty
spike count
(a) (e)
(g)
(h)
( f )(b)
(c)
(d)
Figure 4. Spike-count distributions for six di¡erent videoconditions and two noise conditions. In each case thewindow size was chosen so that the average number ofspikes per window was one. Near exponential spike countdistributions were found for all three video conditions:mixed (a), natural (b), indoor (c), laboratory (e), colony (f ) andarti¢cial (g). More surprisingly, the white noise (d ), andblank screen (h) conditions also produced approximatelyexponential distributions. Error bars correspond to stan-dard errors.
1780 R. Baddeley and others Responses of neurons in primary and ITV1to natural scenes
Proc. R. Soc. Lond. B (1997)
1 10 1001
1.2
1.4
1.6
1.8
2
0.1 1 10normalised ISI
prob
abili
ty
0.1 1 100.0001
0.001
0.01
0.1
normalised ISI n
CV
n
(a) (b) (c)
Figure 5. Normalized ISI distributions, and CVn as a function of n. For each cell, the distribution of interspike intervals wasfound, the intervals were divided by the average ISI for each cell and the resulting normalized ISI distributions were aver-aged over all cells. Results are shown for video stimulated cat V1 cells (a) and macaque IT cells (b ), with the error barscorresponding to standard errors. Both are plotted on log^log axes. (c) CVn as a function of n. The thick line indicates theresult for cat V1 and the thin line is for monkey IT.
0 20 400
0.5
1
0 20 400
0.1
0.2
0
0.05
0.1
0
0.1
0.2
0.3
0 20 400
0.2
0.4
0.6
0
0.05
0.1
0.15
pow
erpo
wer
frequency (Hz) frequency (Hz) frequency (Hz)
(a) (b) (c)
(d) (e) ( f )
Figure 6. Representative power spectra for neurons from cat V1 (a complex, b simple, and c simple) and macaque IT (d^f ).The vast majority of cells had excess power at low frequencies.
0 0.5 10
2
4
6
8
0.01 0.1 11
2
4
8
16
0 0.5 10
5
10
15
exponent
Fano
fac
tor
bin size (ms)
freq
uenc
y
exponent
(a) (b) (c)
Figure 7. (a) The average Fano factors for the V1 neurons (thick line) and IT neurons (thin line). The error bars correspondto standard errors. The average Fano factor is well-approximated by a power law (straight line for log^log axes). We calcu-lated the exponents � for all cells and histograms of the exponents are shown for the V1 cells (b ) and IT cells (c). The arrowsshow the average exponents.

in V1 (Legendy & Salcman 1985) and in other visualareas (Gallant 1996).2. The ¢ring patterns for naturally stimulated cells arefar from Poisson. This is indicated by ISI statistics,power spectra, Fano factors, and spike-count distribu-tions. Non-Poisson characteristics of spontaneous andstimulus-induced ¢ring have been reported by Teich etal. (1997) and Bair et al. (1994).3. The spike trains show evidence of self-similarity asdemonstrated by the Fano factor analysis, by the spike-count distributions, and also by the approximatelypower-law form of the ISI distribution and some of thepower spectra. Self-similarity has been reportedpreviously for arti¢cially stimulated V1 neurons (Teichet al. 1996), but this is the ¢rst report for naturallystimulated neurons.4. The spike-count distributions are approximatelyexponential over a large range of window sizes. Thishas been suggested for theoretical reasons (Levy &Baxter 1996; Baddeley 1996), but has not been reportedpreviously as an experimental ¢nding.
(b) Implication for coding
The statistics of the spike trains that we observe areconsistent with an optimized rate code. The observedspike-count distributions are of nearly maximumentropy if the average ¢ring rate is constrained (see¢gures 9a,b). Over a two and a half order of magnitudevariation in the window size used for spike counting,the entropy is approximately constant and near itsmaximum possible value. An alternative way to
Responses of neurons in primary and ITV1to natural scenes R. Baddeley and others 1781
Proc. R. Soc. Lond. B (1997)
0
5
10
0
5
10
0.2 0.4 0.60
5
10
0.5 0.6 0.7 0.8 0.90
5
10
0.2 0.4 0.6 0.80
5
10
freq
uenc
y
0
5
10
freq
uenc
y
<exp( -x^2 )> <|x|><log(1+ x^2)>
(a) (b) (c)
(d) (e) ( f )
Figure 8. Sparseness distributions for the V1 (a^c) and IT (d^f ) cells using the three measures proposed by Olshausen &Field (1996). (a) and (d ) show hexp(ÿ x)i; (b ) and (e) show hlog(1� x)i, and (c) and (f ) show hjxji where x is the vector ofneuronal ¢ring rates divided by the root mean square ¢ring rate for each cell, and h� � �i denotes the average over the entirespike train. The bin size used to estimate spareseness was 500ms. There is one technical di¤culty in directly using theoriginal de¢nitions since the theoretical neurons of Olshausen & Field (1996) could ¢re with both positive and negativerates. We therefore divided by the root mean squared output rather than the standard deviation in calculating spareseness.
0.01 0.1 11
1.25
1.5
0.7
0.8
0.9
1
0.01 0.1 11
2
3
0.7
0.8
0.9
1
T (s)
entr
opy/
max
imum
actu
al r
ate/
min
rat
e
T (s)
(a) (b)
(c) (d)
Figure 9. The observed ¢ring rates are consistent with ane¤cient rate code if average ¢ring rate is a constraint. Foreach cell, the entropy of the spike-count distribution wascalculated and divided by the maximum possible spike-count entropy for a neuron ¢ring at the same average rate.The value of this quantity averaged over all cells is indi-cated by the thick line for V1 neurons (a) and for ITneurons (b ). For comparison, the thin lines show the samequantities for a Poisson process. (c) and (d ) show ratios ofthe actual average ¢ring rates of the neurons to theminimum possible rates for cells with output distributionsof the same entropy (again the thin line corresponds to aPoisson process). The ¢ring rate is near minimal for thegiven output entropy over two orders of magnitude ofwindow size. Error bars represent standard errors. the`time' indicated on the horizontal axis is the spike countingwindow size.

express this result is that for a given entropy, the codeminimizes the average ¢ring rate. This is seen in ¢gure9c,d and D which compare the actual average ¢ringrate to the minimum rate consistent with the observedspike-count entropy.This interpretation assumes that ¢ring rate is the
appropriate variable to consider when studying codingissues. The output of a neuron presents a potentiallysevere bottleneck to communication. Using each inter-spike interval to carry information, rather than spikecounts over discrete time intervals, might appear to bea more e¤cient coding method. The optimal distribu-tion for such a code is a Poisson distribution and this isnot consistent with our results. Psychophysical experi-ments indicate that visual (Watt 1987), and auditory(Viemeister 1996) resolution for many tasks increasesover a period of up to a second. For a representation-based on interspike intervals, a complicated mechanismfor integrating over successive interspike intervalswould be required to display such behaviour. A ratecode would naturally show an increase of resolutionover time.The proposal that average ¢ring rate is being
constrained while information is being maximized hasmany similarities to the sparsity' proposal (Field 1994;Olshausen & Field 1996). Since one of the de¢nitions ofsparsity equates with average ¢ring rate (hjxji),networks that maximize information transmission for¢xed average ¢ring rate result in V1-like receptive¢elds when trained to represent collections of naturalimages (Harpur & Prager 1996; Olshausen & Field1996). However, rather than restricting the number ofactive elements, we suggest that the code is designed tomaximize information transmission at a ¢xed averagerate with all rates conveying information, not just themost active neurons.The visual cortex has among the highest oxygen
consumption of any part of the brain and accounts for10% of brain volume in a typical sighted animal(Diamond 1996). In children the brain can account forup to 50% of the resting oxygen consumption (Sokolo¡1989). Therefore a code that minimized the average¢ring rate, and hence metabolic activity, could make asigni¢cant di¡erence to the energy consumption of ananimal. Assuming that the code in these visual areas isa rate code, the measurements presented here show thatinformation carrying capacity is near its maximumvalue for a given average ¢ring rate over a large rangeof time scales, and at two opposite poles of the corticalvisual pathway.
Research supported by National Science Foundation grantDMS-9503261, the W. M. Keck Foundation (LA), the MRCcentre for Cognitive Neuroscience, and theWellcomeTrust.
REFERENCES
Atick, J. J. & Redlich, A. N. 1992 What does the retina knowabout natural scenes. Neural Comp. 4, 196^210.
Baddeley, R. J. 1996 An e¤cient code in V1? Nature 381,560^561.
Baddeley, R. J. & Hancock, P. J. B. 1991 A statistical analysisof natural images matches psychophysically derived orien-tation tuning curves. Proc. R. Soc. Lon. B 246, 219^223.
Bair, W., Koch, C., Newsome, W. & Britten, K. 1994 Powerspectrum analysis of bursting cells in area MT in thebehaving monkey. J. Neurosci. 14, 2870^2892
Barlow, H. B. 1989. Unsupervised Learning. Neural Comp. 1,295^311.
Dan, Y., Atick, J. J. & Reid, R. C. 1996. E¤cient coding ofnatural scenes in the lateral geniculate-nucleusöexperimental test of a computational theory. J. Neurosci.16(10), 3351^3362.
DeWeese, M. 1996. Optimization principles for the neuralcode. Network: Computation in Neural Systems, 2(May), 325^331.
Diamond, J. M. 1996 Competition for brain space. Nature382(6594), 756^757.
Dong, D. W. & Atick, J. J. 1995 Temporal decorrelationöa theory of lagged and nonlagged responses in the lateralgeniculate-nucleus. Network: Computation in Neural Systems6(2), 159^178.
Field, D. J. 1994 What is the goal of sensory coding? NeuralComp. 6, 559^601.
Gallant, J. L. 1996 Cortical responses to natural scenes undercontrolled and free viewing conditions. Invest. Opthalmol.Vis.Sci., 37(3), 674.
Harpur, G. & Prager, W. 1996 Development of low entropycoding in a recurrent network. Network: Computation inNeural Systems, 7(2), 277^284.
Holt, G. R., Softky, W. R., Koch, C. & Douglas, R. J. 1996Comparison of discharge variability in vitro and in vivo incat visual neurons. J. Neurophysiol. 75(5), 1806^1814.
Laughlin, S. 1981 A simple coding procedure enhances infor-mation capacity. Zeitschrift fu« r Naturforschung, Section C-Biosciences, 36, 910^912.
Legendy, C. R. & Salcman, M. 1985 Bursts and recurrencesof bursts in spike trains of spontaneously active striatecortex neurons. J. Neurophysiol. 53(4), 926^939.
Levy,W. & Baxter, R. A. 1996 Energy-e¤cient neural codes.Neural Comp. 8(3), 531^543.
Linsker, R. 1987 Towards an organising principle for a layeredperceptual network. In Neural information processing systems,vol. 1 (Denver, November 1987) (ed. D. Z. Anderson),pp. 485^494 (American Institute of Physics). Denver, Co:Morgan Kaufmann, San Mateo.
Olshausen, B. & Field, D. 1996 Emergence of simple-cellreceptive-¢eld properties by learning a sparse code fornatural images. Nature 381(6583), 607^609.
Press, W. H., Flannery, B. P., Teukolsky, S. A. & Vetterling,W. T. 1992 Numerical Recipes in C, 2nd edn. CambridgeUniversity Press.
Rieke, F., Warlan, D., de Ruyter van Steveninck, R. R. &Bialek, W. 1997. Spike: exploring the neural code. BradfordBooks, Cambridge, MA: MIT Press.
Rolls, E. T. & Tovee, M. J. 1995. Sparseness of the neuronalrepresentation of stimuli in the primate temporal visualcortex. J. Neurophysiol. 73(2), 713^726.
Sengpiel, F., Blakemore, C., Kind, P. C. & Harrad, R. 1994.Interocular suppression in the visual cortex of strabismiccats. J. Neurosci. 14, 6855.
Shannon, C. E. & Weaver, W. 1949 The mathematical theory ofcommunication. Illinois Press.
Softky,W. R. & Koch, C. 1993 The highly irregular ¢ring ofcortical-cells is inconsistent with temporal integrations ofrandom EPSPs. J. Neurosci. 13(1), 334^350.
Sokolo¡, L. 1989 Circulation and energy metabolism of thebrain. In Basic neurochemistry: molecular, cellular, and medicalaspects, 4th edn (ed. B. W. Agrano¡, R. W. Albers & P. B.Molino¡ ), pp. 565^590. NewYork, Raven Press.
Srinivasan, M.V., Laughlin, S. B. & Dubs, A. 1982 Predictivecoding: a fresh view of inhibition in the retina. Proc. R. Soc.Lond. B 216, 427^459.
Teich, M. C. 1989 Fractal character of the auditoryneural spike train. IEEE Trans. Biomed. Engineer. 36(1),150^159.
1782 R. Baddeley and others Responses of neurons in primary and ITV1to natural scenes
Proc. R. Soc. Lond. B (1997)

Teich, M. C., Turcott, R. G. & Siegel, R. M. 1996 Temporalcorrelations in cat striate-cortex neural spike trains. IEEEEng. Med. Biol. Mag. 15(5), 79^87.
Teich, M. C., Heneghan, C., Lowen, S. B., Ozaki, T. &Kaplan, E. 1997 Fractal character of the neural spike trainin the visual system of the cat. J. Opt. Soc. Am. A 14(3),529^546.
Uttley, A. M. 1973 Information transmission in the nervous system.London: Academic Press.
Van Hateren, J. H. 1992 Real and optimal neural images inearly vision. Nature 360, 68^70.
Van Hateren, J. H. 1993 Spatiotemporal contrast sensitivity ofearly vision.Vis. Res. 33(2), 257^267.
Viemeister, N. 1996 Auditory temporal integration: what isbeing accumulated. Curr. Dir. Psychol. Sci. 5(1), 28^32.
Watt, R. J. 1987 Scanning from coarse to ¢ne scales in thehuman vision system after the onset of a stimulus. J. Opt.Soc. Am. A 4, 2006^2021.
Received 29 July 1997; accepted 28 August 1997
As this paper exceeds the maximum length normally consid-ered for publication in Proceedings B, the authors have agreedto make a contribution towards production costs.
Responses of neurons in primary and ITV1to natural scenes R. Baddeley and others 1783
Proc. R. Soc. Lond. B (1997)