Resistance Training To Counteract the Catabolism of a Low-Protein Diet in Patients with Chronic...
12
Resistance Training To Counteract the Catabolism of a Low-Protein Diet in Patients with Chronic Renal Insufficiency A Randomized, Controlled Trial Carmen Castaneda, MD, PhD; Patricia L. Gordon, RN, PhD; Katherine Leigh Uhlin, RD, MS; Andrew S. Levey, MD; Joseph J. Kehayias, PhD; Johanna T. Dwyer, DSc, RD; Roger A. Fielding, PhD; Ronenn Roubenoff, MD, MHS; and Maria Fiatarone Singh, MD Background: Chronic renal insufficiency leads to muscle wast- ing, which may be exacerbated by low-protein diets prescribed to delay disease progression. Resistance training increases protein utilization and muscle mass. Objective: To determine the efficacy of resistance training in improving protein utilization and muscle mass in patients with chronic renal insufficiency treated with a low-protein diet. Design: Randomized, controlled trial. Setting: Tufts University, Boston, Massachusetts. Patients: 26 older patients with moderate renal insufficiency (17 men, 9 women) who had achieved stabilization on a low-protein diet. Intervention: During a run-in period of 2 to 8 weeks, patients were instructed and their adherence to the low-protein diet (0.6 g/kg of body weight per day) was evaluated. They were randomly assigned to a low-protein diet plus resistance training (n 5 14) or a low-protein diet alone (n 5 12) for 12 weeks. Measurements: Total body potassium, mid-thigh muscle area, type I and II muscle-fiber cross-sectional area, and protein turn- over. Results: Mean protein intake was 0.64 ± 0.07 g/kg per day after stabilization. Total body potassium and type I and II muscle-fiber cross-sectional areas increased in patients who performed resis- tance training by a mean (±SD) of 4% ± 8%, 24% ± 31%, and 22% ± 29%, respectively, compared with those who did not. Leucine oxidation and serum prealbumin levels also improved significantly. Patients assigned to resistance training maintained body weight compared with those who were not. Improvement in muscle strength was significantly greater with resistance training (32% ± 14%) than without (213% ± 20%) (P < 0.001). Conclusion: By improving muscle mass, nutritional status, and function, resistance training seems to be effective against the catabolism of a low-protein diet and uremia in patients with renal failure. Ann Intern Med. 2001;135:965-976. www.annals.org For author affiliations, current addresses, and contributions, see end of text. See editorial comment on pp 999-1001. C hronic renal insufficiency, regardless of cause, gen- erally progresses to end-stage renal disease (1). Mal- nutrition and muscle wasting in chronic uremia often parallel the progression of renal failure (2). They also contribute to excess morbidity and mortality in patients with renal disease (3). Protein-restricted diets delay the progression of renal disease (4, 5) and alleviate uremic symptoms (6). Although nutritional status, as assessed by biochemical and anthropometric indicators, may be maintained during protein restriction (6, 7), studies have shown that deterioration of nutritional status is associated with low energy and protein intake in patients with chronic renal insufficiency (8). Resistance training increases nitrogen retention (9), protein synthesis (10), and expression of insulin-like growth factor I in skeletal muscle (11); ameliorates losses of muscle mass and function; and enhances quality of life (12) in both healthy and unwell persons. The ana- bolic potential of resistance training counteracts the ca- tabolism of HIV infection (13) and myopathy secondary to corticosteroid use in cardiac transplantation (14), the loss of lean tissue during energy restriction for obesity (15), and the interleukin-mediated myopathy of chronic heart failure (16). However, its utility as an adjunctive treatment offsetting the catabolism of a low-protein diet in uremic patients is not known (17). We conducted a randomized, controlled trial to determine whether resis- tance training would preserve lean body mass, nutri- tional status, and muscle function through alterations in protein turnover (synthesis and oxidation) in patients with moderate chronic renal insufficiency who were consuming a low-protein diet to slow the progression of renal failure. METHODS Study Design Patients older than 50 years of age with chronic renal insufficiency were randomly assigned to a low- Article © 2001 American College of Physicians–American Society of Internal Medicine 965
-
Upload
independent -
Category
Documents
-
view
0 -
download
0
Transcript of Resistance Training To Counteract the Catabolism of a Low-Protein Diet in Patients with Chronic...
Resistance Training To Counteract the Catabolism of a Low-ProteinDiet in Patients with Chronic Renal InsufficiencyA Randomized, Controlled TrialCarmen Castaneda, MD, PhD; Patricia L. Gordon, RN, PhD; Katherine Leigh Uhlin, RD, MS; Andrew S. Levey, MD; Joseph J. Kehayias, PhD;Johanna T. Dwyer, DSc, RD; Roger A. Fielding, PhD; Ronenn Roubenoff, MD, MHS; and Maria Fiatarone Singh, MD
Background: Chronic renal insufficiency leads to muscle wast-ing, which may be exacerbated by low-protein diets prescribed todelay disease progression. Resistance training increases proteinutilization and muscle mass.
Objective: To determine the efficacy of resistance training inimproving protein utilization and muscle mass in patients withchronic renal insufficiency treated with a low-protein diet.
Design: Randomized, controlled trial.
Setting: Tufts University, Boston, Massachusetts.
Patients: 26 older patients with moderate renal insufficiency (17men, 9 women) who had achieved stabilization on a low-proteindiet.
Intervention: During a run-in period of 2 to 8 weeks, patientswere instructed and their adherence to the low-protein diet (0.6g/kg of body weight per day) was evaluated. They were randomlyassigned to a low-protein diet plus resistance training (n 5 14) ora low-protein diet alone (n 5 12) for 12 weeks.
Measurements: Total body potassium, mid-thigh muscle area,
type I and II muscle-fiber cross-sectional area, and protein turn-over.
Results: Mean protein intake was 0.64 ± 0.07 g/kg per day afterstabilization. Total body potassium and type I and II muscle-fibercross-sectional areas increased in patients who performed resis-tance training by a mean (±SD) of 4% ± 8%, 24% ± 31%, and22% ± 29%, respectively, compared with those who did not.Leucine oxidation and serum prealbumin levels also improvedsignificantly. Patients assigned to resistance training maintainedbody weight compared with those who were not. Improvement inmuscle strength was significantly greater with resistance training(32% ± 14%) than without (213% ± 20%) (P < 0.001).
Conclusion: By improving muscle mass, nutritional status, andfunction, resistance training seems to be effective against thecatabolism of a low-protein diet and uremia in patients with renalfailure.
Ann Intern Med. 2001;135:965-976. www.annals.orgFor author affiliations, current addresses, and contributions, see end of text.
See editorial comment on pp 999-1001.
Chronic renal insufficiency, regardless of cause, gen-erally progresses to end-stage renal disease (1). Mal-
nutrition and muscle wasting in chronic uremia oftenparallel the progression of renal failure (2). They alsocontribute to excess morbidity and mortality in patientswith renal disease (3). Protein-restricted diets delay theprogression of renal disease (4, 5) and alleviate uremicsymptoms (6). Although nutritional status, as assessedby biochemical and anthropometric indicators, may bemaintained during protein restriction (6, 7), studieshave shown that deterioration of nutritional status isassociated with low energy and protein intake in patientswith chronic renal insufficiency (8).
Resistance training increases nitrogen retention (9),protein synthesis (10), and expression of insulin-likegrowth factor I in skeletal muscle (11); ameliorates lossesof muscle mass and function; and enhances quality oflife (12) in both healthy and unwell persons. The ana-bolic potential of resistance training counteracts the ca-
tabolism of HIV infection (13) and myopathy secondaryto corticosteroid use in cardiac transplantation (14), theloss of lean tissue during energy restriction for obesity(15), and the interleukin-mediated myopathy of chronicheart failure (16). However, its utility as an adjunctivetreatment offsetting the catabolism of a low-protein dietin uremic patients is not known (17). We conducted arandomized, controlled trial to determine whether resis-tance training would preserve lean body mass, nutri-tional status, and muscle function through alterations inprotein turnover (synthesis and oxidation) in patients withmoderate chronic renal insufficiency who were consuminga low-protein diet to slow the progression of renal failure.
METHODS
Study DesignPatients older than 50 years of age with chronic
renal insufficiency were randomly assigned to a low-
Article
© 2001 American College of Physicians–American Society of Internal Medicine 965
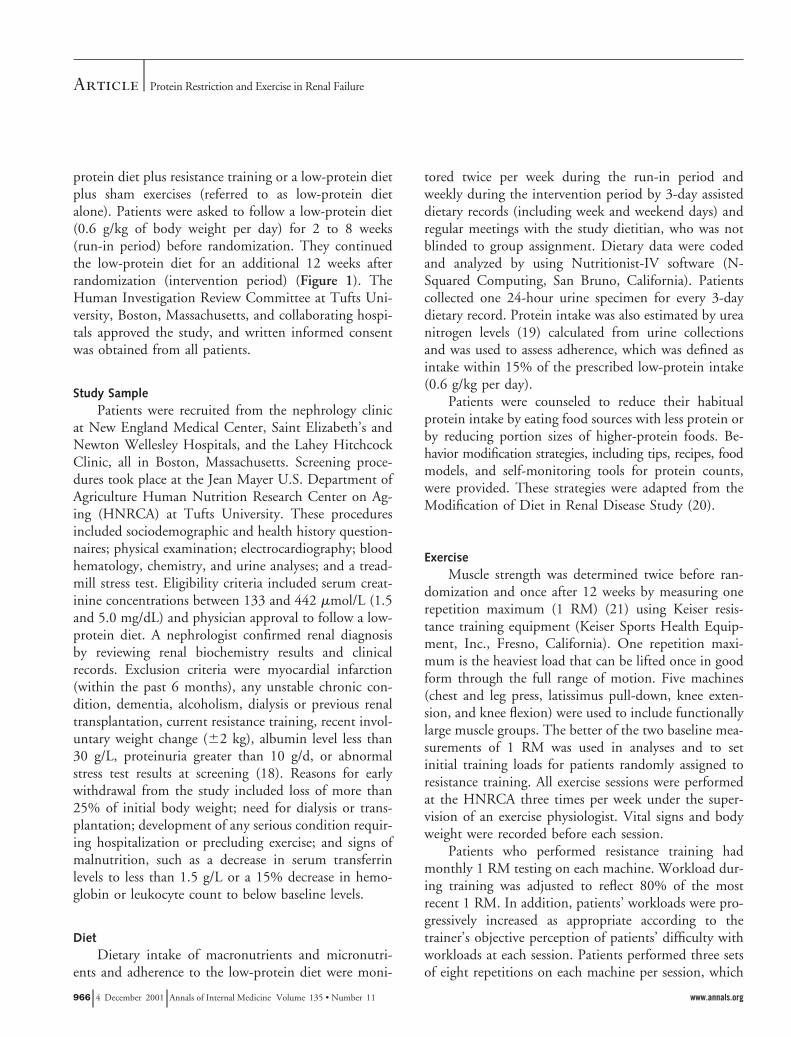
protein diet plus resistance training or a low-protein dietplus sham exercises (referred to as low-protein dietalone). Patients were asked to follow a low-protein diet(0.6 g/kg of body weight per day) for 2 to 8 weeks(run-in period) before randomization. They continuedthe low-protein diet for an additional 12 weeks afterrandomization (intervention period) (Figure 1). TheHuman Investigation Review Committee at Tufts Uni-versity, Boston, Massachusetts, and collaborating hospi-tals approved the study, and written informed consentwas obtained from all patients.
Study SamplePatients were recruited from the nephrology clinic
at New England Medical Center, Saint Elizabeth’s andNewton Wellesley Hospitals, and the Lahey HitchcockClinic, all in Boston, Massachusetts. Screening proce-dures took place at the Jean Mayer U.S. Department ofAgriculture Human Nutrition Research Center on Ag-ing (HNRCA) at Tufts University. These proceduresincluded sociodemographic and health history question-naires; physical examination; electrocardiography; bloodhematology, chemistry, and urine analyses; and a tread-mill stress test. Eligibility criteria included serum creat-inine concentrations between 133 and 442 mmol/L (1.5and 5.0 mg/dL) and physician approval to follow a low-protein diet. A nephrologist confirmed renal diagnosisby reviewing renal biochemistry results and clinicalrecords. Exclusion criteria were myocardial infarction(within the past 6 months), any unstable chronic con-dition, dementia, alcoholism, dialysis or previous renaltransplantation, current resistance training, recent invol-untary weight change (62 kg), albumin level less than30 g/L, proteinuria greater than 10 g/d, or abnormalstress test results at screening (18). Reasons for earlywithdrawal from the study included loss of more than25% of initial body weight; need for dialysis or trans-plantation; development of any serious condition requir-ing hospitalization or precluding exercise; and signs ofmalnutrition, such as a decrease in serum transferrinlevels to less than 1.5 g/L or a 15% decrease in hemo-globin or leukocyte count to below baseline levels.
DietDietary intake of macronutrients and micronutri-
ents and adherence to the low-protein diet were moni-
tored twice per week during the run-in period andweekly during the intervention period by 3-day assisteddietary records (including week and weekend days) andregular meetings with the study dietitian, who was notblinded to group assignment. Dietary data were codedand analyzed by using Nutritionist-IV software (N-Squared Computing, San Bruno, California). Patientscollected one 24-hour urine specimen for every 3-daydietary record. Protein intake was also estimated by ureanitrogen levels (19) calculated from urine collectionsand was used to assess adherence, which was defined asintake within 15% of the prescribed low-protein intake(0.6 g/kg per day).
Patients were counseled to reduce their habitualprotein intake by eating food sources with less protein orby reducing portion sizes of higher-protein foods. Be-havior modification strategies, including tips, recipes, foodmodels, and self-monitoring tools for protein counts,were provided. These strategies were adapted from theModification of Diet in Renal Disease Study (20).
ExerciseMuscle strength was determined twice before ran-
domization and once after 12 weeks by measuring onerepetition maximum (1 RM) (21) using Keiser resis-tance training equipment (Keiser Sports Health Equip-ment, Inc., Fresno, California). One repetition maxi-mum is the heaviest load that can be lifted once in goodform through the full range of motion. Five machines(chest and leg press, latissimus pull-down, knee exten-sion, and knee flexion) were used to include functionallylarge muscle groups. The better of the two baseline mea-surements of 1 RM was used in analyses and to setinitial training loads for patients randomly assigned toresistance training. All exercise sessions were performedat the HNRCA three times per week under the super-vision of an exercise physiologist. Vital signs and bodyweight were recorded before each session.
Patients who performed resistance training hadmonthly 1 RM testing on each machine. Workload dur-ing training was adjusted to reflect 80% of the mostrecent 1 RM. In addition, patients’ workloads were pro-gressively increased as appropriate according to thetrainer’s objective perception of patients’ difficulty withworkloads at each session. Patients performed three setsof eight repetitions on each machine per session, which
Article Protein Restriction and Exercise in Renal Failure
966 4 December 2001 Annals of Internal Medicine Volume 135 • Number 11 www.annals.org
Figure 1. Flow of patients through the study.
* The post office returned letters because addresses were incorrect or persons had relocated. † No patients withdrew, experienced ineffective interven-tions, or were lost to follow-up. One patient in each group had incomplete postintervention measures because of health-related reasons. HNRCA 5 JeanMayer U.S. Department of Agriculture Human Nutrition Research Center on Aging.
ArticleProtein Restriction and Exercise in Renal Failure
www.annals.org 4 December 2001 Annals of Internal Medicine Volume 135 • Number 11 967
lasted about 45 minutes (21). Patients assigned to thelow-protein diet alone performed five to eight sham ex-ercises (gentle movements while standing, sitting, andbending) for the upper and lower body. These weredesigned not to have a physiologic impact but to pro-vide trainer contact time similar to that of the resistancetraining group.
Study MeasuresAll measures were taken before (week 0) and 12
weeks after randomization. Observers were blinded tostudy group assignment at all times, except during as-sessments of postintervention muscle strength.
Main Outcome MeasuresTotal body potassium is the best single measure of
body cell mass closely linked to functional status (22),prognosis, and survival (23). Body cell mass (muscle andviscera) comprises the metabolically active tissues whereprotein is targeted (24). Potassium-40 represents ap-proximately 0.0118% of total body potassium. Loss oftotal body potassium occurs in patients following low-protein diets (25) and in patients with renal disease (26),as well as in patients with many other wasting syn-dromes. Total body potassium was determined in thebody composition laboratory at HNRCA, with a coeffi-cient of variation of 5% (24).
Regional body composition of the area involvingthe mid-thigh muscle was determined by computerizedtomography of the nondominant thigh. A Siemens DR3CT Scanner (Somatom-Siemens, Erlangen, Germany)was used to obtain an 8-mm scan at the midpointbetween the inguinal crease and the proximal pole ofthe patella. Images were digitized and analyzed to thenearest 0.01 cm2, as described elsewhere (coefficient ofvariation, 0.5% to 1.5%) (21).
Type I and type II muscle-fiber cross-sectional areaswere determined from vastus lateralis muscle biopsies ofthe nondominant thigh, performed with a 5-mm Berg-strom needle (27). Sections were stained with adenosinetriphosphatase (pH, 4.3) to visualize type I and type IIfibers. A slide preparation was made for each biopsyspecimen, and 50 to 150 fibers per patient were ana-lyzed by light microscopy (coefficient of variation, 3%)(11, 27).
AnthropometryBody weights were measured to the nearest 0.1 kg
on a Toledo Weight-Plate (Bay State Scale & Systems,Inc., Burlington, Massachusetts). Height was measuredonce to the nearest 0.25 cm, without shoes, by using awall-mounted stadiometer. Body mass index was deter-mined from body weight and height as kg/m2.
Biochemical MeasuresAll measurements were collected in the fasting state
in a blinded fashion at the nutrition evaluation labora-tory at HNRCA (coefficient of variation, 5% to 10%).Urea nitrogen and creatinine concentrations in serumand urine and levels of plasma insulin-like growth factorI were determined, as described elsewhere (25, 27). Inaddition, blood cell count; hematocrit; and levels of se-rum albumin, transferrin, and prealbumin were mea-sured monthly to evaluate nutritional status.
Glomerular Filtration RateGlomerular filtration rate was measured as the renal
clearance of 125I-iothalamate (Glofil, Cypros Pharma-ceutical Corp., Carlsbad, California), with a coefficientof variation of 6.3% (28).
Resting Energy ExpenditureOxygen consumption and carbon dioxide produc-
tion rates were determined by indirect calorimetry in aventilated hood system (Deltatrac Systems, Sensormed-ics Corp., Yorba Linda, California) and were in turnused to determine resting energy expenditure based onthe Weir equation (29).
Peak Oxygen ConsumptionUnder physician supervision, peak oxygen con-
sumption was measured on a motorized treadmill(Desmo CE-25, Woodway USA, Waukesha, Wisconsin)by using a graded exercise tolerance test with on-lineanalysis of expired gas (Vmax Series 229, SensormedicsCorp.) (30). The first 2 minutes of the test were per-formed at 0% grade, and the grade was then increasedby 2% every minute until the patient asked to stop orthe physician terminated the test for medical reasons (18).
Article Protein Restriction and Exercise in Renal Failure
968 4 December 2001 Annals of Internal Medicine Volume 135 • Number 11 www.annals.org
Whole-Body Leucine KineticsProtein turnover was assessed by using a primed-
constant infusion of L-[1-13C]-leucine. Leucine is anessential amino acid that is metabolized solely in skeletalmuscle. Once metabolized, it permits determination ofprotein turnover by isotopic enrichment of 13C-a-ketoisocaproic acid (KIC), resulting from leucine trans-amination. We conducted a 4-hour intravenous con-stant infusion of leucine following priming doses ofNaH13CO2 and L-[1-13C]-leucine, using a calibratedpump (Harvard Apparatus, Natick, Massachusetts) (31).Arterialized venous blood and breath samples were takenat 0, 120, 180, 190, 200, 210, 220, 230, and 240 min-utes to determine the enrichment of KIC and 13CO2
(coefficient of variation, 5%), from which leucine syn-thesis and oxidation, respectively, were calculated (31).
Statistical AnalysisData are presented as the mean (6SD), except for
non-normally distributed variables (glomerular filtration
rate, serum albumin level, creatinine and urea nitrogenconcentrations, hematocrit, and insulin-like growth fac-tor I concentrations), for which medians are shown.The non-normally distributed variables were log-trans-formed, checked for normal distribution after log trans-formation, and used as log-transformed variables foranalyses. Baseline comparisons of the randomly assignedgroups were made by using independent sample t-testcomparisons for continuous variables, the chi-square testfor categorical variables, and the Wilcoxon rank test fornon-normally distributed continuous variables. Regres-sion models were performed by using general linearmodels to test the treatment effect on main outcomes(total body potassium, mid-thigh muscle area, and typeI and II muscle-fiber cross-sectional areas) and secondaryoutcomes (biochemical, metabolic, and dietary vari-ables). The change in each outcome was the dependentvariable, and the covariates were group assignment, anyvariable that differed between groups at baseline, andsex. Sex was selected as a covariate a priori because of its
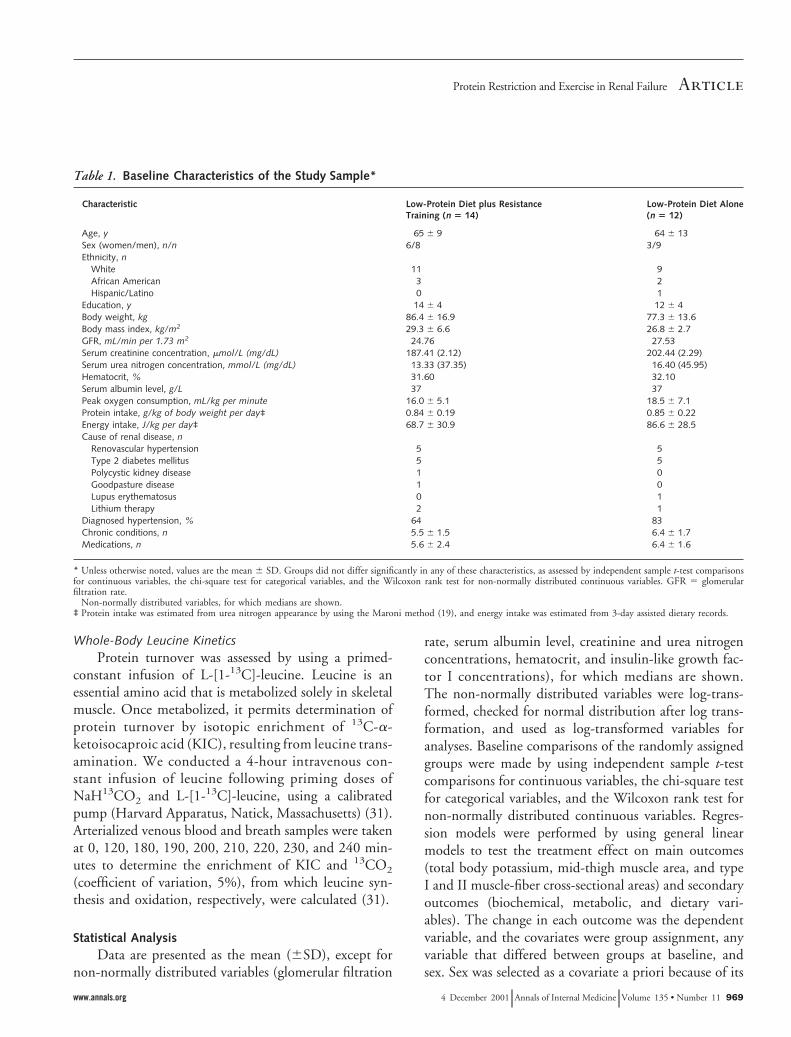
Table 1. Baseline Characteristics of the Study Sample*
Characteristic Low-Protein Diet plus ResistanceTraining (n 5 14)
Low-Protein Diet Alone(n 5 12)
Age, y 65 6 9 64 6 13Sex (women/men), n/n 6/8 3/9Ethnicity, n
White 11 9African American 3 2Hispanic/Latino 0 1
Education, y 14 6 4 12 6 4Body weight, kg 86.4 6 16.9 77.3 6 13.6Body mass index, kg/m2 29.3 6 6.6 26.8 6 2.7GFR, mL/min per 1.73 m2† 24.76 27.53Serum creatinine concentration, mmol/L (mg/dL)† 187.41 (2.12) 202.44 (2.29)Serum urea nitrogen concentration, mmol/L (mg/dL)† 13.33 (37.35) 16.40 (45.95)Hematocrit, %† 31.60 32.10Serum albumin level, g/L† 37 37Peak oxygen consumption, mL/kg per minute 16.0 6 5.1 18.5 6 7.1Protein intake, g/kg of body weight per day‡ 0.84 6 0.19 0.85 6 0.22Energy intake, J/kg per day‡ 68.7 6 30.9 86.6 6 28.5Cause of renal disease, n
Renovascular hypertension 5 5Type 2 diabetes mellitus 5 5Polycystic kidney disease 1 0Goodpasture disease 1 0Lupus erythematosus 0 1Lithium therapy 2 1
Diagnosed hypertension, % 64 83Chronic conditions, n 5.5 6 1.5 6.4 6 1.7Medications, n 5.6 6 2.4 6.4 6 1.6
* Unless otherwise noted, values are the mean 6 SD. Groups did not differ significantly in any of these characteristics, as assessed by independent sample t-test comparisonsfor continuous variables, the chi-square test for categorical variables, and the Wilcoxon rank test for non-normally distributed continuous variables. GFR 5 glomerularfiltration rate.† Non-normally distributed variables, for which medians are shown.‡ Protein intake was estimated from urea nitrogen appearance by using the Maroni method (19), and energy intake was estimated from 3-day assisted dietary records.
ArticleProtein Restriction and Exercise in Renal Failure
www.annals.org 4 December 2001 Annals of Internal Medicine Volume 135 • Number 11 969

known association with the main outcomes. Secondary,model-building stepwise regression analyses of the dif-ference between postintervention and preinterventionoutcomes were carried out to determine the predictivepotential of selected covariates. Independent predictivevariables were chosen on the basis of their statisticallysignificant association with the main outcomes at base-
line (as determined by univariate analysis using the Pear-son correlation coefficient). Thus, separate models wereconstructed with the change in each main outcome asthe dependent variable and baseline protein and energyintakes, baseline body weight, and sex as the indepen-dent variables. Group assignment was forced into eachmodel. Statistical results were considered significant if
Table 2. Biochemical, Metabolic, and Dietary Variables*
Variable Low-Protein Diet plus ResistanceTraining (n 5 14)
Low-Protein Diet Alone(n 5 12)
P Value
Value Change, Absolute Value Change, Absolute
Body weight, kgWeek 0 84.6 6 15.8 76.1 6 13.5Week 12 84.8 6 16.2 0.46 6 2.6 72.5 6 9.0 23.21 6 1.5 0.049
Insulin-like growth factor I level, nmol/L†Week 0 15.5 16.1Week 12 18.3 2.5 17.4 1.0 0.125
Serum prealbumin level, mg/LWeek 0 253 6 46 232 6 60Week 12 276 6 46 17 6 31 234 6 50 3 6 31 0.050
Leucine synthesis, mmol/kg of body weight perminute‡
Week 0 61.1 6 14.8 59.8 6 14.8Week 12 61.4 6 14.7 0.30 6 7.0 60.6 6 15.7 0.8 6 5.9 .0.2
Leucine oxidation, mmol/kg per minute‡Week 0 9.8 6 2.5 9.2 6 1.5Week 12 10.4 6 2.2 0.7 6 2.2 8.1 6 1.9 21.1 6 2.1 0.046
Urinary creatinine concentration, mmol/d (g/d)Week 0 0.113 6 0.03 0.102 6 0.02
(1.13 6 0.03) (1.02 6 0.02)Week 12 0.104 6 0.03 20.01 6 0.1 0.103 6 0.02 0.001 6 0.07 0.074
(1.04 6 0.03) (1.03 6 0.02)GFR, mL/min per 1.73 m2†
Week 0 24.76 30.01Week 12 26.35 1.18 28.03 21.62 0.048
Hematocrit, %†Week 0 31.55 32.10Week 12 32.75 0.99 32.70 20.37 .0.2
Serum urea nitrogen level, mmol/L (mg/dL)†Week 0 8.6 (24.0) 10.4 (29.1)Week 12 9.3 (26.0) 0.5 10.6 (29.6) 0.1 .0.2
Serum creatinine concentration, mmol/L (mg/dL)†Week 0 187.41 (2.12) 202.44 (2.29)Week 12 163.54 (1.85) 0.003 182.10 (2.06) 0.01 .0.2
Resting energy expenditure, mJ/d§Week 0 5.86 6 0.80 5.82 6 1.00Week 12 6.06 6 0.71 0.19 6 0.46 5.63 6 0.84 20.12 6 0.77 .0.2
Protein intake, g/kg of body weight per day\
Week 0 0.64 6 0.08 0.65 6 0.09Week 12 0.60 6 0.08 20.02 6 0.06 0.60 6 0.11 20.01 6 0.05 .0.2
Energy intake, J/kg per day\
Week 0 67.7 6 26.9 87.1 6 28.4Week 12 76.4 6 32.2 8.8 6 17.6 98.3 6 24.9 7.2 6 14.1 .0.2
* Unless otherwise noted, values are the mean 6 SD. Regression analysis by general linear models was performed to compare the treatment group effect on the change ineach variable adjusted for sex. GFR 5 glomerular filtration rate.† Non-normally distributed variables, for which medians are shown. Log-transformed variables were used for analysis.‡ Determined from leucine kinetics on a 4-hour constant infusion of L-[1-13C]-leucine, as described elsewhere (31).§ Resting energy expenditure was estimated from indirect calorimetry.\ Protein intake was estimated from appearance of urea nitrogen in a 48-hour urine collection by using the Maroni method (19), and energy intake was estimated from two3-day assisted dietary records.
Article Protein Restriction and Exercise in Renal Failure
970 4 December 2001 Annals of Internal Medicine Volume 135 • Number 11 www.annals.org

the two-tailed P value was less than 0.05. The packageused for analysis was SPSS 10.0 for Windows (SPSS,Inc., Evanston, Illinois).
Role of the Funding SourcesThe funding sources had no role in the design of the
study but oversaw aspects of its conduct and reporting.
RESULTS
Thirty-six of 200 persons contacted were screened,and 26 completed the study (Figure 1). One patient ineach group did not complete all postintervention mea-sures because of medical reasons. Groups did not differat baseline in sociodemographic, body composition, bio-chemical, or health variables (Table 1).
Adherence to resistance training and sham exercisesessions was 91% 6 9% and 90% 6 10%, respectively.These values did not differ significantly. Dietary adher-ence was achieved in 24 patients during the first 4 weeksof the run-in period. Two patients, one in each group,were permitted an additional 4 weeks to achieve thetarget protein intake. Dietary counseling from screeningto week 12 of the intervention resulted in a 24% reduc-tion in protein intake in each group, while energy intakewas maintained and even increased slightly, as shownby baseline and intervention values (Tables 1 and 2).Adherence to the low-protein diet, determined by uri-nary urea nitrogen level, indicated that patients in theresistance training group consumed an average of108% 6 8% of the target protein level, while patients
Table 3. Muscle Strength*
Variable Low-Protein Diet plus Resistance Training (n 5 14) Low-Protein Diet Alone (n 5 12) P Value
Week 0 Week 12 Change Week 0 Week 12 Change
kg % kg %
Upper body strengthChest press 24.0 6 10.4 31.8 6 12.9 34 6 12 28.4 6 5.8 26.2 6 6.4 27 6 8 ,0.001Latissimuspull-down 26.4 6 7.5 33.9 6 10.0 29 6 14 29.5 6 8.0 27.6 6 10.0 29 6 19 ,0.001
Lower body strengthLeg press 167.4 6 102.3 210.9 6 129.0 29 6 15 135.0 6 26.7 134.3 6 36.3 21 6 12 0.001Knee extension 39.9 6 17.8 55.9 6 22.4 47 6 24 36.7 6 9.8 38.8 6 14.0 2 6 4 ,0.001Knee flexion 39.8 6 13.6 55.8 6 13.6 44 6 22 43.4 6 16.0 39.5 6 9.4 23 6 24 ,0.001
* Values are the mean 6 SD. Regression analysis by general linear models was performed to compare the treatment group effect on the change in muscle strength for eachmachine, adjusted for sex.
Table 4. Main Outcome Variables*
Variable Low-Protein Diet plus ResistanceTraining (n 5 14)
Low-Protein Diet Alone(n 5 12)
P Value
Value Change, Absolute Value Change, Absolute
Total body potassium, kgWeek 0 101.6 6 25.2 104.5 6 18.7Week 12 105.8 6 23.9 1.9 6 7.9 97.9 6 17.9 25.2 6 5.9 0.014
Type I muscle-fiber area, mm2†Week 0 3887 6 1566 4578 6 1524Week 12 4821 6 1411 934 6 1486 3960 6 998 2618 6 967 0.031
Type II muscle-fiber area, mm2†Week 0 3626 6 1216 3957 6 988Week 12 4437 6 1393 811 6 1479 3399 6 814 2558 6 1126 0.045
Mid-thigh muscle area, cm2‡Week 0 108.9 6 29.5 108.2 6 20.7Week 12 111.3 6 29.6 2.42 6 8.35 105.7 6 18.9 22.54 6 6.15 0.113
* Values are the mean 6 SD for patients with completed preintervention and postintervention measures. Regression analysis by general linear models was performed tocompare the treatment group effect on the change in each main outcome, adjusted for sex.† Type I and II skeletal muscle-fiber cross-sectional areas of vastus lateralis muscle of the nondominant leg were determined by histochemical analysis.‡ Measured by computed tomography of the nondominant leg.
ArticleProtein Restriction and Exercise in Renal Failure
www.annals.org 4 December 2001 Annals of Internal Medicine Volume 135 • Number 11 971
following the low-protein diet alone consumed approx-imately 112% 6 12%. These estimates did not differsignificantly between groups. Energy intake, determinedas the mean of two self-reported 3-day dietary records,was low in both groups and suggested approximately20% underreporting compared with measured restingenergy expenditure multiplied by an activity factor of1.2 (32). No exercise-related adverse events or injurieswere reported. Nutritional status assessed by biochemi-cal markers of protein nutrition was not adversely af-fected during the study (Table 2). Muscle strength re-sults are shown in Table 3. Patients who performedresistance training had significantly larger increases inmuscle strength on each machine than patients who fol-lowed the low-protein diet alone (overall improvementin muscle strength, 32% 6 14% vs. 213% 6 20%;P , 0.001).
Main OutcomesTable 4 shows the results of the main outcomes
measured to assess the anabolic effect of resistance train-ing on muscle mass. Completed measurements of totalbody potassium were available in only 23 of 26 patients
(low-protein diet plus resistance training, n 5 12; low-protein diet alone, n 5 11) because of technical difficul-ties (n 5 1) or medical reasons (n 5 2). Similarly, re-sults of muscle biopsies were available in only 21 of 26patients (low-protein diet plus resistance training, n 513; low-protein diet alone, n 5 8) because of patientrefusal to undergo the procedure (n 5 3) or medicalreasons (n 5 2).
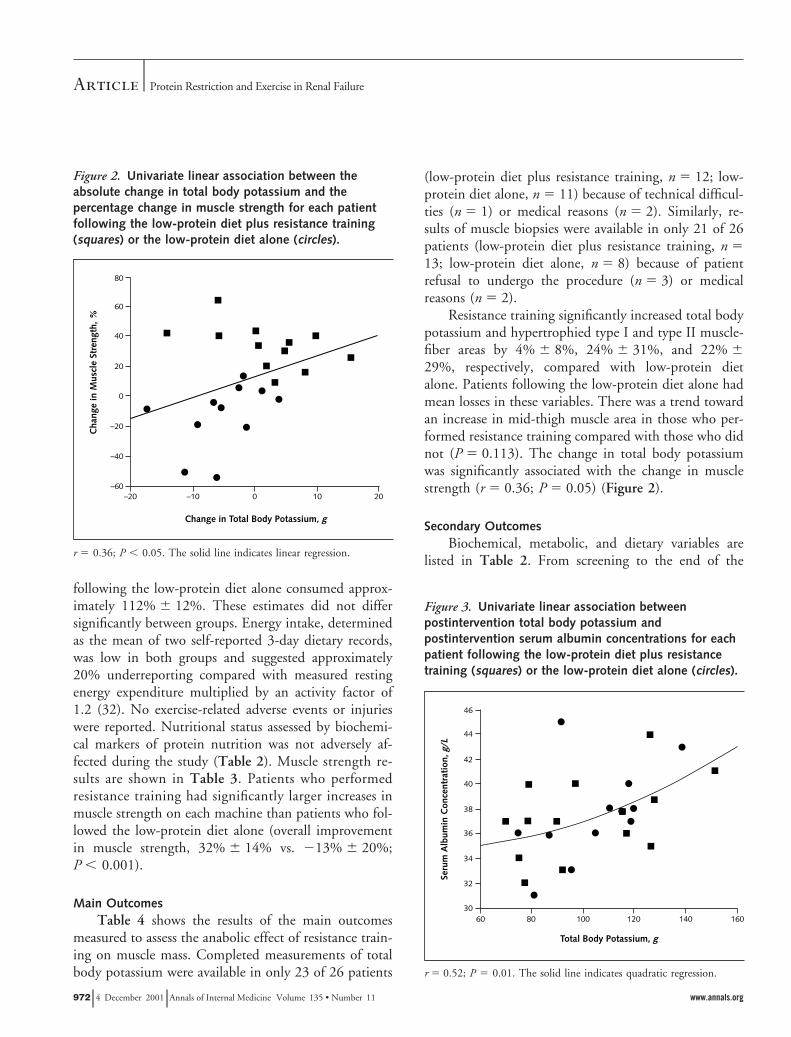
Resistance training significantly increased total bodypotassium and hypertrophied type I and type II muscle-fiber areas by 4% 6 8%, 24% 6 31%, and 22% 629%, respectively, compared with low-protein dietalone. Patients following the low-protein diet alone hadmean losses in these variables. There was a trend towardan increase in mid-thigh muscle area in those who per-formed resistance training compared with those who didnot (P 5 0.113). The change in total body potassiumwas significantly associated with the change in musclestrength (r 5 0.36; P 5 0.05) (Figure 2).
Secondary OutcomesBiochemical, metabolic, and dietary variables are
listed in Table 2. From screening to the end of the
Figure 2. Univariate linear association between theabsolute change in total body potassium and thepercentage change in muscle strength for each patientfollowing the low-protein diet plus resistance training(squares) or the low-protein diet alone (circles).
r 5 0.36; P , 0.05. The solid line indicates linear regression.
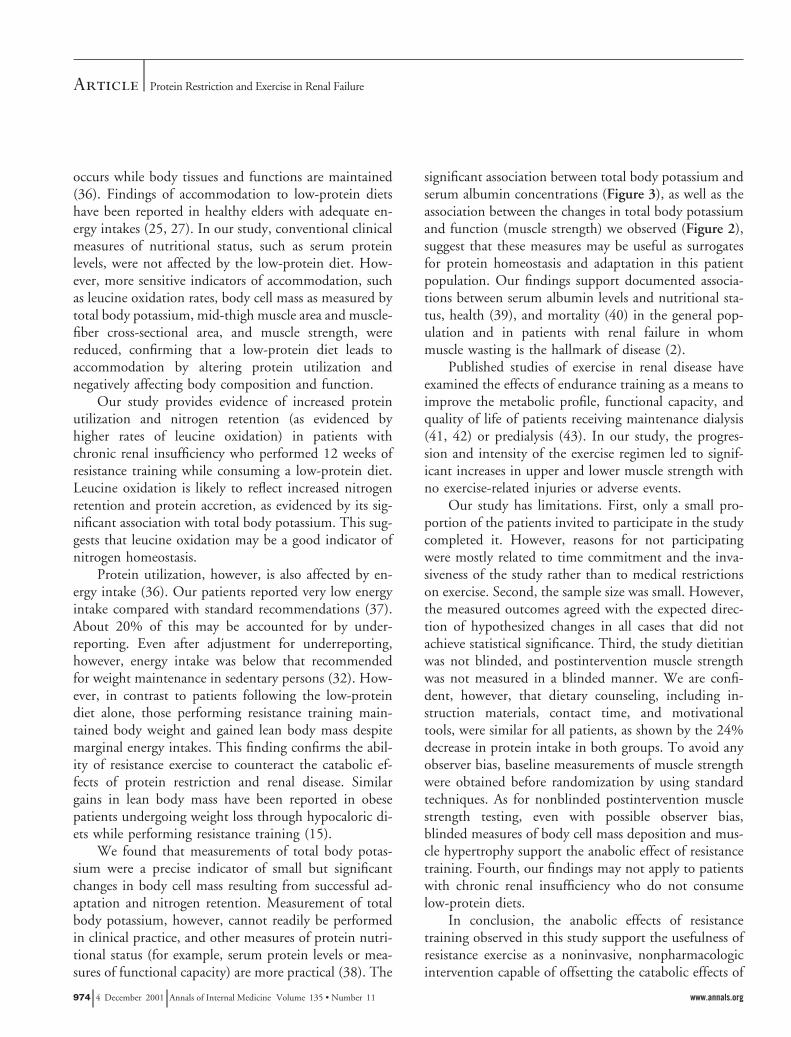
Figure 3. Univariate linear association betweenpostintervention total body potassium andpostintervention serum albumin concentrations for eachpatient following the low-protein diet plus resistancetraining (squares) or the low-protein diet alone (circles).
r 5 0.52; P 5 0.01. The solid line indicates quadratic regression.
Article Protein Restriction and Exercise in Renal Failure
972 4 December 2001 Annals of Internal Medicine Volume 135 • Number 11 www.annals.org

run-in period, patients assigned to the resistance traininggroup lost 2.1 6 2.8 kg and those assigned to the low-protein diet alone lost 1.1 6 1.9 kg (P 5 0.02). Duringthe intervention period, however, those who performedresistance training maintained body weight and thosewho did not experienced substantial additional loss.Concentrations of insulin-like growth factor I increasedby 18% in those who performed resistance training andincreased slightly in those who followed the low-proteindiet alone (P 5 0.125). Serum prealbumin level in-creased significantly in the resistance training groupcompared with the low-protein diet alone group, andsimilar trends were seen for serum albumin and trans-ferrin (data not shown). Postintervention total body po-tassium was significantly correlated with postinterven-tion serum albumin concentrations (r 5 0.52; P ,0.01) (Figure 3).
Leucine synthesis did not change in either group.Leucine oxidation increased with resistance training anddecreased with low-protein diet alone. Urinary creati-nine excretion decreased by 8% in those who performedresistance training and did not change in those whofollowed the low-protein diet alone. Renal function didnot deteriorate, as shown by a small but significant im-provement in glomerular filtration rate in those whoperformed resistance training compared with those whofollowed a low-protein diet alone. This finding was seendespite a sample of only 18 of 26 patients (resistancetraining, n 5 8; low-protein diet alone, n 5 10) becauseof shellfish allergies (n 5 4) and poor intravenous access(n 5 4). The groups did not differ significantly in he-matocrit, serum urea nitrogen level, and creatinine con-centration or resting metabolic rate.
Secondary Analysis of Predictors of the Change inMain Outcomes
Univariate correlation analyses at baseline showedthat total body potassium was associated with both pro-tein intake (r 5 0.70; P , 0.001) and energy intake(r 5 0.37; P 5 0.05), as well as with body weight (r 50.57; P 5 0.003). Mid-thigh muscle area was associatedwith protein intake (r 5 0.77; P , 0.001) and bodyweight (r 5 0.56; P 5 0.003). Total body potassiumwas also significantly associated with concentrations ofinsulin-like growth factor I (r 5 0.39; P 5 0.05) andwith leucine oxidation (r 5 0.56; P 5 0.01). Given that
these variables are a function of protein intake and thatthis study had a small sample size, baseline protein andenergy intake, body weight, sex, and group assignmentwere the only independent variables used as predictorsfor each of the models constructed. The change in eachmain outcome was the dependent variable. Group as-signment was found to be the only significant predictorof the change in total body potassium and the change intype I and II muscle-fiber cross-sectional areas, account-ing for 47% (P 5 0.02), 52% (P 5 0.01), and 61%(P 5 0.03) of their variances, respectively. None ofthese factors were independent contributors to thechange in mid-thigh muscle area.
DISCUSSION
This study suggests that resistance training is a safeand effective countermeasure to the negative effects ofprotein restriction on muscle mass accretion, proteinutilization, nutritional status, and muscle function inpatients with moderate chronic renal insufficiency con-suming a low-protein diet. After 12 weeks of resistancetraining, patients successfully adapted to the low-proteindiet. This was evidenced by improved nitrogen reten-tion, as shown by gains in total body potassium; hyper-trophy of type I and type II muscle-fiber area; increasedprealbumin levels; maintenance of body weight; and in-creased protein utilization, as measured by leucine oxi-dation rates. The anabolic effects of resistance trainingwere observed despite patient age, uremia, self-reportedlow energy intakes, anemia, low aerobic capacity, andcomorbid diseases.
The mean protein intake was 0.64 6 0.07 g/kg perday, a 24% decrease from habitual intake in bothgroups. Although published evidence suggests that alow-protein diet has a beneficial effect in patients withchronic renal insufficiency (6, 7, 33), it is not com-monly prescribed in clinical practice. Nonadherence andthe need for intensive dietary counseling are substantialbarriers to clinical implementation (34). In addition,concerns exist regarding the possible deleterious effectsof accommodation to a low-protein diet on nutritionalstatus, muscle mass, and survival (35). Accommodationtakes place when significant losses in important bodytissues or functions occur as a result of an environmentalstress to maximize protein homeostasis and survival. Incontrast, adaptation to a less than adequate protein diet
ArticleProtein Restriction and Exercise in Renal Failure
www.annals.org 4 December 2001 Annals of Internal Medicine Volume 135 • Number 11 973
occurs while body tissues and functions are maintained(36). Findings of accommodation to low-protein dietshave been reported in healthy elders with adequate en-ergy intakes (25, 27). In our study, conventional clinicalmeasures of nutritional status, such as serum proteinlevels, were not affected by the low-protein diet. How-ever, more sensitive indicators of accommodation, suchas leucine oxidation rates, body cell mass as measured bytotal body potassium, mid-thigh muscle area and muscle-fiber cross-sectional area, and muscle strength, werereduced, confirming that a low-protein diet leads toaccommodation by altering protein utilization andnegatively affecting body composition and function.
Our study provides evidence of increased proteinutilization and nitrogen retention (as evidenced byhigher rates of leucine oxidation) in patients withchronic renal insufficiency who performed 12 weeks ofresistance training while consuming a low-protein diet.Leucine oxidation is likely to reflect increased nitrogenretention and protein accretion, as evidenced by its sig-nificant association with total body potassium. This sug-gests that leucine oxidation may be a good indicator ofnitrogen homeostasis.
Protein utilization, however, is also affected by en-ergy intake (36). Our patients reported very low energyintake compared with standard recommendations (37).About 20% of this may be accounted for by under-reporting. Even after adjustment for underreporting,however, energy intake was below that recommendedfor weight maintenance in sedentary persons (32). How-ever, in contrast to patients following the low-proteindiet alone, those performing resistance training main-tained body weight and gained lean body mass despitemarginal energy intakes. This finding confirms the abil-ity of resistance exercise to counteract the catabolic ef-fects of protein restriction and renal disease. Similargains in lean body mass have been reported in obesepatients undergoing weight loss through hypocaloric di-ets while performing resistance training (15).
We found that measurements of total body potas-sium were a precise indicator of small but significantchanges in body cell mass resulting from successful ad-aptation and nitrogen retention. Measurement of totalbody potassium, however, cannot readily be performedin clinical practice, and other measures of protein nutri-tional status (for example, serum protein levels or mea-sures of functional capacity) are more practical (38). The
significant association between total body potassium andserum albumin concentrations (Figure 3), as well as theassociation between the changes in total body potassiumand function (muscle strength) we observed (Figure 2),suggest that these measures may be useful as surrogatesfor protein homeostasis and adaptation in this patientpopulation. Our findings support documented associa-tions between serum albumin levels and nutritional sta-tus, health (39), and mortality (40) in the general pop-ulation and in patients with renal failure in whommuscle wasting is the hallmark of disease (2).
Published studies of exercise in renal disease haveexamined the effects of endurance training as a means toimprove the metabolic profile, functional capacity, andquality of life of patients receiving maintenance dialysis(41, 42) or predialysis (43). In our study, the progres-sion and intensity of the exercise regimen led to signif-icant increases in upper and lower muscle strength withno exercise-related injuries or adverse events.
Our study has limitations. First, only a small pro-portion of the patients invited to participate in the studycompleted it. However, reasons for not participatingwere mostly related to time commitment and the inva-siveness of the study rather than to medical restrictionson exercise. Second, the sample size was small. However,the measured outcomes agreed with the expected direc-tion of hypothesized changes in all cases that did notachieve statistical significance. Third, the study dietitianwas not blinded, and postintervention muscle strengthwas not measured in a blinded manner. We are confi-dent, however, that dietary counseling, including in-struction materials, contact time, and motivationaltools, were similar for all patients, as shown by the 24%decrease in protein intake in both groups. To avoid anyobserver bias, baseline measurements of muscle strengthwere obtained before randomization by using standardtechniques. As for nonblinded postintervention musclestrength testing, even with possible observer bias,blinded measures of body cell mass deposition and mus-cle hypertrophy support the anabolic effect of resistancetraining. Fourth, our findings may not apply to patientswith chronic renal insufficiency who do not consumelow-protein diets.
In conclusion, the anabolic effects of resistancetraining observed in this study support the usefulness ofresistance exercise as a noninvasive, nonpharmacologicintervention capable of offsetting the catabolic effects of
Article Protein Restriction and Exercise in Renal Failure
974 4 December 2001 Annals of Internal Medicine Volume 135 • Number 11 www.annals.org
low protein and energy intakes and the wasting syn-drome of chronic uremia. If nutritional status cannot beimproved by simply increasing protein or energy intake,resistance training may be a central component in themultifactorial therapeutic approach to chronic renal in-sufficiency and may result in successful adaptation tolow-protein diets secondary to prescription or anorexia.Future studies with longer intervention periods, patientswith more advanced stages of renal failure, and largerpatient samples may confirm and extend our findings.
From Tufts University, New England Medical Center, and Boston Uni-versity Sargent College of Health and Rehabilitation Sciences, Boston,Massachusetts; and University of Sidney, Lidcome, Australia.
Disclaimer: Any opinions, findings, conclusions, or recommendationsexpressed in this publication are those of the authors and do not neces-sarily reflect the view of the U.S. Department of Agriculture.
Acknowledgments: The authors thank the volunteers, who made thisstudy possible, for their kind and valuable cooperation. They also thankthe recruitment, nursing, and dietetic staff of the Metabolic ResearchUnit for their help in undertaking this study; the Nutrition Evaluationand Mass Spectrometry Laboratories at the HNRCA for their valuableassistance with biochemical and isotopic analyses; Keiser Sports HealthEquipment, Inc., for the donation of the resistance training equipment;and Woodway USA for the donation of the treadmill. They especiallythank the late Nancy Lundgren, MS, for her valuable help in the isotopicanalyses. Finally, they thank Drs. James Strom and Geetha Narayan,Saint Elizabeth’s Hospital; Dr. Henry Yager, Newton Wellesley Hospi-tal; Drs. Elizabeth Bouthot, Chrisopher Ying, Mark Parker, and SamirKassissieh, Lahey Hitchcock Clinic; and Drs. John T. Harrington, Nico-laos E. Madias, Klemens B. Meyer, Ronald D. Perrone, Andrew J. King,and Mark Sarnak, the attending physicians of the Nephrology Clinic atNew England Medical Center.
Grant Support: In part by the National Institute on Aging (RO1AG13457), the New England Medical Center Research Fund, and theU.S. Department of Agriculture, Agricultural Research Service (58-1950-9-001).
Requests for Single Reprints: Carmen Castaneda, MD, PhD, JeanMayer USDA Human Nutrition Research Center on Aging, Tufts Uni-versity, 711 Washington Street, Boston, MA 02111; e-mail, [email protected].
Current Author Addresses: Drs. Castaneda, Gordon, Kehayias, andRoubenoff: Jean Mayer USDA Human Nutrition Research Center onAging, Tufts University, 711 Washington Street, Boston, MA 02111.Ms. Uhlin and Dr. Levey: Division of Nephrology, New England Med-ical Center, 35 Kneeland Street, Boston, MA 02111.Dr. Dwyer: Frances Stern Nutrition Center, New England Medical Cen-ter, 750 Washington Street, Boston, MA 02111.
Dr. Fielding: Department of Health Sciences, Boston University SargentCollege of Health and Rehabilitation Sciences, 635 CommonwealthAvenue, Boston, MA 02215.Dr. Singh: School of Exercise and Sport Science, Faculty of HealthSciences, University of Sidney, East Street, Lidcombe 2141 NSW,Australia.
Author Contributions: Conception and design: C. Castaneda, A.S.Levey, J.T. Dwyer, R.A. Fielding, M.F. Singh.Analysis and interpretation of the data: C. Castaneda, A.S. Levey, J.J.Kehayias, J.T. Dwyer, R. Roubenoff, M.F. Singh.Drafting of the article: C. Castaneda, A.S. Levey, J.J. Kehayias, J.T.Dwyer, R. Roubenoff, M.F. Singh.Critical revision of the article for important intellectual content: C. Cas-taneda, A.S. Levey, J.T. Dwyer, R. Roubenoff, M.F. Singh.Final approval of the article: C. Castaneda, P.L. Gordon, K.L. Uhlin,A.S. Levey, J.J. Kehayias, J.T. Dwyer, R.A. Fielding, R. Roubenoff, M.F.Singh.Provision of study materials or patients: C. Castaneda, A.S. Levey.Statistical expertise: M.F. Singh.Obtaining of funding: C. Castaneda, A.S. Levey, R.A. Fielding, M.F.Singh.Administrative, technical, or logistic support: C. Castaneda, P.L. Gor-don, K.L. Uhlin, J.T. Dwyer, R. Roubenoff, M.F. Singh.Collection and assembly of data: C. Castaneda, P.L. Gordon, K.L.Uhlin, J.J. Kehayias.
References1. Remuzzi G, Ruggenenti P, Benigni A. Understanding the nature of renaldisease progression. Kidney Int. 1997;51:2-15. [PMID: 8995712]
2. Kopple JD. Pathophysiology of protein-energy wasting in chronic renal failure.J Nutr. 1999;129:247S-251S. [PMID: 9915908]
3. Lowrie EG, Lew NL. Death risk in hemodialysis patients: the predictive valueof commonly measured variables and an evaluation of death rate differences be-tween facilities. Am J Kidney Dis. 1990;15:458-82. [PMID: 2333868]
4. Pedrini MT, Levey AS, Lau J, Chalmers TC, Wang PH. The effect of dietaryprotein restriction on the progression of diabetic and nondiabetic renal diseases: ameta-analysis. Ann Intern Med. 1996;124:627-32. [PMID: 8607590]
5. Kasiske BL, Lakatua JD, Ma JZ, Louis TA. A meta-analysis of the effects ofdietary protein restriction on the rate of decline in renal function. Am J KidneyDis. 1998;31:954-61. [PMID: 9631839]
6. Maroni BJ, Mitch WE. Role of nutrition in prevention of the progression ofrenal disease. Annu Rev Nutr. 1997;17:435-55. [PMID: 9240935]
7. Levey AS, Greene T, Beck GJ, Caggiula AW, Kusek JW, Hunsicker LG, etal. Dietary protein restriction and the progression of chronic renal disease: whathave all of the results of the MDRD study shown? Modification of Diet in RenalDisease Study group. J Am Soc Nephrol. 1999;10:2426-39. [PMID: 10541304]
8. Guarnieri GF, Toigo G, Situlin R, Carraro M, Tamaro G, Lucchesli A, et al.Nutritional state in patients on long-term low-protein diet or with nephroticsyndrome. Kidney Int Suppl. 1989;27:S195-200. [PMID: 2636656]
9. Campbell WW, Crim MC, Young VR, Joseph LJ, Evans WJ. Effects ofresistance training and dietary protein intake on protein metabolism in olderadults. Am J Physiol. 1995;268:E1143-53. [PMID: 7611390]
10. Rall LC, Rosen CJ, Dolnikowski G, Hartman WJ, Lundgren N, Abad LW,et al. Protein metabolism in rheumatoid arthritis and aging. Effects of muscle
ArticleProtein Restriction and Exercise in Renal Failure
www.annals.org 4 December 2001 Annals of Internal Medicine Volume 135 • Number 11 975
strength training and tumor necrosis factor alpha. Arthritis Rheum. 1996;39:1115-24. [PMID: 8670319]
11. Singh MA, Ding W, Manfredi TJ, Solares GS, O’Neill EF, Clements KM,et al. Insulin-like growth factor I in skeletal muscle after weight-lifting exercise infrail elders. Am J Physiol. 1999;277:E135-43. [PMID: 10409137]
12. Fiatarone MA, Evans WJ. The etiology and reversibility of muscle dysfunc-tion in the aged. J Gerontol. 1993;48:77-83. [PMID: 8409245]
13. Evans WJ, Roubenoff R, Shevitz A. Exercise and the treatment of wasting:aging and human immunodeficiency virus infection. Semin Oncol. 1998;25:112-22. [PMID: 9625393]
14. Braith RW, Mills RM, Welsch MA, Keller JW, Pollock ML. Resistanceexercise training restores bone mineral density in heart transplant recipients. J AmColl Cardiol. 1996;28:1471-7. [PMID: 8917260]
15. Ballor DL, Harvey-Berino JR, Ades PA, Cryan J, Calles-Escandon J. Con-trasting effects of resistance and aerobic training on body composition and me-tabolism after diet-induced weight loss. Metabolism. 1996;45:179-83. [PMID:8596486]
16. Pu CT, Johnson MT, Forman DE, Hausdorff JM, Roubenoff R, FoldvariM, et al. Randomized trial of progressive resistance training to counteract themyopathy of chronic heart failure. J Appl Physiol. 2001;90:2341-50. [PMID:11356801]
17. Castaneda C, Grossi L, Dwyer J. Potential benefits of resistance exercisetraining on nutritional status in renal failure. J Ren Nutr. 1998;8:2-10. [PMID:9724824]
18. American College of Sports Medicine Position Stand and American HeartAssociation. Recommendations for cardiovascular screening, staffing, and emer-gency policies at health/fitness facilities. Med Sci Sports Exerc. 1998;30:1009-18.[PMID: 9624663]
19. Maroni BJ, Steinman TI, Mitch WE. A method for estimating nitrogenintake of patients with chronic renal failure. Kidney Int. 1985;27:58-65. [PMID:3981873]
20. Reduction of dietary protein and phosphorus in the Modification of Diet inRenal Disease Feasibility Study. The MDRD Study Group. J Am Diet Assoc.1994;94:986-90. [PMID: 8071496]
21. Fiatarone MA, Marks EC, Ryan ND, Meredith CN, Lipsitz LA, Evans WJ.High-intensity strength training in nonagenarians. Effects on skeletal muscle.JAMA. 1990;263:3029-34. [PMID: 2342214]
22. Fiatarone MA, O’Neill EF, Ryan ND, Clements KM, Solares GR, NelsonME, et al. Exercise training and nutritional supplementation for physical frailty invery elderly people. N Engl J Med. 1994;330:1769-75. [PMID: 8190152]
23. Roubenoff R, Heymsfield SB, Kehayias JJ, Cannon JG, Rosenberg IH.Standardization of nomenclature of body composition in weight loss. Am J ClinNutr. 1997;66:192-6. [PMID: 9209192]
24. Kehayias JJ, Fiatarone MA, Zhuang H, Roubenoff R. Total body potassiumand body fat: relevance to aging. Am J Clin Nutr. 1997;66:904-10. [PMID:9322566]
25. Castaneda C, Charnley JM, Evans WJ, Crim MC. Elderly women accom-modate to a low-protein diet with losses of body cell mass, muscle function, andimmune response. Am J Clin Nutr. 1995;62:30-9. [PMID: 7598064]
26. Ericsson F, Carlmark B. Potassium in whole body, skeletal muscle and eryth-rocytes in chronic renal failure. Nephron. 1983;33:173-8. [PMID: 6843744]
27. Castaneda C, Gordon PL, Fielding RA, Evans WJ, Crim MC. Marginalprotein intake results in reduced plasma IGF-I levels and skeletal muscle fiber
atrophy in elderly women. J Nutr Health Aging. 2000;4:85-90. [PMID:10842420]
28. Levey AS, Greene T, Schluchter MD, Cleary PA, Teschan PE, Lorenz RA,et al. Glomerular filtration rate measurements in clinical trials. Modification ofDiet in Renal Disease Study Group and the Diabetes Control and ComplicationsTrial Research Group. J Am Soc Nephrol. 1993;4:1159-71. [PMID: 8305642]
29. Weir JB. New methods for calculating metabolic rate with special reference toprotein metabolism. J Physiol. 1949;109:1-9.
30. Foldvari M, Clark M, Laviolette LC, Bernstein MA, Kaliton D, CastanedaC, et al. Association of muscle power with functional status in community-dwelling elderly women. J Gerontol A Biol Sci Med Sci. 2000;55:M192-9.[PMID: 10811148]
31. Matthews DE, Motil KJ, Rohrbaugh DK, Burke JF, Young VR, Bier DM.Measurement of leucine metabolism in man from a primed, continuous infusionof L-[1-3C]leucine. Am J Physiol. 1980;238:E473-9. [PMID: 6769340]
32. Recommended Dietary Allowances. 10th ed. National Research Council.Washington DC: National Academy Pr; 1989.
33. Kopple JD, Levey AS, Greene T, Chumlea WC, Gassman JJ, HollingerDL, et al. Effect of dietary protein restriction on nutritional status in the Modi-fication of Diet in Renal Disease Study. Kidney Int. 1997;52:778-91. [PMID:9291200]
34. Dolecek TA, Olson MB, Caggiula AW, Dwyer JT, Milas NC, Gillis BP,et al. Registered dietitian time requirements in the Modification of Diet in RenalDisease Study. J Am Diet Assoc. 1995;95:1307-12. [PMID: 7594128]
35. Guarnieri G, Toigo G, Fiotti N, Ciocchi B, Situlin R, Giansante C, et al.Mechanisms of malnutrition in uremia. Kidney Int Suppl. 1997;62:S41-4.[PMID: 9350678]
36. Young VR, Marchini JS. Mechanisms and nutritional significance of meta-bolic responses to altered intakes of protein and amino acids, with reference tonutritional adaptation in humans. Am J Clin Nutr. 1990;51:270-89. [PMID:2407099]
37. Kopple JD, Monteon FJ, Shaib JK. Effect of energy intake on nitrogenmetabolism in nondialyzed patients with chronic renal failure. Kidney Int. 1986;29:734-42. [PMID: 3702224]
38. Blumenkrantz MJ, Kopple JD, Gutman RA, Chan YK, Barbour GL, Rob-erts C, et al. Methods for assessing nutritional status of patients with renal failure.Am J Clin Nutr. 1980;33:1567-85. [PMID: 7395778]
39. Rall LC, Roubenoff R, Harris TB. Albumin as a marker of nutritional andhealth status. In: Rosenberg IH, ed. Nutritional Assessment of Elderly Popula-tions. New York: Raven Pr; 1995:1-17.
40. Corti MC, Guralnik JM, Salive ME, Sorkin JD. Serum albumin level andphysical disability as predictors of mortality in older persons. JAMA. 1994;272:1036-42. [PMID: 8089886]
41. Painter P. The importance of exercise training in rehabilitation of patientswith end-stage renal disease. Am J Kidney Dis. 1994;24:S2-9. [PMID: 8023835].
42. Cappy CS, Jablonka J, Schroeder ET. The effects of exercise during hemo-dialysis on physical performance and nutrition assessment. J Ren Nutr. 1999;9:63-70. [PMID: 10089261]
43. Boyce ML, Robergs RA, Avasthi PS, Roldan C, Foster A, Montner P, et al.Exercise training by individuals with predialysis renal failure: cardiorespiratoryendurance, hypertension, and renal function. Am J Kidney Dis. 1997;30:180-92.[PMID: 9261028]
Article Protein Restriction and Exercise in Renal Failure
976 4 December 2001 Annals of Internal Medicine Volume 135 • Number 11 www.annals.org