
RESEARCH ARTICLE The effects of caudal fin loss and ...
17
3164 INTRODUCTION Swimming performance is important for fish because it is closely related to the ability to gain food, to avoid predators and to perform other daily activities (Plaut, 2001; Zeng et al., 2009; Kieffer, 2010; Fu et al., 2012). As an important locomotive organ for most fish species, the caudal fin plays a crucial role in propelling and guiding fish during swimming (Lauder, 2000; Motani, 2002; Handegard et al., 2009). The shape, size and stiffness of the caudal fin are all expected to strongly affect swimming performance (Plaut, 2000). In nature, the caudal fin is frequently observed to be partly lost due to aggressive behaviour, predation and diseases (Winemiller, 1990; Ziskowski et al., 2008; Sinclair et al., 2011). Thus, fish must physiologically and behaviourally adjust to the probable negative effects on swimming performance caused by caudal fin loss and avoid the decline of Darwinian fitness. The relationship between the caudal fin and swimming performance has attracted broad attention for a long time, and caudal fin amputation has been widely used in previous studies (Webb, 1973; Webb, 1977; Champagne et al., 2008; Yang et al., 2013). It has been found that caudal fin amputation profoundly alters the swimming behaviour and/or speed in sockeye salmon (Oncorhynchus nerka) (Webb, 1973), rainbow trout (Salmo gairdneri) (Webb, 1977) and Chinese bream (Parabramis pekinensis) (Yang et al., 2013), while it showed no effect on swimming performance of brown darters (Etheostoma edwini) (Champagne et al., 2008). Thus, the caudal fin may be a different size and present a different level of importance for fish with different swimming capacities; therefore, the regeneration of the caudal fin in these fish may be different to meet those different swimming-capacity needs. The overall change in swimming capacity during caudal fin loss and regeneration has become an important question, but little investigation into this issue has been reported. Under sustainable speeds, most fish species that utilise body and caudal fin propulsion increase their swimming speed primarily by increasing their tail beat frequency (f TB ) and/or their tail beat amplitude (A TB ) (Hunter and Zweifel, 1971; Hunter, 1972; Dickson et al., 2002). Variation in f TB and A TB could therefore be used as an indicator of mechanical power output (Ellerby, 2010). When fish with caudal fin loss or partial caudal fin regeneration swim at the same speed as fish with intact caudal fins, f TB and/or A TB may increase due to the decreased effective area for thrust, to generate a similar thrust to that SUMMARY In nature, the caudal fins of fish species are frequently lost to some extent by aggressive behaviour, predation and diseases. To test whether the swimming performance of fish with different swimming capacities would be differentially affected due to caudal fin loss and regeneration, we investigated the critical swimming speed (U crit ), swimming metabolic rate (M O2 ), tail beat frequency (f TB ) and tail beat amplitude (A TB ) after caudal fin loss and regeneration (20 days) in juveniles of three cyprinid fish species: the qingbo (Spinibarbus sinensis; strong swimmer), the common carp (Cyprinus carpio; intermediate swimmer) and the goldfish (Carassius auratus; poor swimmer). The U crit values of the caudal-fin-lost qingbo, common carp and goldfish were 49, 32 and 35% significantly lower than those of the control groups, respectively. The maximum tail beat amplitude (A TBmax ) (all three fishes), the maximum tail beat frequency (f TBmax ) (only the common carp and the goldfish) and/or the active metabolic rate (M O2active ) (only the common carp) of the caudal-fin-lost fish were significantly higher than those of the control groups. After 20 days of recovery, the caudal fins recovered to 41, 47 and 24% of those of the control groups for the qingbo, the common carp and the goldfish, respectively. However, the U crit values of the fin-regenerated qingbo, common carp and goldfish recovered to 86, 91 and 95% of those of the control group, respectively. The caudal-fin-regenerated qingbo and common carp showed a significantly higher A TBmax and f TBmax , respectively, compared with those of the control groups. The qingbo had a higher f TBmax but a lower A TBmax than the common carp and the goldfish, which suggested that a strong swimmer may maintain swimming speed primarily by maintaining a greater f TBmax , for which the caudal fin plays a more important role during swimming, than a poor swimmer. The M O2active of fish (common carp) with a redundant respiratory capacity could increase due to caudal fin loss to meet the increase in energy expenditure required by an increase in f TBmax . In addition, the sustained swimming performance may not be the only selective pressure acting on caudal fin size in these three species, and the present caudal fin size may be a trade-off between sustain swimming performance and other factors (e.g. sexual selection, escape responses). Supplementary material available online at http://jeb.biologists.org/cgi/content/full/216/16/3164/DC1 Key words: behaviour, compensation, critical swimming speed, metabolic rate, morphology, tail beat frequency. Received 14 December 2012; Accepted 28 April 2013 The Journal of Experimental Biology 216, 3164-3174 © 2013. Published by The Company of Biologists Ltd doi:10.1242/jeb.084244 RESEARCH ARTICLE The effects of caudal fin loss and regeneration on the swimming performance of three cyprinid fish species with different swimming capacities Cheng Fu, Zhen-Dong Cao and Shi-Jian Fu* Laboratory of Evolutionary Physiology and Behaviour, Chongqing Key Laboratory of Animal Biology, Chongqing Normal University, Chongqing 400047, China *Author for correspondence ([email protected]) THE JOURNAL OF EXPERIMENTAL BIOLOGY
-
Upload
khangminh22 -
Category
Documents
-
view
0 -
download
0
Transcript of RESEARCH ARTICLE The effects of caudal fin loss and ...

3164
INTRODUCTIONSwimming performance is important for fish because it is closelyrelated to the ability to gain food, to avoid predators and to performother daily activities (Plaut, 2001; Zeng et al., 2009; Kieffer, 2010;Fu et al., 2012). As an important locomotive organ for most fishspecies, the caudal fin plays a crucial role in propelling and guidingfish during swimming (Lauder, 2000; Motani, 2002; Handegard etal., 2009). The shape, size and stiffness of the caudal fin are allexpected to strongly affect swimming performance (Plaut, 2000).In nature, the caudal fin is frequently observed to be partly lost dueto aggressive behaviour, predation and diseases (Winemiller, 1990;Ziskowski et al., 2008; Sinclair et al., 2011). Thus, fish mustphysiologically and behaviourally adjust to the probable negativeeffects on swimming performance caused by caudal fin loss andavoid the decline of Darwinian fitness. The relationship betweenthe caudal fin and swimming performance has attracted broadattention for a long time, and caudal fin amputation has been widelyused in previous studies (Webb, 1973; Webb, 1977; Champagne etal., 2008; Yang et al., 2013). It has been found that caudal finamputation profoundly alters the swimming behaviour and/or speed
in sockeye salmon (Oncorhynchus nerka) (Webb, 1973), rainbowtrout (Salmo gairdneri) (Webb, 1977) and Chinese bream(Parabramis pekinensis) (Yang et al., 2013), while it showed noeffect on swimming performance of brown darters (Etheostomaedwini) (Champagne et al., 2008). Thus, the caudal fin may be adifferent size and present a different level of importance for fishwith different swimming capacities; therefore, the regeneration ofthe caudal fin in these fish may be different to meet those differentswimming-capacity needs. The overall change in swimming capacityduring caudal fin loss and regeneration has become an importantquestion, but little investigation into this issue has been reported.
Under sustainable speeds, most fish species that utilise body andcaudal fin propulsion increase their swimming speed primarily byincreasing their tail beat frequency (fTB) and/or their tail beat amplitude(ATB) (Hunter and Zweifel, 1971; Hunter, 1972; Dickson et al., 2002).Variation in fTB and ATB could therefore be used as an indicator ofmechanical power output (Ellerby, 2010). When fish with caudal finloss or partial caudal fin regeneration swim at the same speed as fishwith intact caudal fins, fTB and/or ATB may increase due to thedecreased effective area for thrust, to generate a similar thrust to that
SUMMARYIn nature, the caudal fins of fish species are frequently lost to some extent by aggressive behaviour, predation and diseases. Totest whether the swimming performance of fish with different swimming capacities would be differentially affected due to caudalfin loss and regeneration, we investigated the critical swimming speed (Ucrit), swimming metabolic rate (MO2), tail beat frequency(fTB) and tail beat amplitude (ATB) after caudal fin loss and regeneration (20days) in juveniles of three cyprinid fish species: theqingbo (Spinibarbus sinensis; strong swimmer), the common carp (Cyprinus carpio; intermediate swimmer) and the goldfish(Carassius auratus; poor swimmer). The Ucrit values of the caudal-fin-lost qingbo, common carp and goldfish were 49, 32 and 35%significantly lower than those of the control groups, respectively. The maximum tail beat amplitude (ATBmax) (all three fishes), themaximum tail beat frequency (fTBmax) (only the common carp and the goldfish) and/or the active metabolic rate (MO2active) (only thecommon carp) of the caudal-fin-lost fish were significantly higher than those of the control groups. After 20days of recovery, thecaudal fins recovered to 41, 47 and 24% of those of the control groups for the qingbo, the common carp and the goldfish,respectively. However, the Ucrit values of the fin-regenerated qingbo, common carp and goldfish recovered to 86, 91 and 95% ofthose of the control group, respectively. The caudal-fin-regenerated qingbo and common carp showed a significantly higherATBmax and fTBmax, respectively, compared with those of the control groups. The qingbo had a higher fTBmax but a lower ATBmax thanthe common carp and the goldfish, which suggested that a strong swimmer may maintain swimming speed primarily bymaintaining a greater fTBmax, for which the caudal fin plays a more important role during swimming, than a poor swimmer. TheMO2active of fish (common carp) with a redundant respiratory capacity could increase due to caudal fin loss to meet the increase inenergy expenditure required by an increase in fTBmax. In addition, the sustained swimming performance may not be the onlyselective pressure acting on caudal fin size in these three species, and the present caudal fin size may be a trade-off betweensustain swimming performance and other factors (e.g. sexual selection, escape responses).
Supplementary material available online at http://jeb.biologists.org/cgi/content/full/216/16/3164/DC1
Key words: behaviour, compensation, critical swimming speed, metabolic rate, morphology, tail beat frequency.
Received 14 December 2012; Accepted 28 April 2013
The Journal of Experimental Biology 216, 3164-3174© 2013. Published by The Company of Biologists Ltddoi:10.1242/jeb.084244
RESEARCH ARTICLEThe effects of caudal fin loss and regeneration on the swimming performance of
three cyprinid fish species with different swimming capacities
Cheng Fu, Zhen-Dong Cao and Shi-Jian Fu*Laboratory of Evolutionary Physiology and Behaviour, Chongqing Key Laboratory of Animal Biology, Chongqing Normal University,
Chongqing 400047, China*Author for correspondence ([email protected])
THE JOURNAL OF EXPERIMENTAL BIOLOGY
3165
of fish with intact caudal fins, which may increase the energyexpenditure of fin-damaged fish when swimming at a given speed(Plaut, 2000). Thus, caudal fin damage may result in a decline inswimming performance. However, the decreased caudal fin area willalso result in a decrease in drag during swimming (Webb, 1973;Sinclair et al., 2011), making it easier for fish with damaged caudalfins to finish each tail beat. In addition, fin shape and size in manyfish species is subject to sexual selection, either because femaleschoose to mate with males that have larger fins or because males withlarger fins gain access to more females through male-to-malecompetition (Warner and Schultz, 1992; Jordan et al., 2006; Wilsonet al., 2010). Thus, for many fish species, the existing size of thecaudal fin may not be best suited to sustainable swimmingperformance, but instead may be a response to sexual selection or acompromise with unsteady swimming performance, which come fromthe selective pressure of reproduction and escape, respectively(Sinclair et al., 2011). If that is the case, it will be interesting toinvestigate the changes in swimming capacity for caudal-fin-damagedfish, especially changes in fTB, ATB and the metabolic rate (MO2) duringswimming. In addition, changes in fTB, ATB and MO2 during swimmingcaused by decreased fin area may be different in fish with differentswimming capacities and different caudal fin shapes and sizes.
The maximum sustainable swimming speed, or critical swimmingspeed (Ucrit), has long been a widely used parameter for the evaluationof aerobic swimming ability (Plaut, 2001; MacNutt et al., 2004; Liet al., 2010). The maximum oxygen consumption (active oxygenconsumption rate, MO2active) during the Ucrit test was assumed to bethe maximum aerobic metabolic capacity (Alsop and Wood, 1997;Lee et al., 2003; Fu et al., 2011). However, recent studies found that
the locomotion activity alone cannot elicit the maximum metabolicrate in fish species such as the common carp (Dupont-Prinet et al.,2009; Pang et al., 2011; Zhang et al., 2012). Thus, for those fishes,the high respiratory capacity may allow a greater increase in fTB andATB after fin loss. Thus, we hypothesise that fish with differentswimming and respiratory capacities may have different changes inswimming capacity, swimming behaviour (fTB and ATB) and metabolicrates due to caudal fin loss and regeneration.
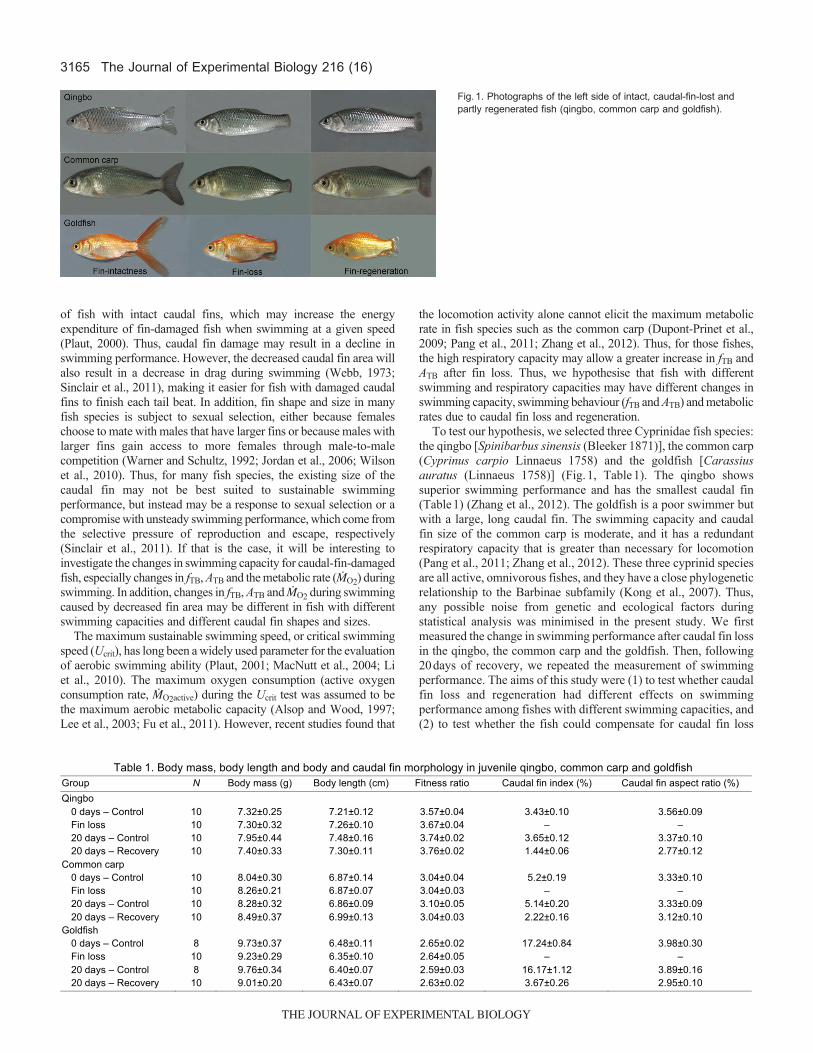
To test our hypothesis, we selected three Cyprinidae fish species:the qingbo [Spinibarbus sinensis (Bleeker 1871)], the common carp(Cyprinus carpio Linnaeus 1758) and the goldfish [Carassiusauratus (Linnaeus 1758)] (Fig.1, Table1). The qingbo showssuperior swimming performance and has the smallest caudal fin(Table1) (Zhang et al., 2012). The goldfish is a poor swimmer butwith a large, long caudal fin. The swimming capacity and caudalfin size of the common carp is moderate, and it has a redundantrespiratory capacity that is greater than necessary for locomotion(Pang et al., 2011; Zhang et al., 2012). These three cyprinid speciesare all active, omnivorous fishes, and they have a close phylogeneticrelationship to the Barbinae subfamily (Kong et al., 2007). Thus,any possible noise from genetic and ecological factors duringstatistical analysis was minimised in the present study. We firstmeasured the change in swimming performance after caudal fin lossin the qingbo, the common carp and the goldfish. Then, following20days of recovery, we repeated the measurement of swimmingperformance. The aims of this study were (1) to test whether caudalfin loss and regeneration had different effects on swimmingperformance among fishes with different swimming capacities, and(2) to test whether the fish could compensate for caudal fin loss
The Journal of Experimental Biology 216 (16)
Table 1. Body mass, body length and body and caudal fin morphology in juvenile qingbo, common carp and goldfish
Group N Body mass (g) Body length (cm) Fitness ratio Caudal fin index (%) Caudal fin aspect ratio (%) Qingbo
0 days – Control 10 7.32±0.25 7.21±0.12 3.57±0.04 3.43±0.10 3.56±0.09 Fin loss 10 7.30±0.32 7.26±0.10 3.67±0.04 – – 20 days – Control 10 7.95±0.44 7.48±0.16 3.74±0.02 3.65±0.12 3.37±0.10 20 days – Recovery 10 7.40±0.33 7.30±0.11 3.76±0.02 1.44±0.06 2.77±0.12
Common carp 0 days – Control 10 8.04±0.30 6.87±0.14 3.04±0.04 5.2±0.19 3.33±0.10 Fin loss 10 8.26±0.21 6.87±0.07 3.04±0.03 – – 20 days – Control 10 8.28±0.32 6.86±0.09 3.10±0.05 5.14±0.20 3.33±0.09 20 days – Recovery 10 8.49±0.37 6.99±0.13 3.04±0.03 2.22±0.16 3.12±0.10
Goldfish 0 days – Control 8 9.73±0.37 6.48±0.11 2.65±0.02 17.24±0.84 3.98±0.30 Fin loss 10 9.23±0.29 6.35±0.10 2.64±0.05 – – 20 days – Control 8 9.76±0.34 6.40±0.07 2.59±0.03 16.17±1.12 3.89±0.16 20 days – Recovery 10 9.01±0.20 6.43±0.07 2.63±0.02 3.67±0.26 2.95±0.10
Fig.1. Photographs of the left side of intact, caudal-fin-lost andpartly regenerated fish (qingbo, common carp and goldfish).
THE JOURNAL OF EXPERIMENTAL BIOLOGY

3166Fin and swimming performance
through kinematics (fTB and ATB) and whether these compensationswere related to swimming capacity and caudal fin size.
MATERIALS AND METHODSExperimental animals and holding
Experimental juvenile qingbo (5–11g, N=100), common carp(6–12g, N=100) and goldfish (6–13g, N=100) were obtained fromlocal farmers and kept in dechlorinated tanks for 1month beforethe experiments were performed (Table1). All of the fish were keptin the same type of tanks (length×width×height, 1.5×0.6×0.5m) andassessed over the same season and time frame. The fish were fedto satiation with a commercial diet once daily at 09:00h. The uneatenfood and faeces were cleared using a siphon 1h after feeding. Thewater temperature was maintained at 25.0±0.5°C, and the wateroxygen content was maintained above 7.0mgl−1. The ammonia-Nranged from 0.005 to 0.025mgl−1. Fish were maintained on a12h:12h light:dark photoperiod cycle.
We declare that the experiments comply with the current lawsof the country in which the experiments were performed.
Experimental protocolAll tests were performed at a water temperature of 25°C. At thebeginning of the experiment, 20 fish of each fish species (18 fish forgoldfish) were chosen from the holding tanks and randomly dividedinto two groups, i.e. half of the fish were placed into the control groups(with no treatment to the caudal fin) and the other half were placedinto the caudal fin treatment groups (caudal fin amputation). For fishin the treatment groups, each individual fish was transferred to a bucketwith 2l of clean and dechlorinated water and was anaesthetised witheugenol (30mgl−1) (Velíšek et al., 2005). Then, both the epaxial andhypaxial caudal fin lobes of the fish in the treatment groups wereamputated with a pair of sharp scissors, ~2mm from the tail muscularpeduncle (Webb, 1973). After amputation, the fish were returned backto the holding tanks and allowed a 48h recovery period before anyexperimental measurement. No fish died during the wholemanipulation process. A pilot experiment revealed that the anaesthesiahad no significant effects on swimming locomotion after 48h ofrecovery (supplementary material FigsS1, S2, TableS1). The fish inthe control group remained in the holding tanks.
After 48h, the swimming performance of fish in both the controland treatment groups was measured. During the 48h, the fish of bothcontrol and treatment groups were kept unfed. The fish wereindividually introduced into a Brett-type swimming tunnelrespirometer (Brett, 1964) and held for 1h at a slow water velocity(~3cms−1) for recovery (Jain et al., 1997). First, we conducted a pilotexperiment to determined the approximate Ucrit and found that therewas no significant difference in Ucrit measured by different initialswimming speed (supplementary material FigsS3, S4, TableS1). Thenthe individual fish were tested in a ramp-Ucrit test for the measurementof Ucrit and MO2 during swimming. The ramp-Ucrit tests involvedincreasing water speed to ~50% of Ucrit over a 5min period, afterwhich water speed was increased by 6cms–1 increments every 20minuntil the fish became exhausted. Simultaneously, the swimmingbehaviour of each individual fish was recorded using a digital camerain video mode (model IXUS 105, Canon, Tokyo, Japan; 30framess−1)positioned above the respirometer to obtain a dorsal view of the fishduring each swimming speed. The videos were used for themeasurement of fTB and ATB. After the Ucrit test, the fish wereindividually anaesthetised with eugenol (30mgl−1) (Velíšek et al.,2005) to measure body mass and length, and then photographs of theright side of each individual fish were taken for morphometricmeasurements of the body and the caudal fin. The starting swimming
speeds of caudal-fin-lost fish during the Ucrit test among the threedifferent species were different from those of caudal-fin-intact fish;thus, both fin-lost and fin-intact fish swam for a similar duration inthe Ucrit test (Fig.3). All the fish were then transferred to their previoustanks and allowed to recover for 20days, i.e. the treatment of 20daysrecovery; the treatment of fin-loss is referred to as 0days forcomparison. The housing conditions for this recovery period werethe same as those in the holding period. Following recovery, themeasurements of Ucrit, MO2, fTB and ATB of the fish of both treatmentand control groups were repeated, following the same procedures asthe first time.
Parameter measurementsMeasurement of Ucrit and swimming MO2
A Brett-type swimming tunnel respirometer (Brett, 1964) was usedto measure Ucrit and MO2 during swimming as a function of swimmingspeed (for details, see Pang et al., 2010). The respirometer wasconstructed from clear plastic poly-methyl-methacrylate. A circulatingwater flow was generated in the tunnel (total volume 3.4l) by an acrylicpropeller attached to a variable speed pump. The speed pump wascontrolled by a variable voltage power source. A digital camera invideo mode was used to calibrate the water velocity from the pumpcontroller by tracking small black agar balls (with a density the sameas water) in current. Then the relationship between water velocityand voltage output could be built to an indicial equation. The watervelocity could be achieved by tuning the voltage output. A honeycombscreen was secured at both ends of the swimming chamber to reduceturbulence and to ensure uniform water velocity across the swimmingchamber. Each individual fish was placed downstream of the propellerin a swimming chamber with a 19.9cm2 cross-sectional area. Thewater temperature in the swimming chamber was controlled to within±0.2°C using a water bath connected to a stainless steel heatexchanger. Ucrit was calculated for each individual fish using Brett’sequation (Brett, 1964):
Ucrit = V + (t / T) ΔV, (1)
where V is the highest speed at which the fish swam during the fulltime period of the experiment (cms−1); ΔV is the velocity increment[approximately 1bodylength (BL)s−1; 6cms−1]; T is the prescribedperiod of swimming per speed (20min); and t is the time that thefish swam at the final speed (min). The criterion for determiningwhether an individual fish failed to swim was when the fish failedto move off the rear honeycomb screen of the swimming chamberfor 20s (Lee et al., 2003).
The O2 concentration was measured continuously throughout theramp-Ucrit test as a function of swimming speed. The respirometercould switch between an open mode and a closed mode to replenishthe oxygen and to measure the MO2, respectively. In the open mode(~2min), the respirometer was supplied with fully aerated andthermo-regulated water. In the closed mode (20min), the tunnel wasisolated from the reservoir tank and the water was recirculated withinthe system. A small volume of water was drawn from the sealedrespirometer by a small pump, forced past a dissolved oxygen probehoused in a sealed temperature-controlled chamber (5ml), and thenreturned to the respirometer. The oxygen concentration (mgl−1) wasrecorded once every 2min. The MO2 (mgkg−1h−1) of each individualfish during swimming was calculated from the depletion of oxygen,according to the equation:
MO2 = 60Sv / m , (2)
where S (mgl−1min−1) is the decrease in the water’s dissolved oxygencontent per minute (slope); v is the total volume of the respirometer
THE JOURNAL OF EXPERIMENTAL BIOLOGY

3167
(3.4l) minus the volume of the fish; and m is the body mass (kg) ofthe fish. The slope was obtained from a linear regression betweentime (min) and the dissolved oxygen content (mgl−1). Only slopeswith an r2>0.95 were considered in the analysis. The maximum MO2during the Ucrit test was defined as the active MO2 (MO2active). Thewater oxygen content in the respirometer was never allowed to fallbelow 85% oxygen saturation by switching between the open andclosed mode of the respirometer (Claireaux et al., 2006).
Measurement of fTB and ATB during swimmingA 10-min video recording was made at each speed at which a fishswam during its MO2 measurements. A 10cm ruler of a similar heightto the fish swimming in the chamber was used to calculate a scalingfactor from each video.
The fTB was calculated from the two-dimensional display of theprogression of the tip of the tail over time by dividing the number ofconsecutive tail beat cycles by the time. Each 2-min video recording(when the fish was positioned in the centre of the chamber and swamsteadily) that was selected from the former 10-min recording for eachswimming speed of each individual fish was used to count the numberof tail beats, which was then transformed into tail beats per minute.One tail beat cycle was defined as the excursion of the tail from oneside of the body to the other and back again. Using the same two-dimensional display, the ATB, the distance between the lateral-mostpositions of the tip of the caudal peduncle during one complete tailbeat cycle and the middle axis of the body, was calculated bymeasuring the distance of each symmetrical tail beat in pixels. Thesevalues were then converted into centimetres by dividing by the scalingfactor (pixelscm−1) calculated prior to digitising. Video segments inwhich the fish was swimming steadily for eight tail beats and waspositioned in the centre of the chamber, away from the walls and thebottom of the chamber, were selected for ATB analysis. Five pointsalong the dorsal midline of each fish that could be identifiedconsistently were digitised in sequential video fields for eight tail beatsat each speed: the tip of the snout, the points along the dorsal midlinebetween both the anterior and the posterior insertion points of theeyes, the midpoint between the anterior insertions of the pectoral fins,and the tip of caudal peduncle (Donley and Dickson, 2000). The ATB
(cm) was transformed into a percentage of the fish body length (%BL)to reduce the influence of body length (Donley and Dickson, 2000;Dickson et al., 2002).
Measurement of morphologyGeometric morphometric methods were used to quantify the bodyand caudal fin shapes. Photographs of the right side of each fish,viewed together with a ruler, were taken with a digital camera andthen analysed with tps software (http://life.bio.sunysb.edu/morph).We measured body length, body height, caudal fin area and caudalfin height, and calculated the values of the following morphologicaltraits: (1) fitness ratio (FR)=body length/body height; (2) caudal finaspect ratio (AR)=caudal fin height2/caudal fin area; and (3) caudalfin index (FI)=caudal fin area/body length2.
Data handling and analysisStatistics17 (SPSS, Chicago, IL, USA) was used for data analysis.All values are presented as means ± s.e.m., and P<0.05 was usedas the level of statistical significance. The effects of species, caudalfin treatment and recovery period on Ucrit, MO2active, fTBmax andATBmax were determined using a mixed-model three-way ANOVAin three fish species. The effects of swimming speed and caudalfin treatment on swimming MO2, fTB and ATB were determinedusing a one-way analysis of covariance (ANCOVA), i.e. weperformed a regression for each treatment group and then madea comparison of their coefficients. The ANOVA was followed bya Duncan test or a t-test if it was necessary to determine thedifference of the value of different treatment groups. A t-test wasused to determine the difference between the control and thetreatment groups.
RESULTSEffects of caudal fin loss and regeneration on Ucrit
Species effectSpecies had significant effects on Ucrit (F2,52=72.20, P<0.001;Fig.2A, Table2). The Ucrit of goldfish was significantly lower thanthat of common carp while the latter was significantly lower thanthat of the qingbo in both the control and recovery groups (P<0.05).
The Journal of Experimental Biology 216 (16)
A
cb
a
cba
b*
a*a,b
*
c#
b*#
a*#
010203040506070
Ucr
it (cm
s–1
)
ControlFin treatment
Ba
b ba
b ba
b ba b
* b
0200400600800
1000120014001600
Qingbo Commoncarp
Goldfish Qingbo Commoncarp
Goldfish
0 days 20 days recovery
M· O2a
ctiv
e (m
g O
2 kg–1
h–1
)
Fig.2. Critical swimming speed (Ucrit) (A) and active metabolic rate(MO2active) (B) of control (open bars) and treatment (filled bars; caudal-fin-lost fish at 0days and caudal-fin-regenerated fish at 20daysrecovery) groups of juvenile qingbo, common carp and goldfish.Different lowercase letters indicate statistically significant differencesbetween fish species in both control and treatment groups. *Significantdifference in variables between control and treatment groups.#Significant difference in variables between 0days and 20days(recovery) groups (P<0.05). Data are means ± s.e.m.
THE JOURNAL OF EXPERIMENTAL BIOLOGY

3168Fin and swimming performance
Treatment effectCaudal fin treatment also had significant effects on Ucrit (caudal finloss, F1,52=345.85, P<0.001; Fig.2A, Table2). The qingbo, thecommon carp and the goldfish showed a significantly different 49,32 and 35% decrease in Ucrit, respectively, following caudal fin loss(interaction effect: F2,52=23.85, P<0.001).
Recovery effectAfter 20days of recovery, the caudal fin index of caudal-fin-regenerated fish recovered to 41, 47 and 24% of those of the controlgroup for the qingbo, the common carp and the goldfish,respectively (Fig.1, Table1). The Ucrit of the caudal-fin-regenerated qingbo, common carp and goldfish was significantlyincreased (F1,52=206.90, P<0.001) and recovered to 86, 91 and95% of those of the control group, respectively (interaction effect:F1,52=196.25, P<0.001), and there was no significant differencein Ucrit between goldfish in the caudal-fin-regenerated and thecontrol group (P=0.16).
Effects of caudal fin loss and regeneration on MO2 duringswimming
Among fish in the 0days groups, MO2 increased significantly withan increase in the swimming speed for all experimental groups(P<0.001), but it increased more sharply in the treatment groupsfor all three fish species compared with those of the control groupswithin each species (P<0.05; Fig.3A,C,E, Table3).
After 20days of recovery, there was no significant differencebetween the MO2–speed curves of the caudal-fin-regenerated andthe control groups in all three species (Fig.3B,D,F).
Effects of caudal fin loss and regeneration on MO2activeSpecies effect
Species had a significant effect on MO2active (F2,52=37.23, P<0.001;Fig. 2B, Table 2). The MO2active values of the qingbo weresignificantly higher than those of the common carp and the goldfishin both the control and the recovery groups (P<0.05; Fig.2B).
Treatment effectTreatment had no effect on MO2active (F1,52=0.00, P=0.990; Fig.2B,Table 2). However, the MO2active of the common carp increasedsignificantly after caudal fin loss in the control group by t-test(P=0.027).
Recovery effectRecovery had no effect on MO2active (F1,52=0.00, P=0.994; Fig. 2B,Table 2).
Effects of caudal fin loss and regeneration on fTB duringswimming
The fTB increased significantly with an increase in the swimmingspeed for all experimental groups, but it increased more sharply inthe treatment groups for all three fish species compared with thoseof the control group within each species (P<0.05; Table3, Fig.4A,Fig.5A, Fig.6A). After 20days of recovery, only caudal-fin-regenerated goldfish showed a sharper curve compared with thoseof the control group (Fig.4C, Fig.5C, Fig.6C).
Effects of caudal fin loss and regeneration on fTBmaxSpecies effect
Species had significant effects on fTBmax (F2,52=71.58, P<0.001;Fig.7A, Table2). The fTBmax values of the qingbo were significantlyhigher than those of both the common carp and the goldfish in boththe control and recovery groups (P<0.001).
Treatment effectThe fTBmax of the common carp (P=0.001) and the goldfish (P=0.013)increased significantly by 13 and 11%, respectively, after caudalfin loss, while there was no significant difference in the qingbo(interaction effect: F1,52=5.12, P<0.010).
Recovery effectAfter 20days of recovery, the fTBmax of common carp decreasedsignificantly (P<0.001). Thus, there was no significant differencebetween caudal-fin-regenerated and control groups in the commoncarp (P=0.36) while the caudal-fin-regenerated goldfish still showeda significantly higher fTBmax than that of the control fish (P=0.014;Fig.7A).
Effects of caudal fin loss and regeneration on ATB duringswimming
The ATB increased significantly with increased swimming speedsfor all experimental groups, but it increased more sharply in thetreatment groups in all three fish species compared with those ofthe control group within each species (P<0.001; Table3, Fig.4B,Fig.5B, Fig.6B). There was no significant difference in slope of
Table 2. The effect of species (between-subject factor), caudal fin amputation (between-subject factor) and 20 days recovery (within-subject factor) on swimming parameters, based on a mixed-model three-way ANOVA
d.f. Ucrit MO2active fTBmax ATBmax
Species effect (S) 2 F=72.20 P<0.001*
F=37.23 P<0.001*
F=71.58 P<0.001*
F=125.02 P<0.001*
Treatment effect (T) 1 F=345.85 P<0.001*
F=0.00 P=0.990
F=0.03 P=0.862
F=27.19 P<0.001*
Recovery effect (R) 1 F=206.90 P<0.001*
F=0.00 P=0.994
F=14.95 P<0.001*
F=63.13 P<0.001*
S T 2 F=23.85 P<0.001*
F=0.98 P=0.391
F=5.12 P=0.010*
F=0.13 P=0.883
S R 2 F=9.37 P<0.001*
F=0.222 P=0.804
F=10.24 P<0.001*
F=0.94 P=0.398
T R 1 F=196.25 P<0.001*
F=3.21 P=0.079
F=2.47 P=0.123
F=37.89 P<0.001*
S T R 2 F=3.79 P=0.029*
F=0.60 P=0.553
F=1.84 P=0.169
F=3.82 P=0.029*
*Significantly different (P<0.05).
THE JOURNAL OF EXPERIMENTAL BIOLOGY

3169
ATB–swimming speed curve between control and fin-regeneratedfish. However, both qingbo and common carp still showedsignificantly higher ATB than those of the control groups due to thesignificantly higher intercept (P<0.05), while there was nosignificant difference between the caudal-fin-regenerated and controlgroups in goldfish.
Effects of caudal fin loss and regeneration on ATBmaxSpecies effect
Species had significant effects on ATBmax (F2,52=125.02, P<0.001;Fig.7B, Table2). The ATBmax of the qingbo was significantly lowerthan those of the common carp and the goldfish in both the controland recovery groups (P<0.001).
Treatment effectCaudal fin treatment had significant effects on the ATBmax(F1,52=27.19, P<0.001; Fig.7B, Table2). Among the control groups,the ATBmax values of the qingbo, the common carp and the goldfishincreased significantly by 16, 25 and 17%, respectively, after caudalfin loss (P<0.001).
Recovery effectAfter 20days of recovery, the ATBmax of all three fish speciesdecreased significantly (F1,52=63.13, P<0.001; Fig.7B, Table2).
Only caudal-fin-regenerated qingbo showed a significantly higherATBmax than the control groups (P=0.011; Fig.7B) while the ATBmaxof both the caudal-fin-regenerated common carp (P=0.69) and thecaudal-fin-regenerated goldfish (P=0.91) did not change comparedwith those of the control groups.
DISCUSSIONThe present study aimed to investigate the effects of caudal fin lossand regeneration on swimming locomotive performance in juvenilesof three cyprinid fish with different swimming capacities,morphologies and metabolic capacities. We found that caudal finloss had pronounced negative effects on swimming performance,but the effects were different among different fish species. To copewith the decline in the effective area for thrust following caudal finloss, all three fish species showed significant increases in ATBmax,fTBmax and/or MO2active. After 20days of recovery, the caudal fins ofthe fish in the treatment groups recovered to approximately 20–40%while Ucrit values recovered to 86–95%. We found that a strongswimmer may maintain swimming speed primarily by maintaininga greater fTBmax and a smaller ATBmax, for which the caudal fin playsa more important role during swimming than for a poor swimmer.Another interesting finding was the asymmetry of recovery betweencaudal fin and swimming performance, which suggested that thesethree fish species may not have the best equipped caudal fin size
The Journal of Experimental Biology 216 (16)
A
C: y=(0.030±0.002)x+(5.248±0.068)N=74, R2=0.815, P<0.001
F: y=(0.057±0.004)x+(5.298±0.081)N=53, R2=0.788, P<0.001
4
4.5
5
5.5
6
6.5
7
7.5
8
0 10 20 30 40 50 60
ControlFin loss
C
C: y=(0.025±0.002)x+(5.464±0.061)N=59, R2=0.778, P<0.001
F : y=(0.044±0.003)x+(5.388±0.033)N=66, R2=0.751, P<0.001
4
4.5
5
5.5
6
6.5
7
7.5
8
0 10 20 30 40 50 60
E
C: y=(0.031±0.002)x+(5.415±0.070)N=42, R2=0.831, P<0.001
F: y=(0.046±0.005)x+(5.399±0.089)N=48, R2=0.690, P<0.001
4
4.5
5
5.5
6
6.5
7
7.5
8
0 10 20 30 40 50 60
B
C: y=(0.030±0.001)x+(5.330±0.057)N=78, R2=0.852, P<0.001
F: y=(0.031±0.001)x+(5.326±0.050)N=77, R2=0.859, P<0.001
4
4.5
5
5.5
6
6.5
7
7.5
8
0 10 20 30 40 50 60
ControlFin regeneration
D
C: y=(0.032±0.002)x+(5.184±0.077)N=57, R2=0.792, P<0.001
F: y=(0.033±0.003)x+(5.133±0.105)N=52, R2=0.646, P<0.001
4
4.5
5
5.5
6
6.5
7
7.5
8
0 10 20 30 40 50 60
FF: y=(0.035±0.002)x+(5.304±0.065)
N=45, R2=0.852, P<0.001
C: y=(0.038±0.002)x+(5.233±0.058)N=42, R2=0.915, P<0.001
4
4.5
5
5.5
6
6.5
7
7.5
8
0 10 20 30 40 50 60
Swimming speed (cm s–1)
ln (M
· O2)
(mg
O2 k
g–1 h
–1)
0 days 20 days recovery Fig.3. Oxygen consumptionrate of control (caudal-fin-intact fish; filled circles) andtreatment (open circles;caudal-fin-lost fish at 0daysand caudal-fin-regeneratedfish at 20days recovery)groups of qingbo (A,B),common carp (C,D) andgoldfish (E,F).
THE JOURNAL OF EXPERIMENTAL BIOLOGY

3170Fin and swimming performance
needed to sustain swimming performance, and some other factors(e.g. sexual selection, escape responses) may also be involved inthe size and shape of the caudal fin.
fTB and ATB as a function of swimming performanceSwimming locomotive performance has attracted much attentionfor a long time because of its importance for survival (Plaut, 2001;Zeng et al., 2009; Kieffer, 2010). It is generally believed that thebody morphology necessary to maximise steady swimmingefficiency involves a streamlined body shape and a high AR (Fisherand Hogan, 2007; Langerhans, 2009). There may be a morphologicalreason that the Ucrit of the qingbo is higher than that of the commoncarp and the goldfish; and while the large, long caudal fin of thegoldfish is less stiff and has a higher drag, it had the lowest Ucrit ofthe three fish species, though it had a high AR.
At sustainable swimming speeds, most fishes utilise body andcaudal fin propulsion to drive them forward. The increasedpropulsion, along with swimming speed, is governed by an increasein fTB and ATB (Anderson and Johnston, 1992; Ellerby, 2010).Bainbridge (Bainbridge, 1958) and Hunter and Zweifel (Hunter andZweifel, 1971) showed that speed during steady swimming isdetermined by fTB and that ATB is essentially constant when fTB isgreater than 5Hz (Fuiman and Batty, 1997); in contrast, previousstudies showed that the chub mackerel (Scomber japonicus) (Gibbet al., 1999; Donley and Dickson, 2000) and cod (Gadus morhua)(Webber et al., 2001) increased their ATB with swimming speedsduring the entire swimming process (including when fTB wasgreater than 5Hz). In the present study, both fTB and ATB in all threefish species showed significant increases with an increase inswimming speed during the entire swimming process. There is a
Table 3. The difference in variable–swimming speed curves between control and fin-loss (or fin-regeneration) groups within each fish species according to the results of one-way ANCOVA
Qingbo Common carp Goldfish 0 days 20 days 0 days 20 days 0 days 20 days
d.f. 1, 127 1, 155 1, 125 1, 109 1, 90 1, 91 MO2 Intercept F=0.230
P=0.633 F=0.004 P=0.948
F=0.678 P=0.412
F=0.155 P=0.695
F=0.018 P=0.893
F=0.645 P=0.424
Slope F=41.79 P<0.001
F=0.376 P=0.541
F=28.98 P<0.001
F=0.089 P=0.766
F=9.47 P=0.003
F=1.074 P=0.303
fTB Intercept F=1.628 P=0.205
F=0.062 P=0.804
F=0.678 P=0.412
F=0.276 P=0.600
F=1.835 P=0.177
F=2.013 P=0.160
Slope F=82.85 P<0.001
F=1.622 P=0.205
F=34.65 P<0.001
F=3.595 P=0.060
F=11.99 P=0.001
F=5.815 P=0.018
ATB Intercept F=28.26 P<0.001
F=3.94 P<0.001
F=30.58 P<0.001
F=9.336 P=0.003
F=18.03 P<0.001
F=2.060 P=0.154
Slope F=67.24 P<0.001
F=0.160 P=0.690
F=14.17 P<0.001
F=0.024 P=0.876
F=19.11 P<0.001
F=0.307 P=0.581
See Figs 3–6 for the regression equations, and hence the intercept and slope coefficient values of each fish group.
A
0
100
200
300
400
500
600
700
800
0 10 20 30 40 50 60
ControlFin loss
C
0
100
200
300
400
500
600
700
800
0 10 20 30 40 50 60
ControlFin regeneration
B
0
5
10
15
20
25
30
0 10 20 30 40 50 60
ControlFin loss
D
0
5
10
15
20
25
30
0 10 20 30 40 50 60
ControlFin regeneration
f TB (n
o. m
in–1
)
Swimming speed (cm s–1)
ATB
(%B
L)
F: y=(12.102±0.577)x+(208.09±11.16)N=44, R2=0.913, P<0.001
F: y=(7.558±0.361)x+(204.81±12.30)N=75, R2=0.857, P<0.001
C: y=(6.898±0.367)x+(209.59±14.93)N=76, R2=0.827, P<0.001
C: y=(6.392±0.283)x+(228.39±11.45)N=73, R2=0.878, P<0.001
F: y=(0.304±.028)x+(7.802±0.543)N=43, R2=0.745, P<0.001
C: y=(0.176±0.008)x+(4.647±0.319)N=73, R2=0.877, P<0.001
F: y=(0.235±0.014)x+(8.258±0.411)N=48, R2=0.867, P<0.001
C: y=(0.238±0.013)x+(6.345±0.470)N=57, R2=0.861, P<0.001
0 days 0 days
20 days recovery20 days recovery
Fig.4. Tail beat frequency (fTB; A,C) and tail beat amplitude (ATB; B,D) of control (caudal-fin-intact fish; filled circles) and treatment (open circles; caudal-fin-lost fish at 0days and caudal-fin-regenerated fish at 20days recovery) groups of qingbo.
THE JOURNAL OF EXPERIMENTAL BIOLOGY

3171
great deal of variability in the present and published data, possiblybecause of the different species and sizes of the fish; for instance,large herring (Clupea harengus) larvae modulated swimming speedwithout making significant changes to their ATB, but the small larvaevaried their ATB with swimming speed, despite the fact that theirfTB values were greater than 5Hz (Fuiman and Batty, 1997).
The qingbo, which is a strong swimmer, showed a higher fTBmaxbut a lower ATBmax than the common carp and the goldfish. Thesedata suggest that strong swimmers may primarily rely on their higherfTBmax to achieve their greater swimming capacity because thelaterally moving portions of their body experience an augmenteddrag (Lighthill, 1971). However, a higher fTBmax will lead to a higherenergy expenditure because fTB has a strong, positive correlationwith MO2 (Herskin and Steffensen, 1998; Lowe, 2001; Steinhausen
et al., 2005); thus, the strong-swimmers (qingbo) have a higherMO2active than the common carp and the goldfish to satisfy the higherenergy expenditure caused by a higher fTBmax. The kawakawa tuna(Euthynnus affinis) had a greater fTB and a lower ATB than the chubmackerel and also had higher energy expenditure (Donley andDickson, 2000). Thus, good swimmers may keep their highswimming capacity at the cost of high energy expenditure becauseof the importance of swimming capacity for those fish.
The effects of caudal fin loss on the swimming performanceof three fish species
The caudal fins are the main transmitters of momentum from themuscles to the water. Without caudal fins, the effective area forthrust is substantially reduced, and the obvious result is a reduction
The Journal of Experimental Biology 216 (16)
0
100
200
300
400
500
600
700
800
0 10 20 30 40 50 60
ControlFin loss
0
100
200
300
400
500
600
700
800
0 10 20 30 40 50 60
ControlFin regeneration
0
5
10
15
20
25
30
0 10 20 30 40 50 60
ControlFin loss
0
5
10
15
20
25
30
0 10 20 30 40 50 60
ControlFin regeneration
A
C
B
D
f TB (n
o. m
in–1
)
Swimming speed (cm s–1)
ATB
(%B
L)
F: y=(11.108±0.553)x+(187.39±11.24)N=61, R2=0.877, P<0.001
C: y=(7.254±0.369)x+(141.75±13.01)N=56, R2=0.877, P<0.001
F: y=(0.321±0.028)x+(11.752±0.569)N=61, R2=0.692, P<0.001
C: y=(0.209±0.013)x+(7.209±0.450)N=52, R2=0.846, P<0.001
F: y=(0.235±0.014)x+(8.258±0.411)N=48, R2=0.867, P<0.001
C: y=(0.238±0.013)x+(6.345±0.470)N=57, R2=0.861, P<0.001
F: y=(7.360±0.399)x+(183.62±11.76)N=62, R2=0.850, P<0.001
C: y=(6.199±0.459)x+(173.19±16.32)N=61, R2=0.758, P<0.001
0 days 0 days
20 days recovery20 days recovery
Fig.5. As Fig.4, but for commoncarp.
0
100
200
300
400
500
600
700
800
0 10 20 30 40 50 60
ControlFin loss
0
100
200
300
400
500
600
700
800
0 10 20 30 40 50 60
ControlFin regeneration
0
5
10
15
20
25
30
0 10 20 30 40 50 60
ControlFin loss
0
5
10
15
20
25
30
0 10 20 30 40 50 60
ControlFin regeneration
A
C
B
D
f TB (n
o. m
in–1
)
Swimming speed (cm s–1)
ATB
(%B
L)
F: y=(11.277±1.052)x+(192.67±20.76)N=45, R2=0.728, P<0.001
F: y=(9.576±0.361)x+(155.41±10.79)N=46, R2=0.941, P<0.001
C: y=(7.660±0.443)x+(159.20±13.78)N=51, R2=0.859, P<0.001
F: y=(0.419±0.030)x+(10.136±0.601)N=45, R2=0.814, P<0.001
C: y=(0.276±0.016)x+(6.799±0.513)N=51, R2=0.854, P<0.001
F: y=(0.278±0.016)x+(7.647±0.501)N=44, R2=0.872, P<0.001
C: y=(0.291±0.015)x+(6.661±0.463)N=38, R2=0.913, P<0.001
C: y=(8.323±0.373)x+(132.89±11.61)N=41, R2=0.927, P<0.001
0 days 0 days
20 days recovery20 days recovery
Fig.6. As Fig.4, but for goldfish.
THE JOURNAL OF EXPERIMENTAL BIOLOGY

3172Fin and swimming performance
in swimming performance (Plaut, 2000). The Ucrit of no-tail orcaudal-fin-lost zebrafish (Danio rerio), Chinese bream (Parabramispekinensis) and sockeye salmon (Oncorhynchus nerka) significantlydecreased by 65% (15.5–6.9BLs−1) (Plaut, 2000), 40%(7.83–4.66BLs−1) (Yang et al., 2013) and 16% (3.02–2.53BLs−1)(Webb, 1973), respectively, compared with those of caudal-fin-intactfish. In the present study, the strong-swimming qingbo also showedthe greatest decrease (49%, 8.26–4.17BLs−1) in Ucrit after caudalfin loss among the three selected fish species. These data suggestedthat the caudal fins of strong-swimming fish played a more importantrole in swimming performance than those of poor-swimming fish.
Animals often take some measures to compensate for a decreasein locomotive capacity because of its importance for survival.Loaded green anoles took off at steeper angles compared withunloaded anoles to compensate for a reduction in take-off speedcaused by loading (Kuo et al., 2011). Bluegill sunfish (Lepomismacrochirus) with partially impaired pectoral fins (35% originalfin area) protracted their pectoral fins significantly more tocompensate for a decrease in deceleration ability during braking(Higham et al., 2005). The caudal-fin-lost Chinese bream showeda higher fTB, ATB and MO2 at higher swimming speed (Yang etal., 2013). In the present study, to cope with a decline inswimming capacity as a consequence of caudal fin loss, threecyprinid fish species all showed swimming behavioural andmetabolic changes. Like the Chinese bream, the fTB, ATB and MO2of the caudal-fin-lost qingbo, common carp and goldfish weresignificantly higher than those of intact fish within each speciesat any given swimming speed. These increases may occur becausethe caudal-fin-lost fish require a thrust similar to that of intactfish at the same swimming speeds. The generation of a similarthrust for caudal-fin-lost fish would require a greater tail beatfrequency, a greater tail beat amplitude and a greater energy inputbecause proportionally more energy is lost in cross-flows aroundthe relatively larger circumference (Webb, 1973).
In addition, all three cyprinid fish showed significant increasesin their ATBmax, which might partly compensate for the substantialdecline in propulsion caused by fin loss, to a certain degree becausean increased body curvature produces a larger thrust and a greaterenergy output (McHenry et al., 1995; Azizi and Landberg, 2002;Porter et al., 2009). However, the improved ATBmax of caudal-fin-lost fish may mainly be caused by a loss of drag as a consequenceof a decreased propeller area (Bainbridge, 1963; Webb, 1973).Moreover, both the common carp and the goldfish showedsignificant increases in their fTBmax, while only the common carpshowed a significant increase in MO2active. It used to be assumedthat the MO2active was the maximum metabolic rate, limited by theoxygen-absorption capacity of the cardio-branchial system.However, recent studies found that, at least for some fish species,such as the common carp and the sea bass (Dicentrarchus labrax),MO2active was not the maximum metabolic rate because fed fishshowed a higher MO2active than that of fasting fish (Thorarensen andFarrell, 2006; Pang et al., 2011). Therefore, the common carpshowed a higher MO2active due to increased energy expenditure as aresult of the swimming behavioural compensation in fTBmax. It isinteresting that the caudal-fin-lost goldfish also showed asignificantly higher fTBmax but an unchanged MO2active compared withthose of intact fish. This result may be due to the large and long,but soft and less effective, caudal fin of the goldfish. The caudalfins in the goldfish were 4.6 and 3.1 times larger than those of theqingbo and the common carp, respectively. Thus, large-long-finnedgoldfish are likely to be more affected by drag forces and, therefore,less efficient swimmers (Plaut, 2000). A substantial decline in dragon the caudal-fin-lost goldfish made it easier to complete each tailbeat. Thus, the caudal-fin-lost goldfish showed significant increasein the fTBmax but not in the MO2active compared with those of intactfish. Furthermore, some other reasons, for example, the possibleincreased Ca2+ handling capacity when facing intensified oxygenand energy demand during swimming after caudal fin loss, may
Aa
b b
a
b ba
bb*
a b*
b*
0
100
200
300
400
500
600
700Control Fin treatment
Bbb
a
bba
b*
b*
a*
b#
b#a
*#
0369
1215182124
Qingbo Commoncarp
Goldfish Qingbo Commoncarp
Goldfish
0 days 20 days recovery
f TB
max
(no.
min
–1)
ATB
max
(%B
L)
#
Fig.7. Maximum tail beat frequency (fTBmax; A) and maximum tailbeat amplitude (ATBmax; B) of control (open bars) and treatment(filled bars; caudal-fin-lost fish at 0days and caudal-fin-regenerated fish at 20days recovery) groups of qingbo, commoncarp and goldfish. Different lowercase letters indicate statisticallysignificant differences between fish species in both control andtreatment groups. *Significant difference in variables betweencontrol and treatment groups. #Significant difference in variablesbetween 0days and 20days (recovery) groups (P<0.05). Data aremeans ± s.e.m.
THE JOURNAL OF EXPERIMENTAL BIOLOGY

3173
also contribute to the increases in ATBmax and fTBmax, as suggestedby a recent study in common carp (Seebacher et al., 2012).
The effects of caudal fin regeneration on the swimmingperformance of three fish species
Caudal fin loss must have a serious negative impact on the growthand survival of fish (Winemiller, 1990). For example, the damagedfins of captive fish are more susceptible to bacterial and fungalinfection (Böckelmann et al., 2010). Fin damage adversely affectsswimming performance, which, in turn, hinders feeding and escapeefficiency (Sinclair et al., 2011; Sazima and Pombal, 1988).Therefore, fish require rapid caudal fin regeneration to decrease allof these negative effects. The epidermis has a fundamental role inthe regenerative process of fish fins (Akimenko et al., 1995;Böckelmann et al., 2010), and this complex process starts only 12hfollowing loss in adult zebrafish (Andreasen et al., 2006). Browndarters (Etheostoma edwini) completely regenerated their finsduring 67days at 21°C (Champagne et al., 2008). After 20days ofrecovery for three fish species, the caudal fin index of the caudal-fin-regenerated fish recovered to 41, 47 and 24% of the caudal-fin-intact fish in the qingbo, the common carp and the goldfish,respectively. The caudal fins of the goldfish regenerated the slowestof the three fish species, which may be due to the larger caudal finarea of intact goldfish. However, it is amazing that the Ucrit of theqingbo, the common carp and the goldfish (which showed nosignificant differences between caudal-regenerated and caudal-intact fish) recovered to 86, 91 and 95% of control groups,respectively. The qingbo and the goldfish still had the swimmingbehavioural compensations of a higher ATBmax and a higher fTBmax,respectively, but it is still difficult to understand the substantialincrease in Ucrit in all three fish species because the caudal finsrecovered to less than 50% of the control groups. Thus, the caudalfin size of the three selected fish species may not be the optimalfin area to sustain swimming. Fin size in many fish species is subjectto sexual selection because fish with larger fins have greater successduring reproduction (Warner and Schultz, 1992; Jordan et al., 2006;Wilson et al., 2010). Furthermore, the stronger unsustainedswimming performance is expected to support a larger caudal fin(Langerhans, 2009). Thus, caudal fin size may be a trade-off betweensustained swimming performance, unsustained swimmingperformance, sexual selection and other factors. In fish with intactcaudal fins, large fins can hinder sustained swimming capacity. Onedisadvantage of long fins is that they can increase the wet surfacearea of the fish, creating more frictional drag and resulting in greaterpower requirements for swimming (Barrett et al., 1999; Plaut, 2000;Sinclair et al., 2011). Thus, both the drag and the thrust decreasedfor the caudal-fin-regenerated fish. If the reduction in thrust wereof a similar order as the reduction in drag, then small areas of caudalfin regeneration could result in a large recovery in Ucrit (Webb,1973). However, caudal-fin-regenerated fish may still have othercompensatory mechanisms. For example, the caudal-fin-regeneratedfish could possibly adapt to caudal fin deficiency, and those fishmay swim with more coordination after 20days of recovery. Theseissues require further research. The other interesting finding wasthat the shapes of the regenerated caudal fins were different fromthose of the intact caudal fins in all three fish species, and the ARsof the regenerated caudal fins were lower than those of the intactcaudal fins. A lower AR was expected to be beneficial to enhancingfast-start swimming performance, which is a rapid, high-energyswimming burst elicited by threatening stimuli and is important forescape from predation (Langerhans, 2009), by improving thecapacity of acceleration (Langerhans and Reznick, 2009). These
results demonstrate that escape from predation may be the mostimportant issue for caudal-fin-lost fish, causing the recovery of fast-start swimming performance to be prioritised.
ACKNOWLEDGEMENTSWe are grateful to H. Yang and X. Pang for their assistance with the experiments.
AUTHOR CONTRIBUTIONSS.-J.F. conceived and designed the experiments. C.F., Z.-D.C. and S.-J.F.performed the experiments. C.F., Z.-D.C. and S.-J.F. analyzed the data. C.F. andS.-J.F. wrote the paper.
COMPETING INTERESTSNo competing interests declared.
FUNDINGThis study was funded by the National Science Foundation of China (NSFC31172096), the Key Project of Science Foundation of Chongqing(cstc2013jjB20003) and the Project of Chongqing Science and TechnologyCommission (CSTC, 2010CA1010) (all to S.-J.F.).
REFERENCESAkimenko, M. A., Johnson, S. L., Westerfield, M. and Ekker, M. (1995). Differential
induction of four msx homeobox genes during fin development and regeneration inzebrafish. Development 121, 347-357.
Alsop, D. H. and Wood, C. M. (1997). The interactive effects of feeding and exerciseon oxygen consumption, swimming performance and protein usage in juvenilerainbow trout (Oncorhynchus mykiss). J. Exp. Biol. 200, 2337-2346.
Anderson, M. E. and Johnston, I. A. (1992). Scaling of power output in fast musclefibres of the Atlantic cod during cyclical contractions. J. Exp. Biol. 170, 143-154.
Andreasen, E. A., Mathew, L. K. and Tanguay, R. L. (2006). Regenerative growth isimpacted by TCDD: gene expression analysis reveals extracellular matrixmodulation. Toxicol. Sci. 92, 254-269.
Azizi, E. and Landberg, T. (2002). Effects of metamorphosis on the aquatic escaperesponse of the two-lined salamander (Eurycea bislineata). J. Exp. Biol. 205, 841-849.
Bainbridge, R. (1958). The speed of swimming of fish as related to size and to thefrequency and the amplitude of the tail beat. J. Exp. Biol. 35, 109-133.
Bainbridge, R. (1963). Caudal fin and body movements in the propulsion of some fish.J. Exp. Biol. 40, 23-56.
Barrett, D. S., Triantafyllou, M. S., Yue, D. K. P., Grosen-baugh, M. A. andWolfgang, M. J. (1999). Drag reduction in fish-like locomotion. J. Fluid Mech. 392,183-212.
Böckelmann, P. K., Ochandio, B. S. and Bechara, I. J. (2010). Histological study ofthe dynamics in epidermis regeneration of the carp tail fin (Cyprinus carpio,Linnaeus, 1758). Braz. J. Biol. 70, 217-223.
Brett, J. R. (1964). The respiratory metabolism and swimming performance of youngsockeye salmon. J. Fish. Res. Board Can. 21, 1183-1226.
Champagne, C. E., Austin, J. D., Jelks, H. L. and Jordan, F. (2008). Effects of finclipping on survival and position-holding behavior of brown darters, Etheostomaedwini. Copeia 2008, 916-919.
Claireaux, G., Couturier, C. and Groison, A. L. (2006). Effect of temperature onmaximum swimming speed and cost of transport in juvenile European sea bass(Dicentrarchus labrax). J. Exp. Biol. 209, 3420-3428.
Dickson, K. A., Donley, J. M., Sepulveda, C. and Bhoopat, L. (2002). Effects oftemperature on sustained swimming performance and swimming kinematics of thechub mackerel Scomber japonicus. J. Exp. Biol. 205, 969-980.
Donley, J. M. and Dickson, K. A. (2000). Swimming kinematics of juvenile kawakawatuna (Euthynnus affinis) and chub mackerel (Scomber japonicus). J. Exp. Biol. 203,3103-3116.
Dupont-Prinet, A., Claireaux, G. and McKenzie, D. J. (2009). Effects of feeding andhypoxia oncardiac performance and gastro-intestinal blood flow during critical speedswimming in the sea bass Dicentrarchus labrax. Comp. Biochem. Physiol. 154A,233-240.
Ellerby, D. J. (2010). How efficient is a fish? J. Exp. Biol. 213, 3765-3767.Fisher, R. and Hogan, J. D. (2007). Morphological predictors of swimming speed: a
case study of pre-settlement juvenile coral reef fishes. J. Exp. Biol. 210, 2436-2443.Fu, S. J., Pang, X., Cao, Z. D., Peng, J. L. and Yan, G. (2011). The effects of fasting
on the metabolic interaction between digestion and locomotion in juvenile southerncatfish (Silurus meridionalis). Comp. Biochem. Physiol. 158, 498-505.
Fu, S. J., Peng, Z. G., Cao, Z. D., Peng, J. L., He, X. K., Xu, D. D. and Zhang, A. J.(2012). Habitat-specific locomotor variation among Chinese hook snout carp(Opsariichthys bidens) along a river. PLoS ONE 7, e40791.
Fuiman, L. and Batty, R. (1997). What a drag it is getting cold: partitioning thephysical and physiological effects of temperature on fish swimming. J. Exp. Biol.200, 1745-1755.
Gibb, A. C., Dickson, K. A. and Lauder, G. V. (1999). Tail kinematics of the chubmackerel Scomber japonicus: testing the homocercal tail model of fish propulsion. J.Exp. Biol. 202, 2433-2447.
Handegard, N. O., Pedersen, G. and Brix, O. (2009). Estimating tail-beat frequencyusing split-beam echosounders. ICES J. Mar. Sci. 66, 1252-1258.
The Journal of Experimental Biology 216 (16)
THE JOURNAL OF EXPERIMENTAL BIOLOGY

3174Fin and swimming performance
Herskin, J. and Steffensen, J. F. (1998). Energy saving in sea bass swimming in aschool: measurements of tail beat frequency and oxygen consumption at differentswimming speeds. J. Fish Biol. 53, 366-376.
Higham, T. E., Malas, B., Jayne, B. C. and Lauder, G. V. (2005). Constraints onstarting and stopping: behavior compensates for reduced pectoral fin area duringbraking of the bluegill sunfish Lepomis macrochirus. J. Exp. Biol. 208, 4735-4746.
Hunter, J. R. (1972). Swimming and feeding behavior of larval anchovy, Engraulismordax. Fish Bull. 70, 821-838.
Hunter, J. R. and Zweifel, J. R. (1971). Swimming speed, tail beat frequency, tail beatamplitude and size in jack mackerel, Trachurus symmetricus and other fishes. FishBull. 69, 253-266.
Jain, K. E., Hamilton, J. C. and Farrell, A. P. (1997). Use of ramp velocity test tomeasure critical swimming speed in Rainbow trout (Oncorhynchus mykiss). Comp.Biochem. Physiol. 117A, 441-444.
Jordan, R., Howe, D., Knight, T. and Gould, J. (2006). Female choice linked to maledorsal fin height in a short fin molly. J. Ethol. 24, 301-304.
Kieffer, J. D. (2010). Perspective – exercise in fish: 50+ years and going strong.Comp. Biochem. Physiol. 156, 163-168.
Kong, X. H., Wang, X. Z., Gan, X. N., Li, J. B. and He, S. P. (2007). Phylogeneticrelationships of Cyprinidae (Teleostei: Cypriniformes) inferred from the partial S6K1gene sequences and implication of indel sites in intron 1. Sci. China C Life Sci. 50,780-788.
Kuo, C. Y., Gillis, G. B. and Irschick, D. J. (2011). Loading effects on jumpperformance in green anole lizards, Anolis carolinensis. J. Exp. Biol. 214, 2073-2079.
Langerhans, R. B. (2009). Morphology, performance, fitness: functional insight into apost-Pleistocene radiation of mosquitofish. Biol. Lett. 5, 488-491.
Langerhans, R. B. and Reznick, D. N. (2009). Ecology and evolution of swimmingperformance in fishes: predicting evolution with biomechanics. Fish Locomotion 200-248.
Lauder, G. V. (2000). Function of the caudal fin during locomotion in fishes:kinematics, flow visualization, and evolutionary patterns. Am. Zool. 40, 101-122.
Lee, C. G., Farrell, A. P., Lotto, A., MacNutt, M. J., Hinch, S. G. and Healey, M. C.(2003). The effect of temperature on swimming performance and oxygenconsumption in adult sockeye (Oncorhynchus nerka) and coho (O. kisutch) salmonstocks. J. Exp. Biol. 206, 3239-3251.
Li, X. M., Cao, Z. D., Peng, J. L. and Fu, S. J. (2010). The effect of exercise trainingon the metabolic interaction between digestion and locomotion in juvenile darkbarbelcatfish (Peltebagrus vachelli). Comp. Biochem. Physiol. 156, 67-73.
Lighthill, M. J. (1971). Large-amplitude elongated-body theory of fish locomotion.Proc. R. Soc. B 179, 125-138.
Lowe, C. G. (2001). Metabolic rates of juvenile scalloped hammer-head sharks(Sphyrna lewini). Mar. Biol. 139, 447-453.
MacNutt, M. J., Hinch, S. G., Farrell, A. P. and Topp, S. (2004). The effect oftemperature and acclimation period on repeat swimming performance in cutthroattrout. J. Fish Biol. 65, 342-353.
McHenry, M. J., Pell, C. A. and Long, J. H., Jr (1995). Mechanical control ofswimming speed: stiffness and axial wave form in undulating fish models. J. Exp.Biol. 198, 2293-2305.
Motani, R. (2002). Scaling effects in caudal fin propulsion and the speed ofichthyosaurs. Nature 415, 309-312.
Pang, X., Cao, Z. D., Peng, J. L. and Fu, S. J. (2010). The effects of feeding on theswimming performance and metabolic response of juvenile southern catfish, Silurusmeridionalis, acclimated at different temperatures. Comp. Biochem. Physiol. 155,253-258.
Pang, X., Cao, Z. D. and Fu, S. J. (2011). The effects of temperature on metabolicinteraction between digestion and locomotion in juveniles of three cyprinid fish
(Carassius auratus, Cyprinus carpio and Spinibarbus sinensis). Comp. Biochem.Physiol. 159, 253-260.
Plaut, I. (2000). Effects of fin size on swimming performance, swimming behaviour androutine activity of zebrafish Danio rerio. J. Exp. Biol. 203, 813-820.
Plaut, I. (2001). Critical swimming speed: its ecological relevance. Comp. Biochem.Physiol. 131, 41-50.
Porter, M. E., Roque, C. M. and Long, J. H., Jr (2009). Turning maneuvers in sharks:predicting body curvature from axial morphology. J. Morphol. 270, 954-965.
Sazima, I. and J. P. Pombal, Jr, J. P. (1988). Fin-clipping by the piranha,Serrasalmus spilopleura, on the Brazilian eartheater, Geophagus brasiliensis. Rev.Bras. BioI. 48, 477-483.
Seebacher, F., Pollard, S. R. and James, R. S. (2012). How well do musclebiomechanics predict whole-animal locomotor performance? The role of Ca2+
handling. J. Exp. Biol. 215, 1847-1853.Sinclair, E. L. E., Ward, A. J. W. and Seebacher, F. (2011). Aggression-induced fin
damage modulates trade-offs in burst and endurance swimming performance ofmosquitofish. J. Zool. 283, 243-248.
Steinhausen, M. F., Steffensen, J. F. and Andersen, N. G. (2005). Tail beatfrequency as a predictor of swimming speed and oxygen consumption of saithe(Pollachius virens) and whiting (Merlangius merlangus) during forced swimming.Mar. Biol. 148, 197-204.
Thorarensen, H. and Farrell, A. P. (2006). Postprandial intestinal blood flow,metabolic rates, and exercise in Chinook salmon (Oncorhynchus tshawytscha).Physiol. Biochem. Zool. 79, 688-694.
Velíšek, J., Svobodova, Z. and Piackova, V. (2005). Effect of clove oil anaesthesiaon rainbow trout (Oncorhynchus mykiss). Acta Vet. 74, 139-146.
Warner, R. R. and Schultz, E. T. (1992). Sexual selection and male characteristics inthe bluehead wrasse, Thalassoma bifasciatum: mating site acquisition, mating sitedefense, and female choice. Evolution 46, 1421-1442.
Webb, P. W. (1973). Effects of partial caudal-fin amputation on the kinematics andmetabolic rate of underyearling sockeye salmon (Oncorhynchus nerka) at steadyswimming speeds. J. Exp. Biol. 59, 565-582.
Webb, P. W. (1977). Effects of median-fin amputation on fast-start performance ofrainbow trout (Salmo gairdneri). J. Exp. Biol. 68, 123-135.
Webber, D. M., Boutilier, R. G., Kerr, S. R. and Smale, M. J. (2001). Caudaldifferential pressure as a predictor of swimming speed of cod (Gadus morhua). J.Exp. Biol. 204, 3561-3570.
Wilson, R. S., Condon, C. H., David, G., Fitzgibbon, S., Niehaus, A. C. and Pratt,K. (2010). Females prefer athletes, males fear the disadvantaged: different signalsused in female choice and male competition have varied consequences. Proc. Biol.Sci. 277, 1923-1928.
Winemiller, K. O. (1990). Caudal eyespots as deterrents against fin predation in theneoptropical cichlid Astronotus ocellatus. Copeia 1990, 665-673.
Yang, H., Cao, Z. D. and Fu, S. J. (2013). Effect of caudal amputation on swimmingcapacity, energy expenditure and behavior in juvenile Chinese bream, Parabramispekinensis. Acta Hydrobiol. Sinica 37, 157-163.
Zeng, L. Q., Cao, Z. D., Fu, S. J., Peng, J. L. and Wang, Y. X. (2009). Effect oftemperature on swimming performance in juvenile southern catfish (Silurusmeridionalis). Comp. Biochem. Physiol. 153, 125-130.
Zhang, W., Cao, Z. D. and Fu, S. J. (2012). The effects of dissolved oxygen levels onthe metabolic interaction between digestion and locomotion in cyprinid fishes withdifferent locomotive and digestive performances. J. Comp. Physiol. 182, 641-650.
Ziskowski, J., Mercaldo-Allen, R., Pereira, J. J., Kuropat, C. and Goldberg, R.(2008). The effects of fin rot disease and sampling method on blood chemistry andhematocrit measurements of winter flounder, Pseudopleuronectes americanus fromNew Haven Harbor (1987–1990). Mar. Pollut. Bull. 56, 740-750.
THE JOURNAL OF EXPERIMENTAL BIOLOGY

Ln(M
O2)
(mgo
2kg-1
h-1)
QingboA: y = (0.034 ± 0.002)x + (5.120 ± 0.083)
N = 55, R2 = 0.854, p < 0.001
C: y = (0.038 ± 0.002)x + (4.905 ± 0.078)N = 55, R2 = 0.892, p < 0.001
44.5
55.5
66.5
77.5
8
20 30 40 50 60
ControlAnesthesia
Common carp
A: y = (0.033 ± 0.004)x + (5.143 ± 0.140)N = 41, R2 = 0.674, p < 0.001
C: y = (0.037 ± 0.003)x + (4.982 ± 0.100)N = 42, R2 = 0.834, p < 0.001
44.5
55.5
66.5
77.5
8
20 30 40 50 60
AnesthesiaControl
GoldfishC: y = (0.042 ± 0.004)x + (5.006 ± 0.131)
N = 35, R2 = 0.797, p < 0.001
A: y = (0.046 ± 0.006)x + (4.837 ± 0.207)N = 35, R2 = 0.649, p < 0.001
44.5
55.5
66.5
77.5
8
20 30 40 50 60
ControlAnesthesia
Fig. S1. The oxygen consumption rate of fish in anesthesia (filled circle ●;) and
control (open circle ○) groups of qingbo, common carp and goldfish.
Swimming speed (cm s-1)

010203040506070
Qingbo Common carp Goldfish
Ucr
it (c
m s
-1)
ControlAnesthesia
0200400600800
100012001400
Qingbo Common carp Goldfish
MO
2act
ive (
mgO
2kg-1
h-1)
ControlAnesthesia
Fig. S2. The critical swimming speed and max metabolic rate of fish in control (open bars □) and anesthesia (filled bars ■) groups of qingbo, common carp and goldfish.

Ln(M
O2)
(mgo
2kg-1
h-1)
Qingbo
24: y = (0.038 ± 0.002)x + (4.905 ± 0.078)N = 55, R2 = 0.892, p < 0.001
6: y = (0.042 ± 0.001)x + (4.715 ± 0.049)N = 78, R2 = 0.8923, p < 0.001
44.5
55.5
66.5
77.5
8
0 10 20 30 40 50 60
6-Start24-Start
Common carp
6: y = (0.034 ± 0.002)x + (5.116 ± 0.065)N = 67, R2 = 0.807, p < 0.001
24: y = (0.037 ± 0.003)x + (4.982 ± 0.100)N = 42, R2 = 0.834, p < 0.001
44.5
55.5
66.5
77.5
8
0 10 20 30 40 50 60
6-Start24-Start
Goldfish
6: y = (0.046 ± 0.003)x + (4.817 ± 0.089) N = 60, R2 = 0.793, p < 0.001
24: y = (0.042 ± 0.004)x + (5.006 ± 0.131)N = 35, R2 = 0.797, p < 0.001
44.5
55.5
66.5
77.5
8
0 10 20 30 40 50 60
6-Start24-Start
Fig. S3. The oxygen consumption rate of fish which start swimming at 24 cm s-1(filled
circle ●;) and 6 cm s-1 (open circle ○) of qingbo, common carp and goldfish.
Swimming speed (cm s-1)

0
10
20
30
40
50
60
70
Qingbo Common carp Goldfish
Ucr
it (c
m s
-1)
6-Start24-Start
0200400600800
1000120014001600
Qingbo Common carp Goldfish
MO
2act
ive (m
gO2 k
g-1h-1
)
6-Start24-Start
Fig. S4. The critical swimming speed and max metabolic rate of fish which start
swimming at 6 cm s-1(open bars □) and 24 cm s-1 (filled bars ■) of qingbo, common
carp and goldfish.


Table. S1 The effect of initial speed and anaesthesia on Ucrit and MO2active.
Initial speed effect Anaesthesia effect Ucrit MO2active Ucrit MO2active
Qingbo F=0.308 F=0.950 F=0.308 F=0.938 p=0.587 p=0.346 p=0.587 p=0.338
Common carp F=0.068 F=0.032 F=0.068 F=0.143 p=0.798 p=0.861 p=0.798 p=0.711
Goldfish F=1.022 F=2.079 F=0.485 F=2.828 p=0.329 p=0.171 p=0.497 p=0.115