
republic of rwanda northern province gicumbi district - Agenda ...
202
Water Resources Management Plan for the Water Sources and Mwange River Watershed in Gicumbi District Prepared by Best Associated Consultants REPUBLIC OF RWANDA NORTHERN PROVINCE GICUMBI DISTRICT September 2018 Financed by
-
Upload
khangminh22 -
Category
Documents
-
view
3 -
download
0
Transcript of republic of rwanda northern province gicumbi district - Agenda ...
Water Resources Management Plan for
the Water Sources and Mwange River
Watershed in Gicumbi District
Interim Report
Prepared by
Best Associated Consultants
REPUBLIC OF RWANDA
NORTHERN PROVINCE GICUMBI DISTRICT
September 2018
Financed by

ii
Final Report
iii
Table of Contents
List of Tables .......................................................................................................................................... vi
List of Figures ........................................................................................................................................ vii
Glossary ............................................................................................................................................... viii
1. Introduction .......................................................................................................................................... 1
1.1 Background of the project ............................................................................................................. 1
1.2Objectives of the assignment .......................................................................................................... 2
1.2.1 General objective .................................................................................................................... 2
1.2.2 Major phases and tasks ........................................................................................................... 2
1.2.3 Scope of the assignment ......................................................................................................... 3
2. Study Area ........................................................................................................................................... 4
2.1 Administrative entities in the study area .................................................................................. 4
2.2. Topography of the study area ................................................................................................... 5
2.3. Climate of the study area ......................................................................................................... 6
2.4. Land Use/Land Cover of the study area ................................................................................... 8
2.5. Groundwater potential of the study area .................................................................................. 9
2.6. Socio-economic characteristics of the study area .................................................................. 10
3. Methodology ................................................................................................................................. 12
3.1. Field visits .............................................................................................................................. 12
3.2. Literature Review/Desk study ................................................................................................ 12
3.3. Focus group discussions and Interviews ................................................................................ 13
3.4. Flow measurements ............................................................................................................... 15
3.4.1. Estimating spring flow ................................................................................................... 15
3.4.2. Estimation of the river and stream flow ......................................................................... 15
3.5. Recharge watershed mapping ................................................................................................ 16
3.6. Recharge catchment management plan .................................................................................. 17
3.6.1. Soil resilience units ........................................................................................................ 18
3.6.2. Management measures ................................................................................................... 19
3.6.3. Spring sources immediate catchment technical management measures ........................ 20
3.7. Water quality sampling and analysis ..................................................................................... 21
3.8. Estimation of water demand based on actual use data ........................................................... 21
3.9. Estimation of water Demand in 25 years to come (2018-2043) ............................................ 22
4. Institutional and legal framework for the management of water resources in Gicumbi District .. 23
4.1. Institutional structure for water resources management ........................................................ 23
4.1.1. Institutions at National level .......................................................................................... 23
4.1.2. Institutions at District level ............................................................................................ 25

iv
4.1.3. Water user associations/User level................................................................................. 26
4.2. Legal framework for water resources management ............................................................... 26
4.2.1. Review of Policies ............................................................................................................... 27
4.2.2. Review of Laws and regulations .................................................................................... 29
4.3 Protection of the water resources (springs) at the district level .................................................. 30
5. Spring sources characterization ..................................................................................................... 31
5.1. Spring sources location .......................................................................................................... 31
5.2. Surface and recharge watersheds in Gicumbi District ........................................................... 32
5.3. Recharge catchment management plan .................................................................................. 35
5.3.1. Spring recharge catchment 1 ............................................................................................... 36
5.3.2. Spring recharge catchment 2 .......................................................................................... 37
5.3.3. Spring recharge catchment 3 .......................................................................................... 38
5.3.4. Spring recharge catchment 4 .......................................................................................... 40
5.3.5. Spring recharge catchment 5 .......................................................................................... 41
5.3.6. Spring recharge catchment 6 .......................................................................................... 42
5.3.7. Spring recharge catchment 7 .......................................................................................... 44
6. Hydrology ..................................................................................................................................... 46
6.1. Physical description of the Mwange River catchment ........................................................... 46
6.2. Climate of the Mwange River catchment............................................................................... 47
6.2.1. Daily Rainfall of the Mwange River catchment .................................................................. 48
6.2.2. Daily Temperature of the Mwange River catchment ..................................................... 50
6.2.3. Daily Evapotranspiration of the Mwange River catchment ........................................... 51
6.3. Existing flow data .................................................................................................................. 52
6.4. Infiltration estimation ............................................................................................................. 53
7. Water demand and balance estimation .......................................................................................... 55
7.1. Available water sources ......................................................................................................... 55
7.2. Estimation on water demand .................................................................................................. 56
7.2.1. Consumption rate of National Master Plans ........................................................................ 56
7.2.2. Water demand scenarios ...................................................................................................... 57
7.2.3. Other consumptive demand ................................................................................................. 57
7.3. Water demand and balance in Gicumbi District .................................................................... 59
8. Water quality analysis ................................................................................................................... 62
8.1. Interpretation of results .......................................................................................................... 68
8.1.1. Hydrogen potential (pH) ..................................................................................................... 68
8.1.2. Turbidity ........................................................................................................................ 70
8.1.3. Iron (Fe) ......................................................................................................................... 72
v
8.1.4. Manganese (Mn) ............................................................................................................ 74
8.1.5. Total Nitrogen (TN) ....................................................................................................... 76
8.1.6. Total Phosphorus (TP) ................................................................................................... 78
8.1.7. Total Coliform (Tot Col) ................................................................................................ 80
9. Strategic management plan for selected springs and their recharge catchment in Gicumbi District
83
9.1. Proposed institutional framework for the management of water sources .............................. 83
9.2. Required activities and their estimated costs ......................................................................... 86
9.2.1. Spring sources activities and their budget ........................................................................... 86
9.2.2. Recharge cahcment management measures budget ..................................................... 101
10. Conclusions and recommendations ............................................................................................. 103
11. References ................................................................................................................................... 106
12. Appendix ..................................................................................................................................... 107
Appendix 1. Estimated water demand per sector ............................................................................ 107
Appendix 2. Type of industry and water demand’s standard used .................................................. 108
Appendix 3. Characterization of potable water sources and watersheds ......................................... 109
Appendix 4. Gicumbi Springs and their discharges ........................................................................ 183

vi
List of Tables
Table 1: Data need and application. ....................................................................................................... 17
Table 2: Land resilience unit’s matrix ................................................................................................... 18
Table 3: Land resilience unit’s matrix ................................................................................................... 19
Table 4: Recharge catchment management measures. ........................................................................... 19
Table 5: Immediate spring catchment management measures ............................................................... 20
Table 6: Gicumbi District Surface Catchment List. ............................................................................... 33
Table 7: Descriptive summary of the spring recharge catchments in the study area. ............................ 35
Table 8: Number of springs and total discharge in dry season per sector .............................................. 55
Table 9: Projected standard for water consumption per capita in Gicumbi District. ............................. 56
Table 10: Estimated population per sector. ............................................................................................ 56
Table 11: Water demand per cattle. ....................................................................................................... 57
Table 12: Water quality analysis. ........................................................................................................... 63
Table 13: Priority, Activities and Budget for identified spring sources protection. .............................. 87
Table 14: Spring recharge catchment management measures estimated budget. ................................ 101
vii
List of Figures
Figure 1: Administrative location of Gicumbi District. ........................................................................... 4
Figure 2: Administrative entities in Gicumbi District.............................................................................. 5
Figure 3: Topographical illustration of Gicumbi District. ....................................................................... 6
Figure 4: Climatology of Gicumbi District. ............................................................................................. 7
Figure 5: Land Use/Land Cover of Gicumbi District. ............................................................................. 8
Figure 6: Aquifer in Gicumbi District. ................................................................................................... 10
Figure 7: Mechanical current meter methods......................................................................................... 16
Figure 8: Delineation of the recharge spring sources watersheds. ......................................................... 17
Figure 9: Location of studied spring sources in Gicumbi District. ........................................................ 31
Figure 10: Gicumbi District surface water catchment. .......................................................................... 32
Figure 11: Spring Sources Recharge catchments in Gicumbi District. .................................................. 34
Figure 12: Recharge catchment 1 management plan. ............................................................................ 36
Figure 13: Recharge catchment 2 management plan. ............................................................................ 38
Figure 14: Recharge catchment 3 management plan. ............................................................................ 39
Figure 15: Recharge catchment 4 management plan. ............................................................................ 40
Figure 16: Recharge catchment 5 management plan. ............................................................................ 42
Figure 17: Recharge catchment 6 management plan. ............................................................................ 43
Figure 18: Recharge catchment 7 management plan. ............................................................................ 44
Figure 19: Physical characteristics of the Mwange River catchment. ................................................... 47
Figure 20: Climate of Mwange River catchment. .................................................................................. 48
Figure 21: Daily rainfall pattern............................................................................................................. 49
Figure 22: Monthly rainfall. ................................................................................................................... 49
Figure 23: Daily temperature. ................................................................................................................ 50
Figure 24: Monthly Temperature. .......................................................................................................... 50
Figure 25: Daily evapotranspiration. ..................................................................................................... 51
Figure 26: Monthly evapotranspiration of Gicumbi. ............................................................................. 51
Figure 27: Mwange River Daily Flow. .................................................................................................. 52
Figure 28: Saturated Hydraulic Conductivity and lithology maps. ........................................................ 53
Figure 29: Water demand for Gicumbi District per sector estimation (A) conservation water consumption
rate scenario; (B) scenario based on National Water Master Plan consumption rate .......................... 59
Figure 30: Deficit vs Surplus of water in Gicumbi District (A) conservation water consumption rate
scenario; (B) scenario based on National Water Master Plan consumption rate ........................... 61
Figure 31: Frequency histogram and normal curve for soil pH in Rwanda ........................................... 68
Figure 32: pH map ................................................................................................................................. 70
Figure 33: Turbidity map ....................................................................................................................... 72
Figure 34: Fe map .................................................................................................................................. 74
Figure 35: Mn map ................................................................................................................................. 76
Figure 36: Variation in concentration of Total nitrogen in the first 24 water sources ........................... 77
Figure 37: TN map ................................................................................................................................. 78
Figure 38: TP map ................................................................................................................................. 80
Figure 39: T_Col map ............................................................................................................................ 82

viii
Glossary
Access to safe water
supply1:
Percentage of people with access to an improved source of
drinking water within 500 meters in rural areas and 200
meters in urban areas. This access should be reliable,
affordable, and provide an adequate quantity (minimum 20
L/person/day) within reasonable time. Improved water
sources are piped water, protected wells and springs, as well
as rainwater collection. Water quality is assumed to be
acceptable for improved water sources but shall be tested for
compliance with national and WHO standards for potable
water.
Watershed area: The entire geographical area drained by a river and its
tributaries; an area characterized by all runoff being
conveyed to the same outlet. Also called watershed basin. In
order to determine the quantity of available water resources
in Rwanda, the country was sub-divided into nine
Watersheds of level one and twenty watersheds of level two.
(See the 2015Rwanda National Water Resources Master
Plan).
Sub-Watershed: A sub-watershed is usually a smaller area of land draining to
a single tributary of a larger river
Evapotranspiration: Is the sum of evaporation from the surface, plus transpiration
from plants. Evaporation accounts for the movement of water
to the air from sources such as the soil, canopy interception,
and waterbodies.
Spring: A spring is a point where water flows out of the ground. A
spring may flow the whole year or only sometimes.
Sustainable water supply: This study will put out the capability of the current water
sources in Gicumbi district vis a vis the water use that will be
in the area in 25 years to come (i.e. from 2018 to 2043).
Watershed: A watershed is an area of land that drains all the streams and
1MININFRA,2010. National Policy and Strategy for Water Supply and Sanitation Services
ix
rainfall to a common outlet such as the outflow of a reservoir,
mouth of a bay, or any point along a stream channel. The
word watershed is sometimes used interchangeably with
drainage basin or watershed.
Water Demand: Is a virtual quantity of water that is needed to satisfy some
perceived need from a user, either for primary use (drinking
water, household requirements, small garden, etc.), livestock
or for commercial purposes.
Water for domestic and
municipal use2:
Domestic and municipal water use is taken to include clean
water supply to households and institutions (schools, health
facilities, prisons, public offices) for drinking, cooking,
hygiene and other purposes.
Water supply services: The abstraction from a water resource, conveyance,
treatment, storage and distribution of potable water, including
all the organizational and sensitization arrangements
necessary to ensure sustainable services and benefits. This
includes domestic water supply (drinking water and other
household uses) as well as the provision of water for
economic activities through public piped networks.
2MINIRENA,2010.Water Resources Management Sub Sector Strategic Plan (2011–2015)
1
1. Introduction
1.1 Background of the project
Water For People (WFP), Gicumbi District and the Ministry of Infrastructure represented by
The Water and Sanitation Corporation (WASAC ltd) have been working together to
implement a water supply program known as “Gicumbi WASH Program” aiming at bringing
the district to full access to safe drinking water and build institutions that will sustain water
services3. A total of Ninety-Seven (97) water supply systems were identified in the district,
some of them are functional, others need to be rehabilitated and new ones will be constructed
in the coming years. The sustainability of water services relies heavily in a proper water
resource management.
The District of Gicumbi lies between 1° 51’ and 1° 23’ South latitude and 29 ° 56’ and
30°17’East longitude. Located in Northern Province, Gicumbi District has 828 km2 with
395,606populations and 478persons/km2 inhabitants. It is composed of 21 sectors, 109 cells
and 630 villages. The district has a more rural economy. Gicumbi is characterized by a
mountainous topography with steep slopes. It is covered by the Buberuka highland agro-
ecological zones. This plateau is surrounded by steep ravines with small valleys segmented by
multiple swamps.
The Water Resources of Rwanda faces growing challenges arising from pressures due to
rapidly changing demographic patterns, demands of intensified socio-economic development,
degradation resulting from unsustainable and inappropriate land use practices; and
uncertainties created by climate change, among others. At the same time, the Rwanda Water
Resource is expected to meet many conflicting water use demands and so contributing in the
access to water for everyone. Meeting the above challenges requires a comprehensive
planning.
As most of the region in Rwanda, the District of Gicumbi has a bimodal rainfall pattern with
two rainy seasons and two dry seasons. Ordinary the first rainy season begins in September to
December followed by a short dry season extends from January to February while the second
rainy season extends from March to May. The long dry season begins from June to August.
The Gicumbi District Development Plan has indicated that the climate is changing
significantly although the range of annual rainfall varies between 1200mm to 1500mm;
therefore the land is still largely suitable to rainfed agriculture. Gicumbi has humid climate
and should not be scarce in water, but in reality as most of the hilly part of Rwanda access to
3WFP, 2017. Terms of Reference for the development of a WRMP inGicumbi district

2
water is constrained by the topography. This is the main reason the country will continue to
invest in water infrastructure. The district of Gicumbi has set as priority water as number 2
(Water and Sanitation Priority Actions)4. It should be noted that Mwange River was purposely
included in this study considering the ongoing project by WASAC to use the river for water
supply to the population.
With that intention, WFP contribute to the Government of Rwanda development agenda and
in particular for Gicumbi district by increasing the provision of sustainable water, sanitation
services and hygiene education resulting in improved health. Water for People is an
international non-governmental organization (NGO) that works with people and partners to
develop innovative and long-lasting solutions to the water, sanitation and hygiene problems in
the developing countries. It is in this background that WFP, hired the Best Associated
Consultants (BAC) firm based in Rwanda to carry out a water resources management plan
study in the district of Gicumbi that will enable partners of Gicumbi WASH Program to have
a clear picture of available water sources versus demand, water quality and recommend
appropriate measures for effective protection and use of water resources.
1.2Objectives of the assignment
1.2.1 General objective
To develop a water resources management plan for the water sources and Mwange River
located in the sub Watersheds of the Gicumbi district.
1.2.2 Major phases and tasks
Phase I - Water Resources Inventory (expected for the interim report)
1. Database of the potable water sources in Gicumbi that includes the following type of
information for each source:
- GPS locations of all the water sources;
- Delineation of the sub-watersheds associated to the water sources identified;
- Discharge of all water sources identified in the district;
- Water quality tests of 101 sources and Mwange River for the following
parameters: pH, Turbididty, Total Coliforms, Total Phosphorous, Total
Nitrogen, Iron and Manganese.
2. Water demand analysis
- Identify all the current water users and their water demand;
- Water demand projection per sector for 25 years horizon;
4 Gicumbi District, 2013. District Development Plan 2013-2018
3
3. Watershed characteristics (land use, land cover, slopes, erosion potential, land
ownership, current and potential source of contamination of sources, hydrological
information, etc.).
4. Existing or current Watershed protection measures.
Phase 2 – Water Resources Management Plan
1. Water Resources Management Plan that includes the following components:
- Current and proposed Legal and institutional framework for Water Resources
Management
- Characterization of potable water sources and watersheds
- Prioritization of watersheds based on the risk of contamination and water
demand analysis
- Water balance analysis for 25 years (2018-2043);
- Proposed protection and mitigation measures;
- Proposed monitoring framework and tools
2. Training Package for Database management
3. Budget for the implementation of the study recommendations.
1.2.3 Scope of the assignment
1) The study will cover the entire District consisting of 21 sectors, 109 cells and 630
villages.
2) The WRMP would be developed for a 25 years’ horizon.
3) The study will be conducted in line with hydrological boundaries at watershed and
sub- watershed levels for water sources (springs) and surface water (Mwange River)
with data collected during rain and dry seasons.
4
2. Study Area
2.1 Administrative entities in the study area
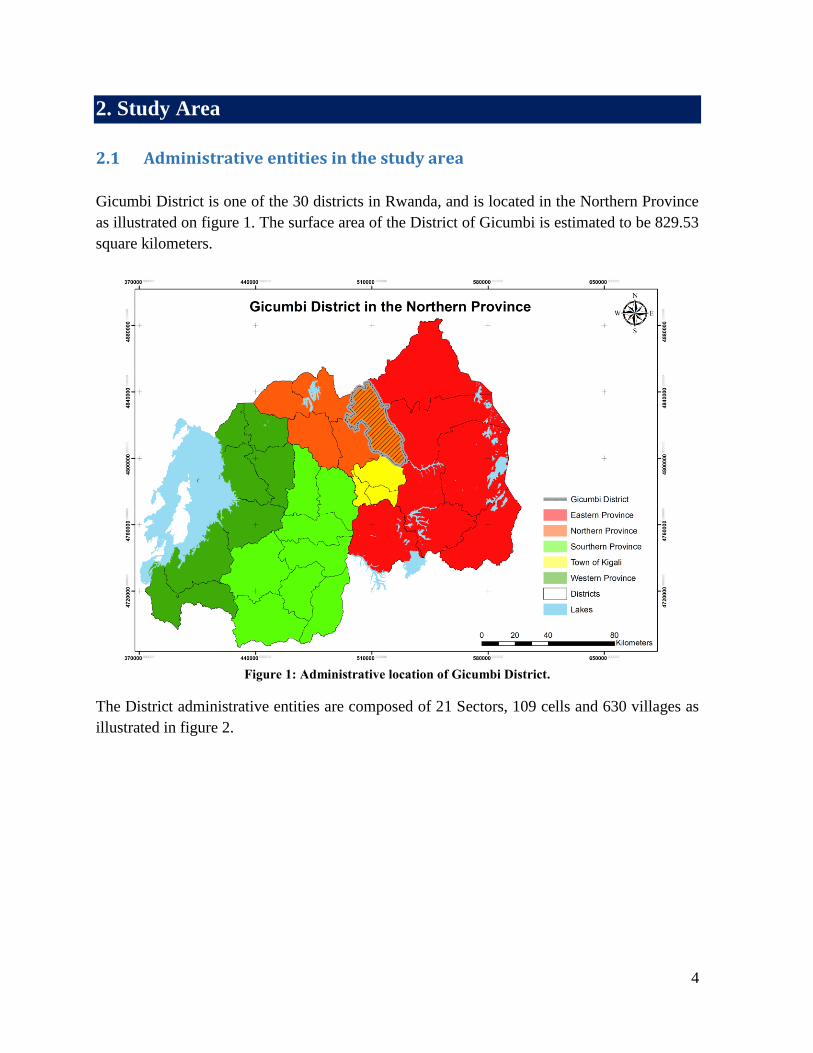
Gicumbi District is one of the 30 districts in Rwanda, and is located in the Northern Province
as illustrated on figure 1. The surface area of the District of Gicumbi is estimated to be 829.53
square kilometers.
Figure 1: Administrative location of Gicumbi District.
The District administrative entities are composed of 21 Sectors, 109 cells and 630 villages as
illustrated in figure 2.
5
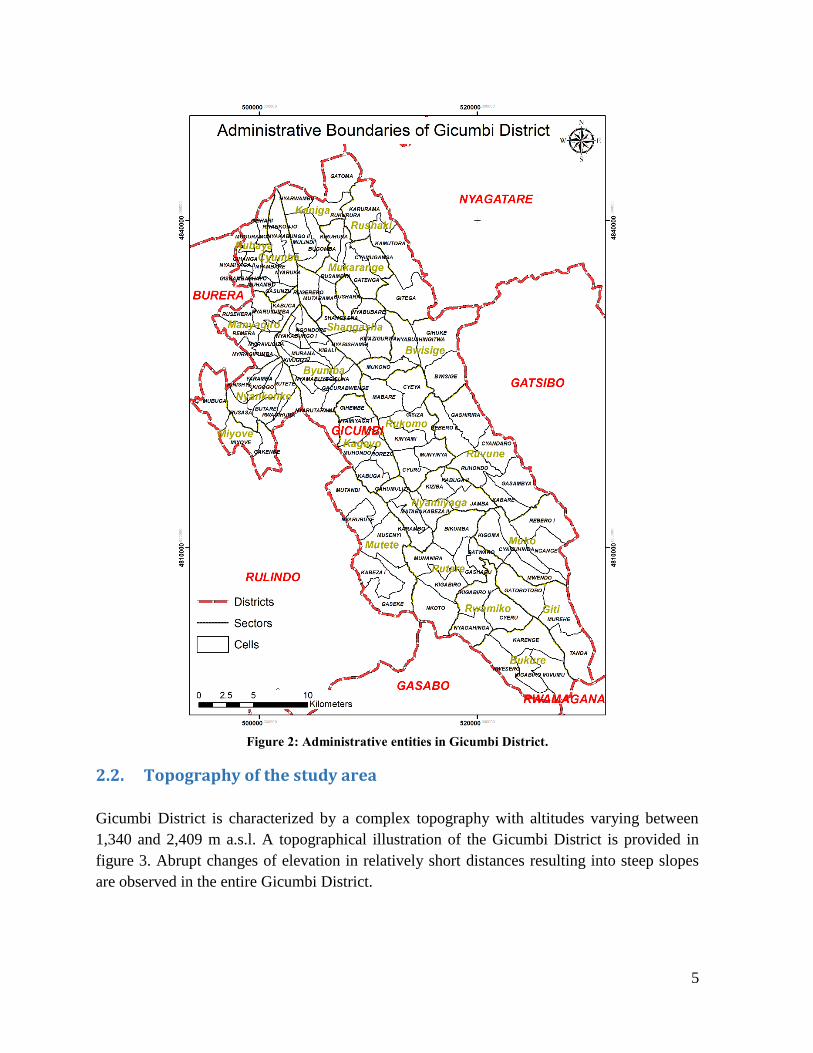
Figure 2: Administrative entities in Gicumbi District.
2.2. Topography of the study area
Gicumbi District is characterized by a complex topography with altitudes varying between
1,340 and 2,409 m a.s.l. A topographical illustration of the Gicumbi District is provided in
figure 3. Abrupt changes of elevation in relatively short distances resulting into steep slopes
are observed in the entire Gicumbi District.

6
Figure 3: Topographical illustration of Gicumbi District.
2.3. Climate of the study area
Rwanda has a bimodal climate distribution and four seasons are experienced in the country.
Two rainy periods, the first being from March to May and a less intensive from October to
December are experienced. In addition, a small dry season starting from mid-December to
February, characterized by occasional light rainfall and varying from dry to moderately wet
days. A heavy dry season starting from June to mid-September, characterized by little to no

7
rain particularly in highlands. The heavy rainy season starts from March to May with the
wettest days in the year. Finally, the small rainy season starts from mid-September (early
October) to mid- December. The annual rainfall and potential evapotranspiration (PET)
variation in the study area, based on the Rwanda Meteorological Agency(RMA) database,
ranges approximately between 903 to 1,349 mm and 596 to 1,140 mm respectively. High
rainfall, PET, relative humidity and low temperature values were observed in the watershed
(refer to figure 4).
Figure 4: Climatology of Gicumbi District.
8
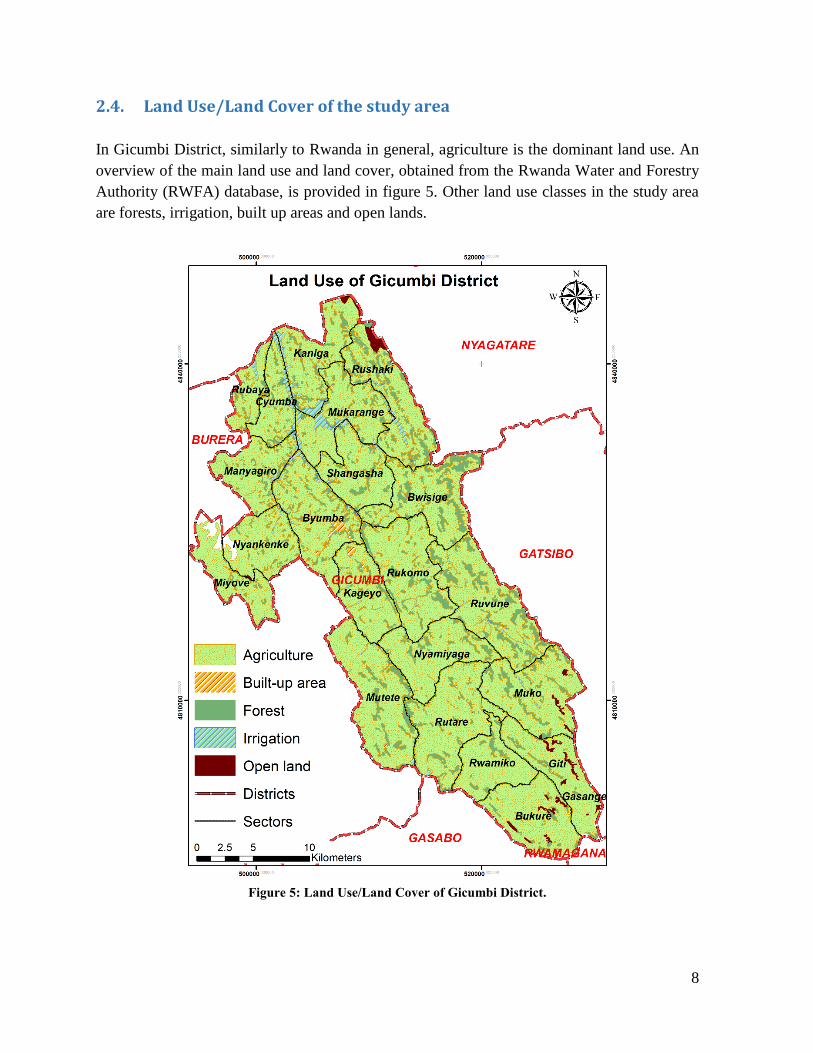
2.4. Land Use/Land Cover of the study area
In Gicumbi District, similarly to Rwanda in general, agriculture is the dominant land use. An
overview of the main land use and land cover, obtained from the Rwanda Water and Forestry
Authority (RWFA) database, is provided in figure 5. Other land use classes in the study area
are forests, irrigation, built up areas and open lands.
Figure 5: Land Use/Land Cover of Gicumbi District.

9
2.5. Groundwater potential of the study area
The characterization of groundwater potential in most cases is done using geological and
lithological information. In fact, rocks are the most valuable clues of all. As a first step,
geologic maps and cross sections showing the distribution and positions of the different kinds
of rocks are prepared for both the surface and underground, as these provide information on
favorable conditions for groundwater development. The types of groundwater, as represented
through their aquifer types, is very much dependent on the area landscape.
In Gicumbi District, many investigations of these kinds were done during the National Water
Resources Masterplan indicating a high groundwater development potential in the District. In
Gicumbi District the existing aquifers contains a number of suspended aquifers. This is
illustrated by the numerous number of spring sources located in the area. Figure 6 provides an
illustration of the identified aquifers in Gicumbi District.
A majority of fractured aquifers is located in Gicumbi District. The major aquifers identified
in the area are mainly a permeable fractured aquifer made of quartzite and schist base, a semi-
permeable fractured aquifer made of schist, mica and quartzite, also a low permeable
fractured aquifer made of schist and mica-schist. An extensive network of alluvial aquifers is
also observed spread in the area as illustrated on figure 6. In the Northern-western part of the
District, a peat formation can be observed.
Alluvial aquifers are generally shallow sand and gravel deposits laid down over time in a river
channel or floodplain with an un-layered nature of the material (often silt, clay, sand, and
gravel) deposited by running water in and around rivers. These aquifers often known as
tributary aquifers exchange water back and forth with surface streams.
Fractured rock aquifers are common in the mountainous areas as depicted in Gicumbi District.
Underneath a layer of soil and loose rocky material, aquifers exist in bedrock full of cracks
and fractures created by the natural folding and faulting of the rock over millions of years.
These cracks can be filled with water supplied by infiltrating rain. Not all fractures contain
water, however springs can arise where fractures intersect the land’s surface. Depending on
the density of the fracture these rocks have, they are classified as low-permeable, semi-
permeable and permeable fractured aquifers.
10
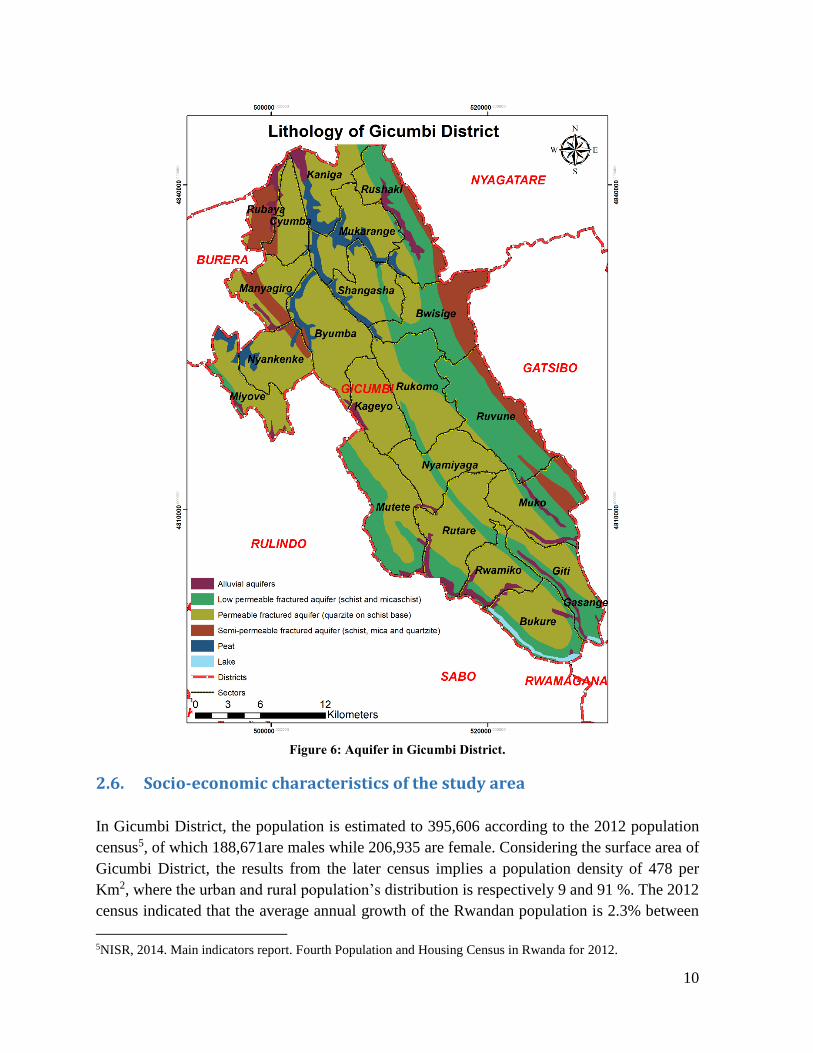
Figure 6: Aquifer in Gicumbi District.
2.6. Socio-economic characteristics of the study area
In Gicumbi District, the population is estimated to 395,606 according to the 2012 population
census5, of which 188,671are males while 206,935 are female. Considering the surface area of
Gicumbi District, the results from the later census implies a population density of 478 per
Km2, where the urban and rural population’s distribution is respectively 9 and 91 %. The 2012
census indicated that the average annual growth of the Rwandan population is 2.3% between
5NISR, 2014. Main indicators report. Fourth Population and Housing Census in Rwanda for 2012.

11
the first and fourth population census of 1978 and 2012 respectively. However, an average
annual growth rate of 1.4% was recorded within the third and fourth census in Rwanda (2002-
2012).
According to EICV3 (2013-2014), 9% of the Northern province households have no access to
an improved drinking water source; in Gicumbi District, this is slightly higher with a 10.4%
estimate. 58.9% of households have access to water in Gicumbi District through protected
springs; 17.3% through public standpipes; 9% trough piped water into dwelling/yard; 0.4%
through borehole; 2.5% through protected wells; and 1.3% of households use rainwater.
12
3. Methodology
The study covered the District of Gicumbi by focusing on water sources and Mwange River
and included different approaches. In this section, a descriptive summary of the applied
methodology is described.
3.1. Field visits
Intensive field visits were conducted across the watersheds in the Gicumbi District. These
field visits were very vital in this assignment as they helped the team to understand the status
of different watersheds in Gicumbi District, the current management of spring’s sub-
watersheds, the potential threat to the water sources in the study area as well as the
environment in general. In addition to this, geographical coordinate for different spring
sources were collected. Furthermore, the outcomes from the field visits were analyzed and
different maps were generated in order to enable the illustration of the status and physical
characterization of sub-watersheds in Gicumbi District.
3.2. Literature Review/Desk study
A literature review was carried out with the aim of accessing additional information that were
used for the assessment of the status of the Gicumbi sub-watersheds. The data were sourced
from different Governmental and Private Institutions such as MoE, MININFRA,
MINECOFIN, RWFA, RLMUA, WASAC, WFP, as well as Gicumbi District and its Sectors.
This review focused mainly on the available technical reports, official and institutional
documents as detailed in references.
The implementation of the watersheds management plan requires a very wide stakeholders’
participation and a strong institutional framework. To know the main actors involved,
Gicumbi watersheds stakeholders were analyzed.
The stakeholder analysis and identification provided the essential information about:
The individuals, groups and institutions affected or benefiting from services provided
in the watershed and their various interventions;
The capacities that these individuals, groups and institutions possess for appropriate
water management;
The people, organizations and institutions who could influence, and contribute to, the
planning and management processes;
The past, current and potential relationships between people and natural resources; and
The current and potential resource use and management conflicts.

13
Stakeholder identification will be carried out in following 3 steps as described below:
Step 1: Consist of listing various natural resources within the site e.g. land, water, forest...
Step 2: Consist of listing all functions and uses for each of the resources – e.g. for tourism,
source of craft material or agriculture.
Step 3: Consist of identifying groups and actors that have a stake in each of the functions and
uses of the various water source by asking the questions like:
1. Who uses the (re)source(s)?
2. Who uses the Mwange River and for which type of activities.
3. Who benefits from the use of the source(s)? Who wishes to benefit but is unable to do
so?
4. Who has impacts on the (re)source, whether positively or negatively?
5. Who has rights and responsibilities over the use of the source(s)?
6. Who would be affected by a change in the status, regime or outputs of the
management?
7. Who makes decisions that affect the use and status of the source(s), and who does not?
These questions will be answered using field observations, discussions with key persons,
literature reviews, consultant team’s experience and questionnaires.
The stakeholder analysis exercise aim at answering questions such as:
1. What are the current and future interests of the various stakeholders in the use and
management of Gicumbi watersheds? What are their needs and expectations? How do
they use services provided by Gicumbi watersheds and what benefits do they derive?
2. What are their past and current power, rights and responsibilities, both formal and
informal? What are the networks and institutions of which they are part?
3. What are the social and environmental impacts, both positive and negative, of their
past and current exploitation of watershed?
4. How ready and willing are they to participate in and contribute to the management?
5. What are the potential areas of agreement and shared interest, upon which consensus
and collaboration can be developed?
6. What are the human, technical and financial resources that they are prepared to
contribute to the management process?
7. What is the current volume of water needed per capita/ person/day?
3.3. Focus group discussions and Interviews
A focus group discussion (or meeting) was conducted with environmental experts from
different sectors of the District and community representatives to optimize the limited time
had for field visit and interviews. The discussion had a gender sensitive basis to ensure
capturing the role of women and children in the results obtained.

14
The meeting helped the team to identify among others the areas of the District under threat,
the types and causes of the problems faced, and efforts and plans already in place, etc. The
interviews pointed out some indicators showing possible ongoing trends for appropriation
beyond the water supply project timeframe: challenges, way forward/suggestion for
improvements. In addition, for sustainability purpose, the interviews assessed the trends for
long-term impacts of the project: planned, executed, challenges met, causes, lessons learnt,
and suggestions for the way forward.
During the interviews, Water Suppliers, Sectors Agronomists, District Environmentalist,
Representatives of Famers, Representatives of Women Associations, Representative of
Youth, Forest Managers, Representation from Members of the Local Community, etc. were
approached.
The interview focused on water users associations and water resources management
committees at Sector and District levels. According to the water law no 62/2008 of
10/09/2008 putting in place the use, conservation, protection and management of water
resources regulations; these water resources management committees are composed of local
government officials, NGOs representatives, representatives of water users’ associations,
farmers’ representatives and private sector. Thus, depending on the water resources
management issue to be discussed, some of the following members are (will be) interviewed:
At District level:
1. Vice Mayor for Economic Affairs;
2. Sector Executive Secretaries;
3. District Environment Officer;
4. District Agronomist;
5. District Women Council Representative;
6. District Youth Council Representative;
7. District representative of water user organizations in the field of agriculture;
8. The staff of the National Authority in charge of Natural Resources operating at the level
of the hydrographical basin;
9. District representative of domestic water users;
10. Two farmers’ representatives;
11. NGO representative;
12. District private sector representative
At Sector level:
1. The Executive Secretary of the Sector
2. The in charge of water at sector level
3. The in charge of agriculture, animal resources, land, settlement, urbanization, forests,
infrastructure and environment at the Sector level;

15
4. A representative of the Executive Committee of each Cell in the Sector elected by his/her
peers;
5. A representative of the National Women’s Council at the Sector level;
6. A representative of the National Youth Council at Sector level;
7. Two (2) representatives of farmers at the Sector level;
8. A representative of water domestic users at the Sector level;
9. Two (2) representatives of non-governmental organizations working in the field of water
resources at the Sector level;
10. A representative of water user organizations in the field of agriculture at the Sector level;
11. A representative of the private sector at sector level
3.4. Flow measurements
3.4.1. Estimating spring flow
The spring yield was measured in liters per second (l/s). The measurement process involved
two persons. One person collecting water with a container of a known volume (1 L) while the
other measuring the time needed to fill the container. Three readings were taken during the
measurement and the averages were made and expressed in l/s/spring.
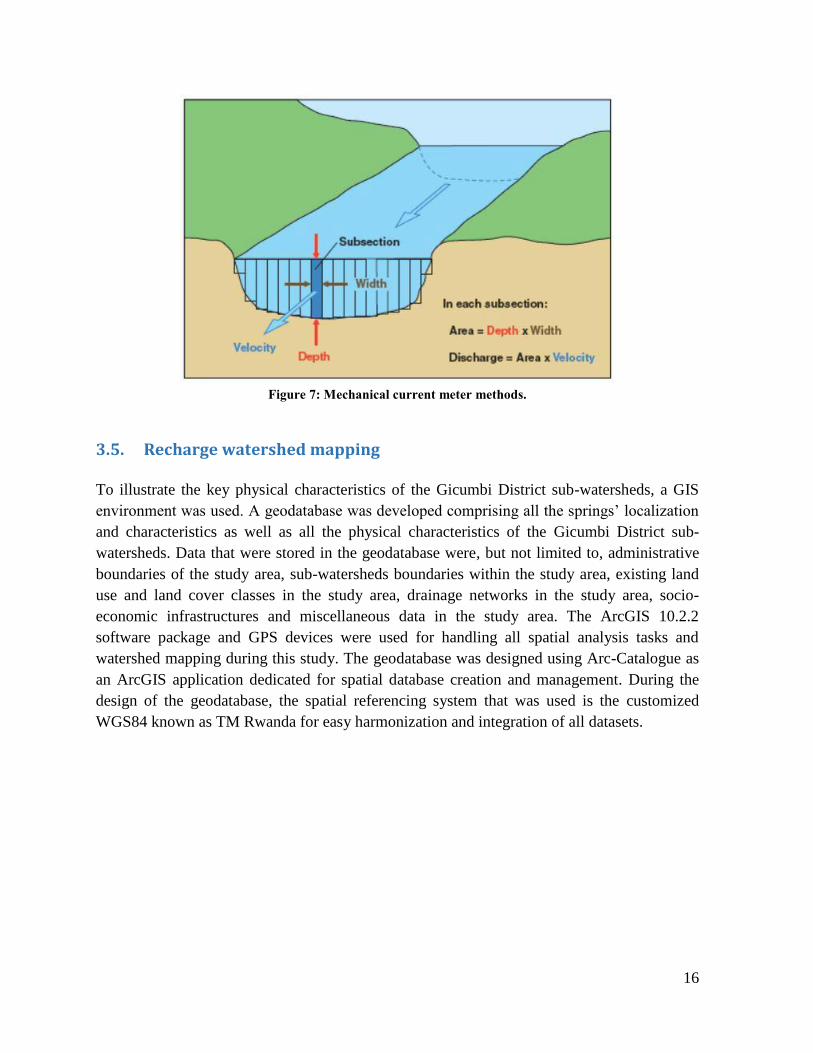
3.4.2. Estimation of the river and stream flow
The mechanical current meter method was used to measure the stream flow of the Mwange
River. This is a standard method used for flow measurement. The stream channel cross
section was divided into numerous vertical subsections (refer to figure 7). In each subsection,
the area was obtained by measuring the width and depth of the subsection, and the water
velocity using the mechanical current meter. The discharge in each subsection was computed
by multiplying the subsection area by the measured velocity. The total discharge was then
computed by summing the discharge of each subsection (using the midsection method),
following equation 1.
(1)
Where Q = discharge, di = depth, v = velocity, W = width
343
232
121 **
2**
2**
2wv
ddwv
ddwv
ddQ CBA
16
Figure 7: Mechanical current meter methods.
3.5. Recharge watershed mapping
To illustrate the key physical characteristics of the Gicumbi District sub-watersheds, a GIS
environment was used. A geodatabase was developed comprising all the springs’ localization
and characteristics as well as all the physical characteristics of the Gicumbi District sub-
watersheds. Data that were stored in the geodatabase were, but not limited to, administrative
boundaries of the study area, sub-watersheds boundaries within the study area, existing land
use and land cover classes in the study area, drainage networks in the study area, socio-
economic infrastructures and miscellaneous data in the study area. The ArcGIS 10.2.2
software package and GPS devices were used for handling all spatial analysis tasks and
watershed mapping during this study. The geodatabase was designed using Arc-Catalogue as
an ArcGIS application dedicated for spatial database creation and management. During the
design of the geodatabase, the spatial referencing system that was used is the customized
WGS84 known as TM Rwanda for easy harmonization and integration of all datasets.
17
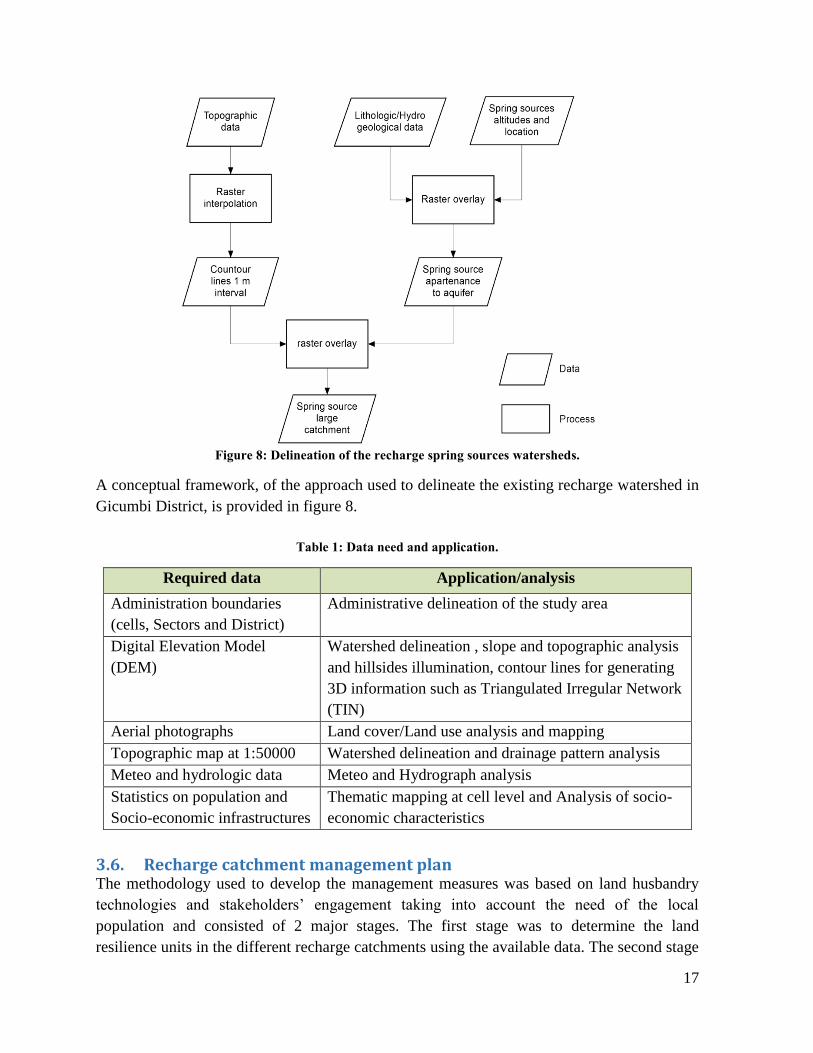
Figure 8: Delineation of the recharge spring sources watersheds.
A conceptual framework, of the approach used to delineate the existing recharge watershed in
Gicumbi District, is provided in figure 8.
Table 1: Data need and application.
Required data Application/analysis
Administration boundaries
(cells, Sectors and District)
Administrative delineation of the study area
Digital Elevation Model
(DEM)
Watershed delineation , slope and topographic analysis
and hillsides illumination, contour lines for generating
3D information such as Triangulated Irregular Network
(TIN)
Aerial photographs Land cover/Land use analysis and mapping
Topographic map at 1:50000 Watershed delineation and drainage pattern analysis
Meteo and hydrologic data Meteo and Hydrograph analysis
Statistics on population and
Socio-economic infrastructures
Thematic mapping at cell level and Analysis of socio-
economic characteristics
3.6. Recharge catchment management plan The methodology used to develop the management measures was based on land husbandry
technologies and stakeholders’ engagement taking into account the need of the local
population and consisted of 2 major stages. The first stage was to determine the land
resilience units in the different recharge catchments using the available data. The second stage

18
was to incorporate the agro-climatic parameters in the land resilience units in order to select
the appropriate management measures that have to be implemented in the recharge catchment
areas. The applicability of the proposed measures was verified during the extensive fieldwork
that was done within the framework of this study.
3.6.1. Soil resilience units To identify the land resilience units in the project area, a comprehensive approach consisting
of a spatial combination of slope classes and soil depth classes in the project area based on the
land unit matrix provided in table 2, was applied. Fifteen classes were identified representing
land husbandry land units in increasing order of care requirement (this classification also
incorporate limitation for production per land units). In other words, the classification
obtained indicates the level of technical and financial investment required to treat the different
classes of land units identified.
Table 2: Land resilience unit’s matrix
Soil depth Slope Categories
0-6% 6-16% 16-40% 40-60% >60%
0-50 cm 9 10 11 12 15
50-100 cm 4 5 6 8 14
>100 cm 1 2 3 7 13
In the above matrix, the 15 land husbandry units identified were classified into 4 categories of
land resilience as illustrated in table 3 (note that the color coding is based on the national
standards provided by MINAGRI for soil mapping), the basis of this classification is that Soil
resilience refers to the ability of a soil to resist or recover their healthy state in response to
destabilizing influences (this is a subset of a notion of environmental resilience). The meaning
behind the classification provided in table 3 is that for each class a specific set of treatment (or
activity) are ideal for it to recover its healthy state (in general a healthy soil is a soil state in
which the soil meets its range of ecosystem functions as appropriate to its environment, for
example in agriculture a healthy soil would be a soil producing healthy crops with minimal
amount of external inputs and few or no adverse ecological impacts).
The first 2 land resilience categories were set for a similar kind of treatment known as
agroforestry because of 2 main reasons. The first reason is the zero grazing policy in place in
Rwanda resulting in no need for rangelands development in the area and the last reason is the
government efforts in place for promoting agroforestry instead of traditional agriculture in the
country.

19
Table 3: Land resilience unit’s matrix
# Code Level of care requirement Land Resilience Unit
1 Low Croplands
2 Medium Forest plantation
3 High Rangelands/Croplands
4 Very High Natural forest
The following combination and categorization was applied to the project area in a GIS
environment and an overall spatial distribution of these categories per spring recharge
catchments are illustrated in thematic maps provided in this report.
3.6.2. Management measures Finally, to select the adequate recharge catchments management measures in the project area,
agro-climatic factors were considered. These management measures are better implemented
as land husbandry technologies which depended on resilience of soil and its agro-climatic
characteristics. The agro-climatic characteristics are mostly categorized into agro-climatic
zones where the Gicumbi District falls in the Eastern part the Buberuka Highlands and the
Northern part of the Central plateau and plateau near the East Savanah. Additionally, the
altitude and annual rainfall distribution were considered in the project area to complement its
agro-climatic parameterization. Four zones were determined as wet highland (W. H. L), wet
mid land (W. M. L), moist mid highland (M. M. H. L) and moist lowland (M. L. L) in the
project area.
Table 4: Recharge catchment management measures.
Land Resilience Units
Croplands Rangelands Forest plantation Natural forest
Agro
climatic
zones
M. L. L
Agro forestry +
simple management
Agroforestry +
average management
(Progressive terraces)
Forest plantation Natural forest
M. M. H. L
Agroforestry +
average management
(Progressive terraces)
Agroforestry +
advanced
management (Radical
terraces)
Forest plantation Natural forest
W. M. L
Agroforestry +
advanced
management (Radical
terraces)
Agroforestry +
advanced
management (Radical
terraces)
Forest plantation Natural forest
W. H. L Natural forest Natural forest Natural forest Natural forest
Table 4 illustrates the classification matrix that was used for implementation measures. The
later table was applied to the project area in a GIS environment and an overall spatial
distribution of these management measures per spring recharge catchments were obtained
provided in this report.

20
3.6.3. Spring sources immediate catchment technical management measures The management measures recommended for immediate spring catchment are standards. In
Rwanda, the standard is fixed by MININFRA through WASAC Ltd as the only drinking
water supplier in Rwanda, who at the same time look at urban and rural areas supply. These
management measures are easy to understand, implement, maintain and do not require
extensive design and studies and therefore are cost effective. From the above fieldwork
observations, quite a number of spring sources do not fulfil all the standard management
measures of their immediate catchment. According to the WASAC Ltd manual of Operation
and Maintenance of Gravitational Rural Water Systems, the following graph and table
illustrates the technical management measures of the immediate spring catchment.
Table 5: Immediate spring catchment management measures
Upstream protection zone:
450 Arc radius of 100
meters upstream outside
the protection ditch,
No potential pollution
source is allowed (latrines,
life stock grazing), nor
roots of trees in that zone
Direct protection area:
Radius of 10 meters
around the surface of
catchment area within the
fence,
Should be fenced,
No farming activities
allowed (no plants, no
animals within the fence.
Protection ditch:
Circle the catchment area,
Drain surface waters
downstream,
Limit direct infiltration
into the capture.
Collection chamber /
departure:
Should be securely
locked.
Source: WASAC Ltd
21
3.7. Water quality sampling and analysis
The water quality parameters were collected and stored in 600 ml plastic bottles and placed in
a cooler box with ice pending after sampling. The plastic bottles were rinsed before with HCl
(1M) and then with distilled water at the laboratory to insure their cleanness. Furthermore,
sampling bottles were also rinsed twice with sample water before final collection.
The Mn and Fe samples were analyzed according to APHA6 standard methods, i.e. few drops
of concentrate nitric acid were added while sampling of total coliforms samples were
preceded by the sterilization of both the sampling bottles and the spring pipe. The analysis of
the collected samples was done following the already developed SOPs for pH, Turbidity,
Total Coliforms, Total Phosphorous, Total Nitrogen, Iron and Manganese as these samples
were analyzed by UR laboratories specialized in water quality control. The results from the
analysis was compared to RSB and WHO standards for drinking water.
3.8. Estimation of water demand based on actual use data
Collection of the actual consumption data
As WFP works with residential water users including households, schools, health centers,
industries, etc., the data collection phase covered all those areas.
One of the first steps in collecting the actual water consumption for each spring was to
identify the number of residential users that were served by a particular spring. These
data were expected to be obtained from WFP and the Gicumbi District.
The next step was to identify the total water consumed collected from private
operators or WASAC,
The last step was the calculation of the residential water use per capita per day
Residential water per capita per day = (Residential Use ÷ Residential Population)
• Residential Use = Single-Family Use + Multi-Family Use
• Residential Population = the residential population of the service area.
The outcome from the above calculation was confronted with the standard of WHO to assess
the level of water demand satisfaction.
For the areas which are not yet supplied; the demand was estimated based on the
number of population staying in these areas.
6 APHA, AWWA, WEF, 1998. Standard methods for the examination of water and wastewater, 20 edn.
American Public Health Association, Washington, D.C.

22
3.9. Estimation of water Demand in 25 years to come (2018-2043)
The water use demand was estimated based on the existing data available in the study area.
This demand was expected to be domestic water supply from the existing water supply
scheme in the study area. The main outcome of this section was water demand estimates per
use and on a monthly basis in terms of volume of water per spring. This allowed relating these
water use demands to the water balance. In this estimation, the main task was to estimate the
population of the area in 25 years to come. Mathematically, the population estimates was
done as shown below.
Where:
P0 = initial population
Pt = population t years later
r =growth rate
t= time horizon
The projected population was confronted to the available water to assess whether the demand
would still be met.
Pt= P0 (1+ r) t
23
4. Institutional and legal framework for the management of water resources in Gicumbi District
Water is the most precious of the natural resources of Rwanda as it is indispensable for human
health and for economic activities. So we must take care of it, protect it and manage it
properly. This requires a strong institutional and legal framework to ensure that management
of water resources, its development; its use and protection are done in a coordinated and
regulated manner.
In this regard, a lot has been made at national level in setting up institutions to deal with water
resources management on different levels and adopting different laws and regulations relating
to the management, use and protection of water resources. The institutional and legal
frameworks are established to indicate clearly who does what in terms of water resources
conservation, protection and management. We cannot separate institutional framework from
legal framework as long as institutional framework for water resources management is
provided for by different policies and legal instruments.
4.1. Institutional structure for water resources management
Currently institutions in charge of water resources management are structured from national
level to the lowest level (user level).
4.1.1. Institutions at National level
4.1.1.1. The Ministry (Ministry of Environment)
The Ministry has the mission to ensure the conservation, protection, management and
development of water resources. Specifically, the Ministry is responsible for the following:
To develop and disseminate water resources policy and its implementing strategies
and programs;
To develop laws and regulations to ensure protection, conservation, management and
development of water resources;
To mobilize the necessary resources for the conservation, protection, management and
development of water resources.

24
4.1.1.2. Authority (Rwanda Water and Forestry Authority)
Law N°62/2008 of 10/09/2008 putting in place the use, conservation, protection and
management of water resources regulations in its article 17 (Water Law) provides for
establishment of a National Water authority and this has been established by Law Nº06/2017
of 03/02/2017 establishing Rwanda Water and Forestry Authority and determining its
mission, organization and functioning.
In terms of water resources management, the Authority’s mandate is to implement policies,
laws, strategies and Government decisions related to the management of water resources and
to undertake technical research, studies and other relevant technical activities for a better
management and use of water resources.
4.1.1.3. National Water Consultative Commission
Water is a cross cutting resource affected by and affecting different sectors. It thus implies
that institutions and stakeholders which have a stake on water resources discuss and have a
common understanding not only on water resources related issues but also on water
development projects to be undertaken by various institutions so as to avoid over up of the
projects. The National Water Consultative Commission was then established to serve as a
discussion forum for that purpose.
As established by Water Law, the National Consultative Commission will be consulted on
planning, water supply and management or development projects in water domain elaborated
to the national level or the big hydrographic basin level as well as the big projects of the same
category of provincial character. According to Prime Minister’s Order No 143/03 of
24/05/2013 determining the organization, functioning and composition of the National
Consultative Commission, the Commission shall meet once in six months and whenever it is
considered necessary and the meetings are chaired by Minister in charge of water resources.
4.1.1.4. Water Inter-ministerial Committee
The Water Interministerial Committee is a technical committee composed of ministerial
department representatives concerned with water in their domain. The Ministry in charge of
water resources ensures the organization and functioning of the Water Interministerial
Committee and convenes its meetings whenever deemed necessary.
The Water Interministerial Committee is consulted on all legislative drafts/Bills regarding
planning in the water domain elaborated at the national level, as well as on matters of
national, regional or international level. It plays also a technical advisory role concerning
matters to be decided by the National Water Consultative Commission.
25
4.1.2. Institutions at District level
Water resources development and management requires involvement and participation of
water users, planners, policy makers at all levels (central and decentralized levels),
communities and other stakeholders where decisions regarding water resources managements
are made through participatory approach by each and everyone involved. This reflects the
idea of decentralization following which the design and implementation of water management
and allocation policies are transferred from the Central Government to local institutions,
which are supposed to have a better knowledge of water related issues at catchment level and
where representatives of local water stakeholders are able to negotiate and decide jointly
water management strategies and measures to be put in place. This was put into practice
through establishment of hydrographic basin committees at District and Sector levels.
4.1.2.1. District hydrographic basin committees
The Districts hydrographic basin committees were provided for by the Water Law in its
article 20 and its composition, organization and functioning are determined by a Ministerial
Order Nº005/16.01 of 24/05/2013 determining the organization and functioning of
hydrographic basin committees. The members of the Committees are representatives of the
following:
1° administrations concerned by water (central and local);
2° elected representatives of the local decentralized communities (women and youth)
3° representatives of the different categories of water users;
4° representatives of Non-Governmental Organizations operating in the water sector and
private sector.
The District hydrographic basin committees have the mandate, among others, to formulate
orientations and proposals concerning the planning and management of the water resources
within the basin/catchment, to propose the management units for which an integrated
management of the water resource must be done where necessary and provide opinions on all
technical or financial questions that are submitted to it by the administration.
Currently 29 hydrographic basin committees were established in all Districts except the
Kamonyi District.
4.1.2.2. Hydrographic basin committees at Sector level
As District hydrographic basin committees, the Water Law has stipulated that the same
committees have to be established at Sector level and shall have the following responsibilities:
1° to propose the initial version of the local master plan/management plan for water resources;
26
2° to fix management procedures for water resources management at the Sector level;
3° to provide any propositions and opinions on water related issues.
The structure and functioning of this committee is the same as set out for the basin committee
at the District level but the composition is a bit different because there are no representatives
of the District and Authority in charge of water resources otherwise, the members are the
same but at Sector level. The hydrographic basin committees at Sector level are not yet
established.
N.B: According to the proposed amendment of the current Water Law, these hydrographic
basin committees will be replaced by Catchment management committees.
4.1.3. Water user associations/User level
The water law stipulates that water users may create a water use association. Those
associations are of paramount importance as long as their members have the common
understanding and interest in the use of water resources hence participate actively in water
resources management activities. On the other hand, the water use associations are considered
as platform where water users in the same field of activity discuss and decide on water related
issues at the grass root and defend their interests where need arises. They also play a big role
in water conflicts management where conflicts may be settled by and among themselves
without intervention of local or central Government authorities.
Currently we have Water Users Associations in irrigation as established by Ministerial Order
N°001/11.30 of 23/11/2011 establishing irrigation Water Users Associations in irrigation
schemes. These associations are established at every segment of irrigation scheme and they
play a key role in water resources management and use in irrigation.
4.2. Legal framework for water resources management
Although the institutions for water resources management were put in place, the
implementation of strategies, management plans and development projects cannot be
successful or may cause adverse effects if are not done in regulated manner. Policies delimit
the activities of all water management stakeholders including the Government itself and lead
to the development of laws and rules designed to achieve policy goals.
The legal framework for managing water resources is mainly governed by the National water
resources management policy (2011), the National policy for water supply and sanitation
(2010), the environment policy, the water law (2008) and the organic law on environment
protection (2005). These Policies and Laws have statements or provisions related to the

27
management of water sources or provide guidelines and requirements for development
projects in a way that is friendly to water resources in particular and environment in general.
4.2.1. Review of Policies
4.2.1.1. National Policy for water resources management, 2011
Through the National Policy on Water Resources Management, Government is outlining its
vision for the water resources management sub-sector. The Policy contains guiding principles
upon which water resources of Rwanda shall be managed and highlights its statements and
related strategic actions to be implemented to meet the policy objective which is ”to manage
and develop the water resources of Rwanda in an integrated and sustainable manner, so as to
secure and provide water of adequate quantity and quality for all social and economic needs
of the present and future generations with the full participation of all stakeholders in decisions
affecting water resources management”.
Given the fact that water is a cross-cutting resource phenomenon, affecting and affected by
multiple sectors, including domestic consumption, agriculture, commerce, industry, transport
and energy as well as ecological functions for environmental conservation, the water policy
has introduced the management of water resources in integrated manner to ensure that
different uses and users of water resources and all other relevant factors are taken into
consideration in resource management, development and allocation.
Another important aspect of water resources management introduced by the water policy is
the catchment-based approach where water resources are managed without considering
administrative boundaries but rather taking into account local decisions, businesses,
landowners, water uses, any activity affecting water resources and the community that share a
specific geographic area, to secure positive environmental improvements for rivers and
catchments. The objectives of the catchment based management approach are to deliver
positive and sustained outcomes for the water environment by promoting a better
understanding of water related issues at a local level; and to encourage local collaboration and
more transparent decision-making when both planning and delivering activities to improve the
water environment.
4.2.1.2. Environment policy
The National Environment Policy of 2003 sets out overall and specific objectives as well as
fundamental principles for improved management of the environment, both at the central and
local level, in accordance with the country’s current policy of decentralization and good
governance. But the policy puts particular emphasis on challenges that water resources are
facing including but not limited to frequent climatic disturbances and increase of competitive

28
demands due to socio-economic development activities and population growth. All these
factors contribute increasingly to the reduction of water availability and during the rainy
seasons, water constitutes a danger and causes considerable damage due to lack of rain water
harvesting and conservation techniques.
In response to the above mentioned challenges, the Environment policy states some strategic
actions aiming at protecting water resources at the same time improving their quality and
increasing the quantity.
4.2.1.3. National Water Supply Policy, 2016
The National Water Supply Policy provides a clear direction for the implementation of
activities in the water supply sub-sector. The Policy outlines initiatives to overcome
challenges and exploit existing opportunities in an integrated manner, and contributes
effectively towards achieving the goals of the National Development Agenda.
The policy states that all Water Supply and Sanitation projects and programs shall abide by
the relevant water resources and environmental laws of Rwanda to make sure that all
measures comply with the standards, permits and regulations with respect to the rational and
sustainable utilization of water resources and environmental protection and conservation of
water resources. This is to acknowledge the importance of water resources in Water Supply
and Sanitation projects and to make sure that all necessary measures are undertaken to ensure
availability and protection of water resources are respected and implemented by each and
every one who has a stake on water resources.
4.2.1.4. National Sanitation Policy, 2016
The Government of Rwanda has the ambition to improve the quality of life of its population
by provision of adequate sanitation services. To reach this objective, the National Sanitation
Policy has been developed as an Umbrella Policy that provides guiding principles for all
aspects of sanitation, including liquid and solid waste, industrial waste, nuclear waste, health-
care waste and hygiene as well as storm water management.
The National Sanitation Policy provides for a range of various activities and means to be
implemented so as to ensure expended access to safe and sustainable sanitation services
including improving operation and maintenance of sanitation facilities and designing projects
to mitigate urban storm water issues among others. Given its impact on water flows and
quality, the management of storm water in urban areas will contributes a lot in improving
water resources quality and at the same time reducing storm water runoff impact on different
infrastructures.
29
4.2.2. Review of Laws and regulations
Policy statements and actions on water resources management need to be translated into legal
and binding provisions in order to be implemented by all persons, institutions and the
Government itself and to provide for penalties for those who act against or omit to do what is
required by the law. In this regards, different laws and regulations were enacted to that effect
as discussed here bellow.
4.2.2.1. Rwanda Water law, 2008
The Water Law incorporates many cutting edge principles of sustainable water resources
management and provides for institutional framework for the coordination of water resources
management, a key ingredient of integrated water resources management. Given the fact that
the water law has been developed following water and sanitation policy of 2004, the law is
being revised to encompass new features introduced by the current water policy including
catchment based management among others.
4.2.2.2. Organic law on environmental protection, 2005
The organic law on environmental protection offers special protection to water resources in as
far as it bans the conduct of activities within a specified distance from the shores of lakes,
rivers and streams in order to prevent their pollution and obliges the Government to
implement measures aiming at protecting and preserving catchment areas around wells from
where drinking water is drawn from. The organic law also requires that any act concerned
with water resources be subject to prior environmental impact assessment before its
implementation and in accordance with relevant regulations.
4.2.2.3. Law governing land in Rwanda, 2013
The Law N° 43/2013 of 16/06/2013 governing land in Rwanda was introduced to regulate the
use and management of land in a way that both improves the livelihoods of people and
protects the water resources. The law identifies land which can be used for various activities
and the land which is protected or reserved for environmental protection. It is in this regard
that the land occupied by lakes and rivers, shores of lakes, rivers and streams, land occupied
by springs and wells, were classified in the category of state land in the public domain.
Concerning the boundary of the area around a water source that is considered to be part of the
public domain and therefore requiring protection, Ministerial Order N° 007/16.01 of
15/07/2010 determining the length of land on shores of lakes and rivers transferred to public
property, which was established to implement the 2005 organic law on environmental
protection, provides for 50 m width for lakes (article 2), 10 m width for big rivers, 5 m width
for small rivers and 2 m width for other rivers not listed in the order including wells and
springs.
30
For protection purposes of the above determined water sources buffer zone, no activities or
buildings are authorized on the said land except activities aiming at protecting lakes, rivers,
shores or activities authorized by the Minister in charge of environment and when such
activities are deemed not destructive to the environment on condition that a prior
environmental impact assessment study has been done.
Therefore, Legal frameworks are an important and integral part of effective integrated water
resources management. In order to be effective, the rules devised under legal frameworks for
water resources management as discussed above must be fully implemented (i.e. put into
practice) and be capable to be enforced (i.e. where the rules are not followed, they can be
required to be followed through enforcement mechanisms). Institutions and individuals are
key prayers in implementation and enforcement process and have to be capacitated for them
to fulfill their mandates as provided for by different laws and regulations.
4.3 Protection of the water resources (springs) at the district level
Under the general principles provided for by the water law (article 5) on the management of
water resources, one of them is on “the prevention of the pollution with priority to the sources
“and the other one is the “user-payer and polluter payer” principles according to which the
user of water and the polluter support a significant part of expenses resulting from measures
of prevention, of pollution reduction and restoration of the resource in quality and in
quantity”.
In respect to the above, the District should implement measures to protect and reserve
catchment area around wells and springs from where drinking water is drawn as provided
for by article 51 of Organic Law on environmental protection. This kind of measures
includes protective fences to surround places where water is drawn for human
consumption as required by article 16 of the same Organic Law. In addition to this, each
well or spring should have a Protection Committee of at least three members elected from
the users of the well or the spring. The Protection Committee will ensure the protection
and management of the well or spring on a daily basis and report to local authorities who
pollute the water sources in order to ensure implementation of “user-payer and polluter
payer” principles.
More specifically institutions at lowest level/user level (water user’s associations /water user’s
committees) have to be created and their capacities enhanced as far as water resources
management and protection are concerned as per subsidiarity principle.
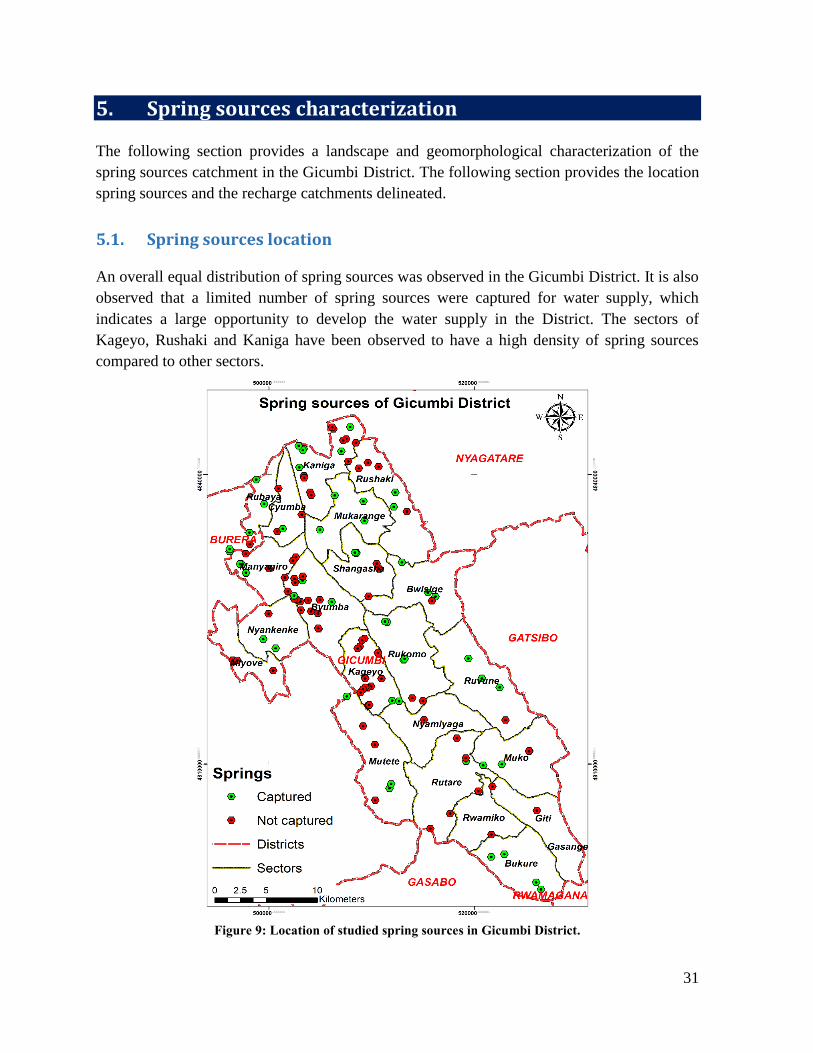
31
5. Spring sources characterization
The following section provides a landscape and geomorphological characterization of the
spring sources catchment in the Gicumbi District. The following section provides the location
spring sources and the recharge catchments delineated.
5.1. Spring sources location
An overall equal distribution of spring sources was observed in the Gicumbi District. It is also
observed that a limited number of spring sources were captured for water supply, which
indicates a large opportunity to develop the water supply in the District. The sectors of
Kageyo, Rushaki and Kaniga have been observed to have a high density of spring sources
compared to other sectors.
Figure 9: Location of studied spring sources in Gicumbi District.
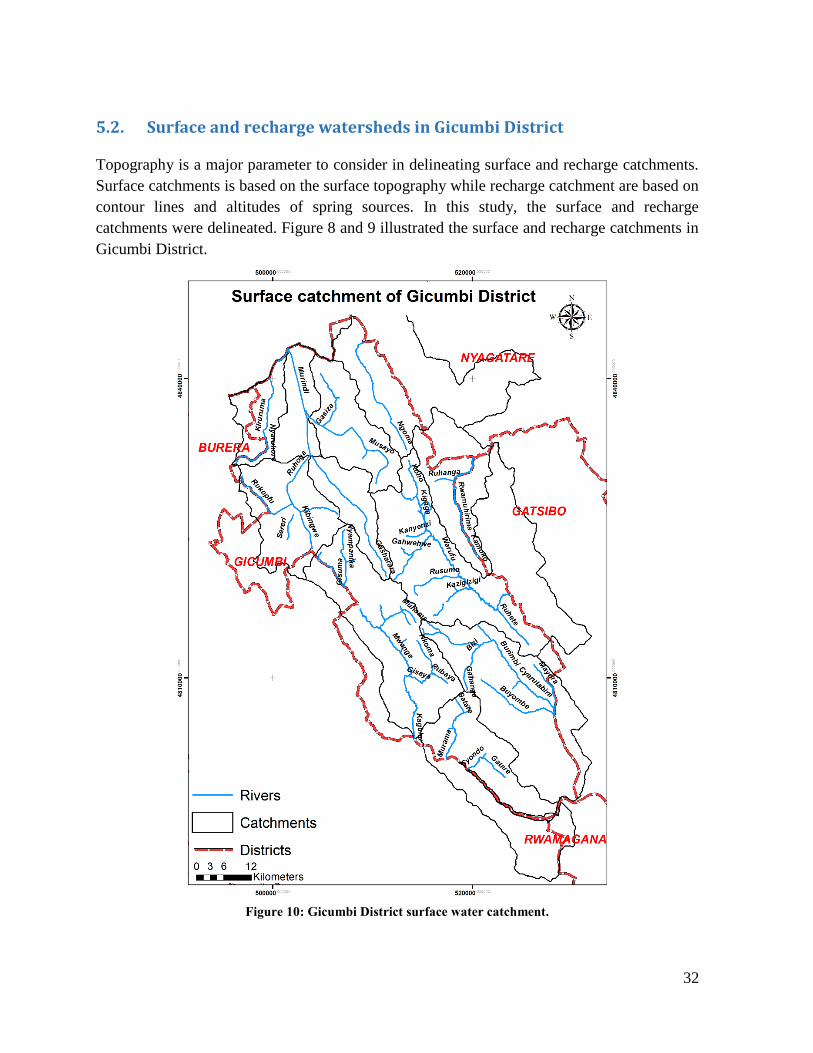
32
5.2. Surface and recharge watersheds in Gicumbi District
Topography is a major parameter to consider in delineating surface and recharge catchments.
Surface catchments is based on the surface topography while recharge catchment are based on
contour lines and altitudes of spring sources. In this study, the surface and recharge
catchments were delineated. Figure 8 and 9 illustrated the surface and recharge catchments in
Gicumbi District.
Figure 10: Gicumbi District surface water catchment.
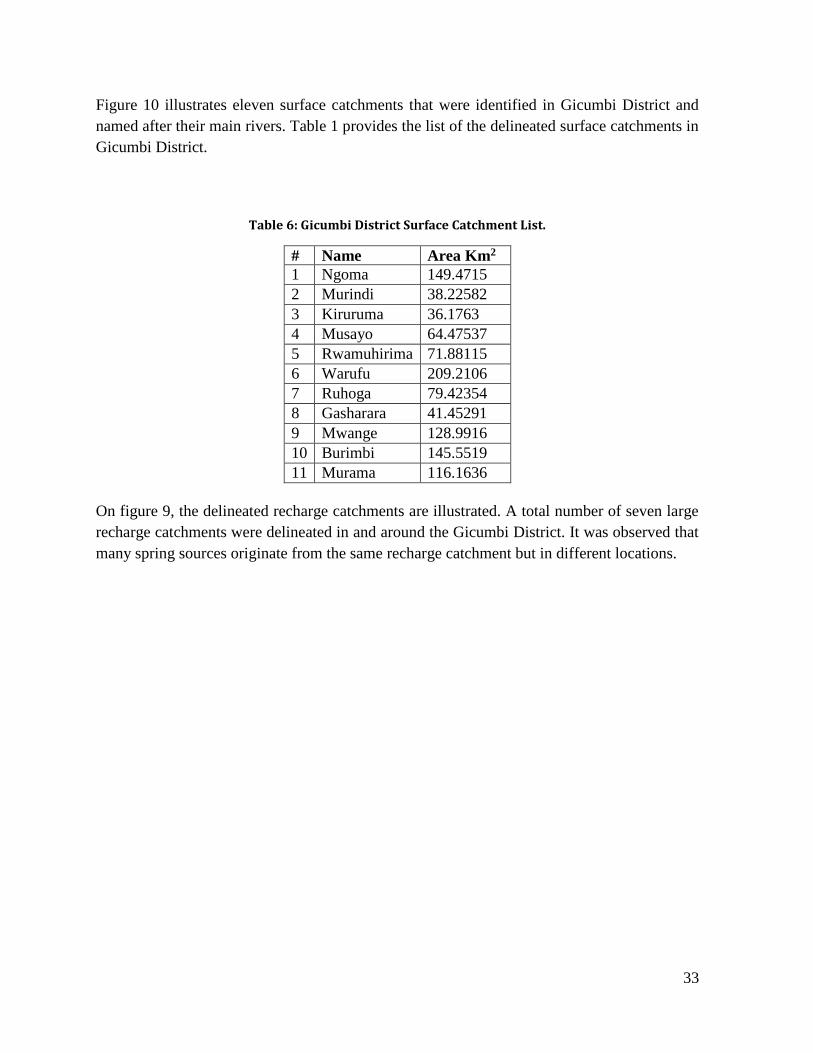
33
Figure 10 illustrates eleven surface catchments that were identified in Gicumbi District and
named after their main rivers. Table 1 provides the list of the delineated surface catchments in
Gicumbi District.
Table 6: Gicumbi District Surface Catchment List.
# Name Area Km2
1 Ngoma 149.4715
2 Murindi 38.22582
3 Kiruruma 36.1763
4 Musayo 64.47537
5 Rwamuhirima 71.88115
6 Warufu 209.2106
7 Ruhoga 79.42354
8 Gasharara 41.45291
9 Mwange 128.9916
10 Burimbi 145.5519
11 Murama 116.1636
On figure 9, the delineated recharge catchments are illustrated. A total number of seven large
recharge catchments were delineated in and around the Gicumbi District. It was observed that
many spring sources originate from the same recharge catchment but in different locations.

34
Figure 11: Spring Sources Recharge catchments in Gicumbi District.
A descriptive summary of all recharge catchments is provided in table 3.
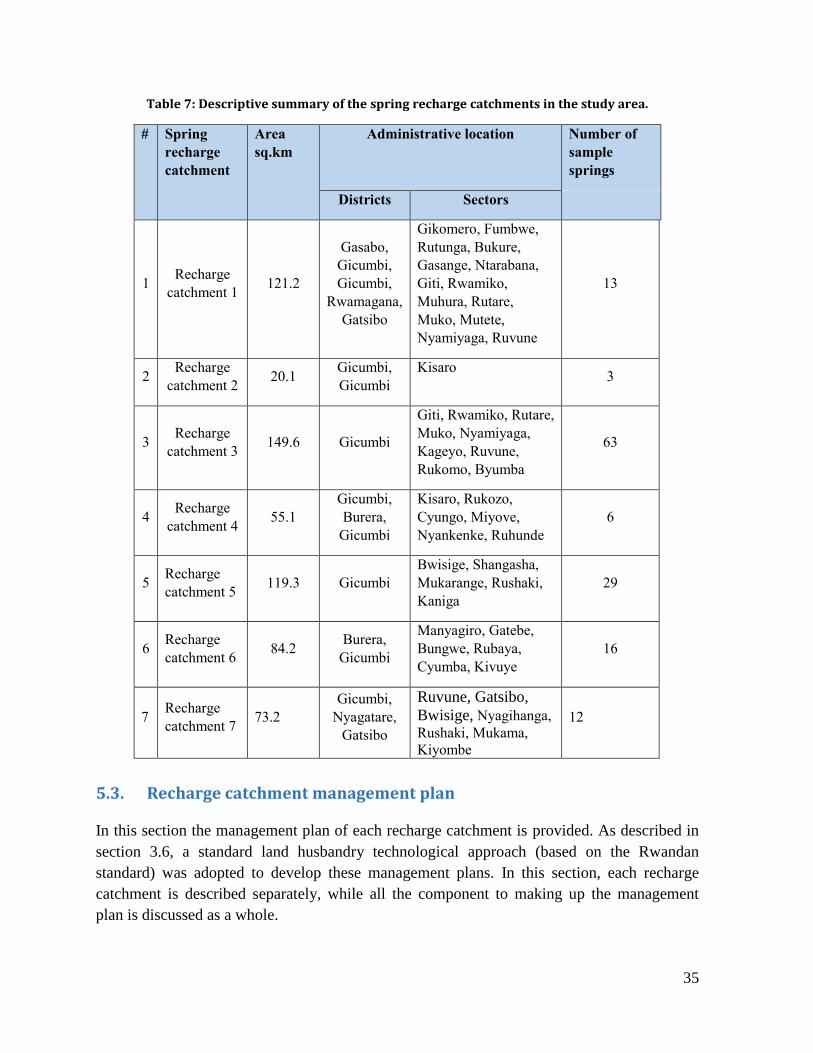
35
Table 7: Descriptive summary of the spring recharge catchments in the study area.
# Spring
recharge
catchment
Area
sq.km
Administrative location Number of
sample
springs
Districts Sectors
1 Recharge
catchment 1 121.2
Gasabo,
Gicumbi,
Gicumbi,
Rwamagana,
Gatsibo
Gikomero, Fumbwe,
Rutunga, Bukure,
Gasange, Ntarabana,
Giti, Rwamiko,
Muhura, Rutare,
Muko, Mutete,
Nyamiyaga, Ruvune
13
2 Recharge
catchment 2 20.1
Gicumbi,
Gicumbi
Kisaro 3
3 Recharge
catchment 3 149.6 Gicumbi
Giti, Rwamiko, Rutare,
Muko, Nyamiyaga,
Kageyo, Ruvune,
Rukomo, Byumba
63
4 Recharge
catchment 4 55.1
Gicumbi,
Burera,
Gicumbi
Kisaro, Rukozo,
Cyungo, Miyove,
Nyankenke, Ruhunde
6
5 Recharge
catchment 5 119.3 Gicumbi
Bwisige, Shangasha,
Mukarange, Rushaki,
Kaniga
29
6 Recharge
catchment 6 84.2
Burera,
Gicumbi
Manyagiro, Gatebe,
Bungwe, Rubaya,
Cyumba, Kivuye
16
7 Recharge
catchment 7 73.2
Gicumbi,
Nyagatare,
Gatsibo
Ruvune, Gatsibo,
Bwisige, Nyagihanga,
Rushaki, Mukama,
Kiyombe
12
5.3. Recharge catchment management plan
In this section the management plan of each recharge catchment is provided. As described in
section 3.6, a standard land husbandry technological approach (based on the Rwandan
standard) was adopted to develop these management plans. In this section, each recharge
catchment is described separately, while all the component to making up the management
plan is discussed as a whole.

36
5.3.1. Spring recharge catchment 1
The description of the spring recharge catchment 1 is provided in table 7.
Figure 12: Recharge catchment 1 management plan.
A dominance of deep soil (above 1 m depth covering 5,521 ha) is observed in the recharge
catchment 1. In combination to its topographical set up (having 6,315.17 ha of slope varying
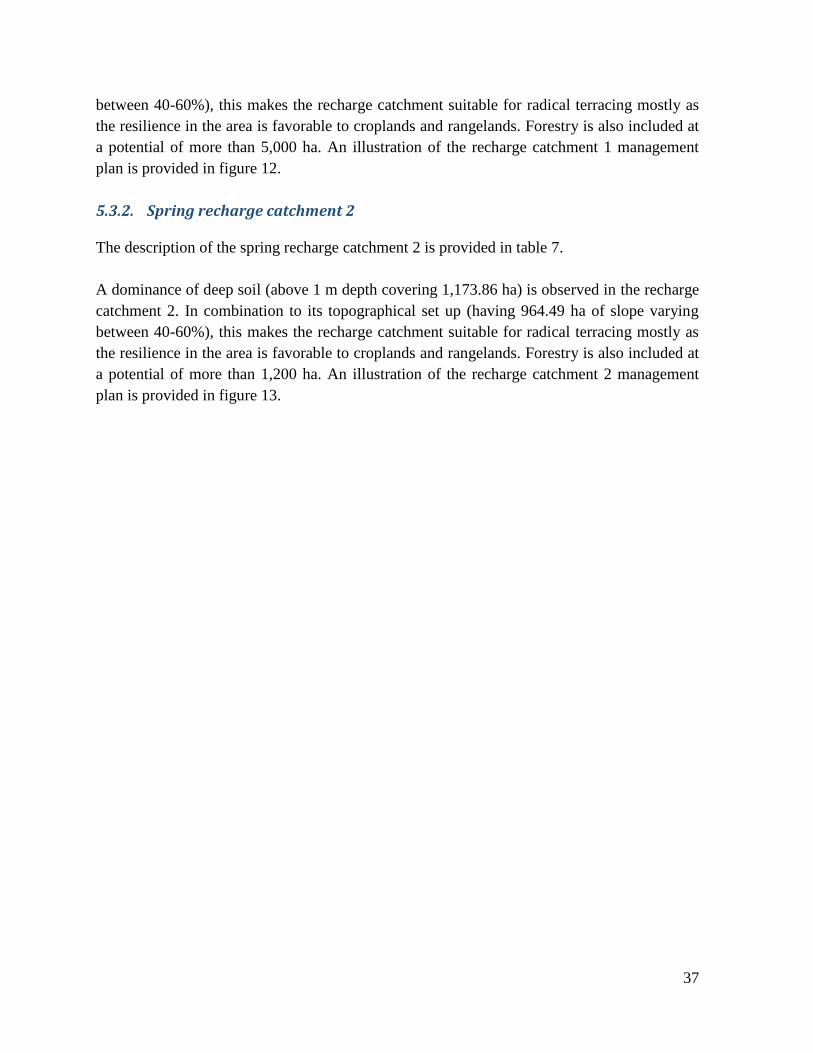
37
between 40-60%), this makes the recharge catchment suitable for radical terracing mostly as
the resilience in the area is favorable to croplands and rangelands. Forestry is also included at
a potential of more than 5,000 ha. An illustration of the recharge catchment 1 management
plan is provided in figure 12.
5.3.2. Spring recharge catchment 2
The description of the spring recharge catchment 2 is provided in table 7.
A dominance of deep soil (above 1 m depth covering 1,173.86 ha) is observed in the recharge
catchment 2. In combination to its topographical set up (having 964.49 ha of slope varying
between 40-60%), this makes the recharge catchment suitable for radical terracing mostly as
the resilience in the area is favorable to croplands and rangelands. Forestry is also included at
a potential of more than 1,200 ha. An illustration of the recharge catchment 2 management
plan is provided in figure 13.
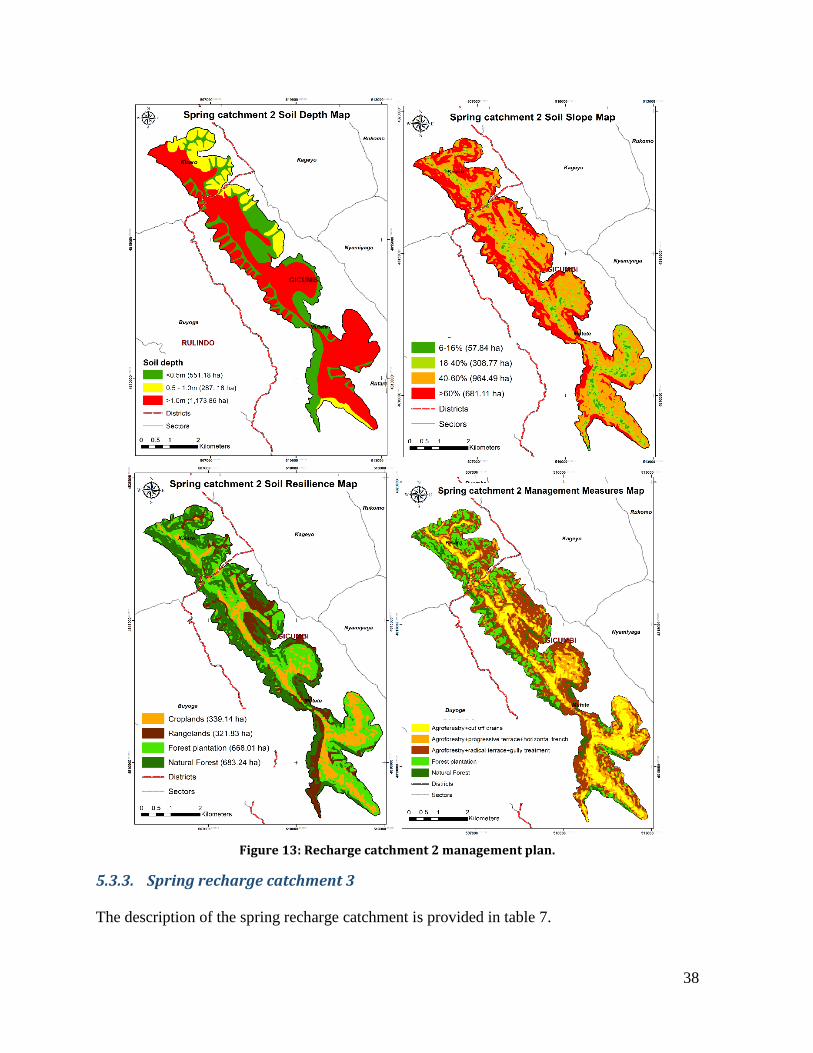
38
Figure 13: Recharge catchment 2 management plan.
5.3.3. Spring recharge catchment 3
The description of the spring recharge catchment is provided in table 7.

39
A dominance of deep soil (above 1 m depth covering 7,714.61 ha) is observed in the recharge
catchment 3. In combination to its topographical set up (having 7,372 ha of slope varying
between 40-60%), this makes the recharge catchment suitable for radical terracing mostly as
the resilience in the area is favorable to croplands and rangelands. Forestry is also included at
a potential of more than 10,000 ha. An illustration of the recharge catchment 3 management
plan is provided in figure 14.
Figure 14: Recharge catchment 3 management plan.
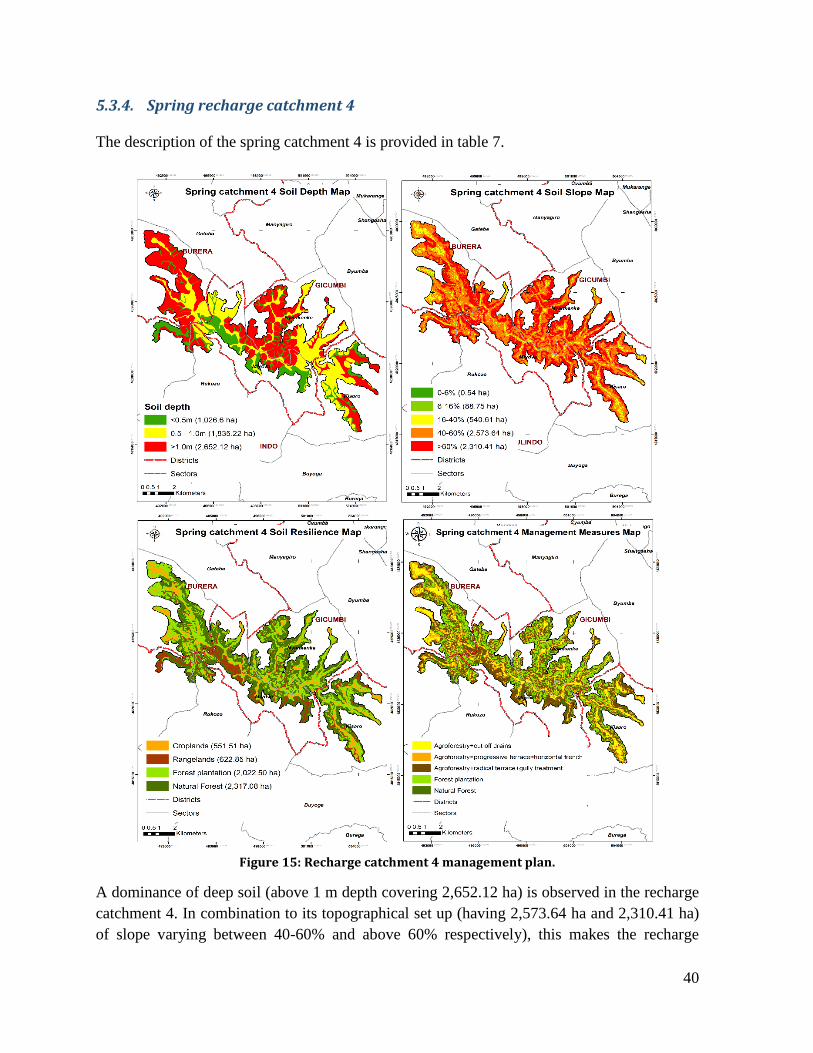
40
5.3.4. Spring recharge catchment 4
The description of the spring catchment 4 is provided in table 7.
Figure 15: Recharge catchment 4 management plan.
A dominance of deep soil (above 1 m depth covering 2,652.12 ha) is observed in the recharge
catchment 4. In combination to its topographical set up (having 2,573.64 ha and 2,310.41 ha)
of slope varying between 40-60% and above 60% respectively), this makes the recharge

41
catchment suitable for radical terracing mostly as the resilience in the area is favorable to
croplands and rangelands. In addition, forestry is a major component, with more than 4,000
ha, in this area due to its topography. An illustration of the recharge catchment 4 management
plan is provided in figure 15.
5.3.5. Spring recharge catchment 5
The description of the recharge catchment 5 is provided in table 7.
A dominance of moderately deep soil (between 0.5 to 1 m depth covering 6,110.7 ha) is
observed in the recharge catchment 5. In combination to its topographical set up (having
4,816.96 ha and 4,722.91 ha of slope varying between 40-60% and above 60% respectively),
this makes the recharge catchment suitable for Forestry with a potential of more than 7,000 ha
and to some extent radical terracing. An illustration of the recharge catchment 5 management
plan is provided in figure 16.

42
Figure 16: Recharge catchment 5 management plan.
5.3.6. Spring recharge catchment 6
The description of the recharge catchment 6 is provided in table 7.
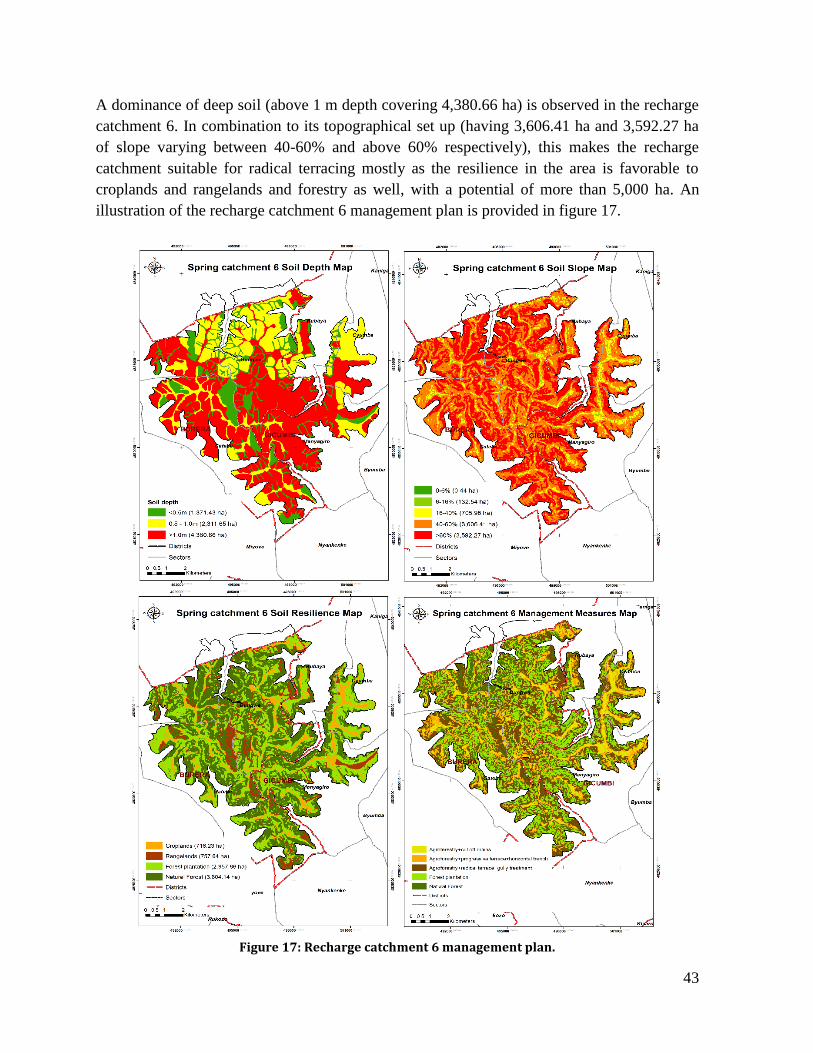
43
A dominance of deep soil (above 1 m depth covering 4,380.66 ha) is observed in the recharge
catchment 6. In combination to its topographical set up (having 3,606.41 ha and 3,592.27 ha
of slope varying between 40-60% and above 60% respectively), this makes the recharge
catchment suitable for radical terracing mostly as the resilience in the area is favorable to
croplands and rangelands and forestry as well, with a potential of more than 5,000 ha. An
illustration of the recharge catchment 6 management plan is provided in figure 17.
Figure 17: Recharge catchment 6 management plan.
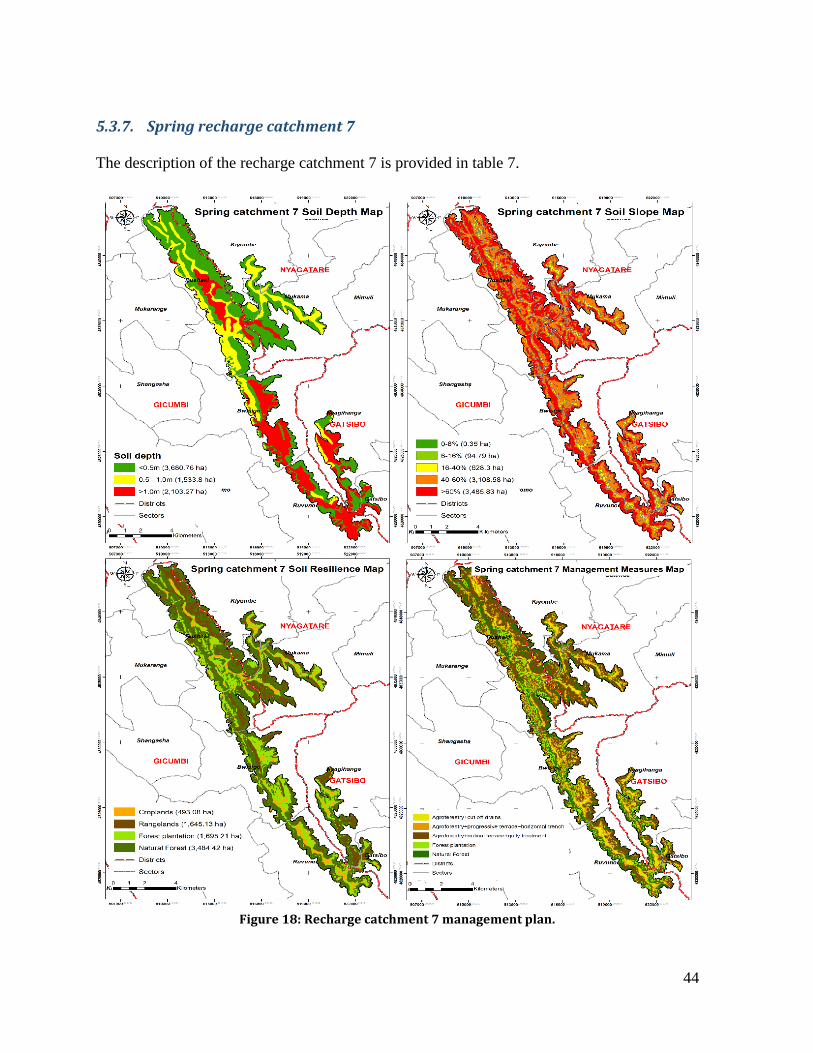
44
5.3.7. Spring recharge catchment 7
The description of the recharge catchment 7 is provided in table 7.
Figure 18: Recharge catchment 7 management plan.
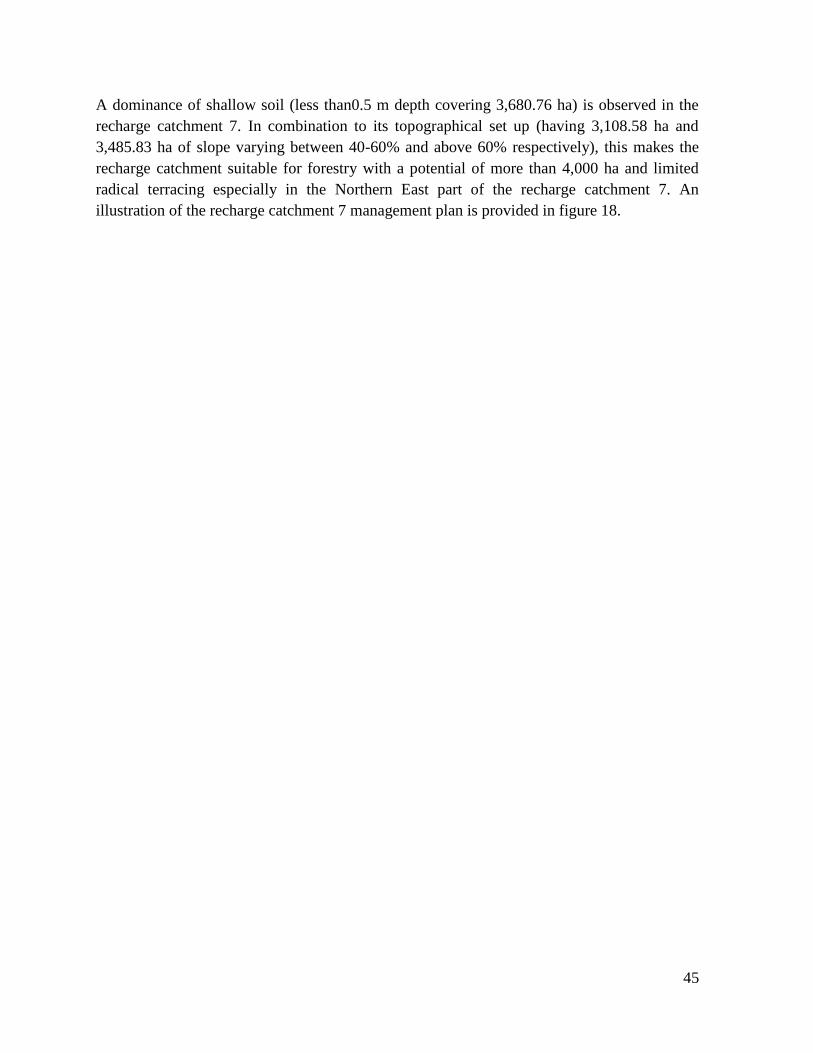
45
A dominance of shallow soil (less than0.5 m depth covering 3,680.76 ha) is observed in the
recharge catchment 7. In combination to its topographical set up (having 3,108.58 ha and
3,485.83 ha of slope varying between 40-60% and above 60% respectively), this makes the
recharge catchment suitable for forestry with a potential of more than 4,000 ha and limited
radical terracing especially in the Northern East part of the recharge catchment 7. An
illustration of the recharge catchment 7 management plan is provided in figure 18.

46
6. Hydrology
6.1. Physical description of the Mwange River catchment
Mwange River catchment is approximately 123 sq. km. agriculture is the major land use in the
catchment. Forest cover is very limited in the catchment and its location is in the lowland,
especially near the outlet of the catchment. The topography of the catchment is complex, in
the sense that abrupt changes on small distance, resulting in steep slopes are observed along
the catchment. It varies approximately between 1,435 and 2,283 m a.s.l. The soil classes in the
catchment are mainly composed of humic soils (indicate high organic matter content in the
soil). Dystric soils (poor in nutrients and found in tropical area) are also spread across the
catchment area. In addition Umbric soils (dark soil rich in organic matter) are concentrated at
the outlet of the catchment, where an irrigation scheme is located. Four geological formation
are observed in the catchment area. The main formation is the Rk (known as the Rukomo
formation: Conglomerate of gravel, sandstone grain size and schist regularly alternating
between beds and bench). In addition, these formations Ho (Alluvial of valley, lower &
middle terraces, cones of dejection. Holocene & Pleistocene undifferentiated), Bus (Base
formation: Pelitical dominant matrix with graphitic membranes of black schist and thick
regular bedding membranes of fine sandstone and schist with large benches of isolated
sandstone) and Bi (Bulimbi formation: Pelitical dominant matrix with very thick membranes
made of a regular alternation of sandstone and schist beds. Local levels volcano-sedimentary
character) are also observed in the catchment area. The Rk formation is known to favor high
infiltration into the soil as a result of its physical characteristics (soil mechanics).
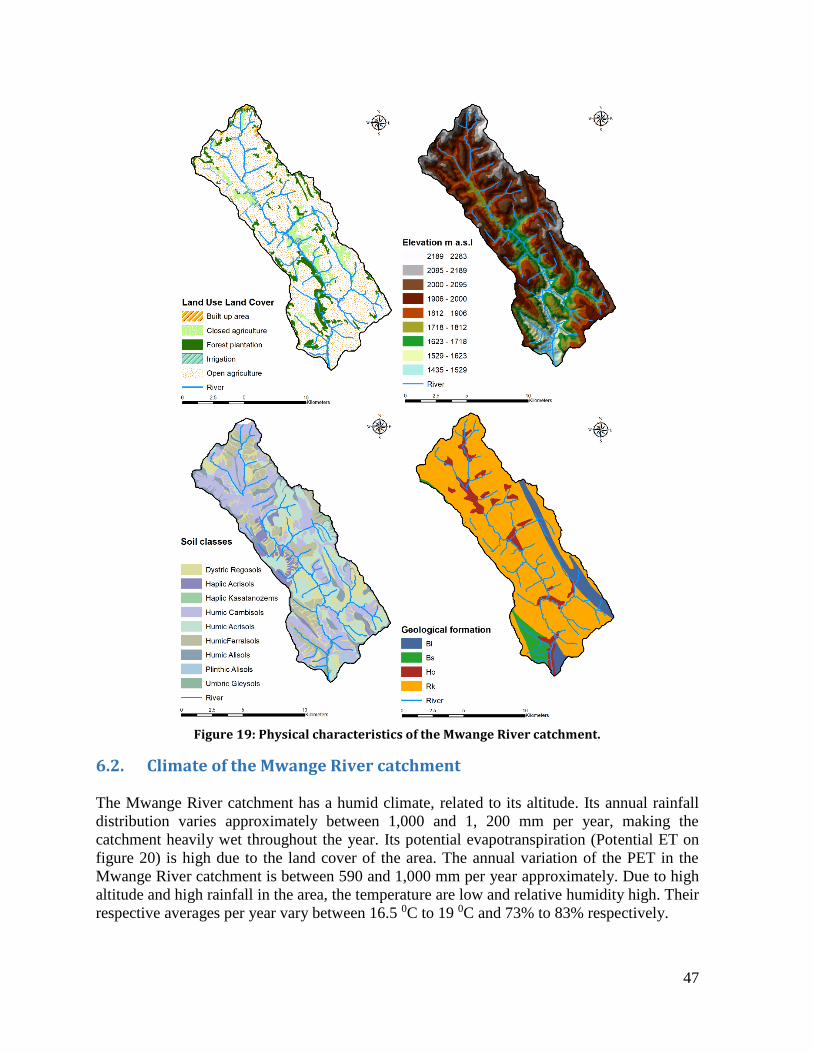
47
Figure 19: Physical characteristics of the Mwange River catchment.
6.2. Climate of the Mwange River catchment
The Mwange River catchment has a humid climate, related to its altitude. Its annual rainfall
distribution varies approximately between 1,000 and 1, 200 mm per year, making the
catchment heavily wet throughout the year. Its potential evapotranspiration (Potential ET on
figure 20) is high due to the land cover of the area. The annual variation of the PET in the
Mwange River catchment is between 590 and 1,000 mm per year approximately. Due to high
altitude and high rainfall in the area, the temperature are low and relative humidity high. Their
respective averages per year vary between 16.5 0C to 19 0C and 73% to 83% respectively.
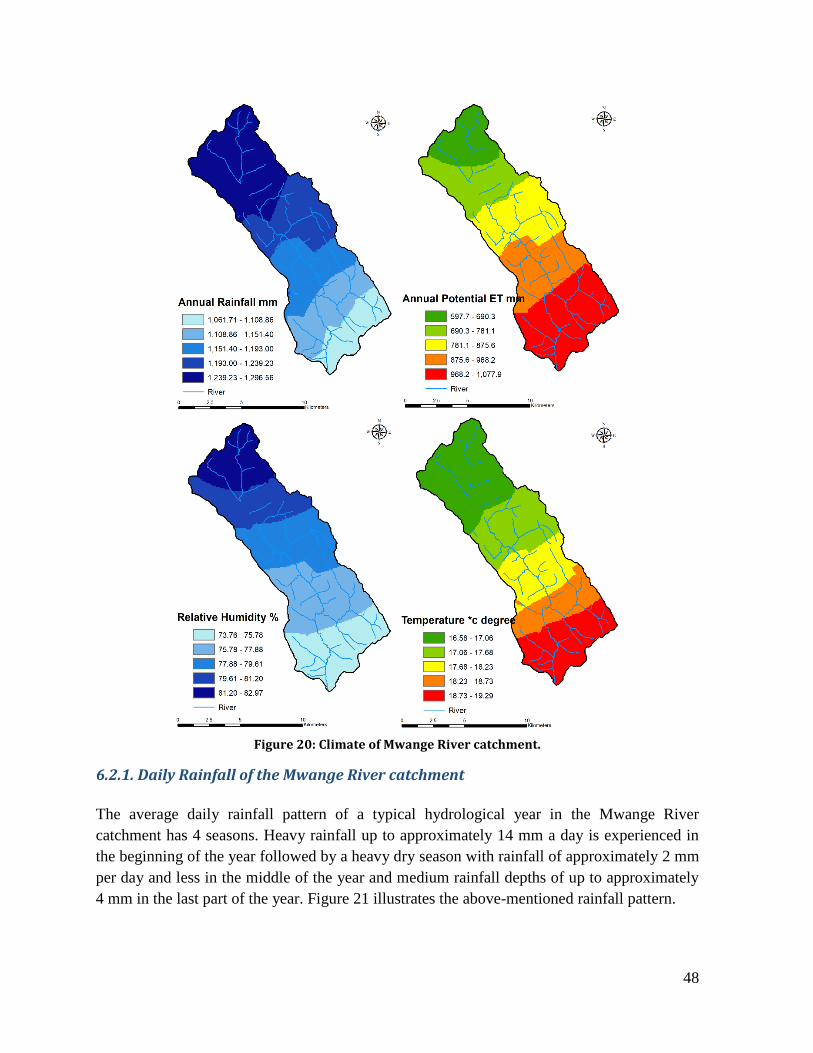
48
Figure 20: Climate of Mwange River catchment.
6.2.1. Daily Rainfall of the Mwange River catchment
The average daily rainfall pattern of a typical hydrological year in the Mwange River
catchment has 4 seasons. Heavy rainfall up to approximately 14 mm a day is experienced in
the beginning of the year followed by a heavy dry season with rainfall of approximately 2 mm
per day and less in the middle of the year and medium rainfall depths of up to approximately
4 mm in the last part of the year. Figure 21 illustrates the above-mentioned rainfall pattern.

49
Figure 21: Daily rainfall pattern.
The same pattern is observed in terms of monthly figures as illustrated on figure22. This
clearly shows that the months of March, April and May constitute the biggest supply of
rainfall water and therefore aquifer recharge. This is followed by the heavy dry period
representing the biggest water consumption period lasting from June to August. The rest of
the months representing a medium recharge period. Depending on the degree of water
consumption (especially when unplanned) this period can easily serve for only recharging
lightly the natural water system.
Figure 22: Monthly rainfall.
0
2
4
6
8
10
12
14
16
1
15
29
43
57
71
85
99
11
3
12
7
14
1
15
5
16
9
18
3
19
7
21
1
22
5
23
9
25
3
26
7
28
1
29
5
30
9
32
3
33
7
35
1
36
5
Rai
nfa
ll m
m
Days
Daily Rainfall
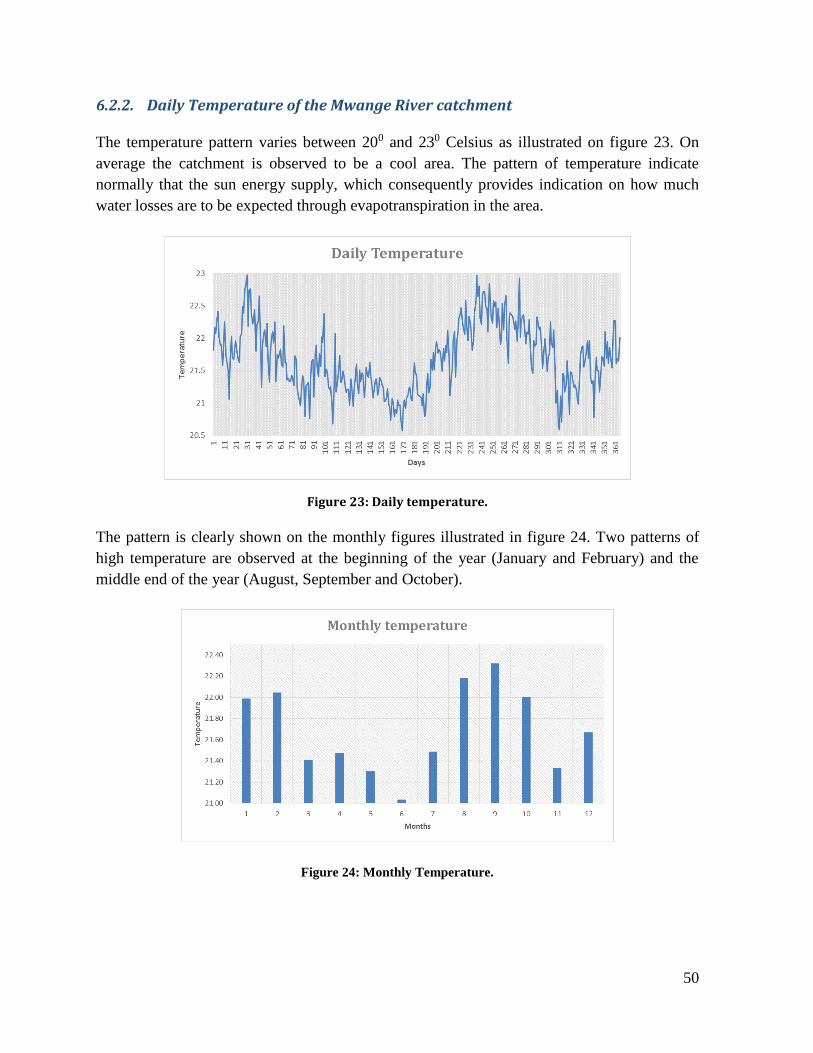
50
6.2.2. Daily Temperature of the Mwange River catchment
The temperature pattern varies between 200 and 230 Celsius as illustrated on figure 23. On
average the catchment is observed to be a cool area. The pattern of temperature indicate
normally that the sun energy supply, which consequently provides indication on how much
water losses are to be expected through evapotranspiration in the area.
Figure 23: Daily temperature.
The pattern is clearly shown on the monthly figures illustrated in figure 24. Two patterns of
high temperature are observed at the beginning of the year (January and February) and the
middle end of the year (August, September and October).
Figure 24: Monthly Temperature.

51
6.2.3. Daily Evapotranspiration of the Mwange River catchment
The evapotranspiration constitutes the biggest natural water loss of the Mwange River
catchment. This process is a component of the water cycle, technically it is not a water loss
however; for the purpose of water resources management it is considered as such because it
cannot be harvested nor used. Its pattern differ from the rainfall. It can be observed from
figure 25 that heavy daily evapotranspiration occurs in August. The reason of this trend can
be explained by the fact that evapotranspiration occur when energy, water and plants are
available. In August there is enough energy from the sun mixed with water in the natural
system, additionally for the month of July an explanation of the high evapotranspiration will
be related to the probable heavy transpiration from plants.
Figure 25: Daily evapotranspiration.
The pattern is clearly shown on the monthly figures illustrated in figure 26. The last part of
the year has high evapotranspiration, considering the medium rainfall contribution; this will
constitutes a limited recharge period for the catchment water resources system in general.
Figure 26: Monthly evapotranspiration of Gicumbi.

52
6.3. Existing flow data
The illustrated catchments in figure 10 are the entire river system considered with either the
whole catchment included in the Gicumbi District or a portion of it but which can be easily
accessed from within the District. There is an existing gauging station on Mwange River. The
flow data from this station was analyzed in this study to provide a basic indication of the
availability of the water resources in terms of surface water.
The following section discuss the available flow data. These were obtained from the existing
database of the Rwanda Water and Forestry Authority. The available data were limited but
they served to estimate an average daily flow at the gauging station of the Mwange river. Note
that, flow data are a result of water level data that were converted into flow data using a rating
curve developed at the gauging station section of the Mwange river.
The Mwange River has a flow variation between 0.1 and 0.5 cubic meters per second on daily
average within its hydrological year. The potential of this river is limited, however possibility
of combining many river resources for exploitation is not to be excluded.
Figure 27: Mwange River Daily Flow.
The pattern of the Mwange River indicates that the River Mwange has a direct response to
rainfall in the area. Also, the Base flow of the river is quite high compare to the size of the
river indicating that this river maybe easily polluted from the surrounding activities in the
area. As the pattern is directly linking to rainfall, it is advised for proper river water
utilization, to think about storing the water during the rainfall period and using tit during the
0.0
0.1
0.2
0.3
0.4
0.5
0.6
1
15
29
43
57
71
85
99
11
3
12
7
14
1
15
5
16
9
18
3
19
7
21
1
22
5
23
9
25
3
26
7
28
1
29
5
30
9
32
3
33
7
35
1
36
5
Dis
char
ge m
3/s
Days
Average Daily Flow
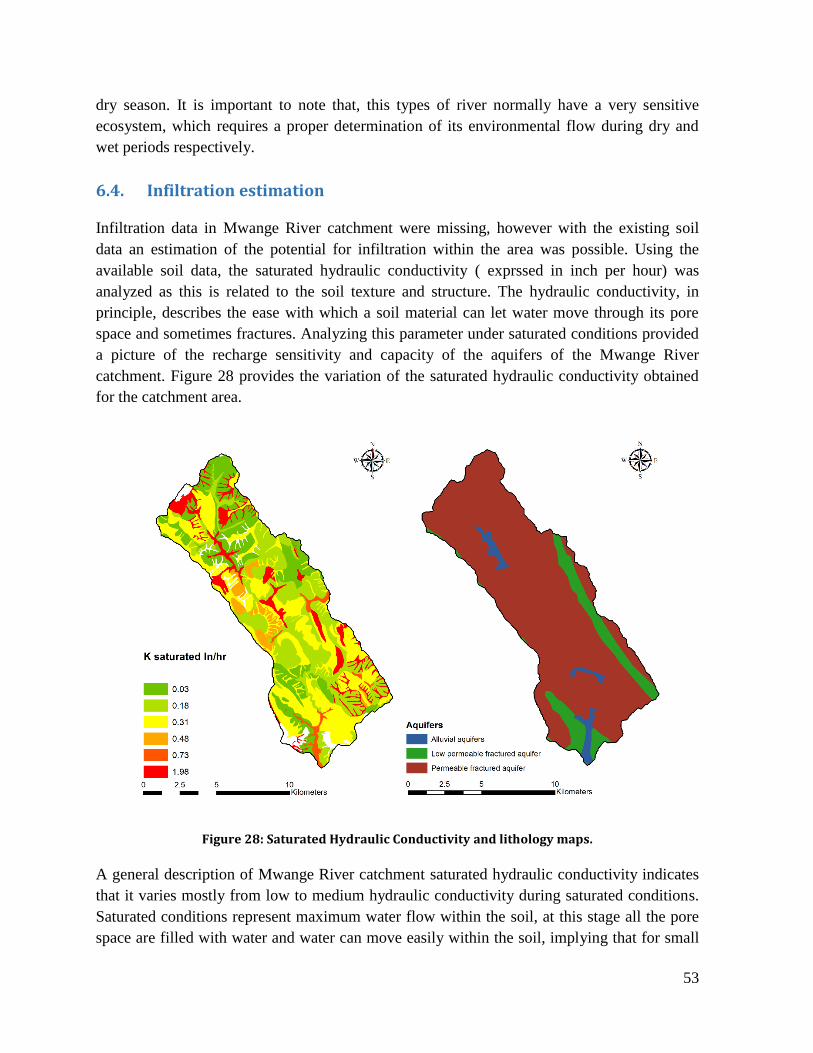
53
dry season. It is important to note that, this types of river normally have a very sensitive
ecosystem, which requires a proper determination of its environmental flow during dry and
wet periods respectively.
6.4. Infiltration estimation
Infiltration data in Mwange River catchment were missing, however with the existing soil
data an estimation of the potential for infiltration within the area was possible. Using the
available soil data, the saturated hydraulic conductivity ( exprssed in inch per hour) was
analyzed as this is related to the soil texture and structure. The hydraulic conductivity, in
principle, describes the ease with which a soil material can let water move through its pore
space and sometimes fractures. Analyzing this parameter under saturated conditions provided
a picture of the recharge sensitivity and capacity of the aquifers of the Mwange River
catchment. Figure 28 provides the variation of the saturated hydraulic conductivity obtained
for the catchment area.
Figure 28: Saturated Hydraulic Conductivity and lithology maps.
A general description of Mwange River catchment saturated hydraulic conductivity indicates
that it varies mostly from low to medium hydraulic conductivity during saturated conditions.
Saturated conditions represent maximum water flow within the soil, at this stage all the pore
space are filled with water and water can move easily within the soil, implying that for small
54
and very high hydraulic conductivities in the area, the high the sensitivity of the soil-water
system to the land use/land cover. This particularly lead to promoting soil management
measures which will consequently conserve, restore and/or improve the infiltration capacity
of the soil in the area, therefore positively affecting the infiltration capacity of the soil and
ultimately the recharge rate of the aquifers. Note that, the type of aquifers under the Mwange
River catchment do not hold water because of the fractures meaning that pumping them
maybe easy similarly as polluting them. There is also a probability of baseflow contribution
from these aquifer during the dry period. In this case, any pollution from the catchment may
ultimatly be observed in the River. Attention has to be taken when implementing any kind of
measures to protect the soil and conserve water in this catchment. Also, the use of pit latrines
as a sanitation technology pauses a quality threat to the groundwater resources in the area.
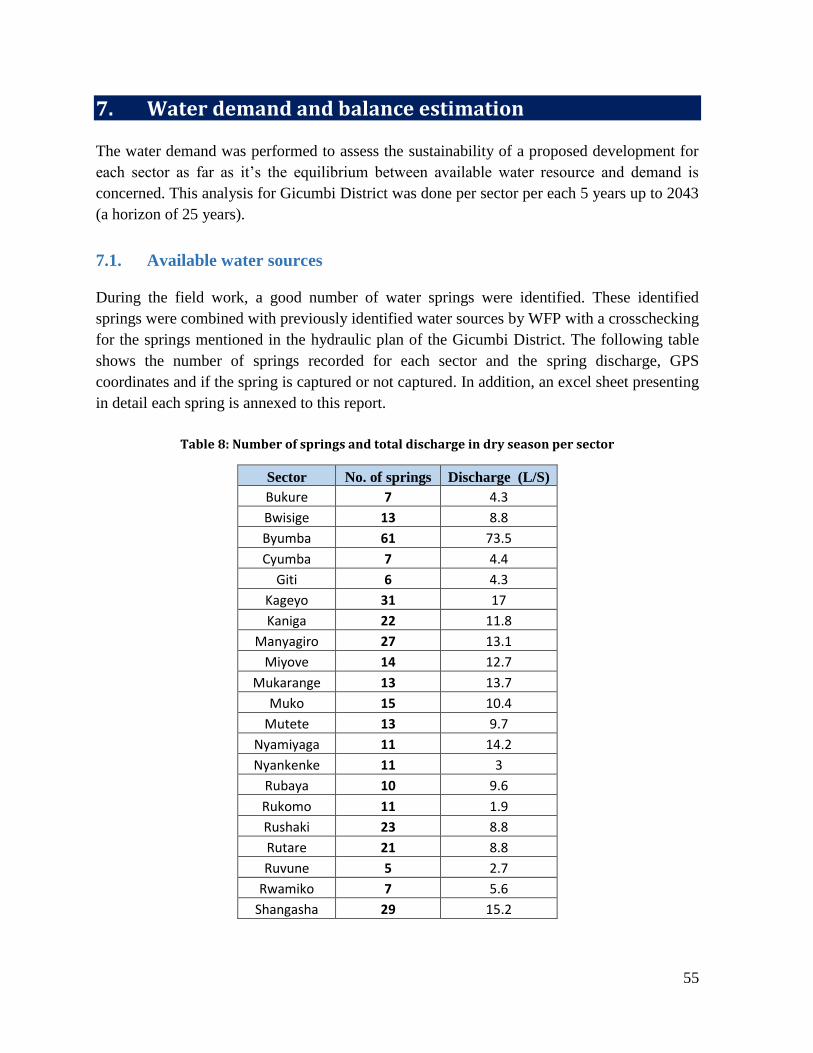
55
7. Water demand and balance estimation
The water demand was performed to assess the sustainability of a proposed development for
each sector as far as it’s the equilibrium between available water resource and demand is
concerned. This analysis for Gicumbi District was done per sector per each 5 years up to 2043
(a horizon of 25 years).
7.1. Available water sources
During the field work, a good number of water springs were identified. These identified
springs were combined with previously identified water sources by WFP with a crosschecking
for the springs mentioned in the hydraulic plan of the Gicumbi District. The following table
shows the number of springs recorded for each sector and the spring discharge, GPS
coordinates and if the spring is captured or not captured. In addition, an excel sheet presenting
in detail each spring is annexed to this report.
Table 8: Number of springs and total discharge in dry season per sector
Sector No. of springs Discharge (L/S)
Bukure 7 4.3
Bwisige 13 8.8
Byumba 61 73.5
Cyumba 7 4.4
Giti 6 4.3
Kageyo 31 17
Kaniga 22 11.8
Manyagiro 27 13.1
Miyove 14 12.7
Mukarange 13 13.7
Muko 15 10.4
Mutete 13 9.7
Nyamiyaga 11 14.2
Nyankenke 11 3
Rubaya 10 9.6
Rukomo 11 1.9
Rushaki 23 8.8
Rutare 21 8.8
Ruvune 5 2.7
Rwamiko 7 5.6
Shangasha 29 15.2
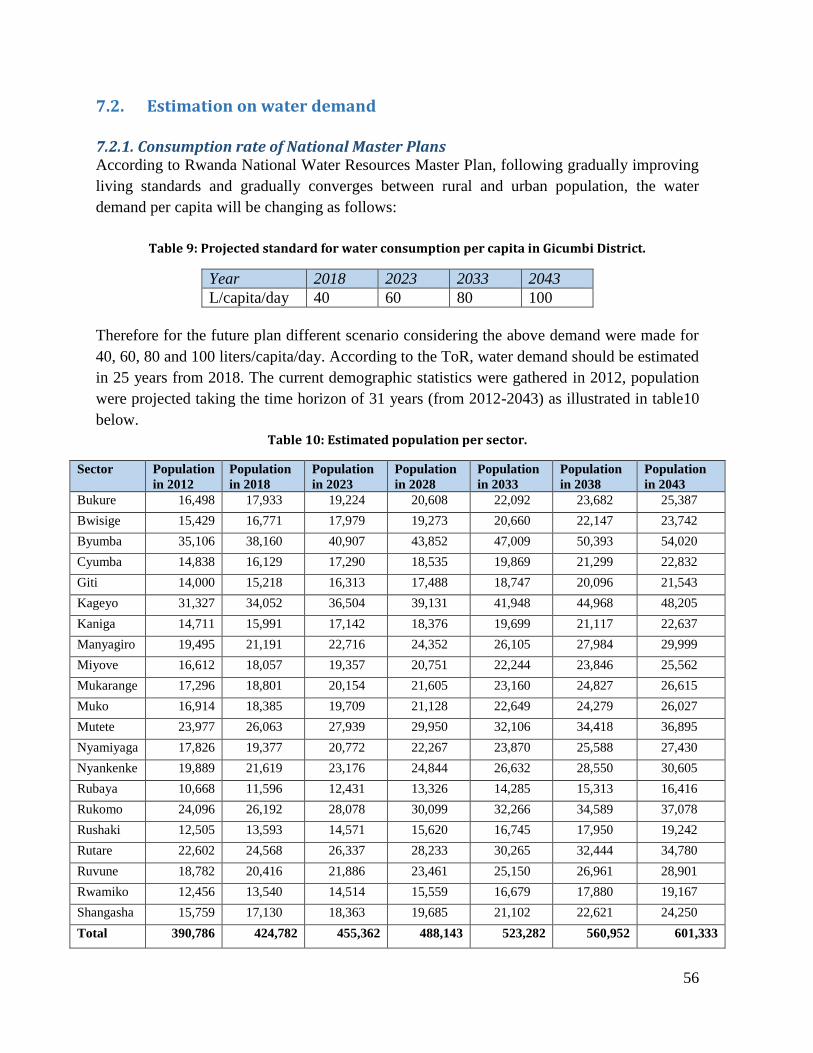
56
7.2. Estimation on water demand
7.2.1. Consumption rate of National Master Plans According to Rwanda National Water Resources Master Plan, following gradually improving
living standards and gradually converges between rural and urban population, the water
demand per capita will be changing as follows:
Table 9: Projected standard for water consumption per capita in Gicumbi District.
Year 2018 2023 2033 2043
L/capita/day 40 60 80 100
Therefore for the future plan different scenario considering the above demand were made for
40, 60, 80 and 100 liters/capita/day. According to the ToR, water demand should be estimated
in 25 years from 2018. The current demographic statistics were gathered in 2012, population
were projected taking the time horizon of 31 years (from 2012-2043) as illustrated in table10
below.
Table 10: Estimated population per sector.
Sector Population
in 2012
Population
in 2018
Population
in 2023
Population
in 2028
Population
in 2033
Population
in 2038
Population
in 2043
Bukure 16,498 17,933 19,224 20,608 22,092 23,682 25,387
Bwisige 15,429 16,771 17,979 19,273 20,660 22,147 23,742
Byumba 35,106 38,160 40,907 43,852 47,009 50,393 54,020
Cyumba 14,838 16,129 17,290 18,535 19,869 21,299 22,832
Giti 14,000 15,218 16,313 17,488 18,747 20,096 21,543
Kageyo 31,327 34,052 36,504 39,131 41,948 44,968 48,205
Kaniga 14,711 15,991 17,142 18,376 19,699 21,117 22,637
Manyagiro 19,495 21,191 22,716 24,352 26,105 27,984 29,999
Miyove 16,612 18,057 19,357 20,751 22,244 23,846 25,562
Mukarange 17,296 18,801 20,154 21,605 23,160 24,827 26,615
Muko 16,914 18,385 19,709 21,128 22,649 24,279 26,027
Mutete 23,977 26,063 27,939 29,950 32,106 34,418 36,895
Nyamiyaga 17,826 19,377 20,772 22,267 23,870 25,588 27,430
Nyankenke 19,889 21,619 23,176 24,844 26,632 28,550 30,605
Rubaya 10,668 11,596 12,431 13,326 14,285 15,313 16,416
Rukomo 24,096 26,192 28,078 30,099 32,266 34,589 37,078
Rushaki 12,505 13,593 14,571 15,620 16,745 17,950 19,242
Rutare 22,602 24,568 26,337 28,233 30,265 32,444 34,780
Ruvune 18,782 20,416 21,886 23,461 25,150 26,961 28,901
Rwamiko 12,456 13,540 14,514 15,559 16,679 17,880 19,167
Shangasha 15,759 17,130 18,363 19,685 21,102 22,621 24,250
Total 390,786 424,782 455,362 488,143 523,282 560,952 601,333
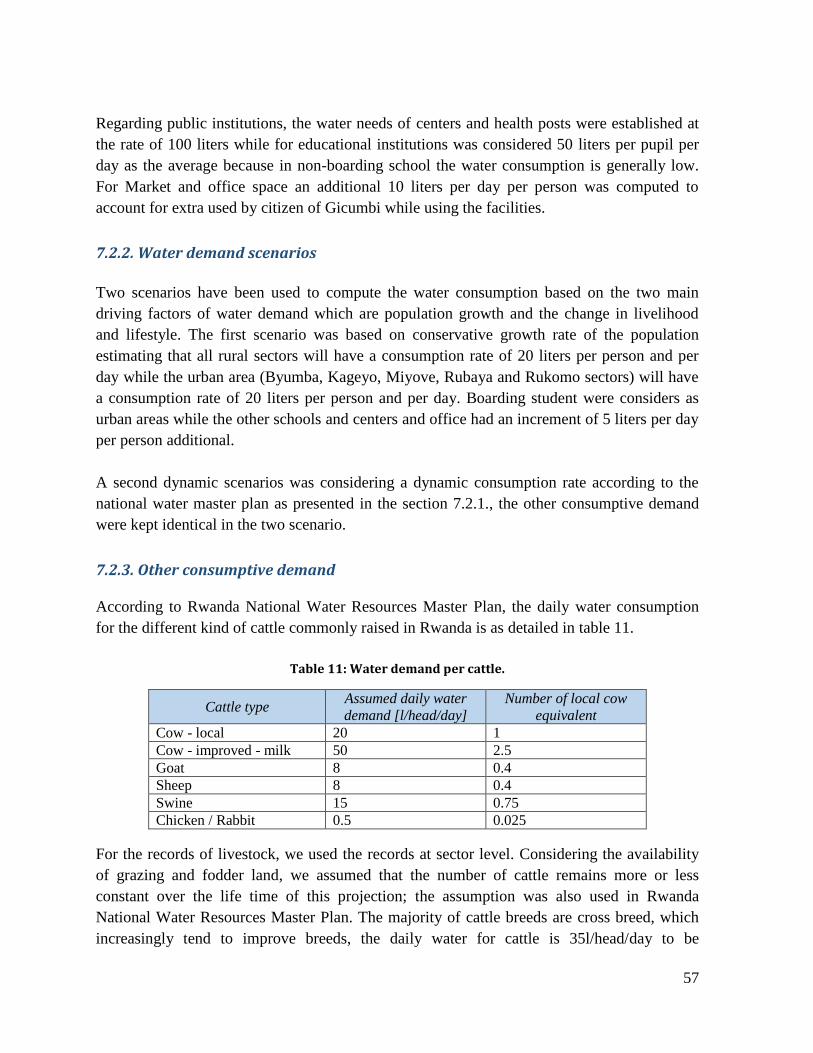
57
Regarding public institutions, the water needs of centers and health posts were established at
the rate of 100 liters while for educational institutions was considered 50 liters per pupil per
day as the average because in non-boarding school the water consumption is generally low.
For Market and office space an additional 10 liters per day per person was computed to
account for extra used by citizen of Gicumbi while using the facilities.
7.2.2. Water demand scenarios
Two scenarios have been used to compute the water consumption based on the two main
driving factors of water demand which are population growth and the change in livelihood
and lifestyle. The first scenario was based on conservative growth rate of the population
estimating that all rural sectors will have a consumption rate of 20 liters per person and per
day while the urban area (Byumba, Kageyo, Miyove, Rubaya and Rukomo sectors) will have
a consumption rate of 20 liters per person and per day. Boarding student were considers as
urban areas while the other schools and centers and office had an increment of 5 liters per day
per person additional.
A second dynamic scenarios was considering a dynamic consumption rate according to the
national water master plan as presented in the section 7.2.1., the other consumptive demand
were kept identical in the two scenario.
7.2.3. Other consumptive demand
According to Rwanda National Water Resources Master Plan, the daily water consumption
for the different kind of cattle commonly raised in Rwanda is as detailed in table 11.
Table 11: Water demand per cattle.
Cattle type Assumed daily water
demand [l/head/day]
Number of local cow
equivalent
Cow - local 20 1
Cow - improved - milk 50 2.5
Goat 8 0.4
Sheep 8 0.4
Swine 15 0.75
Chicken / Rabbit 0.5 0.025
For the records of livestock, we used the records at sector level. Considering the availability
of grazing and fodder land, we assumed that the number of cattle remains more or less
constant over the life time of this projection; the assumption was also used in Rwanda
National Water Resources Master Plan. The majority of cattle breeds are cross breed, which
increasingly tend to improve breeds, the daily water for cattle is 35l/head/day to be

58
42.5l/head/day in 2028 and 50l/head/day in 2038. Appendix 1 provides the estimated water
demand for each sector.
In addition, the water demand for industries was included in this report based on the few
existing industries in the district but also on the planned industries in the near future. The data
for planned and existing industries were obtained from the Gicumbi District Strategy of
Transformation, the Gicumbi District Master Plan as well as the Gicumbi district hydraulic
plan. Appendix 2 provides the type of industry that was considered per each sector for the
water demand estimation. Thus, the water demand were estimated per each five years until
2043 considering the population growth and the increase of other water demand activities
such as livestock and industrial consumption. Irrigation is very insignificant in Gicumbi with
only 1.7 % of irrigation monitored by the seasonal agriculture survey in 2017 (NISR, 2018).
The evapotranspiration was calculated based on average of Rwesero and Byumba
meteorological station with 3mm/day for surface irrigation and 0.8 mm for traditional
irrigation.

59
Figure 29: Water demand for Gicumbi District per sector estimation (A) conservation water consumption
rate scenario; (B) scenario based on National Water Master Plan consumption rate
7.3. Water demand and balance in Gicumbi District
Figure 30 illustrates the findings from the water demand and balance analysis for each Sector
of Gicumbi District. Attention is required to understand that the water demand/balance
analysis was done based on the daily basis with quantities expressed in liters per day. The
deficit and surplus (or in other words the water balance) were calculated as the difference of
water available (from existing spring sources) and water demands. In this particular case, the
unit is a representative “per capita” demand measure that encloses all the types of consumers
0
1000
2000
3000
4000
5000
6000
7000
8000
9000
'00
0 l/
day
Scenario A
2018 2023 2028 2033 2038 2043
0
1000
2000
3000
4000
5000
6000
7000
8000
9000
10000
'00
0 l/
day
Scenario B
2018 2023 2028 2033 2038 2043
60
in one single unit (i.e. all the water users such as humans, livestock, industries, etc.) are all
represented by the term “per unit”. This was done for appropriate illustration and analysis. An
integrated water resource development plan is supposed to consider all the water uses and this
is facilitated with the “per unit” approach as it considers all the uses and scale per day
consumption. The water demand estimation used population growth scenarios and water
consumption rate projection presented in the section 7.2.
As shown in figure 30, under a conservative scenario A for water consumption rate nearly ½
of sectors are non-water deficit, but with a modest surplus. Under this scenario in 20 years,
only Shangasha and Rushaki will be non-water deficit sectors, while in 10 years Byumba,
Manyagiro and Rubaya will still be non-water-deficit.
In a dynamic water consumption rate scenario B, the general observations are that the Sectors
of Byumba, Miyove, Kageyo, Rushaki, Nyamiyaga, Rubaya and Shangasha are currently
(2018) the only non-water deficit Sector of all. Byumba and Rubaya Sectors under the
population growth and water demand per capita scenario will remain the only non-water
deficit sector for the next 10 years. The reason of the deficit is not mainly the water demand
(Byumba sector having the highest) but the number of springs captured and managed that
favored Byumba sector with more than 60 springs used for the water supply of the Town.
Some sectors required specific attention given the number springs known and managed that
are very low (the detailed list of springs and their status is presented in a separate excel sheet
appended to this report). The sector Cyumba, Ruvune, Rwamiko and Giti Sectors are
particularly deficient in water supply considering the number springs (less than 10),
particularly Cyumba and Ruvune Sectors with total discharge of less than 5 liters per second.
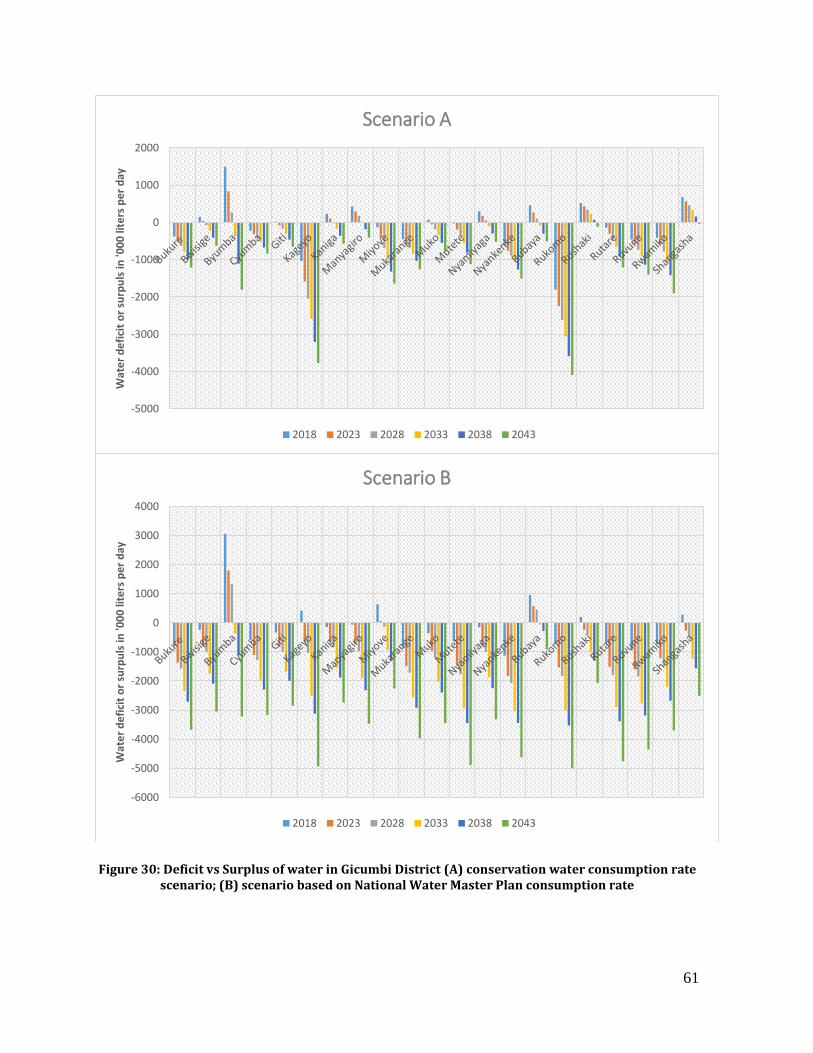
61
Figure 30: Deficit vs Surplus of water in Gicumbi District (A) conservation water consumption rate scenario; (B) scenario based on National Water Master Plan consumption rate
-5000
-4000
-3000
-2000
-1000
0
1000
2000
Wat
er
de
fici
t o
r su
rpu
ls in
'00
0 li
ters
pe
r d
ayScenario A
2018 2023 2028 2033 2038 2043
-6000
-5000
-4000
-3000
-2000
-1000
0
1000
2000
3000
4000
Wat
er
de
fici
t o
r su
rpu
ls in
'00
0 li
ters
pe
r d
ay
Scenario B
2018 2023 2028 2033 2038 2043
62
8. Water quality analysis
Water quality analysis was conducted during the rain season in April and beginning May
2018 and during the dry season in the beginning of August 2018. In total, 100 water sources
and Mwange River located in Gicumbi district were analyzed for pH, Turbididty, Total
Coliforms, Total Phosphorous, Total Nitrogen, Iron and Manganese. These parameters were
analyzed by the UR laboratories specialized in water quality control. The analysis of results
were compared to Rwanda standards and WHO guideline standards for drinking water. Table
7 shows the laboratory results from the rain season (RS) and the dry Season (DS). The gray
color shading in the results indicate that sampled water has exceeded the Rwanda standard
limit or range.
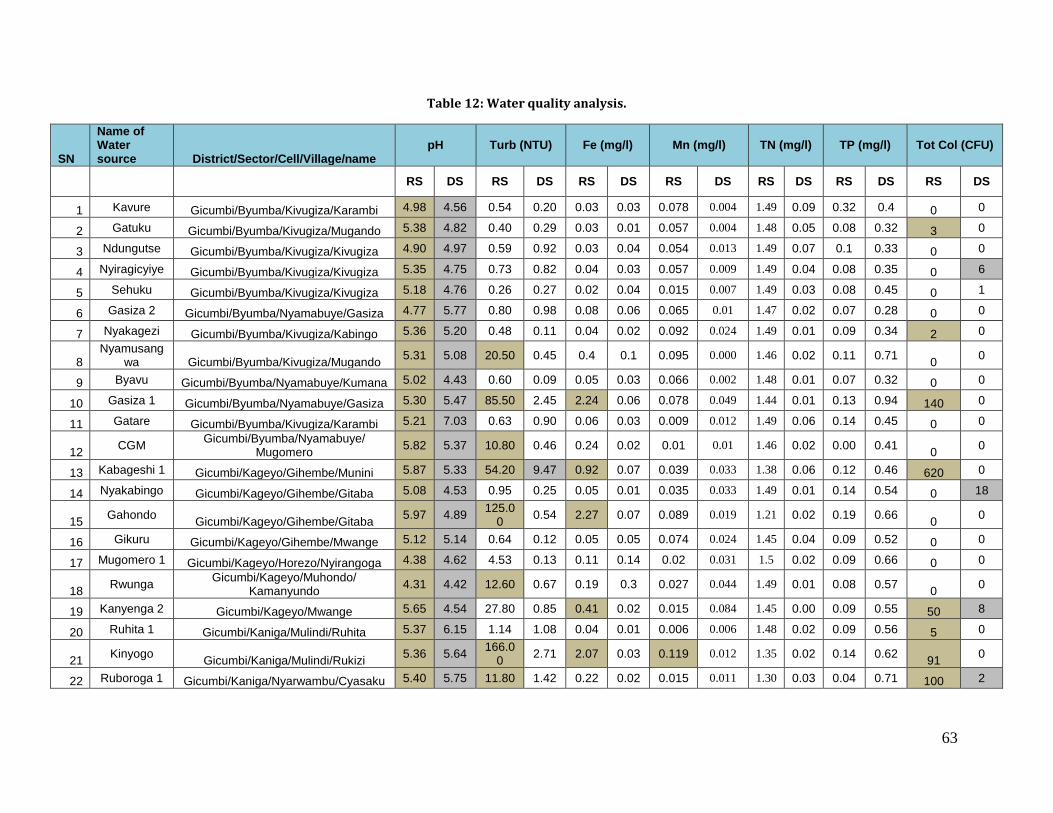
63
Table 12: Water quality analysis.
SN
Name of Water source District/Sector/Cell/Village/name
pH Turb (NTU) Fe (mg/l) Mn (mg/l) TN (mg/l) TP (mg/l) Tot Col (CFU)
RS DS RS DS RS DS RS DS RS DS RS DS RS DS
1 Kavure Gicumbi/Byumba/Kivugiza/Karambi 4.98 4.56 0.54 0.20 0.03 0.03 0.078 0.004 1.49 0.09 0.32 0.4 0 0
2 Gatuku Gicumbi/Byumba/Kivugiza/Mugando 5.38 4.82 0.40 0.29 0.03 0.01 0.057 0.004 1.48 0.05 0.08 0.32 3 0
3 Ndungutse Gicumbi/Byumba/Kivugiza/Kivugiza 4.90 4.97 0.59 0.92 0.03 0.04 0.054 0.013 1.49 0.07 0.1 0.33 0 0
4 Nyiragicyiye Gicumbi/Byumba/Kivugiza/Kivugiza 5.35 4.75 0.73 0.82 0.04 0.03 0.057 0.009 1.49 0.04 0.08 0.35 0 6
5 Sehuku Gicumbi/Byumba/Kivugiza/Kivugiza 5.18 4.76 0.26 0.27 0.02 0.04 0.015 0.007 1.49 0.03 0.08 0.45 0 1
6 Gasiza 2 Gicumbi/Byumba/Nyamabuye/Gasiza 4.77 5.77 0.80 0.98 0.08 0.06 0.065 0.01 1.47 0.02 0.07 0.28 0 0
7 Nyakagezi Gicumbi/Byumba/Kivugiza/Kabingo 5.36 5.20 0.48 0.11 0.04 0.02 0.092 0.024 1.49 0.01 0.09 0.34 2 0
8 Nyamusang
wa Gicumbi/Byumba/Kivugiza/Mugando 5.31 5.08 20.50 0.45 0.4 0.1 0.095 0.000 1.46 0.02 0.11 0.71
0 0
9 Byavu Gicumbi/Byumba/Nyamabuye/Kumana 5.02 4.43 0.60 0.09 0.05 0.03 0.066 0.002 1.48 0.01 0.07 0.32 0 0
10 Gasiza 1 Gicumbi/Byumba/Nyamabuye/Gasiza 5.30 5.47 85.50 2.45 2.24 0.06 0.078 0.049 1.44 0.01 0.13 0.94 140 0
11 Gatare Gicumbi/Byumba/Kivugiza/Karambi 5.21 7.03 0.63 0.90 0.06 0.03 0.009 0.012 1.49 0.06 0.14 0.45 0 0
12 CGM
Gicumbi/Byumba/Nyamabuye/ Mugomero
5.82 5.37 10.80 0.46 0.24 0.02 0.01 0.01 1.46 0.02 0.00 0.41 0
0
13 Kabageshi 1 Gicumbi/Kageyo/Gihembe/Munini 5.87 5.33 54.20 9.47 0.92 0.07 0.039 0.033 1.38 0.06 0.12 0.46 620 0
14 Nyakabingo Gicumbi/Kageyo/Gihembe/Gitaba 5.08 4.53 0.95 0.25 0.05 0.01 0.035 0.033 1.49 0.01 0.14 0.54 0 18
15 Gahondo
Gicumbi/Kageyo/Gihembe/Gitaba 5.97 4.89
125.00
0.54 2.27 0.07 0.089 0.019 1.21 0.02 0.19 0.66 0
0
16 Gikuru Gicumbi/Kageyo/Gihembe/Mwange 5.12 5.14 0.64 0.12 0.05 0.05 0.074 0.024 1.45 0.04 0.09 0.52 0 0
17 Mugomero 1 Gicumbi/Kageyo/Horezo/Nyirangoga 4.38 4.62 4.53 0.13 0.11 0.14 0.02 0.031 1.5 0.02 0.09 0.66 0 0
18 Rwunga
Gicumbi/Kageyo/Muhondo/ Kamanyundo
4.31 4.42 12.60 0.67 0.19 0.3 0.027 0.044 1.49 0.01 0.08 0.57 0
0
19 Kanyenga 2 Gicumbi/Kageyo/Mwange 5.65 4.54 27.80 0.85 0.41 0.02 0.015 0.084 1.45 0.00 0.09 0.55 50 8
20 Ruhita 1 Gicumbi/Kaniga/Mulindi/Ruhita 5.37 6.15 1.14 1.08 0.04 0.01 0.006 0.006 1.48 0.02 0.09 0.56 5 0
21 Kinyogo
Gicumbi/Kaniga/Mulindi/Rukizi 5.36 5.64
166.00
2.71 2.07 0.03 0.119 0.012 1.35 0.02 0.14 0.62 91
0
22 Ruboroga 1 Gicumbi/Kaniga/Nyarwambu/Cyasaku 5.40 5.75 11.80 1.42 0.22 0.02 0.015 0.011 1.30 0.03 0.04 0.71 100 2

64
23 Ruboroga 2 Gicumbi/Kaniga/Nyarwambu/Cyasaku 5.37 5.80 8.63 2.04 0.14 0.16 0.063 0.016 1.49 0.01 0.06 1.01 0 0
24 Cyasaku Gicumbi/Kaniga/Nyarwambu/Cyasaku 5.21 6.13 8.60 1.09 0.08 0.05 0.037 0.074 1.46 0.08 0.05 0.50 9 9
25 Rwungo 1
Gicumbi/Manyagiro/Remera/Shingura 4.84 4.29
162.00
0.11 0.02 0.00 0.156 0.015 1.43 0.45 0.08 0.62 33
0
26 Rwungo 2 Gicumbi/Manyagiro/Remera/Shingura 3.94 4.48 6.82 0.31 0.19 0.03 0.094 0.007 1.49 0.04 0.07 0.57 0 0
27 Rwungo 3 Gicumbi/Manyagiro/Remera/Shingura 3.65 5.37 10.60 4.00 0.01 0.06 0.16 0.008 1.46 0.07 1.85 0.60 1 1
28 Rwungo 4
Gicumbi/Manyagiro/Remera/Shingura 3.70 4.25
235.00
0.28 0.31 0.05 0.11 0.104 1.45 0.05 0.1 0.56 71
0
29 Rwungo 5
Gicumbi/Manyagiro/Remera/Shingura 5.78 4.62
151.00
0.23 1.61 0.01 0.11 0.029 1.39 0.08 0.16 0.47 60
2
30
Kanyirabuki Gicumbi/Bwisige/Gihuke/Kuwindege 4.71 5.01 3.89 1.19 0.11 0.04 0.006 0.011 1.41 0.01 0.6 0.95
0 0
31 Rwangabo Gicumbi/Bwisige/Gihuke/Kaminini 4.84 4.93 0.71 0.26 0.02 0.04 0.006 0.031 1.51 0.06 0.16 0.58 0 0
32 Kagorogoro Gicumbi/Bwisige/Bwisige/Rutoma 4.53 4.78 1.83 0.18 0.03 0.05 0.061 0.040 1.52 0.01 0.13
0.480 18
0
33 Ryaruganzu
Gicumbi/Bwisige/Nyabusingitwa/ Musayo
4.92 5.43 0.69 0.91 0.01 0.09 0.003 0.027 1.38 0.01 0.1 0.67
0 0 0
34 Kigaga Gicumbi/Bwisige/Mukono/Murambi 4.79 5.23 0.54 0.12 0.07 0.06 0.079 0.031 1.39 0.01 0.41 0.84 0 0
35 Nyakabingo
1 Gicumbi/Shangasha/Bushara/Nyakabi
ngo 4.85 5.08 0.57 0.43 0.05 0.01 0.01 0.000 1.5 0.03 0.41 0.49
0 18
36 Nyakabingo
2 Gicumbi/Shangasha/Bushara/
Nyakabingo 5.36 5.57 3.53 1.16 0.15 0.01 0.023 0.013 1.32 0.00 0.31 0.75
0 0
37 Nyakabingo
3 Gicumbi/Shangasha/Bushara/
Nyakabingo 4.16 4.53 0.24 1.15 0.03 0.02 0.031 0.031 1.29 0.05 0.18 0.64
0 0
38 Nyakabingo
4 Gicumbi/Shangasha/Bushara/Gasura 4.23 4.78 0.49 0.25 0.05 0.01 nd 0.002 1.43 0.10 0.95 0.67
0 0
39 Nyakabingo Gicumbi/Muko/Kigoma/Gatobotobo 5.03 4.68 53.40 0.12 1.08 0.04 0.061 0.031 1.42 0.02 0.23 0.85 100 0
40 Bureranyana Gicumbi/Rutare/Gatwaro/Bureranyana 4.89 5.23 0.64 0.09 0 0.04 0.019 0.005 1.47 0.01 0.15 0.62 0 0
41 Gahama Gicumbi/Cyamuhinda/Rwamitembe 5.19 5.41 3.73 0.51 0.13 0.12 nd 0.01 1.50 0.02 0.21 0.54 0 0
42 Ruhondo Gicumbi/Giti/Murehe/Gatare 5.37 5.78 15.80 2.58 0.28 0.05 0.025 0.024 1.41 0.06 0.19 0.57 0 0
43 Kanyana Gicumbi/Giti/Murehe/Butare 5.11 5.41 30.50 2.68 0.65 0.03 0.034 0.015 1.29 0.03 0.09 0.62 25 0
44 Gasharu Gicumbi/Rutare/Gasharu/Kagarama 5.34 4.86 2.50 0.12 0.04 0.04 0.041 0.052 1.33 0.04 1.23 0.63 0 0
45 Karangara Gicumbi/Rutare/Bikumbo/Marembo 5.06 4.68 3.39 0.23 0.05 0.05 0.038 0.015 1.49 0.06 0.22 0.67 0 0
46 Mwange
River Gicumbi/Kageyo/Muhondo/Mwange 6.62 7.61 231 228 1.35 0.87 0.391 0.216 1.36 0.00 0.21 0.64
360,000 302
47 Kabere Gicumbi/Nyankenke/Butare/Kabere 4.69 4.78 40.00 4.59 0.78 0.04 0.034 0.014 1.49 0.04 0.33 0.54 33 0
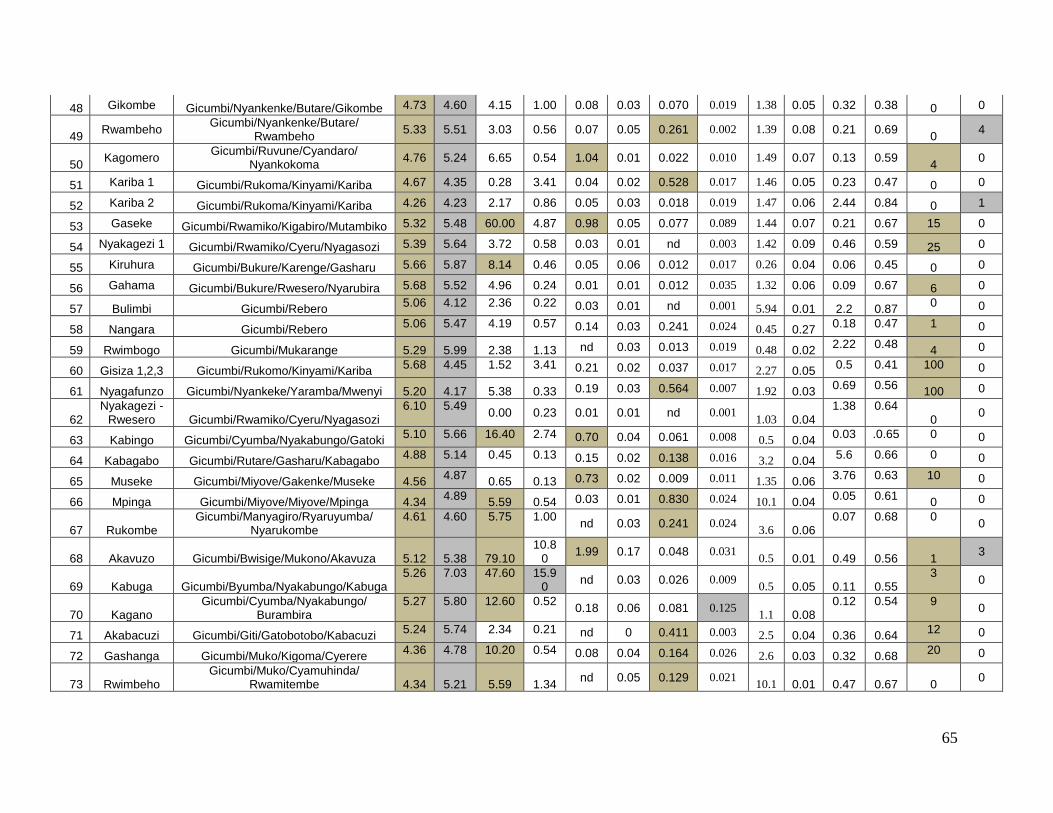
65
48 Gikombe Gicumbi/Nyankenke/Butare/Gikombe 4.73 4.60 4.15 1.00 0.08 0.03 0.070 0.019 1.38 0.05 0.32 0.38 0 0
49 Rwambeho
Gicumbi/Nyankenke/Butare/ Rwambeho
5.33 5.51 3.03 0.56 0.07 0.05 0.261 0.002 1.39 0.08 0.21 0.69 0
4
50 Kagomero
Gicumbi/Ruvune/Cyandaro/ Nyankokoma
4.76 5.24 6.65 0.54 1.04 0.01 0.022 0.010 1.49 0.07 0.13 0.59 4
0
51 Kariba 1 Gicumbi/Rukoma/Kinyami/Kariba 4.67 4.35 0.28 3.41 0.04 0.02 0.528 0.017 1.46 0.05 0.23 0.47 0 0
52 Kariba 2 Gicumbi/Rukoma/Kinyami/Kariba 4.26 4.23 2.17 0.86 0.05 0.03 0.018 0.019 1.47 0.06 2.44 0.84 0 1
53 Gaseke Gicumbi/Rwamiko/Kigabiro/Mutambiko 5.32 5.48 60.00 4.87 0.98 0.05 0.077 0.089 1.44 0.07 0.21 0.67 15 0
54 Nyakagezi 1 Gicumbi/Rwamiko/Cyeru/Nyagasozi 5.39 5.64 3.72 0.58 0.03 0.01 nd 0.003 1.42 0.09 0.46 0.59 25 0
55 Kiruhura Gicumbi/Bukure/Karenge/Gasharu 5.66 5.87 8.14 0.46 0.05 0.06 0.012 0.017 0.26 0.04 0.06 0.45 0 0
56 Gahama Gicumbi/Bukure/Rwesero/Nyarubira 5.68 5.52 4.96 0.24 0.01 0.01 0.012 0.035 1.32 0.06 0.09 0.67 6 0
57 Bulimbi Gicumbi/Rebero 5.06 4.12 2.36 0.22 0.03 0.01 nd 0.001 5.94 0.01 2.2 0.87
0 0
58 Nangara Gicumbi/Rebero 5.06 5.47 4.19 0.57 0.14 0.03 0.241 0.024 0.45 0.27
0.18 0.47 1 0
59 Rwimbogo Gicumbi/Mukarange 5.29 5.99 2.38 1.13 nd 0.03 0.013 0.019 0.48 0.02 2.22 0.48
4 0
60 Gisiza 1,2,3 Gicumbi/Rukomo/Kinyami/Kariba 5.68 4.45 1.52 3.41 0.21 0.02 0.037 0.017 2.27 0.05
0.5 0.41 100 0
61 Nyagafunzo Gicumbi/Nyankeke/Yaramba/Mwenyi 5.20 4.17 5.38 0.33 0.19 0.03 0.564 0.007 1.92 0.03 0.69 0.56
100 0
62 Nyakagezi -
Rwesero Gicumbi/Rwamiko/Cyeru/Nyagasozi 6.10 5.49
0.00 0.23 0.01 0.01 nd 0.001 1.03 0.04
1.38 0.64 0
0
63 Kabingo Gicumbi/Cyumba/Nyakabungo/Gatoki 5.10 5.66 16.40 2.74 0.70 0.04 0.061 0.008 0.5 0.04
0.03 .0.65 0 0
64 Kabagabo Gicumbi/Rutare/Gasharu/Kabagabo 4.88 5.14 0.45 0.13 0.15 0.02 0.138 0.016 3.2 0.04
5.6 0.66 0 0
65 Museke Gicumbi/Miyove/Gakenke/Museke 4.56 4.87
0.65 0.13 0.73 0.02 0.009 0.011 1.35 0.06 3.76 0.63 10 0
66 Mpinga Gicumbi/Miyove/Miyove/Mpinga 4.34 4.89
5.59 0.54 0.03 0.01 0.830 0.024 10.1 0.04 0.05 0.61
0 0
67 Rukombe Gicumbi/Manyagiro/Ryaruyumba/
Nyarukombe 4.61 4.60 5.75 1.00
nd 0.03 0.241 0.024 3.6 0.06
0.07 0.68 0 0
68 Akavuzo Gicumbi/Bwisige/Mukono/Akavuza 5.12 5.38 79.10 10.8
0 1.99 0.17 0.048 0.031
0.5 0.01 0.49 0.56 1 3
69 Kabuga Gicumbi/Byumba/Nyakabungo/Kabuga 5.26 7.03 47.60 15.9
0 nd 0.03 0.026 0.009
0.5 0.05 0.11 0.55 3
0
70 Kagano Gicumbi/Cyumba/Nyakabungo/
Burambira 5.27 5.80 12.60 0.52
0.18 0.06 0.081 0.125 1.1 0.08
0.12 0.54 9 0
71 Akabacuzi Gicumbi/Giti/Gatobotobo/Kabacuzi 5.24 5.74 2.34 0.21 nd 0 0.411 0.003 2.5 0.04 0.36 0.64
12 0
72 Gashanga Gicumbi/Muko/Kigoma/Cyerere 4.36 4.78 10.20 0.54 0.08 0.04 0.164 0.026 2.6 0.03 0.32 0.68
20 0
73 Rwimbeho Gicumbi/Muko/Cyamuhinda/
Rwamitembe 4.34 5.21 5.59 1.34 nd 0.05 0.129 0.021
10.1 0.01 0.47 0.67 0 0

66
74 Rurembo Gicumbi/Mukarange/Rugerero/
Rurembo 5.19 5.05 4.97 1.76
0.12 0.02 0.107 0.029 1.5 0.13 0.15 0.63
3 0
75 Nyagashang
a Gicumbi/Nyamiyaga/Karambo/
Kinyinya 4.62 5.39 9.57 0.99
nd 0.03 0.040 0.000 1.2 0.04 0.37 0.66
6 0
76 Gasura Gicumbi/Shangasha/Bushara/Gasura 5.17 4.93 1.39 0.61 0.03 0.01 0.083 0.025 4.5 0.07 0.18 0.67
20 0
77 GAKERI Gicumbi/Rutare/Gasharu/Yogi 5.24 5.14 0.90 0.15
0.08 0.05 0.038 0.012 0.01 0.06
3.00 0.49 101 0
78 NYARUBAN
DE Gicumbi/Byumba/Nyarutarama/
Rugandu 4.86 4.98 34.90 3.45
1.24 0.02 0.196 0.015
0.09 0.06 1.88 0.45
1 0
79 KIDOGO 1 Gicumbi/Muko/ngange/Kimpongo 6.18 5.21 0.81 0.82
nd 0.1 0.025 0.003 0.04 0.02
0.75 0.58 2 2
80 KIDOGO 2 Gicumbi/Muko/ngange/Kimpongo 3.54 5.18 0.53 0.44
nd 0.04 0.025 0.002 0.32 0.10
0.73 0.54 0 0
81 KIVOMO Gicumbi/Mukarange/Cyamuganga/
Burambira 4.02 5.72 0.87 1.30
0.12 0.1 0.030 0.008
0.08 0.01 2.12 0.74
33 1
82 GAKORE Gicumbi/Nyamiyaga/Kabeza/Mugorore 4.83 5.12 4.69 0.57
nd 0.01 0.044 0.003 0.06 0.07
0.19 0.78 0 0
83 KAZIRANKU
RWE Gicumbi/Shangasha/Nyabubare/
Nyamiyaga 4.58 4.91 1.48 0.15
0.17 0.04 0.153 0.045
0.05 0.01 0.05 0.68
0 7
84 RUSAVE Gicumbi/Mutete/Kabeza/Kagarama 5.38 5.85 2.07 0.46 0.2 0.11 0.036 0.050 7.04 0.03 0.12 0.74 3 0
85 MAGANGA Gicumbi/Mutete/Mutandi/Kamaganga 4.36 4.49 10.20 0.12 0.08 0.05 0.005 0.001 2.61 0.03 1.42 0.54 20 0
86 Marumba Gicumbi/Mutete/Karama/Mutandi 5.24 4.49 2.34 0.28 0.04 0.06 0.052 0.004 2.52 0.04 1.2 0.64 12 0
87 RWIMBOGO Gicumbi/Mutete/Kabeza/Kabasenga 5.19 5.26 4.97 0.39 0.06 0.05 0.032 0.008 1.53 0.01 0.94 0.56 3 3
88 NYAMATA Gicumbi/Mutete/Gaseke/Runyinya 4.62 5.33 9.57 2.45 1.21 0.05 0.082 0.155 1.20 0.01 0.89 0.84 6 0
89 NYAMABUY
E 1 Gicumbi/Rukomo/Cyuru/Karengo 4.88 4.85 0.45 0.52 0.09 0.02 0.062 0.003 3.15 0.03 1.57 0.68 0 0
90 NYAMABUY
E 2 Gicumbi/Rukomo/Cyuru/Karengo 6.28 4.40 24.70 0.67 0.06 0.05 0.048 0.010 1.83 0.13
1.29 0.45 52 6
91 KABERE Gicumbi/Nyankenke/Butare/Kabere 6.69 6.38 87.00 2.54 0.08 0.02 0.058 0.051 0.60 0.04 2.47 0.46 100 0
92 NYAKARIBA Gicumbi/Nyankenke/Butare/
Rwambeho 7.21 7.45 43.90 1.13 0.05 0.03 0.06 0.019 1.35 0.01
2.31 0.44 100 0
93 KU ITARE Gicumbi/Nyankenke/Butare/Gikombe 5.47 5.75 1.50 0.54 0.24 0.08 0.08 0.014 0.76 0.06 0.43 0.42 0 0
94 GATARE Gicumbi/Nyankenke/Yaramba/Mwenyi 5.00 5.33 0.70 0.09 0.18 0.16 0.04 0.012 6.87 0.04 0.76 0.94 0 0
95 GATARE Gicumbi/Bwisige/Gihuke/Kumunini 5.50 5.43 9.53 1.91 0.32 0.09 0.061 0.027 0.30 0.01 0.92 0.45 78 0
96 GISUMA Gicumbi/Bwisige/Guhuke/Kuwendege 4.45 5.43 0.82 1.91 0.07 0.09 0.104 0.027 3.39 0.01 1.27 0.41 0 0
97 NYAGASHA
NGA Gicumbi/Bwisige/Nyabushingitwa/
Musayo 4.45 4.48 0.56 0.12 0.28 0.09 0.021 0.032 2.10 0.04
1.73 0.45 0 0
98 NANGURU
GOMO Gicumbi/Bukure/Kivumu/Butare 6.14 5.30 74.40 0.25 0.31 0.04 0.054 0.016 1.44 0.06
0.97 0.54 43 8
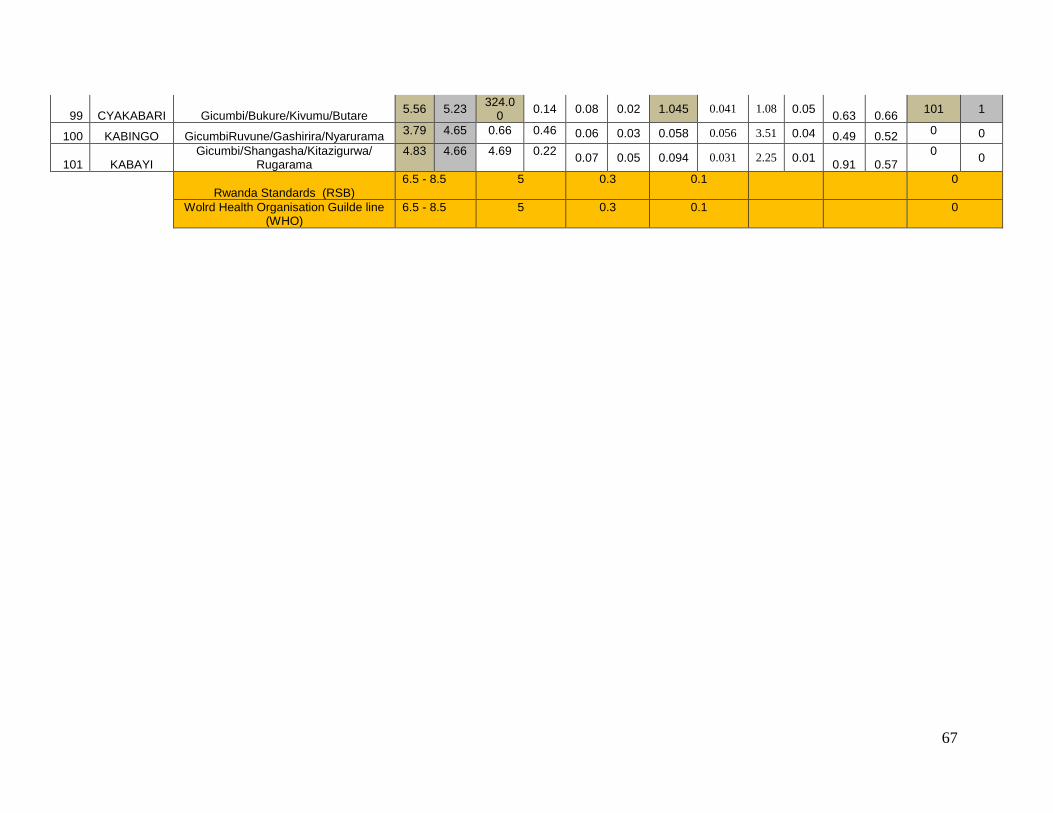
67
99 CYAKABARI Gicumbi/Bukure/Kivumu/Butare 5.56 5.23
324.00
0.14 0.08 0.02 1.045 0.041 1.08 0.05 0.63 0.66
101 1
100 KABINGO GicumbiRuvune/Gashirira/Nyarurama 3.79 4.65 0.66 0.46 0.06 0.03 0.058 0.056 3.51 0.04 0.49 0.52
0 0
101 KABAYI Gicumbi/Shangasha/Kitazigurwa/
Rugarama 4.83 4.66 4.69 0.22
0.07 0.05 0.094 0.031 2.25 0.01 0.91 0.57
0 0
Rwanda Standards (RSB)
6.5 - 8.5
5
0.3
0.1
0
Wolrd Health Organisation Guilde line (WHO)
6.5 - 8.5
5
0.3
0.1
0
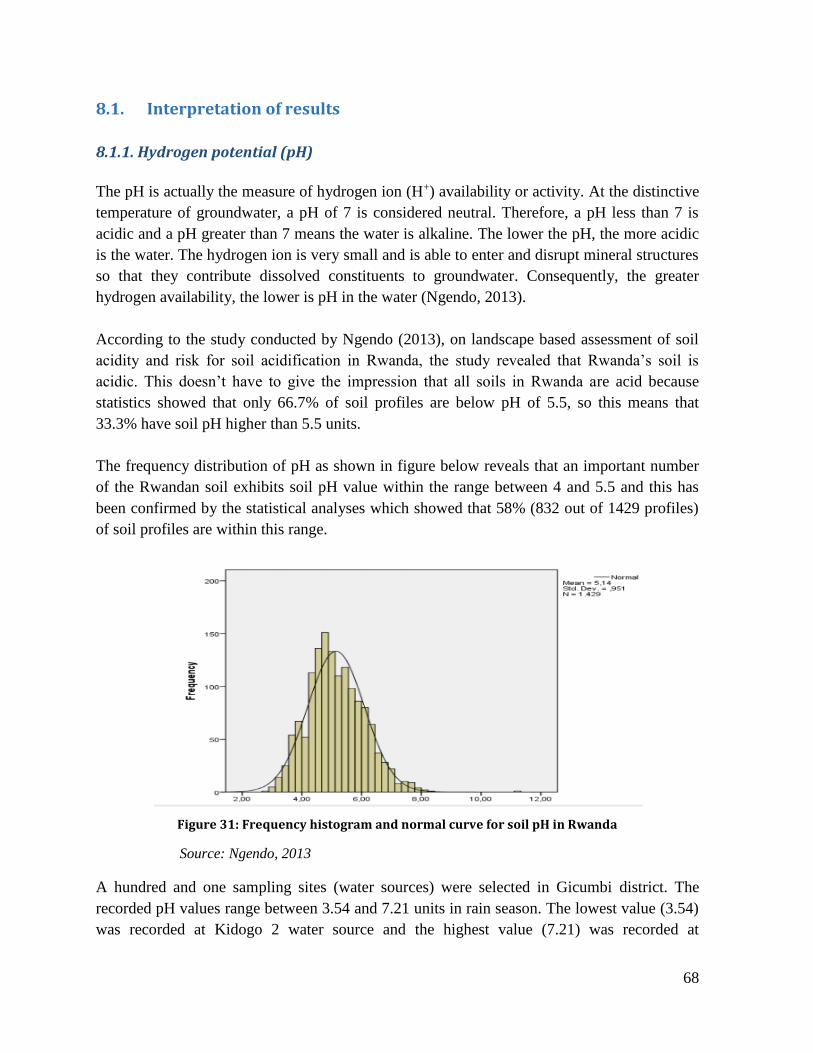
68
8.1. Interpretation of results
8.1.1. Hydrogen potential (pH)
The pH is actually the measure of hydrogen ion (H+) availability or activity. At the distinctive
temperature of groundwater, a pH of 7 is considered neutral. Therefore, a pH less than 7 is
acidic and a pH greater than 7 means the water is alkaline. The lower the pH, the more acidic
is the water. The hydrogen ion is very small and is able to enter and disrupt mineral structures
so that they contribute dissolved constituents to groundwater. Consequently, the greater
hydrogen availability, the lower is pH in the water (Ngendo, 2013).
According to the study conducted by Ngendo (2013), on landscape based assessment of soil
acidity and risk for soil acidification in Rwanda, the study revealed that Rwanda’s soil is
acidic. This doesn’t have to give the impression that all soils in Rwanda are acid because
statistics showed that only 66.7% of soil profiles are below pH of 5.5, so this means that
33.3% have soil pH higher than 5.5 units.
The frequency distribution of pH as shown in figure below reveals that an important number
of the Rwandan soil exhibits soil pH value within the range between 4 and 5.5 and this has
been confirmed by the statistical analyses which showed that 58% (832 out of 1429 profiles)
of soil profiles are within this range.
Figure 31: Frequency histogram and normal curve for soil pH in Rwanda
Source: Ngendo, 2013
A hundred and one sampling sites (water sources) were selected in Gicumbi district. The
recorded pH values range between 3.54 and 7.21 units in rain season. The lowest value (3.54)
was recorded at Kidogo 2 water source and the highest value (7.21) was recorded at

69
Nyakariba water source. The recoded pH values range between 4.12 and 7.61 units in dry
season. The lowest value (4.12) was recorded at Bulimbi water source and the highest value
(7.61) was recorded at Mwange River (refer to figure 32). In general, all sampling sites in rain
season, 98 water sources representing 97.03% of sampled water sources demonstrated pH
values less than WHO and RSB accepted range (6.5-8.5) for drinking water Standard and only
3 water sources representing 2.97%, fell within the range during the rainy season.
However, the pH values in dry season for water sources demonstrated that 97 water sources
representing 96.04%, shown pH values less than WHO and RSB acceptable range (6.5-8.5)
for drinking water standard and only 4 water sources representing 3.96%, fell within the range
in dry season. Therefore, most of water sources are slightly acidic which could be explained
by the acidic soil of Rwanda.
Attention:
The lower pH value was found in three water sources Rwungo 2, 3, 4 with a pH value (3.94,
3.65 and 3.70 respectively). These three sources are from the same type of soil and pH has
been measured on the field in the water tank, but separately each other. The pH meter used is
the same for all 101 water sources tested and it was calibrated on the field. Three buffer
solutions (4.01, 7.00 and 10.00) for pH calibration was used when something not normal
occurred. The lower pH is due to the chemicals characteristics of Soil in Rwanda, which is
acidic. Rwungo is a Pumping system of five water sources and the pH has been measured in
the same conditions for the five sources (Rwungo 1, 2, 3, 4 & 5).
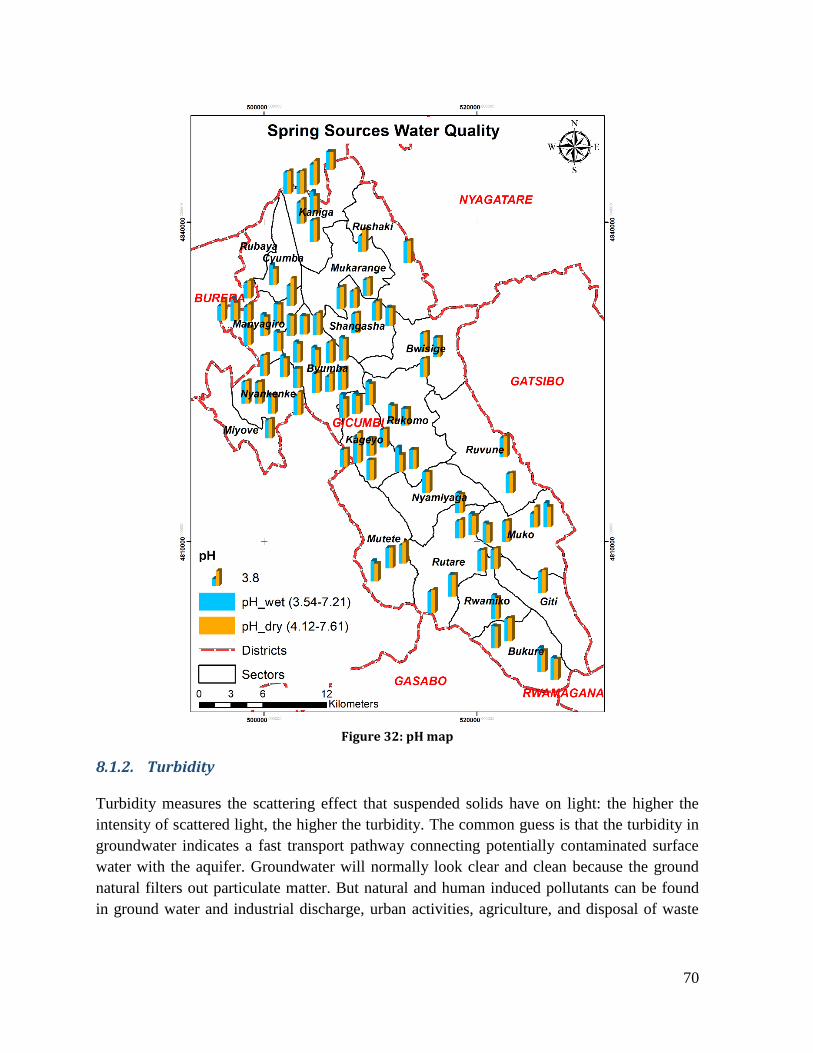
70
Figure 32: pH map
8.1.2. Turbidity
Turbidity measures the scattering effect that suspended solids have on light: the higher the
intensity of scattered light, the higher the turbidity. The common guess is that the turbidity in
groundwater indicates a fast transport pathway connecting potentially contaminated surface
water with the aquifer. Groundwater will normally look clear and clean because the ground
natural filters out particulate matter. But natural and human induced pollutants can be found
in ground water and industrial discharge, urban activities, agriculture, and disposal of waste
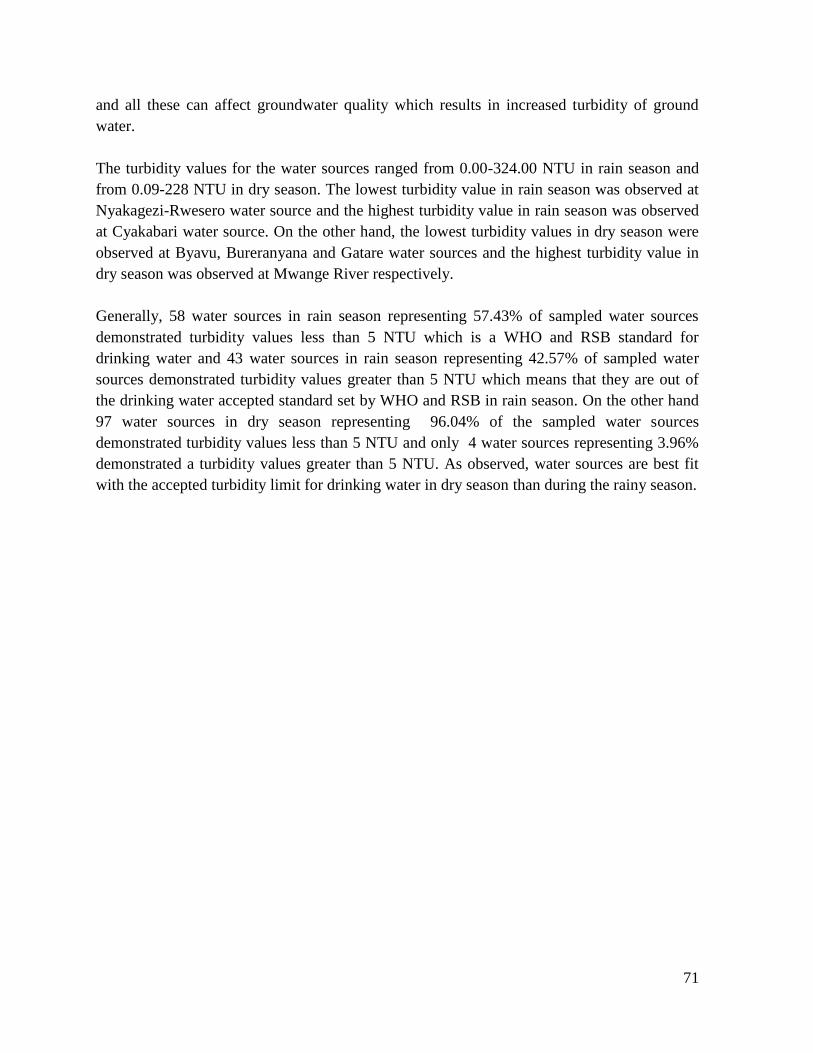
71
and all these can affect groundwater quality which results in increased turbidity of ground
water.
The turbidity values for the water sources ranged from 0.00-324.00 NTU in rain season and
from 0.09-228 NTU in dry season. The lowest turbidity value in rain season was observed at
Nyakagezi-Rwesero water source and the highest turbidity value in rain season was observed
at Cyakabari water source. On the other hand, the lowest turbidity values in dry season were
observed at Byavu, Bureranyana and Gatare water sources and the highest turbidity value in
dry season was observed at Mwange River respectively.
Generally, 58 water sources in rain season representing 57.43% of sampled water sources
demonstrated turbidity values less than 5 NTU which is a WHO and RSB standard for
drinking water and 43 water sources in rain season representing 42.57% of sampled water
sources demonstrated turbidity values greater than 5 NTU which means that they are out of
the drinking water accepted standard set by WHO and RSB in rain season. On the other hand
97 water sources in dry season representing 96.04% of the sampled water sources
demonstrated turbidity values less than 5 NTU and only 4 water sources representing 3.96%
demonstrated a turbidity values greater than 5 NTU. As observed, water sources are best fit
with the accepted turbidity limit for drinking water in dry season than during the rainy season.
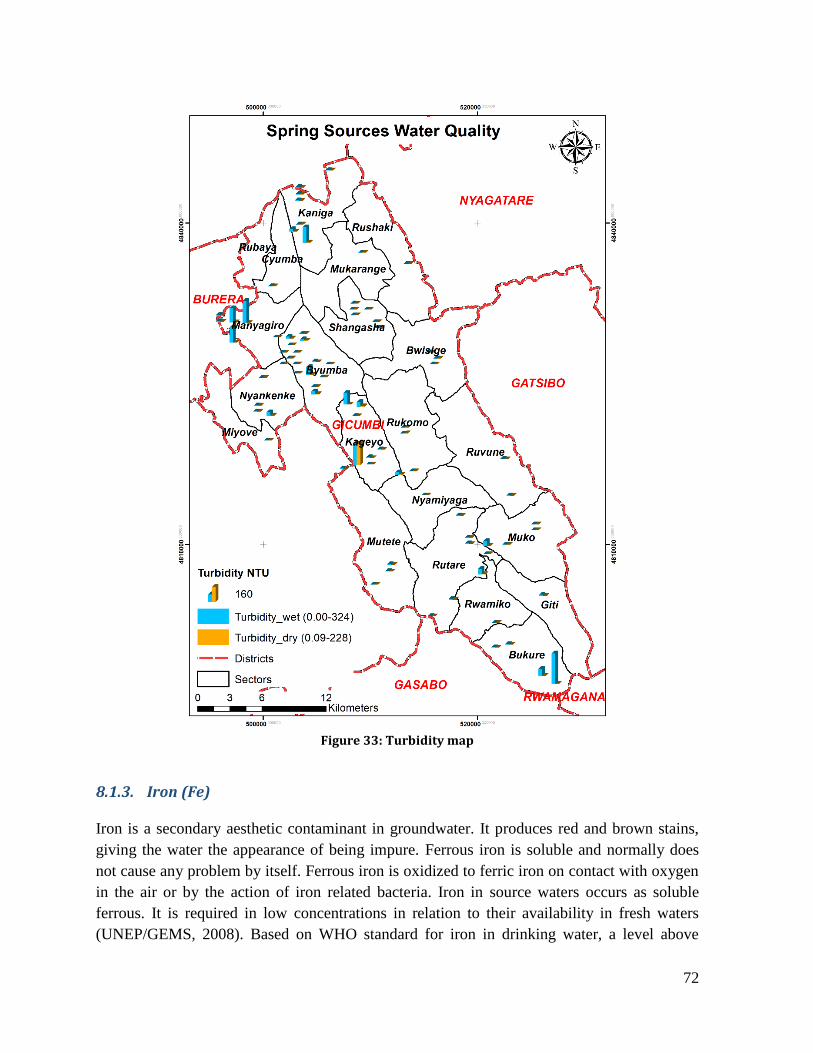
72
Figure 33: Turbidity map
8.1.3. Iron (Fe)
Iron is a secondary aesthetic contaminant in groundwater. It produces red and brown stains,
giving the water the appearance of being impure. Ferrous iron is soluble and normally does
not cause any problem by itself. Ferrous iron is oxidized to ferric iron on contact with oxygen
in the air or by the action of iron related bacteria. Iron in source waters occurs as soluble
ferrous. It is required in low concentrations in relation to their availability in fresh waters
(UNEP/GEMS, 2008). Based on WHO standard for iron in drinking water, a level above

73
0.3mg/l of iron content in water is staining laundry and plumbing fixtures. A turbidity and
color may develop at the concentration of iron greater than 0.3 mg/l (WHO, 4th ed).
For the sampling sites, the concentration of iron in some water sources was below the
accepted standard limit, not detected, and above the accepted standard limit. Starting with the
rain season, the results shows that 74 water sources representing 73.27% of sampled sources
demonstrated iron concentration which is below 0.3 mg/L meaning that were responding to
the accepted standard limit of WHO and RSB. Moreover, 18 water sources representing
17.82% of sampled water sources demonstrated iron concentration above the accepted
standard limit and 9 water sources representing 8.91%, their iron concentration was not
detected meaning that the concentration of iron in these water sources is out of range of
detection limit of an analytical instrument used for the analysis.
On the other hand, dry season results shows that 100 water sources representing 99.01% of
sampled water sources demonstrated an iron concentration below 0.3mg/L which is an
accepted iron standard limit for drinking water and only 1 water source representing 0.99%,
which is Mwange River, and demonstrated an iron concentration greater than 0.3mg/L.
Mwange river is the only water source in dry season not responding to accepted iron
concentration standard limit of WHO and RSB for drinking water.

74
Figure 34: Fe map
8.1.4. Manganese (Mn)
Manganese is one of the most abundant metals in Earth’s crust, usually occurring with iron. It
is a component of over 100 minerals but is not found naturally in its pure (elemental) form.
Manganese is an element essential to the proper functioning of both humans and animals, as it
is required for the functioning of many cellular enzymes and can serve to activate many
others. Manganese can exist in 11 oxidative states; the most environmentally and biologically
important manganese compounds are those that contain Mn2+, Mn4+ or Mn7+ (WHO, 2011).

75
For the sampling sites analyzed for manganese concentration content, it has been observed
that its concentration in some water sources is below the accepted standard limit and in other
sources it is above the accepted standard limit. To begin with the rain season, 75 water
sources representing 74.26% of the sampled sources demonstrated manganese concentration
below 0.1mg/L which is an acceptable manganese concentration limit for drinking water. In
addition, 21 water sources representing 20.79% of sampled water sources demonstrated
manganese concentration greater than 0.1mg/L, i.e. they were greater than accepted standard
limit set by WHO and RSB for drinking water. The concentration of five water sources
representing 4.95% were not detected during the analysis.
Right the contrary, dry season as shown by the results, water sources demonstrated
manganese concentration content below 0.1 mg/L. 97 water sources representing 96.04% of
sampled water sources were found containing manganese concentration less than 0.1mg/L
meaning that were responding to acceptable manganese concentration limit of WHO and RSB
for drinking water, only 4 water sources representing 3.96%, were above the acceptable
standard limit for drinking water.
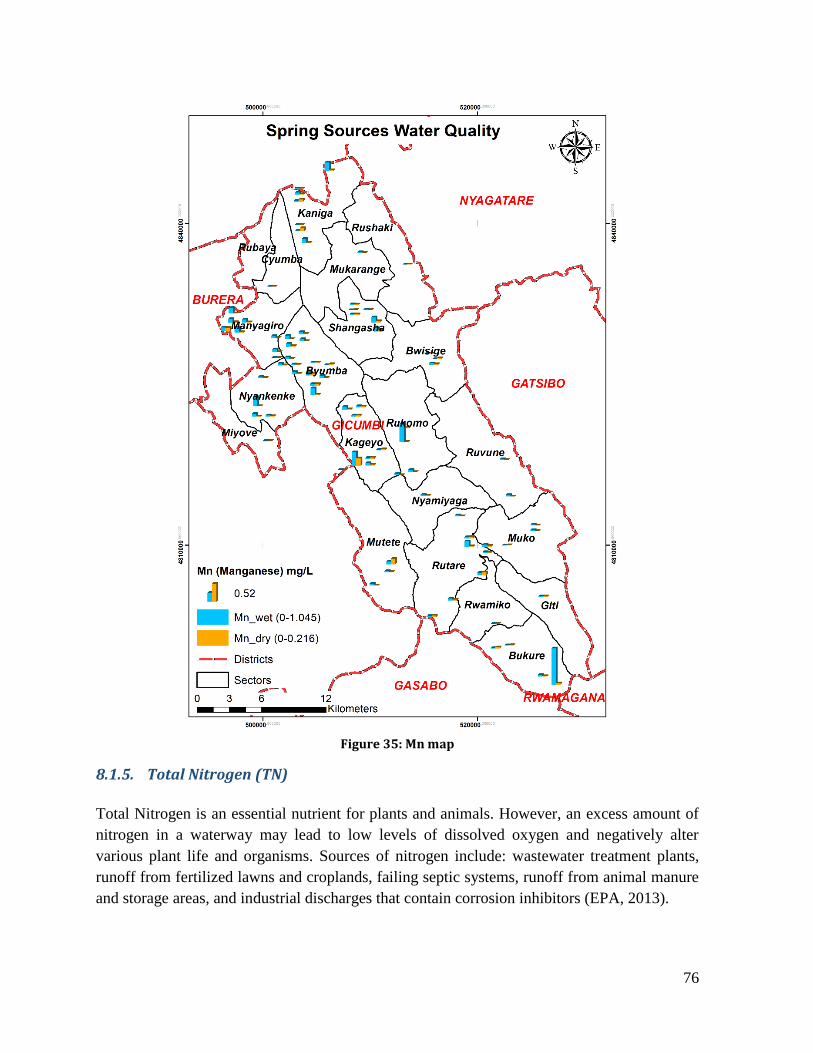
76
Figure 35: Mn map
8.1.5. Total Nitrogen (TN)
Total Nitrogen is an essential nutrient for plants and animals. However, an excess amount of
nitrogen in a waterway may lead to low levels of dissolved oxygen and negatively alter
various plant life and organisms. Sources of nitrogen include: wastewater treatment plants,
runoff from fertilized lawns and croplands, failing septic systems, runoff from animal manure
and storage areas, and industrial discharges that contain corrosion inhibitors (EPA, 2013).
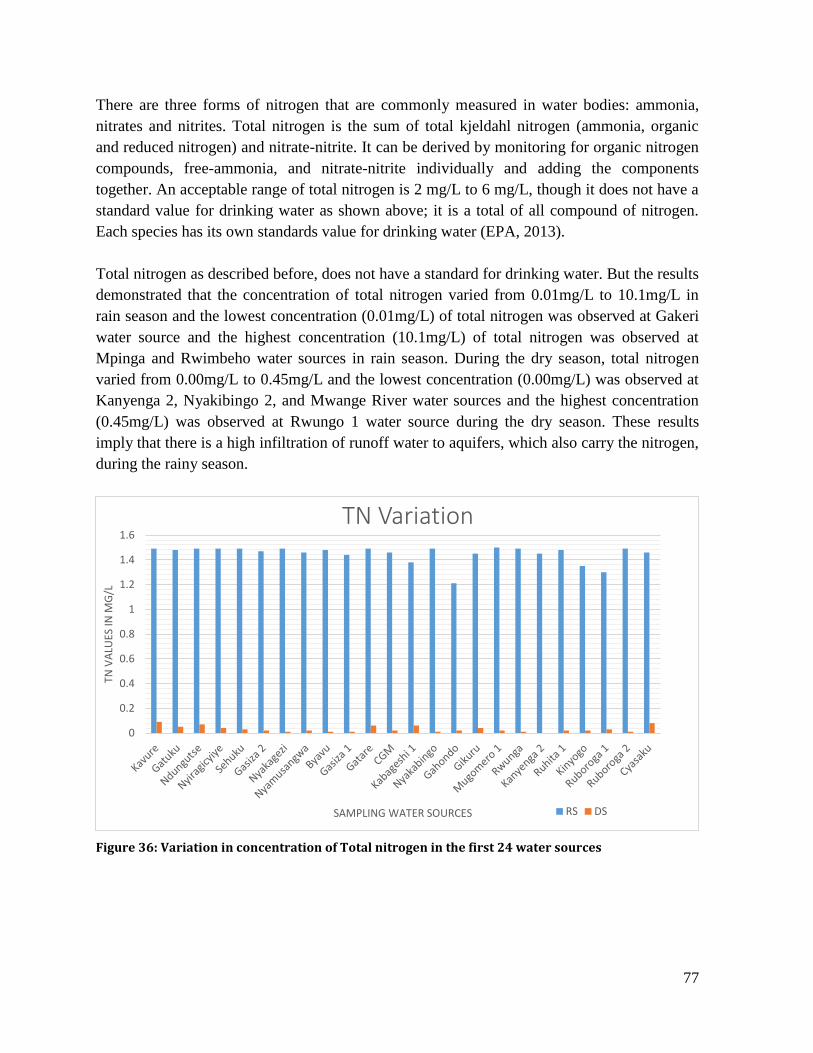
77
There are three forms of nitrogen that are commonly measured in water bodies: ammonia,
nitrates and nitrites. Total nitrogen is the sum of total kjeldahl nitrogen (ammonia, organic
and reduced nitrogen) and nitrate-nitrite. It can be derived by monitoring for organic nitrogen
compounds, free-ammonia, and nitrate-nitrite individually and adding the components
together. An acceptable range of total nitrogen is 2 mg/L to 6 mg/L, though it does not have a
standard value for drinking water as shown above; it is a total of all compound of nitrogen.
Each species has its own standards value for drinking water (EPA, 2013).
Total nitrogen as described before, does not have a standard for drinking water. But the results
demonstrated that the concentration of total nitrogen varied from 0.01mg/L to 10.1mg/L in
rain season and the lowest concentration (0.01mg/L) of total nitrogen was observed at Gakeri
water source and the highest concentration (10.1mg/L) of total nitrogen was observed at
Mpinga and Rwimbeho water sources in rain season. During the dry season, total nitrogen
varied from 0.00mg/L to 0.45mg/L and the lowest concentration (0.00mg/L) was observed at
Kanyenga 2, Nyakibingo 2, and Mwange River water sources and the highest concentration
(0.45mg/L) was observed at Rwungo 1 water source during the dry season. These results
imply that there is a high infiltration of runoff water to aquifers, which also carry the nitrogen,
during the rainy season.
Figure 36: Variation in concentration of Total nitrogen in the first 24 water sources
0
0.2
0.4
0.6
0.8
1
1.2
1.4
1.6
TN V
ALU
ES IN
MG
/L
SAMPLING WATER SOURCES
TN Variation
RS DS
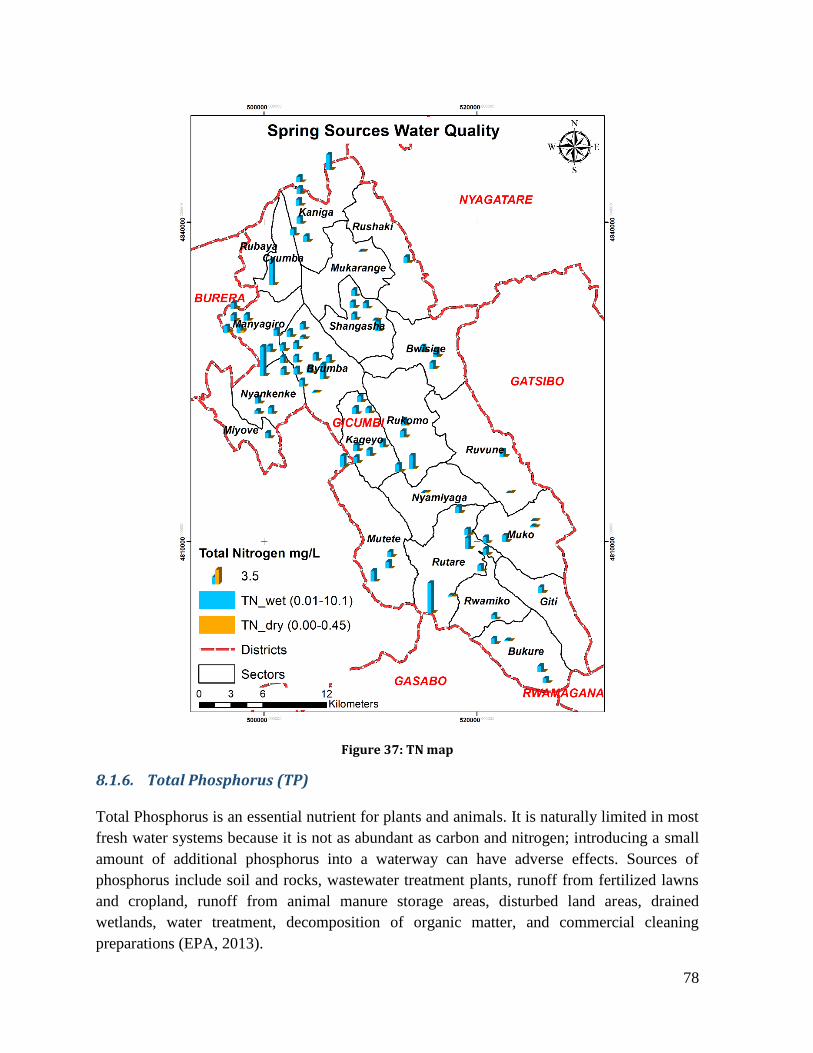
78
Figure 37: TN map
8.1.6. Total Phosphorus (TP)
Total Phosphorus is an essential nutrient for plants and animals. It is naturally limited in most
fresh water systems because it is not as abundant as carbon and nitrogen; introducing a small
amount of additional phosphorus into a waterway can have adverse effects. Sources of
phosphorus include soil and rocks, wastewater treatment plants, runoff from fertilized lawns
and cropland, runoff from animal manure storage areas, disturbed land areas, drained
wetlands, water treatment, decomposition of organic matter, and commercial cleaning
preparations (EPA, 2013).

79
The addition of even a small amount of phosphorus to a water body can have negative
consequences for water quality. Those adverse effects include: algae blooms, accelerated
plant growth, and low dissolved oxygen from the decomposition of additional vegetation. An
acceptable range for total phosphorus is 10 μg/L to 40 μg/L (EPA, 2013).
Total Phosphorus does not have a standard for drinking water. But the results demonstrated
that the concentration of total phosphorus differ from 0.00mg/L to 5.6mg/L in rain season
and the lowest concentration (0.00mg/L) of total Phosphorus was observed at CGM water
source and the highest concentration(5.6mg/L) of total phosphorus was observed at Kabagabo
water source in rain season. During the dry season, total Phosphorus differ from 0.28mg/L to
1.01mg/L and the lowest concentration (0.28mg/L) was observed at Gasiza 2 water source
and the highest concentration (1.01mg/L) was observed at Ruboroga 2 water source during
the dry season.
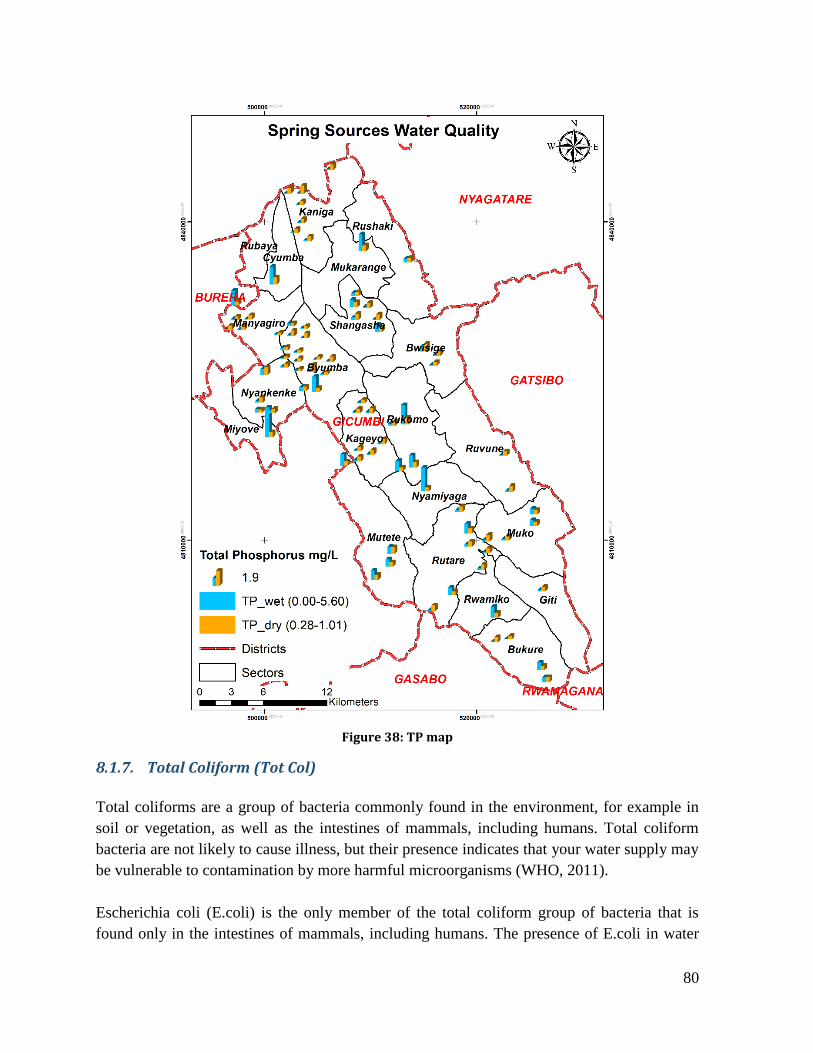
80
Figure 38: TP map
8.1.7. Total Coliform (Tot Col)
Total coliforms are a group of bacteria commonly found in the environment, for example in
soil or vegetation, as well as the intestines of mammals, including humans. Total coliform
bacteria are not likely to cause illness, but their presence indicates that your water supply may
be vulnerable to contamination by more harmful microorganisms (WHO, 2011).
Escherichia coli (E.coli) is the only member of the total coliform group of bacteria that is
found only in the intestines of mammals, including humans. The presence of E.coli in water

81
indicates recent fecal contamination and may indicate the possible presence of disease-
causing pathogens, such as bacteria, viruses, and parasites. Although most strains of E.coli
bacteria are harmless, certain strains, such as E.coli 0157:H7, may cause illness. In water,
coliform bacteria have no taste, smell, or color. They can only be detected through a
laboratory test (WHO, 2011).
The health effects of exposure to disease-causing bacteria, viruses, and parasites in drinking
water area varied. The most common symptoms of waterborne illness include nausea,
vomiting, and diarrhea. Infants, the elderly, and those with compromised immune systems
may suffer more severe effects. In extreme cases some pathogens may infect the lungs, skin,
eyes, nervous system, kidneys, or liver and the effects may be more severe, chronic, or even
fatal.
For the sampling water sources, rain season appeared to be the most contaminated with total
coliforms whereby a 360000 Cfu/100ml were found in Mwange River. In general, 50/101
water sources representing 49.5% of sampled water sources demonstrated coliform content
which is greater than 0.00 Cfu/100ml ranging from 1-360000 Cfu/100ml while 51/101 water
sources representing 50.5% of sampled water sources demonstrated no coliform content (0.00
Cfu/100ml) in rainy season. Therefore, 49.5% of all sampled water sources were not
responding to WHO and RSB coliform accepted standard limit.
On the other hand, Mwange River in dry season appeared also to be the most contaminated
with total coliforms whereby 302 Cfu/100ml were found. 20/101 water sources representing
19.8% of all sampled water sources demonstrated coliform content which is greater than 0.00
Cfu/100ml ranging from 1-302 Cfu/100ml and the remaining portion 81/101 water sources
representing 80.2% of the all sampled water sources was free from coliforms, hence
responding to WHO and RSB coliform accepted standard limit.
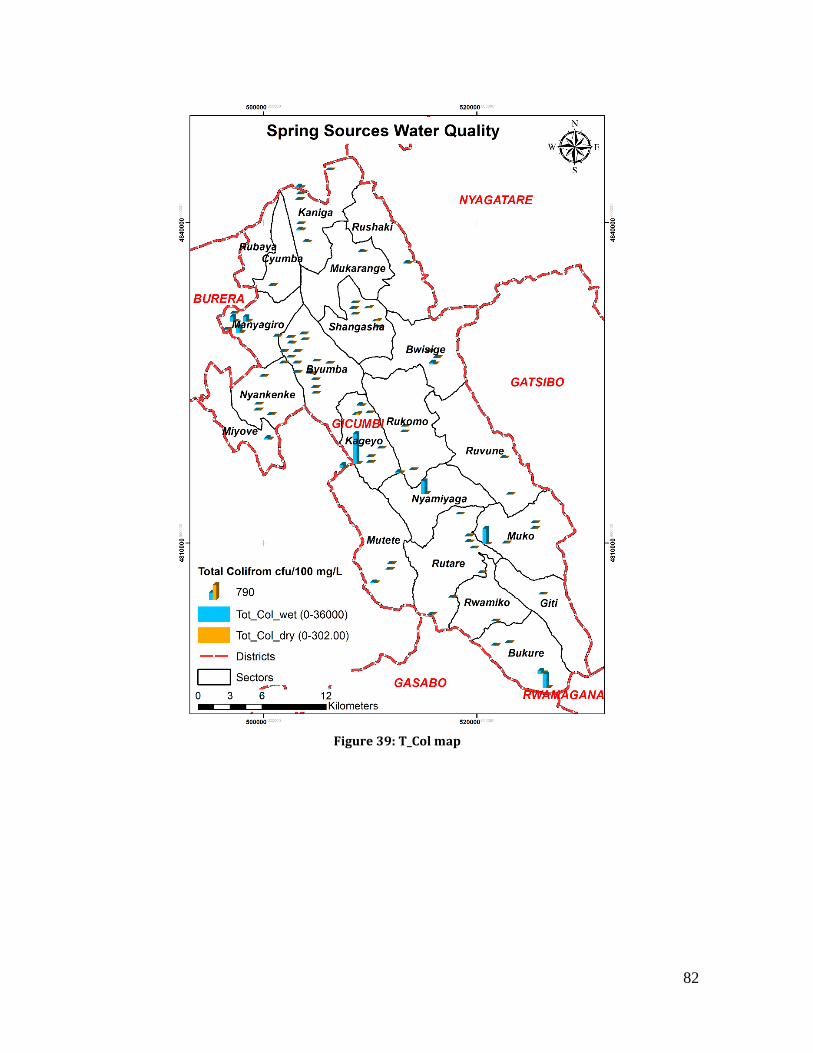
82
Figure 39: T_Col map
83
9. Strategic management plan for selected springs and their recharge catchment in Gicumbi District
To insure the sustainability of the use and sufficiency of springs in the Gicumbi District, a
number of activities are required. These activities vary from one spring to another and their
respective recharge catchment. However, their implementation needs special coordination
mechanisms overseen by a strong working institution framework that fits into the country
context.
9.1. Proposed institutional framework for the management of water sources
Article 3 of the water law provides that water is a good belonging to the State public domain.
Its use constitutes a recognized right in force to all in the scope of laws and regulation in use
and its article 4 provides that protecting and appropriately using water resources, in the
natural balance respect, are of general interest and constitute an imperative duty for all,
notably the State, the local communities, private sector, civil society and citizens.
The same water law, under article 5 gives the primary responsibility for managing water
sources to the water user’s associations whereas the article 24 provides that “Users of water
can constitute a local association of water having legal entity in view of management, of
enhancement of production, and protection of the water resources and fight against
flooding. The management of local water association is composed of representatives who
have a role in the exploitation of rivers, streams and lakes.”
Above these water users associations, the water law within its articles 21, 22 and 23 provides
for the establishment of water resources management committees at Sector level and District
level. These committees are composed of local government officials, NGOs representatives,
and representatives of water users’ associations, farmers’ representatives and private sector.
At District level, the membership of a hydrographic basin committee is as follow:
1. Vice Mayor for Economic Affairs;
2. Sector executive secretaries;
3. District Environment Officer;
4. District Agronomist;
5. District Women Council Representative;
6. District Youth Council Representative;
7. District representative of water user organizations in the field of agriculture;
8. The staff of the National Authority in charge of Natural Resources operating at the level
of the hydrographical basin;
84
9. District representative of domestic water users;
10. Two farmers’ representatives;
11. NGO representative;
12. District private sector representative
At Sector level, the hydrographic basin committee is composed of:
1. The Executive Secretary of the Sector
2. The in charge of water at sector level
3. The in charge of agriculture, animal resources, land, settlement, urbanization, forests,
infrastructure and environment at the Sector level;
4. A representative of the Executive Committee of each Cell in the Sector elected by his/her
peers;
5. A representative of the National Women’s Council at the Sector level;
6. A representative of the National Youth Council at Sector level;
7. Two (2) representatives of farmers at the Sector level;
8. A representative of water domestic users at the Sector level;
9. Two (2) representatives of non-governmental organizations working in the field of water
resources at the Sector level;
10. A representative of water user organizations in the field of agriculture at the Sector level;
11. A representative of the private sector at sector level
However, the article of the water law providing for the establishment of water users
associations does not give details on their composition apart of what is stated above. In
addition to this, it is provided under the article 25 of the water law that Districts may delegate
to local water associations the management of water utilization as well as the infrastructure in
accordance with the same law.
Based on the provisions of the water law, it is recommended that a water users association is
established and operationalized to manage each water source or where possible two or more
water sources to be managed by one association. These water users associations will be
supervised by the water resources management committees at Sector level and District level
where they are operational, otherwise this supervisory role will be played by local authorities
from Cell to District level.
Considering that the law does not provide the number of people to be part of a water user
association, it is suggested that all the beneficiaries getting water from a water source elect at
least 10 people, five men and five women, to constitute the water users association. The 10
elected members of the water users association will be composed of a president, a vice
president, a secretary and the others being just members.

85
In case, there is a private operator contracted by the local authorities or any other organ to
manage water infrastructures as it is the case for many springs in Gicumbi District, this one
will be part of the water users association as an observer. This means that he/she doesn’t have
the voting right.
In fact, as per the public-private sector partnership which is an approach being promoted by
the Government of Rwanda in many areas including domestic water supply, the Districts
which are the owners of rural water supply infrastructures normally delegate their
management to authorized Water Users Associations(WUA) or private professional operators.
In this case, a District enters into a contractual arrangement whereby the responsibilities of
each party are highlighted as follow:
Main obligations of the private operator:
1) To manage domestic water supply infrastructures in a sustainable manner and at the
satisfaction of the water users;
2) To carry out a regular maintenance of the infrastructures so as to meet their fixed
lifespan at the beginning of the contract;
3) To manage waste water generated from water treatment plants and water points in
collaboration with water users associations;
4) To ensure that the quality of water supplied is in accordance with the applicable
drinking water standards in Rwanda;
5) To make sure that water is always supplied to the users except in case of force
majeure;
6) To ensure a good collaboration with the water users association;
7) To carry out a cost recovery of the provided services in accordance with the tariff
fixed by the District in consultation with the water users associations and the private
operator for each water supply system
Main obligations of the District:
1) To ensure the sustainability of water supply infrastructures and the access of the
population to adequate drinking water in accordance with National strategies;
2) To provide support to the private operator for a good quality service and including the
cost recovery;
3) To ensure the involvement of water users associations in the sensitization of water
users and conflicts resolutions;
4) To avail funds for major rehabilitation and extension of the water supply systems and
this including the replacement of water pumps;
86
5) To take the overall responsibility in case the private operator is facing serious
difficulties and in any case the management of water infrastructures is threatened or a
poor service to the water users.
The above elaborated governance framework for water sources can be illustrated by the
following chart:
9.2. Required activities and their estimated costs
9.2.1. Spring sources activities and their budget Activities required to sustainably use the 144 spring sources identified in the Gicumbi District
are illustrated in table 13 with their estimated budget. These springs will serve as a reference
project for the water resources management plan in Gicumbi District given that most of the
springs are either captured or planned for water supply project in the District. These activities
may be considered as short-term intervention for the rehabilitation and protection of the water
sources studied. The total budget required for the short term measures for the identified spring
sources is estimated at Four Hundred Fifty Six Million and Five Hundred Thousand Rwandan
Francs.

87
Table 13: Priority, Activities and Budget for identified spring sources protection.
SN
Water sources
Sector
Cell
Village
X
Y
Z
Status
Recommendation (details in appendix 3)
Estimated short term rehabilitation cost (FRW)
1 Sehuku Byumba Kivugiza Kivugiza 503075.53 4826822.50 1773.33 Not captured not
protected
Establishment of : immediate spring catchment, fences, a water diversion ditch
1,800,000
2 Nyiragice Byumba Kivugiza Kivugiza 502741.07 4827039.50 1836.32 Not captured not protected
Establishment of : immediate spring catchment, fences, a water diversion ditch
1,800,000
3 Ndungutse Byumba Kivugiza Kivugiza 502479.70 4827108.50 1834.74 Not captured not protected
Establishment of : immediate spring catchment, fences, a water diversion ditch
1,800,000
4 Gatare Byumba Kivugiza Karambi 502468.13 4827454.00 1875.47 Captured not protected
Immediate rehabilitation and maintenance of the collection chamber
6,000,000
5 Kavure Byumba Kivugiza Karambi 501854.39 4827893.00 1846.23 Not captured not protected
Establishment of immediate spring catchment and fence it.
1,200,000
6 Gatuku Byumba Kivugiza Mugando 501566.55 4829327.50 1824.61 Not captured not protected
Establishment of : immediate spring catchment, fences, a water diversion ditch
1,800,000
7 Nyamusangwa Byumba Kivugiza Mugando 502472.71 4829228.50 1848.19 Not captured not protected
High turbidity in RS. Establishment of immediate spring catchment and fence it with imiyenzi.
1,600,000
8 Miriku Byumba Kivugiza Kabingo 503281.07 4829019.50 1904.06 Captured
Establishment of a water diversion way as well as the reinforcement of the upstream progressive terraces.
1,200,000
9 Nyakagezi Byumba Kivugiza Kabingo 502572.96 4828811.00 1921.57 Not captured not protected Recapture the spring
3,300,000
10 CGM Byumba Nyamabuye Mugomero 504966.52 4827007.66 1950.22 Not captured not protected
High turbidity in RS.Maintenance of immediate spring catchment and fence it
1,600,000
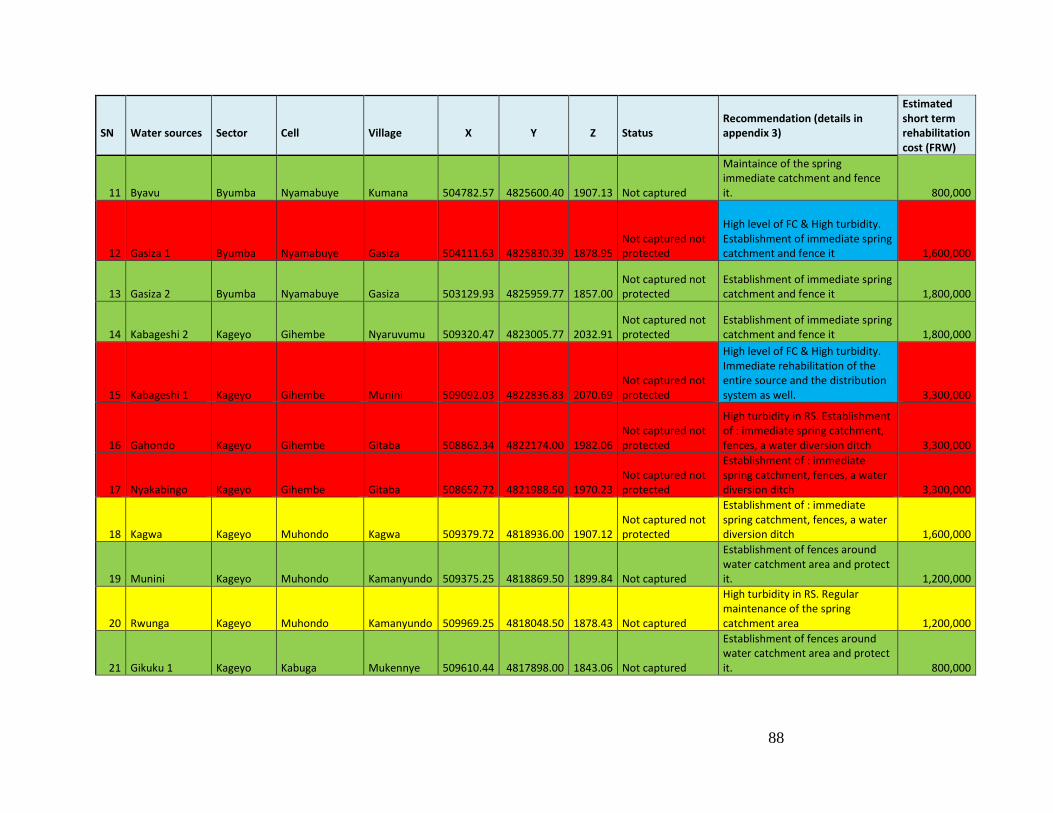
88
SN
Water sources
Sector
Cell
Village
X
Y
Z
Status
Recommendation (details in appendix 3)
Estimated short term rehabilitation cost (FRW)
11 Byavu Byumba Nyamabuye Kumana 504782.57 4825600.40 1907.13 Not captured
Maintaince of the spring immediate catchment and fence it.
800,000
12 Gasiza 1 Byumba Nyamabuye Gasiza 504111.63 4825830.39 1878.95 Not captured not protected
High level of FC & High turbidity. Establishment of immediate spring catchment and fence it
1,600,000
13 Gasiza 2 Byumba Nyamabuye Gasiza 503129.93 4825959.77 1857.00 Not captured not protected
Establishment of immediate spring catchment and fence it
1,800,000
14 Kabageshi 2 Kageyo Gihembe Nyaruvumu 509320.47 4823005.77 2032.91 Not captured not protected
Establishment of immediate spring catchment and fence it
1,800,000
15 Kabageshi 1 Kageyo Gihembe Munini 509092.03 4822836.83 2070.69 Not captured not protected
High level of FC & High turbidity. Immediate rehabilitation of the entire source and the distribution system as well.
3,300,000
16 Gahondo Kageyo Gihembe Gitaba 508862.34 4822174.00 1982.06 Not captured not protected
High turbidity in RS. Establishment of : immediate spring catchment, fences, a water diversion ditch
3,300,000
17 Nyakabingo Kageyo Gihembe Gitaba 508652.72 4821988.50 1970.23 Not captured not protected
Establishment of : immediate spring catchment, fences, a water diversion ditch
3,300,000
18 Kagwa Kageyo Muhondo Kagwa 509379.72 4818936.00 1907.12 Not captured not protected
Establishment of : immediate spring catchment, fences, a water diversion ditch
1,600,000
19 Munini Kageyo Muhondo Kamanyundo 509375.25 4818869.50 1899.84 Not captured
Establishment of fences around water catchment area and protect it.
1,200,000
20 Rwunga Kageyo Muhondo Kamanyundo 509969.25 4818048.50 1878.43 Not captured
High turbidity in RS. Regular maintenance of the spring catchment area
1,200,000
21 Gikuku 1 Kageyo Kabuga Mukennye 509610.44 4817898.00 1843.06 Not captured
Establishment of fences around water catchment area and protect it.
800,000

89
SN
Water sources
Sector
Cell
Village
X
Y
Z
Status
Recommendation (details in appendix 3)
Estimated short term rehabilitation cost (FRW)
22 Gikuku 2 Kageyo Muhondo Mwange 509395.13 4817956.50 1837.76 Not captured
Reinforce the existing fences and regular maintenances of the spring is required
800,000
23 Gikuku 3 Kageyo Muhondo Mwange 509180.16 4817727.50 1825.77 Not captured and not protected
Establishment of the adequate water diversion ditch is required as well as the fences and protection
900,000
24 Mwange Kageyo Muhondo Mwange 508932.81 4817407.50 1805.53 Not captured not protected
Establishment of the adequate water diversion ditch is required as well as the fences and protection
1,800,000
25 Nyiraruzenga 1 Kageyo Kabuga Gatobotobo 509672.53 4816069.50 1806.77 Not captured not protected
Establishment of the adequate water diversion ditch is required as well as the fences and protection
1,800,000
26 Nyiraruzenga 2 Kageyo Kabuga Gatobotobo 509715.16 4816084.00 1812.00 Not captured not protected
Establishment of the adequate water diversion ditch is required as well as the fences and protection
1,800,000
27 Nyiraruzenga 3 Kageyo Kabuga Gatobotobo 509782.03 4816116.00 1823.64 Not captured not protected
Immediate total rehabilitation of the spring
3,300,000
28 Mugomero 2 Kageyo Horezo Nyirangoga 510982.79 4818860.31 1986.62 Not captured not protected
Immediate total rehabilitation of the spring
3,300,000
29 Mugomero 1 Kageyo Horezo Nyirangoga 510988.91 4818851.46 1796.28 Not captured not protected
Immediate total rehabilitation of the spring
3,300,000
30 Ruboroga (Gatuna) 1 Kaniga Nyarwambu Cyasaku 503386.97 4842668.52 1966.99
Captured not protected
High level of FC & High turbidity. Regular and proper cleanig is required and a proper water capturing
3,300,000
31 Ruboroga (Gatuna) 2 Kaniga Nyarwambu Cyasaku 503407.66 4842668.41 1970.40 Captured
High turbidity in RS. Regular and proper cleanig is required
900,000
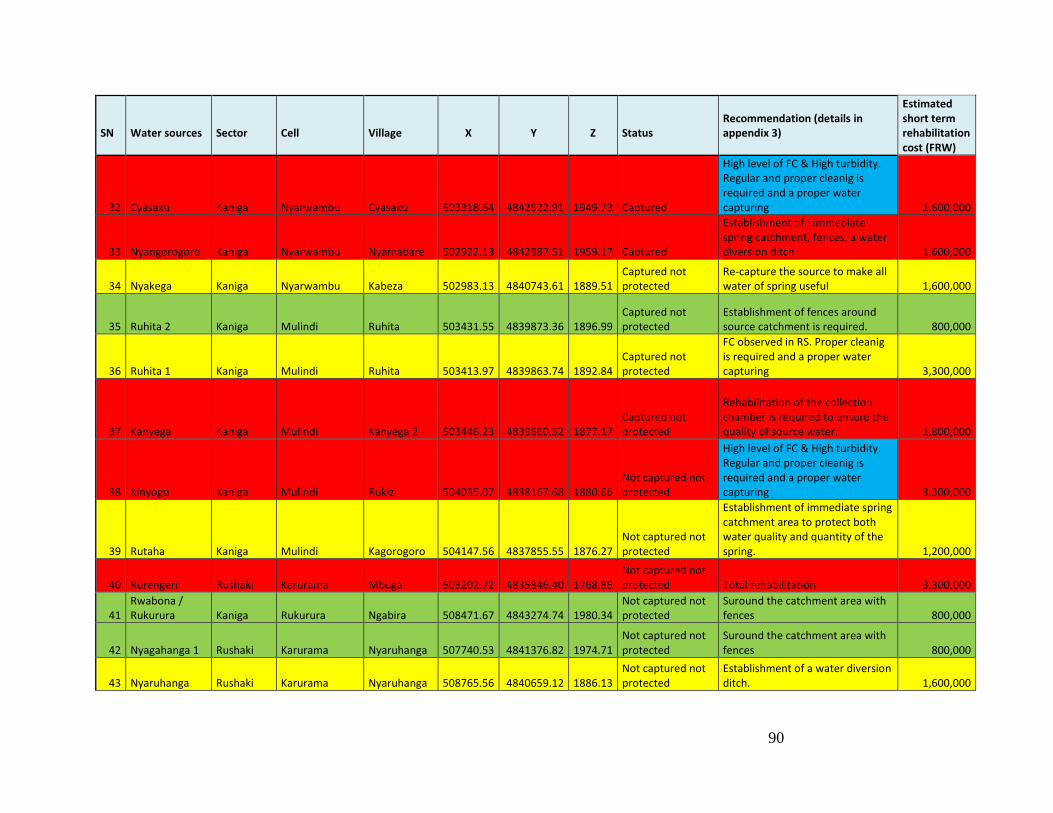
90
SN
Water sources
Sector
Cell
Village
X
Y
Z
Status
Recommendation (details in appendix 3)
Estimated short term rehabilitation cost (FRW)
32 Cyasaku Kaniga Nyarwambu Cyasaku 503318.64 4842522.91 1949.73 Captured
High level of FC & High turbidity. Regular and proper cleanig is required and a proper water capturing
1,600,000
33 Nyangorogoro Kaniga Nyarwambu Nyamabare 502922.18 4842987.51 1959.17 Captured
Establishment of : immediate spring catchment, fences, a water diversion ditch
1,600,000
34 Nyakega Kaniga Nyarwambu Kabeza 502983.13 4840743.61 1889.51 Captured not protected
Re-capture the source to make all water of spring useful
1,600,000
35 Ruhita 2 Kaniga Mulindi Ruhita 503431.55 4839873.36 1896.99 Captured not protected
Establishment of fences around source catchment is required.
800,000
36 Ruhita 1 Kaniga Mulindi Ruhita 503413.97 4839863.74 1892.84 Captured not protected
FC observed in RS. Proper cleanig is required and a proper water capturing
3,300,000
37 Kanyega Kaniga Mulindi Kanyega 2 503446.23 4839660.52 1877.17 Captured not protected
Rehabilitation of the collection chamber is required to ensure the quality of source water.
1,800,000
38 Kinyogo Kaniga Mulindi Rukizi 504035.07 4838167.68 1880.66 Not captured not protected
High level of FC & High turbidity. Regular and proper cleanig is required and a proper water capturing
3,300,000
39 Rutaha Kaniga Mulindi Kagorogoro 504147.56 4837855.55 1876.27 Not captured not protected
Establishment of immediate spring catchment area to protect both water quality and quantity of the spring.
1,200,000
40 Rurengeri Rushaki Karurama Mbuga 503202.72 4835846.40 1768.85 Not captured not protected Total rehabilitation
3,300,000
41 Rwabona / Rukurura Kaniga Rukurura Ngabira 508471.67 4843274.74 1980.34
Not captured not protected
Suround the catchment area with fences
800,000
42 Nyagahanga 1 Rushaki Karurama Nyaruhanga 507740.53 4841376.82 1974.71 Not captured not protected
Suround the catchment area with fences
800,000
43 Nyaruhanga Rushaki Karurama Nyaruhanga 508765.56 4840659.12 1886.13 Not captured not protected
Establishment of a water diversion ditch.
1,600,000
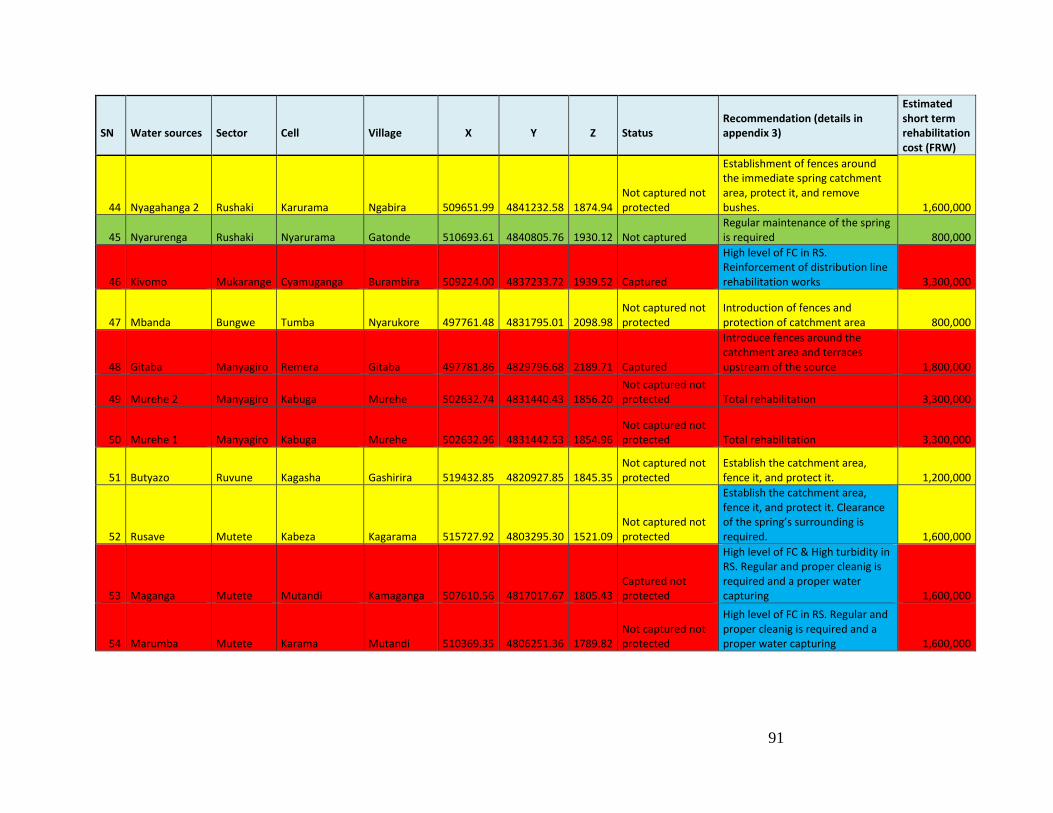
91
SN
Water sources
Sector
Cell
Village
X
Y
Z
Status
Recommendation (details in appendix 3)
Estimated short term rehabilitation cost (FRW)
44 Nyagahanga 2 Rushaki Karurama Ngabira 509651.99 4841232.58 1874.94 Not captured not protected
Establishment of fences around the immediate spring catchment area, protect it, and remove bushes.
1,600,000
45 Nyarurenga Rushaki Nyarurama Gatonde 510693.61 4840805.76 1930.12 Not captured Regular maintenance of the spring is required
800,000
46 Kivomo Mukarange Cyamuganga Burambira 509224.00 4837233.72 1939.52 Captured
High level of FC in RS. Reinforcement of distribution line rehabilitation works
3,300,000
47 Mbanda Bungwe Tumba Nyarukore 497761.48 4831795.01 2098.98 Not captured not protected
Introduction of fences and protection of catchment area
800,000
48 Gitaba Manyagiro Remera Gitaba 497781.86 4829796.68 2189.71 Captured
Introduce fences around the catchment area and terraces upstream of the source
1,800,000
49 Murehe 2 Manyagiro Kabuga Murehe 502632.74 4831440.43 1856.20 Not captured not protected Total rehabilitation
3,300,000
50 Murehe 1 Manyagiro Kabuga Murehe 502632.96 4831442.53 1854.96 Not captured not protected Total rehabilitation
3,300,000
51 Butyazo Ruvune Kagasha Gashirira 519432.85 4820927.85 1845.35 Not captured not protected
Establish the catchment area, fence it, and protect it.
1,200,000
52 Rusave Mutete Kabeza Kagarama 515727.92 4803295.30 1521.09 Not captured not protected
Establish the catchment area, fence it, and protect it. Clearance of the spring’s surrounding is required.
1,600,000
53 Maganga Mutete Mutandi Kamaganga 507610.56 4817017.67 1805.43 Captured not protected
High level of FC & High turbidity in RS. Regular and proper cleanig is required and a proper water capturing
1,600,000
54 Marumba Mutete Karama Mutandi 510369.35 4806251.36 1789.82 Not captured not protected
High level of FC in RS. Regular and proper cleanig is required and a proper water capturing
1,600,000

92
SN
Water sources
Sector
Cell
Village
X
Y
Z
Status
Recommendation (details in appendix 3)
Estimated short term rehabilitation cost (FRW)
55 Gisiza Mutete Kabeza Kabasega 511756.46 4807487.28 1643.67 Captured not protected
High level of FC in RS. Regular and proper cleanig is required and a proper water capturing
3,300,000
56 Nyamata Mutete Gaseke Runyinya 511925.37 4807932.63 1601.90 Captured not protected
High level of FC & High turbidity in RS. Regular and proper cleanig is required and a proper water capturing
1,600,000
57 Kabahura Nyankenke Rwagihura Kabahura 512015.97 4816574.45 1992.70 Captured and protected
Establish water diversion pathways
800,000
58 Ryaruganzu Byumba Murama Gacaca 506139.60 4826800.44 1955.12 Captured and not protected
The immediate rehabilitation of the source is required
1,800,000
59 Mugomero Rukomo Cyuru Sabiro 515004.58 4816537.78 1982.51 Not captured not protected
Introduce fences and protect the catchment area
1,600,000
60 Nyamabuye 1 Nyamiyaga Cyuru Karengo 513979.77 4816834.93 1968.55 Not captured not protected
Introduce fences and protect the catchment area. Reinforcement of the existing terraces
1,600,000
61 Nyamabuye 2 Nyamiyaga Cyuru Karengo 512694.89 4816519.79 1834.80 Captured not protected
High level of FC & High turbidity in RS. Introduce fences and protect the catchment area. Stop grazing in the vicinity of the source
3,300,000
62 Kabingo Byumba Kivugiza Kabingo 503281.89 4829017.30 1912.00 Captured
Establishment of a water source immediate protection area with fences
800,000
63 Gihanga Byumba Kivugiza Kabingo 503304.49 4829452.28 1937.00 Not captured not protected
Maintaince of the spring immediate catchment and fence it
1,600,000
64 Runyenyeri Byumba Kivugiza Kivugiza 503823.44 4826957.45 1887.00 Not captured not protected
Establishment of a water source immediate protection area with fences
1,600,000
65 Nyarukore (Burera) Bungwe Tumba Mubuga 498144.80 4832789.21 2012.23
Not captured not protected
Protect the catchment area and fence it
1,600,000
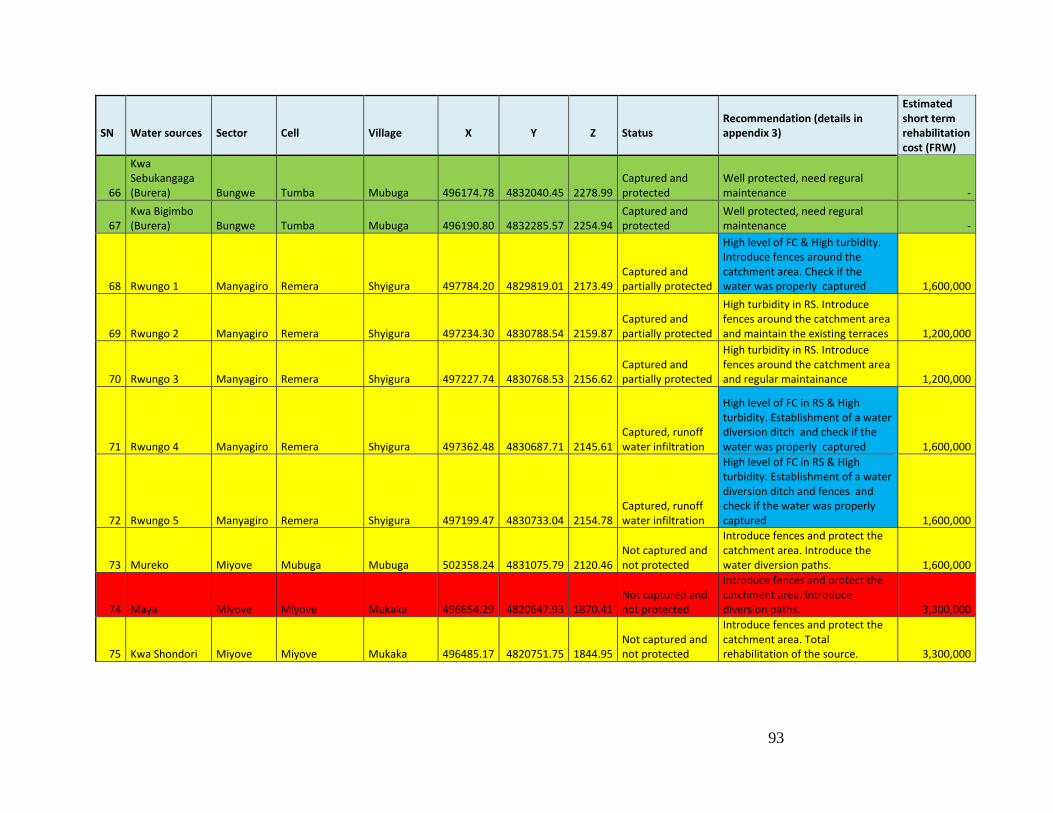
93
SN
Water sources
Sector
Cell
Village
X
Y
Z
Status
Recommendation (details in appendix 3)
Estimated short term rehabilitation cost (FRW)
66
Kwa Sebukangaga (Burera) Bungwe Tumba Mubuga 496174.78 4832040.45 2278.99
Captured and protected
Well protected, need regural maintenance
-
67 Kwa Bigimbo (Burera) Bungwe Tumba Mubuga 496190.80 4832285.57 2254.94
Captured and protected
Well protected, need regural maintenance
-
68 Rwungo 1 Manyagiro Remera Shyigura 497784.20 4829819.01 2173.49 Captured and partially protected
High level of FC & High turbidity. Introduce fences around the catchment area. Check if the water was properly captured
1,600,000
69 Rwungo 2 Manyagiro Remera Shyigura 497234.30 4830788.54 2159.87 Captured and partially protected
High turbidity in RS. Introduce fences around the catchment area and maintain the existing terraces
1,200,000
70 Rwungo 3 Manyagiro Remera Shyigura 497227.74 4830768.53 2156.62 Captured and partially protected
High turbidity in RS. Introduce fences around the catchment area and regular maintainance
1,200,000
71 Rwungo 4 Manyagiro Remera Shyigura 497362.48 4830687.71 2145.61 Captured, runoff water infiltration
High level of FC in RS & High turbidity. Establishment of a water diversion ditch and check if the water was properly captured
1,600,000
72 Rwungo 5 Manyagiro Remera Shyigura 497199.47 4830733.04 2154.78 Captured, runoff water infiltration
High level of FC in RS & High turbidity. Establishment of a water diversion ditch and fences and check if the water was properly captured
1,600,000
73 Mureko Miyove Mubuga Mubuga 502358.24 4831075.79 2120.46 Not captured and not protected
Introduce fences and protect the catchment area. Introduce the water diversion paths.
1,600,000
74 Maya Miyove Miyove Mukaka 496654.29 4820647.93 1870.41 Not captured and not protected
Introduce fences and protect the catchment area. Introduce diversion paths.
3,300,000
75 Kwa Shondori Miyove Miyove Mukaka 496485.17 4820751.75 1844.95 Not captured and not protected
Introduce fences and protect the catchment area. Total rehabilitation of the source.
3,300,000

94
SN
Water sources
Sector
Cell
Village
X
Y
Z
Status
Recommendation (details in appendix 3)
Estimated short term rehabilitation cost (FRW)
76 Mu Kadogo Miyove Miyove Mukaka 496943.13 4820737.82 1989.61 Not captured and not protected
Properly capture the source, introduce fences and protect the catchment area.
3,300,000
77 Kabere Nyankenke Butare Kabere 500664.70 4821996.84 2106.05 Captured and not protected
High level of FC in RS & High turbidity. Establishment of a water diversion ditch and fences and check if the water was properly captured
3,300,000
78 Rwambeho Nyankenke Butare Rwambeho 499474.61 4822958.64 2039.69 Captured and protected
Regular maintenance of the spring is required
-
79 Ku Itare Nyankenke Butare Gikombe 499460.03 4822939.51 2061.73 Captured and protected
Regular maintenance of the spring is required. Reinforce the existing fences
-
80 Gatare Nyankenke Yaramba Mwenyi 499971.74 4825570.82 1973.08 Not captured not protected
Establishment of: immediate spring catchment, fences, a water diversion ditch
1,600,000
81 Nyarukombe Manyagiro Nyarukombe Ryaruyumba 500025.26 4830235.85 1909.60 Not captured not protected
High turbidity in RS. Establishment of: immediate spring catchment, fences, a water diversion ditch
3,300,000
82 Nyarubande Byumba Nyarutarama Rugandu 504857.08 4824000.43 2027.15 Captured not protected
High turbidity in RS. Establishment of: immediate spring catchment, fences, a water diversion ditch
3,300,000
83 Kabingo Ruvune Gashirira Nyarurama 504807.12 4824074.07 1803.01 Not captured and protected
A new source that need to be captured
6,000,000
84 Kagomero Ruvune Cyandaro Nyankokoma 522495.59 4817945.96 1652.62 Captured FC observed in RS. Total rehabilitation
3,300,000
85 Kariba 1 Rukomo Kinyami Kariba 513138.08 4820790.31 1789.88 Captured not protected
Install a collection chamber and it should be secured and locked
3,300,000
86 Kariba 2 Rukomo Kinyami Kariba 513224.54 4820905.74 1882.32 Captured not protected
Install a collection chamber, secure it and lock it
3,300,000
87 Nyakabingo 1 Shangasha Bushara Nyakabingo 508541.60 4831867.51 1886.83 Not captured
High level of FC in DS. Introduce fences around the catchment area. Check if the water was properly captured
3,300,000

95
SN
Water sources
Sector
Cell
Village
X
Y
Z
Status
Recommendation (details in appendix 3)
Estimated short term rehabilitation cost (FRW)
88 Nyakabingo 2 Shangasha Bushara Nyakabingo 508516.56 4831861.88 1903.17 Captured and partially protected
Introduces fences arround the immediate water catchment area
1,600,000
89 Nyakabingo 3 Shangasha Bushara Bushara 508517.57 4831861.32 1889.66 Captured and partially protected
Introduces fences arround the immediate water catchment area
1,600,000
90 Nyakabingo 4 Shangasha Bushara Gasura 508395.62 4831929.21 1938.82 Captured not protected
FC observed in RS. Introduces fences, clear and protect the catchment area. Install a water collection chamber, secure it and lock it
3,300,000
91 Kabayi Shangasha Kitazigurwa Rugarama 510757.57 4830214.38 1946.99 Not captured not protected
Introduces fences to protect the catchment area. Establish of a water diversion ditch
1,600,000
92 Kazirankurwe Shangasha Nyabubare Nyamiyaga 510518.70 4830760.25 1929.32 Not captured not protected
Establishment of: immediate spring catchment, fences, a water diversion ditch
1,600,000
93 Rwangabo Bwisige Gihuke Kumunini 516230.24 4827353.66 1854.25 Captured not protected Total rehabilitation
25,000,000
94 Kagorogoro Bwisige Bwisige Rutoma 515896.52 4826916.40 1870.78 Not captured and not protected
High level of FC in RS. Maintain fences around the catchment area. Check if the water was properly captured
3,300,000
95 Kanyirabuki Bwisige Gihuke Kuwindege 515511.48 4827788.11 1830.84 Captured not protected
Introduces fences and protect the catchment area. Establish a water diversion ditch downstream
1,600,000
96 Ryaruganzu Bwisige Nyabushingitwa Musayo 512976.53 4830918.34 1903.52 Captured not protected
Recapture the source and introduces diversion paths. Introduce fences and protect the catchment area
3,300,000
97 Kigaga Bwisige Mukono Murambi 510547.49 4795925.62 1818.09 Not captured and not protected
Protect both the source and the catchment area and introduces fences
1,600,000
98 Gahondo Rukomo Kinyami Gahondo 510632.55 4821508.78 1874.07 Not captured and not protected
Introduces fences, and protect the catchment area
1,600,000
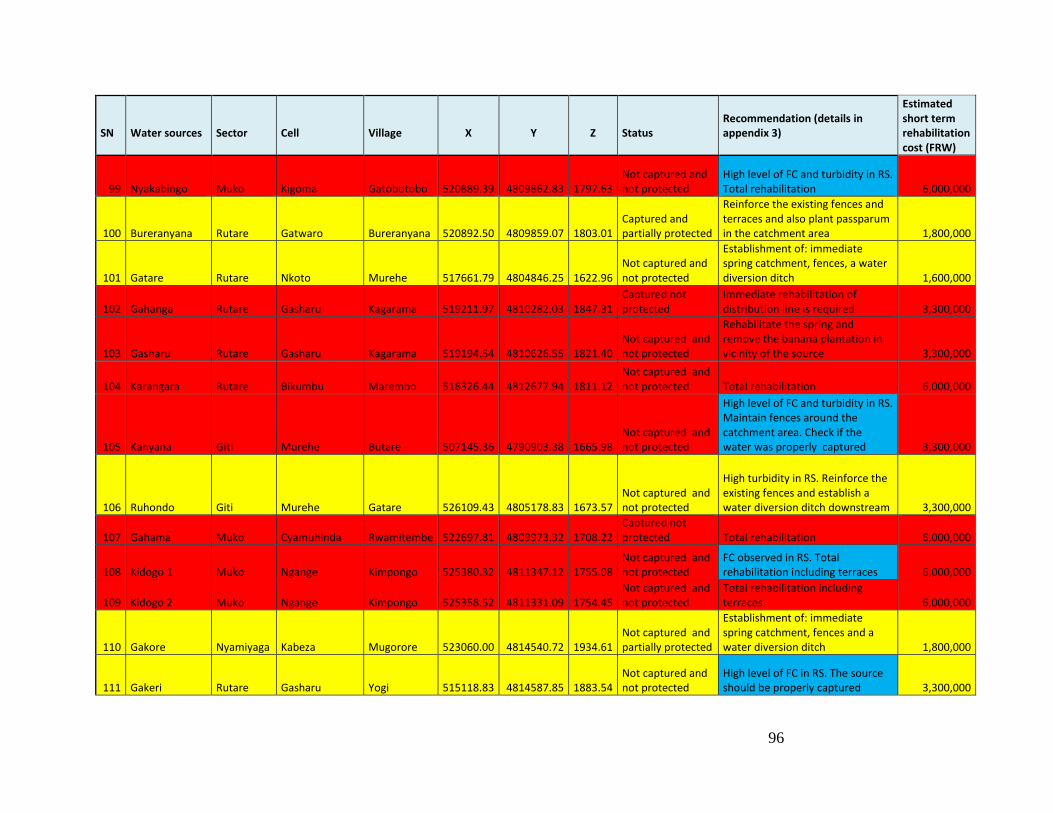
96
SN
Water sources
Sector
Cell
Village
X
Y
Z
Status
Recommendation (details in appendix 3)
Estimated short term rehabilitation cost (FRW)
99 Nyakabingo Muko Kigoma Gatobotobo 520889.39 4809862.83 1797.63 Not captured and not protected
High level of FC and turbidity in RS. Total rehabilitation
6,000,000
100 Bureranyana Rutare Gatwaro Bureranyana 520892.50 4809859.07 1803.01 Captured and partially protected
Reinforce the existing fences and terraces and also plant passparum in the catchment area
1,800,000
101 Gatare Rutare Nkoto Murehe 517661.79 4804846.25 1622.96 Not captured and not protected
Establishment of: immediate spring catchment, fences, a water diversion ditch
1,600,000
102 Gahanga Rutare Gasharu Kagarama 519211.97 4810282.03 1847.31 Captured not protected
Immediate rehabilitation of distribution line is required
3,300,000
103 Gasharu Rutare Gasharu Kagarama 519194.54 4810626.55 1821.40 Not captured and not protected
Rehabilitate the spring and remove the banana plantation in vicinity of the source
3,300,000
104 Karangara Rutare Bikumbu Marembo 518326.44 4812677.94 1811.12 Not captured and not protected Total rehabilitation
6,000,000
105 Kanyana Giti Murehe Butare 507145.36 4790903.38 1665.98 Not captured and not protected
High level of FC and turbidity in RS. Maintain fences around the catchment area. Check if the water was properly captured
3,300,000
106 Ruhondo Giti Murehe Gatare 526109.43 4805178.83 1673.57 Not captured and not protected
High turbidity in RS. Reinforce the existing fences and establish a water diversion ditch downstream
3,300,000
107 Gahama Muko Cyamuhinda Rwamitembe 522697.81 4809973.32 1708.22 Captured not protected Total rehabilitation
6,000,000
108 Kidogo 1 Muko Ngange Kimpongo 525380.32 4811347.12 1755.08 Not captured and not protected
FC observed in RS. Total rehabilitation including terraces
6,000,000
109 Kidogo 2 Muko Ngange Kimpongo 525358.52 4811331.09 1754.45 Not captured and not protected
Total rehabilitation including terraces
6,000,000
110 Gakore Nyamiyaga Kabeza Mugorore 523060.00 4814540.72 1934.61 Not captured and partially protected
Establishment of: immediate spring catchment, fences and a water diversion ditch
1,800,000
111 Gakeri Rutare Gasharu Yogi 515118.83 4814587.85 1883.54 Not captured and not protected
High level of FC in RS. The source should be properly captured
3,300,000
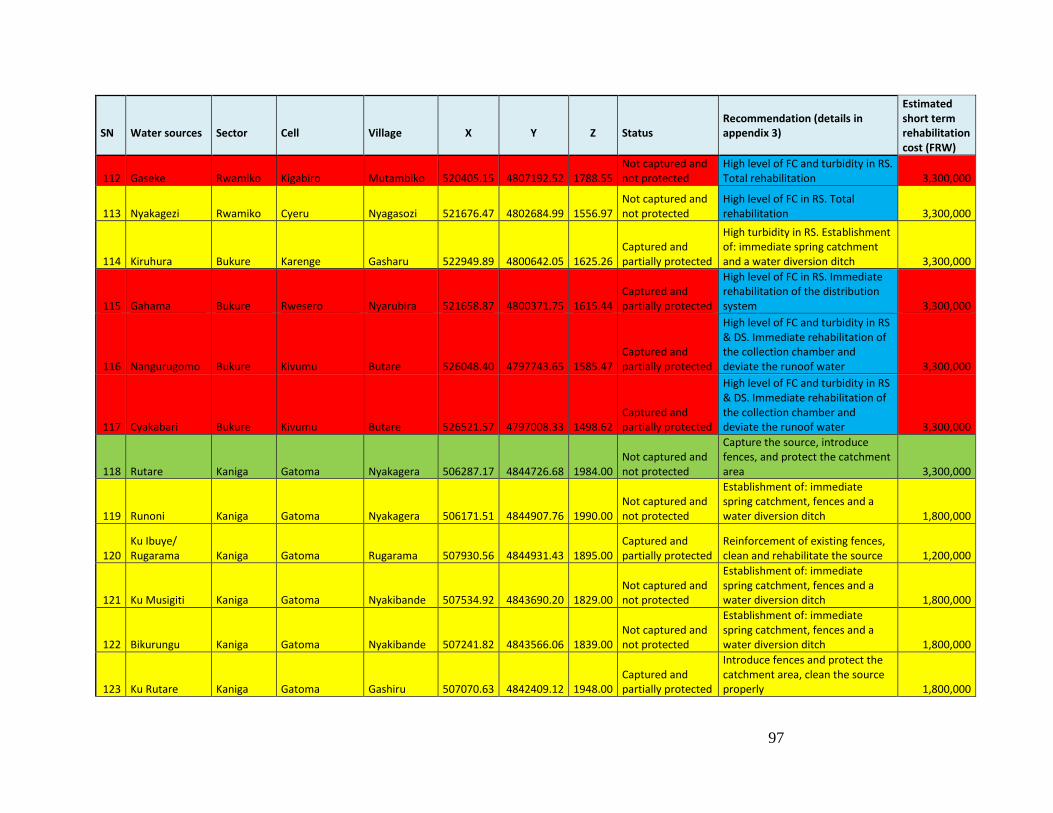
97
SN
Water sources
Sector
Cell
Village
X
Y
Z
Status
Recommendation (details in appendix 3)
Estimated short term rehabilitation cost (FRW)
112 Gaseke Rwamiko Kigabiro Mutambiko 520405.15 4807192.52 1788.55 Not captured and not protected
High level of FC and turbidity in RS. Total rehabilitation
3,300,000
113 Nyakagezi Rwamiko Cyeru Nyagasozi 521676.47 4802684.99 1556.97 Not captured and not protected
High level of FC in RS. Total rehabilitation
3,300,000
114 Kiruhura Bukure Karenge Gasharu 522949.89 4800642.05 1625.26 Captured and partially protected
High turbidity in RS. Establishment of: immediate spring catchment and a water diversion ditch
3,300,000
115 Gahama Bukure Rwesero Nyarubira 521658.87 4800371.75 1615.44 Captured and partially protected
High level of FC in RS. Immediate rehabilitation of the distribution system
3,300,000
116 Nangurugomo Bukure Kivumu Butare 526048.40 4797743.65 1585.47 Captured and partially protected
High level of FC and turbidity in RS & DS. Immediate rehabilitation of the collection chamber and deviate the runoof water
3,300,000
117 Cyakabari Bukure Kivumu Butare 526521.57 4797008.33 1498.62 Captured and partially protected
High level of FC and turbidity in RS & DS. Immediate rehabilitation of the collection chamber and deviate the runoof water
3,300,000
118 Rutare Kaniga Gatoma Nyakagera 506287.17 4844726.68 1984.00 Not captured and not protected
Capture the source, introduce fences, and protect the catchment area
3,300,000
119 Runoni Kaniga Gatoma Nyakagera 506171.51 4844907.76 1990.00 Not captured and not protected
Establishment of: immediate spring catchment, fences and a water diversion ditch
1,800,000
120 Ku Ibuye/ Rugarama Kaniga Gatoma Rugarama 507930.56 4844931.43 1895.00
Captured and partially protected
Reinforcement of existing fences, clean and rehabilitate the source
1,200,000
121 Ku Musigiti Kaniga Gatoma Nyakibande 507534.92 4843690.20 1829.00 Not captured and not protected
Establishment of: immediate spring catchment, fences and a water diversion ditch
1,800,000
122 Bikurungu Kaniga Gatoma Nyakibande 507241.82 4843566.06 1839.00 Not captured and not protected
Establishment of: immediate spring catchment, fences and a water diversion ditch
1,800,000
123 Ku Rutare Kaniga Gatoma Gashiru 507070.63 4842409.12 1948.00 Captured and partially protected
Introduce fences and protect the catchment area, clean the source properly
1,800,000
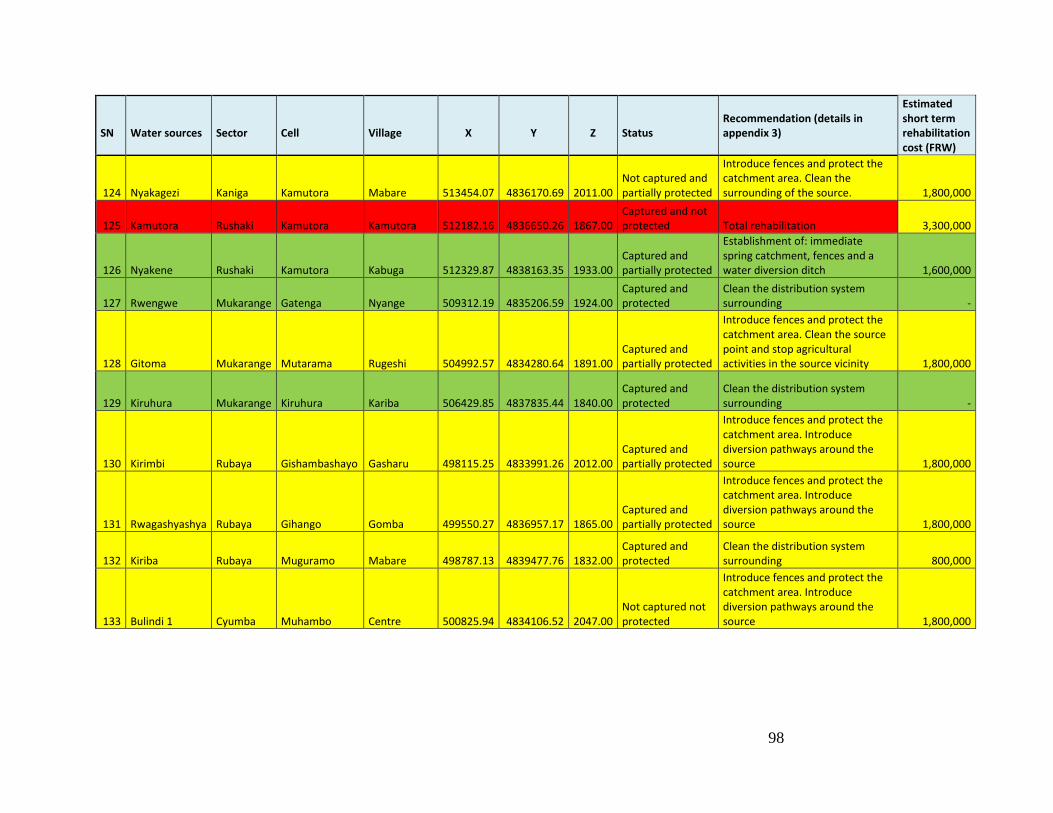
98
SN
Water sources
Sector
Cell
Village
X
Y
Z
Status
Recommendation (details in appendix 3)
Estimated short term rehabilitation cost (FRW)
124 Nyakagezi Kaniga Kamutora Mabare 513454.07 4836170.69 2011.00 Not captured and partially protected
Introduce fences and protect the catchment area. Clean the surrounding of the source.
1,800,000
125 Kamutora Rushaki Kamutora Kamutora 512182.16 4836650.26 1867.00 Captured and not protected Total rehabilitation
3,300,000
126 Nyakene Rushaki Kamutora Kabuga 512329.87 4838163.35 1933.00 Captured and partially protected
Establishment of: immediate spring catchment, fences and a water diversion ditch
1,600,000
127 Rwengwe Mukarange Gatenga Nyange 509312.19 4835206.59 1924.00 Captured and protected
Clean the distribution system surrounding
-
128 Gitoma Mukarange Mutarama Rugeshi 504992.57 4834280.64 1891.00 Captured and partially protected
Introduce fences and protect the catchment area. Clean the source point and stop agricultural activities in the source vicinity
1,800,000
129 Kiruhura Mukarange Kiruhura Kariba 506429.85 4837835.44 1840.00 Captured and protected
Clean the distribution system surrounding
-
130 Kirimbi Rubaya Gishambashayo Gasharu 498115.25 4833991.26 2012.00 Captured and partially protected
Introduce fences and protect the catchment area. Introduce diversion pathways around the source
1,800,000
131 Rwagashyashya Rubaya Gihango Gomba 499550.27 4836957.17 1865.00 Captured and partially protected
Introduce fences and protect the catchment area. Introduce diversion pathways around the source
1,800,000
132 Kiriba Rubaya Muguramo Mabare 498787.13 4839477.76 1832.00 Captured and protected
Clean the distribution system surrounding
800,000
133 Bulindi 1 Cyumba Muhambo Centre 500825.94 4834106.52 2047.00 Not captured not protected
Introduce fences and protect the catchment area. Introduce diversion pathways around the source
1,800,000

99
SN
Water sources
Sector
Cell
Village
X
Y
Z
Status
Recommendation (details in appendix 3)
Estimated short term rehabilitation cost (FRW)
134 Bulindi 2 Cyumba Muhambo Rugerero 501360.57 4834382.82 1950.00 Captured and not protected
Introduce fences and protect the catchment area. Rehabilitate the water diversion pathways. Stop the agricultural activities in the catchment area
3,300,000
135 Gashija Cyumba Nyakabungo Gashija 500931.53 4838569.49 1929.00 Not captured not protected
Introduce fences and protect the catchment area. Introduce diversion pathways around the source
1,800,000
136 Museke Miyove Gakenke Museke 500431.32 4819694.72 2011.00 Not captured not protected
High level of FC in RS. Total rehabilitation
6,000,000
137 Gatare Shangasha Nyabishambi Matyazo 509727.49 4827379.75 1902.00 Not captured not protected
Introduce fences and protect the catchment area
1,800,000
138 Rwagahunde Giti Gatobotobo Matyazo 521781.27 4807668.63 1894.00 Not captured not protected
Introduce fences and protect the catchment area
1,800,000
139 Kariku Mutete Nyarubuye Nyenzi 509182.14 4813930.57 1890.00 Not captured not protected
Introduce fences and protect the catchment area
1,800,000
140 Gahondo Mutete Nyarubuye Gitega 510330.45 4812007.37 1787.00 Not captured not protected Total rehabilitation
6,000,000
141 Rwimilindi 1 Ruvune Cyandaro Kigarama 520758.74 4818873.32 1685.04 Not captured not protected
Introduces fences and protect the catchment area. Remove banana plantation in direct protection zone and rehabilitate the spring
1,800,000
142 Rwimilindi 2 Ruvune Cyandaro Kigarama 520769.09 4818867.02 1684.71 Captured and not protected
Establishment of: immediate spring catchment, fences and a water diversion ditch
3,300,000
143 Karitushi Rukomo Mabare Kanyiramana 511531.73 4824718.53 1794.45 Captured and partially protected
Maintain the immediate spring catchment, fences and a water diversion ditch
3,300,000

100
SN
Water sources
Sector
Cell
Village
X
Y
Z
Status
Recommendation (details in appendix 3)
Estimated short term rehabilitation cost (FRW)
144 Kadogo Rukomo Mabare Kanyiramana 511321.77 4824767.52 1794.44 Captured and partially protected Total rehabilitation
6,000,000
Sub-total (FRW) 356,500,000
Training of water users association for springs management and protection every 5 years (FRW) 100,000,000
Total (FRW) 456,500,000
Explanation
Water sources/springs that needs high priority action for their protection
Water sources/springs that needs medium priority action for their protection
Water sources/springs in good state or with small requirements for their protection
High level of fecal coliform observed/ the system need further investigation
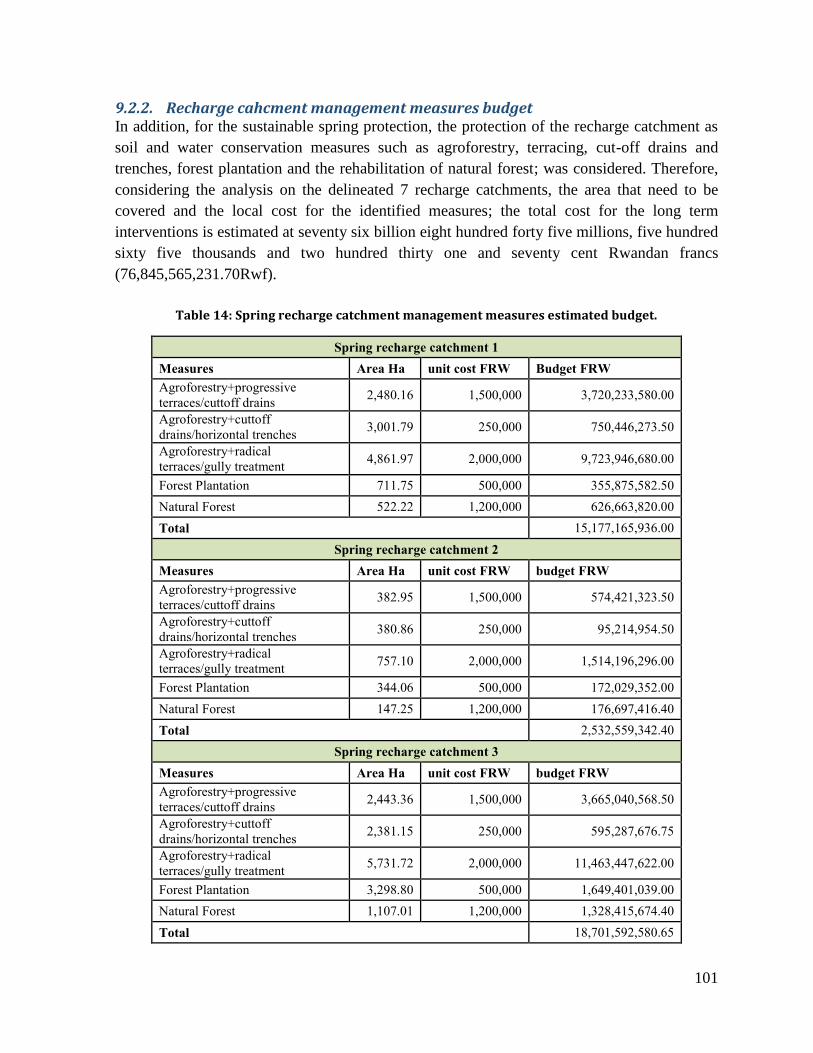
101
9.2.2. Recharge cahcment management measures budget In addition, for the sustainable spring protection, the protection of the recharge catchment as
soil and water conservation measures such as agroforestry, terracing, cut-off drains and
trenches, forest plantation and the rehabilitation of natural forest; was considered. Therefore,
considering the analysis on the delineated 7 recharge catchments, the area that need to be
covered and the local cost for the identified measures; the total cost for the long term
interventions is estimated at seventy six billion eight hundred forty five millions, five hundred
sixty five thousands and two hundred thirty one and seventy cent Rwandan francs
(76,845,565,231.70Rwf).
Table 14: Spring recharge catchment management measures estimated budget.
Spring recharge catchment 1
Measures Area Ha unit cost FRW Budget FRW
Agroforestry+progressive
terraces/cuttoff drains 2,480.16 1,500,000 3,720,233,580.00
Agroforestry+cuttoff
drains/horizontal trenches 3,001.79 250,000 750,446,273.50
Agroforestry+radical
terraces/gully treatment 4,861.97 2,000,000 9,723,946,680.00
Forest Plantation 711.75 500,000 355,875,582.50
Natural Forest 522.22 1,200,000 626,663,820.00
Total 15,177,165,936.00
Spring recharge catchment 2
Measures Area Ha unit cost FRW budget FRW
Agroforestry+progressive
terraces/cuttoff drains 382.95 1,500,000 574,421,323.50
Agroforestry+cuttoff
drains/horizontal trenches 380.86 250,000 95,214,954.50
Agroforestry+radical
terraces/gully treatment 757.10 2,000,000 1,514,196,296.00
Forest Plantation 344.06 500,000 172,029,352.00
Natural Forest 147.25 1,200,000 176,697,416.40
Total 2,532,559,342.40
Spring recharge catchment 3
Measures Area Ha unit cost FRW budget FRW
Agroforestry+progressive
terraces/cuttoff drains 2,443.36 1,500,000 3,665,040,568.50
Agroforestry+cuttoff
drains/horizontal trenches 2,381.15 250,000 595,287,676.75
Agroforestry+radical
terraces/gully treatment 5,731.72 2,000,000 11,463,447,622.00
Forest Plantation 3,298.80 500,000 1,649,401,039.00
Natural Forest 1,107.01 1,200,000 1,328,415,674.40
Total 18,701,592,580.65

102
Spring recharge catchment 4
Measures Area Ha unit cost FRW budget FRW
Agroforestry+progressive
terraces/cuttoff drains 775.00 1,500,000 1,162,493,739.00
Agroforestry+cuttoff
drains/horizontal trenches 669.65 250,000 167,412,532.25
Agroforestry+radical
terraces/gully treatment 2,093.90 2,000,000 4,187,790,634.00
Forest Plantation 1,507.98 500,000 753,990,625.50
Natural Forest 467.42 1,200,000 560,898,926.40
Total 6,832,586,457.15
Spring recharge catchment 5
Measures Area Ha unit cost FRW budget FRW
Agroforestry+progressive
terraces/cuttoff drains 1,483.28 1,500,000 2,224,915,209.00
Agroforestry+cuttoff
drains/horizontal trenches 1,370.88 250,000 342,720,508.75
Agroforestry+radical
terraces/gully treatment 3,958.84 2,000,000 7,917,687,158.00
Forest Plantation 2,846.42 500,000 1,423,208,029.50
Natural Forest 1,175.38 1,200,000 1,410,457,663.20
Total 13,318,988,568.45
Spring recharge catchment 6
Measures Area Ha unit cost FRW budget FRW
Agroforestry+progressive
terraces/cuttoff drains 1,080.31 1,500,000 1,620,471,124.50
Agroforestry+cuttoff
drains/horizontal trenches 886.03 250,000 221,506,932.00
Agroforestry+radical
terraces/gully treatment 2,976.71 2,000,000 5,953,413,412.00
Forest Plantation 2,305.91 500,000 1,152,954,024.00
Natural Forest 786.93 1,200,000 944,321,050.80
Total 9,892,666,543.30
Spring recharge catchment 7
Measures Area Ha unit cost FRW budget FRW
Agroforestry+progressive
terraces/cuttoff drains 992.84 1,500,000 1,489,257,541.50
Agroforestry+cuttoff
drains/horizontal trenches 763.52 250,000 190,879,674.25
Agroforestry+radical
terraces/gully treatment 3,352.06 2,000,000 6,704,116,532.00
Forest Plantation 922.23 500,000 461,116,826.00
Natural Forest 1,287.20 1,200,000 1,544,635,230.00
Total 10,390,005,803.75
Total for 7 catchments 76,845,565,231.70

103
10. Conclusions and recommendations
The main objective was to develop the water sources management plan for the water sources
and Mwange River located in the sub watersheds of the Gicumbi District. For the current
status of the water sources, the main focus was given to the 144 water sources while for the
water balance estimation 390 water sources were used and they were selected in conjunction
with WFP, including those captured, planned and in the pipeline. To this objective the
following specific objectives were associated:
To quantify and qualify the available water sources on the surface in time and
space,
To assess the hydrology of the Mwange River catchment,
To quantify water sources use and demand in the study area,
To identify water surplus and deficit both in time and space in the study area,
To develop a water sources management plan for optimal and rational
utilization of available water sources in the study area,
To train one stop center staffs on the use of GIS tools
Regarding the water demand, surplus and deficit, it has been found that, the water demands
should not meet in 25 years to come if the district continue to rely on water from the existing
springs. Under a conservative scenario “A” for water consumption, nearly half of the sectors
are non-water deficit, but with a modest surplus. On the other side, under a dynamic water
consumption rate scenario “B”, the general observations are that the sectors of Byumba,
Miyove, Kageyo, Rushaki, Nyamiyaga, Rubaya and Shangasha are currently the only non-
water deficit Sector of all. The major driver of the water deficit in Gicumbi District was
observed to be the population demand and growth.
The water quality analysis was done for 101 springs taking into account a number of
parameters critical for drinking water purposes. This analysis was done in the rainy and dry
seasons to ensure capturing the variations of water quality over time and space. In addition to
the springs, the Mwange River was also assessed at the point of interest of WASAC Ltd, as a
prospective intake location for their future water treatment plant. Therefore, the water quality
analysis findings of this study are as follow:
The hydrogen potential (pH) varies between 3.54 - 7.21 units and 4.12 – 7.61 units in
the rainy and dry season respectively. Of all the samples collected, 97.03% in rainy
season were observed with acidic pH below the RSB and WHO standards for drinking
water, while 96.04% in dry season were also below the standards used.
The turbidity varies between 0.00-324.00 NTU and 0.09-228 NTU in the rainy and dry
seasons respectively. Of all the samples collected, 57.43% in the rainy season were

104
below the standards, while 42.57% were above the standards. For the case of dry
season, 96.04% comply with the standards and only 3.96% were above the standards.
For iron concentration, in rainy season 72.18% comply with the standards while
17.82% were above the standards. In the dry season, 99.01% of the sources comply
with the standards while 0.99%, representing the Mwange River, was above the
standards.
For the manganese concentration, in the rainy season 79.21% of the sources comply
with the standards while 20.79% were above standards. In the dry season, 96.04% of
the sources comply with the standards while 3.96% were above standards.
The total nitrogen concentration varied between 0.01 mg/L-10.1 mg/L and 0.00 mg/L-
0.45 mg/L in the rainy and dry season respectively. Note that, the highest
concentration was observed in the Mwange River.
The total phosphorus concentration varies between 0.00 mg/L-5.6 mg/L and 0.28
mg/L-1.01 mg/L in the rainy and dry season respectively. Note that, the highest
concentration was observed in the Mwange River.
For total coliform content, in the rainy season it was found that 49.5% were
contaminated with coliforms and 50.5% had no coliform content. In the dry season,
19.8% were contaminated with coliforms and 80.2% were free of coliforms.
The increased concentration of fecal coliforms during the rainy season should be associated
with the ground water contamination by the pit latrines in the area and the runoff of water in
the water catchment which in many places is not well protected and/or captured. It was also
noted that farmers in the Gicumbi Districts and in the neighboring Rulindo District regularly
empty their pit latrines in their farms as a fertilizer. However, this human waste as a source of
fertilizer is probably behind the high level of total coliforms and need to be stopped until the
practice is standardized for authorized composting. Besides, the measured concentration in
Total Nitrogen and Total Phosphorous indicates a general increasing concentration in rainy
season. It should be noted that the latter two parameters could serve as baseline concentrations
that should be checked at least every two or three years to assure that significant increases in
nitrogen and phosphorous compounds are not occurring due to fertilizer or manure spill.
A catchment management plan and spring protection approach, made of a set of term
measures (all in the soil and water conservation package) were proposed. The catchment
management plan were made for all the delineated spring recharge catchments and the status
of each visited spring and action needed for its protection (provided in appendix 3) were also
assessed and proposed. The identified spring protection activities and budget was estimated at
Four Hundred Fifty Six Million and Five Hundred Thousand Rwandan Francs, while the
spring recharge catchment management measures was estimated at seventy six billion eight
hundred forty five millions, five hundred sixty five thousands and two hundred thirty one and
seventy cent Rwandan francs.

105
Due to the fact that Total coliforms have been confirmed to be present in the water sources
especially in rain season and considering the bad status of many water sources as described in
appendix 3, the following is recommended:
1. There is a need to repair or rehabilitate the existing water springs. Follow the guideline
of the distances between water springs and anthropogenic activities;
2. Recapture properly the water spring that are exposed to erosion and provide a water
diversion ditch as detailed for each source in appendix 3;
3. To create awareness in the population for the effective management of their water
sources especially during the rainy season;
4. Marking the water supply pipelines is an urgent action to avoid water losses that may
occur as pipes are damaged by other anthropogenic activities;
5. The water operators should regularly monitor the water quality of the spring and in
particular the fecal coliforms;
6. It is urgently needed to add pH regulators and disinfection units to treat the water
systems that receives the water from the highly contaminated springs with fecal
coliforms;
7. It is recommended to put in place a water users association to manage each water
source which will work closely with the hydrographic basin committee already
established at the level of Gicumbi District;
8. The water users association, the hydrographic basin committee and water operators
should be trained regularly for the spring/catchment management;
9. A wide awareness campaign should also be carried out targeting local communities
especially in the neighborhood of the spring infrastructures;
10. A comprehensive study on the sanitation of the Gicumbi District is highly
recommended to avoid pollution of the water resources by pit latrines;
11. The district must encourage the population from different centers to harvest the
rainwater from the roofs of their houses as one alternative to mitigate the water deficit.
This should also be accompanied with encouragement of people to go in
agglomeration in order to facilitate the water supply activities;
12. Although the identified 7 recharge catchments correspond to the suspended aquifers,
the district need to consider the potential of using wells in the catchment and
groundwater for water supply.
13. A study on alternatives water sources should be carried out considering that already
many sectors have deficit and that only spring water sources will not be sufficient for
the water demand in Gicumbi District in the years to come. The study should focus on
water from rivers, groundwater and rainwater harvesting.
106
11. References
1. APHA, AWWA, WEF, 1998. Standard methods for the examination of water and
wastewater, 30 edn. American Public Health Association, Washington, D.C.
2. Gicumbi District, 2013. District Development Plan 2013-2018
3. Republic of Rwanda, 2020. Rwanda Vision 2020 Revised 2012.
4. Gicumbi district, 2016. Water sources management plan for the water sources located in
Gicumbi District
5. MINICOFIN (2013): Economic Development and Poverty Reduction Strategy II (2013-
2018)
6. MINIRENA, 2011. National Policy for Water Resources Management.
7. MINIRENA, 2014. Rwanda National Water Resources Master Plan
8. NISR, 2014. Main indicators report. Fourth Population and Housing Census in Rwanda
for 2012
9. NISR, 2015. Results of Integrated Household Living Conditions Survey, EICV 2013-2014
10. Ngendo C, 2013.Landscape-based assessment of soil acidity and risk for soil acidification
in Rwanda. Ghent University ,Vrije Universiteit Brussel, Belgium.
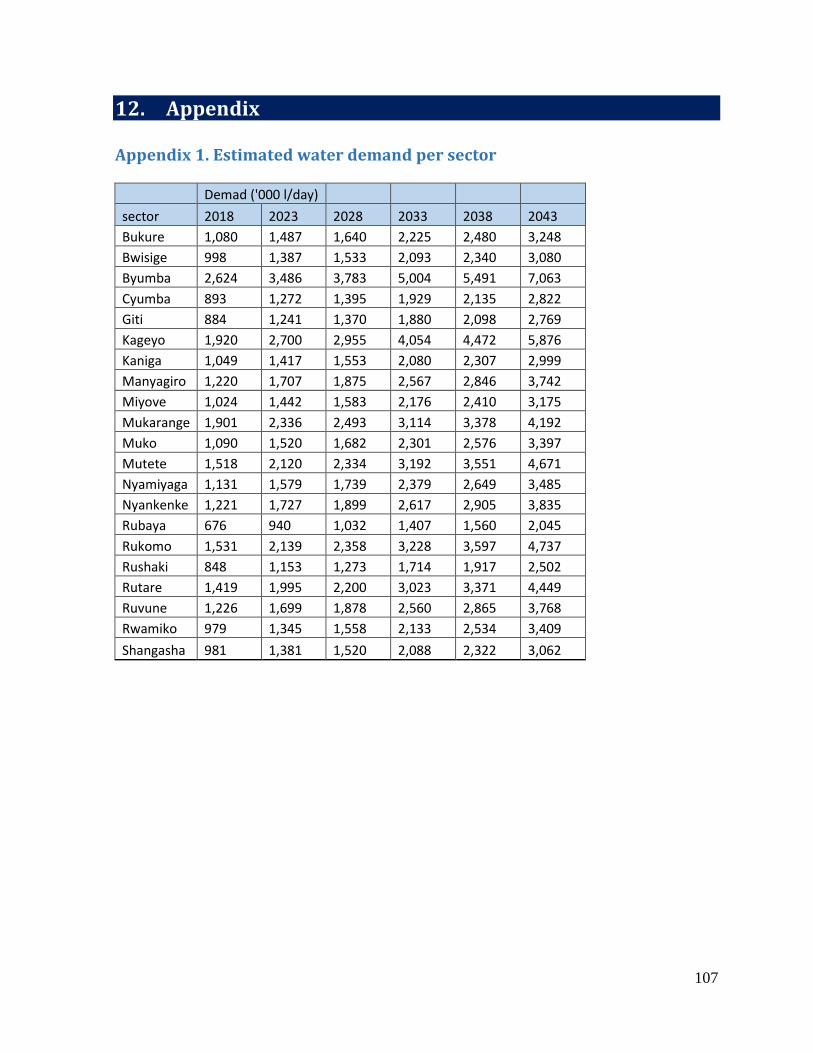
107
12. Appendix
Appendix 1. Estimated water demand per sector
Demad ('000 l/day)
sector 2018 2023 2028 2033 2038 2043
Bukure 1,080 1,487 1,640 2,225 2,480 3,248
Bwisige 998 1,387 1,533 2,093 2,340 3,080
Byumba 2,624 3,486 3,783 5,004 5,491 7,063
Cyumba 893 1,272 1,395 1,929 2,135 2,822
Giti 884 1,241 1,370 1,880 2,098 2,769
Kageyo 1,920 2,700 2,955 4,054 4,472 5,876
Kaniga 1,049 1,417 1,553 2,080 2,307 2,999
Manyagiro 1,220 1,707 1,875 2,567 2,846 3,742
Miyove 1,024 1,442 1,583 2,176 2,410 3,175
Mukarange 1,901 2,336 2,493 3,114 3,378 4,192
Muko 1,090 1,520 1,682 2,301 2,576 3,397
Mutete 1,518 2,120 2,334 3,192 3,551 4,671
Nyamiyaga 1,131 1,579 1,739 2,379 2,649 3,485
Nyankenke 1,221 1,727 1,899 2,617 2,905 3,835
Rubaya 676 940 1,032 1,407 1,560 2,045
Rukomo 1,531 2,139 2,358 3,228 3,597 4,737
Rushaki 848 1,153 1,273 1,714 1,917 2,502
Rutare 1,419 1,995 2,200 3,023 3,371 4,449
Ruvune 1,226 1,699 1,878 2,560 2,865 3,768
Rwamiko 979 1,345 1,558 2,133 2,534 3,409
Shangasha 981 1,381 1,520 2,088 2,322 3,062
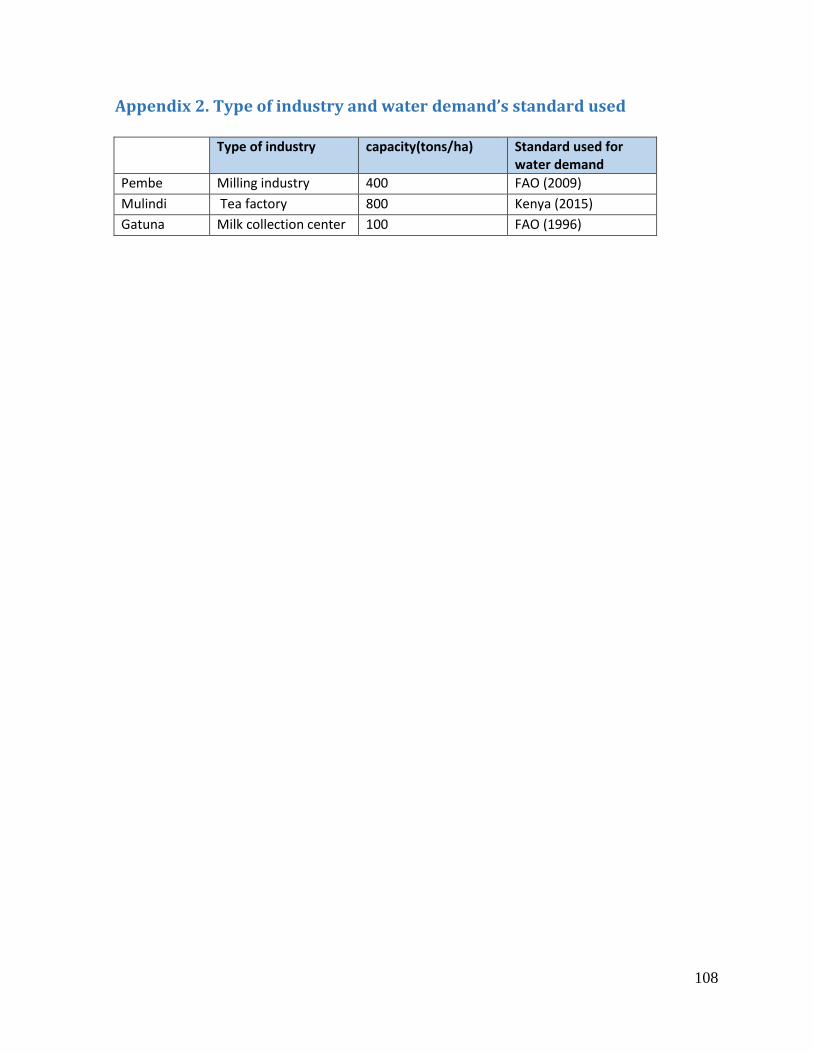
108
Appendix 2. Type of industry and water demand’s standard used
Type of industry capacity(tons/ha) Standard used for water demand
Pembe Milling industry 400 FAO (2009)
Mulindi Tea factory 800 Kenya (2015)
Gatuna Milk collection center 100 FAO (1996)
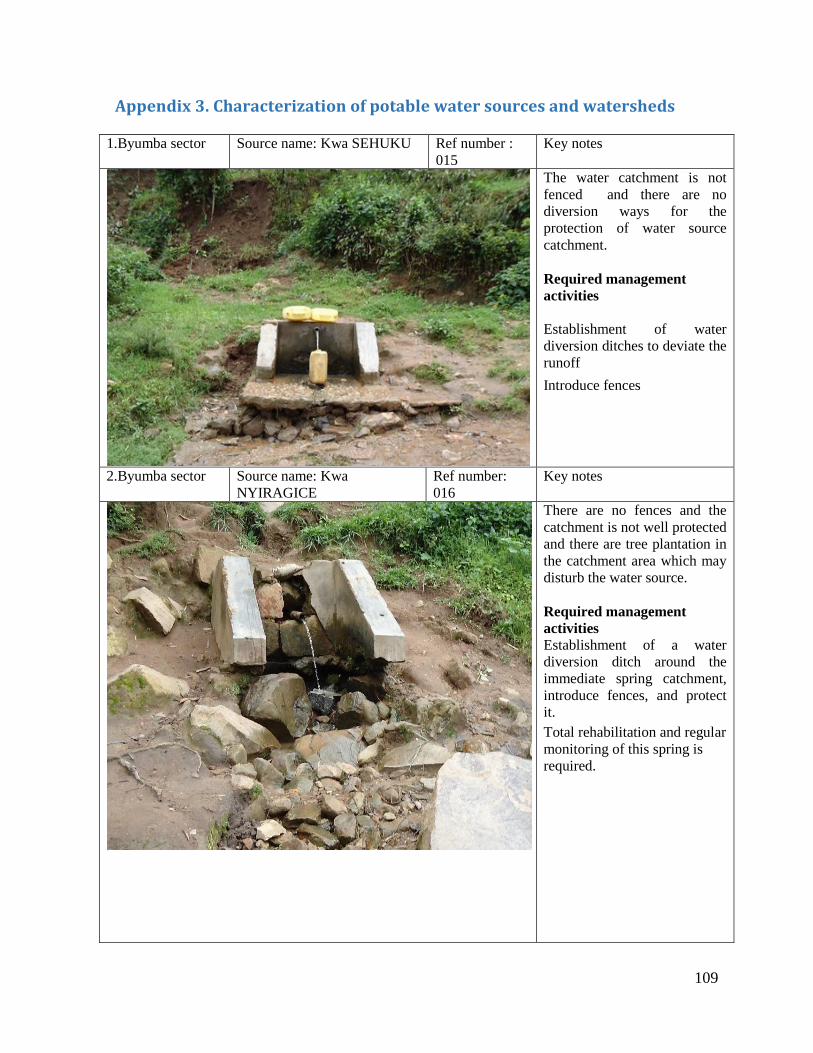
109
Appendix 3. Characterization of potable water sources and watersheds
1.Byumba sector Source name: Kwa SEHUKU Ref number :
015
Key notes
The water catchment is not
fenced and there are no
diversion ways for the
protection of water source
catchment.
Required management
activities
Establishment of water
diversion ditches to deviate the
runoff
Introduce fences
2.Byumba sector Source name: Kwa
NYIRAGICE
Ref number:
016
Key notes
There are no fences and the
catchment is not well protected
and there are tree plantation in
the catchment area which may
disturb the water source.
Required management
activities Establishment of a water
diversion ditch around the
immediate spring catchment,
introduce fences, and protect it.
Total rehabilitation and regular
monitoring of this spring is
required.
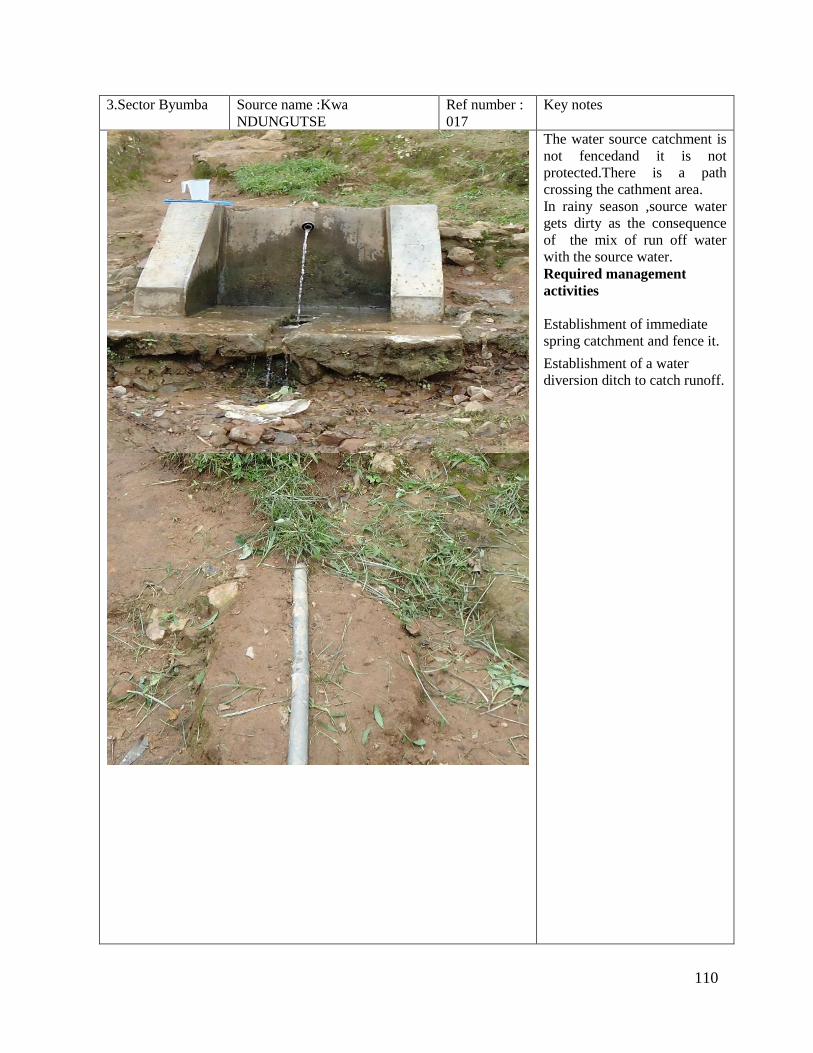
110
3.Sector Byumba Source name :Kwa
NDUNGUTSE
Ref number :
017
Key notes
The water source catchment is
not fencedand it is not
protected.There is a path
crossing the cathment area.
In rainy season ,source water
gets dirty as the consequence
of the mix of run off water
with the source water.
Required management
activities
Establishment of immediate
spring catchment and fence it.
Establishment of a water
diversion ditch to catch runoff.
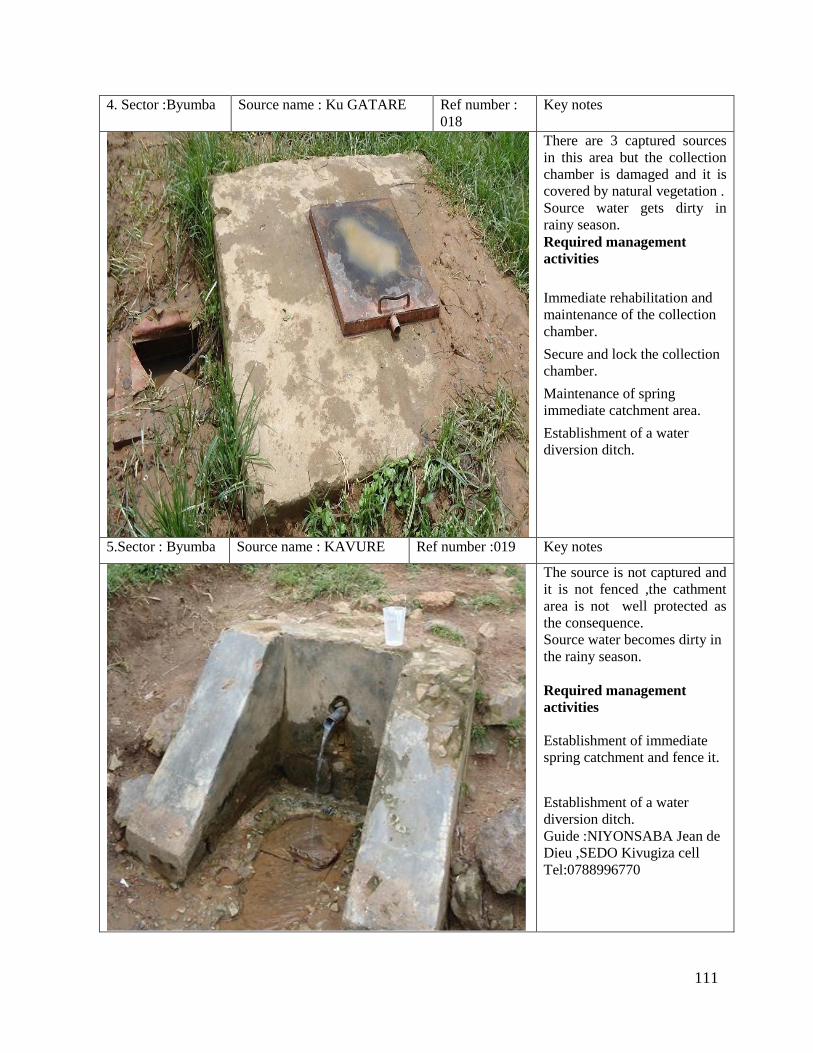
111
4. Sector :Byumba Source name : Ku GATARE Ref number :
018
Key notes
There are 3 captured sources
in this area but the collection
chamber is damaged and it is
covered by natural vegetation .
Source water gets dirty in
rainy season.
Required management
activities
Immediate rehabilitation and
maintenance of the collection
chamber.
Secure and lock the collection
chamber.
Maintenance of spring
immediate catchment area.
Establishment of a water
diversion ditch.
5.Sector : Byumba Source name : KAVURE Ref number :019 Key notes
The source is not captured and
it is not fenced ,the cathment
area is not well protected as
the consequence.
Source water becomes dirty in
the rainy season.
Required management
activities
Establishment of immediate
spring catchment and fence it.
Establishment of a water
diversion ditch.
Guide :NIYONSABA Jean de
Dieu ,SEDO Kivugiza cell
Tel:0788996770
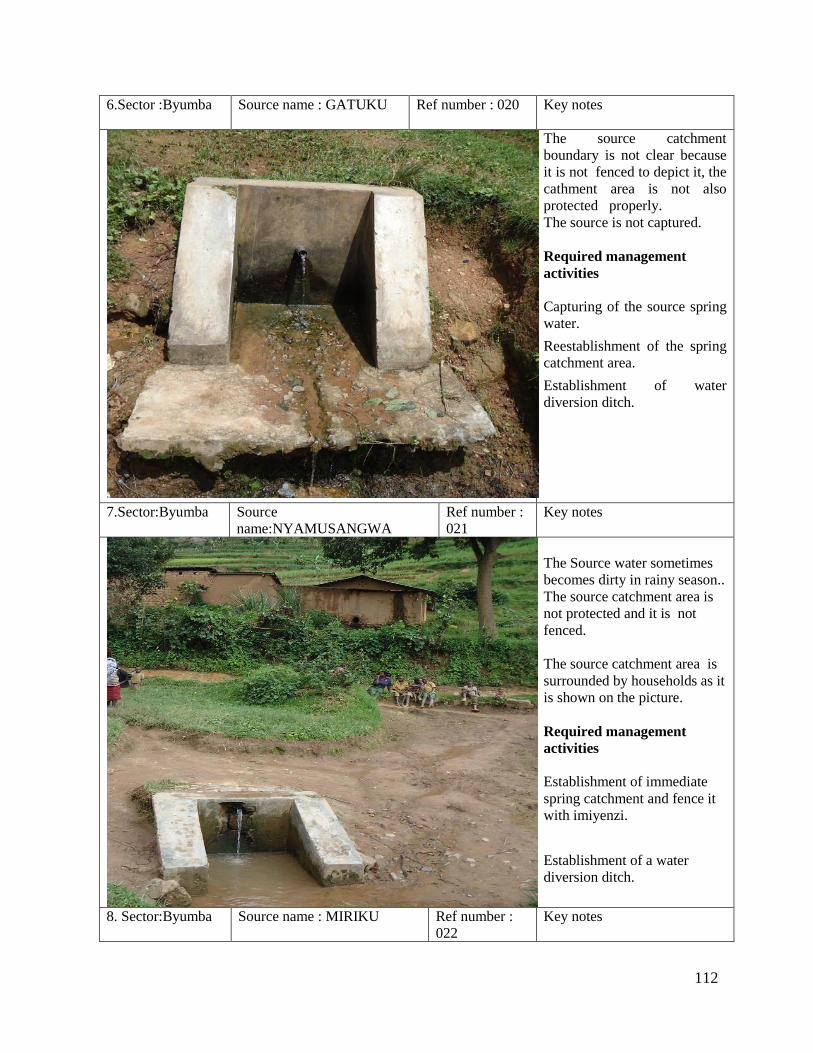
112
6.Sector :Byumba Source name : GATUKU Ref number : 020 Key notes
The source catchment
boundary is not clear because
it is not fenced to depict it, the
cathment area is not also
protected properly.
The source is not captured.
Required management
activities
Capturing of the source spring
water.
Reestablishment of the spring
catchment area.
Establishment of water
diversion ditch.
7.Sector:Byumba Source
name:NYAMUSANGWA
Ref number :
021
Key notes
The Source water sometimes
becomes dirty in rainy season..
The source catchment area is
not protected and it is not
fenced.
The source catchment area is
surrounded by households as it
is shown on the picture.
Required management
activities
Establishment of immediate
spring catchment and fence it
with imiyenzi.
Establishment of a water
diversion ditch.
8. Sector:Byumba Source name : MIRIKU Ref number :
022
Key notes

113
The source is captured and its
discharge is transported to
NYAMABUYE water
treatment plant.
The catchment area is
protected but it is not fenced to
show its boundaries and to
protect life stock grazing.
Required management
activities
Establishment of water spring
catchment and fence it.
Establishment of a water
diversion way as well as the
reinforcement of the upstream
progressive terraces.
9. Sector :Byumba Source name :
NYAKAGEZI
Ref number :023 Key notes
The source is Captured but
distribution pipes are damaged
and the distribution line is no
longer functioning.
There are no fences to protect
the source point area, the water
collection chamber is exposed
to erosion and runoff water
passes over the source
catchment area.
Required management
activities
Establishment of water spring
catchment and fence it.
Establishment of a water
diversion ways as well as the
reinforcement of the upstream
progressive terraces.
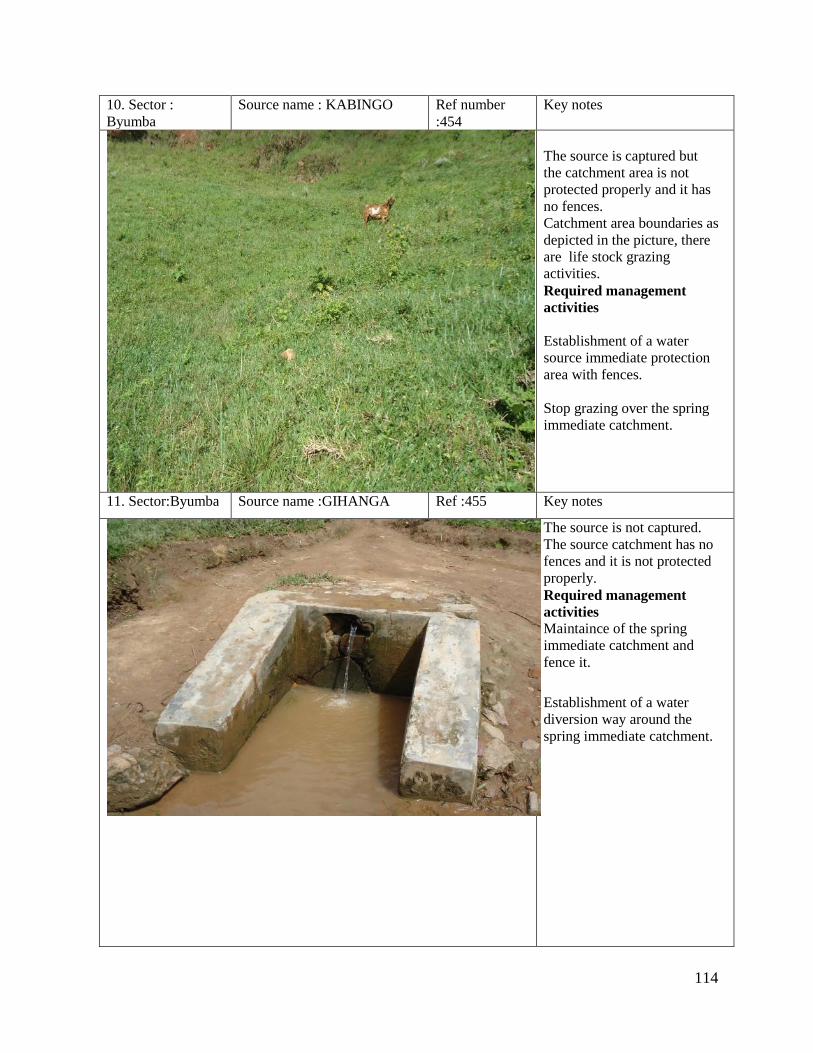
114
10. Sector :
Byumba
Source name : KABINGO Ref number
:454
Key notes
The source is captured but
the catchment area is not
protected properly and it has
no fences.
Catchment area boundaries as
depicted in the picture, there
are life stock grazing
activities.
Required management
activities
Establishment of a water
source immediate protection
area with fences.
Stop grazing over the spring
immediate catchment.
11. Sector:Byumba Source name :GIHANGA Ref :455 Key notes
The source is not captured.
The source catchment has no
fences and it is not protected
properly.
Required management
activities Maintaince of the spring
immediate catchment and
fence it.
Establishment of a water
diversion way around the
spring immediate catchment.
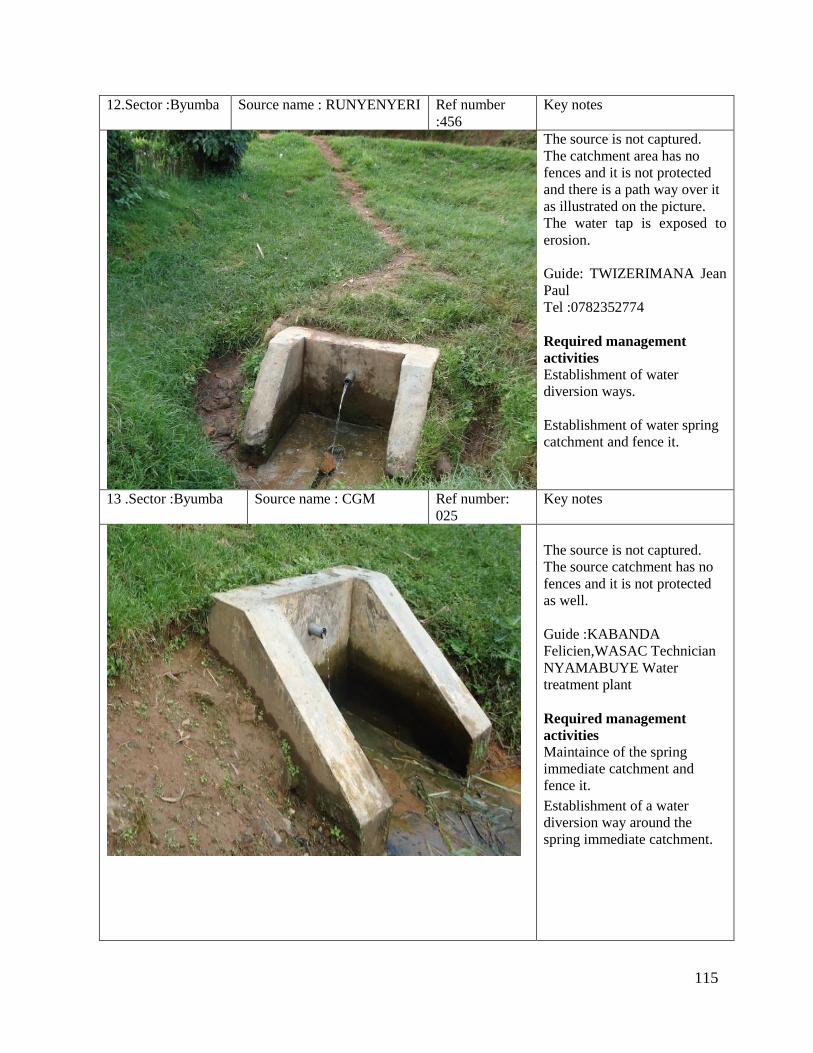
115
12.Sector :Byumba Source name : RUNYENYERI Ref number
:456
Key notes
The source is not captured.
The catchment area has no
fences and it is not protected
and there is a path way over it
as illustrated on the picture.
The water tap is exposed to
erosion.
Guide: TWIZERIMANA Jean
Paul
Tel :0782352774
Required management
activities
Establishment of water
diversion ways.
Establishment of water spring
catchment and fence it.
13 .Sector :Byumba Source name : CGM Ref number:
025
Key notes
The source is not captured.
The source catchment has no
fences and it is not protected
as well.
Guide :KABANDA
Felicien,WASAC Technician
NYAMABUYE Water
treatment plant
Required management
activities Maintaince of the spring
immediate catchment and
fence it.
Establishment of a water
diversion way around the
spring immediate catchment.
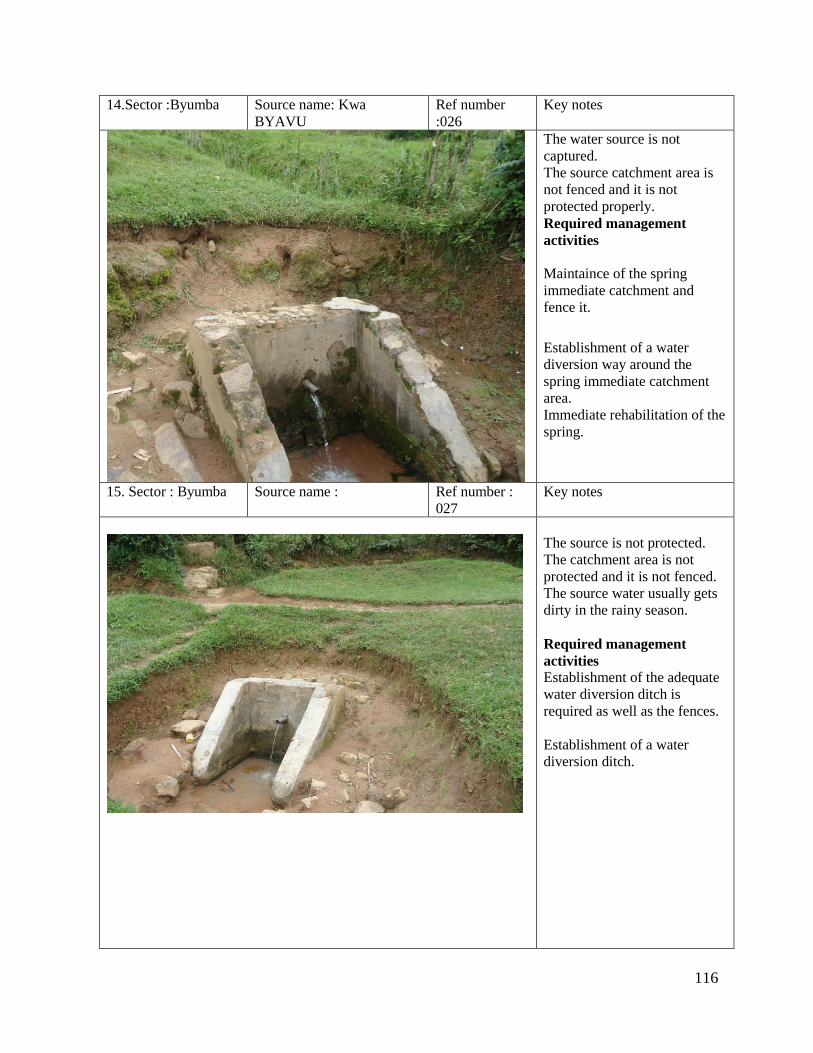
116
14.Sector :Byumba Source name: Kwa
BYAVU
Ref number
:026
Key notes
The water source is not
captured.
The source catchment area is
not fenced and it is not
protected properly.
Required management
activities
Maintaince of the spring
immediate catchment and
fence it.
Establishment of a water
diversion way around the
spring immediate catchment
area.
Immediate rehabilitation of the
spring.
15. Sector : Byumba Source name : Ref number :
027
Key notes
The source is not protected.
The catchment area is not
protected and it is not fenced.
The source water usually gets
dirty in the rainy season.
Required management
activities Establishment of the adequate
water diversion ditch is
required as well as the fences.
Establishment of a water
diversion ditch.

117
16.Sector :Byumba Source name : Ref number : 028 Key notes
The source water becomes
dirty in rainy season.
The source catchment is not
protected and it has no fences.
The source point is surrounded
by natural vegetation and it is
polluted by washing activities.
Required management
activities Establishment of fences
around the spring catchment
area.
Establishment of a water
diversion ditch and total
rehabilitation of the spring.
Establishment of terraces
upstream of the spring and
protect them with grasses.
17 .Sector : Kageyo Source name:KABAGESHI 2 Ref number
:029
Key notes
The water source is not
captured.
The source catchment area is
not fenced and it is not clear as
well.
The spring’s water pipe is
damaged and needs to be
rehabilitated.
Required management
activities
Recapturing of water source
and establishment of fences
arround the immediate
catchment area.
Establishment of water
diversion way around the
spring immediate catchment.
Clearence of immediate
catchment area and
rehabilitation of the spring.
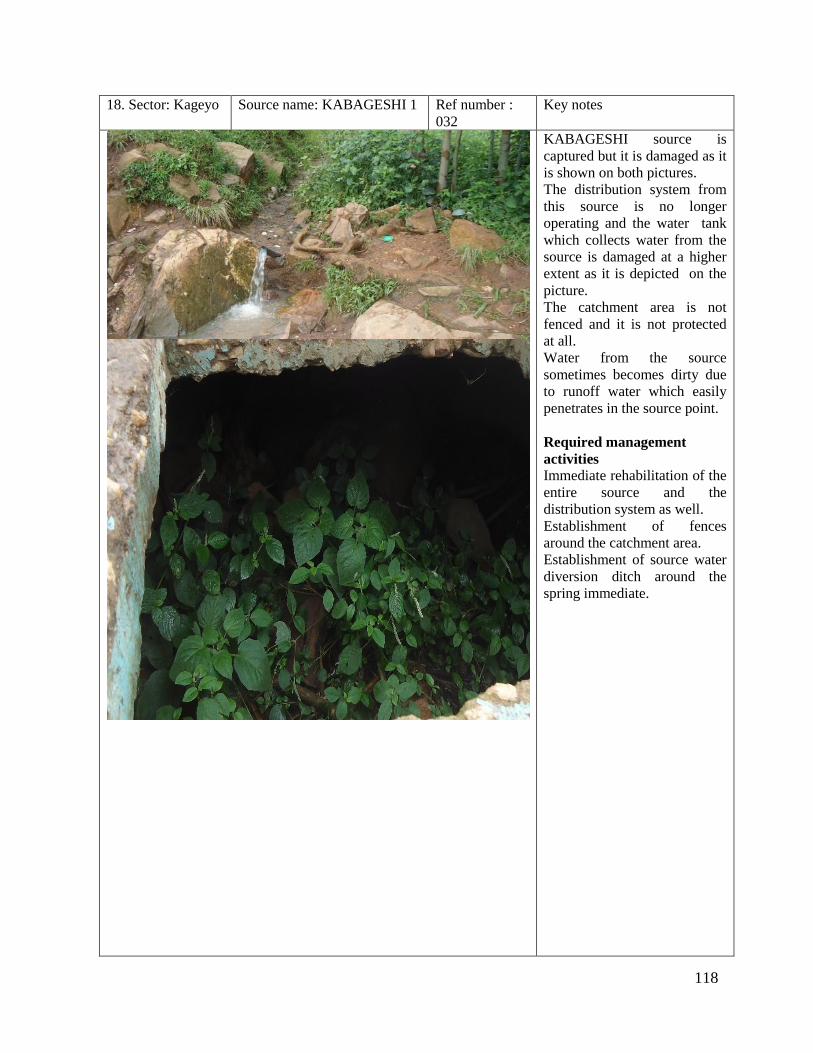
118
18. Sector: Kageyo Source name: KABAGESHI 1 Ref number :
032
Key notes
KABAGESHI source is
captured but it is damaged as it
is shown on both pictures.
The distribution system from
this source is no longer
operating and the water tank
which collects water from the
source is damaged at a higher
extent as it is depicted on the
picture.
The catchment area is not
fenced and it is not protected
at all.
Water from the source
sometimes becomes dirty due
to runoff water which easily
penetrates in the source point.
Required management
activities
Immediate rehabilitation of the
entire source and the
distribution system as well.
Establishment of fences
around the catchment area.
Establishment of source water
diversion ditch around the
spring immediate.

119
19. Sector :Kageyo Source name: GAHONDO Ref number :
036
Key notes
The source is captured but
currently it is damaged as it is
shown on the pictures, water is
coming from the water
collection area.
The source catchment area is
not protected and there are no
clear fences at the catchment
boundary.
Water of Gahondo source
sometimes become dirty in
rainy season periods as it is
shown on the picture.
Required management
activities
Maintaince of the spring
immediate catchment and
fence it.
Establishment of a water
diversion way around the
spring immediate catchment.
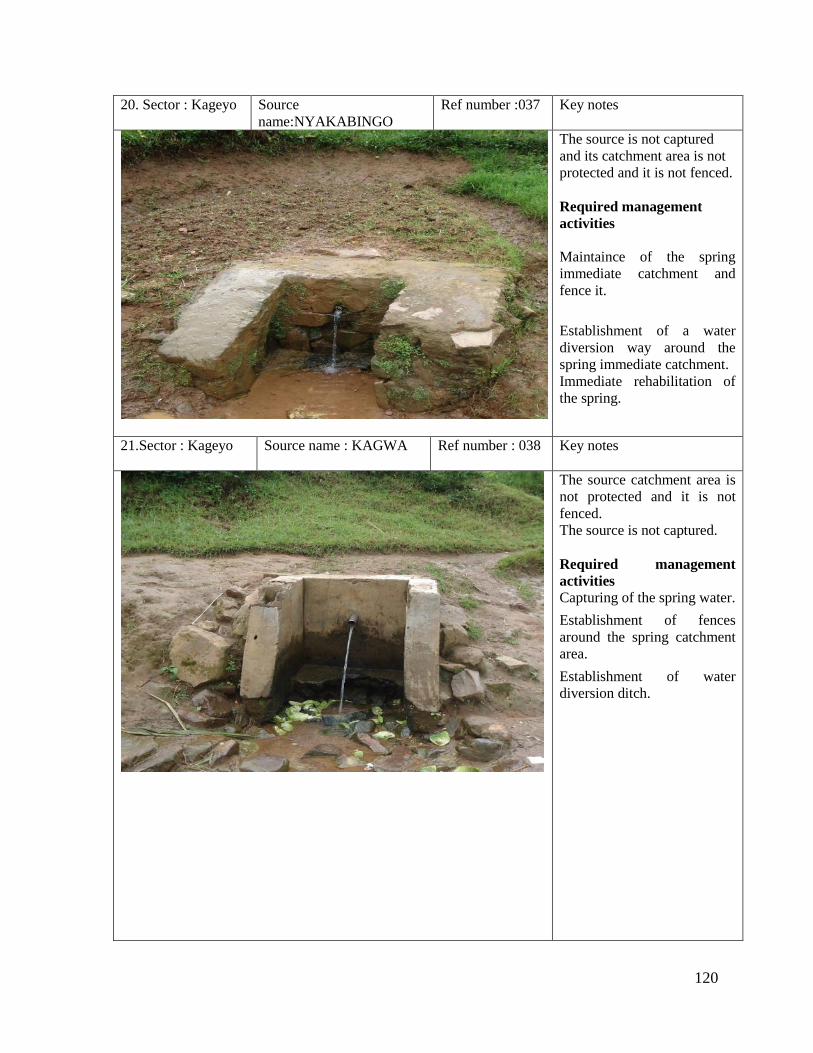
120
20. Sector : Kageyo Source
name:NYAKABINGO
Ref number :037 Key notes
The source is not captured
and its catchment area is not
protected and it is not fenced.
Required management
activities
Maintaince of the spring
immediate catchment and
fence it.
Establishment of a water
diversion way around the
spring immediate catchment.
Immediate rehabilitation of
the spring.
21.Sector : Kageyo Source name : KAGWA Ref number : 038 Key notes
The source catchment area is
not protected and it is not
fenced.
The source is not captured.
Required management
activities Capturing of the spring water.
Establishment of fences
around the spring catchment
area.
Establishment of water
diversion ditch.

121
22. Sector : Kageyo Source name : MUNINI Ref number : 039 Key notes
The source catchment is not
well protected and it has no
fences.
The catchment area is
surrounded by natural
vegetation.
Required management
activities Capturing of the spring water.
Establishment of fences
around water catchment area
and protect it.
23.Sector:KAGEYO Source name :
RWUNGA
Ref number :040 Key notes
The source catchment area is
protected because it has
fences which can show its
boundaries.
But the catchment area is not
protected from a free cross
movement of people and
animals. Spring’s water
sometimes becomes dirty
especially in rainy season but
not at a higher extent.
Required management
activities Reinforce the existing fences
and regular maintenances of
the spring is required.
Establishment of a water
diversion way around the
spring immediate catchment.
Establishment of protection
means around the catchment
area.

122
24 . Sector : Kageyo Source name : Gikuku 1 Ref number : 041 Key notes
The source catchment area
has no fences and
consequently, it is not well
protected.
Required management
activities
Establishment of fences
around water spring
catchment and protect it.
25. Sector: Kageyo Source name : Gikuku 2 Ref number : 042 Key notes
The source catchment area
has a clear fence to depict its
boundaries but as it is shown
on the picture the catchment
area is not protected from a
free cross movement of
animals.
The spring’s water
sometimes become dirty in
rainy season.
Required management
activities
Reinforce the existing fences
and regular maintenances of
the spring is required.
Establishment of protection
means around the catchment
area.

123
26 . Sector : Kageyo Source name : GIKUKU 3 Ref number : 043 Key notes
The source catchment area
doesn’t have fences and it is
not protected as well.
The surrounding of the water
tap and the catchment area
is not well maintained and
trenches transporting water
away from the water tap area
are not clean.
Required management
activities
Establishment of the
adequate water diversion
ditch is required as well as
the fences and protection.
Maintanence of trenches in
the catchment area is
required as it will enhance
the ground water recharge.
27. Sector: Kageyo Source name: Mwange Ref number : 044 Key notes
The surrounding of the water
tap and catchment area is not
well maintained and
trenches transporting water
away from the water tap area
are not clean.
Some of the water from the
source is diverted away from
the water tap and water from
the source sometimes
becomes dirty in rainy
season
The source is not captured
and its catchment area
doesn’t have fences and it is
not protected at all.
Required management
activities Capturing of the source
water.
Establishment of fences
around water catchment area
and protect it.
Maintain the trenches in the
catchment area as required.
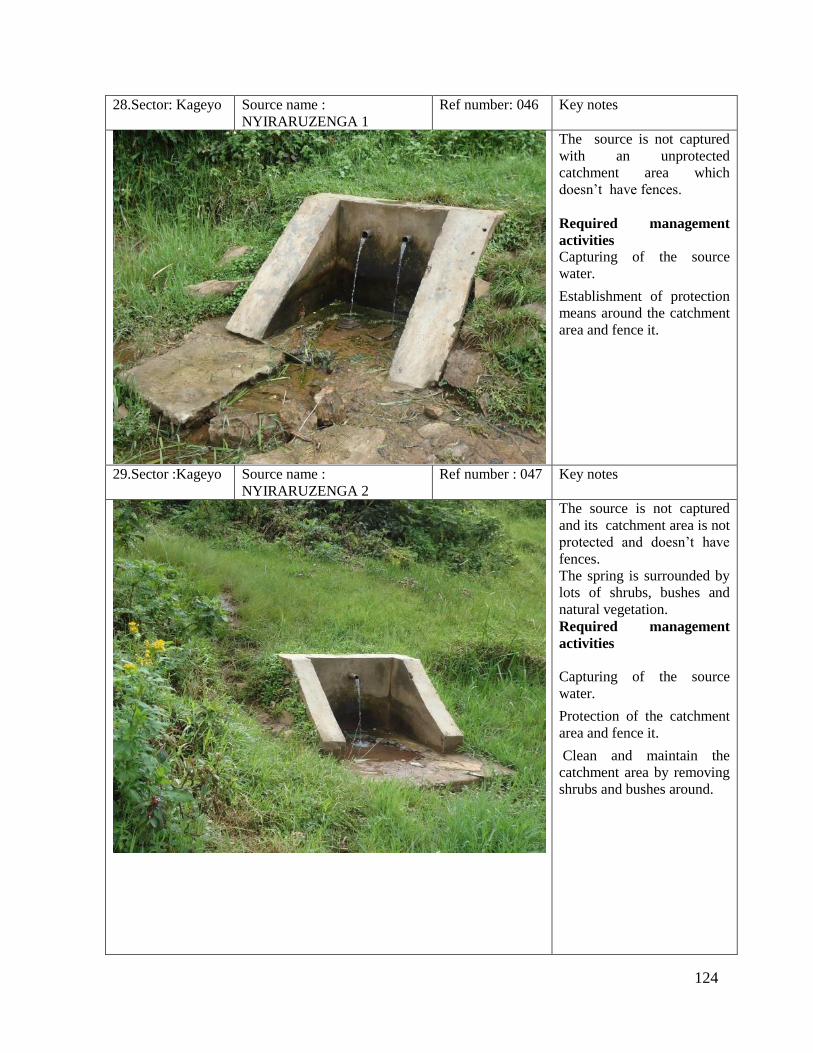
124
28.Sector: Kageyo Source name :
NYIRARUZENGA 1
Ref number: 046 Key notes
The source is not captured
with an unprotected
catchment area which
doesn’t have fences.
Required management
activities Capturing of the source
water.
Establishment of protection
means around the catchment
area and fence it.
29.Sector :Kageyo Source name :
NYIRARUZENGA 2
Ref number : 047 Key notes
The source is not captured
and its catchment area is not
protected and doesn’t have
fences.
The spring is surrounded by
lots of shrubs, bushes and
natural vegetation.
Required management
activities
Capturing of the source
water.
Protection of the catchment
area and fence it.
Clean and maintain the
catchment area by removing
shrubs and bushes around.

125
30. Sector: Kageyo Source name :
NYIRARUZENGA 3
Ref number : 048 Key notes
The water fountain is no
longer operating. It is
preferred to use
Nyiraruzenga 1 and 2
although they are too close
to Nyiraruzenga 3and have a
higher discharge compared
to it.
As illustrated on the picture,
the spring is almost covered
by the bushes.
The source is not captured
and has a water diversion
way, its catchment area is
not protected and doesn’t
have fences.
Required management
activities
Immediate rehabilitation of
the spring.
The source needs to be
captured and the catchment
area needs to be fenced and
protected.
Clean the spring’s
surrounding by removing all
the bushes.

126
31 .Sector:Kageyo Source name: MUGOMERO 1 Ref number : 50 Key notes
The water source needs to be
captured.
The catchment area is not
protected and doesn’t have
fences.
The source discharges water
through the rock and during
rainy season, water usually
becomes dirty.
Guide: GASAGURE
Ildephonse
Tel : 0722827283
Required management
activities
Capturing of the source
water is required.
Establishment of a water
diversion way, fence and
protect the catchment area.
Construction of the standard
spring’s fetching area is
required.
32. Sector:Kageyo Source name: MUGOMERO 2 Ref number : 49 Key notes
Needs to be rehabilitated
Water is always clear and
clean.
The source is not captured
and its catchment area is not
protected.
The source discharge area is
damaged and needs to
rehabilitated and maintained.
Required management
activities
Capturing of the source
water and immediate
rehabilitation is needed .
Maintenance and fencing of
the spring catchment is
necessary.

127
33. Sector:Kaniga Source name : RUBOROGA 1 Ref number : 054 Key notes
The source is captured, well
maintained and it is in good
conditions but its catchment
area is not fenced.
Required management
activities Although the source is
captured and well
maintained, regular and
proper cleanig is required.
Surround the catchment area
by fences.
34 . Sector :Kaniga Source name : RUBOROGA 2 Ref number : 055 Key notes
The source is captured, well
maintained and it is in good
conditions but its catchment
area doesn’t have fences.
Required management
activities
Although the source is
captured and well
maintained, regular and
proper cleanig is required.
Surround the catchment area
by fences.
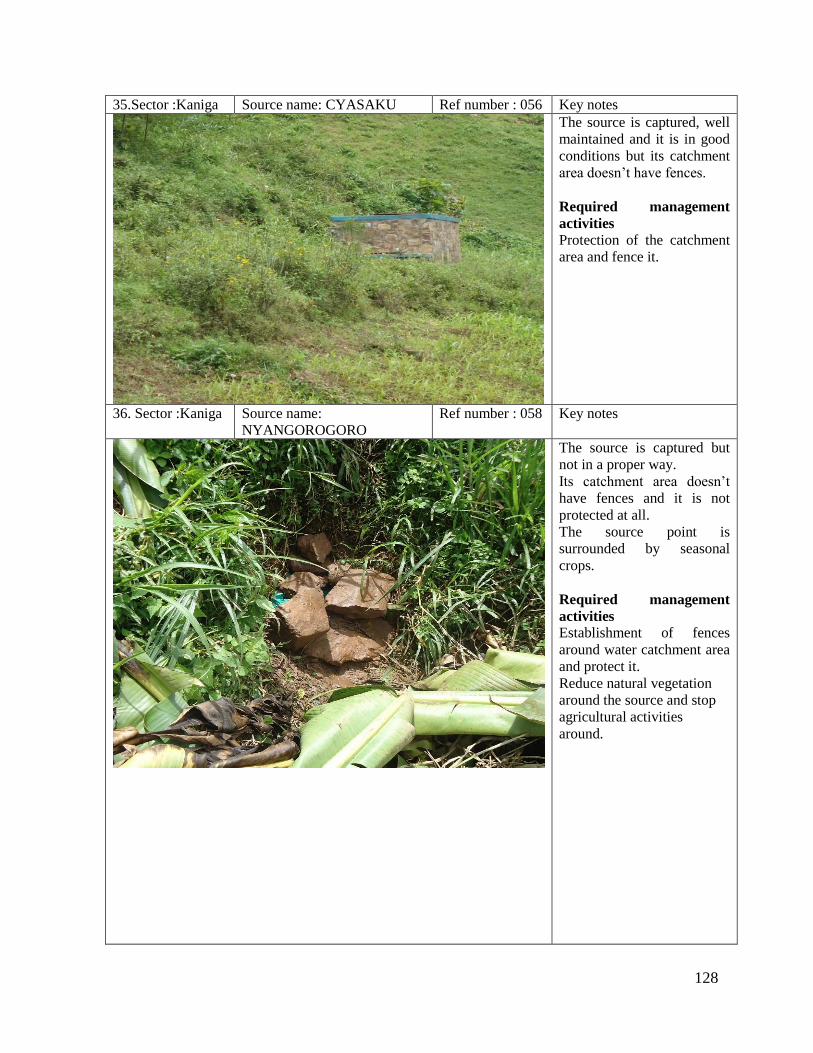
128
35.Sector :Kaniga Source name: CYASAKU Ref number : 056 Key notes
The source is captured, well
maintained and it is in good
conditions but its catchment
area doesn’t have fences.
Required management
activities
Protection of the catchment
area and fence it.
36. Sector :Kaniga Source name:
NYANGOROGORO
Ref number : 058 Key notes
The source is captured but
not in a proper way.
Its catchment area doesn’t
have fences and it is not
protected at all.
The source point is
surrounded by seasonal
crops.
Required management
activities
Establishment of fences
around water catchment area
and protect it.
Reduce natural vegetation
around the source and stop
agricultural activities
around.
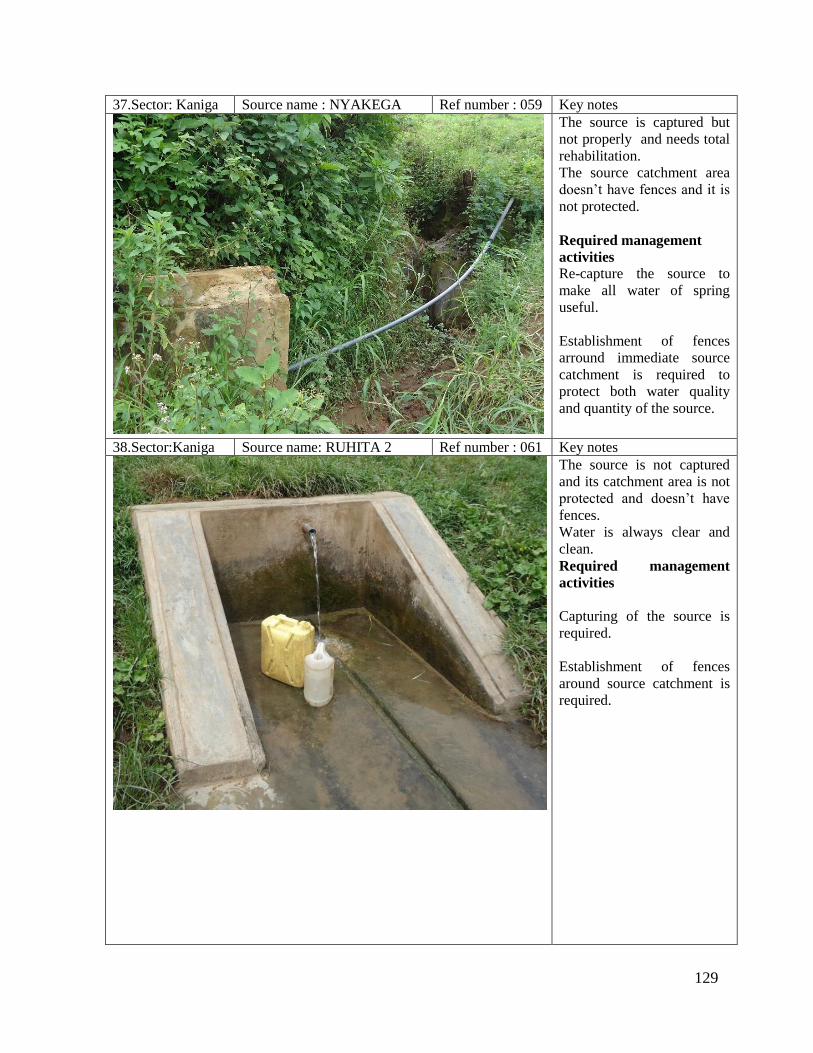
129
37.Sector: Kaniga Source name : NYAKEGA Ref number : 059 Key notes
The source is captured but
not properly and needs total
rehabilitation.
The source catchment area
doesn’t have fences and it is
not protected.
Required management
activities
Re-capture the source to
make all water of spring
useful.
Establishment of fences
arround immediate source
catchment is required to
protect both water quality
and quantity of the source.
38.Sector:Kaniga Source name: RUHITA 2 Ref number : 061 Key notes
The source is not captured
and its catchment area is not
protected and doesn’t have
fences.
Water is always clear and
clean.
Required management
activities
Capturing of the source is
required.
Establishment of fences
around source catchment is
required.
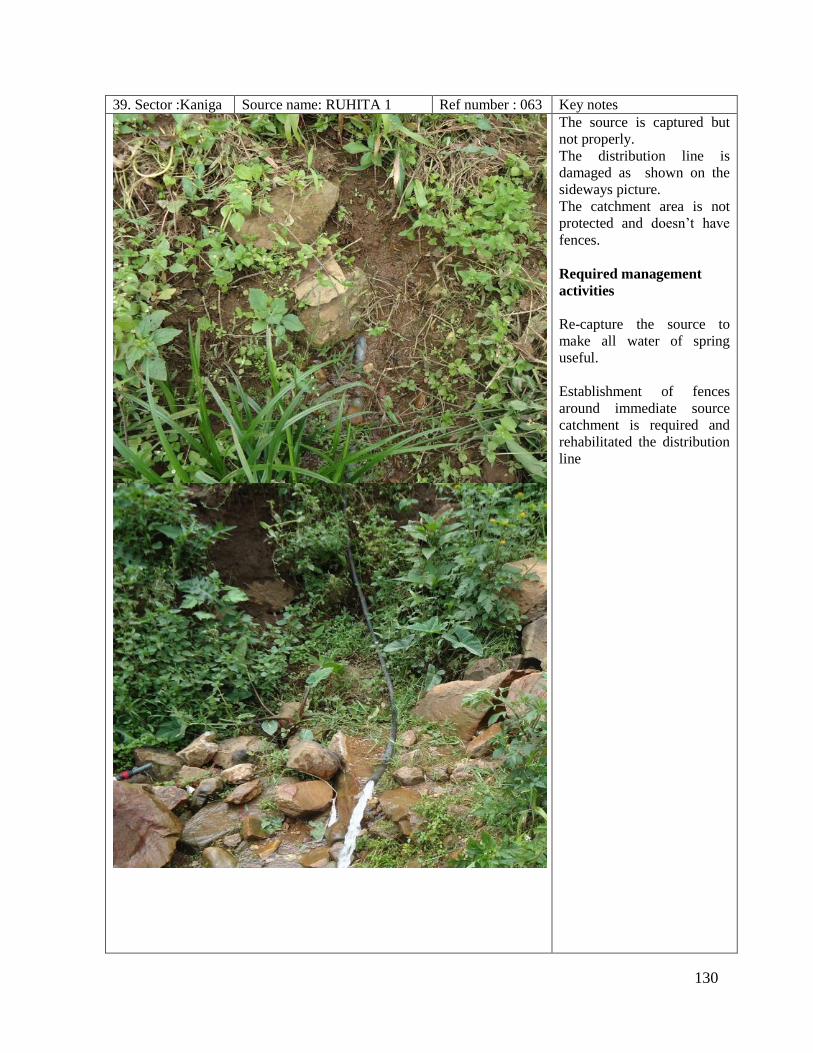
130
39. Sector :Kaniga Source name: RUHITA 1 Ref number : 063 Key notes
The source is captured but
not properly.
The distribution line is
damaged as shown on the
sideways picture.
The catchment area is not
protected and doesn’t have
fences.
Required management
activities
Re-capture the source to
make all water of spring
useful.
Establishment of fences
around immediate source
catchment is required and
rehabilitated the distribution
line

131
40. Sector: Kaniga Source name:KANYEGA Ref number:064 Key notes
The source is captured but
the collection chamber is
damaged as you illustrated
on the picture below.
The source catchment area is
not protected.
Guide :BIZIMANA Jean
Bosco
Tel :0784312635
Required management
activities
Surround the catchment area
by fences and protect it.
Rehabilitation of the
collection chamber is
required to ensure the
quality of source water.
41.Sector : Kaniga Source name : KINYOGO Ref number : 066 Key notes
The source is not captured
and the catchment area
doesn’t have fences but it is
partially protected.
Water becomes dirty in rainy
season.
Required management
activities
Capturing of the source is
required.
Establish a water diversion
ditch and surround the
catchment area by fences.
Immediate rehabilitation of
the source is required.
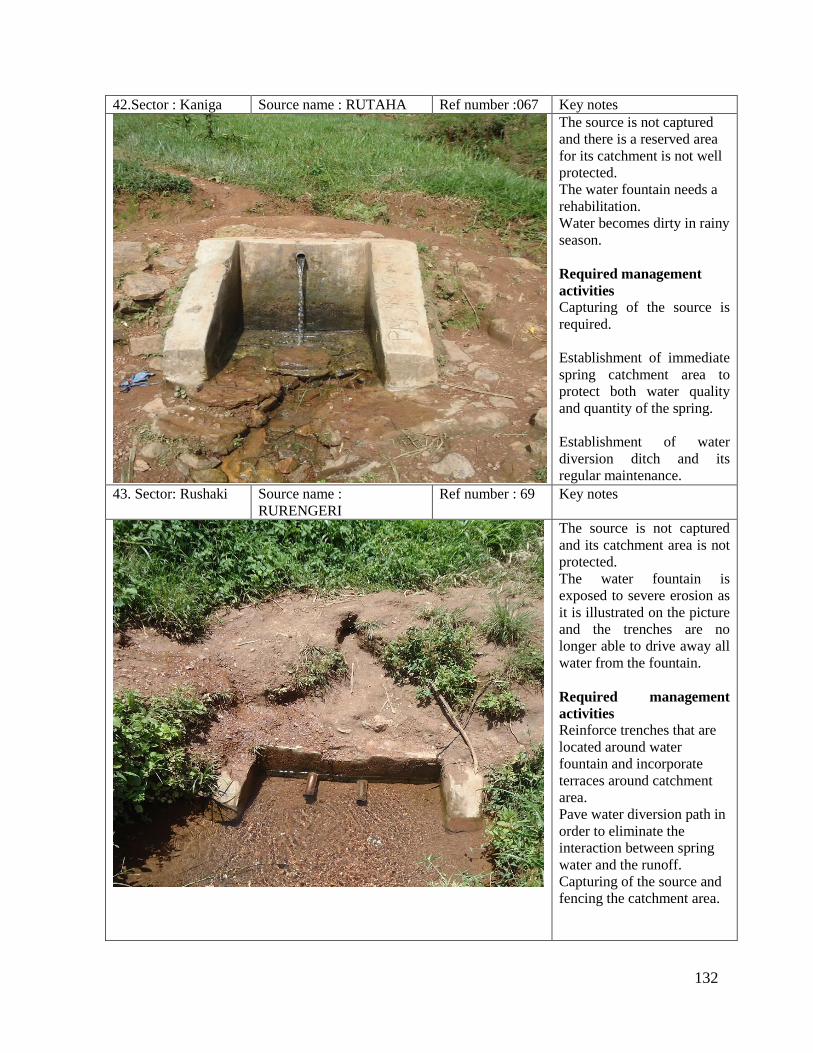
132
42.Sector : Kaniga Source name : RUTAHA Ref number :067 Key notes
The source is not captured
and there is a reserved area
for its catchment is not well
protected.
The water fountain needs a
rehabilitation.
Water becomes dirty in rainy
season.
Required management
activities Capturing of the source is
required.
Establishment of immediate
spring catchment area to
protect both water quality
and quantity of the spring.
Establishment of water
diversion ditch and its
regular maintenance.
43. Sector: Rushaki Source name :
RURENGERI
Ref number : 69 Key notes
The source is not captured
and its catchment area is not
protected.
The water fountain is
exposed to severe erosion as
it is illustrated on the picture
and the trenches are no
longer able to drive away all
water from the fountain.
Required management
activities
Reinforce trenches that are
located around water
fountain and incorporate
terraces around catchment
area.
Pave water diversion path in
order to eliminate the
interaction between spring
water and the runoff.
Capturing of the source and
fencing the catchment area.
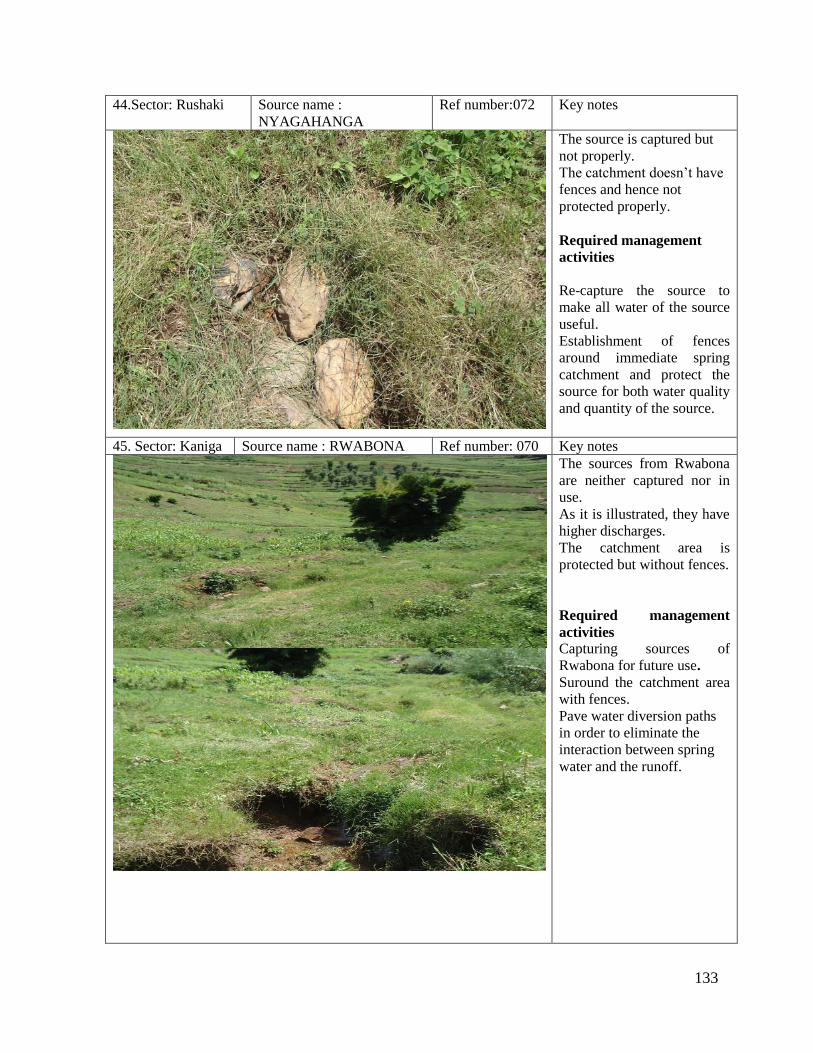
133
44.Sector: Rushaki Source name :
NYAGAHANGA
Ref number:072 Key notes
The source is captured but
not properly.
The catchment doesn’t have
fences and hence not
protected properly.
Required management
activities
Re-capture the source to
make all water of the source
useful.
Establishment of fences
around immediate spring
catchment and protect the
source for both water quality
and quantity of the source.
45. Sector: Kaniga Source name : RWABONA Ref number: 070 Key notes
The sources from Rwabona
are neither captured nor in
use.
As it is illustrated, they have
higher discharges.
The catchment area is
protected but without fences.
Required management
activities
Capturing sources of
Rwabona for future use.
Suround the catchment area
with fences.
Pave water diversion paths
in order to eliminate the
interaction between spring
water and the runoff.

134
46. .Sector : Rushaki Source name :
NYARUHANGA
Ref number : 073 Key notes
The source has a reserved
area for its catchment but
has not fences to fully
protect it.
Water usually becomes dirty
in rainy season.
Required management
activities
Establishment of immediate
spring water catchment and
fence it.
Establishment and regular
maintenance of water
diversion ditch.
47.Sector: Rushaki Source name:
NYAGAHANGA
Ref number :074 Key notes
The source is captured and
its catchment area is not
protected and is covered by
bushes.
Required management
activities.
Establishment of fences
around the immediate spring
catchment area, protect it,
and remove bushes.
48. Sector: Rushaki Source name :
NYARURENGA
Ref number : 075 Key notes
The catchment area is not
protected and doesn’t have
fences.
Required management
activities
Protect the catchment area
and fence it.
Regular maintenance of the
spring is required.
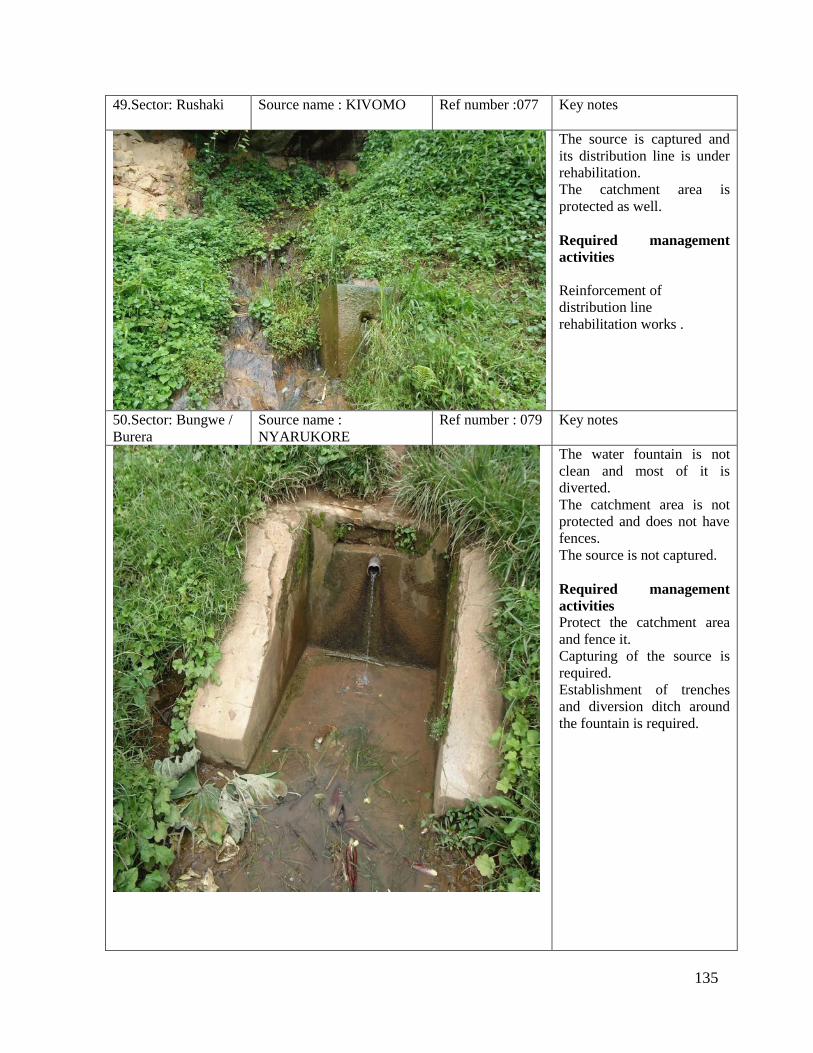
135
49.Sector: Rushaki Source name : KIVOMO Ref number :077 Key notes
The source is captured and
its distribution line is under
rehabilitation.
The catchment area is
protected as well.
Required management
activities
Reinforcement of
distribution line
rehabilitation works .
50.Sector: Bungwe /
Burera
Source name :
NYARUKORE
Ref number : 079 Key notes
The water fountain is not
clean and most of it is
diverted.
The catchment area is not
protected and does not have
fences.
The source is not captured.
Required management
activities
Protect the catchment area
and fence it.
Capturing of the source is
required.
Establishment of trenches
and diversion ditch around
the fountain is required.
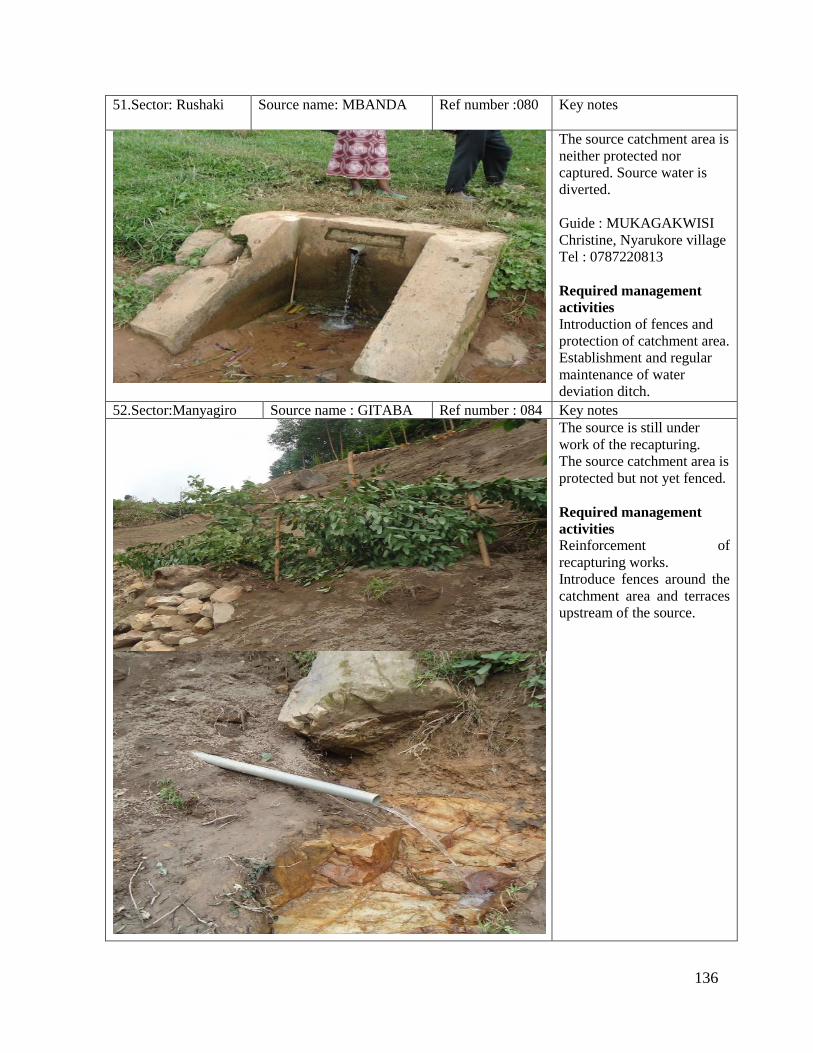
136
51.Sector: Rushaki Source name: MBANDA Ref number :080 Key notes
The source catchment area is
neither protected nor
captured. Source water is
diverted.
Guide : MUKAGAKWISI
Christine, Nyarukore village
Tel : 0787220813
Required management
activities
Introduction of fences and
protection of catchment area.
Establishment and regular
maintenance of water
deviation ditch.
52.Sector:Manyagiro Source name : GITABA Ref number : 084 Key notes
The source is still under
work of the recapturing.
The source catchment area is
protected but not yet fenced.
Required management
activities
Reinforcement of
recapturing works.
Introduce fences around the
catchment area and terraces
upstream of the source.

137
53. Sector: Manyagiro Source name:
RWUNGO 1
Ref number :85 Key notes
The source is captured and is
well maintained and the
catchment area is protected
but without fences.
Required management
activities
Introduce fences around the
catchment area.
54. Sector: Manyagiro Source name: Rwungo 2 Ref number:86 Key notes
The source is captured and is
well maintained and the
catchment area is protected
but without fences.
Required management
activities
Introduce fences around the
catchment area and maintain
the existing terraces.

138
55. Sector: Manyagiro Source name:Rwungo 3 Ref number :87 Key notes
The source is captured and is
well maintained and the
catchment area is protected
but without fences.
Required management
activities
Introduce fences around the
catchment area and maintain
the existing trenches.
56. Sector : Manyagiro Source name :Rwungo 4 Ref number:88 Key notes
The source is captured and is
well maintained and the
catchment area is protected
but without fences.
Required management
activities
Introduce fences around the
catchment area and clear the
zone.

139
57.Sector: Manyagiro Source name : Rwungo 5 Ref number:89 Key notes
The source is captured and is
well maintained and the
catchment area is protected
but without fences.
Required management
activities
Introduce fences around the
catchment area.
58. Sector :Manyagiro Source name :Murehe 1 Ref number :091 Key notes
The catchment area is neither
fenced nor protected.
The source is not captured
and is exposed to erosion.
Required management
activities
Introduce fences and protect
the catchment area.
Capturing of the source is
required and introduces
terraces upstream to prevent
its exposure to erosion.
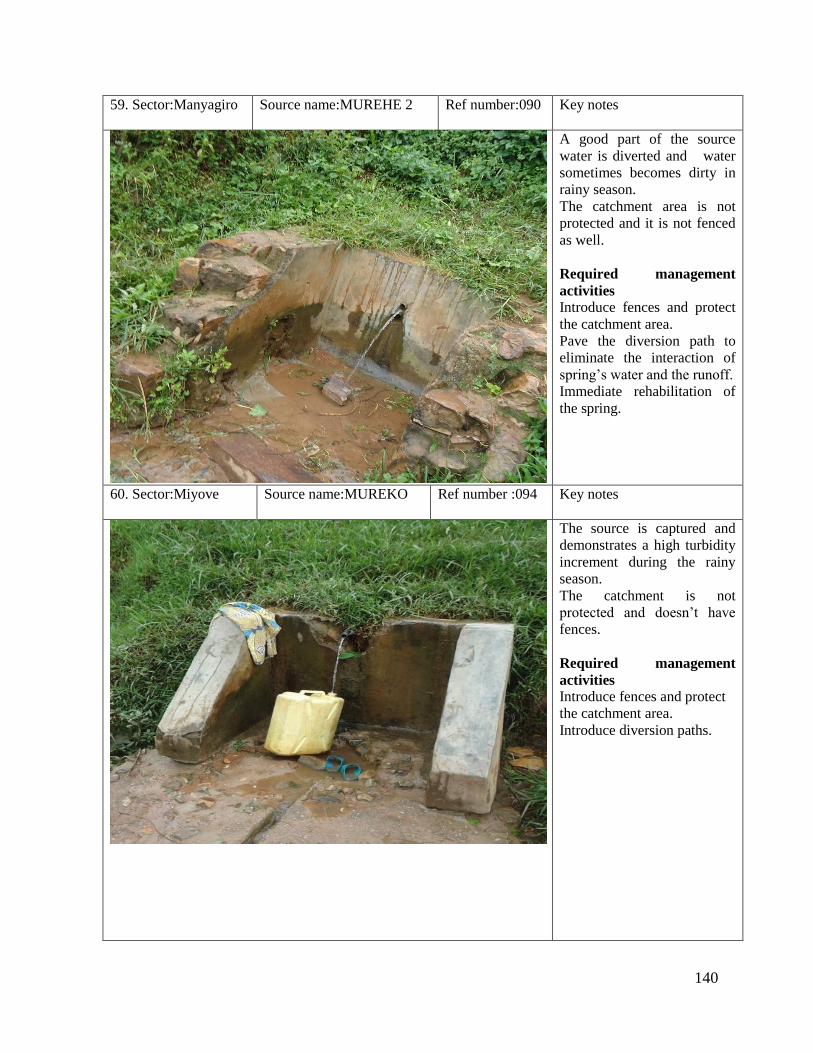
140
59. Sector:Manyagiro Source name:MUREHE 2 Ref number:090 Key notes
A good part of the source
water is diverted and water
sometimes becomes dirty in
rainy season.
The catchment area is not
protected and it is not fenced
as well.
Required management
activities
Introduce fences and protect
the catchment area.
Pave the diversion path to
eliminate the interaction of
spring’s water and the runoff.
Immediate rehabilitation of
the spring.
60. Sector:Miyove Source name:MUREKO Ref number :094 Key notes
The source is captured and
demonstrates a high turbidity
increment during the rainy
season.
The catchment is not
protected and doesn’t have
fences.
Required management
activities
Introduce fences and protect
the catchment area.
Introduce diversion paths.
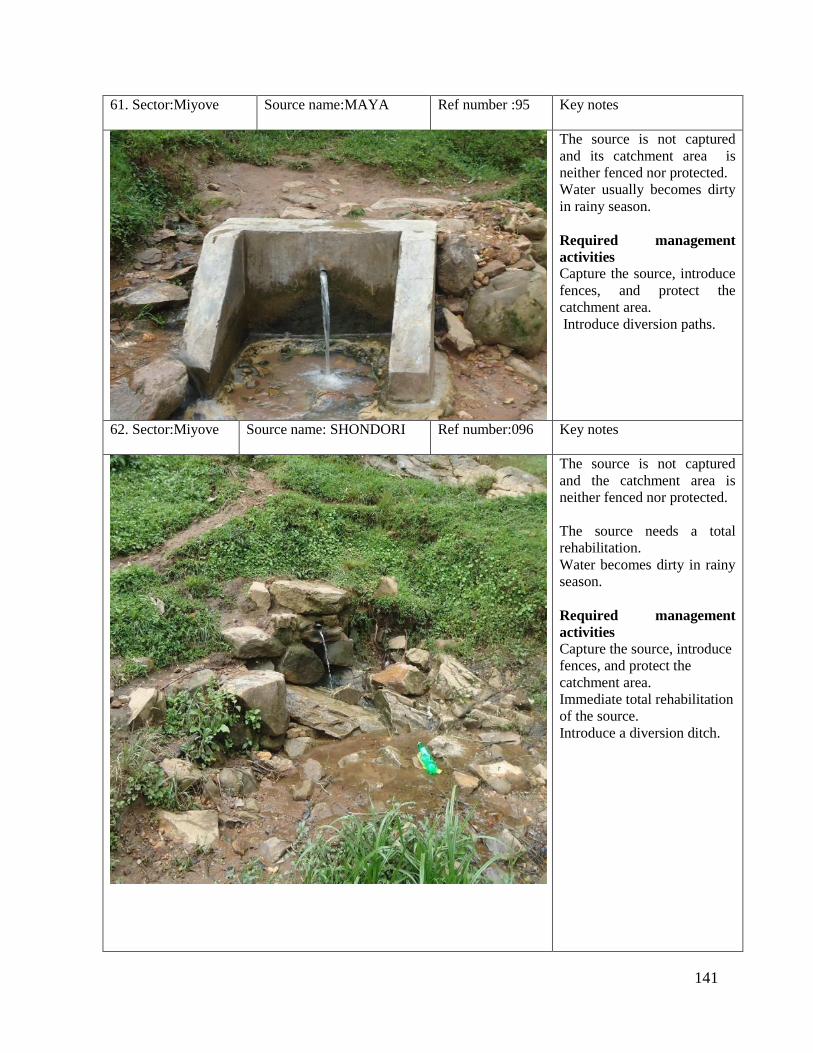
141
61. Sector:Miyove Source name:MAYA Ref number :95 Key notes
The source is not captured
and its catchment area is
neither fenced nor protected.
Water usually becomes dirty
in rainy season.
Required management
activities
Capture the source, introduce
fences, and protect the
catchment area.
Introduce diversion paths.
62. Sector:Miyove Source name: SHONDORI Ref number:096 Key notes
The source is not captured
and the catchment area is
neither fenced nor protected.
The source needs a total
rehabilitation.
Water becomes dirty in rainy
season.
Required management
activities
Capture the source, introduce
fences, and protect the
catchment area.
Immediate total rehabilitation
of the source.
Introduce a diversion ditch.

142
63. Sector:Miyove Source name:Mu KADOGO Ref number :097 Key notes
The source needs
Rehabilitation.
The source is not captured
and its catchment area is not
protected.
Guide : Duniya
Tel : 0783800322
Required management
activities
Capture the source, introduce
fences, and protect the
catchment area.
Immediate rehabilitation and
clearance of the source.
64. Sector:Nyankenke Source name:KABERE Ref number :099 Key notes
The source is captured and
there is a reserved area for
the catchment but it doesn’t
have fences.
Water becomes dirty in rainy
season.
Some of the pipes of the
distribution line are exposed
to erosion.
Required management
activities
Establishment of the spring
catchment area with fences
and protect it.
Introduce terraces upstream.
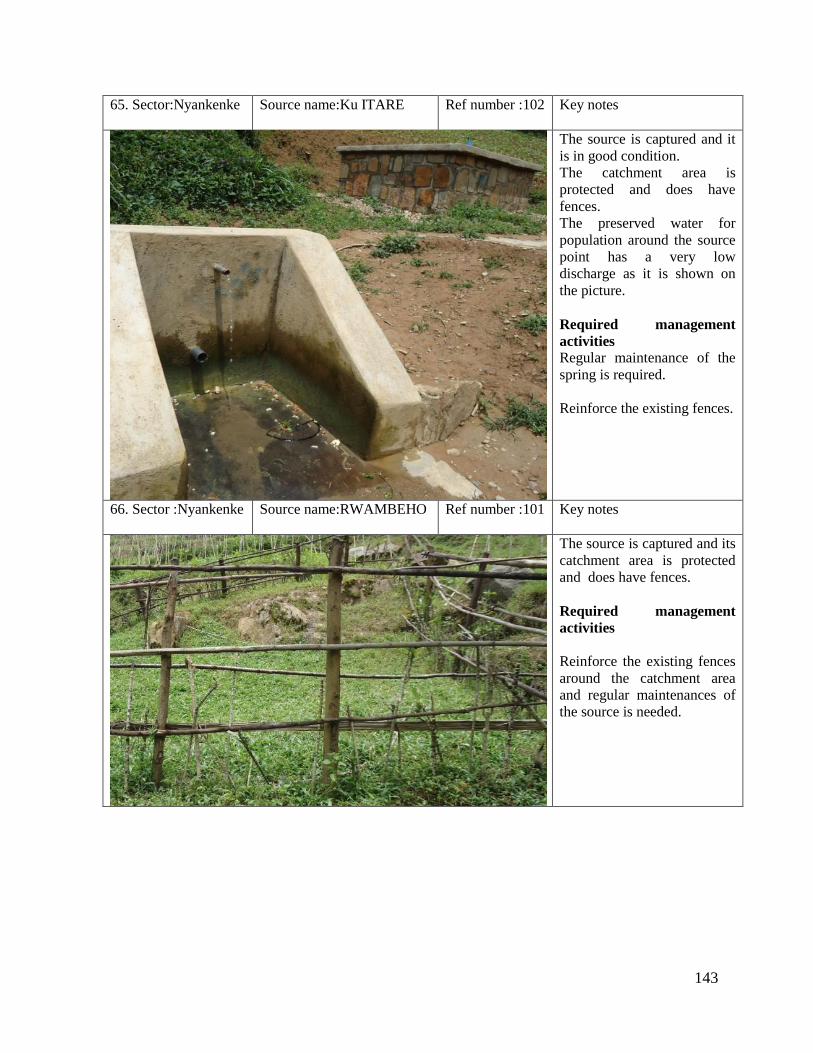
143
65. Sector:Nyankenke Source name:Ku ITARE Ref number :102 Key notes
The source is captured and it
is in good condition.
The catchment area is
protected and does have
fences.
The preserved water for
population around the source
point has a very low
discharge as it is shown on
the picture.
Required management
activities
Regular maintenance of the
spring is required.
Reinforce the existing fences.
66. Sector :Nyankenke Source name:RWAMBEHO Ref number :101 Key notes
The source is captured and its
catchment area is protected
and does have fences.
Required management
activities
Reinforce the existing fences
around the catchment area
and regular maintenances of
the source is needed.
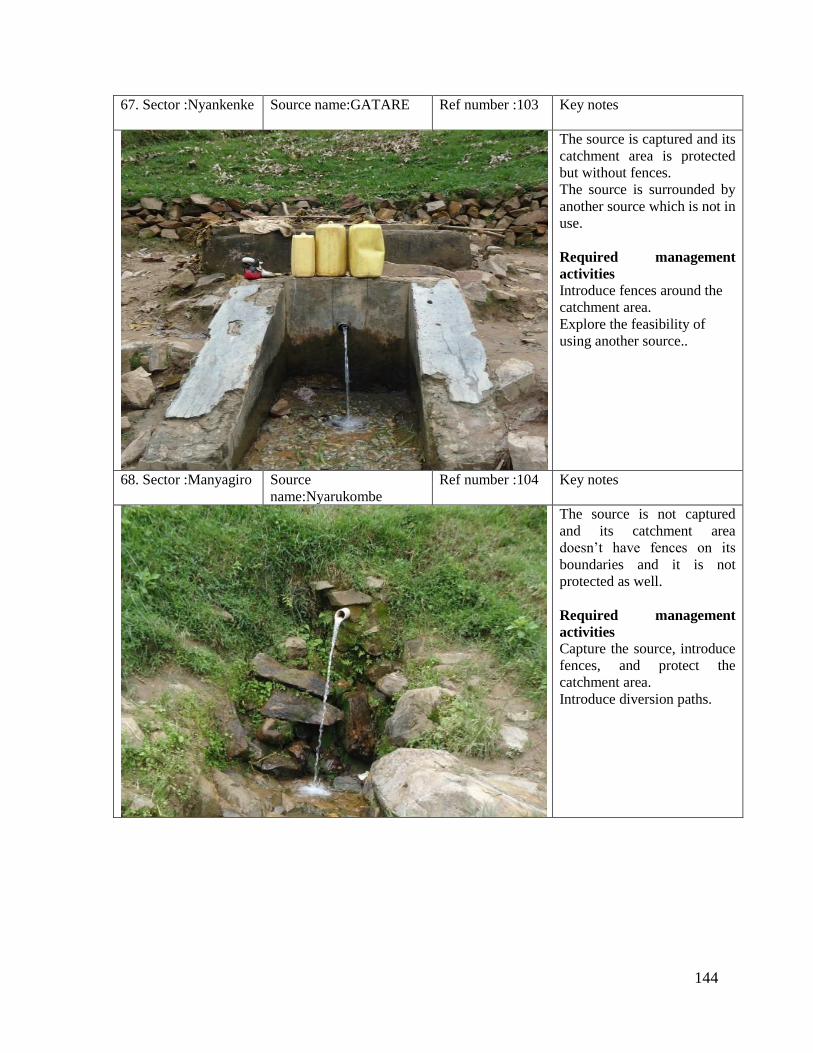
144
67. Sector :Nyankenke Source name:GATARE Ref number :103 Key notes
The source is captured and its
catchment area is protected
but without fences.
The source is surrounded by
another source which is not in
use.
Required management
activities
Introduce fences around the
catchment area.
Explore the feasibility of
using another source..
68. Sector :Manyagiro Source
name:Nyarukombe
Ref number :104 Key notes
The source is not captured
and its catchment area
doesn’t have fences on its
boundaries and it is not
protected as well.
Required management
activities
Capture the source, introduce
fences, and protect the
catchment area.
Introduce diversion paths.

145
69. Sector:Byumba Source name:NYARUBANDE Ref number
:105
Key notes
The source is captured and its
catchment area is not
protected and doesn’t have
fences.
Guide : SINAYIRAZWE
Mathias
Tel : 0785080064
Required management
activities
Introduce fences and protect
the catchment area.
Rehabilitation of the spring is
also needed.
70. Sector :Ruvune Source name:KABINGO Ref
number:106
Key notes
The source is not captured
and doesn’t have a water tap.
The catchment area is not
protected and it is surrounded
by a lot of bushes.
Required management
activities
Capture the source, and
introduce a standard water
tap to the source.
Introduce fences, clear the
surrounding, and protect the
catchment area.
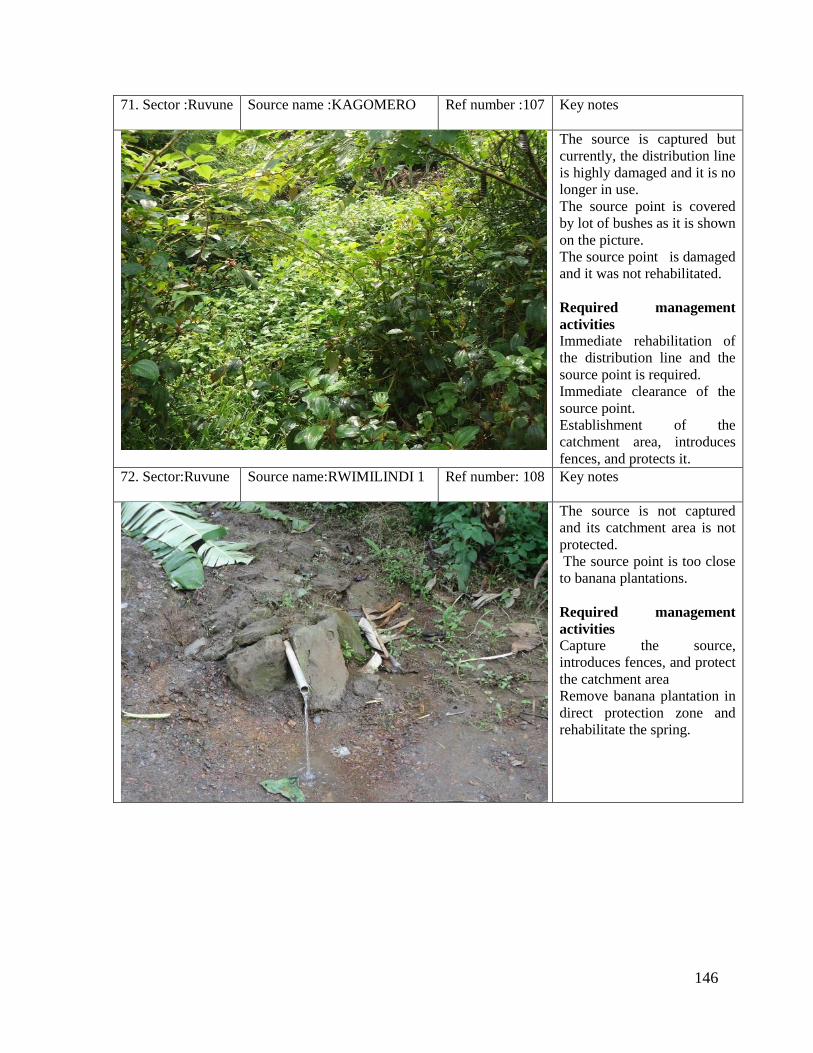
146
71. Sector :Ruvune Source name :KAGOMERO Ref number :107 Key notes
The source is captured but
currently, the distribution line
is highly damaged and it is no
longer in use.
The source point is covered
by lot of bushes as it is shown
on the picture.
The source point is damaged
and it was not rehabilitated.
Required management
activities
Immediate rehabilitation of
the distribution line and the
source point is required.
Immediate clearance of the
source point.
Establishment of the
catchment area, introduces
fences, and protects it.
72. Sector:Ruvune Source name:RWIMILINDI 1 Ref number: 108 Key notes
The source is not captured
and its catchment area is not
protected.
The source point is too close
to banana plantations.
Required management
activities
Capture the source,
introduces fences, and protect
the catchment area
Remove banana plantation in
direct protection zone and
rehabilitate the spring.
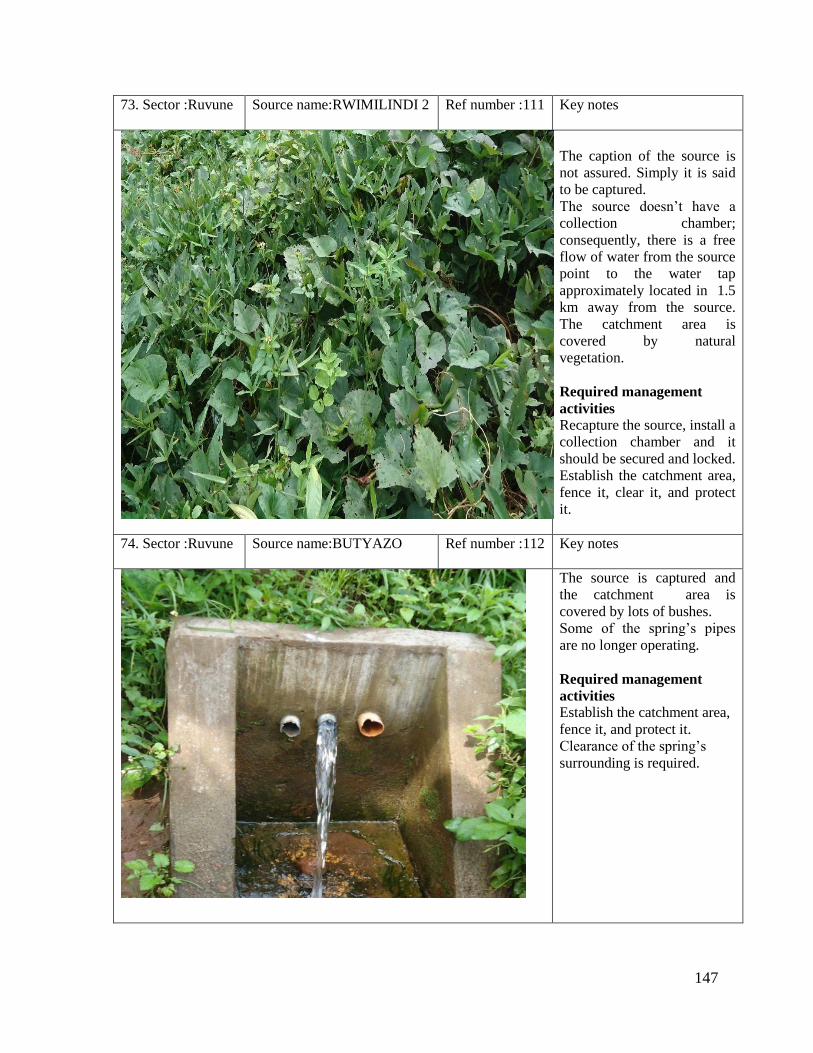
147
73. Sector :Ruvune Source name:RWIMILINDI 2 Ref number :111 Key notes
The caption of the source is
not assured. Simply it is said
to be captured.
The source doesn’t have a
collection chamber;
consequently, there is a free
flow of water from the source
point to the water tap
approximately located in 1.5
km away from the source.
The catchment area is
covered by natural
vegetation.
Required management
activities
Recapture the source, install a
collection chamber and it
should be secured and locked.
Establish the catchment area,
fence it, clear it, and protect
it.
74. Sector :Ruvune Source name:BUTYAZO Ref number :112 Key notes
The source is captured and
the catchment area is
covered by lots of bushes.
Some of the spring’s pipes
are no longer operating.
Required management
activities
Establish the catchment area,
fence it, and protect it.
Clearance of the spring’s
surrounding is required.

148
75. Sector : Rukomo Source name: Kadogo Ref number: 108 Key notes
The source is not captured,
not fenced, and not protected
at all.
Water get dirty during the
rainy season as it is shown on
the picture.
Required management
activities
Capture the source,
introduces fences, and protect
source catchment area.
Establish water diversion
paths upstream to prevent the
interaction of source water
and the runoff.
76. Sector : Ruvune Source name : Karitushi Ref number :111 Key notes
The source is not captured
and does not have fences and
it is not protected.
Water becomes dirty during
the rainy season. The
catchment area is surrounded
by uncultivated area.
The proper maintenance is
required.
Required management
activities
Capture the source, introduce
fences, and protect the source
catchment area.
Introduce water diversion
ditch around the source.

149
77. Sector :Rukomo Source name :KARIBA 1 Ref number :117 Key notes
The source is captured but it
does have a collection
chamber, its catchment is
protected and covered by the
natural vegetation but it is not
fenced.
Required management
activities.
Install a collection chamber,
and it should be secured and
locked.
Introduce fences around the
catchment area.
78. Sector:Rukomo Source name:KARIBA 2 Ref number :118 Key notes
The source is Captured but it
doesn’t have a collection
chamber, its catchment area
is protected but not fenced.
The surrounding area is
covered by the bushes and
shrubs.
Required management
activities
Install a collection chamber,
secure it, and lock it.
Introduces fences on the
catchment area and clear it.

150
79. Sector :Shangasha Source name:
NYAKABINGO 1
Ref number :119 Key notes
The source is not captured
and its catchment area is not
fenced, therefore it is not
connected properly.
As illustrated on the picture,
the spring is surrounded by
agricultural activities and has
a water diversion path.
Required management
activity
Capture the source,
introduces fences around the
catchment area.
Stop agricultural activities
near the source.
80. Sector:Shangasha Source name:
NYAKABINGO 2
Ref number:120 Key notes
The source is captured and
the catchment area is not
fenced and it is not protected
as well.
The upstream area of the
source is cover by the forest
plantation of eucalyptus. And
the catchment area is covered
by the natural plantation, and
too close to small agricultural
activities.
Required management
activities
Introduces fences, and well
protect the catchment area.
Clearance of eucalyptus on
the vicinity of the source.
Establishment of water
diversion pathways.

151
81. Sector:Shangasha Source name:
NYAKABINGO 3
Ref number:121 Key notes
The source is captured and
the catchment area is not
fenced and it is not protected
as well.
The pumping station
illustrated below is no
longer in use and needs
rehabilitation for the future
operations.
The upstream area of the
pumping station is covered
by the banana plantation and
forest plantation.
Required management
activities
Introduce fences, and well
protect the catchment area.
Clearance of eucalyptus on
the vicinity of the spring.
Rehabilitate the pumping
station.

152
82. Sector :Shangasha Source name :
NYAKABINGO 4
Ref number :122 Key notes
The source catchment area is
not protected and most of the
catchment area is covered by
bushes as illustrated on the
picture.
The source of water is
captured but without a
collection chamber, water is
conveyed directly to the tank.
The upstream area of the
source is covered by forest
plantation of eucalyptus.
Required management
activities
Introduces fences, clear and
protect the catchment area.
Install a collection, secure it,
and lock it.
Clearance of eucalyptus on
the vicinity of the source.
83. Sector:Shangasha Source name:
KABAYI
Ref number :123 Key notes
The catchment area of the
source is not fenced and it is
not also well protected.
In addition to that, most of
the source water is diverted.
As a result, only water with
0.02 l/s flow rate is
discharged and it is still
talking the normal flow rate.
The spring discharges water
through two main pipes and
some of the spring water
leaks.
Required management
activities
Introduces fences and well
protect the catchment area.
Establish a diversion ditch
downstream.

153
84. Sector:Shangasha Source name:
KAZIRANKURWE
Ref number:124 Key notes
The source is not captured, its
catchment area is not
protected, and it is not
fenced as well.
The left part of the spring is
surrounded by the shrubs as it
is shown on the picture and
the spring discharges water
through one pipe and some of
the spring water leaks.
Guide : Dominique
Tel : 0728308248
Required management
activities
Capture the source,
introduces fences, and protect
the catchment area.
Clearance and maintenance
of the spring’s surrounding is
required.
Establish a water diversion
ditch downstream.
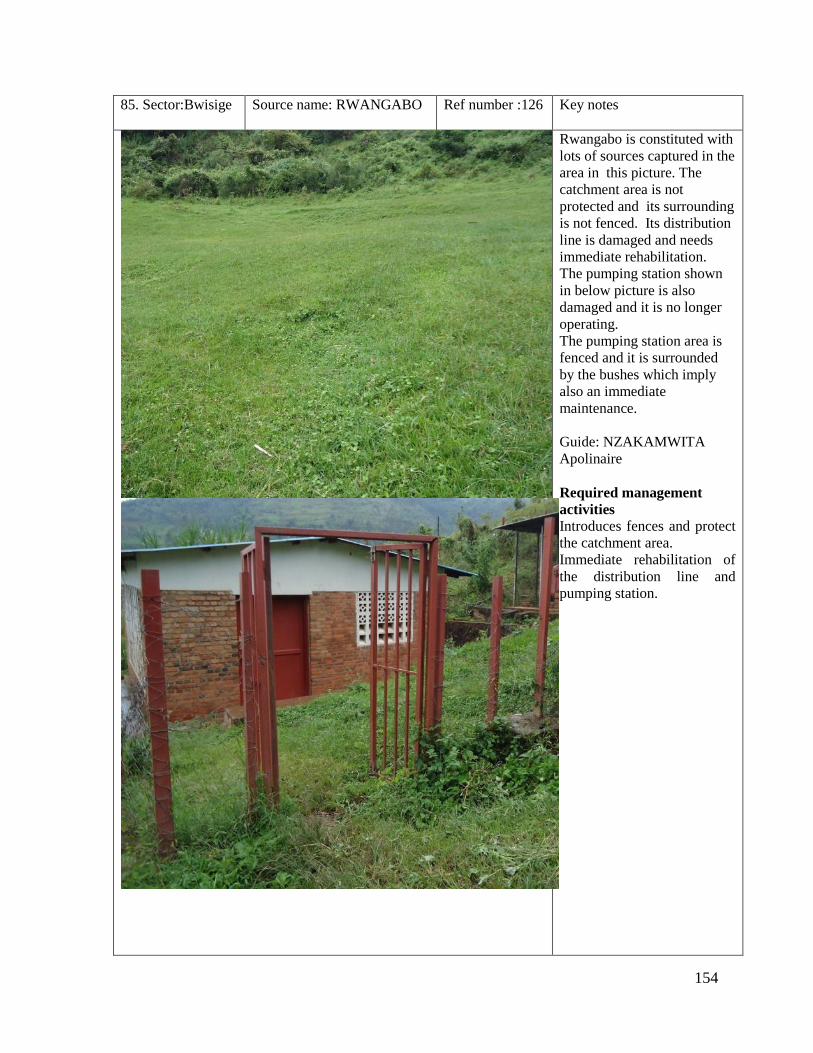
154
85. Sector:Bwisige Source name: RWANGABO Ref number :126 Key notes
Rwangabo is constituted with
lots of sources captured in the
area in this picture. The
catchment area is not
protected and its surrounding
is not fenced. Its distribution
line is damaged and needs
immediate rehabilitation.
The pumping station shown
in below picture is also
damaged and it is no longer
operating.
The pumping station area is
fenced and it is surrounded
by the bushes which imply
also an immediate
maintenance.
Guide: NZAKAMWITA
Apolinaire
Required management
activities Introduces fences and protect
the catchment area.
Immediate rehabilitation of
the distribution line and
pumping station.

155
86. Sector:Bwisige Source name:
KAGOROGORO
Ref number :127 Key notes
The source is not captured, its
catchment area is not
protected, and it is not
fenced as well.
Water becomes dirty in rainy
season. And most of its
part area is diverted. The
catchment area is surrounded
by the shrubs and bushes.
Spring discharges water
through one pipe and some of
the spring water leaks.
Required management
activities
Capture the source,
introduces fences, and protect
the catchment area.
Introduce terraces upstream
and diversion paths and clear
the catchment area.
Introduces a water diversion
ditch downstream.
87. Sector :Bwisige Source name :
KANYIRABUKI
Ref number :128 Key notes
The source is captured and its
catchment area is not
protected, and it is not fenced
as well.
The Springs catchment area
is surrounded by natural
vegetation, and the spring
discharges water through one
pipe and some of the spring
water leaks as it is illustrated
on the picture.
The spring is well
constructed and needs proper
maintenance around.
Required management
activities
Introduces fences and protect
the catchment area.
Establish a water diversion
ditch downstream.

156
88. Sector:Bwisige Source name:
RYARUGANZU
Ref number:129 Key notes
The source is captured but
not properly. There is a
considerable area of the
source which is diverted and
water goes away from the
collection chamber.
The catchment area is not
protected and it is not
fenced.
The distribution line is
damaged and needs an
immediate rehabilitation.
Some of spring catchment
area is covered by passparum
plants.
The spring discharges water
through two main pipes and
some of the spring’s water
leaks.
Required management
activities
Recapture the source and
introduces diversion paths.
Introduce fences and protect
the catchment area.
Immediate rehabilitation of
the distribution line.
Establish a water diversion
ditch downstream.

157
89. Sector :Bwisige Source name: KIGAGA Ref number :130 Key notes
The source is not protected
and its catchment area is not
protected and it is not
fenced as well.
Water becomes dirty in rainy
season.
The immediate spring
catchment is not protected
and it is sloppy with a
possibility of an open runoff.
The spring discharges water
through one pipe as it is
shown on the picture.
Required management
activities
Protect both the source and
the catchment area, and
introduces fences.
Introduces water diversion
paths to eliminate the
interaction of the spring’s
water and the runoff.
90. Sector:Rukomo Source name:GAHONDO Ref number :131 Key notes
The source is not captured, its
catchment area is not fenced
and it is not protected as well.
Water from the source always
becomes dirty in rainy season
periods..
The water fountain is too
close to the road. The spring
discharges water through two
main pipes and some of the
spring water leaks as it is
shown on this picture.
Required management
activities
Capture the source,
introduces fences, and protect
the catchment area.
Establish water diversion
paths possibly upstream
terraces.

158
91. Sector :Muko Source name:
NYAKABINGO
Ref number:133 Key notes
The distribution work is still
under construction and water
becomes dirty in rainy
season.
The source is characterized
by an overflow of water in
the catchment area and water
leaks in pathways area which
seem to be packed with soft
soils.
Required management
activities
Reinforcement of distribution
works and introduces
diversion pathways.
Establish a catchment area,
fence it, and protect it.
Introduce a water diversion
ditch downstream.
92. Sector:Rutare Source name:
BURERANYANA
Ref number:134 Key notes
The distribution line from
BURERANYANA source is
under rehabilitation.
Its catchment area is
protected and it is fenced.
The catchment area is also
surrounded by banana
plantation and terraces that
need a proper improvement.
Required management
activities
Reinforce the rehabilitation
works.
Reinforce the existing fences
and terraces.
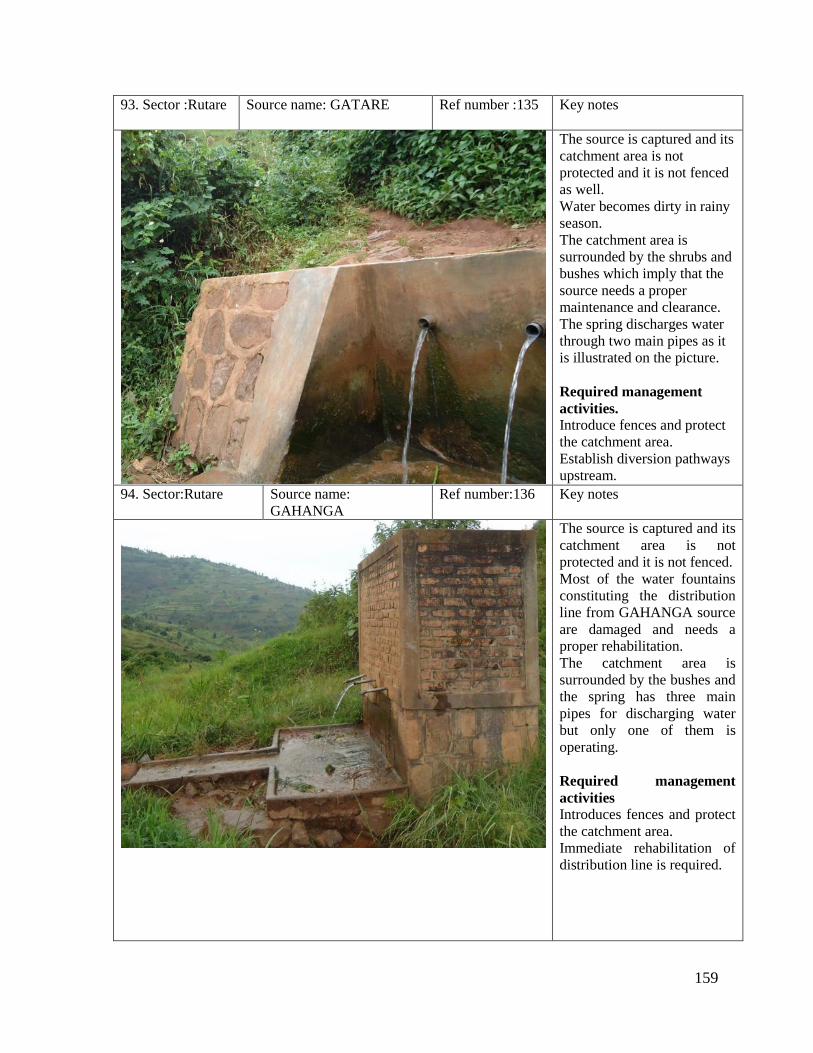
159
93. Sector :Rutare Source name: GATARE Ref number :135 Key notes
The source is captured and its
catchment area is not
protected and it is not fenced
as well.
Water becomes dirty in rainy
season.
The catchment area is
surrounded by the shrubs and
bushes which imply that the
source needs a proper
maintenance and clearance.
The spring discharges water
through two main pipes as it
is illustrated on the picture.
Required management
activities.
Introduce fences and protect
the catchment area.
Establish diversion pathways
upstream.
94. Sector:Rutare Source name:
GAHANGA
Ref number:136 Key notes
The source is captured and its
catchment area is not
protected and it is not fenced.
Most of the water fountains
constituting the distribution
line from GAHANGA source
are damaged and needs a
proper rehabilitation.
The catchment area is
surrounded by the bushes and
the spring has three main
pipes for discharging water
but only one of them is
operating.
Required management
activities
Introduces fences and protect
the catchment area.
Immediate rehabilitation of
distribution line is required.

160
95. Sector: Rutare Source name: GASHARU Ref number: 137 Key notes
Gasharu source is not
captured and its catchment
area is not protected and it is
not fenced.
The catchment area is
surrounded by few
plantations of banana, bushes,
and stones. The spring is
damaged and discharges
water through one pipe.
Required management
activities
Fence and protect the
catchment area.
Rehabilitate the spring and
remove the banana plantation
in vicinity of the source.
96. Sector:Rutare Source
name:KARANGARA
Ref number :138 Key notes
The source is not captured
and its catchment area is not
protected and it is exposed to
erosion.
A considerable part of the
source is diverted and the
water fountain needs
rehabilitation.
The catchment area is mostly
surrounded by the bushes of
flesh grasses and they are
dispatched everywhere within
the catchment area.
Required management
activities
Capture the source,
introduces fences, and protect
the catchment area.
Introduces diversion
pathways, and terraces to
prohibit erosion exposure.
Immediate rehabilitation of
water fountain.
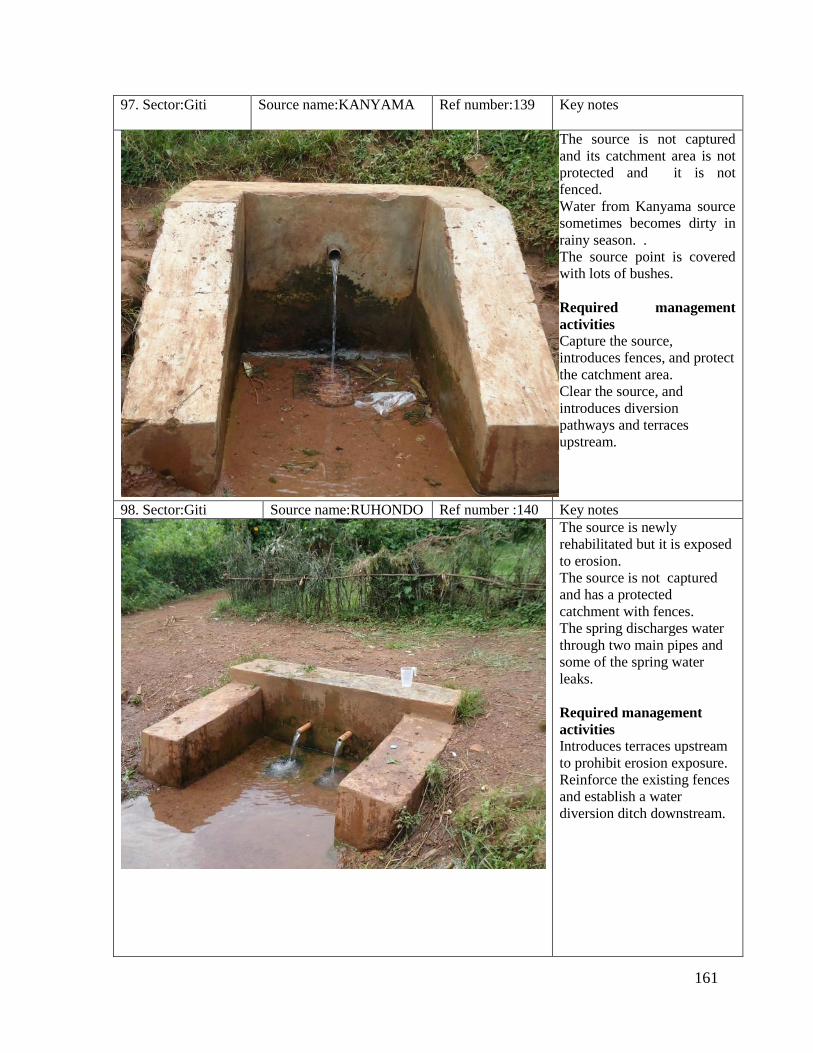
161
97. Sector:Giti Source name:KANYAMA Ref number:139 Key notes
The source is not captured
and its catchment area is not
protected and it is not
fenced.
Water from Kanyama source
sometimes becomes dirty in
rainy season. .
The source point is covered
with lots of bushes.
Required management
activities
Capture the source,
introduces fences, and protect
the catchment area.
Clear the source, and
introduces diversion
pathways and terraces
upstream.
98. Sector:Giti Source name:RUHONDO Ref number :140 Key notes
The source is newly
rehabilitated but it is exposed
to erosion.
The source is not captured
and has a protected
catchment with fences.
The spring discharges water
through two main pipes and
some of the spring water
leaks.
Required management
activities
Introduces terraces upstream
to prohibit erosion exposure.
Reinforce the existing fences
and establish a water
diversion ditch downstream.

162
99. Sector:Muko Source name :GAHAMA Ref number:141 Key notes
The source is captured and its
catchment area is not
protected and it is not
fenced.
The source point is
surrounded by a lot of bushes
and the collection chamber is
secured and locked. Water
spring over leaked out of the
chamber as it is shown on the
picture.
Required management
activities
Introduces fences, and protect
the catchment area.
Clear the source point and
introduce a standard water
pipe.
Establish a water diversion
ditch.
100. Sector: Muko Source name :KIDOGO 1 Ref number:142 Key notes
The source is captured and its
catchment area is not
protected and it is not fenced
as well.
The source was hit by a
severe landslide and is now
highly damaged.
Water becomes dirty during
the rainy season and the
catchment area is located
within banana plantation
field.
Required management
activities
Introduce fences and protect
the catchment area.
Total rehabilitation of the
source is required.
Remove all banana plantation
surrounding the water source.

163
101. Sector:Muko Source name: KIDOGO 2 Ref number :143 Key notes
The source is captured and its
catchment area is not
protected and it is not fenced.
The source was hit by a
severe landslide and is now
highly damaged.
Water gets dirty during the
rainy season.
The source is surrounded by a
banana plantation field and it
really needs an immediate
rehabilitation.
Required management
activities
Introduce fences and protect
the catchment area.
Total rehabilitation of the
source is required.
Remove all banana plantation
in the vicinity of water
source.
102. Sector:Nyamiyaga Source name :Gakore Ref number :144 Key notes
The source is not captured
and its catchment area is not
fenced and it is not protected
at all.
The catchment area is
covered by the natural
vegetation as illustrated on
the picture.
The spring discharges water
through one pipe and some of
the spring water leaks.
Required management
activities
Capture the source, introduce
fences, and protect the
catchment area.
Establish a diversion ditch
downstream.
A rehabilitation of the spring
is required.
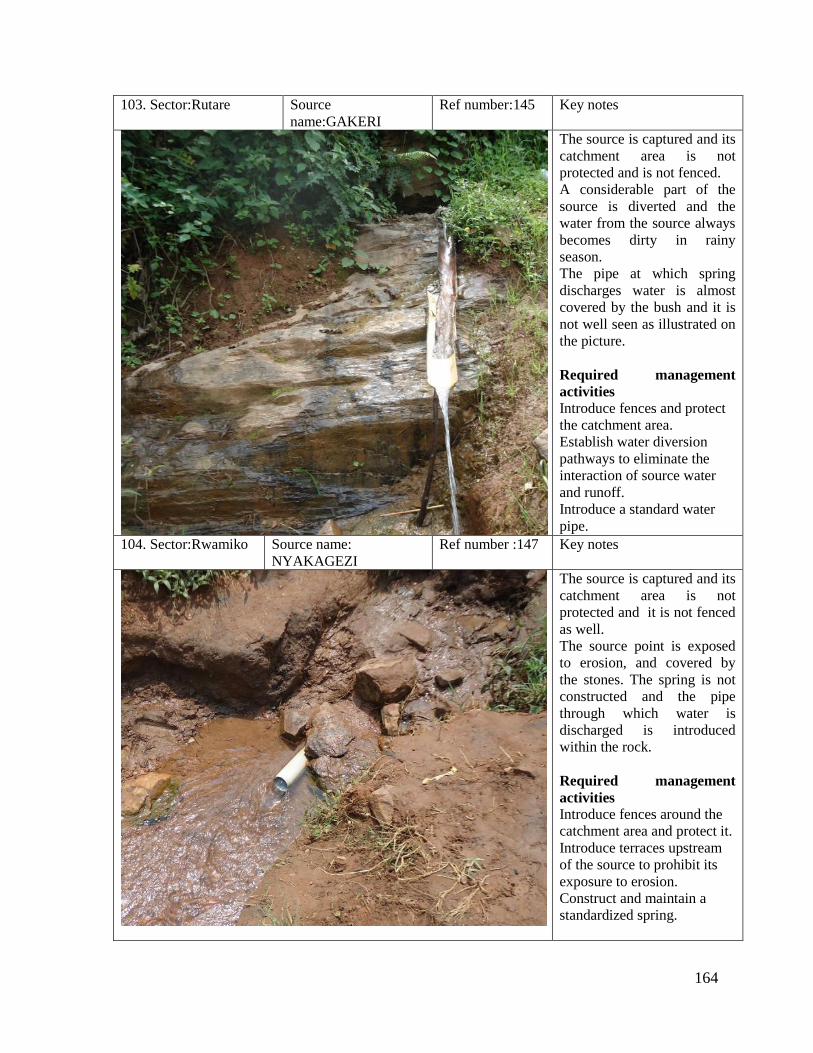
164
103. Sector:Rutare Source
name:GAKERI
Ref number:145 Key notes
The source is captured and its
catchment area is not
protected and is not fenced.
A considerable part of the
source is diverted and the
water from the source always
becomes dirty in rainy
season.
The pipe at which spring
discharges water is almost
covered by the bush and it is
not well seen as illustrated on
the picture.
Required management
activities
Introduce fences and protect
the catchment area.
Establish water diversion
pathways to eliminate the
interaction of source water
and runoff.
Introduce a standard water
pipe.
104. Sector:Rwamiko Source name:
NYAKAGEZI
Ref number :147 Key notes
The source is captured and its
catchment area is not
protected and it is not fenced
as well.
The source point is exposed
to erosion, and covered by
the stones. The spring is not
constructed and the pipe
through which water is
discharged is introduced
within the rock.
Required management
activities
Introduce fences around the
catchment area and protect it.
Introduce terraces upstream
of the source to prohibit its
exposure to erosion.
Construct and maintain a
standardized spring.

165
105. Sector:Rwamiko Source name:Gaseke Ref number :146 Key notes
The source is captured and its
catchment is not protected
and it is not fenced at all.
A considerable part of the
source is diverted and the
water from the source always
becomes dirty in rainy
season.
The catchment area is not
clean and diverted water
leaks.
Required management
activities
Introduce fences and protect
the catchment area.
Establish water diversion
pathways.
Establish a diversion ditch
downstream.
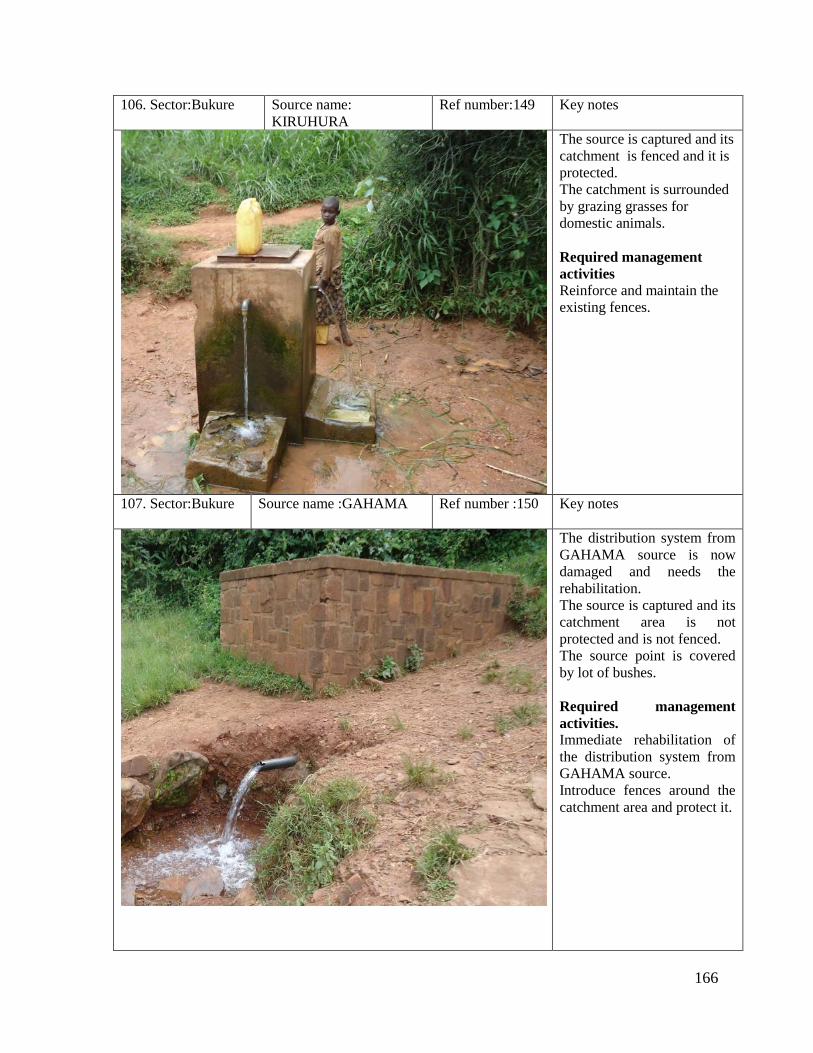
166
106. Sector:Bukure Source name:
KIRUHURA
Ref number:149 Key notes
The source is captured and its
catchment is fenced and it is
protected.
The catchment is surrounded
by grazing grasses for
domestic animals.
Required management
activities
Reinforce and maintain the
existing fences.
107. Sector:Bukure Source name :GAHAMA Ref number :150 Key notes
The distribution system from
GAHAMA source is now
damaged and needs the
rehabilitation.
The source is captured and its
catchment area is not
protected and is not fenced.
The source point is covered
by lot of bushes.
Required management
activities.
Immediate rehabilitation of
the distribution system from
GAHAMA source.
Introduce fences around the
catchment area and protect it.
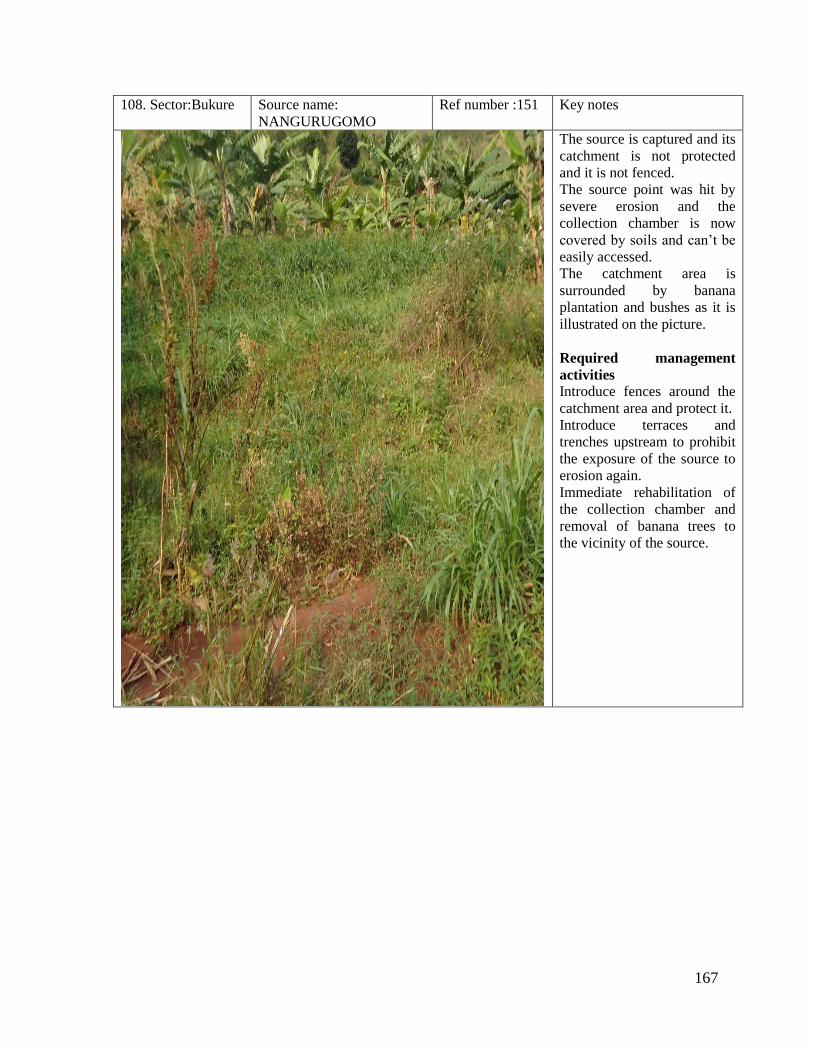
167
108. Sector:Bukure Source name:
NANGURUGOMO
Ref number :151 Key notes
The source is captured and its
catchment is not protected
and it is not fenced.
The source point was hit by
severe erosion and the
collection chamber is now
covered by soils and can’t be
easily accessed.
The catchment area is
surrounded by banana
plantation and bushes as it is
illustrated on the picture.
Required management
activities
Introduce fences around the
catchment area and protect it.
Introduce terraces and
trenches upstream to prohibit
the exposure of the source to
erosion again.
Immediate rehabilitation of
the collection chamber and
removal of banana trees to
the vicinity of the source.

168
109. Sector:Bukure Source name:
CYAKABARI
Ref number:152 Key notes
The source is captured and
the catchment area is not
protected and is not fenced.
The upstream area of the
source point is cover by
agricultural activities.
The catchment area is
covered by natural vegetation
and the spring discharges
water through one pipe and
some of the spring water
leaks.
Required management
activities
Introduce fences and protect
the catchment area.
Remove agricultural
activities in the source point
vicinity.
Introduce a water diversion
ditch.
110. Sector :Mutete Source name: RUSAVE Ref number :153 Key notes
The source is not captured
and its catchment area is not
fenced and it is not protected
as well.
The water fountain needs to
be rehabilitated.
The catchment area is
covered by the bushes and
spring discharges water
through one pipe and some
spring water leaks.
Required management
activities.
Capture the source, introduce
fences, and protect the
catchment area.
Immediate rehabilitation of
water fountain and the spring
itself.
Introduce a water diversion
ditch and clean the
surrounding area.
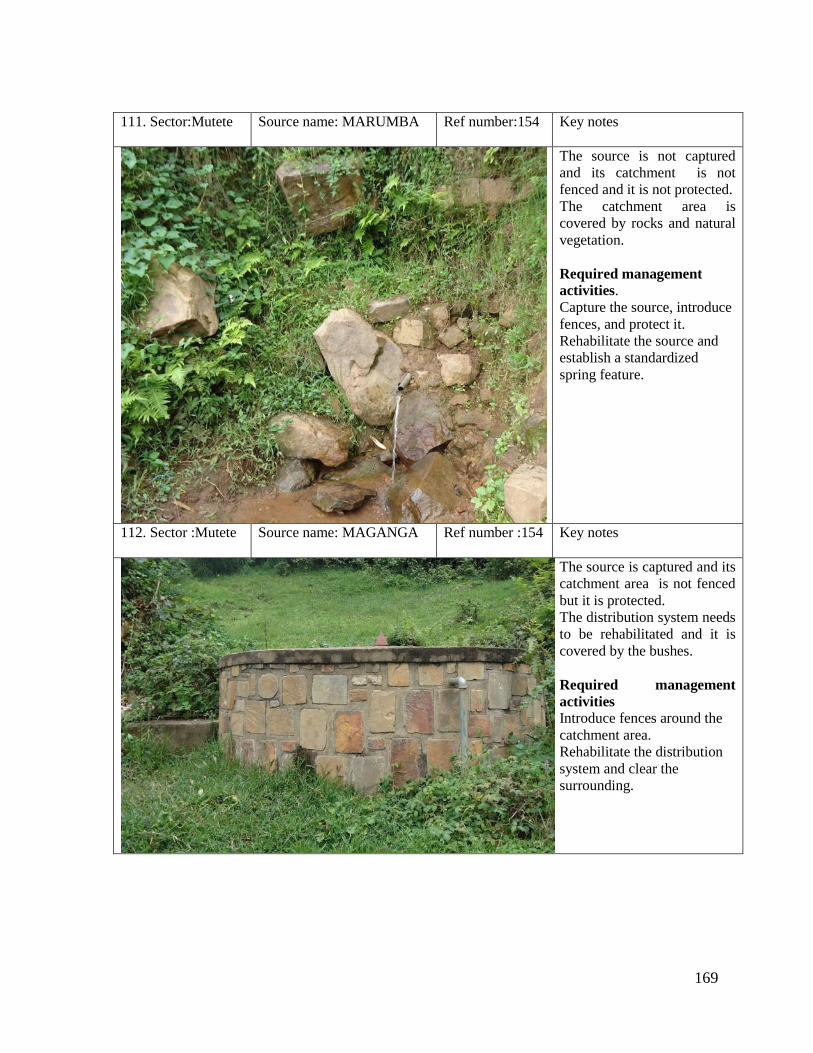
169
111. Sector:Mutete Source name: MARUMBA Ref number:154 Key notes
The source is not captured
and its catchment is not
fenced and it is not protected.
The catchment area is
covered by rocks and natural
vegetation.
Required management
activities.
Capture the source, introduce
fences, and protect it.
Rehabilitate the source and
establish a standardized
spring feature.
112. Sector :Mutete Source name: MAGANGA Ref number :154 Key notes
The source is captured and its
catchment area is not fenced
but it is protected.
The distribution system needs
to be rehabilitated and it is
covered by the bushes.
Required management
activities
Introduce fences around the
catchment area.
Rehabilitate the distribution
system and clear the
surrounding.
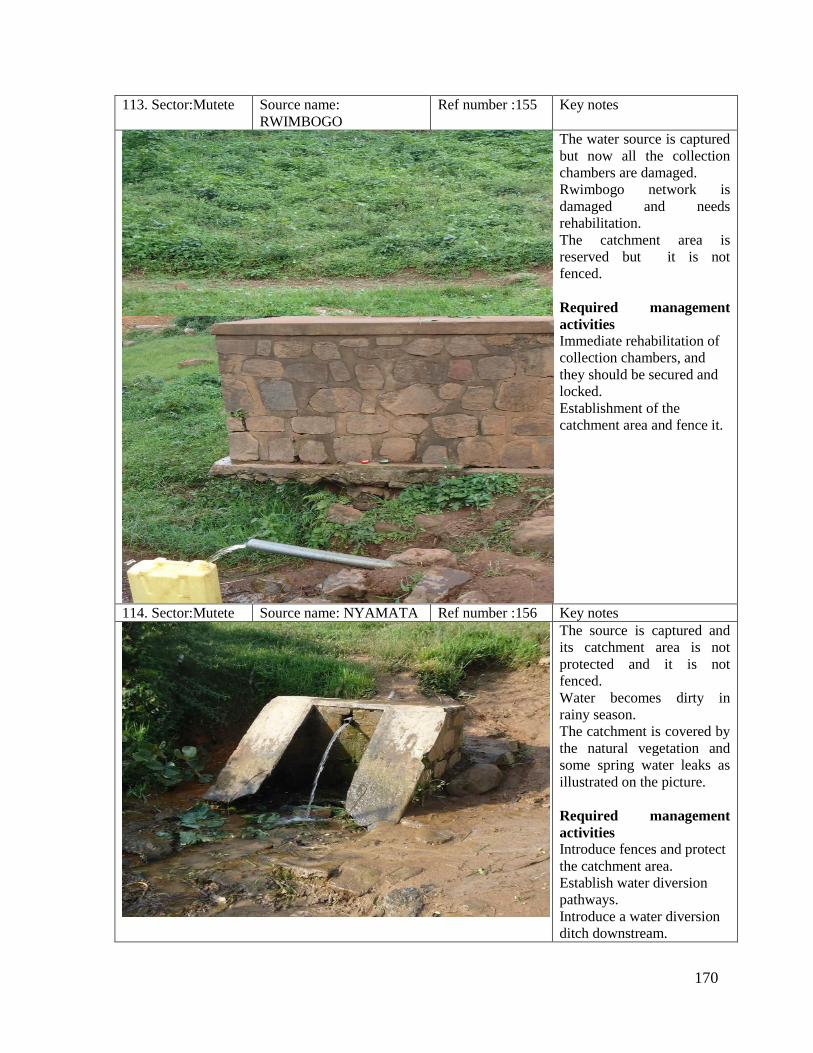
170
113. Sector:Mutete Source name:
RWIMBOGO
Ref number :155 Key notes
The water source is captured
but now all the collection
chambers are damaged.
Rwimbogo network is
damaged and needs
rehabilitation.
The catchment area is
reserved but it is not
fenced.
Required management
activities
Immediate rehabilitation of
collection chambers, and
they should be secured and
locked.
Establishment of the
catchment area and fence it.
114. Sector:Mutete Source name: NYAMATA Ref number :156 Key notes
The source is captured and
its catchment area is not
protected and it is not
fenced.
Water becomes dirty in
rainy season.
The catchment is covered by
the natural vegetation and
some spring water leaks as
illustrated on the picture.
Required management
activities
Introduce fences and protect
the catchment area.
Establish water diversion
pathways.
Introduce a water diversion
ditch downstream.
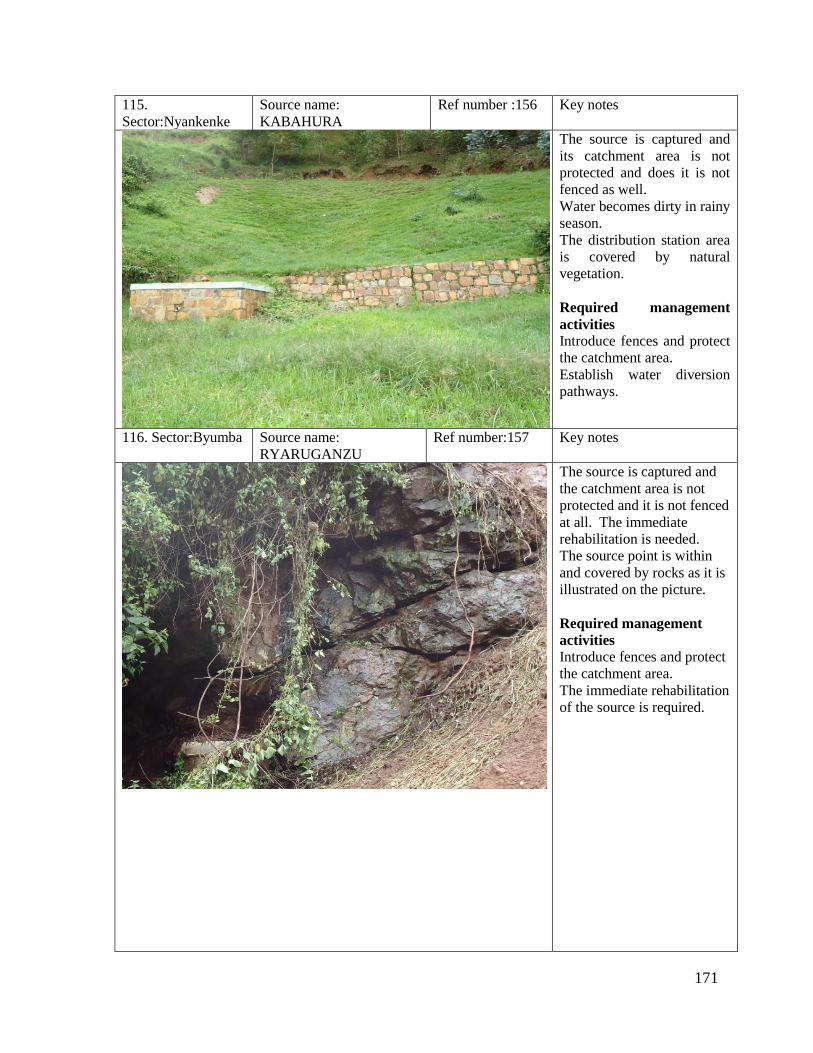
171
115.
Sector:Nyankenke
Source name:
KABAHURA
Ref number :156 Key notes
The source is captured and
its catchment area is not
protected and does it is not
fenced as well.
Water becomes dirty in rainy
season.
The distribution station area
is covered by natural
vegetation.
Required management
activities
Introduce fences and protect
the catchment area.
Establish water diversion
pathways.
116. Sector:Byumba Source name:
RYARUGANZU
Ref number:157 Key notes
The source is captured and
the catchment area is not
protected and it is not fenced
at all. The immediate
rehabilitation is needed.
The source point is within
and covered by rocks as it is
illustrated on the picture.
Required management
activities
Introduce fences and protect
the catchment area.
The immediate rehabilitation
of the source is required.

172
117. Sector:Rukomo Source name: Mugomero Ref number :158 Key notes
The source is not captured
and the catchment area is not
protected and it is not
fenced.
At some part of the source
water is diverted.
Required management
activities
Capture the source,
introduce fences, and protect
the catchment area.
Establish a diversion ditch
downstream.
118. Sector:Rukomo Source name:
NYAMABUYE 1
Ref number :159 Key notes
The source is captured and
the catchment is not
protected and it is not fenced
at all.
The distribution system area
is covered by the bushes and
it is surrounded by
unprogressive terraces.
Required management
activities
Introduce fences and protect
the catchment area.
Reinforcement of the
existing terraces.
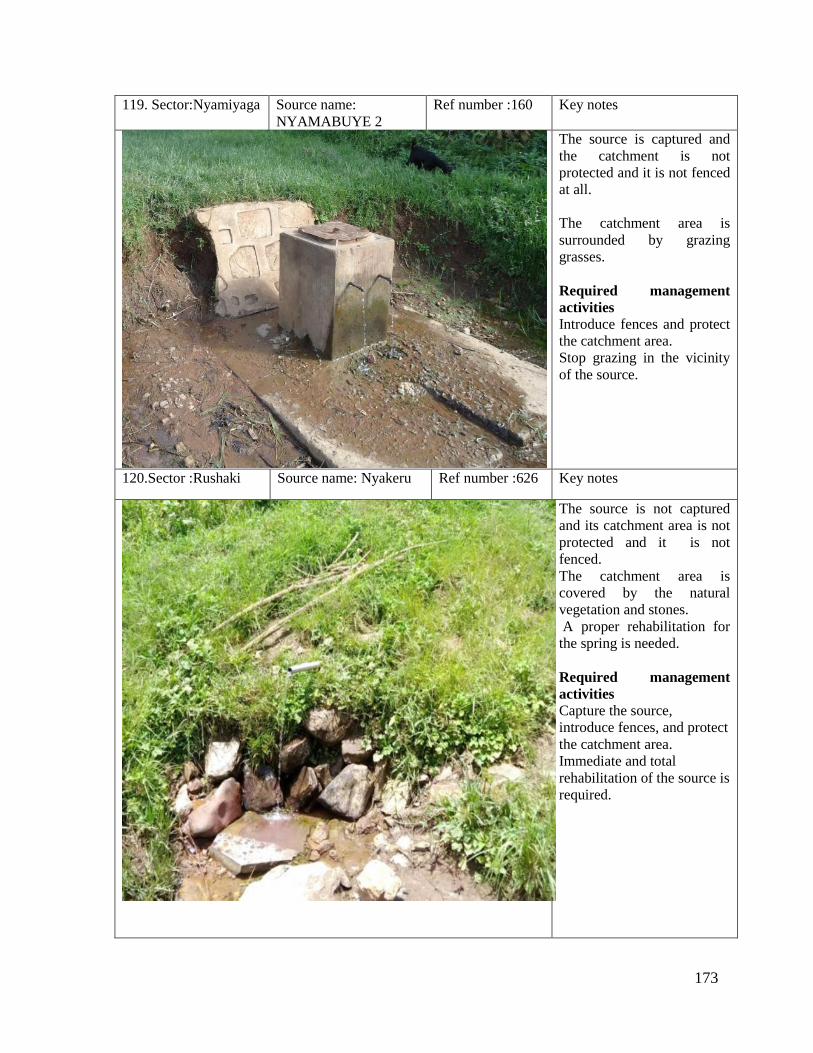
173
119. Sector:Nyamiyaga Source name:
NYAMABUYE 2
Ref number :160 Key notes
The source is captured and
the catchment is not
protected and it is not fenced
at all.
The catchment area is
surrounded by grazing
grasses.
Required management
activities
Introduce fences and protect
the catchment area.
Stop grazing in the vicinity
of the source.
120.Sector :Rushaki Source name: Nyakeru Ref number :626 Key notes
The source is not captured
and its catchment area is not
protected and it is not
fenced.
The catchment area is
covered by the natural
vegetation and stones.
A proper rehabilitation for
the spring is needed.
Required management
activities
Capture the source,
introduce fences, and protect
the catchment area.
Immediate and total
rehabilitation of the source is
required.

174
121.Sector :Rushaki Source name: Kamutora Ref number :625 Key notes
The source is captured and
it is not clean at all.
The source catchment area is
covered by the shrubs and
bushes And needs an
immediate rehabilitation.
Required management
activities
Recapture the source and
clean it properly.
Establish again the source
catchment area and remove
shrubs and bushes.
Immediate and total
rehabilitation is requested.
122.Sector :Kaniga Source name:
Ku musigiti
Ref number :621 Key notes
The source catchment area is
not fenced and it is not
protected.
The water source needs to be
cleaned and there are season
crops in its surroundings.
The source area is
surrounded by the bushes
and it has a low flow rate of
spring’s water through the
pipe as it is shown on the
picture.
Required management
activities
Introduce fences and protect
the catchment area.
Stop agricultural activities in
the source vicinity.
Immediate clearance of the
source is required.
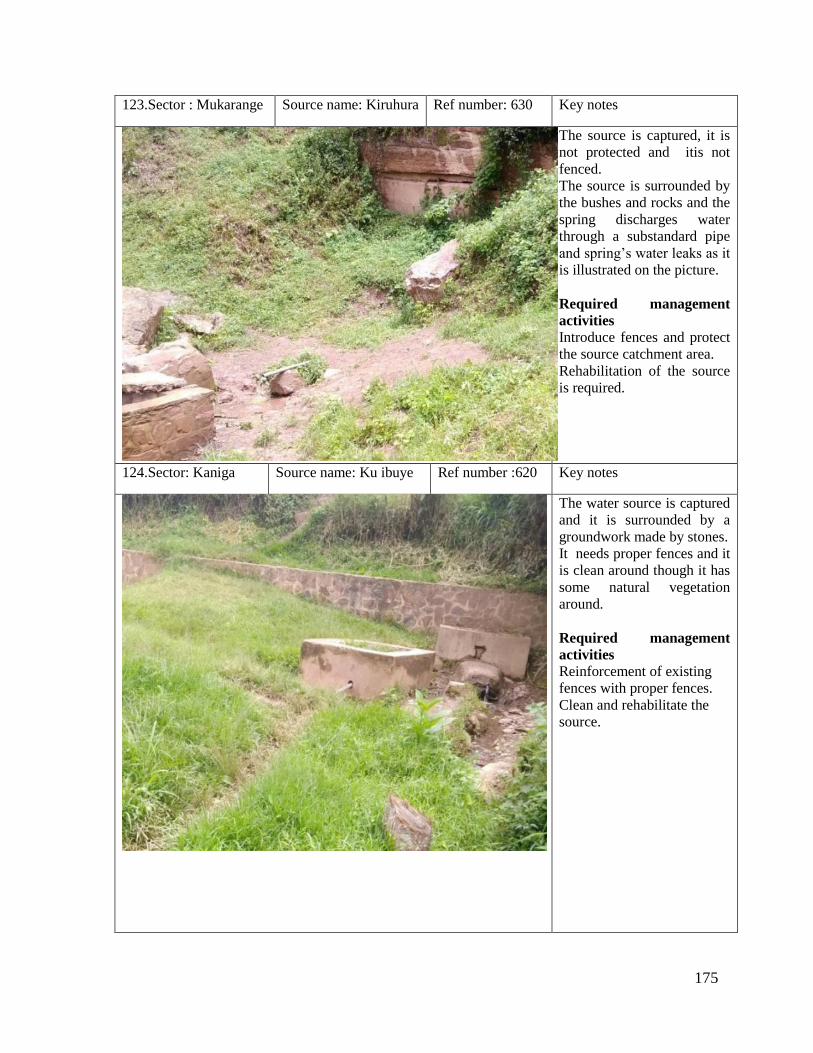
175
123.Sector : Mukarange Source name: Kiruhura Ref number: 630 Key notes
The source is captured, it is
not protected and itis not
fenced.
The source is surrounded by
the bushes and rocks and the
spring discharges water
through a substandard pipe
and spring’s water leaks as it
is illustrated on the picture.
Required management
activities
Introduce fences and protect
the source catchment area.
Rehabilitation of the source
is required.
124.Sector: Kaniga Source name: Ku ibuye Ref number :620 Key notes
The water source is captured
and it is surrounded by a
groundwork made by stones.
It needs proper fences and it
is clean around though it has
some natural vegetation
around.
Required management
activities
Reinforcement of existing
fences with proper fences.
Clean and rehabilitate the
source.
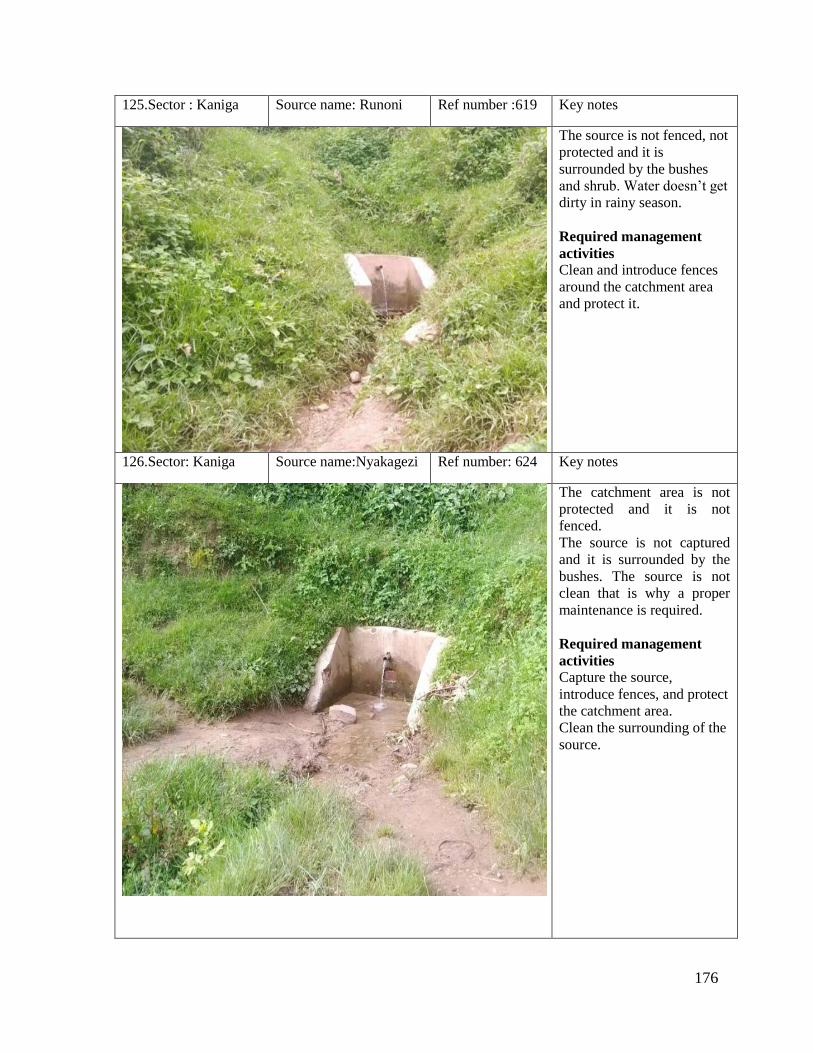
176
125.Sector : Kaniga Source name: Runoni Ref number :619 Key notes
The source is not fenced, not
protected and it is
surrounded by the bushes
and shrub. Water doesn’t get
dirty in rainy season.
Required management
activities
Clean and introduce fences
around the catchment area
and protect it.
126.Sector: Kaniga Source name:Nyakagezi Ref number: 624 Key notes
The catchment area is not
protected and it is not
fenced.
The source is not captured
and it is surrounded by the
bushes. The source is not
clean that is why a proper
maintenance is required.
Required management
activities
Capture the source,
introduce fences, and protect
the catchment area.
Clean the surrounding of the
source.
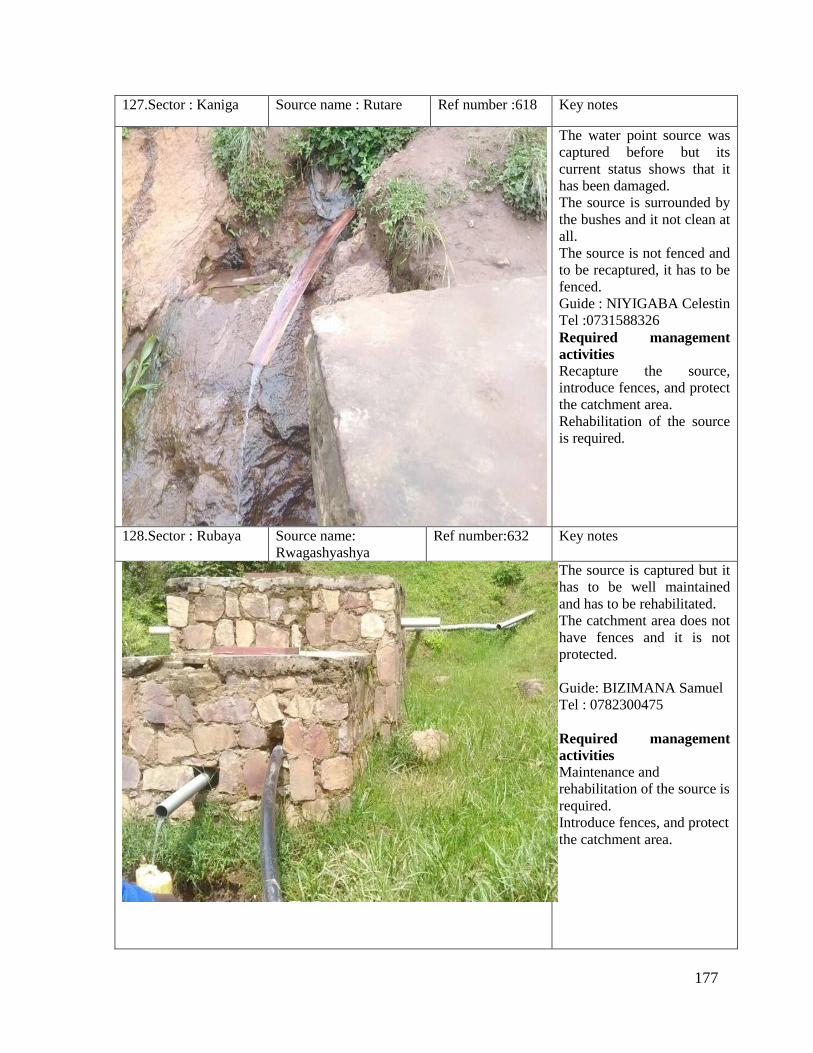
177
127.Sector : Kaniga Source name : Rutare Ref number :618 Key notes
The water point source was
captured before but its
current status shows that it
has been damaged.
The source is surrounded by
the bushes and it not clean at
all.
The source is not fenced and
to be recaptured, it has to be
fenced.
Guide : NIYIGABA Celestin
Tel :0731588326
Required management
activities
Recapture the source,
introduce fences, and protect
the catchment area.
Rehabilitation of the source
is required.
128.Sector : Rubaya Source name:
Rwagashyashya
Ref number:632 Key notes
The source is captured but it
has to be well maintained
and has to be rehabilitated.
The catchment area does not
have fences and it is not
protected.
Guide: BIZIMANA Samuel
Tel : 0782300475
Required management
activities
Maintenance and
rehabilitation of the source is
required.
Introduce fences, and protect
the catchment area.
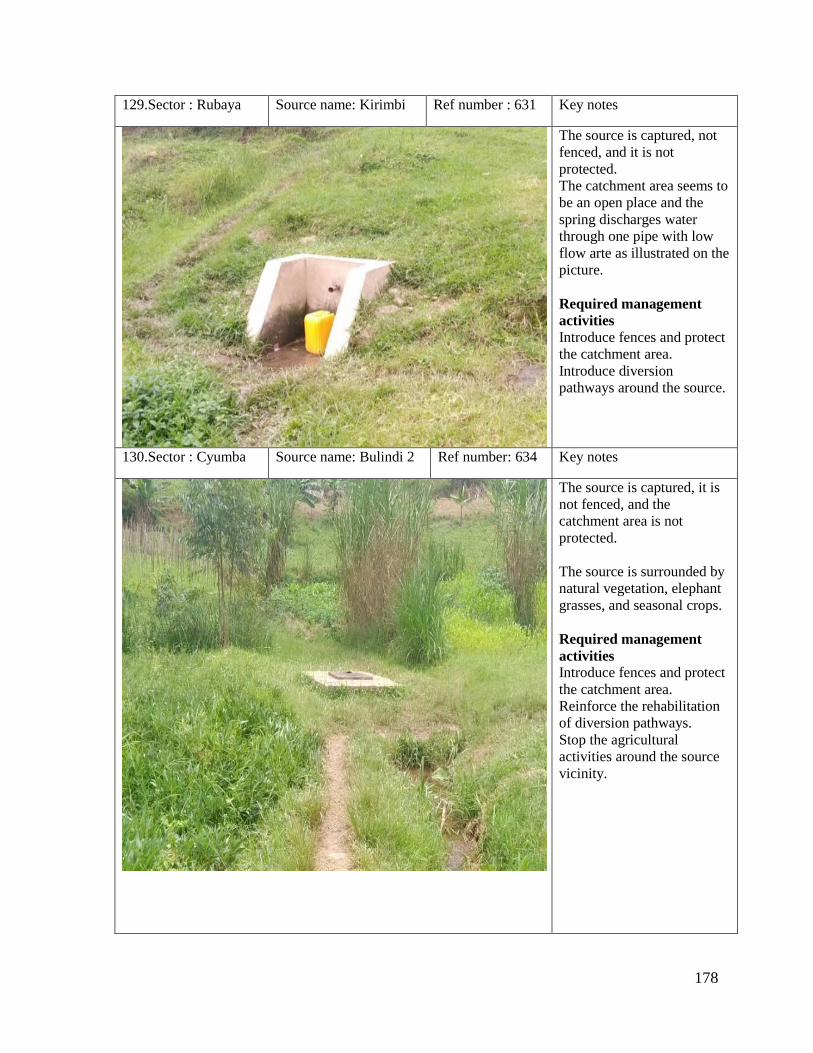
178
129.Sector : Rubaya Source name: Kirimbi Ref number : 631 Key notes
The source is captured, not
fenced, and it is not
protected.
The catchment area seems to
be an open place and the
spring discharges water
through one pipe with low
flow arte as illustrated on the
picture.
Required management
activities
Introduce fences and protect
the catchment area.
Introduce diversion
pathways around the source.
130.Sector : Cyumba Source name: Bulindi 2 Ref number: 634 Key notes
The source is captured, it is
not fenced, and the
catchment area is not
protected.
The source is surrounded by
natural vegetation, elephant
grasses, and seasonal crops.
Required management
activities
Introduce fences and protect
the catchment area.
Reinforce the rehabilitation
of diversion pathways.
Stop the agricultural
activities around the source
vicinity.
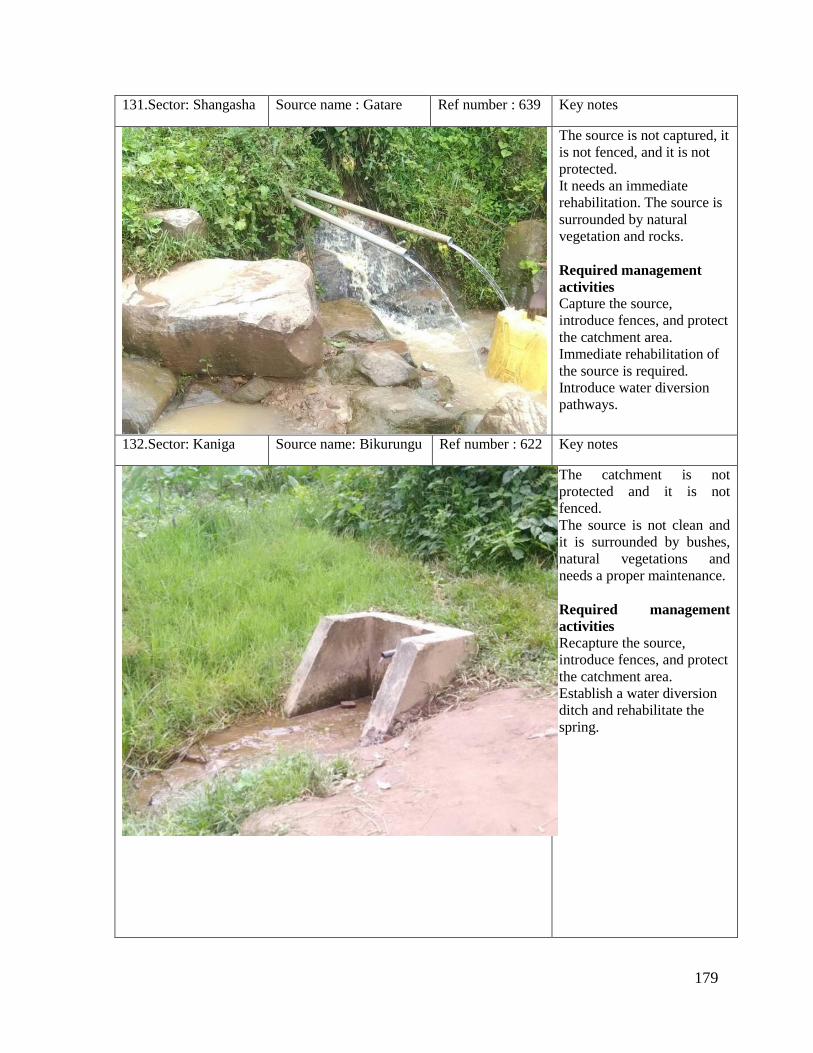
179
131.Sector: Shangasha Source name : Gatare Ref number : 639 Key notes
The source is not captured, it
is not fenced, and it is not
protected.
It needs an immediate
rehabilitation. The source is
surrounded by natural
vegetation and rocks.
Required management
activities
Capture the source,
introduce fences, and protect
the catchment area.
Immediate rehabilitation of
the source is required.
Introduce water diversion
pathways.
132.Sector: Kaniga Source name: Bikurungu Ref number : 622 Key notes
The catchment is not
protected and it is not
fenced.
The source is not clean and
it is surrounded by bushes,
natural vegetations and
needs a proper maintenance.
Required management
activities
Recapture the source,
introduce fences, and protect
the catchment area.
Establish a water diversion
ditch and rehabilitate the
spring.
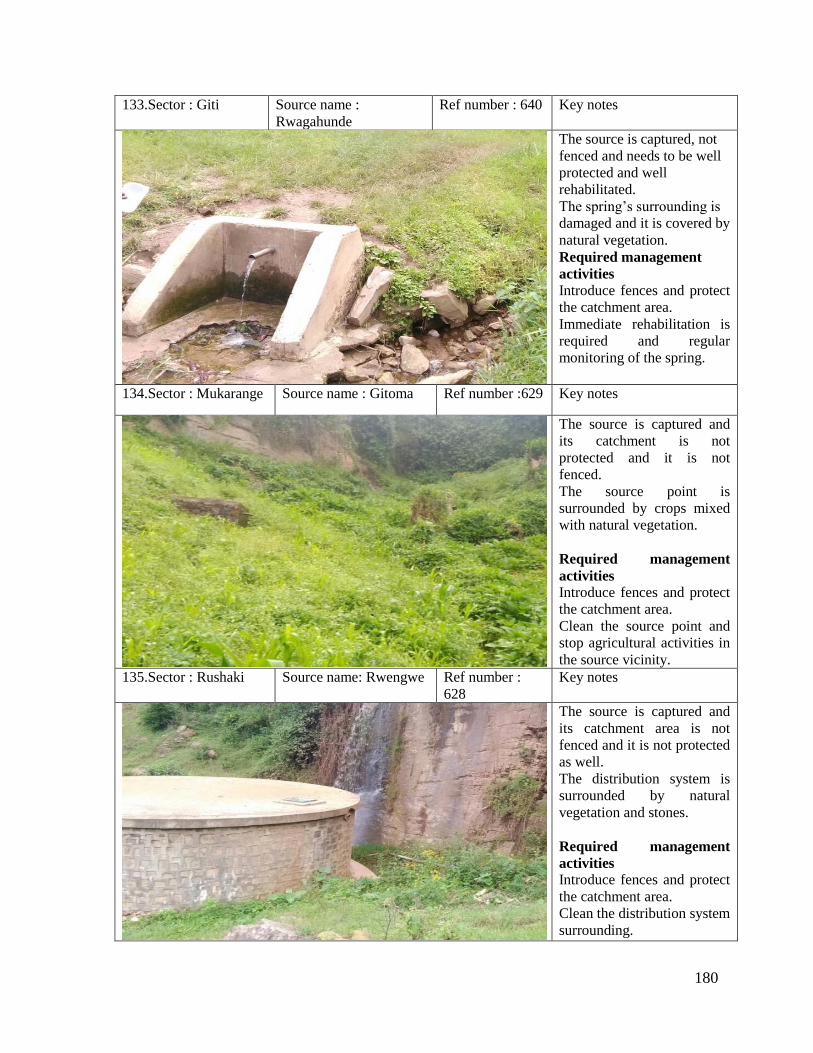
180
133.Sector : Giti Source name :
Rwagahunde
Ref number : 640 Key notes
The source is captured, not
fenced and needs to be well
protected and well
rehabilitated.
The spring’s surrounding is
damaged and it is covered by
natural vegetation.
Required management
activities
Introduce fences and protect
the catchment area.
Immediate rehabilitation is
required and regular
monitoring of the spring.
134.Sector : Mukarange Source name : Gitoma Ref number :629 Key notes
The source is captured and
its catchment is not
protected and it is not
fenced.
The source point is
surrounded by crops mixed
with natural vegetation.
Required management
activities
Introduce fences and protect
the catchment area.
Clean the source point and
stop agricultural activities in
the source vicinity.
135.Sector : Rushaki Source name: Rwengwe Ref number :
628
Key notes
The source is captured and
its catchment area is not
fenced and it is not protected
as well.
The distribution system is
surrounded by natural
vegetation and stones.
Required management
activities
Introduce fences and protect
the catchment area.
Clean the distribution system
surrounding.
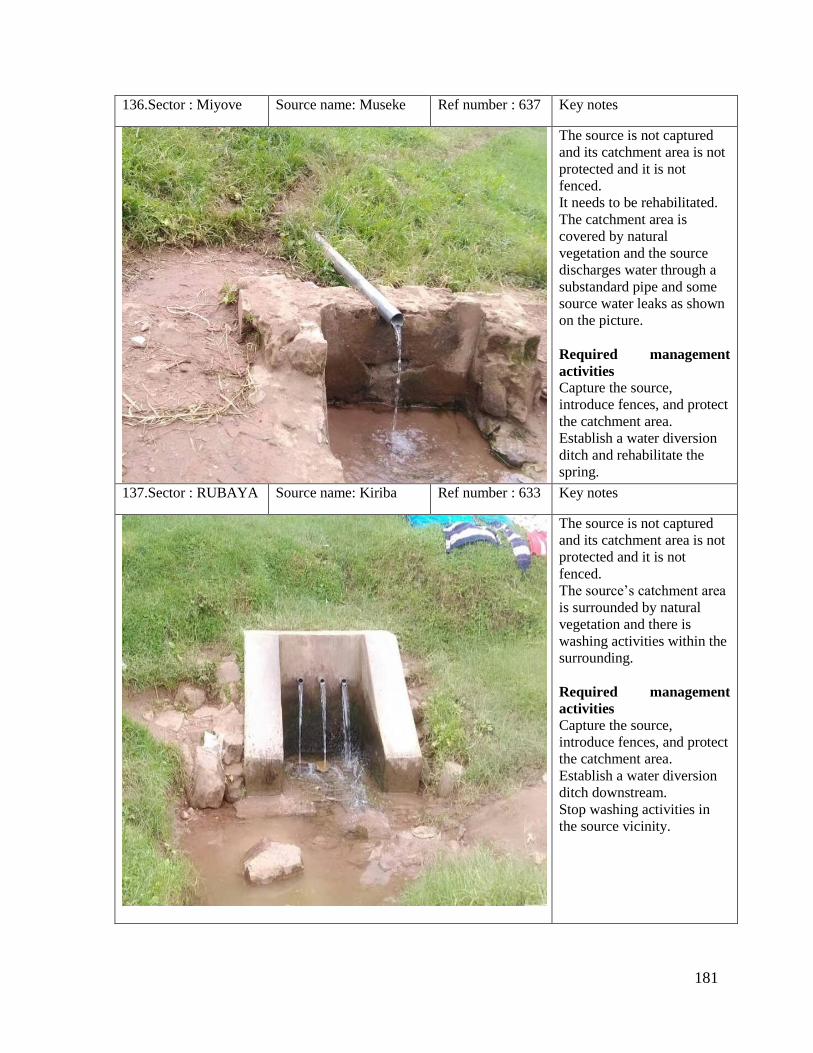
181
136.Sector : Miyove Source name: Museke Ref number : 637 Key notes
The source is not captured
and its catchment area is not
protected and it is not
fenced.
It needs to be rehabilitated.
The catchment area is
covered by natural
vegetation and the source
discharges water through a
substandard pipe and some
source water leaks as shown
on the picture.
Required management
activities
Capture the source,
introduce fences, and protect
the catchment area.
Establish a water diversion
ditch and rehabilitate the
spring.
137.Sector : RUBAYA Source name: Kiriba Ref number : 633 Key notes
The source is not captured
and its catchment area is not
protected and it is not
fenced.
The source’s catchment area
is surrounded by natural
vegetation and there is
washing activities within the
surrounding.
Required management
activities
Capture the source,
introduce fences, and protect
the catchment area.
Establish a water diversion
ditch downstream.
Stop washing activities in
the source vicinity.

182
138.Sector: Kaniga Source name : Ku rutare Ref number : 623 Key notes
The catchment area is not
protected and it is not
fenced.
The source is not clean and
it is covered by the bushes
and natural vegetation.
Required management
activities
Introduce fences and
protect the catchment area.
Clean the source properly.
139.Sector: Mutete Source name : Gahondo Ref number: 624 Key notes
The source is not fenced
and its surrounding is not
clean.
The source is not captured
and its discharge water is
clean.
Required management
activities
Recapture the source,
establish the catchment
area, introduce fences, and
protect the catchment area.
Maintain and clean the
source properly.

183
Appendix 4. Gicumbi Springs and their discharges
SN Source name Discharge (L/S) Sector cell Village x y z Status
1 Burindi 1 0.15 Cyumba Muhambo Centre 500825.94 4834106.52 2047.00 Captured
2 Burindi 2 0.25 Cyumba Muhambo Rugerero 501360.57 4834382.82 1950.00 Captured
3 Gashija 0.20 Cyumba Nyakabungo Gashija 500931.53 4838569.49 1929.00 Not captured
4 Bulindi 3 2.50 Cyumba Nyakabungo Ryamuromba 501177.17 9834372.57 1965.00 Captured
5 Bulindi 4 0.25 Cyumba Muhambo Rugerero 501014.38 4834182.83 1946.00 Captured
6 Bulindi 5 0.25 Cyumba Nyaruka Burindi 502649.66 4834203.72 1844.00 Not captured
7 Ruboroga (Gatuna) 1 0.41 Kaniga Nyarwambu Cyasaku 503386.97 4842668.52 1966.99 Captured
8 Ruboroga (Gatuna) 2 0.20 Kaniga Nyarwambu Cyasaku 503407.66 4842668.41 1970.40 Captured
9 Gitaba 1.20 Manyagiro Remera Gitaba 497781.86 4829796.68 2189.71 Captured
10 Nyarukombe I 0.73 Manyagiro Nyarukombe Ryaruyumba 499945.00 9830527.00 1905.00 Not captured
11 Rusebeya 1 0.40 Manyagiro Rusebeya Nyiravuza 500591.00 9830169.00 1859.00 Not captured
12 Nyarukombe II 0.20 Manyagiro Nyarukombe Ryaruyumba 500250.00 9830551.00 1909.00 Not captured
13 Rusebeya 2 0.07 Manyagiro Rusebeya Nyiravuza 501116.00 9828458.00 1848.00 Not captured
14 Rubindi1 0.15 Manyagiro Kabuga Rubindi 50119.00 983054.00 1894.00 Captured
15 Rubindi 2 0.25 Manyagiro Kabuga Rubindi 50120.00 983051.00 1889.00 Captured
16 Rwungo 1 0.80 Manyagiro Remera Shyigura 497784.20 4829819.01 2173.49 Captured
17 Rwungo 2 1.50 Manyagiro Remera Shyigura 497234.30 4830788.54 2159.87 Captured
18 Rwungo 3 1.20 Manyagiro Remera Shyigura 497227.74 4830768.53 2156.62 Captured
19 Rwungo 4 Manyagiro Remera Shyigura 497362.48 4830687.71 2145.61 Captured
20 Rwungo 5 Manyagiro Remera Shyigura 497199.47 4830733.04 2154.78 Captured
21 Murehe 1 0.11 Manyagiro Kabuga Murehe 502632.96 4831442.53 1854.96 Not captured
22 Murehe 2 0.03 Manyagiro Kabuga Murehe 502632.74 4831440.43 1856.20 Not captured
23 Mubuga 1 (Burera) 0.10 Bungwe Tumba Mubuga 496334.00 9832149.00 2241.00 Not captured
24 Mubuga 2 (Burera) 0.10 Bungwe Tumba Mubuga 496389.00 9832252.00 2217.00 Not captured
25 Mubuga 3 (Burera) 0.10 Bungwe Tumba Mubuga 496378.00 9832234.00 2226.00 Not captured
26 Mubuga 4 (Burera) 0.15 Bungwe Tumba Mubuga 496355.00 9832175.00 2234.00 Not captured
27 Nyarukore (Burera) 0.12 Bungwe Tumba Mubuga 498144.80 4832789.21 2012.23 Not captured
28 Mbanda 0.17 Bungwe Tumba Nyarukore 497761.48 4831795.01 2098.98 Not captured
29 Kwa Sebukangaga (Burera) 0.10 Bungwe Tumba Mubuga 496174.78 4832040.45 2278.99 Captured
30 Kwa Bigimbo (Burera) 0.15 Bungwe Tumba Mubuga 496190.80 4832285.57 2254.94 Captured
31 Mukoto 0.45 Bungwe Tumba Nyarukore 496465.00 9832438.00 2182.00 Not captured
32 Kavure 1 0.09 Manyagiro Rusekera Kavure 496571.00 9832365.00 2183.00 Not captured
33 Kavure 2 0.18 Manyagiro Rusekera Kavure 496641.00 9832449.00 2167.00 Not captured

184
SN Source name Discharge (L/S) Sector cell Village x y z Status
34 Kavure 3 0.10 Manyagiro Rusekera Kavure 496935.00 9832482.00 2148.00 Not captured
35 Kavure 4 0.40 Manyagiro Rusekera Kavure 496961.00 9832471.00 2151.00 Not captured
36 Kagorogoro 0.30 Bungwe Bungwe Gatenga 497699.00 9832086.00 2085.00 Not captured
37 Rwambeho 1 0.47 Nyankenke Butare Rwambeho 499474.61 4822958.64 2039.69 Captured
38 Rwambeho 2 0.25 Nyankenke Butare Rwambeho 499634.00 9823432.00 2020.00 Captured
39 Kigogo Nyankenke Butare Rwambeho 499389.00 9823236.00 2043.00 Not captured
40 Gatare 0.20 Nyankenke Yaramba Mwenyi 499907.00 9825851.00 1941.00 Captured
41 Source kwa Fabien 0.16 Manyagiro Nyiragifumba Rurambi 500034.00 9826818.00 1886.00 Not captured
42 Gashumba 0.05 Nyankenke Yaramba Nyarubuye 500825.00 9827163.00 1855.00 Not captured
43 Gatare 0.43 Nyankenke Yaramba Mwenyi 499971.74 4825570.82 1973.08 Captured
44 Kivugiza 1 Byumba Kivugiza Kivugiza 502416.00 9827793.00 1889.00 Not captured
45 Kivugiza 2 Byumba Kivugiza Kivugiza 502420.00 9827748.00 1886.00 Not captured
46 Sehuku 0.23 Byumba Kivugiza Kivugiza 503075.53 4826822.50 1773.33 Not captured
47 Nyiragice 0.20 Byumba Kivugiza Kivugiza 502741.07 4827039.50 1836.32 Not captured
48 Ndungutse 0.16 Byumba Kivugiza Kivugiza 502479.70 4827108.50 1834.74 Not captured
49 Gatare 0.14 Byumba Kivugiza Karambi 502468.13 4827454.00 1875.47 Captured
50 Kavure 0.20 Byumba Kivugiza Karambi 501854.39 4827893.00 1846.23 Not captured
51 Gatuku 0.22 Byumba Kivugiza Mugando 501566.55 4829327.50 1824.61 Not captured
52 Nyamusangwa 0.32 Byumba Kivugiza Mugando 502472.71 4829228.50 1848.19 Not captured
53 Runyenyeri 0.29 Byumba Kivugiza Kivugiza 503823.44 4826957.45 1887.00 Not captured
54 Kabere 1 0.60 Nyankenke Butare Kabere 500664.70 4821996.84 2106.05 Captured
55 Kabere 2 0.40 Nyankenke Butare Kabere 500584.00 4822000.00 2088.00 Captured
56 Ku itare Nyankenke Butare Gikombe 499460.03 4822939.51 2061.73 Captured
57 Museke (RuhogaIi) 1.80 Miyove Gakenke Museke 500318.00 9819985.00 2005.00 Captured
58 Remera 1 0.30 Miyove Gakenke Remera 500029.00 9819889.00 1952.00 Captured
59 Remera 2 0.30 Miyove Miyove Remera 500031.00 9819890.00 1958.00 Captured
60 Nyarubande 2 0.60 Miyove Gakenke Remera 500136.00 9820228.00 2034.00 Captured
61 Mureko 1 2.20 Miyove Mubuga Rutovu 495347.00 4824399.00 2151.00 Not captured
62 Mureko 2 0.05 Miyove Mubuga Mubuga 502358.24 4831075.79 2120.46 Not captured
63 Kidogo 1.20 Miyove Miyove Mukaka 496953.00 4820731.00 2009.00 Not captured
64 Maya 1.43 Miyove Miyove Mukaka 496654.29 4820647.93 1870.41 Not captured
65 Kadogo 1 2.00 Miyove Miyove Mukaka 496826.00 9820991.00 2019.00 Not captured
66 Kadogo 2 1.00 Miyove Miyove Mukaka 496566.00 9820950.00 1871.00 Not captured
67 Kiryango 0.45 Miyove Murambo Miyove 497517.00 9819994.00 1935.00 Not captured
68 Kwa Shondori 0.10 Miyove Miyove Mukaka 496485.17 4820751.75 1844.95 Not captured
69 Mukadogo 0.19 Miyove Miyove Mukaka 496943.13 4820737.82 1989.61 Not captured
70 Museke 1.09 Miyove Gakenke Museke 500431.32 4819694.72 2011.00 Not captured
71 Nyakagera II 0.60 Kaniga Gatoma Nyakagera 506159.00 4844901.00 1992.00 Captured

185
SN Source name Discharge (L/S) Sector cell Village x y z Status
72 Rugarama 1.50 Kaniga Gatoma Rugarama 507932.00 4844919.00 1898.00 Captured
73 Gashiru 0.50 Kaniga Gatoma Gashiru 507074.00 4842400.00 1960.00 Captured
74 Rwabona / Rukurura 0.50 Kaniga Rukurura Ngabira 508471.67 4843274.74 1980.34 Captured
75 Nyakibande 0.30 Kaniga Nyakibande Gatoma 507227.00 4844012.00 1828.00 Not captured
76 Cyasaku Kaniga Nyarwambu Cyasaku 503318.64 4842522.91 1949.73 Captured
77 Nyangorogoro 0.80 Kaniga Nyarwambu Nyamabare 502922.18 4842987.51 1959.17 Captured
78 Nyakega Kaniga Nyarwambu Kabeza 502983.13 4840743.61 1889.51 Captured
79 Ruhita 1 1.41 Kaniga Mulindi Ruhita 503413.97 4839863.74 1892.84 Not captured
80 Ruhita 2 0.20 kaniga Mulindi Ruhita 503431.55 4839873.36 1896.99 Captured
81 Kanyega 1.15 Kaniga Mulindi Ruhita 503446.23 4839660.52 1877.17 Not captured
82 Kinyogo 0.56 Kaniga Mulindi Rukizi 504035.07 4838167.68 1880.66 Not captured
83 Rutaha 0.28 Kaniga Mulindi Kagorogoro 504147.56 4837855.55 1876.27 Not captured
84 Rutare 0.13 Kaniga Gatoma Nyakagera 506287.17 4844726.68 1984.00 Not captured
85 Runoni 0.17 Kaniga Gatoma Nyakagera 506171.51 4844907.76 1990.00 Not captured
86 Ku ibuye/ Rugarama 1.50 Kaniga Gatoma Rugarama 507930.56 4844931.43 1895.00 Captured
87 Ku musigiti 0.01 Kaniga Gatoma Nyakibande 507534.92 4843690.20 1829.00 Not captured
88 Bikurungu 0.09 Kaniga Gatoma Nyakibande 507241.82 4843566.06 1839.00 Not captured
89 Kurutare 0.20 Kaniga Gatoma Gashiru 507070.63 4842409.12 1948.00 Captured
90 Nyakagezi 0.32 Kaniga Kamutora Mabare 513454.07 4836170.69 2011.00 Not captured
91 Gitoma 1.00 Mukarange Rugeshi Mutarama 504895.00 4834582.00 1873.00 Captured
92 Rwengwe 1.60 Mukarange Mugina Gatenga 509270.00 4835493.00 1938.00 Captured
93 Kagusa 2.50 Mukarange Kiyorwa Gatenga 510532.00 4833935.00 1902.00 Captured
94 Kiruhura 0.45 Mukarange Kariba Kiruhura 506851.00 4837943.00 1899.00 Captured
95 Gatare 1.20 Mukarange Kabungo Rusambya 507295.00 4836277.00 1882.00 Not captured
96 Kagane 1 0.40 Mukarange Kagane Rusambya 508270.00 4838898.00 1955.00 Not captured
97 Kagane 2 0.30 Mukarange Kagane Rusambya 507863.00 4838415.00 1941.00 Not captured
98 Kagane 3 0.10 Mukarange Kagane Rusambya 507809.00 4838309.00 1941.00 Not captured
99 Burema 0.60 Mukarange Karambo Gitega 511853.00 4835061.00 1853.00 Not captured
100 Rwengwe 1.60 Mukarange Gatenga Nyange 509312.19 4835206.59 1924.00 Captured
101 Gitoma 1.00 Mukarange Mutarama Rugeshi 504992.57 4834280.64 1891.00 Captured
102 Kiruhura 0.45 Mukarange Kiruhura Kariba 506429.85 4837835.44 1840.00 Captured
103 Gahama 1.08 Muko Rwamutembe Cyamuhinda 523961.00 9809309.00 1701.00 Captured
104 Rudogo 1 0.30 Muko Kimpongo Ngange 525312.00 9811658.00 1738.00 Not captured
105 Rudogo 2 0.10 Muko Kimpongo Ngange 525318.00 9811628.00 1736.00 Not captured
106 Nyarubande 0.30 Muko Mayora Ngange 527059.00 9810504.00 1619.00 Not captured
107 Rugaragara 0.30 Muko Kigoma Cyerere 521043.00 9812053.00 1797.00 Not captured
108 Bahene 0.60 Muko Kigoma Cyerere 521100.00 9811885.00 1833.00 Not captured
109 Kidogo 1 0.28 Muko Ngange Kimpongo 525380.32 4811347.12 1755.08 Not captured
110 Kidogo 2 0.12 Muko Ngange Kimpongo 525358.52 4811331.09 1754.45 Not captured

186
SN Source name Discharge (L/S) Sector cell Village x y z Status
111 Gahama 1.08 Muko Cyamuhinda Rwamitembe 522697.81 4809973.32 1708.22 Captured
112 Butyazo 0.70 Ruvune Kagasha Gashirira 519432.85 4820927.85 1845.35 Captured
113 Rwimilindi 1 0.19 Ruvune Cyandaro Kigarama 520758.74 4818873.32 1685.04 Not captured
114 Rwimilindi 2 0.80 Ruvune Cyandaro Kigarama 520769.09 4818867.02 1684.71 Captured
115 Byimana 0.90 Nyamiyaga Rugarama Jamba 519249.00 9815990.00 1858.00 Captured
116 Kabingo 0.66 Ruvune Gashirira Nyarurama 504807.12 4824074.07 1803.01 Not captured
117 Kagomero 0.60 Ruvune Cyandaro Nyankokoma 522495.59 4817945.96 1652.62 Captured
118 Gahondo 0.79 Mutete Nyarubuye Gitega 510330.45 4812007.37 1787.00 Captured
119 Gahondo 0.40 Mutete Karama Mutandi 507216.00 9815682.00 1886.00 Not captured
120 Marumba 0.22 Mutete Karama Mutandi 510369.35 4806251.36 1789.82 Not captured
121 Kagombero 0.34 Mutete Rugarama Nyarubuye 510330.00 9812007.00 1787.00 Not captured
122 Nyamutenga 1 0.50 Mutete Rukondo Musenyi 510323.00 9811365.00 1706.00 Not captured
123 Nyamutenga 2 2.00 Mutete Rukondo Musenyi 510354.00 9811348.00 1716.00 Not captured
124 Nyamutenga 3 1.20 Mutete Rukondo Musenyi 510333.00 9811265.00 1706.00 Not captured
125 Rusave 0.34 Mutete Kabeza Kagarama 515727.92 4803295.30 1521.09 Not captured
126 Rwimbogo 3.00 Mutete Kabeza Kabasega 511756.46 4807487.28 1643.67 Captured
127 Kariku 1 0.29 Mutete Nyarubuye Nkenzi 509182.14 4813930.57 1890.00 Not captured
128 Kariku 2 0.20 Mutete Nyarubuye Nkenzi 509096.00 9814228.00 1863.00 Captured
129 Nyamata 1.00 Mutete Gaseke Runyinya 511925.37 4807932.63 1601.90 Captured
130 Maganga 0.50 Mutete Mutandi Kamaganga 507610.56 4817017.67 1805.43 Captured
131 Source Kibingwe Kisaro Murama Kibingwe 501965.00 9821559.00 2059.00 Captured
132 Gasoko Kisaro Murama Kisaro 501647.00 9820957.00 2088.00 Captured
133 Ryamubuga Kisaro Murama Kisaro 502044.00 9821171.00 2042.00 Captured
134 Muyoboke Kisaro Murama Kisaro 502456.00 9821209.00 2046.00 Captured
135 Kibingwe Kisaro Murama Kisaro 502637.00 9820860.00 2063.00 Captured
136 Mwendo / Kabahura 0.02 Nyankenke Rwagihura Kabahura 512015.97 4816574.45 1992.70 Not captured
137 Kibingwe2 Kisaro Murama Kibingwe 502622.00 9820595.00 2062.00 Captured
138 Source Kabahura Nyankenke Rwagihura Kabahura 501978.00 9821624.00 2046.00 Captured
139 Gahondo 0.23 Rukomo Kinyami Gahondo 510632.55 4821508.78 1874.07 Captured
140 Gatare 0.40 Rukomo cyuru sabira 513978.00 9818645.00 1948.00 Captured
141 Rwamabuye 0.20 Rukomo Munyinya Kabuga 514130.00 9819350.00 1910.00 Captured
142 Karitushi 1 0.30 Rukomo Mabare Kanyiramana 511531.73 4824718.53 1794.45 Captured
143 Karitushi 2 0.20 Rukomo Mabare Kanyiramana 510758.00 9824393.00 1884.00 Captured
144 Kariba 1 Rukomo Kinyami Kariba 513138.08 4820790.31 1789.88 Captured
145 Kariba 2 Rukomo Kinyami Kariba 513224.54 4820905.74 1882.32 Captured
146 Kariba 3 source Rukomo Kinyami Kariba 513138.00 9821210.00 1883.00 Not captured
147 Mugomero 0.05 Rukomo Cyuru Sabiro 515004.58 4816537.78 1982.51 Not captured
148 Kadogo 0.20 Rukomo Mabare Kanyiramana 511321.77 4824767.52 1794.44 Captured
149 Nyakagezi 2 3.13 Rwamiko Cyeru Nyagasozi 521676.47 4802684.99 1556.97 Not captured

187
SN Source name Discharge (L/S) Sector cell Village x y z Status
150 Yogi Source Rutare Gasharu yogi 519828.00 9808215.00 1882.00 Not captured
151 Gakeri 2 1.00 Rutare Gasharu yogi 519842.00 9808158.00 1858.00 Not captured
152 Gahama 1.50 Bukure Rwesero Nyarubira 521658.87 4800371.75 1615.44 Captured
153 Cyakabari 0.37 Bukure Kivumu Butare 526521.57 4797008.33 1498.62 Captured
154 Gatoki source 0.56 Bukure Kivumu Butare 526065.00 9797900.00 1566.00 Not captured
155 Nangurugomo 1.00 Bukure Kivumu Butare 526048.40 4797743.65 1585.47 Not captured
156 Kanyinya source 0.20 Bukure Kivumu Karushya 525702.00 9798409.00 1597.00 Not captured
157 Kareranyana source 0.20 Bukure Kivumu Karushya 525668.00 9798489.00 1615.00 Not captured
158 Kiruhura 0.91 Bukure Karenge Gasharu 522949.89 4800642.05 1625.26 Captured
159 Mugomero 0.10 Rukomo Gabiro Cyuru 514937.00 9816848.00 1996.00 Captured
160 Rwinyege 0.19 Rutare Bikumba Nyabisindu 519227.00 4813338.00 1786.00 Captured
161 Karangara 0.34 Rutare Bikumba Marembo 518322.00 4812674.00 1810.00 Captured
162 Karangara 2 0.17 Rutare Bikumba Nyabisindu 518669.00 4813071.00 1804.00 Captured
163 Kagugu 0.13 Rutare Bikumba Nyabisindu 518735.00 4813087.00 1804.00 Captured
164 Byimana 1 Nyamiyaga Jamba Byimana 519501.00 4814187.00 1820.00 Captured
165 Byimana 2 Nyamiyaga Jamba Byimana 519502.00 4814184.00 1819.00 Captured
166 Byimana 3 Nyamiyaga Jamba Byimana 519496.00 4814203.00 1818.00 Captured
167 Karangara 0.24 Rutare Bikumbu Marembo 518326.44 4812677.94 1811.12 Not captured
168 Nyamabuye 1 4.17 Nyamiyaga Cyuru Karengo 513979.77 4816834.93 1968.55 Not captured
169 Nyamabuye 2 0.60 Nyamiyaga Cyuru Karengo 512694.89 4816519.79 1834.80 Captured
170 Nyamabuye 3 3.00 Nyamiyaga Cyuru Maya 512338.00 9816685.00 1767.00 Not captured
171 kanyabagabo 1.20 Nyamiyaga Mataba Kabeza 515090.00 9814043.00 1919.00 Captured
172 Nyiraruzenga 1 0.31 Kageyo Kabuga Gatobotobo 509672.53 4816069.50 1806.77 Captured
173 Nyiraruzenga 2 0.22 Kageyo Kabuga Gatobotobo 509715.16 4816084.00 1812.00 Not captured
174 Nyiraruzenga 3 0.05 Kageyo Kabuga Gatobotobo 509782.03 4816116.00 1823.64 Captured
175 Nyiraruzenga 4 0.30 Kageyo Kabuga Murama 509664.00 9816312.00 1793.00 Captured
176 Nyaruvumu 0.23 Kageyo Gihembe Nyaruvumu 509158.00 9823217.00 2021.00 Not captured
177 Munini 1 0.15 Kageyo Gihembe Munini 509288.00 9823393.00 1995.00 Not captured
178 Munini 2 0.16 Kageyo Gihembe Munini 509287.00 9823384.00 1979.00 Not captured
179 Rwunga 2.00 Kageyo Kamanyundo Muhondo 509894.00 9818365.00 1856.00 Not captured
180 Muhondo 1 0.10 Kageyo Muhondo Muhondo 509116.00 9818030.00 1814.00 Not captured
181 Kagwa 1 0.20 Kageyo Muhondo Kagwa 509328.00 9819292.00 1939.00 Not captured
182 Kagwa 2 0.47 Kageyo Muhondo Kagwa 509379.72 4818936.00 1907.12 Not captured
183 Kagwa 3 0.70 Kageyo Muhondo Kagwa 509310.00 9819172.00 1898.00 Not captured
184 Muhondo 2 0.15 Kageyo Kangwa Muhondo 508256.00 9818605.00 1819.00 Not captured
185 Mugomero 1 2.17 Kageyo Horezo Nyirangoga 510988.91 4818851.46 1796.28 Not captured
186 Mugomero 2 0.42 Kageyo Horezo Nyirangoga 510982.79 4818860.31 1986.62 Not captured
187 Rutikanga 0.20 Kageyo Muhondo Kagwa 508255.00 9818611.00 1823.00 Not captured
188 Gahanda 0.70 Kageyo Gihembe Gitaba 508803.00 9822303.00 2017.00 Not captured

188
SN Source name Discharge (L/S) Sector cell Village x y z Status
189 Kabageshi 1 2.44 Kageyo Gihembe Munini 509092.03 4822836.83 2070.69 Not captured
190 Kabageshi 2 0.19 Kageyo Gihembe Nyaruvumu 509320.47 4823005.77 2032.91 Not captured
191 Kabageshi 3 Kageyo Gihembe Gitaba 508803.00 9822203.00 1980.00 Captured
192 Gahondo 2.08 Kageyo Gihembe Gitaba 508862.34 4822174.00 1982.06 Not captured
193 Nyakabingo 0.26 Kageyo Gihembe Gitaba 508652.72 4821988.50 1970.23 Not captured
194 Munini 3 0.61 Kageyo Muhondo Kamanyundo 509375.25 4818869.50 1899.84 Not captured
195 Rwunga 2.22 Kageyo Muhondo Kamanyundo 509969.25 4818048.50 1878.43 Not captured
196 Gikuku 1 0.47 Kageyo Kabuga Mukennye 509610.44 4817898.00 1843.06 Not captured
197 Gikuku 2 0.45 Kageyo Muhondo Mwange 509395.13 4817956.50 1837.76 Not captured
198 Gikuku 3 0.19 Kageyo Muhondo Mwange 509180.16 4817727.50 1825.77 Not captured
199 Mwange source 0.16 Kageyo Muhondo Mwange 508932.81 4817407.50 1805.53 Not captured
200 Kabingo Byumba Kivugiza Kabingo 503281.89 4829017.30 1912.00 Not captured
201 Nyamusanga 0.25 Byumba Kivugiza Mugando 502398.00 9829537.00 1855.00 Not captured
202 Kivugiza 1 0.30 Byumba Kivugiza Kivugiza 503008.00 9827116.00 1875.00 Not captured
203 Kivugiza 2 Byumba Kivugiza Kivugiza 504189.00 9827307.00 1921.00 Not captured
204 Kivugiza 3 Byumba Kivugiza Kivugiza 504185.00 9827369.00 1926.00 Not captured
205 Runyenyeri Byumba Kivugiza Kivugiza 504224.00 9827331.00 1928.00 Not captured
206 Miriku Byumba Kivugiza Kabingo 503281.07 4829019.50 1904.06 Captured
207 Nyakagezi 0.37 Byumba Kivugiza Kabingo 502572.96 4828811.00 1921.57 Not captured
208 Ruramba 1 Manyagiro Ruramba Nyiragifumba 499993.00 9826814.00 1898.00 Captured
209 Ruramba 2 Manyagiro Ruramba Nyiragifumba 499987.00 9826854.00 1906.00 Captured
210 Gihanga 1 0.40 Byumba Kivugiza Kabingo 503304.49 4829452.28 1937.00 Not captured
211 Gihanga 2 1.00 Byumba Kivugiza Kabingo 503136.00 9829682.00 1884.00 Not captured
212 Kabingo 0.30 Byumba Kivugiza Kabingo 503267.00 9829375.00 1911.00 Not captured
213 Nyangezi 0.35 Byumba Nyamabuye Rwabukoko 506247.00 9825773.00 2030.00 Not captured
214 Nkurunziza Anastasie 0.22 Byumba Nyamabuye Rwabukoko 506215.00 9825650.00 2040.00 Not captured
215 Nizeyimana 0.35 Byumba Nyamabuye Rwabukoko 506151.00 9825696.00 2022.00 Not captured
216 Karake 0.21 Byumba Nyamabuye Rwabukoko 505745.00 9825612.00 2003.00 Not captured
217 Muzaribara 0.36 Byumba Nyamabuye Rwabukoko 505619.00 9825617.00 1998.00 Not captured
218 Rwabukoko Byumba Nyamabuye Rwabukoko 505519.00 9825622.00 1986.00 Not captured
219 Rwabukoko Byumba Nyamabuye Rwabukoko 505351.00 9825575.00 1969.00 Not captured
220 Mukankusi 0.34 Byumba Gisuna Ruhashya 505211.00 9825564.00 1974.00 Not captured
221 Ruhogo 0.41 Byumba Gisuna Ruhaskya 505210.00 9825631.00 1962.00 Not captured
222 Nyakagezi 0.90 Byumba Gisuna Ruhashya 504713.00 9825900.00 1896.00 Not captured
223 Nyakagezi 2 0.49 Byumba Gisuna Ruhashya 504605.00 9825892.00 1888.00 Not captured
224 Nyamabuye 1 & 2 0.44 Byumba Nyamabuye Mugomero 506076.00 9826913.00 2020.00 Captured
225 Source 3 Byumba Murama Gacaca 506190.00 9826957.00 2024.00 Captured
226 Source 4 0.20 Byumba Murama Gacaca 506169.00 9826981.00 2022.00 Captured
227 Source 5 1.00 Byumba Murama Gacaca 506162.00 9827019.00 2023.00 Captured
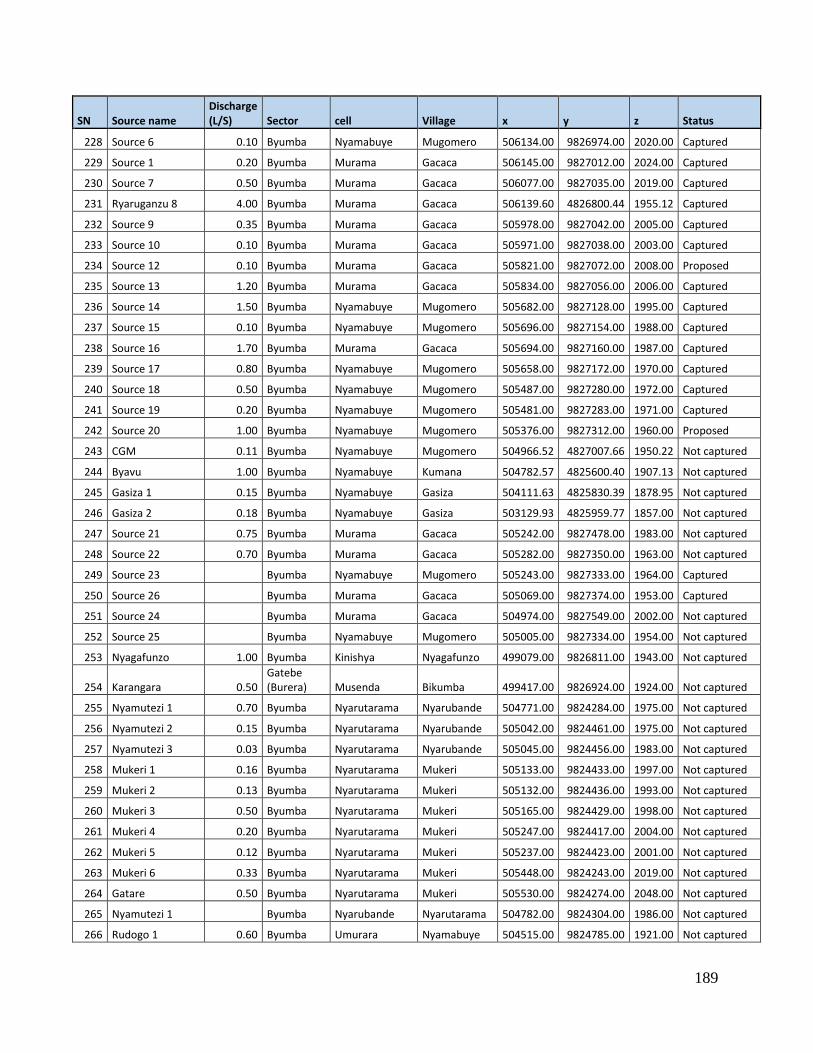
189
SN Source name Discharge (L/S) Sector cell Village x y z Status
228 Source 6 0.10 Byumba Nyamabuye Mugomero 506134.00 9826974.00 2020.00 Captured
229 Source 1 0.20 Byumba Murama Gacaca 506145.00 9827012.00 2024.00 Captured
230 Source 7 0.50 Byumba Murama Gacaca 506077.00 9827035.00 2019.00 Captured
231 Ryaruganzu 8 4.00 Byumba Murama Gacaca 506139.60 4826800.44 1955.12 Captured
232 Source 9 0.35 Byumba Murama Gacaca 505978.00 9827042.00 2005.00 Captured
233 Source 10 0.10 Byumba Murama Gacaca 505971.00 9827038.00 2003.00 Captured
234 Source 12 0.10 Byumba Murama Gacaca 505821.00 9827072.00 2008.00 Proposed
235 Source 13 1.20 Byumba Murama Gacaca 505834.00 9827056.00 2006.00 Captured
236 Source 14 1.50 Byumba Nyamabuye Mugomero 505682.00 9827128.00 1995.00 Captured
237 Source 15 0.10 Byumba Nyamabuye Mugomero 505696.00 9827154.00 1988.00 Captured
238 Source 16 1.70 Byumba Murama Gacaca 505694.00 9827160.00 1987.00 Captured
239 Source 17 0.80 Byumba Nyamabuye Mugomero 505658.00 9827172.00 1970.00 Captured
240 Source 18 0.50 Byumba Nyamabuye Mugomero 505487.00 9827280.00 1972.00 Captured
241 Source 19 0.20 Byumba Nyamabuye Mugomero 505481.00 9827283.00 1971.00 Captured
242 Source 20 1.00 Byumba Nyamabuye Mugomero 505376.00 9827312.00 1960.00 Proposed
243 CGM 0.11 Byumba Nyamabuye Mugomero 504966.52 4827007.66 1950.22 Not captured
244 Byavu 1.00 Byumba Nyamabuye Kumana 504782.57 4825600.40 1907.13 Not captured
245 Gasiza 1 0.15 Byumba Nyamabuye Gasiza 504111.63 4825830.39 1878.95 Not captured
246 Gasiza 2 0.18 Byumba Nyamabuye Gasiza 503129.93 4825959.77 1857.00 Not captured
247 Source 21 0.75 Byumba Murama Gacaca 505242.00 9827478.00 1983.00 Not captured
248 Source 22 0.70 Byumba Murama Gacaca 505282.00 9827350.00 1963.00 Not captured
249 Source 23 Byumba Nyamabuye Mugomero 505243.00 9827333.00 1964.00 Captured
250 Source 26 Byumba Murama Gacaca 505069.00 9827374.00 1953.00 Captured
251 Source 24 Byumba Murama Gacaca 504974.00 9827549.00 2002.00 Not captured
252 Source 25 Byumba Nyamabuye Mugomero 505005.00 9827334.00 1954.00 Not captured
253 Nyagafunzo 1.00 Byumba Kinishya Nyagafunzo 499079.00 9826811.00 1943.00 Not captured
254 Karangara 0.50 Gatebe (Burera) Musenda Bikumba 499417.00 9826924.00 1924.00 Not captured
255 Nyamutezi 1 0.70 Byumba Nyarutarama Nyarubande 504771.00 9824284.00 1975.00 Not captured
256 Nyamutezi 2 0.15 Byumba Nyarutarama Nyarubande 505042.00 9824461.00 1975.00 Not captured
257 Nyamutezi 3 0.03 Byumba Nyarutarama Nyarubande 505045.00 9824456.00 1983.00 Not captured
258 Mukeri 1 0.16 Byumba Nyarutarama Mukeri 505133.00 9824433.00 1997.00 Not captured
259 Mukeri 2 0.13 Byumba Nyarutarama Mukeri 505132.00 9824436.00 1993.00 Not captured
260 Mukeri 3 0.50 Byumba Nyarutarama Mukeri 505165.00 9824429.00 1998.00 Not captured
261 Mukeri 4 0.20 Byumba Nyarutarama Mukeri 505247.00 9824417.00 2004.00 Not captured
262 Mukeri 5 0.12 Byumba Nyarutarama Mukeri 505237.00 9824423.00 2001.00 Not captured
263 Mukeri 6 0.33 Byumba Nyarutarama Mukeri 505448.00 9824243.00 2019.00 Not captured
264 Gatare 0.50 Byumba Nyarutarama Mukeri 505530.00 9824274.00 2048.00 Not captured
265 Nyamutezi 1 Byumba Nyarubande Nyarutarama 504782.00 9824304.00 1986.00 Not captured
266 Rudogo 1 0.60 Byumba Umurara Nyamabuye 504515.00 9824785.00 1921.00 Not captured

190
SN Source name Discharge (L/S) Sector cell Village x y z Status
267 Rudogo 2 Byumba Umurara Nyamabuye 504510.00 9824859.00 1919.00 Not captured
268 Gate 0.50 Byumba Gatete Nyamabuye 504273.00 9825002.00 1900.00 Not captured
269 Nyarukombe 0.59 Manyagiro Nyarukombe Ryaruyumba 500025.26 4830235.85 1909.60 Not captured
270 Nyambare 1 0.73 Manyagiro Nyarukombe Ryaruyumba 499725.00 9831489.00 2037.00 Not captured
271 Nyambare 2 0.15 Manyagiro Nyarukombe Ryaruyumba 499640.00 9831405.00 2014.00 Not captured
272 Nyambare 3 0.20 Manyagiro Nyarukombe Ryaruyumba 499639.00 9831410.00 2003.00 Not captured
273 Source 26 0.60 Manyagiro Rusekera Gakubo 499037.00 9831212.00 1963.00 Not captured
274 Source 27 1.50 Manyagiro Rusekera Gakubo 499039.00 9831166.00 1970.00 Not captured
275 Nyaruvumu 0.23 Kageyo Gihembe Nyaruvumu 509158.00 9823217.00 2021.00 Not captured
276 Munini 4 0.15 Kageyo Gihembe Munini 509288.00 9823393.00 1995.00 Not captured
277 Munini 5 0.16 Kageyo Gihembe Munini 509287.00 9823384.00 1979.00 Not captured
278 Nyarubande 1.00 Byumba Nyarutarama Rugandu 504857.08 4824000.43 2027.15 Captured
279 Gatoki 0.80 Cyumba Nyakabungo Gashija 500746.00 9838982.00 1880.00 Captured
280 Kirimbi 2.50 Rubaya Gishambashayo Gasharu 498115.25 4833991.26 2012.00 Captured
281 Kinyamukana 0.40 Rubaya Nyamiyaga Mariba 498279.00 9835332.00 2048.00 Not captured
282 Karambo 0.10 Rubaya Gishambashayo Karambo 498913.00 9835109.00 1914.00 Not captured
283 Runaba 0.10 Rubaya Gihanga Runaba 499430.00 9835598.00 1904.00 Not captured
284 Ryagashyashya 3.00 Rubaya Gihanga Gomba 499550.27 4836957.17 1865.00 Captured
285 Mu Rutare (kwa Cyiza) 0.40 Rubaya Nyamiyaga Kabeza 499380.00 9836069.00 1885.00 Not captured
286 Mugote 1 (Gishari cell) 0.30 Rubaya Gishari Mugote 500179.00 9838820.00 1827.00 Not captured
287 Mugote 2 0.13 Rubaya Gishari Mugote 500278.00 9838959.00 1830.00 Not captured
288 Kiriba 1.50 Rubaya Muguramo Mabare 498787.13 4839477.76 1832.00 Captured
289 Mabare 1.20 Rubaya Mabare Muguramo 498355.00 9839614.00 1929.00 Not captured
290 Bureranyana 3.50 Rutare Gatwaro Bureranyana 520892.50 4809859.07 1803.01 Captured
291 Kanyama 1 0.48 Giti Murehe Kababito 527248.00 9803321.00 1685.00 Not captured
292 Kanyama 2 0.16 Giti Murehe Butare 507145.36 4790903.38 1665.98 Not captured
293 Rushinya 1.00 Giti Gatobotobo Kabacuzi 524432.00 9806102.00 1744.00 Not captured
294 Ruhondo 1.82 Giti Murehe Gatare 526109.43 4805178.83 1673.57 Not captured
295 Nyakagezi 0.50 Giti Gatobotobo Kababito 525912.00 9805823.00 1674.00 Not captured
296 Karuseke 1.60 Muko Mwendo Kirengo 524303.00 9807792.00 1696.00 Not captured
297 Rwagahunde 0.42 Giti Gatobotobo Matyazo 521781.27 4807668.63 1894.00 Not captured
298 Rutovu 1 1.00 Shangasha Kitazigurwa Rugarama 510386.00 9829619.00 1933.00 Not captured
299 Rutovu 2 0.50 Shangasha Kitazigurwa Rugarama 510448.00 9829616.00 1945.00 Not captured
300 Kibumba 0.20 Shangasha Kitazigurwa Gacyamo 510028.00 9829680.00 1954.00 Not captured
301 Rutovu 3 0.40 Shangasha Kitazigurwa Rugarama 510404.00 9830340.00 1914.00 Not captured
302 Kabayi 3 3.00 Shangasha Kitazigurwa Rugarama 510678.00 9830515.00 1936.00 Not captured
303 Bikumba 1 0.25 Shangasha Nyabubare Bikumba 510463.00 9830706.00 1906.00 Not captured
304 Harama/Kabayi 2 0.30 Shangasha Kitazigurwa Iharama 510540.00 9830843.00 1905.00 Not captured
305 Bikumba 2 0.50 Shangasha Nyabubare Bikumba 510526.00 9830887.00 1895.00 Not captured

191
SN Source name Discharge (L/S) Sector cell Village x y z Status
306 Harama 2 2.00 Shangasha Kitazigurwa Iharama 510622.00 9830990.00 1893.00 Not captured
307 Irembo1 1.00 Shangasha Nyabubare Nyamiyaga 510643.00 9831080.00 1886.00 Not captured
308 Irembo2 0.30 Shangasha Nyabubare Nyamiyaga 510642.00 9831081.00 1886.00 Not captured
309 Nyakagezi 1 0.26 Shangasha Nyabishambi Gasiza 508712.00 9829872.00 1971.00 Not captured
310 Kabarungi 0.20 Shangasha Nyabishambi Gasiza 508477.00 9830080.00 1932.00 Not captured
311 Nyakagezi 2 0.60 Shangasha Nyabishambi Gasiza 508259.00 9830125.00 1923.00 Not captured
312 Mugomero 0.50 Shangasha Nyabishambi Gasiza 509197.00 9830110.00 1942.00 Not captured
313 Gatare 0.44 Shangasha Nyabishambi Matyazo 509727.49 4827379.75 1902.00 Not captured
314 Kazabagarura 0.10 Shangasha Nyabishambi Matyazo 509926.00 9827722.00 1920.00 Not captured
315 Nyirankotsa 0.30 Shangasha Nyabishambi Matyazo 510058.00 9827737.00 1922.00 Not captured
316 Nyakabingo 1 0.15 Shangasha Bushara Nyakabingo 508541.60 4831867.51 1886.83 Captured
317 Nyakabingo 2 0.10 Shangasha Bushara Nyakabingo 508516.56 4831861.88 1903.17 Captured
318 Kinono 0.50 Shangasha Nyabubare Karuhanga 509338.00 9832516.00 1911.00 Not captured
319 Bisika 0.30 Shangasha Nyabubare Irembo 509333.00 9832055.00 1945.00 Not captured
320 Nyakabingo 3 Shangasha Bushara Bushara 508517.57 4831861.32 1889.66 Captured
321 Nyakabingo 4 Shangasha Bushara Gasura 508395.62 4831929.21 1938.82 Captured
322 Kabayi 4 0.02 Shangasha Kitazigurwa Rugarama 510757.57 4830214.38 1946.99 Not captured
323 Kazirankurwe 0.32 Shangasha Nyabubare Nyamiyaga 510518.70 4830760.25 1929.32 Not captured
324 Kagomero 0.51 Bwisige Bwisige Rutoma 516247.00 9826372.00 1806.00 Not captured
325 Kanyirabuki 1 0.60 Bwisige Gihuke Kuwindege 515447.00 9828098.00 1820.00 Captured
326 Kanyirabuki 2 0.20 Bwisige Kuwindege 515505.00 9827909.00 1806.00 Not captured
327 Kanyirabuki 3 0.30 Bwisige Kuwindege 515489.00 9827929.00 1813.00 Captured
328 Kanyirabuki 4 0.20 Bwisige Murehe 515385.00 9828017.00 1812.00 Not captured
329 Kanyirabuki 5 0.10 Bwisige Murehe 515427.00 9828104.00 1816.00 Not captured
330 Ruhondo 1 0.50 Shangasha Kitazigurwa Mubuga 510308.00 9828284.00 1899.00 Captured
331 Ruhondo 2 0.40 Shangasha Mubuga 510307.00 9828291.00 1900.00 Captured
332 Ruhondo 3 0.30 Shangasha Mubuga 510356.00 9828264.00 1889.00 Captured
333 Kigaga 2.00 Bwisige Mukono Murambi 510547.49 4795925.62 1818.09 Not captured
334 Rwangabo 4.00 Bwisige Gihuke Kumunini 516230.24 4827353.66 1854.25 Captured
335 Nyakabungo 0.10 Bwisige Nyakabungo 518704.00 9825614.00 1593.00 Not captured
336 Ryaruganzu 1 0.55 Bwisige Nyabushingitwa Musayo 512902.00 9831224.00 1880.00 Captured
337 Ryaruganzu 2 0.75 Bwisige Nyabushingitwa Musayo 512976.53 4830918.34 1903.52 Captured
338 Kagorogoro 0.09 Bwisige Bwisige Rutoma 515896.52 4826916.40 1870.78 Captured
339 Kanyirabuki 0.60 Bwisige Gihuke Kuwindege 515511.48 4827788.11 1830.84 Captured
340 Cyarugarama 0.30 Rushaki Karurama Nyaruhanga 507676.00 9841677.00 1967.00 Captured
341 Kabakene 0.40 Rushaki Kamutora Nkamba 510863.00 9839666.00 1884.00 Captured
342 Nyakene 0.15 Rushaki Kamutora Kabuga 512329.87 4838163.35 1933.00 Captured
343 Kamutora 0.30 Rushaki Kamutora Kamutora 512182.16 4836650.26 1867.00 Captured
344 Kivomo 2.50 Mukarange Cyamuganga Burambira 509224.00 4837233.72 1939.52 Captured
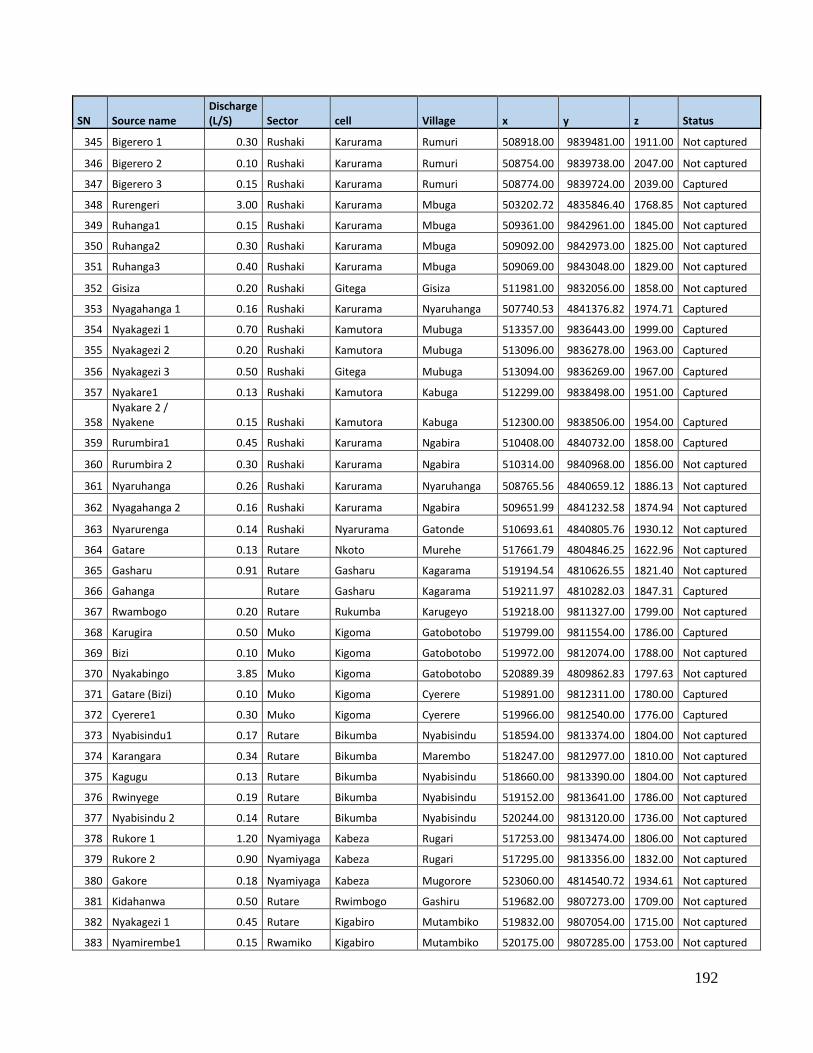
192
SN Source name Discharge (L/S) Sector cell Village x y z Status
345 Bigerero 1 0.30 Rushaki Karurama Rumuri 508918.00 9839481.00 1911.00 Not captured
346 Bigerero 2 0.10 Rushaki Karurama Rumuri 508754.00 9839738.00 2047.00 Not captured
347 Bigerero 3 0.15 Rushaki Karurama Rumuri 508774.00 9839724.00 2039.00 Captured
348 Rurengeri 3.00 Rushaki Karurama Mbuga 503202.72 4835846.40 1768.85 Not captured
349 Ruhanga1 0.15 Rushaki Karurama Mbuga 509361.00 9842961.00 1845.00 Not captured
350 Ruhanga2 0.30 Rushaki Karurama Mbuga 509092.00 9842973.00 1825.00 Not captured
351 Ruhanga3 0.40 Rushaki Karurama Mbuga 509069.00 9843048.00 1829.00 Not captured
352 Gisiza 0.20 Rushaki Gitega Gisiza 511981.00 9832056.00 1858.00 Not captured
353 Nyagahanga 1 0.16 Rushaki Karurama Nyaruhanga 507740.53 4841376.82 1974.71 Captured
354 Nyakagezi 1 0.70 Rushaki Kamutora Mubuga 513357.00 9836443.00 1999.00 Captured
355 Nyakagezi 2 0.20 Rushaki Kamutora Mubuga 513096.00 9836278.00 1963.00 Captured
356 Nyakagezi 3 0.50 Rushaki Gitega Mubuga 513094.00 9836269.00 1967.00 Captured
357 Nyakare1 0.13 Rushaki Kamutora Kabuga 512299.00 9838498.00 1951.00 Captured
358 Nyakare 2 / Nyakene 0.15 Rushaki Kamutora Kabuga 512300.00 9838506.00 1954.00 Captured
359 Rurumbira1 0.45 Rushaki Karurama Ngabira 510408.00 4840732.00 1858.00 Captured
360 Rurumbira 2 0.30 Rushaki Karurama Ngabira 510314.00 9840968.00 1856.00 Not captured
361 Nyaruhanga 0.26 Rushaki Karurama Nyaruhanga 508765.56 4840659.12 1886.13 Not captured
362 Nyagahanga 2 0.16 Rushaki Karurama Ngabira 509651.99 4841232.58 1874.94 Not captured
363 Nyarurenga 0.14 Rushaki Nyarurama Gatonde 510693.61 4840805.76 1930.12 Not captured
364 Gatare 0.13 Rutare Nkoto Murehe 517661.79 4804846.25 1622.96 Not captured
365 Gasharu 0.91 Rutare Gasharu Kagarama 519194.54 4810626.55 1821.40 Not captured
366 Gahanga Rutare Gasharu Kagarama 519211.97 4810282.03 1847.31 Captured
367 Rwambogo 0.20 Rutare Rukumba Karugeyo 519218.00 9811327.00 1799.00 Not captured
368 Karugira 0.50 Muko Kigoma Gatobotobo 519799.00 9811554.00 1786.00 Captured
369 Bizi 0.10 Muko Kigoma Gatobotobo 519972.00 9812074.00 1788.00 Not captured
370 Nyakabingo 3.85 Muko Kigoma Gatobotobo 520889.39 4809862.83 1797.63 Not captured
371 Gatare (Bizi) 0.10 Muko Kigoma Cyerere 519891.00 9812311.00 1780.00 Captured
372 Cyerere1 0.30 Muko Kigoma Cyerere 519966.00 9812540.00 1776.00 Captured
373 Nyabisindu1 0.17 Rutare Bikumba Nyabisindu 518594.00 9813374.00 1804.00 Not captured
374 Karangara 0.34 Rutare Bikumba Marembo 518247.00 9812977.00 1810.00 Not captured
375 Kagugu 0.13 Rutare Bikumba Nyabisindu 518660.00 9813390.00 1804.00 Not captured
376 Rwinyege 0.19 Rutare Bikumba Nyabisindu 519152.00 9813641.00 1786.00 Not captured
377 Nyabisindu 2 0.14 Rutare Bikumba Nyabisindu 520244.00 9813120.00 1736.00 Not captured
378 Rukore 1 1.20 Nyamiyaga Kabeza Rugari 517253.00 9813474.00 1806.00 Not captured
379 Rukore 2 0.90 Nyamiyaga Kabeza Rugari 517295.00 9813356.00 1832.00 Not captured
380 Gakore 0.18 Nyamiyaga Kabeza Mugorore 523060.00 4814540.72 1934.61 Not captured
381 Kidahanwa 0.50 Rutare Rwimbogo Gashiru 519682.00 9807273.00 1709.00 Not captured
382 Nyakagezi 1 0.45 Rutare Kigabiro Mutambiko 519832.00 9807054.00 1715.00 Not captured
383 Nyamirembe1 0.15 Rwamiko Kigabiro Mutambiko 520175.00 9807285.00 1753.00 Not captured

193
SN Source name Discharge (L/S) Sector cell Village x y z Status
384 Nyamirembe 2 0.20 Rwamiko Kigabiro Mutambiko 520220.00 9807329.00 1760.00 Not captured
385 Gaseke 1 0.62 Rwamiko Kigabiro Mutambiko 520405.15 4807192.52 1788.55 Not captured
386 Gaseke 2 0.20 Rwamiko Kigabiro Mutambiko 520349.00 9807567.00 1798.00 Not captured
387 Gaseke 3 0.30 Rutare Yugi Gasharu 520235.00 9807874.00 1838.00 Not captured
388 Gakeri 0.31 Rutare Gasharu Yogi 515118.83 4814587.85 1883.54 Not captured
389 Nyakagezi 1 0.15 Rwamiko Karangara Kigabiro 519831.00 9807012.00 1710.00 Not captured
390 Gakeri 1 1.20 Rwamiko Karangara Kigabiro 519846.00 9808156.00 1845.00 Not captured