reproduction sur papier ou sur format may be printed or ...
254
National Library I*I of Canada Bibliothèque nationale du Canada Acquisitions and Acquisitions et Bibliographie Services services bibliographiques 395 Wellington Street 395, rue Wellington Ottawa ON KI A ON4 Ottawa ON KI A ON4 Canada Canada Your Me Votre refertmce Our file Notre reterenw The author has granted a non- L'auteur a accordé une licence non exclusive licence allowing the exclusive permettant à la National Library of Canada to Bibliothèque nationale du Canada de reproduce, loan, distribute or sel1 reproduire, prêter, distribuer ou copies of this thesis in microfonn, vendre des copies de cette thèse sous paper or electronic formats. la forme de rnicrofiche/film, de reproduction sur papier ou sur format électronique. The author retains ownership of the L'auteur conserve la propriété du copyright in this thesis. Neither the droit d'auteur qui protège cette thèse. thesis nor substantial extracts kom it Ni la thèse ni des extraits substantiels may be printed or otherwise de celle-ci ne doivent être imprimés reproduced without the author's ou autrement reproduits sans son permission. autorisation.
-
Upload
khangminh22 -
Category
Documents
-
view
0 -
download
0
Transcript of reproduction sur papier ou sur format may be printed or ...

National Library I*I of Canada Bibliothèque nationale du Canada
Acquisitions and Acquisitions et Bibliographie Services services bibliographiques
395 Wellington Street 395, rue Wellington Ottawa ON KI A O N 4 Ottawa ON K I A ON4 Canada Canada
Your Me Votre refertmce
Our file Notre reterenw
The author has granted a non- L'auteur a accordé une licence non exclusive licence allowing the exclusive permettant à la National Library of Canada to Bibliothèque nationale du Canada de reproduce, loan, distribute or sel1 reproduire, prêter, distribuer ou copies of this thesis in microfonn, vendre des copies de cette thèse sous paper or electronic formats. la forme de rnicrofiche/film, de
reproduction sur papier ou sur format électronique.
The author retains ownership of the L'auteur conserve la propriété du copyright in this thesis. Neither the droit d'auteur qui protège cette thèse. thesis nor substantial extracts kom it Ni la thèse ni des extraits substantiels may be printed or otherwise de celle-ci ne doivent être imprimés reproduced without the author's ou autrement reproduits sans son permission. autorisation.

IDENTIFYNG AREAS OF CONCERN FOR REGIONAL CUh4LrLATIVE EFFECTS ASSESSMENTS [N AND AROUND NORTHERN NATIONAL PARKS
IN CANADA
b y
Jennifer L. Lenton
Bacl~eior of Science t h . (Biologj ). I.;rii\ ersit? oi'Ù'r=u Bruns\+ ick. I W S
THESIS
Submitted to the Department of Geogrnph? and Environnwntril Studies
in partial fiiltillmsnt of the requirenients for
hiasters in Environmenrd Studies (Gsogrripli>,)
Wiltiid Laurier Ilniversit!
2000
l2 Jennifer L. Lrnton. ZOO0

ABSTRACT
(lement. This thesis uses a literature review of protected areas selection. park mana,
comprehensive regional land use planning. and cumulative environmental effects and assessrnent
to develop a methodology that identifies areas with concentrations of social and/or scological
values in and around northern national parks.
The proposed methodology involves two stages. First. a database of values is drvslopcd b?
taking an inventory of social and ecoloijcal values tlirougli ss tensi~e literature revirus.
interviews. and consultation with the public. This database is thcn uscd in the second step to
deterniine areas with concentrations of wcial and/or txological I alues. or "~alilt' Ii~tspots". I I S I ~ ~
n series of tables and maps.
Oiice developed. the met ho do log^ is testcd u itli a case stiici> of the Grcater Kliianc Region in
southwest Yukon. This analysis identified t~elvc. value Iiotspots that contairi a Iiigli nuniber of
the study area's social and ecological values. [ t is s~tggrsted tlint these Ii»rspots ncrd to be yi\en
special consideration In future planning exercises alid \vIieii esplorin$ questions surrounding
cumulative environmental rffects arising in and around Klurine National Park and Reserve.
In light of the case study findings. rornr potential future applications in regional planning
exercises and in cumulative effects assessments are discussed. The prirnary recommended
planning application involves srtting development thresholds or limits of acceptable change for
the value hotspots so as to take a proactive stance on cumulative environmental rffects. In
addition. the values database would be useful in project-level environmental assessments. acting
as a checklist of local values.

ACKNOWLEDCLCIENTS
Many people have played an important role in hslping to complctr tliis tliesis. First. I ~ ~ o i i l d like
to thank my advisor Scott Slocombe for not only providing guidance and advice when 1 nttcded it.
but also for giving me the freedom that every graduate studrnt should enjoq. Also, 1 am \en
thankful for the privilege of esperiencing Yukon. tvhere 1 built many mernories tliat will last a
.-" - . - iirrritne. hian! i i iü i iL a i s~ ) go ILI juilrl Tiirbci-gt. loi- sigii111g ~ , i l its I I I > c u ~ l l ~ i i i k c I I I L ' I I I ~ ) C I . i t i t%t l>h
beiiig \\ illing to meet and disciiss the thesis. and ne\ er failing to pro\ ide iiisiplitfiil feedback. I nlso
appreciate the willinpncss of Roger Suftling and John Marsli to rend and coitirtieiit on rn?. tlicsis.
and for John Marsh to take the estra time to travel from Peterborough for the deferise.
Also. none of this research would have becn possible n.ithout gcnerous funding froiii tlie
Nattiral Sciences and Engineering Rcsearch Coiincil. the Nortliern Scienti tic Training Program. tlie
Social Sciences and Humanities Resertrcli Couricil. and \Vil frid Lriiiricr Clni~ersit>
1 would also like to thank t h é planners. managers aiid ~vardens in Whiteliarse and Haines
lunction - namely Ray Brennrman. Mark Ekliind. Tom Elliott. Brnoit Godin. David Henry. Ann
Landry. and Fritz Miieiler - who wrre willing to meet and discitss the applicability ofmy resenrcli
to their own work. 1 a m also very tliankftil for dl the help Ryan Danby provided. both as ri Yiikon
tour guide and GIS tutor.
I feel very fortunate to have had the continuous support of many friends. fellow graduate
students. and especially my family. A big tliank-you also gors to mlp husband. Marc. for Iiis
constant encounpment. making a great traveling companion. and always being rcady for an
adven ture.

Chapter 1 - lntroduction
1 . I Background 1.2 Goals and Objectives 1.3 Thesis Themes
1.3.1 Protected Areas Selection I .3 .? Northern Park Management 1.33 Comprelirnsiue Rrgional Land Use Planning . -- i -3.4 Cuniuiacive Environmentai t t tecrs and Assrssiiii=iit
1.4 Dct?nitions 1.5 Thesis Outline
Chnpter 2 - Literature Review 3.1 Protected Areas Selection
2.1.1 Naturai Areas Selection Criteriri wnient 2.2 Northern National Park Mana,
2.2.1 Ecological Integrity 1.1.2 Ecosystern-Based Management 2.3.3 Tlireats 7.3.4 Environniental Assessrnents 2.2.5 Monitoring
2.3 Cumprehrnsive Regional Land Lise Planning 2.3.1 Frame\\orhs 2 . 3 2 Challenges 2 - 3 3 Assessrnent and E\,aliirition 3 3.4 Links to Parks
2.4 Cumulative Environmental Effects and Assessrnent 2.4.1 Cumulative Environmentd Effects 2.4.2 Cumulative Environmental Assessrnent 2.4.3 hpproaches to Regional CEA 2.4.4 Assessrnent and Evriluation 2.4.5 Links to Parks
3.5 S u m m a p
Chapter 3 - Proposed Methodology 3.1 Theme interactions 3.2 Guiding Principles 3.3 Overview of Proposed Methodology
3.3.1 Justification 3 -3 2 Methodolo~y Dei elopment Stages
3.4 Step-by-Step Methodology Description 3 .4. 1 Stage 1 1: Creats Database of Values 3.4.2 Stage 2: Identify Value Hotspots
3.5 Sumrnriry

Chapter 4 - Case Study Background 4.1 Location 4.2 Ecological Aspects
4.2.1 Abiotic Features 4.2.3 Biotic Features
4.3 Social Aspects 43.1 Historical Land Use 4 - 3 2 Present Land Lise 4.3.3 Present Land Management
4.4 History of Park. Planning and Assessmtint Stiidies 4.4. i ?i.utcx~t.cj Ai.t.üs 31d f t i i i ~ ~ t i i id4ii~ti Xcsccil.cli
4.42 Land Use Plans 4.4.3 Environmcntal Impact Assessmcnts
4.5 Sumrtiary
Chapter 5 - Case Study Resiilts and Discussion 5 . I Case Study Boundaries 5 .Z Stage I : Create Database of Vnliics
5 2 . 1 Social Values 5 .2 .2 Ecological Values
5.3 Stage 2: Identif-" Value Hotspots 5.4 Cunclriding Remnrks
Cliapter 6 - Conclusions 6.1 Potential Future Applications 6.2 Case Study Implications 6.3 bletliodolopy Evaluation 6.4 Researcli Contribiittons 6.5 Future Rt.st.arcli 6.6 Tliesis Goals and Objecti~zs Revisitcrd 6.7 Concluding Rcmarks
Appendix 1 - Social and Ecological Values
Appendis 3 - Zone Boundaries and Rationale
Appendix 3 - Values Tabiilated per Zone
Appendis 4 - Zone Rankiys
Appendix 5 - Latin Names
References
Persona1 Commuoications Cited

LIST OF TABLES
Table 1.1 - Key Characteristics of Comprehensivs Regional Land Use Planning Table 1.2 - Definitions of Cumulative Environmental EtTects
Table 2.1 - Significant Ecological Criteria Table 2.2 - Selected Measures for Monitoring Ecological Inteerit' Table 2.3 - Framework for Assessing Ecological Integrit! TabIe 2.4 - Ten Dominant Themes Relevant to Ecosystem Management Table 2.5 - Stresses Causing Ecological Impacts In Yorthern National Parks - i abie 2.b - Evaiuation oiCKLüf Framcworks Table 2.7 - btethods for CEA Table 2.8 - CEA Steps for Canadian National Parks Table 2.9 - Evaluation of Regional CEA Frnmworks
Table 3.1 - Social Values Derived frorn Literriture Table 3.2 - Ecological Values Derived from Literaturt: Table 3.3 - Tabulating Social and Ecologicnl Values Table 3.4 - Determining Most Valuable Locations
Table 5. I - Key Information Sources for Social Valucs Table 5.2 - Keq Inforinritioii Sources for Ecological Values Table 5.3 - Value Hotspots. Ranked by Total Values per Zone Table 5.4 - Value Hotspots. Ranked b- Socini Values per Zone Table 5.5 - Value Hotspots. Ranked by Ecological Values per Zone Table 5.6 - Value Hotspots. Ranked b' rotai Values p u Arca pcr lune Table 5.7 - Valiie Hotspots. Ranked by Social Values per .-Ireri per Zone Table 5.8 - Value Hotspots. Ranked b> Ecological Vrilucs per Arca pcr Lone
Table 6.1 - Evaluation of Proposed Methodo l o g Applications
Box 3 . l - Guiding Principles for the Developrnent of the blethodolop Bos 3.2 - Guiding Principles for Potential Applications of Metliodolog~~

Figure 1.1 - Conceptual Map of Thesis i 5
Figure 2.1 - Monitoring Framework Figure 2.3 - Monitoring Framework for National Parks Figure 2.3 - Three Dimensions of Cumulative Environniental Efkcts Figure 2.4 - CEA Framework for Canadian National Parks Figure 2.5 - Conceptual Map of Thesis
i- igiire 3.1 - lnterrelatrons ri-mong tour I hesis I ticmes Figure 3.2 - Conceptual Map of Tliesis
Figure 1.1 - Greater Kluane Region. South~vest Yuhon Figure 4.2 - Conceptual bIap of Tlissis
Figure 5. 1 - Scatterplot of Social Values Versus Ecological Values 125 Figure 5.2 - Scatterplot of Social Values Per .-\rm Versus Ecological Values Per :\reri 139 Figure 5.3 - Conceptual Map of Thésis 119
blap 5.1 - Zones in the Greater Kluane Resion btap 5.2 - Spatial Distributton of Social and Ecologicril Values Map 5.3 - Spatial Distribution of Social Values Map 5.4 - Spatial Distribution of Ecological Values idap 5.5 - Spatial Distribution of Social nrid Eçological Valiies Ptir Area Map 5.6 - Spatial Distribution of Social Values Per Ares Map 5.7 - Spatial Distribution of Social and Ecologicnl Valiics Pcr Area

LIST OF ABBREVIATIONS
CAFN - Champagne and Aishihik First Nations
CEAs - Cumulative Effects Assessments
CEEs - Cumulative Environmental Effects
CORE - Commission on Rtlsources and Environment
Dl AN D - Urpanment ot Indian At tairs and Nortliern Üevelopmen~
DRR - Departnient of Renewable Rrsources
EA - Environmental Assessrnent
KFN - Kluane First Nation
KNPR - Kliirine National Park and Resen-e
KWS - Kliiane Wildliîè Sanctuan
LAC - Limits of Acceptable Change
LSRP - Lancaster Sound Regonal Land Use Plan
MDBSRP - Mackenzie Delta-Beaufort Sea Regrond Land Usc Plan
NLUP - Nortlwn Land Lise Plannint Process
OMNR - Ontario Ministry of Naturai Resources
SLU P - Strategic Land L'se Planning Process
VAMP - Visitor Activity Management Process
VECs - Valued Ecosystem Components
VSCs - Valued Socioeconomic Components
WRFN - White River First Nation
YTG - Yukon Territorial Government

--
1.1 BACKGROUND
The need to establish a nehvork of protected areas has been given considerable attention in
the past 20 years. Canada now has a variety of designated sites. nnging from national and
provincial parks to wildlife sancniaries and environmentally sensitive areas. 1 ndeed. Canada's
national parks are one of the country's greatest legacies which have unfolded - and continue to
expand - over the past century.
Management foci have clianged significantly since the establishment of Canada's first
national park in 1885. Early management concems included elirninating predators. suppressing
fires. conserving wildlife. and providing recreation facilities. There was little or no consideration
of surrounding land use practices. and most management effoons were focused within park
boundaries (CEAC. 199 1 : Nelson. 1979).
As more parks were established and adjacent developrnent activities continued to expand, it
became evident that national parks were at risk. This was primarily due ro ecolo%ically irrelevant
boundaries and poor to nonexistent coordination and cooperation on management issues between
protected areas managers and neighbors on adjacent lands. These weaknesses led to the adoption
of a more regional. ecosystem-based management approach which encouraged the planning and
management of national parks within a regional context. Indeed. it is now commonly accepted
that "establishing protected areas in isolation from regional planning and decision-making
processes is not an effective way to ensure the maintenance of their long-term ecological
integrity" (CEAC, 199 1 : 39).

INTRODUCTION 2
This more regional view encornpasses larger space and time scales than traditional
management approaches. Consequently. it is important to consider the impacts arising from al1
activities iocated both inside and outside park boundaries. In addition. it is important to consider
the interactions arnong these stressors since they may combine in space and time in an additive or
.yiier&tic iiiaiiiier. T;is~s diiüiniilii i i~ii~ noüld i ~ ~ ~ l i iïi iumülaiivc enrirûiïmcn;al effcia
(CEEs). al lowing seemingly harm less. small scale developments to have n signiticant negative
impact on park ecosystems (Spaling, 1994).
The Panel on the Ecological Integrity of Canada's National Parks States that although park
staff recognize the importance of understanding CEEs. limited resources have resulted in a tocus
on srnail-scale effects. As a result, cumulative and landscape b e l effects are not well addressed
in current park planning and management practices. indeed. of 36 national parks surveyed in
19%- 1996.2 1 reponed severe or major CEEs. and 14 reponed significant or minor CEEs. Only
1 park reported no CEEs. and only 3 parks reported that the overall trend was decreasing (Parks
Canada, 1998).
Although most of the national parks sustaining major and severe CEEs are located in southern
Canada. many northern parks reported signi ficant CEEs (eg. Au lavik. Ivvavi k. Kluane. Nahanni.
Wood Buffalo). Since northern ecological systems are quite sensitive to human disturbance and
the impacts of adjacent land use activities are becoming increasingly more significant (Parks
Canada. 1998), it is irnpentive that managers of northem parks learn a lesson from the southem
parks and take a proactive stance on regional management and CEEs. By addressing adjacent
land uses and acknowledging the potential for CEEs before any substantial damage is done to

INTRODUCTION 3
park ecosystems. Canada's northern parks can continue to protect Canada's natural heritage for
future generations.
Herein lies the motivation for this study. The purpose of this thesis is to develop a
iiietiiuduiugy Cui- illeiiiifj ing arcas ùf cüntèiii Mr rcgiûiiûl c ü m ü I ~ î i x sffcctâ zuxssmcn;s in and
around northern national parks. This work dso addresses the need to "detemine how to manage
the increasing flow of development requests as a way of limitinç cumulative effects" as
recommended by the Panel un the Ecological Integrity of Canada's National Parks (Parks
Canada, 2000: 13.1 7).
The methodology is developed by integrating aspects of protected areas selection. northem
national park management. comprehensive regional land use planning, and cumulative
environmental effects and assessment. A case study of the application of the methodology as well
as a discussion of its potentinl future applications in regional land use planning and cumulative
effects assessrnents is also included.
An overview of thesis goals and objectives (section 1.2) and a brief introduction to sorne of
the major tliemes encountered througliout this thesis (section 1.3) are provided below. Some key
terms used throughout the thesis are then defined (section 1 A), and an outline of the thesis
(section 1.5) presented.
1.2 GOALS AND OBJECTIVES
Three main goals have been identified for this thesis. They are: (1) develop a m e t h o d o l o ~ for
identifying areas of concem for regional cumulative effects assessments in and around nonhem

- . -. . . .
national parks: (2) test the method through a case study: and (3) discuss some potential
applications of the methodology in regional planning exercises and cumulative effects
assessments.
The ';rn pz! I ~ Y O ! X S d e v t ! i p k g 2 methcdo!cgy h r ~ i ! ! h e ! ~ p ! i xe rc 2nd rn~nz-rc O - - - nf - -
nonhem national parks to take a proactive stance on minimizing CEEs. Specific objectives are:
i. place the consideration of CEEs in nonhern parks within the literature of protected areas
selection, national park management. comprehensive regional land use planning. and cumulative
environmental effects and assessment: and
ii. develop a list of çuiding principles to evaluate strengths and weaknesses of the rnethodology.
The second goal involves testing the proposed rnethod through a case study application in the
Greater Kluane Region in southwest Yukon. This location is ideal for the case study as it
contnins a large national park with significant ecological diversity and CEEs are becorning an
increasing concern (Parks Canada. 1998). Speci fic objectives are:
i. identify key social and ecological aspects of the Greater Kluane Region by reviewing
documents and reports; and
ii . create maps as tools for summarizing existing information and making data available to a
broad audience.
The third and final goal of this thesis is to discuss some potential applications of the
rnethodology in regional planning exercises and cumulative effects assessments. Specific
objectives of this goal are:
i. discuss the potential application of the methodology in regional land use planning exercises;

i i . discuss the potential application of the methodology in cumulative effects assessrnents;
iii. discuss implications of the case study; and
iv. evaluate strengths and weaknesses of the methodology based on predetermined guiding
principles.
1.3 THESE THEMES
There are four main themes that require a brief introduction to demonstrate the context and
significance of the current study: protectrd areas selection. northem national park management.
comprehensive regional land use planning, and cumulative environmental ef ic ts and assessment.
Although these themes are not commonly tied together. when integrated they can forrn a solid
foundation for planning parks in a reçional context in order to minimize potttntial CEEs.
First. a general introduction to the key themes in the literature on selecting protected areas is
provided (section 1.3.1 ). The benetïts of and need for northem parks are then outlined. and key
aspects of national park management are bighlighted (section 1.32). Comprehensive regional
land use planning is then defined. followed by a discussion of its application around national
parks (section 13.3). Finally. cumulative environmentai effects and assessments are defined and
discussed within the context of national parks (section 1.3.4).
1 1 PROTECTED AREAS SELECTION
Protected areas provide ecological, educational. scientific. economic. and culturaVspiritua1
benefits. Examples include maintaining essential ecological processes. promoting a deeper
understanding and respect for nature, recreation, acting as benchmarks for scientific studies.

- -
preserving genetic stocks for economic purposes (eg. medicines), and strengthening cultural
identity and heritage values (CEAC, 199 1).
As economic development continues to expand, it is becoming increasingly important that a
cuiiiplsic iysteiii ùf pïf i ic i id axas bi: t h ~ l y cazblished. 'v'riiiûii~ aüdics h î ~ c bccn carricd vü;
on criteria for selecting these protected areas. including studies on the selection of natunl areas
(reviewed by Smith and Therbege, 1986). environmenrally sensitive areas (Eagles. 1980).
environmentaily significant areas (Theberge et ai., 1980). and national parks (Parks Canada.
1994). In addition. studies on ecological boundary considerations (Theberp. 1989) also provide
some insight into appropriate locations and dimensions of protected areas. Each of these stiidies
is reviewed in Chapter 2.
1 J.2 NORTHERN PARK MANAGEhIENT
Canada's national parks are selected based on their level of representation of specific national
park natural regions (see section 2.1 for details). In the northem territories. there are currently
nine openting terrestrial national parks and park reserves. There are also other protected areas
such as territorial parks. heritage rivers. special management areas. bird sanctuaries. habitat
protection areas. and national wildlife areas (Figure 1.1; New Parks North. 1999). Although only
national parks are discussed in this thesis. it is important to note that thrse other parks and
protected areas are also valuable.
Northem national parks are particularly important because they contain sensitive ecosystems
which are highiy susceptible to human damage and require long recovery periods. In addition.
they display a wildemess character with minimal human impacts to date. They also play an

INTRODUCTION 7
important role in maintaining northern culture. as rnany wildlife populations sustained by these
parks are critical for subsistence hunting and fishing across the North.
Due to the numerous values associated with northern parks, it is desirable to maintain them in
a3 na;ural a s:r;:c as ;icssiU!e. To r c x h this grz!, It Is cfir:: necessxy tc 5222ge ! x m n x t iv i tk s
in and around these parks. Generally, management approaches in national parks use a
conservation science framework to maintain ecohgical inregriy. This is accomplished through
the empioyment of ecosystem-bmed munagemenr, which considers threats to park ecosystems
arising from internai and extemal sources. Impacts are considered through environmenrd
~zssessmenrs, after which nroniioring programs are estciblished to ensure the maintenance of
ecological integrity (Parks Canada. 1999). Each of these topics is discussed in detail in Chapier
3.
1.3.3 COMPREHENSIVE REGIONAL LAND USE PLANNING
Since many large northem wildlife species are wide-ranging (eg. wolverines. bears. wolves)
or migratory (eg. salmon. caribou. waterfowl), they often move outside park boundaries in search
of habitat suitable for various stages of their life cycle. Consequently. it is necessary not only to
manage and pian within park boundaries, but to expand the scope to include the surroundings in
which the park is located. One potential approach to viewing parks in a broader context is
through comprehensive regional land use planning (CRLUP).
CRLUP is a planning process that uses specific objectives or a desired future state based on
public values to direct the allocation of land among multiple stakeholders in a particular region
(Brown, 1996; Fenge, 1987). It goes beyond single-purpose functional planning to integnte

environmental, economic, and social objectives at provincial, sub-provincial, and local ievels to
f o m a strategic plan which directs dl subsequent land use planning within the area towards the
desired vision (Branch, 1998: Brown, 1996).
Dut- tu large spatx and timè scalès and thc d j i~an~ iz i~riiürè uf th2 èrï~irüiiii~ei~i, ciiicci~àiiiij,
risk. and arnbiguity are inherent to this process. CRLUP is therefore a continuous and flexible
process in which review and feedback are integral components (Branch. 1998). The most
fundamental characteristics of CRLUP are surnmarized in Table 1.1.
Table 1.1 - Key Characteristics of Comprehensive Regional Land Use Planning (sozrrce: Hodge, 1998: Brown. 1996: Richardson, 1989).
identib strategies to attain these goals.
Characteristic Direction seeking
Expianation Establishes visions and objectives at the outset, and designs plans to
Interactive and interest driven
Encourages stakehoider involvement to determine regional issues and concerns.
Anticipatory Antic ipates future issues before they arise.
Comprehensive Inteçrates social, economic, social. and environmental objectives.
Compiex Involves Iarge geographic areas, multiple governmental jurisdict ions, and dynamic natural systems.
Continuous Achieves continuity over time I
Issues-focused
C learIy de fined roles
Ernphasizes on the most promising solutions to key issues.
Specities the roles and responsibilities of each çroup of actors.
Time conscious Sets reasonable time limits and is aware of constraints.
Flexible and adaptive
Accepts uncertainty, recognizes that the environment is dynamic, and responds to unanticipated events and information as they arise.

These chawcteristics of CRLUP make it a useful tool for viewing parks in a regional context.
In particular. the focus on a predeterrnined vision or set of objectives for a region could help
focus on the ultimate goal of maintaining ecological inteçrity in and around national parks.
Furthemore, the comprehensiveness of CRLUP is amenable to the application of ecosystem-
hzsx! mmrgement r d rhc ccmiderzticr? cf rcgicnr! thrrrs. 3!5z!zin.ir.g r regicm! vi~?1:
through processes such as CRLUP is extrernely important, since scienti fic research has
demonstrated that ecological integrity in parks depends largely on natural processes in areas
surrounding parks (Nelson. 1993).
1.3.4 CUMULATIVE ENVIRONMENTAL EFFECTS A i ASSESSMENT
When working with the broad spatial and temporal scales invoived in CRLUP, interactions
among reçional stressors become more apparent. Additive and synergistic interactions give rise
to cumulative environmental effects (CEEs). These CEEs have been defined in ;i number of
different ways. Table 1.2 presents some more commonly cited definitions. In general, al1 CEE
definitions refer to the same concept: the presence of muitiple stressors interacting in space and
time in an additive or synergistic manner to have a cumulntively significant impact.
CEEs can be detected. evaluated, and possibiy m itigated through cumulative effects
assessments (CEAs). Many authors (CEAWG, 1999: Dias & Chinery, 1994; Spaling & Smit,
1994: Davies, 1993; Peterson er al., 1987; Sonntag et al., 1987) have identified hvo approaches
to CEAs: project assessments and regional assessrnents. At the project level. a CEA is used as a
type of environmental impact messment. It is viewed as a scientific information gathering
activity where the primary focus tends to be on examining the impacts of one project, while
considering any potentiai interactions with past, existing, and tùture projects. Project-level CEAs

are generally carried out in the following manner. First, the scope of the assessments is narrowed
through identification of issues, valued ecosystem components. and system boundaries. Potential
environmental impacts on valued ecosystem components are then analyzed, and possible
mitigation measures identified. The significance of these potential impacts is then evaluated.
,"iscsçrncnts a!sc usuz!!y h:lt 3 hri!t-ir, fL'!!w: ZF. in ~ h k h the XCWX;' cf the rssessment is
evaluated (CEAWG, 1999). At the project level, CEA is "considered distinct from planning and
decision-making, but linked to it through information tlow" (Spaling & Smit. 1994).
Table 1.2 - Definitions of Cumulative Environmental Effects.
Source Definition J.S. Council " ... the incremental impact of the action when added to other past. present. l n and reasonably foreseeable future actions. .. Cumulative impacts can result Snvironment tiorn individually minor but collectively significrint actions taking place over Juality. 1978 a period of tirne."
Vlachos, 1983 ". . . integration of effects of al1 curent and rertsonably foreseeable actions over time and space.. . and . . . three interrelated conceptual dimensions . . . aggregntive [sum of effects] . . . interactive [how effects interact]. . . diaclironic [how effects overlap in tirne] . .."
Dickert and "Cumulative impacts are those that result from the interactions of many Tuttle. 1985 incremental activities. each of which may have an insignificant effect when
viewed alone, but which become cumulatively significant when seen in the aggregate."
Sonntag et al., ". . . impacts on the natural and social environment which ( 1 ) occur so 1987 frequently in time or so densely in space that they cannot be 'assimilated', or
(2) combine with effects of other activities in a synergistic rnanner."
Davies, 1991 "... the combined effects of al1 rictivities in an area over time; and the 1 incrernental effects associûted with individual projects in an area over time."
Spaling and ". . .the phenomenon of temporal and spatial accumulation of change in Smit, 1993 environmental systems in an additive or interactive manner."
Sly, 1994 ".. . collective effects of rnany individual, multiple, and interactive forms of stress over tirne."
CEAWG, ". . . changes to the environment that are caused by an action in combination

Conversely, regional level assessments consider CEAs as integral parts of proactive
environmental planning (Spaling & Smit, 1994). The public are usually consulted to determine
social regional characteristics or valued ecosystem componeots at the start of the process. Public
input is also used to identiS, maximum acceptable levels of environmental change and regional
:h:zsh~!ds, :: rcgicnu! wci..irw nc! considerd In r n r n k r -J !eue! CE.45. ThIr: frarnewwk ii then
used in conjunction with land use plans to judge the acceptability of proposed projects and
activities, and to rnake tradeoffs between environmental, social. and economic objectives (Dias Sr
Chinery, 1994: Eccles rf al., 1994). Thus, regional level assessments extend "beyond the
analytical function of information collection. analysis. and interpretation to also include value
setting. rnulti-goal orientation and participatory decision-making" (Spaling & Srnit. 1994).
Indeed. it is widely accepted that regional CEAs rire "essential to identifiing cumulative effects
at a regional scale" (Slocornbe. 1994) and necessary for "rneaningfully assessing potentiai
cumulative effects" (Dias and Chinery. 1 994).
Since the purpose of this thesis is to address the issue of regional CEEs around northem
national parks, further CEA discussions will focus on these regional level CEAs.
CEEs rnay be significant sources of environmental change and may ultirnately lead to the
degradation of park ecosystems if not planned for and mitigated in advance. To address this
concem, sevenl national parks have already carried out CEAs in anempt to incorponte CEEs
into park management procedures (eg. Kluane National Park, Kouchibouguac National Park).

1.4 DEFINITIONS
Before proceeding, definitions for three key terrns used throughout the remainder of the thesis
must be given. First. sorne clarification regarding the term "regional" is required. This term is
often confusing as regions can be considered at multiple scales. with the hierarchical scale
invc!ved inei i tn l?!~ nficting the rpsults cf a ~ i d y The nctual <cale tiqed n l w varie%
tremendously with particular case studies and the goals and objectives of the research. Thus.
tliroughout this thesis, "region" or "regionai" is only used to encompass the broad notion of any
bounded geognphical area which is used in planning and management applications. When
discussing a bounded area in the context of 3 particular case study. the term "study area" is used
to avoid any confusion.
Definitions rnust also be provided for social values and ecological values. For the purposes of
this thesis. social values rire defmed as activities, species. and locations of particular importance
to members of the cornmunities within the study area. These values rnay stem from a varie'/ of
sources such as recreation. subsistence. spirituality. science. or aesthetics. Note that this
definition of social values excludes al! commercial values such as forestry. mining, agriculture.
These development activities were purposely excluded as they represent economic values as
opposed to socio-cultural or ecological values. They will be considered in greater detail in
Cliapter 6.
Ecological values are defined as abiotic and biotic features of special ecological concern or
interest. This includes both structural and functional aspects of an environment such as unique
species or cornmunities, cntical habitats, and hydrological and geomorphological processes.

-- -
1.5 THESIS OUTLINE
To rneet thesis goals and objectives, and to further develop the ideas expressed above. the
remainder of this thesis is presented in five chnpters.
Chapter 2: Literature Review. In this chapter, principles of protected areas selection, northern
zntlonr! p k zsnrgenen!, ccmprehe~si~e regicn-! ! x d ;se nl-nning, r -----a.- 2nd cw~~!21i\ie
environmental effects and assessment are reviewed and summarized.
Chapter 3: Proposed Methodology. Interactions among the four themes reviewed in Chapter 2
are discussed. Two sets of guiding principles are then developed from the literature reviewed in
Chapter 2: one guiding the development of the methodology. the other guiding the application of
the rnethodology. Each step of the proposed methodology is then described. explaincd. and
justified in detail.
Chapter 4: Case Study Background. The rnethodolosy developed in Chapter 3 is applied in
this chapter. First. a discussion of study area boundaries and justification for the particular
location selected is presented. Then. key ecological and social aspects of the Greater Kluane
Region are outlined. This chnpter concludes with a history of park. planning. and assessment
studies in the Greater Kluane Region.
Chapter 5: Case Study Results and Discussion. Key findings from the case study are presented
through a series of tables and maps in this chapter. Major differences in the results are then
discussed, and general conclusions drawn regarding data quality and future research priorities for
the Greater Kluane Region.
Chapter 6: Conclusion. The potential application of the methodology in regional land use
planning exercises and in cumulative effects assessrnents are discussed. Implications arising from
the case study are also addressed, followed by an evaluation of the strengths and weaknesses
associated with the proposed methodology using the guiding principles developed in Chapter 3.

INTRODUCTION IJ - - -- - - -
A discussion on research contributions and areas for future research are also incIuded. Finally,
thesis goals and objectives are reviewed and some concluding rernarks presented.
To provide a betrer overview of the many stages involved in the thesis, and to gain a greater
ud~:stmdir,g cf hca~ these st~g-s Er rcgcther 2nd de?re!rn r throiighc-t --"-- ! h i ~ &~~men! . 2 "~hesis
map" is presented nt the end of every chapter. in each "rnap". a sliaded box will indicate which
stage of the thesis will be exptored in the following chapter. specifiing what the reader can
expect next and providing an overview of al l thesis components. For instance. the l iterature
review box is shaded in Figure I . f . This indicates that the background and problern definition
have just been presented and that the next chapter will focus on a literature review of protected
rireas selection. park management. comprehensive regional land use planning. and cumulative
env ironmenta l effects and assessment.

- -- -
Problem Definition (Chapter 1 )
- ---
Guiding Principles for Methodology Appplication
(Section 3 -2)
Theme Interactions
(Section 3.1) - . . - - - .
Guiding Principles for
* Methodology Development
(Section 3.2)
Overview of Methodology ,
(Section 3 -3) -- -
Stage 1 Database
(Section 3.4. 1)
Stage 2 Hotspots
(Section 3.4.2) . . - .
Case Study (Chapters J and 5 )
.. .
Conclusions Future
Applications (Sections 6.1 and 6.2)
.
Methodology .- . - - Evaiuation
(Section 6.3) -
Goal 1
Goal 2
Goal 3
Figure 1.1 - Conceptual Map of Thesis.

The purpose of this litenture review is to set the context for the proposed methodology
developed in Chapter 3. This is accomplished by reviewing frameworks proposed in the literature
on protected areas selection (section 2.1). northern national park management (section 2.2).
cornprehensive regional land use planning (section 2.3). and cumulative environmental effects
and assessment (section 2.4). A justification for why these themes are being reviewed and how
they are expected to aid with the development of the methodology presented in Chapter 3 is also
provided.
2.1 PROTECTED AREAS SELECTION
Parks and protected areas play a large role in the long-term maintenance of functioning
rcosystems. A review of criteria used to select these natural areas and define their boundaries is
used to set the broad context for the rnethodology proposed in Chapter 3 by providing sorne
insight into the values and criteria that protected areas are established to protect.
l n the following sections. natunl areas selection criteria are presented. and specific examples
of how these criteria are used to de fine env ironmentaf ly signi ficant areas, environmentalIy
sensitive areas. and national parks are discussed and compared (section 2.1.1). Ecological
boundary considerations are then reviewed and discussed (section 2.1.2).
2.1.1 NATURAL AREAS SELECTION CRITERIA
Selection Criteria
There is a rich body of literature on natunl areas selection (reviewed by Smith and Theberge,
1986a). This literature addresses the question "where do we establish parks and protected areas"
and questions of the size, shape, and spacing of these areas.

LITERATURE REV~EW 17
Smith and Theberge (1986a) identified eight biotic and abiotic criteria that were used
repeatedly in the literature when evaluating natural systems. These criteria are:
- geographic and cirmogruphic rarity and uniqueness: widespread rare or declining species.
endem ic, disjunct, or periphernl populations, andor unique or rare geomorphological features are
iiigiiiy ;itueci;
- ulphu. k m . und gurnrriu diversity: areas with high species and/or genetic divers ity occurring
within. between. or among a specific habitat type, or areas with high concentrations of speciaI
geornorphological or hydrological features are valuable;
- sée : areas capable of supporting wide nnging species, umbrella species, minimum viable
population levels, etc. are more valuable;
- nuturulness: an area is of greater value if it is undisturbed by human intluences as it can serve
as a source for baseline information. and provide aesthetic. spiritual. philosophical. emotional.
and recreational benefits.
- prodzrctivity: areas with a high rate of ene rg assimilation into organic material serves as an
important food base. which particulariy important in the North:
- fragiliy: areas with ecological components susceptible to damaçe or perturbation need more
protection;
- representariveness: areas representing a full range of natural features and/or characteristics
typical of a particular habitat type or biome are considered valuable;
- importancejor wililife: areas containing critical wildlife habitats are more valuable.
Cultural considerations also influence the establishment of protected areas. In particular.
Smith and Theberge (l986a) identifi some cultural critena that are cornrnonly used in selecting
natural areas as:

- scientific significance: areas with eltisting research investment andor scientific research
potential are often considered highly valuable:
- historieal sign#cunce: areas containing representative resources from historic or prehistoric
periods are culturally significant;
valuable; and
- recreutionul sign~jiccrnce: areas sustaining various recreational activities are valunble.
In many crises, the boundaries of protected areas are also influenced by competing land uses.
sucli as agriculture. mining, or forestry, andor political considerations (eg. Theberge. 1978).
AIthough it is not desirable to detïne protected areas based on politics or land use contlicts. these
factors still play ri role in selecting naturai areas and need to be considered nevertheless.
Applications of Criteria
Theberge et cil. (1980) developed a frarnework for identiming environmentally significant
areas with the purpose of ensuring the protection of representative exampies of biophysical
features across the Yukon and Northwest Territories. The ultimate goal was to identify unique.
representative. and sensitive areas so that they could be managed in a way to ensure that they
continue to function as natural, self-reguiating ecosystems. These areas would pmvide wildlife
and renewable resource protection, and opportunities for recreation. science and education
(Theberge et al., 1980).
To select environmentally significant areas. five main categories are used: landform, wildlife.
veptation, ecosystern representation, and land use. Landforms with higher diversity andor the

-
presence of unique or uncommon landforms are considered more valuable. For wildlife, areas
containing critical ranges. habitat for rare or endangered species. or a high diversity of species
and habitats are recorded as highly valuable. Likewise, areas with rare, disjunct. and/or
endangered vegetation species are also considered more valuable. Other prime candidates for
cn;.irûn~cr,t=!!;' signific2nt a r e s ific!u& rrcs u c repres~i.?rti\!p 2f the ccoreclinn in ?\/hic!? 3'C14
it was located. and areas with little or no influence of existing and potential land use activities
(lieberge es al.. 1 980).
Environmentdly sensitive areas selection also applies several criteria listed ribove. Eagles
( 1980: 8) defines an environmentally sensitive area ris "a specifically bounded landscape thrit
hltils one or more of a set of criteria. [Environmentally sensitive areas] are naturd landscapes
that contain features suc h as: aqui fer recharge. hendwaters. unusual plants. wildli fe or land forrns.
breeding or ovenvintering animal habitats. vital ecological functions. rare or endangered species.
or combinations of habitat and landfonn which could be valuable for scientific reserirch or
conservation education." Nine ecological criteria are used to identify environmentally sensitive
areas. These include areas with distinctive and unusual landforms. vital ecoiogical functions.
unusual or highly diverse communities, unusual and uncommon habitat. unusual high biological
diversity, habitat for rare or endangered indigenous species, large rtreas capable of supporting
spatialiy-demanding species, suitable for scientific research. and landform and habitat mosaics of
high aesthetic value (Eagles. 1980).
Parks Canada's main objective is to "protect for al1 time representative natural areas of
Canadian signiticance ..." (Parks Canada, 199425). To meet this objective. Canada is subdivided
into 39 terrestrial natural regions, each of which has distinctive physiographic, vegetation,

wiIdlife and environmental characteristics. The goal is to establish at least one representative
park in each of these natural regions in order to complete Canada's system of national parks
(Parks Canada, 1997). This is accomplished by selecting an area representative of the natural
region and in a healthy, natural state in consultation with fedeni and provinciaVterritoriaI
go:c;nmen:s LX! in:îr'~s:e:! p ~ b ! i ~ . .2 PW~CZ!I: si:: 5: 2 pctezfis! xrirz2! prrk is the:: se!ected
witliin this natural area based on considerations of the criteria outlined in the National Parks
Policy (Parks Canada, 1994:X-27). These criteria are:
- the extent to which the aren represents the ecosystem diversity of the natural region:
- the potential for supporting viable populations of wildlife species native to the naturnl region:
- the ecological integrity of the area's ecosystems. as well as those of surrounding lands:
- the occurrence of exceptional natural phenomena, and rare. threritened or endangered wildlife
and vegetation;
- the existence of signi ficant cultural heritnge features or landscapes;
- opportunities for public understanding, education and enjoyment:
- competing land and resource uses;
- possible threats to the long-terni sustainability of the area's ecosystems: and
- the implications of Aboriginal rights, comprehensive land claims and treaties with Aboriginal
peop les.
In surnmary, envimnmentally significant areas. environmentally sensitive areas, and national
parks are al1 selected based on uniqueness, divenity, importance to wildlife, and inevitable
politics. In addition, both environmentally significant areas and national parks are selected based
on system naturalness and representativeness. The selection of environmentally sensitive areas
and national parks also includes size, scientific value, and aesthetics. National parks also

explicitly include criteria on education, recreation, and cultural resources. None of the three
studies reviewed included productivity, fragility, or recorded history/research investment as the
major selection criterion.
Ecoiogiciii Bouiicilrry Coii&kàtiuiie
Once sites have been selected. boundaries must be drawn. Many boundaries surrounding
parks and protected areas today were established for political reasons. and are far from
ecologically sound (Landres et (11.. 1998a. 1998b). To address this issue. Theberge (1989)
described an approach to drawing ecologically sound boundaries which maximizes ecological
integrity within park boundaries. He presented tive abiotic guidel ines wi th the principle objective
of maintaining the integrity of hydrological drainage basins, and ten biotic guidelines with the
principle objective of reducing "as linle as possible the natural diversity of populations in both
the total natural area and in the communities directly traversed by the boundary line." These
fi fteen guidelines are surnmarized in Table 2.1.
The National Parks Policy also highlights some boundary considerations. These inciude:
protecting representative ecosystems and iandscape features: accommodat ing viable wildlife
populations; includ ing an undisturbed core; keepi ng sensitive. hiçhly diverse or productive
natural communities intact: maintaining drainage basin integrity: protecting exceptional natural
phenornena as well as vulnerable. threatened or endangered fion and fauna: offering
opportunities for public understanding and enjoyment: resulting in "minimum long-term
disruption of the social and economic life" in surrounding regions; and excluding permanent
cornmunities (Parks Canada, 199497).

Table 2.1 - Significant Ecological Criteria (source: Theberge, 1989).
Abiotic
Biotic
Guideline
- Boundaries should sever drainage basins as little as possible; - Boundaries should not leave out headwater areas; - Boundaries should consider subsurface transbasin water flow; - Boundaries shouid not cross active terrain; and - Boundaries siiouici inciuae anci not threaren rare geuriiorpiiuiogic: a d liydrologic features.
- No rare or unique community should be sevzred: - Boundaries should not sever highly diverse communities. especially wet lands. ecotones, and riparian zones:
- Boundaries should not sever communities with a high proportion of faunal spec ies; - Boundaries should not jeopardize the ecological requirements of either numerically rare or distributionally rare (uncornmon) species: - Boundaries should not jeopardize the ecological requirernents of niche spetialists; - Boundaries should not jeopûrdize populations of spatially vulnerable species (migratory. space dernanding, seasonally concentrating. or limited in dispersal); - Boundaries should not jeopardize populations of K-selected species: - Boundaries should not jeopardize populations of range-edge or disjunct species: - Boundaries should take into special account pollution-susceptible species; and - Boundary delineation should take into speciai account the ecologjcal requirernents of ungulate species.
2.2 NORTHERN NATIONAL PARK ~ . ~ N A G E ~ I E N T
Many of the criteria and boundary considerations discussed above are used in the
establishment of national parks. Once established, national parks are managed through the five
main categories reviewed briefly in Section 1.3.2. In meeting the objectives of this thesis. it is
important to undentand these aspects of park management since they set the framework for the
methodology proposed in Chapter 3.
The following sections therefore discuss ecological integrity (section 2.2.1 ), ecosystem-based
management (section 2.2.2), threats (section 2.2.3), environmental assessments (section 2.2.4),

LITERATURE REVIEW 23
and monitoring (section 2.2.5) in detail. For each category. a working definition is provided.
followed by a description of how it relates specifically to national park management. and a
discussion of frameworks and methodologies developed for national parks
22.1 ECOLOCICAL LYTECIIITY
Definition
The concept of ecological integrity has received increasing attention over the past 20 years.
and has been defined in a number of ways. Cairns (1977) defined ecological integrity as "the
maintenance of the comrnunity structure and function characteristic of a particulrir locale or
deemed sntisfactory to society". This definition was later revised by Karr and Dudley (1 98 1).
who stated "[bJiological integrity is the capability of supporting and maintaining a balanced.
integrated. adaptive community of organisms having a species composition. diversity. and
tùnctional organization comparable to that of natural habitats of the region".
As the concept of ecological integrity evolved. some main underlying characteristics were
defined as the ability of ecosystems to: regenerate themselves and withstand stress. undergo
ongoing change and development unconstrained by human interruptions (Westrri. 1995).
maintain optimum operations under normal conditions, cope with changes in environmental
conditions, and continue the process of self-organization on an ongoing ba i s (Kay and
Schneider, 1995). In addition, ecological integrity implies that "ecosystem structures and
functions are unimpaired by human-caused stresses, native species are present at viable
population levels [and] ecosystems do not exhibit the trends associated with stressed
ecosystems." (Wood ley, 1994).

LITERATURE REVIEW 24
Relevance to National Park Management
The 1988 amendment to the National Parks Act States that the "maintenance of ecological
integrity through protection of natunl resources shall be the first priority when considering park
zoning and visitor use in a management plan" (Canada, 1988). Provisions for ecological integrity
zre SC k i ! t iztc t,hr N ~ ~ i ~ n ~ ! Pe!icy, rqcIr iRg 2 ~ P V I - ? ~ c f o q r G r n q n - i i ~ m ~ n t n l ~ m r e n i 5 r-• .- B-*.-**- rAUA4 J
years to report on the status of park ecological integrity (Sections 2.1.1 and 2.1 -2 . Parks Canada.
1994). This management goal is becoming increasingly important as many national parks are
reporting significant to severe levels of impairment to ecologicai integrity (Parks Canada, 1998).
There has therefore been considerable research into the rippiication of ecological integrity to
the management of Canada's national parks (eg. Skibicki et al.. 1994: Woodley. 1994). A panel
on the ecological integrity of Canada's national parks was established in 1999 to evaluate Pnrks
Canada's current approach to rnaintaining ecological integrity using ecosystem-based
management principles. The working definition of ecological integrity adopted by this panel. and
by Parks Canada in genenl. is: '-the condition of an ecosystern where ( 1 ) the structure and
function of the ecosystern are unimpaired by stresses induced by human activity, and. (2) the
ecosystem's biological diversity and supponinp processes are iikely to persist." (PEICNP. 2000).
Frameworks and Methodologies
Most frameworks developed around ecological integrity involve the selection of appropriate
ecological attributes wbich can be measured and monitored to evaluate ecological integrity. Two
different frameworks are discussed below, addressing the question of how to determine
appropriate rneasures and indicators of ecological integrity in national parks. Methodologies and

frameworks dealing with the incorporation of these indicators into national park monitoring
systems will be discussed in Section 2.2.5.
WoodIey (1993) proposed a frarnework for assessing ecological integrity involving multiple
nierarcnicai scaies. t ie recommends the use of moniroring measures ar inaiviauai, popuiariun.
community. and landscape levels (Table 2.2).
Most of these merisures require indicators. Woodley identi fied the follow ing ecosystern
components as key indicators for these monitoring measures: hypersensitive species, rare species.
surnmit predators. keystone species. old-growth species. K-selected species. species with large
body size, successful non-native species, species whicli accumulate toxins. species with
ubiquitous distribution. and species which show slow response tiers.
Table 2.2 - Selected Measures for Monitoring Ecological Integrity (source: Woodley. 1993).
Parks Canada's assessment frarnework for monitoring ecological inteqity in national parks is
largely based on this initial work done by Woodley (1993). Three broad measures - biodivenity.
ecosystem functions, and stressors - are used to monitor and evaluate ecological integrity (Table
-
Hierarc hical Scale
Individual
Population
Cornmunity
Landscape
Monitoring Measure
- Growth and reproduction rates of indicator species
- Minimum viable population size - Population dynamics of selected species
- Species diversity - Succession/retrogression - Nutrient cycling
- Climate - Primary productivity/respiration - Minimum viable area

LITERATURE REVIEW 26
2.3). For each park, relevant and measunble indicators, such as those recornrnended by Woodley
(1993), are selected and monitored in order to detect changes in ecological integrity. Lndicators
are therefore used as early waming signals, instigating necessary changes in management
practices when ecological integrity is at risk of being compromised (Parks Canada, 1998).
Table 2 3 - Fruiiiewurk fur Assessing Eeolugical Xotegrity ( s ù u i ~ c : Park taniida. : 998).
Biodiversity S pecies Ric hness Jhange in species ichness Vurnbers and extent of xotics
Population Dynamics Uortality/natality rates ~f indicator species immigration/emmigratio n of indicator species Population viability of indicator species
Trophic Structure Size and class distribution of dl taxa Predation levels
Ecosystem Functions Succession/retrogression Disturbance frequencies and size [fire, insects, fiooding) Vegetation age class distributions
Productivity Lnndscape or by site
Decom posi tion By site
Nutrient retention Ca. N by site
S trwso rs Human land-use patterns Land use maps, roads. densities, population densities
Habitat fragmentation Patch size inter-patch distance for interior
Pollutants Sewage, petrochemicals, etc. Long-range transportation
Climate Weather data Frequency of extreme events
Other Park speci fic issues
2.2.2 ECOSYSTEM-BASED MANAGEMENT
Definition
Over the past decade, there has been an increasing urgency for the management of the
environment in whole ecological or landscape-based units (Slocombe. 1993). This holistic
approach to management is often referred to as "ecosystem-based management". Afier an
extensive literature search on the ecosystem approach to management. Gmmbine (1994)

LITERATURE REVIEW 27
identified ten recurring themes which authors have identified when discussing the definition,
implementation. or overall comprehension of ecosystem management (see Table 2.4). Using
these ten themes. ecosystem management has been defined as a process which "integrrites
scientific and traditional knowledge of ecological relationships witliin a complex sociopolitical
and vüiues Craiiicaurh iuward &lie gc~~crüi guai wf prureztiiig iidtiw c c u q sieiii iiiiryrit! riber ;lit
long term" (Mitcliell. 1997). In other words. it is a process by which ecosystems are rnanaged to
assure their sustainability (Franklin, 1997).
Table 2.4 - Ten Dominant Themes Relevant to Ecosystem Management (sorrrcr: Grumbine. 1994: 29-30).
Ecological integrity
Theme
Hierarc hical context
Ecological boundaries
I - protect total natural diversity and the patterns/ processes which rnaintain that diversity.
Description
- look at interactions between multiple levels of biodiversity
- pay attention to biophysical or ecological units rather than politicaI ones.
Monitoring 1 - document successes and failures in order to leam from them.
Data collection - we need more biological data.
1 Inter-agency 1 - sharing and coopention among municipal. state, national and
Adap tive management
- treat management as a learning experience with continuous adjustments and modifications.
cooperatiou international agencies. the private sector and non-government organizations.
Organizational change
Values 1 - must consider human values when setting management goals.
- may require alterations in structures and processes used by resource and environmental management agencies.
Humans ernbedded in nature
- see people as part of natural systems.

LITEFUTURE REV~EW 28
Relevance to National Park Management
The National Parks Policy encourages the use of ecosystem-based management as the
conceptual and strategic basis for protecting park ecosysterns for several reasons. For instance,
ecosystem management takes a holistic view of the environment, requires that activities
iniiuencing par^ ecoiogicai integriry be undersrwd ar ri regiunai scair. requirrs bat iarid use
decisions take cornplex interactions and natural dynamics inro account. and recognizes the finite
ability of ecosystems to withstand and recover from anthropogenic stress (Section 3.0. Parks
Canada. 1994). Ecosystem management therefore compkments regional planning, helps planners
and managers maintain a holistic view of the environment, and encourages regional collaboration
and coopention. This will become particularly important in the near future since parks rarely
contain complete or unaltered ecosystems. and it will be increasingly difficult to sustain parks
due to increasing cumulative stress tiom adjacent land use activities (Parks Canada. 1994).
Frameworks and Methodologies
Parks Canada has developed a framework for ecosystem-based management in national parks
including the following characteristics (source: Parks Canada. 19943436):
- Maintain a holistic view of environment.
- Encourage regional integration and collaboration.
- Increase understanding of impacts of human activities on natural environment.
- htervene only if structure and function of park ecosystems have been seriously altered by
human activities,
- Establish clear, practical and measurable objectives.
- Base necessary manipulations on scientific research, using techniques that dupiicate natural
processes as closely as possible.

- Maintain an integrated database as basehe information.
- Subject al l programs. policies and plans to environmental assessrnent
- Participate in environmentsl impact assessments for proposed developments outside national
parks that may affect park ecosystems.
This frarnework largely addresses issues surrounding natural resource conservation. However.
management in national parks also includes a second aspect: visitor management. Processes
developed to deal with visitor impacts can be considered ris part of ecosystem-based management
because proper management of human impacts greatly influences the maintenance of ecological
integrity. In order to deai stTectively with the management of visitor impacts. tlie Canadian Parks
Service developed a process known as Visitor Activity Management Process. or VAMP. This
tiamework was designed to work in concert with naturcil resource management processes to
provide information for park management planning (Payne and Graham, 1993).
In tlie VAMP framework, visitor activity profiles are drawn to connect a particular activity
with the social and demographic characteristics of user groups. the activity's setting
requirements. and the trends affecting the activity. This information is then used to detennine
subactivity groups. For instance. cross-country skiing can be subdivided into four subactivities -
recreationlday use skiing, fitness skiing, cornpetit ive skiing. and back-country skiing - based on
differences arnong participants' sociodernographic chancteristics. equipment, motivations. and
setting needs. Activities and subactivities appropriate in national parks can then be detennined
by cornparing how weil they relate to park mandates and the goals of ecosystem-based
management. In addition, park facilities, programs and services c m be established to suit the
needs highlighted in the visitor activity profile if these needs are compatible with the national

LITERATURE REVIEW 30
park policy objectives of protection, understanding, appreciation, and enjoyrnent (Payne and
Graham, 1993).
2.2.3 THREATS
De finition
Two types of threats can be identified: intemal and extemal. Internal threats are stressors
arising with in park boundaries which could potentially Iiave a negative impact on park ecological
integrity. These couid relate to park management processes. visitor activities. and park facilities.
In genenl. these threats tend to be easier to manage because they are within the sphere of
influence of park managers and planners. Extemal threats. on the other hand. arise from
development activities outside park boundaries. These arise largely due to the presencr of
political as opposed to ecologicûl boundaries. competing land uses. and due to lack of regional
coordination of land management. External threats are difficult to deal with because they are
largely out of the control of park managers. but they can have substantial impacts on park
ecosystems. In fact. many researchers have identified extemal activities as the most significant
threats to the park interior (Buechner et al.. 1992; Schelhas. 199 1 : Mon. 1988).
Retevance to National Park Management
Since "stressors" arising from interna1 and extemal threats were identified as one of the three
indicators of ecological integrity, a survey on ecological stressors was carried out in 36 national
parks in 1996. From this survey, key stressors can be broken down into three categories:
originating outside park, originating inside park. and originating both inside and outside park.
Primary extemal stresson include forestry, agriculture, rnining, sport hunting, and urbanization.
Internal stressors include visitor use, fire control, park infrastructure. and park management

practices. while internai and extemal sources include heavy metal pollution. vehicidwildlife
collisions. climate change. poaching, solid waste, exotic vegetation, human disturbance,
petrochemical pollution, and transportationhtility corridors (Parks Canada. 1998). Ten northern
parks were included in this survey. Surprisingly. many of these parks are reporting multiple
Table 2.5 - Stresses Causing Significant Ecological Impacts In Northern National Parks (source: Parks Canada 1998).
National Park Stresses Reported
Aulavi k - no stresses reported
Auyuittuq - commercial fishing, park management. sewage. urbanization. utility corridors
Ellesmere - no stresses reported
twavik - exotic mammals, solid waste, sport hunting
Kluane - agriculture. dams. exotic vegetation. human disturbance. mining, solid waste. sport fishing, urbanization
Nahanni I
- mining, park management 1
Vuntut
1 Wood Buffalo 1 - dams. visitor facilities 1
- no stresses reported
Wapusk
Frameworks and Methodologies
Although no frameworks or methodologies have been developed relating specifically to
threats in national parks, threats are incorporated into the process of maintaining ecological
integrity. Provisions are made for regional stressors in the measurement of ecological integrity
(see Table 7.3) and in natural resource and visitor use aspects of ecosystem-based management,
as outlined in Section 2.1.2. In addition, regional threats are incorporated into environmental
assessments and monitoring prograrns, discussed in Sections 2.1.4 and 2.1.5 respectively.
- dams, utiIity corridors

2.2.4 ENVIRONMENT.4 ASSESSMENTS
De finition
Environmental assessment (EA) is ''an organized information gathering process used to
identify and understand the effects of proposed projects on the bio-physical environrnent as well
as on the social and economic environments of the people to be aftècted." (CEAA. n.d). At the
kderal level. it is governed by the Canadian Environmental Assessment Act of 1995 and
associated regulations, under the direction of the Canadian Environmental Assessment Agency.
Provincial and territorial legislation also address environrnental assessrnents independent ly. but
these will not be discussed since the focus of this research is on federal parks.
Associatrd regulations detïne four regularions critical to the proper functioning of the Act:
law list. inclusion lis& comprehensive study list. and exclusion 1 ist. The law list hiçhlights
existing acts and reguiations that require a federal EA. The inclusion list refen to reguiations
prescri bing physical activities not related spec i fically to physical works. The comprehensive
study list includes major projects which must undergo a full assessment. and the exclusion list
exempts projects with insignificant effects from EAs.
Relevance to National Park Management
Federal environmental assessments are required by law when a federal authority proposes.
contributes funding to. transfers control of land to, or exercises a regulatory duty in relation to a
proposed project (CEAA, 199u). Therefore. any project in which Parks Canada exercises one or
more of those functions must go through an EA. Specifically. this includes projects listed on the
law list (eg. National Parks Act), inclusion list (eg. culling wildlife population in national park),

and comprehensive study list regulations (eg. proposed construction of a physical work in a
national park).
Parks Canada has also cornmitted itself to perform EAs on proposals which fa11 outside the
scope of riic: Act, bu1 wiiiçii wuid iiavç u i itdvcne c ~ k d u t c ~ ~ ~ ~ s i c i l ~ b "1. i l i l i ~ i i + r i l ï i i i " U r L < j iii
Canada's national parks (Parks Canada, 1999). In addition, the national parks policy States that
Parks Canada wiil participate in EAs both inside and outside park boundaries (Sections 3.2.13
and 3 2.14).
Although this commitment to EAs is clearly stated in the EA Act and the national parks
policy. recent findings of the panel on the ecological integrity of Canada's national parks
indicate that a major weakness of EA in national parks is that it is used as a process to identiS,
mitigative, surveillance. and follow-up measures rather than using the assessments to determine
the appropriateness of a proposed project. program. or policy. Furthemore. the panel found thût
EAs tend to be considered separate frorn park decision making processes. and that this lack of
inteçration of planning and assessrnent has reduced the effectiveness of EAs as tools for
reducing the "ecological footprint of developrnent". Consequently. the panel strongly
recommends that EAs be more Fully integrated into park planning, manqernent. and decision-
making processes to more effectively reach the goal of maintaining park ecological integrity
(PEICNP, 2000).
Fmrneworks and Methodologies
For project-specific proposals, environmental assessments usually consist of the following
components of a standard EA (Davies, 199 1):

- Project rationale,
- Assessrnent of the environmental conditions,
- Public consultation.
- Project alternatives,
- Assessnient ui'eririruririlrrilüj e&cts u r i i ~ ~ : p~ujel;f i l l d ih i
- Ways ta prevent, mitigrite. or compensate for the predicted environmental effects.
This is the framework tliat Pnrks Canada uses to evaluate the rnvironrnental impacts of
proposed projects or activities. Recently, Parks Canada has added an additional step IV hich
involves screening a! l proposals through Prtrks Canada policy first. If the proposal complies with
the goals and objectives outlined in the policy. it then undergoes a proper EA. However. if a
project is not aligned with the policy, the proposal is rejected even betore an official EA is
undertaken (PEICNP. 3000).
2.2.5 MONITORING
Definition
Monitoring cm be defined as the process in which one or more variabtes are measured
repeatedly over time in order to assess and detect changes in ecosystem structure or function.
Conclusions drawn frorn monitoring programs are then fed into decision-making procedures with
the purpose of influencing management decisions (Henry er d., 1995: Woodley, 1994).
Ultimate monitoring goals have been outlined by Freedman et al. ( 1 995) as to: "(i) detect or
anticipate ecoloçical changes, by measuring appropriate indicators, and (ii) understand the
causes and consequences of those changes."

Relevance to National Park Management
The concept of ecological monitoring ties together the other aspects of park management that
have already been discussed, as illustrated in Figure 2.1. Monitoring programs contribute to the
maintenance of ecological integrity in parks and surrounding regions by following up after
mi.-irüfimcfital asscssmciïis, qxcifical!y addrcssing particülri; :!îïcrits, r;;U LU~iïig fa! iztû ilic
ecosystern- based management dec ision making procedure.
It is therefore not surprising that ecological monitoring prognms have already been
introduced into many national parks. There are currently programs in place for a variety of
issues. ranging from monitoring weather. air quality. and snow accumulation to shoreline
erosion. forest succession. and visitor use (Parks Canada. 1999).
Three monitoring objectives have been identified for Parks Canada: ( 1 ) to measure and detect
changes in the ecological integrity of ecosystem(s) witliin park: ( 2 ) to measure the effects of
specific perceived threats to the ecosystem(s) within park: and (3) to provide data on the state of
Canadian national parks (Woodley. 1994). Provisions for monitoring are also made in the
national park policy. For instance. section 2.1.6 states that " implementation and effectiveness of
each park management plan wili be monitored continuously". and section 3.2 stresses the
importance of monitoring throughout, mostly as a tool to collect data and store it as an integnted
data base for baseline information.

Interna1 and Externai Threats 4
- -- - -
* Monitoring ID Environmental
Assessmen t
) Ecosystem-based Management
Ecological Integrity of ' Park and Greater Area
Figure 2.1 - Monitoring Fnrnework (sozirce: adapted frorn Freedman et a/.. 1995)
Fmmeworks and Methodologies
In order to meet the aforementioned monitoring goals and objectives, a monitoring
framework has been devised for Canadian national parks (Figure 2.2). This frarnework is two-
pronged, involving the monitoring of both ecological integrity and specific threats or stresses.
Both types of monitoring are critical to park monitoring plans (Woodley. 1994).

LITERATURE REVIEW 37
Measures, or indicators, of ecological integrity for monitoring programs have already been
discussed in Section 2.1.1. When particular threats are unknown. appropriate measures are
selected from Table 2.2 or 2.3. and incorporated into park monitoring programs. Indicators are
then selected to measure and keep track of overall regional ecological integrity. If û known threat
* . . . ib ideiiiifiscl iliruuaii ihc iiiui~iiùrhg ùf s~ùlùgiiii: iiii~gikj. 'L- L ~ I L app~uc'~11 ------- ' * - LW ---,+-*.-- ~ I I U ~ ~ L L U ~ ltls 3111ILh -':"- *- LU
tlireat-speci fic monitoring.
Threat-specific Monitoring
Known stress . . - prediction of response or threat - creative scenarîo writing
- statistical approaches b - biological indicators
- feedbacks and lags
Park Ecosystem After
identification
Ecosystern health monitoring Unknown stress - stress ecology
or threat - landscape ecology - biological indicators - conservation biology
Figure 2.2 - Monitoring Fnmework for National Parks (source: Woodley, 1994).
The fint obvious step to threat-specific monitoring is the identification of stresses and threats.
either from ecological integrity monitoring programs, staff and other knowledgeable people,

- -
and/or the park conservation plan. Once a threat has been identified. a monitoring program is
designed specifically for this threat. To do so. the threat must be fully described. and al1 potential
ecological consequences outlined. A stress-response model can then be developed in order to
predict the response to the threat through considention of relationships. timing. synergistic
inreraçrions, inlerisity aiid uliier iiifiueiiciti~ Ficlurs. Ne.ti. iiiuiiitori[ig iiieaurrs are reiïiicd by
applying specialized techniques. such as creative scennrio writing, statistical techniques,
identitication and quantification of stresses. feedbacks. and lags. and the use of biological
indicritors. A monitoring program is then deveioped and incorporated into a feedback loop
(Woodley. 1994: Munn. 1988).
2.3 COMPREHENSIVE REGIONAL LAND USE PLANNING
AH aspects of national park management point to the need to consider parks in a regional
perspective. For instance. park ecological inteçrity is linked to nreas outside park boundaries.
and ecosystem management ernbraces the notion of broad scales. In addition. threats arise both
intemal and extemal to park boundaries. the scope of environmental assessments falls outside
park boundaries. and monitoring programs typically involve regional scales. It is therefore
suggested that a proactive. large scale planning approach such as comprehensive regional land
use planning (CRLUP) is compatible with overall park management objectives and procedures.
Since the methodoloey proposed in Chapter 3 must function within this park management
framework and will be applicable to planning exercises, it is important to review the principles
underlying CRLUP.
In the following sections, frameworks used For four CRLUP exercises are presented (section
2.3. l) , and some of the key challenges involved in CRLUP are reviewed (section 2.3.2). This is

followed by an analysis of the strengths and weaknesses of each framework (section 2.3.3). and a
discussion of how CRLUP can help to minimizing CEEs through the encouragement of proactive
park planning (section 2.3.4).
2.3.1 FRAMEWOKS
The purpose of this section is to familiarize the reader with four CRLUP frameworks
employed over the p s t 25 years. Frameworks were drawn Iiom the British Columbia
Commission on Resources and Environment. Lancaster Sound Regionai Land Use Plan.
Mackenzie Delta-Beaufort Sea Regional Land Use Plan. and Ontario Strategic Land Use Plan.
Although there are other examples of CRLUP. these four in panicular were selected because
tliey are well known and two deal specifically with the north. Only four frameworks are
reviewed because it is not the intent of this thesis to provide ri comprehensive review ot'CRLUP,
but rather to provide a few examples to demonstrate the kcy chancteristics of the planning
process and the potential application of these principles to park planning and CEEs.
British Columbia Commission on Resources and Environment
The Commission on Resources and Environment (CORE) was established in 1992 as an
independent body mandated to (1 ) develop a province-wide strategy. (1) develop. monitor and
implement a community-based and participatory regional planning process. (3) coordinate with
the provincial govemment. and (4) encourage the participation of aboriginal groups. In genenl,
they were charged with the challenge of developing a province-wide stratew for land use in
British Columbia. This land use plan was to emphasize economic. social, and environmental
sustainability with extensive public consultation (CORE. 1994).

LITERATURE REVIEW 40
The framework developed to fulfil this task involves shared decision-making and cooperative
involvement of al1 stakeholden (CORE, 1992). It involves several steps. Fint, principles and
goals are outlined to form a vision. L a w and policies are then deveIoped to provide a direction
for attaining this vision. Plans are then created at a variety of scales (eg. provincial, local) so that
the laws and poiicies can be appiied. Nest. pians are impiemented through teiiures onci approvais.
Finally, results are measured and required revisions made (CORE, 1 994).
To carry out this frarnework. CORE defined four study areas (one on Vancouver Island. one
in southcentral BC. and hvo in southeastern BC). Stakeholders were empowered through a round
table approacfi in which each interest group constituency was represented by a negotiating
cornmittee and a spokesperson (Penrose rr cd . , 1998). Two professional mediators, hvo
facilitators, and one local expert were also involved. Although CORE ended with a change in
government in 1996. much of the work carried out throughout the planning process is currently
beinç incorponted into B.C's Land and Resource Management Planning progrnm.
Northern Land Use Planning Program-Lancaster Sound, Mackenzie Delta-Beaufort Sca
The Northern Land Use Planning program (NLUP) was initiûted in the early 1980's for the
purpose of developing balanced land use plans for the Canadian north. Two resulting plans are
reviewed here: the Lancaster Sound Regional Land Use Plan (LSRP) and the Mackenzie Delta-
Beaufort Sea Region Land Use Plan (MDBSRP). A third plan. the Kluane Land Use Plan. is
discussed in more detail in Chapter 4.
The need for a regional land use plan around Lancaster Sound became apparent in the 1960s
as developers became increasingly interested in the rich renewable and non-renewable resources
of Lancaster Sound. The Lancaster Sound Regional Study was carried out between 1979 and
1983 as a precursor to the regional land use plan. In 1986. the Lancaster Sound Regional Land
Use Planning Commission was established with the goal of creating a land use plan to minimize
contlicts among competinç resource user groups while rnaximizing social benefits to local
cornmuniries iFenge. i 989). Particuiür objectives oi-ri~t: curiiinissiuri iiiciudecl idcii~iCyirig issues,
opportunities. and constraints regarding land use. csrablisliing a balance between çompeting land
uses. advising on pretèrred uses of the land. recornmending simple. ciear and accountable
decision making processes. and recommending methods of pubiicizing the existence and
objectives of the plan (LSRLUPC. 1989).
The LSRP considered issues and concerns arising iocally and throughout the entire study
rirea. They d so examined land use opportunities and constraints for the study area. which
encompassed most of the nonheastern arctic islands. The frrimework developed for this plan
involved several steps. First. a series of principles. objectives and actions were developed to
guide the process. A policy framework was then drawn to help move towrirds this vision. Third.
locations of present use and values. present and future conflicts and opportunities. and methods
of resolving these conflicts were identified through extensive public consultation. The final stage
of the fiamework included monitoring and plan revision as required (LSPC. 199 1).
A similar commission was established for the Mackenzie Delta-Beaufort Sea region. The
general goals and objectives of this commission included instituting a community-based
planning process with the end result of a fair balance of land and resource use. developing land
and resource plans based on community priorities, developing ongoing planning capability in
northern cornrnunities, and establishing a planning process in comrnunities.

As with LSRP. the framework involved visioning first, followed by the identification of goals
and recommendations for each land use type based on community consultations. Land and
resource plans were then devetoped based on community and regional priorities. The plan was
tiien to be implemented, monitored, and revised as required (MBPC, 199 1 ).
The NLUP program tvas terminated in 1992 due to Federal government Iùnding cuts.
Although the recommended plans were never implemented. a considerable amount of data had
been ctlllected for the LSRP and were used to develop an informative atlas on the region. Very
littte came directly out of the MDBSRP, althouçh the tieed for land use planning in the
Northwest Territories is being reconsidered through various land claim negotiations.
Ontario Strategic Land Use Plan
The Strategic Land Use Plan (SLUP) was introduced in the early 1970s as an initiative of the
Ontario Ministry of Natural Resources (OMNR) in response to increasing land use conflicts
arising from single-project plans. It was designed to help OMNR attain its goal of providing
"opportunities for outdoor recreation and resource development for the continuous social and
economic benefits of the people of Ontario and to administer, protect and conserve public lands
and waters." (SLUPP, 1980).
SLUP was designed to: be fonvard looking and work towards pre-stated objectives, ensure
public participation, consider a11 alternatives and tradeoffs involved, be dynamic and long-term.
and allocate land to most efficient use while recognizing that the natunl environment has a
limited ability to withstand stress (SLUPP, 1980). The framework employed involves three
different levels: provincial, sub-provincial and district.

First, provincial objectives and policies were developed and used to produce sub-provincial
plans. At the sub-provincial Ievel, specific objectives and policies were then establ ished for each
individual resource (eg. forestry. tourism. mining). Subsequently. these objectives and policies
were used to develop strategies specific to each resource. Al1 resource strategies were then
çombined. aiid iiiiey rüied w ih pruv iitcid alid d q x u v iiiciui puiiciei uirl ubjcciivcs. LU deveiup a
tactical land use plan for each of the study areas. Targets based on tliese strategies were then
specitied for each district. and a more local planning process was designed to follow (Miller.
1981).
The final plan arising from the SLUP proccss was announced in June 1983. Althouçh many
details of SLUP were never implernented due to a change of government in May 1985. a
significant outcome of the process was the establishment of 155 new parks throughout the
province which are stiil present today (Killan, 1993).
2.3.2 CHALLENGES
Although the idea of large-scale. comprehensive planning is a good one in theory. there are
mmy challenges involved in applying CRLUP in practice. blnny of these obstacles arise due to
the inherent complexity of planning. For instance, CRLUP is expected to (CORE. 1994:9):
- inregrate economic, socid und environmenml vuhes;
- nssist decision-muking where decisions have major political, economic, social und environmental impacts;
- foster discussion and seek ivorkabie and sourid uccornmodation.s where conflicts exisr;
- engage the public su that their needs and preferencrs are responded ro:
- plan for and maintain land and water ecosystems bmed on scient@ understanding;

- bridge jurisdictional gaps;
- coordinute the manugemenr capubilities of'chflerenr agencies towurds common objectiva.
Several other challenges associated with land use planning were highlighted by Brown
(1996). These include dealing with cornplex and broad scopes. working with poorly detined
visions or desired States, and the need to consider multiple and ofien contradictory viewpoiiits.
Moreover, a lot of pressure arises frorn the tàct that the effects of the decisions are far reaching
and long lasting, that stakes are usually hi&, and good information is typically lacking. Given al1
these compIicating factors, it is almost certain that CRLUP will not and can not meet absolutely
al1 of the expectations imposed on the process. It is therefore necessary to carry out planning
exercises in spite of these challenges. as in the four case studies reviewed obove. The strengths
and weaknesses of each framework are reviewed in the following section.
2.3.3 ASSESSMENT .4ND EVALUATION
In order to evaluate the effectiveness of these four frameworks. each one is reviewed in light
of how well they fultilled the key characteristics of CRLUP identikied in Chapter I (direction
seeking, interactive and interest driven, anticipatory, comprehensive. cornples. continuous.
issues-focused, cleorfy defined roles, time conscious, and flexible and adaptive). For ench
characteristic, a question was developed. The four frameworks discussed above were then
evaluated in light of these questions. Findings are summarized in Table 2.6.
Al1 four fnrneworks addressed the need for iin overall vision or set of goals and objectives to
work towards and the need to involve the public right frorn the outset. In addition, al1 four were
designed to examine large snidy areas in which al1 potential future projecrs would be considered,


to consider multiple alternatives. and to be flexible by incorporating future modifications as
required. Only CORE, LSRLUP, and MDBSRLUP appropriately integrated social, econornic and
environmental concerns and clearly defined stakeholder roles. SLUP designed policies for each
category independently and made no effort to integrate them. and never explicitly stated which
stakeholders would be involved and how. makinç role detinition unclenr. Only the Lancaster
Sound plan provided a tirne line for plan implementation, and al1 four plans failed to achieve
sontinuity over time. as they were al1 terminated with changes in overnrnent funding before
implementation.
2.3.4 LINKS TO PARKS
Scientific research has demonstrated that ecological health in parks depends on naturd
processes in areas surrounding parks (Nelson. 1993). In addition. since parks generally are too
small to withstand stresses arisinç both inside and outside boundaries, "regional environmental
management is an absolute necessas component of managing protected areas" (Theberge. 1993).
Recognizing that ecological integrity is linked to the regional ecological setting, Parks Canada is
encouraging cooperative regional land use planning and management in areas surrounding
national parks (Parks Canada, 1999). Indeed, the notion of regional cooperation and integnting
the park with its surroundings is expressed in the national parks policy (section 2.1.7).
In theory, parks would benefit frorn the application of the key characteristics of CRLUP to
park planning. Incorporating more CRLUP principles may also address sorne of the many
concems raised by Searle in his recent book on the declining state of Canada's national parks
(Searle, 2000). Many CRLUP components have already been built into park planning processes.

For instance, all national parks are mandated to maintain ecological integrity. giving individual
parks and the system as a whole an end state. or vision, to work towards. Most parks also seem to
have a strong sense of which issues are of greatest importance given the park's unique
circumstances. l n addition, national parks already benet3 from continuity over time and clearly
defined d e s due to the national-level coordination by Parks Canada.
Sorne CRLUP components are only in place at certain national parks, as park planning and
management varies somewhnt among different parks. For example. sorne national parks have
incorporated the cornprehensive and complex components into their planning and management
through the application of the "greater ecosystem" concept (eg. Fundy. Pukaskwa). where parks
are rnanaged as components of a Iarger system.
In general. Parks Canada's performance can be further improved by bener incorporating
additional aspects of CRLUP siich as anticipation and interaction. .4 greater focus on anticipatory
aspects would help identify issues before they arise and nllow park stafîto take the necessary
steps before the issue becomes problematic. In addition. encouragement of greater public
participation. panicularly of Aboriginal people and other local residents, will help to cnsure
greater cooperation and long-term maintenance of Canada's national parks.
2.4 CUMULATIVE ENVIRONMENTAL EFFECTS AND ASSESSMERT
Issues can become increasingly complex at the large space and tirne scales involved in
CRLUP. At these scales, the nsed to address the sources, pathways, and overall impacts of
cumulative environmental effects becornes more apparent. Since the ultimate purpose of the

-
rnethodology to be developed in Chapter 3 is to limit cumulative environmental et'fects (CEEs)
around parks, it is important to review the concepts behind CEEs and their assessment.
In the following sections, sources, pathways, and ensuinç impacts of CEEs are outlined
(section 2.4. i j. Gerierüi appruaciies &cr CEA art: tlieii c j i ~ c u s d . alùi~g v* Itli ii rt-\ isu u f ~ii1üci:
ecosystem components (section 2.12). Several frameworks for regionai CEAs are then presentrd
(section 1.4.3) and analyzed (section 2.4.4). Finally. the need for recognizing CEEs and carrying
out CEAs in national parks is discussed (section 2.4.5).
2.1.1 CUMULATIVE ENVIRONMENTAL EFFECTS
The concept of cumulative environmental et'fects (CEEs) can be divided into three distinct
sections: sources of change. pathways of accumulation. and impact accumulation (Spaling and
Srnit, 1993). The interrelationship arnong these three dimensions are highlighted in Figure 1.3.
and discussed below.
In a broad sense. developrnent activities are the main sources of CEEs. According to Sonntag
et al. (1987), these activities fit into four main types based on time frame and spatial scale:
- single acrivis, : a single project which is spatially well-contained and takes place over a short time frame (eg. hydro-electric dam construction).
- mrrlti-componenr activify : a single project with a number of components being developed sequentially or simultaneously (eg. oilfield and associated transportation facilit ies).
- mrrltiple uctivip : activity invoiving miiltiple sources due to the construction of seveni faciiity types of a varied nature over an extended period of time over large distances (eg. multiple point source ernissions in an area).
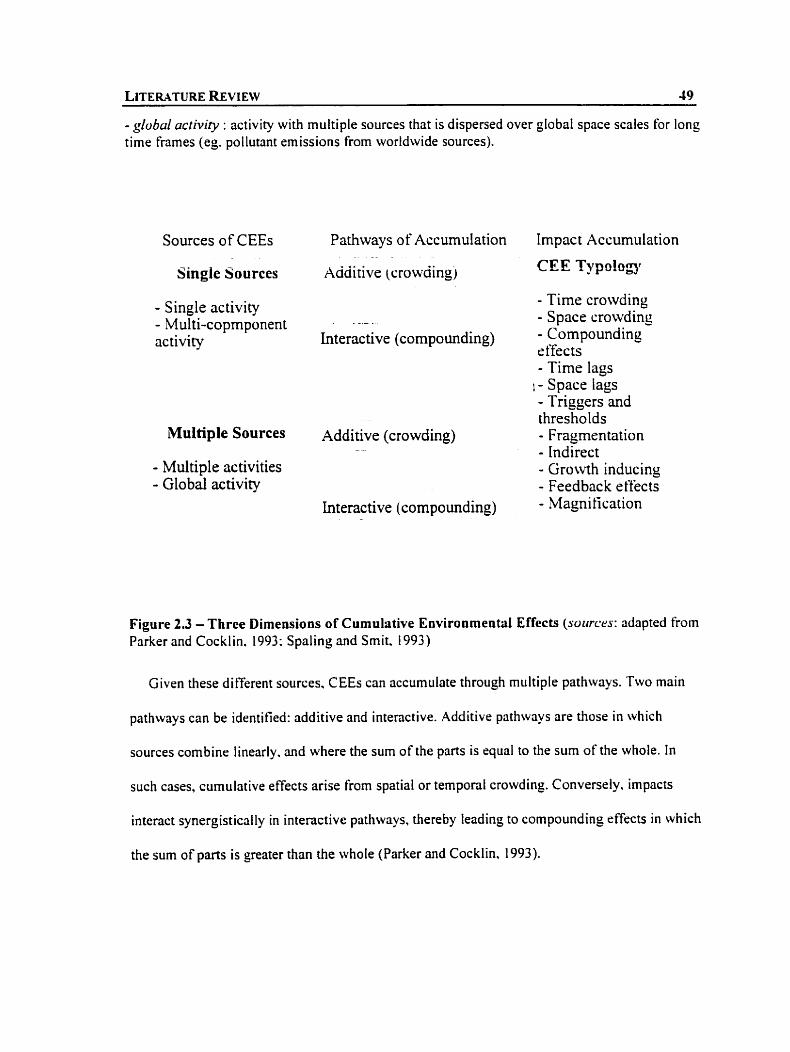
- gfobal uctiviry : activity with multiple sources that is dispersed over global space scales for long time frames (eg. pollutnnt emissions from worldwide sources).
Sources of CEEs Pathways of Accumulation . -. .
Single S ources Additive (crowding)
- Single activity - Multi-copmponen t .
activity Interactive (compounding)
Multiple Sources - -
Additive (crowding)
- Multiple ac tivities - Global activity
Lnteractive (compounding)
Impact Accumulation
CEE Typology
- Time crowding - Space crowding - Compounding e ffects - Time Iags
1 - Space lags - Trigprs and thresholds - Fragmentation - Indirect - Growth inducing - Feedbac k e fiects - Magnification
Figure 2.3 - Three Dimensions of Cumulative Environmentül Effects (sources: adapted from Parker and Cocklin. 1993: Spaling and Smit. 1993)
Given these different sources, CEEs crin accumulate through multiple pathways. Two main
pathways can be identified: additive and interactive. Additive pathways are those in which
sources combine Iinearly. and where the surn of the parts is equal to the sum of the whole. In
such cases, cumulative effects arise from spatial or temporal crowding. Converseiy. impacts
interact synergistically in interactive pathways, thereby leading to compounding effects in which
the surn of parts is greater than the whole (Parker and Cocklin. 1993).

Once various CEE sources have accurnulated through various pathways, a number of different
impact types c m be identified. Although CEEs have been classified in a number of ways (see
Spaling and Smit, 1993). a commonly accepted typology of cumulative effects can be
summarized as follows (Lawrence, 1994; Spaling, 1994; Sonntag et ul.. 1987):
2. Spaw crowding: high density of impacts on a single environmental medium: inability of system to recover From close perturbation before new one
3. cornpountiing gffects: synergistic efiects due to multiple sources on a single environmentai medium
4. rime lags: long delays in experiencing impacts
3. spuce lugs: impacts resulting some distance from source
6. rrig~ers and rhresholds: impacts to biological systems that fundamentally change system behavior
7. inciirect: secondary impacts resulting from a primal activity
8. jrugrnentution: change in landscape pattern
9. growtii inducing: results in spin-offactivities or estûblishes precedent for additional activity
1 O. ferdbuck effects: indirect impacts that loop back and compound direct impacts
1 I . rnagnzjicution: bioaccumulation
2.4.2 CUMULATIVE EFFECTS ASSESSMENT
As was mentioned in Chapter 1, CEEs are analyzed and evaluated through cumulative effects
assessments (CEAs). The foundation of the Canadian Environmental Assessrnent Research
Council in 1986 led to the popularization of CEAs (Duinker, 1994). Awareness of CEEs and

- -- -- - - - - -- - --
CEAs increased further when provisions for the consideration of cumulative impacts were
introduced in the 1995 Canadian Environrnental Assessment Act (Drouin & LeBlanc, 1994). The
legislative basis for CEA is also currently being updated in the five year review of this Act
(Bruce, 1999).
CEAs are performed in a number of different ways. Nurnerous existing methods for CEAs
were reviewed by Smit and Spaling (1995), and are summarized in Table 2.7. The first six
methods are usuaily employed more for project-specific CEAS, whereas the last four are more
likely to be used for regional CEAs for planning purposes. Generaliy. a combination of two or
more approaches is recommended for the most effective assessments. as each rnethod has
associated strengths and weaknesses (Smit and SpaIing, 1995).
Since CEAs can become very broad and cornpiex, many practitioners narrow the scope of the
assessrnent by focusing on valued ecosystrm componenrs (VECs) and valued socioeconomic
cornponents (VSCs). The concept of VECs and VSCs, how they are identified. and how they are
used in CEAs is discussed briefly before reviewing frameworks for CEA.
Valued Ecosystem Cornponents
Beanlands and Duinker (1983) defined a VEC as "a biological resource that has ecological,
social, andor economic significance and which, if affected by the project, would be of concem
to scientists, managers, government regulators and the public.'' VECs have been selected at a
variety of different hierarchical levels, ranging from population level (Hegmann. 1995; Dome el
al., 1982) to habitat (Ecologistics, 1994) and Iandscape (Ramsay. 1996). Population level VEC

LITERATURE REVIEW 52
Table 2.7 - Methods for CEA (source: Smit and Spaling, 1995).
Category Main Feature 1 Mode of Analysis Representative Method(s)
Spatial analysis Geograp hic Information Systems
Map spatial changes over time
YeWork analysis
Sequential geograp h ic analysis
Loap analysis. Sorenson's nehvork
ldentify core qtnictiire 1 Flow dia-nms:
Landscape anaiysis
and interactions of a system
Biogeograp hic analysis
nehvork analysis
Interactive matrices
Analyse structure and function of landscape unit
Reçional pattern analysis
Argonne multiple matrix, synoptic matrix, extended CIM
Sum additive and interactive effects; identiQ higher order effects
Ecological modeling
Matrix. multiplication and aggregation teclin iques
Hypothetical modeling of forest harvesting
Model behavior of an environmental system or component
Expert opinion
Mathematical simulation modeling
Cause-and-e ffect diagramm ing
Pro blern-solving using professional expertise
Multi-criteria evaluation
Croup process techniques
Multi-attribute tradeoff analysis
Use of a priori criteria to evaluate alternatives
-- --
Prograrnming models
Weighing of parameters and computational ranking of scenarios
Linear programrning -
Optimize alternative objective functions subject to specified constraints
Land suitability evaluation
Mass-balance equations
Land disturbance target. ecosystem- based planning
Use ecological criteria to specifi location and intensity of potentiril land uses
Process guidelines
Define acceptable levels of ecosystem heaith and target thresholds utilizing ecoIogical indicators
Snohomish guidelines, CEA dec ision tree
Logic frarnework to conduct CEA
Systematic sequence of procedural steps
selection involves the identification of "indicator species" most vulnerable to development.
Habitat and landscape approaches, on the other hand, generally have a broader focus on essential
ecosystern components. Several case studies which used VECs at these different hierarchical
levels are reviewed below. dong with a discussion of how VECs were selected for each study
and how they were used in the actuaf assessment.
Hegmann ( 1995) did a case study of the potential CEEs arising from Kluane National Park
and Reserve's 1995 park management plan review. For this study. he identitied five population-
levet VECs as: grizzly bears. moose, Dall sheep. mountain goats. and golden eagles. These
particular species were selected because they were identified as the most susceptible to
development in the park management plan and there was considerable value and concem
associated with these particular species in the litenture. Grizzly bears were also selected because
they are of prime research importance to the park and there is a relatively high amount of data
available. Other than discussions with park staff. no fom of public consultation was carried out
to determine social, econornic, andor cultural values of residents. Once VECs were selected,
potential interactions between these species. projects and associated effects were highlighted. A
series of working hypotheses were then dnwn based on these interactions. and used to guide the
assessment of potential cumulative effects arising from proposed and existing park management
practices.
Dome et al. ( 1982) also took a population-level approach when study ing the potential impacts
of hydrocarbon development in the Mackenzie Delta-Beaufort Sea area. Unlike Hegmann.
however, species that were most valuable to the local people were identified as VECs after
several rounds of public consultation. This included species valued for rneat or furs, such as

- - --
~ h a l e s , foxes, waterfowl. and caribou. A series of matrices was drawn, with al1 potential
environmental eftècts listed vertically and al1 VECs listed horizontally. Potential impacts were
then estimated for each VEC as negligible, minor, moderate, or major. Mitigative rneasures and
other recomrnendations were then made in light of potential impact severity and the importance
of the VEC of concern to the subsistence econorny.
A somewhat different approach to the identification of VECs involves the use of habitat.
Ecologistics ( 1 994) took a habitat-level approach while rissessing the effects of cumulative
impacts on the nrttural characteristics of the Oak Ridges Moraine in the Greater Toronto Areri.
Habitat level VECs for aquatic. terrestrial, visual/cultural, and natural resources were identified
through a literature review. Examples of these VECs include Class 1 wetlands. significant tïsh
habitat. coldwater streams. areas with Iiigh forest interior coverage, rireas of natural and scientific
interest. areas of high aesthetic importance, and aquifers for town water supplies. Once
identified. a significance and sensitivity ratinç was given to eacli VEC. These scores were then
combined to give the overall vulnerability of the VEC. which was in turn compared to the level
of anticipated changes to give a tinal risk level (high. medium. low) for each VEC. It was then
recomrnended that programs be designed to rnonitor the VECs at greatest risk
On an even broader scale, Ramsay (1996) used VECs at the landscape level to assess
cumulative effecü dong the Niagara Escarpment in southem Ontario. She used a combination of
landscape (forest interior) and population (neotropical migrants. rare or endangered species,
declining species) level VECs in her assesment. An indicator species was selected for each
VEC. The significance o f the cumulative effects of landscape change were then assessed with
respect to the effects on these indicators. The assessrnent included the consideration of impacts

on iandscape features such as patch size, shape and dispersion, as welt as interna1 forest
composition and rnaturity stage, and landscape diversity.
Many studies have also identified VECs at more than one of the aforementioned hierarcliicat
scales. For instance. whiie considering the porentiai impacts of diamonci m ining in the Nonhwest
Territories, the N WT Diamonds Project identified a number of VECs. The main components
identified as vnluable to local residents at public meetings included wildliîè related to
subsistence (eg. caribou. grizzly bear, furbearers), water quality for fish, rskers as critical
wildl i fe habitat areas. and wilderness areas for the associated heritage, aesthet ic and spiritual
values. For each VEC, the potential et'fects were evaluated. mitigation measures discussed, and
monitoring prograins andor researc h projects suggested ( EAP, 1 996).
The West Kitikmeot/Slave Study ais0 selected VECs rit ri variety of scales. Key VECs
ident ified included caribou. critical wildlife habitats, grizzly bears, fish. muskoxen. wolves,
eskers. permafrost, quality and quantity of ground and surface water, and air quality. As with
many of the previous studies, the potential interactions of these VECs with devdopment
activities and effects were then used to focus the CEA and to identify future research needs
(GeoNorth and AXYS, 1997).
There are numerous other studies which have used VECs to narrow the scope of
environmental assessments. However. the cases reviewed above provide a sufficient overview of
the varying approaches to how VECs are identified and applied in CEAs. From these studies, it is
ciear that VECs can be identified at a variety of hierarchical scales, ranging frorn population
(Hegmann, 1995) to landscape (Ramsay, 1996). Species and population level VECs are good
because they provide a clear focus, and are easily observable. However, some important
community, landscape or ecosystem level features rnay be overlooked if only a few key species
are selected. Although the VECs selected Vary widely based on the location and scope of the
rissessment. it would be ideal to select a variety of VECs at multiple hierarchical levels. This
way, species or populations of prime importance socially (eg. subsistence) and ecologically (eg.
vulnerable) can be included while also considering larger scale attributes which provide a more
holistic view of the ecosystems.
The case studies also demonstrated chat there are a number of different approaches ro
identifiing VECs. ranging from the public-oriented approaches of Dome et al. ( 1982) and EAP
( 1 996) to the more theoretical approaches of Hegmann ( 1995) and Ramsay ( 1996). Since a focus
on too many theoretical aspects may noc be entirely representative of public opinion. and
likewise popular public opinion may not represent all ecosystem components which are of value
ecologically. a balance behveen theory and public opinion will likely result in the most realistic
VECs.
Valued Socioeconomic Components
Since cultures and Iifestyles are also considered as valuable components, many assessments
include not only VECs but also VSCs. This is particularly true in northern areas where the well
being of the residents is still highly interrelated with the surrounding environment. A VSC can be
defined as a "cultural, social or economic aspect of the environment which. if affected by
development, wouid be of concern to regiotial residents a d o r government regulators."
(GeoNorth and AXYS, l997:6).

I t is important to note that not ail assessments use the term "VSC". In many cases.
socioeconomic factors are included under the VEC listings. For instance, in the study by
Ecologistics (1994) discussed above, aesthetics and town water supply were identified as VECs
dong with fish habitat and forest cover. in other cases, valuable ecological and socid
components are combined into one tem. valued ecosvstem and cultural components. or VECCs
(eg. DI AND. 1998). Regardless of the terminology used. it is important that cultural and
socioeconomic values be addressed in CEAs.
The BHP Diamonds Project identified the following VSCs in addition to VECs mentioned
above by EAP ( 1996): community stability/immigration, economic development.
employmentftraining. families. historicûl sitesiburial grounds. human health. traditional
knowledge. tnditional lifestyle. territorial lands. benetit sharinç/partnership. wage rconomy.
culture. outtitters. and land use and stewardship (BHP, 1995). Likewise. the West
KitikmeotJSlave Study identified aboriginal land use. aboriginal resource use. commercial land
use, culturallhistorical sites. and human health as VSCs (GeoNorth and Axyys. 1997). In general.
VSCs are identified through public consultation and are used in assessments in the same manner
as VECs.
2.4.3 APPROACHES TO REGIONAL CEA
There are many conceptual frarneworks thnt have been proposed for CEAs to apply the
approaches mentioned above. Since the focus of this thesis is on regional CEAs and northern
national parks, a brief discussion is pmvided for conceptual f'meworks dealing specifically with
regional ievel assessments either in the Canadian north or around national parks. Four
frarneworks are reviewed from: the West Kitikmeot/Slave Study (19971, Kluane National Park

LITER-\TURE REVIEW 58
and Reserve (1995). Prince Edward Island NationaI Park (1996), and a general framework for
Canada's national parks ( 1995).
The West Kitikmeot/Slave Study was initiated in 1994 as a joint initiative between the
Department of indian A t h i n and Fionhem Uevelopment (UIAIUU) and the N \h 1 Oepanmenr of
Renewable Resources. One objective of this study was to examine the potential cumulative
impacts arising from existinç and potential mining developments and related infrastructure. To
do so. the CEA framework employed involved four steps. At the outset, VECs and VSCs were
identified through a series of public consultations. Al1 potential developrnents. associatcd
activ ities. and environmental effects were then identitied. Next. possible interactions of
VECs/VSCs with activities and effects were evaluated and ranked on ri scrile of 1 to 5 . with 5
representing potentially significant interactions. This ranking was derived from a predetermined
scheme based on the extent (local. regional. provincial. national), magnitude (more or less than
10% of the resource affected). and duration (short, medium or long) of the activities and effects.
The various pressures and effects of all potentinl developments were compiled into a "master
list". which was then used in conjunction with the valued components/activi~ effects framework
rankinçs to guide future discussions on cumulative impacts (GeoNorth and AXYS. 1997).
CEEs are also becoming of greater concem around Kluanr National Park in southwest Yukon
due to the presence of nurnerous small-scale developrnents. A case study by Hegmann (1 993)
used a framework consisting of four levels: bseline. screening, anaiysis, and
sumrnary/conclusions. During the fint stage, baseline information to be used in the analysis was
collected. This included information on ps t , present and future regional projects, park resources,
and the driving forces and implications of human use in the region. VECs were also selected in

LITERATURE REVIEW 59
th is stage. Next, the screening level invo Ived identiS)ing the environmental effects of each
project. synergies in space and tirne arising among projects. and the potential effects of projects
on wildlife. Known cause and efTect relationships were then used to develop a few impact
hypotheses to be used in the next strige. In the analysis level, hypotheses were analyzed by
prec!ic!log effp.c!i cn pnpli!a!l~n viehi!iy and ecmyçtem fiinction, prnjecting these effects into
the future (ie. scenarios), and evaluating the potential combined rffect of increrised activity
throughout the study area. Finally, significant effects and the projects causing them were
surnmarized. Potential CEEs were then used to draw conclusions regarding the ptoposed projects
and implications of these projects for park management.
Parks Canada has also expressed concern over the declining ecological state of Prince Edward
Island National Park (PEPJP). This concern mises mainly because the park is srnall in size, it is
easily accessible and receives high visitation. and there is a high level of existing development. A
CEA was therefore performed for the park and surrounding areris by T. Keith (1996). ln carrying
out the assessment, Keith ( 1996) used the following framework. First. historicnl environmental
change for the study area, such as forest removal. coristal erosion. and road construction were
out lined. Individual and cumulative effects of previous and current developments and rictivities
in the park were then described in detail. Subsequently, potential CEEs arising from proposed
concepts, developrnents or activities in the drafi park management plan were discussed in order
to gain a perspective on potential future developments. Once the potential CEEs of past, present
and future developrnents within park boundaries were discussed, effects originating outside the
park boundary were then considered. The significance of al1 impacts rirising inside and outside
park boundaries were then assessed with respect to key resources or VECs. Given these potential

impacts. possible mitigation measures were highlighted, and monitoring stntegies suggested for
each key resource.
Kalff (19%) developed a framework specifically for CEAs in Canadian national parks. One
main goai oîdevrioping rhis irümrwork was io aiiow iiie betier iiitegraiiuii or pürk piatiiiitig üiid
EIA at a scope beyond park boundaries. The proposed framework is outlined in Figure 2.4. I t
consists of 3 interconnected subsections: sources of CEEs. assessment of CEEs. and management
of CEEs. Sources of CEEs include effects arising from policies. programs and projects. Note that
these effects can ririse both inside and outside park boundaries. To assess CEEs. a three-tiered
assessment framework was designed. This framework considers CEEs rit three nested scales:
regional. park-level. and project specitic. For al1 tiers. the tïrst srrp is to establish park goals and
identify valued ecosystem components (VECs). For national parks. the critical park goal should
31~-s be the maintenance of ecological integrity. Once goals and VECs have bern defined. al1
three tiers follow somewhat different procedures, as indicated in Table 2.8. However. they dl
have the same genoral components of defining boundaries. drscribing the surrounding
environment. describing past. present and future land use activ ities. assessing effects of CEEs on
VECs. and monitoring. The final subsection involves managing the CEEs through park policies
and planning and regional planning initiatives. This step is crucial to the maintenance of park
ecological integrity. as park management actions and reçional plans can encourage impact
mitigation. lirnit future harm ful developments, and minimize the ovenl l potential for the
accumulation of future CEEs.

Environmental change extemal to park
Sources Environmental change of intemal to park
Cumulative Effects Assessment
œ Regional Park-level Project-level
W analysis CEA EN
Regional planning
Weak 4 --
Reg ional
Park control
Scale
Change
Assessment of
Cumulative 4 E ffects
Management Park~olicies ofcurnuIitive and planning effects
S trong m
Local
Figure 2.1 - CEA framework for Canadian National Parks (source: Kalff. 1995)

Table 2.8 - CEA steps for Canadian National Parks (sotnrce: Kalff. 1995)
1 Define regional boundaries
3 / Dercribe regional ecolagy
Step Regional Analysis Park-level CEA
t
Project-level EIA
4
Establish park goals and identify VECs
Describo and map regional land use
5
1 blonitor changes in human activities and land use
ldenti'jl and map economic growth patterns in region and sketch likely economic land use scenarios
6
Describe park ecology
identify ecological problems which cire rit'fecting. or may atlfect. park VECs
Assess current status of VECs
Establish specific goals for erich VEC
Descri be pst. present. and 1 ikely future development
Establisli cause-effect linkages
Assess significance of cumulative efyects on VECs
Undertake cumulative effects monitoring
Describe project and receiving environment
Estabtish project boundaries
identitj, environmental et'fects of proposêd development and the VECs most likely to be affec ted
Analyze cumulative e ffects
Assess signi~lcance of cumulative effects
Ensure that information is fed into park assessrnent
2.4.3 ASSESSMENT AMI EVALUATION
Evaluation Criteria
With so many possible approaches to regional CEAs, some key criteria for these assessments
would be useful to guide the discussion of strengths and weaknesses. In a recent report, Kennett
(1999) highiighted five main components essential to regionri1 CEAs in his new planning-based
paradigm for CEA. First. he recommends that a proactive, planning-based approach must be
adopted to replace project-specific CEAs as the main tool for identiQing CEEs. This is because a
regional, comprehensive scope is more consistent with the nature of CEEs than the traditional
more localized scope. Second, the new paradigm calls for strong govemment leadership, as
opposed to the traditional proponent-driven approach. This component is included in order to
partially circumvent tlie often inappropriate and unattainable expectations placed on project
p p o n e n t s . The third component involves establishing objectives. thresholds. and explicit limits
for land and resource use, with the aim of creating a list of priorities and thresholds to guide
future decisions. Fourth. Kennett sugpests that cumulative effects management must take on a
reçional focus since CEEs often occur over broad landscapes. Finûlly. the tifih cornponent of the
new paradigm involves the establishment of a direct linkage behveen planning and environmental
assessment. Kennett argues that this linkage is necessary if project-specitk cumulative impacts
are to be consistent with regional land use objectives.
Al1 five of these principles are repeatedly mentioned throughout the regional CEA literature
(eg. Clark. 1994: Cooper and Zedler. 1980). In addition. since al1 tive components relate to the
goals of this thesis, they will be used in the following section to evaluate tlie strengths and
weaknesses of the various frameworks presented above.
Framework Evaluation
As with the CRLUP evaluation in section 2.3.3. a series of questions have been derived based
on the criteria suggested by Kennett (1999). These criteria and questions are presented in Table
2.9 dong with an evaluation for each of the CEA frmeworks discussed above.


No ftameworks were specifically tied to a regional planning process or regional goals. The
three park frameworks were tied into the park planning process, but didn't go beyond.
Government involvement was much more successful, as d l studies were initiated and funded (at
least partially) by a government agency. There was a wide variety of application of thresholds -
Hegmnnn and Ksitli hoth recornmended the irnplementation o f use limits and visitor quotas in the
most heavily used areas. Kalff also incorporated the idea of thresholds. except these were not set
as limits of development but were rather used to determine the amount of stress VECs could
undergo. Since al1 frarneworks were designed for regional CEAs. the study area boundaries are
broader than one would expect in a project-specific assessment. However. Hegmann restricted
h is study to the area within park boundaries, which detncts from the comprehensiveness of the
study. Surprisingly. none of the frameworks tffectively addressed the question of making a link
between planning and environmental assessment. All of the park assessments recommended that
cumulative effects be considered when evaluating project-specific assessments and when
planning within park boundaries. but these recommendstions did not go beyond jurisdictional
boundaries.
2.4.5 LINKS TO P W
The plight of Canada's national parks with respect to cumulative impacts has been discussed
in Chapter 1. CEEs can accumulate anywhere and transcend d l political boundaries. and pnrks
are no exception. For this reason. it is becoming increasingly important for parks to specifically
address the potential for impact accumulation arising fiom sources both internai and extemai to
park boundaries. Application of the CEA criteria discussed above in park planning and
management could assist in the identification and mitigation of CEEs accumulating in and
around national parks in a number of ways.

Indeed, aspects of Kennett's new CEE paradigm have already been incorporated into national
park planning and management. For instance, it is already widely accepted that parks need to be
managed in a regional context both to maintain park ecological integrity and to gain a better
understanding of environmental effects arising outside park boundaries. Sorne examples include
the Greater Fundy Ecmyctern aroiind Fiindy National Park in New Bninswick (Franklin. 1997)
and various applications of UNESCO's Biosphere Reserve Mode1 ( IUCN. 1979). I n addition.
since national parks are govemed by a federal agencÿ, tliere is already substantial government
involvement in any park-initiated CEA. A guod example of this is the initiation of the Banff-Bow
Valley Study in 1994 (BBVS, 1996). More and more parks are also starting to incorporate the
notion of tliresholds within their boundaries through park zoning and the establishment of visitor
use quotas.
However, there are a few areas of the CEE paradigrn that could be improved upon in order to
muimize understnnding of CEEs in and around national parks. Fur instance. if Prirks Canada
were to cake an ant icipatory. large-scale planning approach in which park goals and objectives
are linked to the broader objectives. this would encourage al1 stakeholders to work towards a
compatible vision for the park and surrounding areas. This vision could involve setting
development thresholds which go beyond park boundaries to help limit activit ies before
environmental effects accumulate, and enable a proactive stance on CEEs. Lastly. a stronger link
must be made between regionnl planning and environmental assessments in order to provide a
broader planning contert for project-specific decisions. This would limit the CEEs arising from
incrementai project approvals and ensure that ail developments would be aligned with regional
objectives (Kennett, 1999).

Four main themes have been reviewed in this chapter: protected areas selection. northem
national park management, comprehensive regional land use planning, and cumulative
environmental effects and assessment. For protected areas selection. criteria used in selecting
nntzr2! I~P-s were ~oviewed (Smith 2nd nieherge, 19116) 3 r d three euarnpleî of the application o f
these criterin were provided (Parks Canada. 1994: Eagles. 1980; Theberge rr al., 1980).
Ecologicol boundary considerat ions IiighIighted by Theberge ( 1 989) and Parks Canada ( 1994)
were also discussed.
Five aspects of northern national park management were then discussed. Thme were:
ecological integrity. scosysrern-based management. threats. environmental asses?rnents. and
monitoring. For each section. a definition was provided. its relevance to park management
discussed. and existing frameworks reviewed (PEICNP, 2000; Parks Canada. 1998; Parks
Canada, 1994; Woodley. 1994).
Frameworks from four comprehensive regional land use planning exercises were then
reviewed (CORE. 1996: MBPC. 199 1 ; LSRLUPC. 1989). This was followed by ri discussion of
the key challenges of CRLUP and an assessrnent and evaluation of the four frameworks. The
utility of CRLUP in park management was then discussed.
Finally, CEEs and CEAs were reviewed. First, sources and pathways leading to CEEs were
highlighted (Spaling and Srnit, 1993). Common rnethods of CEA were then briefly presented
(Spaling and Smit, 1995), dong with a discussion of VECs and VSCs (eg. EAP, 1996;

LITERATURE REVIEW 68
Ecologistics, 1994). Several frarneworks for regional CEAs in the North and in national parks
were then reviewed. assessed and evaluated (GeoNorth and AXY S. 1997; Ka1 ff, 1995). This
section concluded with a discussion of how CEEs and CEAs are relevant to national parks today.
( i i Cliapier 3 . ilii- intcriiiiiûn~ ziïiüng ~ ~ S S C fûüi t h ~ i i i ~ BTS hi&li&i~d. znd ilic ündcrlying
principles of the themes are used to develop a set of çuiding principles for the development and
impternentation of the proposed methodology. An overview of the proposed methodolosy is then
given. and eacti stage cfescribed in detail (Figure 2 .5 ) .

Problem Definition (Chapter 1 ) -
Literature Review 4 Themes:
- prottctcd areas selcction - park manngemtnt - CRLCJP - CEE and CEA
(ChripJcr 2 ) -
Overview of . MethodoIogy
(Section i 3.3)
--- - -- Guiding 1 Guidhg
a Stage1 1 1
Stage 2 1 Database 1 Hotspots 1
(Section 3.4.1) ? (Section 3.4.2) 1
Principles for Methodology
Case Study (Chapters 4 and 5 )
Tbeme Principles for
(Section 3.1) '
Conclusions Fu tu re
Appiications (Sections 6.1 and 6.21
. . .
- -
Methodology - - -- La Evaiuation
(Section 6.3) - - -- - -
i Goal
I Appplication
(Section 3.2)
Goal 3
* Interactions ' Methodology 1 Devdopment (Section 3.2)
Figure 2.5 - Conceptual Map of Thesis.
I

- - - - -- - -- - -- -
The purpose of this chapter is to develop a methodology to be used to help identifi areas of
concem for regional cumulative impact assessments in and around northem national parks. In
this chapter, the interactions among the four themes reviewed in Chapter 2 are discussed (section
3.1). Principles derived from the four themes in Chapter 2 rire then used to develop a set of
guiding principles for the methodology (section 3.2). An overview of the proposed methodology
and broad links to the literature are then presented (section 3.3). This is followed by a step-by-
step description of the methodolog (section 3.3).
3.1 THEME INTERACTIONS
Although discussed independently in Chapter 2. the four themes - protected areas selection,
park management. cumulative environmental effects and assessrnent, and comprehensive
regional land use planning - are actually Iiighly interrelated, as illustrated in Figure 3.1. These
interactions are important to undentand as al1 four themes are used together to develop the
methodology proposed in the following sections. A brief overview of these interactions is
provided below, with leners in brackets referring to the arrows in Figure 3.1.
Pmtected areas selection methods provide the selection criteria and boundary considerations
required to establish national parks (a). Within national park management, we see a feedback
loop starting with the park7s mandate to maintain ecological integrity (b) through ecosystem-
based management practices (c). This entails specific inclusion of threats (d). both interna1 and
external, which are evaluated through project-specific environmental assessments (e).
Monitoring programs (0 can then be established for potential impacts or other sources of
concern, giving feedback to ecosystem-based management and helping to ensure the maintenance
of ecological integrity (g).

Park b Ecologicnl Ecosystem Management )lntegrity %lanagement ) Threats
CRLUP eg. CORE, SLUP
f e Monitoring 4 EIA 4
v - - b Regional
Cumulative Sources and 0 Cumulative p cumulative Impacts * pathways ' Effects Effects -- - Assessrnent
Figure 3.1 - Interrelations Among Four Thesis Themes, as described in test.
METHODOLOCY 72
Park ecological integrity (h) and regional threats (i) also both tèed back into the protected
areas category. potentially influencing the establishment of future protected areas in the same
region. For instance, if a park's ecological integrity was declining due to the presence of
numerous threats. this might encourage the estabiishment of another nearby protected area andor
rcsu!t i:: mudifier! pvrk h c u d x i e s .
Park management is also connected to CRLUP (j) becouse a key aspect of managing parks
today is to go beyond park boundaries and view the park in a regionol context. By doing so.
CRLUP can influence the effectiveness of ail aspects of park management (k). In addition,
CRLUP exercises may contribute to the establishment of new protected areas, sucfi as in SLUP
(1). CRLUP also feeds into the cumulative impacts category (m), as it becomes necessary to
address sources and pathways (n). overall impacts of cumulative environmental effects (O). and
the need for regional CEAs (p) at the large scales involved. Sources and pûthways ~Fcumulative
impacts also lead to threats affecting national park management (q). while thesr threats in tum
give rise to other potential cumulative effects (r). Finally. regional CEAs can be csrried out in
conjunction with CRLUP processes (s).
3.2 GUIDINC PRINCIPLES FOR DEVELOPMENT AND APPLICATION OF THE METHODOLOCY
Figure 3.1 shows that the four themes reviewed in Chapter 2 are highly interrelated. The four
themes rnay therefore be integrated to provide guiding principles for the developrnent and
application of the proposed methodology. To develop these guiding principles, the key
characteristics of the themes presented in Chapter 2 are briefiy reviewed, and guiding principles
recomrnended in each of the sections below. All guiding principles are then compiled and
classified in the final section.

Protected Areas Selection
Protected areas selection criteria were reviewed to set the broad context by providing some
insight into the values and criteria that protected areas are established to protect. This literature
contains hvo main aspects. First, the need to identiQ priority areas as a focus for implementing
. . . . . . . cûnçcr;a:;ûn :n::;a:il;cs :; ;nhc:znt ta the o..h2!2 iUc3 behicd rsnblishinz C prctrrted ~ 2 2 s . Serox!,
the literature provides an overview of numerous social and ecological values requiring special
attention when considering future land use activities and regional impacts (eg. Parks Canada.
1994: Theberge, 1989; Smith and Theberge. 1986).
Thus, if the methodology is to take account of the protected areas selection literatiire. it needs
to incorporate the following guiding principles:
- provide a means to select arens where achieving the proper balance between environmental
protection and economic development is of greatest importance: and
- explicitly address the social and ecological values of the study area.
Northern National Park Management
Since these aspects of park management set the framework within which the methodology
wilI have to function, severai guiding principles must be derived frorn pruk management
procedures. Five cornponents of national park management were reviewed in Chapter 2.
The ecological integrity literature focuses on the need to have measures andor indicators at a
variety of hierarchical scales. and provides some mesures and indicators useful for identieing
ecological values (Parks Canada, 1998; Woodley, 1993). Ecosystem management encourages the
consideration of social and ecological values at broad scales using ecologically sound boundaries

(Grumbine, I994). It also emphasizes the importance of understanding human impacts through
EAs and CEAs, assimilating existing data, and viewing ecosystems holistically (Parks Canada,
1994). The notion of interna1 and extemal threats emphasizes the need for a regional perspective
in order to effectively rninirnize regionat stressors. The environmental assessment literature
1 . iiighiighis the tlccd tu bé pr i )à~ i ik -è 3ild p i d i i l ù i ; l d d ~ 2 ~ 3 i j ü i ~ ~ i i d i i ~ i p ~ i c i ~ ~ C : ' G T C fh~j- . LùXüi~ii
problematic (CEAA. n.d) and to more fully integrate assessrnents into park planning (PEICNP.
2000). Finally. the monitoring literature focuses on helping to understand long-term human
impacts, the need to recognize threats, and the importance of long-term maintenance of
ecological integrity ( Woodley, 1 994).
In order to effectively function within the existing park management process. the
rnethodology needs to incorporate the following guiding principles:
- take account of the recommended ecological integrity monitoring measures;
- consider social and ecological values of the study area while rissimilating existing data, and
working towards a better understanding of hurnan impacts;
- take a regional perspective on threats;
- maintain a proactive stance on environmental impacts and integrate environmental assessment
more fu1Iy with park planning; and
- focus on long-term human impacts.
Comprehensive Regional Land Use Planning
Since the rnethodology proposed below is intended to be used for planning purposes. it is
important that it also be developed with principles derived from the CRLUP literature in mind.
Al1 CRLUP examples reviewed in Chapter 2 were goal oriented and forward looking. CRLUP is

a regional exercise by nature. and thus highlights the need to consider regional developments and
their impacts nt larger spatial and temporal scales. In the case study. there was also a substantial
effort to integrate social, economic and environmental aspects of the study ûrea, incorporate
public values. and be flexible. In addition, most plans were issue-focused and anticipatory
(CÛW, 1494; LS?C, 199 1; :*IBPC, 1991: SLL'PP. ma). Ûtlicr &i)CSi5 ùf ihdi heft2 i lV i
particularly well incorporated into the examples in Chapter 2 include reasonable tirne lines.
clearly defined stakeholder roles. and contiiiuity in tirne.
In order to effectively function within the CRLUP frarnework. the methodology needs to
incorporate the tollowing guiding principles:
- establish clearly defined goals at the outset:
- work at a larger spatial and temporal scales;
- integrate social, econornic and environmental aspects:
- incorporate public values:
- rnaiiitain flexibiIity;
- focus on key issues and most promising solutions;
- clearly define stakeholder roles;
- achieve continuity over tirne:
- work with realistic tirne restrictions; and
- anticipate future developments before they arise.
Cumulative Environmental Effects and Assessrnent
The CEA Iiterature was reviewed because the ultimate purpose of the methodology is to Iimit
cumulative environmental effects (CEEs) around parks. The VEC NSC literature highlighted the

need to consider social and ecological values at multiple hierarchical scales. Severai case studies
were also reviewed and evaluated in light of how well they satisfied five criteria: ( 1 ) proactive
and planning-based, (2) government leadership, (3) use of objectives. thresho Ids, and expl ic it
limits for land and resource use, (4) regional focus. and (5) direct linkage between planning and
txiviru~~rne~~td iihhcs~11e1iL.
In order to effectively address CEEs. the methodology needs to incorporate the foltowing
guiding principles:
- incorporate social and ecological values at multiple hierarchical scales:
- be proactive and planning-based;
- have government leadership;
- identiS, land use objectives and thresholds:
- maintain a regional focus; and
- link planning witli environmental assessrnents.
Compilation and Classification of Guiding Principles
The guiding principles listed above can be classified into two sets of principles: one set to
guide the developrnent of the actual methodology. the othrr set to guide the potential for future
applications of the rnethodology. These bvo sets are presented in Boxes 3.1 and 3.2 respectively.
The guiding principles outlined in Box 3.1 are used to develop the methodology presented in
the sections 3.3 and 3.4. The principles in Box 3.2 are used to guide the discussion on potential
applications of this methodology and to evaluate its ovenll utility in Chapter 6. They are listed in
no particular order, as al1 criteria are considered equally important.

Boa 3.1 - Guiding Principles for the Development of the Methodology
Guiding Principles for MethodoIogy Development L l
1 . Provide a manner to select a r e s where achieving the proper baIance behveen environment and developrnent is of greatest importance. 2. Incorporate social and ecological values of the study area. 3. Take account of the recommended ecotogical integrity monitoring measures. 4. Work at a regional scale. 5. Assimilate information within study area bcundaries.
Box 3.2 - Guiding Principles for Potential Applications of Methodology
Guiding Principles for Methodology Application
1 . Take a regional perspective on threats. 2. Maintain a proactive stance on environmental impacts and integnte environmental assessment more fully witli park planning. 3. Focus on long-term human impacts. 4. Establish clearly detïned goals. 5 . Integrate social. economic and environmental componenis. 6. Maintain tlexibif ity. 7. Focus on key issues and most promising solutions. 8. Clearly define stakeholder roles. 9. Acliieve continuity over time. 1 O. Work with realistic tirne restrictions. 1 1. Anticipate future developrnents before they arise. 12. Work towards a better understanding of past, present and future human impacts. 13. Be proactive and planning-based. 14. Have government leadership. 15. Identiw land use objectives and thresholds, 16. Link planning with environmental assessments.
- -
3 3 OVERVIEW OF PROPOSED METHODOLOGY
The proposed methodology involves creating a database of social and ecological values, and
locating areas with high concentrations of these values. or value hotspots. This database and
spatial overview of value concentrations may then be applied in proactive regional planning
exercises and CEAs to help minirnize CEEs. These potential applications are reserved for

discussion in Chapter 6 . This section provides an ovewiew of wliy the methodology was
developed (section 3.3.1 ) and the stages involved (section 3.3 2).
3.3.1 JUSTIFICATION
+* i lit: i~izliiuduiugy iiüb bccii J ~ ~ c l u p c c l diüciiiJ llic iiütiüri ùf'sûcial ai;d ~;ûlûgica~ ;.düss f;;r
two main reasons. First, the guiding principles outlined in Box 3.1 specify the need to assimilate
existing information to select priority areas while integrating regional-level social and ecologicai
values. In addition. since the methodology is designed to deal with CEEs. a paraIlel has been
drawn behveen the role of VECsNSCs in focusing the scope of a CEA and the role of the values
database and hotspots in selecting priority areas for proactive regional planning. CEAs dien use
VECs/VSCs. or environmental cornponents identified as valuable to people and likely to be
affected by development. as a means of narrowing the scope of an assessment. The sarne idea is
applied with the methodology, except that rather than focusing on one particular ecosystem
aspect (eg. sand dune. rnoose) and assessing the impacts of development on that component.
areas with concentrations of values are identified to be incorporated into a planning timework
to establish land use limits and levels of acceptable change before CEEs arise (see Chripter 6 for
further discussion). The rnethodology also makes provisions for the presence of outstanding
values through the option of using a weighted ripproach as discussed in section 3.3.2.
3.3.2 METHODOLOGY DEVELOPMENT STAGES
Note that an underlying assurnption of the methodology is that study area boundaries have
aiready been defined based on the goals and objectives of the particular case study. It is not the
intent of this thesis to review issues surrounding definition of appropriate study area boundaries

and scaIes. Nevertheless, study area boundaries must be properly documented and justified
before carrying out either of the two stages involved in this proposed methodology.
Stage 1
TL t lie first stîgo inrûlvcs dsrdoping a daîzbiix üf ralüc; Uj. ;Ain5 an inïcn;ûcj ûf z!! sûîia!
and ecological values within the study area. This stage is included to fulfil the second. third.
fourtli and fifi11 guidelines listed above: incorporate social and ecological values of the study
area. take account of the recommended ecological integrity monitoring measures. work at a
regional scale, and assimilate information within study area boundnries.
A broad overview of potential social and ecological values is given in Tables 3.1 and 3.2
respectively. Ali these potential values were derived from the litenture on protected areas
selection, eco log ical monitoring merisures. and VECs/VSCs.
In genenl. most social values arise from consumptive. non-consurnptive. and recreational
activities. The importance of consumptive wildlife based activities was revealed through a
review of VECs/VSCs in section 2.4. For instance, Hegmann ( 1 995). LGL rr ul. (1985) and
Dome et al. (1982) al1 used ecosystem components that were valuable to the local economy
andor subsistence when canying out environmental impact assessments. Non-consumptive and
recreational activities were also included in this tabIe because severd authors have identifred
criteria such as areas of recreational, educational, scientific, and interpretive value (Smith and
Theberge, 1986: Margules and Usher. 198 1 ), aesthetic importance (Eagles, 198O), or cultural,
archeological, and native importance (Hans-Bastedo, 1986) as valuable. reviewed in section 2.1.

It is important to note that this list is by no means comprehensive but rather it may serve as a
guide to provide suggestions for determining the most important social values.
Table 3.1 - Social Values Derived from Literature.
Activity
Consurnptive wi ldlife-based activities
Values - Subsistence hunting - Subsistence fishing - Recreation and Sport fisheries - Trapping - Big g m e outfitting and recreation iiunting
- W i ldlife viewing and photography species and locations - Aesthetics of large tracts of undisturbed wildemess - Cultural/heritage appreciation sites - Sites of educationalhterpretive value - Sites of scientific value
3. International Biological Programme sites b. Heritage Rivers c. Special Preservation Areas d. Environmentally Significant Areas
- Canoeing - Kayaking and rafting - Motor boating - Hiking - Biking - Natural appreciation sites - Camping sites - Skiing - Dog mushing and snowmobiling
As per ecological values, most abiotic values were derived from discussions on ecological
boundary considentions (Theberge. 1989). environmentally sensitive ares (Eagles, 1980), and
valued ecosystem components (Keith. 1996). Biotic criteria were derived from national park
management, protected areas. and VECNSC litenture discussed in Chapter 2, especially from
Parks Canada ( 1 998), WoodIey ( 1 994). Theberge ( 1989). Smith and Theberge ( 1986). and
Theberge et al. ( 1980). Most of these values either deal with rare. endangered, threatened,
vulnerable, or unique biotic and abiotic attributes which increase landscape heterogeneity and

-
contribute to regional biological diversity, or with species or populations that are either
particularly sensitive or vulnerable to hurnan activity and/or play a major role in mointaining
ecosysterns. Again, it is important to note that the purpose of tlie list was not to be
cornprehensive but rather to provide a general framework to guide the selection of valuable areas,
su riew çriieria riiay bz a d h l wliciii Jesireci. Deiaiib c,ii iiow ic, iiiveii~ury iiicsc vüiucs are
discussed in section 3.4.
Table 3.2 - Ecological Values Derived from Literature.
C riteria 1 Values
Abiotic
Stage 2
The second stage to developing the methodology involves using the values database to
Geomorpholoçical katures - Rare, endangered. threatened, vulnerable or
detemine areas with concentrations of ecological and social values. or 'bvalue hotspots". When
identieing these hotspots. it will be useful to enter ail data collected into a Geographic
Information System (GIS) and analyse the spatial distribution of values across the study area
through a series of rnaps. Using a GIS would also enable the data to be stored in a format that is
both easy to access and update. Details of how to identifi value hotspots are discussed in section
3.4.
Hydrologicnl feritures
Species/population level features
Comrnunity/Ecosystem level features
- Rare, endangered, threatened, vulnerable or unique hydrological katures - Rare, endangered. threatened, vulnerable or unique floral and faunal species - Hypersensit ive species - Key prey species - Surnmit predators - Migratory and spatially dernanding species - Habitat specialists - Regionally uncomrnon or rare vegetation comrnunities - Hi~hIy diverse cornrnunities or ecosystems

3.4 STEP-BY-STEP METHODOLOCY DESCRIPTION
Section 3.3 provided an overview of the hvo stages involved in developing the proposed
rnethodology. This section provides detailed descriptions of how to cany out those stages.
3.4.1 STASE 1: CW.\TE DAT.%B.\SE OF EIEGION.4L V.4LL'ES
As was mentioned above. this stage involves takinç an invcntory of social and ecological
values within the study area. The nece s sq steps required to identiQ these values and store the
data in a useful manner are reviewed below.
First. the social values listed in Table 3.1 must be identified. The most obvious wny to leam
the social values of the study area is to deal directly with the public at large. A variety of public
consultation approaches exist. such as public meetings. worksliops, one-on-one interviews (eg.
with government workers. trappers. hunters. outtitters. First Nations. NGOs. etc.). mail
questionnaires, or relephone surveys (Babbie, 1995). The method used may be selected brised on
time availability, responsiveness of the public. and the financial budget of the project. The extent
of public consultation - from local to national - woutd also va-. depending upon the nature of
the research. For instance, research involving values associated with a municipal park would be
more localized than, Say, research involving vaiues associated with a national park.
A review of the existing litenture will also provide insight into social values. In particular,
consulting past environmenta1 assessments and protected areas studies that have been carried out
in the study area will show ecological aspects h a t were recorded as socially valuable. In
addition. local reports on issues such as indigenous and local knowledge, wildiife, tourism,

METHODOLOGY 83
visitor surveys, and local planning issues will also be a valuable tool when cietermining social
values.
In addition to social values. the methodolou also requires that ecological values bc defined.
habitats. tnditioiial ecological knowledge, planning, and environmental assessments. Interviews
with knowledgeable individuals who have worked nnd/or lived in an area for an extended period
of time (ie. indigenous and local knowledge) will also be key resources in determining al1
potential regional values. Primary field surveys would also be ideal. both to confirrn existing data
and to collect new data. if time and financial resources permit.
Once al1 social and ecological values have been identified, they may be inserted into the first
column of Table 3.3. Then. key species listed for consumptive wildlik based activities and
wildli fe viewing mny be speci tied and speci fic çeomorphological. hydrological. and
species/population level fentures listed under the appropriate value. Nexr. key locations for each
of these values may be listed in the second column. Finally. information sources may then be
recorded in the third column for future reference. These data may also be stored in a GIS for the
reasons discussed above in section 3.3.2.

Table 3.3 - TabuIating Social and Ecological Values.
Values l Key Location (s) I Source(s)
Etc.. . 1 1 ECOLOGICAL VALUES Unique geo- 1 Feature I 1 I
I
SOCIAL VALUES Subsistence ( Species 1
Highly diverse community 1 1 I
1
morphology katures
3.4.2 STAGE 2: IDENTIFY VALUE HOTSPOTS
I
Feature N
The second stage involves identifying areas within the study areû that support a hipli nurnber
of values. or social and rcological value "hotspots". This stage is included as it provides a basis
for implementing the methodology by identifiing sites requiring special consideration in future
studies on the lonptenn well being of the park and surrounding region. as required by the first
guideline in Box 3.1. Again. specific rxamples of how the methodology may be used in future
studies are discussed in Chapter 6.
Value hotspots are identified through three steps. First. the study area must be subdivided into
smaller zones to form a zoning system that will provide a basis for tiiture planning applications.
Recall that the boundary guidelines outlined by Theberge ( 1989) - summarized in Table 2.1 -
Focus on keeping wildlife ranges and key abiotic features intact. Based on these guidelines. the
following approach to zoning is recommended. At the outset, key wildlife habitats, abiotic
components, and dominant phy~io~gaphical features must be mapped. Given the size of the study
area, a decision rnust be made as to how many zones are desired and the approximate area each

zone should encornpass. Wildlife habitat maps and physiographicat features cari then be overlaid.
and zone boundaries drawn based on obvious habitat-physiography associations. For instance, in
a study area that contains both rnountains and valleys, one rnay see that moose habitat is largely
concentrated in the river valleys while mountain goat habitat is concentrated in the mountains.
Givrn hcse a~ruciüiiuii~, iwu diffcréiit Wildj iaii bc diiiihïï - ~ i ï < : iû C i i i ù i i i P i i S S i k ï ipûïkn
habitat. the other to include alpine habitat. Zone delineation will v a s considerably based on
study area topography and the chancteristics of the wildlife species present (eg. migratory.
habitat specialists). However, boundaries must always be drawn to be ecologically relevant by
encornpassing units of critical wildlife habitat and major physiographic katures whi le keeping
zone area as close to the desired size as possible.
It may also be possible to use an existing zoning system tliat is brised on physiographical and
ecological features as opposed to deriving a new one. For instance. the ecodistrict level of the
Ecological Land Classification procedure r n q be suitable for these purposes if the data are
available for the study area. Discretion rnust therefore be used when selecting or creating a
zoning system. with due consideration to both the data availability and the ecological
characteristics of the study area.
Second, once a zoning system bas been derived for the study area. the total number of values
in each zone can be tabulated and stored in the data table frarnework presented in Table 3.4. All
locations identified as valuable in Table 3.3 are listed in column 1 of Table 3.4, and al1 social and
ecological values listed across the top of the rnatrix in row 1. The values present in each zone are
then recorded in this matrix and summed across the entire row. tt is at this stage that storing the
values database in a GIS becomes useful, as the maps may be used to spatially display the key
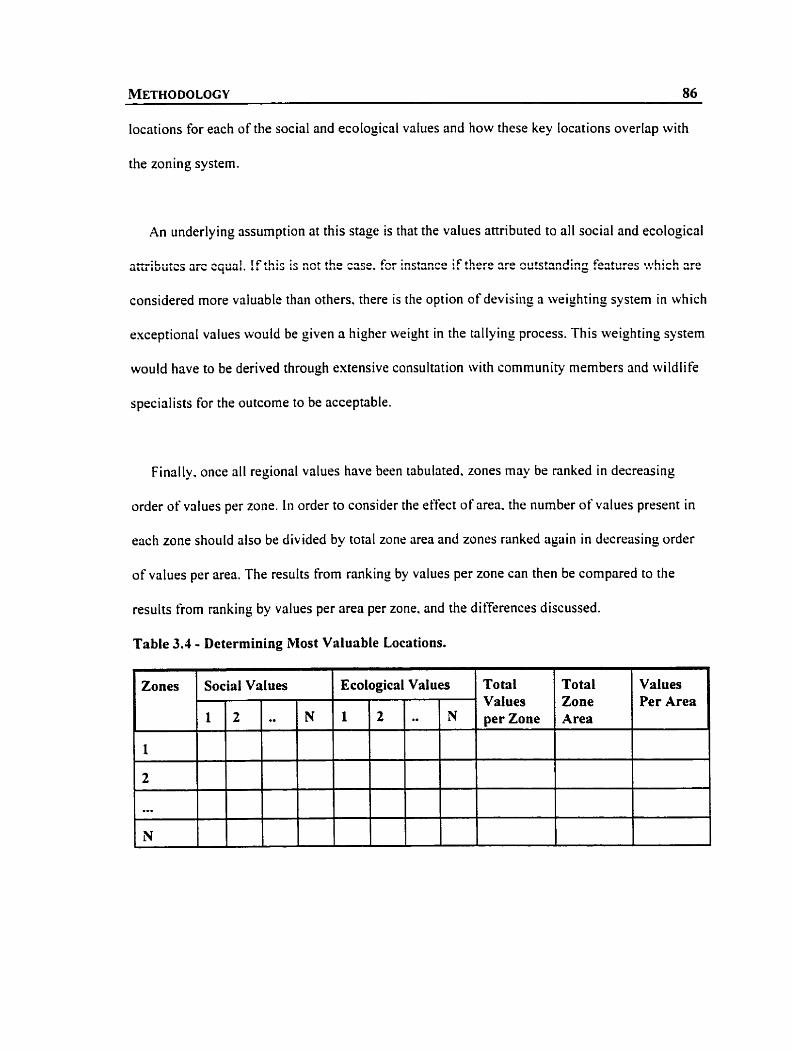
locations for each of the social and ecoIogical values and how these key locations overlap with
the zoning system.
An underlying assumption at this stage is that the values attributed to al1 social and ecologicai
considered more vriluabIc than others. there is the option of devising a weighting system in which
exceptional values would be given a higher weight in the tallyinr process. This weighting system
would have to be derived through extensive consultation with cornrnunity members and wildlife
specialists for the outcome to be acceptable.
Finally. once al1 regional values have been tabulated. zones may be ranked in decreasing
order of values per zone. ln order to consider the effect of area. the number of values present in
each zone should also be divided by total zone area and zones ranked again in decreasing order
of values per area. The results from ranking by values per zone can then be compared to the
results from ranking by values per area per zone. and the differences discussed.
Table 3.4 - Determining Most Valuable Locations.
Total Values per Zone
Zones
1
2
... N
Ecological Values Total Zone Area
Social Values Values Per Area
N 1 N 1 2 2 --

--
3.5 SUMMARY
Two sets of guiding principles were derived frorn the literature reviewed in Chapter 2. The
first set of guidelines was then used to develop a methodology. A broad overview of the
methodology was provided first. followed by a step-by-step description of the proposed
iii~ihùdùIügj. Iii gçiîcral, thc 5rsî çagc iii~~ûtvcs dcrclûpiug a U a i ~ b a x üf sücial and cculugical
values through public consultation, interviews. literature reviews. and field surveys. Key
locations for each of these values are then identified after a thorough literature review.
incorporating indigenous and local knowledge, and field surveys. The second stage involves
determining social and ecological value "liotspots" through the use of a series of tables and GIS
overlays. These areas may then be given key consideration in future studies on long-term goal
setting. limits of acceptable change. and studies on the cumulative impacts of human activities. as
discussed in Chapter 6 .
Although this methodology nppears useful in theory, it must be tested in practice. A pilot
application of the recornmended rnethodology was therefore carried out in the Greater Kluanc
Region of southwest Yukon. Case study background and results are presented in Chapters 4 and
5 respectively (Figure 2 2).

Pro blem Definition (Chapter 1 ) -
Literature Review 4 Themes:
- pratected areas selection - pwk maangement
. - CRLUP - CEE and CEA
2)
Guiding Guiding Principles for Theme Priaciples for Methodology + interactions Methodology Xpppiication (Section 3.1 ) Development
(Section 3.2) (Section 3.2)
Overview of . Methodology
(Section 3.3)
Stage 1 Stage 2 Da ta base Hotspots
(Section 3 - 4 1 ) (Section 3.4.2)
1
CaseStudy i (Cbspttrs 4 and
. - ..
Conclusions - --a Future
Applications (Sections 6.1 and 6.2)
Methodoiogy - - - - - - Evaluation
(Scction 6.3) - - - - - - - - -
Goal 2
Figure 3.2 - Conceptual Map of Thesis.

The applicability of the methodolog developed in Chapter 3 was tested through a case study
of the Greater Kluane Region (GKR) in southwest Yukon. The purpose of this chapter is to
present relevant background information for the GKR. First. the exact location and boundaries of
the study area rire outlined. The main reasons Yukon and the GKR were selected for the case
study are also discussed (section 4.1). Second, abiotic and biotic characteristics of the GKR are
examined to give an ecological overview of the study area (section 4.2). Third. past and present
land use, and present land administration in the GKR are outlined to expiain the social and
managerial aspects of the study area (section 3.3). To conclude, a brief history of park. planning
and assessrnent studies is provided (section 4.4). Crise study results and discussion are reserved
for C hapter 5.
4.1 LOCATION
The GKR is located in the southwest corner of Canada's Yukon Territory. The oficial
boundary of the study area was defined according to the Greater Kluane Land Use Plan. and is
presented in Figure 4. I (YLUPC. 1990). The area is bounded by the British Columbia and
Alaska borders to the south and west respectively. The northeastem boundary extends from the
Alaska border at approximately 63 "North, and continues southeast dong the Nisling River past
the eastern side of Kusawa Lake to the British Columbia border.
The GKR inciudes several small communities, Kluane National Park and Reserve (KNPR),
the KIuane WiIdlife Sanctuary (KWS), and portions of the Haines and Alaska hiçhways.
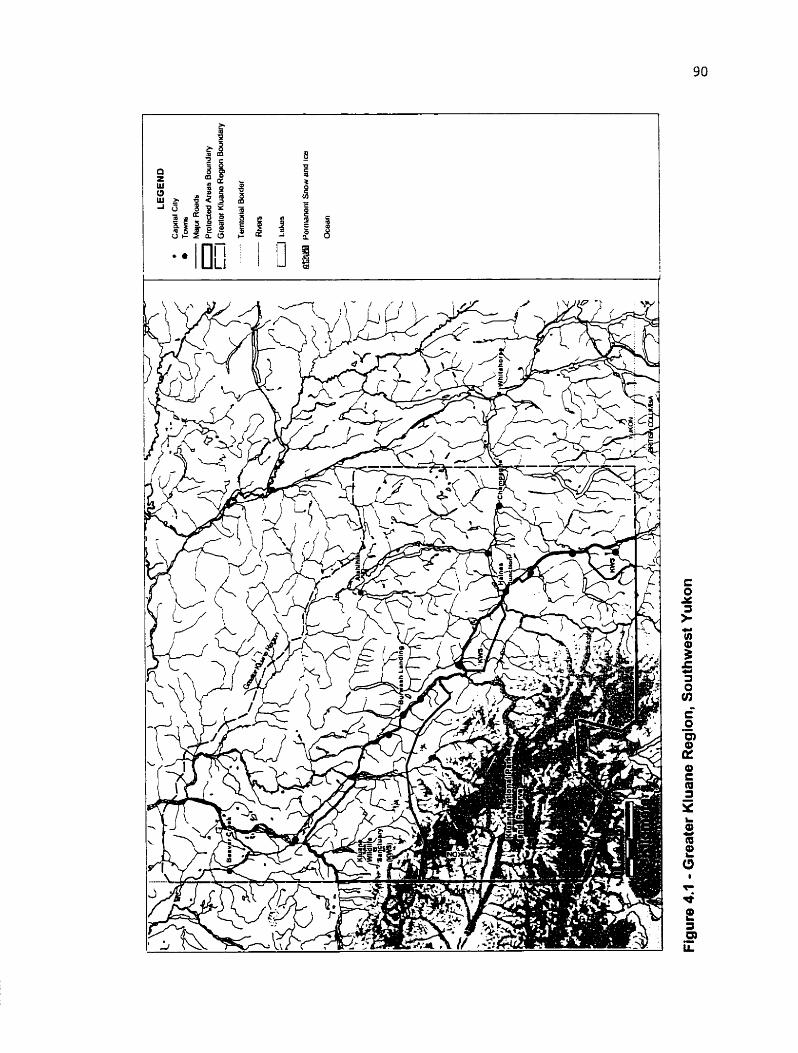

Yukon, and the GKR in particular, were selected for the case study for a nurnber of reasons.
First, northern ecosysterns are quite sensitive to hurnan disturbance and Ilence cumulative effects
may have pronounced impacts in northern regions such as Yukon. In addition, the Environment
Branch of the Departrnent of Indian Affairs and Nonhem Developrnent (DLAND) has been
- t - ' ~ L k ; i r b .ttirrrr >uv~L;t;i:ia! r.rL + .
~t ' fû f i i~:û ; i~ ;~!ûi ; i t lg a ~ i t ~ b ! ~ CE.2 m c i h c d ~ ! ~ ~ t'gr th2 Yukcfi T ~ ~ i t c y ,
and was interested in suggestions for approaches to proactive regional planning to minimize
cumulative effects (Mueller. pers. comm., 1999). However, the entire Territory was too large to
use as a case study given the goals of the thesis. so the study was nanowed to focus on the GKR.
This m a was suitable for the methodology application because it contains a large and
ecologically diverse national park with impending threats Rom potential CEEs arisinç from
intemal and externa1 sources (Parks Canada. 1998). Also, a considerable amount of data for the
region were available due to previous work on cumulative effects (Hegmann. 19951,
environmentally significant areas (eg. Hans-Bastedo, 1986; Theberge et ul.. 1980). regional land
use planning (YLUPC. I W O ) . and many other research projects.
Ecologically speaking. it would be desirable if the case study boundaries extended beyond the
pol itically defined territorial border into Alas ka and British Columbia. However. for practical
reasons such as additional travel expenses and the difftculty of dealing with varying data
collection and stonge approaches, the case study only considers the aren located within the
Yukon Territory. In addition, although trans-border planning has been receiving incre~ing
attention in the past few years, it is likely diat there will still be a higher chance of implementing
the methodology if the study area boundaries overlap with existing territorial planning
frarneworks. For a fuller discussion of the regional ecology and trans-border park planning
considerations in the St. Elias region, see Danby (1999).

- -
4.2 Eco~ocrcrl~ ASPECTS
In this section, both abiotic and biotic aspects of the GKR are discussed. The physiography.
climate, geomorphology, and hydrology are presented tirst, followed by a description of tlora and
fauna.
4.2.1 ABIOTIC FEATURES
Phy siographically. southwest Yukon can be subdivided into 3 major parts (from west to east):
the St. E I i s Ranges. Shakwak Trench. and Ruby Ranges. The western part of the St. Elias
Mountains, ofien referred to as the Icefield ranges, is dominated by icefields. widespread
glaciers. and sharply serrated peaks that reach elevations of up to 6.800 metres above sea Ievel.
Canada's highest rnountain. Mount Logan, is located within these ranges. The eastern part. or
front ranges. of the St. Eliiis Mountains consists of the Kluane, Donjek. Bates. and Alsek ranges.
and is characterized by alpine glaciers. talus screes, nanow ridges, elevation-graded vegetiition
communities, and multiple river valleys. Average elevation for these ranges is approximately
2.000 metres above sea IeveI. The Shakwak Trench is a long, straight valley covered by glacial.
glaciofluvial. and rieolian deposits (Environment Canada, 1987). The Ruby Ranges are
characterized by older rnountains 114th several perigjacial features such as collovium. moraines,
and glaciofluvial sedirnents (Sauchyn, 1986).
A continental-subarctic climate dominates the GKR (Coates & Momson, 1988).
Within the GKR. the climate is influenced greatly by physiography, so the dominating climate in
the northem and southem parts differs considenbly. In the north, moisture fiom the Alaskan
Coast condenses and precipitates in the icefields before reaching the front ranges. The northern
pan of the GKR is therefore dominated by semi-arid, continental air masses due to the

rainshadow effect of the St. Elias Mountains. Converseiy, the southern part of the GKR is
considerably darnper, as wet air is channeled from the Aiaskan Coast up the Alsek valley into the
GKR (Environment Canada. 1987). For instance, estimated annual precipitation levels range
from 1200 to 2800 mm in the icefields, 800 to 1200 mm around Haines Junction in the south. and
400 tû 90V xm a:zur,d Bur;:ush, Lunding ir, th:: zzi,k (FzvIrr!?menr Cxzdz. ! 987).
The geomorpholog of the GKR arises largely from these climatic intluences. The major
geomorphological kature is the presence of discontinuous permafrost. Since the GKR is located
at the boundary benveen scattered- and widespread- discontinuous permafrost. features
associated with underlying permafrost (eg. solifluction lobes. Stone stripes, polygons) are fairly
comrnon at lower elevations in areas north of Kluane Lake. but are restricted to upper alpine
zones further south. However. the local distribution of permafrost still varies tvith site specitk
microclimatic conditions such as slope, aspect. and vegetative cover. Soi1 characteristics. such as
texture and drainage, also intluence the presence or absence of permafrost. Permafrost generally
occurs in Cryosols. tvhich rire found in southwest Yukon in addition to Regosols and Brunisols
( Environment Canada, 1 987).
The hydrolom of the GKR is dominated by five major drainage basins: the Yukon River
drainage to the northeast, Alsek River drainage to the southeast. Gulf of Alaska drainage to
Alaska panhandle in the southwest, Copper River drainage to Alaska in the north West, and
White River drainage to the North. Large Iakes of the region include KIuane, Kusawa, Aishihik,
SekuImun, Dezadeash, Wellesley, Kathleen, Mush, and Bates Lakes. Major drainage rivers
inciude the White. Donjek, Duke, Kluane, Slims, Kaskawulsh, Alsek, Aishihik. Dezadeash,
N isling, and Tatshenshini Rivers.

4.2.2 BIOTIC FEATURES
Dominant abiotic features such as elevation, climate. soils. and wind exposure largely
influence the nature of vegetation communities found in the G U . Three main life zones have
been identified - montane, subalpine, and alpine. The montane zone is located in valleys and on
iower siopes, up io i060 i i i iii eisva~iuii, i i i d is duiiiiiiaterl 'oy iicitrly coîitii~uuur wl l i t c ~prucc
interspersed with rnarsh. fen. halophytic, shrub, and herb comrnunity types. The subalpine zone
extends fiom IO80 to 1400 m and is dominated by ta11 shrubs (primarily willow, dwarf birch. and
dder) with scattered white spruce specimens. From 1400 to 1600 m. the Iandscape is dominated
by low knimmholtz shrubs up to 1 m in height. Above 1600 m. the plant species present depend
larçely on tirne of snowmeit. available soi1 moisture, rind aspect. in general, however, dominant
vegetative communities consist of low-lying vascular plants. mosses and lichens. Isolated
occurrences of these low-lying plants also occur on nunataks scattered throughout the icefield
ranges (Environment Canada. 1987). Overall, plant diversity in the GKR is ribnormally high for
northern regions because its flora consists of species from the coastal reçion. western mountains.
boreal forest. arctic tundra, rind northern prairies due to its location at the confluence of these
five zones (Parks Canada, 1998).
This array of vegetation supports a faunal diversity that is quite rich given the northern
latitude. For instance, the GKR supports globally significant populations of large terrestrial
mammals such as grizzly bears. Da11 sheep, and moose. It is also important for populations of
wolves. mountain goats, and caribou (Danby, 1999). This rich marnrnalian diversity is
complimented by the presence of a high divenity of avifauna such as rapton, owls, songbirds.
shorebirds, waterfowl, passerines, and upiand species. In addition, aquatic resources include

salmon. gray1 ing, whitefish, scul p in, trout. burbot, pike, and longnose suc kers (Env ironment
Canada, 1987).
In total, the GKR supports two threatened species (wood bison, and peregrine hkon unutum
i ihspe~:ie~j, àiiil fùur wlnsrablc :pc;ics (grizzly haï, ï;ûksïin;. ; h m - c a ï d ûx!. and Sqüanga
whitetlsh) as detined by the Cornmittee on the Status of Endangered Wildlife in Canada
(COSEWIC, 1999). There is also a wide variety of plant species thrit are rare in Canada. disjunct,
and/or endernic (Cody. 1996: Douglas et d.. 198 1 ).
4.3 SOCIAL ASPECTS
This section first provides an overview of the historical and present land uses of the GKR to
provide insight into the evolution of the region's economy. Then. roles of the various parties
involved in regional management are discussed to demonstnte the cornplexity of regional
management in the GKR.
4,3,1 HISTORICAL LAND USE
The GKR was first occupied by the Upper Tanana. Northern Tutchone. and Southern
Tutchone lndians as early as 1 1 .O00 years before present (Coates. 199 1). Historicaliy. these
groups led a nomadic. subsistence-based lifestyle dependent on fishing, trapping. and hunting.
Large groups would gather during the summer and faII to tïsh for spawning salmon and to hunt
migrating caribou. The people would then disperse into srnafler family groups for the winter and
spring to focus on srnailer scale harvesting activities (McCleilan. 1987). First direct contact with
Europeans was in the latter part of the 19' century, afier which the Tanana and Tutchone became
more heavily involved with the fur trade, exchanging f u n for western tools and guns.

Despite the presence of a successful fur trade, Yukon is known best for the Klondike Gold
Rush of the late 1800's. Thousands of prospectors immigrated to Yukon in search of gold
beisveen 1897 and 1900, and booming mining towns rippeared across the Territory. Since many
prospectors acccssed the Klondike through southwest Yukon, there was a massive influx of
pcûpls tu ihc GKR. Thc gûld rüshlsû !cd tû expcrimentz! ~griculture in Yukcn ic grder
sustain the ever-increasing population (Peake and Walker, 1975). In addition. harvesting wood
for transportation. mining, and domestic purposes increased during the gold rush era (NDC.
1993). Market and trophy hunting also becanie increasingly popular, and many big game
populations, such ris Da11 sheep and caribou. suffered fiom overexploitation in the years
immediately following the Klondike gold rush (McCandless. 1985). However. the economic
boom ended abruptly, and most of these açtivities were absent from the GKR by the 1930s
(McCrindless, 1985; Environment Canada. 1987).
The next big economic boom in the GKR came with the construction of the Alaska Highway
in 1942 due to the threat of Japanese invasion to Alaska (Environment Canada. 1987). The
highway led to increased access for mineral exploration and big game sport hunting, guiding and
outfitting, as well as a renewed interest in rigricultunl experimentation. Subsequently. a federal
eaperimental station was established in 1944 to explore the agricultural capabilities of the GKR
(Peake and Walker. 1975). Timber harvesting was aIso reactivated. primarily for purposes of
corduroy road construction, housing, and fuelwood (NDC, 1993). Mighway construction also
placed additional stress on wildlife, as newcomers "shot everything in sight" (McCandless.
I98S:88).

. -
Increased concern over the potential extermination of big and srnall game species led to the
designation of the Kluane Wildlife Sanctuary (KWS) in 1943. covering an area of 25,000 km' in
southwest Yukon (Environment Canada 1987). This area was supposed to be established as
Kluane National Park Reserve (KNPR) with the next National Parks Act amendment. However,
3fie: Wxrur!d %f.r !!. minem! exp!mztinn 2nd exrrxtinn cmtinued thrnughwt the GKR, and
mega-scale northern developments were strongly encouraged. High resistance from the mining
industry therefore delayed the establishment of K N P R in which none of these activities would
be pennitted, for 30 years (Theberge. 1975). Finally. 22.000 km' of the KWS were designated as
a National Park Reserve in 1972 (Environment Canada. 1987). It was not given full park status
because land claim negotiations with the Champagne and Aisliihik ( C A M ) and Kluane Firsr
Nations (Km) were still unsettled.
The presence of the National Park brought a new source of money for the local economy:
tourism. Tourism expanded rapidly over the next 20 years. In particular. activities such as
backcountry and frontcountry trail use. flight seeing tours. vehicle-based wildlife sightseeing,
outfitting on horseback, and canoeing became increasingly populnr (Hegmann. 1993; Dill et ul..
1997). The right to carry out subsistence harvesting on tmditional territories located within park
boundaries has aiso recently been recognized for the C A M and KM. Outside the park.
outfitting for big game tmphy hunting and sport fishing became increasingly popular.
4.3.2 PRESENT LAND USE
blany of these historical land uses are still present in the GKR today. Within KNPR most of
the aforementioned activities are increasingly popular. For instance, Hegrnann (1995) estimates
that rafting dong the major rivers increased 16-fold in only 4 years (1989-1993).

The CAFN and KFN have the right to carry out subsistence activities on their respective
traditional territories within park boundaries. A third First Nation group, the White River First
Nations (WRFN), also harvests in the GKR, but their traditional territory does not overlap with
the national park.
Outside park boundaries. small-scale mining are of regional economic significance. Currently.
there are three major sources of aggregate and minera1 potential in the GKR: ( 1 ) aggregates
suitable for construction material rilongside the highways, (2) minerals such as copper, nickel.
molybdenum. and gypsum in the Donjek and Alsek ranges, and (3) placer (gold) mining dong
the Burwash and Duke River areas. upper reaches and tributaries of Jarvis Creek. and dong the
Tatshenshini River area (LeBarge. 1 996; RCP. 1982). The mining industry will therefore
continue to play an important role in the GKR.
Logging operations are also of increasing economic and environmental importance in the
GKR. A widespread spruce bark beetle infestation in southwest Yukon has led to several
proposals for logging in the affected areas as a form of control and to salvage valuable timber
(Humphreys and Safrany ik, 1 993). In addition to ihese salvage opentions. it is estimated that
28% of the forested land in Yukon is capable of producing economically valuable tirnber (Y RR,
1993). Forestry activities in the GKR can therefore be expected to increase in the next few years.
Agriculture is another source of local economic income. Although the federal experimental
farm closed down in 1968, some agricultural activity is still taking place in the GKR today. A
total of 10 farms. covering 5378 ha, were reported in the GKR in 1991. The majority of these
f m s produce livestock (primarily hones, hogs, and poultry), animal products, field crops, and

horticultural items (DRR, 1994; White and Bisset, 1993). A new study of agricultural potential is
also currently underway within the CAFN traditional territory (Y. Harris, pers. comm. 1999)
Consumptive wildlife-based activities in the GKR currently include commercial, sport.
~übsisîcncc, aiid rccxatiûnat fkhiiig, big ganc mtfittiiig, sübsi~cucc Iiüiiti~g. aiid trzpping.
Commercial fisheries are located on Kluane and Hutshi Lakes, and depend primarily on
whitefish. lake trout. and burbot. whereas sport. subsistence. and recreational tisheries use both
freshwater and anadromous fish throuçhout the GKR (deGnff and McEwen. 1989; RCP. 1982).
Big gamr outfiners provide a guiding service for non-resident huniers and focus on species such
as Da11 sheep, caribou. moose. and grizzly bears (Tornpkins, 1996: DRR. l989b). Subsisterice
hunting by CAFN, KFN, and WRFN also focuses on species such as moose, caribou. and sheep,
and occurs on traditional territories throughout the GKR. Trripping for lynx. rnarten. wolverine.
wolf. fox. and otter is also common throughout the GKR, although the tirst three are most sought
after due to their high rconornic value (Tompkins, 1996).
Infrastnicture in the GKR is limited to two major highways (Haines and Alaska) and two
secondary roads leading to Aishihik and Kusawci Lakes. The five main communities are Beaver
Creek. Bunvash Landing. Destruction Bay, Haines Junction. and Champagne. Small villages of
Canyon, Aishihik. Hutshi, Koidem. and Snag are also present. Total year-round population in the
GKR, however, remains quite low at approximately 2000 individuals.
4.3.3 PRESENT LAND MANAGEMENT
Currently, the federal and territoriat government as well as three First Nations bands al1
participate actively in the management of the GKR. The Federal govemment is represented by

CASE STUDY BACKGROUND 100
both Parks Canada and DIAND. Parks Canada's involvement is restricted to within the
boundaries of KNPR, whereas DIAND administers the water, forests and minerals on most of the
remaining lands, including the KWS. The Yukon Territorial Government is responsible for
wildlife resources througliout the region, including the KWS, which are managed by the
Dèpilfii~~èni df Rzi~éfiabk Rcsuürces.
The signing of the Yukon First Nations Urnbrella final Agreement in 1990. and subsequent
land daims negotiations. have recognized traditional territory land rights of the Champagne and
Aishihik First Nations (settlement reached 1993), White River First Nation (settlement reached
1998), and Kluane First Nation (settlement pending). All three bands will therefore be fully
involved in future regional management schernes.
As an outcome of the CAFN land settlement, the Alsek Renewable Resources Council, ci
subdivision of the Yukon Fish and Wildlife Branch was created. It allows 3 Department of
Renewable Resources and 3 C A M appointed members to comment and make recommendations
on the management of renewable resources on C A M traditional tenitory outside KNPR. In
addition, the Kluane National Park Management Board was established to make
recomrnendations on the development and management of KNPR. It consists of 2 CAFN
members and 2 Parks Canada members. It is anticipated that once a settlement has been reached
with the KFN, 2 KM rnembers will also join this board. Furthemore, this settlement will likely
lead to the establishment of another Resources Council through the Yukon Fish and Wildlife
Branch. The WEUN settlement rnay also lead to the development of a new territorial park in the
north of KWS, around the Klutlan glacier.

- - -- --
-1.4 HlSTORY OF PARK, PLANNING AND ASSESSMENT STUDIES
Many studies carried out in the past 20 years in the GKR have proven to be quite useful for
the purposes of this thesis. They can be subdivided into three broad headings: protected areas and
critical habitat research, land use plans, and environmental impact assessrnents. Each subdivision
4.4.1 PROTECTED AREAS AND CRITICAL HA3ITAT RESEARCH
There are two main veins of research related to protected areas in the GKR: research relating
speci fically to KNPR, and environmentally signi ficant areas studies. l n addition. several reports
on critical wildl i fe habitats were derived from traditional ecological reports and from the
Depanment of Renewable Resources key wildlife areas studies. Each study is brietly discussed
below.
Several information sources deal speci fically with KNPR. since Parks Canada requires that
certain information be collected during the establishment of a national park. First. an initial
resource survey identiSing the most unique characteristics of the proposed park must be carried
out. Then, a comprehensive bibliography on the park must be prepared. Subsequently. a
Resource Description and Analysis is undenaken in order to identify, discuss. and record al1
abiotic, biotic, and social aspects of the park. All these studies were carried out between 1972
and 1987 for KNPR. and have provided valuable park-specific information (Environment
Canada, 1987). Furthemore. many independent studies on the park have been carried out (eg.
Danby. 1999; Maraj. 1999).

Another series of reports on protected areas was prepared by a çroup of researchers from the
University of Waterloo. The gos1 of their study was to identib al1 environrnentally significant
areas in the Yukon Territory, and cornpletc abiotic, biotic, and cultural resource surveys for each
environmentally significant areas. Sevenl proposed environmentally significant areas fall within
.L ~itr SIm, hi; ùii14 ?KG xcrc ~ i ü d i ~ d in g r a i &;;il: Xlüanc ? i û ~ h and Xishihih Lakc. A Uiotic
survey of Kluane North, and abiotic. biotic, cultural, and institutional surveys of Aishihik Lake
Iiave provided detailed information on highIy significant areas, ecologicafly and socially,
throughout the GKR (Bastedo. 1986; Hans-Bûstedo, 1986; Theberge er al., 1980).
Three main reports on wildlife habitat arising from the traditional ecological knowledge
literature were available for the GKR. For WRFN, a resource inventory was carried out in 1998.
This report documents information on historical and current moose. caribou, sheep. and goat
distributions in the WRFN traditional territory. Information was also collected on waterfowl.
fish. and tourism opportunities (TransNorthern Consulting, 1998). The AishihiWKluane caribou
recovery program resulted in the documentation of caribou migration corridors, calving grounds.
and general distribution patterns based on knowledge from both the KFN and CAFN. In addition.
information on key moose habitat and wolf pack distribution was collected from KM (Johnson,
1993). Finally. an indcpendent report on key wildlife use areas recorded important areris for
moose and caribou in the CAFN traditional territory. These areas incIuded concentrations in late
winter and seasonal movernent corridors. Traditional moose hunting areas during summer and
winter were also documented (Jingfors, 1990).
Considerable research on wiIdlife habitat has also been canied out by the Department of
Renewable Resources Habitat Branch. A large database of critical habitats was available for

CASE STUDY BACKGROUND 103
most wildlife species except wide-ranging predators whose distribution depends more on
availability of prey than specific habitat characteristics such as wolves. wolverines, and lyiix
(YTG. 1999).
4 . 2 LAND USE PLANS
Three major land use planning studies carried out in the GKR have been instrumental in the
case study by providing considerable information on wildlife and cultural resources: ( 1 ) the
Kluane ~ e ~ i o n Study: ( 2 ) East Kluûne Planning Area: and (3) Greciter Kluane Land Use Plan.
In 1973, the Kluane Region Study was initiated by YTG duc to increased concern that not
enough attention was being given to the need for a long-range. regional plan for the area. Its
purpose was to look at land use dong the Haines and Alaska Hiyhway corridors in order to
determine the "best land use" for the study area. It presented an overvicw of physiography.
climate. land uses. biological resources and hurnan resources dong the highways (Synergy,
1974). Of panicular relevancc to this case study was the identification of biologically significant
zones and areas with high probitbility of major wildlife disturbance.
The East Kluane Planning Area was first described in 1979 when a joint federal and territorial
regional planning exercise was endorsed. As with the Kluane Region Study. it was instiçated due
to increasing concern over the seemingly random exploitation of resources and lack of
consideration of the long-term potential of the East Kluane Planning Area. Baseline data were
coilected between 1979 and 198 1. after which draft background papers were prepared and
consolidated into a final report (RCP. 1982). These reports provided both federal and temtorial
governmenü with useful material on naniral, historical, social and economic resources of the

CASE STUDY BACKGROUND 104 - - --
area. Upon its completion in 1982, however. political incentives to adopt the plan were weak,
and the regional plan was never oficially implemented. The information collected for the East
KIuane Planning Area, however, has aided this case study in providing key wildlife habitat mmaps
as well as land use summaries.
The next attempt at a regional plan arose with the Northem Land Use Planning program's
Greater Kluane Land Use Plan of the late- 1980's. There were 5 major goals associated with this
regional land use plan: "( 1 ) identifi social. cultural and economic opportunities and conservation
requirernents and to propose a course of action to achieve them: (2) anticipate and resolve land
use problems: (3) provide a forum for public involvement in the management of a region: (4)
address the potential for accumulated impacts from development: and ( 5 ) provide guidance for
the project review processes." (Y LUPC. 1990). Altliough the primary outcome of the Greater
Kluane Land Use Plan was n land use plan that made recommendations for land management
policies and practices, a series of background reports and maps describing ecological and social
considerations was ~ S O prepared. Extensive research on subsistence fishing by the CAFN was
nlso documented as part of this land use plan (Joe. 1990). Although the plan was never
implemented, it is probable that it will continue to influence future policy and land use decisions
(Kuhn and Duerden, 19%). The background reports were indeed invaluable for this case study,
as they provided key information on both ecologicai and social values in the GKR. In fact, the
usefûlness of these reports led to the case study taking place within the same boundaries as those
established for the Greater Kluane Land Use Plan.

CASE STUDY BACKGROUND 105
4.4.3 ENVIRONMENTAL IMPACT ASSESSMENTS
Several environmental impact assessments have been carried out in the GKR over the past 20
years. The Cive most prominent are: the Alaska highway gas pipe t ine ( 1977-79). Shakwak
highway improvement ( 1 977). KNPR cumulative effects assessrnent ( 1995). Alsek Pass project
The Alaska highway grts pipeline environmental impact assessrnent involved investigating the
potential impacts of constmcting a pipeline adjacent to the Alaska highway to link gris resources
from Prudhoe Bay to the south. A multitude of background research reports documented
information on rare plants, tïsh spawning, rearing, migration. and ovenvintering grounds.
waterfbwl nesting and staging grounds. raptor nesting areas. and habitat for Dall sheep, caribou.
moose. elk, mule deer, çriuly bears, beaver. muskrat. and other furberirers dong the Alaska
highway corridor (see FPL. 1979 for individual references). Althougli tliis information was
coltected between 1976 and 1978, it still provides the main working base for wildlife
occurrences, particularly for aquatic aspects.
The Shakwak highway irnprovement study evaluated the potential impacts of modifications
required to portions of the Haines and Alaska Highways dong the Shakwak trench. Information
was collected for the occurrence of a variety of wildlife species. including sheep, goat, caribou,
moose, grizzly bear. fox. game birds, raptors, waterfowi and shorebirds, salmon. whitefish. pike,
burbot. suckers. grayling, and Dolly Varden. Although there was not as much new data collected
as for the pipeline project, substantial information was compiled into a usehl format (DPW,
1977). In addition. severai rounds of public meetings and written correspondence were included

in the environmental impact assessment, providing valuable insight into public values (Fisheries
and Environment Canada, 1978).
In 1995, KNPR contracted G. Hegmann to cany out a cumulative environmental assessment
management practices. and compiled information on five key wildlife species (grizzly bear.
golden eagle. Dall sheep. moose. and mountain goat). In addition. potential changes in tourism
level were projected. and effects of development on wildlife species assessed (Hegmann. 1995).
The Alsek Pass project proposal of the mid- 1990's involved the construction of a road and a
day-use area overlooking the Alsek River. The initial environmental evaluation coilected
information on geoinorphological features. rare plants. and wildlitë habitat of the Alsek River
valley (AXY S, 1996).
A compreliensive environmental assessment was carried out for the Aishihik Lake hydro
power relicensing project in 1998. Detailed information on waterfowl. raptors. moose. aquatic
furbearers, freshwater fish, and sites of cultural and archeological significance was provided for
Aishihik Lake. Sekulmun Lake, and surrounding areas (NorthISouth Consultants. 1998: Schmidt
Environmental Consultants, 1998). The assessment report also included traditional ecologicat
information on traditional food fishing areas. hunting areas. and trapping locations (Allen. 1996).
4.5 SUMRIARY
This chapter presented the necessary background information on the GKR. Although each
section is by no means comprehensive, a sufficient overview has been given for ecological and

social aspects of the GKR. In addition, a brief history of park. planning and assessrnent research
was also provided. The next chapter focuses on the results of the case study and discusses the
implications of these tlndings (Figure 4.2).
- - -
Pro'uicrn Definition (Chripter 1 )
. -- - .Au
Literature Review 4 Themes:
- protected areas selection - park maangement - CRLUP - CEE and CEA
(Chapter 2)
Guiding G uiding Principles for Theme Principles for Methodology Interactions Methodotogy Appplication (Section 3.1 ) Development
(Section 3.2) (Section 3.2)
Overview of Methodotogy
(Section 3.3)
Stage f Stage 2 Database Hotspots
(Section 3.4.1) (Section 3.4.2)
- - . - - - . - - . -
Conclusions - - - p. -- Fu tu re
Applica tioas (Sections 6.1 and 6.2)
----
. .-
Methodology --- - Evaluation
(Section 6.3) - - - -- - - - .
Goal 3 -
Goal 3
Figure 4.2 - Conceptual Map of Thesis.

CHAFTER 5 - CASE STUDY RESULTS AND DISCUSSION
Results of the case study are presented for both of the steps outlined in Chapter 3. Boundaries
are described and justified in section 5.1. In section 5.2, a brief discussion of the main
information sources is given, followed by a description of social and ecological values outlined
in Tables 3.1 and 3.2 respectively. These results are then compiled to determine locations with
the highest concentrations of values in the GKR in section 5.3. Differences in results are
discussed throughout this section as the key findings are presented. Concluding rernarks
regarding the limitations of the data. and future research priorities are then discussed in section
5.4.
5.1 CASE STUDY BOUNDARIES
Before implementing the methodology. case study boundaries had to be set. The ofticial
boundary of the 'Greater Kluane Region' was defined according to the Greater Kluane Land Use
Plan (see Figure 4.1). Although it is desirable to use ecoloçicnlly relevant boundaries, the
boundaries defined by the Greater Kluane Land Use Plan were selected for severai reasons.
First, the background reports of the Greater Kluane Land Use Plan provided considerable
information on both ecological and social aspects of the GKR. Second, many regional planners
and managers are familiar with this area because of the Greater Kluane Land Use Plan, so the
case study results ivill be more easily applied. Third, many wiidlife species of concern are wide
ranging species. which makes it even more difficult to define ecologically relevant boundaries
while maintaining a reasonably sized study area. Boundaries were not extended beyond the
Yukon Territorial border for reasons already discussed in section 4.1.

CASE STUDY RESULTS AND DISCUSSION 109 --
5.2 STAGE 1: CREATE DATABASE OF VALUES
5.2.1 SOCIAL VALUES
Once study area boundaries had been defined. the social values highlighted in Table 3.1 were
investigated. The description in Section 3.3.1 recommends the use of two resources to determine
cocial values. These are: ( 1 ) direct consultation with public. and !2! 1 itemture revicw nn topics
such as environmental impact assessments. traditional ecological knowledge. and local planning
issues. Given time and budget restrictions, consultation with the public at large was not carried
out for the purposes of this research. In order to compensate for this, the list of generiited social
values was presented to several individuals familiar with the Kluane area for commentary
(Brenneman. Eklund. Elliott, Godin. Henry. and Slocombe. pers. comrn.. 1999). Their comments
are incorporated into the following list of social values. The list of social values w s therelore
developed by surveying the literature and using Table 3.1 as a guideline. Main information
sources and social values are presented below.
Key Information Sources and Data Collection
Literature reviews were carried out at DIAND, Parks Canada. and Yukon College libraries in
Whitehorse and Haines Junction. These reviews focused on four main publication categories,
namely land use planning, environmental impact messment, traditional ecological knowledge.
and protected areas research (section 4.4). An overview of the main information provided by
each category is presented in Table 5.1.
Since a number of reports of varying quality were available. the most reliablc and credible
reports were selected by applying a senes of data filters. The first filter involved examining the
purpose and methods of each report to determine if the research tindings would be applicable to

CASE STUDY RESULTS AND DISCUSSION 110
this study. Reports that were not relevant were disregarded. Al1 useful information from reports
with pertinent scopes and sound methodologies was then recorded. Any weaknesses associated
with the methodology ernployed were noted at this point. For instance, since data collected on
fish habitats for the Alaska Highway Pipeline project were only collected at the exact locations
where the prnpnced pipeline wniild crnw riverc. it wnq noted thnt data were cite-cpecitic and
could not be extended to the entire river.
Table 5.1 - Key Information Sources for Social Values.
Publication Category
Land Use Planning
information Provided
- sport fisheries - cultural and heritage appreciation sites - recreation
Environmental Impact Assessments
- fishing - wildlife viewing - aquatic furbearers -- - - - -
- subsistence hunting - subsistence fishing - subsistence trapping - cultural and heritage appreciation sites
- wildlife viewing - aesthetics - educat iodinterpretat ion - scientific interest - cultural and heritage appreciation sites - recreation
Sources
Reports associated with the Greater Kluane Land Use Plan, East Kluane Planning Area, and the Greater Kluane Study
Reports associated with Alaska Highway Pipeline
- - - - - - -
WRFN resource surveys. CAFN resource reports. caribou recovery program reports
Parks Canada reports on KNPR. ESA research, independent researc h
A second filter was subsequently applied in which data collected from the different reports
were compared to see how closely the information corresponded. Where several sources cited the
same information, these data were entered into the database. In cases where information was only
cited in one source, a third filter relating to existing information availability was applied. In cases
where a number of documents were available on the particular topic but none of the other

CASE STUDY RESULTS AND DISCUSSION 111 --
documents cited similar information, reports were disregarded. However, when only a limited
num ber of reports were publicly available. for instance with Traditional ecological knowledge
reports. it was assumed that the sources were credible unless some aspect of the report suggested
inherent weaknesses or higti uncertainty. Information presented in tliese reports was also fed into
tJbe A_~&hle.
The database compiled from al1 in format ion collected from these filtered reports is presented
in detail in Appendix 1. However, a brief discussion of vaiues related to consumptive wildlife
based activities. non-consumptive activities. and recreational activities is included here.
Consum ptive Wildlife Based Activi ties
For subsisterice hunting, key species include moose. caribou. Dall sheep. and watertowt
(Allen. 1996; Barichello. 1996: Allen, 1994: Johnson. 1994: Peepre and Associates. 1993;
TransNorthern Consulting. 1993: Jingfors, 1990). Key subsistence fish species include whitetkh.
Iake trout, rainbow trout, arctic grayling, salmon. burbot. and northern pike (TransNorthern
Consulting, 1993: Joe. 1990: FPL, 1979).
Key sport and recreation tishery species include chinook, churn, coho. and sockeye salmon.
lake trout. arctic grayling, and northern pike (Peepre and Associates, 1993; deGraff and
McEwen, 1989: Archer Cathro and Associates, 1988; Hancock and Marshall. 1984: Blood and
Associates, 1982; FPL, 198 1; Paish and Associates. 198 1 ; FPL. 1979: DPW. 1977: FPL, 1977;
NNRS. 1977; Be&, 1976; Brown et al., 1976: WaIker and Brown. 1974).

CASE STUDY RESULTS AND DISCUSSION 112 -- - - . -. . -- - -
Furbearers of greatest economic value in Yukon include lynx marten, wolverine, wolf. fox,
otter. mink, beaver, and muskrat (Schmidt Environrnental Consulting, 1998; Allen, 1996;
TransNorthem Consulting, 1993: DRR, 1989: FPL, 1978; Blood and Associates. 1975). Species
of p r i m q importance to big game outfitting and recreational hunting include Dall sheep. grizzly
hear. mnose. caribou. black bear. and mountain goat (Read and Associates. 1990).
Once dl potential values associated with consumptive wildlife-based activities were liçted,
primary locations for subsistence harvest, sport and recreation tisliing, and recreation hunting
were subsequently recorded in table format (Appendis 1). However, it is important to note that
information on key locations for trapping and outfitting was limited due to trcipper and outtïtter
privacy rights. As a result, kry locations for these activities could not be included in the analysis.
Further discussion of the causes and consequences of data disparities is presented in section 5.5.
Non-consurnptive Activities
Species identified as most valuable for wildlife viewinç include bears. Dall sheep. mountain
goats, moose, raptors. waterfowl. passerines, and shorebirds (Hegmann, 1995: Peepre and
Associates, 1993: DRR. 1990; Henderson, 1987; Blood and Associates. 1975: Yukon W ild, n.d.).
Sevenl key locations of undisturbed wilderness aesthetics are also identified by examining
reports and surveys relating to wilderness tourism (eg. Peepre and Associates. 1993; DRR 1990).
Sites for cul tural/heritage apprec iation include historic sites. prehistoric sites. and sources of
raw material (DRR. 1989: Gotthardt, 1989). Little information was found on sites of educational
and/or interpretive value although interpretive areas associated with the national park are
outlined. Exarnples of sites of scientific value include International Biological Programme sites

CASE STUDY RESULTS AND DISCUSSION 113
(Becket, 1975), Heritage Rivers (Parks Canada. 1984), Special Protection Areas (Parks Canada,
1980). and Environmentally Significant Areas (Theberge et al.. 1980).
Other non-consumptive land activities range from hiking and biking to nature appreciation
and cnmpins. Wnter hased activities in the GKR include canoeing. rafting. kriyakine. and rnotor
boating. and winter activities include cross country skiing, snowmobiling, dog mushing. and ice
tishing (DRR, 1990; deGraffand McEwen, 1989: DRR, 1989; FPL. 1979).
Once al1 known values açsociated with non-consumptive activities were listed. locations
receiving the greatest use for each value were subsequently recordcd in table format (Appendix
1).
5.2.2 ECOLOGICAL VALUES
The approach described in section 3.3.1 recommends that the literature be surveyed.
knowledgeable people be interviewed, and field surveys carried out if possible to determine the
values outiined in Table 3.2. In this case study. the literature was reviewed txtensively. and the
information collected was verified with biologists, ecologists, park wardens. and acadernics with
cxperience in the GKR. No primary field research was undertaken due to limited time and the
author's lack of experience with abiotic landscape features. However. the rich literature
combined with personal communication with locals lead to a high level of confidence tliat major
ecological values have been successfully recorded. Main information sources and social values
are presented below.

CASE STUDY RESULTS AND DISCUSSION 114
Key Information Sources And Data Collection
Literature reviews were carried out at DIAND, Parks Canada, Yukon Renewable Resources,
Canadian Wildlife Service, and Yukon College libraries in Whitehorse and Haines Junction.
These reviews focused on the same four publication categories as social values - environrnental
impact nsseîments. traditionai ecological knowledge. and protected areas researc h - with an
additional source of govemment and independent wildlife reports. An overview of the main
inforrnation provided by each category is presented in Table 5.2 .
As with social values. a large volume of reports was avûilnble for review. These reports were
passed through the same filters described in section 52.1 . AH information collected from the
tïltered reports is presented in detail in Appendix 1. and a brief discussion of abiotic and biotic
values is included below.
Abiotic Features
Rare. rhreatened and unique geomorphological features of the GKR include river tlats and
deltas. icefield nunataks, thundereggs. rock glaciers. loess steppes. sand dunes and ridges.
badlands canyon geomorphology, balanced periglacial environments, and glacial landfoms
(AXYS and Inukshuk, 1996; Hegmann. 1995; Natural Resource Conservation. 1991: Theberge
and Oosenbrug, 1975).
Valuable hydrological resources include groundwater supply and recharge areas. important
headwaters, waterfalls, critical fish habitat watercourses, m d ice free areas for migratory
waterfowl (Hegmann, 1995; Peepre and Associates, 1993: Natural Resource Conservation, 199 1:
Nixon. 1989; Beak, 1978; Beak, 1977; Synergy, 1974).

CASE STUDY RESULTS AND DISCUSSION 11s
Table 5.2 - Key Information Sources for Ecological Values.
- ...
Publication Cat ego ry
Land Use Planning
Eiivironmental Impact Assessments
Tradit ional Ecological Know ledge
. - -
Protected Areas
-
Wildlife Reports
--
Information Provided
- hydrology - RTVE tlorri and fauna - hypersensitive species - key prey speciec - sumrnit predators - tnigratoy and spatially demanding species - habitat specialists
- geomorphology - hydrology - RTVE flora and fauna - Iiypersensitive species - key prey species - sunimit predators - migratory and spatially demandinç species - habitat speciriiists - Iiighly diverse communities
- RTVE flora and tàuna - summit predators
- geomorpholoçy - hydrology - RTVE flora and fauna - hy persensit ive species - key prey species - sumrnit predators
- RTVE flora and fauna - key prey species - summit predators - migratory and spatially demanding species - habitat specialists - highly diverse comrnunities
deGraff and McEwen, 1989; DRR, 1989; Nixon, 1989; Sumantik, 1 989: EKPA. 1982: Synergy. 1974
Schmidt Environmental Consulting, 1998: AXYS and Inukshuk, 1996; Hegrnann, 1995; Peepre and Associates, 1993; Prystupa, 199 1 ; Aniveiler and B food, 198 1 ; Blood and Associates. 1979: FPL. 1979: Beak, 1978: FLP. 1978: Beak, 1977; FPL, 1977: Northern Natural Resource Services, 1977; CFS, 1972
. -- - - -
Allen, 1996; Barichello. 1996: Johnson, 1994; TmnsNorthem Consulting, 1993; Jingfors, 1990
Danby, 1999; Natural Resource Conservation, 199 1 : Gauthier et cd., 1985: Gauthier and Theberge, 1983 ; Parks Canada, 1980; Theberge and Oosenbrug, 1975; Krebs and Wingate. 1974
Ward and Larsen, 1995; deGrrit'f, 1992; Larsen and Ward, 199 1 : DRR, 1990; Slough and *Nard, 1987: Hayes and Bayer, 1986; Slough and Smits. 1985 Dennington, 1985; Mossop and Dennington, 1984: Slougli and Jessup, 1984; Larsen, 198 1 : C WS. 1979: Mossop, 1976

CASE STUDY RESULTS AND D~SCUSSION 116
Once al1 potential abiotic values were outlined, primary locations for geomorphological and
Iiydrological features were subsequently recorded in table format (Appendix 1) . However. it is
important to note that the amount of data available for these abiotic landscape features was quite
limited. so several other sites of potentially high abiotic significance may not be recorded in the
database. Further discussion of the causes and consequences of data disparities is presented in
section 5.5.
Biotic Features
A number of rare. endangered. threatened. vulnerable. or unique tloral rind faunal species are
located within the GKR. Vulnerable species include grizzly bears. wolverines. and Squanga
whitefish. Wood bison. a threatened species. was recently reintroduced to the area (COSEWK.
1999). Other species at risk include mule deer rind elk. Unique species in the GKR include Dail
sheep. moose subspecies. and endemic populations of Kokanee salmon and ninbow trout.
Mountain goats are iiear the nonh of their range in the GKR. and thus deserve special
consideration as well (Danby, 1999: Schmidt. 1996: Hegmann. 1995: Peepre and Associates.
1993: Johnson, 1994: DRR, 1989: Sumantik. 1989; Gauthier et trl., 1985)
Several valuable bird species were also identified. such as trumpeter swans. peregrine falcon.
gyrfalcon. bald eagle, golden eagle, osprey, short-eared owl. great gray owl, and wandering
tattler. There are many nationally rare, regionally rare, disjunct and endemic plants present in
the GKR (Cody, 1996: Environment Canada. 1 987; Douglas et ul.. 198 1 ).
There are also a number of hypersensitive species identified in the GKR. These include
caribou. grizzly bear, beaver, wolverine. raptors, and sharp-tailed grouse (Schmidt Environmental

CASE STUDY RESULTS AND DISCUSSION 117
Consulting, 1998; DE& 1989; EKPA, 1982; Aniveiler and BIood, 198 1 ; FPL, 1978; Synergy.
1974). Key prey species include snowshoe hares. lemmings. squirrels. pikas. shrews and voles.
muskrats. and upland game birds (Schmidt Environmental Consulting. 1998: DRR. 198% Slough
and lessup, 1984; FPL. 1979: Blood and Associates. 1975: Krebs and Wingate. 1974: Synergy.
1974). wliile the main summit predators are the woIves (Allen. 1996: Hegmann. 1995: Johnson.
1994; Hayes and Bayer 1986: Parks Canada. 1980).
Migratory species such as waterfowl and shorebirds are nlso considered ecologically valuable
in the GKR (DRR. 1989; Nixon. 1989; Dennington, 1985; EKPA. 1982; Aniveiler and Blood.
198 1 ; C WS, 1979: Mossop. 1976: Synergy. 1974). as are spatially demanding species including
caribou. grizzly bears. and wolverines (DRR. 1989). Habitat specialists include mountain goats.
lynx. and pine manen (DRR, 1989; Slough and Ward. 1987: Slough and Smits. 1985: FPL. 1979:
Blood and Associates, 1975). Finrilly. a nurnber of regionally uncommon or rare vegetation
communities and highly diverse communit ies can also be identi fied throughout the study area
(deGratT, 1992; CWS. 1979: CF'S, 1972).
Once al1 potentiai biotic values were listed. prima. locations for these values were
subsequently recorded in table format (Appendix 1). However. it is important to note that data on
small mammals (key prey species) and wolverines (hypersensitive. vulnenble. spatially
demanding) were limited. As a result. key locations for these species are not included in the
analysis. Further discussion of the causes and consequences of data disparities is presented in
section 5.5.

CASE STUDY RESULTS AND DISCUSSION 118
5.3 STACE 2: IDENTIFY VALUE HOTSPOTS
The second stage of the recommended methodology involves the selection of the most
valuable areas in the region by identifying areas with high concentrations of social and ecological
values, or value hotspots. This was to be accomplished by subdividing the region into subzones
and tallyinç the amnunt nf values in each zone iising Tahle 3.6.
First, the GKR was subdivided into smaller zones. Given a study area size of approximately
60.000 kmL. a total of 55 zones with a median area of 767 km' were drawn following the
approach outlined in section 3 -4.2. Boundaries were drawn around physiognphical fearures such
as valleys and rnountains that encompassed units of critical wildlife habitat (Map 5.1). tor
instance. zone 13 was drawn to encornpass riparian grizzly bear habitat. whereas boundaries to
zone 45 were drawn to encompass mountain goat habitat in the hills but to exclude the riparian
moose habitat in the Mush-Bates Valley. Details on zone boundaries. rationale. and the values
present in each zone are outlined in Appendix 2. It is important to note that zone boundaries are
approximate and were drawn for discussion purposes only. A detailed analysis has not been
carried out on these boundaries so they must not be considered definitive.
After subdividing the study area* a matrix organized Iike Table 3.6 was compiled and is
presented in Appendix 3. The 55 zones were listed in the first column, and the values present at
each location recorded as 1 if present, O if absent. This case study has therefore not used a
weiçhted approach discussed in 3.4.2. as there were neither the time nor the resources to
facilitate the extensive consultation that would be required to devise a suitable weighting system.
The implications of this decision are discussed in more detail in Chapter 6. The number of social
values, ecological values, and total values present in each zone was then sumrned and recorded.


CASE STUDY RESULTS AND DISCUSSION 120
Zone area was also determined using MapInfo GIS, and the number o f total values per area.
social values per area, and ecological values per area were calculated. This database, presented in
Appendix 4, was subsequently used to carry out six analyses. The first three analyses used the
raw data and looked at the spatial distribution of total values, social values, and ecological
vnlitec. The valiies calculated per area were then used in the Inst three rinaiyses. to determine the
effects of area and to see whether the results when corrected by area were comparable with the
resuits using the raw data. Results from each of these six analyses are presented below in the
following order: total values. social values. ecological values, total values per area. social values
per area and finally ecological values per area.
Total Values Per Zone
Once the number of vaiues per zone had been tallied. zones with the highest concentration of
values were determined by nnking zones in order oldecreasing number of total values per zone.
If two or more zones contained the same number of values. they were al1 given the sarne rank.
Becriuse of this. there wris only a total of 19 ranks in this analysis. These 19 ranks were
subsequently divided into five intervals, with ranks 1 to 3 representing the top 20% (19-2 1
values), 4 to 7 the >20% - 40% ( 15- 18 values), 8 to 1 1 the ~ 4 0 % - 60% ( 1 1- 14 values), 12 to 1 3
the >60% - 80% (7- 10 values), and 16 to 19 the >80% - 100% (3-6 values). This classification
was carried out to sirnpliG comparative analysis throughout this discussion. as rank percentages
can be calculated for each of the analyses. it also provides a classification system for mapping
purposes, since tive categories provide a sufficient overview of the values distribution without
providing too rnuch detail so as to rnake the maps dificult to interpret.

CASE STUDY RESULTS AND DISCUSSION 121
Table 5.3 lists details for the zones falling within the top 40% when ranked by total values,
but details on the ranking of all 55 zones are provided in Appendix 4 (Table A4.1). Of these top
40%. fïve (49,47. 52.38, and 46) are Iocated wholly within KNPR, and three (44. 5 1, and 1 1 )
are at least partially within the KWS.
Table 5.3 - Value Hotspots. Ranked by Total Values per Zone.
[ 7 1 38 1 JO-JO and North Kusawa Lakes 1 15 1 9 1 6 1
Rank
1 2 3 3 3 --
6 6 6
7 L
Results from this analysis are also presented in Map 5.2. Several patterns can be deiected
from this map. First, many high ranking zones are found within KNPR. including 3 of the 5
zones in the top 20%. This suegests that the park contains a diversity of social and ecologicai
values, largely within the southern half. Second, there are a considerable arnount of zones within
the top 40% that lie adjacent to park boundaries, such as zones 1 1, 18. 24, 25.34. and 44. T hird,
many of the highest ranking zones are concentrated dong the highway corridor. This pattern may
a i se because the Haines and Alaska Highways are the oniy îsvo main roads in the area and many
social values - such as fishing, boating, hunting, biking, education and camping - are based frorn
To ta1 Values 3 1 30
19 19 19
4
5 5 5 5
Zone
49
44
47
52 5 1
25 1 1 35
46
Social Values
15 14 IS 1 1 14
Name
Kathleen Lakes Tatshenshini/Dalton Post Lowe11 LakeGoatherd Mt.
Slims Valley Hungry Lakes
Ecological Values
6 6 4
8 5
48 24 28 18 3 4
Kloo Lake Bunvash Uplands
Dezadeash River, Canyon to Champagne
Mush- Bates Lakes
Alsek-Kaskawulsh Contluence Jarvis River
Aishihik and Sekulmun Lakes
Kluane River Pine Lake
IO 16 16
15
18 17 17
17 17
7 8 7
9
9 8 9
6
13 8 1 1
9
i 1
5 9
6
8 , 6


CASE STUDY RESULTS AND DISCUSSION 123 -- -
these access corridors. Althouçh some social values involve more remote settings, such as
backpacking, mountaineering and erperiencing wildemess, the majority would be erpected to be
in closer association with road access. The GKR's physiography and resulting wildlife ranges
may also contribute to this concentration along the highway corridors. as the front ranges of the
St. Elias Mountains and the Sliakwak Trench are known for their high biological diversity
relative to other subarctic regions, especially when cornpareci to the inhospitable icefield ranges
to the southwest. Finally. the roadside concentration may simply be a reflection of a greater
availability of data dong the highway corridor due to ease of access for research purposes.
In order to determine whether the results were afkcted by grouping the social and ecological
values into one grand total. values were also ranked in order of decreasing number of social
values per zone and in order of decreasing number of ecological values per zone. Again. zones
with the sarne number of values were given equal ranks, and the total number of ranks were
divided into five intervals. For social values. there were a total of 16 ranks. with ranks 1 to 3
representing the top 20% ( 13- 15 values), 1 to 6 the >ZO% - 10% ( 10- I ? values). 7 to 9 the >JO%
- 60% (7-9 values). 10 to 12 the >60% - 80% (4-6 values), and 13 to 16 the >80% - 100% (0-3
values). For ecological values, there were a total of 8 ranks. with rank 1 representing the top 20%
(9 values), 2 and 3 the >20% - 40% (7-8 values). 4 the >JO% - 60% (6 values), 5 and 6 the %O%
- 80% (4-5 values), and 7 and 8 the >80% - 100% (2-3 values).
Social Values Per Zone
The zones falling within the top 40% when ranked by social values are listed in Table 5.4. and
details on the nnking of ail 55 zones are provided in Appendix 4 (Table A4.2). Of these top
40%, six (47,49, 48,45, 52, and 50) are located within KNPR and two (44 and 5 1) are at least

CASE STUDY RESULTS AND DISCUSSION 124
partially within the KWS. In addition. only bvo of the zones listed in the top JO% when ranked
by social values are not found on the list of the top 40% when ranked by total values (zones 45
and 50). Neither of these zones are incIuded in Table 5.3 because tliey both have fewer
ecological values. giving them a total values rank of 14, just below the top 40% cut off.
Likewise. several zones listed in the top 40% when ranked bv total values are not included in top
40% when rsnked by social values, narnely zones 24. 1 8.25. L 1.35.46. and 3 8. However. al1 of
these zones have between 7 and 9 social values and would thus hl1 in the next category of top
60% when ranked by social values, suggesting that the differences between tliese zones and the
ones listed in both analyses are slight.
Table 5.4 - Value Hotspots, Ranked by Social Values per Zone.
Results for ranking by social values are also presented in Map 5.3. There are many
similarities between this map and Map 5.2. Although many zones have shifted up or down one
category, only zone l 5 falls in a considerably lower category (top 100 %) when ranked by social
Social Values
Total Values
19 2 1 20 19 18 14 17 17 19 14
L
Rank
1 I 2 3 - 3 4 2 5 5 6
values as opposed to total values (top 60%). This likely arises because there is a large amount of
EcologicaI Values
ecological vaiues in this zone, but few social values. When ranked by social values. the highest
Zone
47 49 44 5 1 48 45 28 34 52 50
concentration of the top 40% of the m k s is stili located in the southem part of KNPR, with a
Name
Goatherd Mountain Kathleen Lake
Tatshenshini River Hungry Lakes
Alsek/Dusty/KaskawuIsh Onion Lake
Aishihik Lake/Sekulmun Lake Pine Lake
Slirns River Mt. ArchibaIdNulcan Mt.
15 15 14 14 13 12 11 1 1 1 1 10
few other hotspots located adjacent to park boundaries and along highway corridors. Overall,
4 6 6 5 5 2 6 6 8 4


CASE STUDY RESULTS AND DISCUSSION 126
then, there is considerable overlap between the zones with the highest ranking social values and
highest ranking total values.
Ecological Values Per Zone
The zones falling within the top 40% when ranked bv ecological values are listed in Table
5.5. and details on the ranking of al1 55 zones are provided iii Appendix 4 (Table A4.3). Of these
top 40%. only one (zone 52j is located within KNPR. and one (zone 1 1 ) is within the KWS. I t is
extremely important to note here that this does not mean that the park does not provide critical
habitat for the species it supports. Rather. zones within the park ranked low in terms of
concentrrited ecological values due to the lack of extensive wetlands such as tliose found in zones
35. 5. 18. 54. and 77 which contain numerous ecological values such as beaver. muskrat.
waterfowl. and a diversity of fish species. The lack of fish diversity in ttie park's Iakes also
contributes to the lower ranking, as does the fact that it lies outside the range of some species
such as the bison. mule deer and elk of zones 27. 35. and 33. Thus. althougfi the park consistently
provides critical habitat for the species which faIl within its boundaries such as grizzly bear. Dall
sheep, mountain goat and moose. ttie actual value of these habitats is not retlected Iiere since no
weighting system was applied for reasons discussed above. Again, implications of this decision
are discussed in Chapter 6.
When compared to the rankings of total values in Table 5.3. we see that six of the fourteen
zones listed in the top 40% when ranked by ecoIogical values are also found on the list of the top
40% when ranked by total values (zones 24.25, 35. 1 1 , 18. and 52). The eight remaining zones
that are only listed when ranked by ecological values are not listed when ranked by total values
because of their low amount of social values, putting them in the top 60% (zones 15, 54,27,3 1,

CASE STUDY ESULTS AND DISCUSSION 127
and 33) and top 80% (zones 4 and 19) categories when nnked by total values. Likewise. several
zones in the top 40% when ranked by total values (Table 5.3) are not included when ranked by
ecological values (Table 5.5). namely zones 49.44.17. 5 1. 48.28. 31. and 46. Tliis arises due to
the lower concentration of ecological values in these zones, particularly in zones 47, 5 1. and 48
which are only found in the top 80% wlien ranked by ecological values for the reasons outlined
above when discussing ecological values within KNPR.
It is also interesting to note that only one zone listed in the top 30% when ranked by total
values (zone 52) is listed in the top 40% both when ranked by socinl values and when ranked by
ecological values. This suggsts that there is little or no relationship between social and
ecological values. Plotting social values versus ecological values confirms this to be tme (Figure
5.1). Tliis is an important point to recognize. as it reinforces the need to consider both social and
ecological values. since zones of high socinl importance may not be so ecologically speaking,
and vice versa.
Table 5.5 - Value Hotspots, Ranked by Ecological Values per Zone.

CASE STUDY RESULTS AND DISCUSSION 128
O - 7 4 6 H 1 O 12 14 16
Nurnber of Social Values
Figure 5.1 - Scatterplot of Social Values Versus Ecologicai Values
Results for ranking by ecological values are aIso presented in Map 5.4. When compared to the
total values map, several differences can be noted. First, several zones (4. 19.44.45.47.48.49.
and 5 1 ) have shified up or down more than one category when mappcd by ecological value ranks.
For instance, both zones 4 and 19 faIl in the top 80% category when ranked by total values, but
rise to fall within the top 40% when ranked by ecologicaf values. This suggests that these zones
contain concentnted ecological values but that they do not contain many social values. Indeed.
they cire both in the lowest category when ranked by social values (Map 5.3). Conversely, zones
47 and 5 1 only rank in the top 80% when ranked by ecological values. whereas they are found
within the top 20% when nnked by total values and by social values. These differences are not
surprising given the lack of a relationship behveen social and ecological values displayed in
Figure 5.1.


CASE STUDY RESULTS AND D~sCUSSION 130
Overall, then. the concentration of values in the southem part of KNPR (ie. zones 45 through
5 1) can be largely attributed to the presence of numerous social values. whereas the higher
rankings of zones near the nonh end of the park (ie. zones 1 1, 18.24. and 25) arise largely due to
a concentration ofecological values. Only one zone - number 52 - contains a concentration of
both social and ecological values. It appears as though prouping social and ecologicd values
together to cary out the anaiysis does not affect the results substantially. as a core group of
zones emerges as Iiaving high concentrations of both social and ecological values. whether
ranked independently or together. Notably, zone 52 is found within the top JO% in al1 three
analyses. In addition, zones 25, 34,44,47,48.49. and 5 1 are al1 within the top 40% in both the
total and social analyses. whereas zones 1 1 . 18.24.25. and 35 are within the top 40% in both the
total and ecological analyses.
The data so far have been analyzed in an unrnodified forrn. Although this approach has
provided a good overview of the data. it hris not taken the possible et'fèct of area into
consideration. Therefore, the data were also analyzed when ranked based on values per area per
zone.
Total Values Per Area Per Zone
First, data were ranked by the total number of values per area per zone. Since no two zones
contained exactly the same number of values per area, there was ri total of 54 tanks. These 54
nnks were subsequently divided into fîve intervals, with ranks 1 to I O represeniing the top 20%.
1 1 to 2 1 the >IO% - 40%, 23 to 32 the NO% - BO%, 33 to 43 the >60% - 80%. and 44 to 54 the
>80% - 100%.

CASE STUDY RESULTS AND DISCUSSION 131
Table 5.6 lists details for the zones falling within the top JO% when nnked by total values per
area per zone, and details on the ranking of al1 55 zones are provided in Appendix 4 (Table
A3.4). Of these top 40%. six (46, 13,52,39. 12, and 48) are located wholly within KNPR. and
six ( 1 1, 5 1.44.43, 9, and 14) are at least partially within the KWS. The list of the top 40% wlien
rrtnked bv total values per area contains hvelve of the fifieen zones oripinally ranked bv tota1
values in Table 5.3. Only zones 47, 28, and 3 8 from Table 5.3 are not incIuded in Table 5.6,
mostly due to their larger areas of 1 143km2. 1393km2, and 977km2 respectively.
Table 5.6 - Value Hotspots, Ranked by Total Values per Aren per Zone.
Results h m this analysis are also presented in Map 5.5. When compared to the map of total
ank
1 2 3 4 5 6
18
1 9
20
values (Map 5.2), the major differences mise in the zones that either have small areas (eg. zones
Total Values
17 16 15 16 9 9
Zone
18 25 46 1 1 13 36
( 21 1 14 i Con~don Creek 1 13 r 9 I 4 I 738 1 0 . 0 1 7 6 2 1
48
3 5
3 7
Name
Kluane River Kloo Lake
Mush-Bates Lakes Bunvash Uplands
South Donjek River Valley Rainbow Lakes
Social Values
9 7 9 8 6 6
Confluence Alsek-Kaskawulsh
Confluence Dezadeash River. Canyon to
Champaqne Dezadeash and Sixmile Lrtkes
Ecoiogicai VaIues
8 9 6 8 3 3
18
1 6
C-----
l4
Area Values per
13
7
9
(km2) Area .
5
9
5
287 348 360 3 89 220 223
0.05923 0.04348 0.04167 0.04 1 13 0.0409 1 0.04036
844
827
736
0.02133
0.01935
0.01902


CASE STUDY RESULTS AND DISCUSSION 133
13 and 36) or large areas (eg. zones 28 and 54). The distribution of zones within the top 40% also
differs slightly, as the higher ranking zones of the total values per area analysis are more evenly
distributed dong the highway corridor as opposed to the concentration in the southern part of
KNPR observed in the total values analysis. Despite these slight differences. however. a total of
twe!ve znnes x e !kted in the No4 bmh wlwn ranked hy t ~ t 2 ! valucr: and when ranked tiy total
values per area (zones 1 1. 18.24. 25,34.35,44. J6,48,49. 5 1. and 52) . indicating that there is a
considerable arnount ofoverlap benveen the two analyses.
As with the above analysis of total values per zone. values were also ranked in order uf
decreasing nurnber of social values per area and decreasing number of ecological values per area.
These data were used to determine if and how the results vriry when corrected by area. and to
deterrnine the effect of grouping the social and ecological values per area into one grand total.
Azain. since no two zones contained exacrly the same number ofsocial values per nrea or
ecological values per area. tliere were a total of 54 ranks in each analysis. These 54 ranks were
subsequently divided into tive intervals. with ranks 1 to 10 representing the top 20%. 1 1 to 21 the
>20% - 40%, 22 to 32 the >40% - 60%, 33 to 43 the >60°h - 80%. and 44 to 54 the >80% - 100%
for both social value per areci and ecological values per area.
Social Values Per Area Per Zone
The zones falling within the top JO% when ranked by social values per area are listed in
Table 5.7, and details on the ranking of al1 55 zones can be found in Appendix 1 (Table AJ.5).
Of these top 40%, eight (zones 13,46,49, 52,48. 12,45 and 47) are located wholly within
KNPR, and six (zones 5 1 , U . 1 1.43.9, and 14) are at least partially within the KWS. Only zones
45 and 47 - both located within KNPR - are not found in the top 40% when ranked by total

CASE STUDY RESULTS AND DISCUSSION 134
values per area. This likely arises because there is a large amount of water recreation dong the
Alsek River in these zones. but given their sizes (910km2 and 1 143km2 respectively) the
ecological values are slightly less concentrated. They are both found in the top 60% when ranked
by total values per area, suggesting that the difference is not substantial. Likewise. although
70ne5 15 and 35 are both in the top 40% when ranked by total values per area. they do not appear
in the top JO% when ranked by social values per area. For zone 15. this is not surprising as it is
not easily accessible, so social values are expected to be somewhat lower. However. zone 35 is
located alongside the Alaska highway. The hct that it is not in the top 40% of social values per
area may be more a reflection of the presence of a lower concentratiori of social values in zone
3 5 relative to numerous other zones around KNPR with relatively high concentrations of social
values per area. Since both of these zones are found in the top 60% when ranked by social values
per area. the difference between ranking by total values per area and by social values per m û cm
be considered minimal.
When compared to the results of the analysis ranked by social values. we see that the list of
the top JO% when ranked by social values per area contains eight of the ten zones originally
ranked by social values in Table 5.4. Only hvo zones in the top JO% of the social values analysis
- zones 28 and 50 - are not listed in the top 40% of the social values per area analysis. rnostly due
to their large areas of 1393 km', and 13 19km' respectively.

CASE STUDY RESULTS AND DISCUSSION 135
TabIe 5.7 - Value Hotspots, Ranked by Social Values per Area per Zone.
Results from the social values per area analysis are also presented in Map 5.6. When
compared to the map of total values per areo (Mop 5.5). there is very little difference. Only one
1 4 1 3 6 1 Rainbow Lakes 1 9 1 6 1 3 1 2 2 3 10.026911
Area (km')
287 473 220
Rank
1 3 3
zone - zone 17 - Ilas shifted up or down more than one category. moving from the top 60% when
Total Values
17 19 9
Social Values
per Area 0.0314 0.0296 0.02727
9 14 15 8 1 I 7 8 8 7 1 1 13 8 4 12 15 9 9
15 20 2 1 16 19 16 17 14 10 17 18 13 9 14 19 1 4 13
ranked by total values per areo down to the top 100% when ranked by social values per area. This
Zone
18 51 13
Musli-Bates Lakes TatshenshiniIDalton Post
Kathleen Lakes Bunvash Uplands
Slims Valley Kloo Lake
Jarvis River Klukshu Lake
North Donjek Valley Pine Lake
Alsek-Kaskawulsh Confluence Bighorn Creek Frederick Lake
Onion Lake Lowell Lake/Goatherd Mt.
Dezadeash and Sixmile Lakes Conpdon Creek
. 5 6 7 8 9 10 1 1 12 13 14 i 5 16 17 18
r
19 20 21
occun because the zone contains feew social values per area but a number of ecological values
Social Values
9 14 6
Name
Kluane River Hungry Lakes
South Donjek River Valley
6 6 G 8 8 9 9 6 3 6 5 5 5 2 4 5 4
- - . 46 44 49 1 1 52 25 24 43 9 34 48 12 39 45 37 3 7 13
per area.
Ecological Values
8 5 3
When compared to the spatial distribution of values when nnked by social values (Map 5.3).
several key differences are noticed. The main difference is that most zones with an area under
500krn2 have shified From the lower m k s of top 60% - top 100% when ranked by social values
up to the top 20% - top 60% when ranked by social values per area (eg. zones 13,34. 10. 1 1. 15,
3 60 562 655 389 568 368 457 476 428 692 844 536 301 910 Il43 736 738
0.025 0.02491 0.0229 0.02057 0.01937 0.01902 0.01751 0.01681 0.01636 0.0159 0.0154
0.01493 0.01329 0.0L3t9 0.01312 0.0122 0.01672
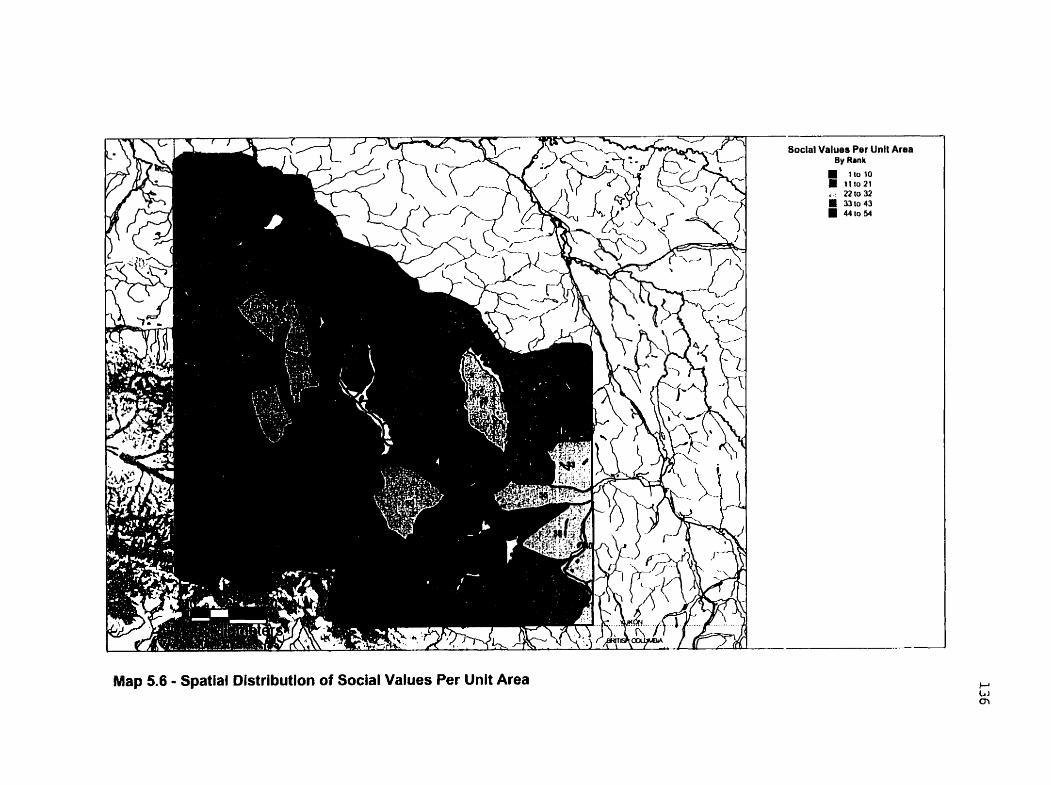
Soclal Values Per Unit Area By Rank
I l 010 11l021
, 22 to 32 1 331043
44 to 54
Map 5.6 - Spatial Distribution of Social Values Pet Unit Area

CASE STUDY ~ S U L T S AND DISCUSSION 137 -
18.14,îj. 39.41. and 46). This is not altogether unexpected. as the whole point of dividinç by
ürea was to allow the srnaller zones to be comparable to the larger ones. Despite these slight
differences, a total of eight zones are Iisted in the top 40% both wlien ranked by social values and
when ranked by social values per area (zones 34,4445, 47.18.49. 5 1. and 52) . indicating that
.!!hm$ rherc will he inevitahlc ciifference< when cnrrccting for aren. the cnre p i i p (if wcinl
value hotspots remains unchanged.
Ecological Values Per Area Per Zone
The zones falling within the top JO% when ranked by ecological values per area are listed in
Table 5.8, and details on the ranking of al1 5 5 zones can be found in Appendix 4 (Table A4.6).
Of these top 40%. t ive f zones 46. 52. 13. 13 and 49) rire located witliin park boundaries. and tive
(zones I 1.43. 44. 5 1 and 10) are at least partially located in the KWS. Five of the zones falling
within the top 40% when ranked by ecological vaIues per area (zones 4 1. 17. 19.33 and 1 O) were
not listed in the origind list of total values per areri due to the low concentration of social values
present in each. By cornparison, zones 349.48.37. and 14 were listed in the top 40% when
ranked by total values per area but were not among the top 40% wiien ranked by ecological
values per area. These zones fall outside of habitat ranges for several species. resulting in a Iower
ecological concentration than areas where more wildlife ranges overlap. However. it is important
to note that the habitats located within these zones rnay still be quite valuable for the species
located within those zones. For instance, the confluence of the Alsek and Kaskawulsh Rivets in
zone 48 may be critical for grizzly bears, but since this zone does not rnaintain as wide of a range
of ecological values as, say. zone 18. zone 48 did not appear in the top 40%.
When compared to the results of the analysis ranked by ecological values. we see that the list
of the top 40% when ranked by ecological values per area contains nine of the fourteen zones

CASE STUDY ~ s U L T S AND DISCUSSION 138
originally in the top 40% when ranked by ecological values in Table 5.5. In addition, zones 5, 54,
4. 27, and 3 1 from the top 40% of the ecological values analysis are not included in the top JO%
of the ecological values per area analysis, mostly due to their larger areas of 983km2, 3 147km2,
866km2, 1 140km2. and 1 143 kmL respectively .
It is also inreresting to note tliat there are considerably more zones that are found in the top
JO% of both the social values per area analysis and the ecological values per area analysis as
opposed to the little amount of overlap between high rankinç zones in tlie social values and
ecological values analyses. Recall t h when not corrected by area, only one zone (number 52)
was listed in the top 40% of both social values and ecological values. However. when corrected
for area. fourteen zones ( 1 1. 12, 13, 1 8.24. 25.36.39.43.44.46.49. 5 1. and 5 2 ) are iisted in the
top 40% of both social values per area and ecological values per area. To examine this
relationship, social values per area were ploned against ecological values per area. Figure 5.2
slzows that there is indeed some correlation between social and ecological values when corrected
for area. This correlation likely arises from the fact that tvhen corrected by area. the zones with
larger areas generally tend to have a smaller number of vaiues per area and vice versa. Two
exceptions are larçer zones with an abnormally high concentration of social (eg. zones 47 and
45) or ecological vaiues (eg. zones 5 and 35). and smaller zones with an abnormally low
concentration of social (eg. zones 4 1 and 17) or ecological values (eg. zones 1 and 40). Note thm
the outlier that ranks high in both social values per area and ecological values per area is zone 18,
Kluane River, which ranks first in al1 three area-corrected analyses.

CASE STUDY RESULTS AND DISCUSSION 139
Figure 5.2 - Scatterplot of Social Values Per Area Versus Ecological Values Per Area.
Table
p n k
1 2 3 4 5 6 7
S 9 10 1 1 13 13 14
15 16 17 18 19 20 21
Ecological Values per Area per Zone. Total
Values
17 16
5.8 - Zone
18 25 i l 24 46 39 15
52 13 36 43 JI 17 35
44 51 19 12 -- 49 33 I O
Value Hotspots, h n k e d by Name
Kluane River Kloo Lake
Burwash Uplands Jarvis River
M ush-Bates Lakes Frederick Lake
Donjek-Kluane River Confluence
Slims Valley South Donjek River Valley
Rainbow Lakes Klukshu Lake
South Takhini River Little CreeWOutlet Hill
Dezadeash River. Canyon to Champagne
Tatshenshini/Dalton Post Hungry Lakes
Brooks Ann Plateau
Bighom Kathleen Lakes
Taye Lake Quill Creek
Social Values
9 7
Ecologicai Values
8 9
IO 17 15 9 I I
19 -------<
9 9 14 3 5 16
20 19 1 O 13 2 1 12 7
8 9 6 5 8
8 3 3 6 - 3
4 9
6 5 -. 1
5 ----- 6 7 4
8 8 9 4 3
I I 6 6 8 I I 7
ILS 14 3 8 15 5 3
Area (km')
287 368
Ecologicai Values per
Area 0.02787 0.02446
389 457 360 301 500
568 220 223 476 179 361 827
362 473 663 536 655 793
1 456
0.02057 0.01969 0.01667 0.01661 0.0 16
0.01408 0.01364 0.01345 0.01261 0.01117 0.01108 0.01088
0.01068 0.01057 0.01056 0.0093 0.0093 0.0088 0.00877

CASE STUDY RESULTS AND DISCUSSION 140
Results from the ecological values per area analysis are also presented in Map 5.7. When
cornpared to the map of total values per area (Map 5.5). there are only a few differences. Only
four zones (14,45,47, and 48) shifted up or down more than one category, moving from the top
60% when ranked by total values per area down to the top 100% when ranked by ecological
values per area. This likely occun because the zones have a high number of social values per
area - al1 are within the top 40% when ranked by social values per area - but a lower
concentration of ecological values per area.
When compared to the spatial distribution of values when ranked by ecologicnl values. many
differences are detectable. The main difference is that most zones with an area under 550krn2
have shitled from the lower ranks of top 60% - top 100% when nnked by ecological values up to
the top 20% - top 60% when ranked by ecological values per area (ie. zones 9. 10. 12. 13. 17. 2 1.
36.39. J I . 46. and 5 1). A Few large zones with areas greater than 1000km2 also decreased from
ranking within the top JO% when ranked by ecological values to only ranking within the top 80%
when ranked by ecological values per area (zones 3 1 and 54). Again. these differencrs were
expected as the intent of conecting by area was to make smaller and larger zones more
comparable. Despite these differences. it is important to note that nine zones are listed in the top
40% both when nnked by ecological values and when ranked by ecological values per aren
(zones 1 I , 15. 18. 19. 24. 25. 33, 35. and 52) . This indicates that although there will be inevitable
differences when correcting for area, the core group of ecological value hotspots remains largely
unc hanged.
Ovenll. grouping social values per area and ecological values per area together to carry out
the analysis does not affect the results substantially, as a core group of zones emerges as having


CASE STUDY RESULTS AND DISCUSSION 142
higli concentrations of both social and ecological values. Notably, zone 18 is ranked as number
one in al1 three analyses. In addition, zones I 1. 12, 13. 1 8, 24, 35. 36,39,43,44.46,49, 5 1, and
52 are al1 within the top 40% in al1 three analyses.
Summary o f Findings
Six different tables and maps have been analyzed and discussed throughout this section. The
distribution of the total values in the GKR were tabulûted and rnapped tirst (Table 5.3, Map 5.2).
Then. social values and ecological values were analyzed independently in order to detennine
whether grouping the hvo into one total value had any major affect on the results (Tables 5.4 and
5.5. Maps 5.3 and 5.4). Interestingiy, there was little overlap between zones with high ranking
social values and zones with high ranking ecologicaf values. reinforcing the need to consider
both social and ecological values in any analysis (Figure 5.1 ). Only one zone - zone 52 -
contained a considerable concentration of both social and ecological values. Despite these
differences. a core group of zones emerçed as having high concentrations of both social and
ecological values. whether ranked independently or together (social viilues in zones 28.34. 44,
47.48.49, and 5 1; ecological values in zones 1 1. 18.24,25. and 35).
The fast three analyses considered how these results changed when the number of values per
zone was corrected for area (Tables 5.6, 5.7. and 5.8: Maps 5.5, 5.6. and 5.7). There was very
little difference when comparing the zones in tlie top 40% when ranked by total values and when
ranked by total values per area, as a total of twelve zones were listed in the top 40% in both
analyses (zones 1 1, 18,24.25,34,35,44,46,48,49,5 1 and 52). Similady, there were only
slight differences when comparing the top 40% when ranked by social values and when ranked
by sociaI values per area, as zones with smaller areas generally ranked higher once corrected for

CASE STUDY RESULTS AND DISCUSSION 143
area. A total of eight of the high-ranking zones (ie. top 40%) when ranked by social values were
also in the top 40% when ranked by social values per area, (zones 34.44.43.47.48.49, 5 1 , and
52) . When comparing the top ranking zones when ranked by ecological values and when ranked
by ecological values per area most of the differences arose due to the smaller zones increasing in
nnk and larger zones decreasing in rank due to the area correction. However. n total of nine
zones were listed in the top 40% when ranked by both ecological values and ecological values
per area (zones I 1. 15, 18. 19. 24.25.33. 3 3. and 52). Overall. tliis indicates tliat although there
will be inevitable differences when correcting for area. a core group of value hotspots remains
unchanged for total. social. and ecological values.
The three analyses that wcre corrected by rirea were also compared with one anotlier to
determine whether grouping social and ecological values together had any eifèct. As with the
analysis on the uncorrected data. there was iittle difference when comparing the spatial
distribution when ranked by total values per area. social values per areo. and ecologicnl values
per area. There was. however. more overlap between social and ecological values when corrected
by area (Figure 5.2). This is because zones with larger areas generally tend to have a smaller
number of values per area. with the exception of large zones with an abnormnlly high
concentration of values social and smaller zones witli an abnormally low concentration of values.
Nevertheless, a core group of zones found within the top 40% of all three analyses emerged. as in
the other analyses (zones 1 1. 12. 13. 1 8.21.25,36,39.43.14.46.49. 5 1. and 52).
When comparing the core zones that emerged from al1 six analyses, it is interesting to note
that zone 52 fell within the top 40% of al1 s i r analyses, while zones I 1, 18,24,Zj, 44,49, and 5 1
fell within the top 40% of five of the six analyses. and zones 34, 35, 46, and 48 fell within the top

CASE STUDY RESULTS AND DISCUSSION 144
40% of four of the six analyses. Regardless of the slight differences arising from grouping social
and ecological values together, or the changes observed when corrected by area, the results from
al1 analyses suggest that these nvelve zones are undoubtedly value hotspots.
Ctiven these tïndingq. the next ~ect ion diwisses wme weoknesses inherent in the data and
suggests some future priorities t'or research within the GKR.
5.4 CONCLUDING REMARKS
Although this exercise provides an overview of the spatial distribution of values on the GKR.
the analysis is only as strong as the data available. The next section therefore discusses the
weaknesses inherent in the data and how these weaknesses may have aftècted the resiilts. Some
general conclusions are then dnwn from the case study tïndings.
Data Weaknesses
Several key weaknesses in the data need to be pointed out. Social values wiil be discussed
first. followed by ecoloçical values and general data disparities. First. it is important to note that
information on subsistence harvesting is not always readily rivailable for public use due to
scnsit ivities associated with traditional ecologicaI knowledge. Moreover. it shoiild be noted that
information for C A M is considerably more accessible than information for KN and WRFN. so
data available for subsistence hanest in the northem portions of the study areci are limited.
Very little information is also available for primary trapping areas and key guiding/outfitting
areas due to the privacy rights of trappers and outtitten. This data gap has probably caused some
areas of key signifcance to trappen and outfitten to be ornitted frorn the final rnaps. This is less

CASE STUDY RESULTS AND DISCUSSION 145
problematic for outfitters, as it is reasonable to assume that key outtitting areas overlap
considerably with key wildlife areas. However, it is a weakness that must be considered for
trapping values. since linle information is available on specitïc habitats of kep furbearing
species. such as lynx, marten. wolves, and wolverines.
One main reason for this lack of information on critical habitats of these predatory tùrbearers
is that the presence of prey is ot'ten more important than speciiïc habitat requirements. Since
many of these key prey species are widely distributed, it is extremely difficult to select key
habitat locations for both prey and predators. Thus, some lsss obvious key habitats. such as
denning sites for ground squirre
dotabase.
1 colonies. have likely been omitted from the ecologica . l values
Data on signi tïcant geomorphological and hydrologicol sites are also lac king. In addition.
exact locations of rare plant species are not yrt available. so rare plants have been lrft out of the
analy sis.
It is also important to note that data are considerably more concentrated around roads. This is
obviously due to the high costs associated with carrying out field surveys in rernote locations.
Consequently. this may have caused some values present in the more rernote zones to be
overlooked.
Another potential weakness in the data arises since some of the information was collected up
to twenty years ago. and there was no way to verib whether the current status is the same

CASE STUDY RESULTS AND DISCUSSION 146 - -- -
without carrying out extensive field surveys. I t is therefore necessary to assume that any major
data flaws would have been detected in discussions with individuals familiar with the study area.
These data disparities have influenced this study in two ways. First, several categories of
social and ecologicai values were omitted from the analysis becriuse there was simply not enough
information available. These include outfitting and trapping areas, wolverine, rare plants, key
prey species (except muskrat). passerines and shorebirds. Second. the databasr represents values
that are well documented more accurately than values where information is sparse, such as
abiotic features and subsistence harvest by KFN and WRFN. The database developed must be
therefore be considered as n srarting point. with more information being ndded as the data
become available.
Future Research Priorities
Based on these data disparities, several areas for future research are recommended. First.
some future research needs to be directed totvards gathering more data on the spatial distribution
of srnall mammals that act as key prey species for the larger predators in the GKR. Knowing the
regional distribution of these prey species, in yean with high and low population densities. will
provide the needed information on large predators such as wolverines. lynx. and wolves. A major
study on small mammal community dynamics in the Kluane area has just been completed and
will likely help to address this area for research once the results have been published (Krebs et
al.. in press).
CASE STUDY RESULTS AND DISCUSSION 147
More detailed research also needs to be carried out on rare plants, as the GKR contains
multiple nationally rare andor endemic plant species. Although the general location of these
plants has been described, more site-specific information would be useful.
More research into aauatic ecology both within the park's otigotrophic Iakes and in the more
diverse lakes outside park boundaries is also required. This area of research lias been recognized
as critical by severni pcirk staff (Brenneman and Elliot. pers. comm. 1999).
General Conclusions
The above analyses explored three main questions: ( I ) liow are value hotspots distributed
throuyhout the GKR. (2) what is the effect of grouping social and ecoloyicnl values into one
total, and (3) what is the effect of area and should it be corrected. Some generai conclusions can
be drawn for each of these questions.
With respect to the distribution of values. the tables and maps presented above repeatedly
showed zones 52 . 5 1,49,44,24.22. 18, 1 1.48,46,35 and 34 ranking within the top 40% of
most analyses. This implies that these zones are undoubtedly value Iiotspots and need to be given
special consideration in future planning exercises and when exploring questions surrounding
cumulative environmental effects. It is interesting to note that of these hotspots. four are fully
protected within KNPR. Three others receive a modente amount of protection in the KWS.
while the rernaining five are located outside the borden of parks and protected areas.
Two sets of analyses were carried out - one on the raw data. one on area-corrected data. In a11
analyses. there were few major differences in the resulting zones nnking in the top 40% when

CASE STUDY RESULTS AND DISCUSSION 148 .. -..
social and ecological values were grouped together in one total as opposed to being analyzed
independently. This indicates that future exercises could analyze social and ecological values
independently or together, depending on the desired level of detail. However. the lack of
relationship between social and ecological values in the uncorrected data also suggests that both
wcia l and ecoiogicnl vnliies rniist he considered in aiiy case study. as one cannot be assumed to
overlap with or include the other. An interesting future option would be to give each zone two
ranks. one for social values and one for ecological values.
When cornparing the analyses that used the raw data with tliose thût used area-corrected
values. many diffkrences were noted. particularly with smaller zones ranking substantially
higher. One potentinl problem with this is that although it nllows zones with smaller areas to be
more comparable with those with larçer areas. there may be too strong of a bias towûrds the
smaller zones which may only have a few values. causing some of the average to large sized
zones with a substantial concentration of vaIues to go undetected. For instance. zone 4 1 has a
small area and only contains two ecological values (goot and sheep), yet it appears within the top
JO% when ranked by ecological values per area. Conversely. zone 3 I contains a diversity of
ecological values (deer. waterfowl. raptors, grouse. grizzly bear and sheep) yet it only ranks in
the top 80% when ranked by ecological values per area due to the medium zone area. For this
reason. it is recommended that in future applications the zone area be kept as constant as possible
when determining the initial zone boundaries. and that al1 analyses be performed on the raw data.
This would avoid the difficulties associated with correcting for data by completely removing the
need for any correction.

CASE STUDY RESULTS AND DISCUSSION 149
The implications of this case study are discussed in Chapter 6, dong with an overview of
potential applications of the methodology, an evaluation of the methodology. and some
concluding rernarks (Figure 5 -3).
Problem De finition (Chapter 1 )
+ -
Literahire Review J Themes:
- protected areas selection - p.uk mamgcmcnt - CRLUP - CEE and CEA
~Chaeter 2)
Guiding Guiding Principles for Theme Principles for Methodology + Interactions Methodotogy Appplicntion (Section 3.1 ) Development
(Section 3.2) (Section 3.1)
Overview of Methodology
(Section 3.3)
Stage 1 Stage 2 Data base Ho tspots
(Section 3.4.1) - -
(Section 3.4.2)
Case Study (Chripters 4 and 5 )
Conclusions - -. Future
Appiications (See~ins 6.1 and 6.24
- Methodology
. -. - . - - Evalnation (Section 6 3 )
Goal 2
Goal 3
Figure 5.3 - Conceptual Map of Thesis

ln the previous cliaprers. tlie literature on protected areas selection. northern national park
management. comprehensive regional land irse planning. and cumulative environniental effects
and assessrnent was revie\ved. This literature tlien sen ed as the basis for a series ot' principks
that guided tlie Jevelopment of the proposed methodolog. The methodolog iri\.ulit.s conipiling
a database of social and scological values and detemining arcas ~vith the higliest concentrations
of these values. To test the methodolos). a case stiidy \cas carried out in the Greatrr Kliiane
Region ofsoutl~ivest Yukon. Resiilts sliou that twehr: zoiies in tl ic GKR are undoiibtcdl' value
Iiotspots and need ta be given special consideration in fiiture planning eserc tses and u lien
esploring questions surrounding cumulative environmental sffrcts. Notabl'. onl! four of thest.
zones are fully protected within KNPR.
In this chapter. tlie question "Wliat Nest'?" is esplored througli a discussion of pottmtinl hitiirc
applications of tlie methodolog (section 6.1 ). implications of the case stiidy tinciings are also
discussed (section 6.2). Conclusions cm the ~rt i lit' of the methodology are tlien dra\i r i b',
evaluating how ivell the methodolog. and its potential applications are alignrd ivitli the guidiiig
principles outlined in Boxes 3.1 and 3.2 (section 6.3). This is followed b!, a discussion on
research contributions (section 6.4) and potential areas for future research (section 6.5). Final ly.
thesis goals and objectives are reviewed (section 6.6) and some concludinp rernarks presenrsd
(section 6.7).
6.1 POTENTIAL FUTURE APPLICATIO~YS
The proposed methodolog consists of hvo products: a database of values and a spatial
overview of concentrations of social/ecological values. These products may be applied in both
150

planning esercises and project-specific CEAs to help minimize CEEs in and around nonhern
national parks.
Regional Planning Applications
For planning piirposes. developnent thresliolds and limits of acceptable clia~ige could bc:
determined as part of a vision for a rsgion. \r itli incire restricted commercial access to Lalue
Iiotspots. These tliresliolds and lirnits of acceptable cliange ma! tlien be iiscid in çonjiinction \\. ith
tlic values databasse and project-speci tic CEAs to evriluate the acceptabi lit! of an) proposed
projrct. only allowinp a project to proceed if impacts (project-spccific A N D ciiniiilntivc) do not
esceed pre-specified thresliolds and limits of acceptable change. Therehre. ris rnore and more
projects are developed in ri region. i t uill becotne increasiiigI> dit'ficiilt to ~ir~cilcip in the most
valuable areas as the aniount of actii it! approaclies tlie predeterinined cap on de\ elopment. .-1s
sucli. a proactive management stance is beitig taken to inhibit more devt'loprntlnt thnn nn nrea cnn
sustain. so tliat social and ecological valiies are not comprornised.
Indeed. some work lias already been staned on thresholds in Yukon (AXYS. 1999) and the
value of proactive planning for rninimizing CEEs is becoming more and rnore recognized
(Muellrr. pers. comm. 1999). In addition. witli the upcoming structiirûl clianges to environnwntal
assessments tliroughout the Yukon Territory with the advent of the new Development
Assessrnent Process, now would be an ideal time to higtilight tlie need to view developrnent
activities at broader space and time scales and to have a planning regime in place to limit CEEs.
Consider the following hypothetical example based on the rrsults of the case study. If the
results presented in Chapter 5 encourage KNPR to develop a regional plan to proactively

-- . - - --
niinimize CEEs. the onus would fall on Parks Canada to initiate the planning process. This could
perhaps be carried out in association with either a management plan review or an ecological
integrity statemeiit update. as botli of these processes require a focus beynd park botindaries and
consideration of CEEs. Past. prcsent aiid f~rture land lises cuuld then be mapped. notins the major
impcts - hoth poîitive and negative. socioeconomic and ecologicnl - associard u itli cadi. as
well as the potential for the interaction and accumulation of these impacts. Keeping the h~gllrst
priori5 areas outlined in Chaptcr 5 in mirid. Parks Canada would tlien consult the public
regarding lirnits of acceptable cliange in tliese areas given past. present and fiirure uses and the
positive and negative implications of various projects and alternatives. Somc professional input
on wildlife tliresliolds would also be useful rit this stage.
Information on lirnits of acceptable cliange. \\ ildlik tliresliolds. dt.velopirierit impacts and
potential accumulations could then bc: corn piled tu determ ine I i w mucli more development can
be permitted in eacli zone. IderiIl'. f w e r future devslopments uoiild bs permittrd in areas of
liigliest value sucli as zones 52. 5 1.49. 41. 25. 24. 1 S and 1 I . The suitiibility or desirability of
future proposed projects and activitiss could tlxn be svaliiated using these thresholds. Fur
instance. zone 1 I (Bunvasli Uplands) already sustains a considerable amoiint of past. present
and potential mining sites. The same area also provides critical caribou calving grounds. habitat
for grizzly bears and raptors. and contains unique geornorphological katures. Bj. placing a cap
on future developments beyond whicli will cause unacceptable clianpes. tlie ecological integrity
of the park and surrounding regions will be siiaintained. Social values associated with the zone -
such as hiking, wilderness esperience. and nature appreciation - will also be preserved. Of
course. some degree of monitoring would be required to ensure that proper development limits
were established and that development impacts are not interacting to cause CEEs. Although a

considerable amount of time and energy is required to carry oiit this planning process. takins n
proactive stance w i l1 help to Save tirne and financial resources in the future.
Cumulative Effects Assessrnent Applications
The proposed methûdology ma- also be used tor proiect-spccitic CEAS. as dl k n m n
elenlents of ecological and social valiie are alread? oiitlined. This initial compreiiensi\*e look at
values will ensure that r d 1 values are plainlq. t isibls from the stan of the assessnient. I t is
important to note tliat the values database andlcir rireas u itli the Iiigliest concentration of 1 aliies
can not act in place of VECs/VSCs. Rather. specific VECs/ VSCs shoiild be selected tiom the
database or valued areas based on tlieir siisceptibilit~ to the projcct iinder rek i e t~ . This \i a'. al1
proposed devetopinttnts for a regioii stan u ith tlie jarne 1 a1iit.s tliat iniist bs considercd. acting
almost as a cliecklist of values. Houeter. it 1s crucial tliat the talues database be iipdritcd
regularly as niore data becornes ritailable in ordttr tlirir it rcrnriins a reliable owrvitm of values in
the studl area.
Although the metliodolq~ has been designed with norttiern pnrks in m ind. it could be appl ied
in virtually any situation wliere C EEs have not yet become problematic. Efforts are the11 directed
towards proactively p tanning to limit the potential for CEEs before sscessive degradation
occurs. In regions where CEEs are already prevalent. howwsr. efforts may be more effective if
directed towards m itigat ing the esisting CEEs.
6.2 CASE STUDY IMPLIC.ATIONS
Case study results indicate that several key areas can be considered as '-value hotspots"
throughout the GKR. Only a third of these zones are located within the boundaries of KNPR. yet

there are many interactions behveen the zones \vitIlin the park and ttiose falling outside park
boundaries. For instance. the grizzly bears in the Slims Riber Vallq (zone 5 3 likel) makc iise of
the habitat found on the east side of Kluane Lake in zones 24 and 2 5 . For social values. the
hiking and biking occurring in zone 49 is likrl! linked to tlir prosinlit' of rducation. camping.
and nature appreciation i r i zone 34. Given tliat values nithin the park are liiiked to tfiost. outs~de
the park. the resiilts of the case stud> reinforcc tlie need to nianage K8PR in n regional contest if
ecologicnl integri' and the associatsd social and ecological u lues are to be maintained. Ont.
Lvay to accomplish this ivould be for Parks Canada to initiate n proactive regional planning
approacli sucli as tliat listed above. This aould involve \\orking u ith adjacent land ou ners. tlie
Yukon Territorial Govrrnmrnt. and lucd Aboriginal croups to determine a long-term b isioii for
tlie region and set development thresholds or limits of acceptable change for the most valiiable
zones. Thrse developrnent limits ma' tlien be i1sr.d to evaluate the acceptnbilit> of proposcd
projects. 50 as to not allow development to ttsceed tlic prcdetermined tlirrsliolds. Hosting regular
meetings and initiating a monitoring program to trach the effecti\eness of the drvelopnient
thresholds or lirnits of acceptable change \ \ i l 1 hslp ro acliieve tliis goal.
By effectively implementing development caps. ri proactive stance on CEEs niIl be takrn b>
limiting development in the most valuable areas brfore environmental impacts occiimiilate and
have significant negative effects. In addition to minimizing CEEs. this approach would provide
better protection for al1 wildlife and contribute to the general long-term sustainability of the
GKR. Indeed. some park staff have already recognized the need for the park to takr a proactive
approach to protect ecological integrity in order to avoid a situation where rectification is
necessary (Elliot. pers. comm. 1999). Taking such a proactive planning approach will also allow
national parks to meet the challenge of deterrnining '- ... how to manage the increasing tlow of

- -
development requests as a Lvay of limiting cumulative effects" put fortli b!, the Panel on the
Ecological Integrity of Canada's National Parks (Parks Canada. 2000: 17.1 7) .
I t is very important to note here tliat zones witli the most concentrated \Aues may not be the
mrrst valuahle for a particiilar species o f concern. For instance. sorne criticnl areas for grizzl?,
bears are not located witliin the zones n.itli niost coiicentrated \.aliles. Tlius. \\lien setting
development thresliolds iviiile undenaking n regional planning rsercist.. i t \tif1 bc iittcttssa~~ to
take species of particular concern into special consideratioii. Oiie possible \ta> tu address this
drawback nould be to devise a ~r eigliting s' stem to be implenicnted N-hen t d l ' iiis total zone
values. as discussed in section 3.4.2. For instance. grizzli bcrir habitat could bt. giceii ri score of
I O \++hile moiintain biking trails a score of 1 . This \va>. zones \\.itti critical srizzlt habitats \\ouid
almost always have a Iiiph number of total ialiies. This approacli was not taken in tlie case stud?.
presented in this thesis because weighting for relative significnnct: would reqiiire considerabIr
input from both the public as \\cl1 as regional biologists ro corne to ail agreement on a siiitablc
weighting systrm for the study area. In addition. it \vas felt thnt u~eiglitiiig wns not reqiiired giwn
tlie csploratory nature of this study. altliougli it \wuld be intrresting to set: tlie resulis o f û futiire
weighted case study of the methodology.
As far as data availability. it can be concluded that altliough there are enough data to car- out
an analysis on vaiues in the GKR. there are inevitable weaknesses associated with this data. as
discussed in section 5.4- This highlights the need for more basic inventorying. continurd
monitoring. and regular updating of the values database in order tu strengthen any future
applications of the methodology in the GKR.

6.3 METHODOLOCY EVALUATION
Two sets of giiding principles are presented in Ctiapter 3. To evaliiatr the effcctiveness of the
proposed methodology. it is useful to compare Iiorv ~vell thc metliodolo~y and its iniplementatioii
potentiais meet the suidel ines outlined in Boses 3. l and 3 2.
Recall thnt the t he principles guidiiig metliodolog> devrlopmrnt require tliat the
metliodoiogy:
i. Provide a manncr to select areas ~vhsre actiieving the proper bnlarice benveen environriient and development is of greatest importance:
i i . Incorporate social and ecological values of the study area:
iii. Take account of the recommt.nded ecological integrit! monitoring measurcs:
iv. Work at a regional scale: and
v . Assimilate information ivitliin stiidy rirea boutidaries .
Al1 of tliese requirements Iiave been met in the rnt.tliodolog> developed in Chnpter 3 . Stase 1
involves assirnilating information to identib social and ecologiçal values at a rcgionnl scalc. as
spec i t k d t
ecological
ecological
y principles 1. 4 and 5 . Principle 3 is also satistied in Stage I sincc the recornmended
integrity monitoring measures have becn incorporûted into the list of social and
values listed in the iiterriture on protected areas selectiun. park manasenlent. and
VECsNSCs presented in Tables 3.1 and 3.2. Stage 2 involves detemiining zones nith the highest
concentrations of social and ecological values. thereby providing a manner to select areas where
achieving the proper balance benveen environment and development is of greatest importance as
stated in principle 1 .

- -- - - - - --
A set of guiding principles was also derived for the potential applications of the nierhodology.
A summary of these sixteen priiiciples and notes on Iiw well tlir msthodology addresses tliese
principles are presented in Table 6.1. In general. the methodolo_o and its associnted applications
disciissed in section 6.1 allow a long-term. oroactivt: regional perspective to be takeii on p s t .
present and futlire development activities. Tliis is accomplished through srtting clear goals.
integrating social. sconomic and environmentiil aspects. and identifying land use thresliotds to
link environmental assessnients and regional planning iindsr goLeniment Icadership. 0tlit.r
pidelines - such as tlesibility. timr cunstraiiits. stahrliolder roles. and coiiiinuit> ovrr timr -
could not be evaluated at tliis time as the- N i l 1 v a n wrisiclt.rribl> bascd on tlic specific conditiuiis
surrounding ericli case application.
Overd 1. the proposed methodolog> and its assoc iated appl icritions in proactive land iisc
planning. srtting developrnent thresliolds. and CEAs satisîj nlinost all of the giiiding principlrs
derived from the literature revien.. Tliis siiggests tliat the inetliodoiog~~ \vil1 be qiiitr usefiil in
working towards a proactive planning approacli to limiting ciimulative environmental effects in
and around nortliern national parks. The main drawback of the merhodology is its reliancr: on
existing data. causing weak data to give weak rrsults. The only lvay to addrcss tliis drawback
would be to initiate more basic inventorying and to rstablisli monitoring programs.


6.4 RESEARCH CONTRIBUTIOM
In this thesis. a proposed rnethodology for derermining areas of cuncern for regionai
cumulative impact assessrnent with applications in regional planning and CEA lias been
developed. A pilot application of this niethodolog \vas also carried out in the Greater Kluane
Region of southwest Yukon. Althougli t h m are certaint> ot!ier èsisting rnetliods for dealing u ith
planning issues and CEAs riround parks. the researcli presentèd in tliis tlièsis is unique botli in its
focus on future applications with planning for c~imulative et'fects. and in irs rreatinrnr of social
and ecoIogical values.
For instance. the ABC resoiirce s ~ i r v q rnt.thod \vas designed in the niid 1980's \b itli tlir
primas purpose of idetiti fy ing environmenrally sigii ticnnt areas in Yukon. altliougli t lie concept
is yxmll), applicable tu al1 park rind resene planning in utlier "linaltercd areas" (Bastedo.
1986). Tlie rnethodology proposed in this thesis has sume sirnilarit itts \vit11 tliis resourcc: ~ u r t t ' ~ ~ .
mostly kvitti respect to tlie integration of abiutic. biotic. and cultural data. itic encouragement of
taking a proactive planning stance. and the incorporation of structural and fiinctional attribures.
Both approaches also have planning applications. but the plannin~ foci are qii ite di fferent.
Planning applications of the ABC approach mostl involve establisliing park and reserve
boundaries. wliereas the planning focus of methodolog in tliis thesis involves setting
deveiopment thresholds to limit CEEs in and around esisting parks rind reserves. The spatial
scale of the individual case studies in the ABC approach is also quite localized. and Iience data
c m be collected in great detail through field sunteys and satellite images. Conversely. the
methodotogy proposed in this thesis works over considerably larger distances. using more
çeneralized data found in the esisting literature. In the same way. abiotic, biotic and cultural
significance were determined through a detailed procedure in the ABC method. whsreas tlie

niethodology proposed in this tliesis rook a more general approach by fociising on the spatial
distribution of social and ecological vallies.
This treatment of values is anotlier ilnique aspect of the proposed methodolog. AS \vas
disciissed in section 6.1. the in et ho do log^. resiilts in ri large database of values \t,liicli clin act as
the basis for selecting tlir VECs!VSCs most siisceptible t« devrlopment impacts w h m cnrpiiip
out CEAs in or crround the park.
6.5 FLTCRE RESEARCH
A f rw areas of potential future research nia! be identifird. First. more rcscarcli is reqiiircd on
Iiow to deterniine. set. and enforce de\elopnient tl~rrsliolds and Iiniits uf acceptable cliüiigr.. as
tliese concepts are central to effective proactiie planning. For instance. if inappropriate
thresholds arc set and environniental impacts wise in spite of the thresliolds. the opportiini' for
proactive planning is lost and inanagcment is forcitd to rake a potentiall>- niore costl! reactive
approacli. Thresholds and limits of acceptable cllange are also imponant wlien deniiiig a i t h
CEEs. as sening and enforcing land use lirnits beforc future proposais arise will help keep spatial
and temporal overiaps to a minimum. Lising development thresliolds and lirn its of acceptable
change will also Iielp achieve a better integrntion of environmental assessments and planning
esercises.
More research also needs to be carried out on regional CEAs. In panicular. a stronger link
needs to be made behveen regional planning and CEAs so that impacts of planned projects will
be considered in a regional perspective. CEAs also need to be better integrated into regional
visions or objectives so that proposed developrnents will only be allowed to proceed if their goals

are aliçned with the regional vision. Indeed. thesé were both weaknesses associated with the
CEA frameworks reviewed in Chapter 2.
6.6 THESIS GOALS A N D OBJECTIVES R E V I S I T E D
n nicaii Li~ai iiii-cc iiiaiii gwib wcïc cAAli4icd 1;1 ilii'i i l i c ~ i ~ . i ; ; A L C ~ Ù P i iii~iliùdùlùgj i3 Li
used for proactive plannine to minimize ciimulative environniental effects in and oround nonliern
national parks: (2 ) test tlie metliod through a case study: and ( 3 ) discuss some potcntial
applications of the metliodology in regional planning cserciscs and ciimulative effeçts
assessments.
Througliout the course of this thesis. a metiiodolog> \vas successfuli~ devcloped bascd on ail
extrnsivc Iiternture re\.ieu of the four thesis themcs (goal 1. objective i ) . The metliodolog~ \\as
then tcsted in the Greater Kluane Region. rcsulting in the identitication of social and ecological
values. and the creation of a serirs of siirnmaq niaps aiid tables (goal 2. objccti\es i and ii). The
potential application ofthe methodology in regional land iisr planning rsercises and ciimiilative
effects assessments wûs then discussed. follo\\ed by a discussion of tlie implications of the case
study (goal 3. objectives i. i i and iii). The rnethodoloyy was tlicn evaluated based on ri serirs of
guiding principles derived from the literature review (goal 1. objective i i and goal 3 . objective
iv). Al1 thesis goals and objectives established in Chapter I have therefore bren successfully met.
6.7 C~KLUDIXG REMARKS
Both the Panel on the Ecological Integrity of Canada's National Park and the 1997 State uf
the Parks Report have acknowledge that the ecological integrity of Canada's national parks is
becominp increasingly at risk dur to cumulative environmental effects (PEICNP. 2000: Parks

Canada. 1998). However. northern parks are currently at an ssciting stage where CEEs. although
impending. have not pet had niajor impacts.
Northrrn parks are therefore at a diride where managers hakfe tno options. The) ma? choose
to address environmentai impacts as t i i q arisr anci risk o~erioukitig it~ciividuaii> iiiitiur bu1
collectively signiticnnt effects. These effccts \\ i l l ultiititttel> lead t« the incl itable degradation o f
ocological integrity in both the park and surrounding areris. .-\lternaticel>, managers ma' choose
to be proactive by implrimenting regional plans \cliicli focus on sstting developinent thresliolds to
limit commercial development of areas of greatest social and t.calogical ~a lue . This \vil1 provide
better protection of the matris to ivhicli park ecologiçal intcgrit) i s intriatel! liiiked. tliereb>
ensurins tliat Canada's nortliern parks u i l1 continue to protect pieces of Canada's natural
heritase for f~iture generations.


I I I
C: = s g ; S m - = 9 ç - 2 2 S e -


APPENDIX 1 174


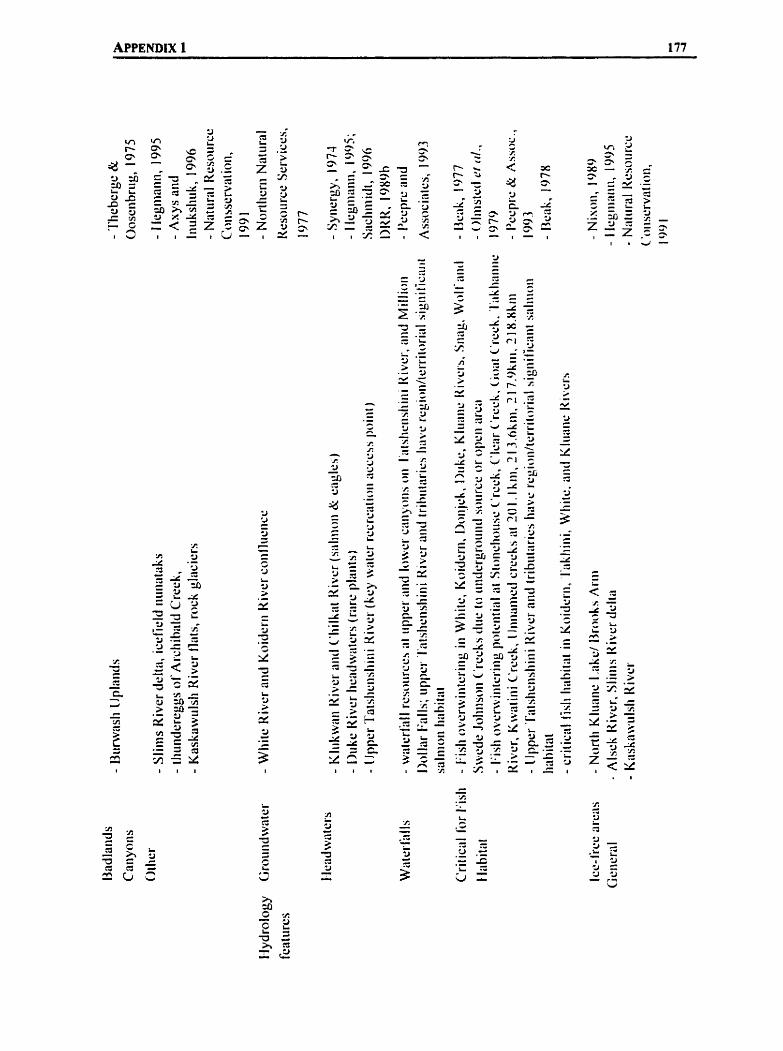
I I I


APPENDIX 1 179


I I I


C. .- S m , r

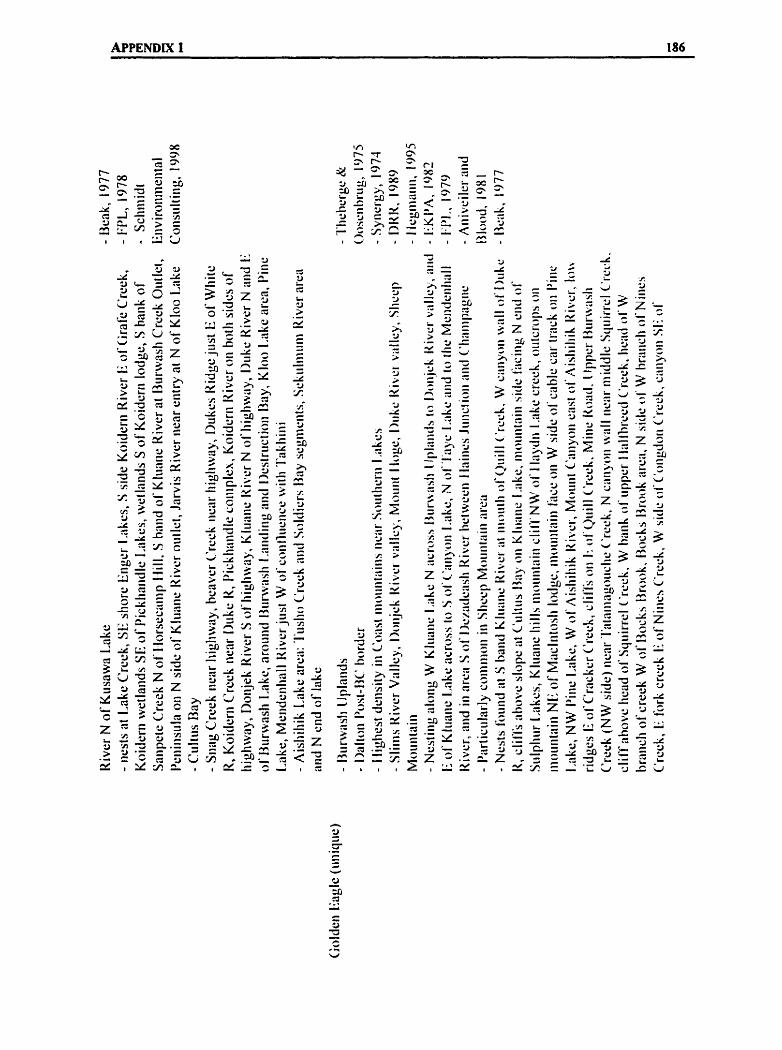

I I I

- C - 3 - V . - -A
*. . - C C " ir cJ P - 3
2 C
* C1 5 C - . - C - .A . - < E S 3 - - - C
E
& *,
CL
d d
5 d
9 2 R! - .c. .I C - L .* 4 - . - .II
u Li- + L
'A r - . - A c. S I
I
'3 A Q -


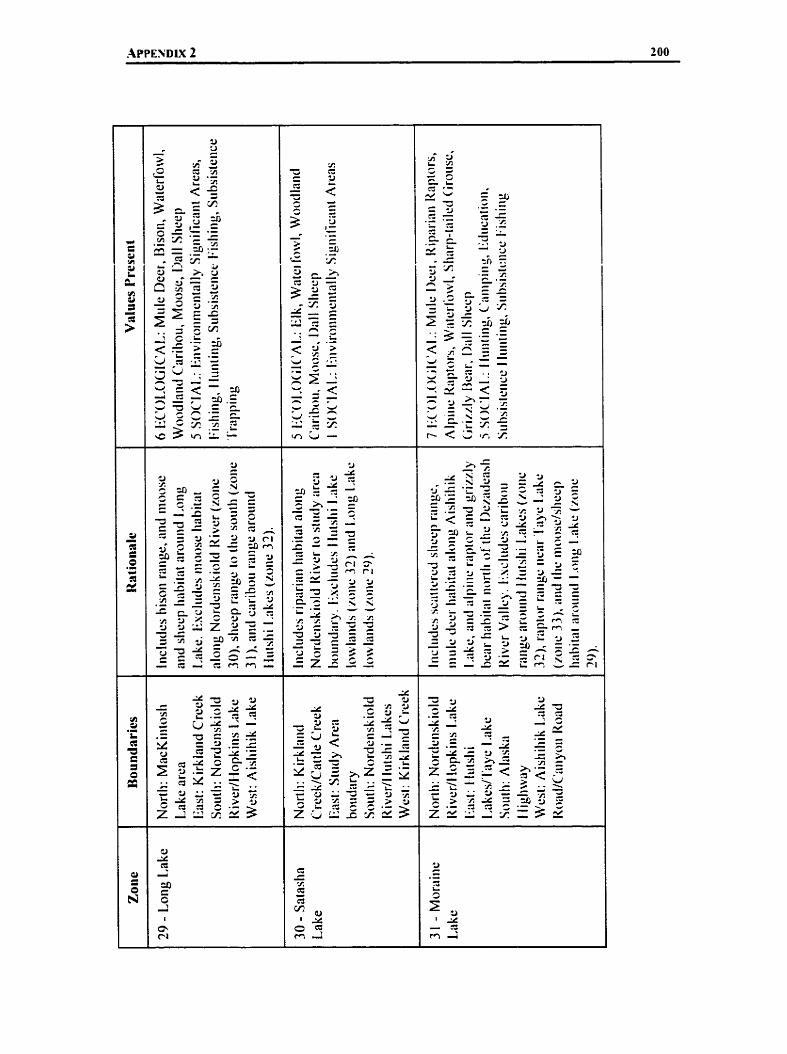


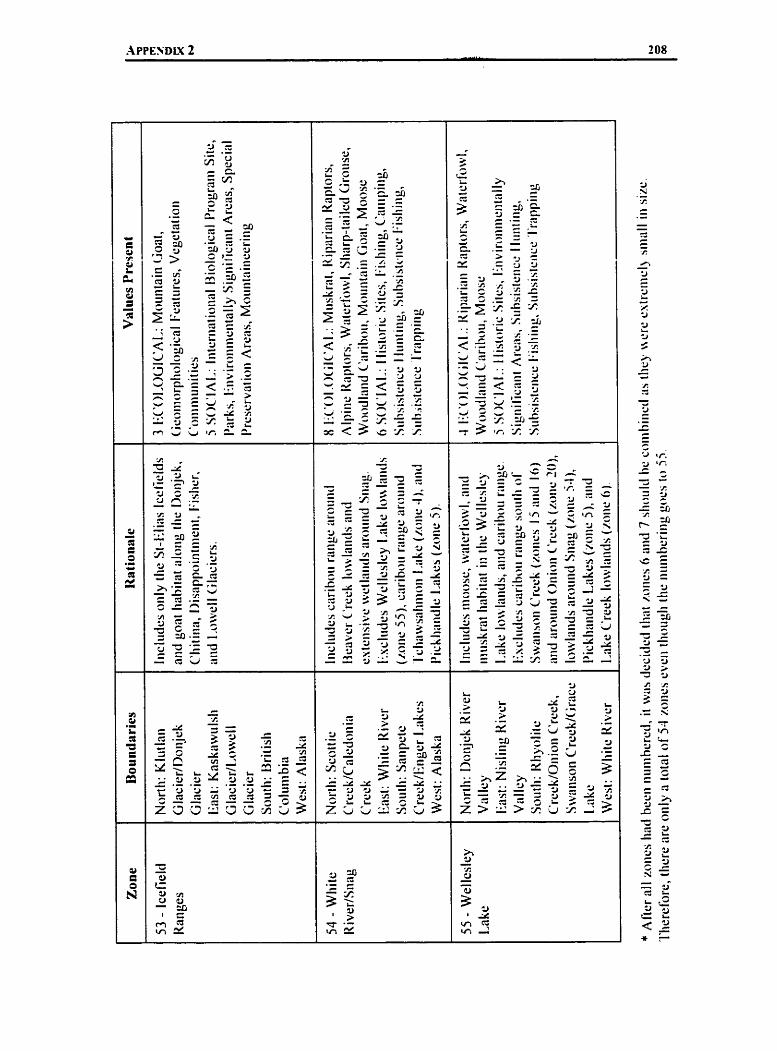

ZONIN~ TIO ON ALE
As discussed in Chapter 5 . zone boundaries were deliiieated based on wildlife habitats and
major physiographical features since a suitable esistiiig system suc h Ecological Land Classification
Ecodistricts was not available for the study area. l n particular. tlie followine steps were taken.
First. al1 wildlife with key habitat in the area of concern were noted. The main wildlift: speçies
used during this step were goat. sheep. mooss. caribou. grizzl). bcar. bison. mule deer and benver.
Once the main species present Iiad been noted. associations with major pli).siograpliical katures
were then recorded. For instance. rnoose habitat was often rissociated with lodands \\hile gorit
habitat mostly occurred rit Iiigher elevations. Boundac lines were ttien drawn to encuiiipass major
iinits of wildlife habitat. To keep zone areas approsimatel' squai in size. boundaries w r e often
drawn dong physiographic features whicli appeared to be nattlral breaks in ivildlife ranges. For
instance. zone 1 boundaries were dratcn to inctude the mountainous goat and sheep habitat. uhile
escluding riparian moose habitat ivhich was subsequently used to define boundaries for zone 11.
I t is interesting to note the simiiarities between the zones used in tliis thesis and esisti~ig zoning
systems in the region. namel? game management iinits and trnpping concessions. The zones used in
this thesis were very close in size to Yukon's game management iinits. In hct. ten zones (5. 6. 15,
! 7. 18. 19. 28.33.40. and 4 1 ) had aimost identical boundaries to gamc management unirs. On
average. other zones contained two to three same management units. escluding zones 54 and 55
which are considcrably larger than the rest. The zones are also similar in size to the region's
trapping concessions. but only four zones (4.28.40. 42) actually Iiave matching boundaries. These
similarities and overlaps confirm that. although approsimate. the zoning approach used for the case
study is in fact valid. that zone boundaries are realistic, and that there is sorne degree of
repeatability.


Table A4.2, cont'tl
Rank
41 42
43 44 45
46 47 48 49
50
5 I 52 53 54
Total Values per areu 0.00258
0.0 1600
0.00672
0.00877
0.00387
0.00808
0.0 1056
0.00209
0.00739 0.00690
17
30
41 30
Social Values pcr urca 0.00343
0.00600
0.00336
0.00658
0.002iN)
O.O036ii,
0.00452 0.00209
0.002~16 0.002.10
Zone
42 15
32 IO 2
4
19 26 16 21
Ecological Values pcr arc,
0.0060 1
0.02200
0.0 1008
0.01535
0.00677
0.01 155
0.0 1508
0.004 1 9 0.00985
0.00920
Social Values 4
3
3 3 3
3 3 - 3
- 3
I 1.ittlc Creek/Oiitlet 1 l i l l
Sataslia Lakc Soiith 'l'rikliiiii Kivcr
I)wiirf l3ircli C rwk
Nanic
Devilliole Creek Doiijek-K luliiie River
Coti fluericc. f lutslii Lakcs Qiiill Cr&
Wolveriiie Plateau
'I'ct~üwsaliiiioii l A c 131-aoks Ariii Plateaii
Ki l lcriiiiiri Lskc
Ecological Vatucs
3
8
6 4 4
7
7
- 7
0
3
Total Values
7
1 I
9
7 7
1 0
1 0
4
5
6
3 5
Area (kni2) 1165
500
893
456
1 034
866
663
95 5 812 435
'f iiiciip Lake 'I'nl bot Creek
I
I I O
8
4 4
5 2 5
361
0 7 3 1 70
21 1-1
0.0 1 t 08
0.005 14
0.0 1 1 17
0.00237
0.0OS:il)


m 'a 3 d c A V
rn m O O z - h V
2 h V A V
c
- .JI 54 - 'A - -
ln
-
30
'Y? 3 "d f
d 2 9 c O U L) 3
- m rn - + v -

- 9 T 3 'a- = 3
-
- 3 9 5 -
n T 'CI - z -
'CI ? I ?J
-
7
-
rC
-
3
-
m ^3 X E J 3 O
E - rY z
- a r)
- 9
-


Table A45 - Zancs Hankcd by Social Vitlues pi. lJnit Area
Total Values per Area 0.05923 0.040 17 C.0409 1 0.04036 0.04 1 67 0.03559 0.03206
l ~ a n k I
, I 2 3 4 5 6 7
Zonc
18 5 1 13 36 46 44 49
8 9 I O 1 1 12
Nanie
Kliiaiic River Hiiiigry Lakes
Soiitli Donjek River Valley Raiiibow Lakcs
Musli-Bates 1,akes Tatsheiisliirii/Daltoii Post Katlilcen Lakcs - f laiiics
Jiiiict ioii 1 1 52 25 24 43
13 14 15 16 17 18 19 20 2 1 22 23 24 25
26
7 1 I 13 8 4 12 15 9 9 5 9 5 7
1 1
Social Valucs
9 14 6 6 9 14 15
Burwash Uplarids Sliiiis Valley aiid Delta
Klao I.ake Jrirvis River
Kluksliii 1.rikc 9 34 48 13 39 45 47 37 14 40 38 6 35
28
3 6 5 5 5 - 3
4 5 4 2 6 4 9
6
North Doiijck Vnllcy Piiic Lake
Alsek-Kaskawulsli Coiifluciicc Rigliorii Creck Freclerick L A C
Oiiioii 1 .akc 1,owcll LnkcIGoutlierd Mt.
I)c.zndeasli atid Sisiiiilc hkcs Coiigdoii Crcck Pritiirosc River
Jo-JO aiid Nartli Kusûwii 1 .akt.s Lake Crcck
Dezadcash River, Ciiiiytrii IO Cliûriipngiic
Aisliiliik ûiid Sckuliiiiiii 1.iikcs
Ecological Values
8 5 3 3 6 6 6
8 I I 7 8 8
Total Values
17 19 9 9 15 20 21
8 8 9 9 6
10 17 18 13 9 14 19 1-3
0.0070 1 0.00867 0.00593 0.00933 0.0 166 1 0.00220 0.003 50 0.00679 0.00542 0.00454 0.006 14 0.00720 0.0 1088
0.0043 1
1
428 692 8-34 536 301 9 1 O 11-13 736
Area (km2) 287 473 220 223 360 562 655
16 19 16 17
0.0 1636 0.0 1590 0.0 1540 0.0! 493 0.0 1 329 0.01319 0.013 13 0.0 1223 0.0 1220 0.0 1 134 0.0092 1 O 0091 1 0.00846
0.00790
13 7 15 9 16
17
Ecological Values per Arca 0.03787 0.0 1057 0.0 1 364 0.01 345 0.0 1667 0.0 1 068 0.009 16
389 568 368 -157
0.02336 0.03457 0.02 133 0.02425 0.03990 0.01538 0.0 1662 0.0 1902 0.0 1 762 0.01 587 0.0 1 535 0.0 1639 0.01935
0.0 1220
72 8 44 1 977 549 827
l393
Social Values p w Arca 0.03 136 0.02960 C.02 72 7 0.0269 1 0.02500 0.0249 1 0.03290
0.0205 7 0.0 1408 0.02446 0.0 1969
14 1 576 0.0 126 1


Common Name Latin Name
PLANTS alder birch spmce. white willo\v
MAMMALS bex. black bear. grizzly beaver. American bison. wood caribou. woodland deer. mule el k fox. red goat. mountain Iirire. cnowshoe lemming, brown lemming. collared Iyns marten. pine mink moose muskrat otter. river pika. collared sheep. Dall s tirew sqiiirrel. Arctic gound vole IVOI f

FISH burbot grayling. Arctic pi ke. northern salmon. chinook satmon. chum salmon. coho salrnon. Kokaneelsoc kqre trout, Iake trout. rainbow varden. Dolly whitefish. round wliitefish. Squanga

Allen. J. 1994. Trmiitiuncil kiowldge report: -4 ishihik cwihorr rrcovc.r\. trrrrr. Champagne and A ishihik First Nations and Renewable Resources. YTG. CVliiteliorse.
Allen. J. 1996. Chanipagne and Aistiihik First Nation Traditional Cultural and Ecological Knowledge of the Aishihik Lake Region. Appendis A IN -4ishihik relic*ën.si~~gprojrc*r environmentid irrrpricr ~rssessn~enr. Volume 8: sociorc-or~unric .stzt~!~*. 1 998. Yukon Energ!, Corporation. Whitehorse. Yukon.
Anweiler. G.G. and D. A. B lood. 1 98 1 . I 980 r~ipror ~tlid trwtrrfi~ri.l n~or~irwirig dorrp Foorhil1.s pipelirw r o m in stlurhrnr Iirkorr. FouthilIr Pipelines (Y tikm ) Ltd.. Calgaq.. Al bertri.
Archer Cathro and Associates Ltd. 1989. Gre~~rrr Klirtitic I I I ~ I I L ' R I I itz\wror\. - Pltt~sc I. jd~iccr nrinirzg. Arclier. Cathro Sr Associates.
AXY S Environniental Consuiting and Inuksliuk Planning and Dewloprnrnt. 1996. lriirrtrl c.m*irorinrrrrrtrl ~.vdrr~itiorr jiw rlit, .-l/.st.k P L I ~ S proj~'cr. U Y S . Calgaq .
Ban ff-Bon. Valle> S tudy . 1 996. U~u~f-Boii ' 1 ;r/lC~: C I ( rlw cr.o~.sroti~~.s. Siirnmap rcport of tlic Banff-Bou Valley Trisk Force (R . Page. S. Ba'.lcy. J.D. Cook. J.E. Green. aiid J.R. Brmt Ritcliie). Prep. For the Honourablc Sheila Copps. Minister of Canadian tleritagr. Ottawa.
Beak Consultants Ltd. 1 977. .-1 prc.lirriint~p. imwtig~~tiorz r,fjjs/r rt'soin-cvs in .soltrhn~ liikoit Territory I Y -6. Footliills Pipelines (Yukon) Ltd.. Calgr??. Albertri.
Beak Consultants Ltd. 1977. .A swrrrier irivrrrrvq ofthe fishrr~. rrsolrrce trh17g (lie proposed ..lhska Highrcq? piprliur in hrkorr Prrirog: 19': Foothills Pipelines (Yukon) Ltd.. Calgap.. Alberta.
Beak Consultants Ltd. 1977. .1 s r r w qf fi-rll sptniaingjish species irt wtcr.boc/ies ivithiri the infllrencr of rlte pruposrr/.4lusku Highitq- piplirie, 1 9 Y Footli ills Pipel inrs ( Yukon) Ltd.. Calgary. Alberta.
Beak Consultants L td. 1 977. CVinter fish inwsrigciticrrts o/se/ec.rd w u w coursrs in Yzikon Territory 19-7. Foothills Pipelines (Yukon) Ltd.. Calgas. Alberta.

Beak Consultants Ltd. 1978. .-f siitrisiqv oj:fishsltr~r itri1rsriguriot1s in wurerhu&s irirlrin rhe inflrrence of the proposer/ .-lfcrîkii H igh i iq Piprlitir if1 lickuti Tcrriroq*. I Y-6- 1 Y--. Volume 1. Report prepared for Foothill Pipelines Ltd.. Calgary. Alberta.
Beanlands. G. E. and P.N. Duinker. 1983. .-Ir1 ecologic.t~lfim~c.it~ork f i11' c.trvirotlnrrtird itty~trcr ~issesstnènr i t ~ C t ~ t l d u . Institute for Resourcrs and Environmental Studies. Halitàs.
Bsckel. D.K.B. (ed). 1975. IBP ~. idoyictrf sires iu .szrCiwcric ~ ' ~ r t r t i h . Unii trrsit? o f Lethbridge Production Services. Letlibridse.
Blood and Associates. 1973. .%)il. \v,qrr~irion m t l rt,iidifi rrsorrrccls c.ffiiv poreurid rrmsporr~irio~r corridors iii KVP Parks Canada. Winnipeg.
Brown. D. W. 1996. Srnrregic l w d icse pltittirit~p solirce hook. Commission on Rssoiirce and Environment. British Columbia.
Bro\v n. R.F.. M.S. Elson. and LW'. Steigen berger. 1 976. C'titri/o,~~ie c~f'~iq~irl?jc rrJ.sowcc.s o f ' l h Lpper Yzrkotr R i i w hiiittige ~?l /r i rrhors~ tireu) Report P.4C.T-76-4. Fislieries and blnrine Service. Depanment of Environnicnt. Pncitic Rqioii.
Bruce, L. 1 999. Srtrrzrs u f ciunul~irii*e cflecr.s tissessni~tlr: i.ssi(c..s to hr trrltlrrswd. Ciln pli bl isliecl repon prepared for Canadian Environmental Assessrnent Agency. tl ull.
Buechner. M.. C. Schonewald-Cos. R. Sauvajot. and B.A. Wilcos. 1992. Cross-boundaq issiies for national parlis: what \i.orks "on the ground." Etriirotirrirnrd .Ikt~zqenieitr 1 6: 799-809.
Cairns. J . 1977. Quantification of biolosical intepi'. IN The itircgriy of \i*~irrr. b?. R.K. BaIIentine and L.J. Giiarraua (eds.). US Environmental Protection Agency. Office of %ter and Hazardous Materials. Washington. D.C. pp. 1 7 1 - 1 87 - cited in Wrstrri and Lrmons. 1995.
Canada. 1988. ,Varional Parks ,4cr. R.S.C.. N- 13. s 1.
Canadian Environmental Advisory Council (CEAC). 199 1 . .-f prorecrrd urrris vision for CmcrLi. CEAC. Ottawa.
Canadian Environmental Assessment Agency (CEAA). n.d. Cnnmlimt rnvirormlentd cwessntarr process: a cirizen S grride. CEAA. H u l l .

Canada Fisheries Service. 1972. Fishrries pprohierrrs trs.socieIrrd wirh ~ I I P PI-opo~ècf .-l islriliik Rii*t'r
poiver <frvelopriertt. Progress Repon. Nortliern Operations Brancli. Fisheriss Semice. department of the Environment. Vancouver.
Canadian Wi ldlife Service. 1979. .Cligrcrrorv hird i~wrstig~rtions trlo)rg the proposecl .-lltrskti Highwq gczs pipriirw roritr - hird use r>f\i~etltirich dririr~g rlw srortnrrr ~iridjiill O!' l ' I o - Iiiterim Report No.3.
Clark. R. 1994. Cumiilative effects assessrnent: a tool for sirstainabls developmttiit. It~tpcrc[ .Issessn~~~rrr. 13: 3 19-3 3 1 .
Coates. K.S. 199 1 . Brsr le$ LLS lricliertts. LlcG ill-Queen's L'niwrsit! Press, Montreril 82 K irisston.
Coates. K.S. Xr W.R. Morrison. 1 988. L~riicf i!f'riw t)tithzi.ght .um: C I Iti.sro~. 01. tltc lirkoit . €-lurt ig Publishers Ltd.. Edmonton Alberta.
Cody. W . 1. 1996. Florcr of rliè Yukon T~~rrirori.. National Rssearcli Council of Canada. Otta~ba.
Comniission on Resourcc and E n t ironment (CORE). 1994. Pimnitlg, f i ~ r .srt.srtritrcIhi/i~*. l i~lunrr 2 of the Prorirrcicrl L m < ! C:SCJ Simrqp*. British Cof~imbia.
Commission on Resoiircc and Environment (CORE 1. I WZ. Rcpot-r or1 LI I t l d MC' sirtit~',q.fi)r British Coiitrrihici. British Calirrn biri.
Cornmittee on the Status of Endangercd M1ildlife in Canada (COSEWIC). 1999
~wv.cosewic .~c .ca. accessed 0 1 / 1 8/00. Iast updated 12! 1 7/99.
Cooper. C.F. and P.H. Zedlrr. 1980. Ecological asscssmrnt for rcpionril development. .loirrmif (!( Ertvirorlntenral .lfcrr~cigc.nrrnr. 1 0: 28 5-296.
Cumulative Effects tlssessmciit Working Group (C EA WG). 1999. Prmvicrd L I ~ ~ ~ O N I I ~ S [O
cumidadvr rflecrs cissessnwrt: tzprczçtitionrr.s piride. Prepared b> AXYS Environmcntal Consulting Ltd. for the Canadian Envi ronmental ilssessmt.nt Agencq.. Hull. Quebec.
Dan by. R. K. 1 999. Rrpioriirl t rcolo~~* -the SI. Elicis trruzrnr~zin pcirks: rr .s~ntlle.si.~ with rrrc~ncrpet?ier~r rntpiicdons. blaster's Thesis. Dc part ment of Gcography and Environmental Studies. W i I frid Laurier Universi t).. Waterloo, ON.
Davies. K. 1993. Defining cumulative impact assessment. Ccaicrtlitrn Lhrer ?P.citclr. 6 : 7-8.
Dav ies. K. 1 99 1 . Toii*wc/s rcosystem-bersrd pIc~rr~lirg: (1 prrsprcriir on cirnrirlcirivr ee,tvironrnr.rtrd eflects. Royal Commission on the Future of the Toronto Watertiont. Toronto.
deGraff. N. 1993. Fish srack assessrnent of Brrrnrrr. Frcmcrs mi/ Kitrme Lc~kes. I9W. Yukon Territorial Govemment, Whitehorse.

deGraff, N. and C. McEiven. 1989. Fisheries r e s r m h - Grecrrrr. Klrrcnte Lmd L:rè Plm. Yukon Territorial Governnient. Whiteliorse
Dennington. M. 1985. Sonzc i»tporriinr migrci~ot?~ hird kihirrits iri t h ~ Ii/kun Territop Environment Canada, Whiteliorse.
Depanment of Indian Affairs and Nortliem Development (DI AND). 199s. .-I rriWr~w (,fit~ilcilifé thrrsliolc/.sji)r cidiressiug c.iit~iu/ciri\.e gfjrecrs in the I'rrkotz Tcrritot:i~: -4 ~ f i s ~ z ~ ~ s l o ~ l pqwr . Preprtred by AXY S Environmenta 1 Consulting for DI AND. Wliitchorse.
Department of Public Works Canada (DPH'C) and C S Departnieiit o f Transponar ion. 1977. Etivirc,nni~.nrd inipuct S I L ~ ~ L L I ~ ~ ~ ~ I ~ : S h ~ ~ k l t ~ i k Higlniq- i~~iprore~~zct~t - BC and Y LI kon. Canada. Vol. 1.
Department of Renewablr Resoiirces (DRR). 1994. Iirkott .-l,yrcrric~rlttri.e Stcire ofrhe i~i~/ir.sri?*: 1992- /9Y1 Apricultiirr Brançh. Depanment of Rene\vable Resoiirces. Wliitehorse.
Depanment of Renewable Resoiirces ( DRR). 1990. Greatu Klrrme Lmd LZL' Plm - rcsidc~zr recreatiottul ML' s i r ~ ~ q * . Yukon Territorial Governmrnt. Whiteliorse. Y dion
Departmcnt of Renewable Resources (DRR). 1989a. Grwrer Wirme Lcud Lkr Plicri - ii-ildifé hackgrota~ri reyot-r. Yukon Tcrritorial Government. W hiteliorsc. Y irkon
Department of Renewnble Rcsources (DRR). 19S9b. Greuter Kliutw Lmd Li-r Plm - recrecitioti srctnr report. Y dion Territorial Government. Wliiteliorsè. Yukon
Dias. O. and B. Chinec,. 1994. Addressing cumi~lativr effects assessrnent in .Alberta: the role of integrcited resoiirce planning. IN C'rmiit1~irii.e qrJfecr.s ~t.s.ses.s~tic.~tr iit ~ii)teii/<i:~i.~tti cotic.~.pr to prctctice by Kennedy. X.J (cd). Alberta Assuciat ion of Prokssional B iulogists. Calgaq .
Dickert. T.G. and A.E. Tuttle. 1983. Ciimiilati~e impact assessment in environmental planning: a coastal watershed esample. Em~iro~tnrrtitd I~tipicr ..ls.sllvwtr~ir R~~i*icw. ?37-6-1.
Diil. S.. S. Jackson. and P.A. Wright. 1997. Klii~ote it~ilc/errzes.s stir<fi-. Centre for Toiirism Policy and Research. Simon Fraser University. Burnaby. B.C.
Dome Petroleum Ltd.. Esso Resources Canada. and Gulf Canada. 1982. Hwlroccrrhon r/eïe/upmrnr in rlir Beazrjorr Seo-A/ackenzie Deltti Region - rtwirut~rnri~td i r ~ i p m sr~Jtetnrttt. Io!. 3.4 - Beaufon- Delta Setting. Calgary.
Douglas. G.W.. G.W. ATUS, H.L. Dickson. and D.F.Brunton. 198 1. T h +cire i~uscirlrirpf~o~~s of the Yukon. National Museurns of Canada and National bluseum of Natural Sciences. Ottmva.
Drouin. C. and P. LeBIanc. 1994. The Canadian environmental assessment act and cumulative environmental effects. IN Crirn~rkrrivr effecfi assessment in Ccrnndci:fi.onr concept ro pnrcticci by Kennedy. A.J (ed). Alberta Association of Prokssional Biologists. Ca lga l .

Duinker. P.N. 1994. Cumulative effects nssessment: what's the big deal? iN C'ltnrul~rrii.~. <~&JCIS
ossessmrnr iti Ctrriuda: fiont c~~r~cepr tu prcrctic~ by Kennedy. .4.J (ed). A lbrna .Association of Professional Biologists. Calgary.
E K P A , 1982. E u s r h'lrcutw Pl~rnrrirtg .-f LI. Prepared b~ Reid. Grandier and Prirtners. Yukon Territorial Government. Whitehorse.
Eccles. R.. J. Greeii. R. blorrison. and A. Kennedy. 1994. Approaches to cumulaticr effects assessment of petroleiim development in Albena. IN C'irii~trl~iriie efleifecrs ri.ssr.s.snietrr irr CV~ii~rtrlrr. fronz cowepr to prucrice. Kennedy. A.J (rd). tllbena Association of Professional Biologists. Calgary.
Environmerit CanaduPrtrks Service. 1992. Toiiunls s~rsrtrirrcihl~~ c.c*o.sj:vter)r.v.- L I C ; I I I L I ~ ~ C I ~ PL~J-k.s Servicr s t r m ~ q ro c.hittce ~~cologico/ i,rre,crir>.. Final report of [lit. ecosystcm nianüpemcn t task force. Canadian Parks Service - Western rqioii.
Environmrnt Canada. Parks. 1987. Htrcirrc .\iitruirrrl Plvk r.~~.soru.cc d~wripriort t r d cintr(i..sr.s. Nrtturrtl Resource Consen rition Sectioti. Environment Canada. Parks. Prairie and . I o n h m Region. Winnipeg. 2 vols.
Environmentai Assessment Panel. 1 996. .VI17 cli~rnto~tds pr(.)J'c>cr report ~f t l ic . ~.m~irow?iruttrl trssrssrrrrttr piitirl. Canadian Environniental Assessmcnt A y q . Hull.
Federal Environmental Assessment Revieu- O ftice ( FEARO). 1 988. Pltairiittg tuid inrp/eme~rtiirg pirblic itrvoii-e~rtc.nr progrcrrrls. Pras is. Calgary.
Fenge. T. 1957. Land use planning in Canada's North: a ~vind of clianse or a b a ~ of wind? IN Hiittrrlund or hon trhd? Lund zrse plmnitrg in riorrlrerir Cw~iritrc/ci. by T. Fcnge and W.E. Rers (eds.). CARC. Ottawa.
Fisheries and Environment Canada. EA Panel. 1 978. Shcikrrclk Highirwy Prujrçr - LI ~.onrpc.irdirmi of-wriften sitb»tissiom to the c.rlvironn~rrrrol ~rssessme~rt ptniel. Whitehorse.
Foothills Pipelines (Yukon) Ltd. 198 1 . Catalogue of tisheries resource information for waterbodies crossed by the Alaska Highway @as pipeline route in Southern Yiikon. Foothills Pipelines (Yukon) Ltd. Calgary.
Foothills Pipe1 inrs (South Yukon) Ltd. 1979. Errvironnreiltcrl Inrpuct Srurenrrnrfi>r rlic Alnskcr Higlnvay gas pipeline projecr. CalgarylWhitehone

REFERENCES 236
Foothill Pipeline (FPL). 1978. Srrntttier-$dl tricmlntc~l sm/ies. 199: 7- -4krsku Hicyliitwj* Pipel i t~ Rmrre. Prepared by Beak Consultants Ltd. Calgary.
Footh il1 Pipelines (FPL). 1 977. -4 stu7.q ($fi111 sptniwi~rg f islr sprciës in wtrrrrhodirs ii~iihin rltr irtjltrrticr cfrhe proposed .-IIti.sk~~ tiig/tii.q pipelitte in Ylrkott T~rritory. / y--. Pre pared b> Beak Consultants Ltd. Calgary.
Franklin, J.F. 1 997. Ecosystem management: and oven,ie~\. 1N Eco.s~:srt.nr nrtr)tt~grtmttr: trpplicuriotts for .sir.sftrirtclbkefirr.s~ trmi wi/dlifë res~rrrcc~~. b>, ?A .S. Bo'w and .A. Hane- ( eds. ). Yale University Press. New Haven and Lotidon.
Freedrnan. B.. C. Staicer and S. Woodley. 1995. Ecolo@ monitoring and reserircli in greater ecological reserves: a conceptual framework. IN Ec-o.s~*.s~rtri mrlniroriug ~ r ) ~ ~ I p r o i c c ~ d Crretis. 13' T.B. Werman, S. Bondrup-Nielsen. J.H .M. W illison. and N.U'.P. Muunro (eds. ). Science and Management of Protected Areris Association. Wolf\ ille. Nova Scotia.
Gauthier. DA.. W.K. Brown and J.B. Theberge. 1985. blwement and befiaciour of tlie BuniasIi caribou Iierd relative to the proposed Alaska Highnay Gas Pipeline. IN Cm-ihorr ~ r r d ltrrnicirt t rc t iv i~ . by A.M. blrirtell and D.E. Russell (ed). Proceedings o f the First Nortli American Caribou Workshop. Canadian Wildlife Senice Special Publication. Ottawa.
Gauthier. D. and J.B. Theberge. 1983. h;olf predation in the Biinush caribou Iierd. south~vest Yukon, Canada. Rtmgfrr 1 : 1 3 7 - 1 44.
Glasson. J. 1974. -417 introtizrcriot~ ro rrgiond p l t i t t ~ ~ ~ t ~ , ~ : L W I I C L ~ I S . ~/ieo-. t~ trdprirc~k~' . Hutcliinson Educational. London.
Gotthardt. R.M. 1989. Srrninicr~. uj'hi.sroric ritdprehisturic rrsorrrces i,t tlrr Kltrrrnr Pltirirtirrg Region. Yukon Territorial Govemment. Wtiitehorse.
Grumbine. R.E. 1993. What is ecosystem management'? Corrsrrwriorr Btolos.. 8: 27-28.
Hancoc k. M.J. and D. E. Marshall. 1 983. C L I I ~ O ~ I W o f . s d t m ~ ~ S ~ ~ ~ J L I I ~ I S m d sptntwit~g rsccrpenrrnrs of srrb-tlisrricts 120 tirrtl/30 Msrk-Slikinr- Ttiku it.~rrrrsltrdsi. Canadian Data Report of Fislieries and Aquatic Sciences No. 456. Enliancsment Services Branch. Depanment of Fisheries and Ocerins. Vancouver.
Hans-Bastedo. B. 1986. .-lishihik Ltikc resozrrce srrrvw. crrl~zrrd crspecrs. President's Cornmittee on Northern Studies. Waterloo.
Hayes. R. and A. Bayer. 1986. CVolfpop~rkrrion rmrcrrch attd nimwgrrnenr sttdirs in rhr Yukon Terri f o l - 198-/ .-îrinwZ Progress Reporf. Parr I : Sorrthvesr Yukon. Fis h and W ildl i fe Branch. Whitehorse.

Hegmann. G.L. 1 995. Iniplènieniiug ciirutrl~rrii~e ~~1ficr.s ~r.sse.s'ss~~ietir. blnsters o f Env ironmriital Design (Environmental Science) tlissis. University of Calgrin. Calpry.
Henderson. L. 1 987. The porenritrl f ür rrori cwnszrnrprive wiid# ~ri~alrigc'riie)rt iu rlw kirkon. hl isc report MR-87- I . Fish and Wildlife Branch. DRR. Wliiteliorse.
Henry. J.D.. S. McCarthy. and M. Raillard. 1995. The mandate for inregrit'.: ecologicril monitoring in the prairie and northern national parks of Canada. IN Eco.si:srrm niouiruri~ry nid proiecrètl uretu. by T.B. Herman. S. Bondriip-N ielsen. J.H.M. W illison. and il. W .P. 1.1 uiinro (eds.). Science and Management of Protccted Areas ,-\ssociation. Wolfville. Nova Scotia.
Hirsch. A. 1988. Regulatory contest for cumulat itle impact resenrcli. Em*irorinrcrird .Ikrncrgrnièrzr. 1 3: 7 1 5-773.
Hodge. G . 1 99 8. Pl~rnrr ing C'imtdiiai coninnrnir ics: toi inrrot/ucriort ro rlw prirr~~ipi~s. prtrciicc. mtlp~rrriciptrrrrs. Tliird d i t ion. 1TP Nelson. Toronto.
Hoet'ç. M. 1980. Homs and Iiooves. IN A'llr~nic. Pimtrc./e of'rlw lirkori. b) J .B . Ttit.bc.rgt. (cd. ).. Doiibledn! Canada Ltd.. Toronto.
Humphreys. N. and L. Safranyik. 1993. Spruce beetle. Forc..sr p . s r k.ir/lc.r - 13. Forestry Canacfa. Victoria.
IUCN's Commission on National Parlis and Protected Areas. 1979. T h hiosp/rerc. rP.sww tmi its relurionship ro orlier prorecrcd m w s . I U C N . Gt.ne\.a.
Jingfors. K. 1990. .î'ont~> iniporrmt wildlifi. MSL. trrerrs iii rlw ~ ' h t t i p ~ g ~ i e . .?ivlriliik hmtl rrcrdirioncrl rrrrirory. C hampagne-Aishilii k FirstNat ion.
Joe. L. 1 990. F i s h i e s rrsewch. Grecrrer K~I ICI IW L ~ m l CSe Piirn. Cl~an~p;lgne-Aish il1 ik Indian Band. Yukon.
Ka1 ff. S.A. 1995. A pruposed fr~rntrwork ru clssess cunzrr1~riir.e environnienroi cffccrs in C'crrrirditrr~ iVdunal Pclrks. Parks Canada Technical Repon in Ecosystem Science i! 1 .
Karr. J.R. and D.R. Dudley. 1981. Ecological perspective on \vater quality goals. Ewironnzri~rcri :Chrtiagemerit 5 : 55-68.

REFERENCES 238
Kay. J.J. and €.Schneider. 1995. Embracing complesity: the challenge of the ecosystem approac h. IN Perspecrives on Ecolopicrif Integrin.. by Westra. L. and J. Lrrnons (rds.). K l u u er Academic Publishers, The Netherlands.
Ke ith. T. L. 1 996. The cwrtrlotiw efjcecrs uj'del~elopnicrrt m d l m d itse tir Pritrce Ethi7cird Isltosl Ycrtiond Pork. Minister of Ptrblic Works and Governrnent Services. Hull.
Kennett. S.A. 1999. Tuiiwd.. u neitt prrdieitr fbr ort~iirlritii~ rtjécrs t~aitniger~ictrr. CI R L Occûsional Paper $ 8. Canadian l nstitute of Resourcrs Law. Calpar>.
Krebs. C.J .. S. Bout in. and R. Boonstra (eds.). In press. I2rrehr~irr ~wninizurlfi. ~ & * I I L I I I I I C S ;II 1111~
Kfrimtc. borecilfi~rc..sr. Oxford University Press. NL'N York.
Krebs. C .J. and 1. W ingate. 1 971. S i t n q , ~$.s»i~ill ~~r~rnrnrds. Wiitnie .\;iriortd Prit-k. Cnnad inn Wildlife Service. Edmonton
Kuhn. R.G. and F. Duerdsn. 1996. Northcrn land iise planning aiid the Klunne Land Usc Plan. Tite .Vorrh~rrr Reriru* 1 51 16: 64-76.
Lancaster Soiind Rrgional Land Use Planning Coniniission ( LSPC). 199 1 . Tire Lrarc~nrer Soirml rgiottuf l m d tcse pimz. Department o f lndian A ffairs and Nonhern Developmrnt. Otraw and Depanment of Renewûblc Resourcrs. Yellowknife.
Landres. P.B.. R.L. Kniglit. S.T.A. Pickett. and M.L. Cndriiasso. 199th. Ecologiçal effeçts c ~ f ndm inistrativc boundaries. IN Sre\rwtbhip ric~o.ss horoxiwies. b?. R.L Kiiiglit and P.B. Lnndres (eds.). Island Press. Covelo. CA.
Landres. P.B.. S. klarsh. L. blerigliano. D. Ritter. and A. Norman. I998b. Boundap rfkcts on wilderness and othrr naturril areas. In Sreiiwclliip cicross hozo~tkrries. by R.L Kniglit and P.B. Landres (eds.). Island Press. Covclo. CA.
Larsen. G.D. 198 1 . Srnttrs of the Rtrb~q Ronge nroimr~iin cririhorr iierd. Technical report TR-8 1-3. Fish and Wildlife Branch, DRR. Whitehorse.
Lawrence. I D. 1994. Cumulative effects assessnient at the project Icvel: a conceptual fcimework for two hazardous waste facilities in Ontario. IN Cirmzrlariw L.ffrcr.s u.s.s~~rsi>it.ti< itz Cii~ititiii: froni concept to pracricr. by Kennedy. A.J (ed). Alberta Association of Prolèssional Biologists. Calgary.
LeBarge. W.P. 1996. Placer deposits of the Yukon: overview and potential for new discoveries. IN Yukon Quofernury Geology, FoZtrme 1. by W.P. LeBarge (ed.). Esploration and GeologicaI Services Division. Northem Affairs Program Yukon Reg ion.

LGL Lim ited, ES L Environmental Sciences Ltd.. ESSA Ltd. 1 985. Becrl~jbrt Eriviro~~nimr~ri Moniroririg Projwt 1983-R4jirrul report. Indian and Nortlicrn Affairs Canada. Ottn~ta.
Machlis. G.E. and D.L. Tichnell. 1987. Economic development and threats to national parks: a prelirninary analysis. Environrtlrriral C ' u ~ ~ ~ e n ' t ~ r i ~ r ~ . 14: 15 1 - 1 36.
Mackenzie Delta-Beaufort Sea Regional Land Use Planning Commission (MBPC). 199 1 . -4 conini~rnip-bmcd regionul /mit/ use p/crri#br [lie . C [ L I C X ' ~ I I Z ~ L ' DL'/ICI-BC'LIZ@I .\;'LI 1-~giori: tr
regiond l m d rrse pltrn. Department ( ~ f Indian Affairs and Northern Devslopment. Ottau a and Department of Rene\tcible Resources. Yslloivkiiife,
Maliar. R.D. 1994. Tonards the identit7catioii of enc ircinnic~itall>. sensitikre arens for ccologiçnl monitoring: a case stiidy in the Sackville River ivatershed. No\.ri Scotiri. IN Eco.sj~.src.rrr .tlotiitoring md Prurecrd .-lretr.s b j T.B. Herman. S. Bondrup-N islscn. J.H. Wi l lisoii. and N.W.P. Munro (eds.). Science and Managenient of Protected Areas Association, CVoIhille.
Mnryles. C. and M.B. Lislier. I O8 1 . Criteriri iiscd in risstxing \r ildlik corism~ntion potcntinl: n revieiv. Biologictrl C'ortservtriior~. 2 1 : 79- 109.
Meffe. G. K. and C.R. Carroll. 1 994. Prirrciplp.s r!f'c.o~r.s~.ri.trrio~t biolo~?.. Sinriiier Associates. bl A.
bl il ler. D. B. 1 98 1 . 9rurc.gic fmrd trsr plmutinp rri die Ortrtrrio .\lirtisrp. o,f.L;rrrrrtr/ Rrsowcrs: ci
conipcrrison of disrricr plirriiti~~g cipprotrclir.~ iti pzrhlic ~rrrcl prii~ire itaitl .sirlr~rriotr.s. Sc hool o f Urban and Regional Planning. University of Waterloo. Waterloo.
ivlitchell. B. 1 997. Rrsourcc. ttnd nri.ironmcr~ttII mrncrgertienr. Addison Weslq, Longman Limited, England.
Mossop. D.H. 1976. Stirrlirs ofwcrrcirfvwl srt~ging crrms. lnterim reprort. Fish and Wildlife Branch. DRR. Whitehorse.
ibtossop. D. and M. Dennington. 1984, Siwu h~rbirtrr in soirrliern Iirkun. Canadian W ildli te Service. Whitehorse.
btott. W.P. 1988. Looking beyond National Park boundaries. .VtrrtiraI .-lueas Journd. 8: 80-82.
Munn. R.E. 1988. The design of integrated monitoring systems to provide early indications of environmental/ecological changes. Environntrnral iIïtl~t~~gerncint und .4ssc.ssntc.nr 1 1 203-2 1 7.
National Parks Act. 1930. c. 33. S. 1

Natural Resources Conservation. 199 1 . Environmental screening o f KNPR i 990 park management plan review. Eni..ironnirirr~zl.4ssc..ssnrtlnr Rrporr Y 1-1.
Nonhern Design Consultnnts (NDC). 1993. .î Itisro-* of'loggi~ip iit the Iirkon: I W 6 - 19-O. lid I CG IIA. NDC. Whitehorse.
Nelson. J.G. 1993. Beyond parks and protected areas: frorri public lands and pri\*atcr stenardstiip to landscape planing and management. IN Pwks ccnd Prt)rc.cred .-irem iiz C*~imc~ki: pi~i~ttiitrg mcl ntonngeriiwl. by P. Dearden and R. Rolliiis (eds.). Lrni~persity Press. Toronto.
Nelson. J.G. 1979. C.LIIILIL~LI +-Y tt~ildl~itle/.s. uni^ ersit? o f LVaterloo Scliool of Crban and Regional Planning Wurking Ptipcrr No. 4. Waterloo.
Nelson. J.G. and Sportza. L.M. (sds.). 1999. Regional approacliss to parks and protected arcas in North ilmericri. Environrnenrs, 27: Special Issue 23.
NonhiSouth Consiiltants. 1998. .-Iishihik rclicc.rwiitg prnjccr cnr.iro~;rric.itrrii irripticr ~issvxsnwrir: wlz~mr 6. tiqirciric srzrclirs. Yukon Energ Corporation. b'liiteliorsr.
Northem Naturd Resource Service. 1977. C'ollecrioir of:fkIt~ric..s infi,rniurion fi-ont rivirerhodies dong rhe propowd .-lltzsk~t Niphwc- pipe'littc. rorrrc. ro .Jtrnlrcrr~. / j. I V - - . Fisherics and bI aririe Sewice. Department of Fislierics and Oceans. Vancouver.
Paish and Associates. 198 1 . The Htkoir .sporr]islreq~ - .-f pti1k.r. oririrretl ii.s.sr..s.v»lc.~tt o)fsporr fishing in I'irkoti. Canadian Department o f Fislieries and Occans. DIAND. and Yukon DRR. Whitehorse.
Panel on the Ecological Integrity of Canada's NatioiiaI Parks (PEICNP). (999. http://~%~~v.ecoIog.org/rnain e.htm. Last updated Nov. 7. 1999.
Parker. S. and C. Cocklin. 1993. The use of geographic information systems for cumiilative environmental effects assessrnent. Co~irpzrter.~. Er~riro~mertr cirtd Li.hort S~.vrettu. 17393-407.
Parks Canada. 1995) - Parks Canada Internet Site. Avaiiable online at
Parks Canada. 1998. 1997 Statr t f the porks repart. Parks Canada. Hull.
Parks Canada. 1997. Nationai parks spien1 p h . 3"' ditirion. Canadian Heritage. Ottawa.
Parks Canada. 1994. Gzrichg principles and operc~tional policies: :Vntionul Park Poliq. Canadian Heritage.

Parks Canada. 1 984. Cumxiiatr Nerittige Rivrrs Svsren~. Parks Canada. Hull.
Payne. R.J.. and R. Graham. 1993. Visitor planning and management in pürks aiid protected areas. IN Pwks mclprorecred iirérn iri C'trridci: pltmt~irrg trnd niturligernerrt. bq P. Dtiarden and R. Rollins (eds.). Oxford University Press. Toronto.
Pcake. R. W. and P.H.Weal ker. 1975. tirko~r ~ip-icrrlrrrre: t r poli-, proposcri. R. IV. Peak and Associates Ltd, Lethbridge.
Peepre Sr Associates. 1993. Ttrtslirn.sliirii R i ~ v r ~Slitr \ t . .slrc. C'liC). Iiikon Tcrrirori*, Hrrir~ige f2iwr.s $c:vrerrr hockgrowdstm!\*. Prepared for Yukon Territorial Governrnent. Cham p a g e Aishihik First Nation. Canadian Parks Service. and DI AND.
Penrose. R.W.. J.C. Day. and M. Roseland. 1998. Shared Decision-ninking in public land planning: an evaluat ion of tlic Cariboo-Chi lcotin CORE Process. Errriromic.>trs. 25 :27-17.
Peterson. E.B.. Y.-If. Chan. N.M. Peterson. G A . Constable, R.B. Criton. C.S. Davis. R.R. Wallace. and G A . Yarranton. 1987. C'ltnitriurii*e c'&fi L~.~.SP.SSII~C'IIC in C'trmi~l~: mi cigetithr filr ticriori ~rrrcl re.s~tirci~. Minister o f Supply and Services Canada. Ottawa.
Primack. R. B. 1998. Es.sc.riri~i1.s ~fcor~.seri.t~riorr hiolo,q*. 2"" cdition. Sinauer Asscicintt.~. .LIA.
Province of British Columbia. 1 993. ..1 prorc.c*rrd trrus .srrcirc.,q+ f & Bririsii C'o/irnibici. Brit isli Coliim bia.
Ramsay. DA. 1996. .-l Icit~cLscrrpr ripprotich J i ~ r nir<i.sriritig mcl nro~riroritrg r h ci~nzrrltrtii~ e]fict.s of tmd iisr change f br rhe .Vitigam Escerrpnrrirr P h trrrci. MA Thesis. Uriiversity of Waterloo. Waterloo.
Reid. Crowther and Panners (RCP). 1982. Etisr h'lircnrr. Pltitirrirrg .-Ireri. Yukon Territorial Government. Whitehorse.
Read and Associates. I 990. Lcmtl resozrrce concrrns prrrtiirri~rg ro rcur~onlic ti~wlopnrwr. Greater Huane Land LSt! PILUI. Champagne-Aishiliik Cndian Band. Yukon.
Richardson. N. 1989. L m c i lise pimnirlp ami srrsraincrblr clevelopnrerrt in Crrndci. C EAC. Ottawa.
Sauchyn. D. 1986- rlishihik Lake tesoirce szinry - (ibioric ~ i spem. Yukon Environmentally Significant Areas Series. No. 2. President's Cornmittee on Northem Studies. University of Waterloo, Waterloo.

Schelhas. J. 199 1 . A methodoiogy for assessrnent of esternal issues facing natioi~al parks. i\.ith an application in Costa Rica. Etivirotinrentui Coriswsrrtion, 18: 23-530.
Schmidt. K. 1 996. Enthgrred rl~retirened ~rml spwid SILI I I IS f ishes (!j'.Li)rrh . - I I ~ Z P ~ - ~ C ' I I . 4'" Eclition. North American Native Fislies Association.
Schmidt Environmental Consulting and DNA enterprises. 19%. Wiid i~r srirtiks. Cid. 3 cg' .-lislrihik rtllic-rrisitz.~ proilict ~'tn?irottnrc'rird i~lptcr t t s . s~~s t~ t~ t~r . Yukon Energ Corporation.
Searle. R. 2000. Phcwtottr p~rrks. Key Porter. Toroiito.
Skibicki. A., A. Stadel, D. Welch. and J.G. Nelson (cids.). 1994. Ecok~giccri niotliroritrp crrrcl .Vcrriontrl Prrrh. Proceedings o f Park Canada National Workshop. Heritqe Resources Centre. University of Waterloo.
Slocom be. D.S. 1993. lmplement ing ecos>.stern-bascd management: developnient of theor'. practice. and research for planning and managing n region. BioSc.imct. 43: 6 17-67 1 .
Slougli. B.G. and H. Jessup. 1 984. Frrrhettrer i t lrvnro~. hrhircir ~rs.se.s.snirtir crr r t i [rtrpper rrriiizarion ofthe firkon Rirw htrsin. Technical Report TR-84-6. Fisli and Wildlife Brnnch. DRR, Wliitehorse.
Slougli B.G. and M .M. Sm its. t 985. ltrkoti nrtrrr~~tr tt~~rtr~rgrnic.nr - Progw.ss IO ..l~rgrr.sr. 1985 Progress report PR-85-6. Fish and Wildlik Brrinch. DRR, Whiteliorse.
Slough. B.G and R.M.P. Ward. 1987. Ftrrhrtrrrr mmrtr,grmrnr progrmi. 1986-8- crrltrrtcrl progress report. Fish and W ildl i fe Brandi. DRR. Wliiteliorse.
S l y. P.G. 1994. Hzrnian inrprcts or1 ~ l i r Hzrd.sotr B L ~ . biorrpiot~. its prcrsettr s r w tind f irrttrc. c.nvironnirntcrlc~oncert~.~. Canadian Arctic Resources Comm ittee and tlie kt unici pal ity of Sanikil uaq.
Smit. B. and H. Spnl ing. 1 995. Methods for cumulative et'fects assessment. Et~siroritrr~rrrcrl I/,tpcici .4ssess»rënr Revieiv. 1 5:s 1 - 106.
Smith. P.G.R. and J.B. Theberge. 1986. A review of criteria for evaluating naturnl areas. Environrrrerrrcd .\.~i-onqerrwnr. 1 0: 7 1 5-73 4.
Sonntag N.C., R.R. Everitt. L.P. Rattie. D.L. Colnett. C.P. Wolf. J.C. Truett. A.H.J. Dorcey. and C.S. Ho1 1 ing. 1 987. Cumirhrivr l i f l ec~~ nssrssmenr: u conrexr f ürfrrrrher resetrrcli mtldewloprrienr. Minister o f Supply and Services Canada. Ottawa.
Soule, M.E. 1985. What is conservation biology? BioScience. 35: 727-734.

Spaling. H. 1994. Cumulative effects assessment: concepts and principles. Imp~rcr ..lsses.smozr, II: 23 1-25 1.
Spaling. H. and B. Srnit. 1994. Classificatioii and evaluation of rnrttiods h r CEA. IN Czisrzi1~rrir.e effecrs trssrssrnertr itl Cumrtkirfrun~ coilwpr ro pr~icrice. Kenned? . A.J (ed). -4 l brna :\ssocia<ion of Professional Biolo~ists. Calgay
Spaling. H. and B. Smit. 1993. Cumulative en\,ironmsntal cliange: çonçeptiial frameivorks. evaluation approaches. and institutional perspectives. Et~i'iroun~cntiil .\hrmrgt'tner~r. 17: 587-600.
Strategic Land Use Planning Prograin (SLUPP). 1980. Proposrd snwrc.pic Imd rrsc pim. :Vorthc.~arrrir Otitcrrio. Ontario Ministq of Naturai Rèsources, Ontario.
Sy nergy . 1974. Wliutle Rqioit Srir~ii.. Synrrg . W hitéliorsr.
Thebergc. J.B. 1993. Ecology. conservation and protectsd areas in Canada. IN Pr1rk.s rrmi prorecred uretrs in C~inc«hr: pltitinirrg i e d nrmrrgcwirttt. B> P. Deardcn and R. Rollins (cds. ). Ostord University Press. Toronto.
Theberge. J .B. I989. Guidel ines to draiving scologicall> sound baindaries for rintioiial parks and nature resenes. Em+roirrrleilroI .Ilm~iprrrwttr. 1 3 : 695-7'02.
Theberge. J .B. 1 978. Kluane National Park. IN .li)riiieni Trmsiriot~s. I'oiirrii~) I. b) E . B. Petrrson and J.B. Wright (eds.1. Canadian Xrctic Resotrrces Cornmittee. Ottajva.
Theberge. J.B. J.G. Nelson and T. F e n s (sds.) 1 980. Etii*ironr~~etrtirl!~.l rigri ~jicuttr ra-errs r,f*iiw Yzikun Terriru- Canadian Arctic Resources Committee. Ottawa.
Theberse. J.B. and S. Oosenbrug. 1 975. Iirko~r '.Y Llrrniusir Lplmrb: rlw iiecdfiw itrclu.siott iit KVP. Canadian Nature Federation. National and Provincial Parks Association of Canada. and Federation of Ontario Naturalists.
Tompliins. L. 1996. A description of wilderness tourism and outtitting in the Yukon. DIAND. Whitehorse.
Transnorthern Consulting. 1 993. ..ln i l tw t~ tap of resowcrs in rhë rrmfitioitd terrirop of the PVhire River F i m ivdion: ci bmis fur slrsrainablr tkveiopnrettt. Prepared for White River First Nation. Beaver Creek. Yukon.
U.S. Council on Environmentat Quality. l978.-FO CFR Parts 1 508.7 and 1508.8. 29 November 1978. Cited in Sonntag et al.. 1987.
Vlachos. E. 1982, Cumulative impact analysis. hpticr ..lssessnrerir Brdleriri. 1 :60-70.

REFERENCES 2 44
Waiker . C.E. and R.F. Brown. 1974. Slreml srrrdirs in rlw .-lishilzik .s>:vrenl \i,irh r.rfC;rencr 10
hyrlroelrcrric dewlopmrnr. Environment Canada. Fisheries and Marine Sen ice.
Ward. R.M.P. and D.G. Larsen. 1995. Surnmirry of- 1992 nloosr szrrv9.s iti rhr .-l ishihik, Ih~ioji Crrrk. Big Sd~tron. .Lfq.o. cwd Dmv.sot~ cirrus. PR-95-02. Fish and Wildlitè Branch. DRR. Whiteliorse.
Westra. L. and J. Lemons (eds.). 1995. P~rspr~ri\!é.s ( N I e~uIogic~11 i)zrrgrir~.. Klii~\er Acrideniic Publishers. The Netherlands.
Westra. L. 1995. Ecosystem integrit) and sustainabilir': the foundarional value of the irild. IN Persprcriws on rcolugicrri irtregrig-. b) Westra. L. and J. Lemuns ( rds. ). 1 995. Kluaer Academ ic Publishers. The Netherlands.
White. M. and K.P. Bisset. 1993. Itrkurl firrrri .wnq-. l !NI. Yukon .4griciilturnl .-\ssociation rind Yukon Rmew able Resources .c\griciiltiire Brnncli. \Vliiteli«rst..
Woodley. S .J.. cd. 1994. .\lo)~irorb~g for eco.s!:srrm rrrrcgrin iu ~ l m d i i r ) t mrioricrl pcrrks Heritage Resources Centre. Working Pnper 6. Universit) of Il ntcirloo. Waterloo.
Woodley. S.J. 1993. .-l.sses.sitig mi</ woviroruy ~.colopictr/ i i r r y r i ~ . i)r prrks m d p r o ~ e ~ ~ e d crrrtis. PhD thesis. Department of Geography. U ni~wsit? of Waterloo. Waterloo.
Yukon Land Use Planning Council ( Y LUPC). 1990. Grwrc.r K1t1~1~t~ Ltml LSc. P h . Yukon Territorial Government, Wliiteliorse. Yukon.
Yukon Territorial Government (YTG). 1999a. Rc.)~cwtrhlc. Rc.sowce.s durer ~.orrlpiled h!. geogrcrpiticd infirntcirion s?sreni.s. DRR. W h i tellorse. http:1/706.12.26.168/pu bs/rrgis/data/dat+sc/G MA-OC-RTC .II tm ldroadesc
Yukon Wild. n.d. RoLIcIs~CIL' piide 111 wi ld l~r ~ i m ~ i l ~ g . Yukon I V i Id. W hitehorse.

Brenneman. Ray. Park Warden. Kluane National Park and Rrsen.e. Haines Junction. Monda>. October 4. 1999.
Eklund. Mark. Council of Yukon First Nations. Whiteliorse. Wctdnesdny. Septeniber 29. 1999. Elliot. Tom. Parks Canada. Whitehorse. Wednesda).. Septernber 8. 1999.
Godin. Benoit. Environment Canada. Wliitetiorsc. blonds!.. Srpttzmber 27. I9W.
Harris. Yvonne. Yukon Territorial Govsrnrnent. Wliitehorst.. Frida?.. Octuber S. 1999.
Henry David. Park Ecologist, K 1999.
luane National Park and Rcsene. \Vedncsdn>. September 1.
Land?, Ann. Land Use Planner. Parks Canada, lVliiteliorse. Tuesda>. September 7. 1999.
bluellcr. Fritz. Department of lndian Affriirs and Nortliern Dewlopnient. Whitcliorsr. Thursda?. September 2. 1999.
Slocombe. Scott. bItiltiple cons~iltations tliroughuut surnmcr and faIl of 1999