The effects of dietary phytoestrogens on aromatase activity in human endometrial stromal cells
Upload
independentCategory
view
0download
0
NUTRITION AND CANCER, 49{2), 109-124Copyright © 2004, Lawrence Erlhaum Associates, Inc.
REPORTS
Plasma and Dietary Phytoestrogens and Risk ofPremalignant Lesions of the Cervix
Brenda Y. Hernandez, Katharine McDuffie, Adrian A. Franke, Jeffrey Killeen,and Marc T. Goodman
Abstract: A number of epidemiological studies have ob-served an inverse association between phytoestrogens andrisk of certain hormonally dependent cancers. We undertookan exploratory analysis of the relationship between specificphytoestrogens and premalignant cervical lesions. Acase-control study of 122 women with histologically con-firmed cervical squamous intraepithelial lesions (SILs) of thecervix and 183 cytologically normal controls was conductedfrom 1992 to 1996 in Honolulu, Hawaii. A cervical cell sam-ple was obtained for human papillomavirus (HPV) testing.Dietary information was collected using a structured survey,and a fasting blood sample was taken for measurement of fiveisofiavonoids (genistein, glycitein, daidzein, 0-desmethyl-angolensin, and equol), two flavonoids (hesperetin andnaringenin), and two lignans (enterodiol and enterolactone).Plasma levels of equol and enterodiol were positively associ-ated with cervical SIL risk: odds ratio, OR = 6.5: 95% confi-dence interval, Cl = 1.4-29.2: Pfor trend = 0.02 and OR =2.7: 95% Cl = 1.1-6.3: P for trend = 0.01, respectively, forthe highest relative to the lowest quartile level afier adjust-ment for age, race/ethnicity, HPV infection, cigarette smok-ing, alcohol drinking, and lifetime number of sexual part-ners. A nonsignificant positive association with cervical SILrisk was observed for plasma enterolactone. Consistent withthe relationships observed for the plasma lignans, dietarysources of lignans, including garlic and taro leaves/ongchoy/marunggay, were positively associated with cervicalSIL risk. A positive association was also suggested for otherlignan sources such as seaweed, onions, grapefruit, andseeds. This is the first study to observe a positive associationbetween specific phytoestrogens and premalignancies of thecervix. The results of this investigation should be consideredpreliminary and need to be verified in larger, prospectivestudies.
Introduction
Although the human papillomavirus (HPV) has beenidentified as the major cause of cervical cancer and its pre-cursor lesions (1,2), the role of cofactors involved in cervi-cal carcinogenesis has not been definitively established.Evidence of protective effects against cervical neoplasiaand cancer has been reported for specific micronutrients,including tocopherols (3,4), carotenoids (4,5), vitamin C(5), folate (6-8), and other B vitamins (8). Nevertheless,the role of diet in the development of cervical neoplasia re-mains ill defined.
Phytoestrogens are a general term for a diverse group ofnonsteroidal, dietary compounds of plant origin withstructures similar to estrogen. They possess varying de-grees of estrogenic and anti-estrogenic activity (9-11) aswell as other nonhormonal functions including antioxi-dant activity (12). Isofiavonoids, flavonoids, and lignansare three classes of phytoestrogens (13,14). The main di-etary sources of isofiavonoids are soybeans and soy-hasedfoods. Sources of flavonoids include several vegetables,fruits, berries, herhs, and tea. Lignans are found in a di-verse number of foods, including flaxseed, cereals, grains,seeds, nuts, certain fruits and vegetables as well as tea andcoffee (13,15).
There is some evidence that phytoestrogens protectagainst estrogen-dependent cancers, possibly throughanti-estrogenic mechanisms. Epidemiological studies havereported a decreased risk of breast cancer associated with uri-nary levels of the isoflavonoid equol and the lignanenterolactone as well as with total urinary levels ofisofiavonoids and lignans (16,17).
Although cervical cancer has not traditionally been recog-nized as a hormone-dependent malignancy, there is evidence
B. Y. Hernandez, K. MeDuffie, A. A. Franke, and M. T. Goodman are affiliated with the Cancer Research Center of Hawaii, University of Hawaii, Honolulu,Hawaii 96813. J. Killeen is affiliated with the Department of Pathology, Kapiolani Medical Center for Women and Children, Honolulu, Hawaii 96826.

from epidemiological and animal studies that the develop-ment of cervical neoplasia may also be influenced by estro-gen. Multiparity and long-term oral contraceptive use, condi-tions that both contribute to higher physiological estrogenlevels, are associated with an increased risk of cervical can-cer among HPV-positive women (18-20). Chronic exposureto estrogen is necessary for the development of cervicaldysplasia and cancer in HPV-infected transgenic mousemodels (21-23).
Testing the hypothesis that phytoestrogens may protectagainst cervical carcinogenesis, we undertook an exploratoryanalysis of the relationship between phytoestrogens—asmeasured through both dietary intake and plasma lev-els—and premalignant cervical lesions.
Materials and Methods
Study Subjects
This study was approved by the Committee on HumanSubjects of the University of Hawaii and local hospital inter-nal review boards. Written, informed consent was obtainedfrom all study subjects. Details of the study have been previ-ously reported (4).
Briefly, we conducted a case-control study on the islandof Oahu, Hawaii, among women receiving cervical cytologi-cal screening at one of three hospital-based clinics betweenJune 1992 and December 1996. Eligible subjects includedwomen 18 yr and over who were residents of Oahu and whohad an intact cervix. Women who had been pregnant or lac-tating within the prior 6 mo and those who had a history ofcervical abnormalities within the past 3 yr were ineligible toparticipate. Cases consisted of patients at one of the threeclinics who were diagnosed with histologically confirmedsquamous intraepithelial lesions (SILs) of the cervix. Con-trols consisted of patients at the same clinics who had nega-tive cytological smears.
Among 330 women with histologically confirmed SILs,214 were eligible and completed the interview. A total of 271of 318 women identified as cytologically normal were eligi-ble and completed the interview. Blood samples were ob-tained from 147 interviewed cases and 191 interviewed con-trols. A number of bloods could not be collected within therequired 1-3 days of the collection of cervical specimens dueto subjects' scheduling conflicts and/or failure of subjects tofast overnight. Of the 147 cases and 191 controls from whichblood was collected, a number of bloods were not processedwithin 1-2 h of collection and were subsequently excludedfrom laboratory analyses. A total of 122 cases and 183 con-trols had plasma prepared and stored under sufficient condi-tions for analyses of phytoestrogen levels. Therefore, the fi-nal study group represented 57% (122 of 214) and 68% (183of 271) of eligible interviewed cases and controls, respec-tively.
Collection of Cervical Smears andHPV Specimens
The collection of cervical cytology smears and HPV speci-mens from the 122 cases and 183 controls was performed at theclinic sites. Immediately following the Pap smear, exfoliatedcervical cell specimens for HPV testing were collected usingDacron swabs and placed in 1 ml of a commercial buffered so-lution (Digene Corp., Garthersburg, MD). Positive Pap smearswere subsequently confirmed by biopsy. All smears and biop-sies were read by study pathologists and classified accordingto the Bethesda classification system (24).
Dietary and Nondietary Interview
Cases (n = 122) and controls (n = 183) were interviewedin their homes by a trained interviewer. The structured di-etary survey, previously validated in our population (25),queried the frequency and quantity of consumption of over250 specific food items. The nutrient content of foods wasdetermined from a food composition database customizedfor the diverse diets of Hawaii's multiethnic population andcovering over 100 macro- and micronutrients. The referenceperiod for the dietary survey was the 12 mo prior to diagnosisfor cases and the 12 mo prior to study enrollment for con-trols. The structured, nondietary survey included sexual, re-productive, medical, cigarette smoking, and alcohol drinkinghistories. Standing height and weight were also taken at thetime of the interview to calculate the body mass index (BMI)(kg/m2).
Collection of Blood Specimens
Blood specimens were collected by an experienced phle-botomist during a separate visit to subjects' homes. Thirtymilliliters of blood was drawn from subjects after a minimum10-h overnight fast. Plasma was separated from the cells bycentrifugation within 1-2 h after being drawn and frozen at-80° prior to testing.
Plasma Phytoestrogen Analysis
Liquid chromatography photodiode array electrospraymass spectrometry (LC/PDATESI-MS) was used for deter-mining plasma levels of five isoflavonoids (genistein, glyci-tein, daidzein, and its two metabolites, o-desmethyl-angolensin [0-DMA] and equol), two flavonoids (hesperetinand naringenin), and two lignans (enterodiol andenterolactone). The methods have been previously detailed(26). Triethylamine buffer (pH 7) was added to 0.45 mlplasma followed by incubation with p-glucuronidase andarylsulfatase at 37°C. After addition of formononetin solu-tion (in methanol) as an internal standard, proteins were pre-cipitated by vortexing this mixture with acetonitrile. Hydro-lyzed analytes were then isolated by partitioning into diethylether several times. The combined organic phases were evap-
110 Nutrition and Cancer 2004

orated under a stream of dry nitrogen, redissolved byvortexing with methanol, and diluted with acetate buffer (pH5). Ten to 20 ^1 of this solution was injected into the LC/MSsystem consisting of a HydroBond PS C18 reversed-phasecolumn coupled to a HydroBond PS C18 direct-connectguard column (both from Mac-Mod Analytical, Inc., ChaddsFord, PA). Elution was carried out with a gradient of metha-nol/acetonitrile/water. UV detection was performed between220 and 400 nm. ESI and MS measurements were per-formed; equol was included at M-1 = m/z 241. Detection lim-its were previously found to be 1-15 nM depending on theanalyte and interassay coefficients of variation 8-22% at lev-els below 20 nM, 7-14% at levels of 20-100 nM, and 3-12%at levels over 100 nM.
HPV Testing
After collection, exfoliated cervical cell specimens werefrozen at -20°C and sent to the testing laboratory of Dr. N.Kiviat in Seattle, Washington. Cervical specimens weretested for HPV DNA by polymerase chain reaction (PCR) ofthe highly conserved LI region of the viral genome using de-generate primers (MY09 and MYll) (27). PCR productswere evaluated through dot blot hybridization using bio-tin-labeled oligonucleotide DNA probes. Five type-specificprobes (6/11, 16, 18, 31/33/35/39, and 45) and a genericprobe detecting a broad spectrum of HPV types were used.
Statistical Analysis
Analysis of covariance (28) was used to compare themean, log-transformed values of plasma phytoestrogen lev-els and dietary intake between cases and controls. Adjust-ment was made for age and race/ethnicity. Partial Pearsoncorrelations (r) were calculated for continuous plasmaphytoestrogen levels, dietary items (log transformed), and afew nondietary variables, adjusted for age and ethnicity/race.
The relationships of plasma phytoestrogens and dietaryitems with cervical SILs were evaluated by unconditionalmultiple logistic regression (29) modeling case-control sta-tus. Odds ratios (ORs) were derived as an estimate of relativerisk. ORs and 95% confidence intervals (CIs) were calcu-lated by exponentiating the coefficients for the binary indica-tor variables representing quartile levels of plasmaphytoestrogens or food intake. We performed a test for lineartrend in the logit of risk by assigning the median for the ap-propriate quartile of plasma phytoestrogen level or dietaryintake and comparing twice the difference in log likelihoodsfor models with and without a trend variable, based on a x^distribution with 1 degree of freedom. Based on an analysisof the relationship of subject characteristics with cervicalSILs as well as a previous analysis of the data (4), all ORswere adjusted for age (continuous variable), ethnicity/race,HPV infection (positive/negative), tobacco use (ever/neversmoked cigarettes daily for 6 mo or more), alcohol drinking(ever/never drank alcohol at least weekly for 6 mo or more).
and lifetime number of sexual partners (continuous variable).Models for dietary values also included adjustment for en-ergy intake (continuous variable).
For all plasma phytoestrogens and dietary items, addi-tional models were evaluated with all eovariates except HPVstatus. HPV has been established as a necessary cause of cer-vical neoplasia (1,2). Consequently, failure to adjust for viralstatus ignores consideration of a critical factor in the causalpathway. Conversely, direct adjustment for viral status canobscure the relationship of potential cofactors. Comparisonof risk estimates yielded from models with and without HPVpermits evaluation of the form of the relationship of factors,that is, independent or dependent of HPV, on the risk of cer-vical SIL.
Additional evaluation was made of potential confoundersinvolved in the relationship of individual plasma phyto-estrogens with cervical SIL risk. Case-control status wasmodeled with additional adjustment of certain dietary con-stituents.
We also evaluated the joint associations of plasmaphytoestrogens and HPV infection with risk of cervical SIL.The likelihood ratio test with 1 degree of freedom was used tocompare a no-interaction model containing main effect termswith a fully parameterized model containing all possible in-teraction terms for the variables of interest. In these models,dummy variables were created to represent the interactionterms of plasma phytoestrogen level (high/low, dichotomizedat the median level of controls) with HPV infection (posi-tive/negative). Interaction models were also adjusted for age,ethnicity/race, tobacco use, alcohol drinking, and lifetimenumber of sexual partners.
Results
Characteristics of cases and controls are shown in Table 1.Cervical HPV infection was strongly associated with cervi-cal SIL risk; 70% of cases were HPV positive compared with10% of controls. HPV 16 was the most common individualtype, accounting for 36% of cases (31 of 86). Compared withnormal cytology controls, SIL cases were younger, had moresexual partners, and were more likely to have a history ofsmoking and drinking alcohol.
The mean levels of the nine plasma phytoestrogens werecompared for cases and controls (Table 2). Cases had highermean levels of equol and enterodiol than controls, adjustedfor age and ethnicity/race. Correlation was observed betweenrelated plasma phytoestrogens, including enterodiol andenterolactone (r = 0.4; P = 0.0001), hesperetin andnaringenin (r = 0.5; P = 0.0001), and between daidzein and anumber of other isoflavonoids, including genistein (r=0.6; P= 0.0001), glycitein (r = 0.7; P = 0.0001), and 0-DMA (r =0.4; P = 0.0001). Interestingly, enterodiol and enterolactonewere also both correlated with 0-DMA: r = 0.6; P = 0.0001and r = 0.3; P = 0.0001, respectively. Equol was not corre-lated with any plasma phytoestrogen.
Vol. 49, No. 2 111
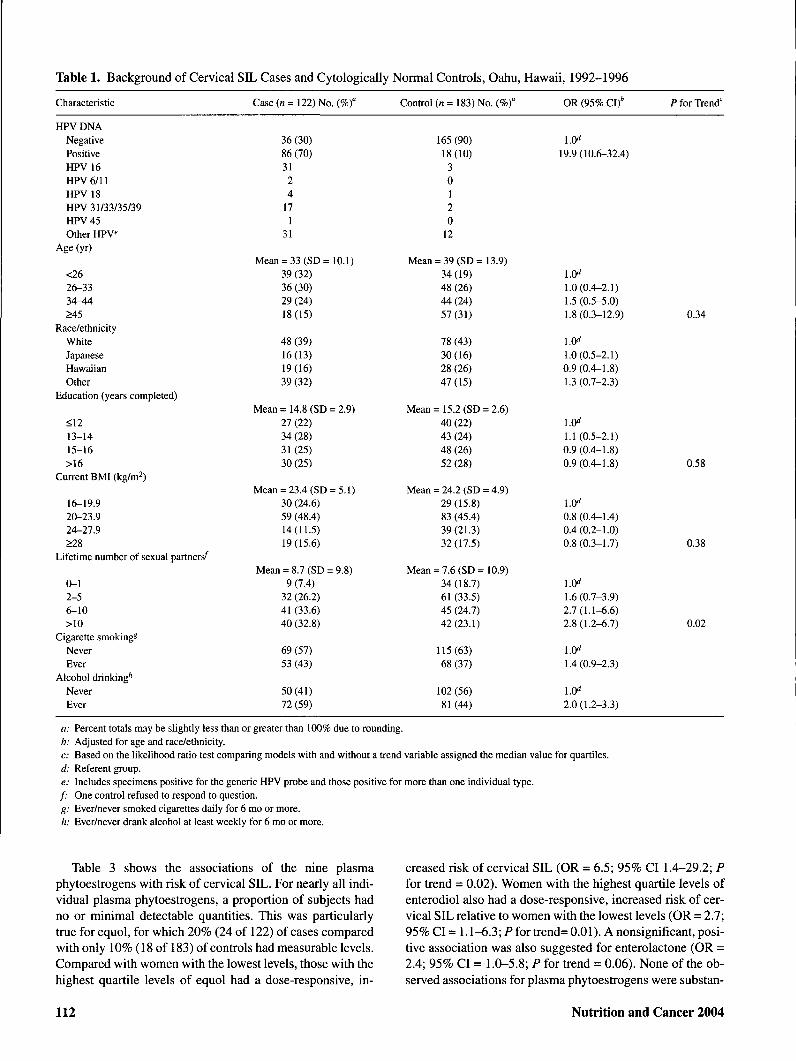
Table 1. Background of Cervical SIL Cases and Cytologically Normal Controls, Oahu, Hawaii, 1992-1996
Characteristic
HPV DNANegativePositiveHPV 16HPV 6/11HPV 18HPV 31/33/35/39HPV 45Other HPV
Age (yr)
<2626-3334-44>45
Race/ethnicityWhiteJapaneseHawaiianOther
Education (years completed)
<1213-1415-16>16
Current BMI (kg/m^)
16-19.920-23.924-27.9>28
Lifetime number of sexual partners'̂
0-12-56-10>10
Cigarette smoking*NeverEver
Alcohol drinking*"NeverEver
Case (« = 122) No. (%)°
36 (30)86 (70)3124
171
31
Mean = 33 (SD= 10.1)39 (32)36 (30)29 (24)18(15)
48 (39)16(13)19(16)39 (32)
Mean = 14.8 (SD = 2.9)27 (22)34 (28)31(25)30(25)
Mean = 23.4 (SD = 5.1)30 (24.6)59 (48.4)14(11.5)19(15.6)
Mean = 8.7 (SD = 9.8)9 (7.4)
32 (26.2)41 (33.6)40 (32.8)
69 (57)53 (43)
50(41)72 (59)
Control (n = 183) No. (%)°
165(90)18(10)
30120
12
Mean = 39 (SD = 13.9)34(19)48 (26)44(24)57(31)
78 (43)30(16)28 (26)47(15)
Mean = 15.2 (SD = 2.6)40 (22)43 (24)48 (26)52 (28)
Mean = 24.2 (SD = 4.9)29(15.8)83 (45.4)39(21.3)32(17.5)
Mean = 7.6 (SD = 10.9)34(18.7)61 (33.5)45 (24.7)42(23.1)
115(63)68 (37)
102 (56)81(44)
OR (95% CI)'
1.0̂19.9(10.6-32.4)
1.0̂1.0(0.4-2.1)1.5 (0.5-5.0)1.8 (0.3-12.9)
1.0^1.0(0.5-2.1)0.9(0.4-1.8)1.3 (0.7-2.3)
1.0^1.1 (0.5-2.1)0.9(0.4-1.8)0.9(0.4-1.8)
1.0^0.8(0.4-1.4)0.4(0.2-1.0)0.8(0.3-1.7)
1.0̂1.6(0.7-3.9)2.7(1.1-6.6)2.8(1.2-6.7)
1.0̂1.4(0.9-2.3)
1.0^2.0(1.2-3.3)
P for Trend'
0.34
0.58
0.38
0.02
a: Percent totals may be slightly less than or greater than 100% due to rounding.b: Adjusted for age and race/ethnicity.c: Based on the likelihood ratio test comparing models with and without a trend variable assigned the median value for quartiles.d: Referent group.e: Includes specimens positive for the generic HPV probe and those positive for more than one individual type./• One control refused to respond to question.g: Ever/never smoked cigarettes daily for 6 mo or more.h: Ever/never drank alcohol at least weekly for 6 mo or more.
Table 3 shows the associations of the nine plasmaphytoestrogens with risk of cervical SIL. For nearly all indi-vidual plasma phytoestrogens, a proportion of subjects hadno or minimal detectable quantities. This was particularlytrue for equol, for which 20% (24 of 122) of cases comparedwith only 10% (18 of 183) of controls had measurable levels.Compared with women with the lowest levels, those with thehighest quartile levels of equol had a dose-responsive, in-
creased risk of cervical SIL (OR = 6.5; 95% CI 1.4-29.2; Pfor trend - 0.02). Women with the highest quartile levels ofenterodiol also had a dose-responsive, increased risk of cer-vical SIL relative to women with the lowest levels (OR = 2.7;95% CI = 1.1-6.3; Pfor trend= 0.01). A nonsignificant, posi-tive association was also suggested for enterolactone (OR =2.4; 95% CI = 1.0-5.8; P for trend = 0.06). None of the ob-served associations for plasma phytoestrogens were substan-
112 Nutrition and Cancer 2004

Table 2. Comparison of Plasma Phytoestrogen Levels Between Cervical SIL Cases and CytologicallyNormal Controls, Oahu, Hawaii, 1992-1996
Phytoestrogen (nM) Case (n = 122) Mean (SD) Control (« = 183) Mean (SD) P Value"
DaidzeinGlyciteinGenisteinEquol0-DesmethylangolensinNaringeninHesperetinEnterodiolEnterolactone
21.2(56.9)1.1(3.2)
43.3 (125.4)4.5 (17.4)4.3 (20.1)
13.7 (24.6)2.4 (7.5)3.1 (6.3)
15.7 (24.0)
29.7 (68.8)1.1(3.3)
21.7(52.0)1.2(10.0)4.6(21.6)
12.2 (30.2)2.3 (13.2)2.3 (8.5)
14.7(21.7)
0.880.930.670.010.610.180.530.0020.20
a: P for difference in mean, log-transformed values between cases and controls (using least-squared means, adjusted for age andrace/ethnicity).
tially altered through exclusion of HPV status as a covariate(data not shown). The relationship of equol with cervical SILwas not altered with additional adjustment for daidzein, totalenergy, carbohydrates, crude fiber, nonsoluble polysaccha-rides (NSPs), or current BMI (data not shown). Similarly, therelationship of enterodiol with cervical SIL was not alteredwith adjustment for total energy, carbohydrates, crude fiber,NSPs, or current BMI (data not shown). These relationshipswere also unchanged with the exclusion of smoking and alco-hol as covariates (data not shown).
Table 4 displays the joint association of plasmaphytoestrogens and HPV status. Compared with HPV-nega-tive women with low levels, HPV-positive women with highequol levels had a statistically significant, highly elevatedrisk of cervical SIL. A statistically significant, positive asso-ciation was also found for HPV-positive women with lowequol levels, although the magnitude of association wasmuch smaller. A nonsignificant, positive association withSIL risk was suggested for HPV-negative women with highequol levels. The test for interaction was not statistically sig-nificant.
Similarly, compared with HPV-negative women with lowlevels, HPV-positive women with high enterodiol levels hada statistically significant, strongly increased risk of cervicalSIL. A statistically significant, positive association was alsofound for HPV-positive women with low enterodiol levels,although the magnitude of association was much smaller. In-terestingly, a statistically significant, increased risk of SILwas also found for HPV-negative women with highenterodiol levels. The test for interaction was not statisticallysignificant.
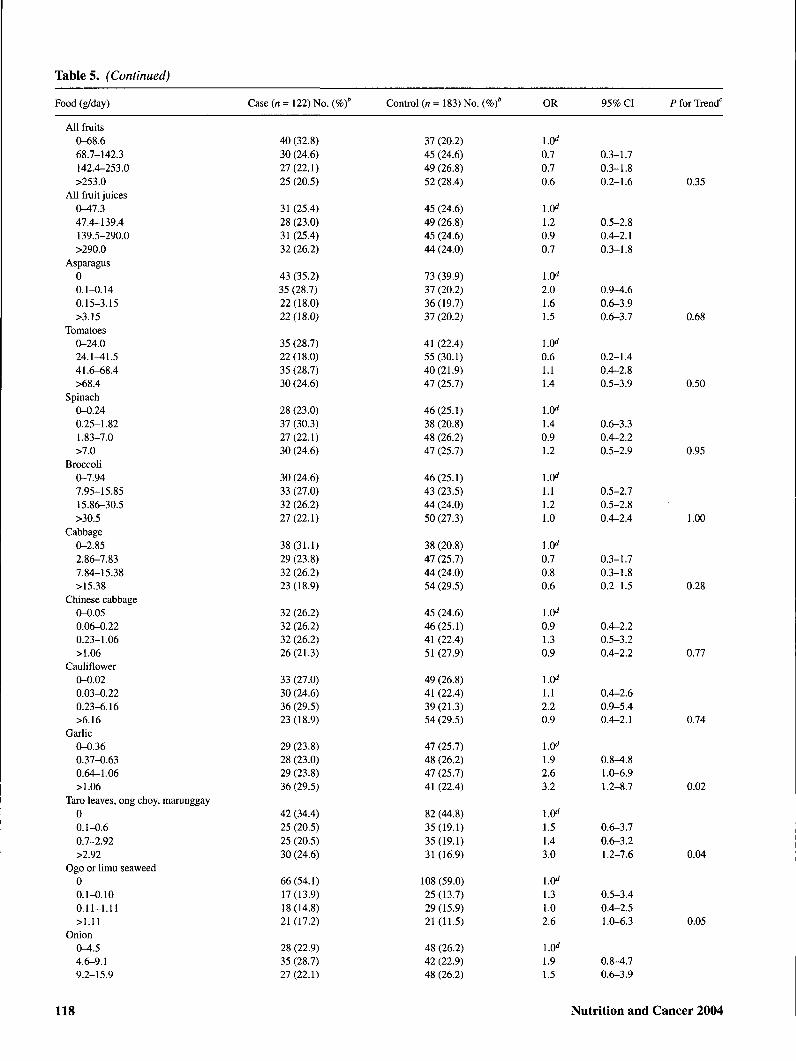
Table 5 shows the association of selected foods and nutri-ents with risk of cervical SIL. Sources of isoflavonoids,lignans, and flavonoids as well as major food groups andmacronutrients are included. In addition, individual foods forwhich an association was observed are shown. Comparedwith those in the lowest quartile of intake, women with thehighest intakes of shellfish, fried shellfish, garlic, taroleaves/ong choy/marunggay, and added oils were at signifi-cantly elevated risk of cervical SIL. Positive dose-responsiveassociations were also suggested for all types of fish,
ogo/limu seaweed, onions, grapefruit, and seeds. Inverse as-sociations with SIL risk were observed for added fats,calories from carbohydrates, and total carbohydrates.Dose-responsive gradients in risk were significant for garlic,taro leaves/ong choy/marunggay, seaweed, shellfish, friedshellfish, total oils, added fats, and total carbohydrates. Norelationship was observed between consumption ofisoflavonoid food sources, including tofu and other soy prod-ucts, and SIL risk. None of the dietary associations were sub-stantially altered with exclusion of HPV status as a covariate(data not shown).
Correlations observed between individual plasmaphytoestrogens and specific foods were generally weak.Genistein was weakly correlated with white rice, the majorstarch staple in Hawaii (r - 0.2; P = 0.007). Daidzein wasweakly correlated with soybeans (r = 0.2; P - 0.01), apricots(r = 0.3; P = 0.0003), onions (r = 0.2; P = 0.04), insolublenonstarch polysaccharides (r = 0.2; P = 0.03), and solublenonstarch polysaccharides (r = 0.2; P = 0.01) and negativelycorrelated with crude fiber (r = -0.2; P - 0.01). Equol wasweakly negatively correlated with total calories (r - -0.2; P =0.04), total carbohydrate (r = -0.2; P = 0.04), crude fiber (r =-0.2; P = 0.01), insoluble nonstarch polysaccharides (r =-0.2; P = 0.03), and soluble nonstarch polysaccharides (r =-0.2; P = 0.02). Enterodiol was weakly correlated with pro-tein from plant products (r - 0.2; P = 0.02). Naringenin wasweakly correlated with onions (r = 0.2; P = 0.04).
With respect to nondietary items, both equol and 0-DMAlevels were weakly correlated with cigarette pack-years (r -0.2; P = 0.04) and duration smoked (r = 0.2; P = 0.04), re-spectively. None of the plasma phytoestrogens were corre-lated with BMI.
Discussion
The positive associations of plasma levels of equol, anisoflavonoid metabolite, and enterodiol, a lignan metabohte,with the risk of cervical SIL were unexpected. Furthermore,enterodiol was associated with an increased risk of cervicalSIL among both HPV-positive and HPV-negative women.
Vol. 49, No. 2 113

Table 3. ORs° and 95% CIs for the Association of Plasma Phytoestrogens With the Risk of Cervical SIL,Oahu, Hawaii, 1992-1996
Phytoestrogen (nM) Case (n = 122) No. ( Control (n = 183) No. ( OR 95% CI P for Trend"
Daidzein00.1-11.711.8-39.6>39.6
Glycitein00.1-0.30.3-1.0>1.0
Equol00.1-0.50.6-5.9>5.9
Genistein00.1-17.517.6-67.8>67.8
O-Desmethylangolensin00.1-2.72.8-7.9>7.9
Enterodiol00.1-1.31.4-2.5>2.5
Naringenin<0.80.8-3.73.8-12.9>12.9
Enterolactone<2.12.1-6.97.0-17.3>17.3
Hesperetin00.1-1.51.6-5.0>5.0
65 (53.3)21 (17.2)18 (14.8)18(14.8)
49 (40.2)26(21.3)23(18.8)24 (19.7)
98 (80.3)6 (4.9)9 (7.4)9 (7.4)
74 (60.7)16(13.1)16(13.1)16(13.1)
95 (77.9)8 (6.6)
11 (9.0)8 (6.6)
38(31.2)22(18.0)29 (23.8)33(27.1)
26(21.3)30 (24.6)30 (24.6)36 (29.5)
28 (23.0)33 (27.1)29 (23.8)32 (26.2)
83 (68.0)21 (17.2)
8 (6.6)11 (8.2)
97 (53)27 (14.8)30 (16.4)29(15.8)
76(41.5)45 (24.6)28(15.3)34(18.6)
165 (90.2)8 (4.4)6 (3.3)4(2.2)
119(65.0)22 (12.0)21(11.5)21(11.5)
127 (69.4)20 (10.9)17 (9.3)19 (10.4)
80 (43.7)47 (25.7)29(15.8)27 (14.8)
52 (28.4)48 (26.2)43 (23.5)40 (21.9)
49 (26.8)45 (24.6)45 (24.6)44 (24.0)
130(71.0)14(7.7)21(11.5)18(9.8)
l.O''2.00.91.2
1.0̂0.71.60.8
0.65.46.5
1.0̂2.11.01.4
0.60.80.5
1.0̂0.72.42.7
1.11.21.2
1.0̂1.31.52.4
1.0̂2.30.50.7
0.8^.50.4-2.20.5-2.9
0.3-1.70.6-3.80.3-1.9
0.1-2.81.5-20.01.4-29.2
0.8-5.20.4-2.50.5-3.6
0.2-1.90.3-2.20.2-1.7
0.3-1.71.0-5.91.1-6.3
0.4-2.60.5-3.00.5-3.0
0.6-3.30.6-3.71.0-5.8
0.9-5.90.2-1.70.2-2.2
0.92
0.71
0.02
0.67
0.28
0.01
0.66
0.06
0.44
a: Adjusted for age, race/ethnicity, cigarette smoking, aleohol drinking, lifetime number of sexual partners, and HPV.b: Percent totals may be slightly less than or greater than 100% due to rounding.c: Based on the likelihood ratio test comparing models with and without a trend variable assigned the median value for quartiles.d: Referent group.
Positive associations were also suggested for the lignan me-tabolite enterolactone.
Consistent with the relationships observed for the plasmalignans, dietary sources of lignans, including garlic and taroleaves/ong choy/marunggay, were positively associated withan increased risk of cervical SIL. Positive associations weresuggested for other lignan sources including limu seaweed,onion, grapefruit, and seeds. However, no associations wereobserved for lignan sources such as coffee, tea, Chinese cab-bage, asparagus, and nuts.
The plant lignans secoisolariciresinol and matairesinol arefurther metabolized to produce enterodiol and enterolactone,respectively. Garlic and onions contain secoisolariciresinoland, to a lesser extent, matairesinol (14,15). Ogo and limu aretypes of seaweed popular among Asians and Polynesiangroups in Hawaii, with relatively high lignan contents (30,31).Taro leaves, ong choy, and marunggay, which are also con-sumed by various ethnic groups in Hawaii, are also lignansources (14,31). Our study did not evaluate some majorsources of lignans and isoflavonoids that are not eaten to a
114 Nutrition and Cancer 2004

Table 4. Joint Association of HPV Infection and Plasma Phytoestrogen Levels With the Risk of Cervical SIL, Oahu, Hawaii,1992-1996
HPV Status/Phytoestrogen Level" Case (n = 122) No, ( Control (n = 183) No, ( OR' 95% CI P for Interaction
DaidzeinHPV-/IOWHPV-/highHPV+/IOWHPV+/high
GlyciteinHPV-/I0WHPV-/highHPV+/IOWHPV+/high
EquolHPV-/IOWHPV-/highHPV+/IOWHPV+/high
GenisteinHPV-/I0WHPV-/highHPV+/I0WHPV+/high
0-DesmethylangoIensinHPV-/IOWHPV-/highHPV+/IOWHPV+/high
EnterodiolHPV-/IOWHPV-/highHPV+/IOWHPV+/high
NaringeninHPV-/IOWHPV-/highHPV+/IOWHPV+/high
EnterolactoneHPV-/I0WHPV-/highHPV+/IOWHPV+/high
HesperetinHPV-/IOWHPV-/highHPV+AowHPV+/high
26(21,3)10(8,2)60 (49,2)26(21,3)
20(16,4)16(13,1)55 (45,1)31 (25,4)
28 (23,0)8 (6,6)
70 (57,4)16(13,1)
26(21,3)10(8,2)64 (52,5)22 (18,0)
32 (26,2)4(3,3)
71 (58,2)15(12,3)
17(13,9)19(15,6)43 (35,2)43 (35,2)
18(14,8)18(14,8)38(31,1)48 (39,3)
16(13,1)20(16,4)45 (36,9)41 (33,6)
31 (25,4)5(4,1)
72 (59,0)14(11,5)
112(61,2)53 (29,0)12 (6,6)6(3,3)
110(60,1)55 (30,1)11 (6,0)7 (3,8)
148 (80,9)17 (9,3)17 (9,3)1 (0,5)
130(71,0)35(19,1)11 (6,0)7 (3,8)
132(72,1)33 (18,0)15 (8,2)3 (1,6)
112(61,2)53 (29,0)15 (8,2)3(1,6)
91 (49,7)74 (40,4)9 (4,9)9 (4,9)
83 (45,4)82 (44,8)11(6,0)7 (3,8)
132(72,1)33(18,0)12 (6,6)6 (3,3)
LOO"̂0,88
21,519,6
1,0̂1,5
25,424,2
1,0̂2,619,479,1
1,0̂1,3
25,517,9
1,0̂0,518,922,0
1,0̂2,519,686,4
1,0"1,1
18,626,7
i.(y1,8
26,134,8
1,0"̂0,6
22,812,1
0,4-2,09,58-48,47,1-54,4
0,7-3,210,8-59,89,1-64,7
1,0-6,69,8-38,49.4-664,4
0,5-3,011,6-56,46,3-50,7
0,2-1,59,1-39,25,7-84,5
1,2-5,38,6-44,8
23,5-317,9
0,5-2,37,4-46,410,5-68,2
0,8-3,910,3-66,512,5-96,9
0,2-1,810,7-48,63,9-38,1
0,92
0,53
0,41
0,42
0,31
0,45
0,65
0,65
0,92
a: Level of plasma phytoestrogen (high/low) dichotomized at the median level of controls,b: Percent totals may be slightly less than or greater than 100% due to rounding,c: Adjusted for age, race/ethnicity, cigarette smoking, alcohol drinking, and lifetime number of sexual partners,d: Based on the likelihood ratio test comparing models with and without an interaction term (1 degree of freedom),e: Referent group.
great extent in this population. Oilseeds such as linseed andflaxseed are among the richest sources of lignan precursors (9)and were not included as specific items in the dietary survey.
In contrast to lignan dietary sources, we observed no asso-ciation between isoflavonoid food sources, including tofuand other soy products, and the risk of cervical SIL. Thesoy-derived isoflavonoid daidzein undergoes extensive me-tabolism to produce equol, 0-DMA, or both (32), There islarge interindividual variation in the metabolism of
isoflavonoids, particularly in the production equol fromdaidzein, so plasma levels may not necessarily reflect dietaryintake. The correlation observed for plasma daidzein levelswith O-DMA, but not with equol, is consistent with a highlevel of variability in equol production. The production ofthese metabolites is largely dependent on gut bacteria. Thespecific bacterial constituents of individuals who produceequol are unique such that it is produced in only 30% of thegeneral population (33).
Vol. 49, No. 2 115
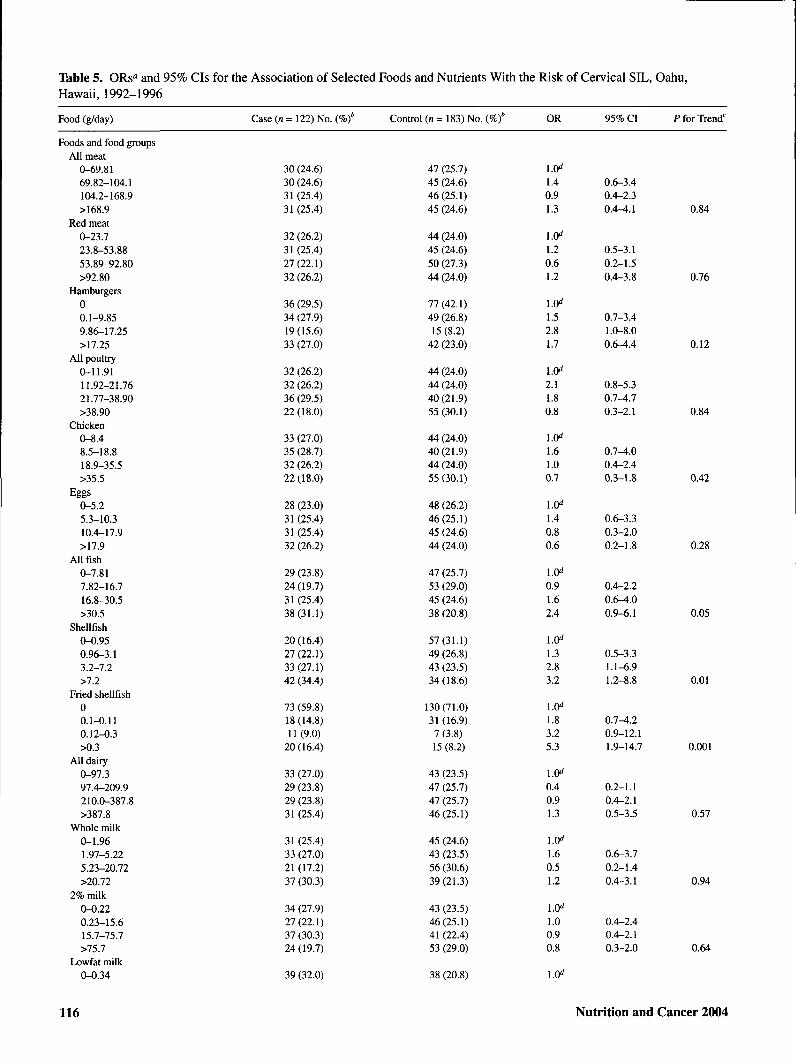
Table 5. ORs° and 95% CIs for the Association of Selected Foods and Nutrients With the Risk of Cervical SIL, Oahu,Hawaii, 1992-1996
Food (g/day) Case (n= 122) No. ( Control (n= 183) No. ( OR 95% CI P for Trend'
Foods and food groupsAll meat
0-69.8169.82-104.1104.2-168.9>168.9
Red meat0-23.723.8-53.8853.89-92.80>92.80
Hamburgers00.1-9.859.86-17.25>17.25
All poultry0-11.9111.92-21.7621.77-38.90>38.90
Chicken0-8.48.5-18.818.9-35.5>35.5
Eggs0-5.25.3-10.310.4-17.9>17.9
All fish0-7.817.82-16.716.8-30.5>30.5
Shellfish0-0.950.96-3.13.2-7.2>7.2
Fried shellfish00.1-0.110.12-0.3>0.3
All dairy0-97.397.4-209.9210.0-387.8>387.8
Whole milk0-1.961.97-5.225.23-20.72>20.72
2% milk0-0.220.23-15.615.7-75.7>75.7
Lowfat milk0-0.34
30 (24.6)30 (24.6)31(25.4)31 (25.4)
32 (26.2)31 (25.4)27(22.1)32 (26.2)
36 (29.5)34 (27.9)19(15.6)33 (27.0)
32 (26.2)32 (26.2)36 (29.5)22(18.0)
33 (27.0)35 (28.7)32 (26.2)22 (18.0)
28 (23.0)31 (25.4)31 (25.4)32 (26.2)
29 (23.8)24(19.7)31 (25.4)38(31.1)
20(16.4)27(22.1)33 (27.1)42 (34.4)
73 (59.8)18(14.8)11(9.0)20(16.4)
33 (27.0)29 (23.8)29 (23.8)31 (25.4)
31 (25.4)33 (27.0)21 (17.2)37 (30.3)
34 (27.9)27(22.1)37 (30.3)24 (19.7)
39 (32.0)
47 (25.7)45 (24.6)46(25.1)45 (24.6)
44 (24.0)45 (24.6)50 (27.3)44 (24.0)
77(42.1)49 (26.8)15 (8.2)42 (23.0)
44 (24.0)44 (24.0)40(21.9)55(30.1)
44 (24.0)40(21.9)44 (24.0)55 (30.1)
48 (26.2)46(25.1)45 (24.6)44 (24.0)
47 (25.7)53 (29.0)45 (24.6)38 (20.8)
57(31.1)49 (26.8)43 (23.5)34 (18.6)
130(71.0)31 (16.9)7 (3.8)15 (8.2)
43 (23.5)47 (25.7)47 (25.7)46(25.1)
45 (24.6)43 (23.5)56 (30.6)39(21.3)
43 (23.5)46(25.1)41 (22.4)53 (29.0)
38 (20.8)
1.40.91.3
1.20.61.2
1.52.81.7
2.11.80.8
1.61.00.7
1.40.80.6
0.91.62.4
1.0̂1.32.83.2
1.83.25.3
0.40.91.3
1.60.51.2
1.00.90.8
0.6-3.40.4-2.30.4-4.1
0.5-3.10.2-1.50.4-3.8
0.7-3.41.O-8.00.6-4.4
0.8-5.30.7-4.70.3-2.1
0.7-^.00.4-2.40.3-1.8
0.6-3.30.3-2.00.2-1.8
0.4-2.20.6^.00.9-6.1
0.5-3.31.1-6.91.2-8.8
0.7-4.20.9-12.11.9-14.7
0.2-1.10.4-2.10.5-3.5
0.6-3.70.2-1.40.4-3.1
0.4-2.40.4-2.10.3-2.0
0.84
0.76
0.12
0.84
0.42
0.28
0.05
0.01
0.001
0.57
0.94
0.64
116 Nutrition and Cancer 2004

Tables. (Continued)
Food (g/day) Case (n = 122) No. I Control (n = 183) No. ( OR 95% CI P for Trend'
0.35-13.5713.58-64.16>64.16
Cheese0-7.07.1-14.714.8-29.02>29.02
Butter0-0.030.04-0.240.25-1.1>1.1
All rice0-53.153.2-133.7133.8-211.1
White rice0-35.335.4-101.95101.96-203.94>203.94
All bread0-39.940.0-74.774.8-118.3
White bread0-7.87.9-18.118.2-36.8>36.8
Whole wheat bread0-0.210.22-7.147.15-19.42>19.42
All cereal0-2.802.81-18.118.2^14.9>44.9
Whole grain cereal0-1.181.19-11.0111.02-35.07>35.07
Cooked cereal0-0.020.03-1.51.6-6.4>6.4
Whole grain foods0-18.218.3^6.446.5-91.1>91.1
All vegetables0-152.4152.5-234.0234.1-331.9>331.9
32 (26.2)26(21.3)25 (20.5)
29 (23.8)30 (24.6)31 (25.4)32 (26.2)
32 (26.2)28 (23.0)30 (24.6)32 (26.2)
31 (25.4)25 (20.5)35 (28.7)31 (25.4)
33 (27.0)29 (23.8)28 (23.0)32 (26.2)
31 (24.4)35 (27.6)32 (25.2)29 (22.8)
23 (18.8)33 (27.0)37 (30.3)29 (23.8)
38(31.1)30 (24.6)33 (27.0)21 (17.2)
35 (28.7)32 (26.2)31 (25.4)24 (19.7)
36 (29.5)31 (25.4)32 (26.2)23 (18.9)
36 (29.5)33 (27.0)27(22.1)26(21.3)
40 (32.8)23 (18.8)33 (27.0)26(21.3)
30 (24.6)30 (24.6)34 (27.9)28 (23.0)
44 (24.0)50 (27.3)51 (27.9)
48 (26.2)46(25.1)44 (24.0)45 (24.6)
48 (26.2)46(25.1)43 (23.5)46(25.1)
45 (24.6)51 (27.9)41 (22.4)46(25.1)
47 (25.7)44 (24.0)48 (26.2)44 (24.0)
46 (26.0)40 (22.6)44 (24.9)47 (26.6)
53 (29.0)44 (24.0)39(21.3)47 (25.7)
39(21.3)47 (25.7)42 (23.0)55 (30.0)
41 (22.4)45 (24.6)45 (24.6)52 (28.4)
41 (22.4)45 (24.6)44 (24.0)53 (29.0)
41 (22.4)44 (24.0)49 (26.8)49 (26.8)
37 (20.2)52 (28.4)43 (23.5)51 (27.9)
43 (23.9)46 (25.6)42 (23.3)49 (27.2)
0.50.70.8
1.0̂0.71.10.7
1.0̂0.70.90.6
1.0̂0.81.41.1
1.0̂0.70.50.9
1.0̂1.51.21.0
1.0̂243.01.1
1.0̂0.70.70.3
1.0̂0.40.80.5
1.0̂0.50.60.5
1.0̂0.60.70.4
1.0̂0.40.80.4
1.0̂1.81.61.6
0.2-1.20.3-1.80.3-2.0
0.3-1.80.4-3.00.2-2.1
0.3-1.60.4-2.20.2-14
0.3-2.10.5-3.50.4-3.0
0.3-1.80.2-1.40.3-2.4
0.6-3.60.5-3.00.4-2.8
0.9-6.01.2-7.70.4-3.1
0.3-1.60.3-1.70.1-0.8
0.2-1.10.3-1.80.2-1.2
0.2-1.20.2-140.2-1.2
0.2-140.3-1.60.1-0.9
0.2-1.00.3-1.80.2-1.1
0.8^.50.6-4.10.6-4.7
0.90
0.65
0.08
0.72
0.62
0.93
0.46
0.02
0.27
0.12
0.10
0.13
0.42(continued)
Vol. 49, No. 2 117
Tables. (Continued)
Food (g/day) Case (n = 122) No. ( Control (n= 183) No. ( OR 95% CI P for Trend'
All fruits0-68.668.7-142.3142.4-253,0>253.0
All fruit juices0-47.347.4-139.4139.5-290.0>290.0
Asparagus00.1-0.140.15-3.15>3.15
Tomatoes0-24.024.1^1.541.6-68.4>68.4
Spinach0-0.240.25-1.821.83-7.0>7.0
Broccoli0-7.947.95-15.8515.86-30.5>30.5
Cabbage0-2.852.86-7.837.84-15.38>15.38
Chinese cabbage0-0.050.06-0.220.23-1.06>1.06
Cauliflower0-0.020.03-0.220.23-6.16>6.16
Garlic0-0.360.37-0.630.64-1.06>1.06
Taro leaves, ong choy, mamnggay00.1-0.60.7-2.92>2.92
Ogo or limu seaweed00.1-0.100.11-1.11>1.11
Onion0^.54.6-9.19.2-15.9
40 (32.8)30 (24.6)27(22.1)25 (20.5)
31 (25.4)28 (23.0)31 (25.4)32 (26.2)
43 (35.2)35 (28.7)22 (18.0)22(18.0)
35 (28.7)22(18.0)35 (28.7)30 (24.6)
28 (23.0)37 (30.3)27(22.1)30 (24.6)
30 (24.6)33 (27.0)32 (26.2)27(22.1)
38(31.1)29 (23.8)32 (26.2)23 (18.9)
32 (26.2)32 (26.2)32 (26.2)26(21.3)
33 (27.0)30 (24.6)36 (29.5)23 (18.9)
29 (23.8)28 (23.0)29 (23.8)36 (29.5)
42 (34.4)25 (20.5)25 (20.5)30 (24.6)
66(54.1)17(13.9)18(14.8)21 (17.2)
28 (22.9)35 (28.7)27(22.1)
37 (20.2)45 (24.6)49 (26.8)52 (28.4)
45 (24.6)49 (26.8)45 (24.6)44 (24.0)
73 (39.9)37 (20.2)36 (19.7)37 (20.2)
41 (22.4)55 (30.1)40(21.9)47 (25.7)
46(25.1)38 (20.8)48 (26.2)47 (25.7)
46(25.1)43 (23.5)44 (24.0)50 (27.3)
38 (20.8)47 (25.7)44 (24.0)54 (29.5)
45 (24.6)46(25.1)41 (22.4)51 (27.9)
49 (26.8)41 (22.4)39(21.3)54 (29.5)
47 (25.7)48 (26.2)47 (25.7)41 (22.4)
82 (44.8)35(19.1)35(19.1)31 (16.9)
108 (59.0)25 (13.7)29(15.9)21(11.5)
48 (26.2)42 (22.9)48 (26.2)
0.70.70.6
1.20.90.7
2.01.61.5
0.61.11.4
1.0̂1.40.91.2
1.11.21.0
0.70.80.6
0.91.30.9
1.0̂1.12.20.9
1.0̂1.92.63.2
1.51.43.0
1.0̂1.31.02.6
1.91.5
0.3-1.70.3-1.80.2-1.6
0.5-2.80.4-2.10.3-1.8
0.9-4.60.6-3.90.6-3.7
0.2-1.40.4-2.80.5-3.9
0.6-3.30.4-2.20.5-2.9
0.5-2.70.5-2.80.4-2.4
0.3-1.70.3-1.80.2-1.5
0.4-2.20.5-3.20.4-2.2
0.4-2.60.9-5.40.4-2.1
0.8-4.81.0-6.91.2-8.7
0.6-3.70.6-3.21.2-7.6
0.5-3.40.4-2.51.0-6.3
0.8-4.70.6-3.9
0.35
0.68
0.50
0.95
1.00
0.28
0.77
0.74
0.02
0.04
0.05
118 Nutrition and Cancer 2004
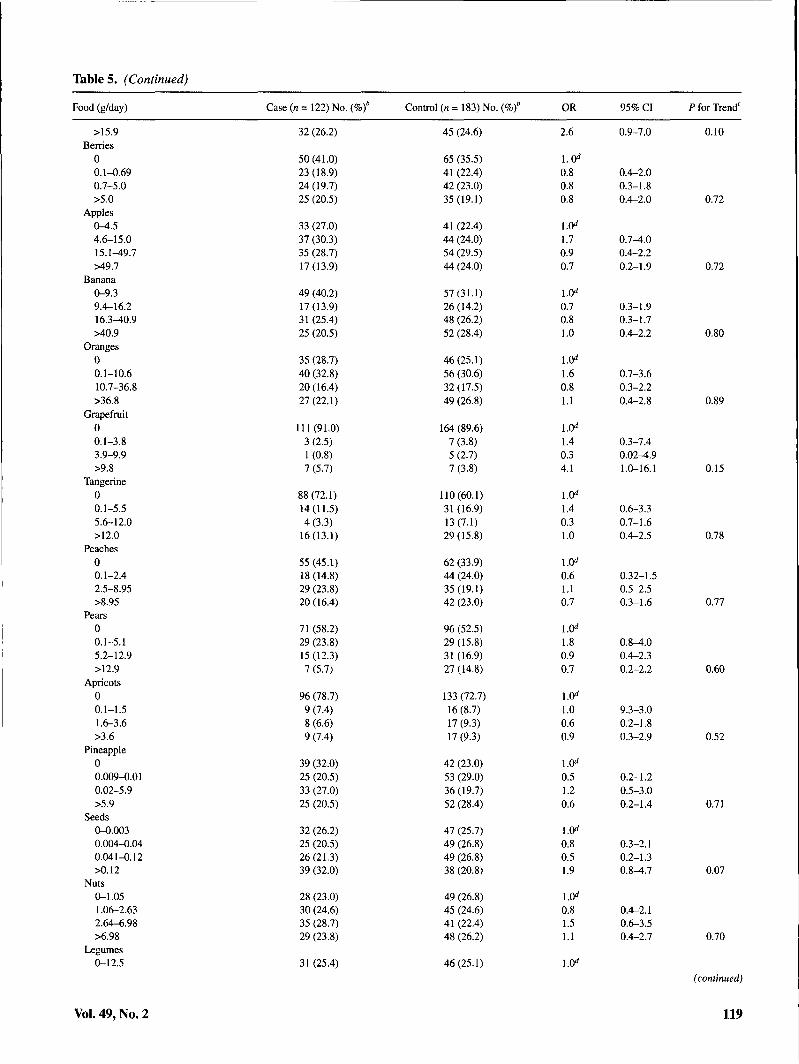
Table 5. (Continued)
Food (g/day) Case (n = 122) No. ( Control (n = 183) No. ( OR 95% CI P for Trend'
>15.9Berries
00.1-^.690.7-5.0>5.0
Apples0-4.54.6-15.015.1^9.7>49.7
Banana0-9.39.4-16.216.3-40.9>40.9
Oranges00.1-10.610.7-36.8>36.8
Grapefruit00.1-3.83.9-9.9>9.8
Tangerine00.1-5.55.6-12.0>12.0
Peaches00.1-2.42.5-8.95>8.95
Pears00.1-5.15.2-12.9>12.9
Apricots00.1-1.51.6-3.6>3.6
Pineapple00.009-0.010.02-5.9>5.9
Seeds0-0.0030.004-0.040.041-0.12>0.12
Nuts0-1.051.06-2.632.64-6.98>6.98
Legumes0-12.5
Vol. 49, No. 2
32 (26.2)
50(41.0)23 (18.9)24 (19.7)25 (20.5)
33 (27.0)37 (30.3)35 (28.7)17(13.9)
49 (40.2)17(13.9)31 (25.4)25 (20.5)
35 (28.7)40 (32.8)20 (16.4)27(22.1)
111 (91.0)3 (2.5)1 (0.8)7 (5.7)
88(72.1)14(11.5)4(3.3)16(13.1)
55 (45.1)18(14.8)29 (23.8)20(16.4)
71 (58.2)29 (23.8)15(12.3)7 (5.7)
96 (78.7)9 (7.4)8 (6.6)9 (7.4)
39 (32.0)25 (20.5)33 (27.0)25 (20.5)
32 (26.2)25 (20.5)26(21.3)39 (32.0)
28 (23.0)30 (24.6)35 (28.7)29 (23.8)
31 (25.4)
45 (24.6)
65 (35.5)41 (22.4)42 (23.0)35(19.1)
41 (22.4)44 (24.0)54 (29.5)44 (24.0)
57(31.1)26 (14.2)48 (26.2)52 (28.4)
46(25.1)56 (30.6)32(17.5)49 (26.8)
164 (89.6)7 (3.8)5 (2.7)7 (3.8)
110(60.1)31 (16.9)13(7.1)29 (15.8)
62 (33.9)44 (24.0)35(19.1)42 (23.0)
96 (52.5)29(15.8)31 (16.9)27 (14.8)
133(72.7)16 (8.7)17 (9.3)17 (9.3)
42 (23.0)53 (29.0)36 (19.7)52 (28.4)
47 (25.7)49 (26.8)49 (26.8)38 (20.8)
49 (26.8)45 (24.6)41 (22.4)48 (26.2)
46(25.1)
2.6 0.9-7.0 0.10
0.80.80.8
1.70.90.7
0.70.81.0
1.60.81.1
1.40.34.1
1.40.31.0
0.61.10.7
1.80.90.7
1.0̂1.00.60.9
0.51.20.6
0.80.51.9
1.0̂0.81.51.1
1.0̂
0.4-2.00.3-1.80.4-2.0
0.7^.00.4-2.20.2-1.9
0.3-1.90.3-1.70.4-2.2
0.7-3.60.3-2.20.4-2.8
0.3-7.40.02^.91.0-16.1
0.6-3.30.7-1.60.4-2.5
0.32-1.50.5-2.50.3-1.6
0.8^.00.4-2.30.2-2.2
9.3-3.00.2-1.80.3-2.9
0.2-1.20.5-3.00.2-1.4
0.3-2.10.2-1.30.8-4.7
0.4-2.10.6-3.50.4-2.7
0.72
0.72
0.80
0.89
0.15
0.78
0.77
0.60
0.52
0.71
0.07
0.70
(continued)
119

Tables. (Continued)
Food (g/day) Case {n = 122) No. ( Control (n= 183) No. ( OR 95% CI P for Trend'
12.6-24.024.1^5.1>45.1
Dried beans0-5.65.7-12.112.2-26.2>26.2
Tofu0-0.910.92-4.604.61-12.1
Soy products0-1.451.46-6.226.23-17.34>17.34
All teas00.1-33.833.9-157.7>157.7
Black tea00-19.619.7-85.2>85.2
Green tea00-19.619.7-39.4>39.4
All coffee00.1-170.2170.3^79.4>479.4
Regular coffee00.1-171.0171.1-479.4>479.4
Total added fats0-3.33.4-5.85.9-9.3>9.3
Total added oils0-3.43.5-5.25.3-8.5>8.5
MacronutrientsTotal calories
0-1481.51481.6-19221923-2599.1>2599.1
Calories from carbohydrate0-792.61792.62-1054.581054.59-1402.18>1402.18
34 (27.9)26(21.3)31 (25.4)
34 (27.9)21 (17.2)31 (25.4)36 (29.5)
34 (27.9)33 (27.1)30 (24.6)25 (20.5)
34 (27.9)33(27.1)27(22.1)28 (23.0)
54 (44.3)25 (20.5)22 (18.0)21 (17.2)
82 (67.2)13 (10.7)16(13.1)11(9.0)
92 (75.4)10(8.2)9 (7.4)11(9.0)
39 (32.0)24 (19.7)35 (28.7)24(19.7)
45 (36.9)23 (18.9)36 (29.5)18(14.8)
36 (29.5)28 (23.0)30 (24.6)28 (23.0)
26(21.3)30 (24.6)29 (23.8)37 (30.3)
36 (29.5)23 (18.8)32 (26.2)31 (25.4)
34 (27.9)29 (23.8)31 (25.4)28 (23.0)
42 (23.0)50 (27.3)45 (24.6)
42 (23.0)55 (30.1)46(25.1)40(21.9)
43 (23.5)42 (23.0)46(25.1)52 (28.4)
42 (23.0)44 (24.0)48 (26.2)49 (26.8)
68 (37.2)41 (22.4)33 (18.0)41 (22.4)
113(61.7)25 (13.7)22 (12.0)23 (12.6)
141 (77.0)11(6.0)18(9.8)13(7.1)
58(31.7)34 (18.6)67 (36.6)24(13.1)
71 (38.8)31 (16.9)65 (35.5)16 (8.7)
41 (22.4)47 (25.7)46(25.1)49 (26.8)
51 (27.9)45 (24.6)48 (26.2)39(21.3)
39(21.3)54 (29.5)49 (26.8)41 (22.4)
42 (23.0)47 (25.7)48 (26.2)46(25.1)
1.10.51.2
1.0̂0.70.71.3
1.0̂1.30.80.9
1.0̂1.20.71.0
1.0̂1.01.60.8
1.0̂1.01.20.7
1.0̂2.01.81.6
1.0̂1.10.81.7
1.0̂1.10.71.5
1.0̂0.40.50.3
1.0̂1.01.43.4
1.0̂0.50.50.5
1.0̂0.40.70.2
0.4-2.60.2-1.30.5- 3.0
0.3-1.70.3-1.70.5-3.3
0.5-3.10.3-2.10.4-2.2
0.5-2.90.3-1.90.4-2.6
0.4-2.30.7^.10.3-2.0
0.4-2.60.5-2.90.2-2.0
0.6-6.70.6-5.50.5-5.2
0.4-2.60.4-1.90.6-4.4
0.4-2.60.3-1.60.5-̂ .2
0.2-1.00.2-1.20.1-0.8
0.4-2.60.6-3.51.1-10.2
0.2-1.10.2-1.10.2-1.2
0.2-1.00.3-1.80.1-0.8
0.70
0.85
0.60
0.80
0.93
0.73
0.20
0.77
0.93
0.01
0.03
0.06
0.06
120 Nutrition and Cancer 2004
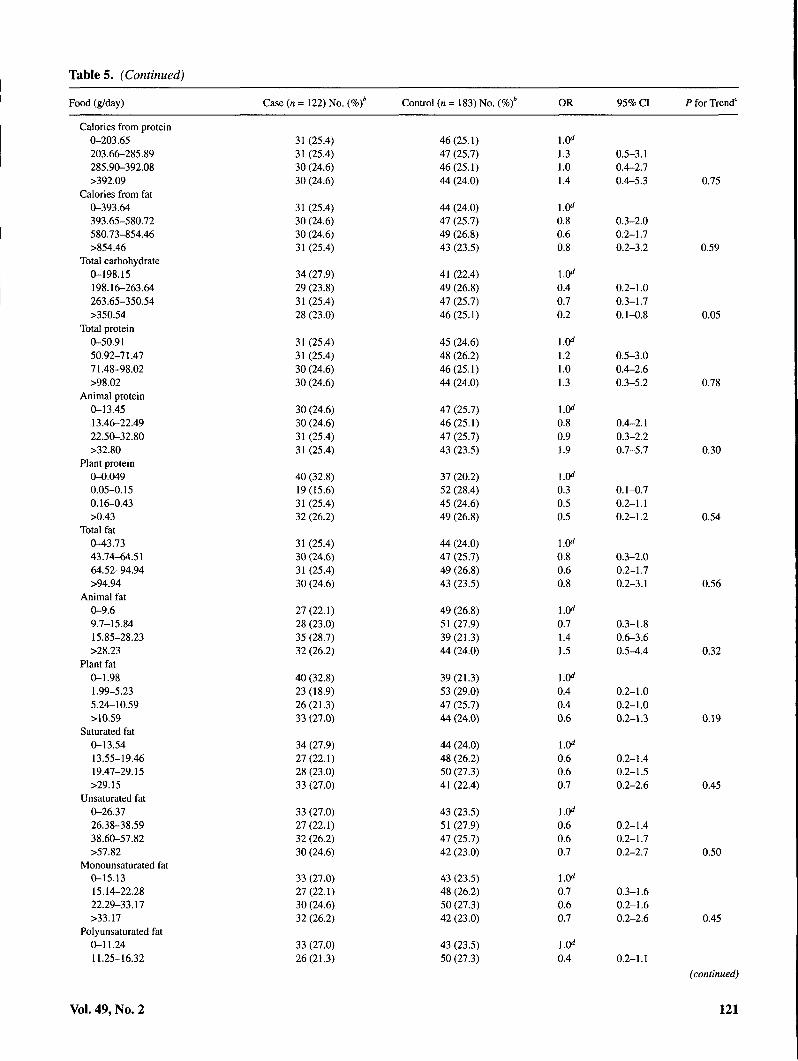
Table 5. (Continued)
Food (g/day) Case (n = 122) No. ( Control (n = 183) No. ( OR 95% CI P for Trend'
Calories from protein0-203.65203.66-285.89285.90-392.08>392.09
Calories from fata-393.64393.65-580.72580.73-854.46>854.46
Total carbohydrate0-198.15198.16-263.64263.65-350.54>350.54
Total protein0-50.9150.92-71.4771.48-98.02>98.02
Animal protein0-13.4513.46-22.4922.50-32.80>32.80
Plant protein0-0.0490.05-0.150.16-0.43>0.43
Total fat0-43.7343.74-64.5164.52-94.94>94.94
Animal fat0-9.69.7-15.8415.85-28.23>28.23
Plant fat0-1.981.99-5.235.24-10.59>10.59
Saturated fat0-13.5413.55-19.4619.47-29.15>29.15
Unsaturated fat0-26.3726.38-38.5938.60-57.82>57.82
Monounsaturated fat0-15.1315.14-22.2822.29-33.17>33.17
Polyunsaturated fat0-11.2411.25-16.32
Vol. 49, No. 2
31 (25.4)31 (25.4)30 (24.6)30 (24.6)
31 (25.4)30 (24.6)30 (24.6)31 (25.4)
34 (27.9)29 (23.8)31 (25.4)28 (23.0)
31 (25.4)31 (25.4)30 (24.6)30 (24.6)
30 (24.6)30 (24.6)31 (25.4)31 (25.4)
40 (32.8)19(15.6)31 (25.4)32 (26.2)
31 (25.4)30 (24.6)31 (25.4)30 (24.6)
27(22.1)28 (23.0)35 (28.7)32 (26.2)
40 (32.8)23 (18.9)26(21.3)33 (27.0)
34 (27.9)27(22.1)28 (23.0)33 (27.0)
33 (27.0)27(22.1)32 (26.2)30 (24.6)
33 (27.0)27(22.1)30 (24.6)32 (26.2)
33 (27.0)26(21.3)
46(25.1)47 (25.7)46(25.1)44 (24.0)
44 (24.0)47 (25.7)49 (26.8)43 (23.5)
41 (22.4)49 (26.8)47 (25.7)46(25.1)
45 (24.6)48 (26.2)46(25.1)44 (24.0)
47 (25.7)46(25.1)47 (25.7)43 (23.5)
37 (20.2)52 (28.4)45 (24.6)49 (26.8)
44 (24.0)47 (25.7)49 (26.8)43 (23.5)
49 (26.8)51 (27.9)39(21.3)44 (24.0)
39(21.3)53 (29.0)47 (25.7)44 (24.0)
44 (24.0)48 (26.2)50 (27.3)41 (22.4)
43 (23.5)51 (27.9)47 (25.7)42 (23.0)
43 (23.5)48 (26.2)50 (27.3)42 (23.0)
43 (23.5)50 (27.3)
1.31.014
0.80.60.8
0 40.70.2
1.21.01.3
1.0̂0.80.91.9
0.30.50.5
0.80.60.8
0.7141.5
1.0̂0.40.40.6
0.60.60.7
0.60.60.7
l.O''0.70.60.7
0.5-3.10.4-2.70.4-5.3
0.3-2.00.2-1.70.2-3.2
0.2-1.00.3-1.70.1-0.8
0.5-3.00.4-2.60.3-5.2
0.4-2.10.3-2.20.7-5.7
0.1-0.70.2-1.10.2-1.2
0.3-2.00.2-1.70.2-3.1
0.3-1.80.6-3.60.5-4.4
0.2-1.00.2-1.00.2-1.3
0.2-140.2-1.50.2-2.6
0.2-140.2-1.70.2-2.7
0.3-1.60.2-1.60.2-2.6
0.4 0.2-1.1
0.75
0.59
0.05
0.78
0.30
0.54
0.56
0.32
0.19
0.45
0.50
0.45
(continued)
121

Tables. (Continued)
Food (g/day)
16.33-24.66>24.66
Cholesterol0-132.18132.19-197.96197.97-287.72>287.72
Crude fiber0-3.133.14-^.514.52-6.46>6.46
Nonsoluble polysaccharides (NSP)0-10.7910.80-15.3215.33-21.44>21.44
Noncellulosic NSP0-13.2013.21-19.4319.44-26.45>26.45
Case (/I = 122) No. {Vcf
34 (27.9)29 (23.8)
33 (27.0)28 (23.0)28 (23.0)33 (27.0)
34 (27.9)31 (25.4)32 (26.2)25 (20.5)
37 (30.3)32 (26.2)25 (20.5)28 (23.0)
34 (27.9)36 (29.5)24 (19.7)28 (23.0)
Control (n = 183) No. (%)'
46(25.1)44 (24.0)
44 (24.0)51 (27.9)48 (26.2)40(21.9)
42 (23.0)47 (25.7)44 (24.0)50 (27.3)
39(21.3)47 (25.7)48 (26.2)49 (26.8)
40(21.9)43 (23.5)53 (29.0)47 (25.7)
OR
0.50.5
1.0^0.60.50.8
1.0^0.61.00.6
1.0^0.60.70.6
1.0^0.80.60.6
95% CI
0.2-1.30.1-1.8
0.2-1.40.2-1.20.2-2.6
0.3-1.50.4-2.60.2-1.8
0.3-1.50.3-1.80.2-1.8
0.3-1.80.2-1.50.2-2.0
P for Trend'
0.29
0.41
0.37
0.20
0.31
a: Adjusted for age, race/ethnicity, cigarette smoking, alcohol drinking, lifetime number of sexual partners, HPV, and total energy intake (kcal).b: Percent totals may be slightly less than or greater than 100% due to rounding.c: Based on the likelihood ratio test comparing models with and without a trend variable assigned the median value for quartiles.d: Referent group.
By definition, equol nonproducers would produce agreater proportion of 0-DMA. The correlation observed be-tween enterodiol and enterolactone each with O-DMA wasdifficult to explain. It is not intuitive that the production ofO-DMA would be correlated with lignan metabolism.
The overall weak correlation observed between individualplasma phytoestrogen levels and consumption of their foodsources may also be explained by their temporally distinctmeasures. The plasma phytoestrogens measured in the studylikely reflect current exposures as phytoestrogen levels gen-erally have a very short biological half-life whereby they aremetabolized within hours of consumption (15). By contrast,dietary phytoestrogen consumption ascertained through thestudy's dietary survey reflected average consumption overthe past 12 mo. Nevertheless, plasma phytoestrogen levelsmay be an adequate measure of average consumption assum-ing no major recent changes in diet. Because biological mea-sures of isoflavonoids generally correlate with the dietary in-take of soy products (34), the correlation of daidzein levelsand soybean intake, for example, strengthens our confidencein the dietary assessment utilized in this study.
The weak negative correlation of equol with total carbo-hydrate intake as well as with crude fiber, and both insolubleand soluble NSP, may indicate that these dietary constituentsdeter equol production. It has been proposed by other investi-gators that fiber may be an important determinant of the com-position and activity of gut microflora (15). The inverse asso-ciation of total carbohydrate with cervical SIL risk observedin our study may involve the effects of carbohydrate on intes-tinal bacteria, which, in turn, may influence the production of
equol. Adjustment for carbohydrates, however, did not influ-ence the relationship of equol with cervical SIL.
Because of their estrogenic properties, any role ofphytoestrogens in cervical carcinogenesis is likely to involveestrogenic mechanisms. Phytoestrogens have a wide range ofestrogenic potency with the isoflavonoids, and equol in par-ticular, generally having greater potency than flavonoids andlignans (35,36).
There is epidemiological and laboratory evidence that es-trogen can contribute to malignant development in HPV-in-fected cervical tissue. Multiparity and long-term oral contra-ceptive use, conditions that contribute to higherphysiological estrogen levels, are associated with an in-creased risk of cervical cancer among HPV-positive women(18-20). Chronic exposure to estrogen is necessary for thedevelopment of cervical dysplasia and cancer in HPV-in-fected transgenic mouse models (21-23), and carcinogenesisoccurs specifically at the cervical transformation zonethrough a progression from metaplasia to dysplasia and, fi-nally, to squamous carcinoma (21).
Estrogen increases the prohferation of HPV-infected, es-trogen-sensitive cells (37) and of cervical cancer cell lines(38) and increases the expression of oncogenic HPV types 16(39^1) and 18 (39). Furthermore, steroid hormones enhancethe expression of oncogenic HPV E6 and E7 viral genes andinhibit MHC class I and II antigen expression, thereby inhib-iting the ability of HPV infections to resolve (42). HPV itselfmay also have direct effects on estrogen, which contribute tocervical carcinogenesis. Specifically, HPV infection in-creases the 16a-hydroxylation of estradiol (43) producing
122 Nutrition and Cancer 2004

the metabolite 16a-hydroxyestrone, which increases thegrowth of HPV-immortalized keratinocytes (38).
Although their activity is weaker than that of endogenousestrogens (9-11), phytoestrogens may contribute to cervicalcarcinogenesis through similar mechanisms. Severalflavonoids, including naringenin, increase estrogen-regu-lated gene transcription in eervieal HELA cells transfeetedwith the a-estrogen receptor (44).
Whether isoflavonoids and lignans, including equol,enterodiol, and enterolactone, have similar estrogenie effectsin cervical tissue is not known. Human cervical cells containthe estrogen receptors a and P (45). In contrast to endoge-nous estrogens, which hind to both a- and p-estrogen recep-tors, phytoestrogens may preferentially bind to jJ-estrogenreceptors, which are strongly expressed in the cervix (46).
Phytoestrogen activity may also depend on endogenousestrogen levels. There is in vitro evidence that, in tissue withlow endogenous estrogen levels, phytoestrogens such asenterolactone may have growth-stimulating effects; con-versely, in tissue with high endogenous levels,phytoestrogens have inhibitory effects (47). Unfortunately,the influence of endogenous estrogens on phytoestrogen ac-tivity could not be evaluated in the present study as we didnot measure the levels of estradiol and other endogenousestrogens in women.
The observed dietary associations in this study may havebeen attributable to other unmeasured phytoestrogens orother compounds. For example, in addition to lignans, garlicand onions also contain boron (14,48), a mineral with weaklyestrogenie effects (14). Fish and shellfish, which were posi-tively associated with an increased risk of SIL in the presentstudy, also contain boron (14).
Our results were consistent with evidence that cigarettesmoking is a risk factor for cervical SIL (49). The positive as-sociations of equol and enterolactone with cervical SIL riskwere not altered with or without the inclusion of cigarettesmoking as a covariate. Nevertheless, it is possible thatsmoking may be indirectly involved in the relationship be-tween equol and cervical neoplasia. Both equol and the otherdaidzein metabolite 0-DMA were weakly correlated withmeasures of smoking quantity: pack-years and smoking du-ration, respectively. This may be an indication that smokingmodifies the composition of the colonic microflora, specifi-cally the composition of the bacteria involved in isoflavonoidproduction. Chronic tobacco exposure may promote the co-lonic microflora involved in the differential production ofequol from daidzein.
The case-control design of this study did not permit con-sideration of the duration of viral infection. Given the tran-sient nature of HPV infection, a limitation of this study is theinability to consider past HPV infections or to distinguish be-tween transient and persistent infections. Persistent infectionwith HPV is most strongly associated with cervical neoplasia(50).
The results of this investigation were unexpected. This isthe first study to observe a positive association between spe-cific phytoestrogens and premalignancies of the cervix. The
results of this investigation should be considered preliminaryand need to be verified in larger, prospective studies in whichHPV DNA, plasma phytoestrogens, and dietary intake, aswell as other factors such as endogenous estrogen levels, aremeasured at multiple periods in time.
Acknowledgments and Notes
This investigation was supported in part by USPHS grantsROl-CA-55700 and P30 CA-71789 and contracts NOl-CN-55424 andNOl-PC-67001 from the National Cancer Institute, NIH, Department ofHealth and Human Services. We acknowledge Dr. Nancy Kiviat of the Uni-versity of Washington for the HPV testing and genotyping. We thank LaurieJ. Custer of the Cancer Research Center of Hawaii for the LC/MS analysis ofplasma phytoestrogens and Summer Sylva and Anna Judilla of the CancerResearch Center of Hawaii for assistance in the preparation of this manu-script. Address correspondence to B. Y. Hernandez, Cancer Research Centerof Hawaii, University of Hawaii, 1236 Lauhala Street, Honolulu, Hawaii96813. Phone: (808) 586-2992. FAX: (808) 586-2982. E-mail:[email protected].
Submitted 2 December 2003; accepted in final form 12 May 2004.
References
1. Schiffman MH, Bauer HM, Hoover RN, Glass AG. Cadell DM, et al.:Epidemiologic evidence showing that human papillomavinis infectioncauses most cervical intraepithelial neoplasia. JNCI 85, 958-964,1993.
2. Franco EL, Rohan TE, and Villa LL: Epidemiologic evidence and hu-man papillomavirus infection as a necessary cause of cervical cancer.yWC/91,506-511, 1999.
3. Cuzick J, De Stavola BL, Russell MJ, and Thomas BS: Vitamin A, vi-tamin E and the risk of cervical intraepithelial neoplasia. Br J Cancer62,651-652,1990.
4. Goodman MT, Kiviat N, McDuffie K, Hankin JH, Hernandez B, et al.:The association of plasma micronutrients with the risk of cervicaldysplasia in Hawaii. Cancer Epidemiol Biomarkers Prev 7, 537-544,1998.
5. Herrero R, Potischman N, Bdnton LA, Reeves WC, Brenes MM, et al.:A case-control study of nutrient status and invasive cervical cancer. I.Dietary indicators. Am J Epidemiol 134, 1335-1346, 1991.
6. Potischman N, Brinton LA, Laiming VA, Reeves WC, Brenes MM, etal.: A case control study of serum folate levels and invasive cervicalcancer. Cancer «ei 51,4785-4789, 1991.
7. Butterworth CE Jr, Hatch KD, Macaluso M, Cole P, Sauberlich HE, etal.: Folate deficiency and cervical dysplasia. JAMA 267, 528—533,1992.
8. Hernandez BY, McDuffie K, Kamemoto L, and Goodman MT: Dietand high-grade premalignant lesions of the cervix: evidence of a pro-tective role for folate, riboflavin, thiamin, and vitamin B|2. CancerCauses Control 14, 859-870, 2003.
9. Adlercreutz H: Epidemiology of phytoestrogens. Baillieres CtinEndocrinol Metab 12,605-623, 1998.
10. Collins-Burow BM, Burow ME, Duong BN, and McLachlan JA: Es-trogenie and anti-estrogenic activities of flavonoid phytochemicalsthrough estrogen receptor binding-dependent and independent mecha-nisms. Nutr Cancer 38, 222-244, 2000.
11. Kurzer MS and Xu X: Dietary phytoestrogens. Annu Rev Nutr 17,353-381, 1997.
12. Owen RW, Giacosa A, Hull WE, Haubner R, Wurtele G, et al.: Ol-ive-oil consumption and health: the possible role of antioxidants. Lan-cet Oncol I, \01-U2, 2000.
Vol. 49, No. 2 123

13. Strauss L, Santti R, Saarinen N, Streng T, Joshi S, et al.: Dietaryphytoestrogens and their role in hormonally-dependent disease.Toxicol Utt 102-103,349-354,1998.
14. Pillow PC, Duphome CM, Chang S, Contois JH, Strom SS, et al.: De-velopment of a database for assessing dietary phytoestrogen intake.Nutr Cancer 33, 3-19, 1999.
15. Mazur W and Adlercreutz A: Overview of naturally occurring endo-crine-active substances in the human diet in relation to human health.Nutrition 16, 654-^88, 2000.
16. Ingram D, Sanders K, Kolybaba M, and Lopez D: Case-control studyof phytoestrogens and breast cancer. Lancet 350,990-994, 1997.
17. Dai Q, Franke AA, Jin F, Shu XO, Hebert JR, et al.: Urinary excretionof phytoestrogens and risk of breast cancer among Chinese women inShanghai. Cancer Epidemiol Biomarkers Prev 1, 815-821, 2002.
18. de Villiers EM: Relationship between steroid hormone contraceptivesand HPV, cervical intraepithelial neoplasia and cervical carcinoma. IntJ Cancer 103, 705-708, 2003.
19. Moreno V, Bosch FX, Munoz N, Meijer CJ, Shah KV, et al.: Effect oforal contraceptives on risk of cervical cancer in women with humanpapillomavirus infection: the I ARC multicentric case-control study.Lancet^59,1085-1092, 2002.
20. Munoz N, Franceschi S, Bosetti C, Moreno V, Herrero R, et al.: Role ofparity and human papillomavirus in cervical cancer: the IARCmulticentric case-control study. Lancet 359,1093-1101,2002.
21. Elson DA, Riley RR, Lacey A, Thordarson G, Talamantes FJ, et al.:Sensitivity of the cervical transformation zone to estrogen inducedsquamous carcinogenesis. Cancer Res 60, 1267-1275, 2000.
22. Jin L, Qi M, Chen DZ, Anderson A, Yang GP, et al.: Indole-3-carbinolprevents cervical cancer in human papillomavirus type 16 (HPV 16)transgenic mice. Cancer Res 59, 3991-3997, 1999.
23. Arbeit JM, Howley PM, and Hanahan D: Chronic estrogen-inducedcervical and vaginal squamous carcinogenesis in humanpapillomavirus type 16 transgenic mice. Proc Natl Acad Sci USA 93,2930-2935, 1996.
24. NCI Workshop: The Bethesda System for reporting cervical/vaginalcytologic diagnoses. J Am Diet Assoc 161, 931-933, 1989.
25. Hankin J: A diet history method for research, clinical and communityuse. 23rd Lenna Frances Cooper Memorial Lecture. J Am Diet Assoc86, 868-872, 1986.
26. Franke AA, Custer U , Wilkens LR, Le Marchand L, Nomura ANS, etal.: Liquid chromatographic analysis of dietary phytoestrogens fromhuman urine and blood. / Chromatogr B 777, 43-57, 2002.
27. Ting Y and Manos MM: Detection and typing of genital humanpapillomavirus. In PCR Protocol: A Guide to Methods and Applica-tions, Innis MA, Gelfond DH, Sninsky JJ, and White TJ (eds). SanDiego, CA: Academic Press, 1990, pp 356-367.
28. Snedecor GW and Cochran WG: Statistical Methods. Ames, IA: IowaState University Press, 1967.
29. Breslow NE and Day E: Statistical Methods in Cancer Research, vol 1.Lyon, France: International Agency for Cancer Research, 1980.
30. Knight DC and Eden JA: A review of the clinical effects ofphytoestrogens. Obstet Gynecol 87, 897-904, 1996.
31. Thompson LU, Robb P, Serraino M, and Cheung F: Mammalian lignanproduction from various foods. Nutr Cancer 16,43-52, 1991.
32. Rowland I, Faughnan M, Hoey L, Wahala K, Williamson G, et al.:Bioavailability of phyto-oestrogens. Br J Nutr 89 Suppl, 45S-58S,2003.
33. Rowland I, Wiseman H, Sanders TA, Adlercreutz H, and Bowey EA:Interindividual variation in metabolism of soy isoflavones and lignans:influence of habitual diet on equol production by the gut microflora.Nutr Cancer?^, 27-32, 2000.
34. Adlercreutz CHT, Goldin BR, Gorbach SL, Hockerstedt KAV,Watanabe S, et al.: Soybean phytoestrogen intake and cancer risk. JNutr 125 Suppl, lil^llQS, 1995.
35. Kuiper GGJM, Lemmen JG, Carlsson B, Corton JC, Safe SH, et al.: In-teraction of estrogenic chemicals and phytoestrogens with estrogen re-ceptor beta. Endocrinology 139,4252-4263, 1998.
36. Zava DT and Duwe G: Estrogenic and antiproliferative properties ofgenistein and other flavonoids in human breast cancer cells in vitro.Nutr Cancer 27, 31^0, 1997.
37. Newfield L, Bradlow HL, Sepkovic DW, and Aubom K: Estrogen me-tabolism and the malignant potential of human papillomavirus immor-talized keratinocytes. Proc Soc Exp Biol Med 217, 322-326, 1998.
38. Kim CJ, Um SJ, Kim TY, Kim EJ, Park TC, et al.: Regulation of cellgrowth and HPV genes by exogenous estrogen in cervical cancer cells.Int J Gynecol Cancer 10, 157-164, 2000.
39. Chen YH, Huang LH, and Chen TM: Differential effects of progestinsand estrogens on long control regions of human papillomavirus types16 and 18. Biochem Biophys Res Commun 224, 651-659, 1996.
40. Mitrani-Rosenbaum S, Tsvieli R, and Tur-Kaspa R: Oestrogen stimu-lates differential transcription of human papillomavirus type 16 inSiHa cervical carcinoma cells. J Gen Virol 70, 2227-2232, 1989.
41. Yuan F, Chen D-Z, Liu K, Sepkovic DW, Bradlow HL, et al.:Antiestrogenic activities of indole-3-carbinol in cervical cells: impli-cation for the prevention of cervical cancer. Anticancer Res 13,337-342, 1993.
42. Von knebel DM, Spitkovsky D, and Ridder R: Interactions betweensteroid hormones and viral oncogenes in the pathogenesis of cervicalcancer. Ver hand lungen Deutschen Gesellschaft Pathol 813,233-239,1997.
43. Aubom KJ, Woodworth C, Di Paolo JA, and Bradlow HL: The interac-tion between HPV infection and estrogen metabolism in cervicalcarcinogenesis. Int J Cancer 49, 867-869, 1991.
44. Miksicek RJ: Interaction of naturally occurring nonsteroidal estrogenswith expressed recombinant human estrogen receptor. / SteroidBiochem Mol Biol 49, 153-160, 1994.
45. Gorodeski GI and Pal D: Involvement of estrogen receptors alpha andbeta in the regulation of cervical permeability. Am J Physiol CellPhysiol 278,689-696, 2000.
46. Kuiper GG, Carlsson B, Grandien K, Enmark E, Haggblad J, et al.: Acomparison of ligand binding specificity and transcript tissue distribu-tion of estrogen receptors alpha and beta. Endocrinology 138,863-870, 1997.
47. Mousavi Y and Adlercreutz H: Enterolactone and estradiol inhibiteach other's proliferative effects on MCF-7 breast cancer cells in cul-ture. J Steroid Biochem Mol Biol 41,615-619, 1992.
48. Horn-Ross PL, Lee M, John EM, and Koo J: Sources of phytoestrogenexposure among non-Asian women in California, USA. CancerCauses Control 11, 299-302, 2000.
49. Castle PE, Wacholder S, Lorincz AT, Scott DR, Sherman ME, et al.: Aprospective study of high-grade cervical neoplasia risk among humanpapillomavirus-infected women. JNCI94, 1406-1414, 2002.
50. Ho GY, Burk RD, Klein S, Kadish AS, Chang CJ, et al.: Persistent gen-ital human papillomavirus infection as a risk factor for persistent cervi-cal dysplasia. JNCISl, 1365-1371, 1995.
124 Nutrition and Cancer 2004

Copyright © 2022 FDOKUMEN