Report Studio Professional Authoring User Guide - IIS Windows Server
714
IBM ® Cognos ® 8 Business Intelligence REPORT STUDIO PROFESSIONAL AUTHORING USER GUIDE
-
Upload
khangminh22 -
Category
Documents
-
view
0 -
download
0
Transcript of Report Studio Professional Authoring User Guide - IIS Windows Server

IBM® Cognos® 8 Business Intelligence
REPORT STUDIO
PROFESSIONAL AUTHORING USER GUIDE
Product InformationThis document applies to IBM® Cognos® 8 Version 8.4 and may also apply to subsequent releases. To check for newer versions of this document,visit the IBM Cognos Resource Center (http://www.ibm.com/software/data/support/cognos_crc.html).
CopyrightCopyright © 2008 Cognos ULC (formerly Cognos Incorporated). Cognos ULC is an IBM Company.Portions of Cognos ULC software products are protected by one or more of the following U.S. Patents: 6,609,123 B1; 6,611,838 B1; 6,662,188B1; 6,728,697 B2; 6,741,982 B2; 6,763,520 B1; 6,768,995 B2; 6,782,378 B2; 6,847,973 B2; 6,907,428 B2; 6,853,375 B2; 6,986,135 B2;6,995,768 B2; 7,062,479 B2; 7,072,822 B2; 7,111,007 B2; 7,130,822 B1; 7,155,398 B2; 7,171,425 B2; 7,185,016 B1; 7,213,199 B2; 7,243,106B2; 7,257,612 B2; 7,275,211 B2; 7,281,047 B2; 7,293,008 B2; 7,296,040 B2; 7,318,058 B2; 7,325,003 B2; 7,333,995 B2.Cognos and the Cognos logo are trademarks of Cognos ULC (formerly Cognos Incorporated) in the United States and/or other countries. IBMand the IBM logo are trademarks of International Business Machines Corporation in the United States, or other countries or both. Java andall Java-based trademarks are trademarks of Sun Microsystems, Inc. in the United States, other countries, or both. Other company, product,or service names may be trademarks or service marks of others.While every attempt has been made to ensure that the information in this document is accurate and complete, some typographical errors ortechnical inaccuracies may exist. Cognos does not accept responsibility for any kind of loss resulting from the use of information containedin this document.This document shows the publication date. The information contained in this document is subject to change without notice. Any improvementsor changes to the information contained in this document will be documented in subsequent editions.U.S. Government Restricted Rights. The software and accompanying materials are provided with Restricted Rights. Use, duplication, or dis-closure by the Government is subject to the restrictions in subparagraph (C)(1)(ii) of the Rights in Technical Data and Computer clause atDFARS 252.227-7013, or subparagraphs (C)(1) and (2) of the Commercial Computer Software - Restricted Rights at 48CFR52.227 as applicable.The Contractor is Cognos Corporation, 15 Wayside Road, Burlington, MA 01803.This document contains proprietary information of Cognos. All rights are reserved. No part of this document may be copied, photocopied,reproduced, stored in a retrieval system, transmitted in any form or by any means, or translated into another language without the priorwritten consent of Cognos.
Table of Contents
Introduction 27
Chapter 1: What's New? 29New Features in Version 8.4 29
Enhanced Drill-through Capabilities 29New Chart Types 29Extended Suppression Capabilities 30Crosstab Measures Can be Formatted Based on Other Crosstab Measures 30New Color Palettes for Charts 30Enhanced Report Graphics 30Synchronized Drilling Up and Drilling Down with Multiple Queries 30Lineage Information for Data 31Access to the IBM® WebSphere® Business Glossary 31
Extended Support for Dimensionally-modeled Relational Data Sources 31Support for Multiple Hierarchies per Dimension for IBM Cognos and SSAS Cubes 31Intersections (Tuples) Can Include Calculated Members and Measures 32New Query Properties 32
Changed Features in Version 8.4 32Shared Queries Between Lists and Repeaters 32Editing SQL 32
What's New in Version 8.3 32New Features in Version 8.3 33Changed Features in Version 8.3 37Deprecated Features in Version 8.3 41
Chapter 2: Understanding Report Studio 43Building IBM Cognos 8 Applications 43Relational vs. Dimensional Reporting Styles 44The User Interface 46Report Layout and Queries 50
Layout 50Queries 51
Report Objects 51Find Objects in a Report 53
Options 53Web Browser Settings 56Professional Authoring Mode vs. Express Authoring Mode 56
Change Authoring Modes 57The IBM Cognos 8 SDK 57
Chapter 3: Creating a Report 59Creating a Basic Report 59
Specify the Data Package 59Choose a Basic Report Layout 60Add Data 61
Professional Authoring User Guide 3
Validate a Report 63Save a Report 64Run a Report 65Set PDF Page Options 70
Creating Accessible Reports 71View Lineage Information for a Data Item 71Access the IBM® WebSphere® Business Glossary 74
Creating Reports for IBM Cognos 8 Go! Office 74Creating Reports for Mobile Devices 76
Chapter 4: Lists 77Set List Properties 77Limitations When Using Set Expressions in List Reports 78Using Repeaters 79
Convert a List into a Repeater 79Example - Create Mailing Labels 80
Chapter 5: Crosstabs 83Crosstab Nodes and Crosstab Node Members 84
Moving Crosstab Nodes 84Crosstab Node Creation Option 85
Set Crosstab Properties 85Create a Single-Edge Crosstab 87Create a Nested Crosstab 87Specify the Default Measure 88Swap Columns and Rows 89Indent Data 89Change a List into a Crosstab 90Example - Add Aggregate Data to a Crosstab 90Example - Create a Discontinuous Crosstab 91
Chapter 6: Charts 93Creating Charts 93Chart Types 94
Choosing a Chart Type and Configuration 96Microcharts 96Pie Charts 97Column Charts 98Marimekko Charts 98Progressive Column Charts 99Pareto Charts 99Win-loss Charts 100Bar Charts 100Line Charts 101Area Charts 102Combination Charts 102Radar Charts 103Scatter Charts 103Bubble Charts 104Point Charts 105
4 Report Studio
Table of Contents
Quadrant Charts 105Polar Charts 106Metrics Range Charts 106Gauge Charts 107Chart Configurations 108
Example - Create a Column Chart to Plot Order Trends 110Set Chart Properties 111Insert a Microchart into a Crosstab 114
Example - Insert a Line Microchart 114Create a Win-Loss Chart 115
Example - Create a Win-Loss Chart 116Show Data Points or Value Markers 117Customize the Colors of a Chart 118
Example - Customize the Palette in the Order Trends Chart 118Change a Chart Background 119
Example - Change the Background of the Order Trends Chart 120Add a Baseline to a Chart 120
Example - Add a Baseline to the Order Trends Chart 122Customize the Lines in a Chart 123Add a Marker to a Chart 124Add a Note to a Chart 125
Example - Add a Note to the Order Trends Chart 126Example - Format the Axis Values of the Order Trends Chart 127Example - Create a Drill-through Chart 127
Specify Custom Label Text 129Specify the Properties of a Gauge Chart 130Create a Drill-up and Drill-down Chart 130Example - Show Values in the Chart Legend 131Define Query Context When Customizing Legend Entries, Legend Titles, or Axis Labels 132Example - Customize the Axis Titles 133Example - Create a Conditional Palette 135
Chapter 7: Maps 137The Report Studio Map Object 137Example - Create a Map Report 139Set Map Properties 140Example - Define Data Values for the Region Layer 142Match Data Values to Names in the Map File 142Define Data Values for the Point Layer 143Add Colors to the Region or Point Layer 144Add a Legend Title 144Add a Note to a Map 145Drill Through to Another Report From a Map 146Edit a Map 147Additional Maps 147Location Intelligence 147
Chapter 8: Relational Reporting Style 149Add Relational Data to a Report 149Grouping Relational Data 150
Professional Authoring User Guide 5
Table of Contents
Perform Advanced Grouping 151Set the Group Span for a Column 152Divide Data into Sections 154
Summarizing Data Relationally 156Add a Simple Summary 157Set the Auto Group & Summarize Property 158Specify Detail or Summary Aggregation in the Model 158Specify Aggregation Properties for a Data Item 158Use Summary Functions in Data Item Expressions 159Summary Functions 160
Focusing Relational Data 165Create a Detail or Summary Filter 165
Sorting Relational Data 170Perform Advanced Layout Sorting 171
Working with Relational Queries 171Specify a List of Data Items for an Object 172Relate a Query to a Layout 172Connecting Queries Between Different Data Sources 173Multiple-fact Queries 173Add a Query to a Relational Report 176Create a Union Query 177Create a Join Relationship 180Reference a Package Item in a Child Query 181Create a Master Detail Relationship 182Working with Queries in SQL 184
Using Relational Calculations 187Units of Measures 188
Chapter 9: Dimensional Reporting Style 189Add Dimensional Data to a Report 189
Insert Members 191Create a Set of Members 192Insert a Hierarchy 192Insert a Member Property 193Nest Members 193Search for Members 194Extended Data Items 194Tips for Working with Ragged or Unbalanced Hierarchies 195Limited Support for Relational Functions When Used with OLAP Data Sources 196Customize Your Source Tree 196
Summarizing Data Dimensionally 197Add a Simple Summary 198Specify the Aggregation Mode 199Aggregating Values in Crosstabs 199Aggregating Member Sets 202Limitations When Summarizing Measures in Dimensionally-modeled Relational (DMR)
Data Sources 202Summary Functions 203
Focusing Dimensional Data 208
6 Report Studio
Table of Contents
Create a Context Filter 208Limitations When Filtering Dimensional Data Sources 210Define a Prompts Using a Context Filter 211
Sorting Dimensional Data 211Perform Advanced Set Sorting 213
Working with Dimensional Queries 213Specify a List of Data Items for an Object 213Relate a Query to a Layout 214Using Dimensional Data Sources with Queries 214Connecting Queries Between Different Data Sources 215Multiple-fact Queries 215Add a Query to a Dimensional Report 218Add Dimension Information to a Query 219Create a Master Detail Relationship 221Working with Queries in SQL or MDX 224Example - Create a Dynamic Report That Shows Period-to-date Data 228
Using Dimensional Calculations 230Create a Simple Member Calculation 231Create a Layout Calculation 232Insert a Calculated Member or Measure 232Create a Set Expression 234Create an Intersection (Tuple) 235Intersecting Calculations in Crosstabs and Charts 235
Drilling Up and Drilling Down in Dimensional Reports 238Member Sets 238Create a Drill-up/Drill-down Report 239
Chapter 10: Using the Expression Editor 245Dimensional Coercion Rules 247
Coercion Rules for Dimensional Objects 249Coercion Rules for Numeric and String Values 250Coercion Paths 250
Browse or Search the Values of a Data Item 251Searching for Values May Return Unexpected Results 252
Using Quotation Marks in Literal Strings 252Recommendation - Use Member Unique Name (MUN) Aliases 252
Running a Report That Contains Members 252Functions Not Available When Creating a Report or Layout Expression 253
Concatenating Strings 253Limitations for Specific Data Sources 253
Creating Expressions Using SAP BW Data Sources 253Using Excel Functions with SSAS 2005 Data Sources 254
Expression Components 254Operators 255Summaries 262Member Summaries 273Constants 276Constructs 278Business Date/Time Functions 279
Professional Authoring User Guide 7
Table of Contents
Block Functions 283Macro Functions 284Common Functions 294DB2 311Informix 325MS Access 330Oracle 337Red Brick 345SQL Server 350Teradata 357SAP BW 362Sybase 364Report Functions 371
Chapter 11: Adding Prompts to Filter Data 391Use the Build Prompt Page Tool 391Build Your Own Prompt and Prompt Page 392
Example - Create a Report Showing Products Shipped for a Specific Time Interval 395Create a Parameter to Produce a Prompt 397Create a Prompt Directly in a Report Page 398Modifying Prompts 399
Change the Prompt Control Interface 399Specify That a Prompt Requires User Input 399Allow Users to Select Multiple Values in a Prompt 400Show or Hide Prompt Status 401Specify a Default Selection for a Prompt 401Specify Prompt Values 401Add a Prompt Button 402Create a Cascading Prompt 403
Control the Data That Appears in a Tree Prompt 404
Chapter 12: Laying Out a Report 405Report Layout Recommendations 405The Page Structure View 406Copy Object Formatting 407Add a Header or Footer to a Report 407Add Borders to an Object 409Add a Text Item to a Report 409Specify the Report Font 410Insert an Image in a Report 410
Insert a Background Image in an Object 410Use Visual Effects 411Insert a Formatting Object in a Report 413
Elements Supported in Rich Text Items 415Example - Add a Multimedia File to a Report 416
Rolling and Moving Averages 416Show Data for Specific Time Periods 417Align an Object in a Report 417Use a Table to Control Where Objects Appear 418
Apply a Table Style 418
8 Report Studio
Table of Contents
Apply Padding to an Object 419Set Margins for an Object 419Add Multiple Items to a Single Column 420
Example - Create a Report with Multiple Items in One Column 420Reuse a Layout Object 422
Change a Reused Object 423Update Reused Objects 424
Specify Text Flow in an Object 424Specify Line Spacing and Breaking 425Specify the Height and Width of an Object 426Control How Other Objects Flow Around an Object 426Specify Report Properties 427Create and Modify Object Styles 428
Modify Classes to Format Query Studio Reports 429Modifying the Default Layout Style Sheet 430
Add Color to an Object 430
Chapter 13: Using Conditions 431Highlight Data Using a Conditional Style 431
Manage Conditional Styles 434Example - Add a Conditional Style to an Existing Report 434
Highlight Data Using a Style Variable 435Adding Conditional Rendering to a Report 436
Add a Variable 437Hide or Show an Object 438Add Conditional Rendering 439Example - Create a Conditional Report 440Add Multiple Layouts 442Creating Multilingual Reports 442Create a Multilingual Report in Report Studio 444
Chapter 14: Bursting Reports 445Defining Burst Recipients 445
Create a Calculated Field 445Creating a Burst Table 446
Specify a Burst Group 448Set Burst Options 448Enable Bursting 449Creating Burst Reports Using Dimensional Data Sources 450Example - Burst a Report 451
Chapter 15: Format Data 453Set the Default Data Formats 453Specifying the Number of Decimals in Numbers 454Specify the Data Format for an Object 454Locale-sensitive Properties 455Suppress Empty Cells 456
Limitations When Formatting Empty Cells in SAP BW Data Sources 456Example - Suppress Zeros in Rows and Columns in an Existing Report 456
Specify What Appears for Data Containers that Contain No Data 457
Professional Authoring User Guide 9
Table of Contents
Using Patterns to Format Data 458Pattern Guidelines 458Date and Time Symbols 459Decimal Format Symbols 466
Chapter 16: Using Query Macros 469Add a Query Macro 469Creating Prompts Using Query Macros 470
Example - Select a Country Prompt 472
Chapter 17: Using Drill-through Access 473Understanding Drill-through Concepts 474
Drill-through Paths 474Selection Contexts 475Drilling Through to Different Report Formats 475Drilling Through Between Packages 476Bookmark References 476Members and Values 477Member Unique Names 477Conformed Dimensions 478Business Keys 479Scope 479Mapped Parameters 480Drilling Through on Dates Between PowerCubes and Relational Packages 480
Set Up Drill-through Access in a Report 481Specify the Drill-through Text 484Example - Drill Through to a Hidden Report from a Report Studio Report 485Try It Yourself - Create a Report with Drill-through Access to Itself 487Drilling Through from IBM Cognos Series 7 to IBM Cognos 8 491Setting Up Drill-through Access from IBM Cognos Visualizer 491Setting Up Drill-through Access from PowerPlay Web 491Create and Test the Target for a Series 7 Report 491
Chapter 18: Working with Multiple Pages 493Add a Page to a Report 493Create a Page Break or Page Set 494Join Nested Page Sets 495Example - Preparing a Product List Report 496Add a Bookmark 498Create a Table of Contents 500
Example - Add a Table of Contents to a Report 501Insert Page Numbers in a Report 503Control Page Breaks and Page Numbering 503Create Page Layers 506
Chapter 19: Creating Report Templates 507Convert a Report to a Template 507Create a New Template 507
Chapter 20: Managing Existing Reports 509Open and Save a Report Locally 509
10 Report Studio
Table of Contents
Open a Report from the Clipboard 510Open a File from Another Studio 510
Analysis Studio Query Specification 510Managing Changes in the Package 515
Update a Name Reference 515Change the Package 516
Chapter 21: Upgrading Reports 517Upgrading Reports from IBM Cognos 8 Version 8.1 or 8.2 517
Product Behavior After Upgrade 517Members Containing No Data Are Not Suppressed for SAP BW 517Thousands Separators Missing 518
Upgrading Reports from IBM Cognos ReportNet 518Undocumented and Unsupported Features 518No Sort Order 518Layout Errors 518Report Format 518Customized Style Sheets 519PDF Reports 519IF-THEN-ELSE Statements 519Solve Order 519Chart Behavior 519Database Only Processing of Queries 519Changes in the Behavior of Count Between IBM Cognos ReportNet® 1.1 and IBM
Cognos 8 519
Chapter 22: Sample Reports and Packages 521The Great Outdoors Company Samples 521The Great Outdoors Group of Companies 522Employees 523Sales and Marketing 524Great Outdoors Database, Models, and Packages 524Samples in the Sales and Marketing (Cube) Package 527
Actual vs. Planned Revenue 527Historical Revenue 527Revenue by Date Range 528Revenue by Product Brand (2005) 528Same Month Prior Year 528Selected Retailer Country 529Top Retailers by Country 529
Samples in the GO Data Warehouse (analysis) Package 529Budget vs. Actual 529Customer Returns and Satisfaction 530Employee Satisfaction 2006 530Employee Training by Year 531Eyewear Revenue by Brand and Size 531Global Bonus Report 531GO Balance Sheet as at Dec 31 2006 532Great Outdoors Company Balance Sheet as at Dec 31 2006 532Manager Profile 532
Professional Authoring User Guide 11
Table of Contents
Planned Headcount 532Positions to Fill 533Promotion Success 533Quantity Sold vs. Shipped and Inventory 533Recruitment Report 534Return Quantity by Order Method 534Returned Items 534Returns by Damage, Failed Orders and Complaints in 2006 534Returns by Failed Orders in 2006 535Returns by Order Method 535Revenue by GO Subsidiary 2005 535Sales Commissions for Central Europe 536Sales Growth Year Over Year 536Succession Report 537Top 10 Retailers for 2005 537
Samples in the GO Data Warehouse (query) Package 537Bursted Sales Performance Report 538Employee Expenses 538Health Insurance 538Pension Plan 538Regular Salary 538TOC Report 539Total Revenue by Country 539
Samples in the GO Sales (analysis) Package 5392005 Quarterly Sales Forecast 5392005 Sales Summary 540Briefing Book 540Horizontal Pagination 540No Data 541PDF Page Properties 541Singletons on Page Body 541Table of Contents 541
Samples in the GO Sales (query) Package 542Order Invoices - Donald Chow, Sales Person 542
Interactive Samples 542Bursted Sales Performance Report 542Recruitment Report 543Revenue by GO Subsidiary 2005 543Rolling and Moving Averages 544
Chapter 23: Limitations When Producing Reports in Microsoft Excel Format 545Unable to Load Images from the IBM Cognos 8 Content Store in a Report 545Blank Worksheet Is Opened 545Warning Message Appears When Excel Opens an IBM Cognos 8 Report 545Error Message Appears in an Excel 2000 Single Sheet Report 545Spreadsheet Content Not Saved for Reports Saved in XLS Format 546Unable to Load Excel Report in Netscape 7.01 546Unable to Nest Labels in Charts 546Data Series Are Truncated 546
12 Report Studio
Table of Contents
Colors in Excel Different From Those in HTML or PDF 546Repeating Pie Charts 546Unable to Skip Discrete Axis Labels 547Unsupported IBM Cognos 8 Formatting 547Cell Contains Series of # 548Excel Cannot Render Reports with More Than 256 Columns 548Table and Column Width 548Secure Socket Layer (SSL) Is Not Supported in Some Excel Formats and Versions 548Number Format Becomes Currency Format in Japanese Excel 549Report Shows Data in Wrong Columns 549Unable to Access a Report on a Remote Server 549Drill-through Reports Are Not Supported in Excel 549Map Reports Are Not Supported in Excel 549Unsupported Excel Formatting 549Hyperlink Buttons Are Not Supported in Excel 550Unable to View Reports in Excel Format Sent as Email Attachments 550Unsupported Chart Properties in Excel 550Unsupported Chart Types in Excel 551
Chapter 24: Report Studio Object and Property Reference 553Report Studio Objects 553
3-D Area 5533-D Bar 5533-D Combination Chart 5543-D Line 5543-D Scatter Chart 554Angular Axis 554Angular Measure 555Area 555As of Time Expression 555Axis Title 555Bar 555Baseline 555Baseline 556Baseline 556Baseline 556Block 556Bookmark 557Bubble Chart 557Bubble Measure 557Calculated Measure 557Calculated Member 558Calculated Member 558Caption 558Chart Body 558Chart Footer 558Chart Node Member 558Chart Subtitle 559Chart Text Item 559
Professional Authoring User Guide 13
Table of Contents
Chart Title 559Class 559Combination Chart 559Component Override 560Conditional Block 560Conditional Block 560Context Item Text 560Crosstab 561Crosstab Columns 561Crosstab Columns 561Crosstab Corner 561Crosstab Fact Cells 562Crosstab Intersection 562Crosstab Member Fact Cells 562Crosstab Node Member 563Crosstab Rows 563Crosstab Rows 563Crosstab Space 563Cumulation Line 564Cumulation Line Axis 564Cumulation Line Label 564Data Item 564Date 564Date & Time Prompt 565Date Prompt 565Default Measure 565Detail Filter 565Dimension 565Display Layer 566Explicit Member Set 566Fact 566Field Set 566Gauge Chart 566Gauge Labels 567Gauge Numerical Axis 567Generated Prompt 567Hierarchy Set 567HTML Item 567Hyperlink 568Hyperlink Button 568Image 568Intersection (Tuple) 568Interval Prompt 569Join 569Key 569Layout Component Reference 569Legend 569Legend Title 570Level 570
14 Report Studio
Table of Contents
Level Hierarchy 570Level Set 570Line 570List 570List Cell 571List Column 571List Column Body 571List Columns 572List Columns 572List Columns Body Style 572List Columns Title Style 572List Column Title 572List Footer 573List Header 573List Page Footer 573List Page Header 573List Row 573List Row Cells Style 574Map 574Map Location 574Map Location 574Map Refinement Location 574Map Refinement Location 575Marimekko Chart 575Marker 575Marker 575MDX 576Measure 576Member 576Member Children Set 576Member Hierarchy 576Member Property 576Member Property 577Member Set 577Metrics Range Chart 577Metric Studio Diagram 577Named Set 577Note 578Note Content 578Numerical Axis 578Numerical Axis 578Ordinal Axis 578Page 578Page Body 579Page Break Text 579Page Footer 579Page Header 579Page Number 579Page Set 580
Professional Authoring User Guide 15
Table of Contents
Pareto Chart 580Pie Chart 580Pie Labels 580Point Color Legend Title 581Point Layer 581Point Measure 581Point Size Legend Title 581Point Size Measure 581Polar Chart 581Progressive Chart 582Prompt Button 582Query 582Query Operation 583Query Reference 583Radar Chart 583Radial Axis 583Radial Measure 583Region Color Legend Title 584Region Layer 584Region Measure 584Regression Line 584Repeater 584Repeater Table 584Repeater Table Cell 585Rich Text Item 585Row Number 585Scatter Chart 585Select & Search Prompt 586Set Expression 586Singleton 586Slicer Member Set 586SQL 586Summary Filter 587Table 587Table Cell 587Table of Contents 587Table of Contents Entry 587Table Row 588Target Measure 588Text Box Prompt 588Text Item 588Time 588Time Prompt 589Tolerance Measure 589Total Column 589Total Column Label 589Tree Prompt 589Value Prompt 590Variable 590
16 Report Studio
Table of Contents
Win-Loss Chart 590Win-Loss Measure 590X Axis 590X Axis 591X Axis Measure 591Y1 Axis 591Y2 Axis 591Y Axis 591Y Axis 592Y Axis Measure 592Z Axis 592Z Axis 592Z Axis Measure 592
Report Studio Properties 5933-D Viewing Angle 593Absolute Position 593Across 593Aggregate Function 593Allow 45° Rotation 594Allow 90° Rotation 594Allow Skip 594Allow Stagger 594Allow Ties 594Angular Axis 594Application 595Apply Single Class 595Auto Group & Summarize 595Auto-Sort 595Auto-Submit 595Auto Truncation 596Avoid Division by Zero 596Avoid Label Collision 596Axis Assignment 596Axis Assignment 596Axis Labels 596Axis Line 597Axis Title 597Background Color 597Background Image 597Bar, Line, or Area Index 598Baselines 598Block Variable 598Border 598Border Color 599Borders 599Bottom Position (px) 599Bottom Position (px) 599Box Type 599Box Type 600
Professional Authoring User Guide 17
Table of Contents
Bubble Size 600Calculation Intersection 600Calendar Type 600Caption 600Caption 601Cardinality 601Cascade Source 601Case Insensitive 601Catalog 601Chart Orientation 601Chart Type 601Chart Type 602Classes 602Clock Mode 602Color Legend Title 602Color Legend Title 603Column Coordinate 603Column Titles 603Component Reference 603Component Reference 603Conditional Palette 603Conditional Styles 604Connecting Lines 604Contents Height 604Cross Product Allowed 605Cumulation Axis 605Cumulation Label 605Cumulative Line 605Current Block 605Custom Label 605Data Format 605Data Item 606Data Item 606Data Item Label 606Data Item Label 606Data Item Label 606Data Item Label 607Data Item Value 607Data Item Value 607Data Item Value 607Data Item Value 607Data Item Value 608Data Item Value 608Data Language 608Data Source 608Default Measure 608Default Selections 608Default Title 609Define Contents 609
18 Report Studio
Table of Contents

Define Member Sets 609Depth 609Description 609Detail 609Diagram Identifier 610Dial Outline Color 610Dictionary 610Dimension 610Display After Overall Header 610Display Frequency 610Display Milliseconds 611Display Seconds 611Display Value 611Down 611Drill-Through Definitions 611Drop Shadow 611Duplicates 612Embed 612Execution Method 612Execution Optimization 612Expand Features 612Expression 613Expression 613Expression 613Expression 613Face Color 613Fact Cells Precedence 614Fill Effects 614First Column Color 614First Date 614First Label Index 614Floating 614Font 615Font Auto-Sizing 615Footer 615Foreground Color 616Gauge Labels 616Gauge Palette 616Generated Background Image 616Generated SQL 617Gradient 617Gridlines 617Grouping & Sorting 617Grouping Type 617Group Span 617Has Fact Cells 618Heading Level 618Height (px) 618Hide Adornments 618
Professional Authoring User Guide 19
Table of Contents
Hide Text 618Hierarchy 618Hierarchy Unique Name 619Hole Size (%) 619Horizontal Alignment 619HTML 619HTML Source Variable 620Ignore Data with No Features 620Include Zero For Auto Scale 620Join Relationships 620Label 620Label 621Label 621Label 621Label 621Label 621Label Control 621Labels 622Labels 622Last Date 622Left Position (px) 622Left Position (px) 622Legend 622Legend Label 623Legend Title 623Level 623Level Indentation 623Level Unique Name 623Line 624Line Style 624Line Styles 624Line Type 624Line Weight (pt) 624Loss Color 624Map & Layers 624Map Drills 625Margin 625Marimekko Totals 625Marker Color 625Marker Color 625Marker Label 625Markers 626Marker Shape 626Marker Size (pt) 626Marker Text Location 626Master Detail Relationships 626Maximum Characters 626Maximum Execution Time 627Maximum Hotspots 627
20 Report Studio
Table of Contents
Maximum Rows Retrieved 627Maximum Size (pt) 627Maximum Tables 627Maximum Text Blob Characters 628Maximum Truncation Characters 628Maximum Value 628MDX 628Member 628Member Offset (%) 629Members 629Members 629Member Unique Name 629Minimum Size (pt) 629Minimum Value 630Minor Gridlines 630Multi-Line 630Multi-Select 630Name 630Name 631Name 631Name 631Name 631Name 632Negative Column Color 632No Data Contents 632No Data Features Size (pt) 632Node Coordinate 632Note Border 632Notes 633Number of Regression Lines 633Numbers Only 633Number Style 633Numerical Axis 633Numerical Axis 633Numeric Value 634Numeric Value 634Ordinal Axis 634Outer Join Allowed 634Override Dimension Info 634Overrides 634Padding 634Pagination 635Palette 635Palette 635Parameter 635Pareto Axis 636PDF Page Setup 636Percentile 636Percent of Axis 636
Professional Authoring User Guide 21
Table of Contents
Performance Pattern 636Pie Labels 636Point Shape 636Polynomial Exponent 637Position 637Position type 637Position type 637Position type 637Positive Column Color 637Pre-populate 638Pre-populate Levels 638Pre-Sort 638Processing 638Progressive Axis 638Projection List 638Properties 639Property 639Property Unique Name 639Push To Bottom 639Query 639Radar Type 640Radial Axis 640Range 640Range Label 640Regression Line 640Regression Type 641Relative Alignment 641Render Fact Cells 641Render Page when Empty 641Render Variable 641Repeater Direction 642Report Expression 642Report Expression 642Report Expression 642Report Expression 642Report Expression 643Report Expression 643Report Expression 643Report Expression 643Report Expression 643Required 643Right Position (px) 644Rollup Aggregate Function 644Rollup Processing 644Root Members Only 644Rotate Values 645Row Coordinate 645Rows Per Page 645Scale 645
22 Report Studio
Table of Contents
Scale Interval 645Scope 645Select UI 646Separator 646Series Color 646Set Operation 646Set Sorting 646Share Result Set 646Show Caption 647Show Data Points 647Show Data Range in Legend 647Show Features with No Data 647Show Feelers 647Show Legend Values 647Size & Overflow 648Size Legend Title 648Solve Order 648Sorting 648Source Type 648Source Type 649Source Type 649Source Type 649Spacing & Breaking 649Spider Effects 650SQL 650SQL Join Syntax 650SQL Syntax 650Standard Deviations 650Static Choices 650Style Variable 651Subtitle 651Suppress 651Suppression 652Table of Contents 652Table of Contents Name 652Table Properties 652Target Color 652Target Marker 652Target Marker Border Color 652Target Marker Position 653Target Range (%) 653Text 653Text Flow & Justification 653Text Source Variable 653Title 654Tolerance Color 654Tolerance Label 654Tooltips 654Top Position (px) 654
Professional Authoring User Guide 23
Table of Contents
Total Column 654Total Column Color 655Truncation 655Truncation Text 655Type 655Type 655Type 655Upper Range Skew (%) 656URL 656URL Source Variable 656Usage 656Use 1.x Behavior 656Use Aggregate Cache 657Use Detail Value on Page 657Use for Parameter Info 657Use Local Cache 657User SAP Member Cache 657Use Same Range For All Instances 658Use SAP MUN as Business Key 658Use SQL Parameters 658Use SQL With Clause 658Use Thousands Separator 658Use Value 658Use Value 659Value Location 659Value Representation 659Values 659Values 659Values 659Value Type 660Vertical Alignment 660Visible 660Visual Angle 660White Space 660Width (px) 661Win Color 661Win-Loss Threshold 661X Axis 661Y1 Axis 661Y2 Axis 661Y2 Axis Position 662Y Axis 662
Data Formatting Properties 662"Not Applicable" Characters 662Any Error Characters 662Calendar Type 662Clock 662Currency 663Currency Display 663
24 Report Studio
Table of Contents
Currency Symbol 663Currency Symbol Position 663Date Ordering 663Date Separator 663Date Style 663Decimal Separator 663Display AM / PM Symbols 663Display As Exponent 664Display Days 664Display Eras 664Display Hours 664Display Milliseconds 664Display Minutes 664Display Months 664Display Months 664Display Seconds 664Display Time Zone 664Display Weekdays 665Display Years 665Display Years 665Divide By Zero Characters 665Exponent Symbol 665Group Size (digits) 665International Currency Symbol 665Mantissa (digits) 665Maximum No. of Digits 665Minimum No. of Digits 666Missing Value Characters 666Negative Pattern 666Negative Sign Position 666Negative Sign Symbol 666No. of Decimal Places 666Numeric Overflow Characters 666Padding Character 666Pattern 666Percentage Symbol 667Percent Scale (integer) 667Scale 667Secondary Group Size (digits) 667Security Error Characters 667Thousands Separator 667Time Separator 667Time Style 667Time Unit 668Use Thousands Separator 668Zero Value Characters 668
Appendix A: Troubleshooting 669Problems Creating Reports 669
Professional Authoring User Guide 25
Table of Contents
Division by Zero Operation Appears Differently in Lists and Crosstabs 669Application Error Appears When Upgrading a Report 669Nested List Report Containing a Data Item That is Grouped More Than Once Does Not
Run After Upgrade 669Background Color in Template Does not Appear 670Subtotals in Grouped Lists 670Chart Labels Overwrite One Another 670Chart Shows Only Every Second Label 670Chart Gradient Backgrounds Appear Gray 671Metadata Change in Essbase Not Reflected in Reports and in the Studios 671Relationships Not Maintained in a Report With Overlapping Set Levels 671Count Summaries in Query Calculations Include Nulls with SAP BW Data Sources 672Creating Sections on Reports That Access SAP BW Data Sources 672Saving a Report Takes a Long Time 672Error Characters (--) Appear in Reports 673Columns, Rows, or Data Disappear With SSAS 2005 Cubes 673Descendants Function Unreliable with Sets 674Report Differences Between TM1 Executive Viewer and IBM Cognos 8 with TM1 Data
Sources 674Order of Metadata Tree Differs for TM1 Data Sources 674
Problems Calculating Data 675Unexpected Summary Values in Nested Sets 675Incorrect Results with IBM Cognos PowerCubes and Time Measures 676
Problems Filtering Data 676HRESULT= DB_E_CANTCONVERTVALUE Error When Filtering on a _make_timestamp
Column 676Problems Running Reports 676
Summaries in Report Do not Correspond to the Visible Members 676Cannot Find the Database in the Content Store (Error QE-DEF-0288) 678Parse Errors When Opening or Running an Upgraded Report 678Overflow Error Occurs When a Value in a Crosstab Is More Than 19 Characters 678The ORA-00907 Error Appears When Running a Report 678A Report or Analysis Does Not Run Because of Missing Items 678Cannot View Burst Report 679A Report Upgraded from ReportNet Does Not Retain its Original Look 680Drill-through Links Not Active in the Safari Browser 680A Running Total in Grouped Reports Gives Unexpected Results 680PCA-ERR-0057 Recursive Evaluation Error 680Arithmetic Overflow Error When Running a Report in PDF Format 681
Problems When Drilling Through 681Cannot Drill Between PowerCubes Because MUNs Do Not Match 681Unexpected or Empty Results When Drilling Through 682Cannot Drill From a Relational Source to a Cube 682
Glossary 685
Index 691
26 Report Studio
Table of Contents
Introduction
This document is intended for use with Report Studio. It provides step-by-step procedures and
background information to help you create standard and complex reports. Report Studio is a Web
product for creating reports that analyze corporate data according to specific information needs.
Audience
To use this guide, you should have
● knowledge of your business requirements
● experience using a Web browser, developing Web applications, and writing reports
● knowledge of databases and data modeling concepts
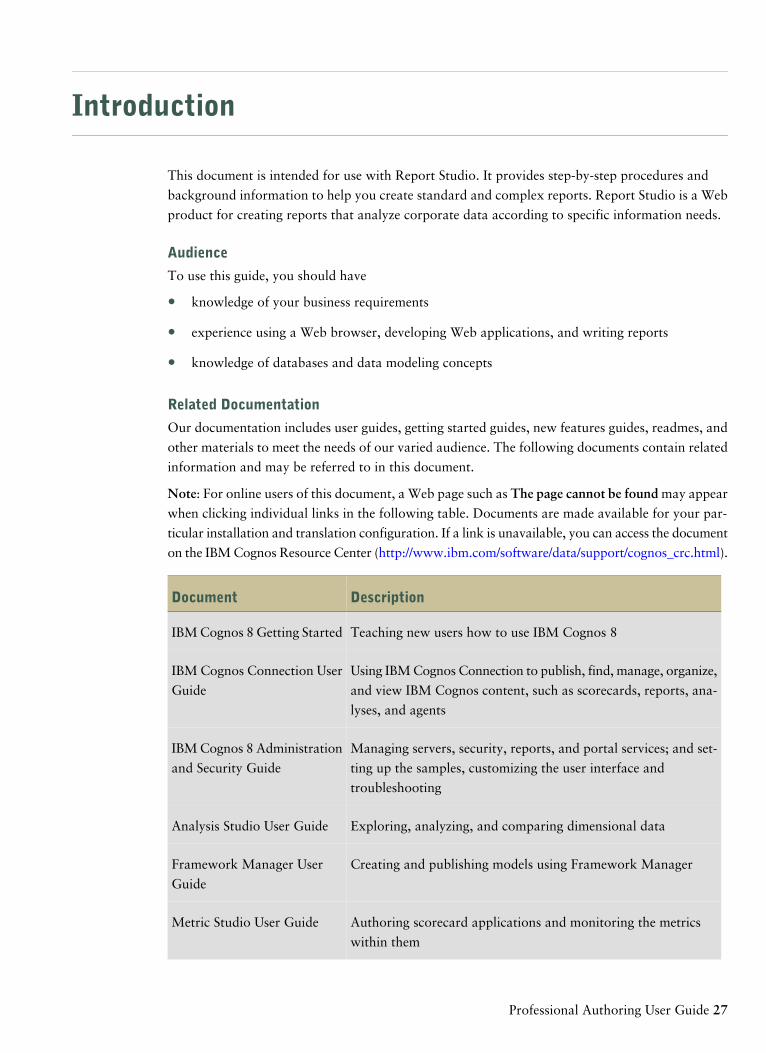
Related Documentation
Our documentation includes user guides, getting started guides, new features guides, readmes, and
other materials to meet the needs of our varied audience. The following documents contain related
information and may be referred to in this document.
Note: For online users of this document, a Web page such as The page cannot be found may appear
when clicking individual links in the following table. Documents are made available for your par-
ticular installation and translation configuration. If a link is unavailable, you can access the document
on the IBM Cognos Resource Center (http://www.ibm.com/software/data/support/cognos_crc.html).
DescriptionDocument
Teaching new users how to use IBM Cognos 8IBM Cognos 8 Getting Started
Using IBM Cognos Connection to publish, find, manage, organize,
and view IBM Cognos content, such as scorecards, reports, ana-
lyses, and agents
IBM Cognos Connection User
Guide
Managing servers, security, reports, and portal services; and set-
ting up the samples, customizing the user interface and
troubleshooting
IBM Cognos 8 Administration
and Security Guide
Exploring, analyzing, and comparing dimensional dataAnalysis Studio User Guide
Creating and publishing models using Framework ManagerFramework Manager User
Guide
Authoring scorecard applications and monitoring the metrics
within them
Metric Studio User Guide
Professional Authoring User Guide 27
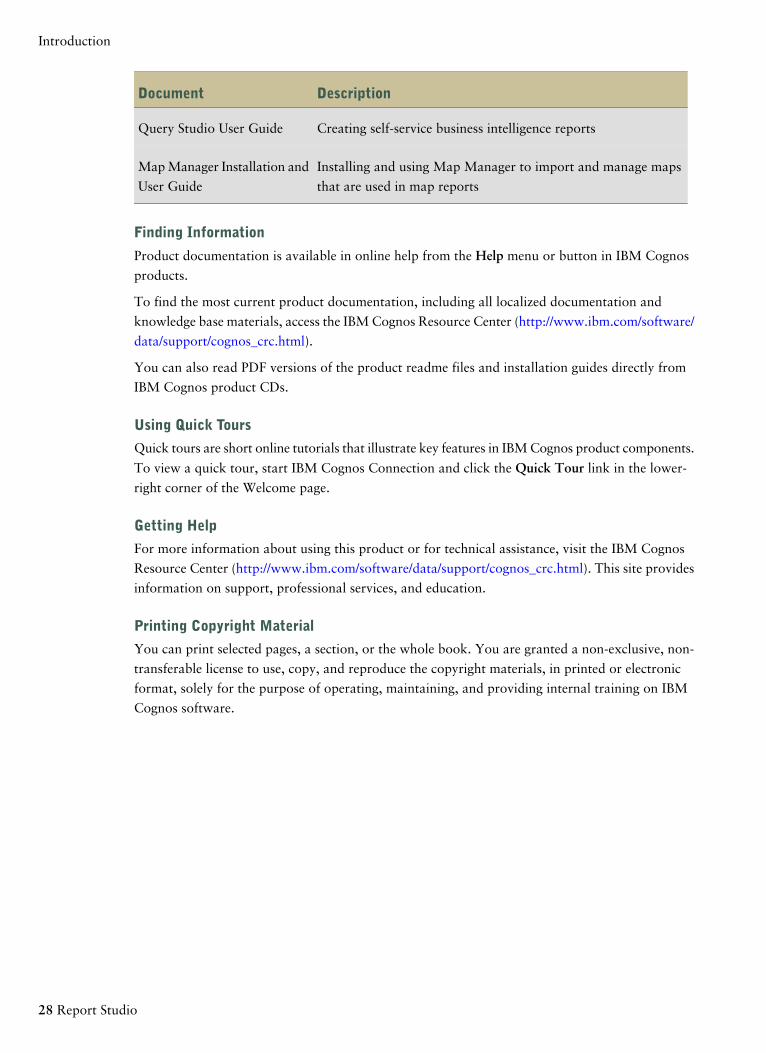
DescriptionDocument
Creating self-service business intelligence reportsQuery Studio User Guide
Installing and using Map Manager to import and manage maps
that are used in map reports
Map Manager Installation and
User Guide
Finding Information
Product documentation is available in online help from the Help menu or button in IBM Cognos
products.
To find the most current product documentation, including all localized documentation and
knowledge base materials, access the IBM Cognos Resource Center (http://www.ibm.com/software/
data/support/cognos_crc.html).
You can also read PDF versions of the product readme files and installation guides directly from
IBM Cognos product CDs.
Using Quick Tours
Quick tours are short online tutorials that illustrate key features in IBM Cognos product components.
To view a quick tour, start IBM Cognos Connection and click the Quick Tour link in the lower-
right corner of the Welcome page.
Getting Help
For more information about using this product or for technical assistance, visit the IBM Cognos
Resource Center (http://www.ibm.com/software/data/support/cognos_crc.html). This site provides
information on support, professional services, and education.
Printing Copyright Material
You can print selected pages, a section, or the whole book. You are granted a non-exclusive, non-
transferable license to use, copy, and reproduce the copyright materials, in printed or electronic
format, solely for the purpose of operating, maintaining, and providing internal training on IBM
Cognos software.
28 Report Studio
Introduction
Chapter 1: What's New?
This section contains a list of new and changed features for this release. It also contains a cumulative
list of similar information for previous releases. It will help you plan your upgrade and application
deployment strategies and the training requirements for your users.
For changes to previous versions, see "What's New in Version 8.3" (p. 32).
For information about upgrading, see the Installation and Configuration Guide for your product.
To review an up-to-date list of environments supported by IBM Cognos products, such as operating
systems, patches, browsers, Web servers, directory servers, database servers, and application servers,
visit the IBM Cognos Resource Center (http://www.ibm.com/software/data/support/cognos_crc.
html).
For an overview of new features for this release, see the New Features Guide.
New Features in Version 8.4Listed below are new features since the last release. Links to directly-related topics are included.
Enhanced Drill-through CapabilitiesIn earlier versions of IBM Cognos 8, model-based drill-through supported only reports created in
Analysis Studio, Query Studio, or Report Studio as targets. Other types of drill-through targets are
now supported. For example, you can now drill through to PowerPlay Studio reports saved in the
content store or to a package that contains a PowerCube.
You can now perform dynamic filtering of data in Report Studio reports. When you apply a filter
to a source report and then drill through to a target report, the target report is automatically filtered
if the item you selected is in a query in the target report.
In Report Studio, you can now define a drill-through definition that allows a report to be shown
on the Go To page only when a specific measure, dimension, hierarchy, alternate hierarchy, level,
or query item exists in the source report. This allows you to restrict when the drill path is available
to users. For more information, see "Using Drill-through Access" (p. 473).
When the source report is based on a dimensional package and you choose to pass parameter values,
you can now choose what property of the source metadata item to map to the target item. For
example, you can map the member caption instead of the business key to the target. By default, the
business key is used.
New Chart TypesThe following new chart types are now available:
● microcharts, which are miniature line and column charts (p. 96).
● win-loss charts, which are microcharts where the value of each bar is either one or minus one.
This chart type is often used to represent a win or loss (p. 100).
Professional Authoring User Guide 29
● marimekko charts, which are 100 percent stacked charts in which the width of a column is
proportional to the total of the column's values. Individual segment height is a percentage of
the respective column total value (p. 98).
Line charts now include an option for creating step line charts. A new Line Type property for the
Line object in the chart allows you to use vertical and horizontal lines to connect the data points,
forming a step-like progression.
Line charts can now also include opening, closing, minimum, and maximum value markers (p. 117).
In bubble charts, a new Bubble Size property allows you to control the size of bubbles in relation
to the actual values of the Z-axis.
Extended Suppression CapabilitiesYou can now suppress rows, columns, or rows and columns based on zero, null, divide by zero,
and overflow values in reports created with relational, dimensionally-modeled relational, and OLAP
data sources. For more information, see "Suppress Empty Cells" (p. 456).
Crosstab Measures Can be Formatted Based on Other Crosstab MeasuresYou can apply conditional styles to crosstab cells based on an adjacent value in the crosstab. For
example, you can conditionally color the bubbles in a bubble chart based on any combination of
the measures, and you can conditionally color an entire row of the crosstab based on any measure
in the columns. For more information, see "Highlight Data Using a Conditional Style" (p. 431).
New Color Palettes for ChartsYou can now easily match the palette of Report Studio charts with charts from Microsoft Excel.
The Palette property provides palettes that match those from various versions of Excel.
You can also use the new Jazz palette, which is compatible with the IBM Cognos Go! Dashboard
palette.
For more information about color palettes, see "Customize the Colors of a Chart" (p. 118).
Enhanced Report GraphicsA greater variety of colorful graphics and backgrounds are now available for dashboards and
reports. For example, you can now include borders with rounded corners, transparent background
fills and images, drop shadows, and background gradients. For more information, see "Use Visual
Effects" (p. 411).
Synchronized Drilling Up and Drilling Down with Multiple QueriesYou can now link groups of data items from different queries in a report so that when you drill up
or down on one query, data items in the other query also drill up or down. For more information,
see "Create a Drill-up/Drill-down Report" (p. 239).
30 Report Studio
Chapter 1: What's New?
Lineage Information for DataYou can now view lineage information of a data item to see what the item represents before you
add it to a report. A data item's lineage information traces the item's metadata back through the
package and the package's data sources. Viewing lineage information ensures that you add the
correct data items to a report. For example, you can view the lineage information of a model calcu-
lation to see how it was created.
You can view this information from Report Studio, Query Studio, Analysis Studio, and Cognos
Viewer. For more information, see "View Lineage Information for a Data Item" (p. 71).
Access to the IBM®WebSphere® Business GlossaryIf you use the IBM WebSphere Business Glossary, you can now access the glossary from any of the
following data objects in Report Studio:
● Query subject
● Query item
● Measure
● Dimension
● Hierarchy
● Level
● Property/attribute
● Top node member
● Member
● Level item
Extended Support for Dimensionally-modeled Relational Data SourcesThere is now support for multiple hierarchies of a single dimension for dimensionally-modeled
relational data sources.
In addition, the sorting of data by member is enhanced. A member can appear sorted in the metadata
tree and on the report without slowing performance. Also, members of a level are sorted in the
context of their ancestor levels. This means that the hierarchical relationship of a level is considered
when member sorting is applied.
Support for Multiple Hierarchies per Dimension for IBM Cognos and SSAS CubesIf you use IBM Cognos PowerCubes or SSAS 2005 cubes, you can now insert multiple hierarchies
from a single dimension in the same query in your report. In previous releases, if a query contained
multiple hierarchies from the same dimension, you encountered errors or no data appeared in your
report. For more information, see "Insert a Hierarchy" (p. 192).
Professional Authoring User Guide 31
Chapter 1: What's New?
Intersections (Tuples) Can Include Calculated Members and MeasuresYou can now insert calculated members and measures in an intersection (tuple). This allows you
to sort using calculated members and measures. For more information, see "Create an Intersection
(Tuple)" (p. 235).
New Query PropertiesThe following two new properties allow you to customize queries:
● User SAP Member Cache (p. 657) allows you to specify whether to cache members from the
hierarchy for SAP BW data sources.
● Use SQL Parameters (p. 658) allows you to specify whether generated SQL uses parameters.
For information about working with SQL, see "Working with Queries in SQL or MDX" (p. 224).
For more information about queries in the relational reporting style, see "Working with Relational
Queries" (p. 171). For more information about queries in the dimensional reporting style, see
"Working with Dimensional Queries" (p. 213).
Changed Features in Version 8.4Listed below are changes to features since the last release. Links to directly-related topics are
included.
Shared Queries Between Lists and RepeatersThe Share Query property was renamed to Share Result Set.
This property allows you to share an identical query between data containers that use it. To share
a query, data containers must be lists, repeaters, or repeater tables and must use the same grouping
structure and list of properties. The data containers cannot be part of a master detail relationship.
Sharing queries improves performance by minimizing the number of queries executed against the
database. For more information, see "Share Result Set" (p. 646).
Editing SQLIf you edit the SQL of a query, you must now set the Processing property of the query to Limited
Local. For more information see "Working with Queries in SQL or MDX" (p. 224).
What's New in Version 8.3This section contains a list of new, changed, and deprecated features for past releases. It also contains
a cumulative list of similar information for previous releases. Knowing this information will help
you plan your upgrade and application deployment strategies and the training requirements for
your users.
To review an up-to-date list of environments supported by IBM Cognos products, such as operating
systems, patches, browsers, Web servers, directory servers, database servers, and application servers,
32 Report Studio
Chapter 1: What's New?
visit the IBM Cognos Resource Center (http://www.ibm.com/software/data/support/cognos_crc.
html).
For information about upgrading, see the Installation and Configuration Guide for your product.
For an overview of new features for this release, see the New Features Guide.
New Features in Version 8.3Listed below are new features since the last release. Links to directly-related topics are included.
Professional and Express Authoring Modes
Report Studio now accommodates two distinct types of users:
● the professional report author
● the report author
The Professional authoring mode is designed for report authors who require access to the full range
of Report Studio functionality. This is the traditional Report Studio profile and the only profile
available until this release.
The Express authoring mode is a subset of the traditional Report Studio user interface. It is designed
for report authors who create financial crosstab reports using dimensional data sources. Financial
authoring requires many but not all of the features that already exist in Report Studio, combined
with a more intuitive user experience and interaction with live data.
For more information, see "Professional Authoring Mode vs. Express Authoring Mode" (p. 56).
Enhanced User Interface When Working With Dimensional Data Sources
Report Studio now offers several enhancements for when you work with a dimensional data source.
You can now
● view a members-oriented source tree in the Insertable Objects pane and customize the tree to
show the information you want (p. 196).
● create sets of members by selecting multiple members from within the same hierarchy in the
source tree (p. 192).
● select whether to insert only members, only their children, or both into your report (p. 191).
● create sectioned page breaks by dropping members or sets in the Page layers area (p. 506).
● create slicer filters by dropping members or sets in the Context filter area (p. 208).
Enhanced Conditional Styles
Conditional styles are now easier to use due to a new streamlined user interface and more options.
You can now apply multiple conditional styles in reports. For example, you can apply one style for
data formats on specific objects and apply a second style for conditional highlighting throughout
the report.
For more information, see "Highlight Data Using a Conditional Style" (p. 431).
Professional Authoring User Guide 33
Chapter 1: What's New?
Extended Crosstab Indentation
Crosstab indentation is extended with new properties to support both outdenting and relative
indenting. Relative indenting adds an indent based on the levels as they appear in the report rather
than in the cube data source. You can now avoid double-indenting, by which members are taken
from both the parent and grandchild levels.
For more information, see "Indent Data" (p. 89).
Customizable Data Tree
You can now customize the source tree in the Insertable Objects pane. You can select options for
a metadata view with dimensions, hierarchies, levels, and an optional members folder; or you can
select a member-oriented tree view. You can also select a combination of these views. For more
information, see "Customize Your Source Tree" (p. 196).
Table of Contents in PDF Reports
You can now add one or more book-like table of contents in your PDF report to summarize all or
part of the content of the report. The table of contents provides page numbers and dynamic links
to the content.
For more information, see "Create a Table of Contents" (p. 500).
No Data Handling
When a query returns no data, you can now choose to provide a message or to remove the data
item from the report. The new No Data Contents property was added to many data containers
such as lists, crosstabs, and charts. For more information, see "Specify What Appears for Data
Containers that Contain No Data" (p. 457).
You can also choose not to render the entire report page if all the data containers on the page do
not contain any data. For more information, see "Specify What Appears for Data Containers that
Contain No Data" (p. 457).
Simplified Report Style
You can now use a Report Studio style class named Simplified styles to remove the default styles
defined in the GlobalReportStyles.css file. This class can be used in any report to present a style
more appropriate to the financial crosstab style of report. This new class is used in the financial
report template.
For more information, see "Create and Modify Object Styles" (p. 428).
Enhanced Report Expressions
A series of new functions was added in the expression editor to make report expressions more
powerful. The new functions give you the flexibility to create report expressions for reporting and
conditional processing.
The new functions include a new mathematical function named mod(), time-based functions, and
conversion functions. Of interest to PowerCube users are the cube variables that can now be added
to report output.
The double2string( ) function can be used in data type conversions.
34 Report Studio
Chapter 1: What's New?
The following functions return the named PowerCube properties:
● CubeName( )
● CubeDescription( )
● CubeCreatedOn( )
● CubeDataUpdatedOn( )
● CubeSchemaUpdatedOn( )
● CubeIsOptimized( )
● CubeDefaultMeasure( )
● CubeCurrentPeriod( )
● CellValue( )
The following functions are used to determine where the current cell is within a data frame, such
as a list or crosstab:
● GetColumnNumber( )
● IsFirstColumn( )
● IsLastColumn( )
● GetColumnNumber( )
● GetRowNumber( )
● IsColumnNodeMember( )
● IsRowNodeMember( )
● IsInnerMostColumnNodeMember( )
● IsOuterMostColumnNodeMember( )
● IsInnerMostRowNodeMember( )
● IsOuterMostRowNodeMember( )
● IsLastInnerMostColumnNodeMember( )
● IsLastInnerMostRowNodeMember( )
● IsFirstColumn( )
● IsLastColumn( )
● IsFirstRow( )
● IsLastRow( )
● GetTableRowNumber( )
Professional Authoring User Guide 35
Chapter 1: What's New?
● GetTableColumnNumber( )
● InScope( )
For more information, see "Using the Expression Editor" (p. 245).
Singleton Results in Layout
You can now insert single data items anywhere in your report using the new singleton object.
For more information, see "Insert a Single Data Item" (p. 62).
PDF Horizontal Pagination
Reports can now span two or more page widths in a PDF. This is useful when you want wide data
in lists and crosstabs to show in its original size. The fit-to-page option from previous releases is
still available. You decide for each list or crosstab which items span across pages and which items
shrink to fit a single page.
Several options for horizontal page numbering are provided. For more information, see "Control
Page Breaks and Page Numbering" (p. 503) and "Insert Page Numbers in a Report" (p. 503).
Page-by-Page PDF Page Layout
You can now set the page orientation (portrait or landscape) and paper size independently on each
page of PDF reports. This is useful when some pages within the same report present information
that is better suited to a different layout.
The page orientation and size are set as properties of the page. For more information, see "Set PDF
Page Options" (p. 70).
Zooming on Chart Region
You can now zoom into any area of a map report. Because the area of interest is expanded to fit
the full report frame, it is no longer necessary to create a separate map in MapInfo for each area
of interest or the corresponding drill-through and report definitions.
A single map with multiple layers can be used as the target of authored reports that use a drill-
through or a prompt to define the area of interest. The new Expand Features property indicates
whether the map should be expanded to focus on the filtered features.
For example, a single map of Europe first shows revenue by country and then, when drilling on a
country, expands the selected country to fit the report frame.
For more information, see "Expand Features" (p. 612).
Other New Features
Other new features include the following:
● A new style toolbar allows you to easily apply styles, such as fonts, colors, alignment, borders,
and data formats.
● You can now copy and reuse the style information from one object to another (p. 407).
● You can now save your report output to a file system, such as a local area network (p. 64).
36 Report Studio
Chapter 1: What's New?
● A new financial report template is now available with default formatting for financial reports
(p. 507).
● The Select & Search Prompt and Value Prompt now let you browse through large numbers of
prompt values (p. 392).
● You can now perform a search to find objects with specific characteristics in your report (p. 53).
● You can now specify a default measure for map, point, scatter, bubble, and polar charts (p. 88).
● Excel 2007 native spreadsheets are now supported as a report format in addition to the existing
Microsoft Excel HTML formats (p. 545).
Changed Features in Version 8.3Listed below are changes to features since the last release. Links to directly-related topics are
included.
Product Behavior After Upgrade
When you upgrade from IBM Cognos 8 BI version 8.2 to version 8.3, some features in IBM Cognos 8
may behave differently after the upgrade. When you upgrade reports, for example, changes in
behavior may cause validation errors. Documentation is available about the behavior changes. This
documentation includes examples of the changed behavior and solutions for issues that may occur
during the upgrade. For more information, see Upgrading to IBM Cognos 8 BI 8.3: Changes in
Product Behavior on the IBM Cognos Resource Center (http://www.ibm.com/software/data/support/
cognos_crc.html).
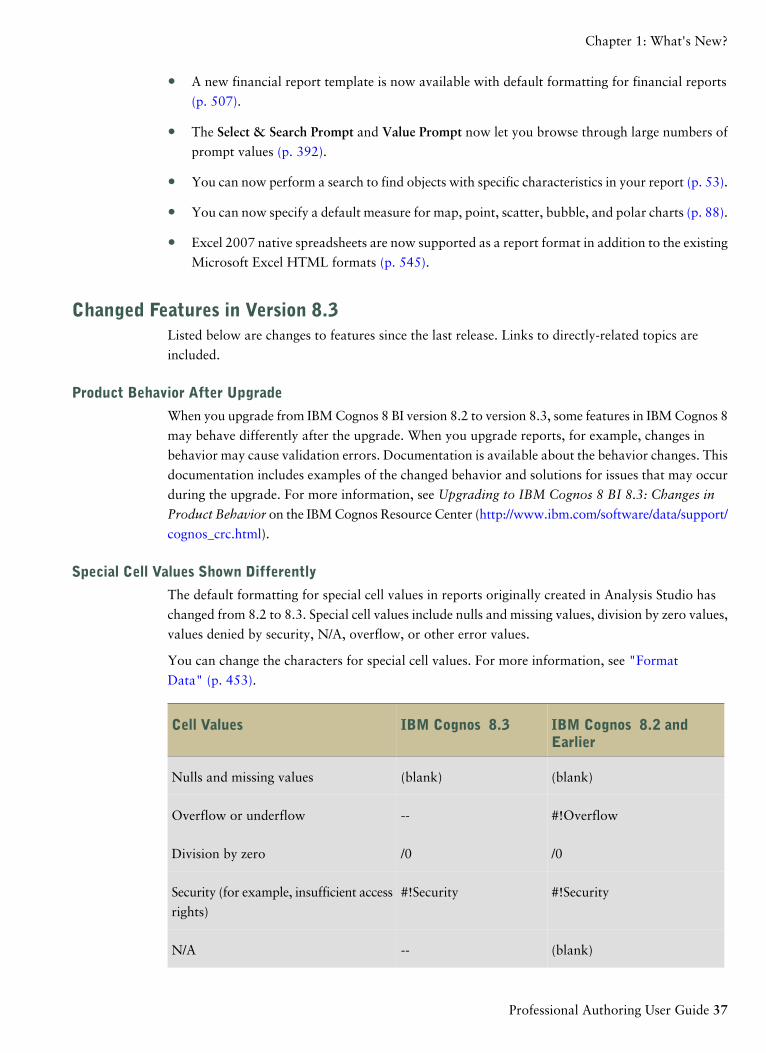
Special Cell Values Shown Differently
The default formatting for special cell values in reports originally created in Analysis Studio has
changed from 8.2 to 8.3. Special cell values include nulls and missing values, division by zero values,
values denied by security, N/A, overflow, or other error values.
You can change the characters for special cell values. For more information, see "Format
Data" (p. 453).
IBM Cognos 8.2 andEarlier
IBM Cognos 8.3Cell Values
(blank)(blank)Nulls and missing values
#!Overflow--Overflow or underflow
/0/0Division by zero
#!Security#!SecuritySecurity (for example, insufficient access
rights)
(blank)--N/A
Professional Authoring User Guide 37
Chapter 1: What's New?
IBM Cognos 8.2 andEarlier
IBM Cognos 8.3Cell Values
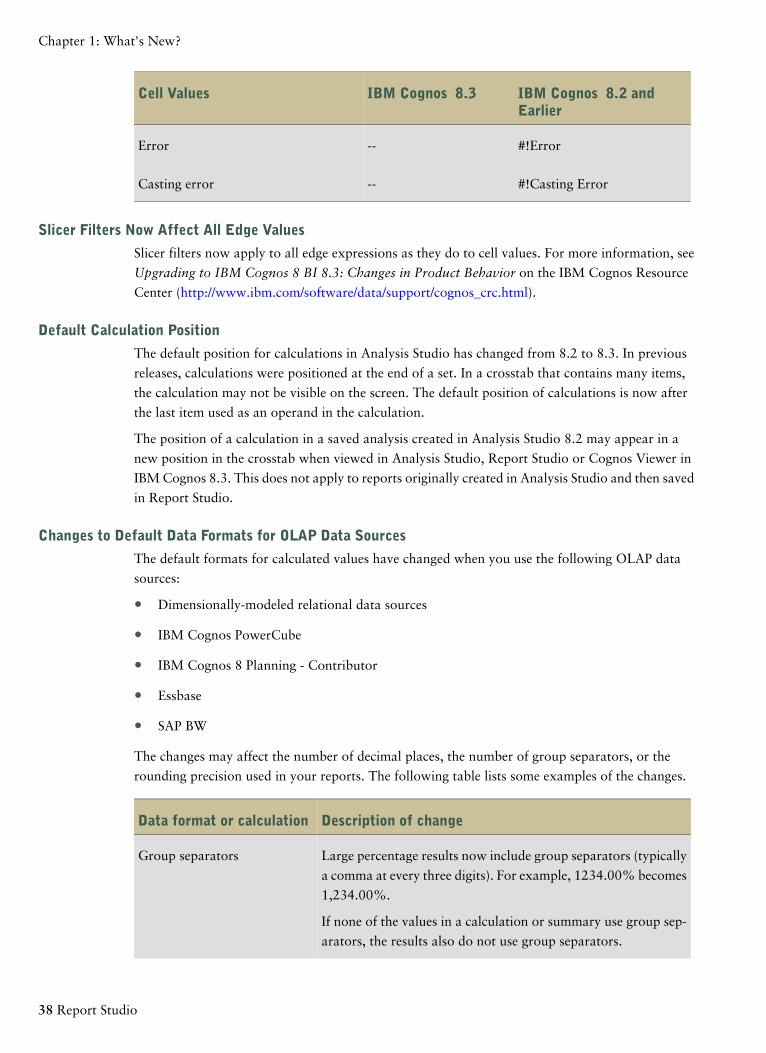
#!Error--Error
#!Casting Error--Casting error
Slicer Filters Now Affect All Edge Values
Slicer filters now apply to all edge expressions as they do to cell values. For more information, see
Upgrading to IBM Cognos 8 BI 8.3: Changes in Product Behavior on the IBM Cognos Resource
Center (http://www.ibm.com/software/data/support/cognos_crc.html).
Default Calculation Position
The default position for calculations in Analysis Studio has changed from 8.2 to 8.3. In previous
releases, calculations were positioned at the end of a set. In a crosstab that contains many items,
the calculation may not be visible on the screen. The default position of calculations is now after
the last item used as an operand in the calculation.
The position of a calculation in a saved analysis created in Analysis Studio 8.2 may appear in a
new position in the crosstab when viewed in Analysis Studio, Report Studio or Cognos Viewer in
IBM Cognos 8.3. This does not apply to reports originally created in Analysis Studio and then saved
in Report Studio.
Changes to Default Data Formats for OLAP Data Sources
The default formats for calculated values have changed when you use the following OLAP data
sources:
● Dimensionally-modeled relational data sources
● IBM Cognos PowerCube
● IBM Cognos 8 Planning - Contributor
● Essbase
● SAP BW
The changes may affect the number of decimal places, the number of group separators, or the
rounding precision used in your reports. The following table lists some examples of the changes.
Description of changeData format or calculation
Large percentage results now include group separators (typically
a comma at every three digits). For example, 1234.00% becomes
1,234.00%.
Group separators
If none of the values in a calculation or summary use group sep-
arators, the results also do not use group separators.
38 Report Studio
Chapter 1: What's New?
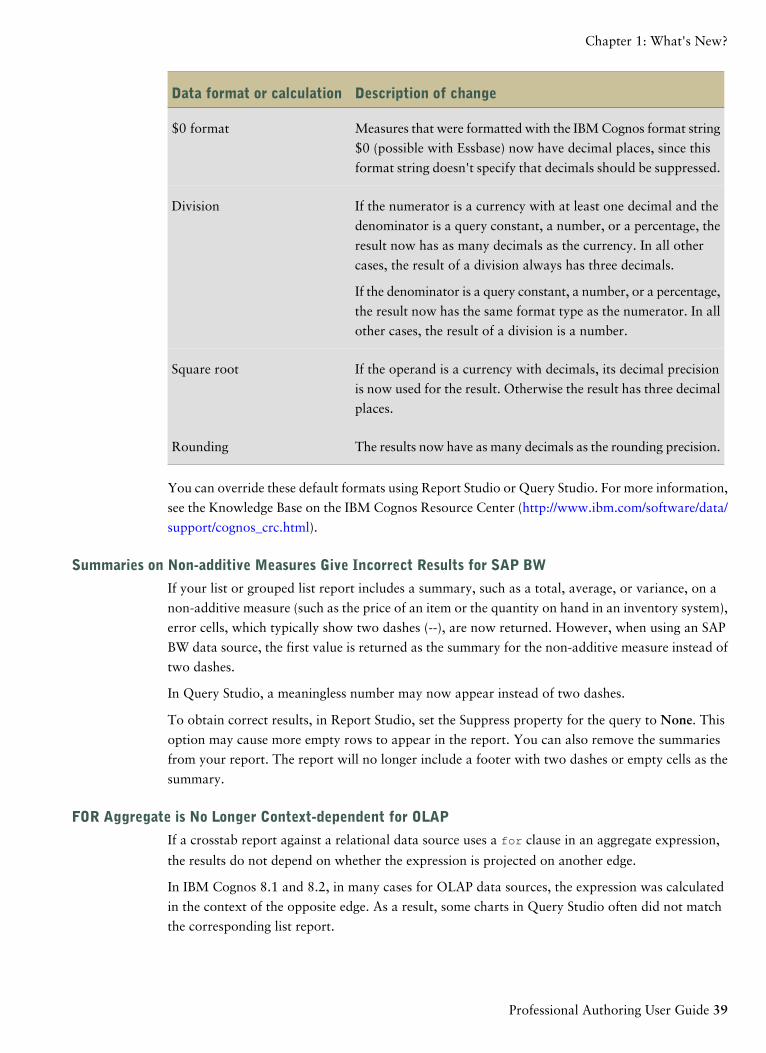
Description of changeData format or calculation
Measures that were formatted with the IBM Cognos format string
$0 (possible with Essbase) now have decimal places, since this
format string doesn't specify that decimals should be suppressed.
$0 format
If the numerator is a currency with at least one decimal and the
denominator is a query constant, a number, or a percentage, the
result now has as many decimals as the currency. In all other
cases, the result of a division always has three decimals.
Division
If the denominator is a query constant, a number, or a percentage,
the result now has the same format type as the numerator. In all
other cases, the result of a division is a number.
If the operand is a currency with decimals, its decimal precision
is now used for the result. Otherwise the result has three decimal
places.
Square root
The results now have as many decimals as the rounding precision.Rounding
You can override these default formats using Report Studio or Query Studio. For more information,
see the Knowledge Base on the IBM Cognos Resource Center (http://www.ibm.com/software/data/
support/cognos_crc.html).
Summaries on Non-additive Measures Give Incorrect Results for SAP BW
If your list or grouped list report includes a summary, such as a total, average, or variance, on a
non-additive measure (such as the price of an item or the quantity on hand in an inventory system),
error cells, which typically show two dashes (--), are now returned. However, when using an SAP
BW data source, the first value is returned as the summary for the non-additive measure instead of
two dashes.
In Query Studio, a meaningless number may now appear instead of two dashes.
To obtain correct results, in Report Studio, set the Suppress property for the query to None. This
option may cause more empty rows to appear in the report. You can also remove the summaries
from your report. The report will no longer include a footer with two dashes or empty cells as the
summary.
FOR Aggregate is No Longer Context-dependent for OLAP
If a crosstab report against a relational data source uses a for clause in an aggregate expression,
the results do not depend on whether the expression is projected on another edge.
In IBM Cognos 8.1 and 8.2, in many cases for OLAP data sources, the expression was calculated
in the context of the opposite edge. As a result, some charts in Query Studio often did not match
the corresponding list report.
Professional Authoring User Guide 39
Chapter 1: What's New?
In IBM Cognos 8.3, the OLAP behavior is now consistent with the relational behavior. If you
require context-dependence, use either the bare measure or the member aggregate syntax (within
set or within detail).
For more information, see Upgrading to IBM Cognos 8 BI 8.3: Changes in Product Behavior on
the IBM Cognos Resource Center (http://www.ibm.com/software/data/support/cognos_crc.html).
Rounding with Equality Filters for SSAS Cubes
In previous versions of IBM Cognos 8, when using an Microsoft SQL Server 2000 or 2005 Analysis
Services (SSAS) cube, adding an equality filter with a specific constant implicitly rounded the cells
to the number of decimal places for the constant. This caused some inconsistencies when using the
following operators: <, >, <=, >=, and <>.
For example, the following filter uses the not equal (< >) operator: [measures].[BigInt] <> 3.14159.
It now returns the raw values 3.141586 and 3.141592 and no longer rounds the values to five
decimal places.
For example, the following filter uses the = operator: [MEASURES].[BigInt] = 3.14159. In previous
releases, the left side of the expression was rounded to 5 digits and raw values of 3.141586 and
3.141592 were returned. In this release, raw values of 3.141586 and 3.141592 are no longer
returned, consistent with the behavior for <>.
Other data sources were always consistent and did not round values.
If you want to keep the old behavior, use the round function or use ([MEASURES].[BigInt] <
3.141595 AND [MEASURES].[BigInt] >= 3.141585).
Essbase Calculations on Missing Facts
In IBM Cognos 8 version 8.2, arithmetic query calculations for Essbase data sources treated missing
fact values as zero. In version 8.3, such calculations now have no value (null).
This new behavior is consistent with the behavior of calculated members in Essbase cubes and with
PowerCubes and SAP BW behavior. In addition, it improves the behavior of null suppression based
on such calculations.
If you want to keep these values as zero, you can explicitly convert the null to zero with an
expression such as if ([Discount Percentage] IS NULL) then (0) else ([Discount Percentage]).
For more information, see Upgrading to IBM Cognos 8 BI 8.3: Changes in Product Behavior on
the IBM Cognos Resource Center (http://www.ibm.com/software/data/support/cognos_crc.html).
Changes to the Data Tree for SAP BW
If you use an SAP BW data source, you will notice the following changes when working with the
data tree:
● If you expand the member folder, you now see all the members.
● If you expand the member folder and the data source uses variables, you are no longer
prompted to satisfy the variables.
● If you search in the member folder, you are no longer prompted to satisfy the data source
variables.
40 Report Studio
Chapter 1: What's New?
● If you search for members, the search retrieves all the members that meet the search criteria
despite the variable conditions.
● If your data source uses variables and the report includes an IBM Cognos 8 prompt, you are
now prompted to satisfy the variables.
Deprecated Features in Version 8.3A deprecated feature is one that is being replaced by a newer version or a better implementation.
The intention is to discontinue the use of the feature and provide recommendations for adapting
to this change over multiple releases.
Listed below are deprecated features.
Excel 2000 Format
The Microsoft Excel 2000 format for report outputs is deprecated in version 8.3. In a future release,
Excel 2000 format will no longer be available.
Professional Authoring User Guide 41
Chapter 1: What's New?

42 Report Studio
Chapter 1: What's New?
Chapter 2: Understanding Report Studio
Report Studio is a Web-based tool that professional report authors use to build sophisticated,
multiple-page, multiple-query reports against multiple databases. With Report Studio, you can
create any reports that your company requires, such as invoices, statements, and weekly sales and
inventory reports.
Building IBM Cognos 8 ApplicationsThe lifetime of an IBM Cognos 8 business intelligence application can be months, or even years.
During that time, data may change and new requirements appear. As the underlying data changes,
authors must modify existing content and develop new content. Administrators must also update
models and data sources over time. For more information about using data sources, see the IBM
Cognos 8 Administration and Security Guide and the Framework Manager User Guide.
In a working application, the technical and security infrastructure and the portal are in place, as
well as processes for change management, data control, and so on. For information about the
workflow associated with creating IBM Cognos 8 content, see the IBM Cognos 8 Architecture and
Deployment Guide. For additional information, see the IBM Cognos Solutions Implementation
Methodology toolkit, which includes implementation roadmaps and supporting documents.
Information about the toolkit is available on the IBM Cognos Resource Center (http://www.ibm.
com/software/data/support/cognos_crc.html).
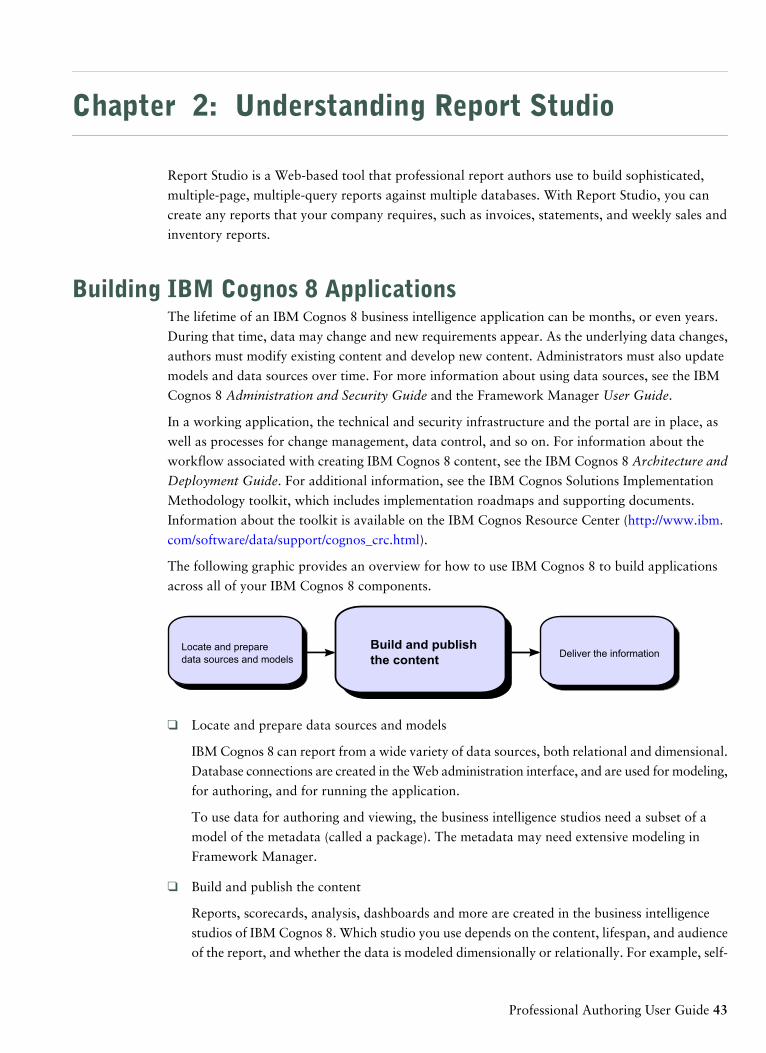
The following graphic provides an overview for how to use IBM Cognos 8 to build applications
across all of your IBM Cognos 8 components.
Locate and preparedata sources and models
Build and publishthe content Deliver the information
❑ Locate and prepare data sources and models
IBM Cognos 8 can report from a wide variety of data sources, both relational and dimensional.
Database connections are created in the Web administration interface, and are used for modeling,
for authoring, and for running the application.
To use data for authoring and viewing, the business intelligence studios need a subset of a
model of the metadata (called a package). The metadata may need extensive modeling in
Framework Manager.
❑ Build and publish the content
Reports, scorecards, analysis, dashboards and more are created in the business intelligence
studios of IBM Cognos 8. Which studio you use depends on the content, lifespan, and audience
of the report, and whether the data is modeled dimensionally or relationally. For example, self-
Professional Authoring User Guide 43
service reporting and analysis are done through Query Studio and Analysis Studio, and scheduled
reports are created in Report Studio. Report Studio reports and scorecards are usually prepared
for a wider audience, published to IBM Cognos Connection or another portal, and scheduled
there for bursting, distribution, and so on. You can also use Report Studio to prepare templates
for self-service reporting.
❑ Deliver and view the information
You deliver content from the IBM Cognos portal or other supported portals, and view
information that has been saved to portals, or delivered by other mechanisms. You can also
run reports, analyses, scorecards, and more from within the business intelligence studio in which
they were created.
For information about tuning and performance, see the IBM Cognos 8 Administration and
Security Guide and the IBM Cognos Resource Center (http://www.ibm.com/software/data/
support/cognos_crc.html).
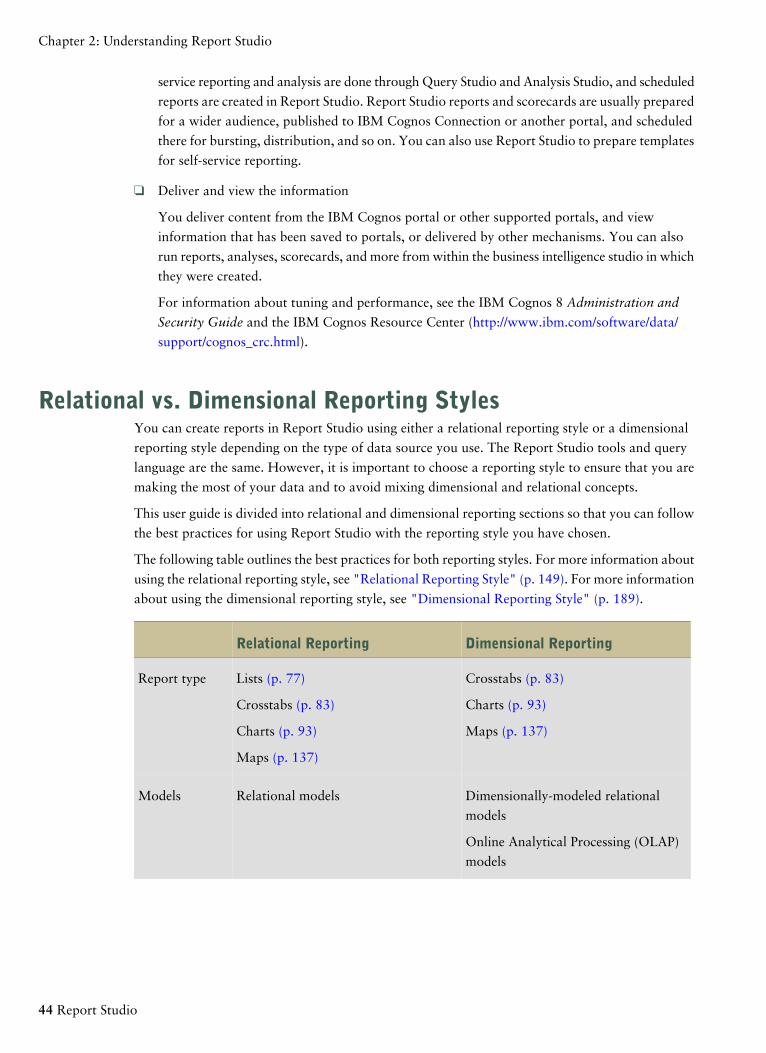
Relational vs. Dimensional Reporting StylesYou can create reports in Report Studio using either a relational reporting style or a dimensional
reporting style depending on the type of data source you use. The Report Studio tools and query
language are the same. However, it is important to choose a reporting style to ensure that you are
making the most of your data and to avoid mixing dimensional and relational concepts.
This user guide is divided into relational and dimensional reporting sections so that you can follow
the best practices for using Report Studio with the reporting style you have chosen.
The following table outlines the best practices for both reporting styles. For more information about
using the relational reporting style, see "Relational Reporting Style" (p. 149). For more information
about using the dimensional reporting style, see "Dimensional Reporting Style" (p. 189).
Dimensional ReportingRelational Reporting
Crosstabs (p. 83)Lists (p. 77)Report type
Charts (p. 93)Crosstabs (p. 83)
Maps (p. 137)Charts (p. 93)
Maps (p. 137)
Dimensionally-modeled relational
models
Relational modelsModels
Online Analytical Processing (OLAP)
models
44 Report Studio
Chapter 2: Understanding Report Studio
Dimensional ReportingRelational Reporting
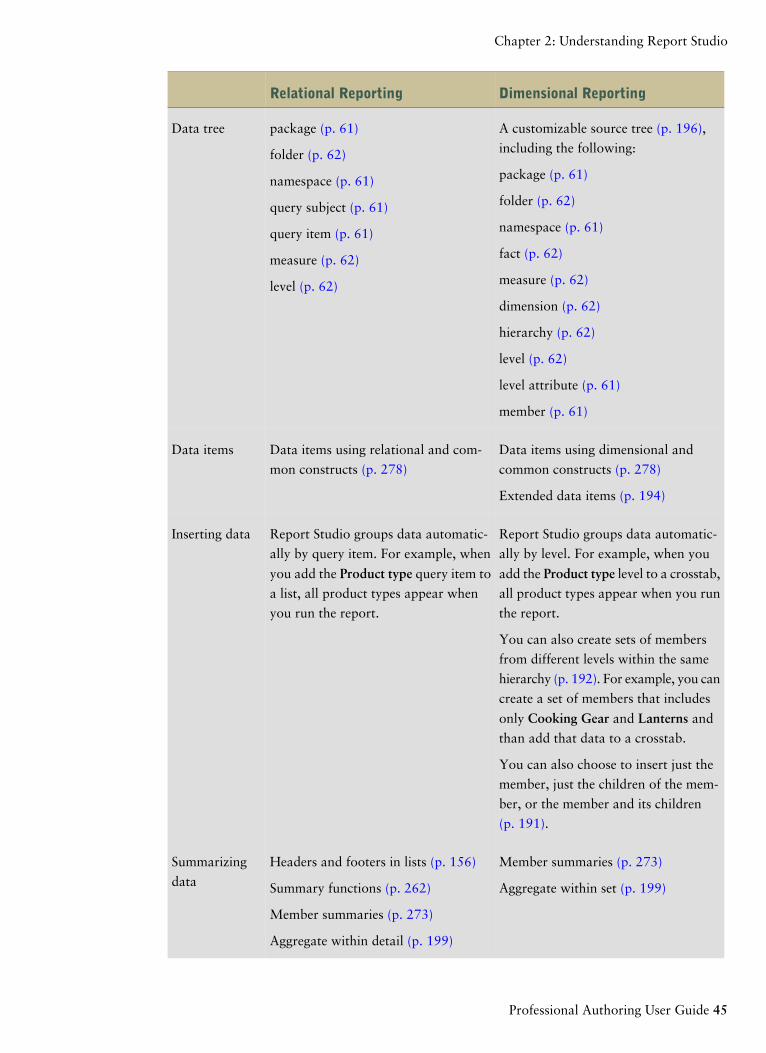
A customizable source tree (p. 196),
including the following:
package (p. 61)
folder (p. 62)
Data tree
package (p. 61)namespace (p. 61)
folder (p. 62)query subject (p. 61)
namespace (p. 61)query item (p. 61)
fact (p. 62)measure (p. 62)
measure (p. 62)level (p. 62)
dimension (p. 62)
hierarchy (p. 62)
level (p. 62)
level attribute (p. 61)
member (p. 61)
Data items using dimensional and
common constructs (p. 278)
Data items using relational and com-
mon constructs (p. 278)
Data items
Extended data items (p. 194)
Report Studio groups data automatic-
ally by level. For example, when you
add the Product type level to a crosstab,
all product types appear when you run
the report.
Report Studio groups data automatic-
ally by query item. For example, when
you add the Product type query item to
a list, all product types appear when
you run the report.
Inserting data
You can also create sets of members
from different levels within the same
hierarchy (p. 192). For example, you can
create a set of members that includes
only Cooking Gear and Lanterns and
than add that data to a crosstab.
You can also choose to insert just the
member, just the children of the mem-
ber, or the member and its children
(p. 191).
Member summaries (p. 273)Headers and footers in lists (p. 156)Summarizing
data Aggregate within set (p. 199)Summary functions (p. 262)
Member summaries (p. 273)
Aggregate within detail (p. 199)
Professional Authoring User Guide 45
Chapter 2: Understanding Report Studio
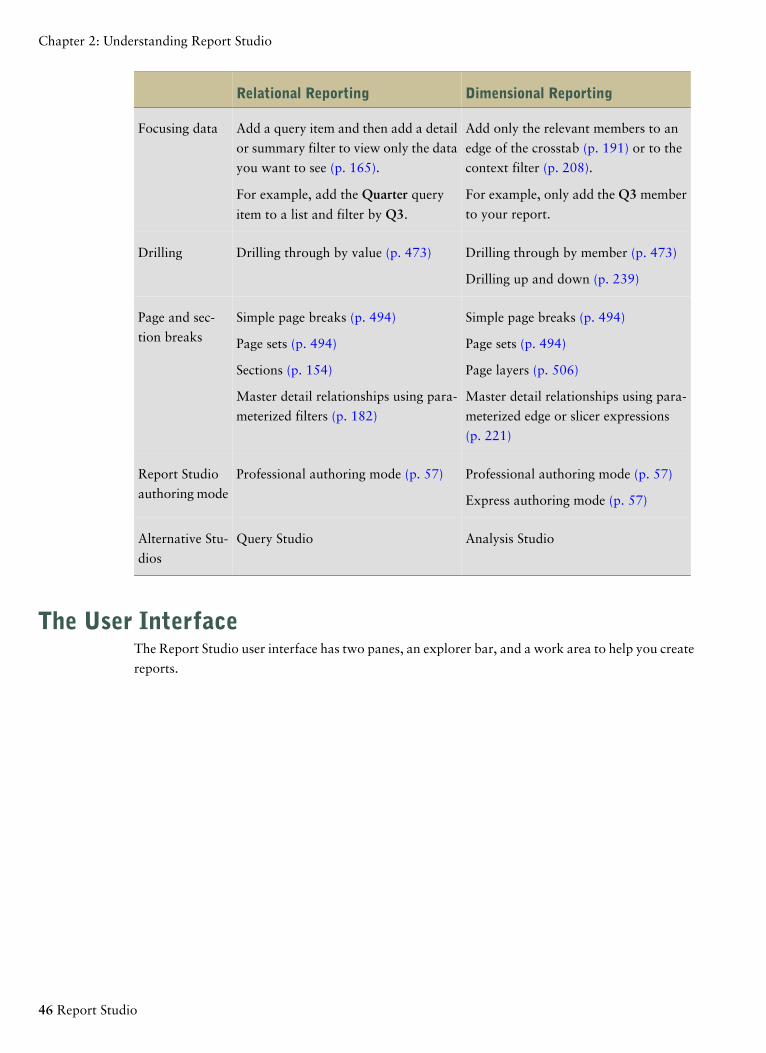
Dimensional ReportingRelational Reporting
Add only the relevant members to an
edge of the crosstab (p. 191) or to the
context filter (p. 208).
Add a query item and then add a detail
or summary filter to view only the data
you want to see (p. 165).
Focusing data
For example, only add the Q3 member
to your report.
For example, add the Quarter query
item to a list and filter by Q3.
Drilling through by member (p. 473)Drilling through by value (p. 473)Drilling
Drilling up and down (p. 239)
Simple page breaks (p. 494)Simple page breaks (p. 494)Page and sec-
tion breaks Page sets (p. 494)Page sets (p. 494)
Page layers (p. 506)Sections (p. 154)
Master detail relationships using para-
meterized edge or slicer expressions
(p. 221)
Master detail relationships using para-
meterized filters (p. 182)
Professional authoring mode (p. 57)Professional authoring mode (p. 57)Report Studio
authoring mode Express authoring mode (p. 57)
Analysis StudioQuery StudioAlternative Stu-
dios
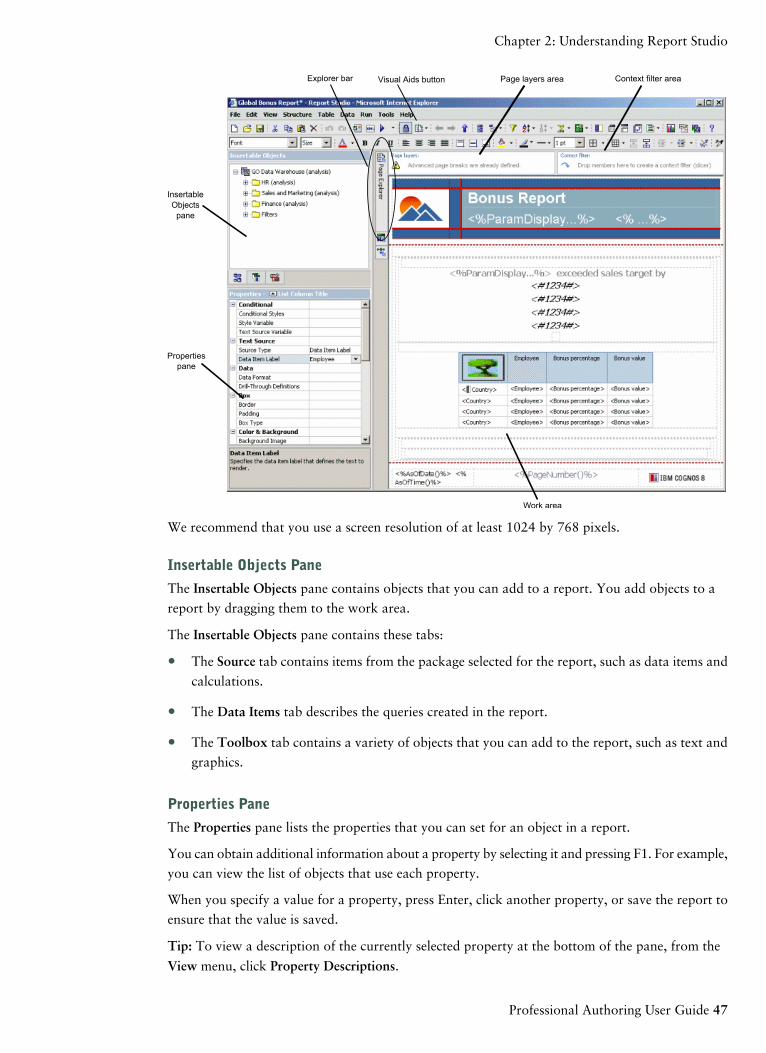
The User InterfaceThe Report Studio user interface has two panes, an explorer bar, and a work area to help you create
reports.
46 Report Studio
Chapter 2: Understanding Report Studio
Explorer bar
InsertableObjectspane
Propertiespane
Work area
Visual Aids button Context filter areaPage layers area
We recommend that you use a screen resolution of at least 1024 by 768 pixels.
Insertable Objects Pane
The Insertable Objects pane contains objects that you can add to a report. You add objects to a
report by dragging them to the work area.
The Insertable Objects pane contains these tabs:
● The Source tab contains items from the package selected for the report, such as data items and
calculations.
● The Data Items tab describes the queries created in the report.
● The Toolbox tab contains a variety of objects that you can add to the report, such as text and
graphics.
Properties Pane
The Properties pane lists the properties that you can set for an object in a report.
You can obtain additional information about a property by selecting it and pressing F1. For example,
you can view the list of objects that use each property.
When you specify a value for a property, press Enter, click another property, or save the report to
ensure that the value is saved.
Tip: To view a description of the currently selected property at the bottom of the pane, from the
View menu, click Property Descriptions.
Professional Authoring User Guide 47
Chapter 2: Understanding Report Studio
Explorer Bar
Pause the pointer over the following buttons on the Explorer bar to work with different parts of a
report:
● the page explorer button
You use Page Explorer to view or create new report pages and prompt pages (p. 391) or to create
and modify classes (p. 428).
● the query explorer button
You use Query Explorer to create or modify queries in relational reporting (p. 171) or dimensional
reporting (p. 213) and to perform complex tasks, such as defining union joins and writing SQL
statements.
● the condition explorer button
You use Condition Explorer to work with variables to define conditions (p. 431) in a report.
Page Layers Area
Use the Page layers area to create sections, or page breaks, in a report to show values for each
member on a separate page. For example, you can drag Northern Europe sales territory from the
Insertable Objects pane to the Page layers area. The report is broken into a separate page for each
territory within northern Europe. Each page's context appears in the report header.
For more information, see "Create Page Layers" (p. 506).
Context Filter Area
When working with dimensional data, use the Context filter area to filter your report to show values,
or context, for only a specific data item. This technique is also known as a slicer filter. For example,
you can drag Sales Territory from the Insertable Objects pane to the Context filter area. When you
click a specific territory from the list, the values in the crosstab change to represent data for that
territory.
For more information, see "Create a Context Filter" (p. 208).
Visual Aids Button
The visual aids button provides the following options to help you when you are designing
reports in the layout.
DescriptionOption
Shows all boundary lines.Show Boundary Lines
Overrides all boundary line settings by replacing them
with default (dotted line) lines. For example, if you set the
Border property for an object, the border lines are replaced
with dotted lines.
Force Boundary Lines
48 Report Studio
Chapter 2: Understanding Report Studio
DescriptionOption
Repeats objects when you insert them. For example, when
you insert a data item in a crosstab, the data item appears
in each row or in each column of the crosstab.
Show Repeating
Shows the page header and page footer.Show Page Header And Footer
Shows drag-and-drop zone when the Padding property
for an object is set to 0. If the Padding property is set to
a value that is greater than the minimum padding that
Report Studio uses to show drag-and-drop zones, only the
minimum padding is shown.
Show Drag & Drop Padding
Shows objects for which the Box Type property was set
to None or for which the Visible property was set to No.
Show Hidden Objects
Shows the sorting icon for data items for which a sort
order was specified. For more information about sorting
data, see "Sorting Relational Data" (p. 170) or "Sorting
Dimensional Data" (p. 211).
Show Sorting
Shows the grouping icon for grouped data items (p. 150).Show Grouping
Shows the icon for the source type of objects, such as lay-
out calculation.Show Source Type
Shows the icon for the type of data item, such as query
item, member, or measure.Show Data Item Type
Shows data items for which the drill-through definition
(p. 481) was defined as a hyperlink.Show Drill-through Definitions
Shows table of contents entries (p. 500) inserted in the
report.Show Table of Contents Entries
Shows bookmarks (p. 498) inserted in the report.Show Bookmarks
Shows master detail relationships (p. 221) defined in the
report.Show Master Detail Relationships
Tip: Pausing the pointer over the master detail relationship
icon shows the relationship.
Shows tabs if the data container's No Data Contents
property is set to Yes (p. 457).
Show No Data Contents Tab Control
Professional Authoring User Guide 49
Chapter 2: Understanding Report Studio
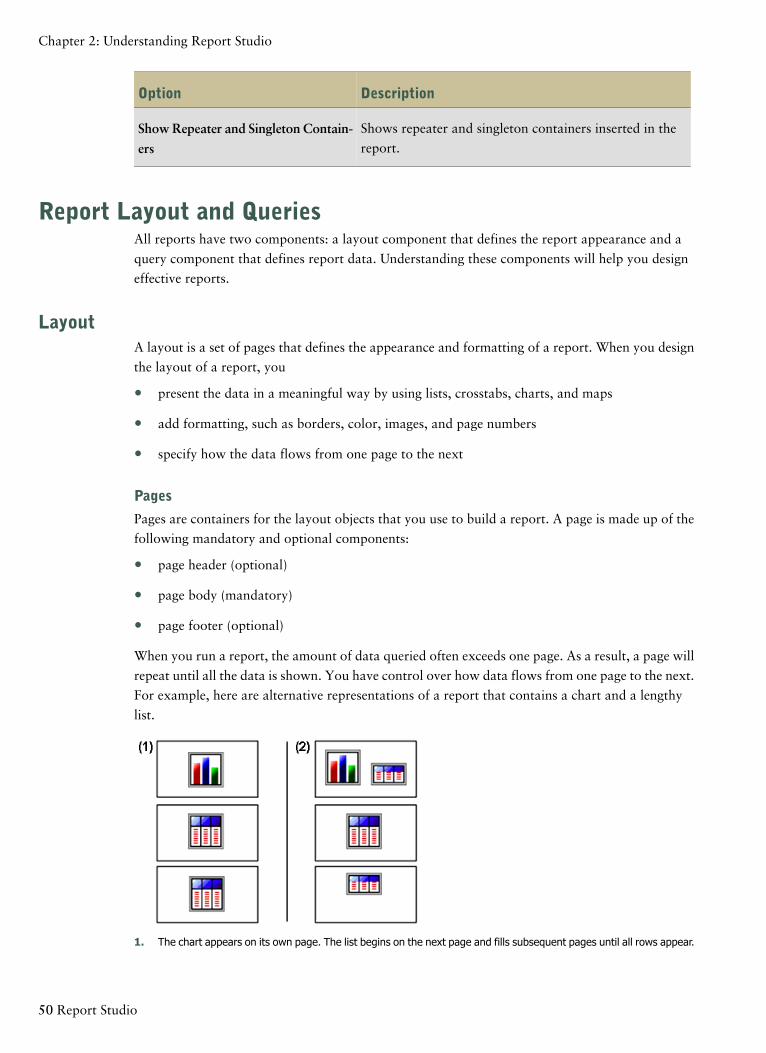
DescriptionOption
Shows repeater and singleton containers inserted in the
report.ShowRepeater and Singleton Contain-
ers
Report Layout and QueriesAll reports have two components: a layout component that defines the report appearance and a
query component that defines report data. Understanding these components will help you design
effective reports.
LayoutA layout is a set of pages that defines the appearance and formatting of a report. When you design
the layout of a report, you
● present the data in a meaningful way by using lists, crosstabs, charts, and maps
● add formatting, such as borders, color, images, and page numbers
● specify how the data flows from one page to the next
Pages
Pages are containers for the layout objects that you use to build a report. A page is made up of the
following mandatory and optional components:
● page header (optional)
● page body (mandatory)
● page footer (optional)
When you run a report, the amount of data queried often exceeds one page. As a result, a page will
repeat until all the data is shown. You have control over how data flows from one page to the next.
For example, here are alternative representations of a report that contains a chart and a lengthy
list.
1. The chart appears on its own page. The list begins on the next page and fills subsequent pages until all rows appear.
50 Report Studio
Chapter 2: Understanding Report Studio
2. The chart and the first few rows of the list appear on the first page. The rest of the data in the list appears on thesubsequent pages.
Objects
You add layout objects to a page when you create a report. Below are objects that you will use
often when building reports in Report Studio:
● list
Add a list to show data in rows and columns.
● crosstab
Add a crosstab to show data in a grid with dimensions along the rows and columns and
measures in the cells or intersection points.
● chart
● map
● repeater
Add a repeater to show each instance of a certain column or data item in a separate frame.
● text
● block
Add a block to hold text or other information. Blocks are often used to lay out horizontal bands
of information.
● table
For information about other layout objects you can add to a report, see "Insert a Formatting Object
in a Report" (p. 413).
QueriesQueries determine what data items appear in the report. Sometimes you want detailed rows of data,
which you obtain by using a simple SELECT statement. Other times you must calculate totals or
averages using summary functions and grouped columns or must apply filters to show only the data
you want.
Report Studio automatically creates the queries you need as you build reports. However, you can
modify these queries or create your own custom queries to get the results you want.
For more information about working with queries in the relational reporting style, see "Working
with Relational Queries" (p. 171). For more information about working with queries in the dimen-
sional reporting style, see "Working with Dimensional Queries" (p. 213).
Report ObjectsYou build reports by adding objects and manipulating them to obtain the results you want. To
understand how to work with objects in Report Studio, you must be familiar with the following
concepts:
Professional Authoring User Guide 51
Chapter 2: Understanding Report Studio
● object types
● objects as containers
● locking and unlocking objects
● hierarchy of objects
For information about Report Studio objects, see "Report Studio Object and Property Refer-
ence" (p. 553).
Object Types
In Report Studio, layout objects are either inline or block. You can insert other objects on the same
line as an inline object, but not on the same line as a block object. When you insert an object to
the left or to the right of a block object, the object appears on the line above or below the block
object, respectively. Examples of inline objects include graphics and text items. Examples of block
objects include any report type (list, crosstab, chart, map, or repeater) and tables.
Note:You can also use an object's floating (p. 426) property to define how other objects flow around
the object. For example, you can specify how text flows around an image.
Objects as Containers
Objects, such as tables (p. 418), blocks (p. 413), and any report frame (p. 413), are containers in which
you can insert other objects. For example, you can insert a list in one cell of a table and a chart in
another.
Tip: You can also nest objects to create a sophisticated layout. For example, you can insert a table
in a cell of another table.
Locking and Unlocking Objects
To manipulate the contents of some objects, you must first unlock the object. For example, you
have a list that contains the column Product Name. You want to insert a graphic inside the Product
Name column to show an image of each product. Unlocking the list allows you to insert the image
object inside a list column.
Tip: From the Structure menu, click Lock Page Objects . Toggling this menu item locks and
unlocks all layout objects in a report. However, this setting is not saved with the report.
Hierarchy of Objects
In Report Studio, objects are organized hierarchically. For example, a list contains list columns,
and each list column contains a text item, which is the name of the inserted data item.
The hierarchy of objects is useful to remember when you apply formatting because formatting is
applied to the child objects of the object. For example, you can specify that all list column titles in
a list have red as the background color. The formatting is automatically applied to any new columns
you add to the list because the formatting is applied to the list and is therefore applied to the objects
in the list. If you apply formatting to a specific object, it will override the same formatting specified
for the parent object.
52 Report Studio
Chapter 2: Understanding Report Studio
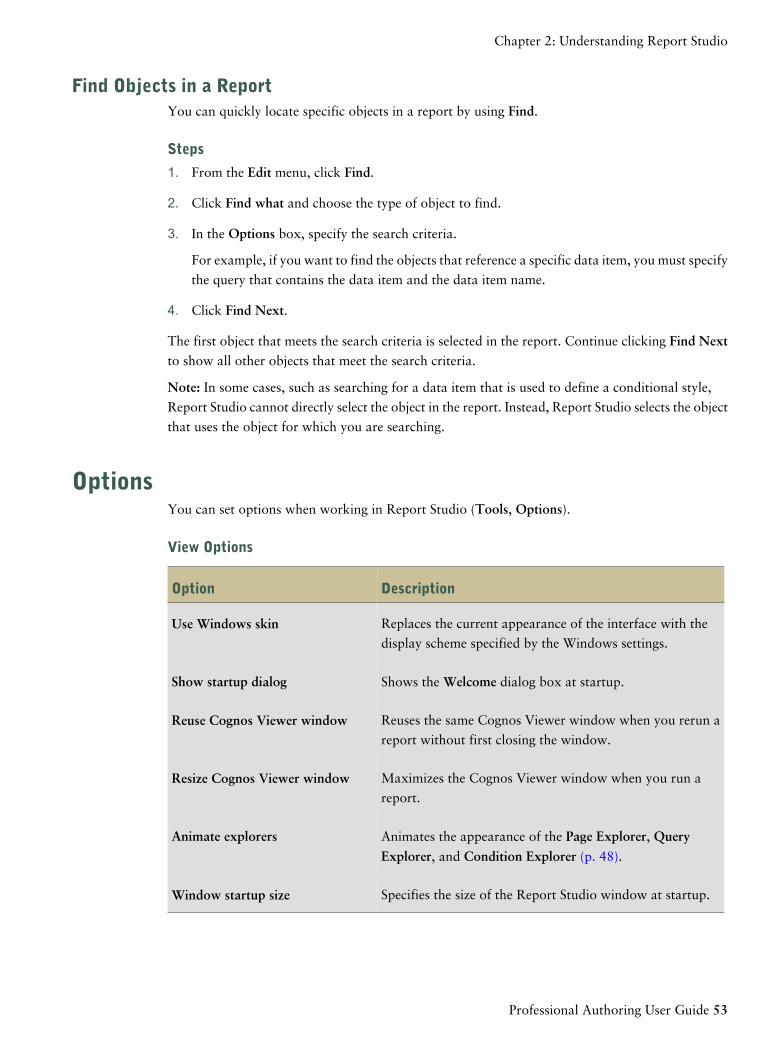
Find Objects in a ReportYou can quickly locate specific objects in a report by using Find.
Steps
1. From the Edit menu, click Find.
2. Click Find what and choose the type of object to find.
3. In the Options box, specify the search criteria.
For example, if you want to find the objects that reference a specific data item, you must specify
the query that contains the data item and the data item name.
4. Click Find Next.
The first object that meets the search criteria is selected in the report. Continue clicking Find Nextto show all other objects that meet the search criteria.
Note: In some cases, such as searching for a data item that is used to define a conditional style,
Report Studio cannot directly select the object in the report. Instead, Report Studio selects the object
that uses the object for which you are searching.
OptionsYou can set options when working in Report Studio (Tools, Options).
View Options
DescriptionOption
Replaces the current appearance of the interface with the
display scheme specified by the Windows settings.Use Windows skin
Shows the Welcome dialog box at startup.Show startup dialog
Reuses the same Cognos Viewer window when you rerun a
report without first closing the window.Reuse Cognos Viewer window
Maximizes the Cognos Viewer window when you run a
report.Resize Cognos Viewer window
Animates the appearance of the Page Explorer, Query
Explorer, and Condition Explorer (p. 48).
Animate explorers
Specifies the size of the Report Studio window at startup.Window startup size
Professional Authoring User Guide 53
Chapter 2: Understanding Report Studio
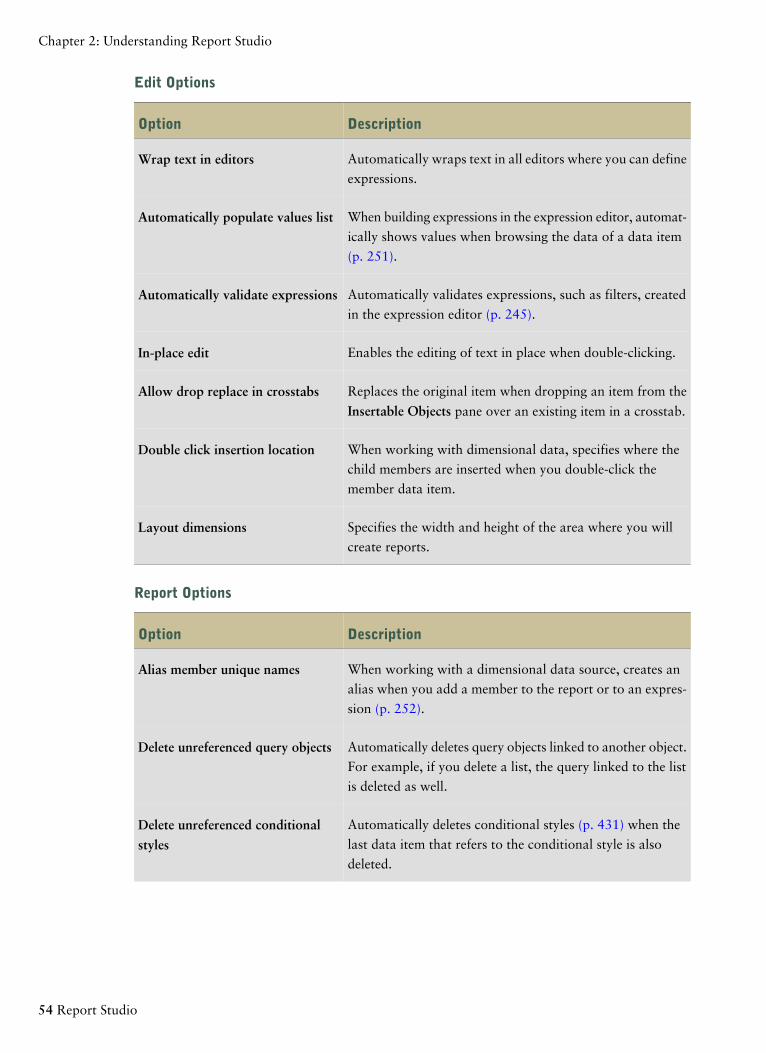
Edit Options
DescriptionOption
Automatically wraps text in all editors where you can define
expressions.Wrap text in editors
When building expressions in the expression editor, automat-
ically shows values when browsing the data of a data item
(p. 251).
Automatically populate values list
Automatically validates expressions, such as filters, created
in the expression editor (p. 245).Automatically validate expressions
Enables the editing of text in place when double-clicking.In-place edit
Replaces the original item when dropping an item from the
Insertable Objects pane over an existing item in a crosstab.
Allow drop replace in crosstabs
When working with dimensional data, specifies where the
child members are inserted when you double-click the
member data item.
Double click insertion location
Specifies the width and height of the area where you will
create reports.Layout dimensions
Report Options
DescriptionOption
When working with a dimensional data source, creates an
alias when you add a member to the report or to an expres-
sion (p. 252).
Alias member unique names
Automatically deletes query objects linked to another object.
For example, if you delete a list, the query linked to the list
is deleted as well.
Delete unreferenced query objects
Automatically deletes conditional styles (p. 431) when the
last data item that refers to the conditional style is also
deleted.
Delete unreferenced conditional
styles
54 Report Studio
Chapter 2: Understanding Report Studio
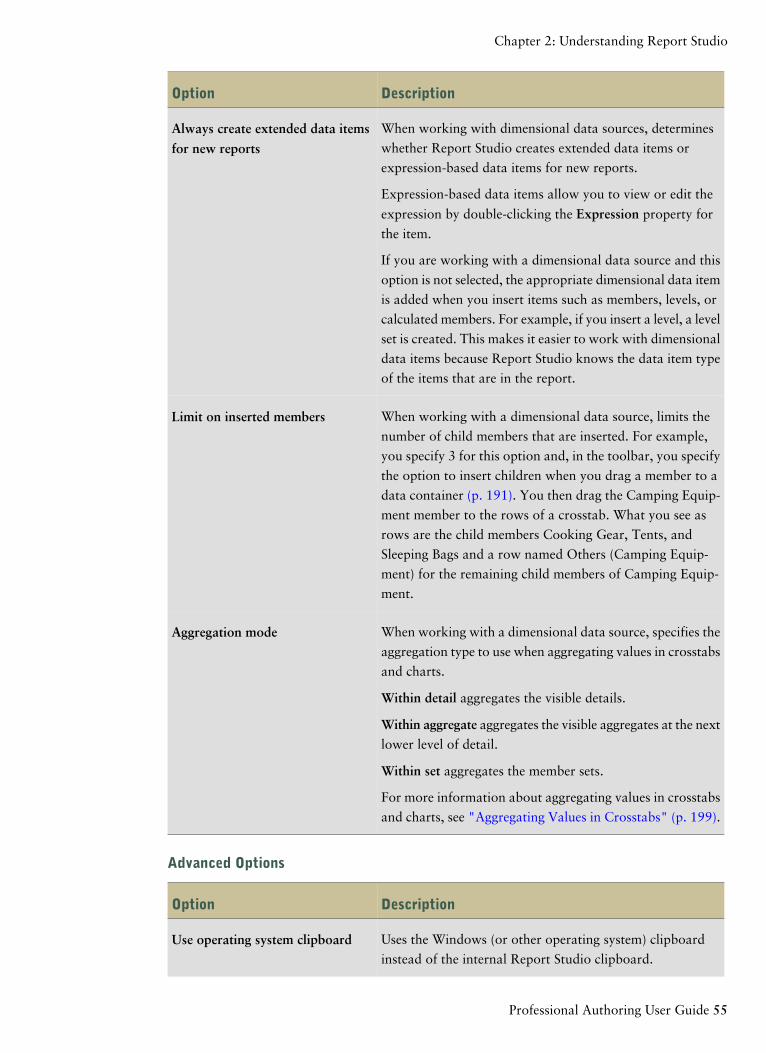
DescriptionOption
When working with dimensional data sources, determines
whether Report Studio creates extended data items or
expression-based data items for new reports.
Always create extended data items
for new reports
Expression-based data items allow you to view or edit the
expression by double-clicking the Expression property for
the item.
If you are working with a dimensional data source and this
option is not selected, the appropriate dimensional data item
is added when you insert items such as members, levels, or
calculated members. For example, if you insert a level, a level
set is created. This makes it easier to work with dimensional
data items because Report Studio knows the data item type
of the items that are in the report.
When working with a dimensional data source, limits the
number of child members that are inserted. For example,
you specify 3 for this option and, in the toolbar, you specify
the option to insert children when you drag a member to a
data container (p. 191). You then drag the Camping Equip-
ment member to the rows of a crosstab. What you see as
rows are the child members Cooking Gear, Tents, and
Sleeping Bags and a row named Others (Camping Equip-
ment) for the remaining child members of Camping Equip-
ment.
Limit on inserted members
When working with a dimensional data source, specifies the
aggregation type to use when aggregating values in crosstabs
and charts.
Aggregation mode
Within detail aggregates the visible details.
Within aggregate aggregates the visible aggregates at the next
lower level of detail.
Within set aggregates the member sets.
For more information about aggregating values in crosstabs
and charts, see "Aggregating Values in Crosstabs" (p. 199).
Advanced Options
DescriptionOption
Uses the Windows (or other operating system) clipboard
instead of the internal Report Studio clipboard.Use operating system clipboard
Professional Authoring User Guide 55
Chapter 2: Understanding Report Studio
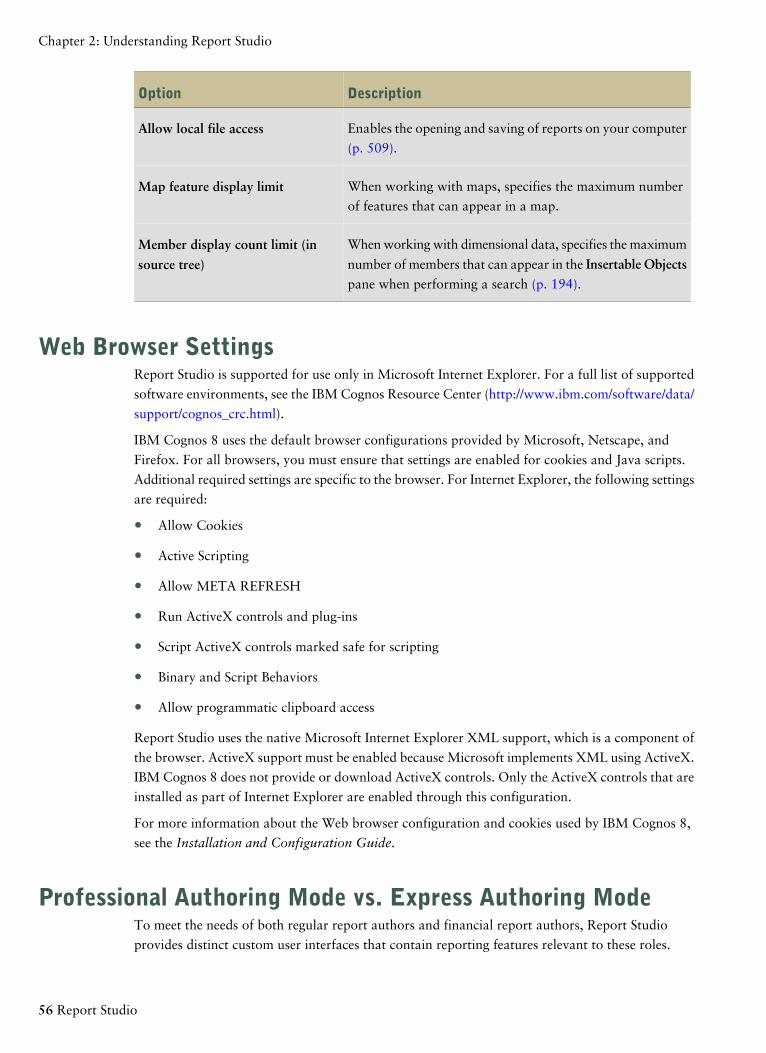
DescriptionOption
Enables the opening and saving of reports on your computer
(p. 509).Allow local file access
When working with maps, specifies the maximum number
of features that can appear in a map.Map feature display limit
When working with dimensional data, specifies the maximum
number of members that can appear in the Insertable Objectspane when performing a search (p. 194).
Member display count limit (in
source tree)
Web Browser SettingsReport Studio is supported for use only in Microsoft Internet Explorer. For a full list of supported
software environments, see the IBM Cognos Resource Center (http://www.ibm.com/software/data/
support/cognos_crc.html).
IBM Cognos 8 uses the default browser configurations provided by Microsoft, Netscape, and
Firefox. For all browsers, you must ensure that settings are enabled for cookies and Java scripts.
Additional required settings are specific to the browser. For Internet Explorer, the following settings
are required:
● Allow Cookies
● Active Scripting
● Allow META REFRESH
● Run ActiveX controls and plug-ins
● Script ActiveX controls marked safe for scripting
● Binary and Script Behaviors
● Allow programmatic clipboard access
Report Studio uses the native Microsoft Internet Explorer XML support, which is a component of
the browser. ActiveX support must be enabled because Microsoft implements XML using ActiveX.
IBM Cognos 8 does not provide or download ActiveX controls. Only the ActiveX controls that are
installed as part of Internet Explorer are enabled through this configuration.
For more information about the Web browser configuration and cookies used by IBM Cognos 8,
see the Installation and Configuration Guide.
Professional Authoring Mode vs. Express Authoring ModeTo meet the needs of both regular report authors and financial report authors, Report Studio
provides distinct custom user interfaces that contain reporting features relevant to these roles.
56 Report Studio
Chapter 2: Understanding Report Studio
Access to each authoring mode is determined by the permissions you have to secured functions and
features. For more information, see the Administration and Security Guide.
Professional Authoring Mode
The Professional authoring mode gives users access to the full range of Report Studio functionality.
In this mode, you can create any report type, including charts, maps, lists, and repeaters, using any
data source (relational or multi-dimensional). Professional authoring mode contains a superset of
the features available in the Express authoring mode. However, you cannot view live data.
Express Authoring Mode
The Express authoring mode provides a simplified and focused Report Studio interface. It is designed
for non-technical users to create traditional financial and management statement reports. Express
authoring mode allows access only to dimensionally-modeled data and uses a member-oriented
data tree.
This authoring mode allows you to see live data and supports only crosstab reports. It contains a
subset of the features available in the Professional authoring mode.
When you are in the Express authoring mode, if you open a report that was authored in the Profes-
sional authoring mode, you can see but cannot modify objects that can be inserted only in the
Professional authoring mode, such as charts, maps, and lists.
Change Authoring ModesIf you have access to both the Professional and Express authoring modes, you can switch between
the two from within Report Studio.
You may want to start authoring your report in the Express authoring mode to see live data and
to easily create your report layout. Then you can switch to the Professional authoring mode to add
more information, such as charts and multiple pages.
Step
● From the View menu, click Authoring Mode and select a mode.
The IBM Cognos 8 SDKWhen you create a report in Report Studio, you are creating a report specification. A report specific-
ation is an XML file that you can view (Tools menu, Show Specification ). In addition, you can
view the specification for a selected object with the Show Specification (Selection) menu option.
Tip: When you are viewing the report specification in Report Studio, you cannot modify or copy
parts of it.
Instead of using Report Studio, you can programmatically create or modify reports by using an
editing tool to work with report specifications. You then use the IBM Cognos 8 software development
kit (SDK) to implement the reports in your IBM Cognos 8 environment. This is useful if, for example,
you must make the same modification in many reports. Rather than opening each report in Report
Studio and making the change, you can automate the process using the SDK, thereby saving you
time. For more information about the IBM Cognos 8 SDK, contact your local sales office.
Professional Authoring User Guide 57
Chapter 2: Understanding Report Studio

Tip: You can also modify the XML code in a report specification by saving the report specification
on your computer (p. 509).
58 Report Studio
Chapter 2: Understanding Report Studio
Chapter 3: Creating a Report
When you create a report, you are actually creating a report specification. The report specification
defines the queries and prompts that are used to retrieve data and the layouts and styles used to
present the data. For simplicity, the report specification is named by the same name as the report.
Creating a report includes
● creating basic reports
● understanding how to create accessible reports
● viewing lineage information for data items
● accessing the IBM WebSphere Business Glossary
● creating reports for IBM Cognos Go! Mobile
● creating reports for mobile devices
Creating a Basic ReportCreating a basic report involves
❑ specifying the data package
❑ choosing a basic report layout
❑ adding data
❑ inserting a single data item
❑ validating the report
❑ saving the report
❑ running the report
❑ setting PDF page options
You can then lay out the report (p. 405) and manipulate the data that will appear in the report. For
information about other tasks that are specific to a report type, see "Lists" (p. 77),
"Crosstabs" (p. 83), "Charts" (p. 93), and "Maps" (p. 137).
Specify the Data PackageSpecify the package that will provide items for the report.
The packages that you use to generate reports are based on models that are created in the modeling
tool, Framework Manager. A model is a set of related objects, such as query subjects, dimensions,
filters, and calculations. When you open a package in IBM Cognos 8, these model objects are visible
in the left frame.
Professional Authoring User Guide 59
The package must be previously created and published to the IBM Cognos Connection portal. For
more information, see the Framework Manager User Guide.
Steps
1. Open Report Studio with the package you want to use.
2. In the Welcome dialog box, choose whether to open a new or existing report or template:
● To create a new report or template, click Create a new report or template and choose a
basic report layout.
Tip: You can specify a language other than the default language for your package by
clicking on the ellipsis (...) button to the right of the Package field, clicking the Language
ellipsis button in the Report Package dialog box, highlighting the desired language, and
then clicking OK. As stated on the language selection dialog box, items such as separators
and decimals may need to be manually updated for language-specific syntax rules as a
result of your selection.
● To open an existing report or template, clickOpen an existing report or template and select
a report.
Objects from the selected package, such as query items, appear on the Source tab of the Insertable
Objects pane.
Tip: You can later change packages (p. 516).
Refresh the Package
If the package that a report is using has changed, refresh it to ensure that you are working with the
latest version.
Steps
1. In the Insertable Objects pane, click the Source tab .
2. Right-click in the Source tab and click Refresh.
Tip: You can also close and reopen the report to upgrade it to the latest version of the package.
Choose a Basic Report LayoutReport Studio includes several basic report layouts that include report objects, such as lists, crosstabs,
maps, repeaters, and headers and footers. You can also choose to start with a blank report or open
an existing report.
Tip: The Budget vs. Actual sample report (p. 529) in the GO Data Warehouse (analysis) package is
based on a basic report layout. For more information about The Great Outdoors Company samples,
see "Sample Reports and Packages" (p. 521).
Steps
1. From the File menu, click New .
60 Report Studio
Chapter 3: Creating a Report
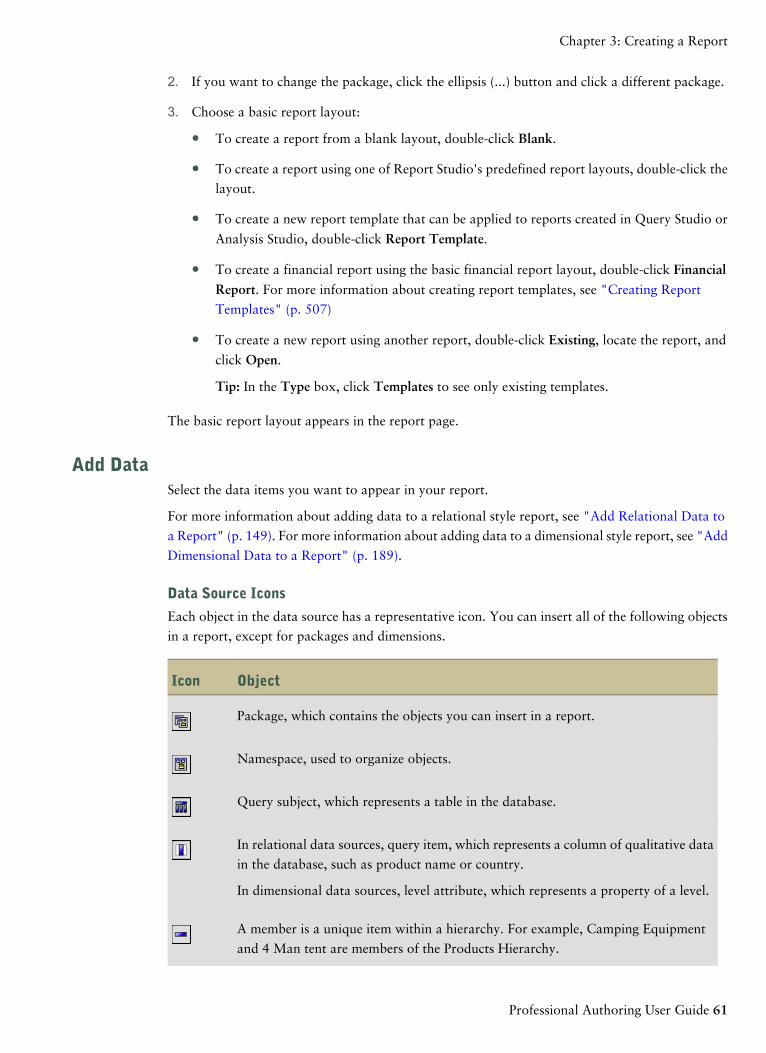
2. If you want to change the package, click the ellipsis (...) button and click a different package.
3. Choose a basic report layout:
● To create a report from a blank layout, double-click Blank.
● To create a report using one of Report Studio's predefined report layouts, double-click the
layout.
● To create a new report template that can be applied to reports created in Query Studio or
Analysis Studio, double-click Report Template.
● To create a financial report using the basic financial report layout, double-click Financial
Report. For more information about creating report templates, see "Creating Report
Templates" (p. 507)
● To create a new report using another report, double-click Existing, locate the report, and
click Open.
Tip: In the Type box, click Templates to see only existing templates.
The basic report layout appears in the report page.
Add DataSelect the data items you want to appear in your report.
For more information about adding data to a relational style report, see "Add Relational Data to
a Report" (p. 149). For more information about adding data to a dimensional style report, see "Add
Dimensional Data to a Report" (p. 189).
Data Source Icons
Each object in the data source has a representative icon. You can insert all of the following objects
in a report, except for packages and dimensions.
ObjectIcon
Package, which contains the objects you can insert in a report.
Namespace, used to organize objects.
Query subject, which represents a table in the database.
In relational data sources, query item, which represents a column of qualitative data
in the database, such as product name or country.
In dimensional data sources, level attribute, which represents a property of a level.
A member is a unique item within a hierarchy. For example, Camping Equipment
and 4 Man tent are members of the Products Hierarchy.
Professional Authoring User Guide 61
Chapter 3: Creating a Report
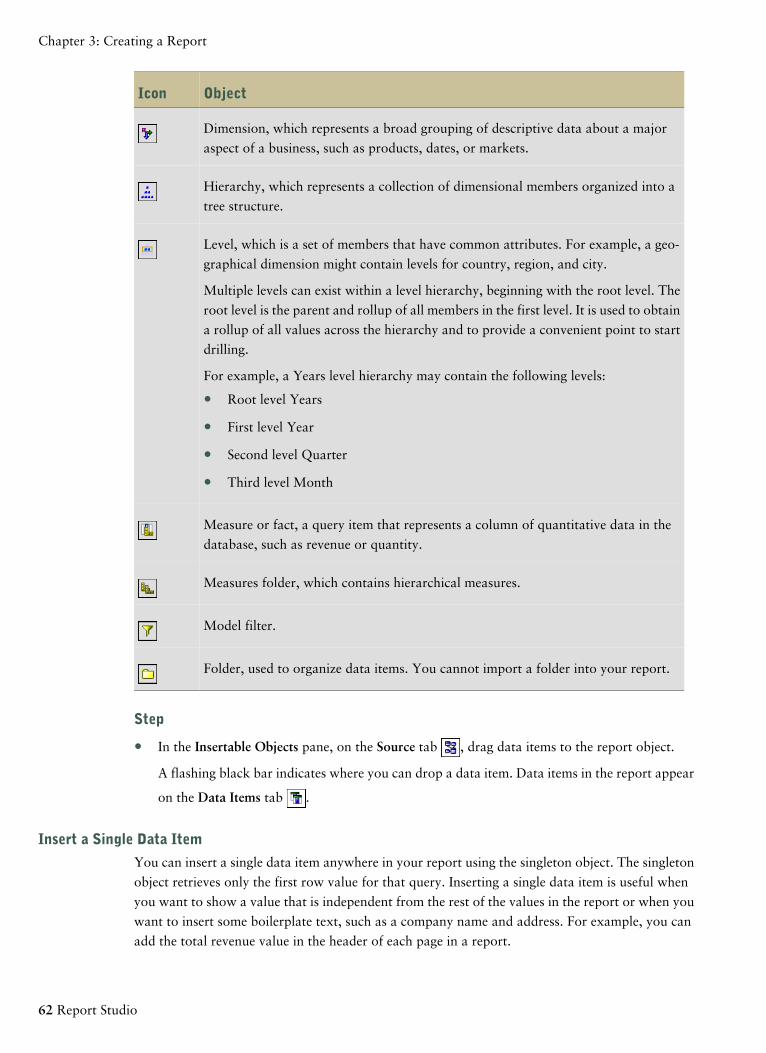
ObjectIcon
Dimension, which represents a broad grouping of descriptive data about a major
aspect of a business, such as products, dates, or markets.
Hierarchy, which represents a collection of dimensional members organized into a
tree structure.
Level, which is a set of members that have common attributes. For example, a geo-
graphical dimension might contain levels for country, region, and city.
Multiple levels can exist within a level hierarchy, beginning with the root level. The
root level is the parent and rollup of all members in the first level. It is used to obtain
a rollup of all values across the hierarchy and to provide a convenient point to start
drilling.
For example, a Years level hierarchy may contain the following levels:
● Root level Years
● First level Year
● Second level Quarter
● Third level Month
Measure or fact, a query item that represents a column of quantitative data in the
database, such as revenue or quantity.
Measures folder, which contains hierarchical measures.
Model filter.
Folder, used to organize data items. You cannot import a folder into your report.
Step
● In the Insertable Objects pane, on the Source tab , drag data items to the report object.
A flashing black bar indicates where you can drop a data item. Data items in the report appear
on the Data Items tab .
Insert a Single Data Item
You can insert a single data item anywhere in your report using the singleton object. The singleton
object retrieves only the first row value for that query. Inserting a single data item is useful when
you want to show a value that is independent from the rest of the values in the report or when you
want to insert some boilerplate text, such as a company name and address. For example, you can
add the total revenue value in the header of each page in a report.
62 Report Studio
Chapter 3: Creating a Report
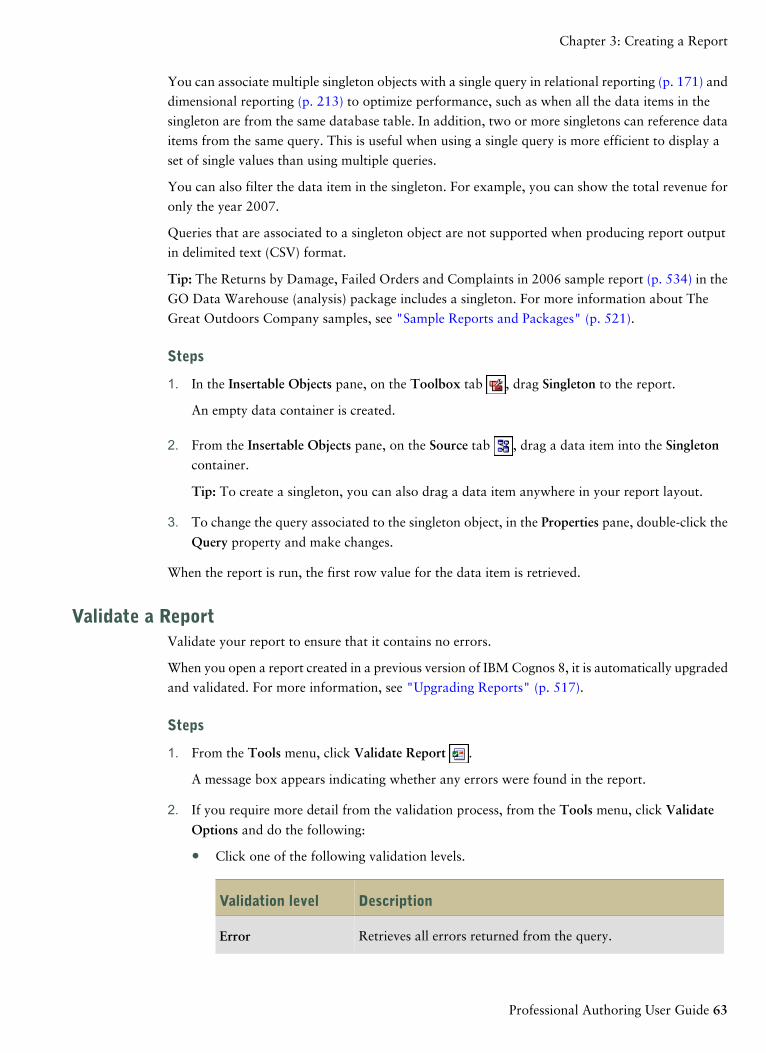
You can associate multiple singleton objects with a single query in relational reporting (p. 171) and
dimensional reporting (p. 213) to optimize performance, such as when all the data items in the
singleton are from the same database table. In addition, two or more singletons can reference data
items from the same query. This is useful when using a single query is more efficient to display a
set of single values than using multiple queries.
You can also filter the data item in the singleton. For example, you can show the total revenue for
only the year 2007.
Queries that are associated to a singleton object are not supported when producing report output
in delimited text (CSV) format.
Tip: The Returns by Damage, Failed Orders and Complaints in 2006 sample report (p. 534) in the
GO Data Warehouse (analysis) package includes a singleton. For more information about The
Great Outdoors Company samples, see "Sample Reports and Packages" (p. 521).
Steps
1. In the Insertable Objects pane, on the Toolbox tab , drag Singleton to the report.
An empty data container is created.
2. From the Insertable Objects pane, on the Source tab , drag a data item into the Singletoncontainer.
Tip: To create a singleton, you can also drag a data item anywhere in your report layout.
3. To change the query associated to the singleton object, in the Properties pane, double-click the
Query property and make changes.
When the report is run, the first row value for the data item is retrieved.
Validate a ReportValidate your report to ensure that it contains no errors.
When you open a report created in a previous version of IBM Cognos 8, it is automatically upgraded
and validated. For more information, see "Upgrading Reports" (p. 517).
Steps
1. From the Tools menu, click Validate Report .
A message box appears indicating whether any errors were found in the report.
2. If you require more detail from the validation process, from the Tools menu, click Validate
Options and do the following:
● Click one of the following validation levels.
DescriptionValidation level
Retrieves all errors returned from the query.Error
Professional Authoring User Guide 63
Chapter 3: Creating a Report
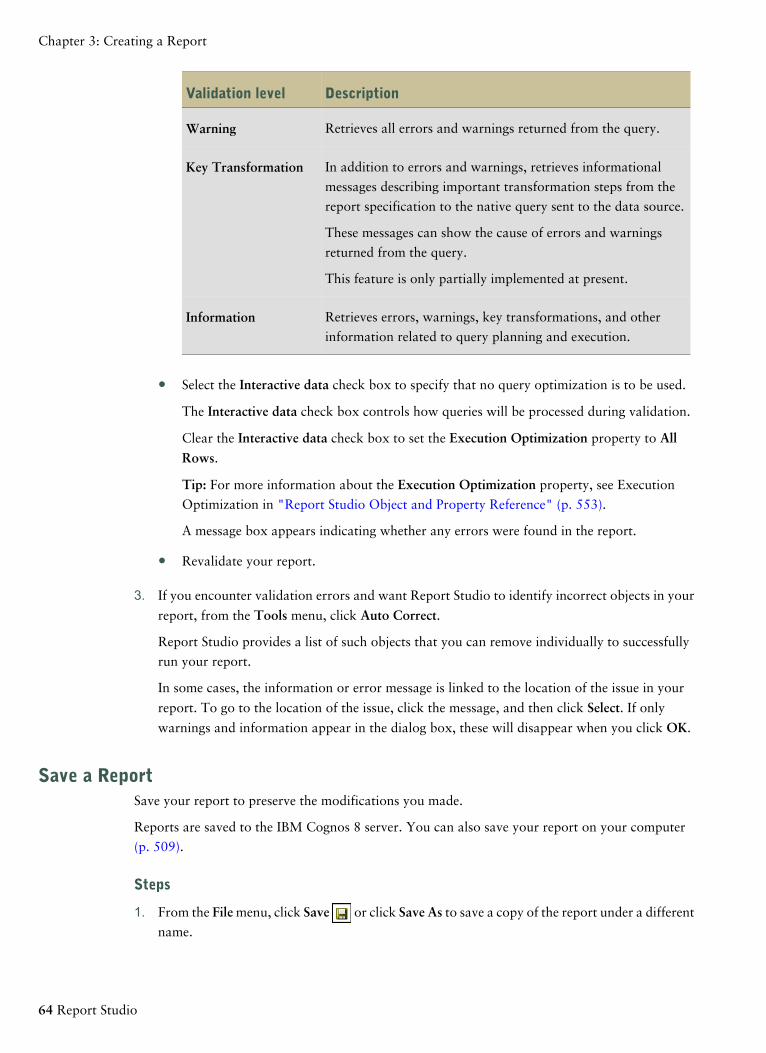
DescriptionValidation level
Retrieves all errors and warnings returned from the query.Warning
In addition to errors and warnings, retrieves informational
messages describing important transformation steps from the
report specification to the native query sent to the data source.
Key Transformation
These messages can show the cause of errors and warnings
returned from the query.
This feature is only partially implemented at present.
Retrieves errors, warnings, key transformations, and other
information related to query planning and execution.Information
● Select the Interactive data check box to specify that no query optimization is to be used.
The Interactive data check box controls how queries will be processed during validation.
Clear the Interactive data check box to set the Execution Optimization property to All
Rows.
Tip: For more information about the Execution Optimization property, see Execution
Optimization in "Report Studio Object and Property Reference" (p. 553).
A message box appears indicating whether any errors were found in the report.
● Revalidate your report.
3. If you encounter validation errors and want Report Studio to identify incorrect objects in your
report, from the Tools menu, click Auto Correct.
Report Studio provides a list of such objects that you can remove individually to successfully
run your report.
In some cases, the information or error message is linked to the location of the issue in your
report. To go to the location of the issue, click the message, and then click Select. If only
warnings and information appear in the dialog box, these will disappear when you click OK.
Save a ReportSave your report to preserve the modifications you made.
Reports are saved to the IBM Cognos 8 server. You can also save your report on your computer
(p. 509).
Steps
1. From the File menu, click Save or click Save As to save a copy of the report under a different
name.
64 Report Studio
Chapter 3: Creating a Report
2. If you are saving the report for the first time, specify where to save the report and type a file
name.
For information about setting up folders in IBM Cognos Connection for your reports, see the
IBM Cognos Connection User Guide.
3. Click Save.
Run a ReportRun your report to see the data that is retrieved. Save time by validating it first (p. 63) to check for
errors.
You can also run a report or a group of reports in IBM Cognos Connection. Furthermore, you can
save report outputs to a file system. For more information, see the Administration and Security
Guide.
You can specify not to render a report page if it does not contain any data (p. 67).
If you run a report that uses functions or features not supported by the data source, an error message
appears. We recommend that you periodically test your reports while you author them in Report
Studio to ensure that you do not encounter multiple error messages when you run the report.
Steps
1. Open a report.
2. If you want to clear parameter values stored on the IBM Cognos 8 server, from the File menu,
click Clear Parameter Values.
Parameter values stored by the IBM Cognos 8 server include signon, validation, and prompt
information. For example, if you define two data source connections in IBM Cognos Connection
that point to the same data source, you are prompted to choose one when you run a report.
This information is stored so that you are not prompted each time you run the report.
3. If you want to view only the tabular data, from the Run menu, click View Tabular Data .
If the report contains multiple queries, you must first click an object, such as a list or crosstab,
that uses the query for which you want to view the tabular data.
Use this command to ensure that the right results appear. For example, you create a calculation
(p. 187) and you want to ensure it is giving you the results you want.
Tip: You can also view tabular data in Query Explorer, which is useful when you are building
queries.
4. If you want to set run options, from the Run menu, click Run Options.
The default value is the value of the selected corresponding run option in IBM Cognos Connec-
tion.
The run options that you set apply only to the current session. When you close Report Studio,
the options return to the default settings.
5. Change any values for the current session.
Professional Authoring User Guide 65
Chapter 3: Creating a Report
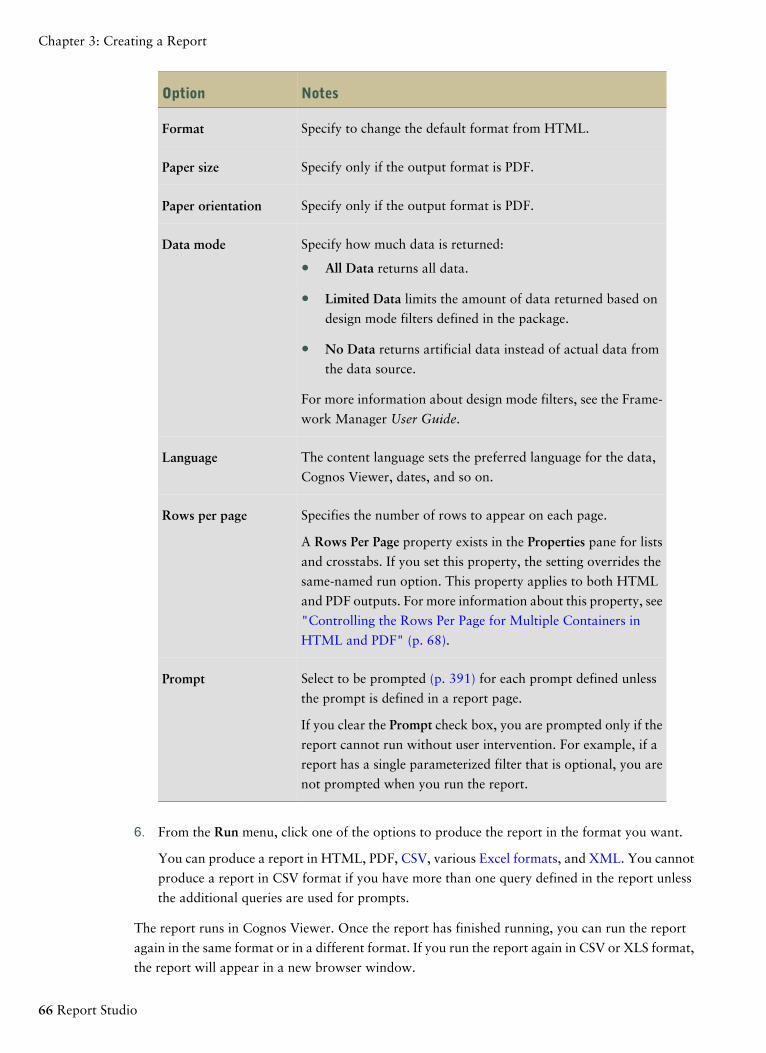
NotesOption
Specify to change the default format from HTML.Format
Specify only if the output format is PDF.Paper size
Specify only if the output format is PDF.Paper orientation
Specify how much data is returned:Data mode
● All Data returns all data.
● Limited Data limits the amount of data returned based on
design mode filters defined in the package.
● No Data returns artificial data instead of actual data from
the data source.
For more information about design mode filters, see the Frame-
work Manager User Guide.
The content language sets the preferred language for the data,
Cognos Viewer, dates, and so on.Language
Specifies the number of rows to appear on each page.Rows per page
A Rows Per Page property exists in the Properties pane for lists
and crosstabs. If you set this property, the setting overrides the
same-named run option. This property applies to both HTML
and PDF outputs. For more information about this property, see
"Controlling the Rows Per Page for Multiple Containers in
HTML and PDF" (p. 68).
Select to be prompted (p. 391) for each prompt defined unless
the prompt is defined in a report page.Prompt
If you clear the Prompt check box, you are prompted only if the
report cannot run without user intervention. For example, if a
report has a single parameterized filter that is optional, you are
not prompted when you run the report.
6. From the Run menu, click one of the options to produce the report in the format you want.
You can produce a report in HTML, PDF, CSV, various Excel formats, and XML. You cannot
produce a report in CSV format if you have more than one query defined in the report unless
the additional queries are used for prompts.
The report runs in Cognos Viewer. Once the report has finished running, you can run the report
again in the same format or in a different format. If you run the report again in CSV or XLS format,
the report will appear in a new browser window.
66 Report Studio
Chapter 3: Creating a Report
The options available in Cognos Viewer depend on the capabilities set by the administrator for
each user. For more information, see the Administration and Security Guide.
Running a Report Against a Dimensional Data Source
You can cancel a report that is running against Microsoft SQL Server Analysis Services only during
the initial portion of its execution. After this time, the report runs to completion.
The same behavior applies to SAP BW data sources.
In Framework Manager, you can also control the number of levels within a hierarchy from which
members, or values, are extracted from the hierarchy to populate a tree prompt.
For SAP BW, you can reduce the number of hierarchy levels to limit the number of nodes by setting
the SAP BW variable property trimHierarchyLevels to 1. This removes the lowest level from the
hierarchy prior to creating the list of nodes.
Units of Measure Notation
When running a report against an SAP BW data source, units of measure are included in the same
column as the data values, separated by one space. For example, Celsius and Fahrenheit notations
are appended to the end of the value.
If you see an asterisk character (*), one of the following was detected:
● an unknown currency
● a value with an unknown or questionable unit of measure, such as a mixed currency calculation
or rollup
Mixed currency values occur when you calculate values with different currencies.
This behavior occurs when you are using an IBM Cognos cube as a data source.
This behavior also occurs for SAP BW data sources.
Unsupported SAP Variable Properties
The following SAP variable properties are not supported:
● Exclusionary ranges appear as an inclusionary prompt.
● Mandatory not initial appears as a mandatory prompt.
When using Business Explorer (BEx) to define variables in your SAP data source, avoid using
exclusionary ranges and the mandatory not initial property.
Specify Not to Render a Page If It Does Not Contain Data
You can specify not to render a report page if the page does not contain any data when the report
is run.
Steps
1. In the report page, click a data container.
2. In the Properties pane, click the select ancestor button and click the data container type.
Professional Authoring User Guide 67
Chapter 3: Creating a Report
For example, if the data container is a list, click List.
3. Set the Render Page when Empty property to No.
4. Repeat steps 1 to 3 for all other data containers in the page and any table of contents objects
(p. 413).
When you run the report, if no data is produced in all data containers and table of contents objects
in a page, the page is not rendered. The page is not rendered even if the page contains other objects,
such as text items or images.
Controlling the Rows Per Page for Multiple Containers in HTML and PDF
If you have more than one data container in a report, such as a list and a crosstab, you can control
how the report is rendered in HTML and PDF by setting the Rows Per Page property for each
container.
For HTML output, the report property option Page break by data container for interactive
HTML (p. 427) controls whether the default number of rows is rendered for each data container
on each page.
IBM Cognos 8 uses the following rules when rendering reports in HTML and PDF:
● If the Rows Per Page property is not set for any of the data containers, 20 rows per page are
rendered in HTML and each page is completely filled in PDF. The first data container is rendered
until there is no more data, followed by the next container, and so on.
Tip: The number of rows that appear on a PDF page depends on the font size set in the report.
● If the Rows Per Page property is set for each data container, the specified numbers of rows are
rendered in HTML and PDF on each page until there is no more data.
● If the property is set for only some of the containers, the specified numbers of rows are rendered
in HTML and PDF on each page until there is no more data. For the remaining containers, 20
rows per page are rendered on each page in HTML and each page is completely filled in PDF.
For example, you have two lists, List1 and List2. You set the Rows Per Page property to 5 for
List1. When you run the report in HTML, the first page contains the first 5 rows from List1
followed by the first 15 rows of List2.
● If no data is returned for a data container, an empty container is rendered.
Producing a Report in CSV Format
IBM Cognos 8 can produce reports in CSV format so you can open them in other applications,
such as Microsoft Excel. Reports saved in CSV format
● support Unicode data across many client operating systems
● are UTF-16 Little Endian data encoded
● include a BOM (Byte Order Mark) at the beginning of the file
● are tab-delimited
● do not enclose strings in quotation marks
68 Report Studio
Chapter 3: Creating a Report
● use a new line character to delimit rows
You can open reports saved in CSV format using Microsoft Excel, Microsoft Windows Wordpad,
and Star Office. By default, reports produced in CSV format will appear in the application associated
with the .csv file type.
You cannot produce the following in CSV format:
● maps
● charts that do not have at least one category or series
● reports that have more than one query defined in the report, unless the additional queries are
used for prompts
In IBM Cognos Connection, you can configure the CSV output to suit your environment. For
example, you can specify the character used to delimit fields. For more information, see the
Administration and Security Guide.
Producing a Report in Excel Format
IBM Cognos 8 can produce reports in Excel format. Three options are available:
● Excel 2000 Single Sheet will produce reports on one sheet that you can view in Microsoft Excel
versions earlier than 2002.
● Excel 2002 will produce reports that you can view in Microsoft Excel versions earlier than
2007.
● Excel 2007 will produce reports that you can view in Microsoft Excel version 2007.
The Excel 2000 format can be viewed with versions of Excel 2000 and later. It supports up to
65,536 rows and multiple sheets. The Excel 2000 format is only available in IBM Cognos 8 when
IBM Cognos Application Firewall validation is disabled.
Excel 2000 single sheet format offers improved security. Excel 2000 may have cookies in the URLs
to spreadsheets, which could be used to illegally impersonate a user. Excel 2000 single sheet format
does not use outgoing URLs. However, there is a limit of 65,536 rows, and page breaks for multiple-
author pages are ignored.
Excel 2002 format and Excel 2000 single sheet format also offer the following benefits:
● Both work with SSL protocol.
● Both work with a single signon.
Secure reports can be accessed without subsequent signons because the system automatically
identifies users and provides security information.
● Both work with Netscape 7.01.
● Spreadsheets are contained in a single file for reliable spreadsheet navigation.
The IBM Cognos 8 full date format does not always appear correctly in Microsoft Excel 2000 if it
is on a system with a regional setting other than English. This does not occur with Microsoft Excel
2002 or 2003 versions. To fix this, reapply the proper format in Excel.
Professional Authoring User Guide 69
Chapter 3: Creating a Report
Excel 2007 format renders report output in native Excel XML format, also known as XLSX, that
provides a fast way to deliver native Excel spreadsheets to Microsoft Excel 2002, Microsoft Excel
2003, and Microsoft Excel 2007. Users of Microsoft Excel 2002 and Microsoft Excel 2003 must
install the Microsoft Office Compatibility Pack, which provides file open and save capabilities for
the new format. The output is similar to other Excel formats, with the following exceptions:
● Charts are rendered as static images.
● Row height can change in the rendered report to achieve greater fidelity.
Limitations exist when producing reports in XLS format. For more information, see "Limitations
When Producing Reports in Microsoft Excel Format" (p. 545).
Producing a Report in XML Format
XML report outputs save the report data in a format that conforms to an internal schema,
xmldata.xsd. You can find this schema file in c8_location/bin.
This format consists of a dataset element, which contains a metadata element and a data element.
The metadata element contains the data item information in item elements. The data element contains
all the row and value elements.
You can create models from reports and other data that conform to the xmldata.xsd schema. This
is useful if you want to use a report as a data source for another report, or if you use a database
that cannot be read by Framework Manager. In this case, export the data from the data source to
an XML file, in conformance with the xmldata schema, and then open the XML file in Framework
Manager.
For more information, see the Framework Manager User Guide.
You cannot produce the following in XML format:
● maps
● charts that do not have at least one category or series
● reports that have more than one query defined in the report, unless the additional queries are
used for prompts
Set PDF Page OptionsSet PDF page options to control how report pages appear in PDF. You can set PDF page options
for individual report pages or for all report pages in a layout (p. 442).
Tip: The PDF Page Properties sample report (p. 541) in the GO Sales (analysis) package includes
PDF page options. For more information about The Great Outdoors Company samples, see "Sample
Reports and Packages" (p. 521).
You can also set PDF page options in IBM Cognos Connection. For more information, see the IBM
Cognos Connection User Guide.
Steps
1. To set PDF page options for all report pages in a layout, do the following:
● From the File menu, click PDF Page Setup and set the page options.
70 Report Studio
Chapter 3: Creating a Report
2. To set PDF page options for an individual page, do the following:
● Pause the pointer over the page explorer button and click the page.
● In the work area, click anywhere on the page.
● In the Properties pane, click the select ancestor button and click Page.
● Double-click the PDF Page Setup property, select the Override the page setup for this pagecheck box, and set the page options.
Creating Accessible ReportsCreating accessible reports ensures access of information to all users, with all levels of ability.
For example, blind users may use screen reading technology to access the information in a report.
The following are some design considerations for creating accessible reports:
● Avoid using visual cues, such as bold text or color, to convey important information.
● Avoid using pictures and OLE Objects in PDF documents, as these items are tagged as artifacts
and ignored by the screen reader.
● Avoid using conditional formatting to convey important information.
● Ensure there is a table corresponding to chart types that are rendered as images because the
screen reader ignores this information.
● Deliver reports through HTML, as it is the most supported output format for most screen
readers.
● Always ensure there is a title on the report.
● Gain an understanding for screen reading technology.
● Avoid spelling and grammar errors, as they cause the screen reading software to misinterpret
the information.
● Avoid using features like calendar boxes and up and down selections on time controls. Using
prompts such as check boxes, radio buttons, combo boxes, and multi-select boxes is fine.
● Ensure the target application is accessible when choosing to use embedded Web applications
or drill-through paths.
● Avoid using large, complex list or crosstab reports.
Displaying the information in multiple simple lists or crosstab reports is more manageable for
users of Assistive Technology.
View Lineage Information for a Data ItemView lineage information of a data item to see what the item represents before you add it to a
report. Lineage information traces the metadata of an item back through the package and the data
Professional Authoring User Guide 71
Chapter 3: Creating a Report
sources used by the package. Lineage also displays any data item filters that were added by the
report author or that were defined in the data model. Viewing lineage information ensures that you
add the correct data items to a report. For example, you can view the lineage information of a
model calculation to see how it was created.
Note: Lineage is not supported in reports that are not linked to packages.
You can use the lineage tool that comes with IBM Cognos 8, or you can use another lineage tool
by specifying the URL to the tool in IBM Cognos Administration. Note that if the URL source is
secured, the source must be able to prompt users for a password because IBM Cognos 8 does not
pass security information. IBM Cognos 8 also supports the IBM Metadata Workbench as a lineage
tool. For more information about configuring other lineage tools, see the Administration and
Security Guide.
Tip: The Customer Returns and Satisfaction sample report (p. 530) in the GO Data Warehouse
(analysis) package includes lineage information. For more information about The Great Outdoors
Company samples, see "Sample Reports and Packages" (p. 521).
The IBM Cognos 8 Lineage Tool
The IBM Cognos 8 lineage tool includes two views: the business view and the technical view.
Business View
The business view shows high-level textual information that describes and explains the data item
and the package from which it comes. This information is taken from IBM Cognos Connection
and the Framework Manager model.
Technical View
The technical view shows a graphical representation of the lineage of the selected data item. The
lineage traces the data item from the package to the data sources used by the package.
When you click an item, its properties appear below it. If you click an item in the Package area,
you see the model properties of the item. If you click an item in the Data Sources area, you see the
data source properties of the item.
72 Report Studio
Chapter 3: Creating a Report
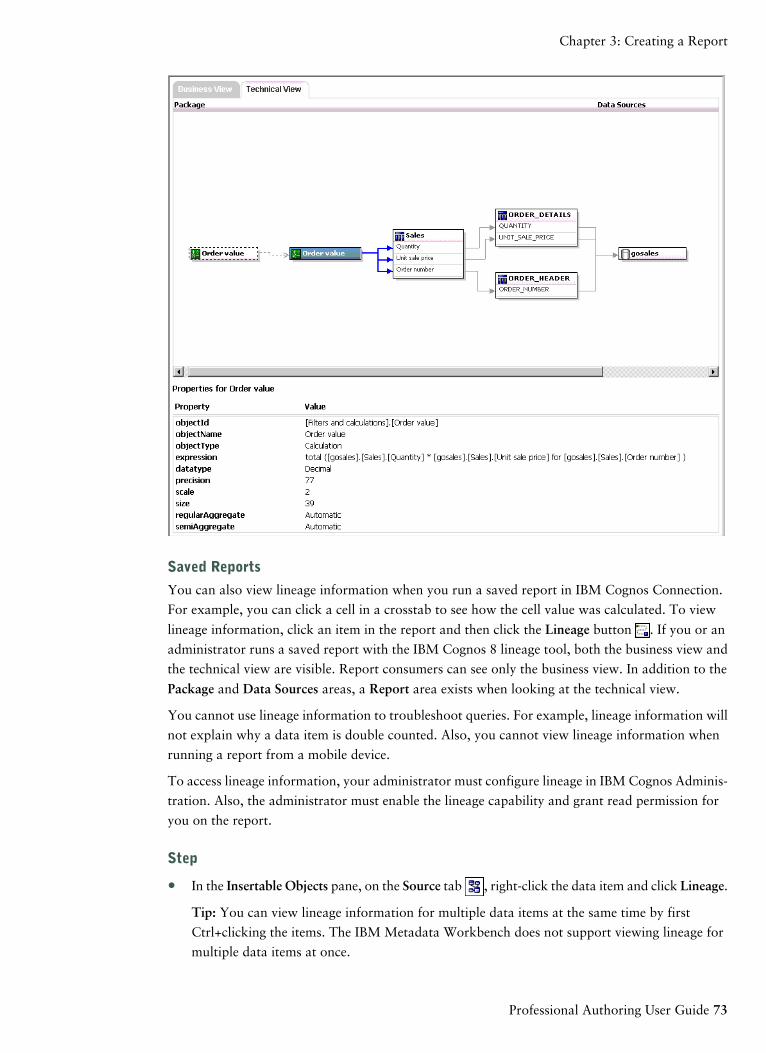
Saved Reports
You can also view lineage information when you run a saved report in IBM Cognos Connection.
For example, you can click a cell in a crosstab to see how the cell value was calculated. To view
lineage information, click an item in the report and then click the Lineage button . If you or an
administrator runs a saved report with the IBM Cognos 8 lineage tool, both the business view and
the technical view are visible. Report consumers can see only the business view. In addition to the
Package and Data Sources areas, a Report area exists when looking at the technical view.
You cannot use lineage information to troubleshoot queries. For example, lineage information will
not explain why a data item is double counted. Also, you cannot view lineage information when
running a report from a mobile device.
To access lineage information, your administrator must configure lineage in IBM Cognos Adminis-
tration. Also, the administrator must enable the lineage capability and grant read permission for
you on the report.
Step
● In the Insertable Objects pane, on the Source tab , right-click the data item and click Lineage.
Tip: You can view lineage information for multiple data items at the same time by first
Ctrl+clicking the items. The IBM Metadata Workbench does not support viewing lineage for
multiple data items at once.
Professional Authoring User Guide 73
Chapter 3: Creating a Report
The lineage tool opens showing the lineage information of the selected data item.
Access the IBM®WebSphere® Business GlossaryIf you use the IBM WebSphere Business Glossary, you can access the glossary from any of the fol-
lowing data objects in Report Studio:
● Query subject
● Query item
● Measure
● Dimension
● Hierarchy
● Level
● Property/attribute
● Top node member
● Member
● Level item
Step
● Right-click the data item and click Glossary.
The IBM WebSphere Business Glossary appears.
Creating Reports for IBM Cognos 8 Go! OfficeIBM Cognos 8 Go! Office provides an integrated environment for IBM Cognos products and
Microsoft Office. You can use IBM Cognos 8 Go! Office to select pieces of reports to embed in
Microsoft Excel workbooks, Microsoft Word documents, or Microsoft PowerPoint presentations,
including data, metadata, headers, footers, and charts. You can use predefined reports or you can
create new content using PowerPlay Web, Query Studio, or Report Studio.
Note that to access PowerPlay content, your administrator must configure PowerPlay to work with
IBM Cognos 8. PowerPlay content that is published only to Upfront is not available to IBM Cognos 8
Go! Office.
Because IBM Cognos 8 Go! Office cannot fully convert highly formatted reports into Excel or other
Microsoft document output types, you may not get the results that you want.
To create effective reports for IBM Cognos 8 Go! Office, follow these recommendations:
● Create content to meet specific Microsoft Office integration needs.
For example, in IBM Cognos 8, many options are available to format data. Use less formatting
to make data more accessible to Office applications.
74 Report Studio
Chapter 3: Creating a Report
● Organize reports.
You can publish workbooks to IBM Cognos Connection and organize them with your reports
in Public Folders or My Folders. For more information, see the IBM Cognos Connection User
Guide. By organizing your content, you can quickly retrieve the information that you want.
Tip: Workbooks, documents, and presentations that are enabled for IBM Cognos 8 Go! Office
are identified by their own unique icons, helping you to distinguish them from other types of
files.
● Optimize report templates for Microsoft Office.
If you rely on IT personnel or other report authors to create content, request report templates
that are optimized for your Microsoft Office integration needs. You may want to request only
the data elements or queries that you need and request minimal formatting so that you can
more easily use Microsoft Office formatting capabilities with the IBM Cognos content. For
example, reports authored in Report Studio can contain list objects embedded within list objects
with specific formatting applied. When converted to the tabular representation available in
Excel, these reports may not be rendered in the same way in which they appear in IBM Cognos 8.
● Format elements in the Office application.
Instead of formatting objects in IBM Cognos 8, add the formatting in the Office application.
By applying less formatting in IBM Cognos 8, you can import more data into the desired loca-
tions.
● Label report elements using descriptive names.
This practice makes them more easier to find after you import them. Examples of report elements
include lists, crosstabs, and charts.
● Do not nest report objects.
If you nested report objects, some objects may not appear in the correct location, or they may
not appear at all. In addition, nesting report objects may cause the following error message to
appear:
RDS-ERR-1000 Report Data Service could not process from the content provider.
For example, this error occurs if a repeater or repeater table is inside a block or table. It also
appears when layout objects, such as lists, crosstabs, and charts, are in a conditional block that
is inside another block or table.
● Keep table sizes small.
For example, because of the size of slides, the maximum number of rows and columns that you
can have in PowerPoint tables is 25. Although Word and Excel permit larger tables, it takes
more time to download and render them.
● Use images with transparent backgrounds.
The background will show through the image in the Office application, making the image look
like part of the presentation. If you want, you can then supply your own background color.
● Specify the height and width of images in a list.
Professional Authoring User Guide 75
Chapter 3: Creating a Report
This practice ensures that the image appears in the correct size in the Office application.
● Remember that graphs and charts are imported as images.
Images in IBM Cognos 8 have image maps associated with them to enable tooltips and hotspots.
IBM Cognos 8 Go! Office cannot import tooltips and hotspots into Office applications.
● Consider the additional limitations that exist when producing reports in Excel format (p. 545).
Creating Reports for Mobile DevicesYou can send Report Studio reports to mobile devices that have IBM Cognos 8 Go! Mobile installed.
Note: The following Report Studio prompts are not supported in IBM Cognos Go! Mobile:
● prompts that are directly on a report page (p. 398)
● prompts that allow users to select multiple ranges; for example, a prompt that allows users to
view data for January 1 to February 15 and February 17 to March 2 (p. 400)
For more information about IBM Cognos 8 Go! Mobile, see the IBM Cognos 8 Go! Mobile
Installation and Administration Guide and User Guide.
76 Report Studio
Chapter 3: Creating a Report
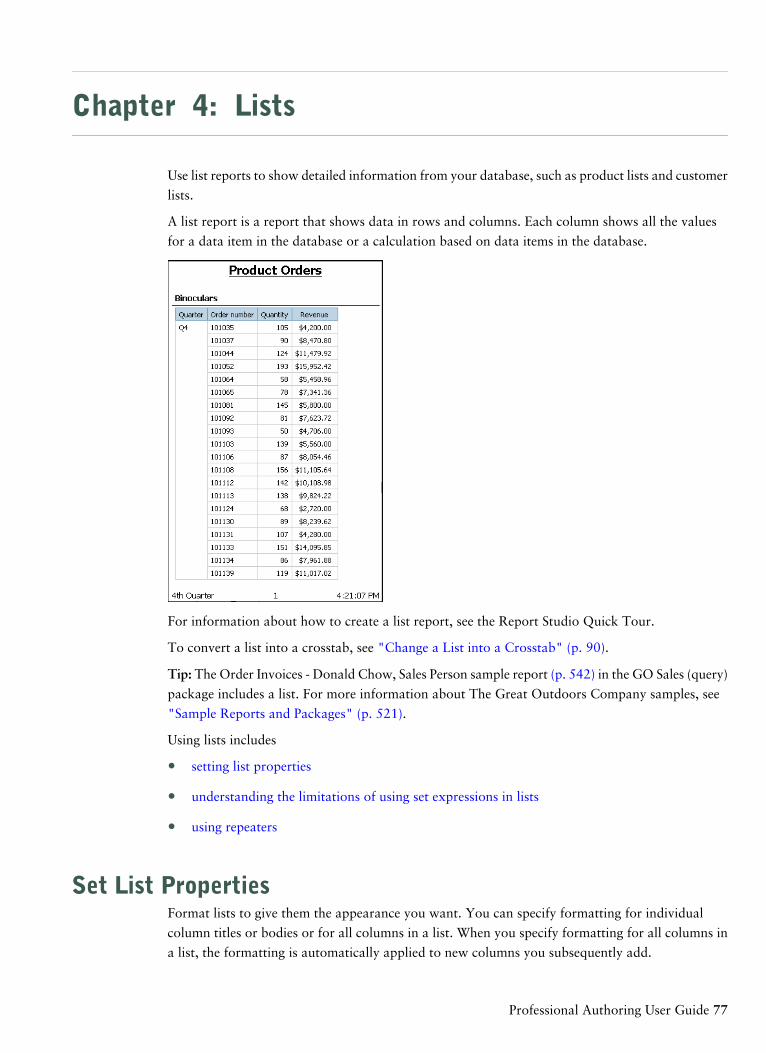
Chapter 4: Lists
Use list reports to show detailed information from your database, such as product lists and customer
lists.
A list report is a report that shows data in rows and columns. Each column shows all the values
for a data item in the database or a calculation based on data items in the database.
For information about how to create a list report, see the Report Studio Quick Tour.
To convert a list into a crosstab, see "Change a List into a Crosstab" (p. 90).
Tip: The Order Invoices - Donald Chow, Sales Person sample report (p. 542) in the GO Sales (query)
package includes a list. For more information about The Great Outdoors Company samples, see
"Sample Reports and Packages" (p. 521).
Using lists includes
● setting list properties
● understanding the limitations of using set expressions in lists
● using repeaters
Set List PropertiesFormat lists to give them the appearance you want. You can specify formatting for individual
column titles or bodies or for all columns in a list. When you specify formatting for all columns in
a list, the formatting is automatically applied to new columns you subsequently add.
Professional Authoring User Guide 77
You can also quickly format lists by applying table styles (p. 418).
Steps
1. To format an individual column, do the following:
● Click the column title or column body.
To format the text in the column title or the data in the column body, click the unlock
button in the toolbar and then click the title or body.
To format the whole column, click the select ancestor button in the title bar of the
Properties pane and click List Column.
● In the Properties pane, set the property value.
For example, to specify a background color, click Background Color and choose the color.
2. To format all columns, do the following:
● Click a column in the list.
● To format list column bodies, click the select ancestor button in the title bar of the Properties
pane and click List Columns Body Style.
● To format list column titles, click the select ancestor button in the title bar of the Properties
pane and click List Columns Title Style.
● To format entire columns, click the select ancestor button in the title bar of the Properties
pane and click List Columns.
● To format the entire list, click the select ancestor button in the title bar of the Properties
pane and click List.
● In the Properties pane, set the property value.
For example, to specify a background color, click Background Color and choose the color.
Formatting for specific columns overrides formatting for entire columns. For example, you specify
red as the background color for a specific column body and green as the background color for all
columns. When you run the report, the specific column body is red and the remaining columns in
the list are green. New columns added to the list will be green.
For more information about formatting reports, see "Laying Out a Report" (p. 405).
Limitations When Using Set Expressions in List ReportsIn list reports, we recommend that you avoid using set expressions. When in a list, set expressions,
such as TopCount, may produce fewer rows than in the corresponding crosstab.
For example, the following list report includes Year in the first column, followed by a column
containing an expression that returns the top three months by revenue. Only three rows appear in
the report and they correspond to the top three months across all years. If you group by Year, the
report still shows only three months. However, the corresponding crosstab report, you see three
months for each year.
78 Report Studio
Chapter 4: Lists
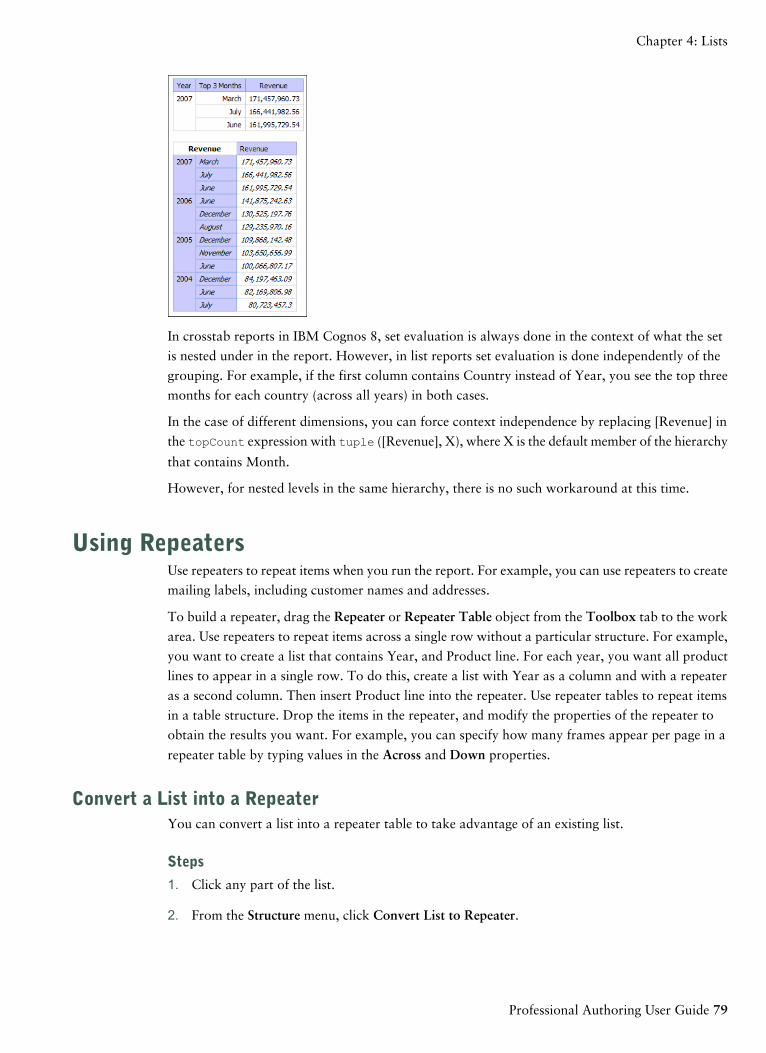
In crosstab reports in IBM Cognos 8, set evaluation is always done in the context of what the set
is nested under in the report. However, in list reports set evaluation is done independently of the
grouping. For example, if the first column contains Country instead of Year, you see the top three
months for each country (across all years) in both cases.
In the case of different dimensions, you can force context independence by replacing [Revenue] in
the topCount expression with tuple ([Revenue], X), where X is the default member of the hierarchy
that contains Month.
However, for nested levels in the same hierarchy, there is no such workaround at this time.
Using RepeatersUse repeaters to repeat items when you run the report. For example, you can use repeaters to create
mailing labels, including customer names and addresses.
To build a repeater, drag the Repeater or Repeater Table object from the Toolbox tab to the work
area. Use repeaters to repeat items across a single row without a particular structure. For example,
you want to create a list that contains Year, and Product line. For each year, you want all product
lines to appear in a single row. To do this, create a list with Year as a column and with a repeater
as a second column. Then insert Product line into the repeater. Use repeater tables to repeat items
in a table structure. Drop the items in the repeater, and modify the properties of the repeater to
obtain the results you want. For example, you can specify how many frames appear per page in a
repeater table by typing values in the Across and Down properties.
Convert a List into a RepeaterYou can convert a list into a repeater table to take advantage of an existing list.
Steps
1. Click any part of the list.
2. From the Structure menu, click Convert List to Repeater.
Professional Authoring User Guide 79
Chapter 4: Lists
Example - Create Mailing LabelsYou are a report author at The Great Outdoors Company, which sells sporting equipment. You
are requested to create mailing labels for all of the company's retailers.
Steps
1. Open Report Studio with the GO Data Warehouse (query) package.
2. In the Welcome dialog box, click Create a new report or template.
3. In the New dialog box, click Repeater Table and click OK.
4. Click the repeater, click the select ancestor button in the Properties pane title bar, and click
Repeater Table.
5. In the Properties pane, set the following properties:
● Set the Across property to 2.
● Set the Down property to 5.
● Double-click the Table Properties property, select the Fixed size check box, and click OK.
6. In the Insertable Objects pane, on the Toolbox tab, drag the Table object to the repeater.
The Insert Table dialog box appears.
7. In the Number of columns box, type 1 and click OK.
8. Click the table, ensure that you see Table Cell in the Properties pane title bar, and modify the
following properties:
● Double-click Background Image, click Browse, click logo.jpg, and click OK.
● In the Background Image dialog box, under Position, click the align top right button.
● Under Tiling, click Do not tile and click OK.
● Double-click Size & Overflow, and in the Height box, type 175, and click OK.
9. Click the table, click the select ancestor button in the Properties pane title bar, and click Table.
10. In the Properties pane, specify properties for the table:
● Double-click Border.
● In the Style box, click Solid line.
● In the Width box, click 1 pt.
● In the Color box, click Black.
● Under Preview, click the apply all borders button and click OK.
● Double-click Font, and under the Size box, click 8pt, and click OK.
80 Report Studio
Chapter 4: Lists
11. In the Insertable Objects pane, on the Toolbox tab, drag the Block object to the repeater 8
times to create 8 blocks.
12. Drag the Text Item object to the first block:
● In the Text dialog box, type To: and click OK.
● Select the text item.
● Double-click the Font property, set the weight to Bold, and click OK.
13. Click the first block, and, in the Properties pane, specify properties for the first block:
● Double-click the Padding property, type 35 in the box on the right, click mm as the unit,
and click OK.
● Set the Horizontal Alignment property to Center.
14. In the Insertable Objects pane, on the Source tab , expand Sales and Marketing (query),
Sales (query), and Retailer site and drag seven data items to the remaining seven blocks.
15. Ctrl+click the seven blocks to select them, and in the Properties pane, specify properties for the
seven blocks:
● Double-click the Padding property, type 25 in the box on the left, click mm as the unit,
and click OK.
● Set the Horizontal Alignment property to Left.
When you run the report, each page contains 10 mailing labels in two columns.
Professional Authoring User Guide 81
Chapter 4: Lists

82 Report Studio
Chapter 4: Lists
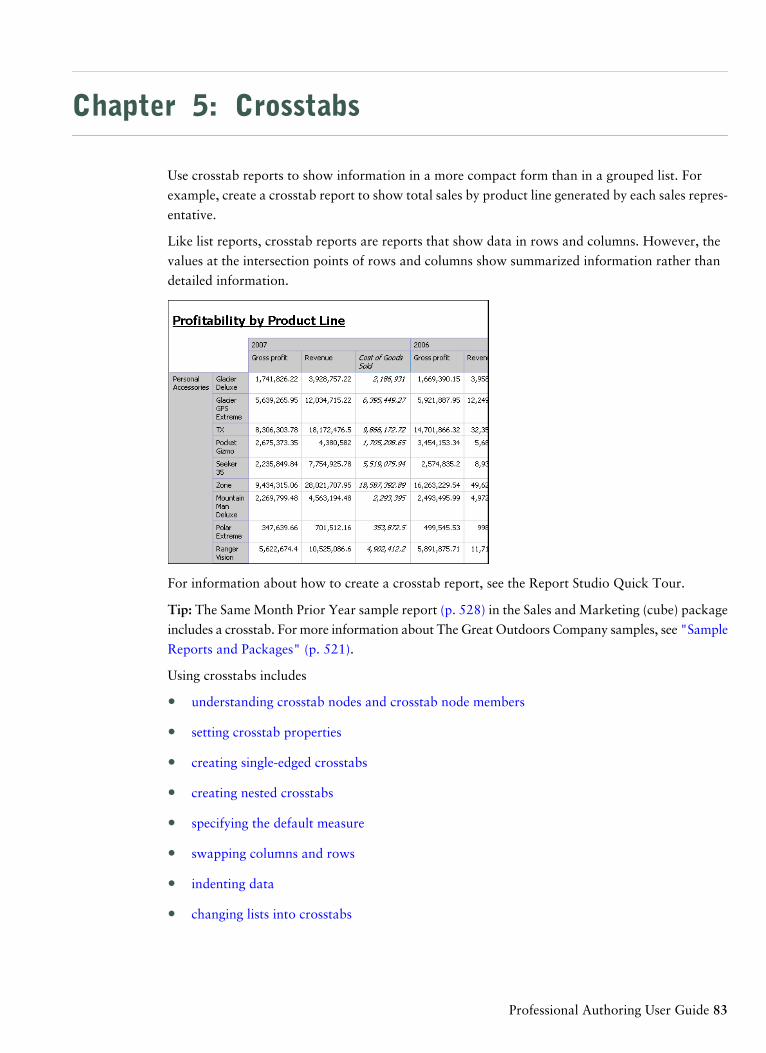
Chapter 5: Crosstabs
Use crosstab reports to show information in a more compact form than in a grouped list. For
example, create a crosstab report to show total sales by product line generated by each sales repres-
entative.
Like list reports, crosstab reports are reports that show data in rows and columns. However, the
values at the intersection points of rows and columns show summarized information rather than
detailed information.
For information about how to create a crosstab report, see the Report Studio Quick Tour.
Tip: The Same Month Prior Year sample report (p. 528) in the Sales and Marketing (cube) package
includes a crosstab. For more information about The Great Outdoors Company samples, see "Sample
Reports and Packages" (p. 521).
Using crosstabs includes
● understanding crosstab nodes and crosstab node members
● setting crosstab properties
● creating single-edged crosstabs
● creating nested crosstabs
● specifying the default measure
● swapping columns and rows
● indenting data
● changing lists into crosstabs
Professional Authoring User Guide 83
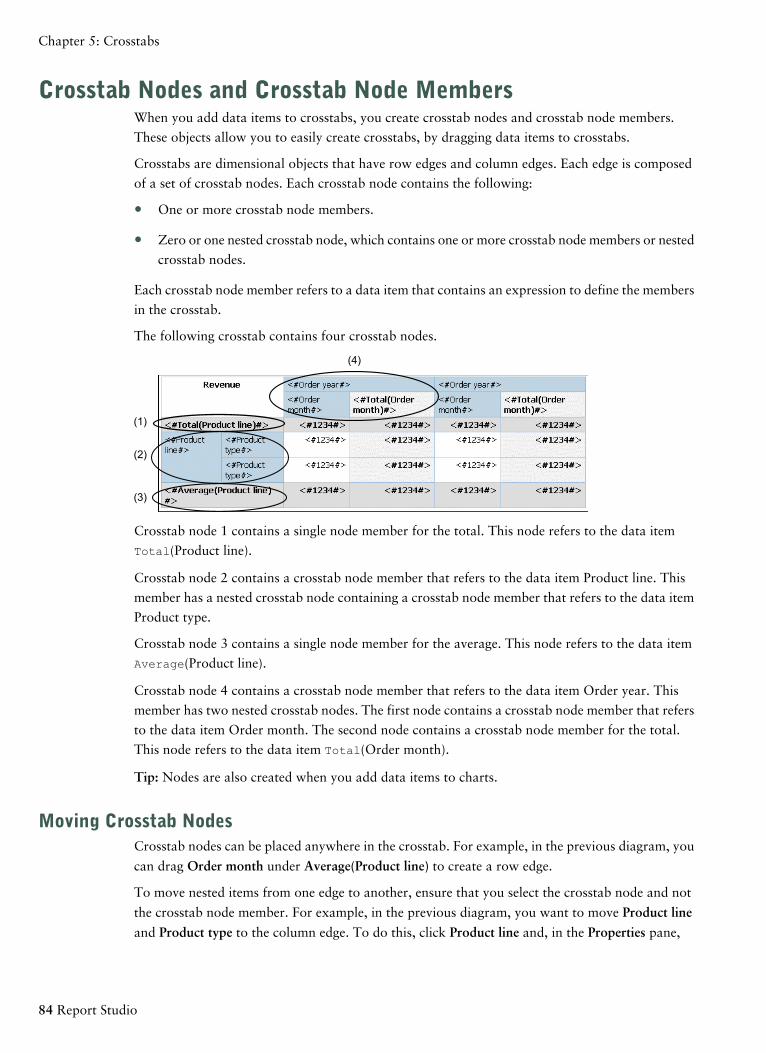
Crosstab Nodes and Crosstab Node MembersWhen you add data items to crosstabs, you create crosstab nodes and crosstab node members.
These objects allow you to easily create crosstabs, by dragging data items to crosstabs.
Crosstabs are dimensional objects that have row edges and column edges. Each edge is composed
of a set of crosstab nodes. Each crosstab node contains the following:
● One or more crosstab node members.
● Zero or one nested crosstab node, which contains one or more crosstab node members or nested
crosstab nodes.
Each crosstab node member refers to a data item that contains an expression to define the members
in the crosstab.
The following crosstab contains four crosstab nodes.
(4)
(1)
(2)
(3)
Crosstab node 1 contains a single node member for the total. This node refers to the data item
Total(Product line).
Crosstab node 2 contains a crosstab node member that refers to the data item Product line. This
member has a nested crosstab node containing a crosstab node member that refers to the data item
Product type.
Crosstab node 3 contains a single node member for the average. This node refers to the data item
Average(Product line).
Crosstab node 4 contains a crosstab node member that refers to the data item Order year. This
member has two nested crosstab nodes. The first node contains a crosstab node member that refers
to the data item Order month. The second node contains a crosstab node member for the total.
This node refers to the data item Total(Order month).
Tip: Nodes are also created when you add data items to charts.
Moving Crosstab NodesCrosstab nodes can be placed anywhere in the crosstab. For example, in the previous diagram, you
can drag Order month under Average(Product line) to create a row edge.
To move nested items from one edge to another, ensure that you select the crosstab node and not
the crosstab node member. For example, in the previous diagram, you want to move Product line
and Product type to the column edge. To do this, click Product line and, in the Properties pane,
84 Report Studio
Chapter 5: Crosstabs
click the select ancestor button and click Crosstab Node. Both Product line and Product typeare selected.
Crosstab Node Creation OptionIn the Structure menu, the Create Crosstab Nodes option affects the drag-and-drop behavior in
crosstabs. When the option is turned on and you add a data item to a crosstab, the item is created
as a crosstab node. If the option is turned off, the item is created as a crosstab node member to an
existing crosstab node.
For example, in the previous diagram, if the option is turned on and you drag Country from the
Insertable Objects pane to beneath Product line, Country becomes a new peer node to Product line.
If the option is turned off, Country becomes a new peer node to Product line and has Product typeas a nested crosstab node. This happens because instead of adding a new node, you are adding a
new member to the existing node that already contains Product line.
Tip: To create discontinuous crosstabs (p. 91), turn the Create Crosstab Nodes option on. If you
want the items on the edges of crosstabs to be related (contain the same nested items), turn the
Create Crosstab Nodes option off.
Set Crosstab PropertiesFormat crosstabs to give them the appearance you want. You can specify formatting for rows,
columns, and fact cells in a crosstab or for the entire crosstab. When you specify formatting for all
rows, columns, fact cells, or the crosstab, the formatting is automatically applied to any new items
you add.
Order of Styles Applied
If you apply the same styles, such as font color, to crosstab rows, columns, and crosstab intersections,
the styles are applied in the following order:
● crosstab fact cells
● fact cells in the outermost rows
● fact cells in the innermost rows
● fact cells in the outermost columns
● fact cells in the innermost columns
● crosstab intersections
The style applied to the last object in the list overrides styles applied to previous objects. In addition,
class styles are applied before styles that you apply manually.
You can also quickly format crosstabs by applying table styles (p. 418) and add white space to a
crosstab by inserting crosstab space objects (p. 413).
Steps
1. To format the entire crosstab, do the following:
Professional Authoring User Guide 85
Chapter 5: Crosstabs
● Click anywhere in the crosstab.
● Click the select ancestor button in the title bar of the Properties pane and click Crosstab.
● In the Properties pane, set the property value.
For example, to specify a background color, click Background Color and choose a color.
2. To format all rows, columns, or fact cells, click a row, column, or fact cell in the crosstab and
then do the following:
● If you clicked a row, click the select ancestor button in the title bar of the Properties pane
and click Crosstab Rows.
● If you clicked a column, click the select ancestor button in the title bar of the Properties
pane and click Crosstab Columns.
● If you clicked a fact cell, click the select ancestor button in the title bar of the Properties
pane and click Crosstab Fact Cells.
● In the Properties pane, set the property value.
For example, to specify a background color, click Background Color and choose the color.
Tip: You can also right-click the row or column and click Select Fact Cells.
3. To format all crosstab cells for a specific row or column, do the following:
● Click the row or column.
● Click the select ancestor button in the title bar of the Properties pane and click Crosstab
Member Fact Cells.
Tip: You can also right-click the row or column and click Select Member Fact Cells.
● In the Properties pane, set the property value.
For example, to specify a background color, click Background Color and choose the color.
4. To format all row or column titles, do the following:
● Click a row or column title.
● Click the select ancestor button in the title bar of the Properties pane and click Crosstab
Rows or Crosstab Columns.
● In the Properties pane, set the property value.
For example, to specify a background color, click Background Color and choose the color.
5. To format an individual row, column, or intersection, do the following:
● Click the row, column, or intersection.
Tip: To format the data in a row, column, or intersection, click the unlock button in
the toolbar and then click the text item to format.
● In the Properties pane, set the property value.
86 Report Studio
Chapter 5: Crosstabs
For example, to specify a background color, click Background Color and choose the color.
Tip: In cases where fact cell formatting applied to rows conflicts with fact cell formatting applied
to columns, you can set the Fact Cells Precedence property in the Properties pane to determine
whether the row formatting or the column formatting has precedence. To set this property, click
anywhere in the crosstab, click the select ancestor button in the title bar of the Properties pane, and
click Crosstab.
For more information about formatting reports, see "Laying Out a Report" (p. 405).
Create a Single-Edge CrosstabCreate a single-edge crosstab report to show data in a list-like form. For example, to show the
quantity of products sold for each year and for each order method, you could create a crosstab
with Order Year and Order Method as rows and Quantity as the measure.
Steps
1. From the File menu, click New.
2. Click Crosstab and click OK.
3. In the Insertable Objects pane, on the Source tab , drag data items to the Rows or Columnsdrop zone.
A black bar indicates where you can drop the data item.
4. Repeat step 3 to insert additional data items:
● If you dragged the data item in step 3 to the Rows drop zone, drag the additional items
above or below the first item.
● If you dragged the data item in step 3 to the Columns drop zone, drag the additional items
to the left or right of the first item.
5. To add measures to the crosstab, drag the measures to the Measures drop zone.
When you run the report, a crosstab is produced that has only one edge.
Create a Nested CrosstabNest data in a crosstab report to compare information by using more than one data item in a column
or row. For example, a report shows the number of sales by product line for the past fiscal year.
You decide to add a data item to further break down the number of sales by quarter.
When nesting columns in a crosstab report, there are four distinct drop zones where you can insert
a new data item. The drop zone you choose will define the relationship between the data item and
the column.
Rows
The following relationships are created when you insert a data item as a row:
Professional Authoring User Guide 87
Chapter 5: Crosstabs
● Inserting a data item to the left or right of a column creates a parent-child relationship between
them.
When you insert a data item to the left of a column, the data item becomes a parent to the
column. When you insert a data item to the right of a column, the data item becomes a child
of the column.
● Inserting a data item above or below a column creates a union relationship between them.
Columns
The following relationships are created when you insert a data item as a column:
● Inserting a data item to the left or right of a column creates a union relationship between them.
● Inserting a data item above or below a column creates a parent-child relationship between
them.
When you insert a data item above a column, the data item becomes a parent to the column. When
you insert a data item below a column, the data item becomes a child of the column.
For example, you have a crosstab with Product line as rows and Quantity and Revenue as nested
rows. For columns, you have Order method with Country as a nested column. In this crosstab,
● Product line is a parent to Quantity and Revenue.
● Quantity and Revenue are peers.
● Order method is a parent to Country.
Steps
1. In the Insertable Objects pane, on the Source tab , click the data item to add.
2. Drag the data item to the report as a nested column or nested row.
A black bar indicates where you can drop the data item.
3. Repeat steps 1 to 2 to add other nested columns or rows.
Tip: If you add more than one measure to a crosstab, all measures appear as columns. You
cannot have one measure appear as a row and another as a column. To make all measures
appear as rows, swap columns and rows (p. 89).
Specify the Default MeasureYou can specify the default measure for crosstabs and certain chart types. Specify the default
measure to be used when the measures cannot be determined by what is on the edges. For example,
you create a crosstab with Order method as rows and Product line as columns. You add Quantity
and Revenue as nested rows, making Order method their parent. You then add Country under
Order method. Since there is no measure specified for Country, you specify the default measure so
that data is returned for each country.
88 Report Studio
Chapter 5: Crosstabs
In crosstabs, Report Studio automatically sets the default measure when you insert a measure into
the crosstab cells.
Steps
1. To specify the default measure for a crosstab, do the following:
● Click any part of the crosstab, and then click the select ancestor button in the title bar
of the Properties pane.
● Click Crosstab.
● Set the Default Measure property to the default measure.
2. To specify the default measure for a chart, drag the measure to the Default measure box in the
chart.
Swap Columns and RowsSwap columns and rows to look at information from a different perspective. This may help you
discover high and low points in the data that you hadn't previously noted.
You can only swap columns and rows in a crosstab or chart.
Step
● From the toolbar, click the swap rows and columns button .
In the report, the rows become the columns and the columns become the rows.
Indent DataYou can indent crosstab node members to set them apart from surrounding data.
When you insert a hierarchy in rows, all members are automatically indented according to their
level. By default, the first member in a set is not indented. If you insert a hierarchy in columns, the
members are not automatically indented. You can change the indentation properties of members
in the report.
Relative indentation means that the member will shift by one tab when the member's level increases
relative to the previous member in the hierarchy.
Indenting based on the level in the hierarchy means that the member will shift the number of tabs
equivalent to the level in the hierarchy.
You can also indent objects by applying padding (p. 419).
Level Indentation is not supported for Excel 2002 and Excel 2000 Single Sheet format reports.
Steps
1. Click the crosstab node member to indent.
Professional Authoring User Guide 89
Chapter 5: Crosstabs
2. In the Properties pane, set the Level Indentation property to your indentation type, length, and
direction.
Change a List into a CrosstabChange a list into a crosstab to view your data from a different perspective.
Steps
1. Click the columns to appear as columns or nested columns in the crosstab.
2. From the Structure menu, click Pivot List to Crosstab.
The list becomes a crosstab with the columns you selected in step 2 appearing as columns and nested
columns. The unselected columns, except for measures, appear as rows and nested rows. If you
have one measure, it becomes the cells of the crosstab. If you have more than one measure, they
appear as columns.
Tip: To make all measures appear as rows, swap columns and rows (p. 89).
Example - Add Aggregate Data to a CrosstabYou are a report author at The Great Outdoors Company, which sells sporting equipment. You
are requested to create a report showing sales by order method to determine which methods are
generating the most revenue and the highest sales volume.
Steps
1. Open Report Studio with the GO Data Warehouse (query) package.
2. In the Welcome dialog box, click Create a new report or template.
3. In the New dialog box, click Crosstab and click OK.
4. In the Insertable Objects pane, on the Source tab :
● Expand Sales and Marketing (query) and Sales (query).
● Expand Product and double-click Product line to add it as rows.
● Expand Order method and double-click Order method to add it as columns.
● Click Product type and drag it just to the right of Product line.
Product type is now nested in Product line.
● Expand Sales fact and drag Quantity to the Measures drop zone to add it as a measure.
● Drag Revenue to the right of Quantity to add it as a second measure.
● Tip: Drop Revenue into the crosstab when you see a vertical bar between the Product type
column and the Order method column.
90 Report Studio
Chapter 5: Crosstabs
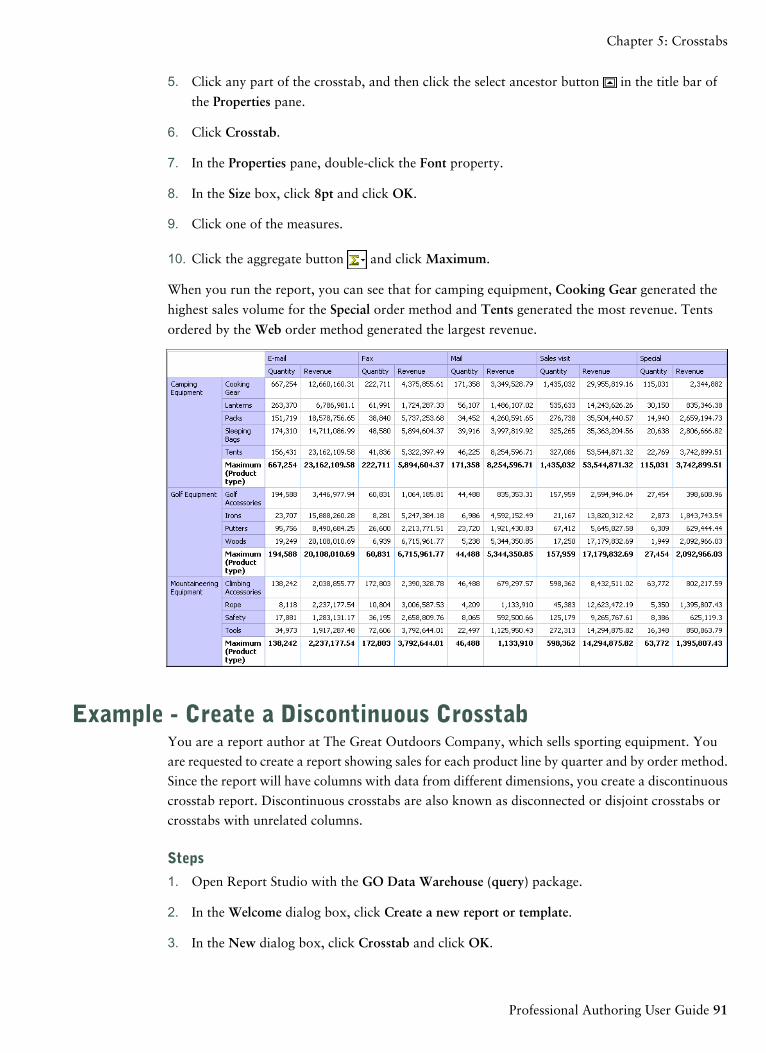
5. Click any part of the crosstab, and then click the select ancestor button in the title bar of
the Properties pane.
6. Click Crosstab.
7. In the Properties pane, double-click the Font property.
8. In the Size box, click 8pt and click OK.
9. Click one of the measures.
10. Click the aggregate button and click Maximum.
When you run the report, you can see that for camping equipment, Cooking Gear generated the
highest sales volume for the Special order method and Tents generated the most revenue. Tents
ordered by the Web order method generated the largest revenue.
Example - Create a Discontinuous CrosstabYou are a report author at The Great Outdoors Company, which sells sporting equipment. You
are requested to create a report showing sales for each product line by quarter and by order method.
Since the report will have columns with data from different dimensions, you create a discontinuous
crosstab report. Discontinuous crosstabs are also known as disconnected or disjoint crosstabs or
crosstabs with unrelated columns.
Steps
1. Open Report Studio with the GO Data Warehouse (query) package.
2. In the Welcome dialog box, click Create a new report or template.
3. In the New dialog box, click Crosstab and click OK.
Professional Authoring User Guide 91
Chapter 5: Crosstabs
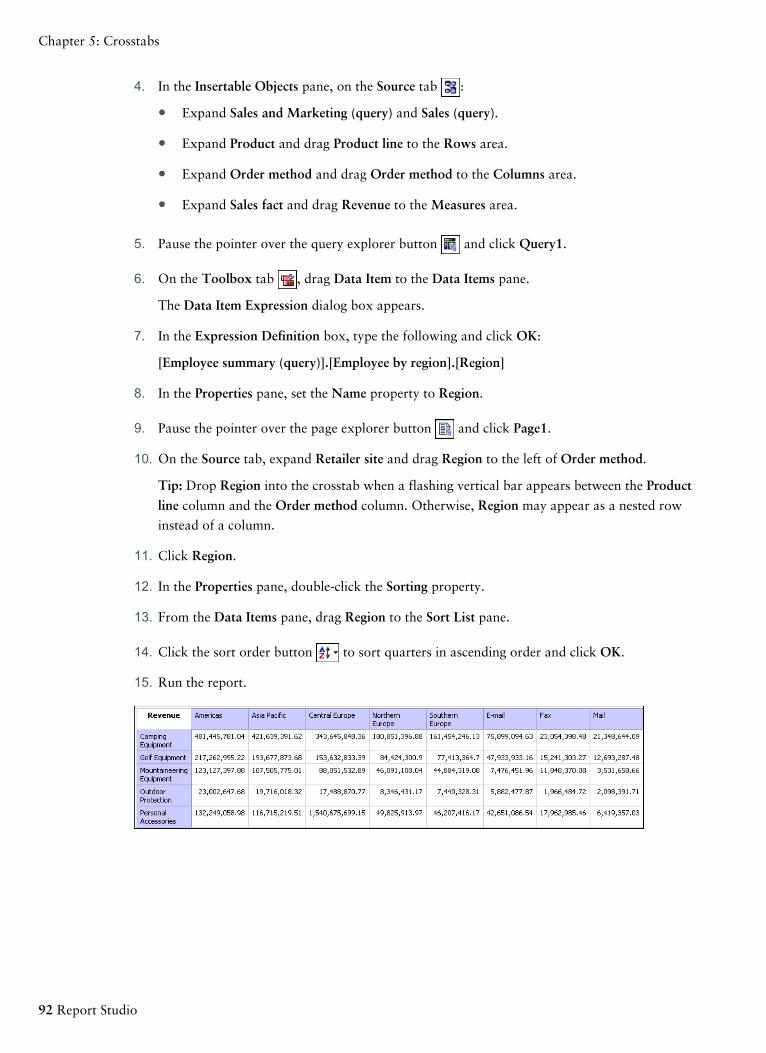
4. In the Insertable Objects pane, on the Source tab :
● Expand Sales and Marketing (query) and Sales (query).
● Expand Product and drag Product line to the Rows area.
● Expand Order method and drag Order method to the Columns area.
● Expand Sales fact and drag Revenue to the Measures area.
5. Pause the pointer over the query explorer button and click Query1.
6. On the Toolbox tab , drag Data Item to the Data Items pane.
The Data Item Expression dialog box appears.
7. In the Expression Definition box, type the following and click OK:
[Employee summary (query)].[Employee by region].[Region]
8. In the Properties pane, set the Name property to Region.
9. Pause the pointer over the page explorer button and click Page1.
10. On the Source tab, expand Retailer site and drag Region to the left of Order method.
Tip: Drop Region into the crosstab when a flashing vertical bar appears between the Product
line column and the Order method column. Otherwise, Region may appear as a nested row
instead of a column.
11. Click Region.
12. In the Properties pane, double-click the Sorting property.
13. From the Data Items pane, drag Region to the Sort List pane.
14. Click the sort order button to sort quarters in ascending order and click OK.
15. Run the report.
92 Report Studio
Chapter 5: Crosstabs
Chapter 6: Charts
You can use Report Studio to create many chart types, including column, bar, area, and line charts.
You can also create custom charts that combine these chart types.
Charts are similar to crosstabs in the way their data is organized. The display is different, but charts
show the intersection of data the same ways as crosstabs; for example, you can see the revenue for
golf equipment in 2004.
For information about different chart types, see "Chart Types" (p. 94).
Tip: To view the available chart types, from the File menu, click New, and then double-click the
chart icon . You can also view the available chart types by adding a Chart object from the
Toolbox tab in the Insertable Objects pane to an existing report.
You can also find information about how to create a chart in the Report Studio Quick Tour.
Using charts includes
● reviewing chart types
● setting chart properties
● inserting microcharts into crosstabs
● creating win-loss charts
● showing data points or value markers
● customizing chart colors
● changing chart backgrounds
● adding baselines
● customizing chart lines
● adding markers
● adding notes
● customizing label text
● specifying gauge chart properties
● creating drill-up/drill-down charts
● defining query context when customizing legend entries, legend titles, or axis labels
Creating ChartsTo create charts, you drag items from the Insertable Objects pane to the following drop zones:
Professional Authoring User Guide 93
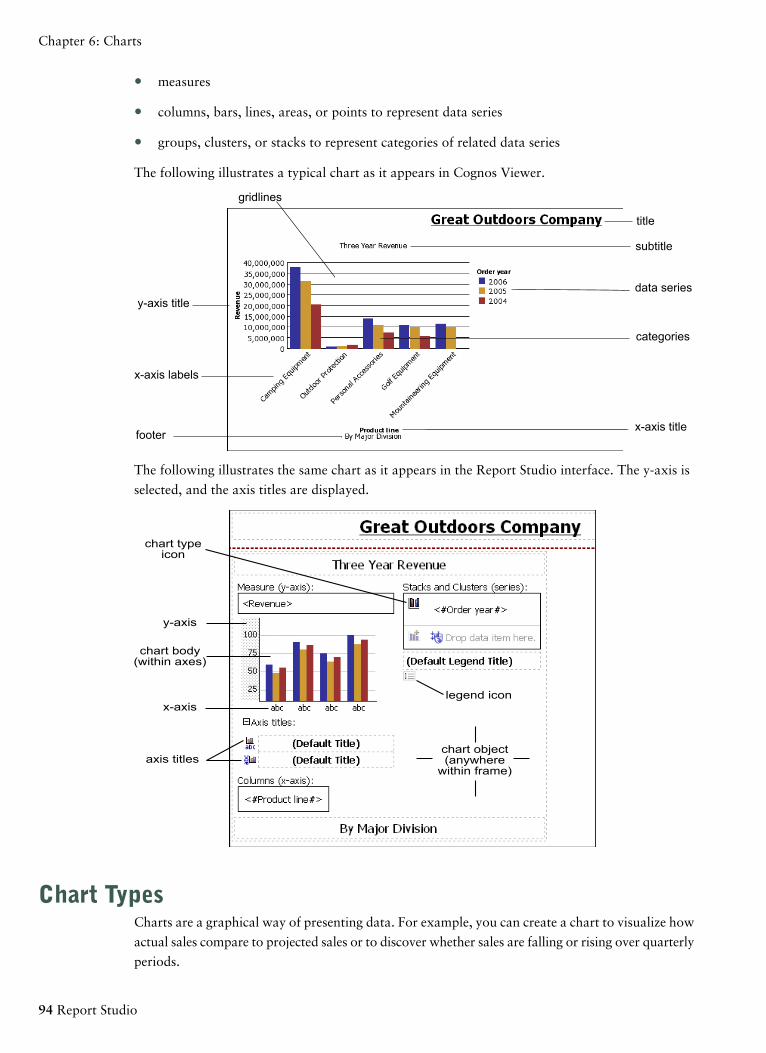
● measures
● columns, bars, lines, areas, or points to represent data series
● groups, clusters, or stacks to represent categories of related data series
The following illustrates a typical chart as it appears in Cognos Viewer.
y-axis title
gridlines
x-axis labels
footer
title
subtitle
data series
categories
x-axis title
The following illustrates the same chart as it appears in the Report Studio interface. The y-axis is
selected, and the axis titles are displayed.
chart typeicon
y-axis
chart body(within axes)
x-axis
axis titles
legend icon
chart object(anywherewithin frame)
Chart TypesCharts are a graphical way of presenting data. For example, you can create a chart to visualize how
actual sales compare to projected sales or to discover whether sales are falling or rising over quarterly
periods.
94 Report Studio
Chapter 6: Charts
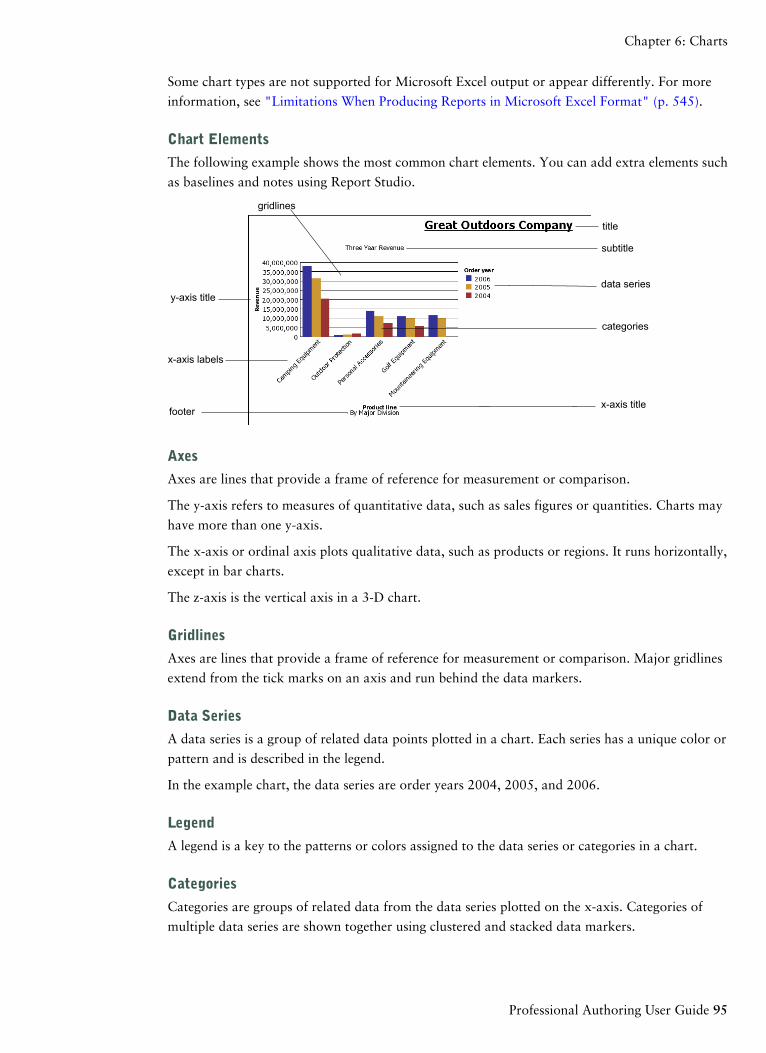
Some chart types are not supported for Microsoft Excel output or appear differently. For more
information, see "Limitations When Producing Reports in Microsoft Excel Format" (p. 545).
Chart Elements
The following example shows the most common chart elements. You can add extra elements such
as baselines and notes using Report Studio.
y-axis title
gridlines
x-axis labels
footer
title
subtitle
data series
categories
x-axis title
Axes
Axes are lines that provide a frame of reference for measurement or comparison.
The y-axis refers to measures of quantitative data, such as sales figures or quantities. Charts may
have more than one y-axis.
The x-axis or ordinal axis plots qualitative data, such as products or regions. It runs horizontally,
except in bar charts.
The z-axis is the vertical axis in a 3-D chart.
Gridlines
Axes are lines that provide a frame of reference for measurement or comparison. Major gridlines
extend from the tick marks on an axis and run behind the data markers.
Data Series
A data series is a group of related data points plotted in a chart. Each series has a unique color or
pattern and is described in the legend.
In the example chart, the data series are order years 2004, 2005, and 2006.
Legend
A legend is a key to the patterns or colors assigned to the data series or categories in a chart.
Categories
Categories are groups of related data from the data series plotted on the x-axis. Categories of
multiple data series are shown together using clustered and stacked data markers.
Professional Authoring User Guide 95
Chapter 6: Charts
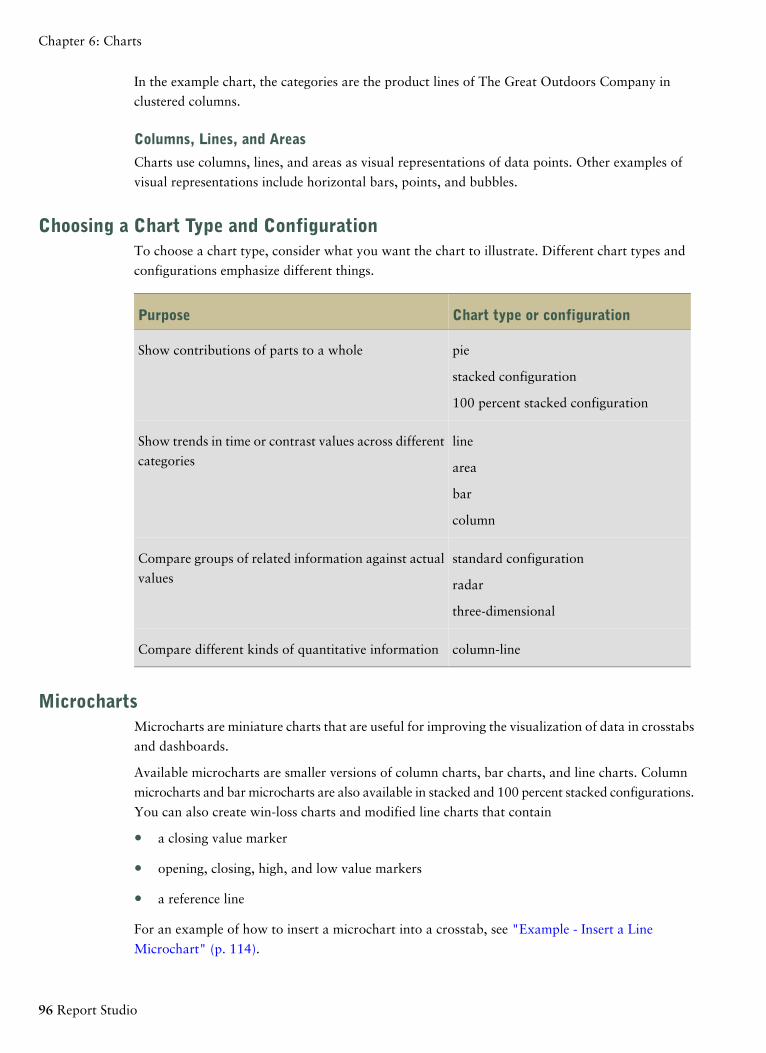
In the example chart, the categories are the product lines of The Great Outdoors Company in
clustered columns.
Columns, Lines, and Areas
Charts use columns, lines, and areas as visual representations of data points. Other examples of
visual representations include horizontal bars, points, and bubbles.
Choosing a Chart Type and ConfigurationTo choose a chart type, consider what you want the chart to illustrate. Different chart types and
configurations emphasize different things.
Chart type or configurationPurpose
pieShow contributions of parts to a whole
stacked configuration
100 percent stacked configuration
lineShow trends in time or contrast values across different
categories area
bar
column
standard configurationCompare groups of related information against actual
values radar
three-dimensional
column-lineCompare different kinds of quantitative information
MicrochartsMicrocharts are miniature charts that are useful for improving the visualization of data in crosstabs
and dashboards.
Available microcharts are smaller versions of column charts, bar charts, and line charts. Column
microcharts and bar microcharts are also available in stacked and 100 percent stacked configurations.
You can also create win-loss charts and modified line charts that contain
● a closing value marker
● opening, closing, high, and low value markers
● a reference line
For an example of how to insert a microchart into a crosstab, see "Example - Insert a Line
Microchart" (p. 114).
96 Report Studio
Chapter 6: Charts
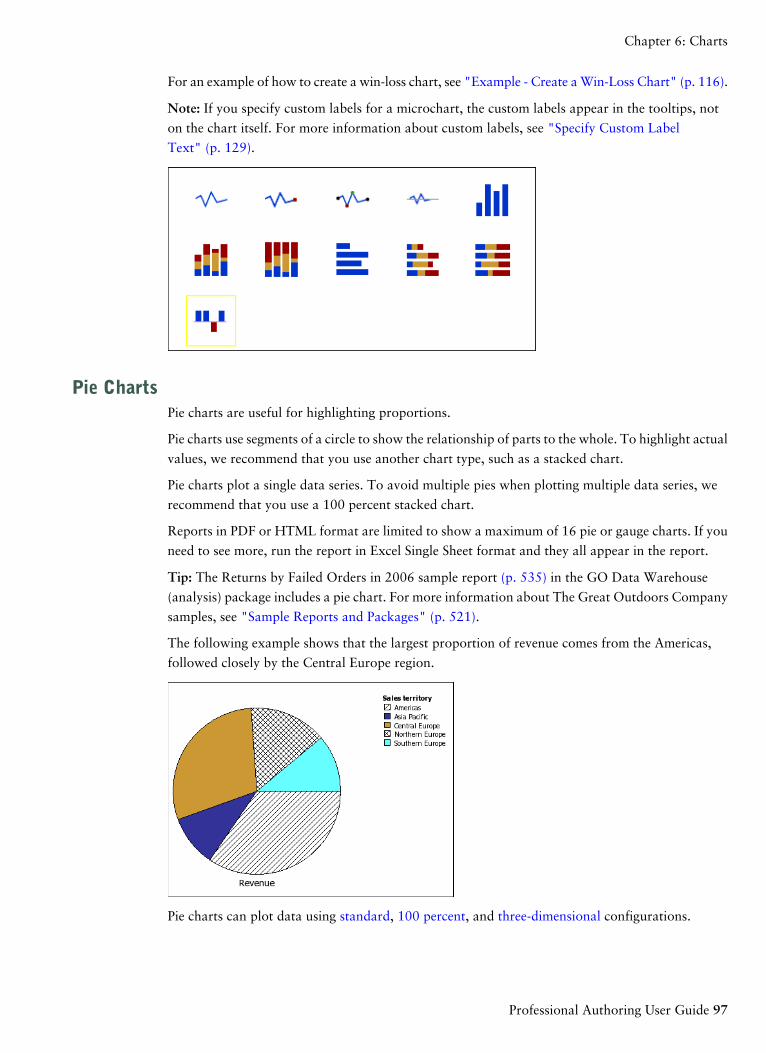
For an example of how to create a win-loss chart, see "Example - Create a Win-Loss Chart" (p. 116).
Note: If you specify custom labels for a microchart, the custom labels appear in the tooltips, not
on the chart itself. For more information about custom labels, see "Specify Custom Label
Text" (p. 129).
Pie ChartsPie charts are useful for highlighting proportions.
Pie charts use segments of a circle to show the relationship of parts to the whole. To highlight actual
values, we recommend that you use another chart type, such as a stacked chart.
Pie charts plot a single data series. To avoid multiple pies when plotting multiple data series, we
recommend that you use a 100 percent stacked chart.
Reports in PDF or HTML format are limited to show a maximum of 16 pie or gauge charts. If you
need to see more, run the report in Excel Single Sheet format and they all appear in the report.
Tip: The Returns by Failed Orders in 2006 sample report (p. 535) in the GO Data Warehouse
(analysis) package includes a pie chart. For more information about The Great Outdoors Company
samples, see "Sample Reports and Packages" (p. 521).
The following example shows that the largest proportion of revenue comes from the Americas,
followed closely by the Central Europe region.
Pie charts can plot data using standard, 100 percent, and three-dimensional configurations.
Professional Authoring User Guide 97
Chapter 6: Charts
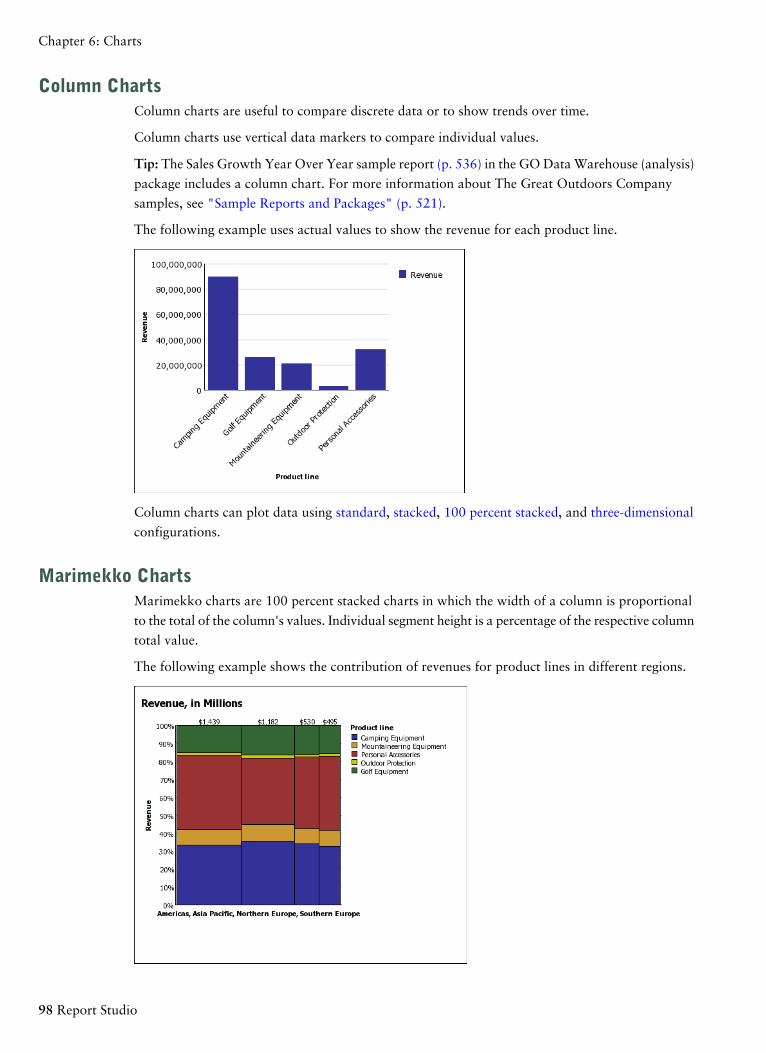
Column ChartsColumn charts are useful to compare discrete data or to show trends over time.
Column charts use vertical data markers to compare individual values.
Tip: The Sales Growth Year Over Year sample report (p. 536) in the GO Data Warehouse (analysis)
package includes a column chart. For more information about The Great Outdoors Company
samples, see "Sample Reports and Packages" (p. 521).
The following example uses actual values to show the revenue for each product line.
Column charts can plot data using standard, stacked, 100 percent stacked, and three-dimensional
configurations.
Marimekko ChartsMarimekko charts are 100 percent stacked charts in which the width of a column is proportional
to the total of the column's values. Individual segment height is a percentage of the respective column
total value.
The following example shows the contribution of revenues for product lines in different regions.
98 Report Studio
Chapter 6: Charts
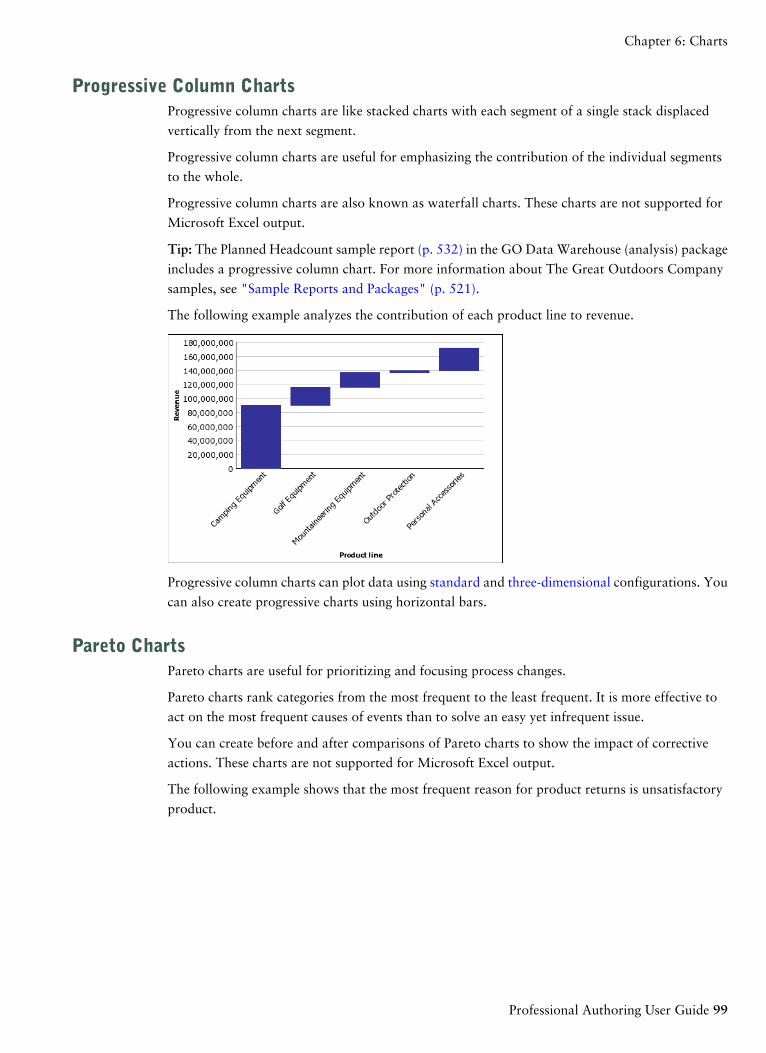
Progressive Column ChartsProgressive column charts are like stacked charts with each segment of a single stack displaced
vertically from the next segment.
Progressive column charts are useful for emphasizing the contribution of the individual segments
to the whole.
Progressive column charts are also known as waterfall charts. These charts are not supported for
Microsoft Excel output.
Tip: The Planned Headcount sample report (p. 532) in the GO Data Warehouse (analysis) package
includes a progressive column chart. For more information about The Great Outdoors Company
samples, see "Sample Reports and Packages" (p. 521).
The following example analyzes the contribution of each product line to revenue.
Progressive column charts can plot data using standard and three-dimensional configurations. You
can also create progressive charts using horizontal bars.
Pareto ChartsPareto charts are useful for prioritizing and focusing process changes.
Pareto charts rank categories from the most frequent to the least frequent. It is more effective to
act on the most frequent causes of events than to solve an easy yet infrequent issue.
You can create before and after comparisons of Pareto charts to show the impact of corrective
actions. These charts are not supported for Microsoft Excel output.
The following example shows that the most frequent reason for product returns is unsatisfactory
product.
Professional Authoring User Guide 99
Chapter 6: Charts
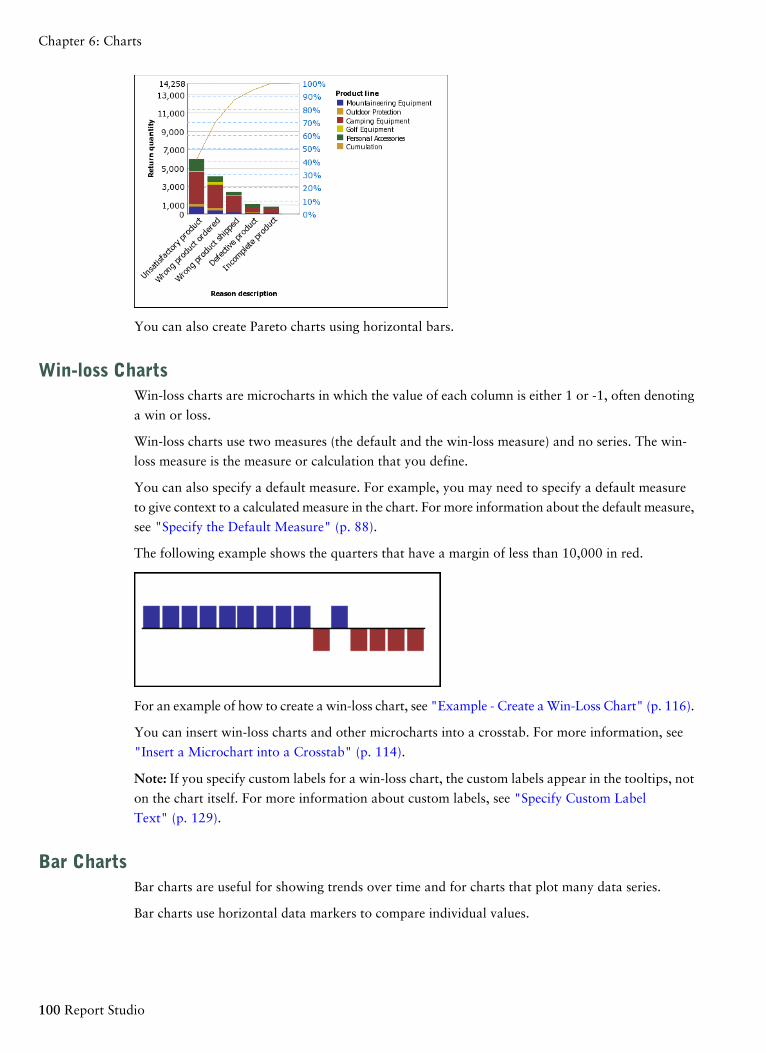
You can also create Pareto charts using horizontal bars.
Win-loss ChartsWin-loss charts are microcharts in which the value of each column is either 1 or -1, often denoting
a win or loss.
Win-loss charts use two measures (the default and the win-loss measure) and no series. The win-
loss measure is the measure or calculation that you define.
You can also specify a default measure. For example, you may need to specify a default measure
to give context to a calculated measure in the chart. For more information about the default measure,
see "Specify the Default Measure" (p. 88).
The following example shows the quarters that have a margin of less than 10,000 in red.
For an example of how to create a win-loss chart, see "Example - Create a Win-Loss Chart" (p. 116).
You can insert win-loss charts and other microcharts into a crosstab. For more information, see
"Insert a Microchart into a Crosstab" (p. 114).
Note: If you specify custom labels for a win-loss chart, the custom labels appear in the tooltips, not
on the chart itself. For more information about custom labels, see "Specify Custom Label
Text" (p. 129).
Bar ChartsBar charts are useful for showing trends over time and for charts that plot many data series.
Bar charts use horizontal data markers to compare individual values.
100 Report Studio
Chapter 6: Charts
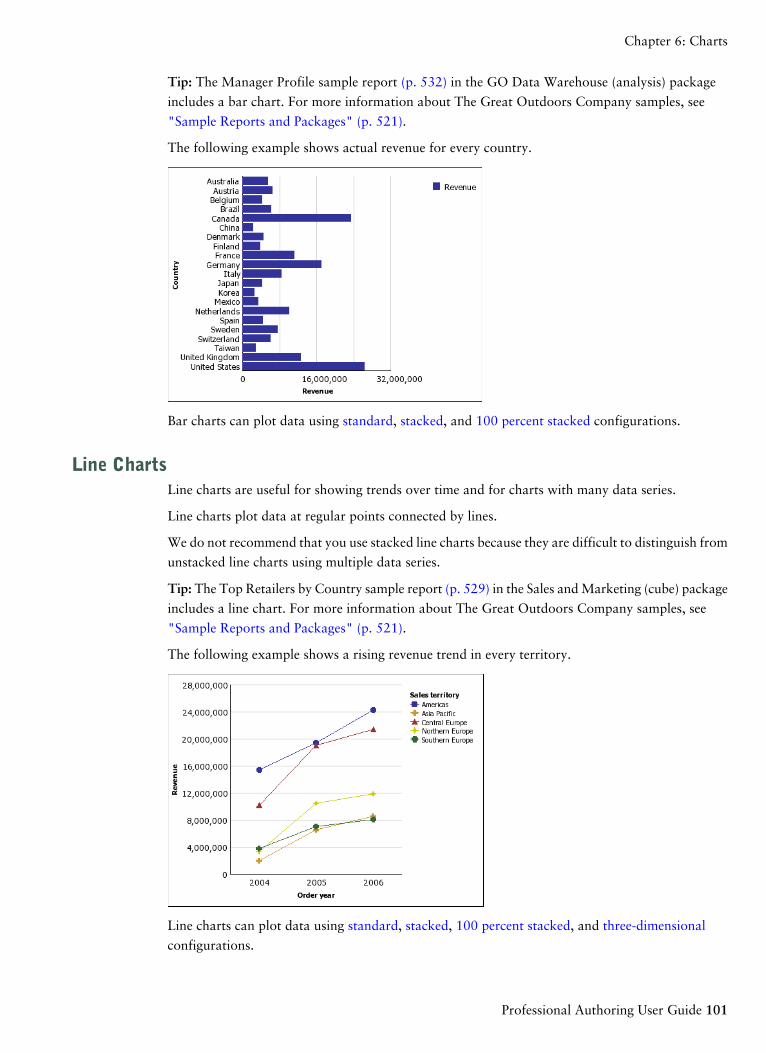
Tip: The Manager Profile sample report (p. 532) in the GO Data Warehouse (analysis) package
includes a bar chart. For more information about The Great Outdoors Company samples, see
"Sample Reports and Packages" (p. 521).
The following example shows actual revenue for every country.
Bar charts can plot data using standard, stacked, and 100 percent stacked configurations.
Line ChartsLine charts are useful for showing trends over time and for charts with many data series.
Line charts plot data at regular points connected by lines.
We do not recommend that you use stacked line charts because they are difficult to distinguish from
unstacked line charts using multiple data series.
Tip: The Top Retailers by Country sample report (p. 529) in the Sales and Marketing (cube) package
includes a line chart. For more information about The Great Outdoors Company samples, see
"Sample Reports and Packages" (p. 521).
The following example shows a rising revenue trend in every territory.
Line charts can plot data using standard, stacked, 100 percent stacked, and three-dimensional
configurations.
Professional Authoring User Guide 101
Chapter 6: Charts
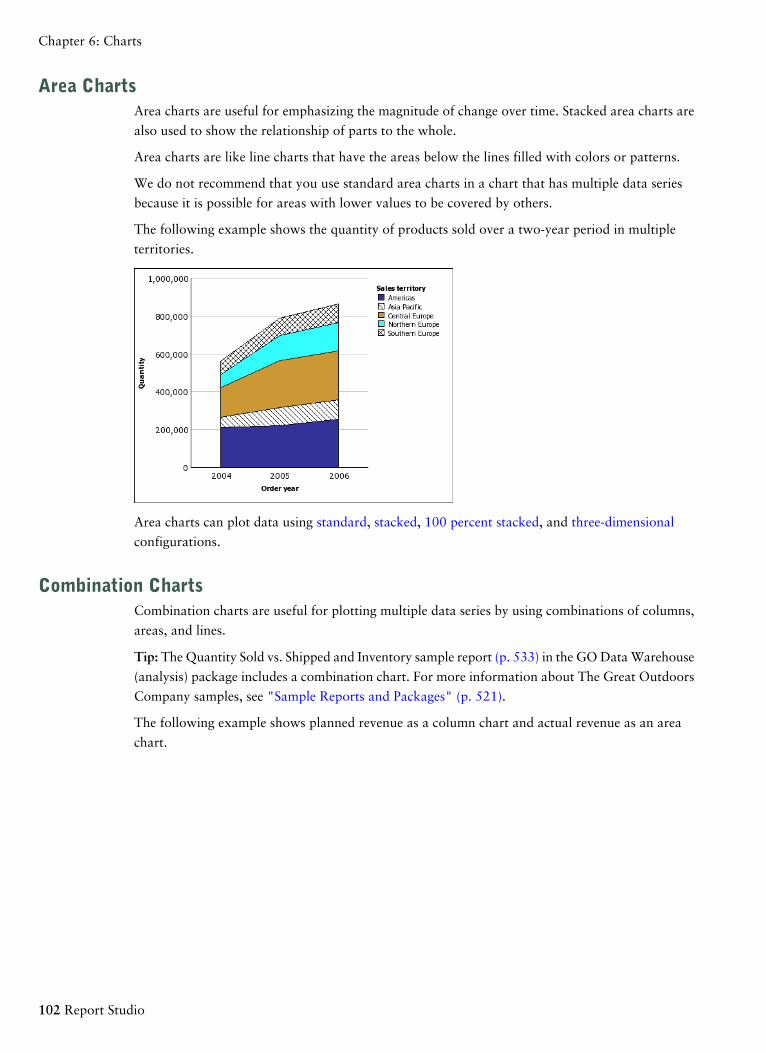
Area ChartsArea charts are useful for emphasizing the magnitude of change over time. Stacked area charts are
also used to show the relationship of parts to the whole.
Area charts are like line charts that have the areas below the lines filled with colors or patterns.
We do not recommend that you use standard area charts in a chart that has multiple data series
because it is possible for areas with lower values to be covered by others.
The following example shows the quantity of products sold over a two-year period in multiple
territories.
Area charts can plot data using standard, stacked, 100 percent stacked, and three-dimensional
configurations.
Combination ChartsCombination charts are useful for plotting multiple data series by using combinations of columns,
areas, and lines.
Tip: The Quantity Sold vs. Shipped and Inventory sample report (p. 533) in the GO Data Warehouse
(analysis) package includes a combination chart. For more information about The Great Outdoors
Company samples, see "Sample Reports and Packages" (p. 521).
The following example shows planned revenue as a column chart and actual revenue as an area
chart.
102 Report Studio
Chapter 6: Charts
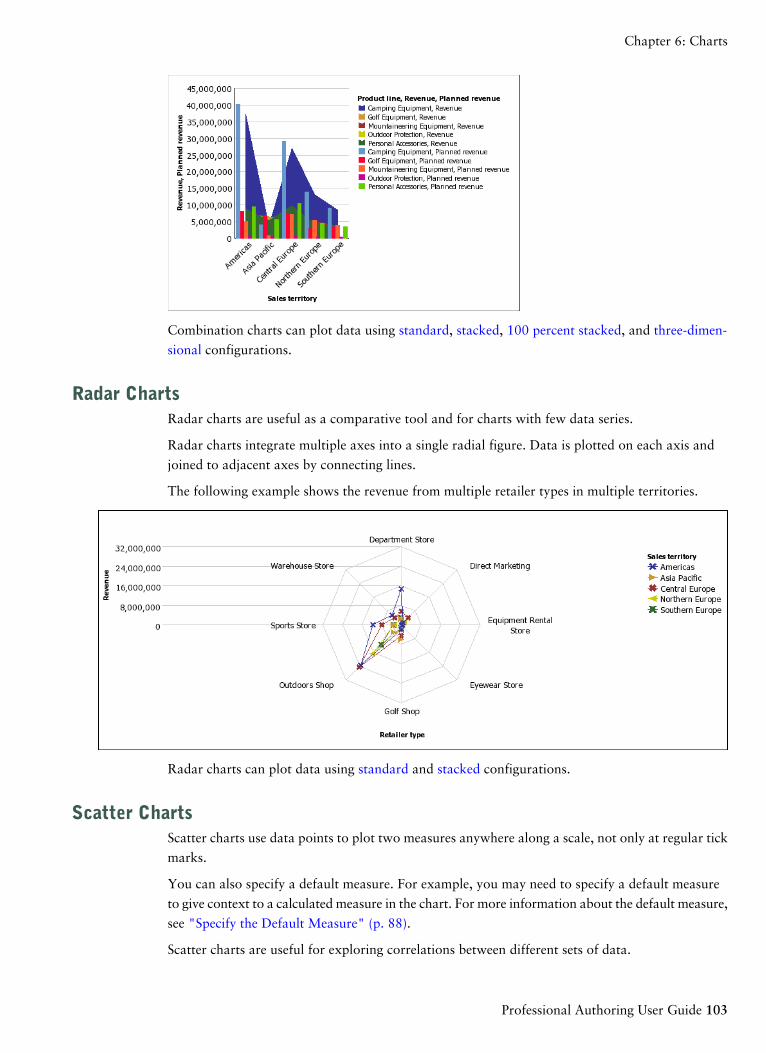
Combination charts can plot data using standard, stacked, 100 percent stacked, and three-dimen-
sional configurations.
Radar ChartsRadar charts are useful as a comparative tool and for charts with few data series.
Radar charts integrate multiple axes into a single radial figure. Data is plotted on each axis and
joined to adjacent axes by connecting lines.
The following example shows the revenue from multiple retailer types in multiple territories.
Radar charts can plot data using standard and stacked configurations.
Scatter ChartsScatter charts use data points to plot two measures anywhere along a scale, not only at regular tick
marks.
You can also specify a default measure. For example, you may need to specify a default measure
to give context to a calculated measure in the chart. For more information about the default measure,
see "Specify the Default Measure" (p. 88).
Scatter charts are useful for exploring correlations between different sets of data.
Professional Authoring User Guide 103
Chapter 6: Charts
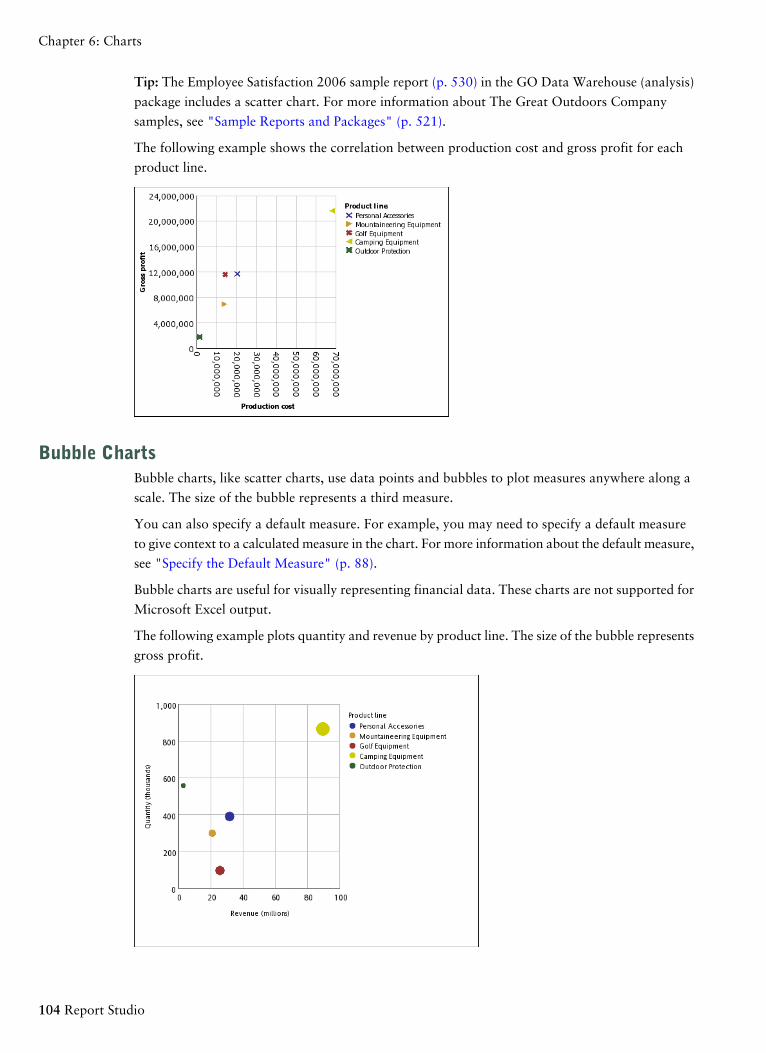
Tip: The Employee Satisfaction 2006 sample report (p. 530) in the GO Data Warehouse (analysis)
package includes a scatter chart. For more information about The Great Outdoors Company
samples, see "Sample Reports and Packages" (p. 521).
The following example shows the correlation between production cost and gross profit for each
product line.
Bubble ChartsBubble charts, like scatter charts, use data points and bubbles to plot measures anywhere along a
scale. The size of the bubble represents a third measure.
You can also specify a default measure. For example, you may need to specify a default measure
to give context to a calculated measure in the chart. For more information about the default measure,
see "Specify the Default Measure" (p. 88).
Bubble charts are useful for visually representing financial data. These charts are not supported for
Microsoft Excel output.
The following example plots quantity and revenue by product line. The size of the bubble represents
gross profit.
104 Report Studio
Chapter 6: Charts
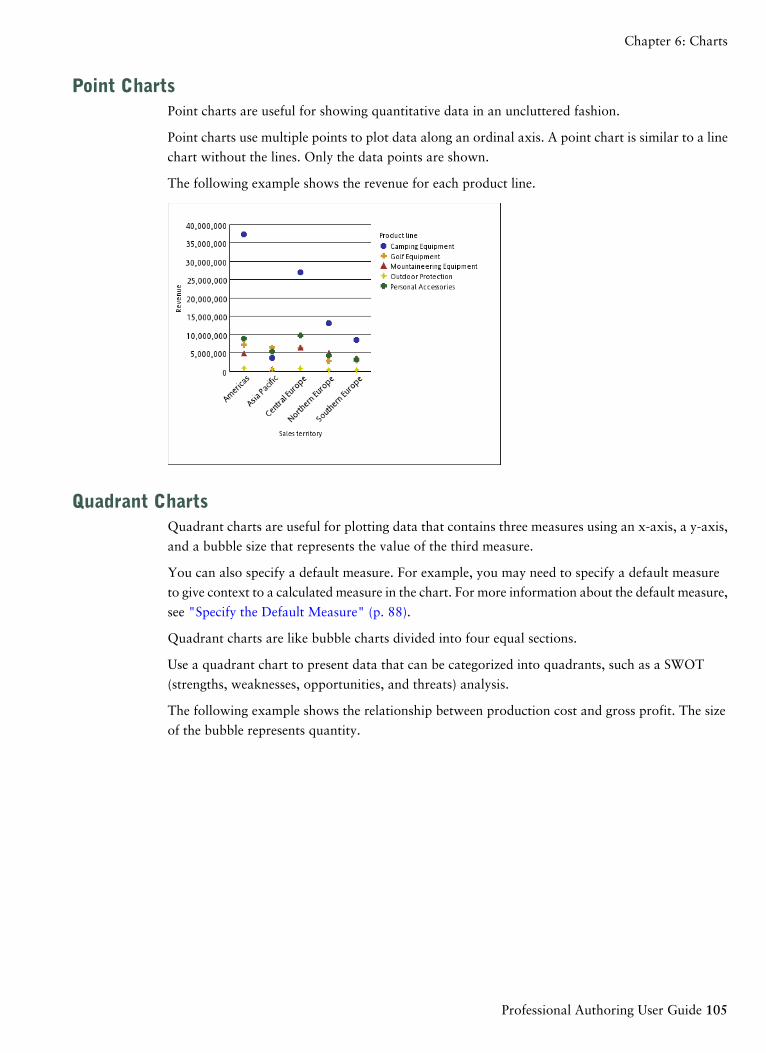
Point ChartsPoint charts are useful for showing quantitative data in an uncluttered fashion.
Point charts use multiple points to plot data along an ordinal axis. A point chart is similar to a line
chart without the lines. Only the data points are shown.
The following example shows the revenue for each product line.
Quadrant ChartsQuadrant charts are useful for plotting data that contains three measures using an x-axis, a y-axis,
and a bubble size that represents the value of the third measure.
You can also specify a default measure. For example, you may need to specify a default measure
to give context to a calculated measure in the chart. For more information about the default measure,
see "Specify the Default Measure" (p. 88).
Quadrant charts are like bubble charts divided into four equal sections.
Use a quadrant chart to present data that can be categorized into quadrants, such as a SWOT
(strengths, weaknesses, opportunities, and threats) analysis.
The following example shows the relationship between production cost and gross profit. The size
of the bubble represents quantity.
Professional Authoring User Guide 105
Chapter 6: Charts
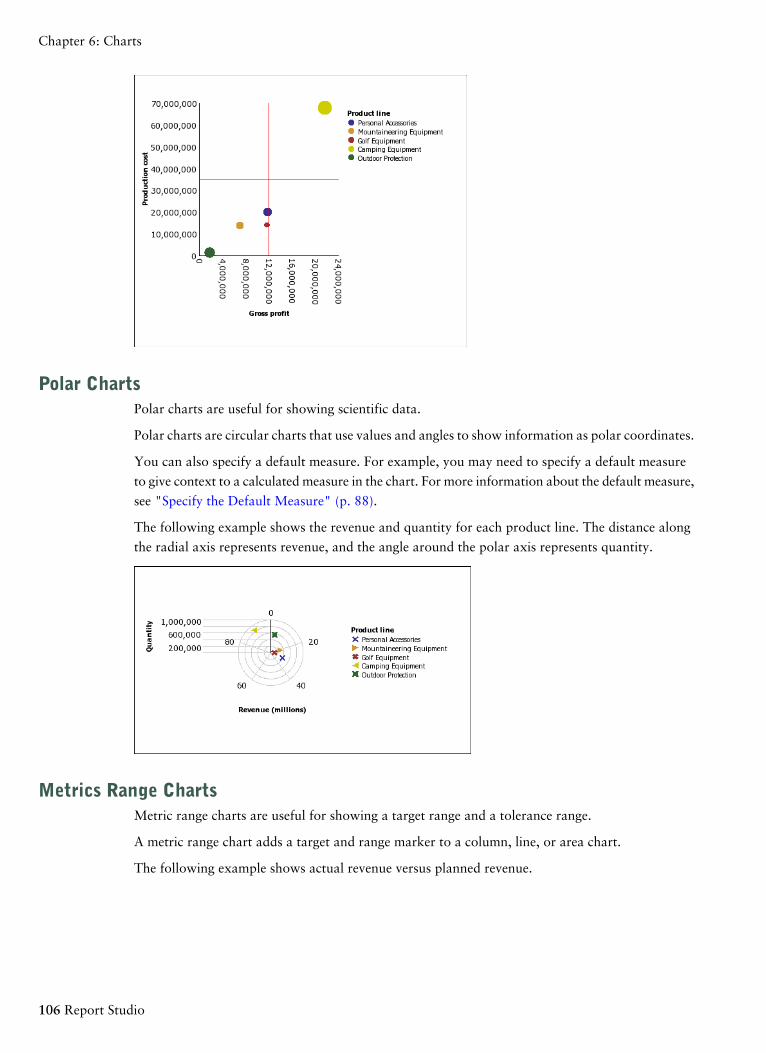
Polar ChartsPolar charts are useful for showing scientific data.
Polar charts are circular charts that use values and angles to show information as polar coordinates.
You can also specify a default measure. For example, you may need to specify a default measure
to give context to a calculated measure in the chart. For more information about the default measure,
see "Specify the Default Measure" (p. 88).
The following example shows the revenue and quantity for each product line. The distance along
the radial axis represents revenue, and the angle around the polar axis represents quantity.
Metrics Range ChartsMetric range charts are useful for showing a target range and a tolerance range.
A metric range chart adds a target and range marker to a column, line, or area chart.
The following example shows actual revenue versus planned revenue.
106 Report Studio
Chapter 6: Charts
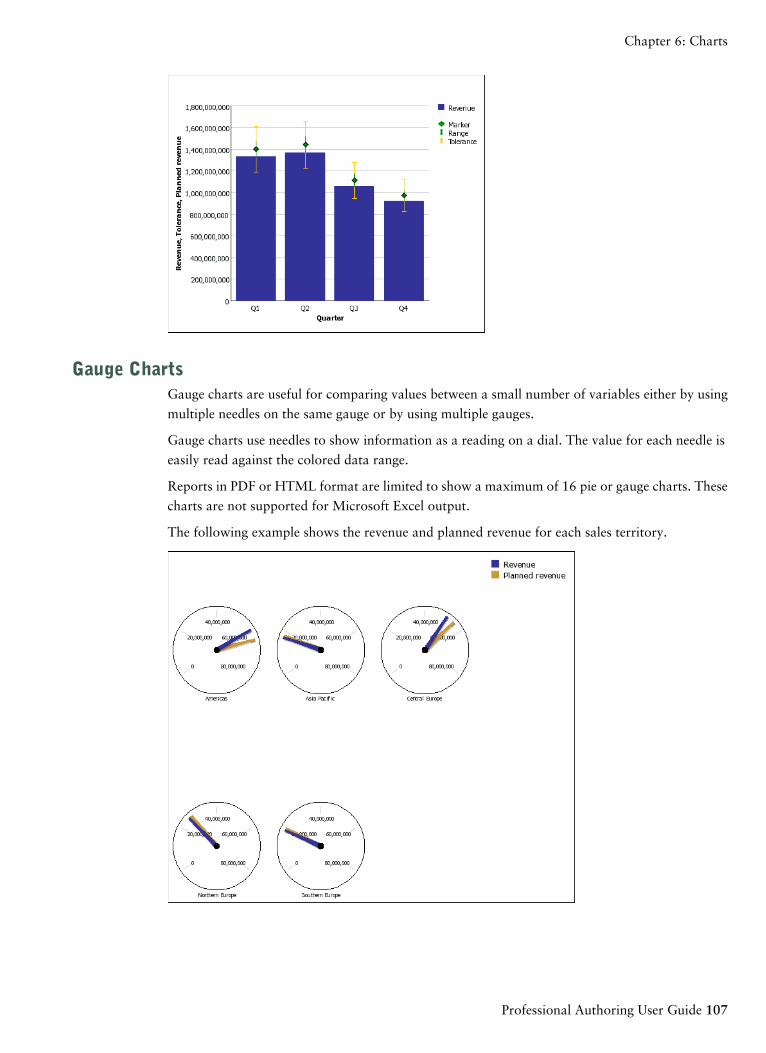
Gauge ChartsGauge charts are useful for comparing values between a small number of variables either by using
multiple needles on the same gauge or by using multiple gauges.
Gauge charts use needles to show information as a reading on a dial. The value for each needle is
easily read against the colored data range.
Reports in PDF or HTML format are limited to show a maximum of 16 pie or gauge charts. These
charts are not supported for Microsoft Excel output.
The following example shows the revenue and planned revenue for each sales territory.
Professional Authoring User Guide 107
Chapter 6: Charts
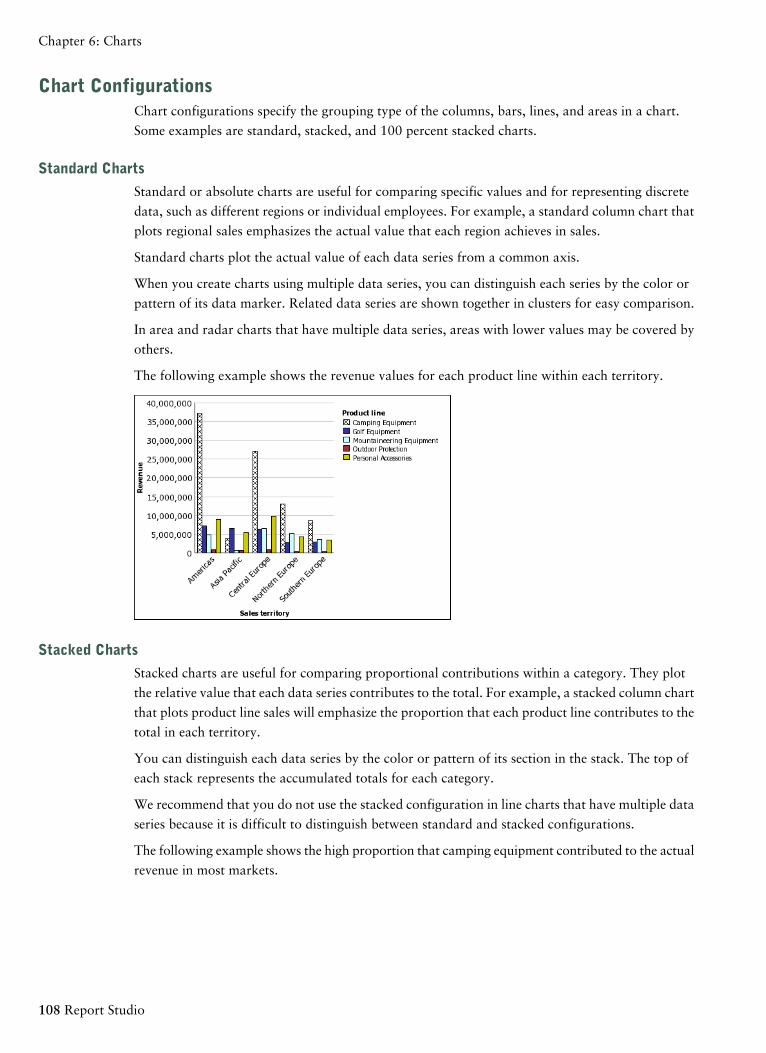
Chart ConfigurationsChart configurations specify the grouping type of the columns, bars, lines, and areas in a chart.
Some examples are standard, stacked, and 100 percent stacked charts.
Standard Charts
Standard or absolute charts are useful for comparing specific values and for representing discrete
data, such as different regions or individual employees. For example, a standard column chart that
plots regional sales emphasizes the actual value that each region achieves in sales.
Standard charts plot the actual value of each data series from a common axis.
When you create charts using multiple data series, you can distinguish each series by the color or
pattern of its data marker. Related data series are shown together in clusters for easy comparison.
In area and radar charts that have multiple data series, areas with lower values may be covered by
others.
The following example shows the revenue values for each product line within each territory.
Stacked Charts
Stacked charts are useful for comparing proportional contributions within a category. They plot
the relative value that each data series contributes to the total. For example, a stacked column chart
that plots product line sales will emphasize the proportion that each product line contributes to the
total in each territory.
You can distinguish each data series by the color or pattern of its section in the stack. The top of
each stack represents the accumulated totals for each category.
We recommend that you do not use the stacked configuration in line charts that have multiple data
series because it is difficult to distinguish between standard and stacked configurations.
The following example shows the high proportion that camping equipment contributed to the actual
revenue in most markets.
108 Report Studio
Chapter 6: Charts
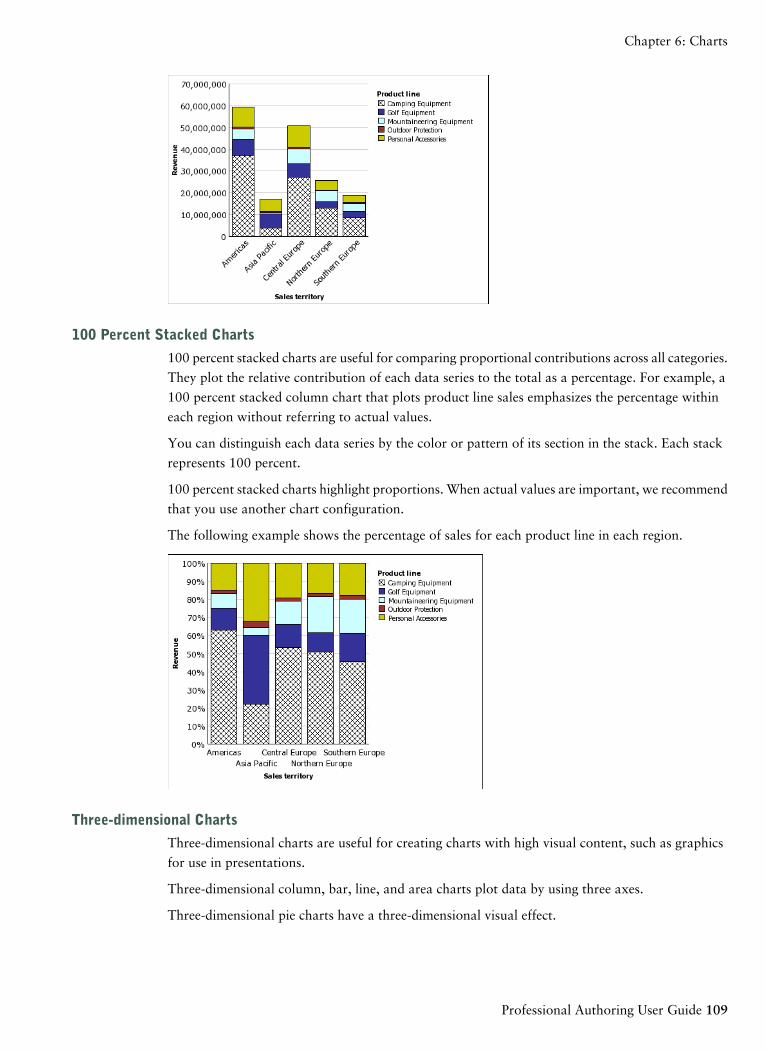
100 Percent Stacked Charts
100 percent stacked charts are useful for comparing proportional contributions across all categories.
They plot the relative contribution of each data series to the total as a percentage. For example, a
100 percent stacked column chart that plots product line sales emphasizes the percentage within
each region without referring to actual values.
You can distinguish each data series by the color or pattern of its section in the stack. Each stack
represents 100 percent.
100 percent stacked charts highlight proportions. When actual values are important, we recommend
that you use another chart configuration.
The following example shows the percentage of sales for each product line in each region.
Three-dimensional Charts
Three-dimensional charts are useful for creating charts with high visual content, such as graphics
for use in presentations.
Three-dimensional column, bar, line, and area charts plot data by using three axes.
Three-dimensional pie charts have a three-dimensional visual effect.
Professional Authoring User Guide 109
Chapter 6: Charts
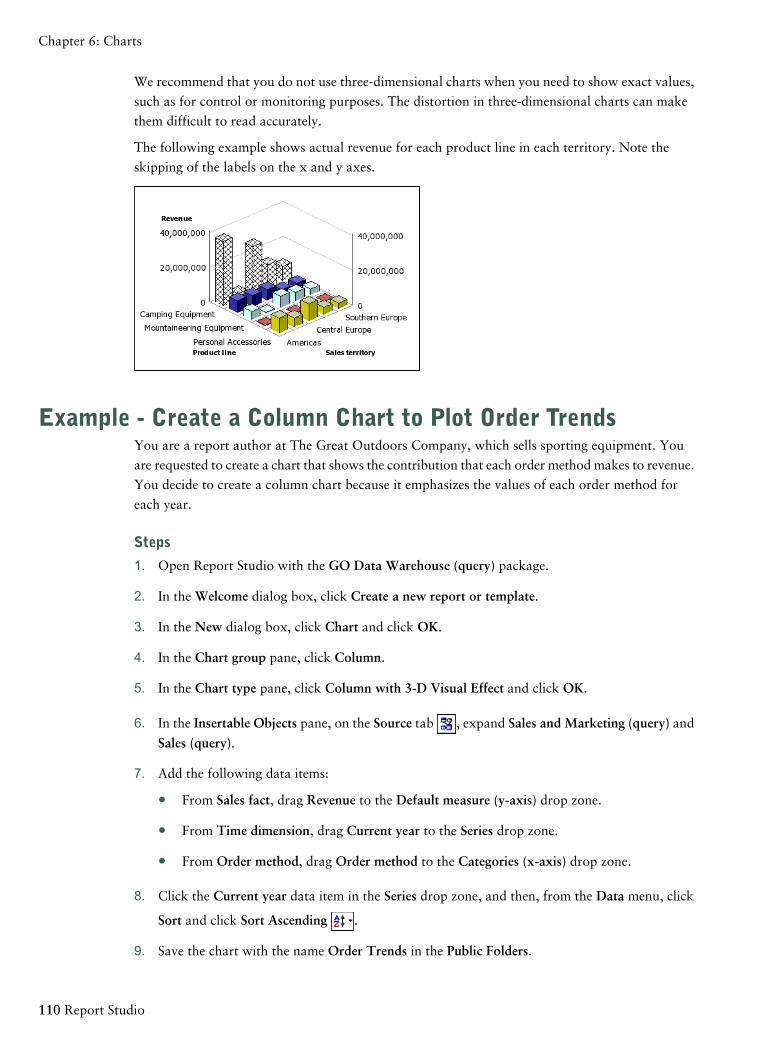
We recommend that you do not use three-dimensional charts when you need to show exact values,
such as for control or monitoring purposes. The distortion in three-dimensional charts can make
them difficult to read accurately.
The following example shows actual revenue for each product line in each territory. Note the
skipping of the labels on the x and y axes.
Example - Create a Column Chart to Plot Order TrendsYou are a report author at The Great Outdoors Company, which sells sporting equipment. You
are requested to create a chart that shows the contribution that each order method makes to revenue.
You decide to create a column chart because it emphasizes the values of each order method for
each year.
Steps
1. Open Report Studio with the GO Data Warehouse (query) package.
2. In the Welcome dialog box, click Create a new report or template.
3. In the New dialog box, click Chart and click OK.
4. In the Chart group pane, click Column.
5. In the Chart type pane, click Column with 3-D Visual Effect and click OK.
6. In the Insertable Objects pane, on the Source tab , expand Sales and Marketing (query) and
Sales (query).
7. Add the following data items:
● From Sales fact, drag Revenue to the Default measure (y-axis) drop zone.
● From Time dimension, drag Current year to the Series drop zone.
● From Order method, drag Order method to the Categories (x-axis) drop zone.
8. Click the Current year data item in the Series drop zone, and then, from the Data menu, click
Sort and click Sort Ascending .
9. Save the chart with the name Order Trends in the Public Folders.
110 Report Studio
Chapter 6: Charts
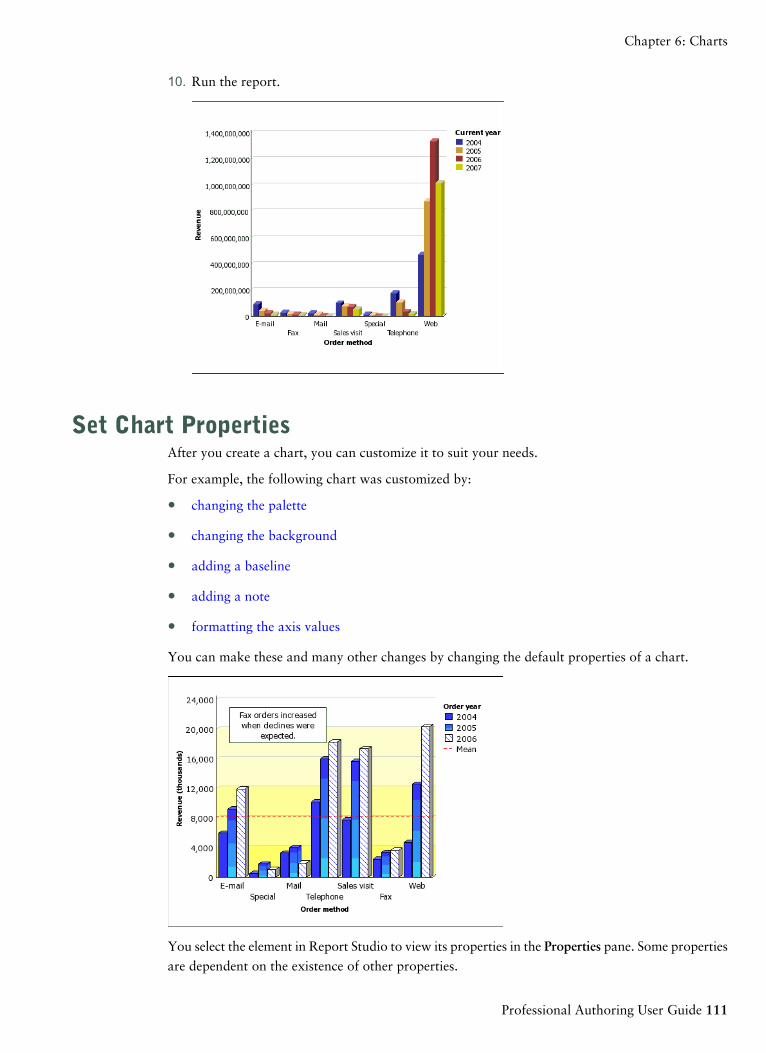
10. Run the report.
Set Chart PropertiesAfter you create a chart, you can customize it to suit your needs.
For example, the following chart was customized by:
● changing the palette
● changing the background
● adding a baseline
● adding a note
● formatting the axis values
You can make these and many other changes by changing the default properties of a chart.
You select the element in Report Studio to view its properties in the Properties pane. Some properties
are dependent on the existence of other properties.
Professional Authoring User Guide 111
Chapter 6: Charts
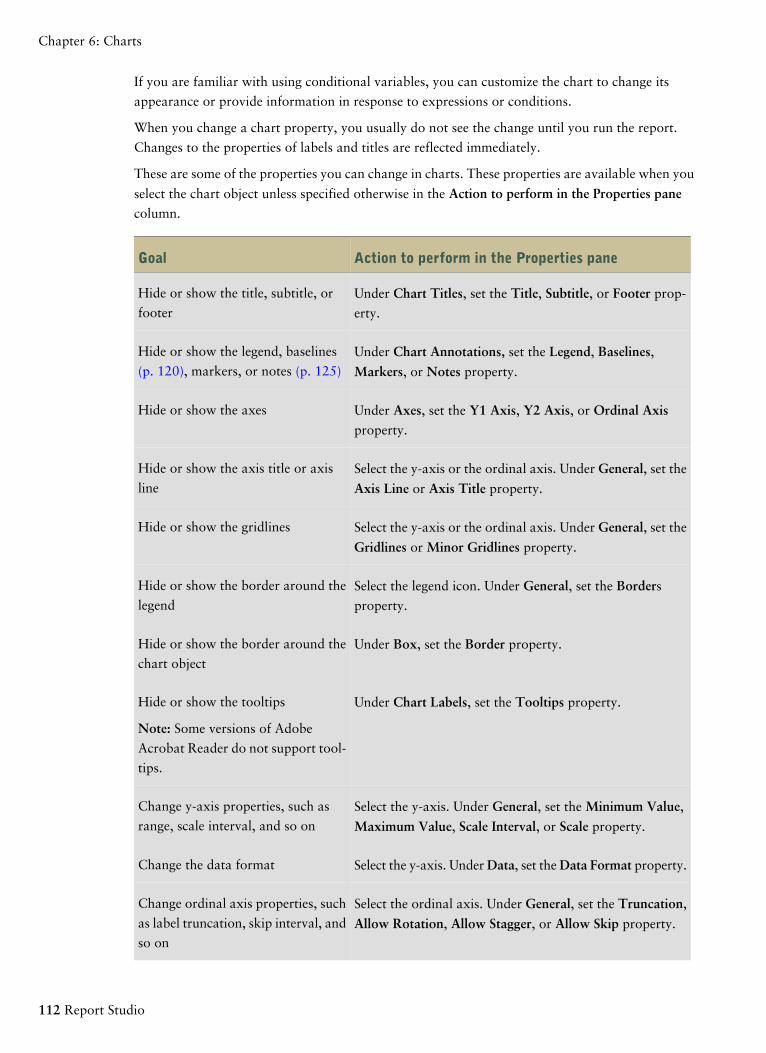
If you are familiar with using conditional variables, you can customize the chart to change its
appearance or provide information in response to expressions or conditions.
When you change a chart property, you usually do not see the change until you run the report.
Changes to the properties of labels and titles are reflected immediately.
These are some of the properties you can change in charts. These properties are available when you
select the chart object unless specified otherwise in the Action to perform in the Properties panecolumn.
Action to perform in the Properties paneGoal
Under Chart Titles, set the Title, Subtitle, or Footer prop-
erty.
Hide or show the title, subtitle, or
footer
Under Chart Annotations, set the Legend, Baselines,
Markers, or Notes property.
Hide or show the legend, baselines
(p. 120), markers, or notes (p. 125)
Under Axes, set the Y1 Axis, Y2 Axis, or Ordinal Axisproperty.
Hide or show the axes
Select the y-axis or the ordinal axis. Under General, set the
Axis Line or Axis Title property.
Hide or show the axis title or axis
line
Select the y-axis or the ordinal axis. Under General, set the
Gridlines or Minor Gridlines property.
Hide or show the gridlines
Select the legend icon. Under General, set the Bordersproperty.
Hide or show the border around the
legend
Under Box, set the Border property.Hide or show the border around the
chart object
Under Chart Labels, set the Tooltips property.Hide or show the tooltips
Note: Some versions of Adobe
Acrobat Reader do not support tool-
tips.
Select the y-axis. Under General, set the Minimum Value,
Maximum Value, Scale Interval, or Scale property.
Change y-axis properties, such as
range, scale interval, and so on
Select the y-axis. Under Data, set the Data Format property.Change the data format
Select the ordinal axis. Under General, set the Truncation,
Allow Rotation, Allow Stagger, or Allow Skip property.
Change ordinal axis properties, such
as label truncation, skip interval, and
so on
112 Report Studio
Chapter 6: Charts
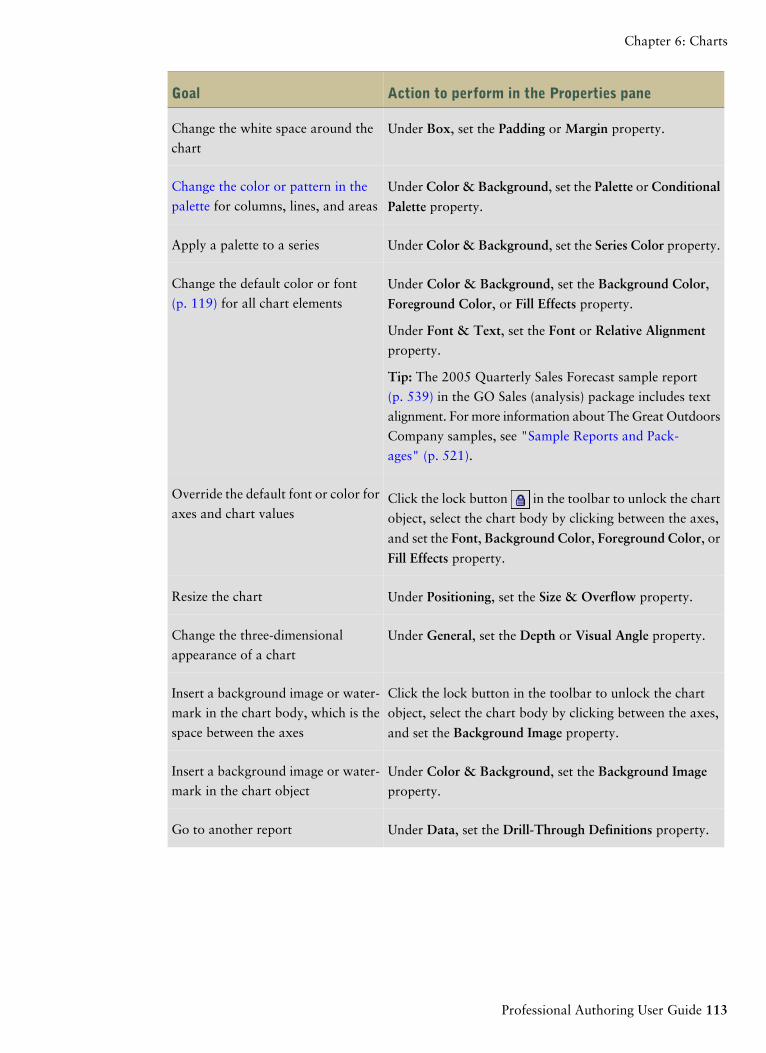
Action to perform in the Properties paneGoal
Under Box, set the Padding or Margin property.Change the white space around the
chart
Under Color & Background, set the Palette or Conditional
Palette property.
Change the color or pattern in the
palette for columns, lines, and areas
Under Color & Background, set the Series Color property.Apply a palette to a series
Under Color & Background, set the Background Color,
Foreground Color, or Fill Effects property.
Change the default color or font
(p. 119) for all chart elements
Under Font & Text, set the Font or Relative Alignmentproperty.
Tip: The 2005 Quarterly Sales Forecast sample report
(p. 539) in the GO Sales (analysis) package includes text
alignment. For more information about The Great Outdoors
Company samples, see "Sample Reports and Pack-
ages" (p. 521).
Click the lock button in the toolbar to unlock the chart
object, select the chart body by clicking between the axes,
and set the Font, Background Color, Foreground Color, or
Fill Effects property.
Override the default font or color for
axes and chart values
Under Positioning, set the Size & Overflow property.Resize the chart
Under General, set the Depth or Visual Angle property.Change the three-dimensional
appearance of a chart
Click the lock button in the toolbar to unlock the chart
object, select the chart body by clicking between the axes,
and set the Background Image property.
Insert a background image or water-
mark in the chart body, which is the
space between the axes
Under Color & Background, set the Background Imageproperty.
Insert a background image or water-
mark in the chart object
Under Data, set the Drill-Through Definitions property.Go to another report
Professional Authoring User Guide 113
Chapter 6: Charts
Action to perform in the Properties paneGoal
Under Chart Labels, set the Values property.Specify which labels and values to use
when generating the text shown on
the chartNote: When you show all the labels and values on some
chart types, such as scatter charts, bubble charts, and polar
charts, the text shown may be too long.
Steps
1. Select the chart or chart element to change:
● To change general properties, such as size and color, select the chart object.
● To change specific chart elements, such as a title or axis, select the element itself.
Tip: To cancel a selection, press the Esc key.
2. In the Properties pane, set the property value.
An ellipsis (...) button indicates that a dialog box provides further options.
You may have to scroll to see all the properties.
Insert a Microchart into a CrosstabYou can use microcharts to improve the visualization of data in crosstabs.
Steps
1. Select a row or column.
2. From the right-click menu, click Insert Chart for Row Data or Insert Chart for Column Data.
3. From the Insert Chart dialog box, select a chart and click OK.
4. Specify the data to plot in the microchart.
The chart automatically plots the data in the specified rows or columns. You can change this
if necessary.
Example - Insert a Line MicrochartYou are a report author at The Great Outdoors Company, which sells sporting equipment. You
have a crosstab report that shows the revenue and planned revenue for your retailers.
You want to show the trends in gross profit, so you insert a microchart to accompany each retailer.
Steps
1. Open Report Studio with the GO Sales (analysis) package.
2. In the Welcome dialog box, click Create a new report or template.
3. In the New dialog box, click Crosstab and click OK.
114 Report Studio
Chapter 6: Charts
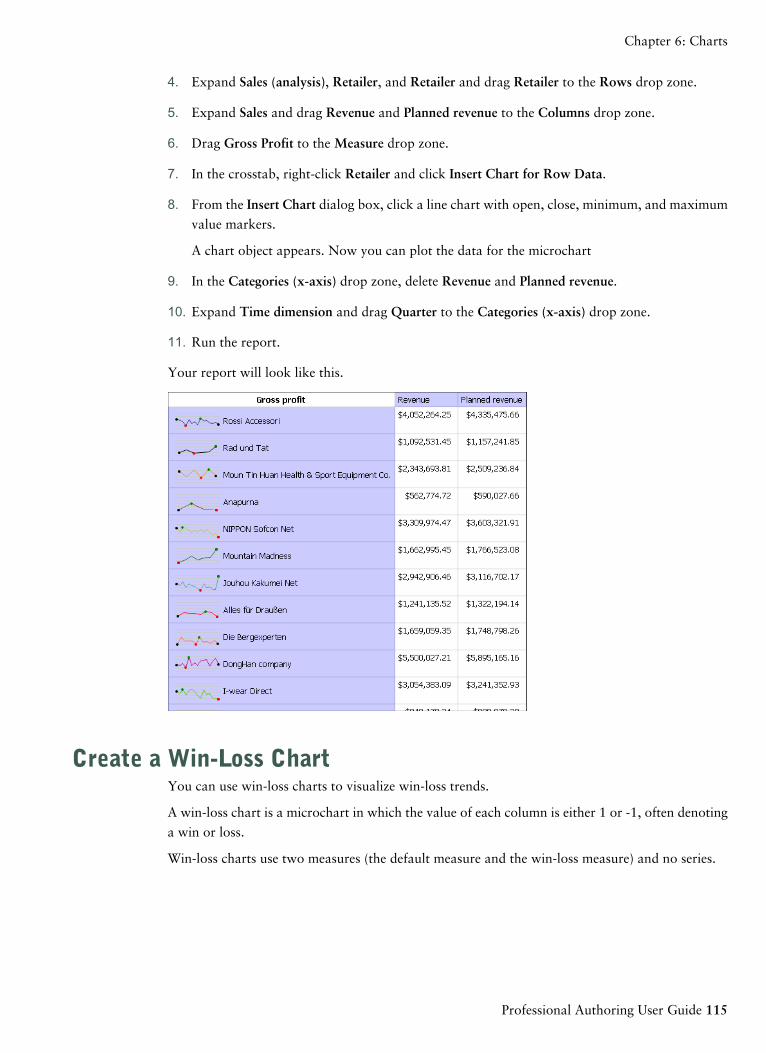
4. Expand Sales (analysis), Retailer, and Retailer and drag Retailer to the Rows drop zone.
5. Expand Sales and drag Revenue and Planned revenue to the Columns drop zone.
6. Drag Gross Profit to the Measure drop zone.
7. In the crosstab, right-click Retailer and click Insert Chart for Row Data.
8. From the Insert Chart dialog box, click a line chart with open, close, minimum, and maximum
value markers.
A chart object appears. Now you can plot the data for the microchart
9. In the Categories (x-axis) drop zone, delete Revenue and Planned revenue.
10. Expand Time dimension and drag Quarter to the Categories (x-axis) drop zone.
11. Run the report.
Your report will look like this.
Create a Win-Loss ChartYou can use win-loss charts to visualize win-loss trends.
A win-loss chart is a microchart in which the value of each column is either 1 or -1, often denoting
a win or loss.
Win-loss charts use two measures (the default measure and the win-loss measure) and no series.
Professional Authoring User Guide 115
Chapter 6: Charts
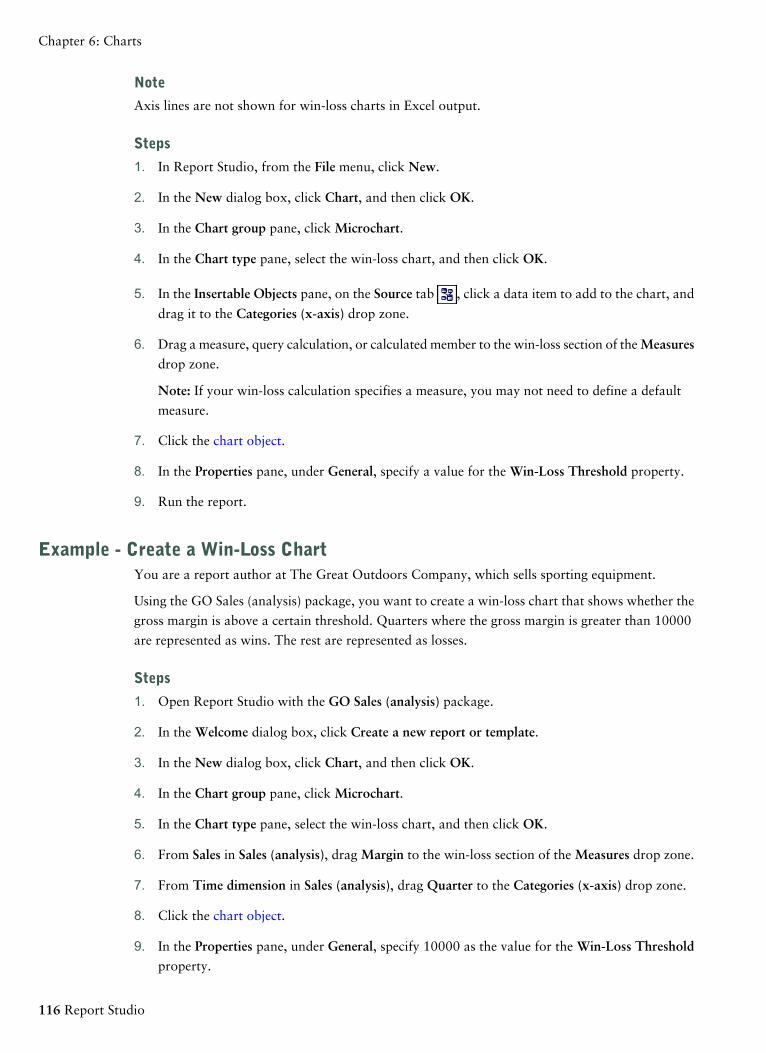
Note
Axis lines are not shown for win-loss charts in Excel output.
Steps
1. In Report Studio, from the File menu, click New.
2. In the New dialog box, click Chart, and then click OK.
3. In the Chart group pane, click Microchart.
4. In the Chart type pane, select the win-loss chart, and then click OK.
5. In the Insertable Objects pane, on the Source tab , click a data item to add to the chart, and
drag it to the Categories (x-axis) drop zone.
6. Drag a measure, query calculation, or calculated member to the win-loss section of the Measuresdrop zone.
Note: If your win-loss calculation specifies a measure, you may not need to define a default
measure.
7. Click the chart object.
8. In the Properties pane, under General, specify a value for the Win-Loss Threshold property.
9. Run the report.
Example - Create a Win-Loss ChartYou are a report author at The Great Outdoors Company, which sells sporting equipment.
Using the GO Sales (analysis) package, you want to create a win-loss chart that shows whether the
gross margin is above a certain threshold. Quarters where the gross margin is greater than 10000
are represented as wins. The rest are represented as losses.
Steps
1. Open Report Studio with the GO Sales (analysis) package.
2. In the Welcome dialog box, click Create a new report or template.
3. In the New dialog box, click Chart, and then click OK.
4. In the Chart group pane, click Microchart.
5. In the Chart type pane, select the win-loss chart, and then click OK.
6. From Sales in Sales (analysis), drag Margin to the win-loss section of the Measures drop zone.
7. From Time dimension in Sales (analysis), drag Quarter to the Categories (x-axis) drop zone.
8. Click the chart object.
9. In the Properties pane, under General, specify 10000 as the value for the Win-Loss Thresholdproperty.
116 Report Studio
Chapter 6: Charts
Tip: Alternatively, from the Toolbox tab you can drag a calculated member or query calculation
to the win-loss section of the Measures drop zone and use the Expression editor to create a
calculation.
10. Run the report.
Your report will look like this.
Show Data Points or Value MarkersYou can specify and format data points or value markers in line charts. Data points represent series
values for each category on the y-axis. Value markers represent statistically significant values, such
as open, high, low, and close values.
You can also add markers at other positions on the chart. For more information, see "Add a Marker
to a Chart" (p. 124).
Notes
You cannot show value markers under the following conditions:
● The Data points option is selected.
● The configuration of the line chart is stacked or 100 percent stacked.
● The Line property is set to No, creating a point chart.
Steps
1. Click under Series in the chart template to view the line properties.
2. In the Properties pane, under General, double-click the Show Data Points property to show
data points or value markers:
● To show or format data points, click Data points and specify the point shape and point
size.
The point color is defined by the chart palette. For more information, see "Customize the
Colors of a Chart" (p. 118).
● To show or format value markers, click Value markers and specify the markers to show.
For each marker, specify the shape and marker size. Click the Color link to change the
marker color.
Tip: To remove all data points and value markers, in the Show Data Points dialog box, select
None.
Professional Authoring User Guide 117
Chapter 6: Charts
Customize the Colors of a ChartYou can use the chart palette to control the colors of the columns, lines, or areas in a chart. For
example, if you know that Telephone is the first in a data series of order methods and you want it
to appear in blue, you use the palette to ensure that the first item in the series is blue.
You use a unique color, pattern, or gradient fill for each series in the chart. Patterns are useful when
the report is printed on a black and white printer because colors do not print well in shades of gray.
If you apply a background color to the chart, the note area does not use the same background color.
You must also change the background color of the note.
Steps
1. Click the chart object.
2. In the Color & Background section of the Properties pane, double-click the Palette property.
3. In the Palette dialog box, click the new palette entry button to define a new palette entry:
● To apply color, click Color, specify the color properties, and click OK.
● To apply a gradient, click Gradient, specify the Direction, From color, and To color
properties, and click OK.
● To apply a pattern, click Pattern, specify the Pattern, Foreground color, and Background
color properties, and click OK.
Tip: You can also select a predefined palette from the Palettes box.
4. Repeat step 3 for each chart series.
Tips
● To delete a palette definition, select the definition in the Palette box, and then click the delete
button .
● To change the order in which the colors, gradients, or patterns appear in the chart, use the
arrow buttons under the Palette box to change their position.
● To copy and paste a palette, open the palette dialog box and press Ctrl+c to copy the palette
to the clipboard. Close the palette dialog box. Select another chart, open the palette dialog box,
and press Ctrl+v to paste the palette from the clipboard.
Example - Customize the Palette in the Order Trends ChartYou are a report author at The Great Outdoors Company, which sells sporting equipment. You
have created a column chart that shows the contribution each order method makes to revenue.
You decide to give each column a distinctive look to better differentiate the values of each order
method for each year.
118 Report Studio
Chapter 6: Charts
Before you can try this example, you must create the chart in "Example - Create a Column Chart
to Plot Order Trends" (p. 110).
Steps
1. Open the Order Trends chart.
2. Click the chart object.
3. In the Color & Background section of the Properties pane, double-click the Palette property.
4. Click Color.
5. On the Web Safe Colors tab, click a medium blue color and click OK.
6. Click the new palette entry button , and then click Gradient.
7. In the Direction box, click Top to Bottom.
8. Click From color.
9. On the Web Safe Colors tab, click a medium blue color and click OK.
10. Click To color.
11. On the Web Safe Colors tab, click a lighter blue color and click OK.
12. Click the new palette entry button, and then click Pattern.
13. In the Pattern box, click a diagonal line pattern.
14. Click Foreground color.
15. On the Web Safe Colors tab, click a blue color and click OK.
Now you must add borders to the diagonal line pattern.
16. Click the chart type icon in the Series drop zone.
17. In the Properties pane, set the Borders property to Show.
18. Save the chart.
Change a Chart BackgroundYou can use a solid color, a pattern, or a gradient fill effect to customize the chart background.
You can also use an image as a background for a chart. For more information, see "Set Chart
Properties" (p. 111).
Steps
1. Click the chart object.
2. Click the unlock button , select the chart body by clicking between the axes, and, in the
Properties pane, under Color & Background, double-click the Fill Effects property.
Professional Authoring User Guide 119
Chapter 6: Charts
3. In the Effect box, choose a color, a gradient fill effect, or a pattern:
● To apply a color, click Color and specify the color properties.
● To apply a gradient fill effect, click Gradient and then specify the Direction, From color,
and To color properties.
● To apply a pattern effect, click Pattern and specify the Pattern, Foreground Color, and
Background Color properties.
The foreground color is the color of the selected pattern. The background color is the color
of the area behind the pattern.
Tip: To remove a background fill effect, click None.
Example - Change the Background of the Order Trends ChartYou are a report author at The Great Outdoors Company, which sells sporting equipment. You
created a column chart that shows the contribution that each order method makes to revenue.
You decide to give your chart a visually interesting background fill.
Before you can try this example, you must create the chart in "Example - Customize the Palette in
the Order Trends Chart" (p. 118).
Steps
1. Open the Order Trends chart.
2. Click the chart object.
3. Click the unlock button .
4. Select the chart body by clicking between the axes.
5. In the Properties pane, under Color & Background, double-click the Fill Effects property.
6. In the Effect box, click Gradient.
7. Specify a gradient that goes from yellow to white:
● In the Direction box, click Bottom to Top and click OK.
● Click From color.
● On the Web Safe Colors tab, click a light yellow color and click OK.
● Leave white as the To color.
8. Save the chart.
Add a Baseline to a ChartBaselines are horizontal or vertical lines that cut through the chart to indicate major divisions in
the data. For example, you can add a baseline to show a sales quota or break-even point.
120 Report Studio
Chapter 6: Charts
You can position the baseline using the following options.
PositionOption
Uses a static numeric value.Numeric Value
Uses a query calculation from the same query or from a different
query. For more information, see "Using Relational Calcula-
tions" (p. 187).
Query Calculation
Uses a layout calculation. For more information, see "Using Rela-
tional Calculations" (p. 187).
Layout Calculation
Uses a position relative to a member. For example, a member calcu-
lation that uses an expression similar to [Query1].[Current
year]=2006 places the baseline in the middle of the chart element
that represents 2006. To place the baseline between 2006 and 2007
on the chart, a half member width to the right, set the Member
Offset property to 50%. To place the baseline between 2005 and
2006, set the Member Offset property to -50%. You can also type
in 100, -200, and so on to place the baseline on the chart.
Member Value
Uses the following expression:Statistical Minimum
25th percentile value - 1.5 * (75th percentile value - 25th percentile
value)
For example, if 2.5 is the 25th percentile and 7.5 is the 75th percent-
ile, the statistical minimum is -5 [2.5 -1.5(5) = -5].
Statistical Minimum uses percentiles to determine values and may
not always appear in the chart if the values are off the axis.
Uses the following expression:Statistical Maximum
75th percentile value + 1.5 * (75th percentile value - 25th percentile
value)
For example, if 2.5 is the 25th percentile and 7.5 is the 75th percent-
ile, the statistical maximum is 15 [7.5 +1.5(5) = 15].
Statistical Maximum uses percentiles to determine values and may
not always appear in the chart if the values are off the axis.
Uses the statistical mean plus or minus a number of standard devi-
ations based on all charted data values on the specified axis.
Mean
Uses a specified percentile.Percentile
Professional Authoring User Guide 121
Chapter 6: Charts
PositionOption
Uses a percentage of the full range of the axis.Percent on Axis
For example, if the axis range is -500 to 1100, a Percent on Axis
value of 25% puts the baseline at -100 (25% of the range, 1600).
If you apply more than one baseline, you can specify in which order they should be drawn when
the report runs. They are drawn from top to bottom. If you have two baselines with the same
coordinates, the first one in the list is drawn first and the next one is drawn on top of the first one.
Tip: The Positions to Fill sample report (p. 533) in the GO Data Warehouse (analysis) package
includes a baseline. For more information about The Great Outdoors Company samples, see "Sample
Reports and Packages" (p. 521).
Steps
1. Click the chart object.
2. In the Chart Annotations section of the Properties pane, double-click the Baselines property.
3. Click the new button and choose the type of baseline from the list.
4. Provide any necessary criteria, such as a value or percentage.
5. If you add more than one baseline, specify their order using the up and down arrows.
6. Click OK.
A baseline icon appears in the Markers, notes, and baselines box.
7. To define the line style, click the baseline icon and set the Line Style property.
8. To define the text style, click the baseline text and make changes in the Properties pane.
Tip: To delete a baseline, click its baseline icon and click the delete button .
Example - Add a Baseline to the Order Trends ChartYou are a report author at The Great Outdoors Company, which sells sporting equipment. You
created a column chart that shows the contribution that each order method makes to revenue.
You decide to add a baseline to indicate the mean revenue for the Order Trends chart.
Before you can try this example, you must create the chart in "Example - Change the Background
of the Order Trends Chart" (p. 120).
Steps
1. Open the Order Trends chart.
2. Click the chart object.
3. In the Chart Annotations section of the Properties pane, double-click the Baselines property.
122 Report Studio
Chapter 6: Charts
4. Click the new button and click Mean.
5. Leave Distance From Mean at zero, and click OK twice.
A baseline icon appears in the Markers, Notes, and Baselines box.
6. To define the line style:
● Click the baseline icon .
● In the Properties pane, under General, double-click the Line Style property.
● Change the line color to Red and the line style to dashed.
7. Save the chart.
Customize the Lines in a ChartYou can change the color, style, and weight of the lines in a chart. You can apply these changes to
the x-axis and y-axis lines and to the major and minor gridlines.
You can also
● specify whether to use a linear or a logarithmic scale for the y-axis
● specify a scale interval for the y-axis
● show or hide major and minor gridlines
● show regression lines on scatter charts (p. 103) and bubble charts (p. 104)
Regression Lines
Regression lines graphically illustrate trends in data series. Also called trend lines, they are commonly
used when charting predictions. A regression line is typically a line or curve that connects two or
more points in the series and then extends into the future.
You can specify the following types of regression lines to determine the position and slope of the
line.
Steps
1. Select the y-axis or the x-axis of the chart.
2. In the Properties pane, under General, double-click the Axis Line, Gridlines, or Minor Gridlinesproperty.
3. Choose the color, weight, and style.
Tips
● To specify a linear or logarithmic scale for the y-axis, in the Properties pane, under General,
set the Scale property.
● To specify a scale interval for the y-axis, set the Scale Interval property.
Professional Authoring User Guide 123
Chapter 6: Charts
● To show minor gridlines, double-click the Minor Gridlines property, select the Show minor
gridlines check box, and type a number under Number of minor gridlines.
● To show regression lines, click a scatter chart or bubble chart object and, in the Properties
pane, under Chart Annotations, set the Regression Line property to Show.
When you show regression lines, you must then select their properties. Click the regression line
icon in the report layout and set the Line Styles,Regression Type, andNumber of Regression
Lines properties.
Add a Marker to a ChartMarkers are notations along the axis of a chart that designate a point on the scale that may help
you analyze or understand the data.
You can position the marker using the following options.
PositionNumeric position type
Uses a static numeric value.Numeric Value
Uses a query calculation from the same query or from a different
query. For more information, see "Using Relational Calcula-
tions" (p. 187).
Query Calculation
Uses a layout calculation. For more information, see "Using Rela-
tional Calculations" (p. 187).
Layout Calculation
Uses the following expression:Statistical Minimum
25th percentile value - 1.5 * (75th percentile value - 25th percentile
value)
For example, if 2.5 is the 25th percentile and 7.5 is the 75th percent-
ile, the statistical minimum is -5 [2.5 -1.5(5) = -5].
Statistical minimum uses percentiles to determine values, and may
not always appear in the chart if the values are off the axis.
Uses the following expression:Statistical Maximum
75th percentile value + 1.5 * (75th percentile value - 25th percentile
value)
For example, if 2.5 is the 25th percentile and 7.5 is the 75th percent-
ile, the statistical maximum is 15 [7.5 +1.5(5) = 15].
Statistical maximum uses percentiles to determine values and may
not always appear in the chart if the values are off the axis.
124 Report Studio
Chapter 6: Charts
PositionNumeric position type
Uses the statistical mean plus or minus a number of standard devi-
ations based on all charted data values on the specified axis.
Mean
Uses a specified percentile.Percentile
Uses a percent of the maximum axis value.Percent on Axis
If you apply more than one marker, you can specify in which order they should be drawn when
the report runs. They are drawn from top to bottom. If you have two markers with the same
coordinates, the first one in the list is drawn first and the next one is drawn on top of the first.
Steps
1. Click the chart object.
2. In the Properties pane, under Chart Annotations, double-click the Markers property.
3. Click the new button , and then set the Numeric position type, Marker label, Marker shape,
Numeric value, and Color properties.
4. If you add more than one marker, specify their order using the up and down arrows.
The new markers appear in the Markers, notes, and baselines box.
Tip: To delete a marker, click the marker icon and text and click the delete button .
5. Run the report.
Add a Note to a ChartNotes are pieces of text that appear in the chart. You can add notes to a chart to provide additional
detail, such as explanatory information, or to highlight a notable value.
You can use text, an item label or value, or a report expression as the source for a note.
Notes overwrite whatever is under them so you must position them properly.
If you apply more than one note, ensure that each note has a different position in the report so that
they do not overwrite each other. You can also specify in which order they should be drawn when
the report runs. They are drawn from top to bottom. If you have two notes with the same
coordinates, the first one in the list is drawn first and the next one is drawn on top of the first.
If you apply a background color to the chart, the note area does not use the same background color.
You must also change the background color of the note.
Professional Authoring User Guide 125
Chapter 6: Charts
Tip: The Top 10 Retailers for 2005 sample report (p. 537) in the GO Data Warehouse (analysis)
package includes a note. For more information about The Great Outdoors Company samples, see
"Sample Reports and Packages" (p. 521).
Steps
1. Click the chart object.
2. In the Properties pane, under Chart Annotations, double-click the Notes property.
3. Click the new button and click OK twice.
A note icon appears in the Markers, notes, and baselines box.
4. Click the note icon and set the note size, position, and border in the Properties pane.
The location and size are statically set based on the number of pixels.
5. Double-click the note text to define the text.
Tip: To delete a note, click the note icon and click the delete button .
Example - Add a Note to the Order Trends ChartYou are a report author at The Great Outdoors Company, which sells sporting equipment. You
created a column chart that shows the contribution that each order method makes to revenue.
You decide to add a note to draw attention to an unexpected result.
Before you can try this example, you must create the chart in "Example - Add a Baseline to the
Order Trends Chart" (p. 122).
Steps
1. Open the Order Trends chart.
2. Click the chart object.
3. In the Properties pane, under Chart Annotations, double-click the Notes property.
The Notes dialog box appears.
4. Click the new button , and then click OK twice.
A note icon appears in the Markers, notes, and baselines section.
5. Select the note icon .
6. In the Properties pane, set the Bottom Position property to 285 and the Left Position property
to 110.
The location and size are statically set based on the number of pixels.
7. In the Properties pane, double-click the Note Border property.
8. Select the Note border check box, click a line color and line style, and click OK.
126 Report Studio
Chapter 6: Charts

9. Run the report.
If necessary, change the position again.
10. Double-click the note text and type Fax orders increased when declines were expected.
11. Save the chart.
Example - Format the Axis Values of the Order Trends ChartYou are a report author at The Great Outdoors Company, which sells sporting equipment. You
created a column chart that shows the contribution that each order method makes to revenue.
You decide to format the y-axis values to make them easier to read.
Before you can try this example, you must create the chart in "Example - Add a Note to the Order
Trends Chart" (p. 126).
Steps
1. Open the Order Trends chart.
2. Select the y-axis.
3. In the Data section of the Properties pane, double-click the Data Format property.
4. Under Format type, click Number.
5. Under Properties, in the Scale box, click -3, and click OK.
6. Expand Axis titles.
7. Select the y-axis title and, in the Properties pane, set the Default title property to No.
8. Double-click the y-axis title and type
Revenue (thousands)
9. Save the chart.
Example - Create a Drill-through ChartYou are a report author at The Great Outdoors Company, which sells sporting equipment. You
are requested to create a chart that shows the revenue for each product line and allows the reader
to drill through from the revenue chart to view the product details for any item selected. You create
a drill-through report to link two reports containing related information. You can then access
related or more detailed information in one report by selecting a value in the chart. You create two
reports: a target list report that contains the details for the item and a source chart that shows the
product line revenue.
For more information about using drill-though reporting in Report Studio, see "Set Up Drill-through
Access in a Report" (p. 481).
Steps to Create the Target Report
1. Open Report Studio with the GO Data Warehouse (query) package.
Professional Authoring User Guide 127
Chapter 6: Charts
2. In the Welcome dialog box, click Create a new report or template.
3. In the New dialog box, click List and click OK.
4. In the Insertable Objects pane, on the Source tab , expand Sales and Marketing (query),
Sales (query), and Product.
5. Double-click the following data items to add them to the list:
● Product line
● Product type
● Product name
● Introduction date
● Product image
Now you must create a filter to use as a drill-through parameter. A drill-through parameter
begins and ends with a question mark (?) symbol.
6. Click the filters button .
7. Click the add button and type the following in the Expression Definition window:
[Sales (query)].[Product].[Product line]=?p_PL?
8. Save the report as Product Line Details.
Steps to Create the Source Chart
1. Create a new report.
2. In the New dialog box, click Chart and click OK.
3. In the Chart group pane, click Column.
4. In the Chart type pane, click Column.
5. Click OK.
6. In the Insertable Objects pane, on the Source tab , expand Sales and Marketing (query) and
then Sales (query).
7. Expand Sales fact and drag Revenue to the Measure (y-axis) drop zone.
8. Expand Order method and drag Order method to the Series drop zone.
9. Expand Product and drag Product Line to the Categories (x-axis) drop zone.
10. From the Data menu, click Drill Behavior.
11. On the Basic tab, under Report output drill capabilities, select the Allow this report to be a
package-based drill-through source check box and click OK.
12. Right-click the chart object and click Drill-Through Definitions.
128 Report Studio
Chapter 6: Charts
13. Click New Drill Through.
14. Under Report, click the ellipsis (...) button.
15. Select the Product Line Details report you created and click Open.
16. Under Action, click Run the Report.
17. Under Format, click HTML.
18. Click the edit button .
Any existing drill-through parameters appear. You see the parameter you created for Product
Line Details.
19. For item p_PL, under Method, click Pass data item value, and under Value, click Product line.
20. Save the chart as Product Revenue.
21. Run the report.
The chart shows the product lines as clickable links. When you click a product line, the second
report runs for that product line.
Specify Custom Label TextYou can override the default label properties.
By default, chart labels use the name of the underlying data item label. You can change the label
text to make it more meaningful. For example, you can rename a chart item labeled ISO_3_Let-
ter_Code to Country.
Steps
1. Click the chart node member or measure.
2. In the Chart Labels section of the Properties pane, set the Custom Label property to Show.
A new chart text item appears.
3. Do one of the following:
● To change the text of the label, double-click the chart text item and type the text.
● To change the source of the label text, select the new chart text item. In the Text Source
section of the Properties pane, set the Source Type property.
If nothing is specified in the new chart text item, the label appears blank.
Tip: To remove a custom label, set the Custom Label property to Hide.
Professional Authoring User Guide 129
Chapter 6: Charts
Specify the Properties of a Gauge ChartThe default gauge chart uses a band divided into thirds that runs from green to red. You can change
the properties to improve the presentation of your data. For example, you may want change the
colors in the band or you may want to use a number instead of a percentage as a threshold.
Steps
1. Open the gauge chart.
2. Click the chart object.
3. In the Color & Background section of the Properties pane, double-click the Gauge Paletteproperty.
4. Specify the following properties:
● To change the color of a palette entry, under Palette, select the color, click Color, specify
the color properties, and click OK.
● To change the boundary value of a palette entry, under Palette, select the boundary value,
and specify the color properties, and click OK.
● To define a new palette entry, click the new palette entry button .
● To choose a threshold style, set the Palette property.
Tips
● You can choose whether to use discrete colors or continuous colors.
● To use a number instead of a percentage as a boundary, click a number under Palette, clear the
Percentage check box, and then type a number in the Numeric boundary box.
● To copy and paste a gauge palette, open the gauge palette dialog box and click the copy button
to copy the palette to the clipboard. Close the palette dialog box. Select another chart, open
the palette dialog box, and click the paste button to paste the palette from the clipboard.
Create a Drill-up and Drill-down ChartIf you use a dimensionally-modeled data source, you can create a chart that allows you to drill
down to lower-level data or drill up to higher-level data.
Drilling up and down allows you to view more general or more detailed information on your data
within a predefined dimensional hierarchy.
This is an example of a dimensional hierarchy:
Years - Year - Quarter - Month
Before you begin, ensure that you are using a dimensionally-modeled data source.
130 Report Studio
Chapter 6: Charts
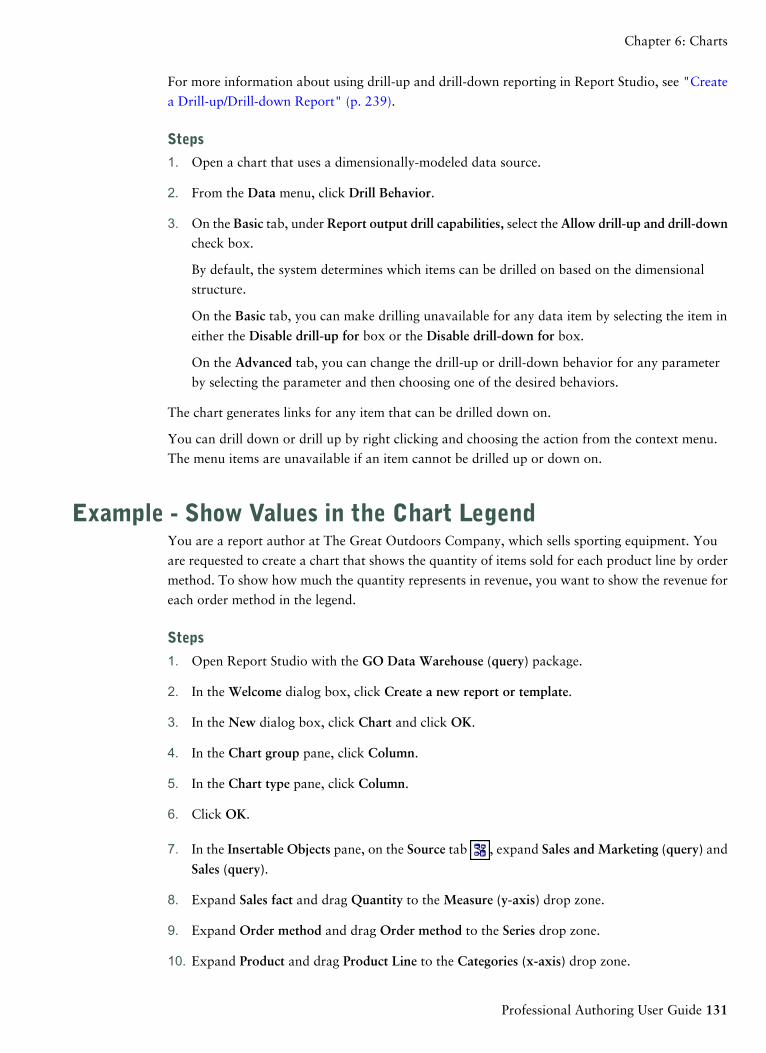
For more information about using drill-up and drill-down reporting in Report Studio, see "Create
a Drill-up/Drill-down Report" (p. 239).
Steps
1. Open a chart that uses a dimensionally-modeled data source.
2. From the Data menu, click Drill Behavior.
3. On the Basic tab, under Report output drill capabilities, select the Allow drill-up and drill-downcheck box.
By default, the system determines which items can be drilled on based on the dimensional
structure.
On the Basic tab, you can make drilling unavailable for any data item by selecting the item in
either the Disable drill-up for box or the Disable drill-down for box.
On the Advanced tab, you can change the drill-up or drill-down behavior for any parameter
by selecting the parameter and then choosing one of the desired behaviors.
The chart generates links for any item that can be drilled down on.
You can drill down or drill up by right clicking and choosing the action from the context menu.
The menu items are unavailable if an item cannot be drilled up or down on.
Example - Show Values in the Chart LegendYou are a report author at The Great Outdoors Company, which sells sporting equipment. You
are requested to create a chart that shows the quantity of items sold for each product line by order
method. To show how much the quantity represents in revenue, you want to show the revenue for
each order method in the legend.
Steps
1. Open Report Studio with the GO Data Warehouse (query) package.
2. In the Welcome dialog box, click Create a new report or template.
3. In the New dialog box, click Chart and click OK.
4. In the Chart group pane, click Column.
5. In the Chart type pane, click Column.
6. Click OK.
7. In the Insertable Objects pane, on the Source tab , expand Sales and Marketing (query) and
Sales (query).
8. Expand Sales fact and drag Quantity to the Measure (y-axis) drop zone.
9. Expand Order method and drag Order method to the Series drop zone.
10. Expand Product and drag Product Line to the Categories (x-axis) drop zone.
Professional Authoring User Guide 131
Chapter 6: Charts
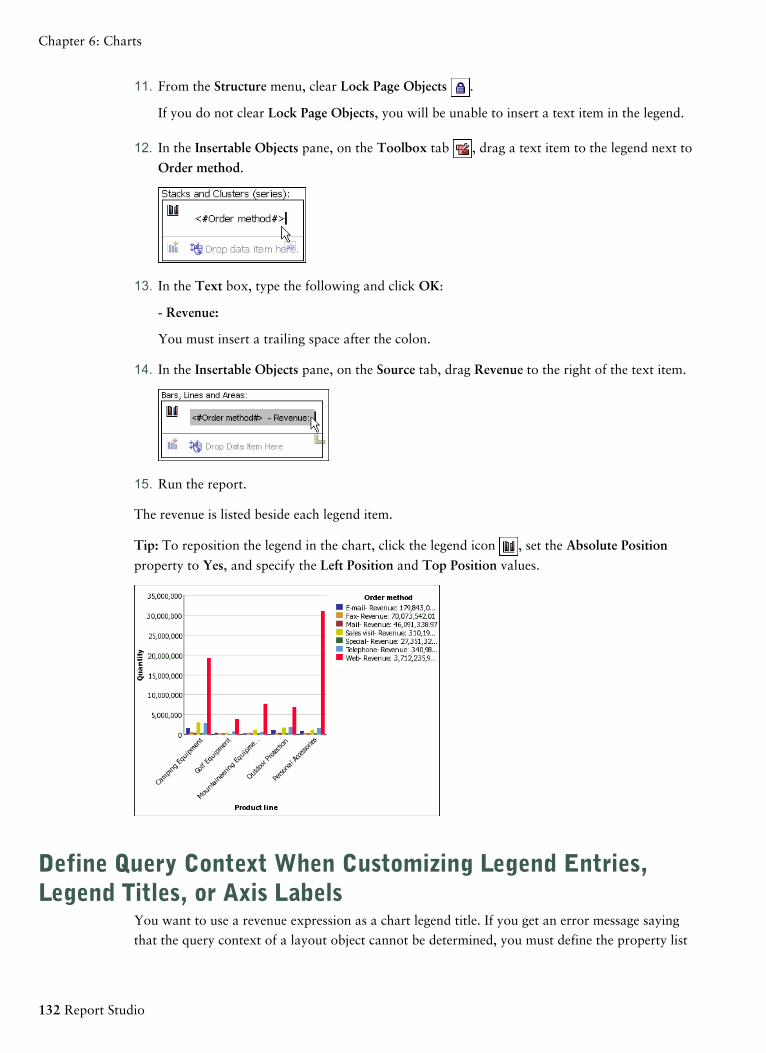
11. From the Structure menu, clear Lock Page Objects .
If you do not clear Lock Page Objects, you will be unable to insert a text item in the legend.
12. In the Insertable Objects pane, on the Toolbox tab , drag a text item to the legend next to
Order method.
13. In the Text box, type the following and click OK:
- Revenue:
You must insert a trailing space after the colon.
14. In the Insertable Objects pane, on the Source tab, drag Revenue to the right of the text item.
15. Run the report.
The revenue is listed beside each legend item.
Tip: To reposition the legend in the chart, click the legend icon , set the Absolute Position
property to Yes, and specify the Left Position and Top Position values.
Define Query Context When Customizing Legend Entries,Legend Titles, or Axis Labels
You want to use a revenue expression as a chart legend title. If you get an error message saying
that the query context of a layout object cannot be determined, you must define the property list
132 Report Studio
Chapter 6: Charts
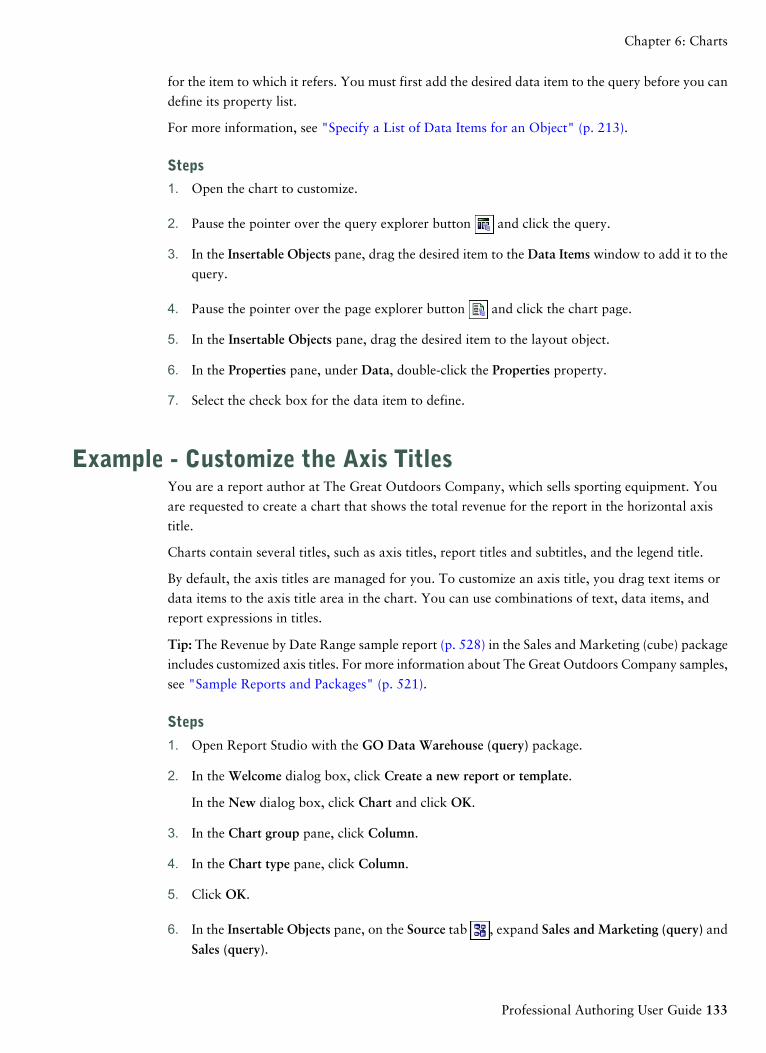
for the item to which it refers. You must first add the desired data item to the query before you can
define its property list.
For more information, see "Specify a List of Data Items for an Object" (p. 213).
Steps
1. Open the chart to customize.
2. Pause the pointer over the query explorer button and click the query.
3. In the Insertable Objects pane, drag the desired item to the Data Items window to add it to the
query.
4. Pause the pointer over the page explorer button and click the chart page.
5. In the Insertable Objects pane, drag the desired item to the layout object.
6. In the Properties pane, under Data, double-click the Properties property.
7. Select the check box for the data item to define.
Example - Customize the Axis TitlesYou are a report author at The Great Outdoors Company, which sells sporting equipment. You
are requested to create a chart that shows the total revenue for the report in the horizontal axis
title.
Charts contain several titles, such as axis titles, report titles and subtitles, and the legend title.
By default, the axis titles are managed for you. To customize an axis title, you drag text items or
data items to the axis title area in the chart. You can use combinations of text, data items, and
report expressions in titles.
Tip: The Revenue by Date Range sample report (p. 528) in the Sales and Marketing (cube) package
includes customized axis titles. For more information about The Great Outdoors Company samples,
see "Sample Reports and Packages" (p. 521).
Steps
1. Open Report Studio with the GO Data Warehouse (query) package.
2. In the Welcome dialog box, click Create a new report or template.
In the New dialog box, click Chart and click OK.
3. In the Chart group pane, click Column.
4. In the Chart type pane, click Column.
5. Click OK.
6. In the Insertable Objects pane, on the Source tab , expand Sales and Marketing (query) and
Sales (query).
Professional Authoring User Guide 133
Chapter 6: Charts
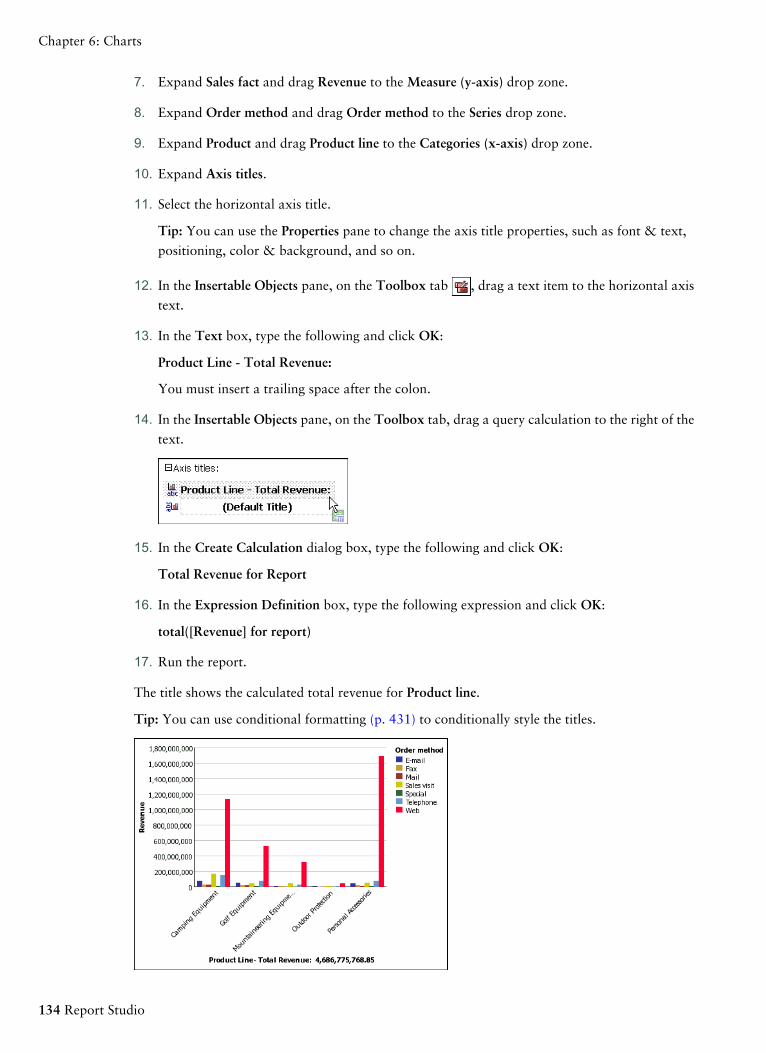
7. Expand Sales fact and drag Revenue to the Measure (y-axis) drop zone.
8. Expand Order method and drag Order method to the Series drop zone.
9. Expand Product and drag Product line to the Categories (x-axis) drop zone.
10. Expand Axis titles.
11. Select the horizontal axis title.
Tip: You can use the Properties pane to change the axis title properties, such as font & text,
positioning, color & background, and so on.
12. In the Insertable Objects pane, on the Toolbox tab , drag a text item to the horizontal axis
text.
13. In the Text box, type the following and click OK:
Product Line - Total Revenue:
You must insert a trailing space after the colon.
14. In the Insertable Objects pane, on the Toolbox tab, drag a query calculation to the right of the
text.
15. In the Create Calculation dialog box, type the following and click OK:
Total Revenue for Report
16. In the Expression Definition box, type the following expression and click OK:
total([Revenue] for report)
17. Run the report.
The title shows the calculated total revenue for Product line.
Tip: You can use conditional formatting (p. 431) to conditionally style the titles.
134 Report Studio
Chapter 6: Charts
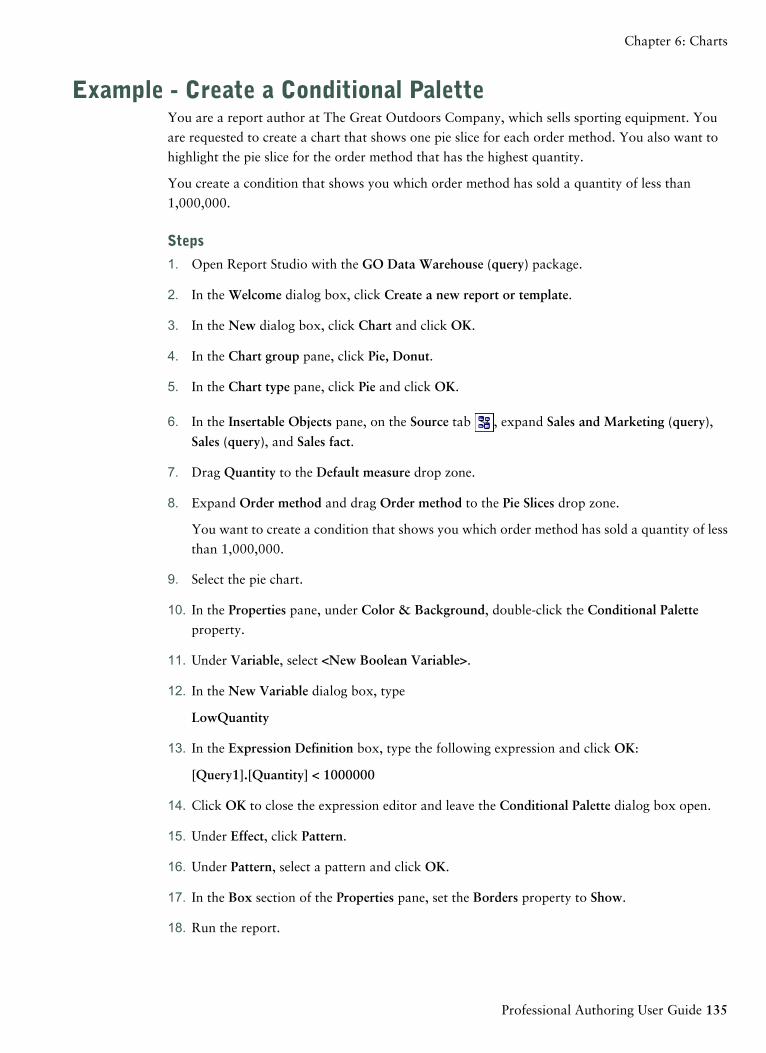
Example - Create a Conditional PaletteYou are a report author at The Great Outdoors Company, which sells sporting equipment. You
are requested to create a chart that shows one pie slice for each order method. You also want to
highlight the pie slice for the order method that has the highest quantity.
You create a condition that shows you which order method has sold a quantity of less than
1,000,000.
Steps
1. Open Report Studio with the GO Data Warehouse (query) package.
2. In the Welcome dialog box, click Create a new report or template.
3. In the New dialog box, click Chart and click OK.
4. In the Chart group pane, click Pie, Donut.
5. In the Chart type pane, click Pie and click OK.
6. In the Insertable Objects pane, on the Source tab , expand Sales and Marketing (query),
Sales (query), and Sales fact.
7. Drag Quantity to the Default measure drop zone.
8. Expand Order method and drag Order method to the Pie Slices drop zone.
You want to create a condition that shows you which order method has sold a quantity of less
than 1,000,000.
9. Select the pie chart.
10. In the Properties pane, under Color & Background, double-click the Conditional Paletteproperty.
11. Under Variable, select <New Boolean Variable>.
12. In the New Variable dialog box, type
LowQuantity
13. In the Expression Definition box, type the following expression and click OK:
[Query1].[Quantity] < 1000000
14. Click OK to close the expression editor and leave the Conditional Palette dialog box open.
15. Under Effect, click Pattern.
16. Under Pattern, select a pattern and click OK.
17. In the Box section of the Properties pane, set the Borders property to Show.
18. Run the report.
Professional Authoring User Guide 135
Chapter 6: Charts
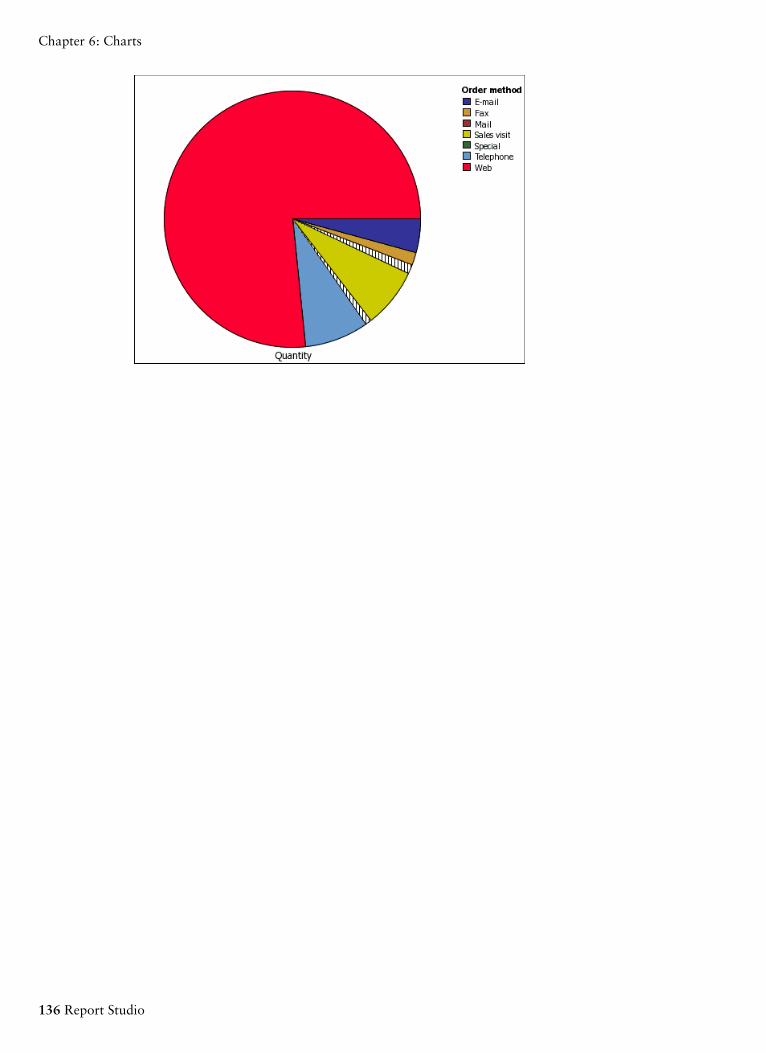
136 Report Studio
Chapter 6: Charts
Chapter 7: Maps
Report Studio provides a set of maps that you can use to represent tabular data in a spatial context.
For example, on a map of the world, countries can be colored to represent the level of revenue.
Using maps includes
● understanding the map object
● setting map properties
● matching data values to names in the map file
● defining data values for the point layer
● adding colors to the region or point layer
● adding legend titles
● adding notes
● drilling through to another report from a map
● editing maps with Map Manager
● accessing additional maps
● understanding location intelligence
The Report Studio Map ObjectMaps are most often used to show geographical areas, but they can be used to show other spatial
information, such as a floor plan in a building, seats in an airplane, or parts of the human body.
Maps are similar to crosstabs in the way their data is organized. The display is different, but maps
show the intersection of data the same ways as crosstabs; for example, you can see the revenue for
golf equipment in Canada.
A map in IBM Cognos 8 consists of a collection of layers. Each layer contains different information
and acts like a transparency that is placed on top of the map. Each layer adds more information to
the map. For example a map of the world may contain information related to countries on one
layer and information related to cities on another level.
Professional Authoring User Guide 137
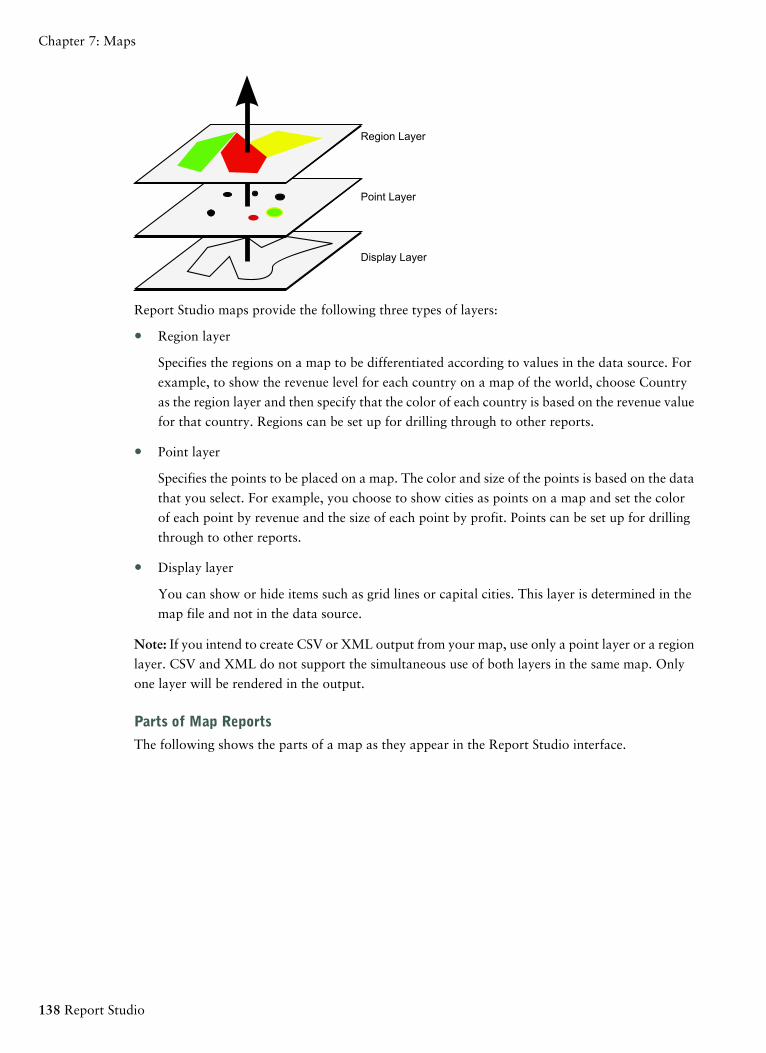
Region Layer
Point Layer
Display Layer
Report Studio maps provide the following three types of layers:
● Region layer
Specifies the regions on a map to be differentiated according to values in the data source. For
example, to show the revenue level for each country on a map of the world, choose Country
as the region layer and then specify that the color of each country is based on the revenue value
for that country. Regions can be set up for drilling through to other reports.
● Point layer
Specifies the points to be placed on a map. The color and size of the points is based on the data
that you select. For example, you choose to show cities as points on a map and set the color
of each point by revenue and the size of each point by profit. Points can be set up for drilling
through to other reports.
● Display layer
You can show or hide items such as grid lines or capital cities. This layer is determined in the
map file and not in the data source.
Note: If you intend to create CSV or XML output from your map, use only a point layer or a region
layer. CSV and XML do not support the simultaneous use of both layers in the same map. Only
one layer will be rendered in the output.
Parts of Map Reports
The following shows the parts of a map as they appear in the Report Studio interface.
138 Report Studio
Chapter 7: Maps
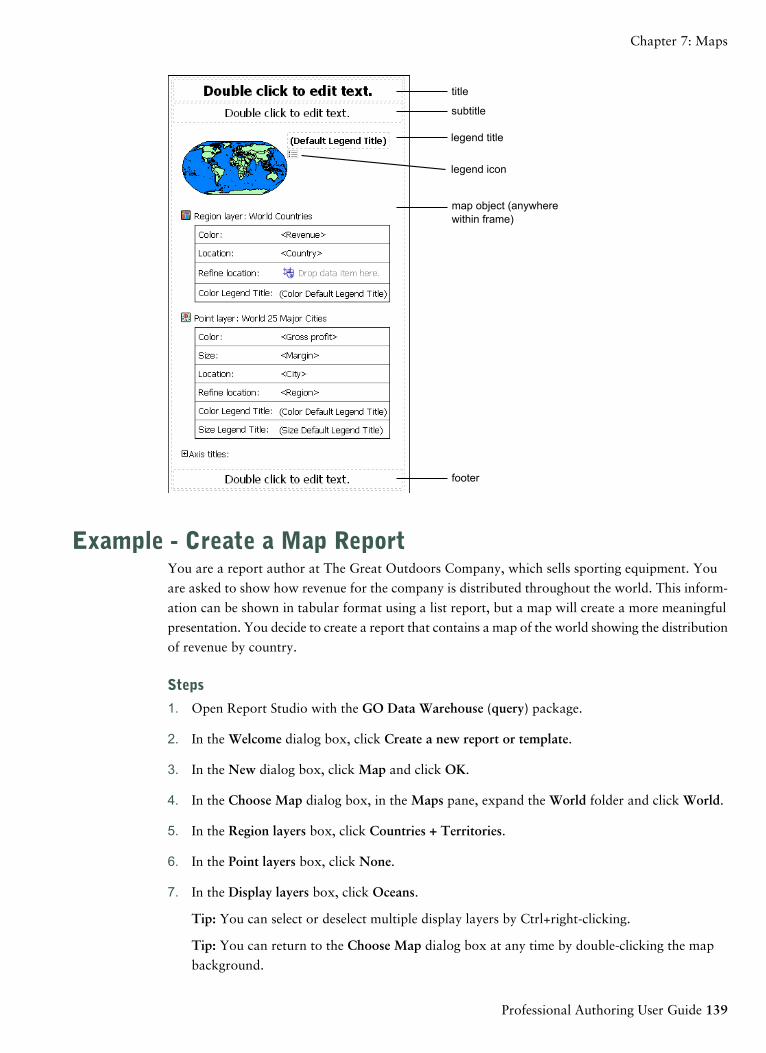
title
subtitle
legend title
legend icon
map object (anywherewithin frame)
footer
Example - Create a Map ReportYou are a report author at The Great Outdoors Company, which sells sporting equipment. You
are asked to show how revenue for the company is distributed throughout the world. This inform-
ation can be shown in tabular format using a list report, but a map will create a more meaningful
presentation. You decide to create a report that contains a map of the world showing the distribution
of revenue by country.
Steps
1. Open Report Studio with the GO Data Warehouse (query) package.
2. In the Welcome dialog box, click Create a new report or template.
3. In the New dialog box, click Map and click OK.
4. In the Choose Map dialog box, in the Maps pane, expand the World folder and click World.
5. In the Region layers box, click Countries + Territories.
6. In the Point layers box, click None.
7. In the Display layers box, click Oceans.
Tip: You can select or deselect multiple display layers by Ctrl+right-clicking.
Tip: You can return to the Choose Map dialog box at any time by double-clicking the map
background.
Professional Authoring User Guide 139
Chapter 7: Maps
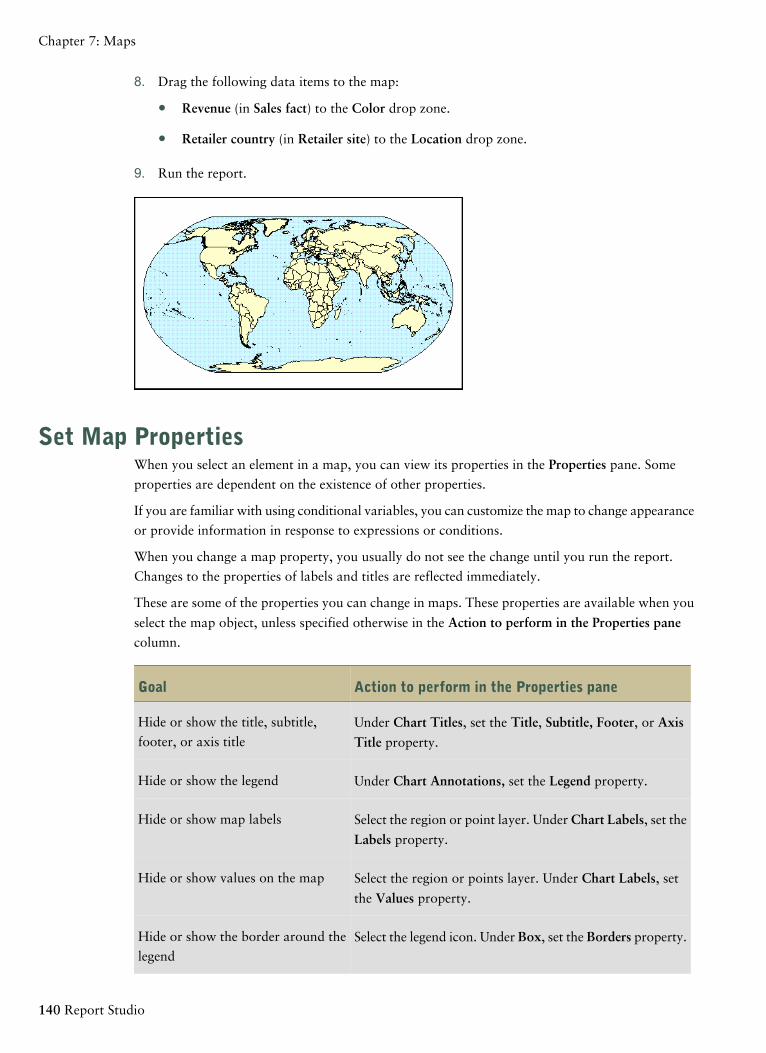
8. Drag the following data items to the map:
● Revenue (in Sales fact) to the Color drop zone.
● Retailer country (in Retailer site) to the Location drop zone.
9. Run the report.
Set Map PropertiesWhen you select an element in a map, you can view its properties in the Properties pane. Some
properties are dependent on the existence of other properties.
If you are familiar with using conditional variables, you can customize the map to change appearance
or provide information in response to expressions or conditions.
When you change a map property, you usually do not see the change until you run the report.
Changes to the properties of labels and titles are reflected immediately.
These are some of the properties you can change in maps. These properties are available when you
select the map object, unless specified otherwise in the Action to perform in the Properties panecolumn.
Action to perform in the Properties paneGoal
Under Chart Titles, set the Title, Subtitle, Footer, or Axis
Title property.
Hide or show the title, subtitle,
footer, or axis title
Under Chart Annotations, set the Legend property.Hide or show the legend
Select the region or point layer. Under Chart Labels, set the
Labels property.
Hide or show map labels
Select the region or points layer. Under Chart Labels, set
the Values property.
Hide or show values on the map
Select the legend icon. Under Box, set the Borders property.Hide or show the border around the
legend
140 Report Studio
Chapter 7: Maps
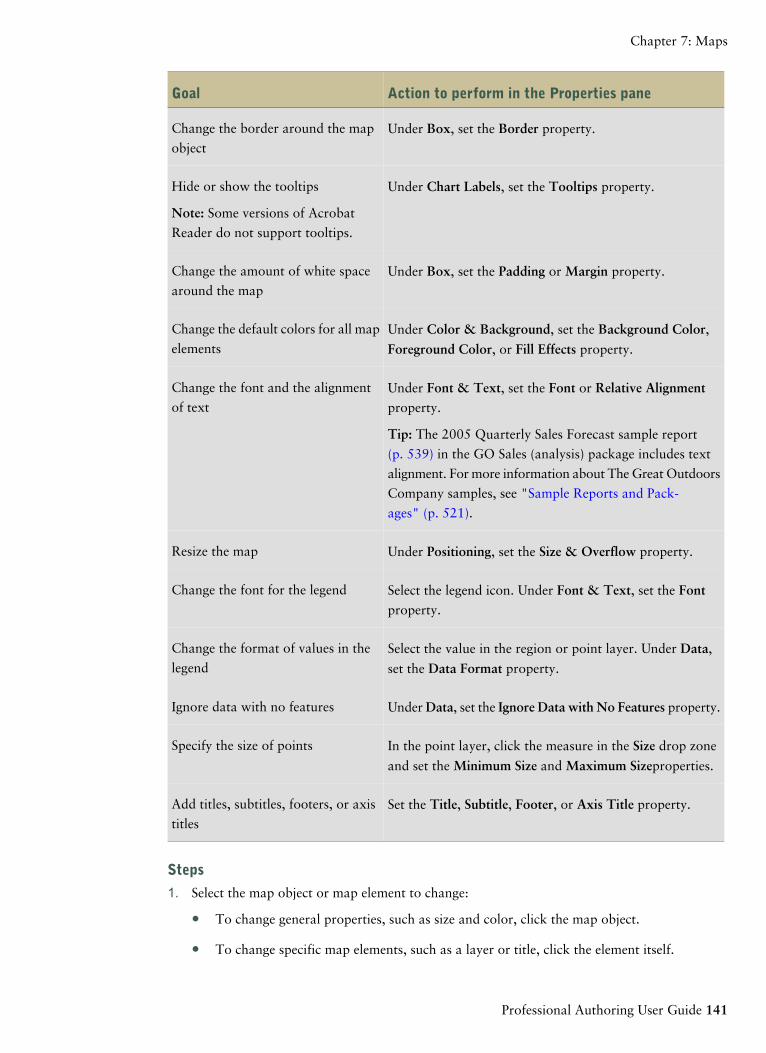
Action to perform in the Properties paneGoal
Under Box, set the Border property.Change the border around the map
object
Under Chart Labels, set the Tooltips property.Hide or show the tooltips
Note: Some versions of Acrobat
Reader do not support tooltips.
Under Box, set the Padding or Margin property.Change the amount of white space
around the map
Under Color & Background, set the Background Color,
Foreground Color, or Fill Effects property.
Change the default colors for all map
elements
Under Font & Text, set the Font or Relative Alignmentproperty.
Change the font and the alignment
of text
Tip: The 2005 Quarterly Sales Forecast sample report
(p. 539) in the GO Sales (analysis) package includes text
alignment. For more information about The Great Outdoors
Company samples, see "Sample Reports and Pack-
ages" (p. 521).
Under Positioning, set the Size & Overflow property.Resize the map
Select the legend icon. Under Font & Text, set the Fontproperty.
Change the font for the legend
Select the value in the region or point layer. Under Data,
set the Data Format property.
Change the format of values in the
legend
Under Data, set the Ignore Data with No Features property.Ignore data with no features
In the point layer, click the measure in the Size drop zone
and set the Minimum Size and Maximum Sizeproperties.
Specify the size of points
Set the Title, Subtitle, Footer, or Axis Title property.Add titles, subtitles, footers, or axis
titles
Steps
1. Select the map object or map element to change:
● To change general properties, such as size and color, click the map object.
● To change specific map elements, such as a layer or title, click the element itself.
Professional Authoring User Guide 141
Chapter 7: Maps
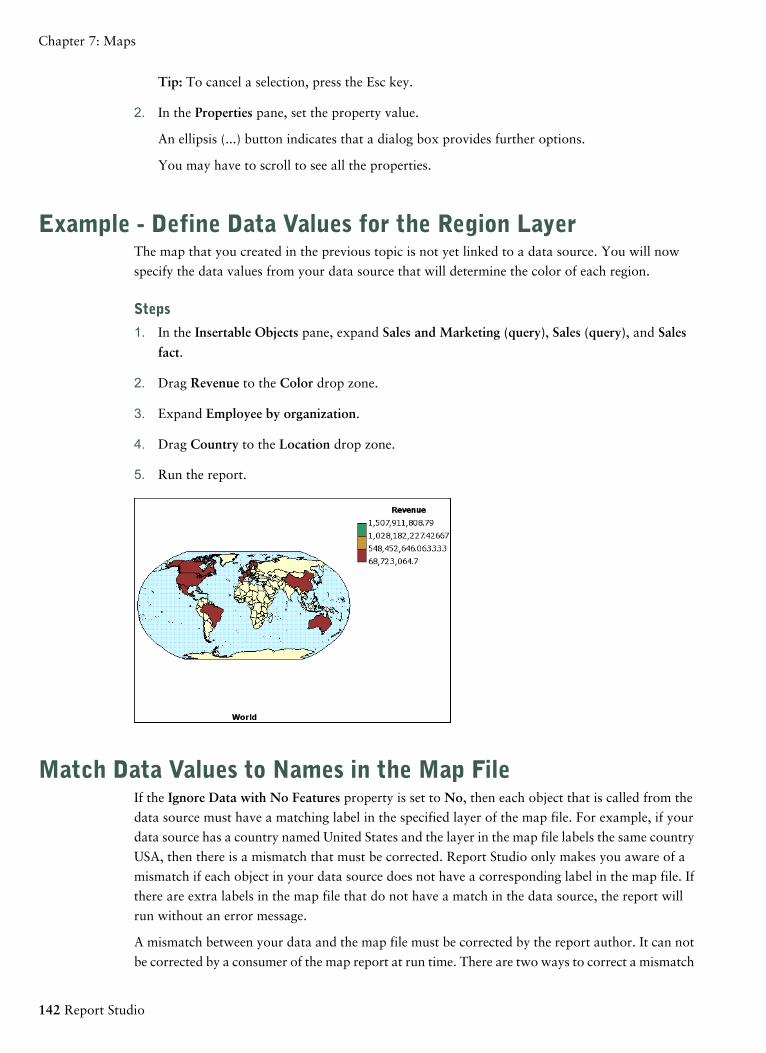
Tip: To cancel a selection, press the Esc key.
2. In the Properties pane, set the property value.
An ellipsis (...) button indicates that a dialog box provides further options.
You may have to scroll to see all the properties.
Example - Define Data Values for the Region LayerThe map that you created in the previous topic is not yet linked to a data source. You will now
specify the data values from your data source that will determine the color of each region.
Steps
1. In the Insertable Objects pane, expand Sales and Marketing (query), Sales (query), and Sales
fact.
2. Drag Revenue to the Color drop zone.
3. Expand Employee by organization.
4. Drag Country to the Location drop zone.
5. Run the report.
Match Data Values to Names in the Map FileIf the Ignore Data with No Features property is set to No, then each object that is called from the
data source must have a matching label in the specified layer of the map file. For example, if your
data source has a country named United States and the layer in the map file labels the same country
USA, then there is a mismatch that must be corrected. Report Studio only makes you aware of a
mismatch if each object in your data source does not have a corresponding label in the map file. If
there are extra labels in the map file that do not have a match in the data source, the report will
run without an error message.
A mismatch between your data and the map file must be corrected by the report author. It can not
be corrected by a consumer of the map report at run time. There are two ways to correct a mismatch
142 Report Studio
Chapter 7: Maps
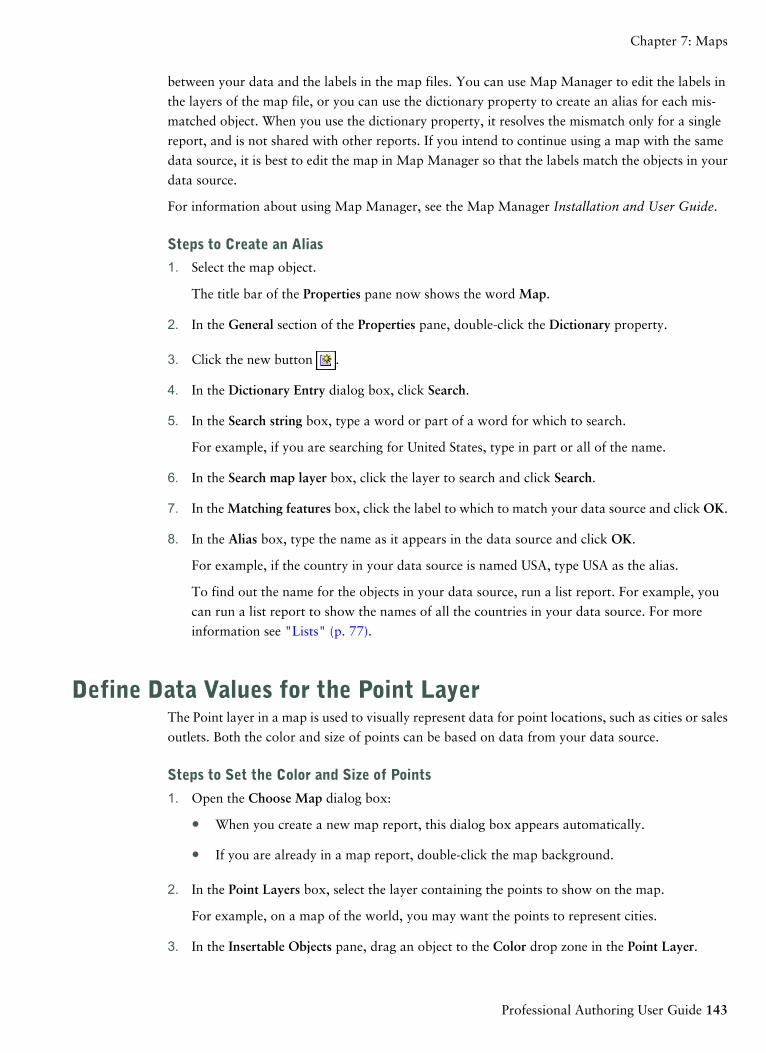
between your data and the labels in the map files. You can use Map Manager to edit the labels in
the layers of the map file, or you can use the dictionary property to create an alias for each mis-
matched object. When you use the dictionary property, it resolves the mismatch only for a single
report, and is not shared with other reports. If you intend to continue using a map with the same
data source, it is best to edit the map in Map Manager so that the labels match the objects in your
data source.
For information about using Map Manager, see the Map Manager Installation and User Guide.
Steps to Create an Alias
1. Select the map object.
The title bar of the Properties pane now shows the word Map.
2. In the General section of the Properties pane, double-click the Dictionary property.
3. Click the new button .
4. In the Dictionary Entry dialog box, click Search.
5. In the Search string box, type a word or part of a word for which to search.
For example, if you are searching for United States, type in part or all of the name.
6. In the Search map layer box, click the layer to search and click Search.
7. In the Matching features box, click the label to which to match your data source and click OK.
8. In the Alias box, type the name as it appears in the data source and click OK.
For example, if the country in your data source is named USA, type USA as the alias.
To find out the name for the objects in your data source, run a list report. For example, you
can run a list report to show the names of all the countries in your data source. For more
information see "Lists" (p. 77).
Define Data Values for the Point LayerThe Point layer in a map is used to visually represent data for point locations, such as cities or sales
outlets. Both the color and size of points can be based on data from your data source.
Steps to Set the Color and Size of Points
1. Open the Choose Map dialog box:
● When you create a new map report, this dialog box appears automatically.
● If you are already in a map report, double-click the map background.
2. In the Point Layers box, select the layer containing the points to show on the map.
For example, on a map of the world, you may want the points to represent cities.
3. In the Insertable Objects pane, drag an object to the Color drop zone in the Point Layer.
Professional Authoring User Guide 143
Chapter 7: Maps
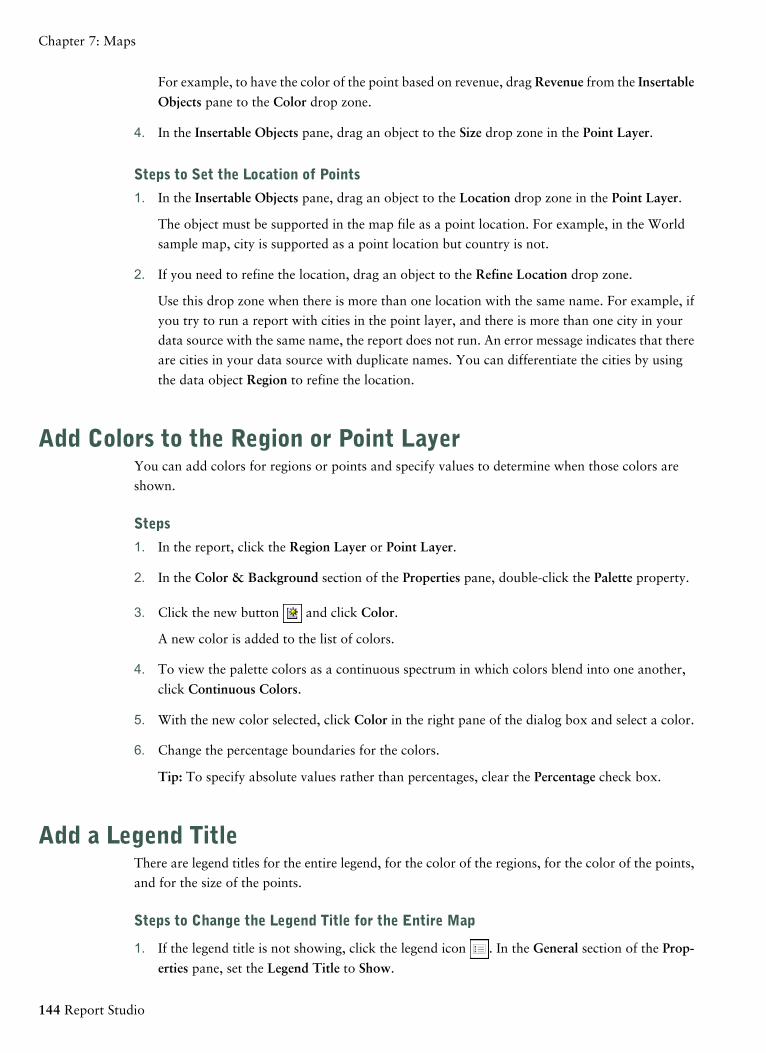
For example, to have the color of the point based on revenue, drag Revenue from the Insertable
Objects pane to the Color drop zone.
4. In the Insertable Objects pane, drag an object to the Size drop zone in the Point Layer.
Steps to Set the Location of Points
1. In the Insertable Objects pane, drag an object to the Location drop zone in the Point Layer.
The object must be supported in the map file as a point location. For example, in the World
sample map, city is supported as a point location but country is not.
2. If you need to refine the location, drag an object to the Refine Location drop zone.
Use this drop zone when there is more than one location with the same name. For example, if
you try to run a report with cities in the point layer, and there is more than one city in your
data source with the same name, the report does not run. An error message indicates that there
are cities in your data source with duplicate names. You can differentiate the cities by using
the data object Region to refine the location.
Add Colors to the Region or Point LayerYou can add colors for regions or points and specify values to determine when those colors are
shown.
Steps
1. In the report, click the Region Layer or Point Layer.
2. In the Color & Background section of the Properties pane, double-click the Palette property.
3. Click the new button and click Color.
A new color is added to the list of colors.
4. To view the palette colors as a continuous spectrum in which colors blend into one another,
click Continuous Colors.
5. With the new color selected, click Color in the right pane of the dialog box and select a color.
6. Change the percentage boundaries for the colors.
Tip: To specify absolute values rather than percentages, clear the Percentage check box.
Add a Legend TitleThere are legend titles for the entire legend, for the color of the regions, for the color of the points,
and for the size of the points.
Steps to Change the Legend Title for the Entire Map
1. If the legend title is not showing, click the legend icon . In the General section of the Prop-
erties pane, set the Legend Title to Show.
144 Report Studio
Chapter 7: Maps
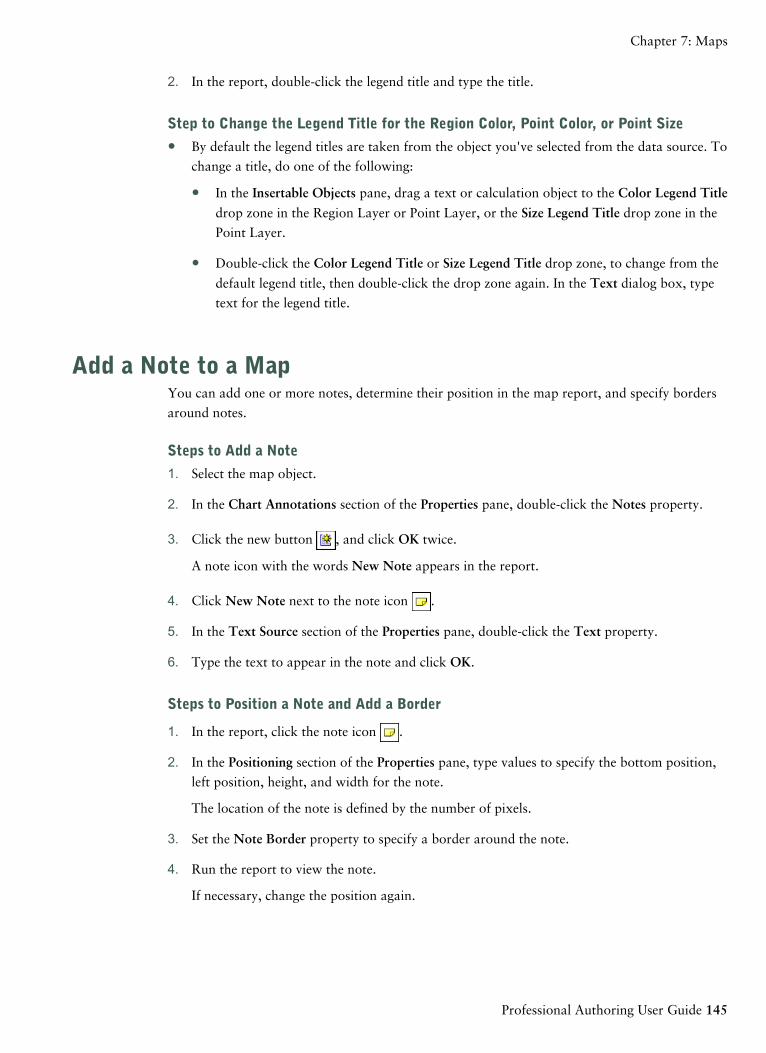
2. In the report, double-click the legend title and type the title.
Step to Change the Legend Title for the Region Color, Point Color, or Point Size
● By default the legend titles are taken from the object you've selected from the data source. To
change a title, do one of the following:
● In the Insertable Objects pane, drag a text or calculation object to the Color Legend Title
drop zone in the Region Layer or Point Layer, or the Size Legend Title drop zone in the
Point Layer.
● Double-click the Color Legend Title or Size Legend Title drop zone, to change from the
default legend title, then double-click the drop zone again. In the Text dialog box, type
text for the legend title.
Add a Note to a MapYou can add one or more notes, determine their position in the map report, and specify borders
around notes.
Steps to Add a Note
1. Select the map object.
2. In the Chart Annotations section of the Properties pane, double-click the Notes property.
3. Click the new button , and click OK twice.
A note icon with the words New Note appears in the report.
4. Click New Note next to the note icon .
5. In the Text Source section of the Properties pane, double-click the Text property.
6. Type the text to appear in the note and click OK.
Steps to Position a Note and Add a Border
1. In the report, click the note icon .
2. In the Positioning section of the Properties pane, type values to specify the bottom position,
left position, height, and width for the note.
The location of the note is defined by the number of pixels.
3. Set the Note Border property to specify a border around the note.
4. Run the report to view the note.
If necessary, change the position again.
Professional Authoring User Guide 145
Chapter 7: Maps
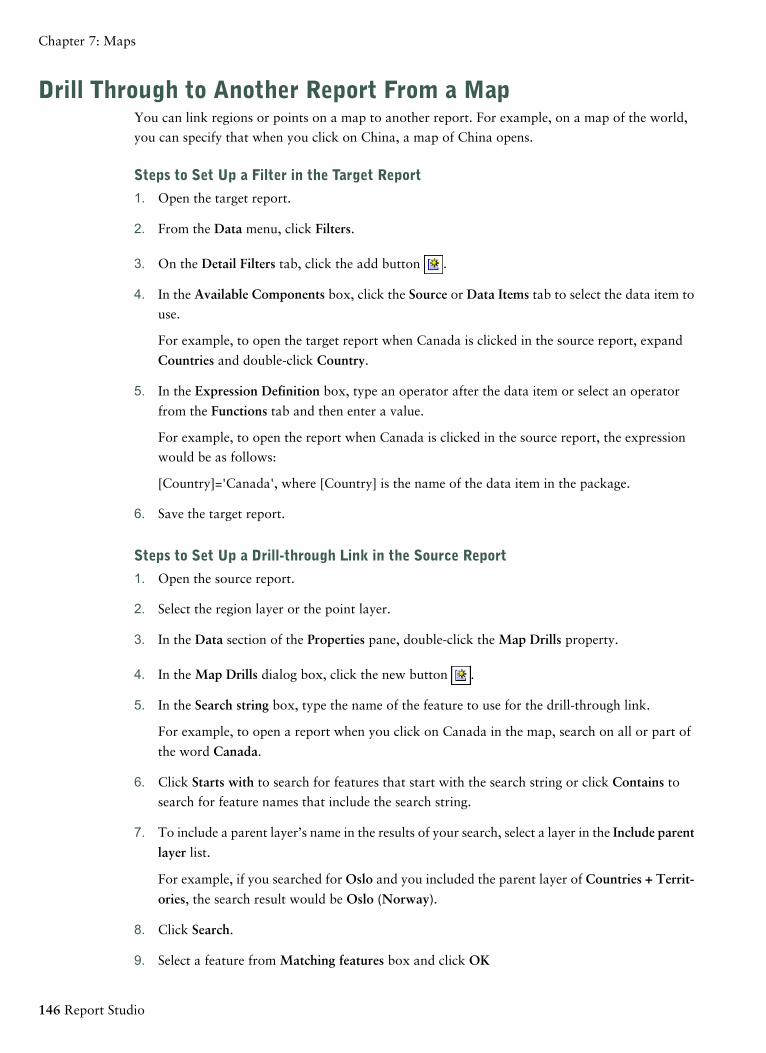
Drill Through to Another Report From a MapYou can link regions or points on a map to another report. For example, on a map of the world,
you can specify that when you click on China, a map of China opens.
Steps to Set Up a Filter in the Target Report
1. Open the target report.
2. From the Data menu, click Filters.
3. On the Detail Filters tab, click the add button .
4. In the Available Components box, click the Source or Data Items tab to select the data item to
use.
For example, to open the target report when Canada is clicked in the source report, expand
Countries and double-click Country.
5. In the Expression Definition box, type an operator after the data item or select an operator
from the Functions tab and then enter a value.
For example, to open the report when Canada is clicked in the source report, the expression
would be as follows:
[Country]='Canada', where [Country] is the name of the data item in the package.
6. Save the target report.
Steps to Set Up a Drill-through Link in the Source Report
1. Open the source report.
2. Select the region layer or the point layer.
3. In the Data section of the Properties pane, double-click the Map Drills property.
4. In the Map Drills dialog box, click the new button .
5. In the Search string box, type the name of the feature to use for the drill-through link.
For example, to open a report when you click on Canada in the map, search on all or part of
the word Canada.
6. Click Starts with to search for features that start with the search string or click Contains to
search for feature names that include the search string.
7. To include a parent layer’s name in the results of your search, select a layer in the Include parent
layer list.
For example, if you searched for Oslo and you included the parent layer of Countries + Territ-
ories, the search result would be Oslo (Norway).
8. Click Search.
9. Select a feature from Matching features box and click OK
146 Report Studio
Chapter 7: Maps
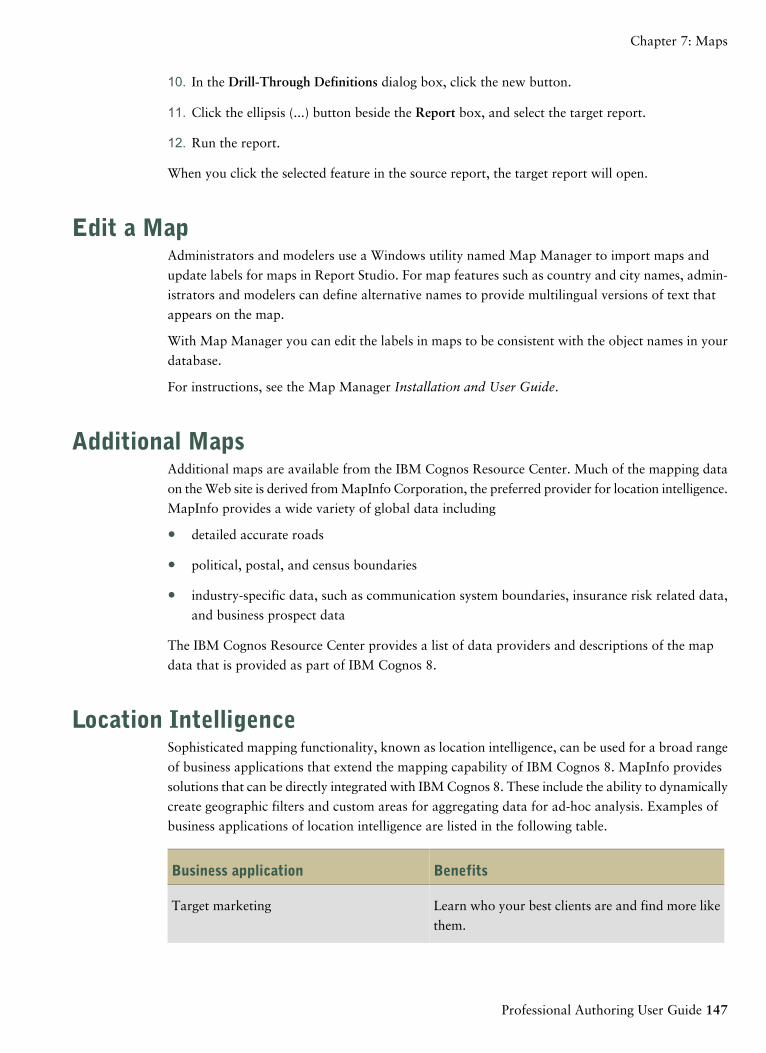
10. In the Drill-Through Definitions dialog box, click the new button.
11. Click the ellipsis (...) button beside the Report box, and select the target report.
12. Run the report.
When you click the selected feature in the source report, the target report will open.
Edit a MapAdministrators and modelers use a Windows utility named Map Manager to import maps and
update labels for maps in Report Studio. For map features such as country and city names, admin-
istrators and modelers can define alternative names to provide multilingual versions of text that
appears on the map.
With Map Manager you can edit the labels in maps to be consistent with the object names in your
database.
For instructions, see the Map Manager Installation and User Guide.
Additional MapsAdditional maps are available from the IBM Cognos Resource Center. Much of the mapping data
on the Web site is derived from MapInfo Corporation, the preferred provider for location intelligence.
MapInfo provides a wide variety of global data including
● detailed accurate roads
● political, postal, and census boundaries
● industry-specific data, such as communication system boundaries, insurance risk related data,
and business prospect data
The IBM Cognos Resource Center provides a list of data providers and descriptions of the map
data that is provided as part of IBM Cognos 8.
Location IntelligenceSophisticated mapping functionality, known as location intelligence, can be used for a broad range
of business applications that extend the mapping capability of IBM Cognos 8. MapInfo provides
solutions that can be directly integrated with IBM Cognos 8. These include the ability to dynamically
create geographic filters and custom areas for aggregating data for ad-hoc analysis. Examples of
business applications of location intelligence are listed in the following table.
BenefitsBusiness application
Learn who your best clients are and find more like
them.
Target marketing
Professional Authoring User Guide 147
Chapter 7: Maps
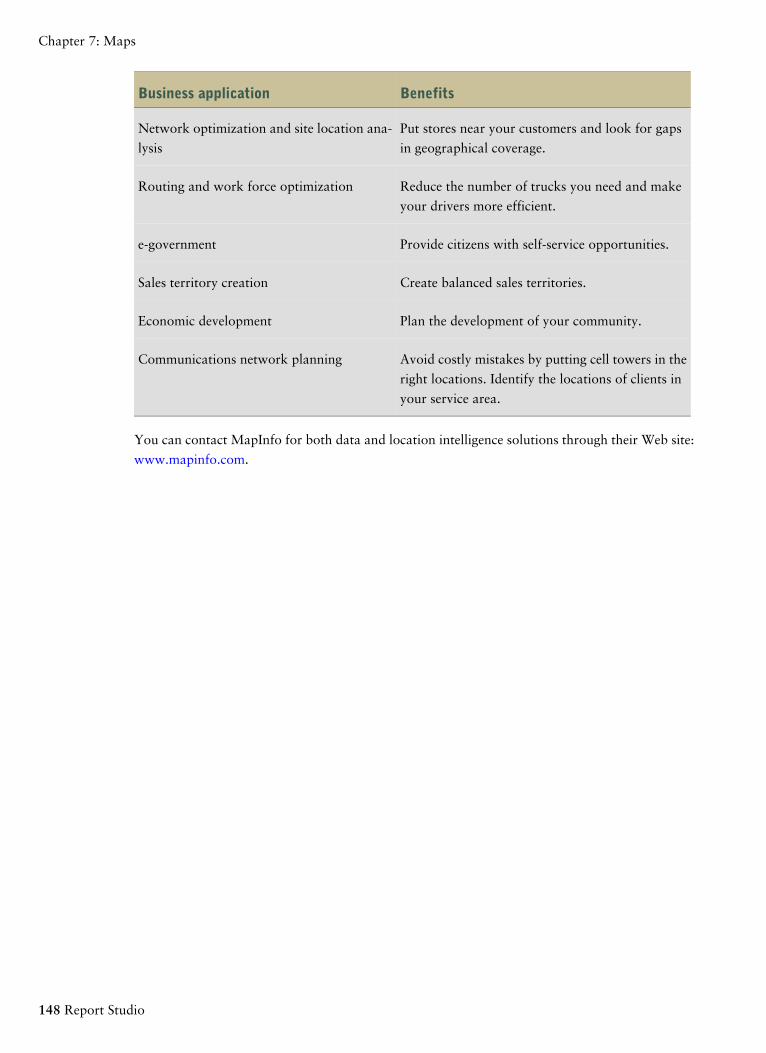
BenefitsBusiness application
Put stores near your customers and look for gaps
in geographical coverage.
Network optimization and site location ana-
lysis
Reduce the number of trucks you need and make
your drivers more efficient.
Routing and work force optimization
Provide citizens with self-service opportunities.e-government
Create balanced sales territories.Sales territory creation
Plan the development of your community.Economic development
Avoid costly mistakes by putting cell towers in the
right locations. Identify the locations of clients in
your service area.
Communications network planning
You can contact MapInfo for both data and location intelligence solutions through their Web site:
www.mapinfo.com.
148 Report Studio
Chapter 7: Maps
Chapter 8: Relational Reporting Style
The relational reporting style is recommended for relational data sources. Relational data is best
represented by lists. This data is organized in Report Studio by query items.
In relational reporting, you summarize data by using headers and footers in lists, summary functions,
member summaries, and within detail aggregation. You focus data in relational reporting with
summary or detail filters.
Query Studio is also available to work with relational data.
You can perform the following tasks in relational reporting:
● add data
● group data
● summarize data
● focus data with filters
● sort data
● add queries
● use calculations
Add Relational Data to a ReportSelect the data items to appear in the report.
We recommend using relational data in the relational reporting style. However, if you are using
dimensional data, see "Add Dimensional Data to a Report" (p. 189).
If you frequently use items from different query subjects or dimensions in the same reports, ask
your modeler to organize these items into a folder or model query subject and then to republish the
relevant package. For example, if you use the product code item in sales reports, the modeler can
create a folder that contains the product code item and the sales items you need.
Step
● In the Insertable Objects pane, on the Source tab , drag each query item to the report.
A flashing black bar indicates where you can drop an item. Items inserted in the report appear
on the Data Items tab .
Tips
● For more information about a query item, right-click the item in the Source tab and click
Properties. For example, when working with relational data sources, the Usage property iden-
Professional Authoring User Guide 149
tifies the intended use for the data represented by the data item. You can also obtain more
information by clicking Lineage (p. 71).
● Other ways to select data items are to double-click each item or to right-click each item and
click Insert.
● If you want to remove a data item from the report, select it and click the delete button . To
remove the data item from the report but keep it on the Data Items tab, click the cut button
instead.
Grouping Relational DataGroup data items in a list report to remove duplicate values. For example, you have a report that
shows products purchased. For each product, the product type is also shown. You group the Product
type column to show only one instance of each product type in the list.
Tip: The Succession Report sample report (p. 537) in the GO Data Warehouse (analysis) package
includes grouping. For more information about The Great Outdoors Company samples, see "Sample
Reports and Packages" (p. 521).
You can also group data items in repeaters (p. 79) and in page sets (p. 494).
In addition to grouping, you can specify the sort order of data items. In lists, you can sort data
items within groups as well as ungrouped items. In crosstabs, you can sort row and column items.
For more information, see "Perform Advanced Layout Sorting" (p. 171).
Limitations When Grouping Data
When working with dimensional data sources, you cannot group two levels or hierarchies from
different dimensions in the same list.
For example, a list contains the following levels:
● Product Line
● Region
● Product Type
● Country
● Revenue
Product Line and Product Type are from one dimension and Region and Country are from another
dimension. You group by the first three columns. You may encounter the following errors.
OP-ERR-0199: The query is not supported. The dimensions on the edge are inconsistent.
OP-ERR-0049. Unable to support a grouping that breaks the hierarchical order of the query items
within it.
When working with dimensional data sources, you can group or sort only in the order of the
existing hierarchy. If you change the order, the above error also occurs.
150 Report Studio
Chapter 8: Relational Reporting Style
You can omit columns from the grouping. For example, if a level hierarchy contains the levels
Country, State, and City, and another level hierarchy contains the level Product:
● Country, State, City is valid.
● Country, Product, and State is not valid because a level from another level hierarchy was
inserted between two levels from another level hierarchy.
● Country, City, and Product is valid even though State is omitted.
● Country, Country code is valid where Country code is a member property of Country.
To override the hierarchical order that the data source specifies, you can override the dimension
information of the query. For more information, see "Add Dimension Information to a
Query" (p. 219).
We recommend that you do not use member properties of a dimension to group data. Grouping
by using member properties may give unexpected results, such as duplicates.
Steps
1. Click the column on which to group.
You can click either the column heading or one of the column cells.
Tip: To perform multiple groupings at once, use Ctrl+click or Shift+click.
2. From the Structure menu, click Group/Ungroup.
A symbol appears indicating that the column is grouped. You can control when its values appear
by setting the group span, and the column appears in the list of headers and footers that you can
add to the report (p. 407).
Note: Grouping all columns in a list is equivalent to creating a single-edge crosstab (p. 87).
Perform Advanced GroupingYou can perform more advanced groupings in a list to get the results you want. For example, you
can
● view the entire grouping structure and make changes to the grouping order
● group a data item that appears in a query but not in the layout
● specify a list of properties for a group (p. 213)
You can also perform advanced sorting (p. 171).
Steps
1. Click a column in the list.
2. Click the select ancestor button in the title bar of the Properties pane and click List.
3. In the Properties pane, double-click the Grouping & Sorting property.
Professional Authoring User Guide 151
Chapter 8: Relational Reporting Style
4. To change the grouping order, in the Groups pane, click the grouped item in the Groups folder
and drag it to the grouping hierarchy.
5. To create a new grouping, in the Data Items pane, click the data item and drag it to the Groups
folder in the Groups pane.
6. To specify a list of data items (p. 213) for a group, do the following:
● Click the group.
Tip: Click Overall to specify a list of data items for the overall group. The overall group
is the grouping of all data into one group. You can specify a list of data items for the
overall group to add overall totals to the list.
● Click the properties button .
● Select the appropriate check boxes.
Set the Group Span for a ColumnWhen columns are grouped, you can choose how often to show column names by changing the
group spanning. For example, when country and city are both grouped, you can choose to show
the country name each time
● the country changes, by spanning Country by Country
● the city changes, by spanning Country by City
● there is a new record, by specifying no spanning
Spanning one grouped column by another column is helpful if the second column contains many
items.
Steps
1. Click the column that will span the other column(s).
2. In the Properties pane, set the Group Span property to the column to span.
Example - Remove Identical Values in a List
You are a report author at The Great Outdoors Company, which sells sporting equipment. You
are requested to create a report that lists all product orders organized by order number. To make
the report easy to read, you group the Order number column so that only one instance of each
order number appears. However, because each order contains different products, the same order
date appears for each product. You decide to show the order date only when the order number
changes.
Steps
1. Open Report Studio with the GO Data Warehouse (query) package.
2. In the Welcome dialog box, click Create a new report or template.
3. In the New dialog box, click List and click OK.
152 Report Studio
Chapter 8: Relational Reporting Style
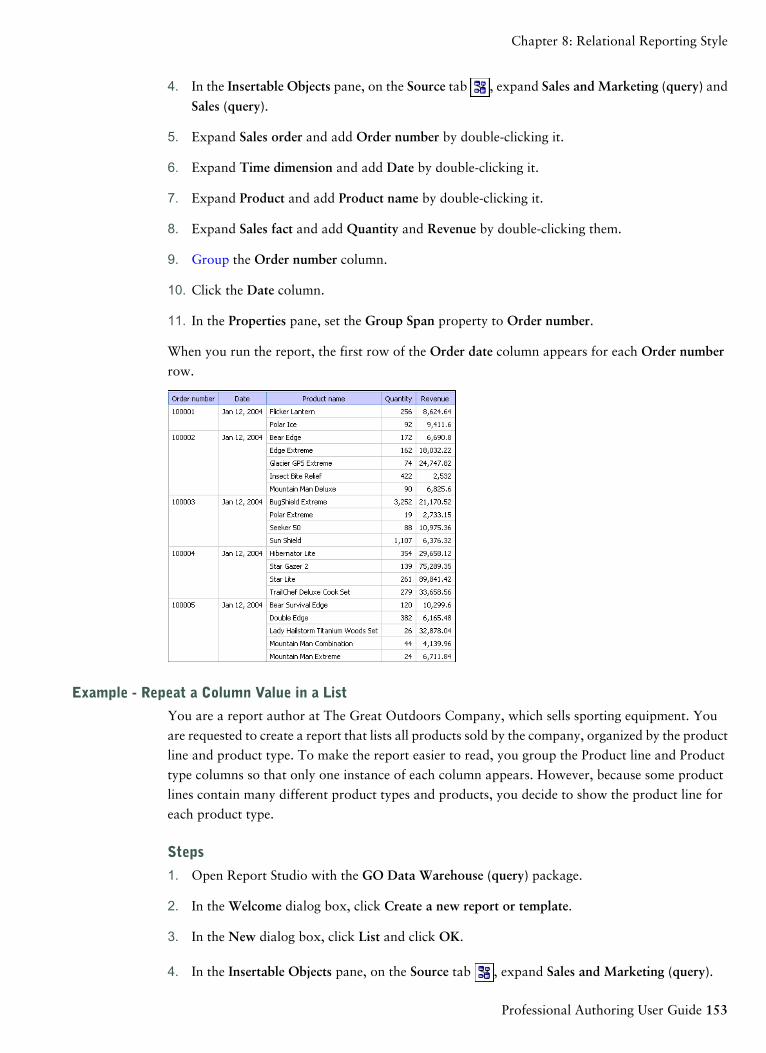
4. In the Insertable Objects pane, on the Source tab , expand Sales and Marketing (query) and
Sales (query).
5. Expand Sales order and add Order number by double-clicking it.
6. Expand Time dimension and add Date by double-clicking it.
7. Expand Product and add Product name by double-clicking it.
8. Expand Sales fact and add Quantity and Revenue by double-clicking them.
9. Group the Order number column.
10. Click the Date column.
11. In the Properties pane, set the Group Span property to Order number.
When you run the report, the first row of the Order date column appears for each Order numberrow.
Example - Repeat a Column Value in a List
You are a report author at The Great Outdoors Company, which sells sporting equipment. You
are requested to create a report that lists all products sold by the company, organized by the product
line and product type. To make the report easier to read, you group the Product line and Product
type columns so that only one instance of each column appears. However, because some product
lines contain many different product types and products, you decide to show the product line for
each product type.
Steps
1. Open Report Studio with the GO Data Warehouse (query) package.
2. In the Welcome dialog box, click Create a new report or template.
3. In the New dialog box, click List and click OK.
4. In the Insertable Objects pane, on the Source tab , expand Sales and Marketing (query).
Professional Authoring User Guide 153
Chapter 8: Relational Reporting Style
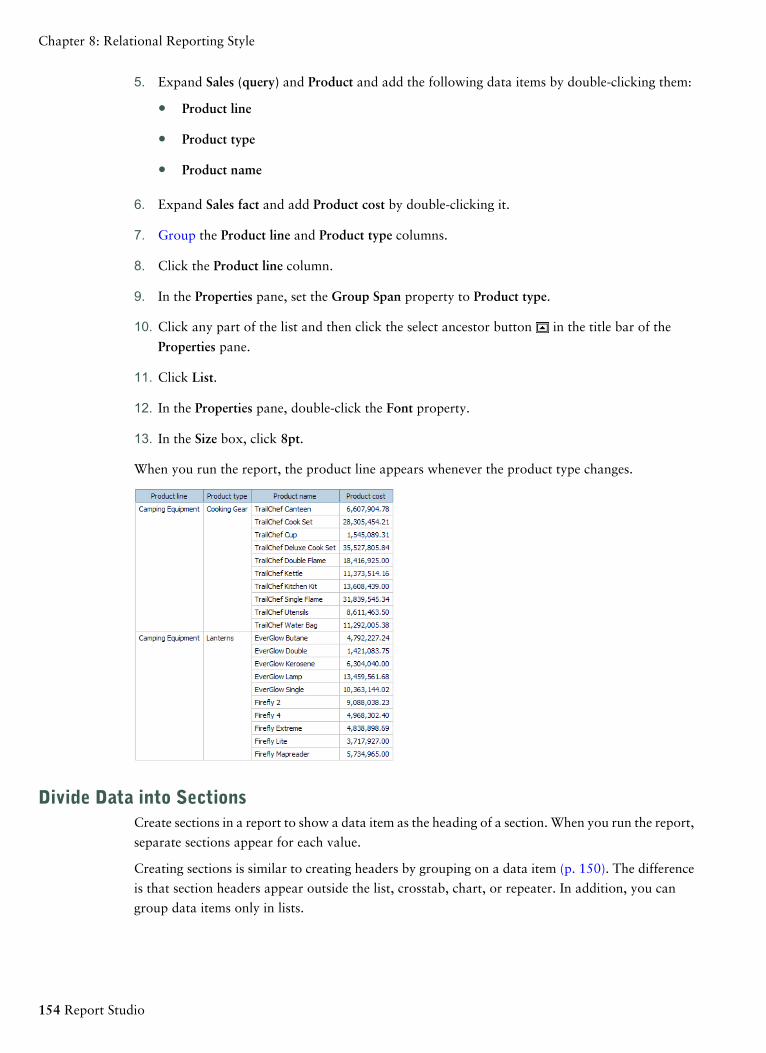
5. Expand Sales (query) and Product and add the following data items by double-clicking them:
● Product line
● Product type
● Product name
6. Expand Sales fact and add Product cost by double-clicking it.
7. Group the Product line and Product type columns.
8. Click the Product line column.
9. In the Properties pane, set the Group Span property to Product type.
10. Click any part of the list and then click the select ancestor button in the title bar of the
Properties pane.
11. Click List.
12. In the Properties pane, double-click the Font property.
13. In the Size box, click 8pt.
When you run the report, the product line appears whenever the product type changes.
Divide Data into SectionsCreate sections in a report to show a data item as the heading of a section. When you run the report,
separate sections appear for each value.
Creating sections is similar to creating headers by grouping on a data item (p. 150). The difference
is that section headers appear outside the list, crosstab, chart, or repeater. In addition, you can
group data items only in lists.
154 Report Studio
Chapter 8: Relational Reporting Style
When working with dimensional data, you can also create page layers to show values on a separate
page for each member (p. 506).
Steps
1. Click the column to make a section heading.
2. Do one of the following:
● From the Structure menu, click Section .
If the column is in a list or repeater, this menu option will create sections without creating
a master detail relationship. This can improve performance when running the report.
If the column is in a crosstab or chart, this menu option will create sections using a master
detail relationship.
● From the Structure menu, click Section Using Master/Detail.
This menu option creates sections using a master detail relationship.
Sections are created, and a section header appears. The data container that contains the column
used to create sections is embedded in a list.
3. To add or remove section headers and footers, from the Structure menu, click Headers &
Footers, click List Headers & Footers, and select or clear the appropriate check boxes.
The section header and footer check boxes appear under Overall header.
Remove Sections
You can remove sections and reinsert the data item that was used to create the sections in the data
container.
Steps
1. From the View menu, click Page Structure.
2. Expand the page containing the data container with the section.
3. Expand Page Body until you see the data container in which you added the section.
The data container is nested in the List Column Body object of the List object that is created
when you add a section.
4. Drag the data container to Page Body.
The data container appears as a node of Page Body.
5. Delete the List object.
6. From the View menu, click Page Design.
7. In the Insertable Objects pane, click the Data Items tab .
8. Drag the data item that was used as a section header back into the data container.
Professional Authoring User Guide 155
Chapter 8: Relational Reporting Style
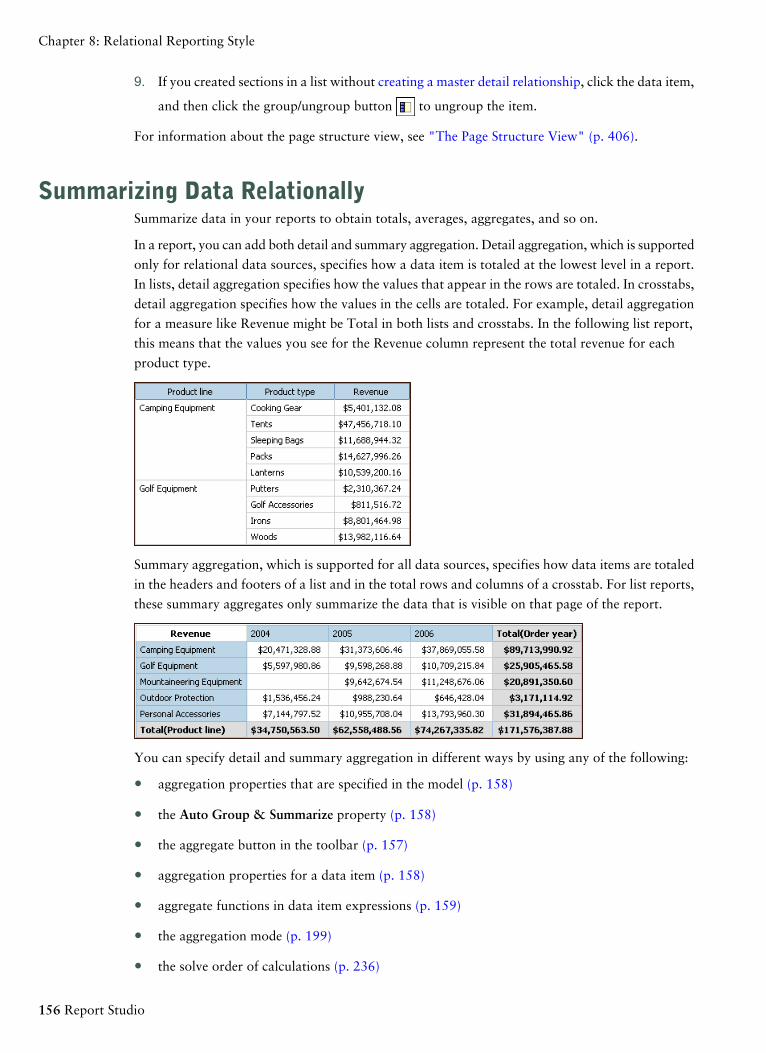
9. If you created sections in a list without creating a master detail relationship, click the data item,
and then click the group/ungroup button to ungroup the item.
For information about the page structure view, see "The Page Structure View" (p. 406).
Summarizing Data RelationallySummarize data in your reports to obtain totals, averages, aggregates, and so on.
In a report, you can add both detail and summary aggregation. Detail aggregation, which is supported
only for relational data sources, specifies how a data item is totaled at the lowest level in a report.
In lists, detail aggregation specifies how the values that appear in the rows are totaled. In crosstabs,
detail aggregation specifies how the values in the cells are totaled. For example, detail aggregation
for a measure like Revenue might be Total in both lists and crosstabs. In the following list report,
this means that the values you see for the Revenue column represent the total revenue for each
product type.
Summary aggregation, which is supported for all data sources, specifies how data items are totaled
in the headers and footers of a list and in the total rows and columns of a crosstab. For list reports,
these summary aggregates only summarize the data that is visible on that page of the report.
You can specify detail and summary aggregation in different ways by using any of the following:
● aggregation properties that are specified in the model (p. 158)
● the Auto Group & Summarize property (p. 158)
● the aggregate button in the toolbar (p. 157)
● aggregation properties for a data item (p. 158)
● aggregate functions in data item expressions (p. 159)
● the aggregation mode (p. 199)
● the solve order of calculations (p. 236)
156 Report Studio
Chapter 8: Relational Reporting Style
Limitation
If a summary is applied to a report that contains binary large object (BLOB) data, such as images
or multimedia objects, you cannot also perform grouping or sorting.
The Type of Data
How data is aggregated also depends on the type of data that you are aggregating. Aggregation
rules are applied differently to facts, identifiers, and attributes. For example, if you aggregate a data
item that represents part numbers, the only aggregate rules that apply are count, count distinct,
count non-zero, maximum, and minimum. For information about how to determine the type of
data that a data item represents, see "Add Relational Data to a Report" (p. 149) and "Add Dimen-
sional Data to a Report" (p. 189).
Add a Simple SummaryYou can add simple summaries to the groups in a report by using the aggregate button. This button
provides a subset of the aggregate functions available in Report Studio. For list reports, a Customoption is also available so that you can add your own aggregate function in the expression of the
data item (p. 159).
The aggregate button sets the rollup aggregate property (p. 158) for the data item to the selected
summary aggregate, and places the data item into an appropriate footer. A footer is created for
each group as well as an overall footer, unless they already exist.
For information about adding a rolling or moving average, see "Rolling and Moving Aver-
ages" (p. 416).
Steps
1. Click the column to which to add a summary.
2. Click the aggregate button and click a summary type (p. 203).
3. To change the summary label, do the following:
● Click the label.
● In the Properties pane, under Text Source, set the Source Type property to the source type
to define the label.
For example, set it as Data Item Value to produce a dynamic label for the summary based
on data item values.
● Set the property below Source Type to specify the label.
This property depends on the source type you chose. For example, if you chose Data Item
Value as the source type, set the Data Item Value property to the data item to use to define
the label.
In lists, the summary appears as a footer (p. 407). If the column to which you added a summary is
grouped, group and overall summaries appear. In crosstabs and charts, the summary appears as a
node (p. 84).
Professional Authoring User Guide 157
Chapter 8: Relational Reporting Style
Tips
● To change a summary, select it and, in the Properties pane, under Data Item, click Rollup
Aggregate Function (p. 158) and choose a different function.
● In crosstabs, you can add multiple summaries at the same level. For example, you have a crosstab
with Product line as rows, Order year as columns, and Revenue as the measure. For Product
line, you can add the Total summary as a header, which will total all revenue for each order
year. You can then add the Average summary as a footer, which will give the average revenue
of all product lines for each order year.
Set the Auto Group & Summarize PropertySet the Auto Group & Summarize query property to specify whether Report Studio should group
non-fact data items (identifiers and attributes) and apply aggregate functions to aggregate fact data
items in lists.
If you are using an OLAP data source, data is always summarized regardless of how this property
is set.
Steps
1. Pause the pointer over the query explorer button and click a query.
2. In the Properties pane, set the Auto Group & Summarize property:
● To group non-aggregate fact data items and apply aggregate functions to aggregate fact
data items in lists, set this property to Yes.
● To render detail rows, set this property to No.
Specify Detail or Summary Aggregation in the ModelWhen working with relational or dimensionally-modeled relational (DMR) data sources, you can
use the aggregation properties specified for the query item in the Framework Manager model instead
of specifying detail or summary aggregation in the report. The model specifies the default summary
function for each query item.
Aggregation functions are mapped between data sources, Framework Manager, and Report Studio
(p. 207).
Specify Aggregation Properties for a Data ItemWhen working with relational data sources and list reports, for each data item in a report, you can
specify detail and summary aggregation properties to manage summaries without having to create
complex data item expressions (p. 159).
Steps
1. Click the data item for which to set detail or summary aggregation.
2. In the Properties pane, set the Aggregate Function or the Rollup Aggregate Function property
to a function (p. 203).
158 Report Studio
Chapter 8: Relational Reporting Style
Use Summary Functions in Data Item ExpressionsYou can use summary functions in data item expressions. The summary functions in the Expression
Editor (p. 245) that have the same name as the summary functions available through the Aggregate
Function and Rollup Aggregate Function properties (p. 158) operate the same way. For example, in
a relational report, setting the Aggregate Function property to Total is the same as changing the
expression of the data item to total([Revenue]).
In general, report maintenance is easier if the Aggregate Function and Rollup Aggregate Functionproperties are used rather than adding aggregate functions to data item expressions. Use summary
functions in expressions if the required summary is not supported as an aggregate or rollup
aggregate property or if the complexity of the expression cannot be managed using the data item
properties. Add an aggregate function to a data item expression if one of the following conditions
applies:
● The underlying data source is relational, and you want to use database vendor-specific
aggregate functions.
● You want to use aggregate functions that require more than one parameter, such as percentile.
● You require aggregate expressions that are not available in the aggregation properties, such as
a for clause.
For example, your report uses Product line, Product type, and Quantity. You want to calculate the
percentage of the parent quantity that is represented by each product type. This requires you to
compare the total quantity for each product type to the total quantity for the parent product line.
In other words, your expression requires aggregates at different group levels. You use aggregate
functions in the data item expression with a for clause to specify the group level as follows:
total ([Quantity] for [Product type]) / total([Quantity] for [Product type])
Tip: The Total Revenue by Country sample report (p. 539) in the GO Data Warehouse (query)
package includes a total aggregate function. For more information about The Great Outdoors
Company samples, see "Sample Reports and Packages" (p. 521).
Steps
1. Click a data item.
2. In the Properties pane, double-click the Expression property and add aggregate functions to
the expression for the data item.
Limitations When Using the FOR Clause in Summary Functions
A summary function that uses a for clause may yield unexpected results. These may include error
messages, warnings, incorrect numbers, and more or fewer than expected rows, columns, or chart
points and lines.
To avoid these problems, ensure that the parameters that follow the for clause adhere to the fol-
lowing constraints:
● Parameters must be simple data item references.
Professional Authoring User Guide 159
Chapter 8: Relational Reporting Style
● All data items in the parameter list must appear on every list, crosstab, or chart that uses that
summary.
● For any edge used in the for clause, data items listed in the for clause must start with the first
data item on that edge.
● Data items must be listed in the order in which they appear on each edge of the report with no
gaps.
● In crosstabs and charts, there must be no sibling data items that are considered details. Sum-
maries are normally not considered details.
● Section headers must not be included in the parameter list.
If following these constraints does not resolve the problems and your report uses dimensional data
with no detail or summary filters, consider using the within set clause instead of the for clause.
Summary FunctionsThis section describes the summary functions that are available in Report Studio. Some functions,
such as Custom, are available only when you click the aggregate button on the toolbar. Addi-
tional summary functions are available in the Expression Editor (p. 245).
Aggregate
In lists, sets the summary function to Automatic. In crosstabs, sets the Rollup Aggregate Function
to Automatic. The Aggregate function (p. 273) uses the summary rules for Automatic.
Automatic
Depending on the type of data item, applies the function None, Summarize, or Calculated based
on the context in which the data item appears.
Calculated is applied if the underlying data source is OLAP. It is also applied if the data item
expression
● contains a summary function
● is an if-then-else or case expression that contains a reference to at least a modeled measure
in its condition
● contains a reference to a model calculation or to a measure that has the Regular Aggregate
property set to a value other than Unsupported
● contains a reference to at least one data item that has the Rollup Aggregate Function property
set to a value other than None
If the underlying data source is relational and if the data item expression contains no summary
functions and a reference to at least one fact that has the Regular Aggregate property set to a value
other than Unsupported, Summarize is applied.
If the underlying data source is OLAP and if the data item expression contains no summary functions
and a reference to at least one fact that has the Regular Aggregate property set to a value other
than Unsupported, Calculated is applied.
160 Report Studio
Chapter 8: Relational Reporting Style
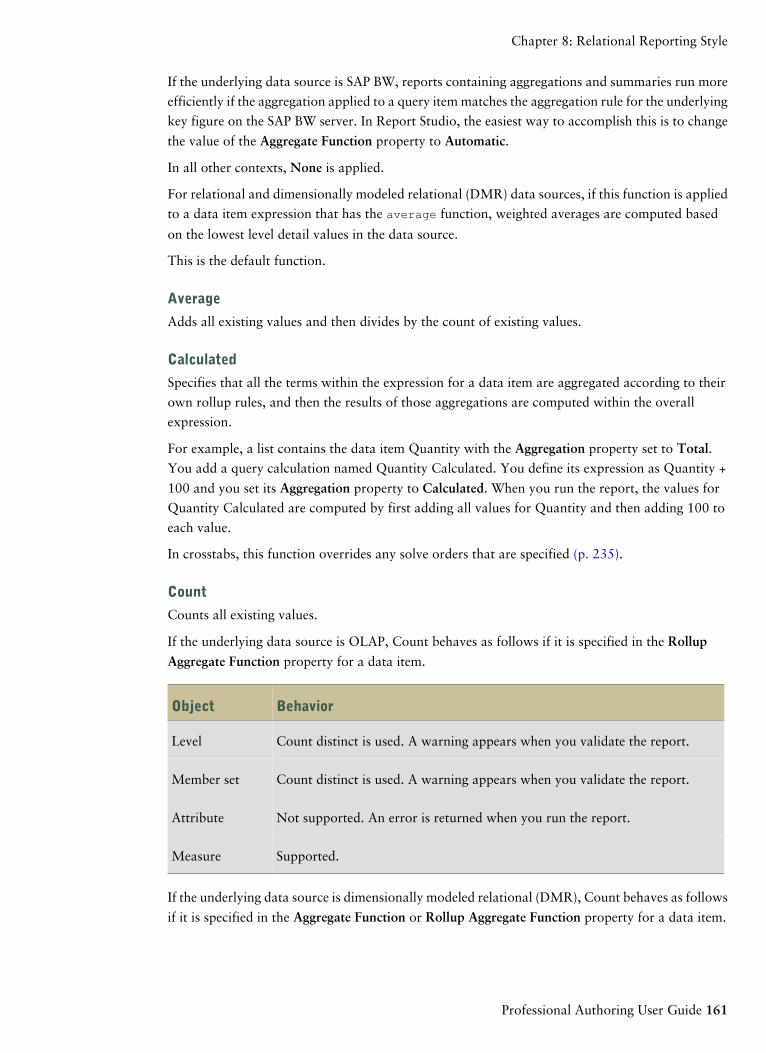
If the underlying data source is SAP BW, reports containing aggregations and summaries run more
efficiently if the aggregation applied to a query item matches the aggregation rule for the underlying
key figure on the SAP BW server. In Report Studio, the easiest way to accomplish this is to change
the value of the Aggregate Function property to Automatic.
In all other contexts, None is applied.
For relational and dimensionally modeled relational (DMR) data sources, if this function is applied
to a data item expression that has the average function, weighted averages are computed based
on the lowest level detail values in the data source.
This is the default function.
Average
Adds all existing values and then divides by the count of existing values.
Calculated
Specifies that all the terms within the expression for a data item are aggregated according to their
own rollup rules, and then the results of those aggregations are computed within the overall
expression.
For example, a list contains the data item Quantity with the Aggregation property set to Total.You add a query calculation named Quantity Calculated. You define its expression as Quantity +
100 and you set its Aggregation property to Calculated. When you run the report, the values for
Quantity Calculated are computed by first adding all values for Quantity and then adding 100 to
each value.
In crosstabs, this function overrides any solve orders that are specified (p. 235).
Count
Counts all existing values.
If the underlying data source is OLAP, Count behaves as follows if it is specified in the Rollup
Aggregate Function property for a data item.
BehaviorObject
Count distinct is used. A warning appears when you validate the report.Level
Count distinct is used. A warning appears when you validate the report.Member set
Not supported. An error is returned when you run the report.Attribute
Supported.Measure
If the underlying data source is dimensionally modeled relational (DMR), Count behaves as follows
if it is specified in the Aggregate Function or Rollup Aggregate Function property for a data item.
Professional Authoring User Guide 161
Chapter 8: Relational Reporting Style
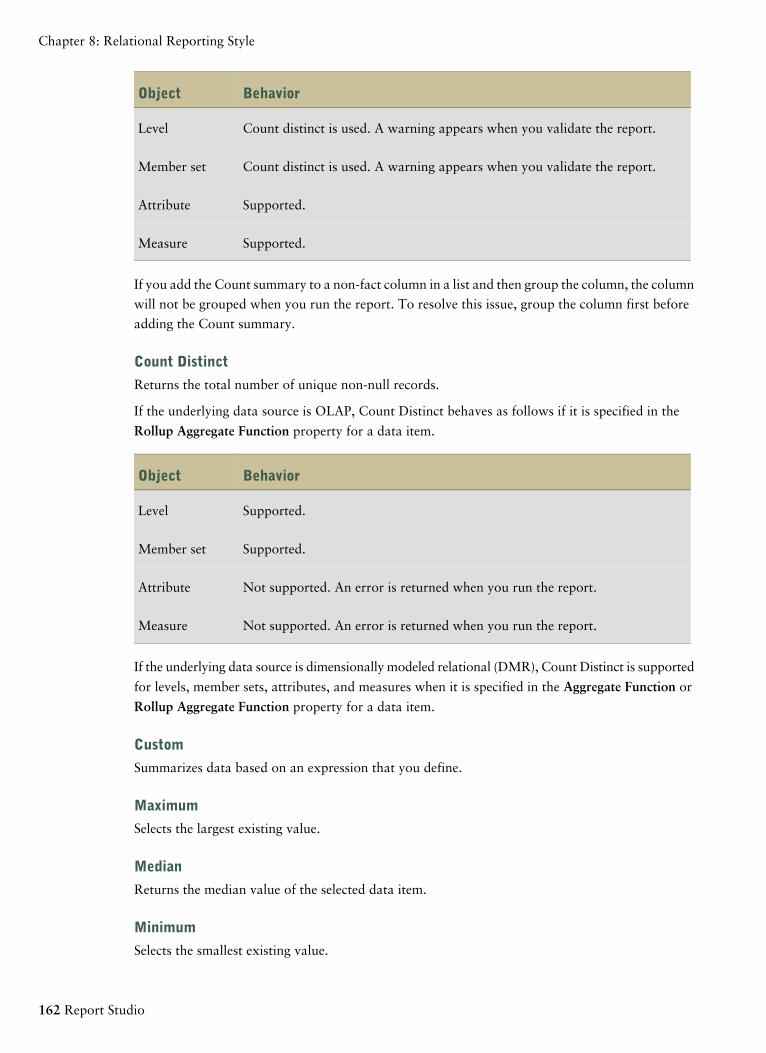
BehaviorObject
Count distinct is used. A warning appears when you validate the report.Level
Count distinct is used. A warning appears when you validate the report.Member set
Supported.Attribute
Supported.Measure
If you add the Count summary to a non-fact column in a list and then group the column, the column
will not be grouped when you run the report. To resolve this issue, group the column first before
adding the Count summary.
Count Distinct
Returns the total number of unique non-null records.
If the underlying data source is OLAP, Count Distinct behaves as follows if it is specified in the
Rollup Aggregate Function property for a data item.
BehaviorObject
Supported.Level
Supported.Member set
Not supported. An error is returned when you run the report.Attribute
Not supported. An error is returned when you run the report.Measure
If the underlying data source is dimensionally modeled relational (DMR), Count Distinct is supported
for levels, member sets, attributes, and measures when it is specified in the Aggregate Function or
Rollup Aggregate Function property for a data item.
Custom
Summarizes data based on an expression that you define.
Maximum
Selects the largest existing value.
Median
Returns the median value of the selected data item.
Minimum
Selects the smallest existing value.
162 Report Studio
Chapter 8: Relational Reporting Style
None
Does not aggregate values.
If the underlying data source is relational, the data item is grouped when the query property Auto
Group & Summarize (p. 158) is set to Yes.
Not Applicable
This function is available only for the Aggregate Function property. It specifies that the aggregate
attribute is ignored. For example, the calculation will be applied after the data is aggregated.
This function differs from the Calculated function, which applies aggregation to the rows and then
performs the calculation.
For example, for the average([Quantity])+5 expression, when the Aggregate Function property is
set to Not Applicable, five is added to the average of the single Quantity value. When the function
is set to Calculated, five is added to the average of a set of numbers.
This setting should not be applied to a simple model reference.
This setting is relevant only for reports that are upgraded from IBM Cognos ReportNet® 1.x.
Standard Deviation
Returns the standard deviation of the selected data item.
From a mathematical perspective, this function is not useful for small numbers of items and is not
supported if the query property Auto Group & Summarize (p. 158) is set to Yes.
Summarize
Aggregates data based on model or data type information. This function can be thought of as a
calculate and then aggregate rule. Data is aggregated using the following rules:
If the underlying data source type is relational and the data item or calculation is a reference to a
single fact query item in the model that has the Regular Aggregate property set to Sum, Maximum,
Minimum, Average, or Count, aggregate data using this function. Otherwise, data is aggregated
according to the data type of the data item as follows:
● Total is applied for numeric and interval values.
● Maximum is applied for date, time, and date-time values.
● Count is applied for everything else.
The underlying data source type can be dimensional and the data item or calculation a reference
to a single item in the model. In this case, if the Regular Aggregate property of the model item is
not unknown, the summary function that corresponds to the Regular Aggregate property is applied.
If the Regular Aggregate property is unknown, set the function to Calculated.
For example, a list contains the data item Quantity with the Aggregation property set to Average.You add a query calculation named Quantity Summarize. You define its expression as Quantity +
100 and you set its Aggregation property to Summarize. When you run the report, the values for
Quantity Summarize are computed by first adding 100 to each value for Quantity and then calcu-
lating the total. The total is calculated because Quantity contains numeric values and the expression
Professional Authoring User Guide 163
Chapter 8: Relational Reporting Style
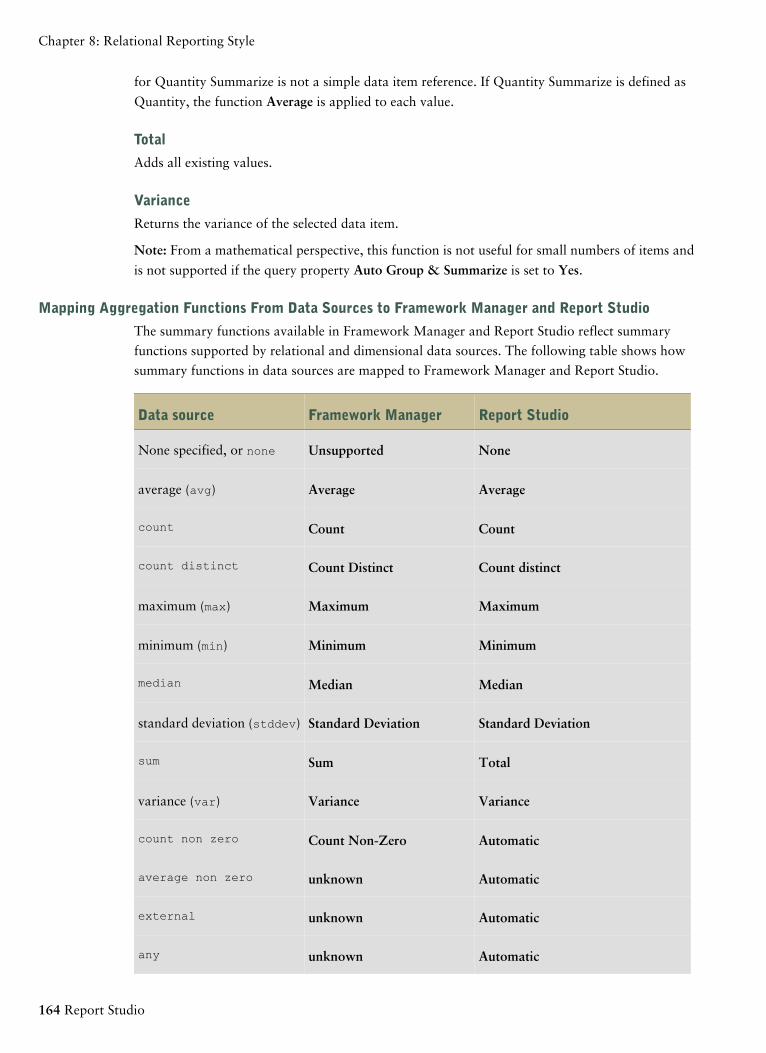
for Quantity Summarize is not a simple data item reference. If Quantity Summarize is defined as
Quantity, the function Average is applied to each value.
Total
Adds all existing values.
Variance
Returns the variance of the selected data item.
Note: From a mathematical perspective, this function is not useful for small numbers of items and
is not supported if the query property Auto Group & Summarize is set to Yes.
Mapping Aggregation Functions From Data Sources to Framework Manager and Report Studio
The summary functions available in Framework Manager and Report Studio reflect summary
functions supported by relational and dimensional data sources. The following table shows how
summary functions in data sources are mapped to Framework Manager and Report Studio.
Report StudioFramework ManagerData source
NoneUnsupportedNone specified, or none
AverageAverageaverage (avg)
CountCountcount
Count distinctCount Distinctcount distinct
MaximumMaximummaximum (max)
MinimumMinimumminimum (min)
MedianMedianmedian
Standard DeviationStandard Deviationstandard deviation (stddev)
TotalSumsum
VarianceVariancevariance (var)
AutomaticCount Non-Zerocount non zero
Automaticunknownaverage non zero
Automaticunknownexternal
Automaticunknownany
164 Report Studio
Chapter 8: Relational Reporting Style

Report StudioFramework ManagerData source
Automaticunknowncalculated
Automaticunknownunknown
Automaticunknownfirst_period
Automaticunknownlast_period
The following summary functions exist only in either Framework Manager or Report Studio. There
is no corresponding summary function in data sources.
Report StudioFramework Manager
AutomaticAutomatic
CalculatedCalculated
SummarizeNo corresponding summary function
Not ApplicableNo corresponding summary function
Focusing Relational DataYou can limit the data in your report with filters or query parameters. The method you choose
should depend on the capabilities of the data source, the performance requirements, the persistence
of the dataset, and how complex you want the report to be.
In Report Studio, summary and detail filters (p. 165), which are best for list reports in the relational
reporting style. Summary filters are applied to summaries and detail filters are applied to details.
These filters remove rows and columns from your reports.
You can also use prompts, or prompt controls, to allow users to provide input for the filter (p. 391).
Create a Detail or Summary FilterAdd a filter expression to focus a report and minimize processing time by excluding unwanted data.
For example, you can filter data to show customers who placed purchase orders that were valued
at over one thousand dollars during the past year. When you run the report, you see only the filtered
data.
Detail filters are applied to the data source. They are boolean expressions used to exclude database
rows based on non-aggregated values or to exclude lowest level groups based on leaf aggregates.
You can specify whether detail filters are applied before or after aggregation using the Applicationproperty.
Professional Authoring User Guide 165
Chapter 8: Relational Reporting Style
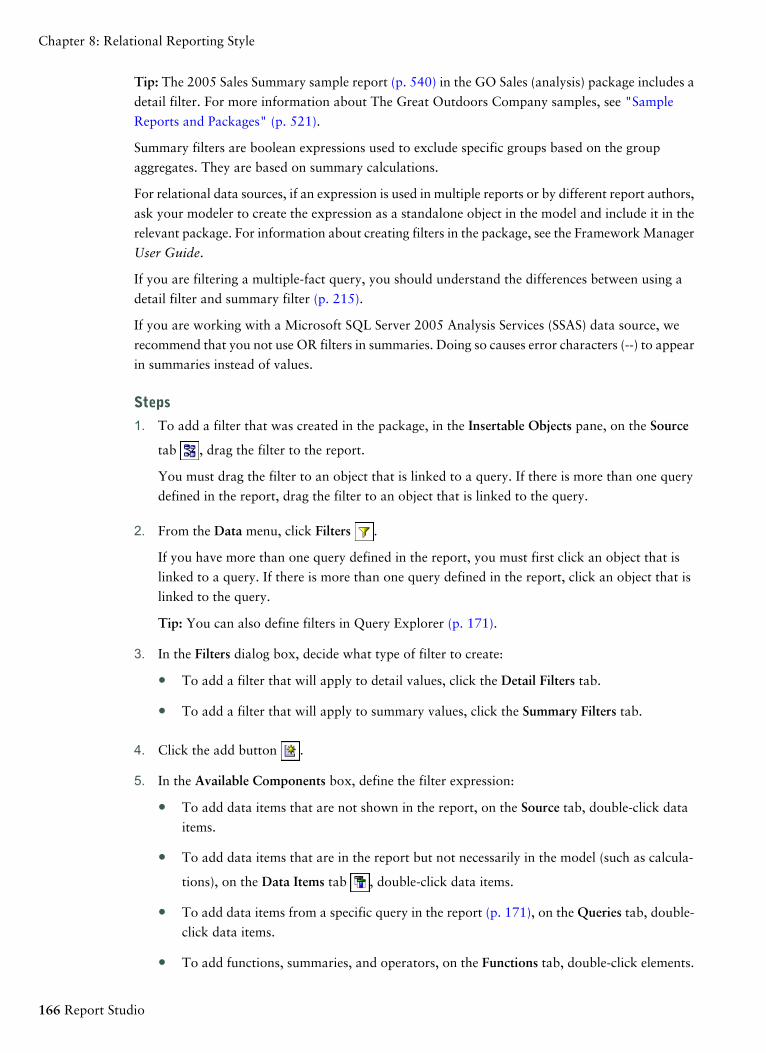
Tip: The 2005 Sales Summary sample report (p. 540) in the GO Sales (analysis) package includes a
detail filter. For more information about The Great Outdoors Company samples, see "Sample
Reports and Packages" (p. 521).
Summary filters are boolean expressions used to exclude specific groups based on the group
aggregates. They are based on summary calculations.
For relational data sources, if an expression is used in multiple reports or by different report authors,
ask your modeler to create the expression as a standalone object in the model and include it in the
relevant package. For information about creating filters in the package, see the Framework Manager
User Guide.
If you are filtering a multiple-fact query, you should understand the differences between using a
detail filter and summary filter (p. 215).
If you are working with a Microsoft SQL Server 2005 Analysis Services (SSAS) data source, we
recommend that you not use OR filters in summaries. Doing so causes error characters (--) to appear
in summaries instead of values.
Steps
1. To add a filter that was created in the package, in the Insertable Objects pane, on the Source
tab , drag the filter to the report.
You must drag the filter to an object that is linked to a query. If there is more than one query
defined in the report, drag the filter to an object that is linked to the query.
2. From the Data menu, click Filters .
If you have more than one query defined in the report, you must first click an object that is
linked to a query. If there is more than one query defined in the report, click an object that is
linked to the query.
Tip: You can also define filters in Query Explorer (p. 171).
3. In the Filters dialog box, decide what type of filter to create:
● To add a filter that will apply to detail values, click the Detail Filters tab.
● To add a filter that will apply to summary values, click the Summary Filters tab.
4. Click the add button .
5. In the Available Components box, define the filter expression:
● To add data items that are not shown in the report, on the Source tab, double-click data
items.
● To add data items that are in the report but not necessarily in the model (such as calcula-
tions), on the Data Items tab , double-click data items.
● To add data items from a specific query in the report (p. 171), on the Queries tab, double-
click data items.
● To add functions, summaries, and operators, on the Functions tab, double-click elements.
166 Report Studio
Chapter 8: Relational Reporting Style
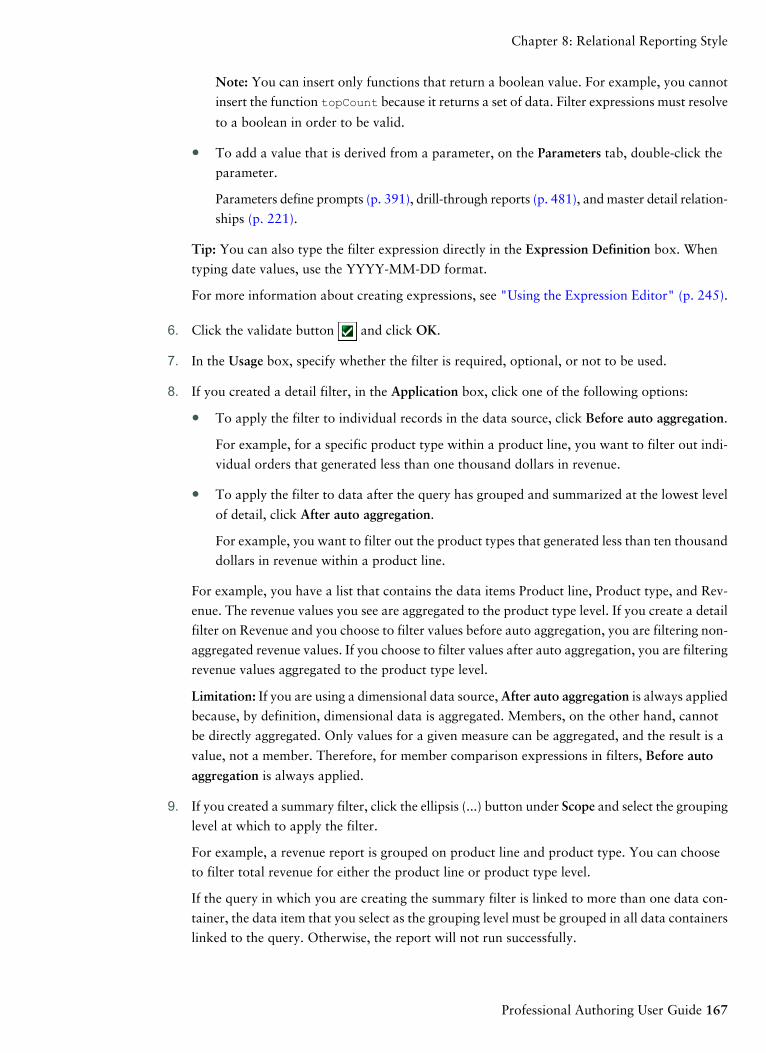
Note: You can insert only functions that return a boolean value. For example, you cannot
insert the function topCount because it returns a set of data. Filter expressions must resolve
to a boolean in order to be valid.
● To add a value that is derived from a parameter, on the Parameters tab, double-click the
parameter.
Parameters define prompts (p. 391), drill-through reports (p. 481), and master detail relation-
ships (p. 221).
Tip: You can also type the filter expression directly in the Expression Definition box. When
typing date values, use the YYYY-MM-DD format.
For more information about creating expressions, see "Using the Expression Editor" (p. 245).
6. Click the validate button and click OK.
7. In the Usage box, specify whether the filter is required, optional, or not to be used.
8. If you created a detail filter, in the Application box, click one of the following options:
● To apply the filter to individual records in the data source, click Before auto aggregation.
For example, for a specific product type within a product line, you want to filter out indi-
vidual orders that generated less than one thousand dollars in revenue.
● To apply the filter to data after the query has grouped and summarized at the lowest level
of detail, click After auto aggregation.
For example, you want to filter out the product types that generated less than ten thousand
dollars in revenue within a product line.
For example, you have a list that contains the data items Product line, Product type, and Rev-
enue. The revenue values you see are aggregated to the product type level. If you create a detail
filter on Revenue and you choose to filter values before auto aggregation, you are filtering non-
aggregated revenue values. If you choose to filter values after auto aggregation, you are filtering
revenue values aggregated to the product type level.
Limitation: If you are using a dimensional data source, After auto aggregation is always applied
because, by definition, dimensional data is aggregated. Members, on the other hand, cannot
be directly aggregated. Only values for a given measure can be aggregated, and the result is a
value, not a member. Therefore, for member comparison expressions in filters, Before auto
aggregation is always applied.
9. If you created a summary filter, click the ellipsis (...) button under Scope and select the grouping
level at which to apply the filter.
For example, a revenue report is grouped on product line and product type. You can choose
to filter total revenue for either the product line or product type level.
If the query in which you are creating the summary filter is linked to more than one data con-
tainer, the data item that you select as the grouping level must be grouped in all data containers
linked to the query. Otherwise, the report will not run successfully.
Professional Authoring User Guide 167
Chapter 8: Relational Reporting Style
Tip: To filter at the overall level, do not click a level. For example, if a report has an overall
footer that shows the total revenue for all products, by not choosing a level you will apply the
filter to the footer. In addition, if you are using a dimensional data source, excluding a parent
level excludes its children, and excluding all children excludes the parent.
Limitations When Specifying the Scope of Summary Filters with Dimensional Data Sources
When you specify the scope for a summary filter, consider the following limitations. The scope of
a summary filter
● must refer to a grouped data item for list reports. Otherwise, you encounter the following error:
OP-ERR-212 The summary filter scope (Scope1) found in the query (Query1) is not valid. It
must refer to a grouped query item.
● can refer to multiple data items, but it can refer to only one data item per edge of the crosstab.
Otherwise, you encounter the following error:
OP-ERR-213 The summary filter scope (Scope1) found in the query (Query1) is not valid.
Referencing more than one query item from the same edge is not supported.
● must refer to a level and cannot refer to a measure. Otherwise, you encounter the following
error:
OP-ERR-209 The summary filter scope (Scope1) found in the query (Query1) is not valid. It
must refer to a level.
● must refer to a data item that is projected on an edge of the crosstab. If the scope of a summary
filter refers to a data item that was deleted from the report layout, you may encounter unexpected
results. Otherwise, you encounter the following error:
OP-ERR-213 The summary filter scope (Scope1) found in the query (Query1) is not valid.
Referencing more than one query item from the same edge is not supported.
● must refer to unique data items. For example, the summary filter cannot refer to the same data
item more than once.
Limitations When Filtering Data Using an SAP BW Data Source
If you are working with an SAP BW data source, you must consider additional exceptions when
applying filters.
If you apply a filter and a sort to an item that corresponds to the leaf-level of a recursive hierarchy,
siblings may appear in the report even though the aggregated values are correct. Siblings are char-
acteristic values with the same parent as the filtered member.
Each level in an SAP BW hierarchy has an item with the same name as the level and a role of
_businessKey. Such items are known as level identifiers. The level identifier must be an exact value
for the operators =, <, and > to work. For example, for the filter [Office] > 'Chicago' to work, the
value 'Chicago' must exist in the data source. If you do not know the exact values, you can apply
the filter to one of the attribute items associated with the level, such as [OfficeLongName] > 'C'.
Filters on non-identifiers are possible, but they are slower because SAP BW data sources are
optimized for queries based on level identifiers.
168 Report Studio
Chapter 8: Relational Reporting Style
When filtering time-related data, only the level identifier items of the time-related characteristics
in SAP BW, such as 0CALDAY and 0CALMONTH, should be used for performing anything other
than equality filters. All other (attribute) items in these hierarchies are formatted string representations
of the characteristic values with which they are associated. These formatted values sort alphanumer-
ically and not chronologically.
Using Prompt Expressions in Filters
If you create a filter expression using report item attributes, such as the following, no data is returned.
[report item attribute] = ?prompt?
To resolve the problem, do one of the following:
● Fully qualify the item by using items from the source tree instead of data items from the report.
● Use prompt controls in the report instead of hand coded prompts.
Ignoring the Time Component in Date Columns
Database systems use Date, Time, and Timestamp to represent date and time values. While a
timestamp type holds a date and time component, an application may allow the RDBMS to default
the time component. When rows are inserted, updated, or queried, the application may specify only
a date value and leave the RDBMS to extend the value to include a default time (usually
00:00:00.000).
The challenge with a timestamp is when the application has no immediate interest in the time
component. For example, the business question "How many orders were taken today?" implies all
orders taken irrespective of what time the order was booked. If the application defaulted the time
component as it stored rows, the query that was used to answer the question returns the count of
orders taken today. If the application stored the actual time component, the query likely returns
no data, because the number of orders entered at midnight is probably zero.
Relying on the time defaults can be dangerous if the application changes and starts to capture actual
times. To avoid this problem, you can
● truncate the time by creating a derived column
● convert the timestamp to a date
● create a hi-low filter
Truncating the Time by Creating a Derived Column
In the Framework Manager model, create a derived column using a calculated expression that
truncates the time from a timestamp, and returns a timestamp containing the original date and a
default time. For example, if you use an Oracle data source, the following expression creates the
derived column DATEONLY from COL1, where COL1 contains the values as stored by the
application while DATEONLY contains the dates with the default time of 12:00:00 AM:
Select COL1,trunc(COL1) as DATEONLY from [SCOTT_TIGER].DATES
Tip: You can change the data format of the column to show only the date value by setting the Date
Style property to Short.
Professional Authoring User Guide 169
Chapter 8: Relational Reporting Style
You can then apply filters to the DATEONLY column that would return the correct results. If you
create a parameter in Report Studio that filters on this column, the default prompt will present a
date and time control because the data type is still a timestamp.
Converting the Timestamp to a Date
In the Framework Manager model, define a calculation that uses the CAST function to convert the
timestamp to a date. For example, the following expression converts the data type of the column
COL1 to date:
cast ([SCOTT_TIGER].[DATES].[COL1],DATE)
If you create a parameter in Report Studio that filters on this calculation, the default prompt presents
a date control.
Ignoring the Time by Creating a Hi-Low Filter
You can create a hi-low filter to ignore the time. In the Framework Manager model, create a filter
in the form date-column between date-lowtime and date-hightime. For example, the following
expression returns all values between 00:00:00:000 and 23:59:59:000 for a given day:
[SCOTT_TIGER].[DATES].[COL1] between?p1? and cast(substring(?p1?,1,10),'23:59.
59.000',timestamp)
Sorting Relational DataYou can sort items to view them in your preferred order. By default, Report Studio retrieves items
in the order defined in the data source. OLAP data sources always have a defined order. Relational
and dimensionally-modeled relational data sources may not always have a defined order. The data
modeler defines the sorting options in the model. For more information about data modeling, see
the Framework Manager User Guide.
You can sort items in a list in ascending or descending order based on a value or a caption, such
as revenue or employee name. You can also perform advanced sorting (p. 171) to sort columns
within groups or to sort a row or column using another data item.
Tip: The Sales Growth Year Over Year sample report (p. 536) in the GO Data Warehouse (analysis)
package includes sorting. For more information about The Great Outdoors Company samples, see
"Sample Reports and Packages" (p. 521).
Steps
1. Click the data item on which to sort.
2. Click the sort button and click Sort Ascending or Sort Descending.
Tip: If you are sorting an extended data item, click the sort button, click Layout, and then click
Sort Ascending or Sort Descending.
An arrow appears beside the data item to indicate that a sort order was set.
When you specify a sort order for more than one column, the columns are sorted in the order
in which they were inserted in the report. For example, you add columns A, B, and C to a report
and specify a sort order for each. When you run the report, column A is sorted first, then column
170 Report Studio
Chapter 8: Relational Reporting Style
B, and then column C. You can change the order in which the columns are sorted in the
Advanced Sorting options.
Tip: To remove a sort order, click Don't Sort.
Perform Advanced Layout SortingIf you use relational data, in a list, you can sort columns within groups and change the sort order
of columns. In a crosstab, you can sort a row or column by another item, such as Order year by
Revenue.
Steps to Sort in the Layout
1. Click a column.
In a crosstab, click the row or column on which to perform advanced sorting.
2. From the Data menu, click Sort, and then click Advanced Sorting.
Tip: If you are sorting a set, click Sort, click Layout, and then click Advanced Sorting.
3. To sort a list column within a group, do the following:
● In the Groups pane, under the Groups folder, expand the folder of the grouped column
(p. 150).
● In the Data Items pane, drag the data items to sort to the Sort List folder.
Tip: You can also drag data items from the Detail Sort List folder.
● Click the sort order button to specify ascending or descending order.
4. To change the sort order of columns, in the Groups pane, change the order of columns in the
Sort List folder of a group or in the Detail Sort List folder.
Tip: Add items to the Detail Sort List folder to sort items that are not groups.
5. If you are sorting a crosstab, do the following:
● From the Data Items pane, drag the item on which to sort to the Sort List pane.
For example, you have a crosstab with Product line as rows, Order year as columns, and
Revenue as the measure. To sort Order year by Revenue, drag Revenue to the Sort Listpane.
● Click the sort order button to specify ascending or descending order.
Working with Relational QueriesQueries specify what data appears in the report. In Report Studio, you create and modify queries
using Query Explorer (p. 48). Query Explorer provides an alternative way to modify existing reports
or to author new reports. You can use Query Explorer to perform complex tasks and other tasks
that are more difficult to do in the report layout. For example, use Query Explorer to
Professional Authoring User Guide 171
Chapter 8: Relational Reporting Style
● improve performance by changing the order in which items are queried from the database, or
by changing query properties to allow the report server to execute queries concurrently where
possible
Note: By default, queries run sequentially. Your administrator must enable the concurrent
query execution feature. For more information, see the Administration and Security Guide.
● view or add filters and parameters and modify their properties
● view or add dimensions, levels, and facts
● incorporate SQL statements that come from other reports or reports that you write
● create complex queries using set operations and joins
Specify a List of Data Items for an ObjectSpecify the list of data items for an object when you must reference a data item that is in a query
but is not in the layout. For example, you want to add a layout calculation to a list that uses a data
item that is in the query definition. If the data item does not appear in the list, you must reference
it in order to make the layout calculation work.
You must also specify the list of data items if you apply conditional formatting (p. 431) that uses a
data item that is not in the query.
Steps
1. Click a layout object.
Tip: For a list of layout objects for which you can specify a list of properties, see the Propertiesproperty in "Report Studio Object and Property Reference" (p. 553).
2. In the Properties pane, double-click the Properties property and select data items.
Relate a Query to a LayoutQueries and layouts work together. After you decide the type of data that you need, you must create
a layout in which to show the results. Each column of data must be both selected for the query and
shown in a layout unless there are some columns that you don't want to show. The query and layout
portions of a report must be linked to produce a valid report.
Report Studio automatically links query and layout. For example, when you use Report Studio and
the list report layout, query and layout are automatically linked.
Steps to Manually Link a Query to a Data Container
1. Select a data container.
2. In the Properties pane, set the Query property to a query.
3. In the Insertable Objects pane, on the Data Items tab , drag data items from the query to
the data container.
172 Report Studio
Chapter 8: Relational Reporting Style
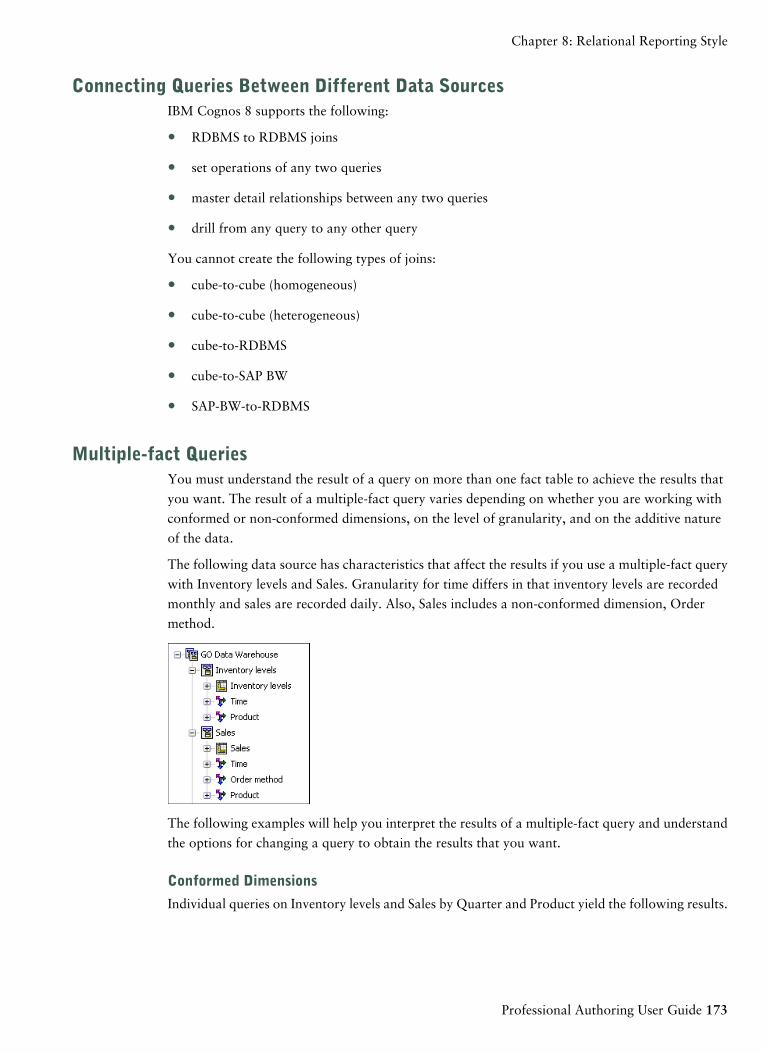
Connecting Queries Between Different Data SourcesIBM Cognos 8 supports the following:
● RDBMS to RDBMS joins
● set operations of any two queries
● master detail relationships between any two queries
● drill from any query to any other query
You cannot create the following types of joins:
● cube-to-cube (homogeneous)
● cube-to-cube (heterogeneous)
● cube-to-RDBMS
● cube-to-SAP BW
● SAP-BW-to-RDBMS
Multiple-fact QueriesYou must understand the result of a query on more than one fact table to achieve the results that
you want. The result of a multiple-fact query varies depending on whether you are working with
conformed or non-conformed dimensions, on the level of granularity, and on the additive nature
of the data.
The following data source has characteristics that affect the results if you use a multiple-fact query
with Inventory levels and Sales. Granularity for time differs in that inventory levels are recorded
monthly and sales are recorded daily. Also, Sales includes a non-conformed dimension, Order
method.
The following examples will help you interpret the results of a multiple-fact query and understand
the options for changing a query to obtain the results that you want.
Conformed Dimensions
Individual queries on Inventory levels and Sales by Quarter and Product yield the following results.
Professional Authoring User Guide 173
Chapter 8: Relational Reporting Style
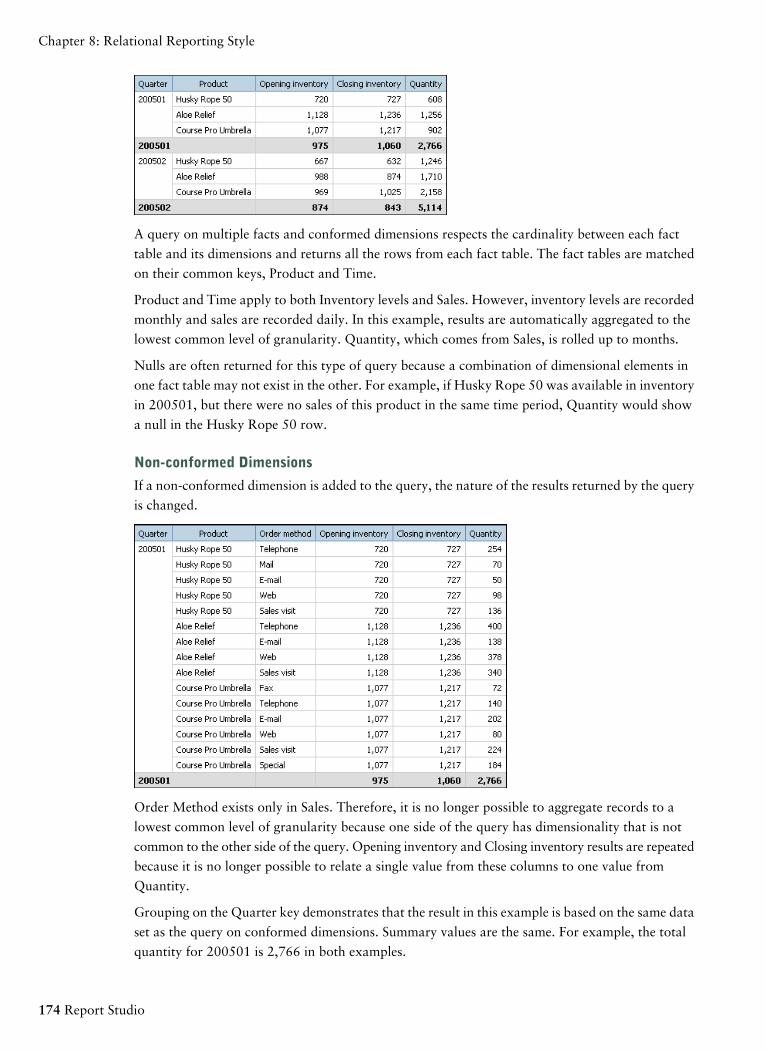
A query on multiple facts and conformed dimensions respects the cardinality between each fact
table and its dimensions and returns all the rows from each fact table. The fact tables are matched
on their common keys, Product and Time.
Product and Time apply to both Inventory levels and Sales. However, inventory levels are recorded
monthly and sales are recorded daily. In this example, results are automatically aggregated to the
lowest common level of granularity. Quantity, which comes from Sales, is rolled up to months.
Nulls are often returned for this type of query because a combination of dimensional elements in
one fact table may not exist in the other. For example, if Husky Rope 50 was available in inventory
in 200501, but there were no sales of this product in the same time period, Quantity would show
a null in the Husky Rope 50 row.
Non-conformed Dimensions
If a non-conformed dimension is added to the query, the nature of the results returned by the query
is changed.
Order Method exists only in Sales. Therefore, it is no longer possible to aggregate records to a
lowest common level of granularity because one side of the query has dimensionality that is not
common to the other side of the query. Opening inventory and Closing inventory results are repeated
because it is no longer possible to relate a single value from these columns to one value from
Quantity.
Grouping on the Quarter key demonstrates that the result in this example is based on the same data
set as the query on conformed dimensions. Summary values are the same. For example, the total
quantity for 200501 is 2,766 in both examples.
174 Report Studio
Chapter 8: Relational Reporting Style
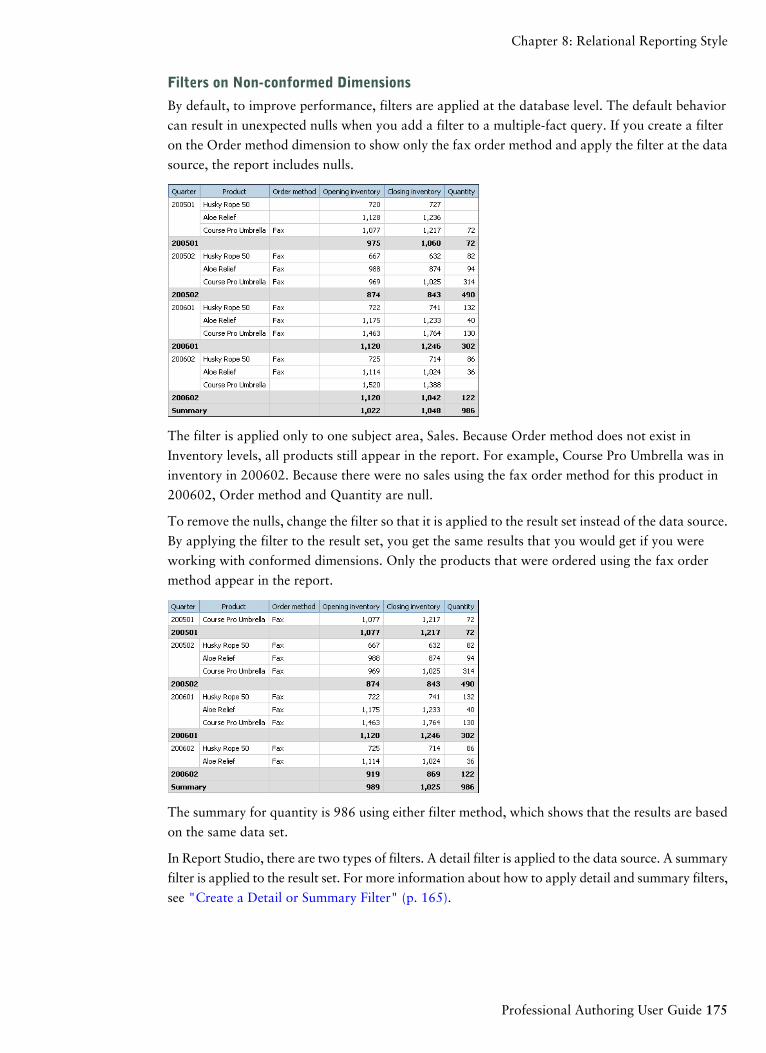
Filters on Non-conformed Dimensions
By default, to improve performance, filters are applied at the database level. The default behavior
can result in unexpected nulls when you add a filter to a multiple-fact query. If you create a filter
on the Order method dimension to show only the fax order method and apply the filter at the data
source, the report includes nulls.
The filter is applied only to one subject area, Sales. Because Order method does not exist in
Inventory levels, all products still appear in the report. For example, Course Pro Umbrella was in
inventory in 200602. Because there were no sales using the fax order method for this product in
200602, Order method and Quantity are null.
To remove the nulls, change the filter so that it is applied to the result set instead of the data source.
By applying the filter to the result set, you get the same results that you would get if you were
working with conformed dimensions. Only the products that were ordered using the fax order
method appear in the report.
The summary for quantity is 986 using either filter method, which shows that the results are based
on the same data set.
In Report Studio, there are two types of filters. A detail filter is applied to the data source. A summary
filter is applied to the result set. For more information about how to apply detail and summary filters,
see "Create a Detail or Summary Filter" (p. 165).
Professional Authoring User Guide 175
Chapter 8: Relational Reporting Style
Add a Query to a Relational ReportYou can create multiple queries in Query Explorer to suit your particular needs. For example, you
can create a separate query for each data container in a report to show different data.
Tip: The Briefing Book sample report (p. 540) in the GO Sales (analysis) package and the Top 10
Retailers for 2005 sample report in the GO Data Warehouse (analysis) package include multiple
queries. For more information about The Great Outdoors Company samples, see "Sample Reports
and Packages" (p. 521).
Steps
1. Pause the pointer over the query explorer button and click Queries.
2. In the Insertable Objects pane, drag one of the following objects to the work area.
DescriptionObject
Adds a query.Query
Adds a join relationship.Join
Adds a union operator.Union
Adds an intersect operator.Intersect
Adds an except (minus) operator.Except
Adds SQL commands.SQL
3. In the Properties pane, set the object properties.
For example, if you added a join, set the Join Relationships property to define the join.
4. Double-click a query.
5. In the Insertable Objects pane, on the Source tab , drag data items to the Data Items pane.
Tip: You can add data items to the query that you do not want to appear in the layout. For
example, to filter on Product line code and show Product line in the layout, you must add both
data items to the query.
6. To create a new data item, in the Insertable Objects pane, on the Toolbox tab , drag Data
Item to the Data Item pane.
7. To add a filter, in the Insertable Objects pane, on the Toolbox tab, drag Filter to the Detail
Filters or Summary Filters pane and define the filter expression (p. 165).
Tip: You can also create a filter by dragging a data item from the Source tab to one of the filters
panes and completing the filter expression. If you are working with a dimensional data source,
you can quickly filter data by dragging a member to a filter pane instead of dragging the level
176 Report Studio
Chapter 8: Relational Reporting Style
to which the member belongs. For example, dragging the member 2006 from the Years level
will filter data for the year 2006. This method is quicker than dragging the Years level and
specifying data only for the year 2006 in the filter expression.
When adding queries to the report
● right-click the work area and click Show Package Sources to see the queries that use data items
from a package
● right-click the work area and click Expand References to see the relationships that exist between
queries in the report, which is useful when you are creating complex queries
Create a Union QueryCreate a union query to combine two or more queries into one result set.
You can combine queries that use different data sources. For example, you can combine a query
that returns data from a dimensional data source with a query that returns data from a relational
data source.
To combine two queries, the following conditions must be met:
● The two queries must have the same number of data items.
● The data items must have compatible types and appear in the same order.
For numeric data types, integer, float, double, and decimal are compatible.
For string data types, char, varChar, and longVarChar are compatible.
For binary data types, binary and varBinary are compatible.
Date data types must match exactly.
Steps
1. Pause the pointer over the query explorer button and click Queries.
2. In the Insertable Objects pane, do the following:
● Drag Query to the work area.
● Drag Union, Intersect, or Except to the right of the query.
Two drop zones appear to the right of the operator.
● Drag a Query object to each drop zone.
Two queries are created in the work area, and a shortcut to each query appears in the drop
zones.
3. Double-click each query that makes up the union query and add data items to the query.
4. Return to the Queries work area.
5. Click the set operator that you added in step 2.
6. In the Properties pane, set the Duplicates property to remove or preserve duplicate rows.
Professional Authoring User Guide 177
Chapter 8: Relational Reporting Style
7. Double-click the Projection List property.
The projection list shows the list of projected data items for the set operation.
8. To automatically produce the list of projected data items, click Automatically generated.
Report Studio generates the projection list using only one of the two queries in the union.
9. To add, delete, move, or rename data items in the projection list, click Manual and make the
changes.
10. Double-click the union query.
11. In the Insertable Objects pane, on the Source tab , drag data items to the Data Items pane.
The union query is complete. You can now link the union query to a data container in the layout.
Example - Create a Two-column List Report for Three Data Items
You are a report author at The Great Outdoors Company, which sells sporting equipment. You
are requested to create a list report that shows revenue for all product lines and order methods.
However, you want the product lines and order methods to appear in a single column. To create
this report, you use a union query to join the Product line and Order method data items.
Steps to Create a Report
1. Open Report Studio with the GO Data Warehouse (query) package.
2. In the Welcome dialog box, click Create a new report or template.
3. In the New dialog box, click Blank.
4. Pause the pointer over the query explorer button and click Queries.
5. In the Insertable Objects pane, do the following:
● Drag Query to the work area.
● Drag Union to the right of the query.
Two drop zones appear to the right of the operator.
● Drag a Query object to each drop zone.
Query2 and Query3 are created in the work area, and a shortcut to each query appears in
the drop zones.
Steps to Define the Queries
1. Double-click Query2.
2. In the Insertable Objects pane, on the Source tab , drag the following data items to the Data
Items pane:
● from the Product folder, drag Product line
● from the Sales fact folder, drag Revenue
178 Report Studio
Chapter 8: Relational Reporting Style
3. In the Insertable Objects pane, on the Toolbox tab , drag Data Item to the Data Items pane.
The data item will be used to sort product lines and order methods in the report.
4. In the Expression Definition box, type 'A' and click OK.
5. In the Properties pane, set the Name property to
Sort key
6. On the toolbar, press the back button to return to the Queries work area.
7. Double-click Query3.
8. In the Insertable Objects pane, on the Source tab, drag the following data items to the Data
Items pane:
● from the Order method folder, drag Order method
● from the Sales fact folder, drag Revenue
9. Repeat steps 3 to 5 to create a Sort key data item in Query3 with 'B' as its definition.
Steps to Define the Operator
1. On the toolbar, press the back button to return to the Queries work area.
2. Click the Union operator.
3. Double-click the Projection List property.
The Product line item in the projection list contains both product lines and order methods.
4. Click Manual.
5. Click Product line, and then click the edit button .
6. In the Edit box, type the following after Product line:
& Order method
7. Click OK twice.
Steps to Define the List Properties
1. Double-click Query1.
2. In the Insertable Objects pane, on the Source tab, drag the following data items to the Data
Items pane:
● Product line & Order method
● Revenue
● Sort key
Professional Authoring User Guide 179
Chapter 8: Relational Reporting Style
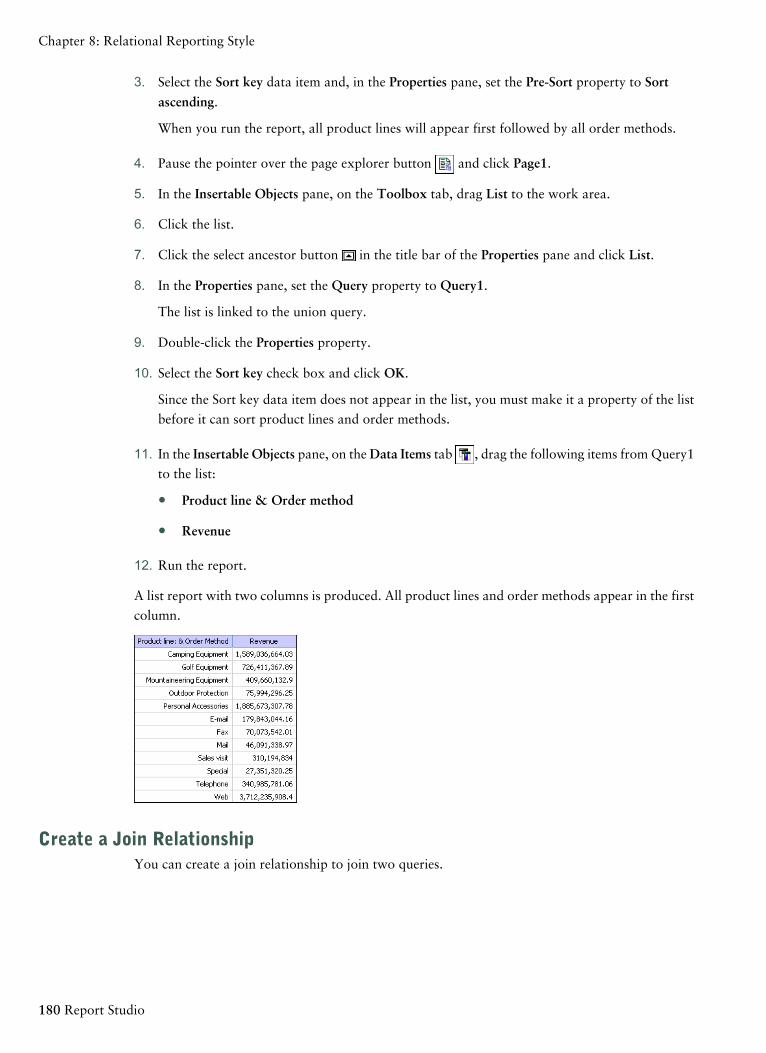
3. Select the Sort key data item and, in the Properties pane, set the Pre-Sort property to Sort
ascending.
When you run the report, all product lines will appear first followed by all order methods.
4. Pause the pointer over the page explorer button and click Page1.
5. In the Insertable Objects pane, on the Toolbox tab, drag List to the work area.
6. Click the list.
7. Click the select ancestor button in the title bar of the Properties pane and click List.
8. In the Properties pane, set the Query property to Query1.
The list is linked to the union query.
9. Double-click the Properties property.
10. Select the Sort key check box and click OK.
Since the Sort key data item does not appear in the list, you must make it a property of the list
before it can sort product lines and order methods.
11. In the Insertable Objects pane, on the Data Items tab , drag the following items from Query1
to the list:
● Product line & Order method
● Revenue
12. Run the report.
A list report with two columns is produced. All product lines and order methods appear in the first
column.
Create a Join RelationshipYou can create a join relationship to join two queries.
180 Report Studio
Chapter 8: Relational Reporting Style
In general, join relationships should be created in the Framework Manager model. Create a join
relationship in Report Studio if what you are trying to do cannot be modeled in Framework Manager.
Steps
1. Pause the pointer over the query explorer button and click Queries.
2. In the Insertable Objects pane, do the following:
● Drag Query to the work area.
● Drag Join to the right of the query.
Two drop zones appear to the right of the operator.
● Drag a Query object to each drop zone.
Two queries are created in the work area, and a shortcut to each query appears in the drop
zones.
3. Double-click each query that makes up the join query and add data items to the query.
4. On the toolbar, press the back button to return to the Queries work area.
5. Click Join.
6. In the Properties pane, double-click the Join Relationships property.
7. Click New Link.
8. To create the link, click a data item in the left query, and then click a data item in the right
query.
9. For each query, click Cardinality and click a cardinality option.
10. Click Operator and click an operator.
11. To convert the join relationship to an expression, click Convert to expression.
Convert the join relationship to an expression to make changes to the join definition.
Note: After you convert the relationship to an expression, you cannot change it back to a
relationship.
12. Double-click the join query.
13. In the Insertable Objects pane, on the Source tab , drag data items to the Data Items pane.
The join query is complete. You can now link the join query to a data container in the layout.
Reference a Package Item in a Child QueryWhen you create a child query in Report Studio, you can only reference items from its parent or
from other queries. For example, if you add a filter to a child query, the only items that you can
Professional Authoring User Guide 181
Chapter 8: Relational Reporting Style
insert into the expression are items that exist in other queries defined in the report. To add an item
from the package, you must unlink the child query from its parent.
Steps
1. Pause the pointer over the query explorer button and click Queries.
2. Unlink the child query from its parent by selecting the parent query shortcut to the right of the
child query and clicking the delete button .
3. Double-click the child query.
Package items are now available on the Source tab of the Insertable Objects pane.
4. Add package items.
For example, to create a detail filter that references a package item, drag the filter object from
the Toolbox tab to the Detail Filters pane, and then add the items in the Expression Definitionbox.
5. Click the up arrow button in the toolbar to return to the queries work area.
6. Recreate the link between the child query and the parent query by dragging the parent query
to the right of the child query.
7. If necessary, double-click the child query to complete it.
For example, if you created a filter, you may need to complete the filter expression.
Create a Master Detail RelationshipCreate a master detail relationship to deliver information that would otherwise require two or more
reports. For example, you can combine a list with a chart. The list can contain product lines and
the chart can show details for each product line.
Master detail relationships must appear in nested frames to produce the correct results. You can
create a master detail relationship in two ways:
● Use a parent frame for the master query and a nested frame for the detail query.
● Associate a report page with the master query and use a data container, such as a list or crosstab,
for the detail query.
You cannot display parent data in the child frame or child data in the parent frame. Also, you
cannot perform calculations across master detail queries.
You can use a master detail relationship to show data from separate data sources in a single report.
However, the data sources must be contained in the same package.
If you are working with an SAP BW data source, you cannot use a data item from the master query
that contains non-ASCII values.
182 Report Studio
Chapter 8: Relational Reporting Style
To create a master detail relationship using queries that reference two different dimensional data
sources, you must first link the members by aliasing the levels that contain the members.
Steps
1. To use a parent frame for the master query and a nested frame for the detail query:
● In the Insertable Objects pane, on the Toolbox tab , drag a List, Repeater Table, or
Repeater to the report.
● Add a second data container to the object you inserted.
You can insert a list, crosstab, chart, repeater table, or repeater into a list. You can add a
list to a repeater table or repeater.
● Add data items to both data containers.
2. To associate a report page with the master query and use a data container for the detail query:
● Click anywhere in the report page.
● In the Properties pane, click the select ancestor button and click Page.
● Set the Query property.
● In the Insertable Objects pane, on the Toolbox tab, drag a data container to the report.
3. To link a data item in the master query to a parameter in the detail query instead of to another
data item, create the parameter in the detail query.
Use parameters to filter values at a lower level in the detail query.
● Pause the pointer over the query explorer button and click the detail query.
● In the Insertable Objects pane, on the Toolbox tab, drag the Filter object to the Detail Filtersbox.
● In the Expression Definition box, create the parameter (p. 397).
4. Pause the pointer over the page explorer button and click the report page.
5. Click anywhere in the report page.
6. In the Properties pane, click the select ancestor button and click Page.
7. Click the data container containing the details.
8. From the Data menu, click Master Detail Relationships.
9. Click New Link.
10. In the Master box, click the data item that will provide the primary information.
11. To link the master query to a data item, in the Detail box, click the data item that will provide
the detailed information.
Professional Authoring User Guide 183
Chapter 8: Relational Reporting Style
12. To link the master query to a parameter, in the Parameters box, click the parameter that will
provide the detailed information.
Tip: To delete a link, select the link and press the Delete key.
13. If your detail query object is a chart, you can disconnect a chart title from the master query.
● Click the chart title, and then, from the Data menu, click Master Detail Relationships.
● Clear the Use the master detail relationships from the chart check box.
Tip: To avoid seeing the same data item twice in the report, click the data item in the data container
driven by the detail query and click the cut button. This removes the item from the report display
but keeps it in the query.
Master Detail or Burst Reports with Charts or Crosstabs May Result in Denial of Service
When running a master detail or burst report that includes a chart or crosstab, disk space exhaustion
may cause the report or other requests to fail. A large set of burst keys or master rows may produce
one or more charts per detail, resulting in many master detail executions. This may cause the temp
folder to accumulate many gigabytes of temporary files containing data required for successful chart
rendering.
To avoid this issue, we recommend that you test large master detail or burst reports that include
charts or crosstabs to determine the potential peak disk requirements for the report.
Working with Queries in SQLFor each query in a report, you can work with the SQL that is executed when you run a report.
You can
● view the SQL for an entire report or a query
● build a report using your own SQL
● convert a report to use SQL directly
● edit the SQL
When working with a relational data source, the SQL that is produced by Report Studio depends
on the report output selected.
Note: MDX is not available with relational or DMR data sources.
View the SQL for an Entire Report or a Query
View the SQL to see what is passed to the database when you run a report.
Steps
1. To view the SQL for the entire report, from the Tools menu, click ShowGenerated SQL/MDX.
This option shows the SQL that will be executed in the data source. The SQL is organized by
query and by query result. If a query is used in more than one data container, a query result is
generated for each data container.
184 Report Studio
Chapter 8: Relational Reporting Style
2. To view the SQL for a specific query, do the following:
● Pause the pointer over the query explorer button and click the query.
● In the Properties pane, double-click the Generated SQL/MDX property.
The Generated SQL/MDX property shows the SQL that is executed when you view tabular
data (from the Run menu, click View Tabular Data). Tabular data shows the data that is pro-
duced by the query in the form of a list. You can use this property to help you build advanced
queries.
The SQL for the query appears in the Generated SQL/MDX dialog box. You can choose to view
native SQL, which is the SQL that is passed to the database when you execute the query, or Cognos
SQL, which is a generic form of SQL that Report Studio uses. Cognos SQL is converted to native
SQL before the query is executed.
Build a Report Using Your Own SQL
You can build a report by adding SQL from an external source, such as another report.
If you edit the SQL of a query, you must change the Processing property for that query to Limited
Local.
Steps
1. From the File menu, click New.
2. Click Blank.
3. Pause the pointer over the query explorer button and click Queries.
4. In the Insertable Objects pane, drag Query to the work area.
5. In the Insertable Objects pane, to build an SQL query, drag SQL to the right of the query
Tip:You can drag SQL anywhere in the work area, and Report Studio will automatically create
a query.
6. In the Properties pane, double-click the Data Source property and click a data source.
7. If required, set the Catalog property to the name of the catalog.
8. Double-click the SQL or MDX property and type the SQL.
9. Click Validate to check for errors.
10. In the Properties pane, set the Processing property to Limited Local.
11. Double-click the query.
If the SQL is valid, the data items defined in the SQL appear in the Data Items pane.
12. Pause the pointer over the page explorer button and click a report page.
13. In the Insertable Objects pane, on the Toolbox tab, drag an object to the work area.
For example, drag a list, crosstab, chart, or repeater.
Professional Authoring User Guide 185
Chapter 8: Relational Reporting Style
14. Click the data container.
15. In the Properties pane, click the select ancestor button and click the container you just created.
For example, if you created a list, click List.
16. Set the Query property to the query for the report type.
17. In the Insertable Objects pane, on the Data Items tab , drag the items from the query you
chose in the previous step to the data container.
Convert a Query to SQL
You can convert a query to SQL to edit it. You may want to do this to improve performance or to
use SQL features that are not supported directly by Report Studio.
Converting a query to SQL is an irreversible process.
Steps
1. Pause the pointer over the query explorer button and click the query.
2. In the Properties pane, double-click the Generated SQL property.
3. Click Convert.
4. Click Validate to check for errors.
5. In the Properties pane, set the Processing property to Limited Local.
Edit the SQL
You can edit the SQL for a query that has been created as an SQL query or that has been converted
to SQL.
Steps
1. Pause the pointer over the query explorer button and click the SQL item under the query.
2. Double-click the SQL item.
3. Make changes in the text box.
4. Click Validate to check for errors.
First-Rows Optimization
The SQL produced by Report Studio depends on the report format you choose. For example, if
you specify HTML format, first-rows optimization is requested. All-rows is requested if you specify
PDF.
It is important for database administrators and programmers to remember that Report Studio does
not always use first-rows optimization. If you assume first-rows optimization is always requested,
this can cause the RDBMS optimizer to process the query differently than you expect.
186 Report Studio
Chapter 8: Relational Reporting Style
Using Relational CalculationsCreate calculations to make a report more meaningful by deriving additional information from the
data source. For example, you create an invoice report and you want to see the total sale amount
for each product ordered. Create a calculated column that multiplies the product price by the
quantity ordered.
For relational data sources, if an expression is used in multiple reports or by different report authors,
ask your modeler to create the expression as a standalone object in the model and include it in the
relevant package. For information about creating filters in the package, see the Framework Manager
User Guide.
You can add calculations to lists, crosstabs, and all other data containers. You can also add calcu-
lations directly to a page header, body, or footer. However, you must first associate a query to the
page. For more information, see "Add a Page to a Report" (p. 493).
Steps
1. In the Insertable Objects pane, click the Toolbox tab .
2. To create a calculation that will be applied to data, do the following:
● Drag Query Calculation to the report.
The Create Calculation dialog box appears.
● In the Name box, type a name for the calculation.
3. To create a calculation that contains run-time information, such as current date, current time,
and user name, drag Layout Calculation to the report.
4. In the Available Components box, define the calculation:
● To add data items that are not shown in the report, on the Source tab , double-click
data items.
● To add data items that are in the report but not necessarily in the model, such as calcula-
tions, on the Data Items tab , double-click data items.
● To add data items from a specific query (p. 171), on the Queries tab , double-click data
items.
● To add functions, summaries, and operators, on the Functions tab , double-click elements.
● To add a value that is derived from a parameter, on the Parameters tab , double-click
a parameter.
Parameters define prompts (p. 391), drill-through reports (p. 481), and master detail relation-
ships (p. 221).
Tip: You can also type the expression directly in the Expression Definition box.
For more information about creating expressions, see "Using the Expression Editor" (p. 245).
Professional Authoring User Guide 187
Chapter 8: Relational Reporting Style
5. Click the validate expression button .
Units of MeasuresWhen creating calculations in Report Studio and Query Studio, you may encounter problems with
the units of measure. For example, the calculation Cost*Cost returns the unit of measure * instead
of a currency unit of measure. To avoid this problem, change the format of the corresponding
column to obtain the desired unit of measure.
188 Report Studio
Chapter 8: Relational Reporting Style

Chapter 9: Dimensional Reporting Style
The dimensional reporting style is recommended for dimensionally-modeled relational (DMR) and
Online Analytical Processing (OLAP) data sources. Dimensional data is best represented by crosstabs,
maps, and charts. This data is shown in Report Studio in dimensions, hierarchies, levels, and
members.
In dimensional reporting, you summarize data by using member summaries and within set aggreg-
ation. You focus data in dimensional reporting by adding only the relevant members to the edge
of a crosstab or to the context filter. You can also enable drilling up and drilling down in dimensional
reports.
Analysis Studio and the Report Studio Express authoring mode are also available to work with
dimensional data.
You can perform the following tasks in dimensional reporting:
● add data
● summarize data
● focus data with filters
● sort data
● add queries
● use calculations
● enable drilling up and down
Add Dimensional Data to a ReportWe recommend using dimensional data in the dimensional reporting style. However, if you are
using relational data, see "Add Relational Data to a Report" (p. 149).
If you are working with a dimensional data source, data items are organized hierarchically.
Dimensional data sources include OLAP and dimensionally-modeled relational (DMR) data sources.
The Source tab in the Insertable Objects pane shows a metadata-based view of the data.
Professional Authoring User Guide 189
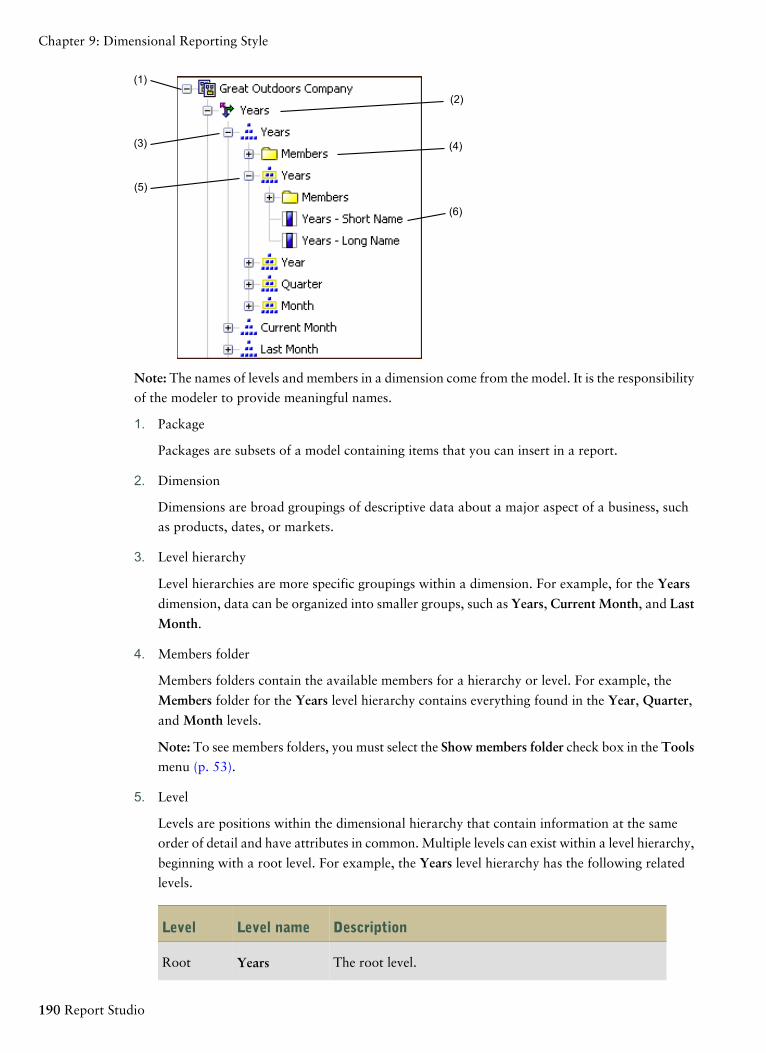
(1)
(2)
(4)(3)
(5)
(6)
Note: The names of levels and members in a dimension come from the model. It is the responsibility
of the modeler to provide meaningful names.
1. Package
Packages are subsets of a model containing items that you can insert in a report.
2. Dimension
Dimensions are broad groupings of descriptive data about a major aspect of a business, such
as products, dates, or markets.
3. Level hierarchy
Level hierarchies are more specific groupings within a dimension. For example, for the Years
dimension, data can be organized into smaller groups, such as Years, Current Month, and Last
Month.
4. Members folder
Members folders contain the available members for a hierarchy or level. For example, the
Members folder for the Years level hierarchy contains everything found in the Year, Quarter,
and Month levels.
Note: To see members folders, you must select the Showmembers folder check box in the Toolsmenu (p. 53).
5. Level
Levels are positions within the dimensional hierarchy that contain information at the same
order of detail and have attributes in common. Multiple levels can exist within a level hierarchy,
beginning with a root level. For example, the Years level hierarchy has the following related
levels.
DescriptionLevel nameLevel
The root level.YearsRoot
190 Report Studio
Chapter 9: Dimensional Reporting Style
DescriptionLevel nameLevel
Years in the Years root level. For example, 2004, 2003,
and 2002.
YearFirst
Quarters for each year in the Year level. For example, 2004
Q1, 2004 Q2, and 2004 Q3.
QuarterSecond
Months for each quarter in the Quarter level. For example,
Jan., Feb., and Mar.
MonthThird
Tip: The Measures dimension contains the measures available in the data source.
6. Member property
Member properties are attributes that each member possesses. For example, gender could be
a property for all employee members. For more information about member properties, see
"Insert a Member Property" (p. 193).
Insert MembersBy default, when you insert members from the source tree into your report, single members are
inserted without any details or children. You can change how members are inserted. For example,
you may want to insert a member along with all its children or insert only the member's children.
When you double-click a member that you have already inserted in your report, by default, its
children are inserted after the parent member. You can control whether the children are inserted
before or after, nested, or not inserted at all: from the Tools menu, click Options, and then choose
a setting on the Edit tab.
When inserting members into a crosstab, ensure that you insert members from the same hierarchy
only on one of the crosstab edges. If you insert members from the same hierarchy on both edges of
the crosstab, you may encounter unexpected results. For example, a report that uses members from
years in the rows and Quarters in the columns is very difficult to read because the useful numbers
are distributed over a large area of mostly blank cells.
Calculated members from the data source also appear in the source tree. However, calculated
members in Microsoft SQL Server Analysis Services (SSAS) cubes do not appear in the list of des-
cendants in the query. If you want these calculated members to appear in a report or a prompt, you
must insert them explicitly.
Steps
1. Click the insert single member button and select how to insert members.
2. In the Insertable Objects pane, from the Source tab , do one of the following:
● To insert a member above or below another member, drag the new member above or below
a cell.
A flashing black bar appears where you can drop the new member.
Professional Authoring User Guide 191
Chapter 9: Dimensional Reporting Style
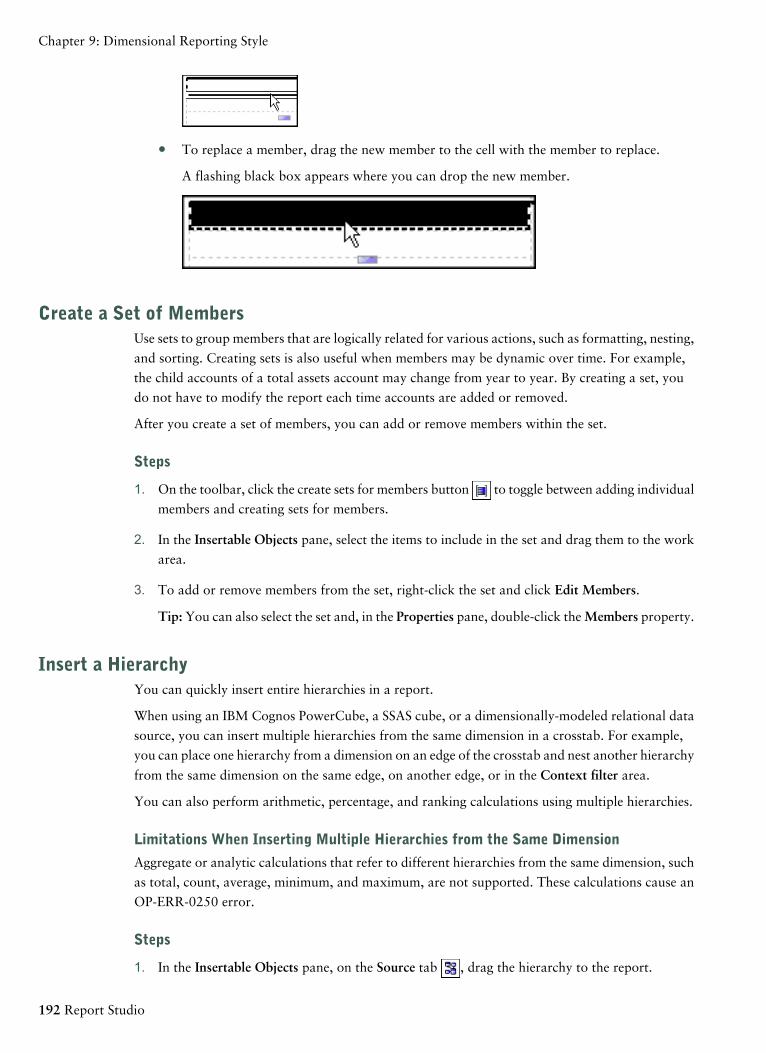
● To replace a member, drag the new member to the cell with the member to replace.
A flashing black box appears where you can drop the new member.
Create a Set of MembersUse sets to group members that are logically related for various actions, such as formatting, nesting,
and sorting. Creating sets is also useful when members may be dynamic over time. For example,
the child accounts of a total assets account may change from year to year. By creating a set, you
do not have to modify the report each time accounts are added or removed.
After you create a set of members, you can add or remove members within the set.
Steps
1. On the toolbar, click the create sets for members button to toggle between adding individual
members and creating sets for members.
2. In the Insertable Objects pane, select the items to include in the set and drag them to the work
area.
3. To add or remove members from the set, right-click the set and click Edit Members.
Tip: You can also select the set and, in the Properties pane, double-click the Members property.
Insert a HierarchyYou can quickly insert entire hierarchies in a report.
When using an IBM Cognos PowerCube, a SSAS cube, or a dimensionally-modeled relational data
source, you can insert multiple hierarchies from the same dimension in a crosstab. For example,
you can place one hierarchy from a dimension on an edge of the crosstab and nest another hierarchy
from the same dimension on the same edge, on another edge, or in the Context filter area.
You can also perform arithmetic, percentage, and ranking calculations using multiple hierarchies.
Limitations When Inserting Multiple Hierarchies from the Same Dimension
Aggregate or analytic calculations that refer to different hierarchies from the same dimension, such
as total, count, average, minimum, and maximum, are not supported. These calculations cause an
OP-ERR-0250 error.
Steps
1. In the Insertable Objects pane, on the Source tab , drag the hierarchy to the report.
192 Report Studio
Chapter 9: Dimensional Reporting Style
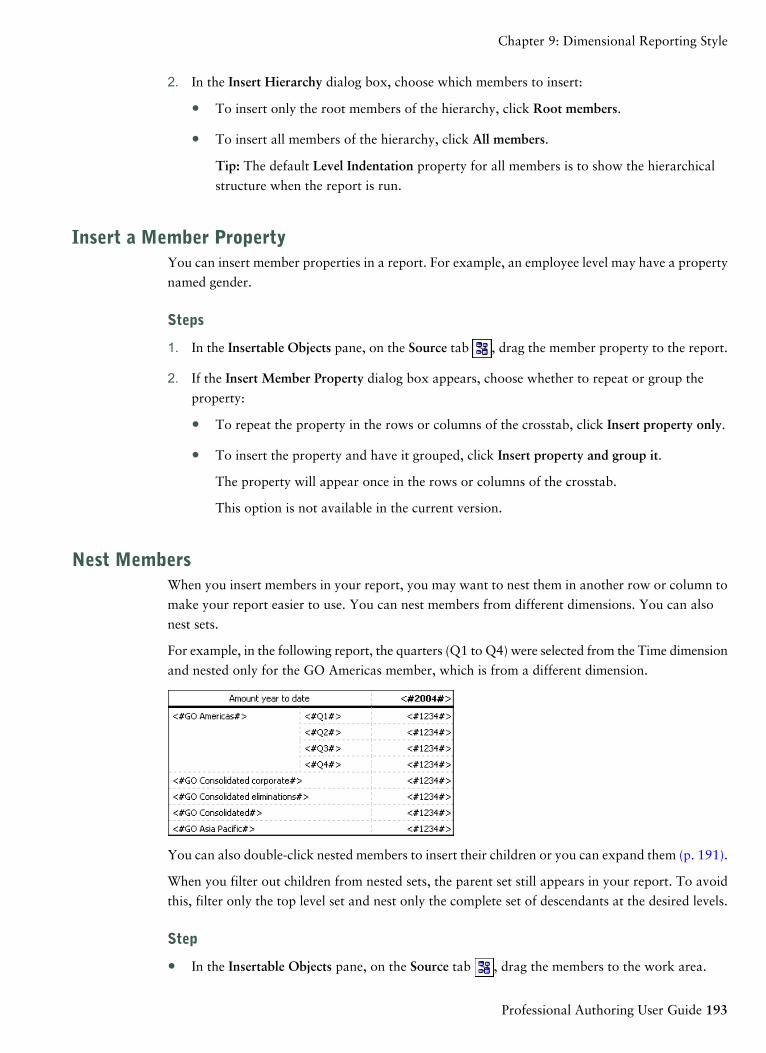
2. In the Insert Hierarchy dialog box, choose which members to insert:
● To insert only the root members of the hierarchy, click Root members.
● To insert all members of the hierarchy, click All members.
Tip: The default Level Indentation property for all members is to show the hierarchical
structure when the report is run.
Insert a Member PropertyYou can insert member properties in a report. For example, an employee level may have a property
named gender.
Steps
1. In the Insertable Objects pane, on the Source tab , drag the member property to the report.
2. If the Insert Member Property dialog box appears, choose whether to repeat or group the
property:
● To repeat the property in the rows or columns of the crosstab, click Insert property only.
● To insert the property and have it grouped, click Insert property and group it.
The property will appear once in the rows or columns of the crosstab.
This option is not available in the current version.
Nest MembersWhen you insert members in your report, you may want to nest them in another row or column to
make your report easier to use. You can nest members from different dimensions. You can also
nest sets.
For example, in the following report, the quarters (Q1 to Q4) were selected from the Time dimension
and nested only for the GO Americas member, which is from a different dimension.
You can also double-click nested members to insert their children or you can expand them (p. 191).
When you filter out children from nested sets, the parent set still appears in your report. To avoid
this, filter only the top level set and nest only the complete set of descendants at the desired levels.
Step
● In the Insertable Objects pane, on the Source tab , drag the members to the work area.
Professional Authoring User Guide 193
Chapter 9: Dimensional Reporting Style
A flashing black bar indicates where you can drop an item.
Search for MembersYou can perform a member search to quickly find data.
You can control the number of members that are returned in a search by specifying a value for the
Member display count limit (in source tree) option (p. 53).
Steps
1. In the Insertable Objects pane, on the Source tab , select and then right-click a dimension,
hierarchy, or level and click Search.
2. In the Words box, type the words or characters for which to search.
3. Click the search parameter to use.
4. To search all descendants instead of just the immediate children, select the Search all descendantscheck box.
For example, when performing a search in a hierarchy, selecting this check box returns members
found in all the levels of the hierarchy.
5. Click Search.
Report Studio searches for all members for the object selected in step 1. The results appear in a
hierarchical structure on the Search tab in the Insertable Objects pane. You can browse the
hierarchy to explore members at lower levels.
Tip: You can insert members directly into a report. This can save you time, because you do not
have to define a filter. For example, instead of inserting Product line from the Source tab and adding
a filter for Camping Equipment, you can insert Camping Equipment from the Search tab.
Extended Data ItemsNote: Extended data items do not apply to relational packages or non-dimensionally modeled
packages.
Extended data items differ from the traditional, expression-based text strings by enabling you to
do the following:
● Add an extended data item's child members
You can double-click an extended data item to insert its child members beside it in the report
object.
● View an extended data item's details
You can select an extended data item and see where the data item appears in the package in
the Properties pane under Data Item.
● Select member sets
194 Report Studio
Chapter 9: Dimensional Reporting Style
You can select a member in a set to highlight it as the primary selection and the other members
as secondary selections.
● Sort sets
You can select an extended data item, click the sort button , and click Advanced Set Sortingto sort a set in ascending or descending order, to sort hierarchically, and to sort by caption, by
a property, or by an intersection (tuple).
● Apply contextual calculations
You can select an extended data item and then, from the Data menu, click Calculate to see a
contextual list of calculations that are available for this extended data item.
Extended data items are optional. If you use extended data items in a report, we recommend that
you use them for the entire report instead of mixing them with expression-based data items. For
information about turning on extended data items, see "Specify Report Properties" (p. 427).
Note: In Express Authoring mode, extended data items are always used. Therefore, if you are
authoring a report in Professional Authoring mode for report consumers who are working in Express
Authoring mode, you should use extended data items.
Tips for Working with Ragged or Unbalanced HierarchiesIn ragged or unbalanced hierarchies, some members that are not at the lowest level of the hierarchy
may have no descendants at one or more lower levels. Support for these hierarchy gaps in relational
data sources is limited. More complete support is provided for OLAP data sources, but some reports
may still result in unexpected behavior. For example, the following may occur:
● Groups corresponding to missing members may appear or disappear when grouped list reports
are pivoted to a crosstab. This happens with set expressions using the filter function, and detail
filters on members.
● Ragged and unbalanced sections of the hierarchy are suppressed when set expressions in that
hierarchy are used on an edge.
● When a crosstab is sectioned or is split into a master detail report, sections corresponding to
missing members become empty.
● Cells that were suppressed may still appear in the report output for reports with ragged or
unbalanced hierarchies.
Some of these behaviors may be corrected in a future release, while others may be codified as sup-
ported behavior. To avoid these behaviors, do not use levels from ragged or unbalanced hierarchies.
Instead of using levels, use the descendants, children, or ancestors.
We consider the following scenarios to be safe:
● One or more nested level references on an edge with no modifying expression.
● A hierarchy reference on only one level of one edge.
● One or more explicit members or sets of explicit members as siblings on only one level of one
edge.
Professional Authoring User Guide 195
Chapter 9: Dimensional Reporting Style
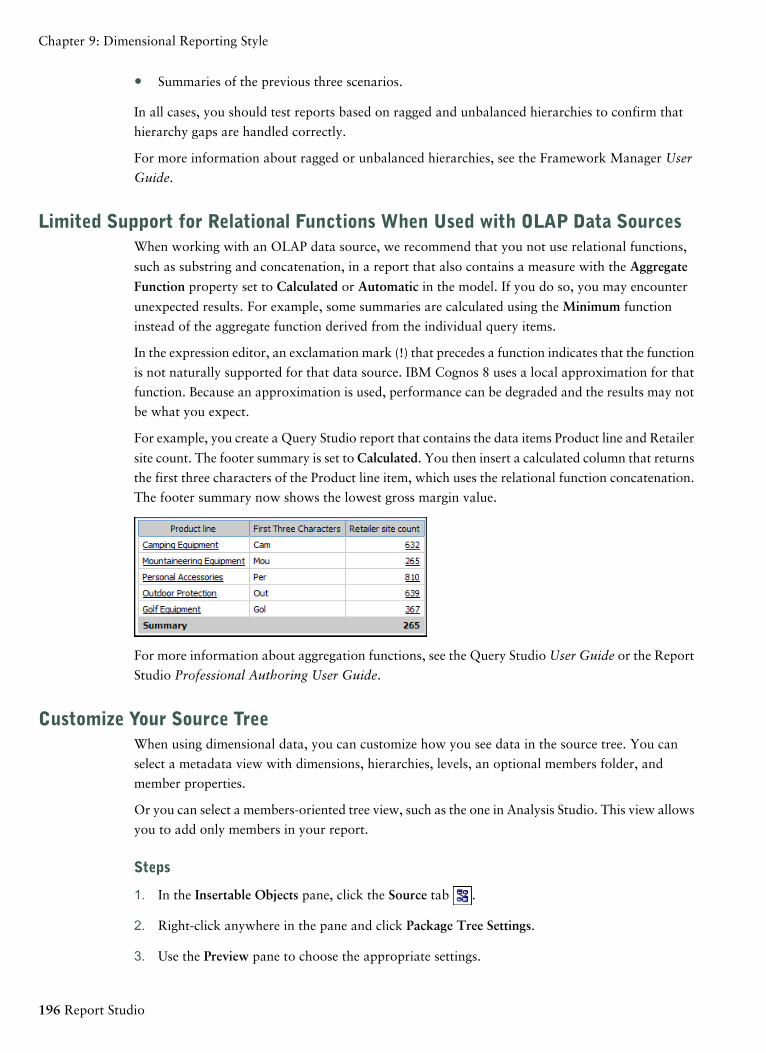
● Summaries of the previous three scenarios.
In all cases, you should test reports based on ragged and unbalanced hierarchies to confirm that
hierarchy gaps are handled correctly.
For more information about ragged or unbalanced hierarchies, see the Framework Manager User
Guide.
Limited Support for Relational Functions When Used with OLAP Data SourcesWhen working with an OLAP data source, we recommend that you not use relational functions,
such as substring and concatenation, in a report that also contains a measure with the Aggregate
Function property set to Calculated or Automatic in the model. If you do so, you may encounter
unexpected results. For example, some summaries are calculated using the Minimum function
instead of the aggregate function derived from the individual query items.
In the expression editor, an exclamation mark (!) that precedes a function indicates that the function
is not naturally supported for that data source. IBM Cognos 8 uses a local approximation for that
function. Because an approximation is used, performance can be degraded and the results may not
be what you expect.
For example, you create a Query Studio report that contains the data items Product line and Retailer
site count. The footer summary is set to Calculated. You then insert a calculated column that returns
the first three characters of the Product line item, which uses the relational function concatenation.
The footer summary now shows the lowest gross margin value.
For more information about aggregation functions, see the Query Studio User Guide or the Report
Studio Professional Authoring User Guide.
Customize Your Source TreeWhen using dimensional data, you can customize how you see data in the source tree. You can
select a metadata view with dimensions, hierarchies, levels, an optional members folder, and
member properties.
Or you can select a members-oriented tree view, such as the one in Analysis Studio. This view allows
you to add only members in your report.
Steps
1. In the Insertable Objects pane, click the Source tab .
2. Right-click anywhere in the pane and click Package Tree Settings.
3. Use the Preview pane to choose the appropriate settings.
196 Report Studio
Chapter 9: Dimensional Reporting Style
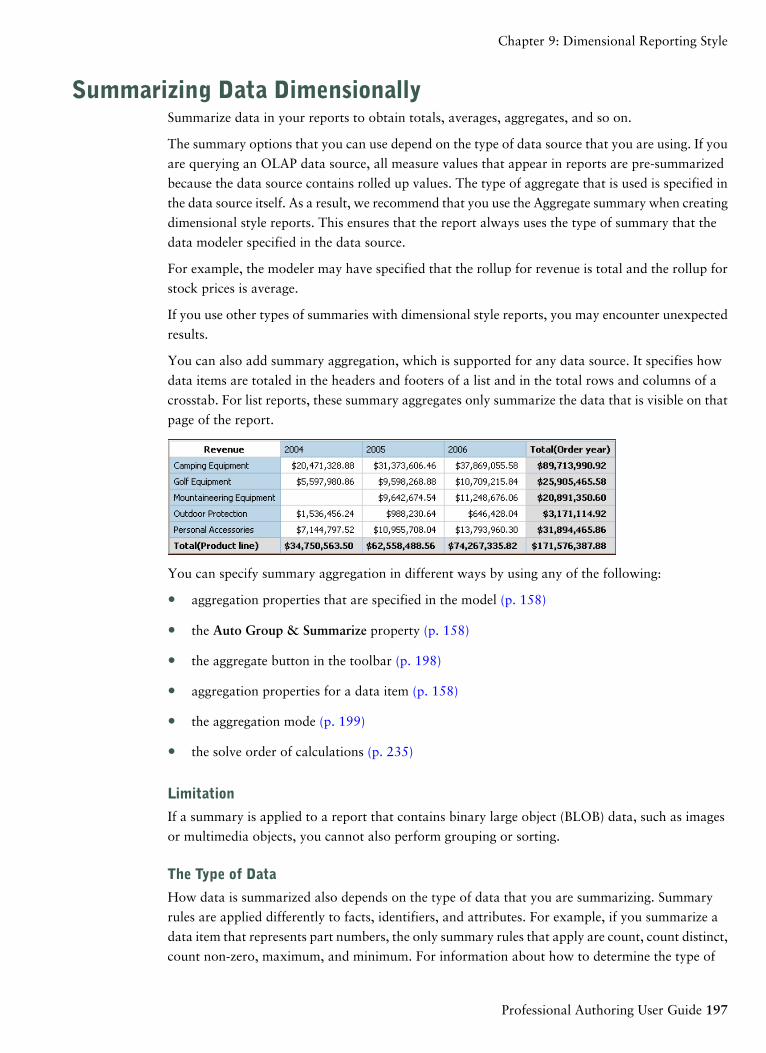
Summarizing Data DimensionallySummarize data in your reports to obtain totals, averages, aggregates, and so on.
The summary options that you can use depend on the type of data source that you are using. If you
are querying an OLAP data source, all measure values that appear in reports are pre-summarized
because the data source contains rolled up values. The type of aggregate that is used is specified in
the data source itself. As a result, we recommend that you use the Aggregate summary when creating
dimensional style reports. This ensures that the report always uses the type of summary that the
data modeler specified in the data source.
For example, the modeler may have specified that the rollup for revenue is total and the rollup for
stock prices is average.
If you use other types of summaries with dimensional style reports, you may encounter unexpected
results.
You can also add summary aggregation, which is supported for any data source. It specifies how
data items are totaled in the headers and footers of a list and in the total rows and columns of a
crosstab. For list reports, these summary aggregates only summarize the data that is visible on that
page of the report.
You can specify summary aggregation in different ways by using any of the following:
● aggregation properties that are specified in the model (p. 158)
● the Auto Group & Summarize property (p. 158)
● the aggregate button in the toolbar (p. 198)
● aggregation properties for a data item (p. 158)
● the aggregation mode (p. 199)
● the solve order of calculations (p. 235)
Limitation
If a summary is applied to a report that contains binary large object (BLOB) data, such as images
or multimedia objects, you cannot also perform grouping or sorting.
The Type of Data
How data is summarized also depends on the type of data that you are summarizing. Summary
rules are applied differently to facts, identifiers, and attributes. For example, if you summarize a
data item that represents part numbers, the only summary rules that apply are count, count distinct,
count non-zero, maximum, and minimum. For information about how to determine the type of
Professional Authoring User Guide 197
Chapter 9: Dimensional Reporting Style
data that a data item represents, see "Add Relational Data to a Report" (p. 149) and "Add Dimen-
sional Data to a Report" (p. 189).
Limitations on Measure Rollups
For all OLAP data sources except PowerCube and Microsoft SQL Server 2005 Analysis Services
(SSAS), aggregation and re-aggregation are supported only for calculations and measures that use
the following rollups: Sum (Total), Maximum, Minimum, First, Last, and Count.
All other types of rollup either fail or return error cells, which typically appear as two dash characters
(--).
This problem occurs in, but is not limited to, the following:
● footers
● aggregate function
● context filters that select more than one member of a hierarchy that is used elsewhere on the
report
Summarizing Sets
When working with Microsoft SQL Server Analysis Services (SSAS) data sources, We recommend
that you not summarize values for sets which contain members that are descendants of other
members in the same set. If you do so, SSAS double-counts values for automatic summaries and all
data sources double-counts values for explicit summaries.
Add a Simple SummaryYou can add simple summaries in a report by using the aggregate button. This button provides a
subset of the summary functions available in Report Studio.
The aggregate button sets the rollup aggregate property (p. 158) for the data item to the selected
summary aggregate, and places the data item into an appropriate footer. A footer is created for
each set, hierarchy, or level.
For information about adding a rolling or moving average, see "Rolling and Moving Aver-
ages" (p. 416).
Steps
1. Click the item to which to add a summary.
2. Click the aggregate button and click a summary type (p. 203).
3. To change the summary label, do the following:
● Click the label.
● In the Properties pane, under Text Source, set the Source Type property to the source type
to define the label.
For example, set it as Data Item Value to produce a dynamic label for the summary based
on data item values.
198 Report Studio
Chapter 9: Dimensional Reporting Style
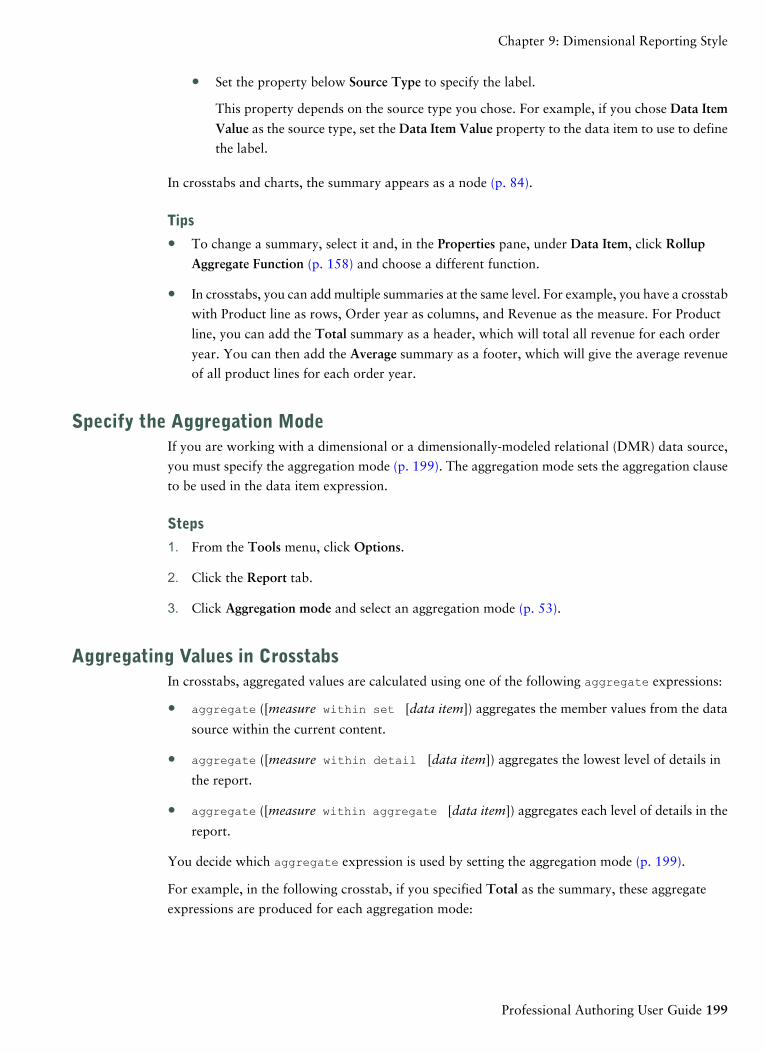
● Set the property below Source Type to specify the label.
This property depends on the source type you chose. For example, if you chose Data Item
Value as the source type, set the Data Item Value property to the data item to use to define
the label.
In crosstabs and charts, the summary appears as a node (p. 84).
Tips
● To change a summary, select it and, in the Properties pane, under Data Item, click Rollup
Aggregate Function (p. 158) and choose a different function.
● In crosstabs, you can add multiple summaries at the same level. For example, you have a crosstab
with Product line as rows, Order year as columns, and Revenue as the measure. For Product
line, you can add the Total summary as a header, which will total all revenue for each order
year. You can then add the Average summary as a footer, which will give the average revenue
of all product lines for each order year.
Specify the Aggregation ModeIf you are working with a dimensional or a dimensionally-modeled relational (DMR) data source,
you must specify the aggregation mode (p. 199). The aggregation mode sets the aggregation clause
to be used in the data item expression.
Steps
1. From the Tools menu, click Options.
2. Click the Report tab.
3. Click Aggregation mode and select an aggregation mode (p. 53).
Aggregating Values in CrosstabsIn crosstabs, aggregated values are calculated using one of the following aggregate expressions:
● aggregate ([measure within set [data item]) aggregates the member values from the data
source within the current content.
● aggregate ([measure within detail [data item]) aggregates the lowest level of details in
the report.
● aggregate ([measure within aggregate [data item]) aggregates each level of details in the
report.
You decide which aggregate expression is used by setting the aggregation mode (p. 199).
For example, in the following crosstab, if you specified Total as the summary, these aggregate
expressions are produced for each aggregation mode:
Professional Authoring User Guide 199
Chapter 9: Dimensional Reporting Style
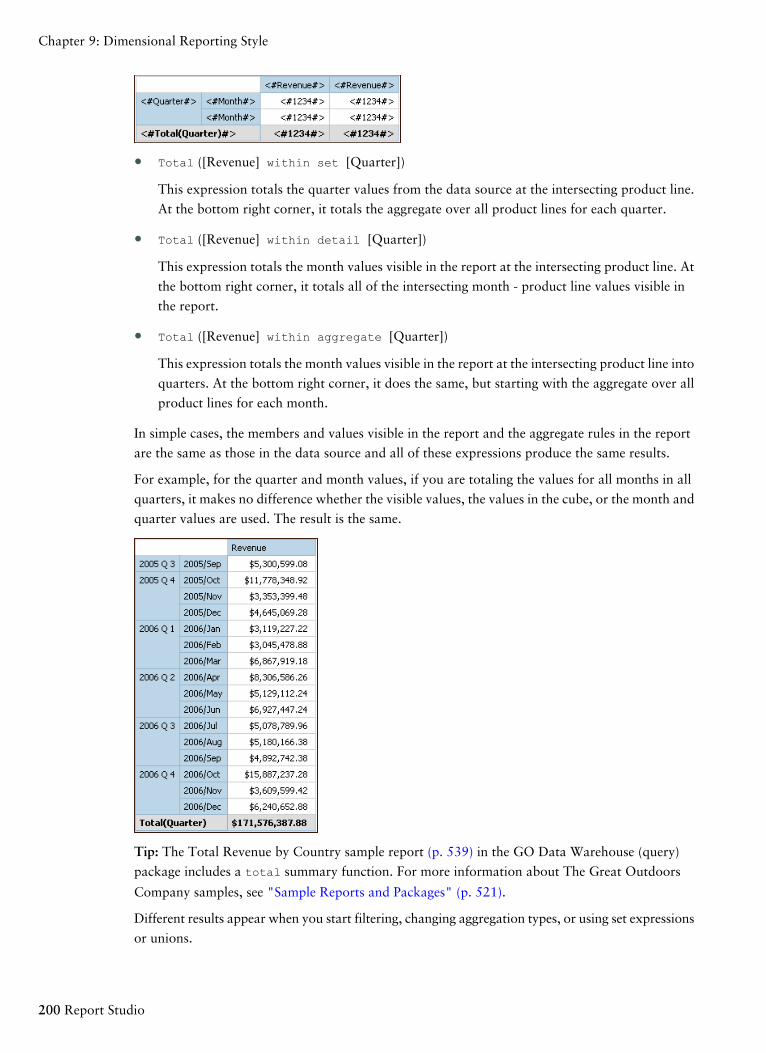
● Total ([Revenue] within set [Quarter])
This expression totals the quarter values from the data source at the intersecting product line.
At the bottom right corner, it totals the aggregate over all product lines for each quarter.
● Total ([Revenue] within detail [Quarter])
This expression totals the month values visible in the report at the intersecting product line. At
the bottom right corner, it totals all of the intersecting month - product line values visible in
the report.
● Total ([Revenue] within aggregate [Quarter])
This expression totals the month values visible in the report at the intersecting product line into
quarters. At the bottom right corner, it does the same, but starting with the aggregate over all
product lines for each month.
In simple cases, the members and values visible in the report and the aggregate rules in the report
are the same as those in the data source and all of these expressions produce the same results.
For example, for the quarter and month values, if you are totaling the values for all months in all
quarters, it makes no difference whether the visible values, the values in the cube, or the month and
quarter values are used. The result is the same.
Tip: The Total Revenue by Country sample report (p. 539) in the GO Data Warehouse (query)
package includes a total summary function. For more information about The Great Outdoors
Company samples, see "Sample Reports and Packages" (p. 521).
Different results appear when you start filtering, changing aggregation types, or using set expressions
or unions.
200 Report Studio
Chapter 9: Dimensional Reporting Style
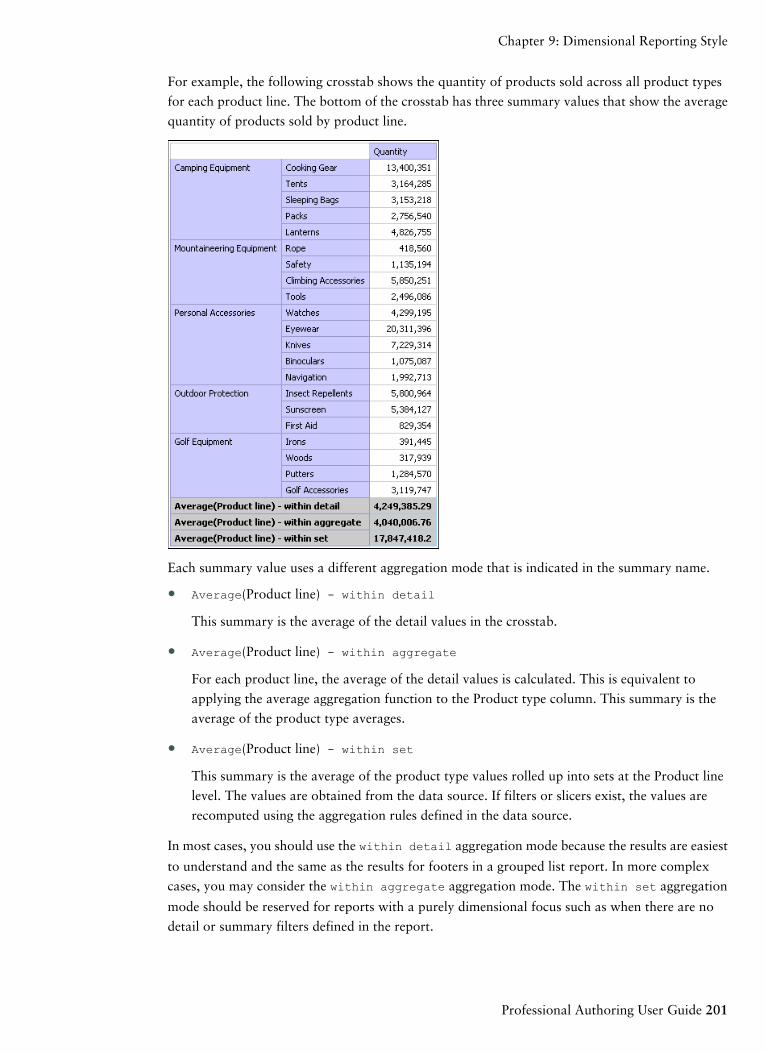
For example, the following crosstab shows the quantity of products sold across all product types
for each product line. The bottom of the crosstab has three summary values that show the average
quantity of products sold by product line.
Each summary value uses a different aggregation mode that is indicated in the summary name.
● Average(Product line) - within detail
This summary is the average of the detail values in the crosstab.
● Average(Product line) - within aggregate
For each product line, the average of the detail values is calculated. This is equivalent to
applying the average aggregation function to the Product type column. This summary is the
average of the product type averages.
● Average(Product line) - within set
This summary is the average of the product type values rolled up into sets at the Product line
level. The values are obtained from the data source. If filters or slicers exist, the values are
recomputed using the aggregation rules defined in the data source.
In most cases, you should use the within detail aggregation mode because the results are easiest
to understand and the same as the results for footers in a grouped list report. In more complex
cases, you may consider the within aggregate aggregation mode. The within set aggregation
mode should be reserved for reports with a purely dimensional focus such as when there are no
detail or summary filters defined in the report.
Professional Authoring User Guide 201
Chapter 9: Dimensional Reporting Style
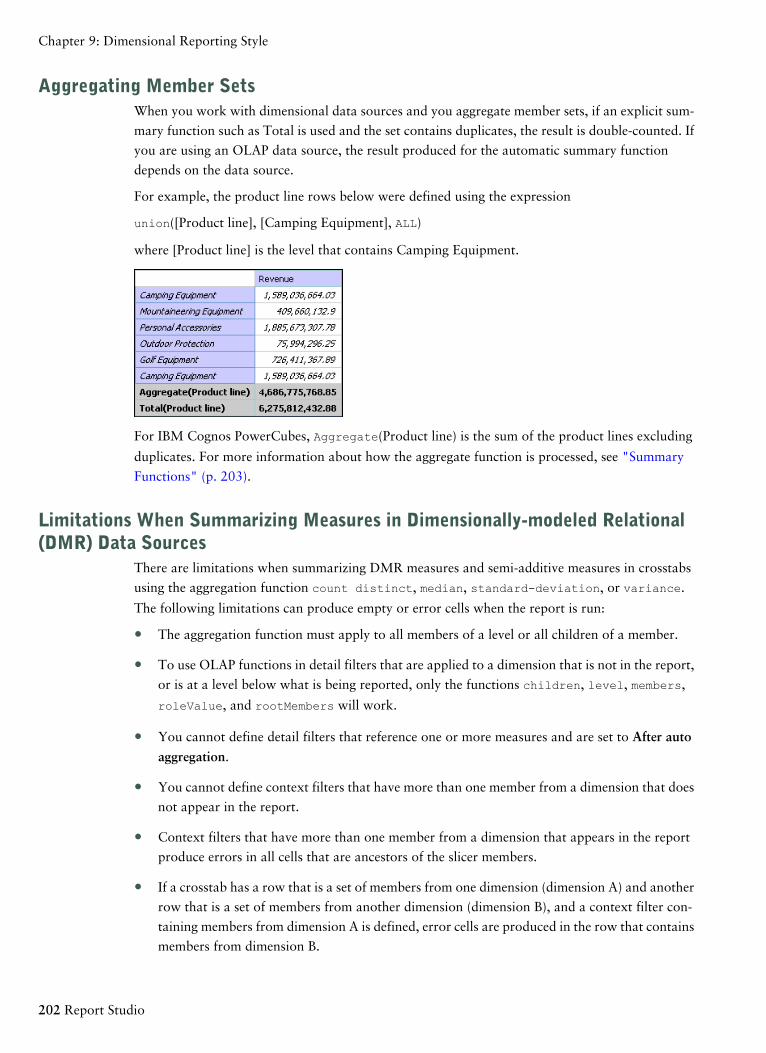
Aggregating Member SetsWhen you work with dimensional data sources and you aggregate member sets, if an explicit sum-
mary function such as Total is used and the set contains duplicates, the result is double-counted. If
you are using an OLAP data source, the result produced for the automatic summary function
depends on the data source.
For example, the product line rows below were defined using the expression
union([Product line], [Camping Equipment], ALL)
where [Product line] is the level that contains Camping Equipment.
For IBM Cognos PowerCubes, Aggregate(Product line) is the sum of the product lines excluding
duplicates. For more information about how the aggregate function is processed, see "Summary
Functions" (p. 203).
Limitations When Summarizing Measures in Dimensionally-modeled Relational(DMR) Data Sources
There are limitations when summarizing DMR measures and semi-additive measures in crosstabs
using the aggregation function count distinct, median, standard-deviation, or variance.
The following limitations can produce empty or error cells when the report is run:
● The aggregation function must apply to all members of a level or all children of a member.
● To use OLAP functions in detail filters that are applied to a dimension that is not in the report,
or is at a level below what is being reported, only the functions children, level, members,
roleValue, and rootMembers will work.
● You cannot define detail filters that reference one or more measures and are set to After auto
aggregation.
● You cannot define context filters that have more than one member from a dimension that does
not appear in the report.
● Context filters that have more than one member from a dimension that appears in the report
produce errors in all cells that are ancestors of the slicer members.
● If a crosstab has a row that is a set of members from one dimension (dimension A) and another
row that is a set of members from another dimension (dimension B), and a context filter con-
taining members from dimension A is defined, error cells are produced in the row that contains
members from dimension B.
202 Report Studio
Chapter 9: Dimensional Reporting Style
● If a context filter contains members from a dimension, and a crosstab has a row that is a set
of members from a higher level than the slicer members, error cells are produced for that row.
● Error cells are produced when drilling down on a crosstab that has two nested levels.
If you do not consider these limitations in a calculation, the report may return inaccurate results.
If there is a non-measure calculation that returns a constant or contains a summary function, and
the calculation has a lower solve order than the measure being aggregated, error cells are returned
for the aggregated measure.
In list reports, error cells are produced as a result of these limitations if the list uses an OLAP
function other than children, filter, level, members, roleValue, and rootMembers.
Summary FunctionsThis section describes the summary functions that are available in Report Studio. Some functions,
such as Custom, are available only when you click the aggregate button on the toolbar. Addi-
tional summary functions are available in the Expression Editor (p. 245).
Aggregate
In lists, sets the summary function to Automatic. In crosstabs, sets the Rollup Aggregate Function
to Automatic. The Aggregate function (p. 273) uses the summary rules for Automatic.
Automatic
Depending on the type of data item, applies the function None, Summarize, or Calculated based
on the context in which the data item appears.
Calculated is applied if the underlying data source is OLAP. It is also applied if the data item
expression
● contains a summary function
● is an if-then-else or case expression that contains a reference to at least a modeled measure
in its condition
● contains a reference to a model calculation or to a measure that has the Regular Aggregate
property set to a value other than Unsupported
● contains a reference to at least one data item that has the Rollup Aggregate Function property
set to a value other than None
If the underlying data source is relational and if the data item expression contains no summary
functions and a reference to at least one fact that has the Regular Aggregate property set to a value
other than Unsupported, Summarize is applied.
If the underlying data source is OLAP and if the data item expression contains no summary functions
and a reference to at least one fact that has the Regular Aggregate property set to a value other
than Unsupported, Calculated is applied.
If the underlying data source is SAP BW, reports containing aggregations and summaries run more
efficiently if the aggregation applied to a query item matches the aggregation rule for the underlying
Professional Authoring User Guide 203
Chapter 9: Dimensional Reporting Style
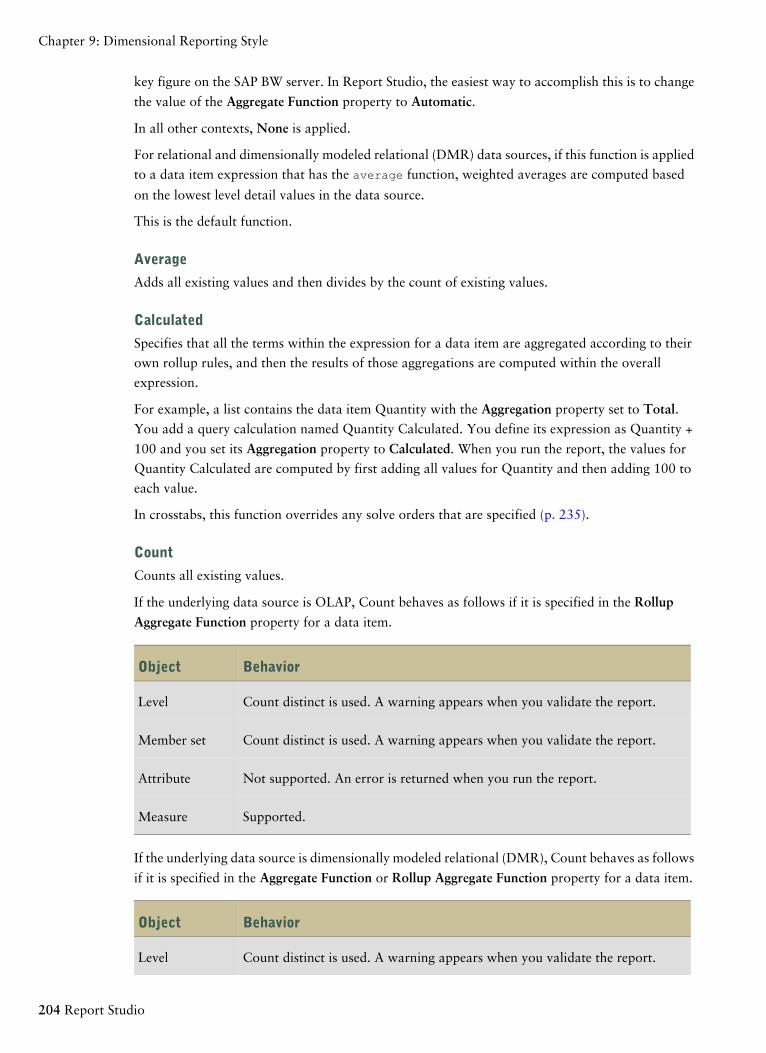
key figure on the SAP BW server. In Report Studio, the easiest way to accomplish this is to change
the value of the Aggregate Function property to Automatic.
In all other contexts, None is applied.
For relational and dimensionally modeled relational (DMR) data sources, if this function is applied
to a data item expression that has the average function, weighted averages are computed based
on the lowest level detail values in the data source.
This is the default function.
Average
Adds all existing values and then divides by the count of existing values.
Calculated
Specifies that all the terms within the expression for a data item are aggregated according to their
own rollup rules, and then the results of those aggregations are computed within the overall
expression.
For example, a list contains the data item Quantity with the Aggregation property set to Total.You add a query calculation named Quantity Calculated. You define its expression as Quantity +
100 and you set its Aggregation property to Calculated. When you run the report, the values for
Quantity Calculated are computed by first adding all values for Quantity and then adding 100 to
each value.
In crosstabs, this function overrides any solve orders that are specified (p. 235).
Count
Counts all existing values.
If the underlying data source is OLAP, Count behaves as follows if it is specified in the Rollup
Aggregate Function property for a data item.
BehaviorObject
Count distinct is used. A warning appears when you validate the report.Level
Count distinct is used. A warning appears when you validate the report.Member set
Not supported. An error is returned when you run the report.Attribute
Supported.Measure
If the underlying data source is dimensionally modeled relational (DMR), Count behaves as follows
if it is specified in the Aggregate Function or Rollup Aggregate Function property for a data item.
BehaviorObject
Count distinct is used. A warning appears when you validate the report.Level
204 Report Studio
Chapter 9: Dimensional Reporting Style
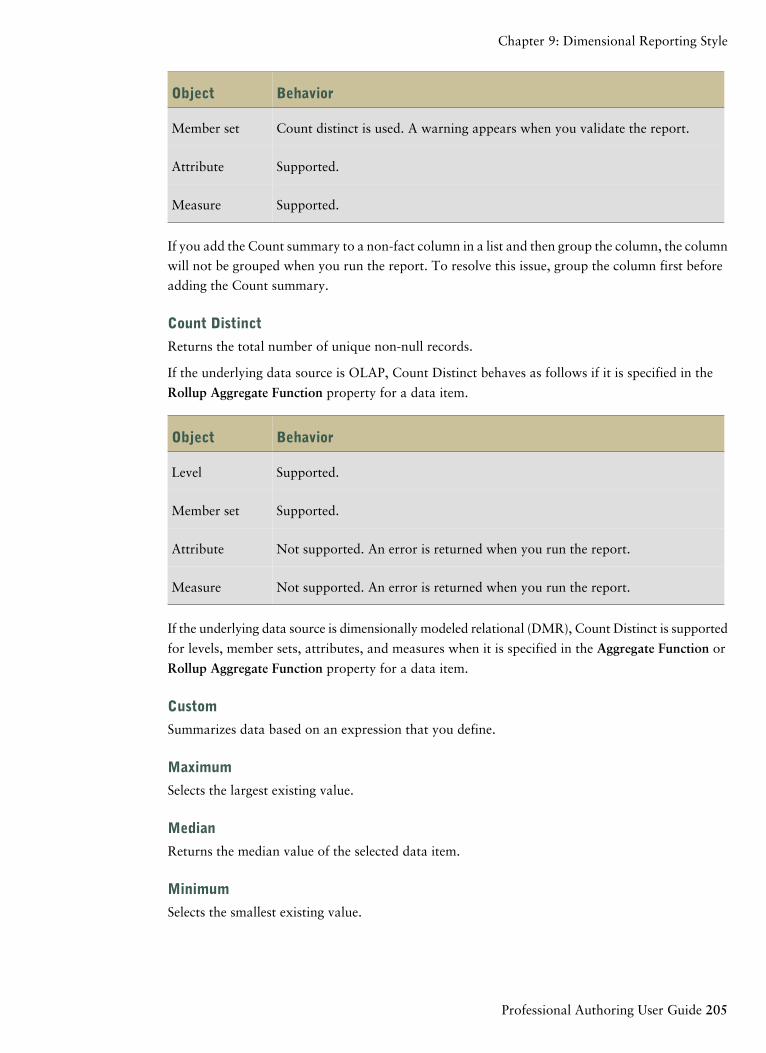
BehaviorObject
Count distinct is used. A warning appears when you validate the report.Member set
Supported.Attribute
Supported.Measure
If you add the Count summary to a non-fact column in a list and then group the column, the column
will not be grouped when you run the report. To resolve this issue, group the column first before
adding the Count summary.
Count Distinct
Returns the total number of unique non-null records.
If the underlying data source is OLAP, Count Distinct behaves as follows if it is specified in the
Rollup Aggregate Function property for a data item.
BehaviorObject
Supported.Level
Supported.Member set
Not supported. An error is returned when you run the report.Attribute
Not supported. An error is returned when you run the report.Measure
If the underlying data source is dimensionally modeled relational (DMR), Count Distinct is supported
for levels, member sets, attributes, and measures when it is specified in the Aggregate Function or
Rollup Aggregate Function property for a data item.
Custom
Summarizes data based on an expression that you define.
Maximum
Selects the largest existing value.
Median
Returns the median value of the selected data item.
Minimum
Selects the smallest existing value.
Professional Authoring User Guide 205
Chapter 9: Dimensional Reporting Style
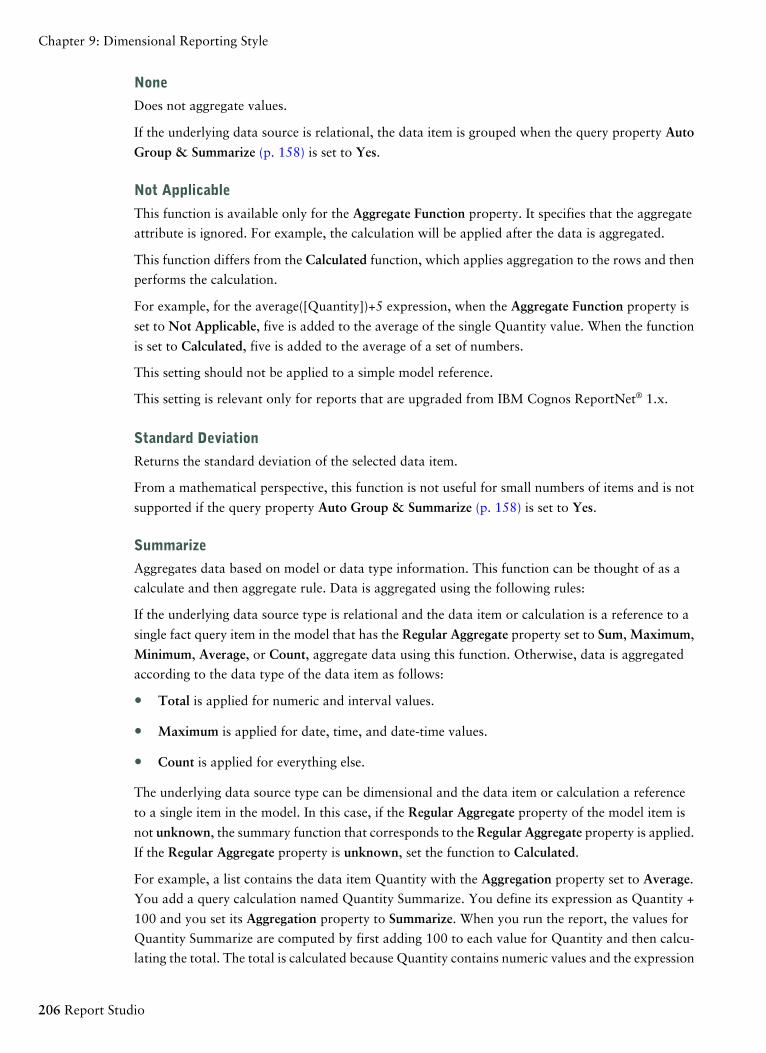
None
Does not aggregate values.
If the underlying data source is relational, the data item is grouped when the query property Auto
Group & Summarize (p. 158) is set to Yes.
Not Applicable
This function is available only for the Aggregate Function property. It specifies that the aggregate
attribute is ignored. For example, the calculation will be applied after the data is aggregated.
This function differs from the Calculated function, which applies aggregation to the rows and then
performs the calculation.
For example, for the average([Quantity])+5 expression, when the Aggregate Function property is
set to Not Applicable, five is added to the average of the single Quantity value. When the function
is set to Calculated, five is added to the average of a set of numbers.
This setting should not be applied to a simple model reference.
This setting is relevant only for reports that are upgraded from IBM Cognos ReportNet® 1.x.
Standard Deviation
Returns the standard deviation of the selected data item.
From a mathematical perspective, this function is not useful for small numbers of items and is not
supported if the query property Auto Group & Summarize (p. 158) is set to Yes.
Summarize
Aggregates data based on model or data type information. This function can be thought of as a
calculate and then aggregate rule. Data is aggregated using the following rules:
If the underlying data source type is relational and the data item or calculation is a reference to a
single fact query item in the model that has the Regular Aggregate property set to Sum, Maximum,
Minimum, Average, or Count, aggregate data using this function. Otherwise, data is aggregated
according to the data type of the data item as follows:
● Total is applied for numeric and interval values.
● Maximum is applied for date, time, and date-time values.
● Count is applied for everything else.
The underlying data source type can be dimensional and the data item or calculation a reference
to a single item in the model. In this case, if the Regular Aggregate property of the model item is
not unknown, the summary function that corresponds to the Regular Aggregate property is applied.
If the Regular Aggregate property is unknown, set the function to Calculated.
For example, a list contains the data item Quantity with the Aggregation property set to Average.You add a query calculation named Quantity Summarize. You define its expression as Quantity +
100 and you set its Aggregation property to Summarize. When you run the report, the values for
Quantity Summarize are computed by first adding 100 to each value for Quantity and then calcu-
lating the total. The total is calculated because Quantity contains numeric values and the expression
206 Report Studio
Chapter 9: Dimensional Reporting Style
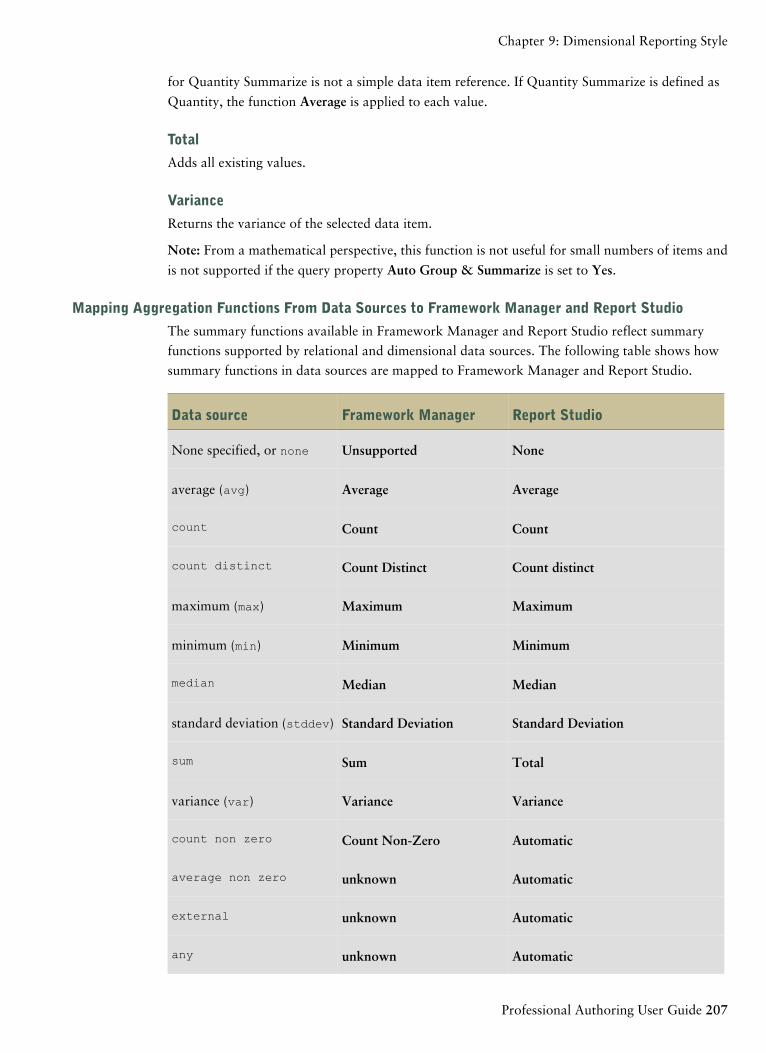
for Quantity Summarize is not a simple data item reference. If Quantity Summarize is defined as
Quantity, the function Average is applied to each value.
Total
Adds all existing values.
Variance
Returns the variance of the selected data item.
Note: From a mathematical perspective, this function is not useful for small numbers of items and
is not supported if the query property Auto Group & Summarize is set to Yes.
Mapping Aggregation Functions From Data Sources to Framework Manager and Report Studio
The summary functions available in Framework Manager and Report Studio reflect summary
functions supported by relational and dimensional data sources. The following table shows how
summary functions in data sources are mapped to Framework Manager and Report Studio.
Report StudioFramework ManagerData source
NoneUnsupportedNone specified, or none
AverageAverageaverage (avg)
CountCountcount
Count distinctCount Distinctcount distinct
MaximumMaximummaximum (max)
MinimumMinimumminimum (min)
MedianMedianmedian
Standard DeviationStandard Deviationstandard deviation (stddev)
TotalSumsum
VarianceVariancevariance (var)
AutomaticCount Non-Zerocount non zero
Automaticunknownaverage non zero
Automaticunknownexternal
Automaticunknownany
Professional Authoring User Guide 207
Chapter 9: Dimensional Reporting Style
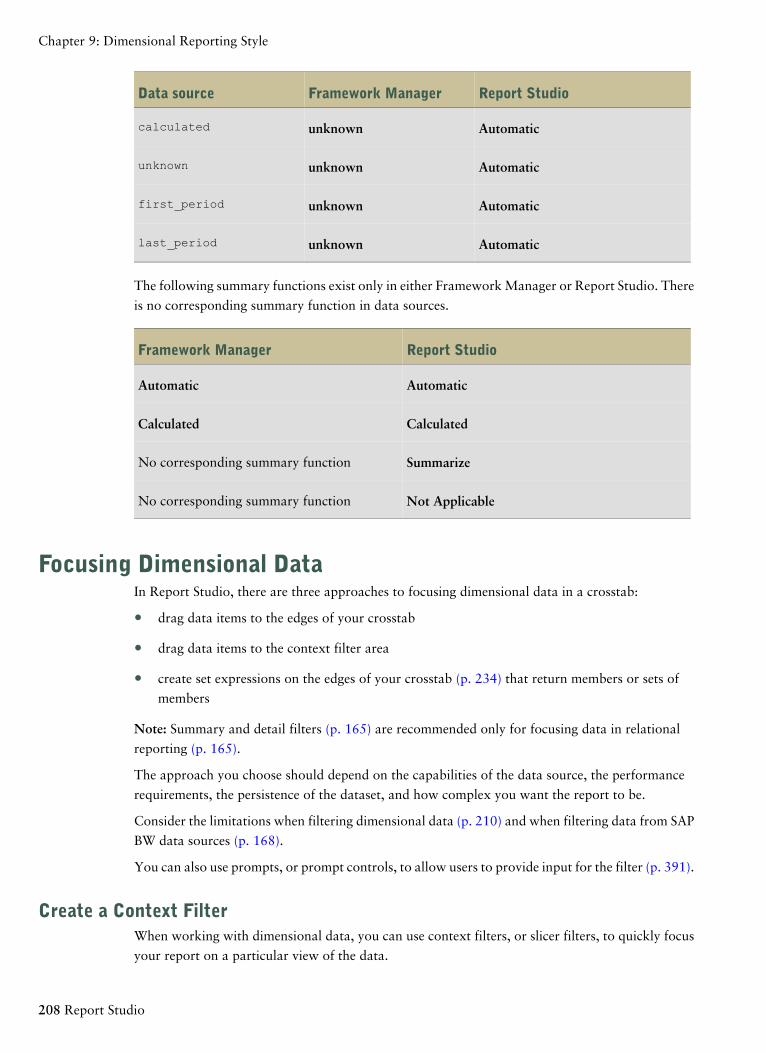
Report StudioFramework ManagerData source
Automaticunknowncalculated
Automaticunknownunknown
Automaticunknownfirst_period
Automaticunknownlast_period
The following summary functions exist only in either Framework Manager or Report Studio. There
is no corresponding summary function in data sources.
Report StudioFramework Manager
AutomaticAutomatic
CalculatedCalculated
SummarizeNo corresponding summary function
Not ApplicableNo corresponding summary function
Focusing Dimensional DataIn Report Studio, there are three approaches to focusing dimensional data in a crosstab:
● drag data items to the edges of your crosstab
● drag data items to the context filter area
● create set expressions on the edges of your crosstab (p. 234) that return members or sets of
members
Note: Summary and detail filters (p. 165) are recommended only for focusing data in relational
reporting (p. 165).
The approach you choose should depend on the capabilities of the data source, the performance
requirements, the persistence of the dataset, and how complex you want the report to be.
Consider the limitations when filtering dimensional data (p. 210) and when filtering data from SAP
BW data sources (p. 168).
You can also use prompts, or prompt controls, to allow users to provide input for the filter (p. 391).
Create a Context FilterWhen working with dimensional data, you can use context filters, or slicer filters, to quickly focus
your report on a particular view of the data.
208 Report Studio
Chapter 9: Dimensional Reporting Style
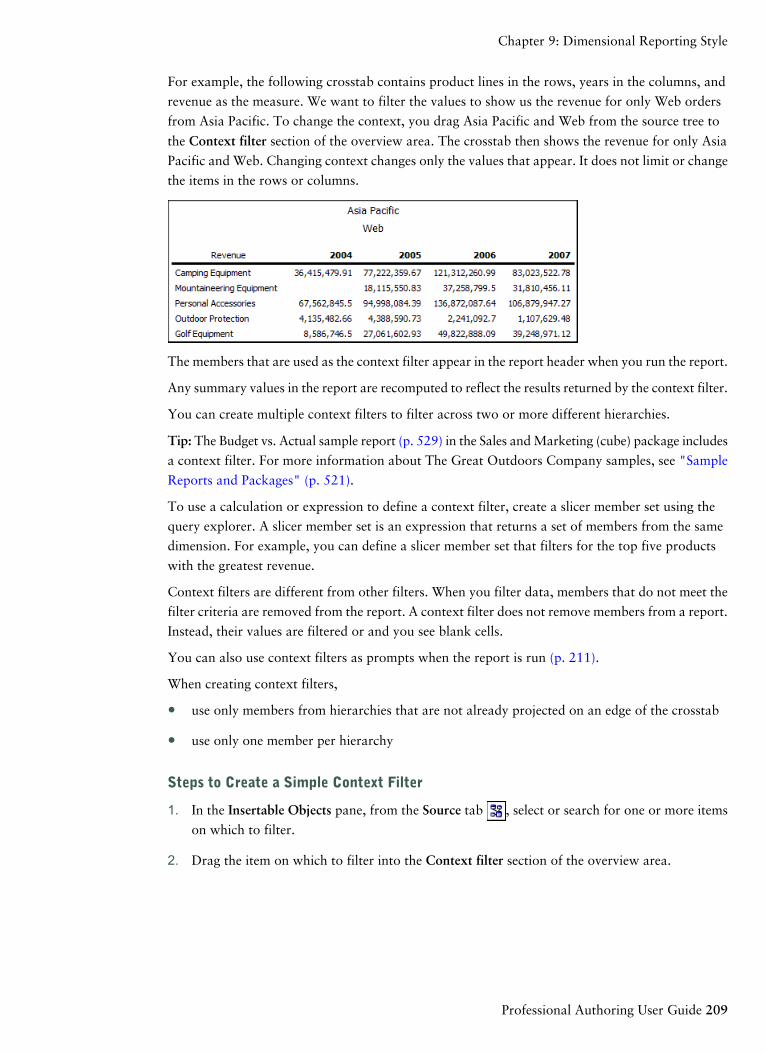
For example, the following crosstab contains product lines in the rows, years in the columns, and
revenue as the measure. We want to filter the values to show us the revenue for only Web orders
from Asia Pacific. To change the context, you drag Asia Pacific and Web from the source tree to
the Context filter section of the overview area. The crosstab then shows the revenue for only Asia
Pacific and Web. Changing context changes only the values that appear. It does not limit or change
the items in the rows or columns.
The members that are used as the context filter appear in the report header when you run the report.
Any summary values in the report are recomputed to reflect the results returned by the context filter.
You can create multiple context filters to filter across two or more different hierarchies.
Tip: The Budget vs. Actual sample report (p. 529) in the Sales and Marketing (cube) package includes
a context filter. For more information about The Great Outdoors Company samples, see "Sample
Reports and Packages" (p. 521).
To use a calculation or expression to define a context filter, create a slicer member set using the
query explorer. A slicer member set is an expression that returns a set of members from the same
dimension. For example, you can define a slicer member set that filters for the top five products
with the greatest revenue.
Context filters are different from other filters. When you filter data, members that do not meet the
filter criteria are removed from the report. A context filter does not remove members from a report.
Instead, their values are filtered or and you see blank cells.
You can also use context filters as prompts when the report is run (p. 211).
When creating context filters,
● use only members from hierarchies that are not already projected on an edge of the crosstab
● use only one member per hierarchy
Steps to Create a Simple Context Filter
1. In the Insertable Objects pane, from the Source tab , select or search for one or more items
on which to filter.
2. Drag the item on which to filter into the Context filter section of the overview area.
Professional Authoring User Guide 209
Chapter 9: Dimensional Reporting Style
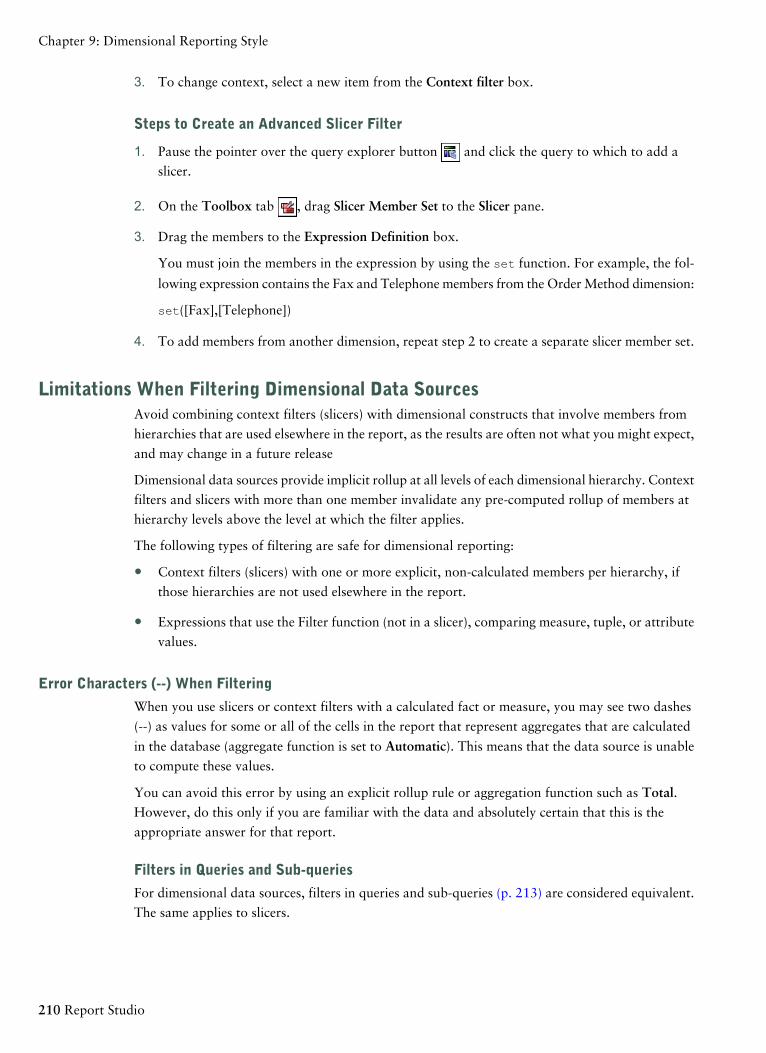
3. To change context, select a new item from the Context filter box.
Steps to Create an Advanced Slicer Filter
1. Pause the pointer over the query explorer button and click the query to which to add a
slicer.
2. On the Toolbox tab , drag Slicer Member Set to the Slicer pane.
3. Drag the members to the Expression Definition box.
You must join the members in the expression by using the set function. For example, the fol-
lowing expression contains the Fax and Telephone members from the Order Method dimension:
set([Fax],[Telephone])
4. To add members from another dimension, repeat step 2 to create a separate slicer member set.
Limitations When Filtering Dimensional Data SourcesAvoid combining context filters (slicers) with dimensional constructs that involve members from
hierarchies that are used elsewhere in the report, as the results are often not what you might expect,
and may change in a future release
Dimensional data sources provide implicit rollup at all levels of each dimensional hierarchy. Context
filters and slicers with more than one member invalidate any pre-computed rollup of members at
hierarchy levels above the level at which the filter applies.
The following types of filtering are safe for dimensional reporting:
● Context filters (slicers) with one or more explicit, non-calculated members per hierarchy, if
those hierarchies are not used elsewhere in the report.
● Expressions that use the Filter function (not in a slicer), comparing measure, tuple, or attribute
values.
Error Characters (--) When Filtering
When you use slicers or context filters with a calculated fact or measure, you may see two dashes
(--) as values for some or all of the cells in the report that represent aggregates that are calculated
in the database (aggregate function is set to Automatic). This means that the data source is unable
to compute these values.
You can avoid this error by using an explicit rollup rule or aggregation function such as Total.However, do this only if you are familiar with the data and absolutely certain that this is the
appropriate answer for that report.
Filters in Queries and Sub-queries
For dimensional data sources, filters in queries and sub-queries (p. 213) are considered equivalent.
The same applies to slicers.
210 Report Studio
Chapter 9: Dimensional Reporting Style
Define a Prompts Using a Context FilterIf context filters (or slicers) are defined, you can use these filters to create prompts in the report.
Prompts provide questions that help users to customize the information in a report to suit their
own needs. For example, you create a prompt so that users can select a region. Only data for the
specified region is retrieved and shown in the report.
Before you define a prompt, you must create context filters (p. 208).
Steps
1. In the Context filter section of the overview area, click the down arrow next to the filter to use
as a prompt.
2. Click Prompt and do one of the following:
● To remove the prompt, click No Prompt.
● To allow users who run the report to select any member from the hierarchy, click Prompt
on Hierarchy.
● To allow users who run the report to select from a list of members in the current level,
click Prompt on Level.
Sorting Dimensional DataYou can sort items to view them in your preferred order. By default, Report Studio retrieves items
in the order defined in the data source. OLAP data sources always have a defined order. Relational
and dimensionally-modeled relational data sources may not always have a defined order. The data
modeler defines the sorting options in the model. For more information about data modeling, see
the Framework Manager User Guide.
Tip: The Sales Growth Year Over Year sample report (p. 536) in the GO Data Warehouse (analysis)
package includes sorting. For more information about The Great Outdoors Company samples, see
"Sample Reports and Packages" (p. 521).
Set Sorting
You can sort sets of members based on their caption. By default, when you select Sort Set -
Ascending or Sort Set - Descending, sets are sorted only by their captions. You can also perform
advanced sorting (p. 213) to sort sets using an intersection (tuple) or a member property.
For example, a set contains regions and you sort the regions within the set in descending alphabetical
order. Only extended data items that represent sets support set sorting.
Before you can perform set sorting, you must create sets for the members in your report (p. 192).
You cannot sort data items from different dimensions that are intermixed. For example, if you have
years and products on the same edge and at the same level in your crosstab, you can sort the years,
and you can sort the product lines, but you cannot sort them as combined set because years and
products come from different dimensions.
Professional Authoring User Guide 211
Chapter 9: Dimensional Reporting Style
Sorting by Value
You can sort members in the sets on the opposite axis based on the value of a member or measure
that you select.
For example, a crosstab contains years inserted as individual members in the columns, product lines
inserted as a member set in the rows, and revenue as the measure. You select 2004, click the sort
opposite axis sets by value button , and sort in descending order. The values in the 2004 column
are sorted.
Before you can perform this sorting, you must create sets for the members in your report (p. 192).
In nested crosstabs, items are sorted based on the values of the innermost nested row or column of
the opposite axis. For example, a crosstab contains years in the columns and retailers nested within
product line in the rows. Select 2004, sort in descending order, and you see retailers listed from the
largest value to the smallest value for each product line.
Limitations When Sorting SAP BW Data
If you use a SAP BW data source, each level in a hierarchy has an item with the same name as the
level and a role of _businessKey. Such items are known as level identifiers. You should use only the
level identifier of all the time-related characteristics, such as 0CALDAY and 0CALMONTH, for
sorting. All other (attribute) items in these hierarchies are formatted string representations of the
characteristic values with which they are associated. These formatted values sort alphanumerically
and not chronologically.
Tip: By level identifier, we are referring to a query item with the same name as the level that has
the role of _businessKey. Each level in a SAP BW hierarchy has a level identifier.
Steps to Sort Sets by Caption
1. In a crosstab, select a set to sort.
2. Click the sort button and click Sort Set - Ascending or Sort Set - Descending.
Tip: To remove a sort order, click Don't Sort.
Steps to Sort Sets in the Opposite Axis by Value
1. In a crosstab, select a member or measure to sort.
For example, to sort a set in the row axis, select a member or measure in the column axis.
2. Click the sort opposite axis sets by value button .
Tip: To remove a sort order, click Don't Sort.
212 Report Studio
Chapter 9: Dimensional Reporting Style
Perform Advanced Set SortingIf you use dimensional data, you can sort using the property of a member. For example, your report
includes employee names and you want to sort the employees using the gender property. You can
also sort using an intersection of members, also known as a tuple. For example, you want to sort
the employees using the value of sick days taken for the year 2006 (p. 235).
Steps to Sort Sets of Dimensional Data
1. Select a set.
2. Click the sort button and click Advanced Set Sorting.
3. Specify the sorting options.
4. If you are sorting members from different levels and want to preserve the hierarchy, select the
Hierarchized sorting check box.
5. To sort items using a member property, under Sort by, double-click Property, navigate the tree,
and select the member property to use.
6. To sort items using an intersection of members, or a tuple, under Sort by, click Intersection
(tuple) and click the ellipsis (...) button. Then, from the Available members and measures box,
select the items to use and click the right arrow to move them to the Intersection members and
measures box. You can also select items from the Calculated Members and Measures tab.
Working with Dimensional QueriesQueries specify what data appears in the report. In Report Studio, you create and modify queries
using Query Explorer (p. 48). Query Explorer provides an alternative way to modify existing reports
or to author new reports. You can use Query Explorer to perform complex tasks and other tasks
that are more difficult to do in the report layout. For example, use Query Explorer to
● improve performance by changing the order in which items are queried from the database, or
by changing query properties to allow the report server to execute queries concurrently where
possible
Note: By default, queries run sequentially. Your administrator must enable the concurrent
query execution feature. For more information, see the Administration and Security Guide.
● view or add filters and parameters and modify their properties
● view or add dimensions, levels, and facts
● incorporate SQL statements that come from other reports or reports that you write
● create complex queries using set operations and joins
Specify a List of Data Items for an ObjectSpecify the list of data items for an object when you must reference a data item that is in a query
but is not in the layout. For example, you want to add a layout calculation to a list that uses a data
Professional Authoring User Guide 213
Chapter 9: Dimensional Reporting Style
item that is in the query definition. If the data item does not appear in the list, you must reference
it in order to make the layout calculation work.
You must also specify the list of data items if you apply conditional formatting (p. 431) that uses a
data item that is not in the query.
Steps
1. Click a layout object.
Tip: For a list of layout objects for which you can specify a list of properties, see the Propertiesproperty in "Report Studio Object and Property Reference" (p. 553).
2. In the Properties pane, double-click the Properties property and select data items.
Relate a Query to a LayoutQueries and layouts work together. After you decide the type of data that you need, you must create
a layout in which to show the results. Each column of data must be both selected for the query and
shown in a layout unless there are some columns that you don't want to show. The query and layout
portions of a report must be linked to produce a valid report.
Report Studio automatically links query and layout. For example, when you use Report Studio and
the list report layout, query and layout are automatically linked.
Steps to Manually Link a Query to a Data Container
1. Select a data container.
2. In the Properties pane, set the Query property to a query.
3. In the Insertable Objects pane, on the Data Items tab , drag data items from the query to
the data container.
Using Dimensional Data Sources with QueriesWhen you are working with SAP BW data sources, you can use only a single hierarchy in a query.
Creating queries using a mix of OLAP and relational data is not supported. If you create queries
using a database for which you do not know the type, consult your database administrator or
modeler.
When performing multi-cube queries using dimensional data sources, the following restrictions
apply:
● Only basic operators (+, *, /,-) are available for cross-cube calculations.
● Inner joins are not supported.
● All joins for multi-cube queries are outer joins.
● You cannot sort or filter on a conformed dimension (query subject).
● Conformed dimensions are created in Framework Manager.
214 Report Studio
Chapter 9: Dimensional Reporting Style
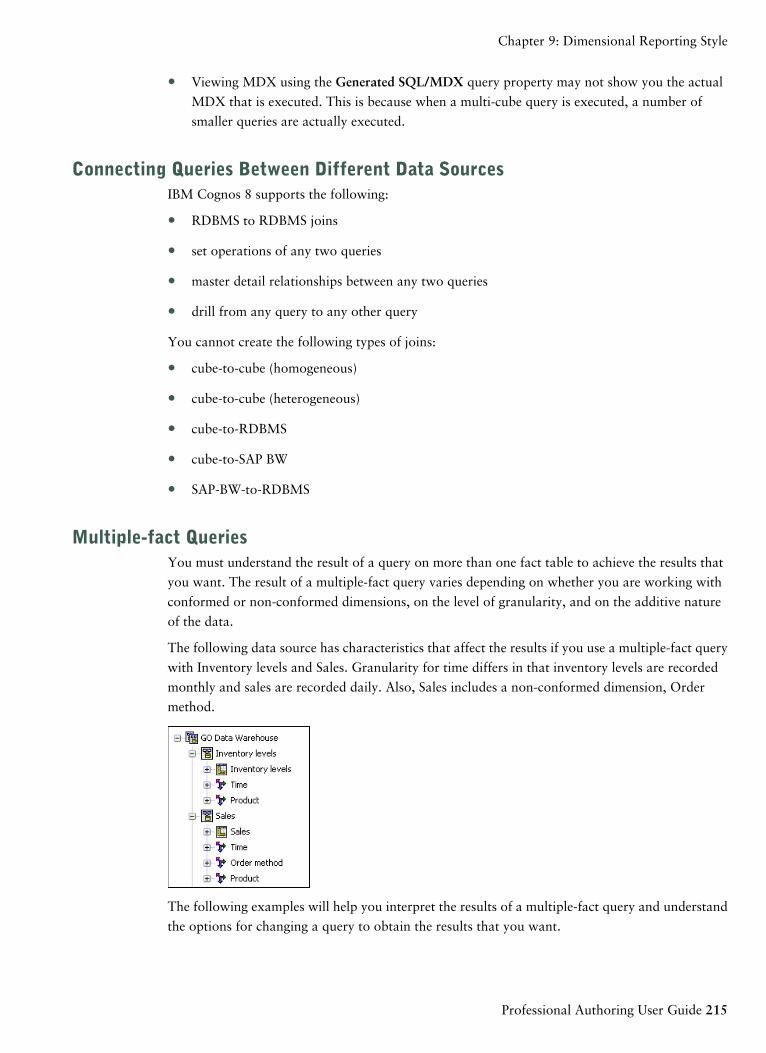
● Viewing MDX using the Generated SQL/MDX query property may not show you the actual
MDX that is executed. This is because when a multi-cube query is executed, a number of
smaller queries are actually executed.
Connecting Queries Between Different Data SourcesIBM Cognos 8 supports the following:
● RDBMS to RDBMS joins
● set operations of any two queries
● master detail relationships between any two queries
● drill from any query to any other query
You cannot create the following types of joins:
● cube-to-cube (homogeneous)
● cube-to-cube (heterogeneous)
● cube-to-RDBMS
● cube-to-SAP BW
● SAP-BW-to-RDBMS
Multiple-fact QueriesYou must understand the result of a query on more than one fact table to achieve the results that
you want. The result of a multiple-fact query varies depending on whether you are working with
conformed or non-conformed dimensions, on the level of granularity, and on the additive nature
of the data.
The following data source has characteristics that affect the results if you use a multiple-fact query
with Inventory levels and Sales. Granularity for time differs in that inventory levels are recorded
monthly and sales are recorded daily. Also, Sales includes a non-conformed dimension, Order
method.
The following examples will help you interpret the results of a multiple-fact query and understand
the options for changing a query to obtain the results that you want.
Professional Authoring User Guide 215
Chapter 9: Dimensional Reporting Style
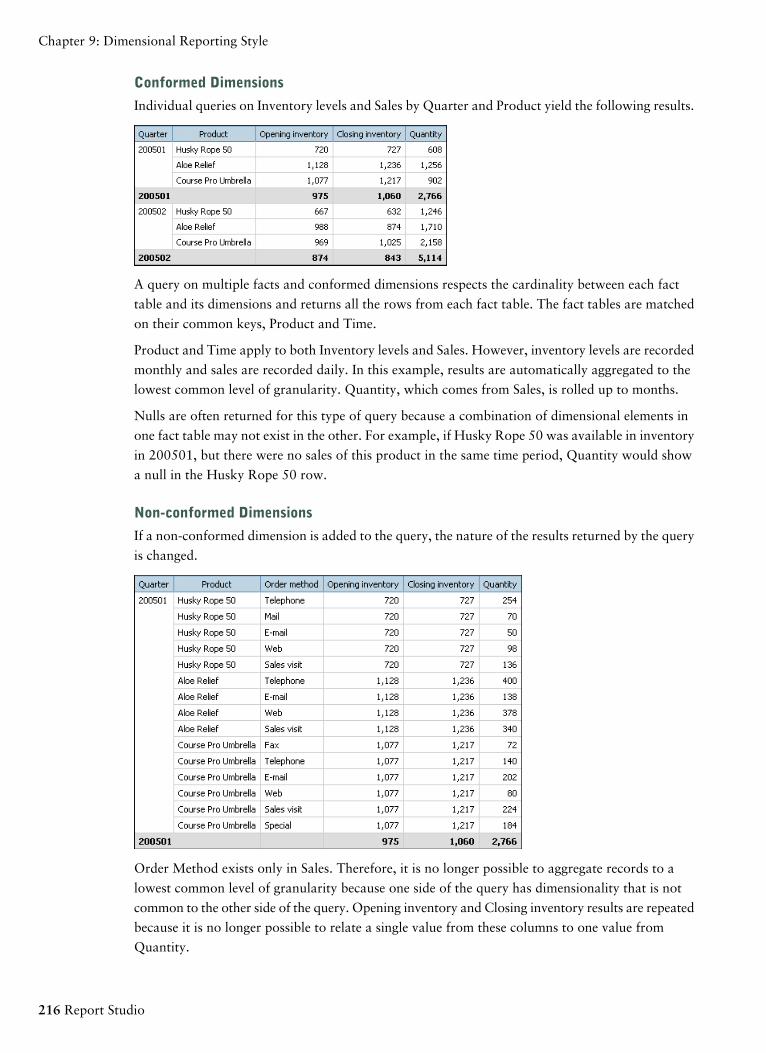
Conformed Dimensions
Individual queries on Inventory levels and Sales by Quarter and Product yield the following results.
A query on multiple facts and conformed dimensions respects the cardinality between each fact
table and its dimensions and returns all the rows from each fact table. The fact tables are matched
on their common keys, Product and Time.
Product and Time apply to both Inventory levels and Sales. However, inventory levels are recorded
monthly and sales are recorded daily. In this example, results are automatically aggregated to the
lowest common level of granularity. Quantity, which comes from Sales, is rolled up to months.
Nulls are often returned for this type of query because a combination of dimensional elements in
one fact table may not exist in the other. For example, if Husky Rope 50 was available in inventory
in 200501, but there were no sales of this product in the same time period, Quantity would show
a null in the Husky Rope 50 row.
Non-conformed Dimensions
If a non-conformed dimension is added to the query, the nature of the results returned by the query
is changed.
Order Method exists only in Sales. Therefore, it is no longer possible to aggregate records to a
lowest common level of granularity because one side of the query has dimensionality that is not
common to the other side of the query. Opening inventory and Closing inventory results are repeated
because it is no longer possible to relate a single value from these columns to one value from
Quantity.
216 Report Studio
Chapter 9: Dimensional Reporting Style
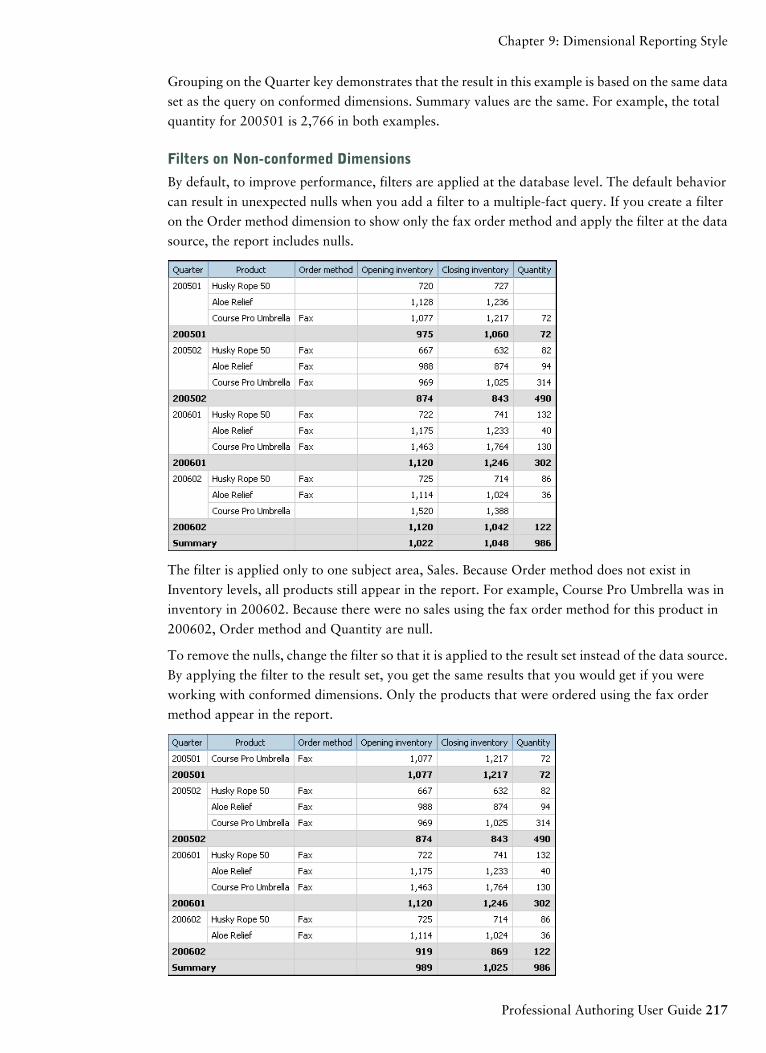
Grouping on the Quarter key demonstrates that the result in this example is based on the same data
set as the query on conformed dimensions. Summary values are the same. For example, the total
quantity for 200501 is 2,766 in both examples.
Filters on Non-conformed Dimensions
By default, to improve performance, filters are applied at the database level. The default behavior
can result in unexpected nulls when you add a filter to a multiple-fact query. If you create a filter
on the Order method dimension to show only the fax order method and apply the filter at the data
source, the report includes nulls.
The filter is applied only to one subject area, Sales. Because Order method does not exist in
Inventory levels, all products still appear in the report. For example, Course Pro Umbrella was in
inventory in 200602. Because there were no sales using the fax order method for this product in
200602, Order method and Quantity are null.
To remove the nulls, change the filter so that it is applied to the result set instead of the data source.
By applying the filter to the result set, you get the same results that you would get if you were
working with conformed dimensions. Only the products that were ordered using the fax order
method appear in the report.
Professional Authoring User Guide 217
Chapter 9: Dimensional Reporting Style
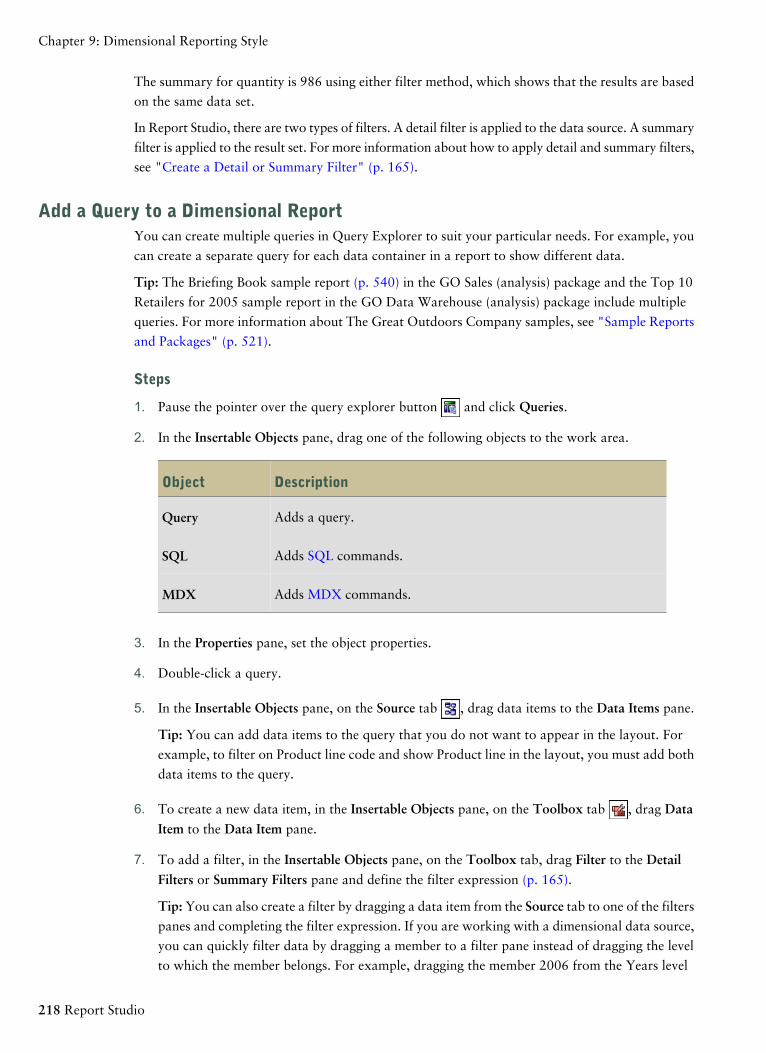
The summary for quantity is 986 using either filter method, which shows that the results are based
on the same data set.
In Report Studio, there are two types of filters. A detail filter is applied to the data source. A summary
filter is applied to the result set. For more information about how to apply detail and summary filters,
see "Create a Detail or Summary Filter" (p. 165).
Add a Query to a Dimensional ReportYou can create multiple queries in Query Explorer to suit your particular needs. For example, you
can create a separate query for each data container in a report to show different data.
Tip: The Briefing Book sample report (p. 540) in the GO Sales (analysis) package and the Top 10
Retailers for 2005 sample report in the GO Data Warehouse (analysis) package include multiple
queries. For more information about The Great Outdoors Company samples, see "Sample Reports
and Packages" (p. 521).
Steps
1. Pause the pointer over the query explorer button and click Queries.
2. In the Insertable Objects pane, drag one of the following objects to the work area.
DescriptionObject
Adds a query.Query
Adds SQL commands.SQL
Adds MDX commands.MDX
3. In the Properties pane, set the object properties.
4. Double-click a query.
5. In the Insertable Objects pane, on the Source tab , drag data items to the Data Items pane.
Tip: You can add data items to the query that you do not want to appear in the layout. For
example, to filter on Product line code and show Product line in the layout, you must add both
data items to the query.
6. To create a new data item, in the Insertable Objects pane, on the Toolbox tab , drag Data
Item to the Data Item pane.
7. To add a filter, in the Insertable Objects pane, on the Toolbox tab, drag Filter to the Detail
Filters or Summary Filters pane and define the filter expression (p. 165).
Tip: You can also create a filter by dragging a data item from the Source tab to one of the filters
panes and completing the filter expression. If you are working with a dimensional data source,
you can quickly filter data by dragging a member to a filter pane instead of dragging the level
to which the member belongs. For example, dragging the member 2006 from the Years level
218 Report Studio
Chapter 9: Dimensional Reporting Style
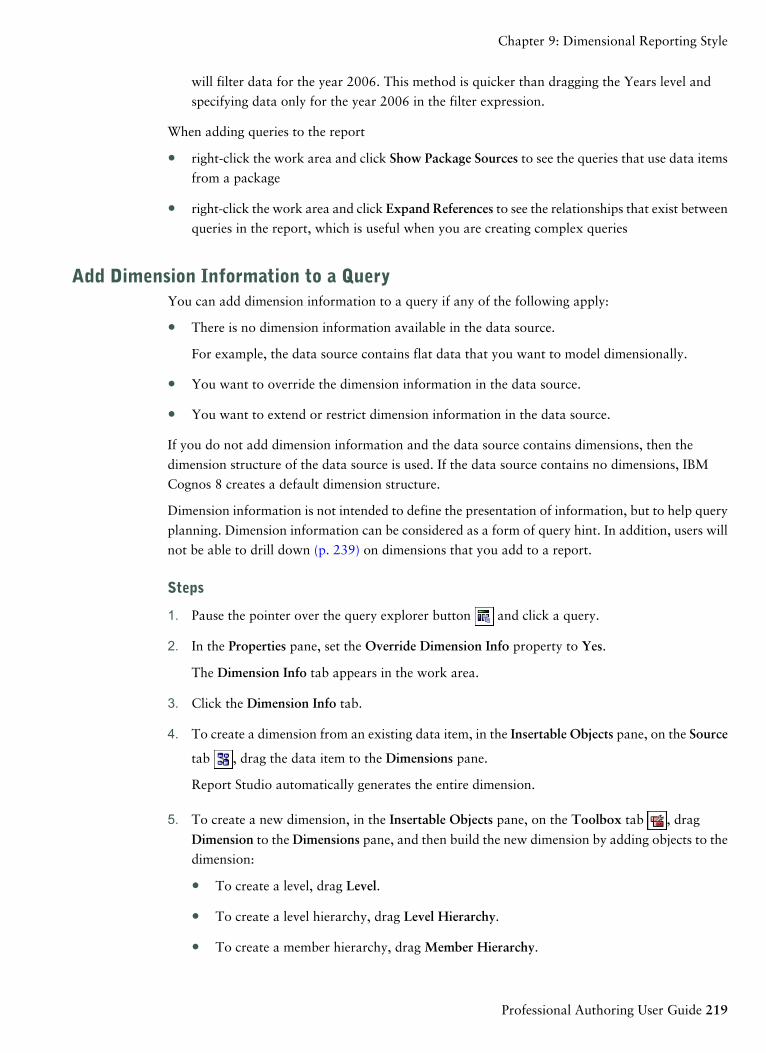
will filter data for the year 2006. This method is quicker than dragging the Years level and
specifying data only for the year 2006 in the filter expression.
When adding queries to the report
● right-click the work area and click Show Package Sources to see the queries that use data items
from a package
● right-click the work area and click Expand References to see the relationships that exist between
queries in the report, which is useful when you are creating complex queries
Add Dimension Information to a QueryYou can add dimension information to a query if any of the following apply:
● There is no dimension information available in the data source.
For example, the data source contains flat data that you want to model dimensionally.
● You want to override the dimension information in the data source.
● You want to extend or restrict dimension information in the data source.
If you do not add dimension information and the data source contains dimensions, then the
dimension structure of the data source is used. If the data source contains no dimensions, IBM
Cognos 8 creates a default dimension structure.
Dimension information is not intended to define the presentation of information, but to help query
planning. Dimension information can be considered as a form of query hint. In addition, users will
not be able to drill down (p. 239) on dimensions that you add to a report.
Steps
1. Pause the pointer over the query explorer button and click a query.
2. In the Properties pane, set the Override Dimension Info property to Yes.
The Dimension Info tab appears in the work area.
3. Click the Dimension Info tab.
4. To create a dimension from an existing data item, in the Insertable Objects pane, on the Source
tab , drag the data item to the Dimensions pane.
Report Studio automatically generates the entire dimension.
5. To create a new dimension, in the Insertable Objects pane, on the Toolbox tab , drag
Dimension to the Dimensions pane, and then build the new dimension by adding objects to the
dimension:
● To create a level, drag Level.
● To create a level hierarchy, drag Level Hierarchy.
● To create a member hierarchy, drag Member Hierarchy.
Professional Authoring User Guide 219
Chapter 9: Dimensional Reporting Style
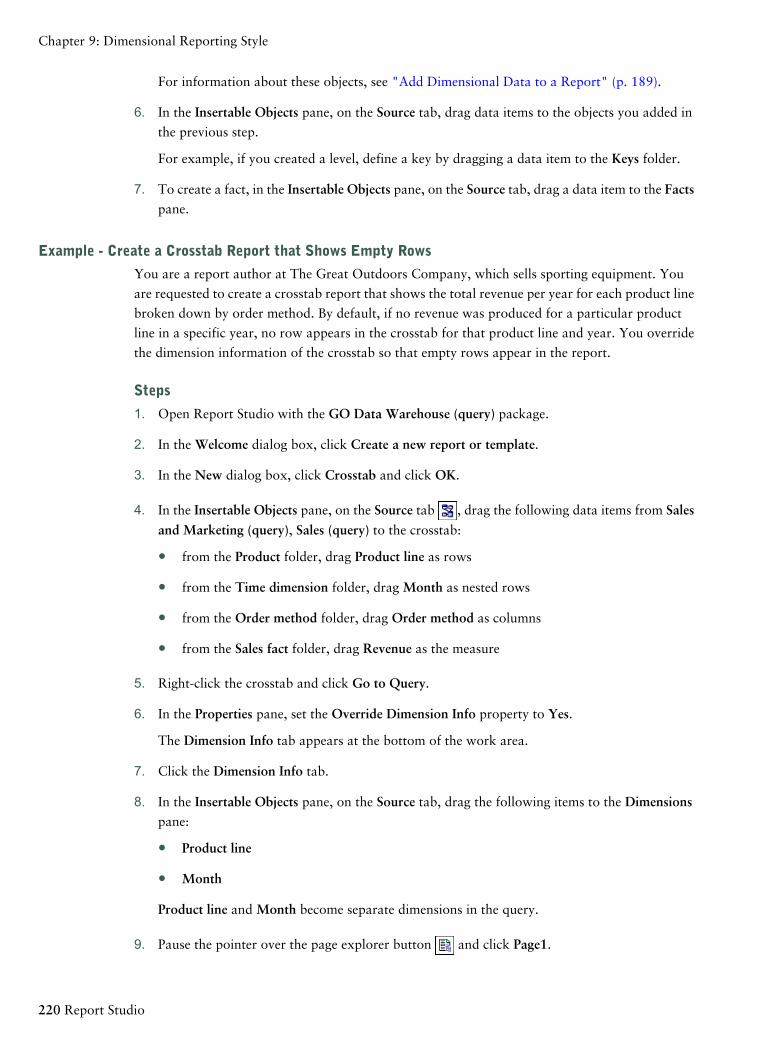
For information about these objects, see "Add Dimensional Data to a Report" (p. 189).
6. In the Insertable Objects pane, on the Source tab, drag data items to the objects you added in
the previous step.
For example, if you created a level, define a key by dragging a data item to the Keys folder.
7. To create a fact, in the Insertable Objects pane, on the Source tab, drag a data item to the Factspane.
Example - Create a Crosstab Report that Shows Empty Rows
You are a report author at The Great Outdoors Company, which sells sporting equipment. You
are requested to create a crosstab report that shows the total revenue per year for each product line
broken down by order method. By default, if no revenue was produced for a particular product
line in a specific year, no row appears in the crosstab for that product line and year. You override
the dimension information of the crosstab so that empty rows appear in the report.
Steps
1. Open Report Studio with the GO Data Warehouse (query) package.
2. In the Welcome dialog box, click Create a new report or template.
3. In the New dialog box, click Crosstab and click OK.
4. In the Insertable Objects pane, on the Source tab , drag the following data items from Sales
and Marketing (query), Sales (query) to the crosstab:
● from the Product folder, drag Product line as rows
● from the Time dimension folder, drag Month as nested rows
● from the Order method folder, drag Order method as columns
● from the Sales fact folder, drag Revenue as the measure
5. Right-click the crosstab and click Go to Query.
6. In the Properties pane, set the Override Dimension Info property to Yes.
The Dimension Info tab appears at the bottom of the work area.
7. Click the Dimension Info tab.
8. In the Insertable Objects pane, on the Source tab, drag the following items to the Dimensionspane:
● Product line
● Month
Product line and Month become separate dimensions in the query.
9. Pause the pointer over the page explorer button and click Page1.
220 Report Studio
Chapter 9: Dimensional Reporting Style
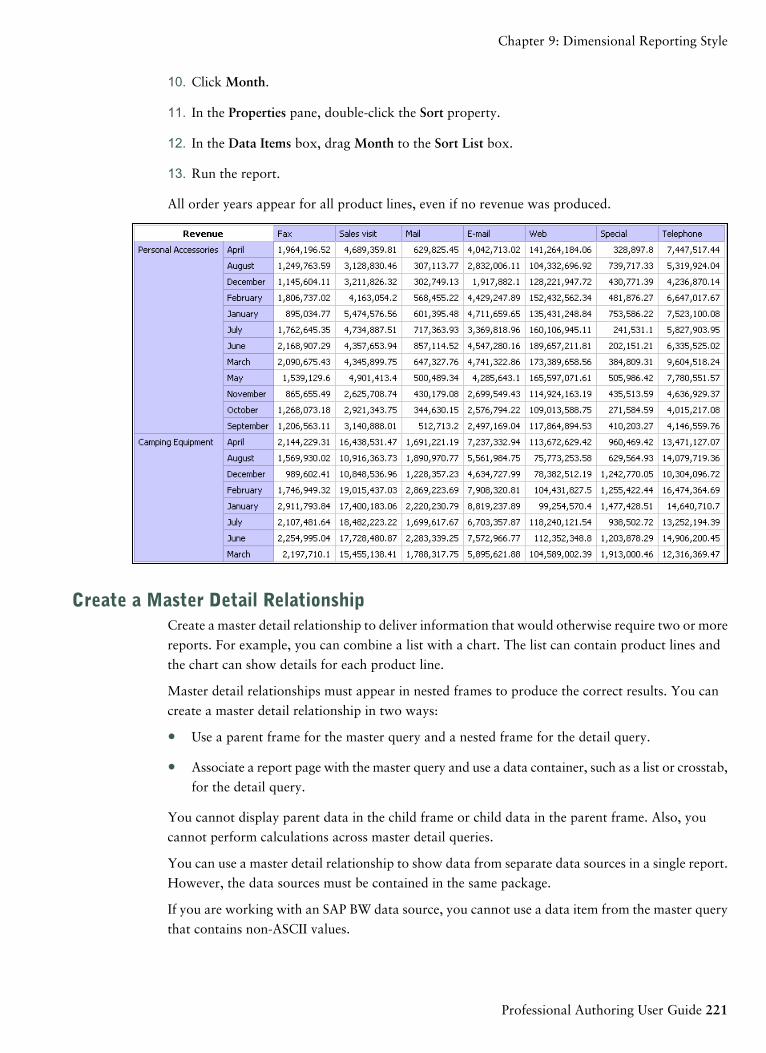
10. Click Month.
11. In the Properties pane, double-click the Sort property.
12. In the Data Items box, drag Month to the Sort List box.
13. Run the report.
All order years appear for all product lines, even if no revenue was produced.
Create a Master Detail RelationshipCreate a master detail relationship to deliver information that would otherwise require two or more
reports. For example, you can combine a list with a chart. The list can contain product lines and
the chart can show details for each product line.
Master detail relationships must appear in nested frames to produce the correct results. You can
create a master detail relationship in two ways:
● Use a parent frame for the master query and a nested frame for the detail query.
● Associate a report page with the master query and use a data container, such as a list or crosstab,
for the detail query.
You cannot display parent data in the child frame or child data in the parent frame. Also, you
cannot perform calculations across master detail queries.
You can use a master detail relationship to show data from separate data sources in a single report.
However, the data sources must be contained in the same package.
If you are working with an SAP BW data source, you cannot use a data item from the master query
that contains non-ASCII values.
Professional Authoring User Guide 221
Chapter 9: Dimensional Reporting Style
To create a master detail relationship using queries that reference two different dimensional data
sources, you must first link the members by aliasing the levels that contain the members.
Steps
1. To use a parent frame for the master query and a nested frame for the detail query:
● In the Insertable Objects pane, on the Toolbox tab , drag a List, Repeater Table, or
Repeater to the report.
● Add a second data container to the object you inserted.
You can insert a list, crosstab, chart, repeater table, or repeater into a list. You can add a
list to a repeater table or repeater.
● Add data items to both data containers.
2. To associate a report page with the master query and use a data container for the detail query:
● Click anywhere in the report page.
● In the Properties pane, click the select ancestor button and click Page.
● Set the Query property.
● In the Insertable Objects pane, on the Toolbox tab, drag a data container to the report.
3. To link a data item in the master query to a parameter in the detail query instead of to another
data item, create the parameter in the detail query.
Use parameters to filter values at a lower level in the detail query.
● Pause the pointer over the query explorer button and click the detail query.
● In the Insertable Objects pane, on the Toolbox tab, drag the Filter object to the Detail Filtersbox.
● In the Expression Definition box, create the parameter (p. 397).
4. Pause the pointer over the page explorer button and click the report page.
5. Click anywhere in the report page.
6. In the Properties pane, click the select ancestor button and click Page.
7. Click the data container containing the details.
8. From the Data menu, click Master Detail Relationships.
9. Click New Link.
10. In the Master box, click the data item that will provide the primary information.
11. To link the master query to a data item, in the Detail box, click the data item that will provide
the detailed information.
222 Report Studio
Chapter 9: Dimensional Reporting Style
12. To link the master query to a parameter, in the Parameters box, click the parameter that will
provide the detailed information.
Tip: To delete a link, select the link and press the Delete key.
13. If your detail query object is a chart, you can disconnect a chart title from the master query.
● Click the chart title, and then, from the Data menu, click Master Detail Relationships.
● Clear the Use the master detail relationships from the chart check box.
Tip: To avoid seeing the same data item twice in the report, click the data item in the data container
driven by the detail query and click the cut button. This removes the item from the report display
but keeps it in the query.
Link Members from Two Data Sources
If you create a master detail relationship using queries that reference two different dimensional data
sources, you may need to create a relationship between levels with the same member captions but
different Member Unique Names (MUNs). For more information about MUNs, see "Recommend-
ation - Use Member Unique Name (MUN) Aliases" (p. 252).
For example, you may want to link the Americas member in the Sales territory level in the Great
Outdoors cube with Americas in the GO Subsidiary level in the Great Outdoors Finance cube. To
create the relationship, you must alias the levels that contain the members to link.
Steps
1. In the parent frame or the report page, double-click the level that contains the member that
will provide the primary information.
The Data Item Expression dialog box appears.
2. In the Expression Definition box, use the expression in the following function:
caption(expression)
For example, caption([great_outdoors_company].[Sales Territory].[Sales Territory].[Sales
territory])
3. Repeat steps 1 to 2 for the level in the data container that contains the details.
A caption alias is created for each level. You can now use the caption alias for each level to
create a master detail relationship using member captions, which are the same, instead of MUNs,
which are different.
You can now create the master detail relationship between the two levels.
Master Detail or Burst Reports with Charts or Crosstabs May Result in Denial of Service
When running a master detail or burst report that includes a chart or crosstab, disk space exhaustion
may cause the report or other requests to fail. A large set of burst keys or master rows may produce
one or more charts per detail, resulting in many master detail executions. This may cause the temp
folder to accumulate many gigabytes of temporary files containing data required for successful chart
rendering.
Professional Authoring User Guide 223
Chapter 9: Dimensional Reporting Style
To avoid this issue, we recommend that you test large master detail or burst reports that include
charts or crosstabs to determine the potential peak disk requirements for the report.
Working with Queries in SQL or MDXFor each query in a report, you can work with the SQL or MDX that is executed when you run a
report. You can
● view the SQL or MDX for an entire report or a query
● build a report using your own SQL or MDX
● convert a report to use SQL
● edit the SQL or MDX
Note: MDX is not available with DMR data sources.
View the SQL or MDX for an Entire Report or a Query
View the SQL or MDX to see what is passed to the database when you run a report.
Note: Only SQL is available when using DMR data sources because these data sources were rela-
tional.
Steps
1. To view the SQL or MDX for the entire report, from the Tools menu, click Show Generated
SQL/MDX.
This option shows the SQL or MDX that will be executed in the data source. The SQL or MDX
is organized by query and by query result. If a query is used in more than one data container,
a query result is generated for each data container.
2. To view the SQL or MDX for a specific query, do the following:
● Pause the pointer over the query explorer button and click the query.
● In the Properties pane, double-click the Generated SQL/MDX property.
The Generated SQL/MDX property shows the SQL or MDX that is executed when you view
tabular data (from the Run menu, click View Tabular Data). Tabular data shows the data that
is produced by the query in the form of a list. You can use this property to help you build
advanced queries.
The SQL or MDX for the query appears in the Generated SQL/MDX dialog box. For SQL, you
can choose to view native SQL, which is the SQL that is passed to the database when you execute
the query, or Cognos SQL, which is a generic form of SQL that Report Studio uses. Cognos SQL
is converted to native SQL before the query is executed.
Build a Report Using Your Own SQL or MDX
You can build a report by adding SQL or MDX from an external source, such as another report.
If you are working with MDX, you must be aware of the MDX syntax that Report Studio supports.
224 Report Studio
Chapter 9: Dimensional Reporting Style
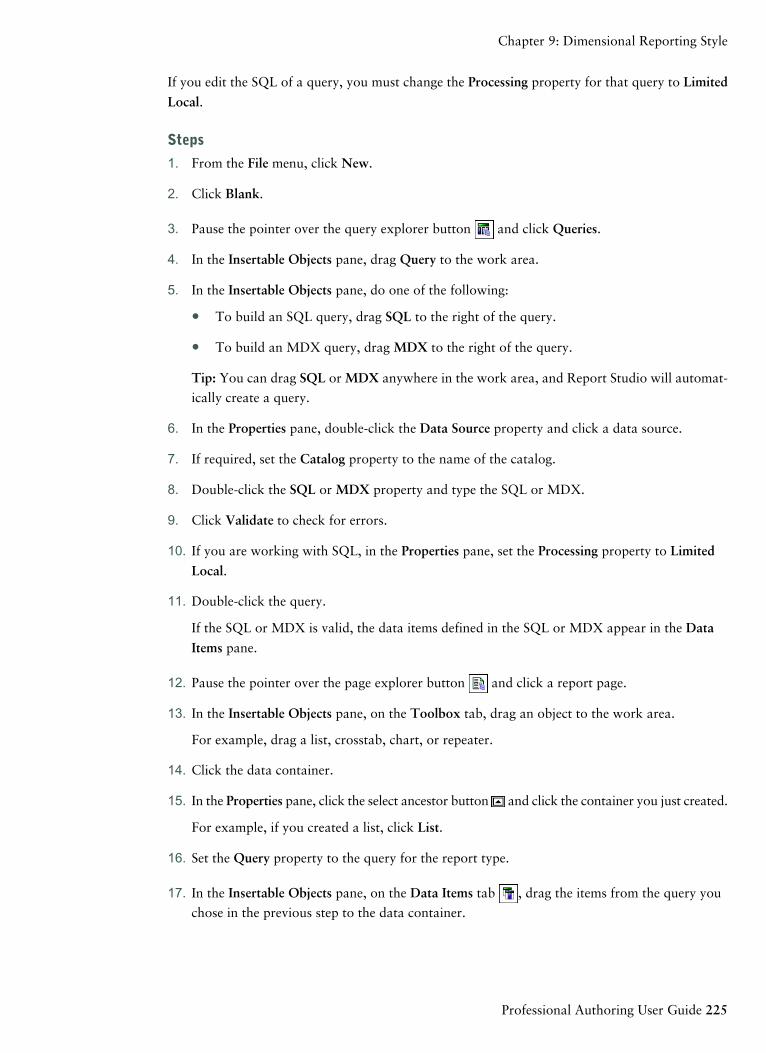
If you edit the SQL of a query, you must change the Processing property for that query to Limited
Local.
Steps
1. From the File menu, click New.
2. Click Blank.
3. Pause the pointer over the query explorer button and click Queries.
4. In the Insertable Objects pane, drag Query to the work area.
5. In the Insertable Objects pane, do one of the following:
● To build an SQL query, drag SQL to the right of the query.
● To build an MDX query, drag MDX to the right of the query.
Tip: You can drag SQL or MDX anywhere in the work area, and Report Studio will automat-
ically create a query.
6. In the Properties pane, double-click the Data Source property and click a data source.
7. If required, set the Catalog property to the name of the catalog.
8. Double-click the SQL or MDX property and type the SQL or MDX.
9. Click Validate to check for errors.
10. If you are working with SQL, in the Properties pane, set the Processing property to Limited
Local.
11. Double-click the query.
If the SQL or MDX is valid, the data items defined in the SQL or MDX appear in the Data
Items pane.
12. Pause the pointer over the page explorer button and click a report page.
13. In the Insertable Objects pane, on the Toolbox tab, drag an object to the work area.
For example, drag a list, crosstab, chart, or repeater.
14. Click the data container.
15. In the Properties pane, click the select ancestor button and click the container you just created.
For example, if you created a list, click List.
16. Set the Query property to the query for the report type.
17. In the Insertable Objects pane, on the Data Items tab , drag the items from the query you
chose in the previous step to the data container.
Professional Authoring User Guide 225
Chapter 9: Dimensional Reporting Style
Convert a Query to SQL
You can convert a query to SQL to edit it. You may want to do this to improve performance or to
use SQL features that are not supported directly by Report Studio.
Converting a query to SQL is an irreversible process.
Steps
1. Pause the pointer over the query explorer button and click the query.
2. In the Properties pane, double-click the Generated SQL property.
3. Click Convert.
4. Click Validate to check for errors.
5. In the Properties pane, set the Processing property to Limited Local.
Edit the SQL or MDX
You can edit the SQL or MDX for a query that has been created as an SQL or MDX query or that
has been converted to SQL.
Steps
1. Pause the pointer over the query explorer button and click the SQL or MDX item under
the query.
2. Double-click the SQL or MDX item.
3. Make changes in the text box.
If you are working with MDX, you must be aware of the MDX syntax that Report Studio
supports.
4. Click Validate to check for errors.
First-Rows Optimization
The SQL produced by Report Studio depends on the report format you choose. For example, if
you specify HTML format, first-rows optimization is requested. All-rows is requested if you specify
PDF.
It is important for database administrators and programmers to remember that Report Studio does
not always use first-rows optimization. If you assume first-rows optimization is always requested,
this can cause the RDBMS optimizer to process the query differently than you expect.
Supported MDX Syntax
If you are working with MDX, you must be aware of the syntax that Report Studio supports.
Report Studio supports the MDX grammar as specified in Microsoft's Data Access SDK version 2.8.
Report Studio supports the following MDX functions. This is a partial list and applies only when
you are working with the following data sources:
● cubes
226 Report Studio
Chapter 9: Dimensional Reporting Style
● SAP BW
● IBM Cognos TM1
● DB2 OLAP
● IBM Cognos Consolidation
● IBM Cognos Contributor
For these data sources, IBM Cognos 8 uses a variation of the Microsoft SQL Server Analysis Services
syntax.
OpeningPeriodFirstSiblingAcos
OrderGenerateAggregate
OrdinalHeadAncestor
ParallelPeriodHierarchizeAncestors
ParentHierarchyAsin
PeriodsToDateIIfAtan
PrevMemberIntersectAvg
PreviousMemberIsBottomCount
PropertiesIsAncestorBottomPercent
QtdIsEmptyBottomSum
RankItemChildren
SiblingsLagClosingPeriod
SinLastChildCoalesceEmpty
SinhLastPeriodsConvert
StddevLastSiblingCos
SubsetLeadCosh
SumLevelCount
TailLevelsCousin
Professional Authoring User Guide 227
Chapter 9: Dimensional Reporting Style
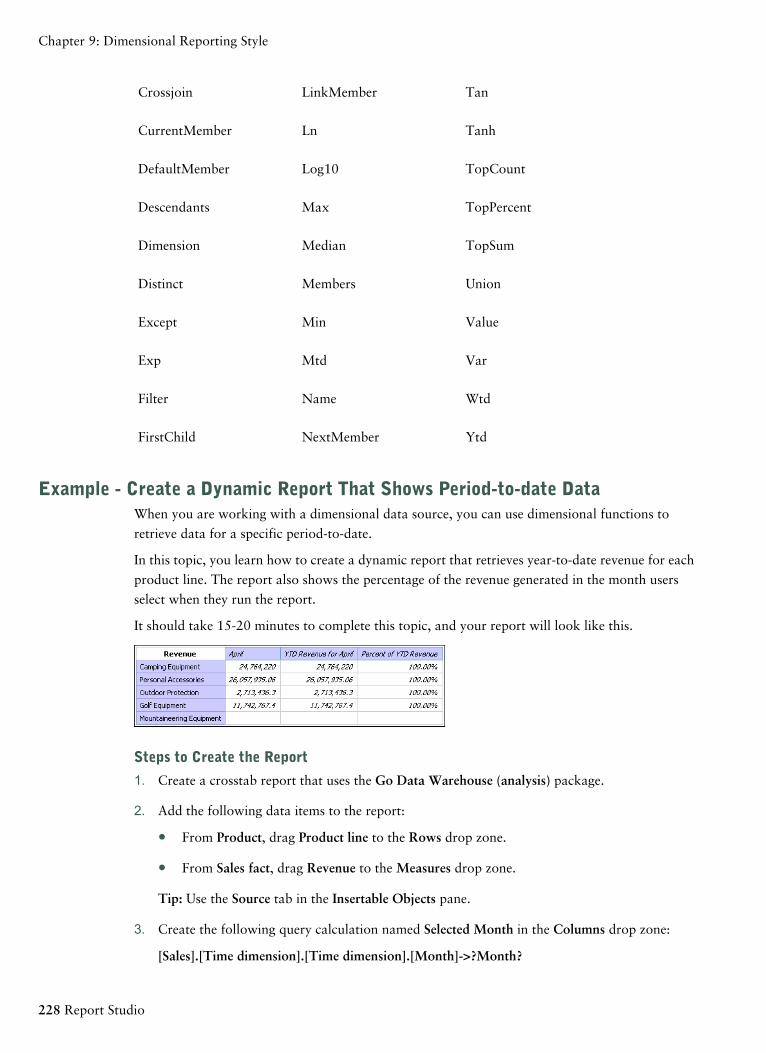
TanLinkMemberCrossjoin
TanhLnCurrentMember
TopCountLog10DefaultMember
TopPercentMaxDescendants
TopSumMedianDimension
UnionMembersDistinct
ValueMinExcept
VarMtdExp
WtdNameFilter
YtdNextMemberFirstChild
Example - Create a Dynamic Report That Shows Period-to-date DataWhen you are working with a dimensional data source, you can use dimensional functions to
retrieve data for a specific period-to-date.
In this topic, you learn how to create a dynamic report that retrieves year-to-date revenue for each
product line. The report also shows the percentage of the revenue generated in the month users
select when they run the report.
It should take 15-20 minutes to complete this topic, and your report will look like this.
Steps to Create the Report
1. Create a crosstab report that uses the Go Data Warehouse (analysis) package.
2. Add the following data items to the report:
● From Product, drag Product line to the Rows drop zone.
● From Sales fact, drag Revenue to the Measures drop zone.
Tip: Use the Source tab in the Insertable Objects pane.
3. Create the following query calculation named Selected Month in the Columns drop zone:
[Sales].[Time dimension].[Time dimension].[Month]->?Month?
228 Report Studio
Chapter 9: Dimensional Reporting Style
4. Create this query calculation named Year to Date Set next to the Selected Month column:
periodsToDate([Sales].[Time dimension].[Time dimension].[Year],[Selected Month])
Tip: Information about the periodsToDate function appears in the Information pane when you
click the function in the Functions tab. The periodsToDate function is located in the M-Q
folder in the Common Functions folder.
5. Click the Year to Date Set column and click the cut button .
6. Create the following query calculation namedYTDRevenue next to the SelectedMonth column:
total(currentMeasure within set [Year to Date Set])
7. Create the following query calculation named Percent of YTDRevenue next to theYTDRevenuecolumn:
[Selected Month]/[YTD Revenue]
Steps to Format the Report
1. Click the lock/unlock button to unlock the report.
2. Add this text item to the left of the text in the YTD Revenue column, and add a blank space
after the text:
YTD Revenue for
3. Set the font style of the text to italic.
4. In the YTD Revenue column, click <#YTD Revenue#> and change the Source Type property
to Report Expression.
5. Double-click the Report Expression property and drag the Month parameter to the Expression
Definition box.
Tip: You can find the Month parameter in the Parameters tab.
6. Click the lock/unlock button to lock the report.
7. Right-click the Percent of YTD Revenue column title and click Fact Cells for "Percent of YTD
Revenue".
8. In the Properties pane, double-click the Data Format property.
9. Under Format type, click Percent.
10. Set the No of Decimals property to 2.
11. Run the report to view what it will look like for your users.
Users are prompted to select a month. When they click OK, the report shows year-to-date
revenue for each product line and the percentage of revenue generated for the selected month.
Need More Help?
● Creating Report Templates
Professional Authoring User Guide 229
Chapter 9: Dimensional Reporting Style
● Add Relational Data to a Report or Add Dimensional Data to a Report
● Using the Expression Editor
● Set Crosstab Properties
● Specify the Report Font
● Format Data
Using Dimensional CalculationsCreate calculations to make a report more meaningful by deriving additional information from the
data source. For example, you create an invoice report and you want to see the total sale amount
for each product ordered. Create a calculated column that multiplies the product price by the
quantity ordered.
In Report Studio, you can create the following types of calculations:
● When working with dimensional data sources, create a simple member calculation with the
insert calculation button (p. 231).
● When working with dimensional data sources, create Calculated Members or Calculated
Measures where the expression is a member or a tuple-based (as opposed to property-based)
value expression (p. 232).
● When working with dimensional data sources, use set expressions to create calculated sets of
members (p. 234).
You must base each set expression on a hierarchy and the set expression must contain only
members from this hierarchy.
● When working with dimensional data sources, use a Layout Calculation in all other cases
(p. 232).
Note: Query calculations are also available in Report Studio, but they are more useful for
relational reporting. For information about using query calculations in relational reporting, see
"Using Relational Calculations" (p. 187).
You can add calculations to lists, crosstabs, and all other data containers. You can also add calcu-
lations directly to a page header, body, or footer. However, you must first associate a query to the
page. For more information, see "Add a Page to a Report" (p. 493).
Limitation When Using Dimensional Functions with Running and Moving Summaries
IBM Cognos 8 does not currently support queries that contain both dimensional functions and
running summaries or moving summaries. For example, when you drill down in a report, the query
uses the dimensional function children, which is not compatible with running and moving sum-
maries. Running and moving summaries are supported for only the overall level of a dimension.
230 Report Studio
Chapter 9: Dimensional Reporting Style
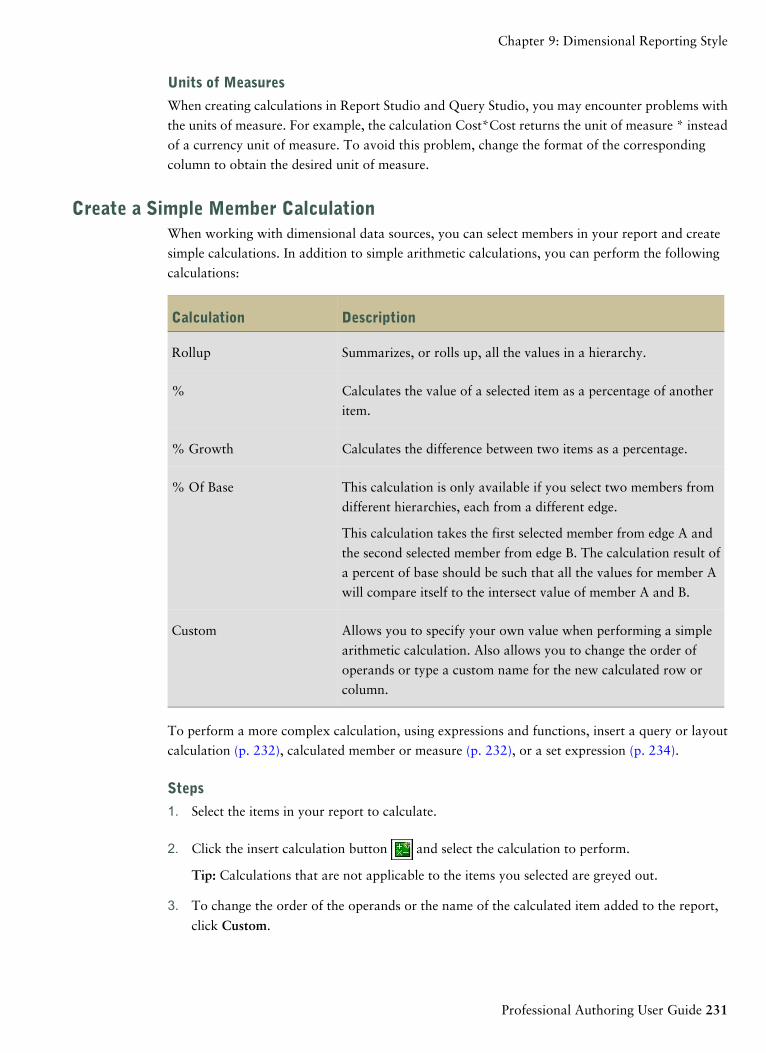
Units of Measures
When creating calculations in Report Studio and Query Studio, you may encounter problems with
the units of measure. For example, the calculation Cost*Cost returns the unit of measure * instead
of a currency unit of measure. To avoid this problem, change the format of the corresponding
column to obtain the desired unit of measure.
Create a Simple Member CalculationWhen working with dimensional data sources, you can select members in your report and create
simple calculations. In addition to simple arithmetic calculations, you can perform the following
calculations:
DescriptionCalculation
Summarizes, or rolls up, all the values in a hierarchy.Rollup
Calculates the value of a selected item as a percentage of another
item.
%
Calculates the difference between two items as a percentage.% Growth
This calculation is only available if you select two members from
different hierarchies, each from a different edge.
% Of Base
This calculation takes the first selected member from edge A and
the second selected member from edge B. The calculation result of
a percent of base should be such that all the values for member A
will compare itself to the intersect value of member A and B.
Allows you to specify your own value when performing a simple
arithmetic calculation. Also allows you to change the order of
operands or type a custom name for the new calculated row or
column.
Custom
To perform a more complex calculation, using expressions and functions, insert a query or layout
calculation (p. 232), calculated member or measure (p. 232), or a set expression (p. 234).
Steps
1. Select the items in your report to calculate.
2. Click the insert calculation button and select the calculation to perform.
Tip: Calculations that are not applicable to the items you selected are greyed out.
3. To change the order of the operands or the name of the calculated item added to the report,
click Custom.
Professional Authoring User Guide 231
Chapter 9: Dimensional Reporting Style
Create a Layout CalculationCreate a layout calculation to add run-time information to your report, such as current date, current
time, and user name.
When creating layout calculations, only report functions are available to you in the expression
editor. These functions are executed in the report layout, as opposed to the other functions which
are executed in the query. For more information, see "Functions Not Available When Creating a
Report or Layout Expression" (p. 253).
Steps
1. In the Insertable Objects pane, click the Toolbox tab .
2. Drag Layout Calculation to the report.
3. In the Available Components box, define the calculation:
● To add data items that are not shown in the report, on the Source tab , double-click
data items.
● To add data items that are in the report but not necessarily in the model, such as calcula-
tions, on the Data Items tab , double-click data items.
● To add data items from a specific query (p. 171), on the Queries tab , double-click data
items.
● To add functions, summaries, and operators, on the Functions tab , double-click elements.
● To add a value that is derived from a parameter, on the Parameters tab , double-click
a parameter.
Parameters define prompts (p. 391), drill-through reports (p. 481), and master detail relation-
ships (p. 221).
Tip: You can also type the expression directly in the Expression Definition box.
For more information about creating expressions, see "Using the Expression Editor" (p. 245).
4. Click the validate expression button .
Insert a Calculated Member or MeasureWhen working with dimensional data, insert a calculated member or measure into your report to
add a new row or column with values that are based on a calculation. For example, you create a
calculated measure named Euros that converts dollars to euros by multiplying an existing dollar
measure by a conversion rate. Euros can then be displayed to end users in a separate row or column.
Insert a calculated measure when the focus of the calculation is one or more measures and when
you want the calculation to behave like a measure or to replace a measure. The expression used to
define the calculation must not depend on the current measure context.
232 Report Studio
Chapter 9: Dimensional Reporting Style
Insert a calculated member when you want the calculation to behave like a member or to replace
a member. In this case, you must choose a hierarchy. The value expression must not depend on the
current member context.
You use the expression editor to define the calculation. You can also create a calculation that uses
an intersection (tuple) that you already defined (p. 235).
Assigning a Hierarchy or Dimension
You must assign each calculated member or measure to a hierarchy or dimension. We recommend
that you select the hierarchy or dimension upon which your calculation focuses. For example, if
your calculated member is based on years, select the Time hierarchy. If you create a calculated
measure, select the Measures dimension.
Select only a hierarchy that cannot affect the value of the calculation. For example, the hierarchy
Camping Equipment has the same value no matter what Products context it appears in the report.
Therefore,
● the calculation ([Camping Equipment]-[Mountaneering Equipment]) has a well-defined meaning
only in the Products hierarchy, so select that hierarchy.
● the calculation tuple([Revenue], [Camping Equipment]) can be assigned to either the Products
or Measures hierarchy, as it is not affected by either context.
● the calculation ([Revenue] - [Camping Equipment]) does not have a well-defined meaning in
any hierarchy, and therefore cannot be used reliably at all.
Automatic Database Aggregation
You can use automatic database aggregation only when using IBM Cognos PowerCubes and
Microsoft SQL Server 2005 Analysis Services (SSAS) data sources.
Steps
1. In the Insertable Objects pane, click the Toolbox tab .
2. Drag Calculated Member or Calculated Measure to the report.
3. In the Name box, type a name for the calculation.
4. In the Hierarchy or Dimension box, select the hierarchy that contains the measure or member
that is the focus of this calculated member or measure.
5. In the Available Components box, define the calculation:
● To add data items that are not shown in the report, on the Source tab , double-click
the data items.
● To add data items that are in the report but not necessarily in the model, such as calcula-
tions, on the Data Items tab , double-click the data items.
● To add data items from a specific query in the report (p. 213), on the Queries tab ,
double-click data items.
Professional Authoring User Guide 233
Chapter 9: Dimensional Reporting Style
● To add functions, summaries, and operators, on the Functions tab , double-click elements.
● To add a value that is derived from a parameter, on the Parameters tab , double-click
the parameter.
Parameters define prompts (p. 391), drill-through reports (p. 481), and master detail relation-
ships (p. 221).
Tip: You can also type the calculation directly in the Expression Definition box. When typing
date values, use the YYYY-MM-DD format.
For more information about creating expressions, see "Using the Expression Editor" (p. 245).
6. Click the validate expression button .
Create a Set ExpressionWhen working with dimensional data, set expressions are a set of dimension members that you
create to reuse in queries in your reports. For example, you can create a named set called Top Ten
Products that contains the ten members of the Product Name dimension that have the highest values
for the Gross Profit measure. You can then use the Top Ten Products set in queries.
When you insert a Set Expression object, you must select a hierarchy and a set expression. The
expression must return members from the specified hierarchy. Note that the Tuple function returns
an intersection value and not a member, and is therefore not a set expression.
Steps
1. In the Insertable Objects pane, click the Toolbox tab .
2. Drag Set Expression to the report.
3. In the Name box, type a name for the calculation.
4. In the Hierarchy box, select the hierarchy within which you will create this calculated member
or measure and click OK.
The Data Item Expression dialog box appears.
5. In the Available Components box, define the calculation:
● To add data items that are not shown in the report, on the Source tab , double-click
the data items.
● To add data items that are in the report but not necessarily in the model, such as calcula-
tions, on the Data Items tab , double-click the data items.
● To add data items from a specific query in the report (p. 213), on the Queries tab ,
double-click data items.
● To add functions, summaries, and operators, on the Functions tab , double-click elements.
234 Report Studio
Chapter 9: Dimensional Reporting Style
● To add a value that is derived from a parameter, on the Parameters tab , double-click
the parameter.
Parameters define prompts (p. 391), drill-through reports (p. 481), and master detail relation-
ships (p. 221).
Tip: You can also type the calculation directly in the Expression Definition box. When typing
date values, use the YYYY-MM-DD format.
For more information about creating expressions, see "Using the Expression Editor" (p. 245).
6. Click the validate expression button .
Create an Intersection (Tuple)When working with dimensional data, an intersection, also known as a tuple, is useful for obtaining
a value from the combination of two or more members that you specify. Each member must be
from a different hierarchy. The intersection can include only one measure.
For example, the intersection (Revenue, 2004, Cooking Gear) shows the revenue value for the year
2004 and for the product line Cooking Gear.
Use tuples to avoid report summaries that do not reflect the visible data. For more information
about this issue, see "Summaries in Report Do not Correspond to the Visible Members" (p. 676).
Steps
1. In the Insertable Objects pane, click the Toolbox tab .
2. Drag the Intersection (Tuple) object to the report.
3. From the Available members and measures pane, select items and click the right arrow to move
them to the Intersection members and measures box. You can also use items from the Calculated
Members and Measures tab .
4. To define the hierarchy for this intersection, click a parent object in the Intersection hierarchybox.
Intersecting Calculations in Crosstabs and ChartsAn intersection point in a crosstab or chart can contain a value that is derived from multiple calcu-
lations.
If the query expressions for the row and column that intersect in a crosstab both include calculations,
the intersecting value is the result of performing both calculations. The second calculation is per-
formed on the result of the first calculation. If you change the order in which the calculations are
performed, the resulting value at the intersection point changes.
The solve order is a positive numeric value that you assign to data items. Negative values are not
supported. The data item with the lowest value is calculated first, followed by the next higher value,
and so on. The data item with the highest solve order is computed last. If you do not specify a solve
Professional Authoring User Guide 235
Chapter 9: Dimensional Reporting Style
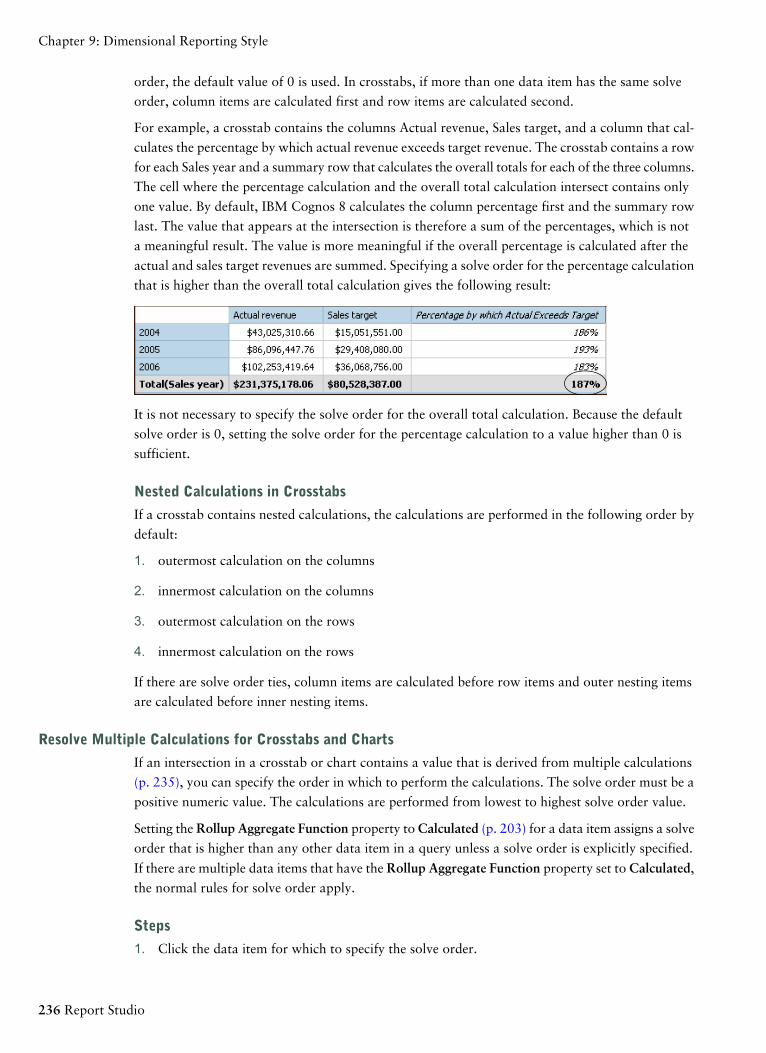
order, the default value of 0 is used. In crosstabs, if more than one data item has the same solve
order, column items are calculated first and row items are calculated second.
For example, a crosstab contains the columns Actual revenue, Sales target, and a column that cal-
culates the percentage by which actual revenue exceeds target revenue. The crosstab contains a row
for each Sales year and a summary row that calculates the overall totals for each of the three columns.
The cell where the percentage calculation and the overall total calculation intersect contains only
one value. By default, IBM Cognos 8 calculates the column percentage first and the summary row
last. The value that appears at the intersection is therefore a sum of the percentages, which is not
a meaningful result. The value is more meaningful if the overall percentage is calculated after the
actual and sales target revenues are summed. Specifying a solve order for the percentage calculation
that is higher than the overall total calculation gives the following result:
It is not necessary to specify the solve order for the overall total calculation. Because the default
solve order is 0, setting the solve order for the percentage calculation to a value higher than 0 is
sufficient.
Nested Calculations in Crosstabs
If a crosstab contains nested calculations, the calculations are performed in the following order by
default:
1. outermost calculation on the columns
2. innermost calculation on the columns
3. outermost calculation on the rows
4. innermost calculation on the rows
If there are solve order ties, column items are calculated before row items and outer nesting items
are calculated before inner nesting items.
Resolve Multiple Calculations for Crosstabs and Charts
If an intersection in a crosstab or chart contains a value that is derived from multiple calculations
(p. 235), you can specify the order in which to perform the calculations. The solve order must be a
positive numeric value. The calculations are performed from lowest to highest solve order value.
Setting the Rollup Aggregate Function property to Calculated (p. 203) for a data item assigns a solve
order that is higher than any other data item in a query unless a solve order is explicitly specified.
If there are multiple data items that have the Rollup Aggregate Function property set to Calculated,
the normal rules for solve order apply.
Steps
1. Click the data item for which to specify the solve order.
236 Report Studio
Chapter 9: Dimensional Reporting Style
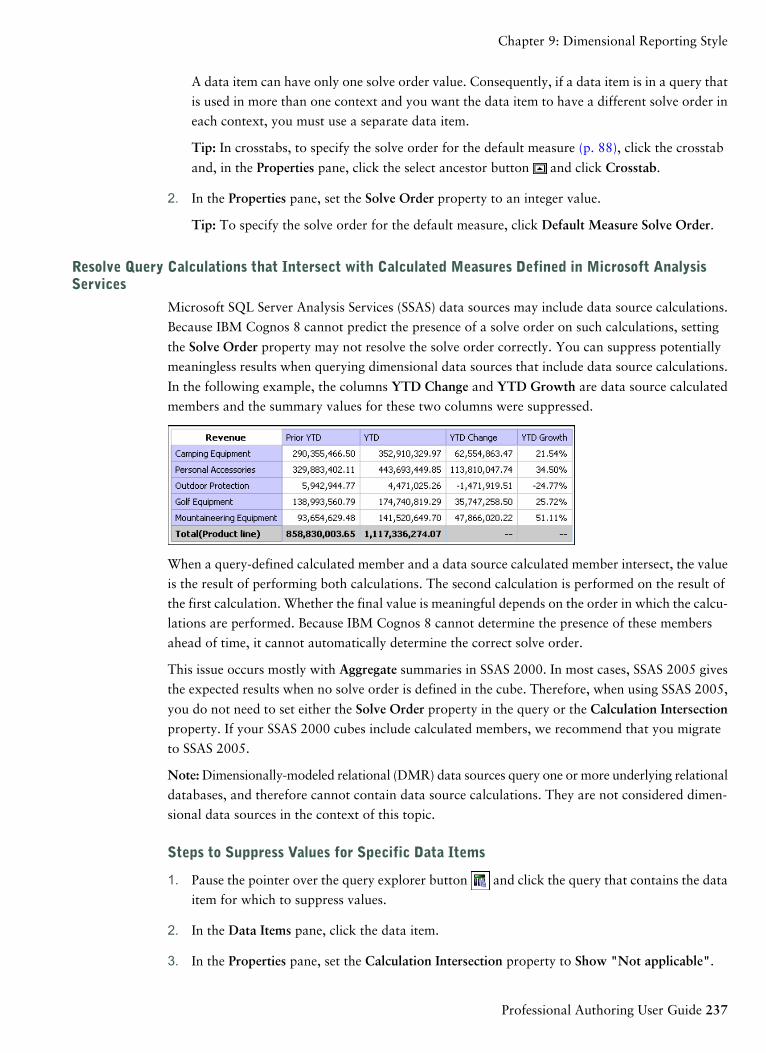
A data item can have only one solve order value. Consequently, if a data item is in a query that
is used in more than one context and you want the data item to have a different solve order in
each context, you must use a separate data item.
Tip: In crosstabs, to specify the solve order for the default measure (p. 88), click the crosstab
and, in the Properties pane, click the select ancestor button and click Crosstab.
2. In the Properties pane, set the Solve Order property to an integer value.
Tip: To specify the solve order for the default measure, click Default Measure Solve Order.
Resolve Query Calculations that Intersect with Calculated Measures Defined in Microsoft AnalysisServices
Microsoft SQL Server Analysis Services (SSAS) data sources may include data source calculations.
Because IBM Cognos 8 cannot predict the presence of a solve order on such calculations, setting
the Solve Order property may not resolve the solve order correctly. You can suppress potentially
meaningless results when querying dimensional data sources that include data source calculations.
In the following example, the columns YTD Change and YTD Growth are data source calculated
members and the summary values for these two columns were suppressed.
When a query-defined calculated member and a data source calculated member intersect, the value
is the result of performing both calculations. The second calculation is performed on the result of
the first calculation. Whether the final value is meaningful depends on the order in which the calcu-
lations are performed. Because IBM Cognos 8 cannot determine the presence of these members
ahead of time, it cannot automatically determine the correct solve order.
This issue occurs mostly with Aggregate summaries in SSAS 2000. In most cases, SSAS 2005 gives
the expected results when no solve order is defined in the cube. Therefore, when using SSAS 2005,
you do not need to set either the Solve Order property in the query or the Calculation Intersectionproperty. If your SSAS 2000 cubes include calculated members, we recommend that you migrate
to SSAS 2005.
Note:Dimensionally-modeled relational (DMR) data sources query one or more underlying relational
databases, and therefore cannot contain data source calculations. They are not considered dimen-
sional data sources in the context of this topic.
Steps to Suppress Values for Specific Data Items
1. Pause the pointer over the query explorer button and click the query that contains the data
item for which to suppress values.
2. In the Data Items pane, click the data item.
3. In the Properties pane, set the Calculation Intersection property to Show "Not applicable".
Professional Authoring User Guide 237
Chapter 9: Dimensional Reporting Style
When a query-defined calculated member and a data source calculated member intersect, the resulting
value is suppressed. If the intersecting members do not contain data source calculations, the value
is not suppressed.
Drilling Up and Drilling Down in Dimensional ReportsWhen working with dimensional or dimensionally-modeled relational (DMR) data sources, you
can create reports that allow the reader to view more general or more detailed information on your
data within a predefined dimensional hierarchy (such as Years - Year - Quarter - Month) without
having to create different reports.
You can link groups of data items from different queries so that when you drill up or drill down
in one query, the data item also drills up or drills down in the linked queries. Linking data items is
useful if your report includes more than one query with the same data item. For example, if your
report shows a list and a crosstab that each include the Product Line data item, you can link the
Product Line data item from the crosstab query to the Product Line data item from the list query
so that when you drill up in the crosstab Product Line data item, the list Product Line data item
also drills up.
Member SetsMember sets are used to group data items that are logically related for various actions, such as drill
actions, zero suppression, and ranking. They can be defined as a flat list or as a tree structure in
which member sets in the same parent chain are considered related.
For example, for drill operations, a member set defines the set of items that can potentially change
when a given item in the set is drilled on. The values of other items in the query or even those in
the same hierarchy are preserved when any item in this set is drilled on. Usually, a member set ref-
erences items that have logical roles in a drill action, such as a detail, a summary of the detail, or
a parent of the detail. A single data item can belong to only one member set.
If you do not define member sets for items, the IBM Cognos 8 server associates items into default
member sets and behaviors using simple dimension rules on item expressions. You can override the
behavior for a particular item while other items continue to use the default.
When you define a member set, you must explicitly define behaviors for each item in the set. Items
in the set that have no behaviors have their values preserved.
Drill behaviors always act from a root member set. This means that when an item is drilled on, the
root member of its member set is found and all items from the root down are processed. Although
calculations and aggregates are not directly related by hierarchy, they respond because of their
dependence on the items upon which they are based.
238 Report Studio
Chapter 9: Dimensional Reporting Style
Create Member Sets
Create a member set when you want to define a non-default drill behavior. You specify what items
respond to a drill action by adding them to the member set.
Steps
1. Pause the pointer over the query explorer button and click the query in which to create a
member set.
2. In the Properties pane, set the Define Member Sets property to Yes.
3. Click the Member Sets tab.
4. In the Insertable Objects pane, drag items to the work area.
To define a member set as a tree structure, drag the item that will serve as the root item of the
set to the work area, and then drag other items over the root item to create the tree structure.
You can also nest member sets.
Create a Drill-up/Drill-down ReportYou can link groups of data items from different queries so that when you drill up or drill down
in one query, the data item also drills up or drills down in the linked queries. Before you begin,
ensure that you are using a dimensional data source.
Tip: The Returned Items sample report (p. 534) in the GO Data Warehouse (analysis) package
includes drilling. For more information about The Great Outdoors Company samples, see "Sample
Reports and Packages" (p. 521).
Steps
1. From the Data menu, click Drill Behavior.
2. On the Basic tab, in the Report output drill capabilities box, select the Allow drill-up and drill-
down check box.
By default, Report Studio determines which items can be drilled on based on the dimensional
structure.
Tip: To enable the report to be used as the source during a package drill-through, select the
Allow this report to be a package-based drill-through source check box and click OK. For more
information about package drill-through, see the Administration and Security Guide.
3. To disable drill-up or drill-down for a data item, select the data item in either the Disable drill-
up for box or the Disable drill-down for box.
4. From the Advanced tab, you can change the drill-up or drill-down behavior for any data item
by selecting the data item and then choosing one of the following behaviors.
Professional Authoring User Guide 239
Chapter 9: Dimensional Reporting Style
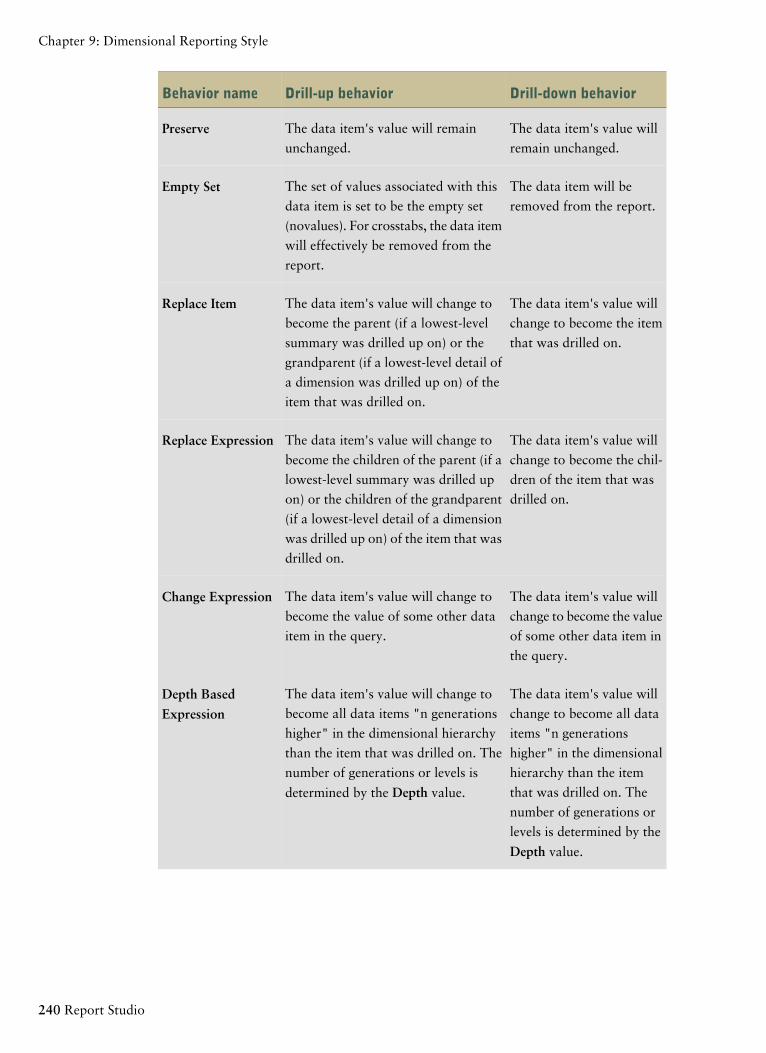
Drill-down behaviorDrill-up behaviorBehavior name
The data item's value will
remain unchanged.
The data item's value will remain
unchanged.Preserve
The data item will be
removed from the report.
The set of values associated with this
data item is set to be the empty set
(novalues). For crosstabs, the data item
will effectively be removed from the
report.
Empty Set
The data item's value will
change to become the item
that was drilled on.
The data item's value will change to
become the parent (if a lowest-level
summary was drilled up on) or the
grandparent (if a lowest-level detail of
a dimension was drilled up on) of the
item that was drilled on.
Replace Item
The data item's value will
change to become the chil-
dren of the item that was
drilled on.
The data item's value will change to
become the children of the parent (if a
lowest-level summary was drilled up
on) or the children of the grandparent
(if a lowest-level detail of a dimension
was drilled up on) of the item that was
drilled on.
Replace Expression
The data item's value will
change to become the value
of some other data item in
the query.
The data item's value will change to
become the value of some other data
item in the query.
Change Expression
The data item's value will
change to become all data
items "n generations
higher" in the dimensional
hierarchy than the item
that was drilled on. The
number of generations or
levels is determined by the
Depth value.
The data item's value will change to
become all data items "n generations
higher" in the dimensional hierarchy
than the item that was drilled on. The
number of generations or levels is
determined by the Depth value.
Depth Based
Expression
240 Report Studio
Chapter 9: Dimensional Reporting Style
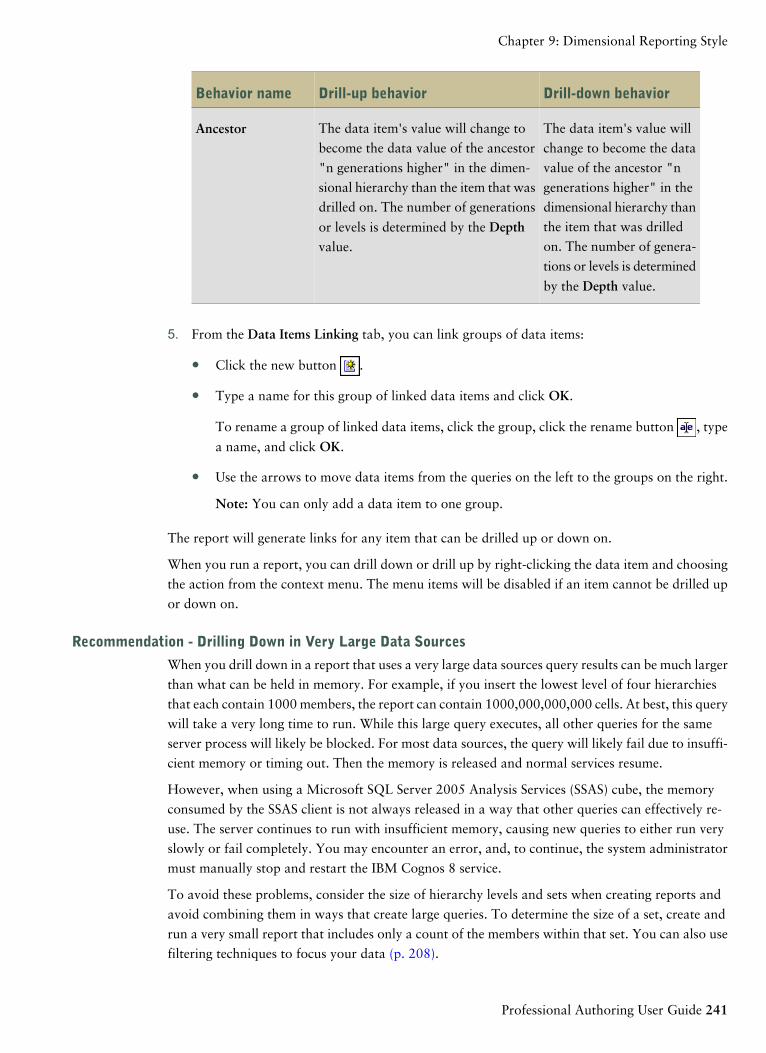
Drill-down behaviorDrill-up behaviorBehavior name
The data item's value will
change to become the data
value of the ancestor "n
generations higher" in the
dimensional hierarchy than
the item that was drilled
on. The number of genera-
tions or levels is determined
by the Depth value.
The data item's value will change to
become the data value of the ancestor
"n generations higher" in the dimen-
sional hierarchy than the item that was
drilled on. The number of generations
or levels is determined by the Depthvalue.
Ancestor
5. From the Data Items Linking tab, you can link groups of data items:
● Click the new button .
● Type a name for this group of linked data items and click OK.
To rename a group of linked data items, click the group, click the rename button , type
a name, and click OK.
● Use the arrows to move data items from the queries on the left to the groups on the right.
Note: You can only add a data item to one group.
The report will generate links for any item that can be drilled up or down on.
When you run a report, you can drill down or drill up by right-clicking the data item and choosing
the action from the context menu. The menu items will be disabled if an item cannot be drilled up
or down on.
Recommendation - Drilling Down in Very Large Data Sources
When you drill down in a report that uses a very large data sources query results can be much larger
than what can be held in memory. For example, if you insert the lowest level of four hierarchies
that each contain 1000 members, the report can contain 1000,000,000,000 cells. At best, this query
will take a very long time to run. While this large query executes, all other queries for the same
server process will likely be blocked. For most data sources, the query will likely fail due to insuffi-
cient memory or timing out. Then the memory is released and normal services resume.
However, when using a Microsoft SQL Server 2005 Analysis Services (SSAS) cube, the memory
consumed by the SSAS client is not always released in a way that other queries can effectively re-
use. The server continues to run with insufficient memory, causing new queries to either run very
slowly or fail completely. You may encounter an error, and, to continue, the system administrator
must manually stop and restart the IBM Cognos 8 service.
To avoid these problems, consider the size of hierarchy levels and sets when creating reports and
avoid combining them in ways that create large queries. To determine the size of a set, create and
run a very small report that includes only a count of the members within that set. You can also use
filtering techniques to focus your data (p. 208).
Professional Authoring User Guide 241
Chapter 9: Dimensional Reporting Style
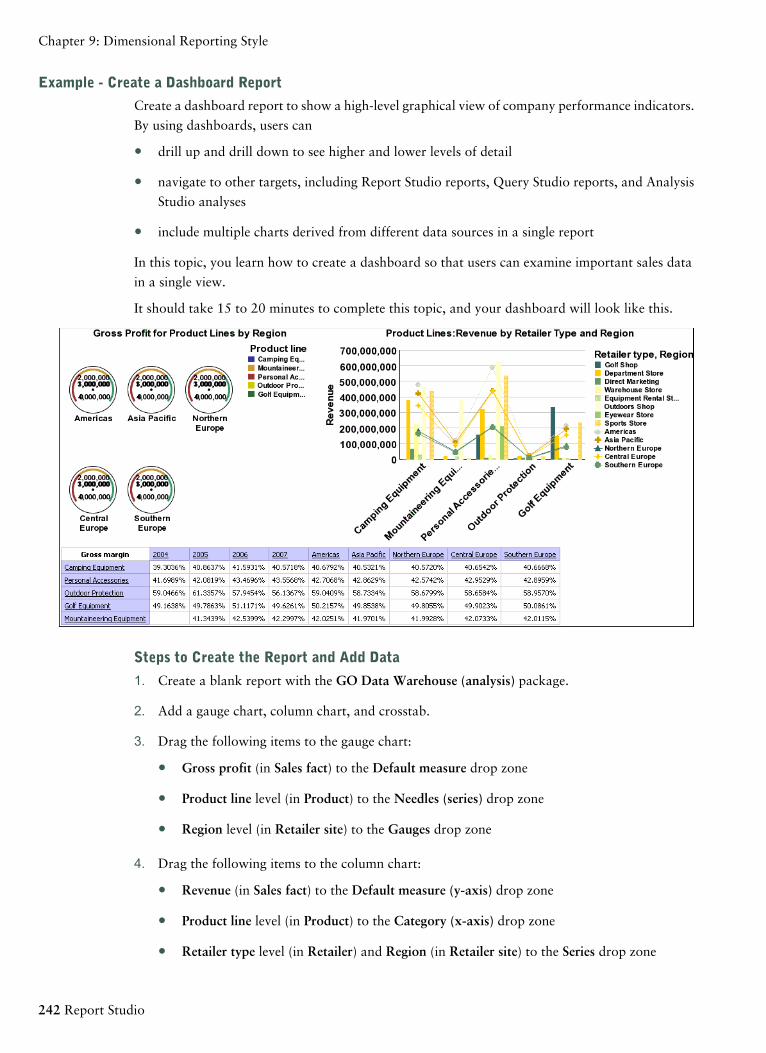
Example - Create a Dashboard Report
Create a dashboard report to show a high-level graphical view of company performance indicators.
By using dashboards, users can
● drill up and drill down to see higher and lower levels of detail
● navigate to other targets, including Report Studio reports, Query Studio reports, and Analysis
Studio analyses
● include multiple charts derived from different data sources in a single report
In this topic, you learn how to create a dashboard so that users can examine important sales data
in a single view.
It should take 15 to 20 minutes to complete this topic, and your dashboard will look like this.
Steps to Create the Report and Add Data
1. Create a blank report with the GO Data Warehouse (analysis) package.
2. Add a gauge chart, column chart, and crosstab.
3. Drag the following items to the gauge chart:
● Gross profit (in Sales fact) to the Default measure drop zone
● Product line level (in Product) to the Needles (series) drop zone
● Region level (in Retailer site) to the Gauges drop zone
4. Drag the following items to the column chart:
● Revenue (in Sales fact) to the Default measure (y-axis) drop zone
● Product line level (in Product) to the Category (x-axis) drop zone
● Retailer type level (in Retailer) and Region (in Retailer site) to the Series drop zone
242 Report Studio
Chapter 9: Dimensional Reporting Style
5. Drag the following items to the crosstab:
● Gross margin (in Sales fact) to the Measures drop zone
● Product line level (in Product) to the Rows drop zone
● Year level (in Time dimension) and Region level (in Retailer site) to the Columns drop zone
Steps to Format the Gauge Chart
1. Click the gauge chart.
2. Set the Size & Overflow property width to 400 px.
3. Set the Title property to Show.
4. Double-click the chart title and type the following text:
Gross Profit for Product Lines by Region
5. Set the Font property for the chart title to Arial, 12pt, Bold.
6. Expand Axis titles, click the horizontal axis title, and set the Visible property to No.
7. Click the numerical axis and, in the Maximum Value property, type 4000000.
Steps to Format the Column Chart
1. Click the Region series and set the Chart Type property to Line.
Note: The column chart becomes a combination chart because you render the sales territory
data as lines.
2. Click the chart, click the Palette property, and select Contemporary from the Palette list.
3. Set the Size & Overflow property width to 600 px.
4. Set the Title property to Show.
5. Double-click the chart title and type the following text:
Product Lines: Revenue by Retailer Type and Region
6. Set the Font property for the chart title to Arial, 12pt, Bold.
7. Expand Axis titles, click the horizontal axis title, and set the Visible property to No.
Steps to Specify the Drill Behavior
1. From the Data menu, click Drill Behavior.
2. Select the Allow drill-up and drill-down check box.
3. Run the dashboard to view what it will look like for your users.
Users can drill up or drill down on values in the report to view related information.
Professional Authoring User Guide 243
Chapter 9: Dimensional Reporting Style
Need More Help?
● Creating Report Templates
● Add Relational Data to a Report or Add Dimensional Data to a Report
● Specify the Properties of a Gauge Chart
● Specify the Height and Width of an Object
● Specify the Report Font
● Example - Customize the Axis Titles
● Create a Drill-up/Drill-down Report
244 Report Studio
Chapter 9: Dimensional Reporting Style
Chapter 10: Using the Expression Editor
Using the Expression Editor includes
● understanding dimensional coercion rules
● browsing or searching the values of data items
● understanding how to use quotation marks
● using Member Unique Names (MUNs)
● understanding the limitations when creating certain expressions
● understanding the limitations of creating expressions with specific data sources
● understanding expression components
An expression is any combination of operators, constants, functions, and other components that
evaluates to a single value. You build expressions to create calculation and filter definitions. A cal-
culation is an expression that you use to create a new value from existing values contained within
a data item. A filter is an expression that you use to retrieve a specific subset of records.
The expression editor shows the expression components that are supported by the data source in
which the metadata is stored. For example, if you import metadata from an Oracle data source,
the expression editor shows only the elements that are supported in Oracle.
If you are using a DB2 data source, note that the subtract operator is invalid if you combine the
datatypes timestamp2 and packed decimal.
When creating an expression that will be used in a double-byte environment, such as Japanese, the
only special characters that will work are ASCII-7 and ~ -- || - $ ¢ £ ¬.
Quality of Service Indicators
Not all data sources support functions the same way. The data modeler can set a quality of service
indicator on functions to give a visual clue about the behavior of the functions. Report authors can
use the quality of service indicators to determine which functions to use in a report. The quality of
service indicators are:
● not available (X)
This function is not available for any data source in the package.
● limited availability (!!)
The function is not available for some data sources in the package.
● limited support (!)
The function is available for all data sources in the package but is not naturally supported for
that data source. IBM Cognos 8 uses a local approximation for that function. Because an
approximation is used, performance can be poor and the results may not be what you expect.
Professional Authoring User Guide 245
● unconstrained (no symbol)
The function is available for all data sources.
SAP BW Support
SAP BW does not support all operators or summaries. This can be confusing if you have imported
SAP BW metadata and non-SAP BW metadata into the same model.
SAP BW does not support the following operators:
● like
● lookup
SAP BW does not support the following member summaries:
● date-time
● interval
● interval month
● interval day
● interval day to hour
● interval day to minute
● interval day to second
● interval hour
● interval hour to minute
● interval hour to second
● interval minute
● interval minute to second
● interval second
● interval year
● interval year to month
● moving
● running
● time with time zone
● timestamp with time zone
Cell values are date, number, or time. Attribute values are strings.
246 Report Studio
Chapter 10: Using the Expression Editor
Length of Expressions
When creating layout calculations that use complex expressions, limit the length of the expression
to less than 1,000 tokens. A token is a keyword, identifier, constant, or special character symbol
that the server identifies when it parses the SQL. For example, the expression 1+1+1+1+1+1+1+1+1+1
contains approximately 28 tokens, whereas the expression 1+1+1...+1 (400 times) contains more
than 1000 tokens.
Tip: The Sales Commissions for Central Europe sample report (p. 536) in the GO Data Warehouse
(analysis) package includes expressions. For more information about The Great Outdoors Company
samples, see "Sample Reports and Packages" (p. 521).
Dimensional Coercion RulesTo simplify building expressions, IBM Cognos 8 provides coercion rules that automatically convert
dimensional types. With coercion rules, you can build simpler expressions, making them easier to
understand. In addition to the implicit rules that IBM Cognos 8 provides, you can specify these
rules explicitly by using various functions.
IBM Cognos 8 supports the following types of coercion:
● coercion of an object of one dimensional type into another, such as a level into a member set
● coercion of a dimensional object into a numeric, date, time, or string value, such as a numeric
measure into a numeric value
Coercion rules are applied to expressions and data items. In expressions, an operator or function
may require operands to be of a particular dimensional type. When an operand is not of the required
type, one or more coercion rules may be applied to coerce the operand to the appropriate type.
Coercion rules may also be applied to data items to coerce the data item to a collection of members
or values.
Function Operands
The following describes how coercion rules are applied to function operands:
● If the operand is of the required type, no coercion is required.
● If the function operand is supposed to be a numeric value, it is coerced into one.
A coercion rule exists for each type of dimensional object coercion (p. 249).
● If the function operand is supposed to be a dimensional object and a coercion exists to coerce
the operand to the required type, the coercion is applied.
● If no coercion exists, an error message with the code QE-DEF-0478 appears to indicate that
an unsupported conversion of a dimensional object from the source to target type occurred.
Comparison and Other Symmetric Operators
Binary operators that accept operands of more than one type, such as equals (=) and in, need both
operands to be the same dimensional type.
Professional Authoring User Guide 247
Chapter 10: Using the Expression Editor
No coercion is possible between value domains (numeric, date, time, and string) or between members
and values. Consequently, if either operand is a value type, both must be in the same value domain.
Otherwise, the query fails.
Members and member set operands are valid only with the operators equals (=), not equals (<>),
in, and not in, where the right side of the expression is a member, member set, or prompt. Only
the following are valid:
● [member/member set] = [member]
● [member/member set] <> [member]
● [member/member set] = ?p?
● [member/member set] <> ?p?
● [member/member set] in ([member], ...)[member/member set] not in ([member], ...)
● [member/member set] in ([member set])[member/member set] not in ([member set])[mem-
ber/member set] in ?p?[membermember set] not in ?p?
Exceptions
For the left operand, member sets are supported in detail and summary filter expressions, but not
in expressions that use the filter function. Members are not supported in detail and summary filters,
but they may be used in expressions that use the filter function.
The in_range operator is not supported for members and member sets.
Normal coercion rules apply to these operands.
NULL operands are considered values, rather than members.
Examples
The following examples illustrate how coercion is applied to levels in expressions with operators.
[Sales].[Products].[].[Product Line] = [Sales].[Products].[].[Product Line]->[Outdoor Equipment]
The left operand is coerced to the following member set:
members([Sales].[Products].[].[Product Line])
The following expressions are invalid:
● [Sales].[Products].[].[Product Line] = NULL
● [Sales].[Products].[].[Product Line] + 1
● [Sales].[Products].[].[Product Line] = 'Canada'
● [Sales].[Products].[].[Product Line] > 2000
The following examples illustrate how coercion is applied to members in expressions with operators.
In each of the examples below, the left operand is coerced to a value of the current cell at this
member:
(tuple([Sales].[Products].[].[Product Line]->[Outdoor Equipment]))
248 Report Studio
Chapter 10: Using the Expression Editor
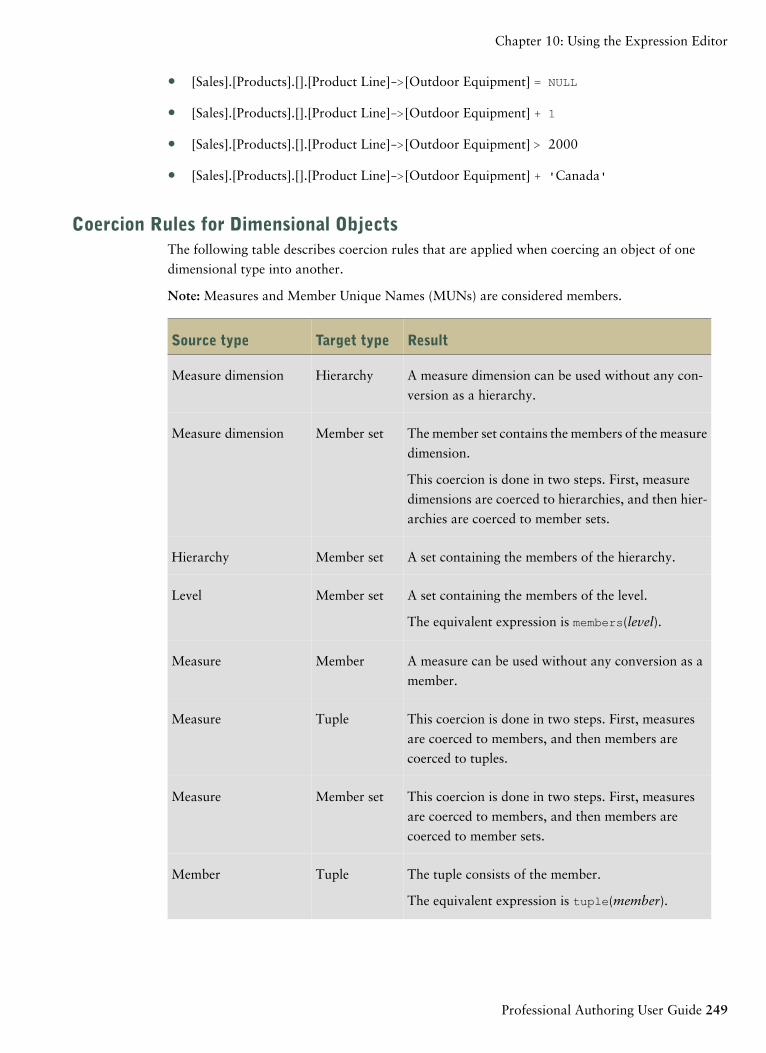
● [Sales].[Products].[].[Product Line]->[Outdoor Equipment] = NULL
● [Sales].[Products].[].[Product Line]->[Outdoor Equipment] + 1
● [Sales].[Products].[].[Product Line]->[Outdoor Equipment] > 2000
● [Sales].[Products].[].[Product Line]->[Outdoor Equipment] + 'Canada'
Coercion Rules for Dimensional ObjectsThe following table describes coercion rules that are applied when coercing an object of one
dimensional type into another.
Note: Measures and Member Unique Names (MUNs) are considered members.
ResultTarget typeSource type
A measure dimension can be used without any con-
version as a hierarchy.
HierarchyMeasure dimension
The member set contains the members of the measure
dimension.
Member setMeasure dimension
This coercion is done in two steps. First, measure
dimensions are coerced to hierarchies, and then hier-
archies are coerced to member sets.
A set containing the members of the hierarchy.Member setHierarchy
A set containing the members of the level.Member setLevel
The equivalent expression is members(level).
A measure can be used without any conversion as a
member.
MemberMeasure
This coercion is done in two steps. First, measures
are coerced to members, and then members are
coerced to tuples.
TupleMeasure
This coercion is done in two steps. First, measures
are coerced to members, and then members are
coerced to member sets.
Member setMeasure
The tuple consists of the member.TupleMember
The equivalent expression is tuple(member).
Professional Authoring User Guide 249
Chapter 10: Using the Expression Editor
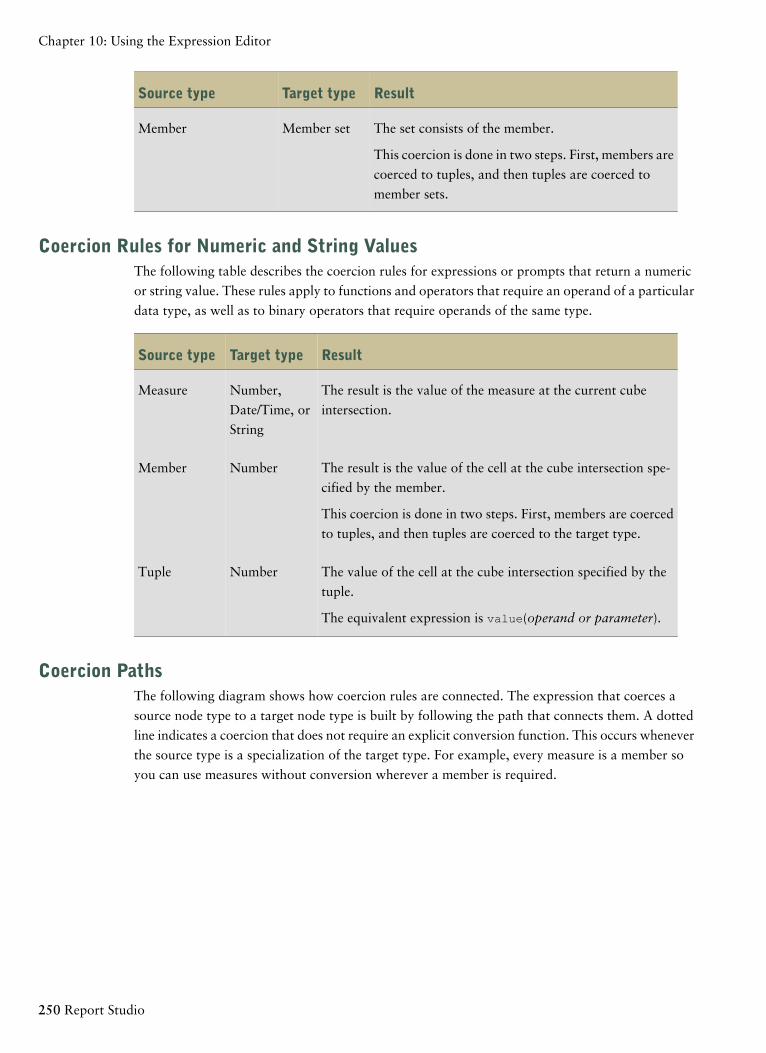
ResultTarget typeSource type
The set consists of the member.Member setMember
This coercion is done in two steps. First, members are
coerced to tuples, and then tuples are coerced to
member sets.
Coercion Rules for Numeric and String ValuesThe following table describes the coercion rules for expressions or prompts that return a numeric
or string value. These rules apply to functions and operators that require an operand of a particular
data type, as well as to binary operators that require operands of the same type.
ResultTarget typeSource type
The result is the value of the measure at the current cube
intersection.
Number,
Date/Time, or
String
Measure
The result is the value of the cell at the cube intersection spe-
cified by the member.
NumberMember
This coercion is done in two steps. First, members are coerced
to tuples, and then tuples are coerced to the target type.
The value of the cell at the cube intersection specified by the
tuple.
NumberTuple
The equivalent expression is value(operand or parameter).
Coercion PathsThe following diagram shows how coercion rules are connected. The expression that coerces a
source node type to a target node type is built by following the path that connects them. A dotted
line indicates a coercion that does not require an explicit conversion function. This occurs whenever
the source type is a specialization of the target type. For example, every measure is a member so
you can use measures without conversion wherever a member is required.
250 Report Studio
Chapter 10: Using the Expression Editor
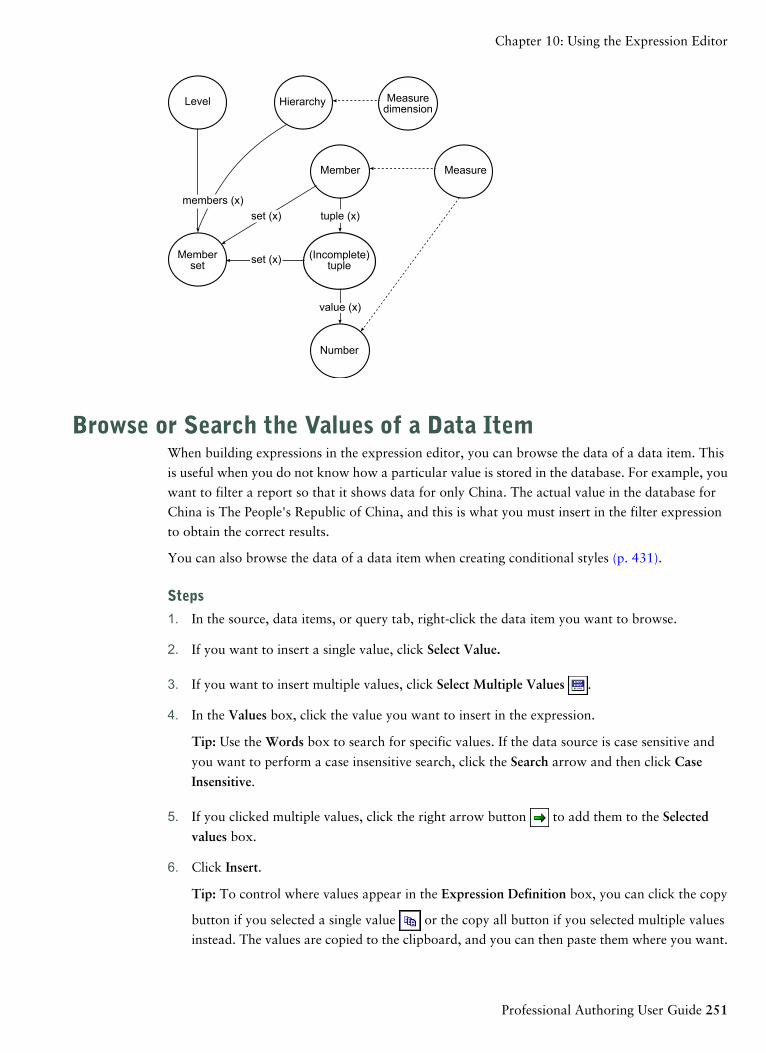
Level Hierarchy Measuredimension
Memberset
Member
(Incomplete)tuple
Number
Measure
set (x) tuple (x)
value (x)
set (x)
members (x)
Browse or Search the Values of a Data ItemWhen building expressions in the expression editor, you can browse the data of a data item. This
is useful when you do not know how a particular value is stored in the database. For example, you
want to filter a report so that it shows data for only China. The actual value in the database for
China is The People's Republic of China, and this is what you must insert in the filter expression
to obtain the correct results.
You can also browse the data of a data item when creating conditional styles (p. 431).
Steps
1. In the source, data items, or query tab, right-click the data item you want to browse.
2. If you want to insert a single value, click Select Value.
3. If you want to insert multiple values, click Select Multiple Values .
4. In the Values box, click the value you want to insert in the expression.
Tip: Use the Words box to search for specific values. If the data source is case sensitive and
you want to perform a case insensitive search, click the Search arrow and then click Case
Insensitive.
5. If you clicked multiple values, click the right arrow button to add them to the Selected
values box.
6. Click Insert.
Tip: To control where values appear in the Expression Definition box, you can click the copy
button if you selected a single value or the copy all button if you selected multiple values
instead. The values are copied to the clipboard, and you can then paste them where you want.
Professional Authoring User Guide 251
Chapter 10: Using the Expression Editor
Searching for Values May Return Unexpected ResultsIn the expression editor, when searching for values for a data item, the results you obtain may
contain unexpected results if the data item is not a string data type. Because users can edit the
expression for a data item, IBM Cognos 8 cannot determine with certainty what the data type is.
Therefore, IBM Cognos 8 guesses the data type of the data item by looking at its aggregate and
rollup aggregate set.
Using Quotation Marks in Literal StringsWhen inserting literal strings in an expression, you must enclose the string in single quotation marks.
If the string contains a quotation mark, it must be escaped. For example, if you want to insert the
string ab'c, you must type 'ab''c'.
Recommendation - Use Member Unique Name (MUN) AliasesIf you are working with a dimensional data source, use MUN aliases to simplify building reports
and expressions. In addition, you can tie the MUN back to the member in the package.
When working with dimensional data sources, IBM Cognos 8 uses MUNs to uniquely identify
members. MUNs are very complex. For example, the MUN for the member 2004 might appear as
[great_outdoors_company].[Years].[Years].[Year]->:[PC].[@MEMBER].[20040101-20041231].
When you are building expressions that involve members, the use of MUNs makes these expressions
difficult to read and maintain.
Tip: To view the MUN of a member, in the Insertable Objects pane, on the Source tab , right-
click the member and click Properties.
Report Studio has an option that automatically generates an alias for MUNs (p. 53). The MUN
alias is a data item that has the MUN as its definition. For the previous example, you would see
2004 as the data item, and the MUN would appear in the data item's Expression property. Enable
this option to produce a MUN alias whenever you add a member to a report or expression.
Note: Do not modify or rename MUN aliases, because they will lose their connection to their
respective members in the package.
Running a Report That Contains MembersIf you are using members in a report and your modeler has updated the data source in a way that
changes member unique names, the following problems may arise when you run the report.
● If the report queries an OLAP data source, you receive an error message explaining that some
specific members cannot be found.
● If the report queries a dimensionally modeled relational (DMR) data source, data items whose
member unique names have changed do not appear in the report. Calculations that refer to
members that have changed no longer contain values from the members.
252 Report Studio
Chapter 10: Using the Expression Editor
To resolve these problems, you must update the member unique names in the report. Open the
query that contains the members that you need to update in Query Explorer. Delete the member
from the pane in which it appears and reinsert it from the Source tab. For example, if you inserted
the member as a detail filter, delete it from the Detail Filters pane and reinsert it.
Functions Not Available When Creating a Report or LayoutExpression
When you create a report expression or a calculation based on a layout expression, unsupported
functions do not appear in the Functions tab of the expression editor. Specifically, there is no
Summaries folder, and some operators, constants, and constructs are also unavailable. These func-
tions are not available because only the database can perform them. Report expressions and calcu-
lations based on layout expressions are performed in Report Studio.
To see the complete list of functions available in the expression editor, except for report functions,
create a detail or group calculation. All functions are available when you create a detail or group
calculation because these calculations are performed in the database and not in Report Studio.
Concatenating StringsWhen IBM Cognos 8 concatenates strings locally and if any of the involved strings contain null
values, the result of the concatenation is an empty cell or a null value. This occurs because IBM
Cognos 8 requires that an expression that involves a null value returns a null value. Many databases
ignore null strings when they perform concatenations. For example, if you concatenate strings A,
B, and C, and if string B is a null value, the database may concatenate only strings A and C.
Limitations for Specific Data SourcesReview the information in these sections if you are using Expression Editor in any of the following
specific situations:
● using SAP BW data sources
● using Excel functions with SSAS 2005 data sources
Creating Expressions Using SAP BW Data SourcesYou must consider the following when creating expressions using an SAP BW data source, or you
may not get the results you expect:
● The case and if/then/else constructs are not supported in filters.
● The query item identifier of the leaf-level of the 0CALDAY characteristic and its presentation
hierarchies is of type date. When the values for the query item identifier are presented in Report
Studio, they are formatted as dates. These formatted values should not be used in filter
expressions. The correct date constant format for use in expressions is YYYY-MM-DD.
● You can apply a comparison expression with an operator other than equals to a query item
that represents a level identifier. However, level identifiers are more efficient for identifying
Professional Authoring User Guide 253
Chapter 10: Using the Expression Editor
specific values. Range comparisons must be performed on the IBM Cognos 8 application server,
which slows down the performance of the report.
Using Excel Functions with SSAS 2005 Data SourcesIf you are working with a Microsoft SQL Server 2005 Analysis Services (SSAS) data source and
you want to use Excel VBA functions such as ROUNDDOWN in MDX queries, the following
Microsoft Office features must be installed on the SSAS server:
● Microsoft Office Excel
● Microsoft Visual Basic for Applications
To see a list of Excel VBA functions, see the Microsoft Web site (http://technet.microsoft.com/en-
us/library/aa178231(SQL.80).aspx).
If these Microsoft Office features are not installed on the SSAS 2005 server, and you use Excel VBA
functions, you encounter an error such as the following: YK-ERR-0008 The data provider returned
an error message: "The '[Excel].[ROUNDDOWN]' function does not exist.".
This error occurs because the OLAP server cannot process the function since Excel function libraries
are missing.
For more information, see the Microsoft Knowledge Base article at http://support.microsoft.com/
kb/932214.
Expression ComponentsTo build an expression, choose from the following:
● operators (p. 255)
● summaries (p. 262)
● member summaries (p. 273)
● constants (p. 276)
● constructs (p. 278)
● business date/time functions (p. 279)
● block functions (p. 283)
● macro functions (p. 284)
● common functions (p. 294)
● DB2 (p. 311)
● Informix (p. 325)
● MS Access (p. 330)
● Oracle (p. 337)
254 Report Studio
Chapter 10: Using the Expression Editor
● Red Brick (p. 345)
● SQL Server (p. 350)
● Teradata (p. 357)
● SAP BW (p. 362)
● Sybase (p. 364)
● report functions (p. 371)
OperatorsOperators specify what happens to the values on either side of the operator. Operators are similar
to functions, in that they manipulate data items and return a result.
(
Inserts an open parenthesis in your expression.
Syntax(exp)
)
Inserts a close parenthesis in your expression.
Syntax(exp)
*
Multiplies two numeric values.
Syntaxvalue1 * value2
,
Separates expression components.
Syntaxexp(param1, param2)
/
Divides two numeric values.
Syntaxvalue1 / value2
||
Concatenates strings.
Professional Authoring User Guide 255
Chapter 10: Using the Expression Editor
Syntaxstring1 || string2
+
Adds two values.
Syntaxvalue1 + value2
-
Subtracts two numeric values or negates a numeric value.
Syntaxvalue1 - value2or- value
<
Compares values against a defined value and retrieves the values that are less than the defined value.
Syntaxvalue1 < value2
<=
Compares values against a defined value and retrieves the values that are less than or equal to the
defined value.
Syntaxvalue1 <= value2
<>
Compares values against a defined value and retrieves the values that are not equal to the defined
value.
Syntaxvalue1 <> value2
=
Compares values against a defined value and retrieves the values that are equal to the defined value.
Syntaxvalue1 = value2
>
Compares values against a defined value and retrieves the values that are greater than the defined
value.
256 Report Studio
Chapter 10: Using the Expression Editor
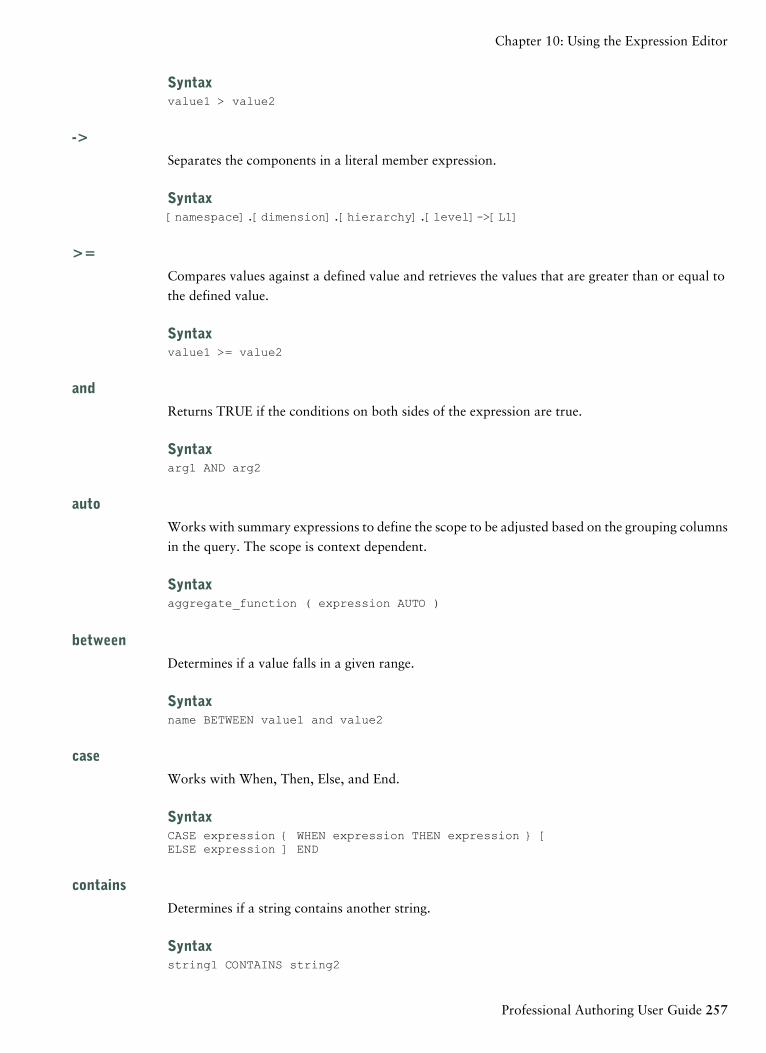
Syntaxvalue1 > value2
->
Separates the components in a literal member expression.
Syntax[namespace].[dimension].[hierarchy].[level]->[L1]
>=
Compares values against a defined value and retrieves the values that are greater than or equal to
the defined value.
Syntaxvalue1 >= value2
and
Returns TRUE if the conditions on both sides of the expression are true.
Syntaxarg1 AND arg2
auto
Works with summary expressions to define the scope to be adjusted based on the grouping columns
in the query. The scope is context dependent.
Syntaxaggregate_function ( expression AUTO )
between
Determines if a value falls in a given range.
Syntaxname BETWEEN value1 and value2
case
Works with When, Then, Else, and End.
SyntaxCASE expression { WHEN expression THEN expression } [ELSE expression ] END
contains
Determines if a string contains another string.
Syntaxstring1 CONTAINS string2
Professional Authoring User Guide 257
Chapter 10: Using the Expression Editor
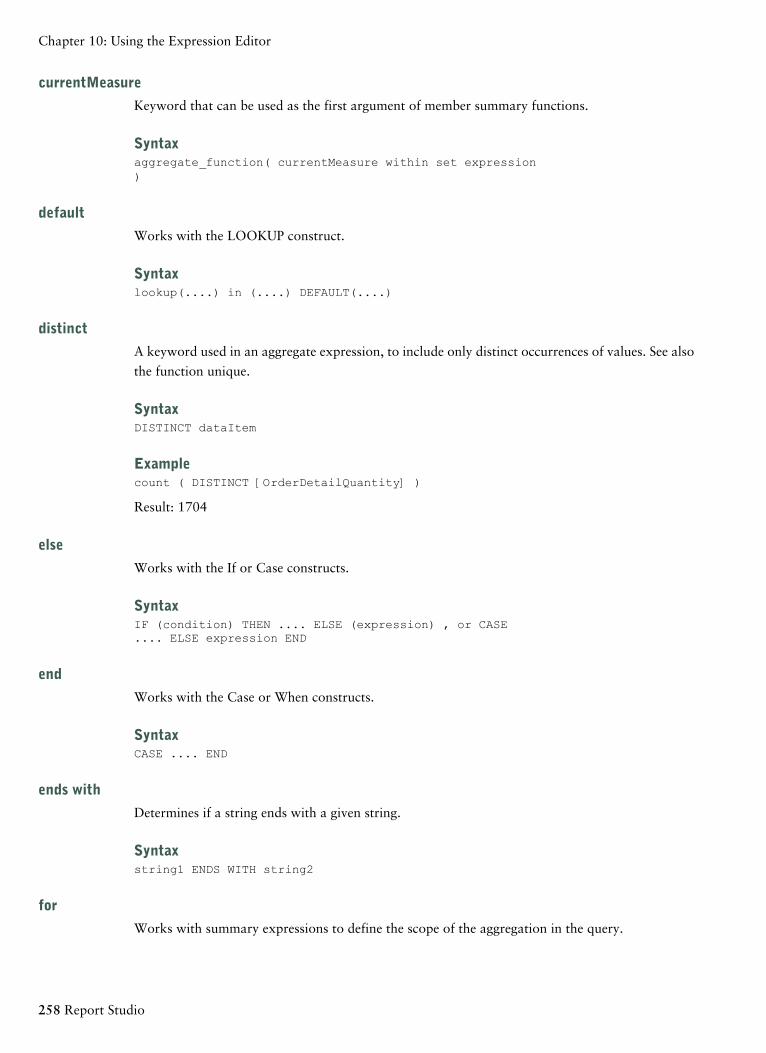
currentMeasure
Keyword that can be used as the first argument of member summary functions.
Syntaxaggregate_function( currentMeasure within set expression)
default
Works with the LOOKUP construct.
Syntaxlookup(....) in (....) DEFAULT(....)
distinct
A keyword used in an aggregate expression, to include only distinct occurrences of values. See also
the function unique.
SyntaxDISTINCT dataItem
Examplecount ( DISTINCT [OrderDetailQuantity] )
Result: 1704
else
Works with the If or Case constructs.
SyntaxIF (condition) THEN .... ELSE (expression) , or CASE.... ELSE expression END
end
Works with the Case or When constructs.
SyntaxCASE .... END
ends with
Determines if a string ends with a given string.
Syntaxstring1 ENDS WITH string2
for
Works with summary expressions to define the scope of the aggregation in the query.
258 Report Studio
Chapter 10: Using the Expression Editor
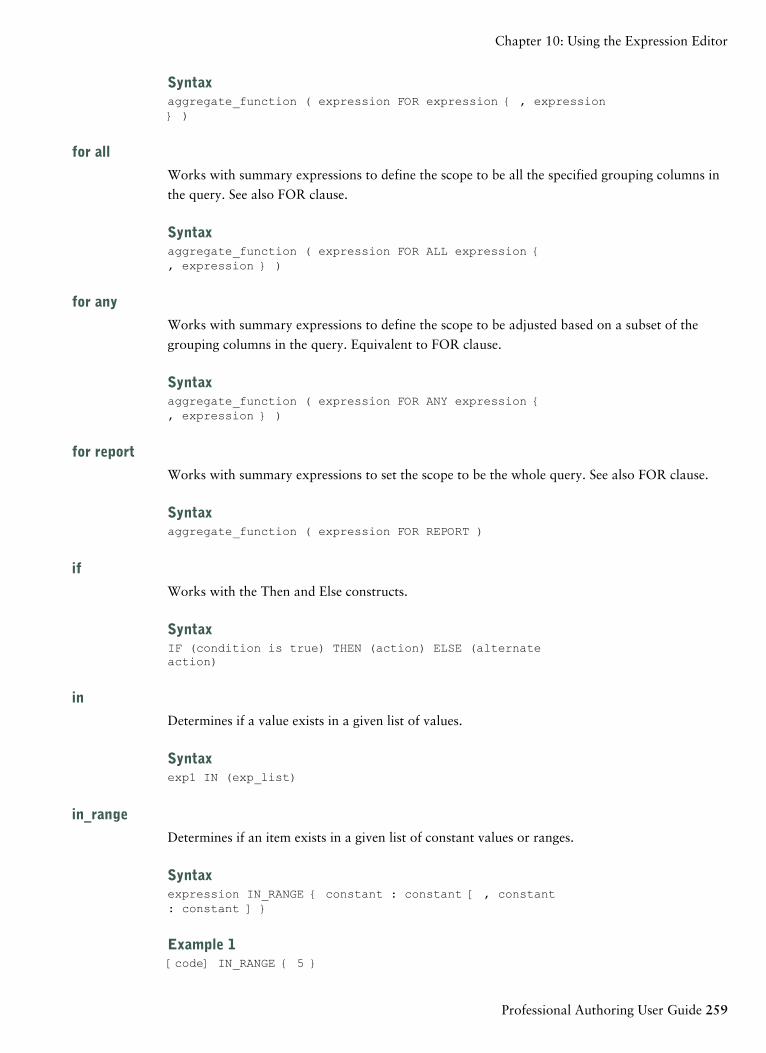
Syntaxaggregate_function ( expression FOR expression { , expression} )
for all
Works with summary expressions to define the scope to be all the specified grouping columns in
the query. See also FOR clause.
Syntaxaggregate_function ( expression FOR ALL expression {, expression } )
for any
Works with summary expressions to define the scope to be adjusted based on a subset of the
grouping columns in the query. Equivalent to FOR clause.
Syntaxaggregate_function ( expression FOR ANY expression {, expression } )
for report
Works with summary expressions to set the scope to be the whole query. See also FOR clause.
Syntaxaggregate_function ( expression FOR REPORT )
if
Works with the Then and Else constructs.
SyntaxIF (condition is true) THEN (action) ELSE (alternateaction)
in
Determines if a value exists in a given list of values.
Syntaxexp1 IN (exp_list)
in_range
Determines if an item exists in a given list of constant values or ranges.
Syntaxexpression IN_RANGE { constant : constant [ , constant: constant ] }
Example 1[code] IN_RANGE { 5 }
Professional Authoring User Guide 259
Chapter 10: Using the Expression Editor
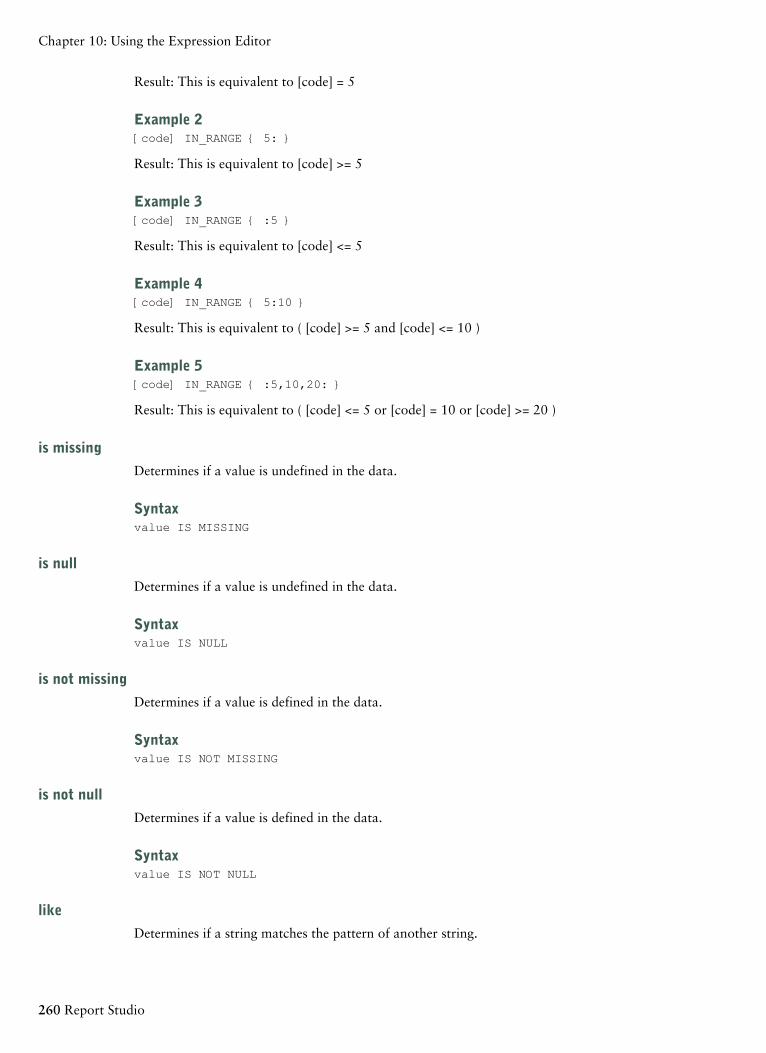
Result: This is equivalent to [code] = 5
Example 2[code] IN_RANGE { 5: }
Result: This is equivalent to [code] >= 5
Example 3[code] IN_RANGE { :5 }
Result: This is equivalent to [code] <= 5
Example 4[code] IN_RANGE { 5:10 }
Result: This is equivalent to ( [code] >= 5 and [code] <= 10 )
Example 5[code] IN_RANGE { :5,10,20: }
Result: This is equivalent to ( [code] <= 5 or [code] = 10 or [code] >= 20 )
is missing
Determines if a value is undefined in the data.
Syntaxvalue IS MISSING
is null
Determines if a value is undefined in the data.
Syntaxvalue IS NULL
is not missing
Determines if a value is defined in the data.
Syntaxvalue IS NOT MISSING
is not null
Determines if a value is defined in the data.
Syntaxvalue IS NOT NULL
like
Determines if a string matches the pattern of another string.
260 Report Studio
Chapter 10: Using the Expression Editor
Syntaxstring1 LIKE string2
lookup
Finds and replaces data with a value you specify. It is preferable to use the CASE construct.
SyntaxLOOKUP (name) in (value1 --> value2) default (expression)
Examplelookup([Country]) in ('Canada'-->([List Price] * 0.60),'Australia'-->([List Price] * 0.80)) default([List Price])
not
Returns TRUE if the condition is false, otherwise returns FALSE.
SyntaxNOT arg
or
Returns TRUE if either of the two conditions on both sides of the expression are true.
Syntaxarg1 OR arg2
prefilter
Performs a summary calculation before applying the summary filter.
Syntaxsummary ([expression] PREFILTER)
rows
Counts the number of rows output by the query. Use with Count().
Syntaxcount(ROWS)
starts with
Determines if a string starts with a given string.
Syntaxstring1 STARTS WITH string2
then
Works with the If or Case constructs.
Professional Authoring User Guide 261
Chapter 10: Using the Expression Editor
SyntaxIF (condition) THEN ...., or CASE expression WHEN expressionTHEN .... END
when
Works with the Case construct.
SyntaxCASE [expression] WHEN .... END
SummariesThis list contains predefined functions that return either a single summary value for a group of
related values or a different summary value for each instance of a group of related values.
aggregate
Returns a calculated value using the appropriate aggregation function, based on the aggregation
type of the expression.
Syntaxaggregate ( expr [ auto ] )aggregate ( expr for [ all | any ] expr { , expr } )aggregate ( expr for report )
average
Returns the average value of selected data items. The keyword distinct is available for backward
compatibility of expressions used in previous versions of the product.
Syntaxaverage ( [ distinct ] expr [ auto ] )average ( [ distinct ] expr for [ all | any ] expr { , expr } )average ( [ distinct ] expr for report )
Exampleaverage ( Sales )
Result: The average of all Sales values.
count
Returns the number of selected data items excluding NULL values. The keyword distinct is available
for backward compatibility of expressions used in previous versions of the product.
Syntaxcount ( [ distinct ] expr [ auto ] )count ( [ distinct ] expr for [ all | any ] expr { , expr } )count ( [ distinct ] expr for report )
Examplecount ( Sales )
Result: The total number of entries under Sales.
262 Report Studio
Chapter 10: Using the Expression Editor
maximum
Returns the maximum value of selected data items. The keyword distinct is available for backward
compatibility of expressions used in previous versions of the product.
Syntaxmaximum ( [ distinct ] expr [ auto ] )maximum ( [ distinct ] expr for [ all | any ] expr { , expr } )maximum ( [ distinct ] expr for report )
Examplemaximum ( Sales )
Result: The maximum value of all Sales values.
median
Returns the median value of selected data items.
Syntaxmedian ( expr [ auto ] )median ( expr for [ all | any ] expr { , expr } )median ( expr for report )
minimum
Returns the minimum value of selected data items. The keyword distinct is available for backward
compatibility of expressions used in previous versions of the product.
Syntaxminimum ( [ distinct ] expr [ auto ] )minimum ( [ distinct ] expr for [ all | any ] expr { , expr } )minimum ( [ distinct ] expr for report )
Exampleminimum ( Sales )
Result: The minimum value of all Sales values.
moving-average
Returns a moving average by row for a specified set of values of over a specified number of rows.
The "<for-option>" defines the scope of the function. The "at" option defines the level of aggregation
and can only be used in the context of relational datasources. The keyword distinct is available for
backward compatibility of expressions used in previous versions of the product.
Syntaxmoving-average ( numeric_expr , numeric_expr [ at exp{, expr } ] [ <for-option> ] [ prefilter ] )moving-average ( [ distinct ] numeric_expr , numeric_expr [ <for-option>] [ prefilter ] )<for-option> ::= for expr {, expr } | for report | auto
Examplemoving-average ( Qty, 3 )
Professional Authoring User Guide 263
Chapter 10: Using the Expression Editor
Result: For each row, this displays the quantity and a moving average of the current row and the
preceding two rows.
Moving-Average (Qty, 3)Qty
------ ------------------------------------
200 200
700 450
400 433.3333
200 433.3333
200 266.6667
500 300.0000
moving-total
Returns a moving total by row for a specified set of values over a specified number of rows. The
"<for-option>" defines the scope of the function. The "at" option defines the level of aggregation
and can only be used in the context of relational datasources. The keyword "distinct" is available
for backward compatibility of expressions used in previous versions of the product.
Syntaxmoving-total ( numeric_expr , numeric_expr [ at exp{, expr } ] [ <for-option> ] [ prefilter ] )moving-total ( [ distinct ] numeric_expr , numeric_expr [ <for-option>] [ prefilter ] )<for-option> ::= for expr {, expr } | for report | auto
Examplemoving-total ( Quantity, 3 )
Result: For each row, this displays the quantity and a moving total of the current row and the pre-
ceding two rows.
Moving-Total (Qty, 3)Qty
------ --------------------------------
200 200
700 900
400 1300
200 1300
200 800
500 900
percentage
Returns the percent of the total value for selected data items. The "<for-option>" defines the scope
of the function. The "at" option defines the level of aggregation and can only be used in the context
264 Report Studio
Chapter 10: Using the Expression Editor
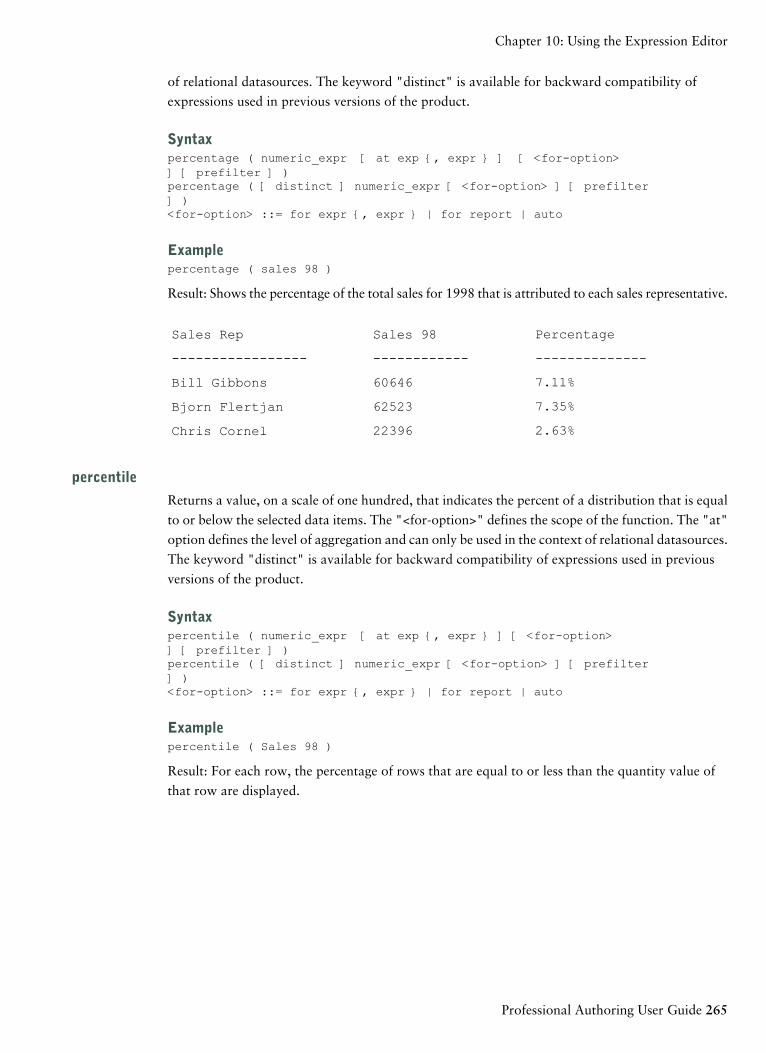
of relational datasources. The keyword "distinct" is available for backward compatibility of
expressions used in previous versions of the product.
Syntaxpercentage ( numeric_expr [ at exp {, expr } ] [ <for-option>] [ prefilter ] )percentage ( [ distinct ] numeric_expr [ <for-option> ] [ prefilter] )<for-option> ::= for expr {, expr } | for report | auto
Examplepercentage ( sales 98 )
Result: Shows the percentage of the total sales for 1998 that is attributed to each sales representative.
PercentageSales 98Sales Rep
-------------------------------------------
7.11%60646Bill Gibbons
7.35%62523Bjorn Flertjan
2.63%22396Chris Cornel
percentile
Returns a value, on a scale of one hundred, that indicates the percent of a distribution that is equal
to or below the selected data items. The "<for-option>" defines the scope of the function. The "at"
option defines the level of aggregation and can only be used in the context of relational datasources.
The keyword "distinct" is available for backward compatibility of expressions used in previous
versions of the product.
Syntaxpercentile ( numeric_expr [ at exp {, expr } ] [ <for-option>] [ prefilter ] )percentile ( [ distinct ] numeric_expr [ <for-option> ] [ prefilter] )<for-option> ::= for expr {, expr } | for report | auto
Examplepercentile ( Sales 98 )
Result: For each row, the percentage of rows that are equal to or less than the quantity value of
that row are displayed.
Professional Authoring User Guide 265
Chapter 10: Using the Expression Editor
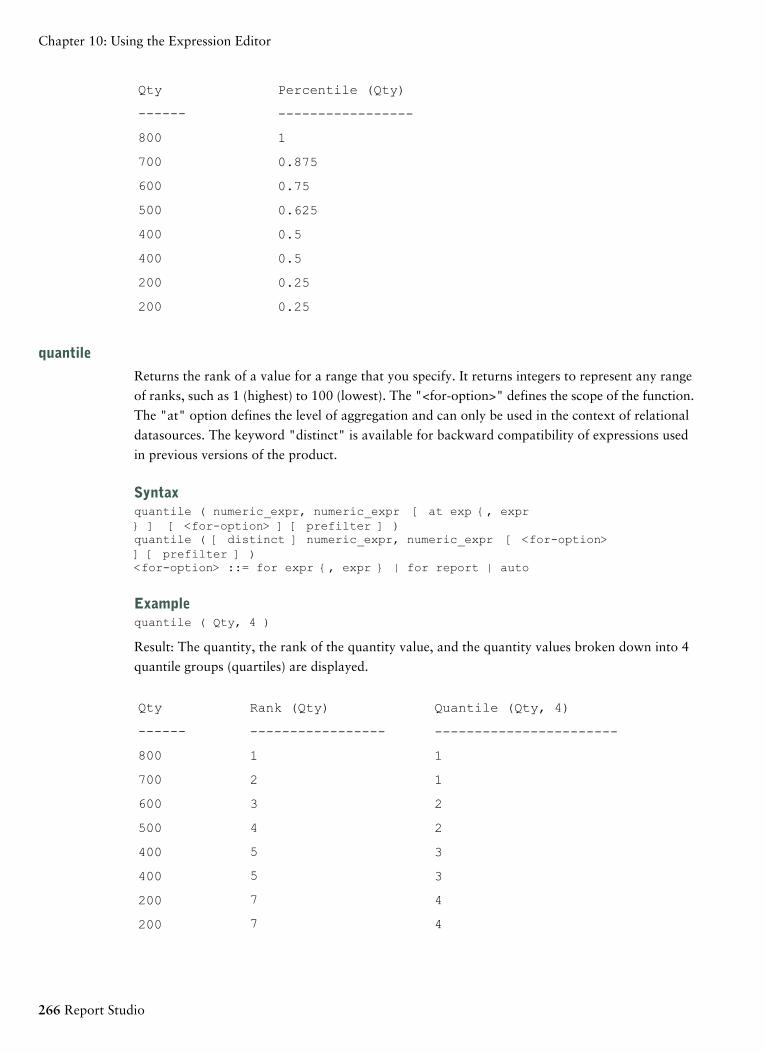
Percentile (Qty)Qty
------ -----------------
800 1
700 0.875
600 0.75
500 0.625
400 0.5
400 0.5
200 0.25
200 0.25
quantile
Returns the rank of a value for a range that you specify. It returns integers to represent any range
of ranks, such as 1 (highest) to 100 (lowest). The "<for-option>" defines the scope of the function.
The "at" option defines the level of aggregation and can only be used in the context of relational
datasources. The keyword "distinct" is available for backward compatibility of expressions used
in previous versions of the product.
Syntaxquantile ( numeric_expr, numeric_expr [ at exp {, expr} ] [ <for-option> ] [ prefilter ] )quantile ( [ distinct ] numeric_expr, numeric_expr [ <for-option>] [ prefilter ] )<for-option> ::= for expr {, expr } | for report | auto
Examplequantile ( Qty, 4 )
Result: The quantity, the rank of the quantity value, and the quantity values broken down into 4
quantile groups (quartiles) are displayed.
Quantile (Qty, 4)Rank (Qty)Qty
------ ----------------------------------------
800 11
700 12
600 23
500 24
5400 3
5400 3
7200 4
7200 4
266 Report Studio
Chapter 10: Using the Expression Editor
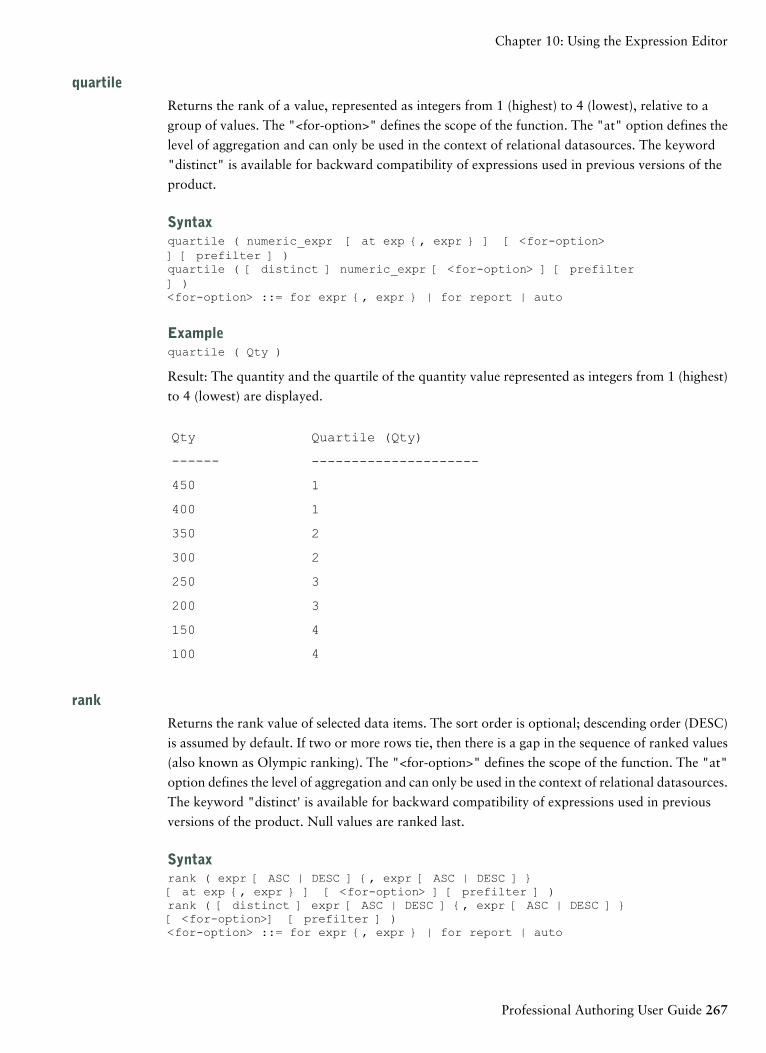
quartile
Returns the rank of a value, represented as integers from 1 (highest) to 4 (lowest), relative to a
group of values. The "<for-option>" defines the scope of the function. The "at" option defines the
level of aggregation and can only be used in the context of relational datasources. The keyword
"distinct" is available for backward compatibility of expressions used in previous versions of the
product.
Syntaxquartile ( numeric_expr [ at exp {, expr } ] [ <for-option>] [ prefilter ] )quartile ( [ distinct ] numeric_expr [ <for-option> ] [ prefilter] )<for-option> ::= for expr {, expr } | for report | auto
Examplequartile ( Qty )
Result: The quantity and the quartile of the quantity value represented as integers from 1 (highest)
to 4 (lowest) are displayed.
Quartile (Qty)Qty
------ ---------------------
450 1
400 1
350 2
300 2
250 3
200 3
150 4
4100
rank
Returns the rank value of selected data items. The sort order is optional; descending order (DESC)
is assumed by default. If two or more rows tie, then there is a gap in the sequence of ranked values
(also known as Olympic ranking). The "<for-option>" defines the scope of the function. The "at"
option defines the level of aggregation and can only be used in the context of relational datasources.
The keyword "distinct' is available for backward compatibility of expressions used in previous
versions of the product. Null values are ranked last.
Syntaxrank ( expr [ ASC | DESC ] {, expr [ ASC | DESC ] }[ at exp {, expr } ] [ <for-option> ] [ prefilter ] )rank ( [ distinct ] expr [ ASC | DESC ] {, expr [ ASC | DESC ] }[ <for-option>] [ prefilter ] )<for-option> ::= for expr {, expr } | for report | auto
Professional Authoring User Guide 267
Chapter 10: Using the Expression Editor
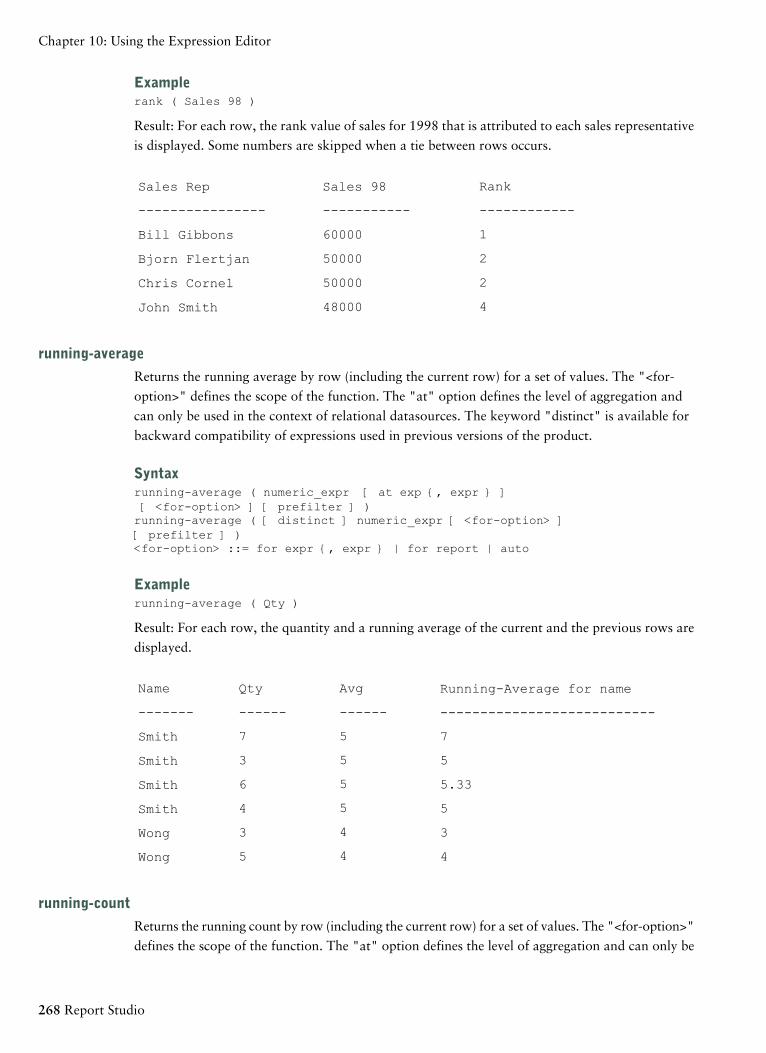
Examplerank ( Sales 98 )
Result: For each row, the rank value of sales for 1998 that is attributed to each sales representative
is displayed. Some numbers are skipped when a tie between rows occurs.
RankSales 98Sales Rep
---------------------------------------
160000Bill Gibbons
250000Bjorn Flertjan
250000Chris Cornel
448000John Smith
running-average
Returns the running average by row (including the current row) for a set of values. The "<for-
option>" defines the scope of the function. The "at" option defines the level of aggregation and
can only be used in the context of relational datasources. The keyword "distinct" is available for
backward compatibility of expressions used in previous versions of the product.
Syntaxrunning-average ( numeric_expr [ at exp {, expr } ][ <for-option> ] [ prefilter ] )running-average ( [ distinct ] numeric_expr [ <for-option> ][ prefilter ] )<for-option> ::= for expr {, expr } | for report | auto
Examplerunning-average ( Qty )
Result: For each row, the quantity and a running average of the current and the previous rows are
displayed.
Running-Average for nameAvgQtyName
------------------- ---------------------------
57Smith 7
53Smith 5
56Smith 5.33
54Smith 5
43Wong 3
45Wong 4
running-count
Returns the running count by row (including the current row) for a set of values. The "<for-option>"
defines the scope of the function. The "at" option defines the level of aggregation and can only be
268 Report Studio
Chapter 10: Using the Expression Editor
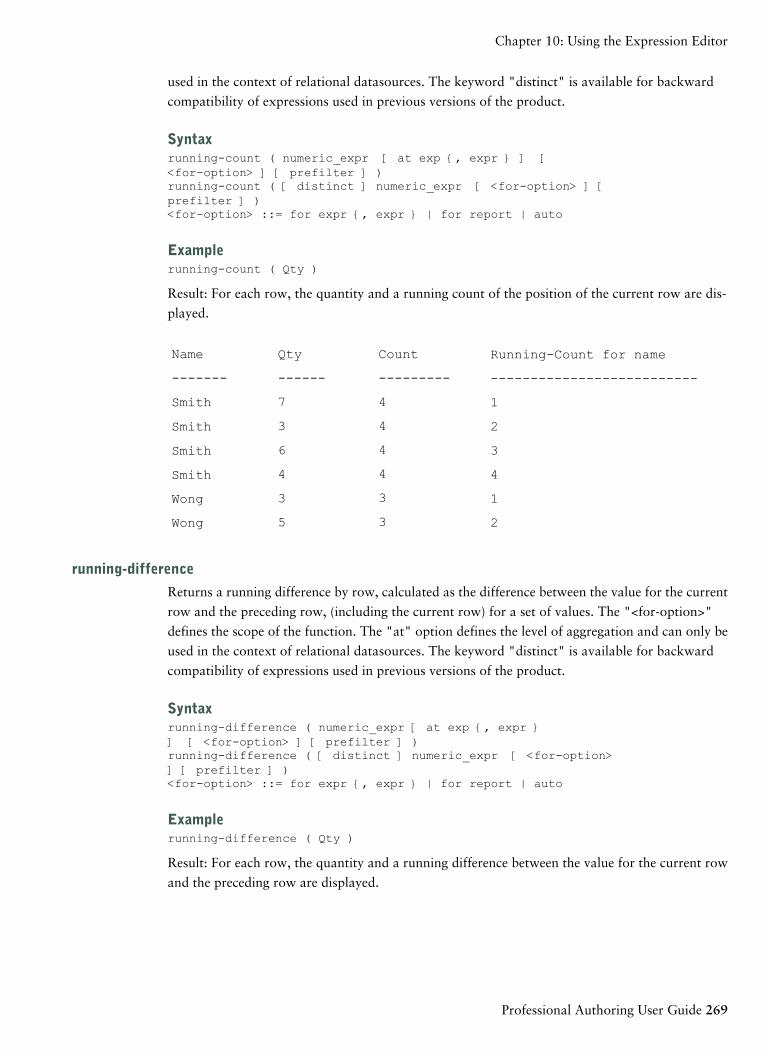
used in the context of relational datasources. The keyword "distinct" is available for backward
compatibility of expressions used in previous versions of the product.
Syntaxrunning-count ( numeric_expr [ at exp {, expr } ] [<for-option> ] [ prefilter ] )running-count ( [ distinct ] numeric_expr [ <for-option> ] [prefilter ] )<for-option> ::= for expr {, expr } | for report | auto
Examplerunning-count ( Qty )
Result: For each row, the quantity and a running count of the position of the current row are dis-
played.
Running-Count for nameCountQtyName
---------------------- --------------------------
47Smith 1
43Smith 2
46Smith 3
44Smith 4
33Wong 1
35Wong 2
running-difference
Returns a running difference by row, calculated as the difference between the value for the current
row and the preceding row, (including the current row) for a set of values. The "<for-option>"
defines the scope of the function. The "at" option defines the level of aggregation and can only be
used in the context of relational datasources. The keyword "distinct" is available for backward
compatibility of expressions used in previous versions of the product.
Syntaxrunning-difference ( numeric_expr [ at exp {, expr }] [ <for-option> ] [ prefilter ] )running-difference ( [ distinct ] numeric_expr [ <for-option>] [ prefilter ] )<for-option> ::= for expr {, expr } | for report | auto
Examplerunning-difference ( Qty )
Result: For each row, the quantity and a running difference between the value for the current row
and the preceding row are displayed.
Professional Authoring User Guide 269
Chapter 10: Using the Expression Editor
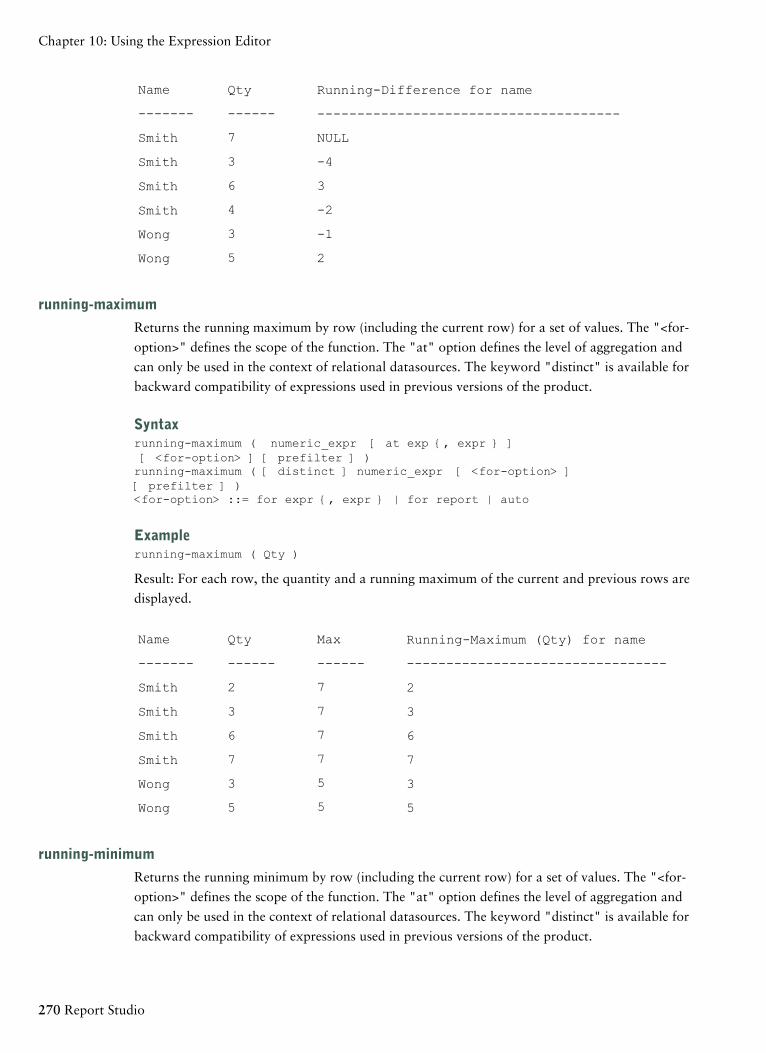
Running-Difference for nameQtyName
------------- --------------------------------------
7Smith NULL
3Smith -4
6Smith 3
4Smith -2
3Wong -1
5Wong 2
running-maximum
Returns the running maximum by row (including the current row) for a set of values. The "<for-
option>" defines the scope of the function. The "at" option defines the level of aggregation and
can only be used in the context of relational datasources. The keyword "distinct" is available for
backward compatibility of expressions used in previous versions of the product.
Syntaxrunning-maximum ( numeric_expr [ at exp {, expr } ][ <for-option> ] [ prefilter ] )running-maximum ( [ distinct ] numeric_expr [ <for-option> ][ prefilter ] )<for-option> ::= for expr {, expr } | for report | auto
Examplerunning-maximum ( Qty )
Result: For each row, the quantity and a running maximum of the current and previous rows are
displayed.
Running-Maximum (Qty) for nameMaxQtyName
------------------- ---------------------------------
72Smith 2
73Smith 3
76Smith 6
77Smith 7
53Wong 3
55Wong 5
running-minimum
Returns the running minimum by row (including the current row) for a set of values. The "<for-
option>" defines the scope of the function. The "at" option defines the level of aggregation and
can only be used in the context of relational datasources. The keyword "distinct" is available for
backward compatibility of expressions used in previous versions of the product.
270 Report Studio
Chapter 10: Using the Expression Editor
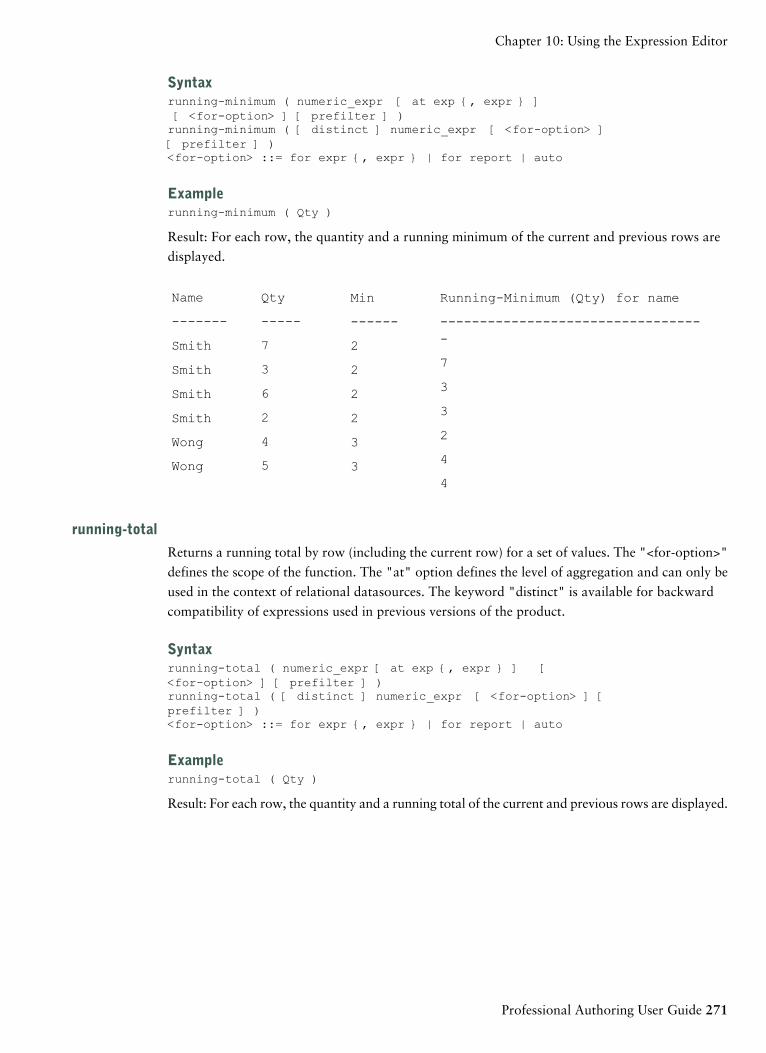
Syntaxrunning-minimum ( numeric_expr [ at exp {, expr } ][ <for-option> ] [ prefilter ] )running-minimum ( [ distinct ] numeric_expr [ <for-option> ][ prefilter ] )<for-option> ::= for expr {, expr } | for report | auto
Examplerunning-minimum ( Qty )
Result: For each row, the quantity and a running minimum of the current and previous rows are
displayed.
Running-Minimum (Qty) for nameMinQtyName
------------ ----------------------------------
------
27Smith723Smith326Smith322Smith234Wong435Wong4
running-total
Returns a running total by row (including the current row) for a set of values. The "<for-option>"
defines the scope of the function. The "at" option defines the level of aggregation and can only be
used in the context of relational datasources. The keyword "distinct" is available for backward
compatibility of expressions used in previous versions of the product.
Syntaxrunning-total ( numeric_expr [ at exp {, expr } ] [<for-option> ] [ prefilter ] )running-total ( [ distinct ] numeric_expr [ <for-option> ] [prefilter ] )<for-option> ::= for expr {, expr } | for report | auto
Examplerunning-total ( Qty )
Result: For each row, the quantity and a running total of the current and previous rows are displayed.
Professional Authoring User Guide 271
Chapter 10: Using the Expression Editor
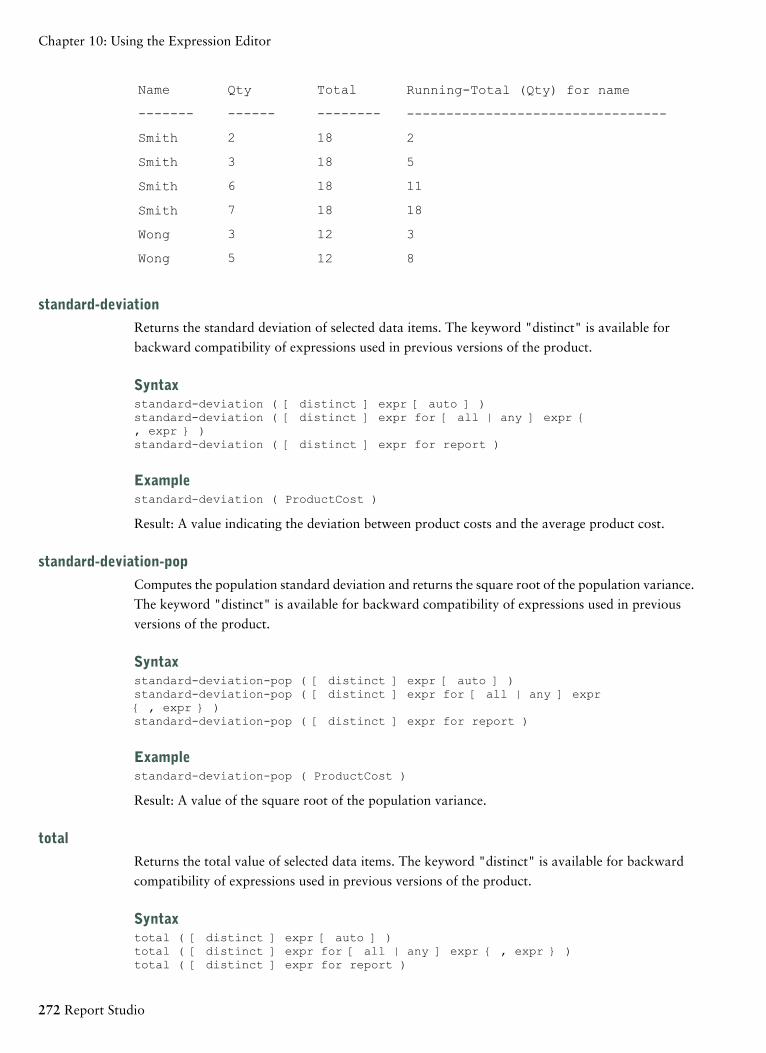
Running-Total (Qty) for nameTotalQtyName
--------------------- ---------------------------------
182Smith 2
183Smith 5
186Smith 11
18187Smith
3123Wong
8125Wong
standard-deviation
Returns the standard deviation of selected data items. The keyword "distinct" is available for
backward compatibility of expressions used in previous versions of the product.
Syntaxstandard-deviation ( [ distinct ] expr [ auto ] )standard-deviation ( [ distinct ] expr for [ all | any ] expr {, expr } )standard-deviation ( [ distinct ] expr for report )
Examplestandard-deviation ( ProductCost )
Result: A value indicating the deviation between product costs and the average product cost.
standard-deviation-pop
Computes the population standard deviation and returns the square root of the population variance.
The keyword "distinct" is available for backward compatibility of expressions used in previous
versions of the product.
Syntaxstandard-deviation-pop ( [ distinct ] expr [ auto ] )standard-deviation-pop ( [ distinct ] expr for [ all | any ] expr{ , expr } )standard-deviation-pop ( [ distinct ] expr for report )
Examplestandard-deviation-pop ( ProductCost )
Result: A value of the square root of the population variance.
total
Returns the total value of selected data items. The keyword "distinct" is available for backward
compatibility of expressions used in previous versions of the product.
Syntaxtotal ( [ distinct ] expr [ auto ] )total ( [ distinct ] expr for [ all | any ] expr { , expr } )total ( [ distinct ] expr for report )
272 Report Studio
Chapter 10: Using the Expression Editor
Exampletotal ( Sales )
Result: The total value of all Sales values.
variance
Returns the variance of selected data items. The keyword "distinct" is available for backward
compatibility of expressions used in previous versions of the product.
Syntaxvariance ( [ distinct ] expr [ auto ] )variance ( [ distinct ] expr for [ all | any ] expr { , expr } )variance ( [ distinct ] expr for report )
Examplevariance ( Product Cost )
Result: A value indicating how widely product costs vary from the average product cost.
variance-pop
Returns the population variance of a set of numbers after discarding the nulls in this set. The
keyword "distinct" is available for backward compatibility of expressions used in previous versions
of the product
Syntaxvariance-pop ( [ distinct ] expr [ auto ] )variance-pop ( [ distinct ] expr for [ all | any ] expr { , expr} )variance-pop ( [ distinct ] expr for report )
Examplevariance-pop ( Qty)
Result: For each row, this displays the population variance of a set of numbers after discarding the
nulls in this set.
Member SummariesThis list contains predefined functions that return either a single summary value for a set of members
or a different summary value for each member of a set of members.
aggregate
Returns a calculated value using the appropriate aggregation function, based on the aggregation
type of the expression.
Syntaxaggregate ( < currentMeasure | numeric_expr > withinset set_expr )aggregate ( < currentMeasure | numeric_expr > within < detail| aggregate > expr )
Professional Authoring User Guide 273
Chapter 10: Using the Expression Editor
average
Returns the average value of the selected data items.
Syntaxaverage ( < currentMeasure | numeric_expr > withinset set_expr )average ( < currentMeasure | numeric_expr > within < detail| aggregate > expr )
count
Returns the number of selected data items excluding NULL values.
Syntaxcount ( < currentMeasure | numeric_expr > within setset_expr )count ( < currentMeasure | numeric_expr > within < detail| aggregate > expr )
maximum
Returns the maximum value of selected data items.
Syntaxmaximum ( < currentMeasure | numeric_expr > withinset set_expr )maximum ( < currentMeasure | numeric_expr > within < detail| aggregate > expr )
median
Returns the median value of selected data items.
Syntaxmedian ( < currentMeasure | numeric_expr > withinset set_expr )median ( < currentMeasure | numeric_expr > within < detail| aggregate > expr )
minimum
Returns the minimum value of selected data items.
Syntaxminimum ( < currentMeasure | numeric_expr > withinset set_expr )minimum ( < currentMeasure | numeric_expr > within < detail| aggregate > expr )
percentage
Returns the percent of the total value for the selected data items.
274 Report Studio
Chapter 10: Using the Expression Editor
Syntaxpercentage ( numeric_expr [ tuple member_expr {, member_expr} ] within set set_expr )
Examplepercentage ( [gosales].[sales measures].[quantity] tuple [gosales].[Staff].[].[department]->[West]within set children([gosales].[Staff].[].[Staff] )
percentile
Returns a value, on a scale from 0 to 100, that indicates the percent of a distribution that is equal
to or below the selected data items.
Syntaxpercentile ( numeric_expr [ tuple member_expr {, member_expr} ] within set set_expr )
quantile
Returns the rank of a value for the specified range. It returns integers to represent any range of
ranks, such as 1 (highest) to 100 (lowest).
Syntaxquantile ( numeric_expr, numeric_expr [ tuple member_expr{, member_expr } ] within set set_expr )
quartile
Returns the rank of a value, represented as integers from 1 (highest) to 4 (lowest), relative to a
group of values.
Syntaxquartile ( numeric_expr [ tuple member_expr {, member_expr} ] within set set_expr )
rank
Returns the rank value of the selected data items. The type of ranking returned (Olympic, dense,
or serial) is data source dependent. The sort order is optional; DESC is assumed by default.
Syntaxrank ( numeric_expr [ ASC | DESC ] [ tuple member_expr{, member_expr } ] within set set_expr )
Examplerank ( [gosales].[sales measures].[quantity] tuple [gosales].[Staff].[].[department]->[West]within set children([gosales].[Staff].[].[Staff] )
standard-deviation
Returns the standard deviation of the selected data items.
Professional Authoring User Guide 275
Chapter 10: Using the Expression Editor
Syntaxstandard-deviation ( < currentMeasure | numeric_expr> within set set_expr )standard-deviation ( < currentMeasure | numeric_expr > within< detail | aggregate > expr )
standard-deviation-pop
Returns the standard deviation population of the selected data items.
Syntaxstandard-deviation-pop ( < currentMeasure | numeric_expr> within set set_expr )standard-deviation-pop ( < currentMeasure | numeric_expr > within< detail | aggregate > expr )
total
Returns the total value of the selected data items.
Syntaxtotal ( < currentMeasure | numeric_expr > within setset_expr )total ( < currentMeasure | numeric_expr > within < detail| aggregate > expr )
variance
Returns the variance of the selected data items.
Syntaxvariance ( < currentMeasure | numeric_expr > withinset set_expr )variance ( < currentMeasure | numeric_expr > within < detail| aggregate > expr )
variance-pop
Returns the variance population of the selected data items.
Syntaxvariance-pop ( < currentMeasure | numeric_expr > withinset set_expr )variance-pop ( < currentMeasure | numeric_expr > within <detail | aggregate > expr )
ConstantsA constant is a fixed value that you can use in an expression.
date
Inserts the current system date.
date-time
Inserts the current system date and time.
276 Report Studio
Chapter 10: Using the Expression Editor
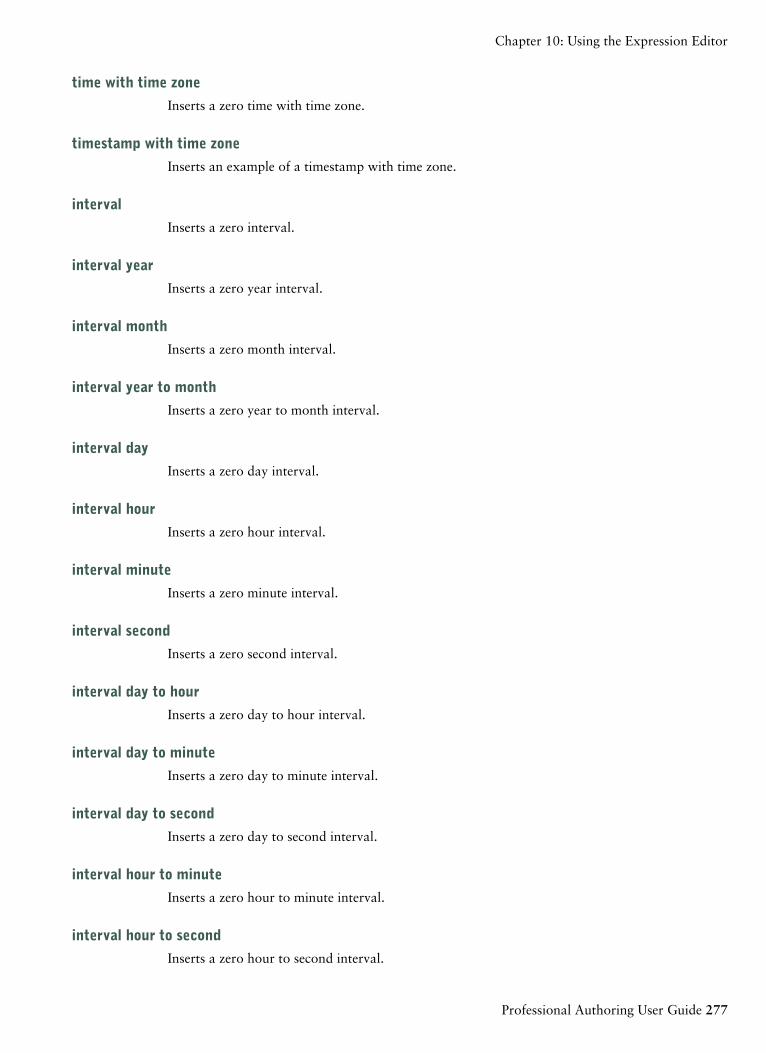
time with time zone
Inserts a zero time with time zone.
timestamp with time zone
Inserts an example of a timestamp with time zone.
interval
Inserts a zero interval.
interval year
Inserts a zero year interval.
interval month
Inserts a zero month interval.
interval year to month
Inserts a zero year to month interval.
interval day
Inserts a zero day interval.
interval hour
Inserts a zero hour interval.
interval minute
Inserts a zero minute interval.
interval second
Inserts a zero second interval.
interval day to hour
Inserts a zero day to hour interval.
interval day to minute
Inserts a zero day to minute interval.
interval day to second
Inserts a zero day to second interval.
interval hour to minute
Inserts a zero hour to minute interval.
interval hour to second
Inserts a zero hour to second interval.
Professional Authoring User Guide 277
Chapter 10: Using the Expression Editor
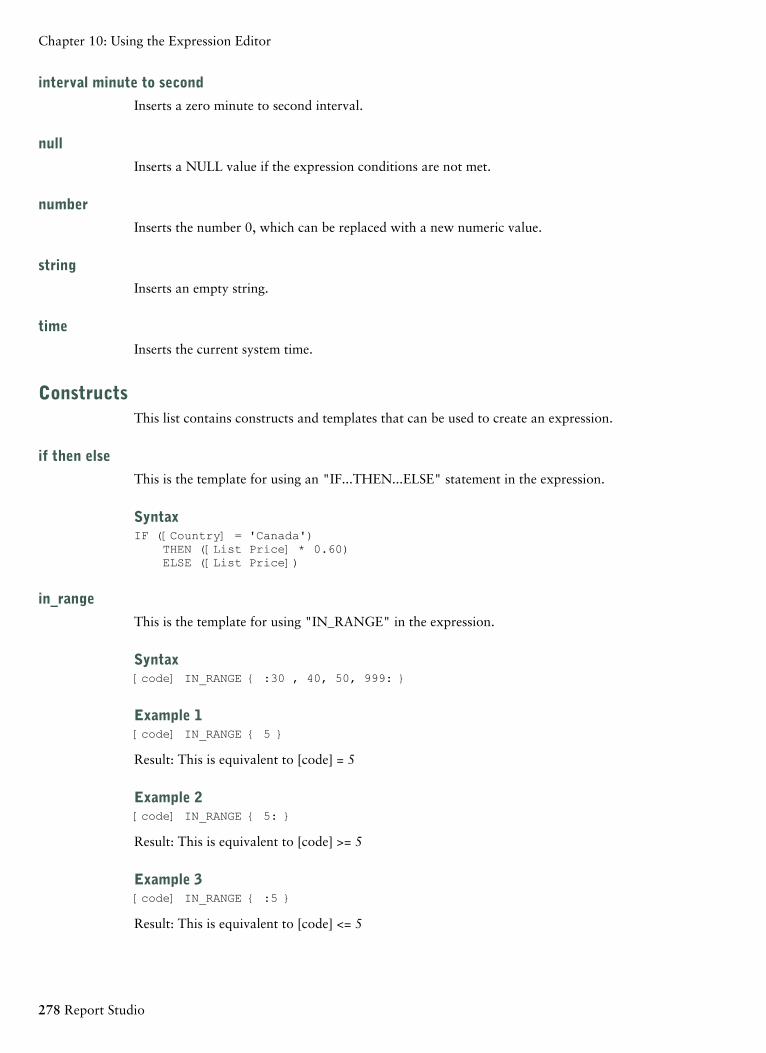
interval minute to second
Inserts a zero minute to second interval.
null
Inserts a NULL value if the expression conditions are not met.
number
Inserts the number 0, which can be replaced with a new numeric value.
string
Inserts an empty string.
time
Inserts the current system time.
ConstructsThis list contains constructs and templates that can be used to create an expression.
if then else
This is the template for using an "IF...THEN...ELSE" statement in the expression.
SyntaxIF ([Country] = 'Canada')
THEN ([List Price] * 0.60)ELSE ([List Price])
in_range
This is the template for using "IN_RANGE" in the expression.
Syntax[code] IN_RANGE { :30 , 40, 50, 999: }
Example 1[code] IN_RANGE { 5 }
Result: This is equivalent to [code] = 5
Example 2[code] IN_RANGE { 5: }
Result: This is equivalent to [code] >= 5
Example 3[code] IN_RANGE { :5 }
Result: This is equivalent to [code] <= 5
278 Report Studio
Chapter 10: Using the Expression Editor
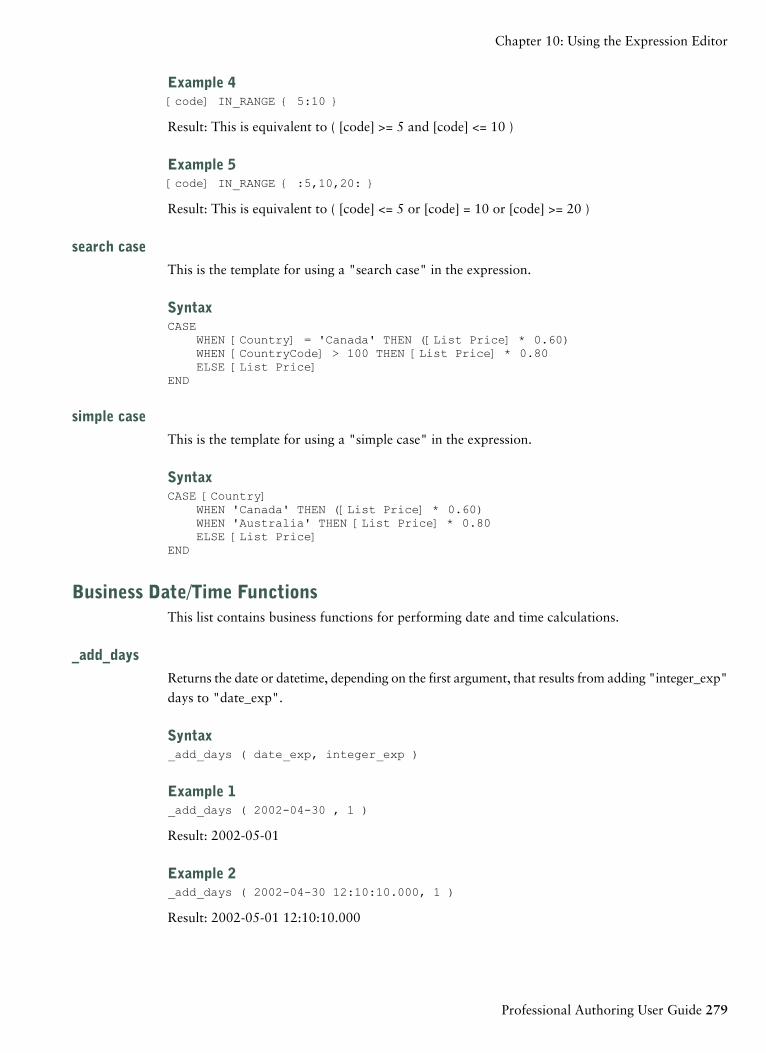
Example 4[code] IN_RANGE { 5:10 }
Result: This is equivalent to ( [code] >= 5 and [code] <= 10 )
Example 5[code] IN_RANGE { :5,10,20: }
Result: This is equivalent to ( [code] <= 5 or [code] = 10 or [code] >= 20 )
search case
This is the template for using a "search case" in the expression.
SyntaxCASE
WHEN [Country] = 'Canada' THEN ([List Price] * 0.60)WHEN [CountryCode] > 100 THEN [List Price] * 0.80ELSE [List Price]
END
simple case
This is the template for using a "simple case" in the expression.
SyntaxCASE [Country]
WHEN 'Canada' THEN ([List Price] * 0.60)WHEN 'Australia' THEN [List Price] * 0.80ELSE [List Price]
END
Business Date/Time FunctionsThis list contains business functions for performing date and time calculations.
_add_days
Returns the date or datetime, depending on the first argument, that results from adding "integer_exp"
days to "date_exp".
Syntax_add_days ( date_exp, integer_exp )
Example 1_add_days ( 2002-04-30 , 1 )
Result: 2002-05-01
Example 2_add_days ( 2002-04-30 12:10:10.000, 1 )
Result: 2002-05-01 12:10:10.000
Professional Authoring User Guide 279
Chapter 10: Using the Expression Editor
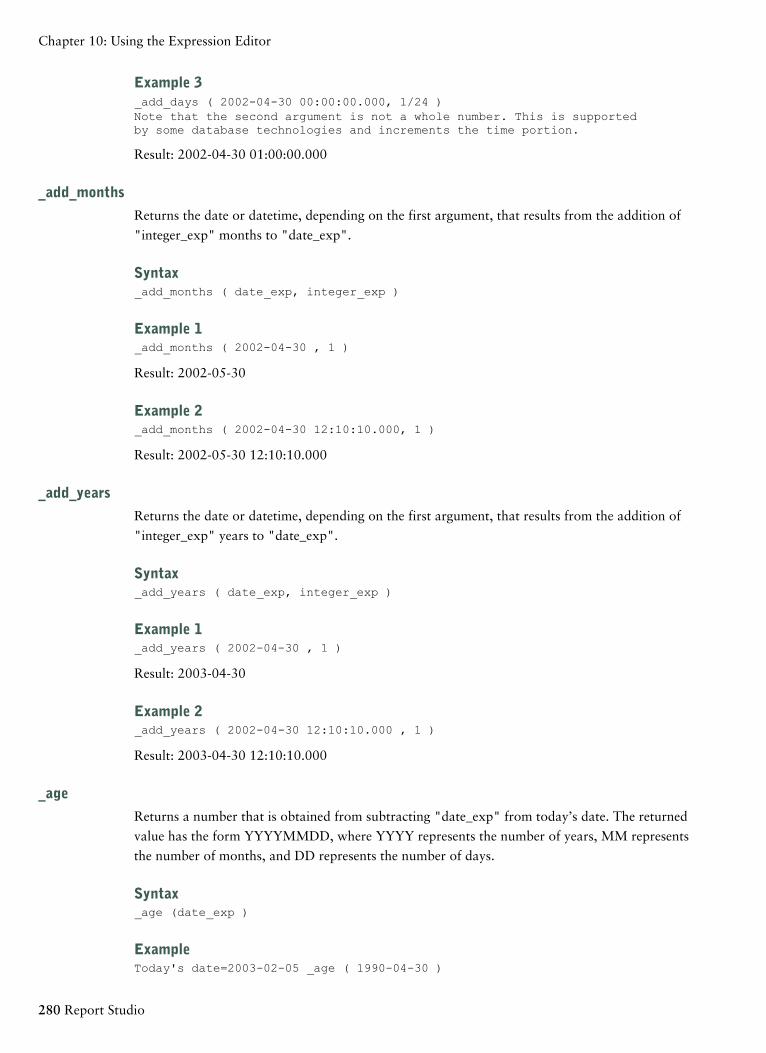
Example 3_add_days ( 2002-04-30 00:00:00.000, 1/24 )Note that the second argument is not a whole number. This is supportedby some database technologies and increments the time portion.
Result: 2002-04-30 01:00:00.000
_add_months
Returns the date or datetime, depending on the first argument, that results from the addition of
"integer_exp" months to "date_exp".
Syntax_add_months ( date_exp, integer_exp )
Example 1_add_months ( 2002-04-30 , 1 )
Result: 2002-05-30
Example 2_add_months ( 2002-04-30 12:10:10.000, 1 )
Result: 2002-05-30 12:10:10.000
_add_years
Returns the date or datetime, depending on the first argument, that results from the addition of
"integer_exp" years to "date_exp".
Syntax_add_years ( date_exp, integer_exp )
Example 1_add_years ( 2002-04-30 , 1 )
Result: 2003-04-30
Example 2_add_years ( 2002-04-30 12:10:10.000 , 1 )
Result: 2003-04-30 12:10:10.000
_age
Returns a number that is obtained from subtracting "date_exp" from today’s date. The returned
value has the form YYYYMMDD, where YYYY represents the number of years, MM represents
the number of months, and DD represents the number of days.
Syntax_age (date_exp )
ExampleToday's date=2003-02-05 _age ( 1990-04-30 )
280 Report Studio
Chapter 10: Using the Expression Editor
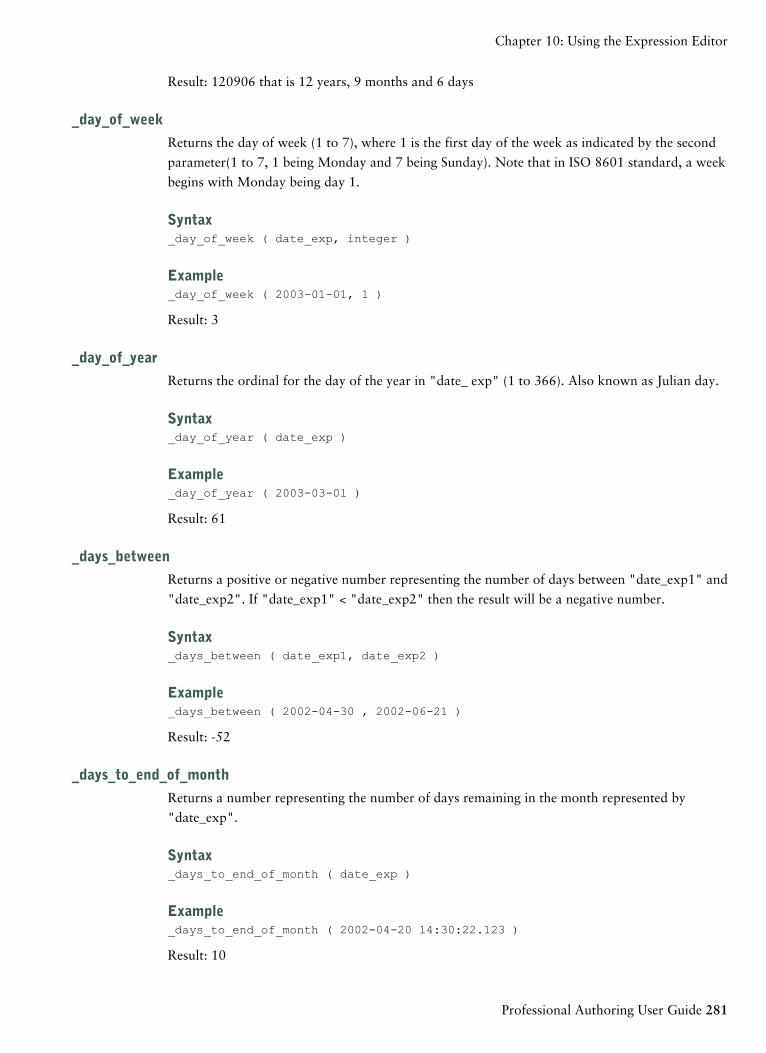
Result: 120906 that is 12 years, 9 months and 6 days
_day_of_week
Returns the day of week (1 to 7), where 1 is the first day of the week as indicated by the second
parameter(1 to 7, 1 being Monday and 7 being Sunday). Note that in ISO 8601 standard, a week
begins with Monday being day 1.
Syntax_day_of_week ( date_exp, integer )
Example_day_of_week ( 2003-01-01, 1 )
Result: 3
_day_of_year
Returns the ordinal for the day of the year in "date_ exp" (1 to 366). Also known as Julian day.
Syntax_day_of_year ( date_exp )
Example_day_of_year ( 2003-03-01 )
Result: 61
_days_between
Returns a positive or negative number representing the number of days between "date_exp1" and
"date_exp2". If "date_exp1" < "date_exp2" then the result will be a negative number.
Syntax_days_between ( date_exp1, date_exp2 )
Example_days_between ( 2002-04-30 , 2002-06-21 )
Result: -52
_days_to_end_of_month
Returns a number representing the number of days remaining in the month represented by
"date_exp".
Syntax_days_to_end_of_month ( date_exp )
Example_days_to_end_of_month ( 2002-04-20 14:30:22.123 )
Result: 10
Professional Authoring User Guide 281
Chapter 10: Using the Expression Editor
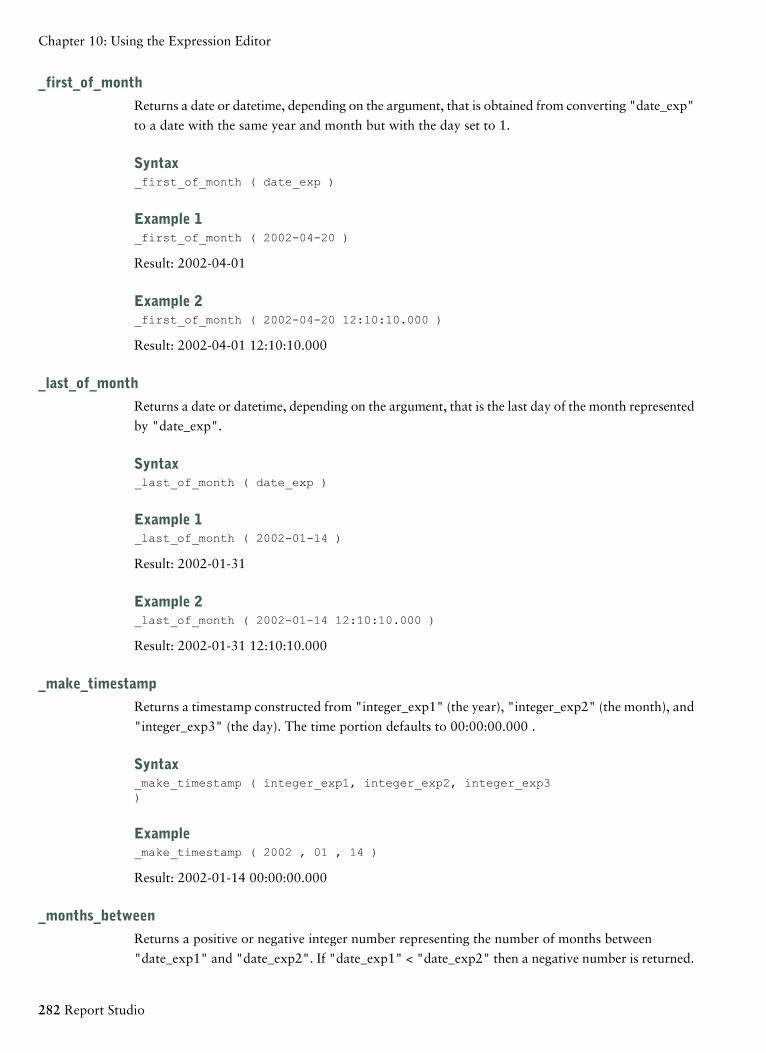
_first_of_month
Returns a date or datetime, depending on the argument, that is obtained from converting "date_exp"
to a date with the same year and month but with the day set to 1.
Syntax_first_of_month ( date_exp )
Example 1_first_of_month ( 2002-04-20 )
Result: 2002-04-01
Example 2_first_of_month ( 2002-04-20 12:10:10.000 )
Result: 2002-04-01 12:10:10.000
_last_of_month
Returns a date or datetime, depending on the argument, that is the last day of the month represented
by "date_exp".
Syntax_last_of_month ( date_exp )
Example 1_last_of_month ( 2002-01-14 )
Result: 2002-01-31
Example 2_last_of_month ( 2002-01-14 12:10:10.000 )
Result: 2002-01-31 12:10:10.000
_make_timestamp
Returns a timestamp constructed from "integer_exp1" (the year), "integer_exp2" (the month), and
"integer_exp3" (the day). The time portion defaults to 00:00:00.000 .
Syntax_make_timestamp ( integer_exp1, integer_exp2, integer_exp3)
Example_make_timestamp ( 2002 , 01 , 14 )
Result: 2002-01-14 00:00:00.000
_months_between
Returns a positive or negative integer number representing the number of months between
"date_exp1" and "date_exp2". If "date_exp1" < "date_exp2" then a negative number is returned.
282 Report Studio
Chapter 10: Using the Expression Editor
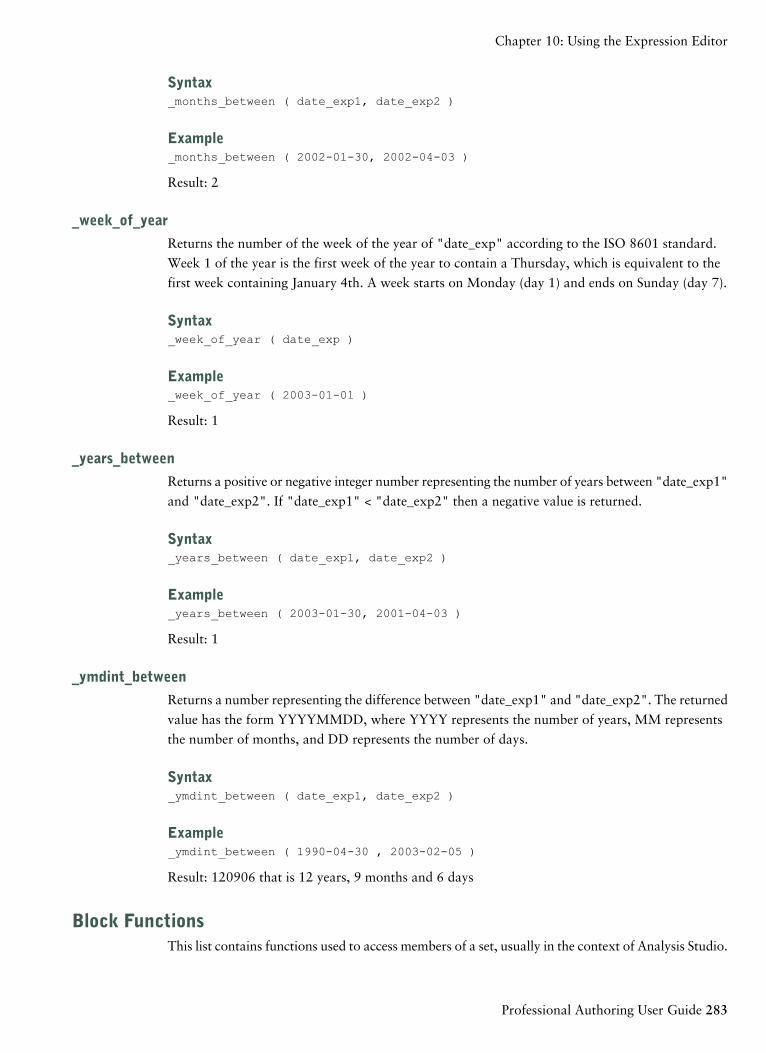
Syntax_months_between ( date_exp1, date_exp2 )
Example_months_between ( 2002-01-30, 2002-04-03 )
Result: 2
_week_of_year
Returns the number of the week of the year of "date_exp" according to the ISO 8601 standard.
Week 1 of the year is the first week of the year to contain a Thursday, which is equivalent to the
first week containing January 4th. A week starts on Monday (day 1) and ends on Sunday (day 7).
Syntax_week_of_year ( date_exp )
Example_week_of_year ( 2003-01-01 )
Result: 1
_years_between
Returns a positive or negative integer number representing the number of years between "date_exp1"
and "date_exp2". If "date_exp1" < "date_exp2" then a negative value is returned.
Syntax_years_between ( date_exp1, date_exp2 )
Example_years_between ( 2003-01-30, 2001-04-03 )
Result: 1
_ymdint_between
Returns a number representing the difference between "date_exp1" and "date_exp2". The returned
value has the form YYYYMMDD, where YYYY represents the number of years, MM represents
the number of months, and DD represents the number of days.
Syntax_ymdint_between ( date_exp1, date_exp2 )
Example_ymdint_between ( 1990-04-30 , 2003-02-05 )
Result: 120906 that is 12 years, 9 months and 6 days
Block FunctionsThis list contains functions used to access members of a set, usually in the context of Analysis Studio.
Professional Authoring User Guide 283
Chapter 10: Using the Expression Editor
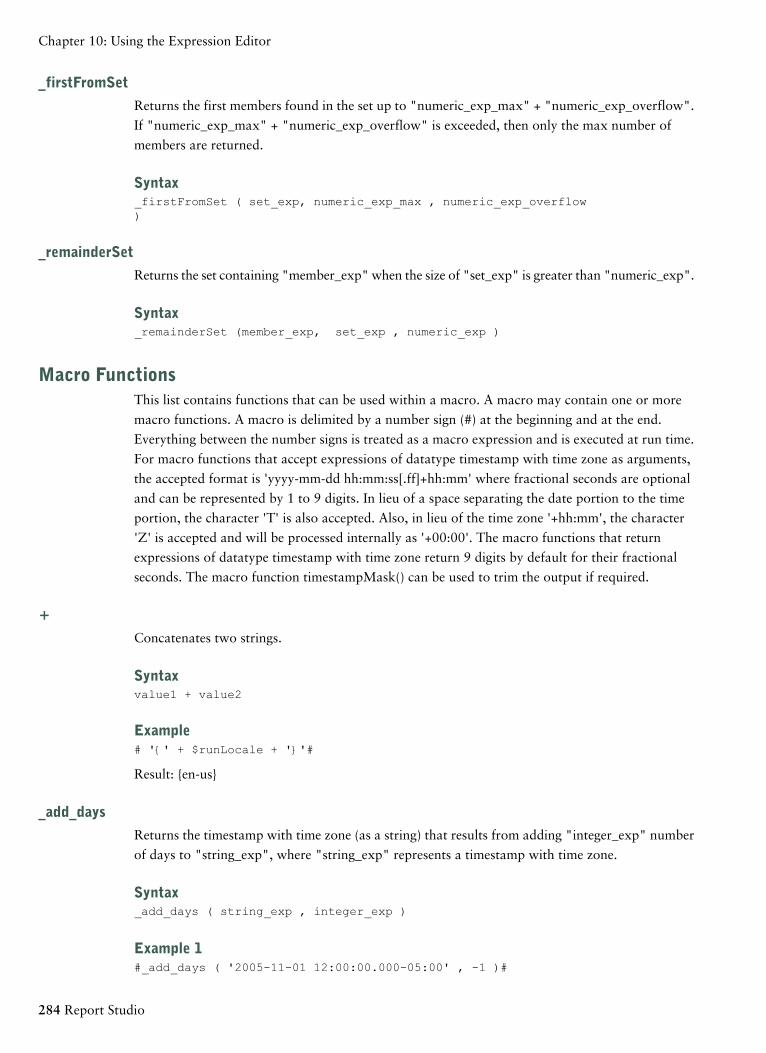
_firstFromSet
Returns the first members found in the set up to "numeric_exp_max" + "numeric_exp_overflow".
If "numeric_exp_max" + "numeric_exp_overflow" is exceeded, then only the max number of
members are returned.
Syntax_firstFromSet ( set_exp, numeric_exp_max , numeric_exp_overflow)
_remainderSet
Returns the set containing "member_exp" when the size of "set_exp" is greater than "numeric_exp".
Syntax_remainderSet (member_exp, set_exp , numeric_exp )
Macro FunctionsThis list contains functions that can be used within a macro. A macro may contain one or more
macro functions. A macro is delimited by a number sign (#) at the beginning and at the end.
Everything between the number signs is treated as a macro expression and is executed at run time.
For macro functions that accept expressions of datatype timestamp with time zone as arguments,
the accepted format is 'yyyy-mm-dd hh:mm:ss[.ff]+hh:mm' where fractional seconds are optional
and can be represented by 1 to 9 digits. In lieu of a space separating the date portion to the time
portion, the character 'T' is also accepted. Also, in lieu of the time zone '+hh:mm', the character
'Z' is accepted and will be processed internally as '+00:00'. The macro functions that return
expressions of datatype timestamp with time zone return 9 digits by default for their fractional
seconds. The macro function timestampMask() can be used to trim the output if required.
+
Concatenates two strings.
Syntaxvalue1 + value2
Example# '{' + $runLocale + '}'#
Result: {en-us}
_add_days
Returns the timestamp with time zone (as a string) that results from adding "integer_exp" number
of days to "string_exp", where "string_exp" represents a timestamp with time zone.
Syntax_add_days ( string_exp , integer_exp )
Example 1#_add_days ( '2005-11-01 12:00:00.000-05:00' , -1 )#
284 Report Studio
Chapter 10: Using the Expression Editor
Result: 2005-10-31 12:00:00.000000000-05:00
Example 2#_add_days ( $current_timestamp , 1 )#
Result: 2005-11-02 12:00:00.000000000-05:00
Example 3#timestampMask ( _add_days ( $current_timestamp , 1 ), 'yyyy-mm-dd' )#
Result: 2005-11-02
_add_months
Returns the timestamp with time zone (as a string) that results from adding "integer_exp" number
of months to "string_exp", where "string_exp" represents a timestamp with time zone.
Syntax_add_months ( string_exp , integer_exp )
Example 1#_add_months ( '2005-11-01 12:00:00.000-05:00' , -1 )#
Result: 2005-10-01 12:00:00.000000000-05:00
Example 2#_add_months ( $current_timestamp , 1 )#
Result: 2005-12-01 12:00:00.000000000-05:00
Example 3#timestampMask ( _add_months ( $current_timestamp , 1) , 'yyyy-mm-dd' )#
Result: 2005-12-01
_add_years
Returns the timestamp with time zone (as a string) that results from adding "integer_exp" number
of years to "string_exp", where "string_exp" represents a timestamp with time zone.
Syntax_add_years ( string_exp , integer_exp )
Example 1#_add_years ( '2005-11-01 12:00:00.000-05:00' , -1 )#
Result: 2004-11-01 12:00:00.000000000-05:00
Example 2#_add_years ( $current_timestamp , 1 )#
Result: 2006-11-01 12:00:00.000000000-05:00
Professional Authoring User Guide 285
Chapter 10: Using the Expression Editor
Example 3#timestampMask ( _add_years ( $current_timestamp , 1) , 'yyyy-mm-dd' )#
Result: 2006-11-01
array
Constructs an array out of the list of parameters.
Syntaxarray ( string_exp | array_exp { , string_exp | array_exp} )
Example#csv ( array ( 'a1' , array ( 'x1' , 'x2' ) , 'a2' ))#
Result: 'a1' , 'x1' , 'x2' , 'a2'
csv
Constructs a string from the elements of the array where the values are separated by commas.
Optionally, the separator and quote strings can be specified. The default separator is a comma ( ,
) and the default quote character is a single quote ( ' ).
Syntaxcsv ( array_exp [ , separator_string [ , quote_string] ] )
Example#csv ( array ( 'a1' , 'a2' ) )#
Result: 'a1' , 'a2'
dq
Surrounds the passed string with double quotes.
Syntaxdq ( string_exp )
Example#dq ( 'zero' )#
Result: "zero"
grep
Searches for and returns elements of an array that match the pattern specified in "pattern_string".
Syntaxgrep ( pattern_string , array_exp )
286 Report Studio
Chapter 10: Using the Expression Editor
Example#csv ( grep ( 's' , array ( 'as', 'an', 'arts' ) ) )#
Result: 'as', 'arts'
_first_of_month
Returns a timestamp with time zone (as a string) converting the day of "string_exp" to 1, where
"string_exp" is a timestamp with time zone.
Syntax_first_of_month ( string_exp )
Example 1#_first_of_month ( '2005-11-11 12:00:00.000-05:00' )#
Result: 2005-11-01 12:00:00.000000000-05:00
Example 2#timestampMask ( _first_of_month ( '2005-11-11 12:00:00.000-05:00'), 'yyyymmdd' )#
Result: 20051101
_last_of_month
Returns a timestamp with time zone (as a string) that is the last day of the month represented by
"string_exp", where "string_exp" is a timestamp with time zone.
Syntax_last_of_month ( string_exp )
Example 1#_last_of_month ( '2005-11-11 12:00:00.000-05:00' )#
Result: 2005-11-30 12:00:00.000000000-05:00
Example 2#timestampMask ( _last_of_month ( '2005-11-11 12:00:00.000-05:00') , 'yyyy-mm-dd' ) #
Result: 2005-11-30
join
Joins the elements of an array using the separator string.
Syntaxjoin ( separator_string , array_exp )
Example# sq ( join ( ' | | ' , array ( 'as', 'an', 'arts' )) )#
Result: 'as | | an | | arts'
Professional Authoring User Guide 287
Chapter 10: Using the Expression Editor
prompt
Prompts the user for a single value. Only "prompt_name" is required. The datatype defaults to
string when not specified. The prompt is optional when "defaultText" is specified. "Text", when
specified, will precede the value. "QueryItem" can be specified to take advantage of the prompt
info properties of "queryItem". "Trailing_text", when specified, will be appended to the value.
Syntaxprompt ( prompt_name , datatype , defaultText , text, queryItem , trailing_text )
Example 1select . . . where COUNTRY_MULTILINGUAL.COUNTRY_CODE> #prompt('Starting CountryCode',
'integer','10'
)#
Result: select . . . where COUNTRY_MULTILINGUAL.COUNTRY_CODE > 10
Example 2[gosales].[COUNTRY].[COUNTRY] = #prompt('countryPrompt','string','''Canada''')#
Result: [gosales].[COUNTRY].[COUNTRY] = 'Canada'
Notes
● The "defaultText" parameter must be specified such that it is literally valid in the context of
the macro since no formatting takes place on this value. See details below.
● The default string '''Canada''' in Example 2 is specified as a string using single quotes, in which
the embedded single quotes are doubled up, thus 3 quotes. This results in the string being
properly displayed within single quotes in the expression.
● As a general rule for the string datatype, "defaultText' should always be specified as in the
previous note, except in the context of a stored procedure parameter.
● For "defaultText" of types 'date' or 'datetime', a special format should be used in the context
of SQL. Examples of these formats are 'DATE ''2001-12-25''' and 'DATETIME ''2001-12-25
12:00:00'''. In all other contexts, use the date/datetime without the keyword and escaped single
quotes (e.g. '2001-12-25').
promptmany
Prompts the user for one or more values. Only "prompt_name" is required. The datatype defaults
to string when not specified. The prompt is optional when "defaultText" is specified. "Text", when
specified, will precede the list of values. "QueryItem" can be specified to take advantage of the
prompt info properties of "queryItem". "Trailing_text", when specified, will be appended to the
list of values.
Syntaxpromptmany ( prompt_name , datatype , defaultText , text, queryItem , trailing_text )
288 Report Studio
Chapter 10: Using the Expression Editor
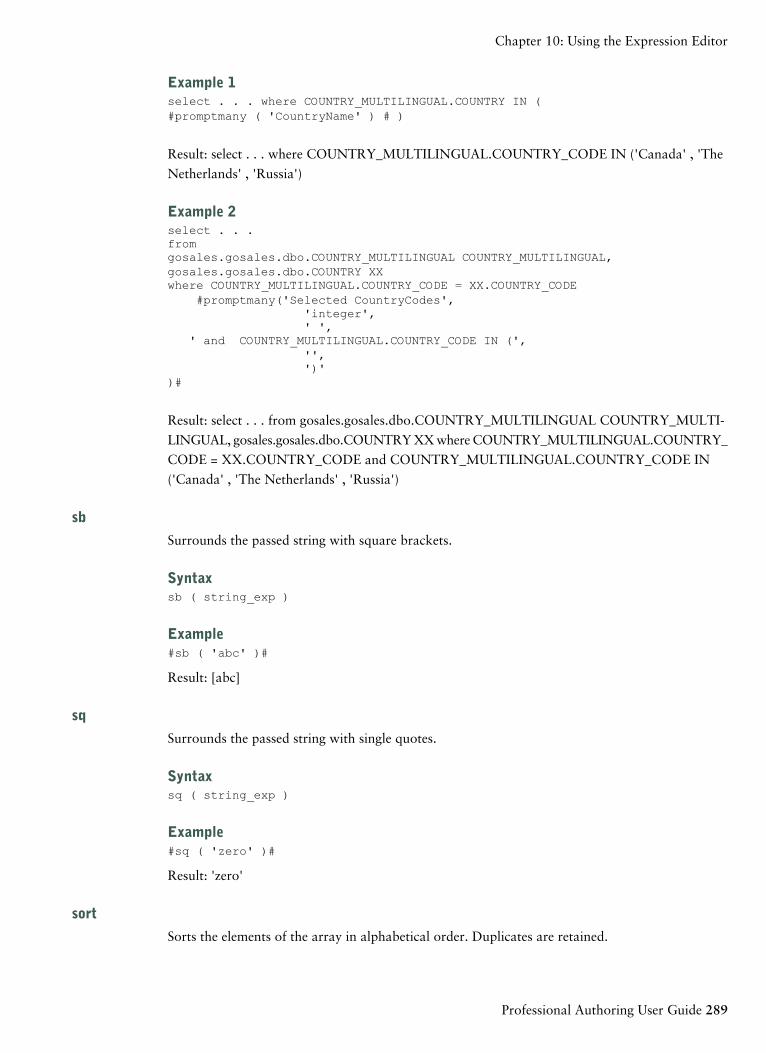
Example 1select . . . where COUNTRY_MULTILINGUAL.COUNTRY IN (#promptmany ( 'CountryName' ) # )
Result: select . . . where COUNTRY_MULTILINGUAL.COUNTRY_CODE IN ('Canada' , 'The
Netherlands' , 'Russia')
Example 2select . . .fromgosales.gosales.dbo.COUNTRY_MULTILINGUAL COUNTRY_MULTILINGUAL,gosales.gosales.dbo.COUNTRY XXwhere COUNTRY_MULTILINGUAL.COUNTRY_CODE = XX.COUNTRY_CODE
#promptmany('Selected CountryCodes','integer',' ',
' and COUNTRY_MULTILINGUAL.COUNTRY_CODE IN (','',')'
)#
Result: select . . . from gosales.gosales.dbo.COUNTRY_MULTILINGUAL COUNTRY_MULTI-
LINGUAL, gosales.gosales.dbo.COUNTRY XX where COUNTRY_MULTILINGUAL.COUNTRY_
CODE = XX.COUNTRY_CODE and COUNTRY_MULTILINGUAL.COUNTRY_CODE IN
('Canada' , 'The Netherlands' , 'Russia')
sb
Surrounds the passed string with square brackets.
Syntaxsb ( string_exp )
Example#sb ( 'abc' )#
Result: [abc]
sq
Surrounds the passed string with single quotes.
Syntaxsq ( string_exp )
Example#sq ( 'zero' )#
Result: 'zero'
sort
Sorts the elements of the array in alphabetical order. Duplicates are retained.
Professional Authoring User Guide 289
Chapter 10: Using the Expression Editor
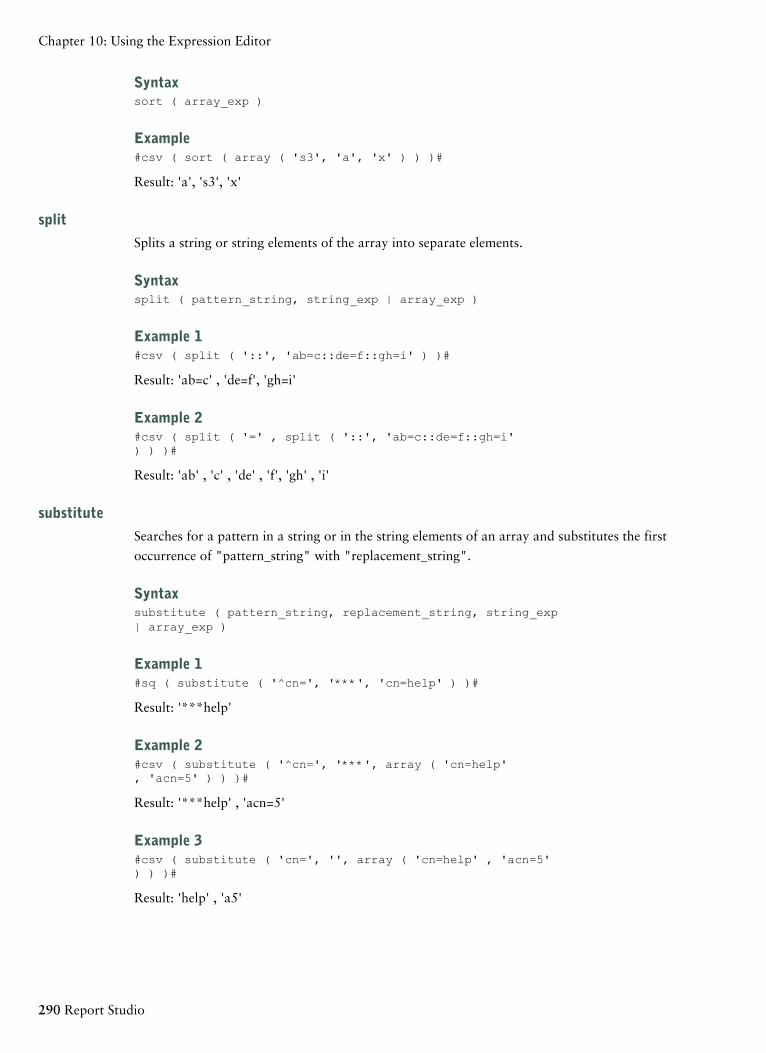
Syntaxsort ( array_exp )
Example#csv ( sort ( array ( 's3', 'a', 'x' ) ) )#
Result: 'a', 's3', 'x'
split
Splits a string or string elements of the array into separate elements.
Syntaxsplit ( pattern_string, string_exp | array_exp )
Example 1#csv ( split ( '::', 'ab=c::de=f::gh=i' ) )#
Result: 'ab=c' , 'de=f', 'gh=i'
Example 2#csv ( split ( '=' , split ( '::', 'ab=c::de=f::gh=i') ) )#
Result: 'ab' , 'c' , 'de' , 'f', 'gh' , 'i'
substitute
Searches for a pattern in a string or in the string elements of an array and substitutes the first
occurrence of "pattern_string" with "replacement_string".
Syntaxsubstitute ( pattern_string, replacement_string, string_exp| array_exp )
Example 1#sq ( substitute ( '^cn=', '***', 'cn=help' ) )#
Result: '***help'
Example 2#csv ( substitute ( '^cn=', '***', array ( 'cn=help', 'acn=5' ) ) )#
Result: '***help' , 'acn=5'
Example 3#csv ( substitute ( 'cn=', '', array ( 'cn=help' , 'acn=5') ) )#
Result: 'help' , 'a5'
290 Report Studio
Chapter 10: Using the Expression Editor
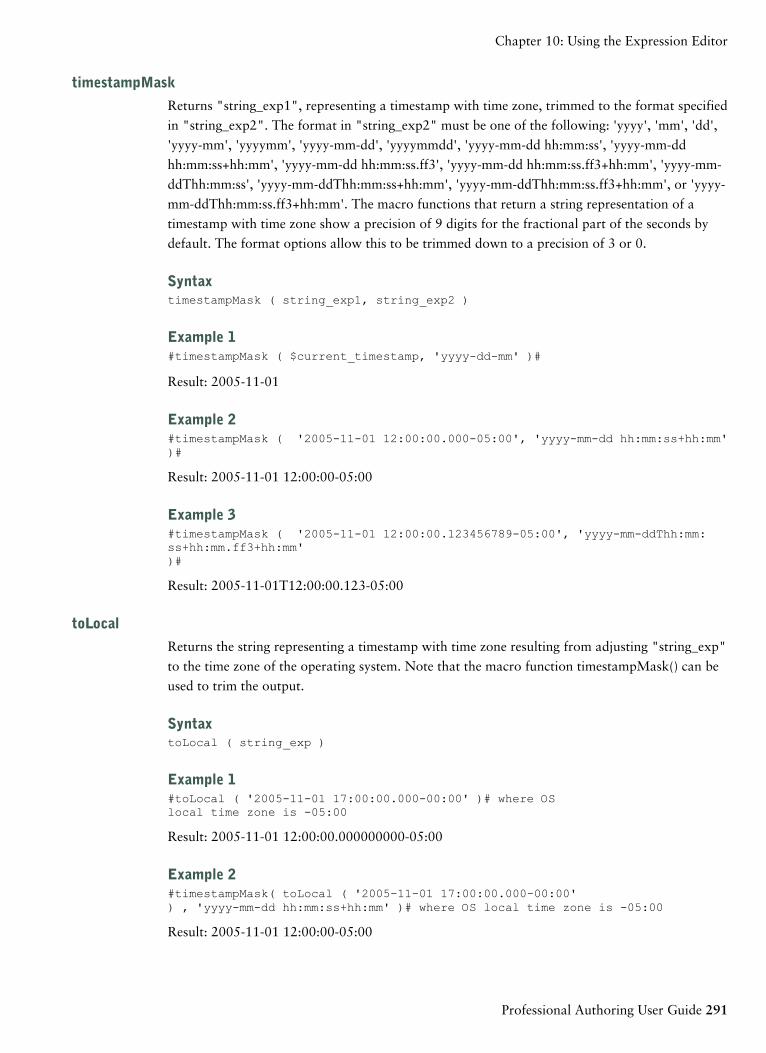
timestampMask
Returns "string_exp1", representing a timestamp with time zone, trimmed to the format specified
in "string_exp2". The format in "string_exp2" must be one of the following: 'yyyy', 'mm', 'dd',
'yyyy-mm', 'yyyymm', 'yyyy-mm-dd', 'yyyymmdd', 'yyyy-mm-dd hh:mm:ss', 'yyyy-mm-dd
hh:mm:ss+hh:mm', 'yyyy-mm-dd hh:mm:ss.ff3', 'yyyy-mm-dd hh:mm:ss.ff3+hh:mm', 'yyyy-mm-
ddThh:mm:ss', 'yyyy-mm-ddThh:mm:ss+hh:mm', 'yyyy-mm-ddThh:mm:ss.ff3+hh:mm', or 'yyyy-
mm-ddThh:mm:ss.ff3+hh:mm'. The macro functions that return a string representation of a
timestamp with time zone show a precision of 9 digits for the fractional part of the seconds by
default. The format options allow this to be trimmed down to a precision of 3 or 0.
SyntaxtimestampMask ( string_exp1, string_exp2 )
Example 1#timestampMask ( $current_timestamp, 'yyyy-dd-mm' )#
Result: 2005-11-01
Example 2#timestampMask ( '2005-11-01 12:00:00.000-05:00', 'yyyy-mm-dd hh:mm:ss+hh:mm')#
Result: 2005-11-01 12:00:00-05:00
Example 3#timestampMask ( '2005-11-01 12:00:00.123456789-05:00', 'yyyy-mm-ddThh:mm:ss+hh:mm.ff3+hh:mm')#
Result: 2005-11-01T12:00:00.123-05:00
toLocal
Returns the string representing a timestamp with time zone resulting from adjusting "string_exp"
to the time zone of the operating system. Note that the macro function timestampMask() can be
used to trim the output.
SyntaxtoLocal ( string_exp )
Example 1#toLocal ( '2005-11-01 17:00:00.000-00:00' )# where OSlocal time zone is -05:00
Result: 2005-11-01 12:00:00.000000000-05:00
Example 2#timestampMask( toLocal ( '2005-11-01 17:00:00.000-00:00') , 'yyyy-mm-dd hh:mm:ss+hh:mm' )# where OS local time zone is -05:00
Result: 2005-11-01 12:00:00-05:00
Professional Authoring User Guide 291
Chapter 10: Using the Expression Editor
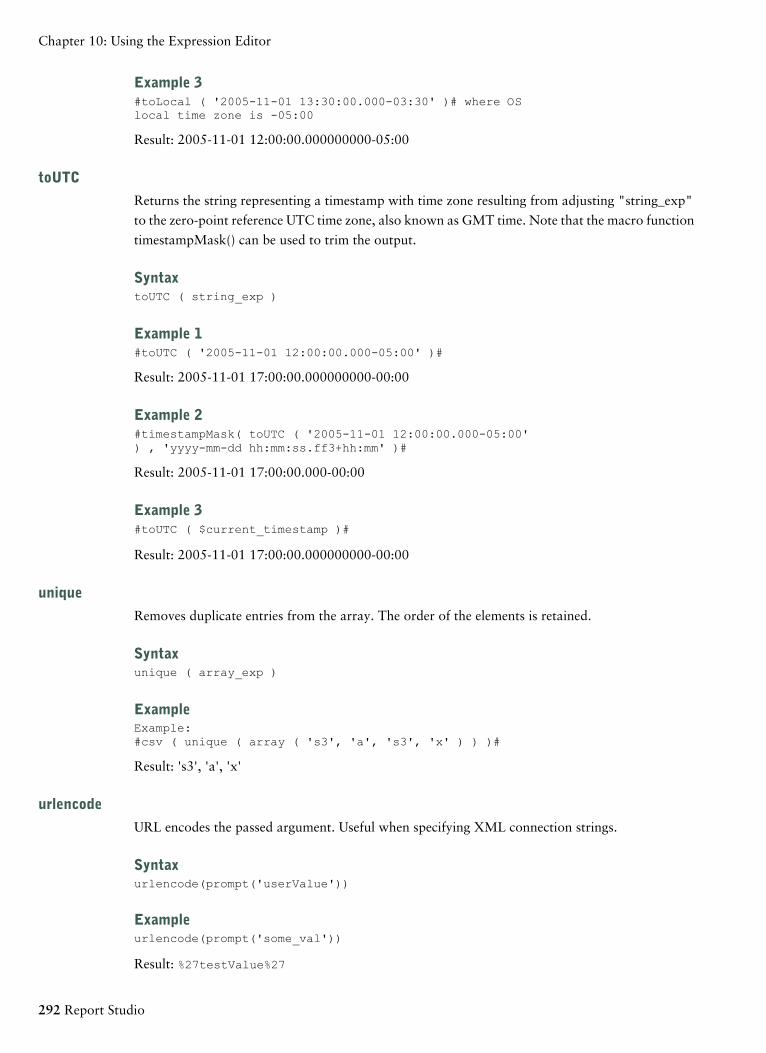
Example 3#toLocal ( '2005-11-01 13:30:00.000-03:30' )# where OSlocal time zone is -05:00
Result: 2005-11-01 12:00:00.000000000-05:00
toUTC
Returns the string representing a timestamp with time zone resulting from adjusting "string_exp"
to the zero-point reference UTC time zone, also known as GMT time. Note that the macro function
timestampMask() can be used to trim the output.
SyntaxtoUTC ( string_exp )
Example 1#toUTC ( '2005-11-01 12:00:00.000-05:00' )#
Result: 2005-11-01 17:00:00.000000000-00:00
Example 2#timestampMask( toUTC ( '2005-11-01 12:00:00.000-05:00') , 'yyyy-mm-dd hh:mm:ss.ff3+hh:mm' )#
Result: 2005-11-01 17:00:00.000-00:00
Example 3#toUTC ( $current_timestamp )#
Result: 2005-11-01 17:00:00.000000000-00:00
unique
Removes duplicate entries from the array. The order of the elements is retained.
Syntaxunique ( array_exp )
ExampleExample:#csv ( unique ( array ( 's3', 'a', 's3', 'x' ) ) )#
Result: 's3', 'a', 'x'
urlencode
URL encodes the passed argument. Useful when specifying XML connection strings.
Syntaxurlencode(prompt('userValue'))
Exampleurlencode(prompt('some_val'))
Result: %27testValue%27
292 Report Studio
Chapter 10: Using the Expression Editor
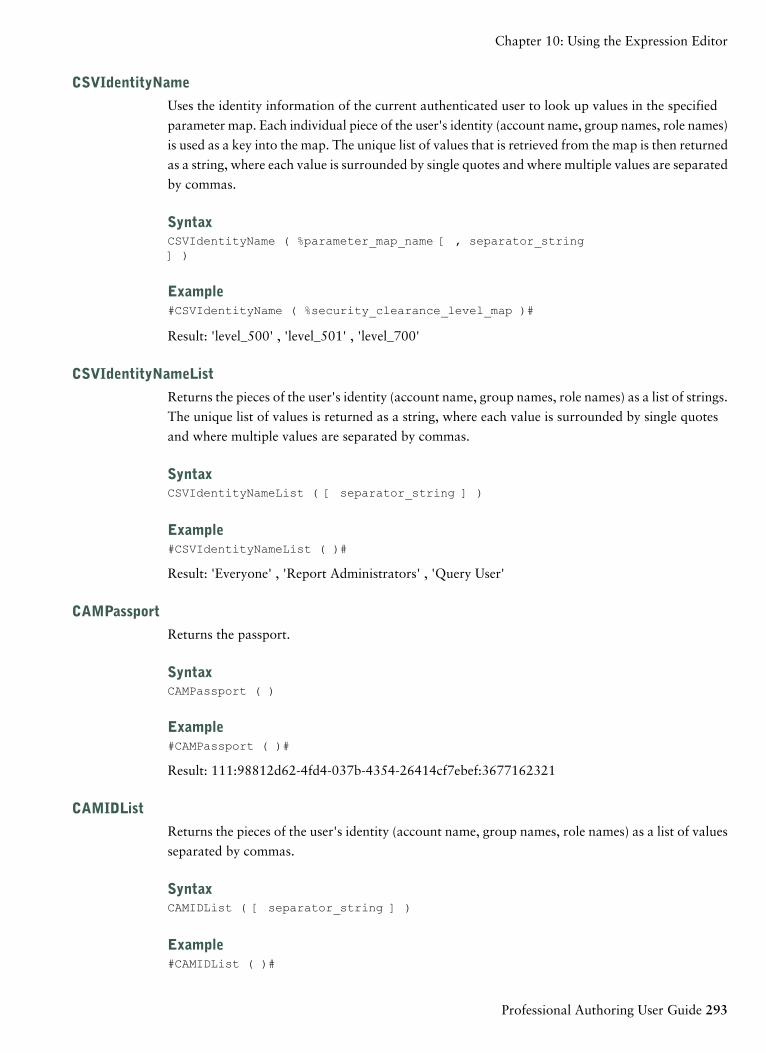
CSVIdentityName
Uses the identity information of the current authenticated user to look up values in the specified
parameter map. Each individual piece of the user's identity (account name, group names, role names)
is used as a key into the map. The unique list of values that is retrieved from the map is then returned
as a string, where each value is surrounded by single quotes and where multiple values are separated
by commas.
SyntaxCSVIdentityName ( %parameter_map_name [ , separator_string] )
Example#CSVIdentityName ( %security_clearance_level_map )#
Result: 'level_500' , 'level_501' , 'level_700'
CSVIdentityNameList
Returns the pieces of the user's identity (account name, group names, role names) as a list of strings.
The unique list of values is returned as a string, where each value is surrounded by single quotes
and where multiple values are separated by commas.
SyntaxCSVIdentityNameList ( [ separator_string ] )
Example#CSVIdentityNameList ( )#
Result: 'Everyone' , 'Report Administrators' , 'Query User'
CAMPassport
Returns the passport.
SyntaxCAMPassport ( )
Example#CAMPassport ( )#
Result: 111:98812d62-4fd4-037b-4354-26414cf7ebef:3677162321
CAMIDList
Returns the pieces of the user's identity (account name, group names, role names) as a list of values
separated by commas.
SyntaxCAMIDList ( [ separator_string ] )
Example#CAMIDList ( )#
Professional Authoring User Guide 293
Chapter 10: Using the Expression Editor
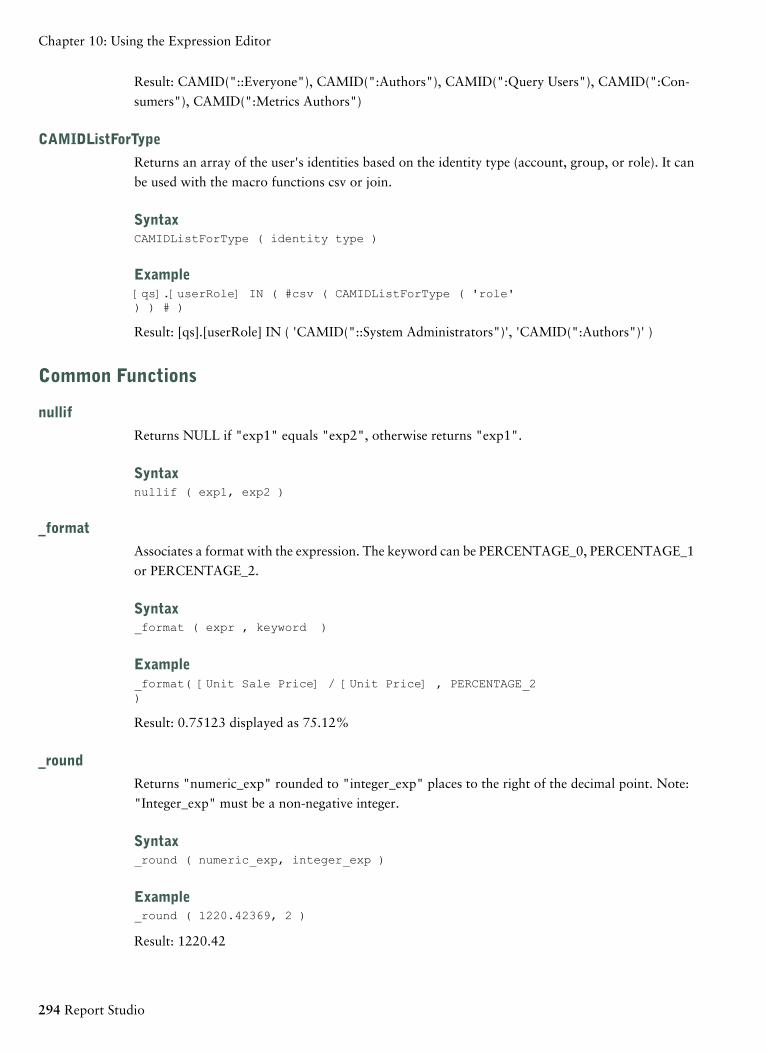
Result: CAMID("::Everyone"), CAMID(":Authors"), CAMID(":Query Users"), CAMID(":Con-
sumers"), CAMID(":Metrics Authors")
CAMIDListForType
Returns an array of the user's identities based on the identity type (account, group, or role). It can
be used with the macro functions csv or join.
SyntaxCAMIDListForType ( identity type )
Example[qs].[userRole] IN ( #csv ( CAMIDListForType ( 'role') ) # )
Result: [qs].[userRole] IN ( 'CAMID("::System Administrators")', 'CAMID(":Authors")' )
Common Functions
nullif
Returns NULL if "exp1" equals "exp2", otherwise returns "exp1".
Syntaxnullif ( exp1, exp2 )
_format
Associates a format with the expression. The keyword can be PERCENTAGE_0, PERCENTAGE_1
or PERCENTAGE_2.
Syntax_format ( expr , keyword )
Example_format( [Unit Sale Price] / [Unit Price] , PERCENTAGE_2)
Result: 0.75123 displayed as 75.12%
_round
Returns "numeric_exp" rounded to "integer_exp" places to the right of the decimal point. Note:
"Integer_exp" must be a non-negative integer.
Syntax_round ( numeric_exp, integer_exp )
Example_round ( 1220.42369, 2 )
Result: 1220.42
294 Report Studio
Chapter 10: Using the Expression Editor
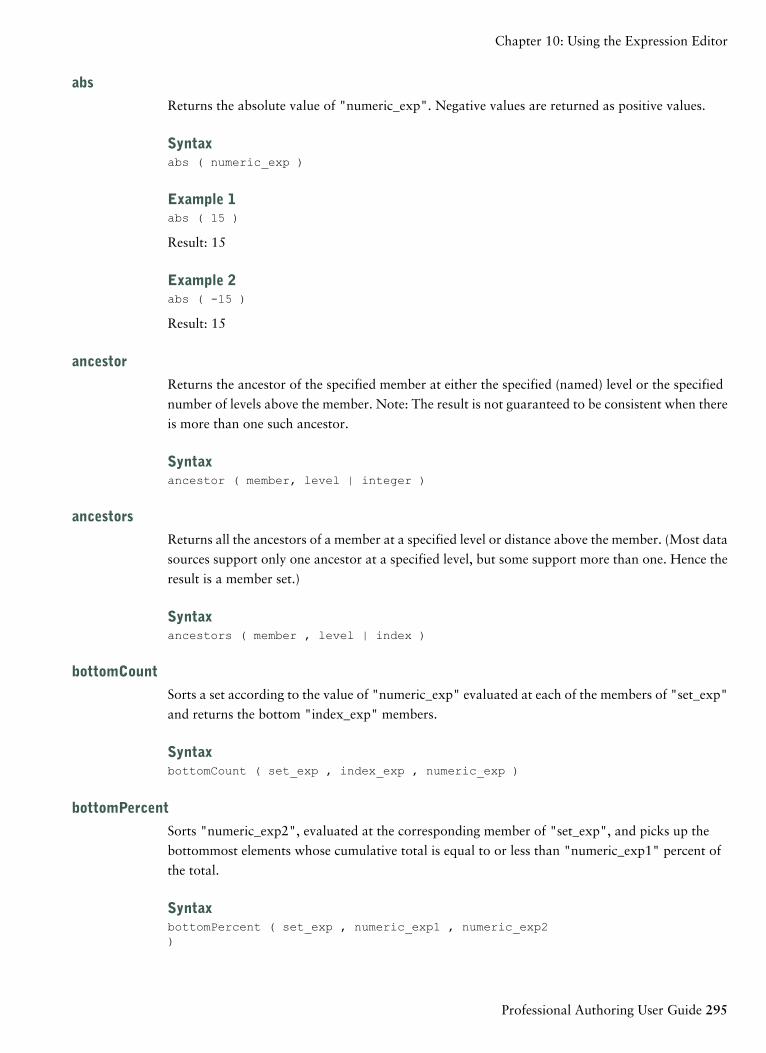
abs
Returns the absolute value of "numeric_exp". Negative values are returned as positive values.
Syntaxabs ( numeric_exp )
Example 1abs ( 15 )
Result: 15
Example 2abs ( -15 )
Result: 15
ancestor
Returns the ancestor of the specified member at either the specified (named) level or the specified
number of levels above the member. Note: The result is not guaranteed to be consistent when there
is more than one such ancestor.
Syntaxancestor ( member, level | integer )
ancestors
Returns all the ancestors of a member at a specified level or distance above the member. (Most data
sources support only one ancestor at a specified level, but some support more than one. Hence the
result is a member set.)
Syntaxancestors ( member , level | index )
bottomCount
Sorts a set according to the value of "numeric_exp" evaluated at each of the members of "set_exp"
and returns the bottom "index_exp" members.
SyntaxbottomCount ( set_exp , index_exp , numeric_exp )
bottomPercent
Sorts "numeric_exp2", evaluated at the corresponding member of "set_exp", and picks up the
bottommost elements whose cumulative total is equal to or less than "numeric_exp1" percent of
the total.
SyntaxbottomPercent ( set_exp , numeric_exp1 , numeric_exp2)
Professional Authoring User Guide 295
Chapter 10: Using the Expression Editor
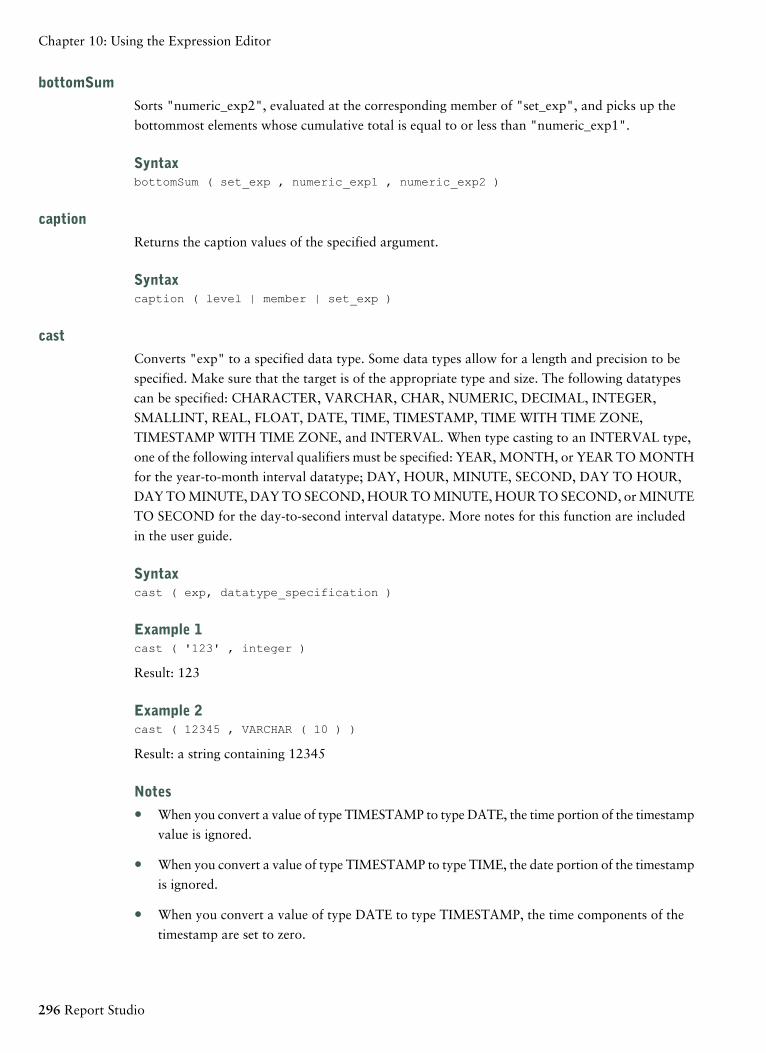
bottomSum
Sorts "numeric_exp2", evaluated at the corresponding member of "set_exp", and picks up the
bottommost elements whose cumulative total is equal to or less than "numeric_exp1".
SyntaxbottomSum ( set_exp , numeric_exp1 , numeric_exp2 )
caption
Returns the caption values of the specified argument.
Syntaxcaption ( level | member | set_exp )
cast
Converts "exp" to a specified data type. Some data types allow for a length and precision to be
specified. Make sure that the target is of the appropriate type and size. The following datatypes
can be specified: CHARACTER, VARCHAR, CHAR, NUMERIC, DECIMAL, INTEGER,
SMALLINT, REAL, FLOAT, DATE, TIME, TIMESTAMP, TIME WITH TIME ZONE,
TIMESTAMP WITH TIME ZONE, and INTERVAL. When type casting to an INTERVAL type,
one of the following interval qualifiers must be specified: YEAR, MONTH, or YEAR TO MONTH
for the year-to-month interval datatype; DAY, HOUR, MINUTE, SECOND, DAY TO HOUR,
DAY TO MINUTE, DAY TO SECOND, HOUR TO MINUTE, HOUR TO SECOND, or MINUTE
TO SECOND for the day-to-second interval datatype. More notes for this function are included
in the user guide.
Syntaxcast ( exp, datatype_specification )
Example 1cast ( '123' , integer )
Result: 123
Example 2cast ( 12345 , VARCHAR ( 10 ) )
Result: a string containing 12345
Notes
● When you convert a value of type TIMESTAMP to type DATE, the time portion of the timestamp
value is ignored.
● When you convert a value of type TIMESTAMP to type TIME, the date portion of the timestamp
is ignored.
● When you convert a value of type DATE to type TIMESTAMP, the time components of the
timestamp are set to zero.
296 Report Studio
Chapter 10: Using the Expression Editor
● When you convert a value of type TIME to type TIMESTAMP, the date component is set to
the current system date.
● It is invalid to convert one interval datatype to the other (for instance because the number of
days in a month is variable). Note that you can specify the number of digits for the leading
qualifier only, i.e. YEAR(4) TO MONTH, DAY(5).
● Errors will be reported if the target type and size are not compatible with the source type and
size.
ceil
Returns the smallest integer greater than or equal to "numeric_exp".
Syntaxceil ( numeric_exp )
ceiling
Returns the smallest integer greater than or equal to "numeric_exp".
Syntaxceiling ( numeric_exp )
Example 1ceiling ( 4.22 )
Result: 5
Example 2ceiling ( -1.23 )
Result: -1
char_length
Returns the number of characters in "string_exp".
Syntaxchar_length ( string_exp )
Examplechar_length ( 'Canada' )
Result: 6
character_length
Returns the number of characters in "string_exp".
Syntaxcharacter_length ( string_exp )
Professional Authoring User Guide 297
Chapter 10: Using the Expression Editor
Examplecharacter_length ( 'Canada' )
Result: 6
children
Returns the set of children of a specified member.
Syntaxchildren ( member )
closingPeriod
Returns the last sibling among the descendants of a member at a specified level. Typically used with
a time dimension.
SyntaxclosingPeriod ( level [, member ] )
coalesce
Returns the first non-NULL argument (or NULL if all arguments are NULL). Requires two or more
arguments.
Syntaxcoalesce ( exp_list )
completeTuple
Identifies a cell location (intersection) based on the specified members, each of which must be from
a different dimension. However, completeTuple () implicitly includes the default member from all
dimensions not otherwise specified in the arguments, rather than the current member. The value
of this cell can be obtained with the "value" function. Similar to tuple ().
SyntaxcompleteTuple ( member { , member } )
cousin
Returns the child member of "member2" with the same relative position as "member1" to its parent.
Syntaxcousin ( member1 , member2 )
current_date
Returns a date value representing the current date of the computer that the database software runs
on.
Syntaxcurrent_date
298 Report Studio
Chapter 10: Using the Expression Editor
Examplecurrent_date
Result: 2003-03-04
current_time
Returns a time with time zone value, representing the current time of the computer that runs the
database software if the database supports this function. Otherwise, it represents the current time
of the computer that runs IBM Cognos 8 software.
Syntaxcurrent_time
Examplecurrent_time
Result: 16:33:11+05:00
current_timestamp
Returns a datetime with time zone value, representing the current time of the computer that runs
the database software if the database supports this function. Otherwise, it represents the current
time of the computer that runs IBM Cognos 8 software.
Syntaxcurrent_timestamp
Examplecurrent_timestamp
Result: 2003-03-03 16:40:15.535000+05:00
currentMember
Returns the current member of the hierarchy during an iteration. If "hierarchy" is not present in
the context in which the expression is being evaluated, its default member is assumed.
SyntaxcurrentMember ( hierarchy )
defaultMember
Returns the default member of "hierarchy".
SyntaxdefaultMember ( hierarchy )
descendants
Returns the set of descendants of a member, or set of members, at a specified level (qualified name)
or distance (integer 0..n) from the root. Multiple options may be specified (separated by a space)
to determine which members are to be returned.
Professional Authoring User Guide 299
Chapter 10: Using the Expression Editor
Syntaxdescendants ( member | set_expr , level | distance [, { self | before | beforewithmember | after } ] )
Exampledescendants([national].[Line].[Line].[Line1]->:[PC].[Line (Root)].[Dishwashers],2, SELF AFTER)
Result: Result: AcmeWash MR AcmeWash AcmeWash HE
Notes
● self: Only the members at the specified level are included in the final set (this is the default
behaviour in the absence of any options).
● before: If there are any intermediate levels between the member's level and the one specified,
members from those levels are included. If the level specified is the same as the member upon
which the function is applied, the member is included in the final set.
● beforewithmember: If there are any intermediate levels between the member's level and the one
specified, members from those levels are included. The member upon which the function is
applied is also included in the final set.
● after: If other levels exist after the specified level, members from those levels are included in
the final set.
emptySet
Returns an empty member set for "hierarchy".
SyntaxemptySet ( hierarchy )
except
Returns the members of "set_exp1" that are not also in "set_exp2". Duplicates are retained only
if the optional keyword ALL is supplied as the third argument.
Syntaxexcept ( set_exp1 , set_exp2 [,ALL] )
exp
Returns 'e' raised to the power of "numeric_exp". The constant 'e' is the base of the natural logar-
ithm.
Syntaxexp ( numeric_exp )
Exampleexp ( 2 )
Result: 7.389056
300 Report Studio
Chapter 10: Using the Expression Editor
extract
Returns an integer representing the value of datepart (year, month, day, hour, minute, second) in
"datetime_exp".
Syntaxextract ( datepart , datetime_exp )
Example 1extract ( year , 2003-03-03 16:40:15.535 )
Result: 2003
Example 2extract ( hour , 2003-03-03 16:40:15.535 )
Result: 16
filter
Returns the set resulting from filtering a specified set based on the boolean condition. Each member
is included in the result if and only if the corresponding value of "boolean_exp" is true.
Syntaxfilter ( set_exp , boolean_exp )
firstChild
Returns the first child of a member.
SyntaxfirstChild ( member)
firstSibling
Returns the first child of the parent of a member.
SyntaxfirstSibling ( member )
floor
Returns the largest integer less than or equal to "numeric_exp".
Syntaxfloor ( numeric_exp )
Example 1floor ( 3.22 )
Result: 3
Example 2floor ( -1.23 )
Professional Authoring User Guide 301
Chapter 10: Using the Expression Editor
Result: -2
generate
Evaluates "set_exp2" for each member of "set_exp1" and joins the resulting sets by union. If "ALL"
is specified, duplicates in the result are retained.
Syntaxgenerate ( set_exp1 , set_exp2 [ , ALL ] )
head
Returns the first "index_exp" elements of "set_exp". The default for "index_exp" is 1.
Syntaxhead ( set_exp [ , index_exp ] )
hierarchize
Orders the members of a set in a hierarchy. Members in a level are sorted in their natural order.
This is the default ordering of the members along a dimension when no other sort conditions are
specified.
Syntaxhierarchize ( set_exp )
hierarchy
Returns the hierarchy that contains the specified level, member, or member set.
Syntaxhierarchy ( level | member | set_exp )
intersect
Returns the intersection of "set_exp1" and "set_exp2". The result retains duplicates only when the
optional keyword "ALL" is supplied as the third argument.
Syntaxintersect ( set_exp1 , set_exp2 [ , ALL ] )
item
Returns a member from a specified location within a set. The index into the set is zero based.
Syntaxitem ( set_exp , index )
lag
Returns the sibling member that is a specified number of positions prior to a specified member.
302 Report Studio
Chapter 10: Using the Expression Editor
Syntaxlag ( member , index_exp )
lastChild
Returns the last child of a specified member.
SyntaxlastChild ( member )
lastPeriods
Returns the set of members from the same level that ends with the specified member. The number
of members returned is the absolute value of "integer_exp". If "integer_exp" is negative, members
following and including the specified member are returned. Typically used with a time dimension.
SyntaxlastPeriods ( integer_exp , member )
lastSibling
Returns the last child of the parent of a specified member.
SyntaxlastSibling ( member )
lead
Returns the sibling member that is "index_exp" number of positions following a specified member.
Syntaxlead ( member , index_exp )
level
Returns the level of a member.
Syntaxlevel ( member )
levels
Returns the level in the hierarchy whose distance from the root is specified by "index".
Syntaxlevels ( hierarchy , index )
linkMember
Returns the corresponding member in the specified level or hierarchy (of the same dimension). For
level-based hierarchies, a level must be specified as the second argument and for parent-child hier-
archies, a hierarchy must be specified. An exception is thrown when the second parameter does not
Professional Authoring User Guide 303
Chapter 10: Using the Expression Editor
resolve to a hierarchy of the dimension that the member of the first parameter belongs to. Note
that calculated members are not supported as the first argument.
SyntaxlinkMember ( member , level | hierarchy )
ln
Returns the natural logarithm of the "numeric_exp".
Syntaxln ( numeric_exp )
Exampleln ( 4 )
Result: 1.38629
localtime
Returns a time value, representing the current time of the computer that runs the database software.
Syntaxlocaltime
Examplelocaltime
Result: 16:33:11
localtimestamp
Returns a datetime value, representing the current timestamp of the computer that runs the database
software.
Syntaxlocaltimestamp
Examplelocaltimestamp
Result: 2003-03-03 16:40:15.535000
lower
Returns "string_exp" with all uppercase characters shifted to lowercase.
Syntaxlower ( string_exp )
Examplelower ( 'ABCDEF' )
Result: 'abcdef'
304 Report Studio
Chapter 10: Using the Expression Editor
member
Defines a member based on the specified expression in the specified hierarchy. "String1" is used to
identify the member created by this function. It must be unique in the query and must be different
from any other member in the same hierarchy. "String2" is used as the caption of the member; if
it is absent, the caption is empty. To ensure predictable results, it is recommended to supply the
hierarchy parameter. Note: All calculations used as grouping items, whose sibling items are other
calculations or member sets, should be explicitly assigned to a hierarchy using this function. The
results are not predictable otherwise. The only exception is where the calculation involves only
members of the same hierarchy as the siblings. In this case, the calculation is assumed to belong to
that hierarchy.
Syntaxmember ( value_exp [ , string1 [ , string2 [ , hierarchy] ] ] )
members
Returns the set of members in a hierarchy or level. In the case of a hierarchy, the order of the
members in the result is not guaranteed. If a predictable order is required, an explicit ordering
function (such as hierarchize) must be used.
Syntaxmembers ( hierarchy | level )
mod
Returns the remainder (modulus) of "integer_exp1" divided by "integer_exp2". "Integer_exp2"
must not be zero or an exception condition is raised.
Syntaxmod ( integer_exp1, integer_exp2 )
Examplemod ( 20 , 3 )
Result: 2
nestedSet
Returns the set of members of "set_exp2" evaluated in the context of the current member of
"set_exp1".
SyntaxnestedSet ( set_exp1 , set_exp2 )
nextMember
Returns the next member in the level to which "member" exists.
SyntaxnextMember ( member )
Professional Authoring User Guide 305
Chapter 10: Using the Expression Editor
octet_length
Returns the number of bytes in "string_exp".
Syntaxoctet_length ( string_exp )
Example 1octet_length ( 'ABCDEF' )
Result: 6
Example 2octet_length ( '' )
Result: 0
openingPeriod
Returns the first sibling member among the descendants of a member at a specified level. Typically
used with a time dimension.
SyntaxopeningPeriod ( level [ , member ] )
order
Arranges members of a specified set, as determined from the set of values created by evaluating
"value_exp" for each value of the set, and modified by the third parameter. There are two varieties
of order: hierarchized (ASC or DESC) and non-hierarchized (BASC or BDESC, where B stands for
"break hierarchy"). The hierarchized ordering first arranges members according to their position
in the hierarchy. It then orders the children of each member according to "value_exp". The non-
hierarchized ordering arranges members in the set without regard to the hierarchy. In the absence
of an explicit specification, ASC is the default.
Syntaxorder ( set_exp , value_exp [ , ASC | DESC | BASC | BDESC] )
ordinal
Returns the zero-based ordinal value (distance from the root level) of the specified level.
Syntaxordinal ( level )
parallelPeriod
Returns a member from a prior period in the same relative position as a specified member. This
function is similar to the "Cousin" function, but is more closely related to time series. It takes the
ancestor of "member" at "level" (called "ancestor") and the sibling of "ancestor" that lags by
"int_exp" positions, and returns the parallel period of "member" among the descendants of that
sibling. When unspecified, "int_exp" defaults to 1 and "member" defaults to the current member.
306 Report Studio
Chapter 10: Using the Expression Editor
SyntaxparallelPeriod ( level [ , int_exp [ , member ] ] )
parent
Returns the member that is the parent of "member" or "measure".
Syntaxparent ( member | measure )
periodsToDate
Returns a set of sibling members from the same level as a given member, as constrained by "level".
It locates the ancestor of "member" at "level", and returns that ancestor's descendants at the same
level as "member" (up to and including "member"). Typically used with a time dimension.
SyntaxperiodsToDate ( level , member )
position
Returns the integer value representing the starting position of "string_exp1" in "string_exp2" or
0 when the "string_exp1" is not found.
Syntaxposition ( string_exp1 , string_exp2 )
Example 1position ( 'C' , 'ABCDEF' )
Result: 3
Example 2position ( 'H' , 'ABCDEF' )
Result: 0
power
Returns "numeric_exp1" raised to the power "numeric_exp2". If "numeric_exp1" is negative then
"numeric_exp2" must result in an integer value.
Syntaxpower ( numeric_exp1, numeric_exp2 )
Examplepower ( 3 , 2 )
Result: 9
prevMember
Returns the member that immediately precedes the specified member in the same level.
Professional Authoring User Guide 307
Chapter 10: Using the Expression Editor
SyntaxprevMember ( member )
roleValue
Returns the value of the attribute that is associated with the role whose name is specified by "string"
within the specified context. The second argument is optional only in a number of limited circum-
stances, where it can be derived from another context. Applications can be made portable across
different data sources and models by accessing attributes by role, rather than by query item ID.
(For dimensionally modelled relational data sources, assignment of roles is the modeller's respons-
ibility.) Intrinsic roles that are defined for members of all data source types include: '_businessKey',
'_memberCaption', '_memberDescription', '_memberUniqueName'.
SyntaxroleValue ( string [ , member | set_exp ] )
ExampleroleValue ( '_memberCaption', [Sales].[Product].[Product].[Productline]->[all].[1])
Result: Camping Equipment
rootMember
Returns the root member of a single-root hierarchy.
SyntaxrootMember ( hierarchy )
rootMembers
Returns the root members of a hierarchy.
SyntaxrootMembers ( hierarchy )
set
Returns the list of members defined in the expression. The members must belong to the same hier-
archy.
Syntaxset ( member { , member } )
siblings
Returns the children of the parent of the specified member.
Syntaxsiblings ( member )
308 Report Studio
Chapter 10: Using the Expression Editor
sqrt
Returns the square root of "numeric_exp". "Numeric_exp" must be non-negative.
Syntaxsqrt ( numeric_exp )
Examplesqrt ( 9 )
Result: 3
subset
Returns a subset of members from a specified set starting at "index_exp1" from the beginning. If
the count "index_exp2" is specified, that many members are returned (if available). Otherwise, all
remaining members are returned.
Syntaxsubset ( set_exp, index_exp1 [ , index_exp2 ] )
substring
Returns the substring of "string_exp" that starts at position "integer_exp1" for "integer_exp2"
characters or to the end of "string_exp" if "integer_exp2" is omitted. The first character in
"string_exp" is at position 1.
Syntaxsubstring ( string_exp , integer_exp1 [ , integer_exp2] )
Examplesubstring ( 'abdefg', 3, 2)
Result: 'de'
tail
Returns the last "index_exp" elements of "set exp". The default for "index_exp" is 1.
Syntaxtail ( set_exp [ , index_exp ] )
topCount
Sorts a set according to the values of "numeric_exp" evaluated at each of the members of "set_exp"
and returns the top "index_exp" members.
SyntaxtopCount ( set_exp , index_exp , numeric_exp )
Professional Authoring User Guide 309
Chapter 10: Using the Expression Editor
topPercent
Sorts "numeric_exp2", evaluated at the corresponding members of "set_exp", and picks up the
topmost elements whose cumulative total is at least "numeric_exp1" percent of the total.
SyntaxtopPercent ( set_exp , numeric_exp1, numeric_exp2 )
topSum
Sorts "numeric_exp2", evaluated at the corresponding members of "set_exp", and picks up the
topmost elements whose cumulative total is at least "numeric_exp1".
SyntaxtopSum ( set_exp , numeric_exp1 , numeric_exp2 )
trim
Returns "string_exp" trimmed of leading and trailing blanks or trimmed of a certain character
specified in "match_character_exp". "BOTH" is implicit when the first argument is not stated and
blank is implicit when the second argument is not stated.
Syntaxtrim ( [ [ TRAILING | LEADING | BOTH ] [ match_character_exp] , ] string_exp )
Example 1trim ( TRAILING 'A' , 'ABCDEFA' )
Result: 'ABCDEF'
Example 2trim ( BOTH ' ABCDEF ' )
Result: 'ABCDEF'
tuple
Identifies a cell location (intersection) based on the specified members, each of which must be from
a different dimension. Implicitly includes the current member from all dimensions not otherwise
specified in the arguments. The current member of any dimension not specified in the evaluating
context is assumed to be the default member of that dimension. The value of this cell can be obtained
with the "value" function.
Syntaxtuple ( member { , member } )
union
Returns the union of "set_exp1" and "set_exp2". The result retains duplicates only when the
optional keyword "ALL" is supplied as the third argument.
310 Report Studio
Chapter 10: Using the Expression Editor
Syntaxunion ( set_exp1 , set_exp2 [ , ALL ] )
unique
Removes all duplicates from the specified set. The remaining members retain their original order.
Syntaxunique ( set_expr )
upper
Returns "string_exp" with all lowercase characters shifted to uppercase.
Syntaxupper ( string_exp )
Exampleupper ( 'abcdef' )
Result: 'ABCDEF'
value
Returns the value of the cell identified by a "tuple". Note that the default member of the Measures
dimension is the Default Measure.
Syntaxvalue ( tuple )
DB2
ascii
Returns the ASCII code value of the leftmost character of the argument as an integer.
Syntaxascii ( string_exp )
ceiling
Returns the smallest integer greater than or equal to "numeric_exp".
Syntaxceiling ( numeric_exp )
char
Returns a string representation of a date/time value or a decimal number.
Syntaxchar ( exp )
Professional Authoring User Guide 311
Chapter 10: Using the Expression Editor
chr
Returns the character that has the ASCII code value specified by "integer_exp". "Integer_exp"
should be between 0 and 255.
Syntaxchr ( integer_exp )
concat
Returns a string that is the result of concatenating "string_exp1" with "string_exp2".
Syntaxconcat ( string_exp1, string_exp2 )
date
Returns a date from a single input value. "Exp" can be a string or integer representation of a date.
Syntaxdate ( exp )
day
Returns the day of the month (1-31) from "date_exp". "Date_exp" can be a date value or a string
representation of a date.
Syntaxday ( date_exp )
dayname
Returns a character string containing the data source_specific name of the day (for example, Sunday
through Saturday or Sun. through Sat. for a data source that uses English, or Sonntag through
Samstag for a data source that uses German) for the day portion of "date_exp". "Date_exp" can
be a date value or a string representation of a date.
Syntaxdayname ( date_exp )
dayofweek
Returns the day of the week in "date_exp" as an integer in the range 1 to 7, where 1 represents
Sunday. "Date_exp" can be a date value or a string representation of a date.
Syntaxdayofweek ( date_exp )
dayofweek_iso
Returns the day of the week in "date_exp" as an integer in the range 1 to 7, where 1 represents
Monday. "Date_exp" can be a date value or a string representation of a date.
312 Report Studio
Chapter 10: Using the Expression Editor
Syntaxdayofweek_iso ( date_exp )
dayofyear
Returns the day of the year in "date_exp" as an integer in the range 1 to 366. "Date_exp" can be
a date value or a string representation of a date.
Syntaxdayofyear ( date_exp )
days
Returns an integer representation of a date. "Exp" can be a date value or a string representation
of a date.
Syntaxdays ( exp )
dec
Returns the decimal representation of "string_exp1" with precision "numeric_exp1", scale
"numeric_exp2" and decimal character "string_exp2". "String_exp1" must be formatted as an
SQL Integer or Decimal constant.
Syntaxdec ( string_exp1 [ , numeric_exp1 [ , numeric_exp2 [, string_exp2 ] ] ] )
decimal
Returns the decimal representation of "string_exp1" with precision "numeric_exp1", scale
"numeric_exp2" and decimal character "string_exp2". "String_exp1" must be formatted as an
SQL Integer or Decimal constant.
Syntaxdecimal ( string_exp1 [ , numeric_exp1 [ , numeric_exp2[ , string_exp2 ] ] ] )
difference
Returns an integer value representing the difference between the values returned by the data
source_specific soundex function for "string_exp1" and "string_exp2". The value returned ranges
from 0 to 4, with 4 indicating the best match. Note that 4 does not mean that the strings are equal.
Syntaxdifference ( string_exp1, string_exp2 )
digits
Returns the character string representation of a non-floating point number.
Professional Authoring User Guide 313
Chapter 10: Using the Expression Editor
Syntaxdigits ( numeric_exp )
double
Returns the floating-point representation of an expression. "Exp" can either be a numeric or string
expression.
Syntaxdouble ( exp )
event_mon_state
Returns the operational state of a particular state monitor.
Syntaxevent_mon_state ( string_exp )
float
Returns the floating-point representation of a number.
Syntaxfloat ( numeric_exp )
hex
Returns the hexadecimal representation of a value.
Syntaxhex ( exp )
hour
Returns the hour, an integer from 0 (midnight) to 23 (11:00 pm), from "time_exp". "Time_exp"
can be a time value or a string representation of a time.
Syntaxhour ( time_exp )
insert
Returns a string where "integer_exp2" characters have been deleted from "string_exp1" beginning
at "integer_exp1" and where "string_exp2" has been inserted into "string_exp1" at start. The first
character in the string is at position 1.
Syntaxinsert ( string_exp1, integer_exp1, integer_exp2, string_exp2)
integer
Returns the integer representation of an expression. "Exp" can be a numeric value or a string rep-
resentation of a number.
314 Report Studio
Chapter 10: Using the Expression Editor
Syntaxinteger ( exp )
int
Returns the integer representation of an expression. "Exp" can be a numeric value or a string rep-
resentation of a number.
Syntaxint ( exp )
julian_day
Returns an integer value representing the number of days from January 1, 4712 BC (the start of
the Julian date calendar) to the date value specified in "exp". "Exp" can be a date value or a string
representation of a date.
Syntaxjulian_day ( exp )
lcase
Returns "string_exp" with all uppercase characters shifted to lowercase.
Syntaxlcase ( string_exp )
left
Returns the leftmost "integer_exp" characters of "string_exp".
Syntaxleft ( string_exp, integer_exp )
length
Returns the length of the operand in bytes. Exception: double byte string types return the length in
characters.
Syntaxlength ( exp )
locate
Returns the starting position of the first occurrence of "string_exp1" within "string_exp2". The
search starts at position start "integer_exp" of "string_exp2". The first character in a string is at
position 1. If "string_exp1" is not found, zero is returned.
Syntaxlocate ( string_exp1, string_exp2 [ , integer_exp ] )
Professional Authoring User Guide 315
Chapter 10: Using the Expression Editor
long_varchar
Returns a long string.
Syntaxlong_varchar ( string_exp )
ltrim
Returns "string_exp" with leading spaces removed.
Syntaxltrim ( string_exp )
microsecond
Returns the microsecond (time-unit) part of a value. "Exp" can be a timestamp or a string repres-
entation of a timestamp.
Syntaxmicrosecond ( exp )
midnight_seconds
Returns an integer value in the range 0 to 86400 representing the number of seconds between
midnight and time value specified in the argument. "Exp" can be a time value, a timestamp or a
string representation of a time.
Syntaxmidnight_seconds ( exp )
minute
Returns the minute (an integer from 0-59) from "time_exp". "Time_exp" can be a time value, a
timestamp, or a string representation of a time.
Syntaxminute ( time_exp )
month
Returns the month (an integer from 1-12) from "date_exp".
Syntaxmonth ( date_exp )
monthname
Returns a character string containing the data source_specific name of the month (for example,
January through December or Jan. through Dec. for an English data source, or Januar through
Dezember for a German data source) for the month portion of "date_exp".
316 Report Studio
Chapter 10: Using the Expression Editor
Syntaxmonthname ( date_exp )
quarter
Returns the quarter in "date_exp" as a number in the range 1 to 4, where 1 represents January 1
through March 31.
Syntaxquarter ( date_exp )
radians
Returns the number of radians converted from "numeric_exp" degrees.
Syntaxradians ( numeric_exp )
repeat
Returns a string consisting of "string_exp" repeated "integer_exp" times.
Syntaxrepeat ( string_exp, integer_exp )
replace
Replaces all occurrences of "string_exp2" in "string_exp1" with "string_exp3".
Syntaxreplace ( string_exp1, string_exp2, string_exp3 )
right
Returns the rightmost "integer_exp" characters of "string_exp".
Syntaxright ( string_exp, integer_exp )
round
Returns "numeric_exp" rounded to "integer_exp" places to the right of the decimal point. If
"integer_exp" is negative, "numeric_exp" is rounded to the nearest absolute value "integer_exp"
places to the left of the decimal point, e.g., round-near (125, -1) rounds to 130.
Syntaxround ( numeric_exp, integer_exp )
rtrim
Returns "string_exp" with trailing spaces removed.
Professional Authoring User Guide 317
Chapter 10: Using the Expression Editor
Syntaxrtrim ( string_exp )
second
Returns the second (an integer from 0-59) from "time_exp".
Syntaxsecond ( time_exp )
sign
Returns an indicator of the sign of "numeric_exp": +1 if "numeric_exp" is positive, 0 if zero, or -
1 if negative.
Syntaxsign ( numeric_exp )
smallint
Returns the small integer representation of a number.
Syntaxsmallint ( exp )
soundex
Returns a 4 character string code obtained by systematically abbreviating words and names in
"string_exp" according to phonetics. Can be used to determine if two strings sound the same, e.g.,
does sound-of ('SMITH') = sound-of ('SMYTH').
Syntaxsoundex ( string_exp )
space
Returns a string consisting of "integer_exp" spaces.
Syntaxspace ( integer_exp )
substr
Returns the substring of "string_exp" that starts at position "integer_exp1" for "integer_exp2"
characters. The first character in "string_exp" is at position 1.
Syntaxsubstr ( string_exp, integer_exp1 [ , integer_exp2 ])
318 Report Studio
Chapter 10: Using the Expression Editor
table_name
Returns an unqualified name of a table or view based on the object name in "string_exp1" and the
schema name given in "string_exp2". It is used to resolve aliases.
Syntaxtable_name ( string_exp1 [ , string_exp2 ] )
table_schema
Returns the schema name portion of the two part table or view name based on the object name in
"string_exp1" and the schema name in "string_exp2". It is used to resolve aliases.
Syntaxtable_schema ( string_exp1 [ , string_exp2 ] )
time
Returns a time from a value.
Syntaxtime ( exp )
timestamp
Returns a timestamp from a value or a pair of values. "Exp1' must represent a date value, and
"exp2" must represent a time value.
Syntaxtimestamp ( exp1 [ , exp2 ] )
timestamp_iso
Returns a datetime in the ISO format (yyyy-mm-dd hh:mm:ss.nnnnnn) converted from the IBM
format (yyyy-mm-dd-hh.mm.ss.nnnnnn). If "exp" is a time, it inserts the value of the CURRENT
DATE for the date elements and zero for the fractional time element.
Syntaxtimestamp_iso ( exp )
timestampdiff
Returns an estimated number of intervals of type "exp1" based on the difference between two
timestamps. "Exp2" is the result of subtracting two timestamp types and converting the result to
CHAR. Valid values of "exp1" are: 1 Fractions of a second; 2 Seconds; 4 Minutes; 8 Hours; 16
Days; 32 Weeks; 64 Months; 128 Quarters; 256 Years.
Syntaxtimestampdiff ( exp1, exp2 )
to_char
Returns the string representation of a timestamp with the format of "string_exp".
Professional Authoring User Guide 319
Chapter 10: Using the Expression Editor
Syntaxto_char ( timestamp_exp , string_exp )
translate
Returns "string_exp1" in which characters from "string_exp3" are translated to the equivalent
characters in "string_exp2". "String_exp4" is a single character that is used to pad "string_exp2"
if it is shorter than "string_exp3". If only "string_exp1" is present, then this function translates it
to uppercase characters.
Syntaxtranslate ( string_exp1 [ , string_exp2, string_exp3[ , string_exp4 ] ] )
trunc
Returns "numeric_exp1" truncated to "numeric_exp2" places to the RIGHT of the decimal point.
If "numeric_exp2" is negative, "numeric_exp1" is truncated to the absolute value of "numeric_exp2"
places to the LEFT of the decimal point.
Syntaxtrunc ( numeric_exp1, numeric_exp2 )
truncate
Returns "numeric_exp1" truncated to "numeric_exp2" places to the RIGHT of the decimal point.
If "numeric_exp2" is negative, "numeric_exp1" is truncated to the absolute value of "numeric_exp2"
places to the LEFT of the decimal point.
Syntaxtruncate ( numeric_exp1, numeric_exp2 )
ucase
Returns "string_exp" with all lowercase characters shifted to uppercase.
Syntaxucase ( string_exp )
value
Returns the first non-null argument (or null if all arguments are null). The Value function takes
two or more arguments.
Syntaxvalue ( exp_list )
varchar
Returns a VARCHAR representation of exp, with length numeric_exp.
320 Report Studio
Chapter 10: Using the Expression Editor
Syntaxvarchar ( exp [ , numeric_exp ] )
week
Returns the week of the year in "date_exp" as an integer value in the range 1 to 53.
Syntaxweek ( date_exp )
year
Returns the year from "date_exp".
Syntaxyear ( date_exp )
DB2 Cast
cast_char
Returns the first "numeric_exp" characters of the value of "exp" cast as a string. The whole string
is returned when the second argument is not specified.
Syntaxcast_char ( exp [ , numeric_exp ] )
cast_date
Returns the value of "exp" cast as a date.
Syntaxcast_date ( exp )
cast_decimal
Returns the value of "exp" cast as a decimal with the precision of "numeric_exp1" and scale of
"numeric_exp2".
Syntaxcast_decimal ( exp [ , numeric_exp1, numeric_exp2 ] )
cast_double_precision
Returns the value of "exp" cast as a double.
Syntaxcast_double_precision ( exp )
cast_float
Returns the value of "exp" cast as a float.
Professional Authoring User Guide 321
Chapter 10: Using the Expression Editor
Syntaxcast_float ( exp )
cast_integer
Returns the value of "exp" cast as a integer.
Syntaxcast_integer ( exp )
cast_longvarchar
Returns the value of "string_exp" cast as a longvarchar.
Syntaxcast_longvarchar ( string_exp )
cast_smallint
Returns the value of "exp" cast as a smallint.
Syntaxcast_smallint ( exp )
cast_time
Returns the value of "string_exp" cast as a time value.
Syntaxcast_time ( string_exp )
cast_timestamp
Returns the value of "exp" cast as a datetime.
Syntaxcast_timestamp ( exp )
cast_varchar
Returns the value of "exp" cast as a varchar with length "integer_exp".
Syntaxcast_varchar ( exp, integer_exp )
DB2 Math
log
Returns the natural logarithm of "numeric_exp".
Syntaxlog ( numeric_exp )
322 Report Studio
Chapter 10: Using the Expression Editor
log10
Returns the base ten logarithm of "numeric_exp".
Syntaxlog10 ( numeric_exp )
rand
Generates a random number using "integer_exp" as a seed value.
Syntaxrand ( integer_exp )
DB2 Trigonometry
acos
Returns the arccosine of "numeric_exp" in radians. The arccosine is the angle whose cosine is
"numeric_exp".
Syntaxacos ( numeric_exp )
asin
Returns the arcsine of "numeric_exp" in radians. The arcsine is the angle whose sine is
"numeric_exp".
Syntaxasin ( numeric_exp )
atan
Returns the arctangent of "numeric_exp" in radians. The arctangent is the angle whose tangent is
"numeric_exp".
Syntaxatan ( numeric_exp )
atanh
Returns the hyperbolic arctangent of "numeric_exp" where "numeric_exp" is an angle expressed
in radians.
Syntaxatanh (numeric_exp )
atan2
Returns the arctangent of the x and y coordinates specified by "numeric_exp1" and "numeric_exp2",
respectively, in radians. The arctangent is the angle whose tangent is "numeric_exp2" /
"numeric_exp1".
Professional Authoring User Guide 323
Chapter 10: Using the Expression Editor
Syntaxatan2 ( numeric_exp1, numeric_exp2 )
cos
Returns the cosine of "numeric_exp" where "numeric_exp" is an angle expressed in radians.
Syntaxcos ( numeric_exp )
cosh
Returns the hyperbolic cosine of "numeric_exp" where "numeric_exp" is an angle expressed in
radians.
Syntaxcosh ( numeric_exp )
cot
Returns the cotangent of "numeric_exp" where "numeric_exp" is an angle expressed in radians.
Syntaxcot ( numeric_exp )
degrees
Returns "numeric_exp" radians converted to degrees.
Syntaxdegrees ( numeric_exp )
sin
Returns the sine of "numeric_exp" where "numeric_exp" is an angle expressed in radians.
Syntaxsin ( numeric_exp )
sinh
Returns the hyperbolic sine of "numeric_exp" where "numeric_exp" is an angle expressed in radians.
Syntaxsinh ( numeric_exp )
tan
Returns the tangent of "numeric_exp" where "numeric_exp" is an angle expressed in radians.
Syntaxtan ( numeric_exp )
324 Report Studio
Chapter 10: Using the Expression Editor
tanh
Returns the hyperbolic tangent of "numeric_exp" where "numeric_exp" is an angle expressed in
radians.
Syntaxtanh ( numeric_exp )
Informix
cardinality
Returns the number of elements in a collection column (SET, MULTISET, LIST).
Syntaxcardinality ( string_exp )
char_length
Returns the number of logical characters (which can be distinct from the number of bytes in some
East Asian locales) in "string_exp".
Syntaxchar_length ( string_exp )
concat
Returns a string that is the result of concatenating "string_exp1" to "string_exp2".
Syntaxconcat ( string_exp1, string_exp2 )
date
Returns the date value of "string_exp" or "date_exp" or "int_exp".
Syntaxdate ( string_exp | date_exp | int_exp )
day
Returns an integer that represents the day of the month.
Syntaxday ( date_exp )
extend
Adjusts the precision of a DATETIME or DATE expression. The expression cannot be a quoted
string representation of a DATE value. If you do not specify first and last qualifiers, the default
qualifiers are YEAR TO FRACTION(3). If the expression contains fields that are not specified by
the qualifiers, the unwanted fields are discarded. If the first qualifier specifies a larger (that is, more
significant) field than what exists in the expression, the new fields are filled in with values returned
Professional Authoring User Guide 325
Chapter 10: Using the Expression Editor
by the CURRENT function. If the last qualifier specifies a smaller field (that is, less significant)
than what exists in the expression, the new fields are filled in with constant values. A missing
MONTH or DAY field is filled in with 1, and the missing HOUR to FRACTION fields are filled
in with 0.
Syntaxextend ( date_exp , ' { ' YEAR TO SECOND ' } ' )
ExampleEXTEND (some_date_column , {YEAR TO SECOND} )
hex
Returns the hexadecimal encoding of "integer_exp".
Syntaxhex ( integer_exp )
initcap
Returns "string_exp", with the first letter of each word in uppercase and all other letters in lowercase.
A word begins after any character other than a letter. Thus, in addition to a blank space, symbols
such as commas, periods, colons, and so on, introduce a new word.
Syntaxinitcap ( string_exp )
length
Returns the number of bytes in "string_exp", not including any trailing blank spaces. For BYTE
or TEXT "string_exp", LENGTH returns the full number of bytes, including any trailing blank
spaces.
Syntaxlength ( string_exp )
lpad
Returns a copy of "string_exp1" that is left-padded by "string_exp2" to the total number of char-
acters specified by "integer_exp". The sequence of "string_exp2" occurs as many times as necessary
to make the return string the length specified by "integer_exp".
Syntaxlpad ( string_exp1, integer_exp, string_exp2 )
mdy
Returns a type DATE value with three expressions that evaluate to integers that represent the month
(integer_exp1), day (integer_exp2), and year (integer_exp3).
326 Report Studio
Chapter 10: Using the Expression Editor
Syntaxmdy ( integer_exp1, integer_exp2, integer_exp3 )
month
Returns an integer corresponding to the month portion of "date_exp".
Syntaxmonth ( date_exp )
nvl
Returns the value of "exp1" if "exp1" is not NULL. If "exp1" is NULL, then the value of "exp2"
is returned.
Syntaxnvl ( exp1, exp2 )
octet_length
Returns the number of bytes in "string_exp", including any trailing spaces.
Syntaxoctet_length ( string_exp )
replace
Returns a copy of "string_exp1" in which every occurrence of "string_exp2" is replaced by
"string_exp3". If you omit the "string_exp3" option, every occurrence of "string_exp2" is omitted
from the return string.
Syntaxreplace ( string_exp1, string_exp2 [ , string_exp3 ])
round
Returns the rounded value of "numeric_exp". If you omit "integer_exp", the value is rounded to
zero digits or to the units place. The digit range of 32 (+ and -) refers to the entire decimal value.
Syntaxround ( numeric_exp [ , integer_exp ] )
rpad
Returns a copy of "string_exp1" that is right-padded by "string_exp2" to the total number of
characters specified by "integer_exp". The sequence of "string_exp2" occurs as many times as
necessary to make the return string the length specified by "integer_exp".
Syntaxrpad ( string_exp1, integer_exp, string_exp2 )
Professional Authoring User Guide 327
Chapter 10: Using the Expression Editor
substr
Returns the substring of "string_exp" that starts at position "integer_exp1". The first character in
"string_exp" is at position 1. "Integer_exp2" can be used to select fewer characters, by default it
selects to the end of the string.
Syntaxsubstr ( string_exp, integer_exp1 [ , integer_exp2 ])
to_char
Returns the character string "date_exp" with the specified "string_exp" formatting. You can use
this function only with built-in data types.
Syntaxto_char ( date_exp, string_exp )
to_date
Returns "string_exp1" as a date according to the date format you specify in the "string_exp2"
parameter. If "string_exp1" is NULL, then a NULL value is returned.
Syntaxto_date ( string_exp1, string_exp2 )
trunc
Returns the truncated value of "numeric_exp". If you omit "integer_exp", the value is truncated
to zero digits or to the unit’s place. The digit limitation of 32 (+ and -) refers to the entire decimal
value.
Syntaxtrunc ( numeric_exp [ , integer_exp ] )
weekday
Returns an integer that represents the day of the week; zero (0) represents Sunday, one (1) represents
Monday, and so on.
Syntaxweekday ( date_exp )
year
Returns a four-digit integer that represents the year.
Syntaxyear ( date_exp )
328 Report Studio
Chapter 10: Using the Expression Editor
Informix Math
log10
Returns the log of "numeric_exp" to base 10.
Syntaxlog10 ( numeric_exp )
logn
Returns the natural logarithm of "numeric_exp".
Syntaxlogn ( numeric_exp )
root
Returns the root value of "numeric_exp". Requires at least one numeric argument (the radians
argument). If only "numeric_exp1" is supplied, 2 is used as a default value for "numeric_exp2"; 0
cannot be used as the value of "numeric_exp2".
Syntaxroot ( numeric_exp1[ , numeric_exp2 ] )
Informix Trigonometry
acos
Returns the arccosine of "numeric_exp" in radians. The arccosine is the angle whose cosine is
"numeric_exp".
Syntaxacos ( numeric_exp )
asin
Returns the arcsine of "numeric_exp" in radians. The arcsine is the angle whose sine is
"numeric_exp".
Syntaxasin ( numeric_exp )
atan
Returns the arctangent of "numeric_exp" in radians. The arctangent is the angle whose tangent is
"numeric_exp".
Syntaxatan ( numeric_exp )
Professional Authoring User Guide 329
Chapter 10: Using the Expression Editor
atan2
Returns the arctangent of the x and y coordinates specified by "numeric_exp1" and "numeric_exp2",
respectively, in radians. The arctangent is the angle whose tangent is "numeric_exp1".
Syntaxatan2 ( numeric_exp1, numeric_exp2 )
cos
Returns the cosine of "numeric_exp" where "numeric_exp" is an angle expressed in radians.
Syntaxcos ( numeric_exp )
sin
Returns the sine of "numeric_exp" where "numeric_exp" is an angle expressed in radians.
Syntaxsin ( numeric_exp )
tan
Returns the tangent of "numeric_exp" where "numeric_exp" is an angle expressed in radians.
Syntaxtan ( numeric_exp )
MS Access
ascii
Returns a number representing the ascii code value of the leftmost character of "string_exp".
Syntaxascii(string_exp)
ceiling
Returns the smallest integer greater than or equal to "numeric_exp".
Syntaxceiling(numeric_exp)
chr
Returns the character that has the ASCII code value specified by "integer_exp". "Integer_exp"
should be between 0 and 255.
Syntaxchr(integer_exp)
330 Report Studio
Chapter 10: Using the Expression Editor
concat
Returns a string that is the result of concatenating "string_exp1" to "string_exp2".
Syntaxconcat(string_exp1, string_exp2)
curdate
Returns a date value representing the current date of the computer that the database software runs
on.
Syntaxcurdate()
curtime
Returns a time value representing the current time of the computer that the database software runs
on.
Syntaxcurtime()
dayname
Returns a character string containing the data source specific name of the day (for example, Sunday
through Saturday or Sun. through Sat. for an English data source, or Sonntag through Samstag for
a German data source) for the day portion of "date_exp".
Syntaxdayname(date_exp)
dayofmonth
Returns the day of the month (1-31) from "date_exp". Returns the days field (a signed integer)
from "interval_exp".
Syntaxdayofmonth(date_exp|interval_exp)
dayofweek
Returns the day of the week in "date_exp" as an integer (1-7), where 1 represents Monday.
Syntaxdayofweek(date_exp)
dayofyear
Returns the day of the year in "date_exp" as an integer (1-366).
Syntaxdayofyear(date_exp)
Professional Authoring User Guide 331
Chapter 10: Using the Expression Editor
hour
Returns the hour (an integer from 0 (midnight) to 23 (11:00 pm)) from "time_exp".
Syntaxhour(time_exp)
instr
Searches "string_exp1" for the first occurrence of "string_exp2" and returns an integer specifying
the position of "string_exp2". The optional argument "integer_exp1" sets the starting position for
the search. If omitted, the search begins at the first character position of "string_exp1". The optional
argument "integer_exp2" specifies the type of string comparison. "Integer_exp1" is required if
"integer_exp2" is specified.
Syntaxinstr ( [ integer_exp1 , ] string_exp1, string_exp2 [, integer_exp2 ] )
lcase
Returns "string_exp" with all uppercase characters shifted to lowercase.
Syntaxlcase(string_exp)
left
Returns the leftmost "integer_exp" characters of "string_exp".
Syntaxleft(string_exp, integer_exp)
length
Returns the number of characters in "string_exp", excluding trailing blanks and the string termin-
ation character.
Syntaxlength(string_exp)
locate
Returns the starting position of the first occurrence of "string_exp1" within "string_exp2". The
search starts at position "integer_exp" of "string_exp2". The first character in a string is at position
1. If "string_exp1" is not found then zero is returned.
Syntaxlocate(string_exp1, string_exp2 [ , integer_exp ] )
ltrim
Returns "string_exp" with leading spaces removed.
332 Report Studio
Chapter 10: Using the Expression Editor
Syntaxltrim(string_exp)
minute
Returns the minute (an integer from 0-59) from "time_exp".
Syntaxminute(time_exp)
month
Returns the month (an integer from 1-12) from "date_exp".
Syntaxmonth(date_exp)
monthname
Returns a character string containing the data source specific name of the month (for example,
January through December or Jan. through Dec. for an English data source, or Januar through
Dezember for a German data source) for the month portion of "date_exp".
Syntaxmonthname(date_exp)
now
Returns a datetime value representing the current date and time of the computer that the database
software runs on.
Syntaxnow()
position
Returns the starting position of "string_exp1" in "string_exp2". The first character in a string is
at position 1.
Syntaxposition(string_exp1, string_exp2)
quarter
Returns the quarter in "date_exp" as a number (1-4), where 1 represents January 1 through March
31.
Syntaxquarter(date_exp)
right
Returns the rightmost "integer_exp" characters of "string_exp".
Professional Authoring User Guide 333
Chapter 10: Using the Expression Editor
Syntaxright(string_exp, integer_exp)
round
Returns "numeric_exp" rounded to the nearest value "integer_exp" places right of the decimal
point. If "integer_exp" is negative, "numeric_exp" is rounded to the nearest absolute value,
"integer_exp" places to the left of the decimal point.
Syntaxround(numeric_exp, integer_exp)
rtrim
Returns "string_exp" with trailing spaces removed.
Syntaxrtrim(string_exp)
sign
Returns an indicator of the sign of "numeric_exp": +1 if positive, 0 if zero, or -1 if negative.
Syntaxsign(numeric_exp)
space
Returns a string consisting of "integer_exp" spaces.
Syntaxspace(integer_exp)
substr
Returns the substring of "string_exp" that starts at position "integer_exp1" for "integer_exp2"
characters. The first character in "string_exp" is at position 1.
Syntaxsubstr(string_exp, integer_exp1, integer_exp2)
substring
Returns the substring of "string_exp" that starts at position "integer_exp1" for "integer_exp2"
characters. The first character in "string_exp" is at position 1.
Syntaxsubstring(string_exp, integer_exp1, integer_exp2)
truncate
Returns "string_exp" with trailing spaces removed.
334 Report Studio
Chapter 10: Using the Expression Editor
Syntaxtruncate(string_exp)
ucase
Returns "string_exp" with all lowercase characters shifted to uppercase.
Syntaxucase(string_exp)
week
Returns the week of the year in "date_exp" as an integer value (1-53), where 1 represents the first
week of the year.
Syntaxweek(date_exp)
year
Returns the year from "date_exp".
Syntaxyear(date_exp)
MS Access Cast
cast_decimal
Returns the value of "exp" cast as a decimal.
Syntaxcast_decimal(exp)
cast_float
Returns the value of "exp" cast as a float.
Syntaxcast_float(exp)
cast_integer
Returns the value of "exp" cast as an integer.
Syntaxcast_integer(exp)
cast_numeric
Returns the value of "string_exp" cast as a numeric value.
Syntaxcast_numeric(string_exp)
Professional Authoring User Guide 335
Chapter 10: Using the Expression Editor
cast_real
Returns the value of "exp" cast as a real.
Syntaxcast_real(exp)
cast_smallint
Returns the value of "exp" cast as a smallint.
Syntaxcast_smallint(exp)
cast_varchar
Returns the value of "exp" cast as a varchar.
Syntaxcast_varchar(exp)
MS Access Math
log
Returns the natural logarithm of "numeric_exp".
Syntaxlog(numeric_exp)
rand
Generates a random number using "integer_exp" as a seed value.
Syntaxrand(integer_exp)
MS Access Trigonometry
atan
Returns the arctangent of "numeric_exp" in radians. The arctangent is the angle whose tangent is
"numeric_exp".
Syntaxatan(numeric_exp)
cos
Returns the cosine of "numeric_exp" where "numeric_exp" is an angle expressed in radians.
Syntaxcos(numeric_exp)
336 Report Studio
Chapter 10: Using the Expression Editor
sin
Returns the sine of "numeric_exp" where "numeric_exp" is an angle expressed in radians.
Syntaxsin(numeric_exp)
tan
Returns the tangent of "numeric_exp" where "numeric_exp" is an angle expressed in radians.
Syntaxtan(numeric_exp)
Oracle
add_months
Returns the datetime resulting from adding "integer_exp" months to "date_exp".
Syntaxadd_months ( date_exp, integer_exp )
ascii
Returns a number representing the ascii code value of the leftmost character of "string_exp", e.g.
ascii('A') is 65.
Syntaxascii ( string_exp )
ceil
Returns the smallest integer greater than or equal to "numeric_exp".
Syntaxceil ( numeric_exp )
char_length
Returns the number of characters in "string_exp".
Syntaxchar_length ( string_exp )
chr
Returns the character that has the ASCII code value specified by "integer_exp". "Integer_exp"
should be between 0 and 255.
Syntaxchr ( integer_exp )
Professional Authoring User Guide 337
Chapter 10: Using the Expression Editor
concat
Returns a string that is the result of concatenating "string_exp1" to "string_exp2".
Syntaxconcat ( string_exp1, string_exp2 )
decode
Compares "expr" to each search value one by one. If "expr" is equal to a search, then it returns
the corresponding result. If no match is found, it returns "default". If "default" is omitted, it returns
null.
Syntaxdecode ( expr , search , result [, search , result]...[, default] )
dump
Returns internal representation of "expr" with the format of "numeric_exp1" starting from position
"numeric_exp2" for "numeric_exp3".
Syntaxdump ( expr [ , numeric_exp1 [ , numeric_exp2 [ , numeric_exp3] ] ] )
greatest
Returns the greatest value in "exp_list".
Syntaxgreatest ( exp_list )
initcap
Returns "string_exp", with the first letter of each word in uppercase, all other letters in lowercase.
Words are delimited by white space or characters that are not alphanumeric.
Syntaxinitcap ( string_exp )
instr
Searches "string_exp1" starting at position "integer_exp1" for the "integer_exp2" occurance of
"string_exp2". If "integer_exp1" is negative then the search is backwards from the end of
"string_exp1". Returns an integer indicating the position of "string_exp2".
Syntaxinstr ( string_exp1, string_exp2 [ , integer_exp1 [ ,integer_exp2 ] ] )
338 Report Studio
Chapter 10: Using the Expression Editor
instrb
Searches "string_exp1" starting at position "integer_exp1" for the "integer_exp2" occurance of
"string_exp2". If "integer_exp1" is negative then the search is backwards from the end of
"string_exp1". The result returned indicates the position (byte number) where the search was found.
Syntaxinstrb ( string_exp1, string_exp2 [ , integer_exp1 [, integer_exp2 ] ] )
least
Returns the least value in "exp_list".
Syntaxleast ( exp_list )
length
Returns the number of characters in "string_exp".
Syntaxlength ( string_exp )
lengthb
Returns the number of bytes in "string_exp".
Syntaxlengthb ( string_exp )
lpad
Returns "string_exp1" padded to length "integer_exp" with occurrences of "string_exp2". If
"string_exp1" is longer than "integer_exp", the appropriate portion of "string_exp1" is returned.
Syntaxlpad ( string_exp1, integer_exp [ , string_exp2 ] )
ltrim
Returns "string_exp1", with leading characters removed up to the first character not in
"string_exp2", e.g. ltrim('xyxXxyAB', 'xy') returns 'XxyAB'.
Syntaxltrim ( string_exp1 [ , string_exp2 ] )
months_between
Returns the number of months from "date_exp1" to "date_exp2". If "date_exp1" is later than
"date_exp2" then the result will be a positive number. The days and time portion of the difference
are ignored, i.e. the months are not rounded, except if "date_exp1" and "date_exp2" are the last
days of a month.
Professional Authoring User Guide 339
Chapter 10: Using the Expression Editor
Syntaxmonths_between ( date_exp1, date_exp2 )
new_time
Returns the datetime in timezone "new_tz" for "datetime_exp" in "old_tz" timezone. "Old_tz"
and "new_tz" can be one of 'AST', 'ADT', 'BST', 'BDT', 'CST', 'CDT', 'EST', 'EDT', 'HST', 'HDT',
'MST', 'MDT', 'NST', 'PST', 'PDT', 'YST' or 'YDT'.
Syntaxnew_time ( datetime_exp, old_tz, new_tz )
next_day
Returns the datetime of the first weekday named by "string_exp" that is later than "datetime_exp".
The return value has the same hours, minutes, and seconds as "datetime_exp".
Syntaxnext_day ( datetime_exp, string_exp )
nls_initcap
Returns "string_exp1" with the first letter of each word in uppercase, all other letters in lowercase.
Words are delimited by white space or characters that are not alphanumeric. "String_exp2" specifies
the sorting sequence.
Syntaxnls_initcap ( string_exp1 [ , string_exp2 ] )
nls_lower
Returns "string_exp1" with all letters in lowercase. "String_exp2" specifies the sorting sequence.
Syntaxnls_lower ( string_exp1 [ , string_exp2 ] )
nls_upper
Returns "string_exp1" with all letters in uppercase. "String_exp2" specifies the sorting sequence.
Syntaxnls_upper ( string_exp1 [ , string_exp2 ] )
nvl
Returns "exp" if not null, otherwise returns "constant". Valid for "numeric_exp", "string_exp",
"date_exp", and "time_exp".
Syntaxnvl ( exp, constant )
340 Report Studio
Chapter 10: Using the Expression Editor
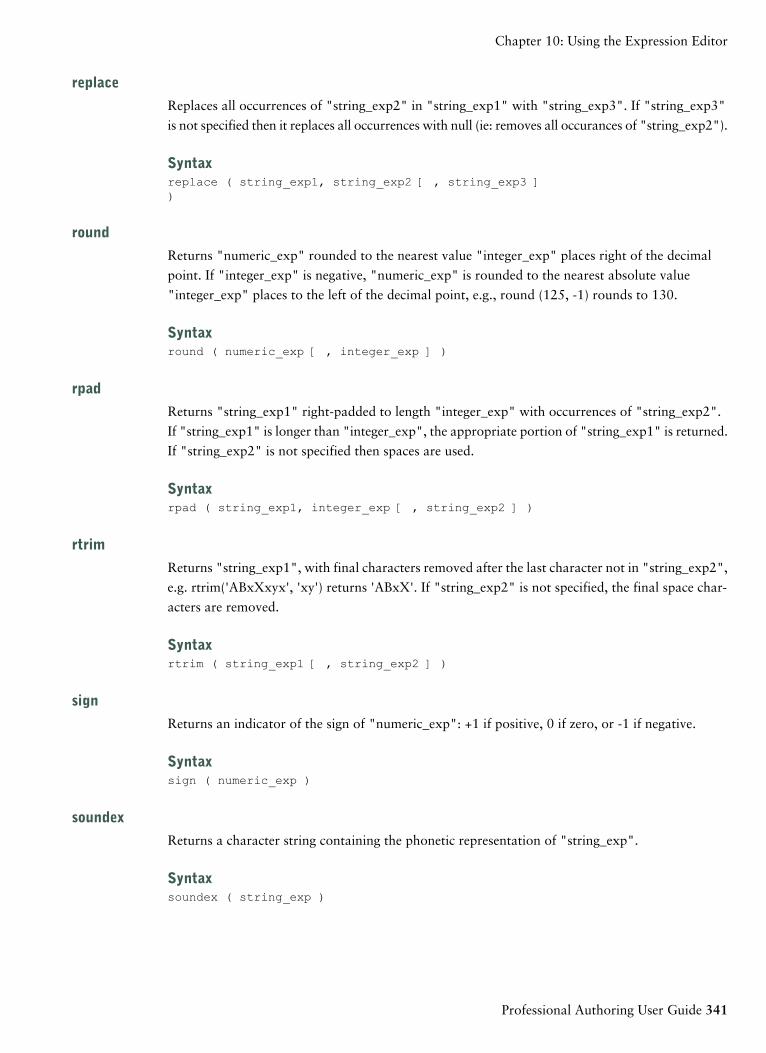
replace
Replaces all occurrences of "string_exp2" in "string_exp1" with "string_exp3". If "string_exp3"
is not specified then it replaces all occurrences with null (ie: removes all occurances of "string_exp2").
Syntaxreplace ( string_exp1, string_exp2 [ , string_exp3 ])
round
Returns "numeric_exp" rounded to the nearest value "integer_exp" places right of the decimal
point. If "integer_exp" is negative, "numeric_exp" is rounded to the nearest absolute value
"integer_exp" places to the left of the decimal point, e.g., round (125, -1) rounds to 130.
Syntaxround ( numeric_exp [ , integer_exp ] )
rpad
Returns "string_exp1" right-padded to length "integer_exp" with occurrences of "string_exp2".
If "string_exp1" is longer than "integer_exp", the appropriate portion of "string_exp1" is returned.
If "string_exp2" is not specified then spaces are used.
Syntaxrpad ( string_exp1, integer_exp [ , string_exp2 ] )
rtrim
Returns "string_exp1", with final characters removed after the last character not in "string_exp2",
e.g. rtrim('ABxXxyx', 'xy') returns 'ABxX'. If "string_exp2" is not specified, the final space char-
acters are removed.
Syntaxrtrim ( string_exp1 [ , string_exp2 ] )
sign
Returns an indicator of the sign of "numeric_exp": +1 if positive, 0 if zero, or -1 if negative.
Syntaxsign ( numeric_exp )
soundex
Returns a character string containing the phonetic representation of "string_exp".
Syntaxsoundex ( string_exp )
Professional Authoring User Guide 341
Chapter 10: Using the Expression Editor
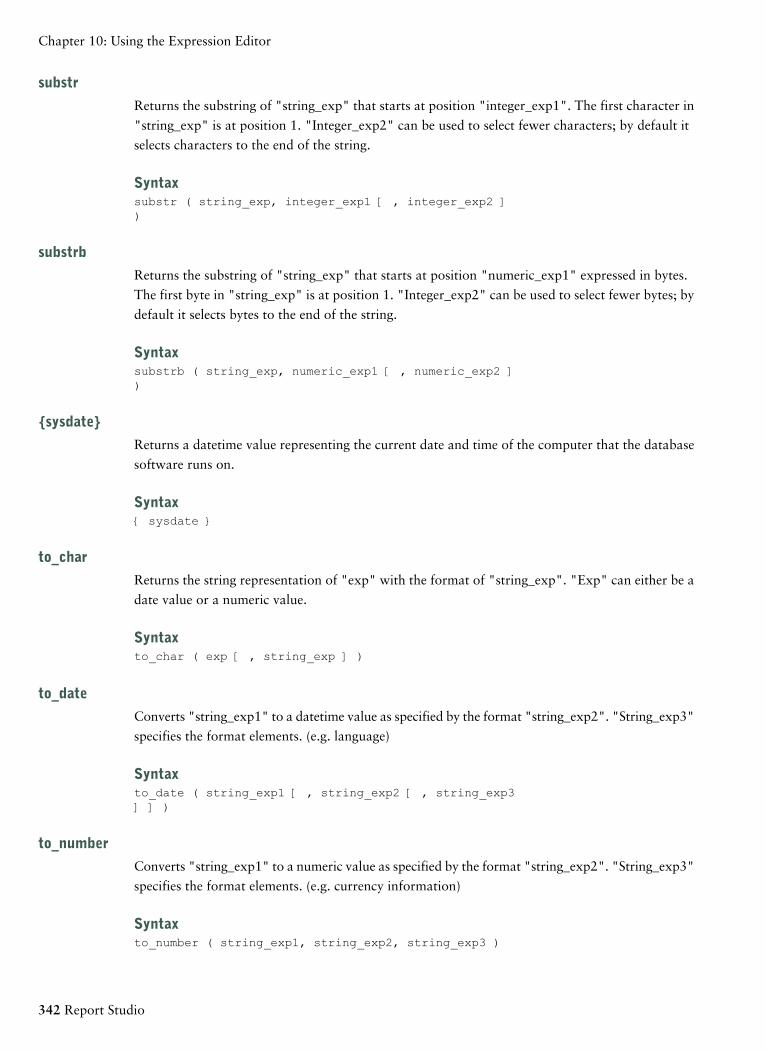
substr
Returns the substring of "string_exp" that starts at position "integer_exp1". The first character in
"string_exp" is at position 1. "Integer_exp2" can be used to select fewer characters; by default it
selects characters to the end of the string.
Syntaxsubstr ( string_exp, integer_exp1 [ , integer_exp2 ])
substrb
Returns the substring of "string_exp" that starts at position "numeric_exp1" expressed in bytes.
The first byte in "string_exp" is at position 1. "Integer_exp2" can be used to select fewer bytes; by
default it selects bytes to the end of the string.
Syntaxsubstrb ( string_exp, numeric_exp1 [ , numeric_exp2 ])
{sysdate}
Returns a datetime value representing the current date and time of the computer that the database
software runs on.
Syntax{ sysdate }
to_char
Returns the string representation of "exp" with the format of "string_exp". "Exp" can either be a
date value or a numeric value.
Syntaxto_char ( exp [ , string_exp ] )
to_date
Converts "string_exp1" to a datetime value as specified by the format "string_exp2". "String_exp3"
specifies the format elements. (e.g. language)
Syntaxto_date ( string_exp1 [ , string_exp2 [ , string_exp3] ] )
to_number
Converts "string_exp1" to a numeric value as specified by the format "string_exp2". "String_exp3"
specifies the format elements. (e.g. currency information)
Syntaxto_number ( string_exp1, string_exp2, string_exp3 )
342 Report Studio
Chapter 10: Using the Expression Editor
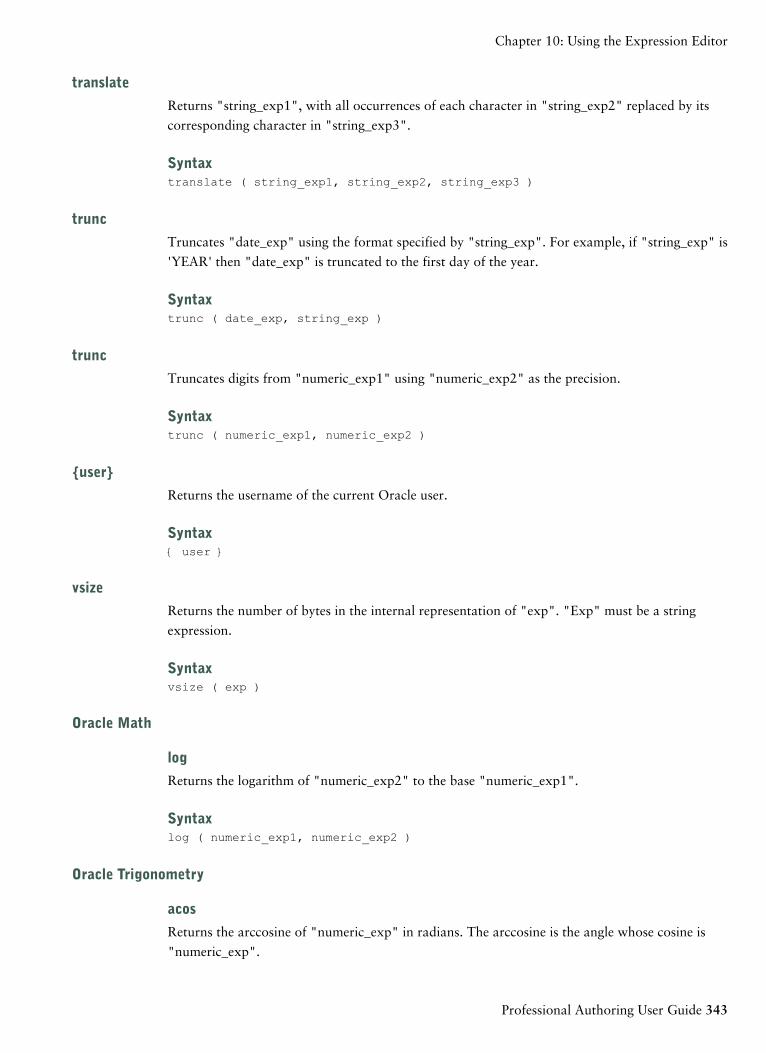
translate
Returns "string_exp1", with all occurrences of each character in "string_exp2" replaced by its
corresponding character in "string_exp3".
Syntaxtranslate ( string_exp1, string_exp2, string_exp3 )
trunc
Truncates "date_exp" using the format specified by "string_exp". For example, if "string_exp" is
'YEAR' then "date_exp" is truncated to the first day of the year.
Syntaxtrunc ( date_exp, string_exp )
trunc
Truncates digits from "numeric_exp1" using "numeric_exp2" as the precision.
Syntaxtrunc ( numeric_exp1, numeric_exp2 )
{user}
Returns the username of the current Oracle user.
Syntax{ user }
vsize
Returns the number of bytes in the internal representation of "exp". "Exp" must be a string
expression.
Syntaxvsize ( exp )
Oracle Math
log
Returns the logarithm of "numeric_exp2" to the base "numeric_exp1".
Syntaxlog ( numeric_exp1, numeric_exp2 )
Oracle Trigonometry
acos
Returns the arccosine of "numeric_exp" in radians. The arccosine is the angle whose cosine is
"numeric_exp".
Professional Authoring User Guide 343
Chapter 10: Using the Expression Editor
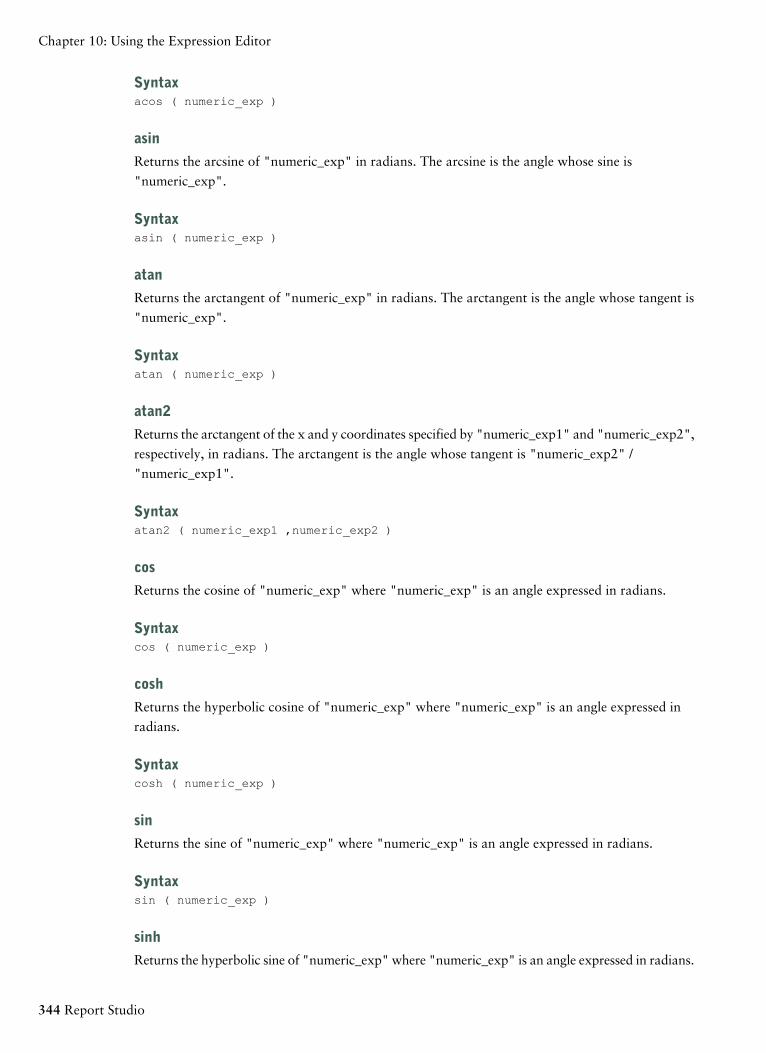
Syntaxacos ( numeric_exp )
asin
Returns the arcsine of "numeric_exp" in radians. The arcsine is the angle whose sine is
"numeric_exp".
Syntaxasin ( numeric_exp )
atan
Returns the arctangent of "numeric_exp" in radians. The arctangent is the angle whose tangent is
"numeric_exp".
Syntaxatan ( numeric_exp )
atan2
Returns the arctangent of the x and y coordinates specified by "numeric_exp1" and "numeric_exp2",
respectively, in radians. The arctangent is the angle whose tangent is "numeric_exp2" /
"numeric_exp1".
Syntaxatan2 ( numeric_exp1 ,numeric_exp2 )
cos
Returns the cosine of "numeric_exp" where "numeric_exp" is an angle expressed in radians.
Syntaxcos ( numeric_exp )
cosh
Returns the hyperbolic cosine of "numeric_exp" where "numeric_exp" is an angle expressed in
radians.
Syntaxcosh ( numeric_exp )
sin
Returns the sine of "numeric_exp" where "numeric_exp" is an angle expressed in radians.
Syntaxsin ( numeric_exp )
sinh
Returns the hyperbolic sine of "numeric_exp" where "numeric_exp" is an angle expressed in radians.
344 Report Studio
Chapter 10: Using the Expression Editor
Syntaxsinh ( numeric_exp )
tan
Returns the tangent of "numeric_exp" where "numeric_exp" is an angle expressed in radians.
Syntaxtan ( numeric_exp )
tanh
Returns the hyperbolic tangent of "numeric_exp" where "numeric_exp" is an angle expressed in
radians.
Syntaxtanh ( numeric_exp )
Red Brick
ceil
Returns the smallest integer greater than or equal to "numeric_exp" or "string_exp". Note that
"string_exp" must represent a valid numeric value.
Syntaxceil ( numeric_exp | string_exp )
concat
Returns "string_exp1" concatenated with "string_exp2".
Syntaxconcat ( string_exp1 , string_exp2 )
{current_user}
Returns the database username (authorization ID) of the current user.
Syntax{ current_user }
date
Returns a date value. "Exp" can be either characters or a timestamp.
Syntaxdate ( exp )
Professional Authoring User Guide 345
Chapter 10: Using the Expression Editor
dateadd
Adds an interval to a datetime value and returns a result that is the same datetime data type as that
of "datetime_exp". The datepart refers to year, month, day, hour, minute, second. The interval
must be an integer and "datetime_exp" can be date, time, or timestamp.
Syntaxdateadd ( { datepart }, interval, datetime_exp )
datediff
Determines the difference between two datetime expressions and returns an integer result in
"datepart" units. "Datepart" refers to year, month, day, hour, minute, or second. "Datetime_exp1"
and "datetime_exp2" can be dates, times, or timestamps.
Syntaxdatediff ( { datepart }, datetime_exp1, datetime_exp2)
datename
Extracts the specified datepart component and returns its value as a character string. The datepart
refers to year, month, day, hour, minute, or second. "Datetime_exp" can be a date, a time, or a
timestamp.
Syntaxdatename ( { datepart }, datetime_exp )
dec
Converts a specified value to a decimal value and returns a value with the data type decimal (preci-
sion, scale). The default value of precision is 9. The default value of scale is 0.
Syntaxdec ( exp, [precision, scale] )
decimal
Converts a specified value to a decimal value and returns a value with the data type decimal (preci-
sion, scale). The default value of precision is 9. The default value of scale is 0.
Syntaxdecimal ( exp, [precision, scale] )
decode
Compares and converts "exp" to another value. If "exp" matches the target, it is replaced, otherwise
it is replaced by default or by NULL if no default is specified. The expressions can be any data type
as long as they are all the same data type.
Syntaxdecode ( exp, target, replacement [,default] )
346 Report Studio
Chapter 10: Using the Expression Editor
float
Converts a specified value into a double-precision floating-point value.
Syntaxfloat ( numeric_exp )
ifnull
Tests "exp" for missing values and replaces each one with a specified value. If "exp" is NULL,
"substitute" is returned, otherwise it returns the value of "exp". The expressions can be any data
type as long as they are all the same data type.
Syntaxifnull ( exp, substitute )
int
Converts "numeric_exp" into an integer value and returns an integer value. If the argument is
NULL, it returns NULL.
Syntaxint ( numeric_exp )
integer
Converts "numeric_exp" into an integer value and returns an integer value. If the argument is
NULL, it returns NULL.
Syntaxinteger ( numeric_exp )
length
Returns an integer result specifying the number of characters in "string_exp". If "string_exp" is
NULL, it returns NULL.
Syntaxlength ( string_exp )
lengthb
Returns an integer result specifying the number of bytes in "string_exp". If "string_exp" is NULL,
it returns NULL.
Syntaxlengthb ( string_exp )
ltrim
Removes leading blanks from "string_exp". If "string_exp" is NULL, it returns NULL.
Professional Authoring User Guide 347
Chapter 10: Using the Expression Editor
Syntaxltrim ( string_exp )
nullif
Returns NULL if both "exp1" and "exp2" have the same value. If they have different values, the
value of "exp1" is returned. "Exp1" and "exp2" can be any data type as long as they are the same
data type.
Syntaxnullif ( exp1, exp2 )
positionb
Returns an integer that is relative to the beginning byte position of "string_exp1" in "string_exp2".
If "string_exp1" is not located, the result is 0. If "string_exp1" is of zero length, the result is 1. If
"string_exp1" is NULL, an error message is returned. If "string_exp2" is NULL, the result is 0.
Syntaxpositionb ( string_exp1, string_exp2 )
real
Returns a real value. If "numeric_exp" is NULL, it returns NULL.
Syntaxreal ( numeric_exp )
round
Returns "numeric_exp" rounded to the nearest value "integer_exp" places to the right of the decimal
point. If "integer_exp" is negative, "numeric_exp" is rounded to the nearest absolute value
"integer_exp" places to the left of the decimal point, e.g., round (125, -1) rounds to 130.
Syntaxround ( numeric_exp, integer_exp )
rtrim
Removes trailing blanks from "string_exp". If "string_exp" is NULL, it returns NULL.
Syntaxrtrim ( string_exp )
sign
Determines the sign of "numeric_exp", and returns 1 for a positive value, –1 for a negative value,
and 0 for zero.
Syntaxsign ( numeric_exp )
348 Report Studio
Chapter 10: Using the Expression Editor
string
Converts numeric or datetime values to character strings. "Exp" can be either numeric or datetime.
Syntaxstring ( exp [, length [, scale]] )
substr
Returns a substring of "string_exp" that begins at position "start_integer" and continues for
"length_integer" characters. If "length_integer" is not specified, a substring from the start to the
end of "string_exp" is returned.
Syntaxsubstr ( string_exp, start_integer, length_integer )
substrb
Returns a substring of "string_exp" that begins at position "start_integer" and continues for
"length_integer" bytes. If "length_integer" is not specified, a substring from the start to the end of
"string_exp" is returned.
Syntaxsubstrb ( string_exp, start_integer, length_integer )
time
Creates a time value from a character string or a time-stamp data type expression.
Syntaxtime ( exp )
timestamp
Creates a time-stamp value from a character string.
Syntaxtimestamp ( timestamp_exp )
timestamp
Creates a time-stamp value from "time_exp" and "date_exp". If either "time_exp" or "date_exp"
is NULL, the resulting time-stamp expression is also NULL.
Syntaxtimestamp ( date_exp, time_exp )
to_char
This function is a datetime scalar function that operates on a date, time, or timestamp data type
and returns the character string specified by a given format.
Professional Authoring User Guide 349
Chapter 10: Using the Expression Editor
Syntaxto_char ( source_date, format_str )
SQL Server
ascii
Returns a number representing the ascii code value of the leftmost character of "string_exp", e.g.
ascii('A') is 65.
Syntaxascii ( string_exp )
char
Returns the character that has the ASCII code value specified by "integer_exp". "Integer_exp"
should be between 0 and 255. e.g. char(65) has the value 'A'.
Syntaxchar ( integer_exp )
charindex
Searches "string_exp2" for the first occurrence of "string_exp1" and returns an integer.
"Start_location" is the character position to start searching for "string_exp1" in "string_exp2". If
"start_location" is not specified, is a negative number, or is zero, the search starts at the beginning
of "string_exp2".
Syntaxcharindex ( string_exp1, string_exp2 [ , start_location] )
{current_user}
Returns the name of the current user.
Syntax{ current_user }
datalength
Returns the length in bytes of "string_exp".
Syntaxdatalength ( string_exp )
dateadd
Returns the date resulting from the addition of "integer_exp" units (indicated by datepart (day,
month, year)) to "date_exp".
350 Report Studio
Chapter 10: Using the Expression Editor
Syntaxdateadd ( {datepart}, integer_exp, date_exp )
datediff
Returns the number of units indicated by datepart (day, month, year) between "date_exp1" and
"date_exp2".
Syntaxdatediff ( {datepart}, date_exp1, date_exp2 )
datename
Returns part of a datetime, smalldatetime, date or time value as an ASCII string. Note that the
"datepart" argument must be a keyword representing a datepart or its abbreviation recognized by
Microsoft SQL Server and must be enclosed in curly brackets.
Syntaxdatename ( ' { ' datepart ' } ' , date_exp )
Exampledatename ( {mm}, 2000-01-01 )
Result: January.
datepart
Returns part of a datetime, smalldatetime, date or time value (for example, the month) as an integer.
Note that the "datepart" argument must be a keyword representing a datepart or its abbreviation
recognized by Microsoft SQL Server and must be enclosed in curly brackets.
Syntaxdatepart ( ' { ' datepart ' } ' , date_exp )
Exampledatepart ( {wk}, 2000-01-01 )
Result: 1 (first week of the year).
day
Returns the day portion of "date_exp". Same as extract (day from date_exp).
Syntaxday ( date_exp )
difference
Returns an integer value representing the difference between the values returned by the data
source_specific soundex function for "string_exp1" and "string_exp2". The value returned ranges
from 0 to 4, with 4 indicating the best match. Note that 4 does not mean that the strings are equal.
Professional Authoring User Guide 351
Chapter 10: Using the Expression Editor
Syntaxdifference ( string_exp1, string_exp2 )
getdate
Returns a datetime value representing the current date and time of the computer that the database
software runs on.
Syntaxgetdate ()
left
Returns the leftmost "integer_exp" characters of "string_exp".
Syntaxleft ( string_exp, integer_exp )
ltrim
Returns "string_exp" with leading spaces removed.
Syntaxltrim ( string_exp )
month
Returns the month portion of "date_exp". Same as extract (month from date_exp).
Syntaxmonth ( date_exp )
patindex
Returns an integer which represents the starting position of the first occurrence of "string_exp1"
in the "string_exp2". Returns 0 if "string-exp1" is not found. The % wildcard character must
precede and follow "string_exp1", except when searching for first or last characters.
Syntaxpatindex ( string_exp1, string_exp2 )
Examplepatindex ( '%nos%', 'Cognos' )
Result: 4
replace
Replaces all occurrences of "string_exp2" in "string_exp1" with "string_exp3".
Syntaxreplace ( string_exp1 , string_exp2 , string_exp3 )
352 Report Studio
Chapter 10: Using the Expression Editor
replicate
Returns a string consisting of "string_exp" repeated "integer_exp" times.
Syntaxreplicate ( string_exp, integer_exp )
reverse
Returns "string_exp" in reverse order.
Syntaxreverse ( string_exp )
right
Returns the rightmost "integer_exp" characters of "string_exp".
Syntaxright ( string_exp, integer_exp )
round
Returns "numeric_exp" rounded to the nearest value "integer_exp" places to the right of the decimal
point.
Syntaxround ( numeric_exp, integer_exp )
rtrim
Returns "string_exp" with trailing spaces removed.
Syntaxrtrim ( string_exp )
sign
Returns an indicator of the sign "numeric_exp": +1 if "numeric_exp" is positive, 0 if zero or -1 if
negative.
Syntaxsign ( numeric_exp )
soundex
Returns a four character string representing the sound of the words in "string_exp".
Syntaxsoundex ( string_exp )
space
Returns a string consisting of "integer_exp" spaces.
Professional Authoring User Guide 353
Chapter 10: Using the Expression Editor
Syntaxspace ( integer_exp )
str
Returns a string representation of "numeric_exp" where "integer_exp1" is the length of the string
returned and "integer_exp2" is the number of decimal digits.
Syntaxstr ( numeric_exp [ , integer_exp1 [ , integer_exp2 ]] )
stuff
Returns a string where "integer_exp2" characters have been deleted from "string_exp1" beginning
at "integer_exp1" and where "string_exp2" has been inserted into "string_exp1" at start. The first
character in a string is at position 1.
Syntaxstuff ( string_exp1, integer_exp1, integer_exp2, string_exp2)
year
Returns the year portion of "date_exp". Same as extract (year from date_exp).
Syntaxyear ( date_exp )
SQL Server Cast
cast_char
Returns the value of "exp" cast as a character. A limit of 30 characters is returned.
Syntaxcast_char ( exp )
cast_float
Returns the value "exp" cast as a float.
Syntaxcast_float ( exp )
cast_integer
Returns the value of "exp" cast as an integer.
Syntaxcast_integer ( exp )
354 Report Studio
Chapter 10: Using the Expression Editor
cast_real
Returns the value of "exp" cast as a real.
Syntaxcast_real ( exp )
cast_smallint
Returns the value of "exp" cast as a small integer.
Syntaxcast_smallint ( exp )
SQL Server Math
log
Returns the natural logarithm of "numeric_exp".
Syntaxlog ( numeric_exp )
log10
Returns the base ten logarithm of "numeric_exp".
Syntaxlog10 ( numeric_exp )
pi
Returns the constant value of pi as a floating point value.
Syntaxpi ()
rand
Generates a random number using "integer_exp" as the seed value.
Syntaxrand ( integer_exp )
SQL Server Trigonometry
acos
Returns the arccosine of "numeric_exp" in radians. The arccosine is the angle whose cosine is
"numeric_exp".
Syntaxacos ( numeric_exp )
Professional Authoring User Guide 355
Chapter 10: Using the Expression Editor
asin
Returns the arcsine of "numeric_exp" in radians. The arcsine is the angle whose sine is
"numeric_exp".
Syntaxasin ( numeric_exp )
atan
Returns the arctangent of "numeric_exp" in radians. The arctangent is the angle whose tangent is
"numeric_exp".
Syntaxatan ( numeric_exp )
atn2
Returns the arctangent of the x and y coordinates specified by "numeric_exp1" and "numeric_exp2",
respectively, in radians. The arctangent is the angle whose tangent is "numeric_exp1".
Syntaxatn2 ( numeric_exp1, numeric_exp2 )
cos
Returns the cosine of "numeric_exp" where "numeric_exp" is an angle expressed in radians.
Syntaxcos ( numeric_exp )
cot
Returns the cotangent of "numeric_exp" where "numeric_exp" is an angle expressed in radians.
Syntaxcot ( numeric_exp )
degrees
Returns "numeric_exp" radians converted to degrees.
Syntaxdegrees ( numeric_exp )
radians
Returns the number of radians converted from "numeric_exp" degrees.
Syntaxradians ( numeric_exp )
356 Report Studio
Chapter 10: Using the Expression Editor
sin
Returns the sine of "numeric_exp" where "numeric_exp" is an angle expressed in radians.
Syntaxsin ( numeric_exp )
tan
Returns the tangent of "numeric_exp" where "numeric_exp" is an angle expressed in radians.
Syntaxtan ( numeric_exp )
Teradata
account
Returns the account string for the current user.
Syntax{account}
add_months
Returns the date or the datetime resulting from adding "integer_exp" months to 'date_exp" or
"datetime_exp".
Syntaxadd_months ( date_exp | datetime_exp, integer_exp )
bytes
Returns the number of bytes contained in "byte_exp". "Byte_exp" is restricted to BYTE or VAR-
BYTE.
Syntaxbytes ( byte_exp )
case_n
Evaluates a list of conditions and returns the position of the first condition that evaluates to TRUE,
provided that no prior condition in the list evaluates to UNKNOWN. The keywords must be
enclosed in curly brackets. The NO CASE is an optional condition that evaluates to TRUE if every
"conditional_exp" in the list evaluates to FALSE. The NO CASE OR UNKNOWN condition
evaluates to TRUE if every "conditional_exp" in the list evaluates to FALSE, or if a "condi-
tional_exp" evaluates to UNKNOWN and all prior conditions in the list evaluate to FALSE. The
UNKNOWN is an optional condition that evaluates to TRUE if a conditional_expression evaluates
to UNKNOWN and all prior conditions in the list evaluate to FALSE.
Professional Authoring User Guide 357
Chapter 10: Using the Expression Editor
Syntaxcase_n ( condition_exp_list [, NO CASE | UNKNOWN | NOCASE OR UNKNOWN [, UNKNOWN ]] )
char2hexint
Returns the hexadecimal representation for "string_exp".
Syntaxchar2hexint ( string_exp )
characters
Returns an integer value representing the number of logical characters or bytes contained in
"string_exp".
Syntaxcharacters ( string_exp )
database
Returns the name of the default database for the current user.
Syntax{database}
date
Returns the current date.
Syntax{date}
format
Returns the declared format for "exp". The data type returned by a FORMAT phrase is a variable
character string of up to 30 characters.
Syntaxformat ( expression )
index
Returns the starting position of "string_exp2" in "string_exp1".
Syntaxindex ( string_exp1, string_exp2 )
log
Computes the base 10 logarithm of "numeric_exp". "Numeric_exp" must be a non-zero, positive,
numeric expression.
358 Report Studio
Chapter 10: Using the Expression Editor
Syntaxlog ( numeric_exp )
nullif
Returns NULL if "scalar_exp1" and "scalar_exp2" are equal. Otherwise, it returns "scalar_exp1".
"Scalar_exp1" and "scalar_exp2" can be any data type.
Syntaxnullif ( scalar_exp1, scalar_exp2 )
nullifzero
Converts data from zero to null to avoid division by zero.
Syntaxnullifzero ( numeric_exp )
profile
Returns the current profile for the session or NULL if none.
Syntax{profile}
random
Returns a random integer number for each row of the results table. "Lower_bound" and
"upper_bound" are integer constants. The limits for "lower_bound" and "upper_bound" range
from -2147483648 to 2147483647 inclusive. "Upper_bound" must be greater than or equal to
"lower_bound".
Syntaxrandom ( lower_bound, upper_bound )
role
Returns the current role for the session or NULL if none.
Syntax{role}
session
Returns the number of the session for the current user.
Syntax{session}
soundex
Returns a character string that represents the Soundex code for "string_exp".
Professional Authoring User Guide 359
Chapter 10: Using the Expression Editor
Syntaxsoundex ( string_exp )
substr
Returns the substring of "string_exp" that starts at position "integer_exp1". The first character in
"string_exp" is at position 1. "Integer_exp2" can be used to select fewer characters, by default it
selects character to the end of the string.
Syntaxsubstr ( string_exp, integer_exp1 [ , integer_exp2 ])
time
Returns the current time based on a 24-hour day.
Syntax{time}
type
Returns the data type defined for "exp".
Syntaxtype ( exp )
user
Returns the user name of the current user.
Syntax{user}
vargraphic
Returns a character string that represents the vargraphic code for "string_exp".
Syntaxvargraphic ( string_exp )
zeroifnull
Converts data from NULL to 0 to avoid errors created by a NULL value. If "numeric_exp" is not
NULL, it returns the value of "numeric_exp". If "numeric_exp" is a character string, it is converted
to a numeric value of FLOAT data type. If "numeric_exp" is NULL or zero, it returns zero.
Syntaxzeroifnull ( numeric_exp )
360 Report Studio
Chapter 10: Using the Expression Editor
Teradata Trigonometry
acos
Returns the arccosine of "numeric_exp" in radians. The arccosine is the angle whose cosine is
"numeric_exp". "Numeric_exp" must be between -1 and 1, inclusive.
Syntaxacos ( numeric_exp )
acosh
Returns the inverse hyperbolic cosine of "numeric_exp" where "numeric_exp" can be any real
number equal to or greater than 1.
Syntaxacosh ( numeric_exp )
asin
Returns the arcsine of "numeric_exp" in radians. The arcsine is the angle whose sine is
"numeric_exp". "Numeric_exp" must be between -1 and 1, inclusive.
Syntaxasin ( numeric_exp )
asinh
Returns the inverse hyperbolic sine of "numeric_exp" where "numeric_exp" can be any real number.
Syntaxasinh ( numeric_exp )
atan
Returns the arctangent of "numeric_exp" in radians where the arctangent is the angle whose tangent
is "numeric_exp".
Syntaxatan ( numeric_exp )
atan2
Returns the arctangent of the x and y coordinates specified by "numeric_exp1" and "numeric_exp2",
respectively, in radians. The returned angle will be between - and π radians, excluding π.
Syntaxatan2 ( numeric_exp1, numeric_exp2 )
atanh
Returns the inverse hyperbolic tangent of "numeric_exp" where "numeric_exp" can be any real
number between 1 and -1, excluding 1 and -1.
Professional Authoring User Guide 361
Chapter 10: Using the Expression Editor

Syntaxatanh (numeric_exp )
cos
Returns the cosine of "numeric_exp" where "numeric_exp" is an angle expressed in radians.
Syntaxcos ( numeric_exp )
cosh
Returns the hyperbolic cosine of "numeric_exp" where "numeric_exp" can be any real number.
Syntaxcosh ( numeric_exp )
sin
Returns the sine of "numeric_exp" where "numeric_exp" is an angle expressed in radians.
Syntaxsin ( numeric_exp )
sinh
Returns the hyperbolic sine of "numeric_exp" where "numeric_exp" can be any real number.
Syntaxsinh ( numeric_exp )
tan
Returns the tangent of "numeric_exp" where "numeric_exp" is an angle expressed in radians.
Syntaxtan ( numeric_exp )
tanh
Returns the hyperbolic tangent of "numeric_exp" where "numeric_exp" can be any real number.
Syntaxtanh ( numeric_exp )
SAP BW
SAP BW Trigonometry
arccos
Returns the arccosine of "numeric_exp in radians". The arccosine is the angle whose cosine is
"numeric_exp".
362 Report Studio
Chapter 10: Using the Expression Editor
Syntaxarccos ( numeric_exp )
arcsin
Returns the arcsine of "numeric_exp" in radians. The arcsine is the angle whose sine is
"numeric_exp".
Syntaxarcsin ( numeric_exp )
arctan
Returns the arctangent of "numeric_exp" in radians. The arctangent is the angle whose tangent is
"numeric_exp".
Syntaxarctan ( numeric_exp )
cos
Returns the cosine of "numeric_exp" where "numeric_exp" is an angle expressed in radians.
Syntaxcos ( numeric_exp )
sin
Returns the sine of "numeric_exp" where "numeric_exp" is an angle expressed in radians.
Syntaxsin ( numeric_exp )
tan
Returns the tangent of "numeric_exp" where "numeric_exp" is an angle expressed in radians.
Syntaxtan ( numeric_exp )
coshyp
Returns the hyperbolic cosine of "numeric_exp" where "numeric_exp" is an angle expressed in
radians.
Syntaxcoshyp ( numeric_exp )
sinhyp
Returns the hyperbolic sine of "numeric_exp" where "numeric_exp" is an angle expressed in radians.
Professional Authoring User Guide 363
Chapter 10: Using the Expression Editor
Syntaxsinhyp ( numeric_exp )
tanhyp
Returns the hyperbolic tangent of "numeric_exp" where "numeric_exp" is an angle expressed in
radians.
Syntaxtanhyp ( numeric_exp )
SAP BW Math
log10
Returns the base ten logarithm of "numeric_exp".
Syntaxlog10 ( numeric_exp )
Sybase
ascii
Returns a number representing the ascii code value of the leftmost character of "string_exp".
Syntaxascii ( string_exp )
Exampleascii( 'A' )
Result: 65
char
Converts "integer_exp" to a character value. Char is usually used as the inverse of ascii where
"integer_exp" must be between 0 and 255. If the resulting value is the first byte of a multibyte
character, the character may be undefined.
Syntaxchar ( integer_exp )
charindex
Searches "string_exp2" for the first occurrence of "string_exp1" and returns an integer that repres-
ents its starting position. If "string_exp1" is not found, zero is returned. If "string_exp1" contains
wildcard characters, charindex treats them as literals.
Syntaxcharindex ( string_exp1, string_exp2 )
364 Report Studio
Chapter 10: Using the Expression Editor
datalength
Returns the length in bytes of "string_exp".
Syntaxdatalength ( string_exp )
dateadd
Returns the date resulting from adding "integer_exp" units indicated by datepart (day, month,
year) to "date_exp". Note that the datepart argument must be enclosed in curly brackets.
Syntaxdateadd ( ' { ' datepart ' } ' , integer_exp, date_exp)
Exampledateadd ( {dd}, 16, 1997-06-16 )
Result: Jul 2, 1997
datediff
Returns the number of units indicated by datepart (day, month, year) between "date_exp1" and
"date_exp2". Note that the datepart argument must be enclosed in curly brackets.
Syntaxdatediff ( ' { ' datepart ' } ' , date_exp1, date_exp2)
Exampledatediff ( {yy}, 1984-01-01, 1997-01-01 )
Result: 13
datename
Returns part of a datetime, smalldatetime, date, or time value as an ASCII string. Note that the
datepart argument must be enclosed in curly brackets.
Syntaxdatename ( ' { ' datepart ' } ' , date_exp )
Exampledatename ( {mm}, 1999-05-01 )
Result: May
datepart
Returns part of a datetime, smalldatetime, date, or time value (e.g. month) as an integer. Note that
the datepart argument must be enclosed in curly brackets.
Professional Authoring User Guide 365
Chapter 10: Using the Expression Editor
Syntaxdatepart ( ' { ' datepart ' } ' , date_exp )
Exampledatepart ( {mm}, 1999-05-01 )
Result: 5
day
Returns the day of the month (1-31) from "date_exp".
Syntaxday ( date_exp )
difference
Returns an integer value representing the difference between the values returned by the data source
specific soundex function for "string_exp1" and "string_exp2". The value returned ranges from 0
to 4, with 4 indicating the best match. Note that 4 does not mean that the strings are equal.
Syntaxdifference ( string_exp1, string_exp2 )
getdate
Returns current system date and time.
Syntaxgetdate ()
left
Returns the leftmost "integer_exp" characters of "string_exp".
Syntaxleft ( string_exp, integer_exp )
ltrim
Returns "string_exp" with any leading spaces removed.
Syntaxltrim ( string_exp )
month
Returns the month (1-12) from "date_exp".
Syntaxmonth ( date_exp )
366 Report Studio
Chapter 10: Using the Expression Editor
patindex
Returns an integer representing the starting position of the first occurrence of "string_exp1" in
"string_exp2' or returns 0 if "string-exp1" is not found. By default, patindex returns the offset in
characters. The offset can be returned in bytes by setting the return type to bytes. The % wildcard
character must precede and follow the pattern in "string_exp1", except when searching for first or
last characters.
Syntaxpatindex ( string_exp1, string_exp2 [ using {bytes |chars | characters} ] )
rand
Returns a random float value between 0 and 1, using the optional "integer_exp" as a seed value.
Syntaxrand ( integer_exp )
replicate
Returns a string with the same datatype as "string_exp", containing the same expression repeated
"integer_exp" times or as many times as will fit into a 225-byte space, whichever is less.
Syntaxreplicate ( string_exp, integer_exp )
reverse
Returns the reverse of "string_exp".
Syntaxreverse ( string_exp )
right
Returns the rightmost "integer_exp" characters of "string_exp".
Syntaxright ( string_exp, integer_exp )
round
Returns "numeric_exp" rounded to the nearest value "integer_exp" places to the right of the decimal
point.
Syntaxround ( numeric_exp, integer_exp )
rtrim
Returns "string_exp" with trailing spaces removed.
Professional Authoring User Guide 367
Chapter 10: Using the Expression Editor
Syntaxrtrim ( string_exp )
soundex
Returns a four-character soundex code for character strings that are composed of a contiguous
sequence of valid single- or double byte Roman letter.
Syntaxsoundex ( string_exp )
space
Returns a string with "integer_exp" single byte spacing.
Syntaxspace ( integer_exp )
str
Returns a string representation of "numeric_exp". "Integer_exp1" is the length of the returned
string and has a default setting of 10. "Integer_exp2" is the number of decimal digits and has a
default setting of 0. Both are optional values.
Syntaxstr ( numeric_exp [ , integer_exp1 [ , integer_exp2 ]] )
stuff
Deletes "integer_exp2" characters from "string_exp1" starting at "integer_exp1", and inserts
"string_exp2" into "string_exp1" at that position. To delete characters without inserting other
characters, "string_exp2" should be NULL and not " ", which indicates a single space.
Syntaxstuff ( string_exp1, integer_exp1, integer_exp2, string_exp2)
substring
Returns the substring of "string_exp" that starts at position "integer_exp1". "Integer_exp2" specifies
the number of characters in the substring.
Syntaxsubstring ( string_exp, integer_exp1, integer_exp2 )
to_unichar
Returns a unichar expression having the value "integer_exp". If "integer_exp" is in the range
0xD800..0xDFFF, the operation is aborted. If the "integer_exp" is in the range 0..0xFFFF, a single
Unicode value is returned. If "integer_exp" is in the range 0x10000..0x10FFFF, a surrogate pair
is returned.
368 Report Studio
Chapter 10: Using the Expression Editor
Syntaxto_unichar ( integer_exp )
uhighsurr
Returns 1 if the Unicode value at "integer_exp" is the high half of a surrogate pair (which should
appear first in the pair). Otherwise, it returns 0. This function allows you to write explicit code for
surrogate handling. Particularly, if a substring starts on a Unicode character where uhighsurr() is
true, extract a substring of at least 2 Unicode values, as substr() does not extract just 1. Substr()
does not extract half of a surrogate pair.
Syntaxuhighsurr ( string_exp, integer_exp )
ulowsurr
Returns 1 if the Unicode value at "integer_exp" is the low half of a surrogate pair (which should
appear second in the pair). Otherwise, it returns 0. This function allows you to explicitly code
around the adjustments performed by substr(), stuff(), and right(). Particularly, if a substring ends
on a Unicode value where ulowsurr() is true, extract a substring of 1 less characters (or 1 more),
since substr() does not extract a string that contains an unmatched surrogate pair.
Syntaxulowsurr ( string_exp, integer_exp )
uscalar
Returns the Unicode scalar value for the first Unicode character in "string_exp". If the first character
is not the high-order half of a surrogate pair, then the value is in the range 0..0xFFFF. If the first
character is the high-order half of a surrogate pair, a second value must be a low-order half, and
the return value is in the range 0x10000..0x10FFFF. If this function is called on a uchar_exp con-
taining an unmatched surrogate half, the operation is aborted.
Syntaxuscalar ( string_exp )
year
Returns the year from date_exp.
Syntaxyear ( date_exp )
Sybase Math
log
Returns the natural logarithm of "numeric_exp".
Syntaxlog ( numeric_exp )
Professional Authoring User Guide 369
Chapter 10: Using the Expression Editor
log10
Returns the base ten logarithm of "numeric_exp".
Syntaxlog10 ( numeric_exp )
pi
Returns the constant value of pi as a floating point value.
Syntaxpi ()
sign
Returns an indicator denoting the sign of "numeric_exp": +1 if "numeric_exp" is positive, 0 if zero
or -1 if negative.
Syntaxsign ( numeric_exp )
Sybase Trigonometry
acos
Returns the arccosine of "numeric_exp" in radians. The arccosine is the angle whose cosine is
"numeric_exp".
Syntaxacos ( numeric_exp )
asin
Returns the arcsine of "numeric_exp" in radians. The arcsine is the angle whose sine is
"numeric_exp".
Syntaxasin ( numeric_exp )
atan
Returns the arctangent of "numeric_exp" in radians. The arctangent is the angle whose tangent is
"numeric_exp".
Syntaxatan ( numeric_exp )
tan
Returns the tangent of "numeric_exp" where "numeric_exp" is an angle expressed in radians.
370 Report Studio
Chapter 10: Using the Expression Editor
Syntaxtan ( numeric_exp )
atn2
Returns the angle, in radians, whose tangent is "numeric_exp1" / "numeric_exp2".
Syntaxatn2 ( numeric_exp1, numeric_exp2 )
cos
Returns the cosine of "numeric_exp" where "numeric_exp" is an angle expressed in radians.
Syntaxcos ( numeric_exp )
cot
Returns the cotangent of "numeric_exp" where "numeric_exp" is an angle expressed in radians.
Syntaxcot ( numeric_exp )
degrees
Returns "numeric_exp" radians converted to degrees.
Syntaxdegrees ( numeric_exp )
radians
Returns the degree equivalent of "numeric_exp". Results are of the same type as "numeric_exp".
For expressions of type numeric or decimal, the results have an internal precision of 77 and a scale
equal to that of "numeric_exp". When the money datatype is used, an internal conversion to float
may cause some loss of precision.
Syntaxradians ( numeric_exp )
sin
Returns the sine of "numeric_exp" where "numeric_exp" is an angle expressed in radians.
Syntaxsin ( numeric_exp )
Report Functions
_add_days
Returns the datetime resulting from adding "integer_exp" days to "timestamp_exp".
Professional Authoring User Guide 371
Chapter 10: Using the Expression Editor
Syntax_add_days (timestamp_exp, integer_exp)
_add_months
Returns the datetime resulting from adding "integer_exp" months to "timestamp_exp".
Syntax_add_months (timestamp_exp, integer_exp)
_add_years
Returns the datetime resulting from adding "integer_exp" years to "timestamp_exp".
Syntax_add_years (timestamp_exp, integer_exp)
_age
Returns a number that is obtained from subtracting "timestamp_exp" from today's date in
YYYYMMDD format (years, months, days).
Syntax_age (timestamp_exp)
_day_of_week
Returns the day of week (between 1 and 7), where 1 is the first day of the week (Monday) as
indicated by "integer_exp". Note that in ISO 8601 standard, a week begins with Monday as day
1.
Syntax_day_of_week (timestamp_exp, integer_exp)
Example_day_of_week (2003-01-01, 1) will return 3 because 2003-01-01was a Wednesday.
Result: 3
_day_of_year
Returns the ordinal for the day of the year in "timestamp_ exp" (1 to 366). Also known as Julian
day.
Syntax_day_of_year (timestamp_exp)
_days_between
Returns a positive or negative number representing the number of days between "timestamp_exp1"
and "timestamp_exp2". If "timestamp_exp1" < "timestamp_exp2", the result will be a negative
number.
372 Report Studio
Chapter 10: Using the Expression Editor
Syntax_days_between (timestamp_exp1, timestamp_exp2)
_days_to_end_of_month
Returns a number representing the number of days remaining in the month represented by
"timestamp_exp".
Syntax_days_to_end_of_month (timestamp_exp)
_first_of_month
Returns a datetime that is the first day of the month represented by "timestamp_exp".
Syntax_first_of_month (timestamp_exp)
_last_of_month
Returns a datetime that is the last day of the month represented by "timestamp_exp".
Syntax_last_of_month (timestamp_exp)
_make_timestamp
Returns a timestamp constructed from "integer_exp1" (the year), "integer_exp2" (the month) and
"integer_exp3" (the day). The time portion defaults to 00:00:00.000 .
Syntax_make_timestamp (integer_exp1, integer_exp2, integer_exp3)
_months_between
Returns a positive or negative number representing the number of months between "timestamp_exp1"
and "timestamp_exp2". If "timestamp_exp1" < "timestamp_exp2", the result will be a negative
number.
Syntax_months_between (timestamp_exp1, timestamp_exp2)
_week_of_year
Returns the week number (1-53) of the year, represented by "timestamp_exp". According to the
ISO 8601, week 1 of the year is the first week to contain a Thursday, which is equivalent to the
first week containing January 4th. A week starts on a Monday (day 1) and ends on a Sunday (day
7).
Syntax_week_of_year (timestamp_exp)
Professional Authoring User Guide 373
Chapter 10: Using the Expression Editor
_years_between
Returns a positive or negative integer number representing the number of years between
"timestamp_exp1" and "timestamp_exp2". If "timestamp_exp1" < "timestamp_exp2" a negative
value is returned.
Syntax_years_between (timestamp_exp1, timestamp_exp2)
_ymdint_between
Returns a number representing the difference between "timestamp_exp1" and "timestamp_exp2".
This value has the form YYYYMMDD, where YYYY represents the number of years, MM represents
the number of months, and DD represents the number of days.
Syntax_ymdint_between (timestamp_exp1, timestamp_exp2)
abs
Returns the absolute value of "numeric_exp". If "numeric_exp" is negative, a positive value is
returned.
Syntaxabs (numeric_exp)
AsOfDate
Returns the date value of the AsOfDate expression, if it is defined. Otherwise, AsOfDate returns
the report execution date.
SyntaxAsOfDate ()
AsOfTime
Returns the time value of the AsOfTime expression, if it is defined. Otherwise, AsOfTime returns
the report execution time.
SyntaxAsOfTime ()
BurstKey
Returns the burst key.
SyntaxBurstKey ()
BurstRecipients
Returns the distribution list of burst recipients.
374 Report Studio
Chapter 10: Using the Expression Editor
SyntaxBurstRecipients ()
ceiling
Returns the smallest integer greater than or equal to "numeric_exp".
Syntaxceiling (numeric_exp)
CellValue
Returns the value of the current crosstab cell.
SyntaxCellValue ()
character_length
Returns the number of characters in "string_exp".
Syntaxcharacter_length (string_exp)
ColumnNumber
Returns the current column number.
SyntaxColumnNumber ()
CubeCreatedOn
Returns the date and time when the cube was created. "Dimension" specifies from which cube to
retrieve the metadata. If the dimension source is an IBM Cognos PowerCube (.mdc), the function
returns a blank string. The initial creation date of a PowerCube is not maintained.
SyntaxCubeCreatedOn (dimension)
CubeCurrentPeriod
Returns the current period for the cube. "Dimension" specifies from which cube to retrieve the
metadata.
SyntaxCubeCurrentPeriod (dimension)
CubeDataUpdatedOn
Returns the date time that data in the cube was last updated. "Dimension" specifies from which
cube to retrieve the metadata.
Professional Authoring User Guide 375
Chapter 10: Using the Expression Editor
SyntaxCubeDataUpdatedOn (dimension)
CubeDefaultMeasure
Returns the name of the default measure for the cube. "Dimension" specifies from which cube to
retrieve the metadata.
SyntaxCubeDefaultMeasure (dimension)
CubeDescription
Returns the description of the cube. "Dimension" specifies from which cube to retrieve the metadata.
SyntaxCubeDescription (dimension)
CubeIsOptimized
Returns TRUE if the cube is optimized. "Dimension" specifies from which cube to retrieve the
metadata.
SyntaxCubeIsOptimized (dimension)
CubeName
Returns the name of the cube. "Dimension" specifies from which cube to retrieve the metadata.
SyntaxCubeName (dimension)
CubeSchemaUpdatedOn
Returns the date time that the cube schema was last updated. "Dimension" specifies from which
cube to retrieve the metadata.
SyntaxCubeSchemaUpdatedOn (dimension)
exp
Returns the constant 'e' raised to the power of "numeric_exp". The constant 'e' is the base of the
natural logarithm.
Syntaxexp (numeric_exp)
extract
Returns an integer representing the value of "datepart_exp" ("year", "month", "day", "hour",
"minute", "second" (=default)) in "datetime_exp".
376 Report Studio
Chapter 10: Using the Expression Editor
Syntaxextract (datepart_exp , datetime_exp)
floor
Returns the largest integer less than or equal to "numeric_exp".
Syntaxfloor (numeric_exp)
GetLocale
Returns the run locale (deprecated).
SyntaxGetLocale ()
HorizontalPageCount
Returns the current horizontal page count.
SyntaxHorizontalPageCount ()
HorizontalPageNumber
Returns the current horizontal page number.
SyntaxHorizontalPageNumber ()
InScope
Returns boolean 1 (TRUE) when the cell is in the scope of the data items and MUNs; otherwise,
returns 0 (FALSE).
SyntaxInScope (dataItem, MUN, ...)
IsBursting
Returns boolean 1 (TRUE) when the report will be distributed to the recipient; otherwise returns
0 (FALSE).
SyntaxIsBursting ('recipientName')
IsCrosstabColumnNodeMember
Returns boolean 1 (TRUE) if the current node is a crosstab column node member.
SyntaxIsCrosstabColumnNodeMember ()
Professional Authoring User Guide 377
Chapter 10: Using the Expression Editor
IsCrosstabRowNodeMember
Returns boolean 1 (TRUE) if the current node is a crosstab row node member.
SyntaxIsCrosstabRowNodeMember ()
IsFirstColumn
Returns boolean 1 (TRUE) if the current column is the first column.
SyntaxIsFirstColumn ()
IsInnerMostCrosstabColumnNodeMember
Returns boolean 1 (TRUE) if the current node is an innermost crosstab column node member.
SyntaxIsInnerMostCrosstabColumnNodeMember ()
IsInnerMostCrosstabRowNodeMember
Returns boolean 1 (TRUE) if the current node is an innermost crosstab row node member.
SyntaxIsInnerMostCrosstabRowNodeMember ()
IsLastColumn
Returns boolean 1 (TRUE) if the current column is the last column.
SyntaxIsLastColumn ()
IsLastInnerMostCrosstabColumnNodeMember
Returns boolean 1 (TRUE) if the current node is the last innermost crosstab column node member.
SyntaxIsLastInnerMostCrosstabColumnNodeMember ()
IsLastInnerMostCrosstabRowNodeMember
Returns boolean 1 (TRUE) if the current node is the last innermost crosstab row node member.
SyntaxIsLastInnerMostCrosstabRowNodeMember ()
IsOuterMostCrosstabColumnNodeMember
Returns boolean 1 (TRUE) if the current node is an outermost crosstab column node member.
SyntaxIsOuterMostCrosstabColumnNodeMember ()
378 Report Studio
Chapter 10: Using the Expression Editor
IsOuterMostCrosstabRowNodeMember
Returns boolean 1 (TRUE) if the current node is an outermost crosstab row node member.
SyntaxIsOuterMostCrosstabRowNodeMember ()
IsPageCountAvailable
Returns boolean 1 (TRUE) if the page count is available for the current execution of the report.
SyntaxIsPageCountAvailable ()
ln
Returns the natural logarithm of "numeric_exp".
Syntaxln (numeric_exp)
Locale
Returns the run locale.
SyntaxLocale ()
lower
Returns "string_exp" with all uppercase characters shifted to lowercase.
Syntaxlower (string_exp)
mapNumberToLetter
Adds "integer_exp" to "string_exp".
SyntaxmapNumberToLetter (string_exp, integer_exp)
ExamplemapNumberToLetter ('a', 1) will result in 'b'.
Result: 'b'
mod
Returns an integer value representing the remainder (modulo) of "integer_exp1" / "integer_exp2".
Syntaxmod (integer_exp1, integer_exp2)
Professional Authoring User Guide 379
Chapter 10: Using the Expression Editor
ModelPath
Returns the model path.
SyntaxModelPath ()
Now
Returns the current system time.
SyntaxNow ()
nullif
Returns NULL if "string_exp1" equals "string_exp2" (case insensitive), otherwise returns
"string_exp1".
Syntaxnullif (string_exp1, string_exp2)
octet_length
Returns the number of bytes in "string_exp".
Syntaxoctet_length (string_exp)
PageCount
Returns the current page count. This function works only when the report output is PDF or Excel.
If you save the report output, this function works for all formats.
SyntaxPageCount ()
PageName
Returns the current page name.
SyntaxPageName ()
PageNumber
Returns the current page number.
SyntaxPageNumber ()
ParamCount
Returns parameter count of the variable identified by "parameterName".
380 Report Studio
Chapter 10: Using the Expression Editor
SyntaxParamCount ('parameterName')
ParamDisplayValue
Returns a string that is the parameter display value of the variable identified by "parameterName".
SyntaxParamDisplayValue ('parameterName')
ParamName
Returns the parameter name of the variable identified by "parameterName".
SyntaxParamName ('parameterName')
ParamNames
Returns all parameter names.
SyntaxParamNames ()
ParamValue
Returns a string that is the parameter value of the variable identified by "parameterName".
SyntaxParamValue ('parameterName')
position
Returns the integer value representing the starting position of "string_exp1" in "string_exp2".
Returns 0 if "string_exp1" is not found.
Syntaxposition (string_exp1, string_exp2)
power
Returns "num_exp1" raised to the power of "num_exp2".
Syntaxpower (num_exp1, num_exp2)
ReportAuthorLocale
Returns the author locale.
SyntaxReportAuthorLocale()
Professional Authoring User Guide 381
Chapter 10: Using the Expression Editor
ReportCreateDate
Returns the date that the report was created.
SyntaxReportCreateDate ()
ReportDate
Returns the report execution date and time.
SyntaxReportDate ()
ReportDescription
Returns the report description. This function works only when the report is run from an IBM
Cognos Connection.
SyntaxReportDescription ()
ReportID
Returns the report id.
SyntaxReportID ()
ReportLocale
Returns the run locale.
SyntaxReportLocale ()
ReportName
Returns the report name. This function works only when the report is run from an IBM Cognos
Connection.
SyntaxReportName ()
ReportOption
Returns the value of the run option variable identified by "optionName". Possible values for
"optionName" are: attachmentEncoding, burst, cssURL, email, emailAsAttachment, emailAsURL,
emailBody, emailSubject, emailTo, emailToAddress, history, metadataModel, outputEncapsulation,
outputFormat, outputLocale, outputPageDefinition, outputPageOrientation, primaryWaitThreshold,
print, printer, printerAddress, prompt, promptFormat, saveAs, saveOutput, secondaryWaitThreshold,
verticalElements, xslURL.
382 Report Studio
Chapter 10: Using the Expression Editor
SyntaxReportOption ('optionName')
ReportOutput
Returns the name of the output format. Possible return values are: CSV, HTML, layoutDataXML,
MHT, PDF, rawXML, singleXLS, spreadsheetML, XLS, XML, XLWA.
SyntaxReportOutput ()
ReportPath
Returns the report path. This function works only when the report is run from an IBM Cognos
Connection.
SyntaxReportPath ()
ReportProductLocale
Returns the product locale.
SyntaxReportProductLocale ()
ReportSaveDate
Returns the date when the report was last saved.
SyntaxReportSaveDate ()
round
Returns "numeric_exp" rounded to the nearest value "integer_exp" places to the right of the decimal
point. If "integer_exp" is negative, "numeric_exp" is rounded to the nearest absolute value
"integer_exp" places to the left of the decimal point.
Syntaxround (numeric_exp, integer_exp)
Exampleround (125, -1) rounds to 130.
Result: 130.
RowNumber
Returns the current row.
SyntaxRowNumber ()
Professional Authoring User Guide 383
Chapter 10: Using the Expression Editor
ServerLocale
Returns the locale of the server that runs the report.
SyntaxServerLocale ()
ServerName
Returns the name of the server that runs the report.
SyntaxServerName ()
sqrt
Returns the square root of "numeric_exp". "Numeric_exp" must be non-negative.
Syntaxsqrt (numeric_exp)
substring
Returns the substring of "string_exp" that starts at position "integer_exp1" for "integer_exp2"
characters or to the end of "string_exp" if "integer_exp2" equals -1. The first character in
"string_exp" is at position 1.
Syntaxsubstring (string_exp , integer_exp1, integer_exp2)
TOCHeadingCount
Returns the table of contents heading count for a specified heading level.
SyntaxTOCHeadingCount (headingLevel)
Today
Returns the current system date.
SyntaxToday ()
trim
Returns "string_exp" trimmed of any leading and trailing blanks or trimmed of the character spe-
cified by "match_character_exp". "Trim_what_exp" may be: "LEADING", "TRAILING", or
"BOTH" (default). "Match_character_exp" must be an empty string to trim blanks, or specify a
character to be trimmed.
Syntaxtrim (trim_what_exp, match_character_exp, string_exp)
384 Report Studio
Chapter 10: Using the Expression Editor
upper
Returns "string_exp" with all lowercase characters shifted to uppercase.
Syntaxupper (string_exp)
URLEncode
Returns the url encoded value of the input text.
SyntaxURLEncode ('text')
Data Type Casting Functions
date2string
Returns a date as a string in YYYY-MM-DD format.
Syntaxdate2string (date_exp)
date2timestamp
Converts a date to a timestamp. The time part of the timestamp will equal zero.
Syntaxdate2timestamp (date_exp)
date2timestampTZ
Converts a date to a timestamp with a time zone. The time and time zone parts of the timestamp
will equal zero.
Syntaxdate2timestampTZ (date_exp)
DTinterval2string
Returns a date time interval as a string in "DDDD HH:MM:SS.FFFFFFF" or "-DDDD
HH:MM:SS.FFF" format.
SyntaxDTinterval2string (DTinterval_exp)
DTinterval2stringAsTime
Returns a date time interval as a string in "HHHH:MM:SS.FFFFFFF" or "HH:MM:SS.FFF". Days
are converted to hours.
SyntaxDTinterval2stringAsTime (DTinterval_exp)
Professional Authoring User Guide 385
Chapter 10: Using the Expression Editor
int2DTinterval
Converts an integer to a date time interval. "String_exp" specifies what "integer_exp" represents:
"ns" = nanoseconds, "s" = seconds (default), "m" = minutes, "h" = hours, "d" = days.
Syntaxint2DTinterval (integer_exp, string_exp)
int2YMinterval
Converts an integer to a year month interval. "String_exp" specifies what "integer_exp" represents:
"y" = years, "m" = months (default).
Syntaxint2YMinterval (integer_exp, string_exp)
number2string
Converts a number to a string, using the %g format specifier (C/C++ syntax).
Syntaxnumber2string (num_exp)
string2date
Returns a date string as a date in "YYYY-MM-DD" format.
Syntaxstring2date (string_exp)
string2double
Returns a floating point number. "String_exp" has the following form:"[whitespace] [sign] [digits]
[digits] [ {d | D |e | E }[sign]digits]"
Syntaxstring2double (string_exp)
string2DTinterval
Returns a date-time interval string as a date time interval in "[-]DD HH:MM[:SS[.FFF]]" format.
Syntaxstring2DTinterval (string_exp)
string2int32
Returns an integer. "String_exp" has the following form: "[whitespace] [{+ | -}] [digits]"
Syntaxstring2int32 (string_exp)
386 Report Studio
Chapter 10: Using the Expression Editor
string2int64
Returns a long integer. "String_exp" has the following form: "[whitespace] [{+ | -}] [digits]"
Syntaxstring2int64 (string_exp)
string2time
Returns a time string as a time in "HH:MM:SS.FFFFFFF" format.
Syntaxstring2time (string_exp)
string2timestamp
Returns a timestamp string as a timestamp in "YYYY-MM-DD [T|t|[white space]+]
HH:MM:SS.FFFFFFF" format.
Syntaxstring2timestamp (string_exp)
string2timestampTZ
Returns a timestamp with time zone "YYYY-MM-DD HH:MM:SS.FFFFFFF +HHMM" or "YYYY-
MM-DD [T|t] HH:MM:SS.FFF -HHMM" format.
Syntaxstring2timestampTZ (string_exp)
string2YMinterval
Returns a year-month interval string as a Year Month Interval in "[-]YY MM" format.
Syntaxstring2YMinterval (string_exp)
time2string
Returns a time as a string in HH:MM:SS.FFF format.
Syntaxtime2string (time_exp)
timestamp2date
Converts a timestamp to a date. The time part of the timestamp will be ignored.
Syntaxtimestamp2date (timestamp_exp)
timestamp2string
Returns a timestamp as a string in YYYY-MM-DD HH:MM:SS.FFFFFFF format.
Professional Authoring User Guide 387
Chapter 10: Using the Expression Editor
Syntaxtimestamp2string (timestamp_exp)
timestamp2timestampTZ
Converts a timestamp to a timestamp with a time zone. The displacement part of the timestamp
with the time zone will be zero.
Syntaxtimestamp2timestampTZ (timestamp_exp)
timestampTZ2date
Converts a timestamp with a time zone to a date. The time and time zone parts of the timestamp
will be ignored.
SyntaxtimestampTZ2date (timestampTZ_exp)
timestampTZ2string
Returns a timestamp with the time zone as a string in "YYYY-MM-DD HH:MM:SS.FFFFFFF
+HHMM" or "YYYY-MM-DD HH:MM:SS.FFF -HHMM" format.
SyntaxtimestampTZ2string (timestampTZ_exp)
timestampTZ2timestamp
Converts a timestamp with time zone to a timestamp. The displacement part of the timestamp with
the time zone will be ignored.
SyntaxtimestampTZ2timestamp (timestampTZ_exp)
timeTZ2string
Returns a time with the time zone as a string in "HH:MM:SS.FFF +HHMM" or
"HH:MM:SS.FFFFFFF -HHMM" format.
SyntaxtimeTZ2string (timeTZ_exp)
Example"-05:30" means a TimeZone of GMT minus 5 hours and 30minutes.
Result: GMT minus 5 hours and 30 minutes
YMinterval2string
Returns a year month interval as a string in "(YY MM)" or "-(YY MM)" format.
388 Report Studio
Chapter 10: Using the Expression Editor

SyntaxYMinterval2string (YMinterval_exp)
Professional Authoring User Guide 389
Chapter 10: Using the Expression Editor

390 Report Studio
Chapter 10: Using the Expression Editor
Chapter 11: Adding Prompts to Filter Data
You can add prompts to a report to add interactivity for users. Prompts act as questions that help
users to customize the information in a report to suit their own needs. For example, you create a
prompt so that users can select a product type. Only products belonging to the selected product
type are retrieved and shown in the report.
Prompts are composed of three interrelated components: parameters, prompt controls, and parameter
values. Parameters are based on parameterized filters and form the questions to ask users. Prompt
controls provide the user interface in which the questions are asked. Parameter values provide the
answers to the questions.
Report Studio provides several ways to create prompts. You can
● use the Build Prompt Page tool
● build your own prompt and prompt page
● create a parameter to produce a prompt
● insert prompts directly into the report page
● in dimensional reporting, you can also define prompts using context filters (p. 211)
If you include reports from different packages in an interactive dashboard that uses global filters,
ensure that you use the same parameter name for the prompt in all the reports. For more information
about creating interactive dashboards, see the Administration and Security Guide.
You can also create prompts in the package. For more information, see the Framework Manager
User Guide.
Syntax of Prompt Expressions
Prompt expressions use the following syntax, where p represents the parameter name.
DimensionalRelational
[level or hierarchy]->?p? for single prompts[data item] = ?p? for single prompts
set([level or hierarchy]->?p?) for multiple prompts[data item] in ?p? for multiple prompts
Use the Build Prompt Page ToolUse the Build Prompt Page tool to quickly add prompts to a report. Report Studio creates the
prompts for you in a default prompt page.
Tips: The Promotion Success sample report (p. 533) in the GO Data Warehouse (analysis) package
includes a prompt page. The Historical Revenue sample report (p. 527) in the Sales and Marketing
(cube) package and the Eyewear Revenue by Brand and Size sample report (p. 531) in the GO Data
Professional Authoring User Guide 391
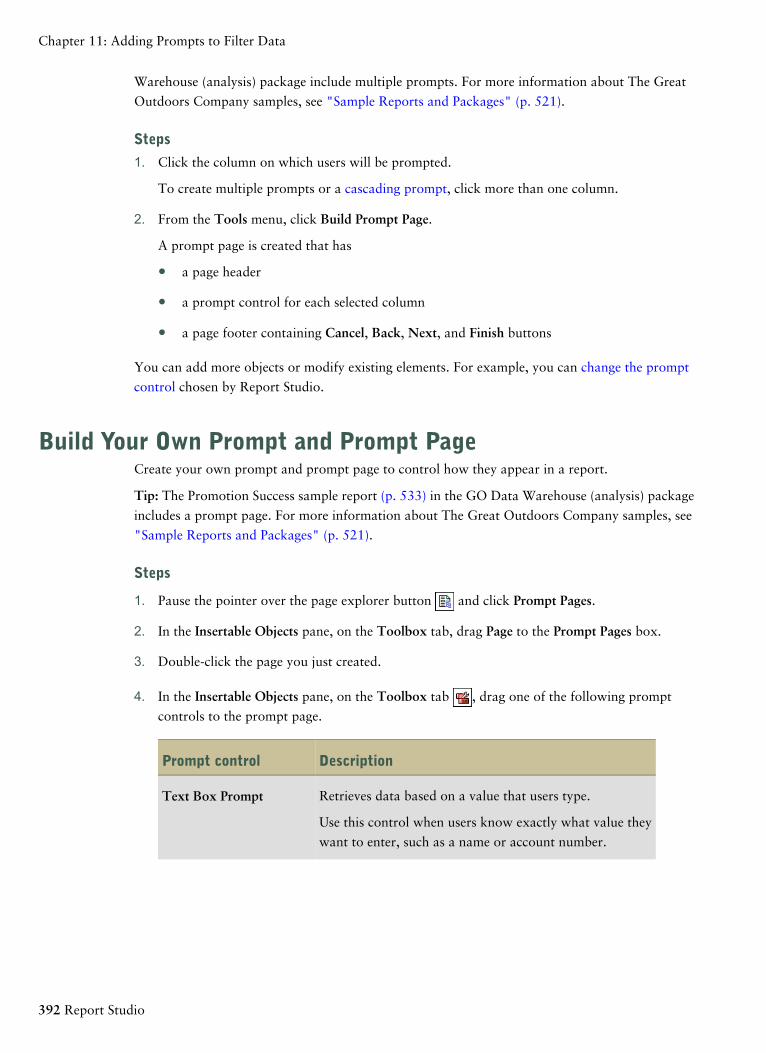
Warehouse (analysis) package include multiple prompts. For more information about The Great
Outdoors Company samples, see "Sample Reports and Packages" (p. 521).
Steps
1. Click the column on which users will be prompted.
To create multiple prompts or a cascading prompt, click more than one column.
2. From the Tools menu, click Build Prompt Page.
A prompt page is created that has
● a page header
● a prompt control for each selected column
● a page footer containing Cancel, Back, Next, and Finish buttons
You can add more objects or modify existing elements. For example, you can change the prompt
control chosen by Report Studio.
Build Your Own Prompt and Prompt PageCreate your own prompt and prompt page to control how they appear in a report.
Tip: The Promotion Success sample report (p. 533) in the GO Data Warehouse (analysis) package
includes a prompt page. For more information about The Great Outdoors Company samples, see
"Sample Reports and Packages" (p. 521).
Steps
1. Pause the pointer over the page explorer button and click Prompt Pages.
2. In the Insertable Objects pane, on the Toolbox tab, drag Page to the Prompt Pages box.
3. Double-click the page you just created.
4. In the Insertable Objects pane, on the Toolbox tab , drag one of the following prompt
controls to the prompt page.
DescriptionPrompt control
Retrieves data based on a value that users type.Text Box Prompt
Use this control when users know exactly what value they
want to enter, such as a name or account number.
392 Report Studio
Chapter 11: Adding Prompts to Filter Data
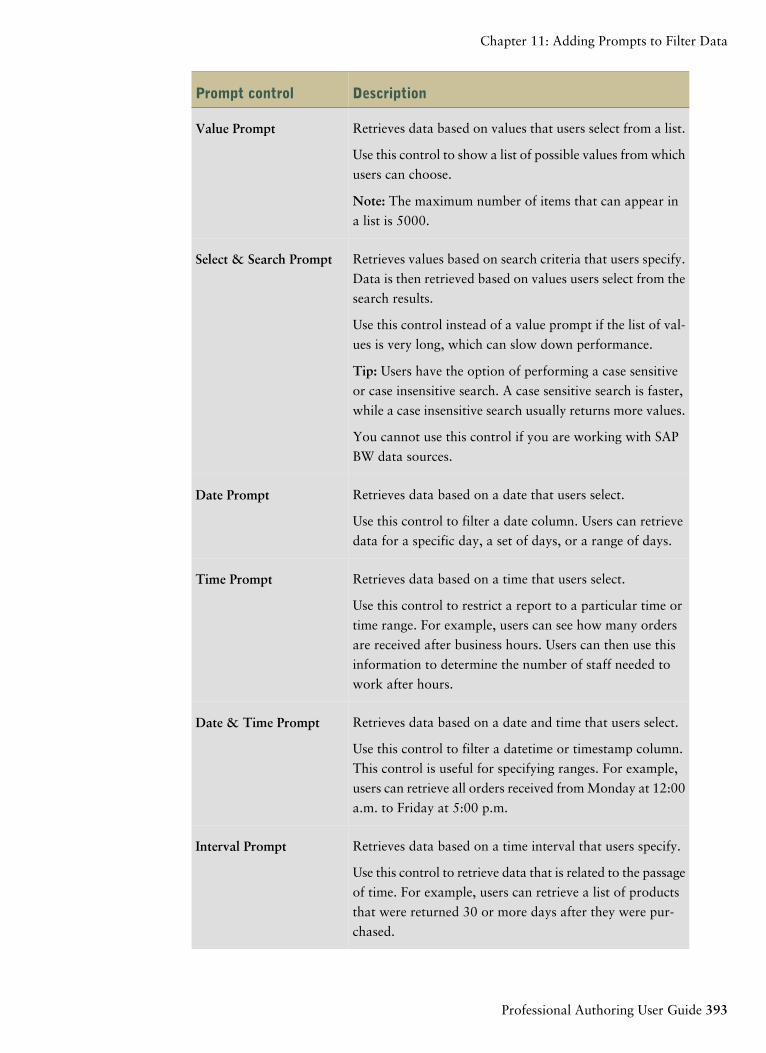
DescriptionPrompt control
Retrieves data based on values that users select from a list.Value Prompt
Use this control to show a list of possible values from which
users can choose.
Note: The maximum number of items that can appear in
a list is 5000.
Retrieves values based on search criteria that users specify.
Data is then retrieved based on values users select from the
search results.
Select & Search Prompt
Use this control instead of a value prompt if the list of val-
ues is very long, which can slow down performance.
Tip: Users have the option of performing a case sensitive
or case insensitive search. A case sensitive search is faster,
while a case insensitive search usually returns more values.
You cannot use this control if you are working with SAP
BW data sources.
Retrieves data based on a date that users select.Date Prompt
Use this control to filter a date column. Users can retrieve
data for a specific day, a set of days, or a range of days.
Retrieves data based on a time that users select.Time Prompt
Use this control to restrict a report to a particular time or
time range. For example, users can see how many orders
are received after business hours. Users can then use this
information to determine the number of staff needed to
work after hours.
Retrieves data based on a date and time that users select.Date & Time Prompt
Use this control to filter a datetime or timestamp column.
This control is useful for specifying ranges. For example,
users can retrieve all orders received from Monday at 12:00
a.m. to Friday at 5:00 p.m.
Retrieves data based on a time interval that users specify.Interval Prompt
Use this control to retrieve data that is related to the passage
of time. For example, users can retrieve a list of products
that were returned 30 or more days after they were pur-
chased.
Professional Authoring User Guide 393
Chapter 11: Adding Prompts to Filter Data
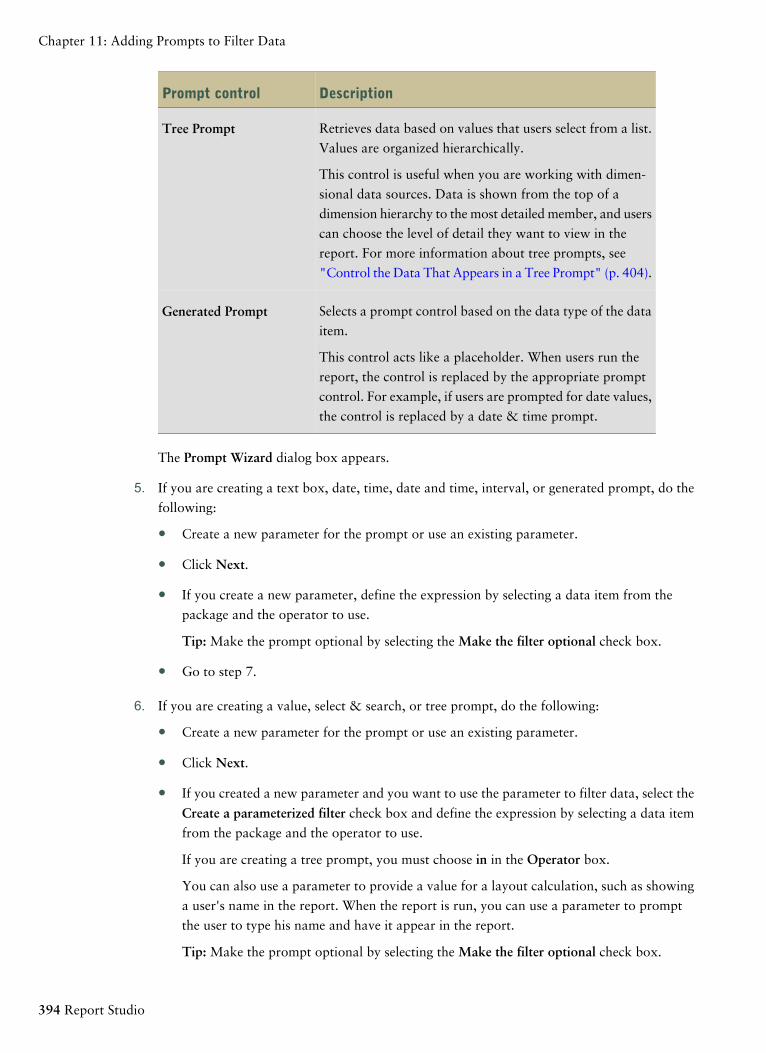
DescriptionPrompt control
Retrieves data based on values that users select from a list.
Values are organized hierarchically.Tree Prompt
This control is useful when you are working with dimen-
sional data sources. Data is shown from the top of a
dimension hierarchy to the most detailed member, and users
can choose the level of detail they want to view in the
report. For more information about tree prompts, see
"Control the Data That Appears in a Tree Prompt" (p. 404).
Selects a prompt control based on the data type of the data
item.Generated Prompt
This control acts like a placeholder. When users run the
report, the control is replaced by the appropriate prompt
control. For example, if users are prompted for date values,
the control is replaced by a date & time prompt.
The Prompt Wizard dialog box appears.
5. If you are creating a text box, date, time, date and time, interval, or generated prompt, do the
following:
● Create a new parameter for the prompt or use an existing parameter.
● Click Next.
● If you create a new parameter, define the expression by selecting a data item from the
package and the operator to use.
Tip: Make the prompt optional by selecting the Make the filter optional check box.
● Go to step 7.
6. If you are creating a value, select & search, or tree prompt, do the following:
● Create a new parameter for the prompt or use an existing parameter.
● Click Next.
● If you created a new parameter and you want to use the parameter to filter data, select the
Create a parameterized filter check box and define the expression by selecting a data item
from the package and the operator to use.
If you are creating a tree prompt, you must choose in in the Operator box.
You can also use a parameter to provide a value for a layout calculation, such as showing
a user's name in the report. When the report is run, you can use a parameter to prompt
the user to type his name and have it appear in the report.
Tip: Make the prompt optional by selecting the Make the filter optional check box.
394 Report Studio
Chapter 11: Adding Prompts to Filter Data
● Click Next.
● If you created a parameterized filter and you have more than one query defined in the
report, select the check box for the query on which to filter and click Next.
● Select the Create new query check box to create the query that will be used to build the
list of data values shown when the report is run.
Tip: Do not create a new query if you want to link the prompt to an existing query or if
you intend to create the query at a later time.
● Click the ellipsis (...) button beside Values to use and click the data item on which to
prompt.
● To choose a data item that is different than what users will see when they are prompted,
click the ellipsis (...) button beside Values to display and click the data item.
● To create a cascading prompt, in the Cascading source box, click the parameter that rep-
resents the cascade source.
7. Click Finish.
The prompt control is added to the prompt page. A prompt page is like a report page. You can
insert graphics and text and apply formatting.
You can also modify the properties of the prompt control by clicking it and making changes in the
Properties pane.
Example - Create a Report Showing Products Shipped for a Specific Time IntervalYou are a report author at The Great Outdoors Company, which sells sporting equipment. You
are requested to create a report that shows the time interval between closing and shipping dates.
Steps
1. Open Report Studio with the GO Data Warehouse (query) package.
2. In the Welcome dialog box, click Create a new report or template.
3. In the New dialog box, click List and click OK.
4. In the Insertable Objects pane, on the Source tab , expand Sales and Marketing (query) and
Sales (query).
5. Expand Sales order and double-click Order number.
6. Expand Product and double-click Product name.
7. Expand Sales fact and double-click Quantity.
8. In the Insertable Objects pane, on the Toolbox tab , drag Query Calculation to the right of
Return quantity in the list.
9. In the Name box, type the following and click OK:
Professional Authoring User Guide 395
Chapter 11: Adding Prompts to Filter Data
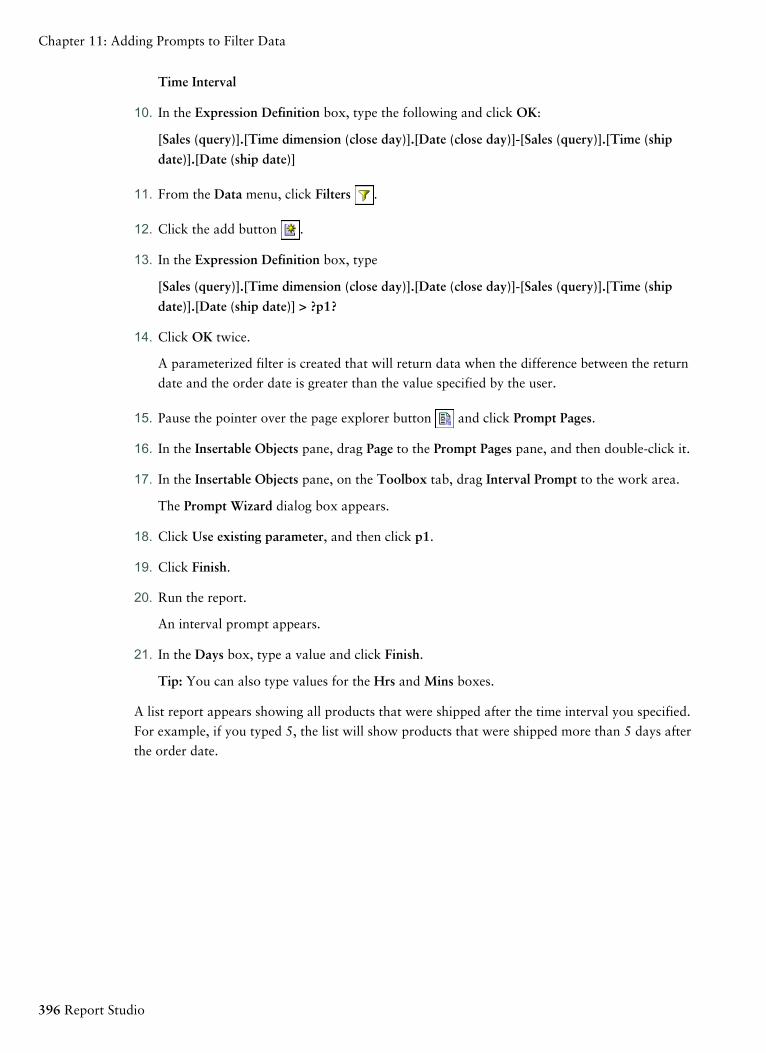
Time Interval
10. In the Expression Definition box, type the following and click OK:
[Sales (query)].[Time dimension (close day)].[Date (close day)]-[Sales (query)].[Time (ship
date)].[Date (ship date)]
11. From the Data menu, click Filters .
12. Click the add button .
13. In the Expression Definition box, type
[Sales (query)].[Time dimension (close day)].[Date (close day)]-[Sales (query)].[Time (ship
date)].[Date (ship date)] > ?p1?
14. Click OK twice.
A parameterized filter is created that will return data when the difference between the return
date and the order date is greater than the value specified by the user.
15. Pause the pointer over the page explorer button and click Prompt Pages.
16. In the Insertable Objects pane, drag Page to the Prompt Pages pane, and then double-click it.
17. In the Insertable Objects pane, on the Toolbox tab, drag Interval Prompt to the work area.
The Prompt Wizard dialog box appears.
18. Click Use existing parameter, and then click p1.
19. Click Finish.
20. Run the report.
An interval prompt appears.
21. In the Days box, type a value and click Finish.
Tip: You can also type values for the Hrs and Mins boxes.
A list report appears showing all products that were shipped after the time interval you specified.
For example, if you typed 5, the list will show products that were shipped more than 5 days after
the order date.
396 Report Studio
Chapter 11: Adding Prompts to Filter Data
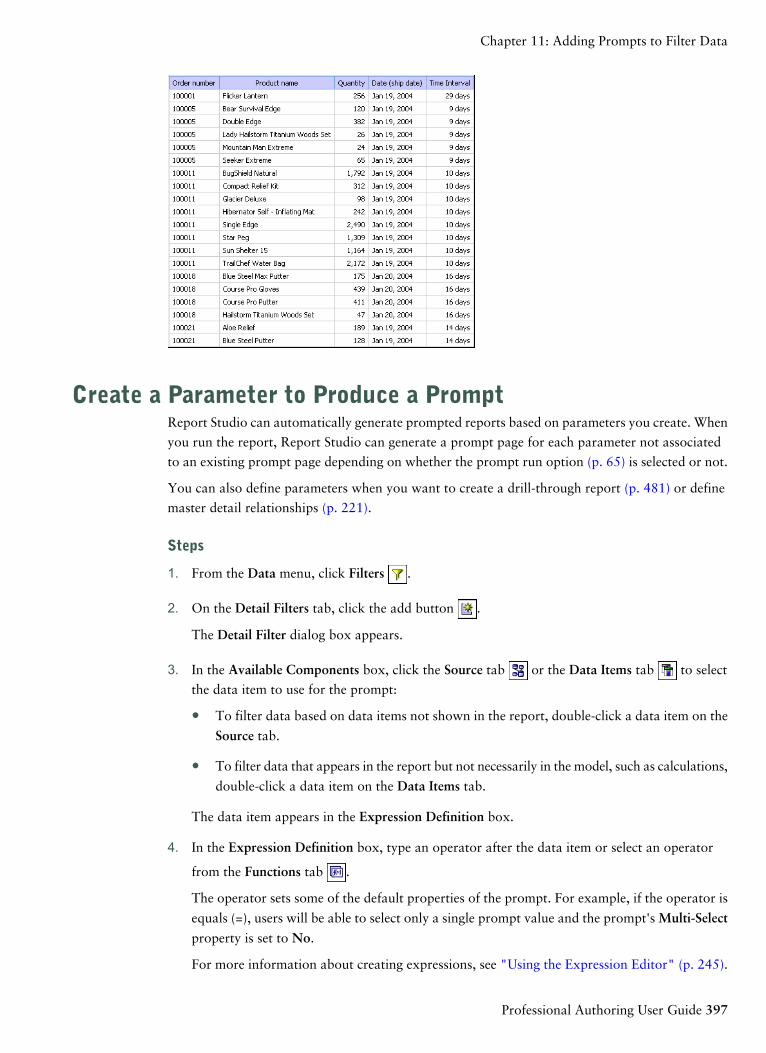
Create a Parameter to Produce a PromptReport Studio can automatically generate prompted reports based on parameters you create. When
you run the report, Report Studio can generate a prompt page for each parameter not associated
to an existing prompt page depending on whether the prompt run option (p. 65) is selected or not.
You can also define parameters when you want to create a drill-through report (p. 481) or define
master detail relationships (p. 221).
Steps
1. From the Data menu, click Filters .
2. On the Detail Filters tab, click the add button .
The Detail Filter dialog box appears.
3. In the Available Components box, click the Source tab or the Data Items tab to select
the data item to use for the prompt:
● To filter data based on data items not shown in the report, double-click a data item on the
Source tab.
● To filter data that appears in the report but not necessarily in the model, such as calculations,
double-click a data item on the Data Items tab.
The data item appears in the Expression Definition box.
4. In the Expression Definition box, type an operator after the data item or select an operator
from the Functions tab .
The operator sets some of the default properties of the prompt. For example, if the operator is
equals (=), users will be able to select only a single prompt value and the prompt's Multi-Select
property is set to No.
For more information about creating expressions, see "Using the Expression Editor" (p. 245).
Professional Authoring User Guide 397
Chapter 11: Adding Prompts to Filter Data
5. Type a name after the operator to define the prompt parameter. A question mark must precede
and follow the name.
6. To specify whether the prompt is mandatory, in the Usage box, click Required, Optional, or
Disabled.
Create a Prompt Directly in a Report PageYou can add prompt controls directly in a report page instead of creating a prompt page.
Prompt controls that are added to report pages will not appear in the following:
● saved reports
● PDF reports
● reports that are sent to users by email
● scheduled reports
Prompt controls are interactive. They are used to satisfy parameter values before running a report.
As a result, prompt controls added to a report page only appear when you run the report in HTML
format. When you run a report in HTML format, users select which values they want to see, and
the report is refreshed, producing a new report.
For the non-interactive reports listed above, prompt parameter values must be collected and satisfied
before the report is run. You provide the parameter values using the Run options tab in IBM Cognos
Connection. If you do not provide all the required values, the report will fail to run. You can access
the Run options tab by clicking the set properties button for the report.
Tip: The Revenue by Product Brand (2005) sample report (p. 528) in the Sales and Marketing (cube)
package and the Rolling and Moving Averages interactive sample report (p. 544) include value
prompts. For more information about The Great Outdoors Company samples, see "Sample Reports
and Packages" (p. 521).
Steps
1. In the Insertable Objects pane, on the Toolbox tab , drag a prompt control to the report.
The Prompt Wizard dialog box appears.
2. Provide the information necessary to create the prompt.
Tip: Make the prompt optional by selecting the Make the filter optional check box. Otherwise,
when you run the report for the first time, the prompt appears in a generated prompt page
rather than in the report page. Alternatively, you can specify a default selection for the prompt
(p. 401).
3. In the work area, click the prompt.
4. In the Properties pane, set the Auto-Submit property to Yes.
If you do not set the Auto-Submit property to Yes, the report will not refresh when users select
a different prompt value.
398 Report Studio
Chapter 11: Adding Prompts to Filter Data
Tip: An alternative to setting the prompt to auto-submit is to add a prompt button from the
Toolbox tab and set its Type property to Finish.
The prompt control is added to the report page. You can modify its properties by clicking it and
making changes in the Properties pane.
Modifying PromptsFor each prompt you create, you can modify its properties by specifying values in the Propertiespane. For example, you can
● change the prompt control interface
● require user input
● enable multiple selections
● show or hide prompt statuses
● specify default selections
● specify prompt values
● add prompt buttons
● create cascading prompts
Some properties you set for a prompt may be overridden under some conditions. For example, some
properties set for the filter associated with a prompt may override the corresponding prompt
property.
Change the Prompt Control InterfaceBy default, when you create a prompt, Report Studio selects the prompt control interface. You can
change the prompt control interface depending on the type of prompt you created. For example,
for a value prompt, you can choose a drop-down list, a list box, or a radio button group.
Steps
1. Click the prompt control.
2. In the Properties pane, set the Select UI property to the interface.
Specify That a Prompt Requires User InputYou can specify that a prompt requires user input before the report can run.
Steps
1. Click the prompt control.
2. In the Properties pane, set the Required property to Yes.
3. Pause the pointer over the page explorer button and click a report page.
Professional Authoring User Guide 399
Chapter 11: Adding Prompts to Filter Data
4. From the Data menu, click Filters .
5. Click the filter associated with the prompt.
6. In the Usage box, click Required.
When you run the report, a star appears next to the prompt indicating that the user must select or
type a value.
If you have a cascading prompt and the parent prompt control is required, the child prompt control
is disabled. This ensures that users choose at least one value in the parent prompt before they can
choose a value in the child prompt. Conversely, if the parent control is optional, then the child
control is populated. This gives users the ability to choose values in the child prompt without having
to choose a value in the parent prompt.
Allow Users to Select Multiple Values in a PromptYou can allow users to select more than one value in a prompt. For example, you have a prompt
for which users must select a product line. You can modify the prompt so that users can select more
than one product line.
If you enable multiple selections, the Auto-Submit property is always set to no.
Steps
1. Click the prompt control.
2. In the Properties pane, choose whether to allow users to specify more than one value or a range
of values:
● To allow users to specify more than one value, set the Multi-Select property to Yes.
● To allow users to specify a range of values, set the Range property to Yes.
3. Pause the pointer over the page explorer button and click a report page.
4. From the Data menu, click Filters .
If you have more than one query defined in the report, you must first click an object linked to
a query.
5. Double-click the filter associated with the prompt.
6. Change the operator to one of the following:
● If you are creating a multi-select prompt, change the operator to in.
For example, [Product_line] in ?Product line? where [Product_Line] is the name of the data
item allows users to select multiple product lines.
● If you are creating a range prompt, change the operator to in_range.
For example, [Margin] in_range ?Margin? where [Margin] is the name of the data item
allows users to specify a margin range.
400 Report Studio
Chapter 11: Adding Prompts to Filter Data
Show or Hide Prompt StatusEach prompt you create in a report provides dynamic validation when the report is run. Validity
checks are performed to ensure that the data is correct and that required values are supplied. For
example, a star appears next to each required prompt. An arrow appears next to a prompt if you
must select or type a value. If you type an incorrect value, a dotted line appears. You can choose
whether to show the star and arrow for each prompt.
Steps
1. Click the prompt control.
2. In the Properties pane, set the Hide Adornments property to Yes to hide the prompt characters
or No to show them.
Specify a Default Selection for a PromptYou can specify a default selection for a prompt so that users do not have to select or type a value
when they run the report.
Steps
1. Click the prompt control.
2. To define a range of values, in the Properties pane, set the Range property to Yes.
3. To specify more than one default selection, in the Properties pane, set the Multi-Select property
to Yes.
4. In the Properties pane, double-click the Default Selections property.
5. Click the add button and do one of the following:
● If you chose to define a single value, type the value as the default selection.
● If you chose to define a range of values, type the minimum and maximum values of the
range in the Minimum value and Maximum value boxes, respectively.
6. Repeat step 4 to specify other default selections.
Specify Prompt ValuesProvide your own values in a prompt to
● show something different from what is in the database
● improve performance by not accessing the database
● provide text for optional prompts, such as Select a value
● restrict the number of values available
For example, you have a prompt in which users choose a country. For the database value United
States, you want USA to appear in the prompt.
Professional Authoring User Guide 401
Chapter 11: Adding Prompts to Filter Data
Tip: The Rolling and Moving Averages interactive sample report (p. 544) includes a value prompt.
For more information about The Great Outdoors Company samples, see "Sample Reports and
Packages" (p. 521).
Steps
1. Click the prompt control.
2. In the Properties pane, double-click the Static Choices property.
3. Click the add button .
4. In the Use box, type the prompt value to add.
5. In the Display box, type the value that will appear in the prompt.
6. Repeat steps 3 to 5 to add other prompt values.
7. To link a prompt value to a condition (p. 431), do the following:
● In the Variable box, choose the variable to use or create your own.
For information about creating variables, see "Add a Variable" (p. 437).
● In the Value box, click one of the possible values for the variable.
● Click the static value to link to the variable and click the edit button .
● In the Display box, type the value to appear in the prompt.
● Repeat this procedure for each additional value.
Add a Prompt ButtonAdd prompt buttons so that users can submit selected items, cancel reports, or navigate between
pages.
When you are building prompts and prompt pages (p. 392), you may have to add prompt buttons
to submit selections. Some prompt controls, such as the value prompt, can be set to submit selections
automatically. Other prompt controls, such as the date prompt, require a prompt button.
Steps
1. Pause the pointer over the page explorer button and click the page to which to add a prompt
button.
2. In the Insertable Objects pane, on the Toolbox tab, drag Prompt Button to the work area.
3. Click the prompt button and, in the Properties pane, set the Type property to one of the follow-
ing actions.
ActionGoal
CancelCancel the report
402 Report Studio
Chapter 11: Adding Prompts to Filter Data
ActionGoal
BackGo to the previous prompt page
NextGo to the next prompt page
FinishRun the report
RepromptReprompt the user
Tip: Reprompting users is useful when you have cascading
prompts.
Create a Cascading PromptCreate a cascading prompt to use values from one prompt to filter values in another prompt. For
example, a report contains the columns Product line and Product type. You create prompts for
these columns, and you specify that the Product type prompt is a cascading prompt that uses Product
line as the source. When users select a product line, they see only the product types related to the
selected product line.
Tip: The Employee Training by Year sample report (p. 531) in the GO Data Warehouse (analysis)
package includes cascading prompts. For more information about The Great Outdoors Company
samples, see "Sample Reports and Packages" (p. 521).
Steps
1. To make the cascading source a required prompt, select it and, in the Properties pane, set the
Required property to Yes.
2. Click the prompt control to use as a cascading prompt.
3. In the Properties pane, double-click the Cascade Source property.
4. Click the parameter that represents the cascade source.
5. If the prompt allows users to select multiple values, add a prompt button to the cascade source
to provide the cascading prompt with the appropriate values:
● In the Insertable Objects pane, on the Toolbox tab, drag Prompt Button to the report.
● Click the prompt button and, in the Properties pane, set the Type property to Reprompt.
● To change the text in the prompt button, in the Insertable Objects pane, on the Toolbox
tab, drag Text Item to the prompt button and type the text.
For more information about how to create cascading prompts, see the Report Studio Quick Tour.
Professional Authoring User Guide 403
Chapter 11: Adding Prompts to Filter Data
Control the Data That Appears in a Tree PromptYou can control what data appears in a tree prompt and how the data is structured to get the results
that you want. To do this, you add various functions to the filter expression.
In addition, the operator that you chose in the Prompt Wizard dialog box (p. 392) controls what
appears next to each prompt value. If the operator is in or not in, check boxes appear next to each
prompt value. If the operator is equals (=), no check boxes appear.
Steps
1. Pause the pointer over the query explorer button and click the query that is associated with
the prompt.
2. In the Data Items pane, double-click the data item on which you are prompting.
3. In the Expression Definition box, type one of the following functions.
FunctionGoal
rootmembers(data_item)Show the hierarchical structure of all members in the
hierarchy. If this function is not used, all members are
shown in a flat list.
descendants(rootmembers
(data_item, x)
Show the descendants of the data item in a hierarchical
structure where x represents the level. For example, if you
are prompting on the Year hierarchy and x=1, you will
see 2004, 2005, and 2006 in the tree. If x=2, you will see
2004 Q1, 2004 Q2, and so on.
children(member)Show the children of a member. For example, 2004 Q1,
2004 Q2, 2004 Q3, and 2004 Q4 appear for the member
2004.
404 Report Studio
Chapter 11: Adding Prompts to Filter Data
Chapter 12: Laying Out a Report
When creating a report, a good layout is essential to ensure that the information in the report is
presented in a clear and effective manner.
Laying out a report can include
● adding headers and footers
● adding borders
● adding text
● specifying fonts
● inserting images
● using visual effects
● inserting formatting objects
● aligning objects
● using tables
● applying padding
● setting margins
● specifying text flow
● specifying object height and width
● setting object flow
● setting report properties
● setting object styles
● adding color
Report Layout Recommendations❑ Define the page structure.
Determine what goes into the page header, body, and footer. The page header contains
information that appears at the top of each page. The page body contains information that
starts on the first instance of the page. If there is too much data to fit on a single page, it con-
tinues across all instances of the page. The page footer contains information that appears at
the bottom of each page.
❑ Identify horizontal bands of information.
Professional Authoring User Guide 405
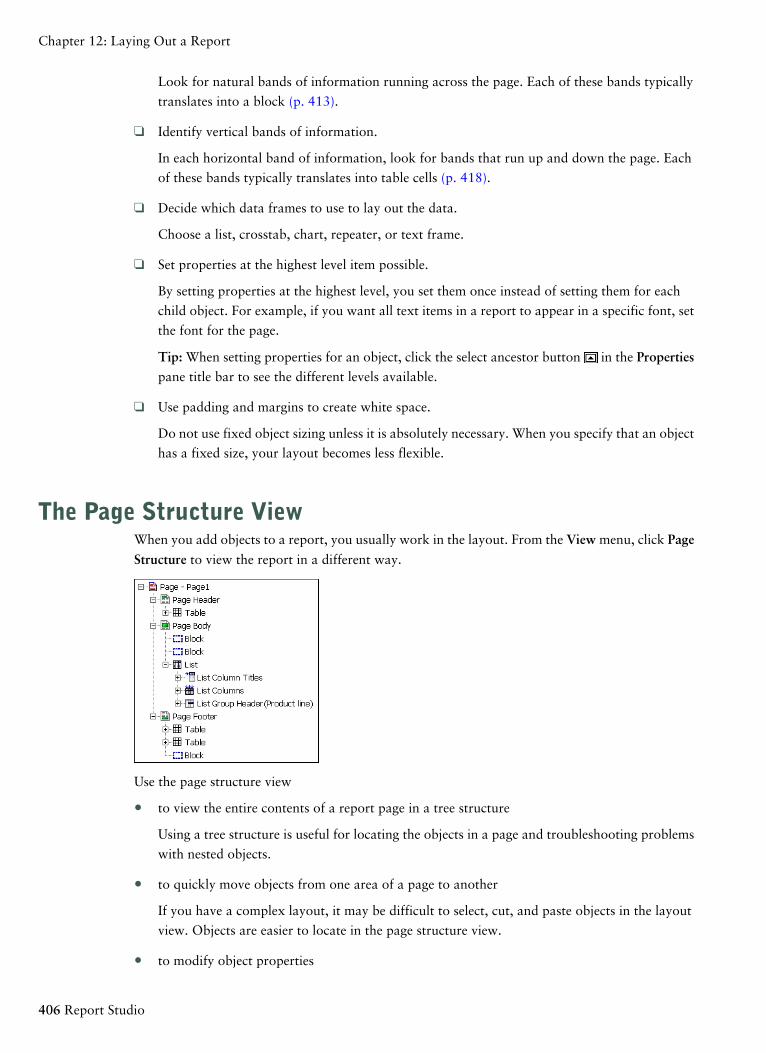
Look for natural bands of information running across the page. Each of these bands typically
translates into a block (p. 413).
❑ Identify vertical bands of information.
In each horizontal band of information, look for bands that run up and down the page. Each
of these bands typically translates into table cells (p. 418).
❑ Decide which data frames to use to lay out the data.
Choose a list, crosstab, chart, repeater, or text frame.
❑ Set properties at the highest level item possible.
By setting properties at the highest level, you set them once instead of setting them for each
child object. For example, if you want all text items in a report to appear in a specific font, set
the font for the page.
Tip: When setting properties for an object, click the select ancestor button in the Propertiespane title bar to see the different levels available.
❑ Use padding and margins to create white space.
Do not use fixed object sizing unless it is absolutely necessary. When you specify that an object
has a fixed size, your layout becomes less flexible.
The Page Structure ViewWhen you add objects to a report, you usually work in the layout. From the View menu, click Page
Structure to view the report in a different way.
Use the page structure view
● to view the entire contents of a report page in a tree structure
Using a tree structure is useful for locating the objects in a page and troubleshooting problems
with nested objects.
● to quickly move objects from one area of a page to another
If you have a complex layout, it may be difficult to select, cut, and paste objects in the layout
view. Objects are easier to locate in the page structure view.
● to modify object properties
406 Report Studio
Chapter 12: Laying Out a Report
You can modify object properties in the layout or in the page structure view.
Tip: To switch back to the report layout, from the View menu, click Page Design.
Copy Object FormattingYou can quickly copy the formatting of items in your report, such as fonts, colors, borders, and
number formats, and apply that formatting to other items.
Steps
1. Click an item that has the formatting to copy.
2. Do one of the following:
● To copy all the formatting applied to the item, click the pick up style button , click the
item to format, and then click the apply style button .
● To copy only one of the formatting styles, click the down arrow to the right of the pick up
style button and click the style to copy. Then click the item to format and click the apply
style button.
3. If you want to make changes to a style that you copied, click the down arrow to the right of
the pick up style button and click Edit Dropper Style.
4. In the Style dialog box, specify basic and advanced style characteristics.
Add a Header or Footer to a ReportAdd a header or footer to make a report easier to read. Headers and footers are containers in which
you can add objects like text, images, and report expressions such as the current date and page
numbers. You can add headers and footers to pages and lists.
Tip: The Revenue by Product Brand (2005) sample report (p. 528) in the Sales and Marketing (cube)
package includes a customized header and footer. For more information about The Great Outdoors
Company samples, see "Sample Reports and Packages" (p. 521).
Pages
Add a page header or footer when you want information to appear on every page in the report,
such as a title or page numbers.
Lists
You can add the following headers and footers to lists to organize data into logical sections or to
identify every change in value of a column.
DescriptionType
Adds a header that appears at the top of the list on every page
in which list data appears.
List page header
Professional Authoring User Guide 407
Chapter 12: Laying Out a Report
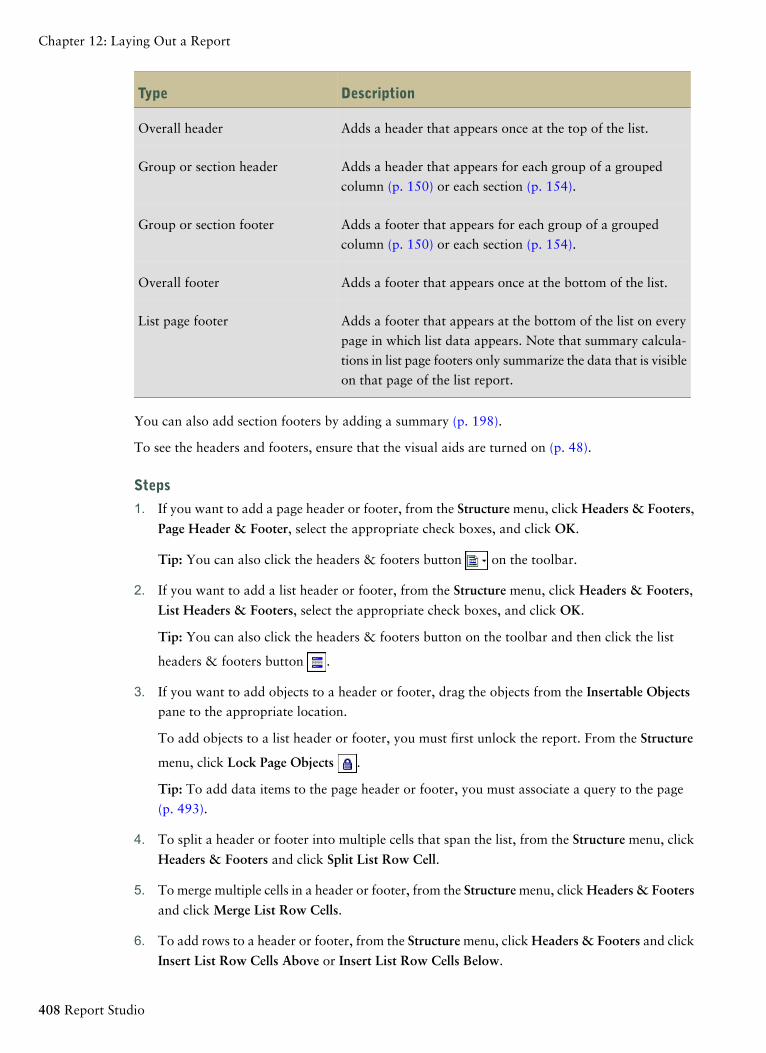
DescriptionType
Adds a header that appears once at the top of the list.Overall header
Adds a header that appears for each group of a grouped
column (p. 150) or each section (p. 154).
Group or section header
Adds a footer that appears for each group of a grouped
column (p. 150) or each section (p. 154).
Group or section footer
Adds a footer that appears once at the bottom of the list.Overall footer
Adds a footer that appears at the bottom of the list on every
page in which list data appears. Note that summary calcula-
tions in list page footers only summarize the data that is visible
on that page of the list report.
List page footer
You can also add section footers by adding a summary (p. 198).
To see the headers and footers, ensure that the visual aids are turned on (p. 48).
Steps
1. If you want to add a page header or footer, from the Structure menu, click Headers & Footers,
Page Header & Footer, select the appropriate check boxes, and click OK.
Tip: You can also click the headers & footers button on the toolbar.
2. If you want to add a list header or footer, from the Structure menu, click Headers & Footers,
List Headers & Footers, select the appropriate check boxes, and click OK.
Tip: You can also click the headers & footers button on the toolbar and then click the list
headers & footers button .
3. If you want to add objects to a header or footer, drag the objects from the Insertable Objectspane to the appropriate location.
To add objects to a list header or footer, you must first unlock the report. From the Structure
menu, click Lock Page Objects .
Tip: To add data items to the page header or footer, you must associate a query to the page
(p. 493).
4. To split a header or footer into multiple cells that span the list, from the Structure menu, click
Headers & Footers and click Split List Row Cell.
5. To merge multiple cells in a header or footer, from the Structure menu, click Headers & Footers
and click Merge List Row Cells.
6. To add rows to a header or footer, from the Structure menu, click Headers & Footers and click
Insert List Row Cells Above or Insert List Row Cells Below.
408 Report Studio
Chapter 12: Laying Out a Report
Add Borders to an ObjectYou can add borders to objects in a report such as a column, a header, or a footer or to the whole
report.
Steps
1. Click the object to which to add a border.
Tip: To quickly select the parent of an object, click the object, and then click the select ancestor
button in the title bar of the Properties pane.
2. In the Properties pane, double-click the Border property and select values in the Color, Style,
and Width boxes.
Note: Specifying a width using % as the unit of measure is not supported when producing
reports in PDF.
3. Apply the selected values to the top, bottom, left side, right side, or all sides of the object by
clicking the appropriate button in the Preview section.
Tip: To clear the border applied, click the clear borders button .
Tip: You can also add borders using the Report Studio toolbar.
Add a Text Item to a ReportYou can add text to a report. You can insert text in other objects, such as a block or table cell, or
directly in the report page.
You can also add multilingual text to a report (p. 442).
Steps
1. In the Insertable Objects pane, click the Toolbox tab.
2. Drag the Text Item object to the report.
The Text dialog box appears.
3. Type the text and click OK.
Tip: You can also paste text from another part of the report.
If you click OK without typing any text, Report Studio inserts the string Double click to edit
text.
You can now format the text by changing the font, color, size, and so on. Select the text and make
the appropriate changes in the Properties pane.
Professional Authoring User Guide 409
Chapter 12: Laying Out a Report
Specify the Report FontYou can specify the font for text in a report.
Steps
1. Click the object.
Tip: To specify the default font for the report, click the page.
2. Do one of the following:
● From the toolbar, specify the font properties.
● In the Properties pane, double-click the Font property and specify the font properties.
Tip: Type a list of fonts in the Family box if you are not sure whether a specific font is
installed on a user's computer. For example, if you type Times New Roman, Arial, mono-
space, Report Studio checks to see if Times New Roman is installed. If it is not, Report
Studio checks for Arial. If Arial is not installed, the monospace font used by the computer
is used.
If you clicked (Default) for any of the font properties, the default value for the property is used.
Default values are stored in a style sheet that is used across all IBM Cognos 8 tools. You can modify
default values by modifying classes (p. 428).
Insert an Image in a ReportYou can insert an image in a report. You can insert images in other objects, such as blocks or table
cells, directly in the report page or as the background image of another object.
The images that you insert must first be uploaded to the IBM Cognos 8 server or another Web
server and must be .gif or .jpg format.
Steps
1. In the Insertable Objects pane, click the Toolbox tab .
2. Drag the Image object to the report and then double-click it.
3. In the Image URL dialog box, type the URL of the image to insert or click Browse to go to the
location containing the image.
To browse images on a Web server, you must enable Web-based Distributed Authoring and
Versioning (WebDAV) on your Web server. For more information about configuring Web
servers, see the Installation and Configuration Guide.
Insert a Background Image in an ObjectYou can insert a background image for objects in a report. For example, use a background image
to add a watermark to a page.
410 Report Studio
Chapter 12: Laying Out a Report
You can also create your own background visual effects, such as drop shadows and gradient fills.
For more information, see "Use Visual Effects" (p. 411).
The images that you insert must first be uploaded to the IBM Cognos 8 server or another Web
server and must be .gif or .jpg format.
Steps
1. Select the object.
2. In the Properties pane, double-click the Background Image property.
3. In the Image URL box, type the URL of the image to insert or click Browse to go to the location
containing the image.
To browse images on a Web server, you must enable Web-based Distributed Authoring and
Versioning (WebDAV) on your Web server. For more information about configuring Web
servers, see the Installation and Configuration Guide.
Tip: To remove an image, delete the URL.
4. In the Position box, choose how to align the image in the object.
5. In the Tiling box, click a tiling option.
Use Visual EffectsYou can define and generate an enhanced background for objects in a report that support a back-
ground, such as data containers (lists, crosstabs, and charts), headers, footers, page bodies, and so
on. Effects that you can define for the generated background image property include border, fill,
drop shadow, and images. You can also apply enhanced backgrounds as a class style.
Notes
● If the generated image is complex and large, the size of the output may be affected proportion-
ately.
● The generated image is only rendered if the data container has a fixed size: if a percentage size
is given, IBM Cognos 8 ignores the gradient properties.
● Resizing or overflow behavior is ignored for generated images in HTML reports.
Steps to Add a Generated Background to a Chart
1. Click the element to which to apply the generated background.
2. Under Color & Background in the Properties pane, double-click the Generated Background
Image property.
3. Select one or more of the following:
● To apply a border, click Border and specify settings for border style, width, color, corner
radius for rounded rectangles, and transparency.
Professional Authoring User Guide 411
Chapter 12: Laying Out a Report
If the element also includes a fill with a transparency setting, select the Allow transparent
bleed check box to apply the same transparency to the border.
● To apply a fill effect, click Fill and specify the settings. The fill effect can either be a solid
color, a gradient, or a pattern. You can define a gradient fill effect as a linear, radial line,
or radial rectangle gradient.
● To apply a drop shadow effect, click Drop Shadow and specify the shadow color, transpar-
ency value, color, and offset settings. The default horizontal and vertical offset is 5 pixels.
● To specify one or more images as a background, click Images. You can specify the trans-
parency value and the position for each defined image. You can also specify a custom
position for each image.
Tip: To remove the effect, clear its check box.
Steps to Add a Background Gradient to a Page
1. Click anywhere in the report page.
2. In the Properties pane title bar, click the select ancestor button and click Page.
3. Under Color & Background, double-click the Gradient property.
4. Select the Gradient check box and then select the colors and direction for the gradient.
Background gradients and drop shadows do not appear in Excel output. They are also supported
only for report outputs run in the Internet Explorer Web browser.
Tip: To remove the effect, clear the Gradient check box.
Steps to Add a Drop Shadow to a Container
1. Click the crosstab, list, repeater table, or table in the report.
2. In the Properties pane title bar, click the select ancestor button and click Crosstab, List,
Repeater Table, or Table.
3. Under Color & Background, double-click the Drop Shadow property.
4. Select the Drop shadow check box and then select the color, offset, and transparency values.
Background gradients and drop shadows do not appear in Excel output. They are also supported
only for report outputs run in the Internet Explorer Web browsers.
If you add a drop shadow, ensure that you also specify a background color for the object.
Otherwise, if you keep the default transparent background, data values also have a drop shadow
and are difficult to read.
Tip: To remove the effect, clear the Drop shadow check box.
412 Report Studio
Chapter 12: Laying Out a Report
Insert a Formatting Object in a ReportIn addition to text and images, the Toolbox tab in the Insertable Objects pane contains other
objects that you can add to the report layout.
DescriptionObject
Adds an empty block, which is a container in which you can insert
other objects. This is useful for controlling where objects appear.Block
Tip: You can use blocks to add space between objects. However,
empty blocks are not rendered. You must insert an object or specify
the height and width.
Tip: The Revenue by GO Subsidiary 2005 sample report (p. 535)
in the GO Data Warehouse (analysis) package includes an empty
block. For more information about The Great Outdoors Company
samples, see "Sample Reports and Packages" (p. 521).
Adds a table, which is a container in which you can insert other
objects. This is useful for controlling where objects appear.Table
Adds an empty block that has a caption. This is similar to the
Block object, but with a caption.
Field Set
Adds a calculated member (p. 232).Calculated Member
Adds an intersection (tuple) (p. 235).Intersection (Tuple)
Adds a calculated column (p. 187).Query Calculation
Adds a calculation in the layout that contains run-time information,
such as current date, current time, and user name.Layout Calculation
Inserts an empty cell on a crosstab edge. Allows for the insertion
of non-data cells on an edge. Blank cells appear for the edge when
the report is run.
Crosstab Space
Insert this object when a crosstab edge does not produce useful
data and you want blanks to appear in the cells instead.
Professional Authoring User Guide 413
Chapter 12: Laying Out a Report
DescriptionObject
Inserts an empty cell on a crosstab edge. Allows for the insertion
of non-data cells on an edge. The contents of the fact cells for the
edge are rendered when a measure is added or the default measure
(p. 88) is specified.
Crosstab Space (with fact
cells)
● If the crosstab space is nested, the scope of the fact cells is the
scope of the item that is at the level before the space.
● If the crosstab space is not nested and there are no items nested
below it, the scope of the fact cells is the default measure.
Inserts a single data item (p. 62).Singleton
Adds an empty block that you can use for conditional formatting
(p. 431).Conditional Blocks
Adds a container in which you can insert HTML code. HTML
items can be anything that your browser will execute, including
links, images, multimedia, tooltips, or JavaScript.
HTML Item
HTML items appear only when you run the report in HTML
format.
Note: You cannot include <form> tags in HTML items.
Tip: The Table of Contents sample report (p. 541) in the GO Sales
(analysis) package includes an HTML item. For more information
about The Great Outdoors Company samples, see "Sample Reports
and Packages" (p. 521).
When you upgrade to the next version of IBM Cognos 8, the report
upgrade processes do not account for the use of undocumented
and unsupported mechanisms or features, such as JavaScript, that
refers to IBM Cognos HTML objects.
Inserts an object that is used to render HTML in the layout. This
object is similar to the HTML Item, except that rich text items
also render in PDF output. Using rich text items is useful when
you want to add annotations defined in a data source to a report.
Rich Text Item
Note: Rich text items support only a restricted set of well-formed
XHTML.
Adds a hyperlink so that users can jump to another place, such as
a Web site.Hyperlink
Adds a hyperlink in the form of a button.Hyperlink Button
414 Report Studio
Chapter 12: Laying Out a Report
DescriptionObject
Adds an As of Time expression so that you can show data for a
specific time period (p. 417).As of Time Expression
Inserts page numbers that you can customize (p. 503).Page Number
Numbers each row of data returned when the report is run.Row Number
Note: You can add row numbers only to lists and repeaters.
Adds a reference to another object. Useful when you want to reuse
an object.Layout Component Reference
Adds a Metric Studio history chart as an image.Metric Studio Diagram
For information about adding a Metric Studio diagram to a report,
see the Metric Studio User Guide.
Creates a table of contents that is rendered in the output of a report
(p. 500).Table of Contents
Adds a table of contents marker (p. 500).Table of Contents Entry
Inserts a bookmark so that users can move from one part of a
report to another (p. 498).Bookmark
For information about each prompt control and prompt buttons, see "Adding Prompts to Filter
Data" (p. 391). The Toolbox tab contains other objects when you work in other areas such as Query
Explorer and Condition Explorer. You can also add your own objects to the toolbox, such as a
company logo that you use often. For more information, see the Administration and Security Guide.
Before you can add a hyperlink, HTML item, or hyperlink button, you must have the HTML Items
in Report capability. For more information, see the Administration and Security Guide.
Step
● To add an object, drag or double-click it from the Toolbox tab .
Elements Supported in Rich Text ItemsRich text items support all XHTML character entities, such as (non-breaking space), and
the following elements:
● div
● span
● ul
● ol
Professional Authoring User Guide 415
Chapter 12: Laying Out a Report
● li
Each element only supports the style attribute, which must contain a valid CSS style. In addition,
ul and ol elements support list-style attributes. Specifically, the ol element supports decimal, and
the ul element supports circle, disc, and square, as well as list-style-image.
For example, the following code produces an unordered list entitled List: with three items. Each
list item is in a different color, and the list-style attribute used is circle.
<div style="font-size:14pt; text-decoration:underline">List:</div><ul style="list-style-type:circle"> <li style="color:green">Item<span style="font-weight:bold">A</span></li> <li style="color:red">ItemB</li> <li style="color:blue">Item C</li> </ul>
Example - Add a Multimedia File to a ReportYou are a report author at The Great Outdoors Company, which sells sporting equipment. You
want to insert a Windows Media Audio/Video file named GO.wmv in a template that serves as a
cover page for all reports.
You must have Windows Media Player installed on your computer.
Steps
1. Open Report Studio with the GO Data Warehouse (query) package.
2. In the Welcome dialog box, click Create a new report or template and in the New dialog box,
click Blank.
3. In the Insertable Objects pane, on the Toolbox tab, drag the HTML Item object to the
report.
4. Select the HTML Item.
5. In the Properties pane, double-click the HTML property.
6. In the HTML dialog box, type the following:
<OBJECT classid="CLSID:6BF52A52-394A-11D3-B153-00C04F79FAA6"> <PARAM
NAME="URL" VALUE="/c8/webcontent/samples/images/GO.wmv"/> </OBJECT>
When you run the report in HTML format, the multimedia file plays in Windows Media Player.
Rolling and Moving AveragesUse rolling and moving averages to analyze data for specific time series and to spot trends in that
data. When viewing these averages on a line chart, use a longer period of time to reveal long-term
trends.
In Report Studio, to add a rolling or moving average, you must create summary and custom calcu-
lations using layout expressions (p. 232).
The Rolling and Moving Averages interactive sample report includes rolling and moving calculations.
For more information about The Great Outdoors Company, see "Sample Reports and Pack-
ages" (p. 521).
416 Report Studio
Chapter 12: Laying Out a Report
Rolling Average
A rolling average continuously updates the average of a data set to include all the data in the set
until that point. For example, the rolling average of return quantities at March 2004 would be
calculated by adding the return quantities in January, February, and March, and then dividing that
sum by three.
Tip: The Historical Revenue sample report (p. 527) in the Sales and Marketing (Cube) package also
includes a rolling average. For more information about The Great Outdoors Company samples,
see "Sample Reports and Packages" (p. 521).
Moving Average
A moving average calculates the average of a data set for a specified period. For example, the
moving average of return quantities at March 2004 with a specified period of two would be calcu-
lated by adding the return quantities in February and March and then dividing that sum by two.
In Report Studio, you can use a prompt to specify the period.
Show Data for Specific Time PeriodsShow data for a specific time period to associate a report with a business time period rather than
the execution time. For example, you have a monthly report that you run at the beginning of each
month, and you want the last business day of the previous month to appear rather than the day on
which you run the report.
If the report functions AsOfDate() and AsOfTime() are added to the report, they will return a value
based on the results of the As of Time Expression object. If the As of Time Expression object is not
added to the report, these two functions return the date and time at which the report is run.
If the As of Time Expression object is added more than once in the report, the first occurrence of
the object in the layout that returns a valid value is used.
Steps
1. In the Insertable Objects pane, on the Toolbox tab , drag As of Time Expression to the
report.
2. Double-click As of Time Expression.
3. In the Expression Definition box, type the expression.
The expression must return a date-time value.
Tip: You can drag a function that returns a constant from the Constants folder in the Functionstab. You can then change the constant to the value to use.
If you do not specify a time, the default time 12:00:00.000 AM is used.
Align an Object in a ReportYou can specify a horizontal and vertical alignment for an object in a report to determine where
they appear.
Professional Authoring User Guide 417
Chapter 12: Laying Out a Report
Tables can also be used to determine where objects appear in a report.
Note: The Justify horizontal alignment works with HTML output but does not apply to PDF output.
Steps
1. Select the object to align.
2. From the toolbar, click one of the available horizontal or vertical alignment buttons.
Use a Table to Control Where Objects AppearYou can use tables in your report to control where objects appear. Tables can be inserted anywhere
in a report, such as a header, a footer, or the page body. After you create a table, insert objects in
the cells.
You can also apply a predefined table style to tables.
The alignment buttons can also be used to determine where objects appear in a report.
Tip: The Singletons on Page Body sample report (p. 541) in the GO Sales (analysis) package includes
a table to control the report layout. For more information about The Great Outdoors Company
samples, see "Sample Reports and Packages" (p. 521).
Steps
1. In the Insertable Objects pane, click the Toolbox tab.
2. Drag Table to the report.
The Insert Table dialog box appears.
3. In the Number of columns and Number of rows boxes, type the number of columns and rows
for the table.
4. If you want to have the table span the width of the report page, select the Maximize widthcheck box.
5. If you want to add borders to the table, select the Show borders check box.
Apply a Table StyleApply a table style to quickly format tables. You can also apply a table style to lists, crosstabs, and
repeater tables.
Steps
1. Click the table, list, or crosstab.
2. From the Table menu, click Apply Table Style.
3. In the Table styles box, click a table style.
Tip: Some styles are unique to tables, lists, or crosstabs.
418 Report Studio
Chapter 12: Laying Out a Report
4. If you are applying a table style to a table or list, in the Apply special styles to section, select
or clear the various column and row check boxes based on how you want to treat the first and
last columns and rows.
Some check boxes may not be available for particular table styles, or to particular columns or
rows.
5. If you are applying a table style to a list or crosstab, select the Set this style as the default for
this report check box to set the style as the default for all lists and crosstabs.
For a list, you may need to clear the First column and Last column check boxes in the Apply
special styles to section before you can select this check box. In addition, some table styles
cannot be set as the default.
Apply Padding to an ObjectApply padding to an object to add white space between the object and its margin or, if there is a
border, between the object and its border.
Tip: The GO Balance Sheet as at Dec 31 2006 sample report (p. 532) in the GO Data Warehouse
(analysis) package includes padding. For more information about The Great Outdoors Company
samples, see "Sample Reports and Packages" (p. 521).
Steps
1. Select the object to which to apply padding.
2. In the Properties pane, double-click the Padding property.
3. Specify top, bottom, left, and right padding by typing values in the corresponding boxes and
choosing the unit of measure.
Note: Specifying padding using % as the unit of measure is not supported when producing
reports in PDF.
Tip: You can quickly apply left or right padding by either pressing Tab and Shift+Tab or by clicking
the increase indent and the decrease indent buttons in the toolbar. When using the toolbar
buttons, you can indent an object by up to nine times the indentation length. You can specify the
indentation length to use by clicking the arrow beside either button and clicking Set Default Indent
Length.
Set Margins for an ObjectSet the margins for objects in a report to add white space around them.
For Date, Time, Row Number, and Page Number objects, you can only set the left and right margins.
If you want to set the top or bottom margins for these objects, place them in a table or a block.
Then set the margin or padding properties on the table or block object.
Steps
1. Select the object.
Professional Authoring User Guide 419
Chapter 12: Laying Out a Report
2. In the Properties pane, double-click the Margin property.
3. Specify the top, bottom, left, and right margins by typing values in the corresponding boxes
and choosing the unit of measure.
Note: Specifying margins using % as the unit of measure is not supported when producing
reports in PDF.
Add Multiple Items to a Single ColumnYou can add multiple items to a single column to condense a report. For example, you have a list
report that contains many columns. You can reduce the number of columns in the list by putting
related information in a single column.
Steps
1. From the Structure menu, click Lock Page Objects to unlock the report.
2. In the Insertable Objects pane, drag the items to the column.
For example, you can add data items from the Source tab or text items from the Toolbox
tab .
Example - Create a Report with Multiple Items in One ColumnYou are a report author at The Great Outdoors Company, which sells sporting equipment. You
are requested to create a list report showing the name, position, email address, phone number,
extension, and fax number for each sales representative in each city organized by country. To reduce
the number of columns in the list, you show email addresses, phone numbers, extensions, and fax
numbers in a single column.
Steps to Create a List Report
1. Open Report Studio with the GO Data Warehouse (query) package.
2. In the Welcome dialog box, click Create a new report or template.
3. In the New dialog box, click List and click OK.
4. In the Insertable Objects pane, on the Source tab , expand HR (query), Employee summary
(query), and Employee by region. Add the following data items to the list by double-clicking
them:
● Country
● City
● Employee name
● Position name
420 Report Studio
Chapter 12: Laying Out a Report
● Work phone
● Extension
● Fax
5. Click the Country column and, from the Structure menu, click Section .
6. From the Structure menu, ensure that the report is unlocked
7. Click Country and, in the Properties pane, double-click the Font property.
8. Change the font to Arial Black, 11 pt, and Bold, and then click OK.
Steps to Combine Items in One Column
1. In the Insertable Objects pane, on the Toolbox tab , drag Table to the right of the Work
phone text item in the first row of Work phone column and create a table that has one column
and three rows.
2. Drag the following data items to the table:
● Email to the first row
● Work phone to the second row
● Fax to the third row
3. Drag Extension to the right of Work phone in the table.
4. In the Insertable Objects pane, on the Toolbox tab, drag Text Item to the left of each item in
the table and type the following for each item, putting a blank space before and after the text:
● Email:
● Work phone:
● ext:
● Fax:
5. Ctrl+click the Extension, Email, and Fax column titles and click the delete button .
6. Click the Work phone column title.
7. In the Properties pane, click the Source Type property and click Text.
8. Double-click the Text property.
9. Type the following and click OK:
Contact Information
10. Select the Work phone data item in the first row of the list above the table and click the delete
button.
Professional Authoring User Guide 421
Chapter 12: Laying Out a Report
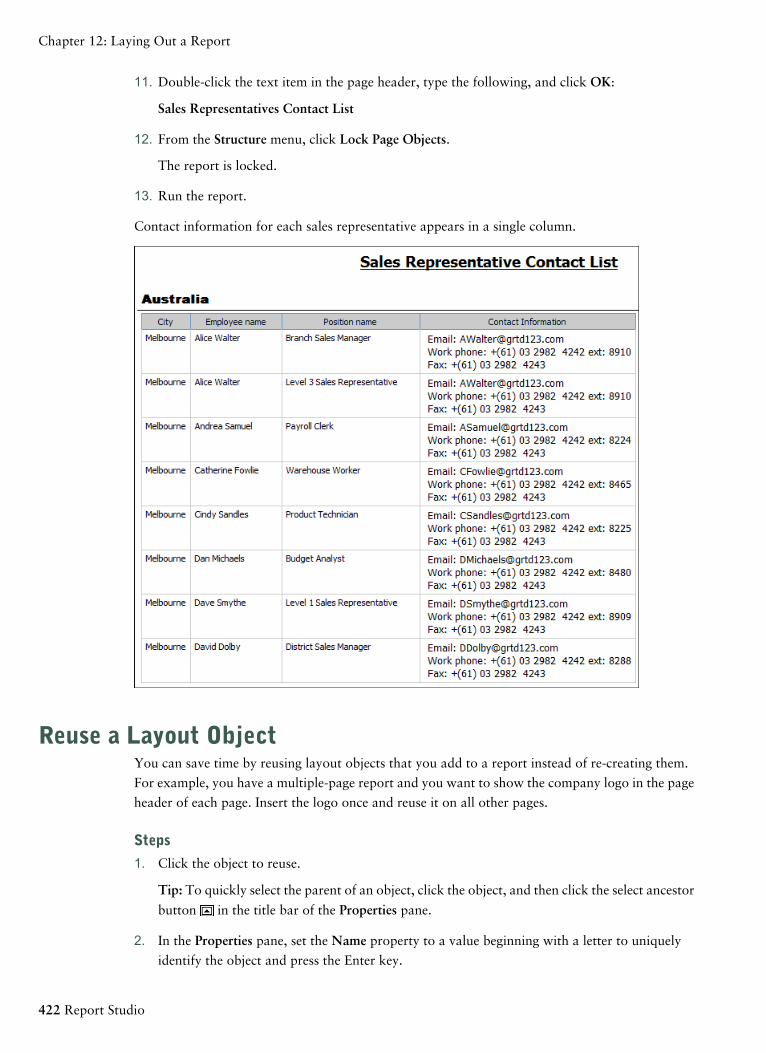
11. Double-click the text item in the page header, type the following, and click OK:
Sales Representatives Contact List
12. From the Structure menu, click Lock Page Objects.
The report is locked.
13. Run the report.
Contact information for each sales representative appears in a single column.
Reuse a Layout ObjectYou can save time by reusing layout objects that you add to a report instead of re-creating them.
For example, you have a multiple-page report and you want to show the company logo in the page
header of each page. Insert the logo once and reuse it on all other pages.
Steps
1. Click the object to reuse.
Tip: To quickly select the parent of an object, click the object, and then click the select ancestor
button in the title bar of the Properties pane.
2. In the Properties pane, set the Name property to a value beginning with a letter to uniquely
identify the object and press the Enter key.
422 Report Studio
Chapter 12: Laying Out a Report
Report Studio may have already specified a name for the object.
3. To reuse the object in another report, open that report.
4. In the Insertable Objects pane, on the Toolbox tab , drag the Layout Component Referenceobject to the location in which it will be reused.
5. In the Component Location box, do one of the following:
● To reference an object in the current report, click This report.
● To reference an object in another report, click Another report, click the ellipsis (...) button,
and open the report.
6. In the Available components to reference box, click the object and click OK.
7. If the referenced object is in another report, click the Layout Component Reference object and
in the Properties pane, set the Embed property to specify how to store the referenced object in
the report:
● Click Copy to store a copy of the object.
The copy is not automatically updated if the source object is modified.
● Click Reference to store a reference, or pointer, of the object.
The reference of the object is automatically updated if the source object is modified. For
example, if you open or run the report, you see the modified object.
A copy or reference of the object appears where you placed the Layout Component Reference object.
If a source object is changed, you can update reused objects.
Tip: You can also create a new report or template and add all the objects to share. All your shared
objects then reside in a single location, like a library.
Change a Reused ObjectIf you reuse an object that contains other objects, you can change the child objects to something
different. For example, you have a block object containing a text item in the page header and you
decide to reuse the block in the page footer. However, you want the text item in the page footer
block to show different text from that in the page header.
Steps
1. In the parent object to reuse, click the child object to change.
2. In the Properties pane, set the Name property to a value beginning with a letter to uniquely
identify the object.
Report Studio may have already specified a name for the object.
3. Select the copy of the parent object you created with the Layout Component Reference object.
4. In the Properties pane, double-click the Overrides property.
5. In the Overrides dialog box, select the child object to change and click OK.
Professional Authoring User Guide 423
Chapter 12: Laying Out a Report
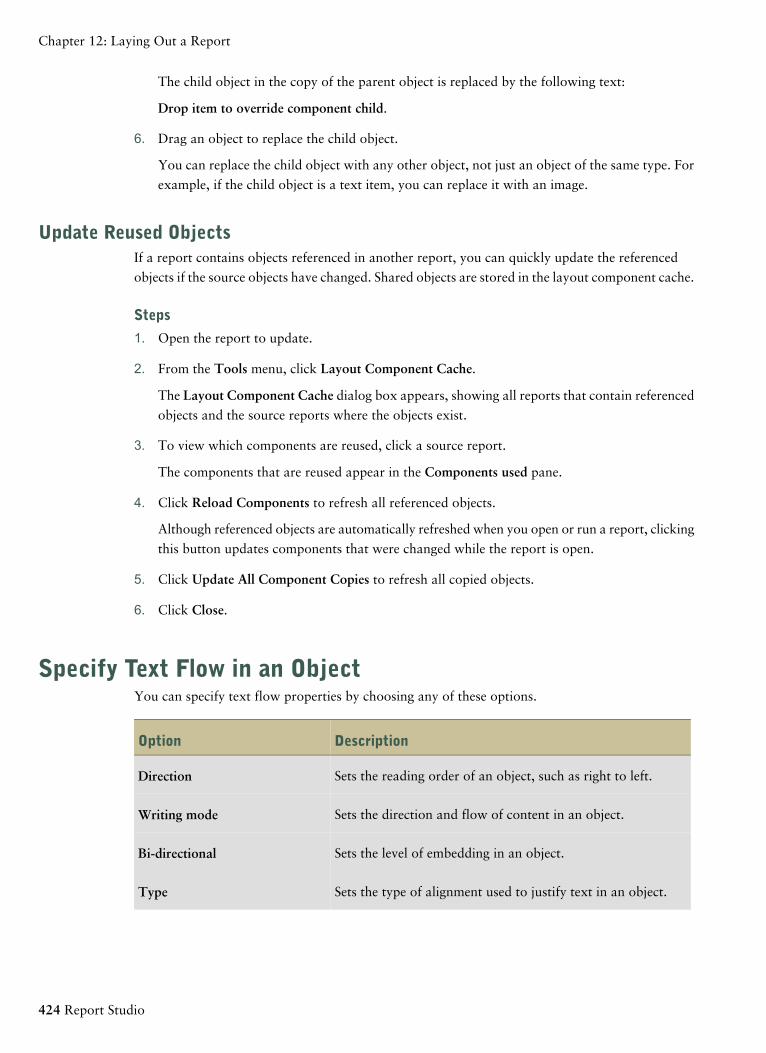
The child object in the copy of the parent object is replaced by the following text:
Drop item to override component child.
6. Drag an object to replace the child object.
You can replace the child object with any other object, not just an object of the same type. For
example, if the child object is a text item, you can replace it with an image.
Update Reused ObjectsIf a report contains objects referenced in another report, you can quickly update the referenced
objects if the source objects have changed. Shared objects are stored in the layout component cache.
Steps
1. Open the report to update.
2. From the Tools menu, click Layout Component Cache.
The Layout Component Cache dialog box appears, showing all reports that contain referenced
objects and the source reports where the objects exist.
3. To view which components are reused, click a source report.
The components that are reused appear in the Components used pane.
4. Click Reload Components to refresh all referenced objects.
Although referenced objects are automatically refreshed when you open or run a report, clicking
this button updates components that were changed while the report is open.
5. Click Update All Component Copies to refresh all copied objects.
6. Click Close.
Specify Text Flow in an ObjectYou can specify text flow properties by choosing any of these options.
DescriptionOption
Sets the reading order of an object, such as right to left.Direction
Sets the direction and flow of content in an object.Writing mode
Sets the level of embedding in an object.Bi-directional
Sets the type of alignment used to justify text in an object.Type
424 Report Studio
Chapter 12: Laying Out a Report
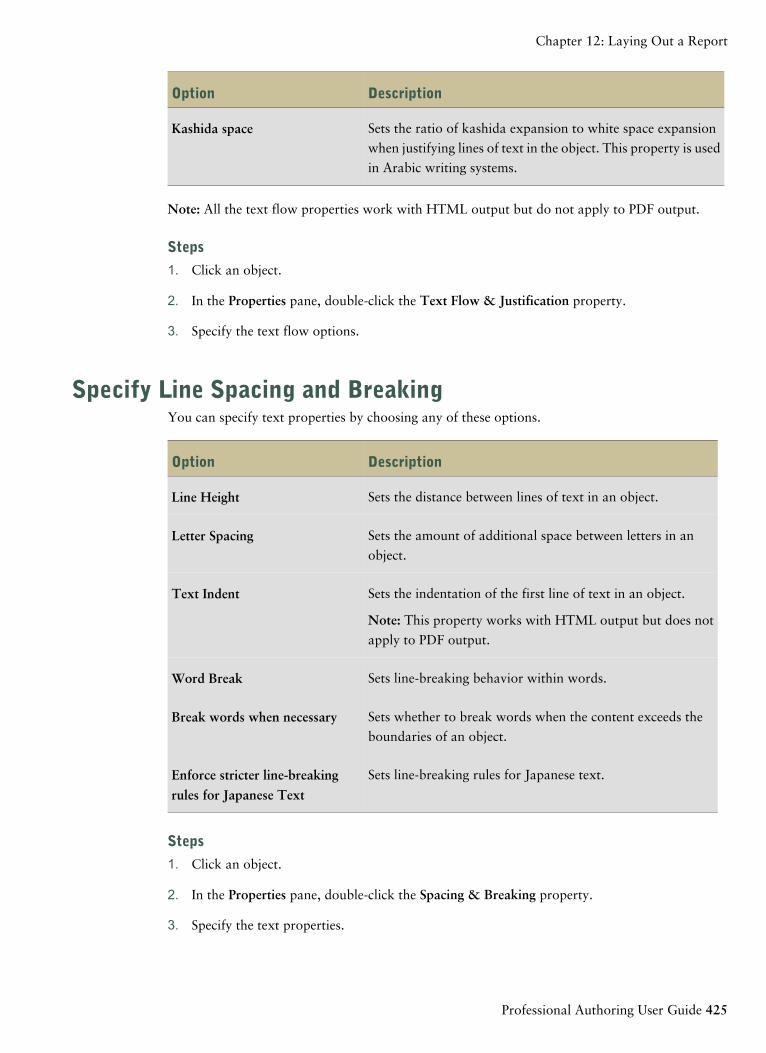
DescriptionOption
Sets the ratio of kashida expansion to white space expansion
when justifying lines of text in the object. This property is used
in Arabic writing systems.
Kashida space
Note: All the text flow properties work with HTML output but do not apply to PDF output.
Steps
1. Click an object.
2. In the Properties pane, double-click the Text Flow & Justification property.
3. Specify the text flow options.
Specify Line Spacing and BreakingYou can specify text properties by choosing any of these options.
DescriptionOption
Sets the distance between lines of text in an object.Line Height
Sets the amount of additional space between letters in an
object.Letter Spacing
Sets the indentation of the first line of text in an object.Text Indent
Note: This property works with HTML output but does not
apply to PDF output.
Sets line-breaking behavior within words.Word Break
Sets whether to break words when the content exceeds the
boundaries of an object.Break words when necessary
Sets line-breaking rules for Japanese text.Enforce stricter line-breaking
rules for Japanese Text
Steps
1. Click an object.
2. In the Properties pane, double-click the Spacing & Breaking property.
3. Specify the text properties.
Professional Authoring User Guide 425
Chapter 12: Laying Out a Report
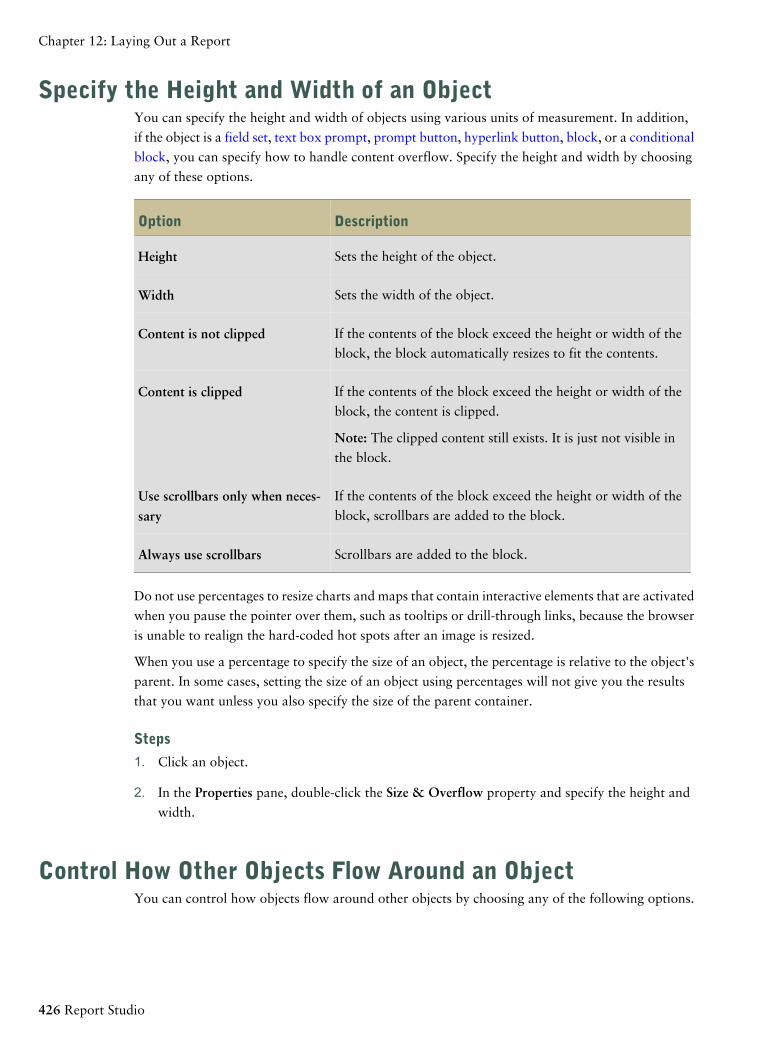
Specify the Height and Width of an ObjectYou can specify the height and width of objects using various units of measurement. In addition,
if the object is a field set, text box prompt, prompt button, hyperlink button, block, or a conditional
block, you can specify how to handle content overflow. Specify the height and width by choosing
any of these options.
DescriptionOption
Sets the height of the object.Height
Sets the width of the object.Width
If the contents of the block exceed the height or width of the
block, the block automatically resizes to fit the contents.Content is not clipped
If the contents of the block exceed the height or width of the
block, the content is clipped.Content is clipped
Note: The clipped content still exists. It is just not visible in
the block.
If the contents of the block exceed the height or width of the
block, scrollbars are added to the block.Use scrollbars only when neces-
sary
Scrollbars are added to the block.Always use scrollbars
Do not use percentages to resize charts and maps that contain interactive elements that are activated
when you pause the pointer over them, such as tooltips or drill-through links, because the browser
is unable to realign the hard-coded hot spots after an image is resized.
When you use a percentage to specify the size of an object, the percentage is relative to the object's
parent. In some cases, setting the size of an object using percentages will not give you the results
that you want unless you also specify the size of the parent container.
Steps
1. Click an object.
2. In the Properties pane, double-click the Size & Overflow property and specify the height and
width.
Control How Other Objects Flow Around an ObjectYou can control how objects flow around other objects by choosing any of the following options.
426 Report Studio
Chapter 12: Laying Out a Report
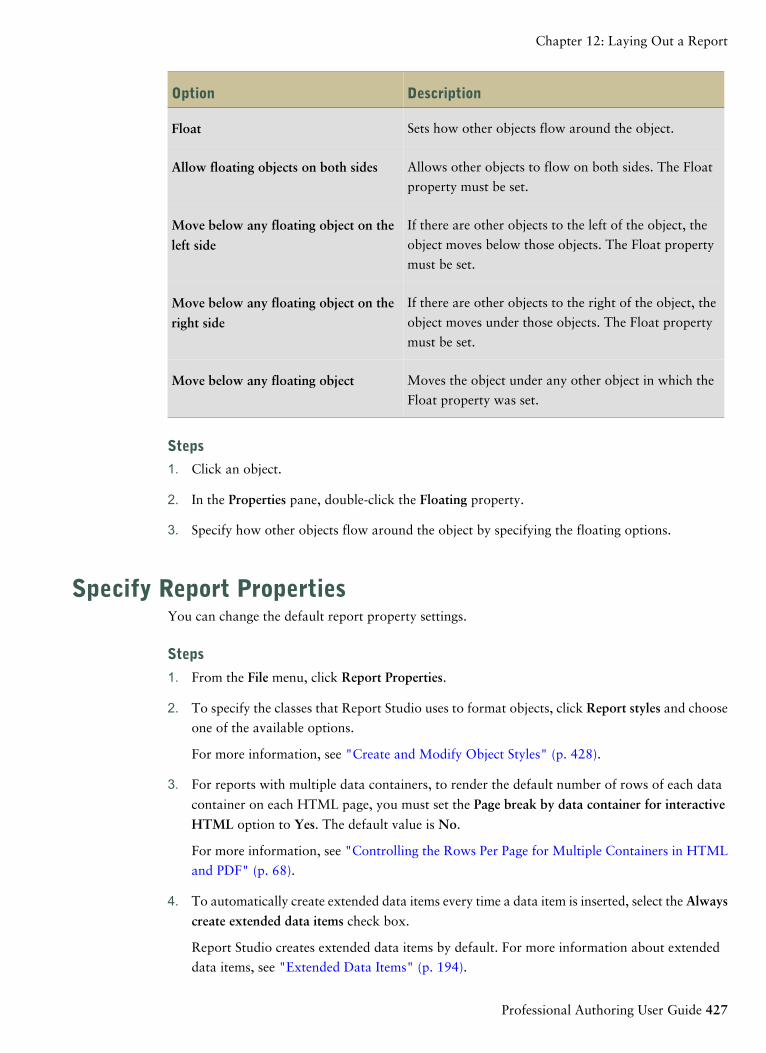
DescriptionOption
Sets how other objects flow around the object.Float
Allows other objects to flow on both sides. The Float
property must be set.Allow floating objects on both sides
If there are other objects to the left of the object, the
object moves below those objects. The Float property
must be set.
Move below any floating object on the
left side
If there are other objects to the right of the object, the
object moves under those objects. The Float property
must be set.
Move below any floating object on the
right side
Moves the object under any other object in which the
Float property was set.Move below any floating object
Steps
1. Click an object.
2. In the Properties pane, double-click the Floating property.
3. Specify how other objects flow around the object by specifying the floating options.
Specify Report PropertiesYou can change the default report property settings.
Steps
1. From the File menu, click Report Properties.
2. To specify the classes that Report Studio uses to format objects, click Report styles and choose
one of the available options.
For more information, see "Create and Modify Object Styles" (p. 428).
3. For reports with multiple data containers, to render the default number of rows of each data
container on each HTML page, you must set the Page break by data container for interactive
HTML option to Yes. The default value is No.
For more information, see "Controlling the Rows Per Page for Multiple Containers in HTML
and PDF" (p. 68).
4. To automatically create extended data items every time a data item is inserted, select the Always
create extended data items check box.
Report Studio creates extended data items by default. For more information about extended
data items, see "Extended Data Items" (p. 194).
Professional Authoring User Guide 427
Chapter 12: Laying Out a Report
5. To create a single, scrollable HTML page when you run and save this report as HTML from
IBM Cognos Connection, clear the Paginate saved HTML output check box.
The default is to paginate HTML reports with the same page breaks as PDF reports. The single,
scrollable HTML page will be available from IBM Cognos Connection when you click the view
output versions for this report button .
6. If you are working with reports created in IBM Cognos ReportNet and you want to create CSV
report output, click Use 1.x CSV export.
This option ensures that all the query columns are exported. In IBM Cognos ReportNet, if a
data item was referenced using the Properties property of a list, it was included in the CSV
output. In IBM Cognos 8, the default is to export only the columns in the list.
Create and Modify Object StylesCreate your own classes or modify existing classes in a report to format objects across a report
according to your particular needs. In Report Studio, objects in reports are assigned a Cascading
Style Sheet (CSS) class that provides a default style for the object. For example, when you create a
new report, the report title has the class property Report title text assigned to it. In addition, objects
inherit the classes set on their parent objects.
You can use classes to highlight data using conditional styles (p. 431).
Classes you create or modify can be applied only to the current report. To create or modify classes
for all reports, you must modify a layout style sheet. In addition, some classes can be used to format
Query Studio reports.
Steps
1. From the File menu, click Report Properties.
2. Click Report styles and select one of the following options:
● To work with classes in the default style sheet, click Default styles.
● To work with classes that were used in IBM Cognos ReportNet, click Use 1.x report styles.
Use 1.x report styles when you are working with reports created in ReportNet and you
want to preserve their original appearance.
● To work with classes that have minimal styling defined, click Simplified styles.
This option is useful when creating financial reports.
3. Pause the pointer over the page explorer button and click Classes.
4. To create a new class, in the Insertable Objects pane, drag Class to the Local Classes pane.
5. To modify an existing class, in the Local Classes or Global Class Extensions pane, click the
class.
Modify a global class to apply a change to all objects that use that class. For example, if you
modified the style List column title cell, all column titles in lists will reflect your modifications.
428 Report Studio
Chapter 12: Laying Out a Report
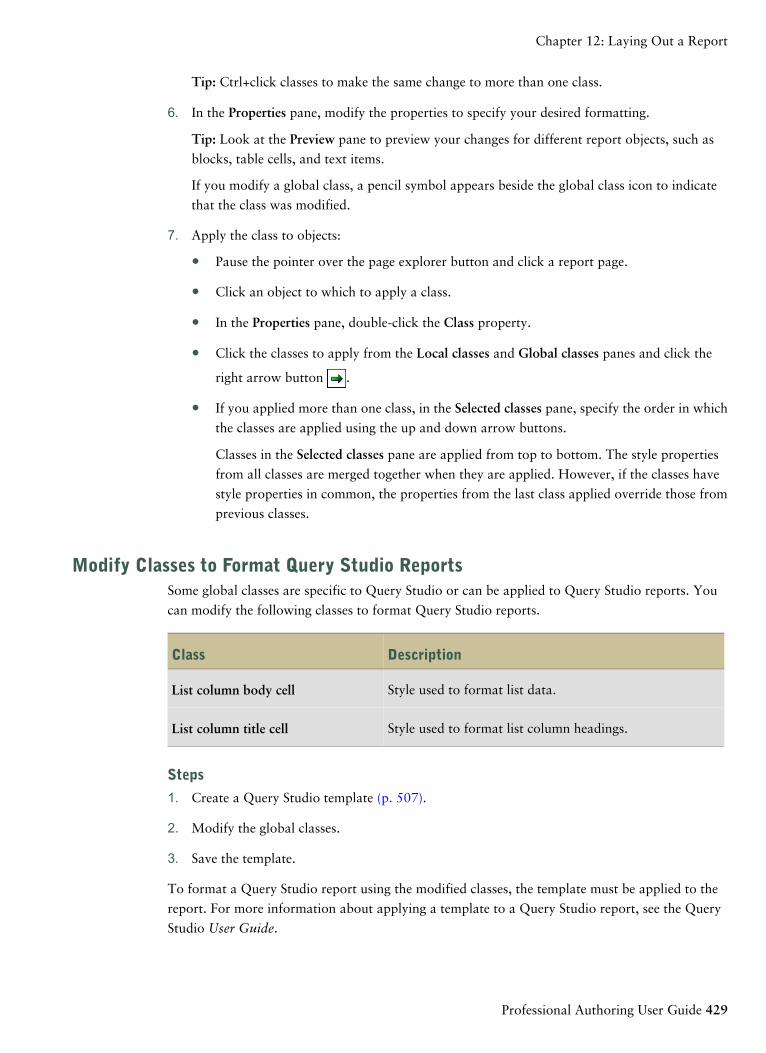
Tip: Ctrl+click classes to make the same change to more than one class.
6. In the Properties pane, modify the properties to specify your desired formatting.
Tip: Look at the Preview pane to preview your changes for different report objects, such as
blocks, table cells, and text items.
If you modify a global class, a pencil symbol appears beside the global class icon to indicate
that the class was modified.
7. Apply the class to objects:
● Pause the pointer over the page explorer button and click a report page.
● Click an object to which to apply a class.
● In the Properties pane, double-click the Class property.
● Click the classes to apply from the Local classes and Global classes panes and click the
right arrow button .
● If you applied more than one class, in the Selected classes pane, specify the order in which
the classes are applied using the up and down arrow buttons.
Classes in the Selected classes pane are applied from top to bottom. The style properties
from all classes are merged together when they are applied. However, if the classes have
style properties in common, the properties from the last class applied override those from
previous classes.
Modify Classes to Format Query Studio ReportsSome global classes are specific to Query Studio or can be applied to Query Studio reports. You
can modify the following classes to format Query Studio reports.
DescriptionClass
Style used to format list data.List column body cell
Style used to format list column headings.List column title cell
Steps
1. Create a Query Studio template (p. 507).
2. Modify the global classes.
3. Save the template.
To format a Query Studio report using the modified classes, the template must be applied to the
report. For more information about applying a template to a Query Studio report, see the Query
Studio User Guide.
Professional Authoring User Guide 429
Chapter 12: Laying Out a Report
Modifying the Default Layout Style SheetIn addition to creating or modifying classes in a report, you can create and modify classes that will
apply to all reports. Default styles are stored in a style sheet named GlobalReportStyles.css. For
information about modifying the style sheet, see the Administration and Security Guide.
Add Color to an ObjectYou can add background and foreground color to objects in the report. The foreground color
applies to the text within objects.
Tip: The TOC Report sample report (p. 539) in the GO Data Warehouse (query) package includes
objects with color. For more information about The Great Outdoors Company samples, see "Sample
Reports and Packages" (p. 521).
Steps
1. Select the object.
Tip: To quickly select the parent of an object, click the object, and then click the select ancestor
button in the title bar of the Properties pane.
2. Do one of the following:
● Click the background color button or the foreground color button .
● In the Properties pane, double-click the Background Color or Foreground Color property.
3. To apply an existing color, click the Named Colors tab or Web Safe Colors tab and choose
one of the available colors.
Use a named color to select a color from a small set of colors. Use Web safe colors to select
from 216 available colors.
4. To apply a custom color, click the Custom Color tab and type values in the Red, Green, and
Blue boxes.
The values must be hexadecimal.
430 Report Studio
Chapter 12: Laying Out a Report
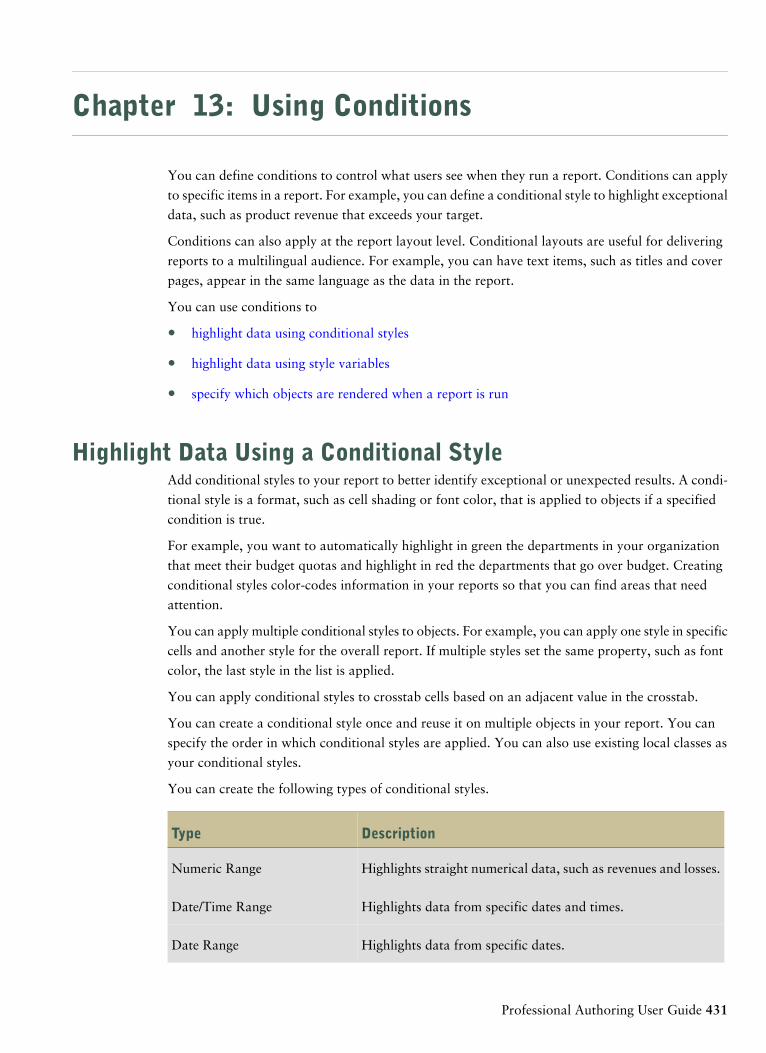
Chapter 13: Using Conditions
You can define conditions to control what users see when they run a report. Conditions can apply
to specific items in a report. For example, you can define a conditional style to highlight exceptional
data, such as product revenue that exceeds your target.
Conditions can also apply at the report layout level. Conditional layouts are useful for delivering
reports to a multilingual audience. For example, you can have text items, such as titles and cover
pages, appear in the same language as the data in the report.
You can use conditions to
● highlight data using conditional styles
● highlight data using style variables
● specify which objects are rendered when a report is run
Highlight Data Using a Conditional StyleAdd conditional styles to your report to better identify exceptional or unexpected results. A condi-
tional style is a format, such as cell shading or font color, that is applied to objects if a specified
condition is true.
For example, you want to automatically highlight in green the departments in your organization
that meet their budget quotas and highlight in red the departments that go over budget. Creating
conditional styles color-codes information in your reports so that you can find areas that need
attention.
You can apply multiple conditional styles to objects. For example, you can apply one style in specific
cells and another style for the overall report. If multiple styles set the same property, such as font
color, the last style in the list is applied.
You can apply conditional styles to crosstab cells based on an adjacent value in the crosstab.
You can create a conditional style once and reuse it on multiple objects in your report. You can
specify the order in which conditional styles are applied. You can also use existing local classes as
your conditional styles.
You can create the following types of conditional styles.
DescriptionType
Highlights straight numerical data, such as revenues and losses.Numeric Range
Highlights data from specific dates and times.Date/Time Range
Highlights data from specific dates.Date Range
Professional Authoring User Guide 431
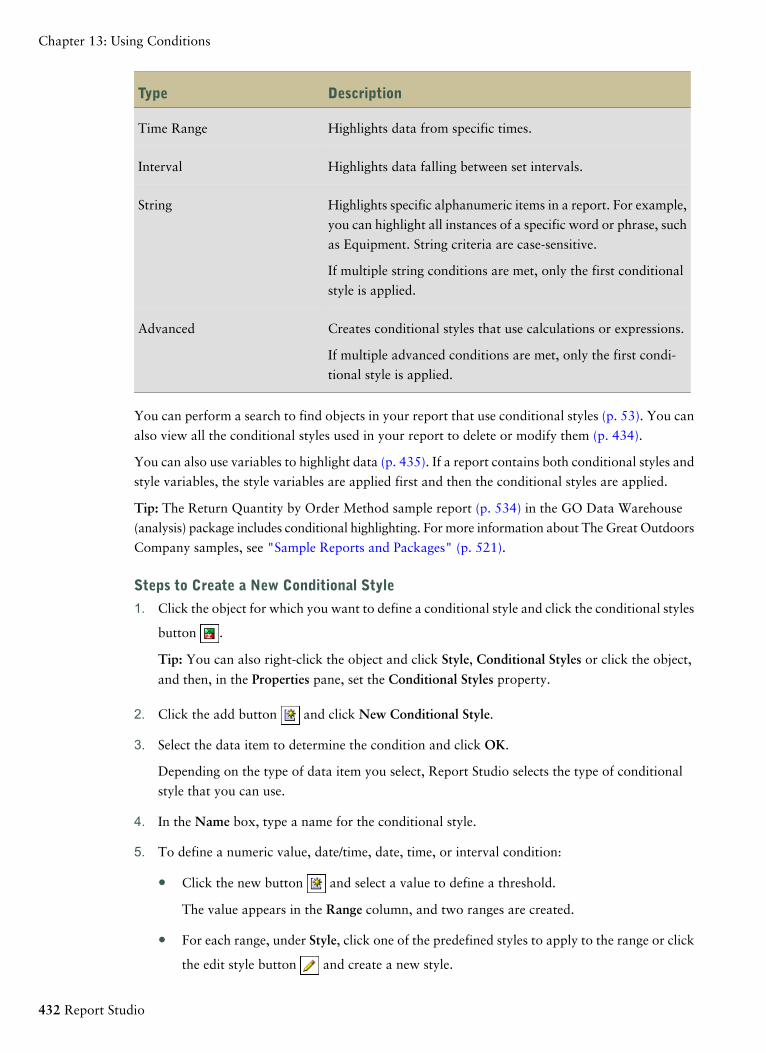
DescriptionType
Highlights data from specific times.Time Range
Highlights data falling between set intervals.Interval
Highlights specific alphanumeric items in a report. For example,
you can highlight all instances of a specific word or phrase, such
as Equipment. String criteria are case-sensitive.
String
If multiple string conditions are met, only the first conditional
style is applied.
Creates conditional styles that use calculations or expressions.Advanced
If multiple advanced conditions are met, only the first condi-
tional style is applied.
You can perform a search to find objects in your report that use conditional styles (p. 53). You can
also view all the conditional styles used in your report to delete or modify them (p. 434).
You can also use variables to highlight data (p. 435). If a report contains both conditional styles and
style variables, the style variables are applied first and then the conditional styles are applied.
Tip: The Return Quantity by Order Method sample report (p. 534) in the GO Data Warehouse
(analysis) package includes conditional highlighting. For more information about The Great Outdoors
Company samples, see "Sample Reports and Packages" (p. 521).
Steps to Create a New Conditional Style
1. Click the object for which you want to define a conditional style and click the conditional styles
button .
Tip: You can also right-click the object and click Style, Conditional Styles or click the object,
and then, in the Properties pane, set the Conditional Styles property.
2. Click the add button and click New Conditional Style.
3. Select the data item to determine the condition and click OK.
Depending on the type of data item you select, Report Studio selects the type of conditional
style that you can use.
4. In the Name box, type a name for the conditional style.
5. To define a numeric value, date/time, date, time, or interval condition:
● Click the new button and select a value to define a threshold.
The value appears in the Range column, and two ranges are created.
● For each range, under Style, click one of the predefined styles to apply to the range or click
the edit style button and create a new style.
432 Report Studio
Chapter 13: Using Conditions
Tip: You can also define a style for the cells in your report that have missing values.
● Repeat the steps above to add other conditions.
Tip: Under Style, pause the pointer over each range to see the condition produced for
that range.
● To move a value above or below a threshold, click the arrow button next to the value.
For example, you insert a threshold value of five million. By default, the ranges are less
than or equal to five million and greater than file million. Moving the five million value
above the threshold changes the ranges to less than five million and greater than or equal
to five million.
6. To define a string condition:
● Click the new button and select how to define the condition.
● To select more than one individual value, click Select Multiple Values and click the values.
● To type specific values, click Enter Values and type the values.
● To specify your own criteria, such as values that begin with the letter A, click Enter String
Criteria and specify the condition.
● For each condition, under Style, click one of the predefined styles to apply or click the edit
style button and create a new style. Specify the style to apply to remaining values by clicking
one of the predefined styles beside Remaining values (including future values).
● Specify the order in which to evaluate the conditions.
Conditions are evaluated from top to bottom, and the first condition that is met is applied.
7. To apply a conditional style to a crosstab cell based on an adjacent value in the crosstab:
● Click the new button, select Variance, and click OK.
● Name the new conditional style and click the add button.
● Type a value to define a threshold.
The value appears under the Range column, and two ranges are created.
● For each range, under Style, click one of the predefined styles to apply to the range or click
the edit style button and create a new style.
Steps to Reuse an Existing Conditional Style
1. Click the data item for which you want to define a conditional style, and then click the condi-
tional styles button .
Tip: You can also right-click the data item and click Style, Conditional Styles or click the data
item, and then, in the Properties pane, set the Conditional Styles property.
Professional Authoring User Guide 433
Chapter 13: Using Conditions
2. Click the add button , click Use Existing Conditional Style, and select the style.
Steps to Create an Advanced Conditional Style
1. Click the data item for which you want to define a conditional style, and then click the condi-
tional styles button .
Tip: You can also right-click the data item and click Style, Conditional Styles or click the data
item, and then, in the Properties pane, set the Conditional Styles property.
2. Click the add button and click Advanced Conditional Style.
3. Type a name for the conditional style.
4. Click the new button and specify the expression that defines the condition.
5. For each condition, under Style, click one of the predefined styles to apply or click the edit style
button and create a new style. Specify the style to apply to remaining values by clicking
one of the predefined styles beside Remaining values (including future values).
6. Specify the order in which to evaluate the conditions by clicking a condition and then clicking
the move up or move down arrow.
Conditions are evaluated from top to bottom, and the first condition that is met is applied.
Manage Conditional StylesYou can view, modify, or delete the conditional styles that are applied to your report. You can also
define a new conditional style.
In the Report Studio options, you can specify whether to automatically delete conditional styles
that are no longer used in a report (p. 53).
Step
● From the Tools menu, click Manage Conditional Styles.
Example - Add a Conditional Style to an Existing ReportYou are a report writer at The Great Outdoors Company, which sells sporting equipment. You
have a report that compares current year data to previous year data and highlights negative percent-
age variances in red (Poor) and positive percentage variances in green (Excellent). You want to add
a third conditional style to indicate percentage variances above 0 but less than 10. You create a
conditional style that highlights percentage variances between 0 and 10% in yellow (Average).
Steps
1. Open the GO Balance Sheet as at Dec 31 2006 report from the GO Data Warehouse (analysis)package.
2. Right-click any cell in the % Variance column and click Style, Conditional Styles.
3. Select Conditional Style 1 and click the edit button .
434 Report Studio
Chapter 13: Using Conditions
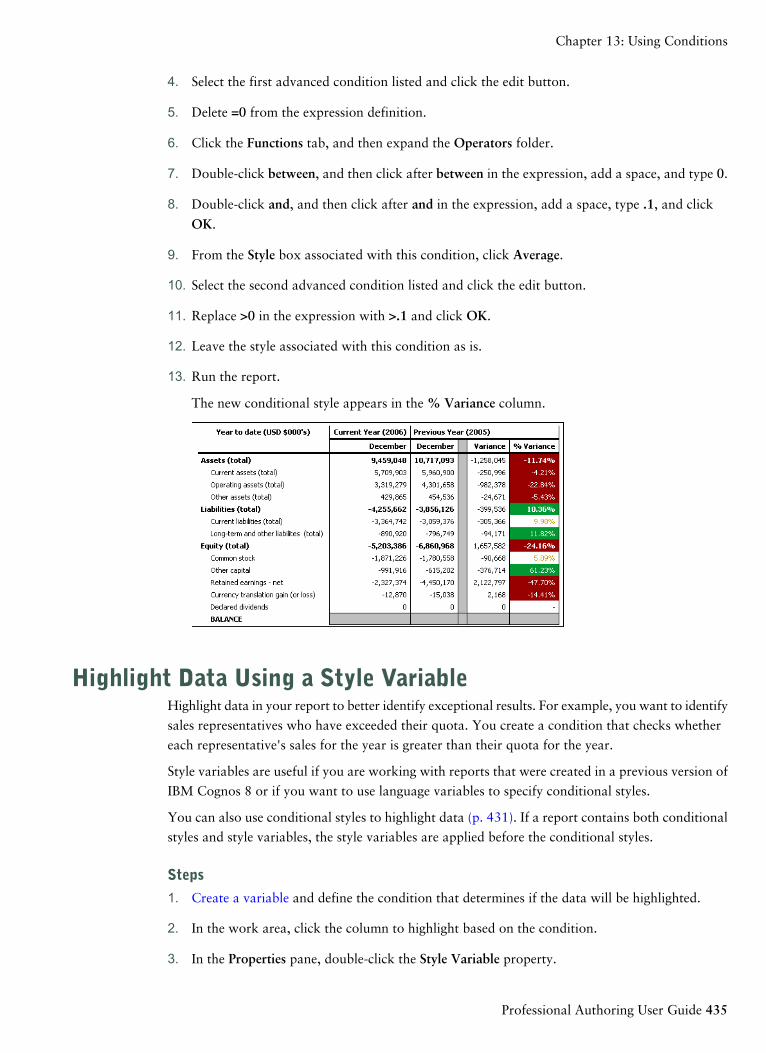
4. Select the first advanced condition listed and click the edit button.
5. Delete =0 from the expression definition.
6. Click the Functions tab, and then expand the Operators folder.
7. Double-click between, and then click after between in the expression, add a space, and type 0.
8. Double-click and, and then click after and in the expression, add a space, type .1, and click
OK.
9. From the Style box associated with this condition, click Average.
10. Select the second advanced condition listed and click the edit button.
11. Replace >0 in the expression with >.1 and click OK.
12. Leave the style associated with this condition as is.
13. Run the report.
The new conditional style appears in the % Variance column.
Highlight Data Using a Style VariableHighlight data in your report to better identify exceptional results. For example, you want to identify
sales representatives who have exceeded their quota. You create a condition that checks whether
each representative's sales for the year is greater than their quota for the year.
Style variables are useful if you are working with reports that were created in a previous version of
IBM Cognos 8 or if you want to use language variables to specify conditional styles.
You can also use conditional styles to highlight data (p. 431). If a report contains both conditional
styles and style variables, the style variables are applied before the conditional styles.
Steps
1. Create a variable and define the condition that determines if the data will be highlighted.
2. In the work area, click the column to highlight based on the condition.
3. In the Properties pane, double-click the Style Variable property.
Professional Authoring User Guide 435
Chapter 13: Using Conditions
4. Click Variable, click the variable to assign to the object, and click OK.
5. If you assigned a string variable, in the Values box, select the values for the condition to support.
Tip: A default value exists for the variable, and it is always selected.
6. If you assigned a language variable, in the Values box, select the languages for the condition
to support.
Tip: A default value exists for the variable, and it is always selected.
7. Click OK.
8. Pause the pointer over the condition explorer button and click a value other than the default
value.
Tip: When you select a value in the condition explorer, the Explorer bar becomes green to
indicate that conditional formatting is turned on and that any changes you make to the report
apply only to the variable value.
For example, if you created a boolean variable, click Yes.
9. In the Properties pane, specify the formatting with which to highlight the column when the
condition is satisfied.
For example, click the Border property to create a thicker border around the column.
10. Repeat steps 8 to 9 for other possible values defined for the variable.
Tip: To view the report with no variables applied, pause the pointer over the condition explorer
button and click (No variable) or triple-click the Explorer bar.
When you run the report, the report objects to which you applied the variable are highlighted when
the condition is satisfied. For example, if you created a boolean variable, the objects are highlighted
when the condition is met. If the condition is not satisfied for any object, no conditional formatting
is applied.
Adding Conditional Rendering to a ReportYou can specify which objects are rendered when a report is run. You can
● add variables
● hide and show objects
● add conditional rendering
● add multiple layouts
● create multilingual reports
436 Report Studio
Chapter 13: Using Conditions
Add a VariableBefore you can add conditional formatting or conditional rendering to your report, you must add
a variable. You can create a variable in the condition explorer or in the Properties pane.
Steps to Add a Variable from the Condition Explorer
1. Pause the pointer over the condition explorer button and click Variables.
2. In the Insertable Objects pane, drag one of the following variables to the Variables pane:
● To create a variable that has only two possible values, Yes and No, drag Boolean Variable.
● To create a variable whose values are string-based, drag String Variable.
● To create a variable whose values are different languages, drag Report Language Variable.
3. If you created a boolean variable, in the Expression Definition box, define the condition and
click OK.
For example, the following expression returns the value Yes if revenue is less than one million
and the value No if revenue is greater than or equal to one million:
[Revenue]<1000000
For information about creating expressions, see "Using the Expression Editor" (p. 245).
4. If you created a string variable, do the following:
● In the Expression Definition box, define the condition and click OK.
For example, the following expression returns the value high if revenue is greater than one
million and the value low if revenue is less than or equal to one million:
if ([Revenue]>1000000) then ('high') else ('low')
For information about creating expressions, see "Using the Expression Editor" (p. 245).
● Click the add button in the Values pane.
● For each value that the variable can assume, type the name of the value that corresponds
with the possible outcomes defined in the expression.
For example, in the previous expression, you must create two values for the variable, high
and low.
Tip: You can create a group by clicking two or more values and then clicking the group
values button . For example, you can create a group that includes the available French
languages.
5. If you created a language-specific variable, in the Languages dialog box, select the languages
to support.
Steps to Add a Variable from the Properties Pane
1. Select the report object.
Professional Authoring User Guide 437
Chapter 13: Using Conditions
2. In the Properties pane, under Conditional, double-click the conditional property to which to
assign the variable.
The following conditional properties are available:
Conditional PropertyGoal
Text Source VariableSpecify a variable based on which text can be conditionally
shown.
For example, you want different text to appear when a
report is run in a different language.
Render VariableSpecify a variable based on which object can be condition-
ally rendered.
For example, you want to make a revenue report smaller
by not rendering rows that are below a threshold.
Style VariableSpecify a variable based on which object can be condition-
ally styled.
For example, you want data that meets some criterion to
appear in a different color.
Block VariableSpecify a variable based on which objects in a block can
be conditionally rendered. Applies only to conditional
block objects that you insert in a report (p. 413).
3. In the Variable box, click an existing variable or one of the following variable types:
● <New language variable>
● <New string variable>
● <New boolean variable>
4. In the New Variable dialog box, in the Name box, type the name of the variable.
5. If you created a string variable, click the add button , type the string values to define, and
click OK.
6. If you created a language variable, select the languages to support and click OK.
7. In the Expression Definition box, define the condition.
Hide or Show an ObjectYou can hide and show objects in a report based on a condition you define.
You can also specify that an object should not be rendered based on a condition (p. 439).
438 Report Studio
Chapter 13: Using Conditions
Tip: The Global Bonus Report sample report (p. 531) in the GO Data Warehouse (analysis) package
includes hidden objects. For more information about The Great Outdoors Company samples, see
"Sample Reports and Packages" (p. 521).
Steps
1. Create a variable, and define the condition that determines if the object is shown or hidden.
Tip: Create a boolean variable to show and hide objects, as this type of variable has only two
possible values.
2. In the Insertable Objects pane, on the Toolbox tab , drag a Conditional Blocks object to
the work area.
3. Select the conditional block.
4. In the Properties pane, double-click the Block Variable property.
5. In the Variable box, click the variable you created and click OK.
6. Set the Current Block property to Yes.
7. In the Insertable Objects pane, drag the object to show or hide to the conditional block.
For example, drag a data item from the Source tab or from the Data Items tab.
You may need to link the report page to a query (p. 493) before you can add a data item to the
block.
When you run the report, the report objects to which you applied the variable are visible when the
condition is satisfied and invisible when it is not.
Add Conditional RenderingAdd conditional rendering to specify which objects are rendered when a report is run. This is useful
when your report contains sensitive data.
Conditional rendering is not the same as hiding objects. When you hide an object, the object exists
but is transparent. If an object is not rendered, it is not in the report.
For a list of objects that can be rendered conditionally, see the Render Variable property in "Report
Studio Object and Property Reference" (p. 553).
Steps
1. Select the list column to be rendered conditionally.
Tip: You must select the list column, not the list column body or the list column title. If the
body or title is selected, as indicated in the Properties pane, click the select ancestor button
and click the list column.
2. In the Properties pane, double-click the Render Variable property.
3. Click Variable and click the variable that will determine if the column will be rendered.
4. In the Render for box, select the values that the condition will support.
Professional Authoring User Guide 439
Chapter 13: Using Conditions
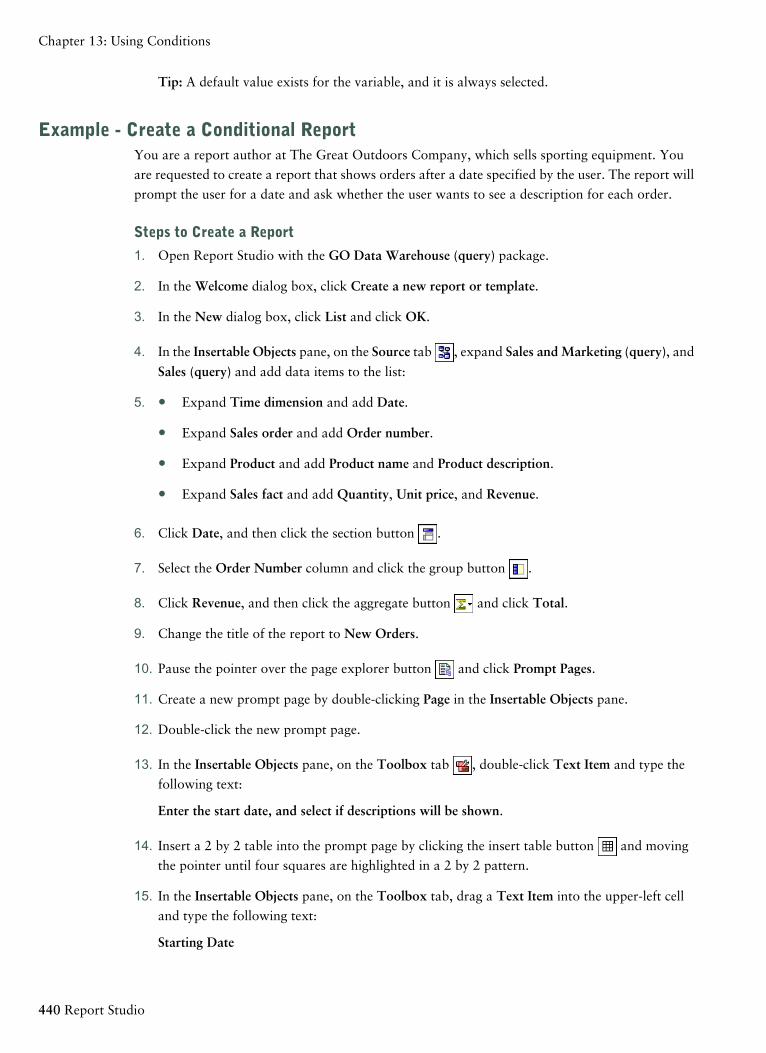
Tip: A default value exists for the variable, and it is always selected.
Example - Create a Conditional ReportYou are a report author at The Great Outdoors Company, which sells sporting equipment. You
are requested to create a report that shows orders after a date specified by the user. The report will
prompt the user for a date and ask whether the user wants to see a description for each order.
Steps to Create a Report
1. Open Report Studio with the GO Data Warehouse (query) package.
2. In the Welcome dialog box, click Create a new report or template.
3. In the New dialog box, click List and click OK.
4. In the Insertable Objects pane, on the Source tab , expand Sales andMarketing (query), and
Sales (query) and add data items to the list:
5. Expand Time dimension and add Date.●
● Expand Sales order and add Order number.
● Expand Product and add Product name and Product description.
● Expand Sales fact and add Quantity, Unit price, and Revenue.
6. Click Date, and then click the section button .
7. Select the Order Number column and click the group button .
8. Click Revenue, and then click the aggregate button and click Total.
9. Change the title of the report to New Orders.
10. Pause the pointer over the page explorer button and click Prompt Pages.
11. Create a new prompt page by double-clicking Page in the Insertable Objects pane.
12. Double-click the new prompt page.
13. In the Insertable Objects pane, on the Toolbox tab , double-click Text Item and type the
following text:
Enter the start date, and select if descriptions will be shown.
14. Insert a 2 by 2 table into the prompt page by clicking the insert table button and moving
the pointer until four squares are highlighted in a 2 by 2 pattern.
15. In the Insertable Objects pane, on the Toolbox tab, drag a Text Item into the upper-left cell
and type the following text:
Starting Date
440 Report Studio
Chapter 13: Using Conditions
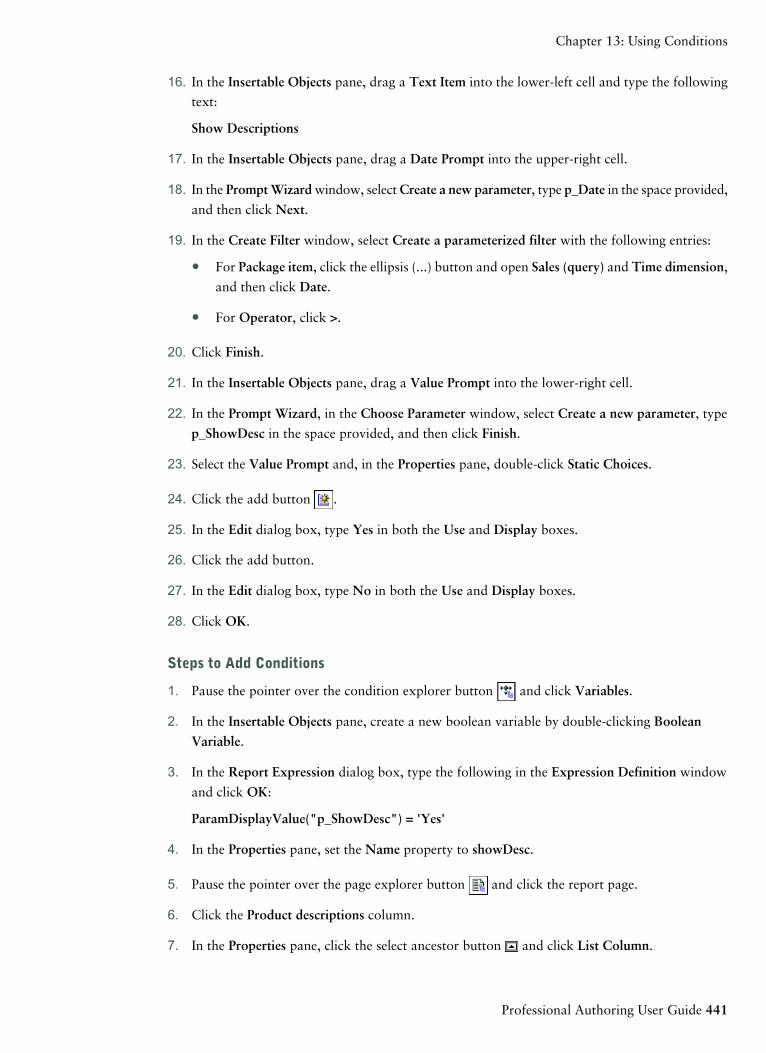
16. In the Insertable Objects pane, drag a Text Item into the lower-left cell and type the following
text:
Show Descriptions
17. In the Insertable Objects pane, drag a Date Prompt into the upper-right cell.
18. In the PromptWizardwindow, selectCreate a new parameter, type p_Date in the space provided,
and then click Next.
19. In the Create Filter window, select Create a parameterized filter with the following entries:
● For Package item, click the ellipsis (...) button and open Sales (query) and Time dimension,
and then click Date.
● For Operator, click >.
20. Click Finish.
21. In the Insertable Objects pane, drag a Value Prompt into the lower-right cell.
22. In the Prompt Wizard, in the Choose Parameter window, select Create a new parameter, type
p_ShowDesc in the space provided, and then click Finish.
23. Select the Value Prompt and, in the Properties pane, double-click Static Choices.
24. Click the add button .
25. In the Edit dialog box, type Yes in both the Use and Display boxes.
26. Click the add button.
27. In the Edit dialog box, type No in both the Use and Display boxes.
28. Click OK.
Steps to Add Conditions
1. Pause the pointer over the condition explorer button and click Variables.
2. In the Insertable Objects pane, create a new boolean variable by double-clicking Boolean
Variable.
3. In the Report Expression dialog box, type the following in the Expression Definition window
and click OK:
ParamDisplayValue("p_ShowDesc") = 'Yes'
4. In the Properties pane, set the Name property to showDesc.
5. Pause the pointer over the page explorer button and click the report page.
6. Click the Product descriptions column.
7. In the Properties pane, click the select ancestor button and click List Column.
Professional Authoring User Guide 441
Chapter 13: Using Conditions
8. In the Properties pane, set the Render Variable property to the showDesc boolean variable you
created.
9. Run the report.
The report prompts you for a date provides orders that occur after the date you entered. The report
also asks whether to show the Descriptions column, and the column is rendered only if you choose
Yes.
Add Multiple LayoutsAdd multiple layouts to show a report in different ways. For example, you can define a different
layout for each language in a multilingual report. This allows you to create a single report that can
be viewed by report consumers that use different regional settings.
Steps
1. Create a variable and define the condition that will be used for each layout.
For example, create a report language variable that includes each language that requires a
conditional layout.
Note: Expressions used in a conditional layout cannot reference a query.
2. From the File menu, click Conditional Layouts.
3. Select a variable, and then select the values that require a separate layout.
A layout is created for each value you selected. Use the page explorer to navigate the different layouts.
For each layout, click Report Pages to create a report page or Prompt Pages to create a prompt
page (p. 391) and add objects.
Tip: You can create new variables from the Conditional Layouts dialog. The variables are added
to the condition explorer. For more information, see "Add a Variable" (p. 437).
Creating Multilingual ReportsYou can create reports that show data in more than one language and use different regional settings.
This means that you can create a single report that can be used by report consumers anywhere in
the world.
The samples databases provided with IBM Cognos 8 store a selection of text fields, such as names
and descriptions, in more than 25 languages to demonstrate a multilingual reporting environment.
For information about how data is stored in the samples databases and how the samples databases
are set up to use multilingual data, see the Administration and Security Guide.
Here is the process for creating a multilingual reporting environment:
❑ Use multilingual metadata.
The data source administrator can store multilingual data in either individual tables, rows, or
columns.
For more information about configuring your database for multilingual reporting, see the
Administration and Security Guide.
442 Report Studio
Chapter 13: Using Conditions
❑ Create a multilingual model.
Modelers use Framework Manager to add multilingual metadata to the model from any data
source type except OLAP. They add multilingual metadata by defining which languages the
model supports, translating text strings in the model for things such as object names and
descriptions, and defining which languages are exported in each package. If the data source
contains multilingual data, modelers can define queries that retrieve data in the default language
for the report user.
For more information, see the Framework Manager User Guide.
❑ Create multilingual maps.
Administrators and modelers use a Windows utility named Map Manager to import maps and
update labels for maps in Report Studio. For map features such as country and city names,
administrators and modelers can define alternative names to provide multilingual versions of
text that appears on the map.
For more information, see the Map Manager Installation and User Guide.
❑ Create a multilingual report.
The report author uses Report Studio to create a report that can be viewed in different languages.
For example, you can specify that text, such as the title, appears in German when the report is
opened by a German user. You can also add translations for text objects, and create other
language-dependent objects.
For more information, see the Report Studio Professional Authoring User Guide.
❑ Specify the language in which a report is viewed.
You can use IBM Cognos Connection to do the following:
● Define multilingual properties, such as a name, screen tip, and description, for each entry
in the portal.
● Specify the default language to be used when a report is run.
Tip: You can specify the default language on the run options page, in the report properties,
or in your preferences.
● Specify a language, other than the default, to be used when a report is run.
For more information, see the IBM Cognos Connection User Guide.
The data then appears in the language and with the regional settings specified in
● the user's Web browser options
● the run options
● the IBM Cognos Connection preferences
Any text that users or authors add appears in the language in which they typed it.
Professional Authoring User Guide 443
Chapter 13: Using Conditions
Create a Multilingual Report in Report StudioYou can create a report in Report Studio that can be viewed in different languages. For example,
you can specify that text such as the title appears in German when the report is opened by a German
user. You can also add translations for text objects and create other language-dependent objects.
If you want the report to show data in different languages, the model must also be multilingual.
Steps
1. Create a report language variable.
2. In the work area, select the object to modify based on a language.
3. In the Properties pane, double-click the Style Variable property.
If you are changing the language of a text string, click Text Source Variable instead.
4. Click Variable and click the language variable you created.
5. In the Values box, select the languages for the condition to support and click OK.
Tip: A default value exists for the variable, and it is always selected.
6. Pause the pointer over the condition explorer button and a language for the variable.
Tip: When you select a value in the condition explorer, the Explorer bar becomes green to
indicate that conditional formatting is turned on and that any changes you make to the report
apply only to the variable value.
7. In the Properties pane, specify the formatting for the language.
For example, to change the language of a text string, double-click the Text property and select
the new string.
8. Press Enter when you are done.
9. Repeat steps 6 to 8 for all other languages specified for the variable.
Tip: To view the report with no variables applied, pause the pointer over the condition explorer
button and click (No variable) or triple-click the Explorer bar.
When you run the report, the report objects to which you applied the variable are formatted
according to the browser's language.
444 Report Studio
Chapter 13: Using Conditions
Chapter 14: Bursting Reports
Burst a report to distribute its contents to various recipients. Bursting is the process of running a
report once and then dividing the results for recipients who each view a subset of the data. For
example, salespeople in different regions each need a report showing the sales target for their
country. You use burst reports to send each salesperson only the information they need. Burst
reports can be distributed by email or saved to a directory for viewing in IBM Cognos Connection.
Tip: The Bursted Sales Performance Report sample report (p. 538) in the GO Data Warehouse
(analysis) package includes bursting. For more information about The Great Outdoors Company
samples, see "Sample Reports and Packages" (p. 521).
To burst a report against a dimensional data source, see "Creating Burst Reports Using Dimensional
Data Sources" (p. 450).
You cannot burst crosstab reports.
For information about avoiding disk space exhaustion when bursting charts or crosstabs, see
"Master Detail or Burst Reports with Charts or Crosstabs May Result in Denial of Service" (p. 223)
To create a burst report, you
❑ define burst recipients
❑ specify burst groups
❑ set burst options
❑ enable bursting
Defining Burst RecipientsDefine the recipients who will receive data when the report is run. You can distribute burst reports
to individual users, groups, roles, distribution lists, and contacts. To define the recipients, you
● create a calculated field in the report
● create a burst table in the data source
Create a Calculated FieldYou can use a calculated field to dynamically create burst report recipients.
Steps
1. Pause the pointer over the query explorer button and click the query that will produce the
data to distribute.
2. In the Insertable Objects pane, on the Toolbox tab , drag Data Item to the Data Items pane.
Professional Authoring User Guide 445
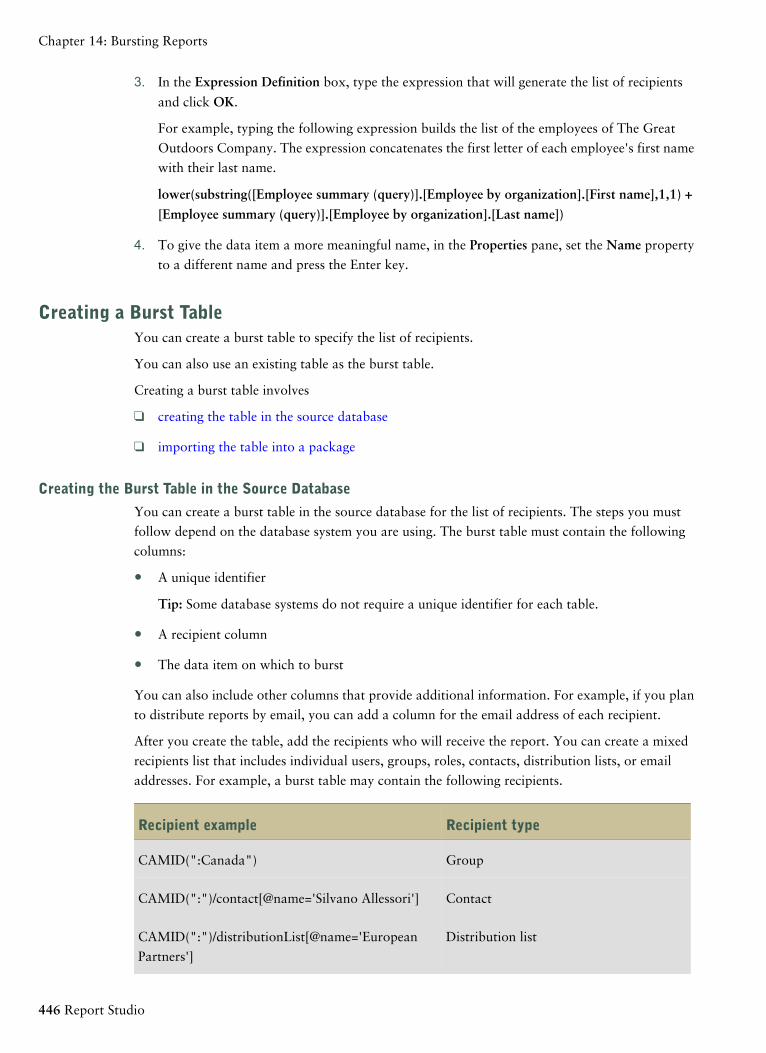
3. In the Expression Definition box, type the expression that will generate the list of recipients
and click OK.
For example, typing the following expression builds the list of the employees of The Great
Outdoors Company. The expression concatenates the first letter of each employee's first name
with their last name.
lower(substring([Employee summary (query)].[Employee by organization].[First name],1,1) +
[Employee summary (query)].[Employee by organization].[Last name])
4. To give the data item a more meaningful name, in the Properties pane, set the Name property
to a different name and press the Enter key.
Creating a Burst TableYou can create a burst table to specify the list of recipients.
You can also use an existing table as the burst table.
Creating a burst table involves
❑ creating the table in the source database
❑ importing the table into a package
Creating the Burst Table in the Source Database
You can create a burst table in the source database for the list of recipients. The steps you must
follow depend on the database system you are using. The burst table must contain the following
columns:
● A unique identifier
Tip: Some database systems do not require a unique identifier for each table.
● A recipient column
● The data item on which to burst
You can also include other columns that provide additional information. For example, if you plan
to distribute reports by email, you can add a column for the email address of each recipient.
After you create the table, add the recipients who will receive the report. You can create a mixed
recipients list that includes individual users, groups, roles, contacts, distribution lists, or email
addresses. For example, a burst table may contain the following recipients.
Recipient typeRecipient example
GroupCAMID(":Canada")
ContactCAMID(":")/contact[@name='Silvano Allessori']
Distribution listCAMID(":")/distributionList[@name='European
Partners']
446 Report Studio
Chapter 14: Bursting Reports
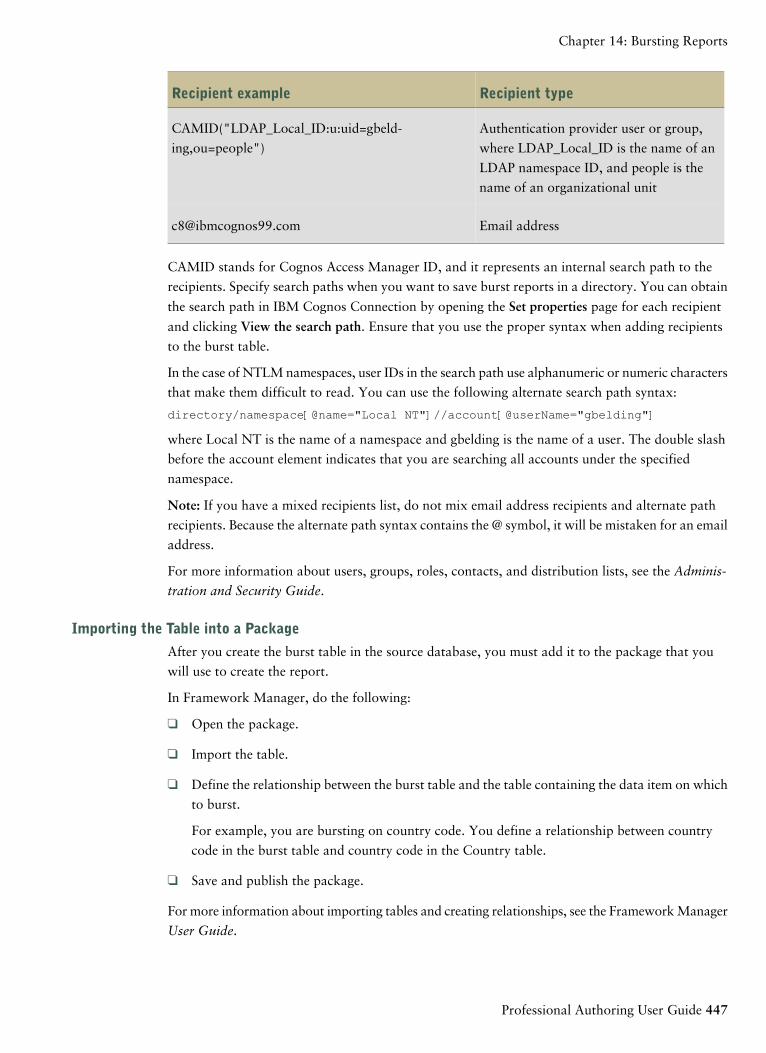
Recipient typeRecipient example
Authentication provider user or group,
where LDAP_Local_ID is the name of an
LDAP namespace ID, and people is the
name of an organizational unit
CAMID("LDAP_Local_ID:u:uid=gbeld-
ing,ou=people")
Email [email protected]
CAMID stands for Cognos Access Manager ID, and it represents an internal search path to the
recipients. Specify search paths when you want to save burst reports in a directory. You can obtain
the search path in IBM Cognos Connection by opening the Set properties page for each recipient
and clicking View the search path. Ensure that you use the proper syntax when adding recipients
to the burst table.
In the case of NTLM namespaces, user IDs in the search path use alphanumeric or numeric characters
that make them difficult to read. You can use the following alternate search path syntax:
directory/namespace[@name="Local NT"]//account[@userName="gbelding"]
where Local NT is the name of a namespace and gbelding is the name of a user. The double slash
before the account element indicates that you are searching all accounts under the specified
namespace.
Note: If you have a mixed recipients list, do not mix email address recipients and alternate path
recipients. Because the alternate path syntax contains the @ symbol, it will be mistaken for an email
address.
For more information about users, groups, roles, contacts, and distribution lists, see the Adminis-
tration and Security Guide.
Importing the Table into a Package
After you create the burst table in the source database, you must add it to the package that you
will use to create the report.
In Framework Manager, do the following:
❑ Open the package.
❑ Import the table.
❑ Define the relationship between the burst table and the table containing the data item on which
to burst.
For example, you are bursting on country code. You define a relationship between country
code in the burst table and country code in the Country table.
❑ Save and publish the package.
For more information about importing tables and creating relationships, see the Framework Manager
User Guide.
Professional Authoring User Guide 447
Chapter 14: Bursting Reports
Specify a Burst GroupSpecify burst groups to set how the report will be distributed. Burst groups are defined by a data
item that you create in the report or that you add from the burst table.
Steps
1. Pause the pointer over the query explorer button and click the query that will produce the
data to distribute.
2. If you are creating a data item, do the following:
● In the Insertable Objects pane, on the Toolbox tab , drag Data Item to the Data Itemspane.
● In the Expression Definition box, type the expression that defines the burst key.
For example, the following expression builds an email address for each sales representative
in The Great Outdoors Company. The expression incorporates the calculated field that
was previously created, which is named userID below, with ibmcognos99.com as the
domain name.
[userID]+'@ibmcognos99.com'
Tip: To give the data item a more meaningful name, in the Properties pane, set the Nameproperty to a different name and press Enter.
3. To specify a burst table column as the data item, do the following:
● In the Insertable Objects pane, on the Source tab , expand the burst table.
● Drag the data item to the Data Items pane.
For example, if you are bursting reports by email, drag the data item containing email
addresses.
Set Burst OptionsSet burst options for the report to indicate the data item on which to burst and the recipients.
Before you set burst options, ensure that the data item on which you intend to burst is in the report
and is grouped. The grouped column will create the appropriate subsets of data. In addition, you
must associate the burst key with this level of grouping.
Steps
1. From the File menu, click Burst Options.
2. Select the Make report available for bursting check box.
3. Under Burst Groups, in the Query box, click the query that contains the data item on which
to burst.
448 Report Studio
Chapter 14: Bursting Reports
Tip: You can choose a query that does not appear in the layout. This is useful to distribute the
same report to all burst recipients.
4. In the Label box, click the data item with which to label each burst report.
5. Click the edit button .
6. In the Data Items box, drag the data item on which to burst to the Groups folder and click OK.
Tip: You can specify the sort order of data within each group by dragging data items to the
Sort List folder and then clicking the sort order button .
7. Under Burst Recipient, in the Query box, click the query that contains the data item to be used
as the distribution list.
8. In the Data Item box, click the data item that contains the recipients.
9. In the Type box, choose the method to burst the report:
● Click Automatic to let IBM Cognos 8 determine from the data item whether to email reports
or send them to a directory.
● Click Email addresses to distribute reports by email.
● Click Directory entries to distribute reports to a directory that recipients can access in IBM
Cognos Connection.
Note: To burst reports to multiple mobile device users, you must choose to distribute
reports to directory entries. You can choose Directory entries, or you can choose Automaticif the data item returns directory entries instead of email addresses. To view the reports,
the recipients must have IBM Cognos 8 Go! Mobile installed on their mobile devices. For
more information about IBM Cognos 8 Go! Mobile, see the IBM Cognos 8 Go! Mobile
Installation and Administration Guide and User Guide.
When recipients log into IBM Cognos 8, they will see only the report that is specific to
them.
10. If the report contains two nested data containers, such as a list and a chart, click the ellipsis
(...) button beside Master detail relationships and define the relationship between the data
containers.
For information about master detail relationships, see "Create a Master Detail Relation-
ship" (p. 221).
Enable BurstingWhen the report is ready to be distributed, enable bursting for the report in IBM Cognos Connection.
Steps
1. Locate the report in IBM Cognos Connection.
2. Under Actions, click the run with options button .
Professional Authoring User Guide 449
Chapter 14: Bursting Reports
3. Click advanced options on the right of the screen.
4. Under Time and mode, click Run in the background.
5. Select the Burst the report check box.
6. If you are distributing reports by email, select the Send the report by email check box.
Tip: If you are bursting the report to a directory, you can also send the report by email if the
Send the report by email check box is selected. Reports will be emailed if the recipient's email
address is stored in the authentication source you are using or if they are entered in the recipient's
personal information in IBM Cognos Connection.
7. If the burst report contains a drill-through link to another report (p. 481) and you are distributing
the burst report by email, do the following:
● Click Edit the options.
● Select the Include a link to the report check box.
If you do not select the check box, the drill-through links in the burst report will not work.
8. Run the report.
Allow a few moments for the report to run. If you are an administrator, you can view all outputs
for the report. Under Actions, click View the output versions for this report. When burst recipients
log into IBM Cognos Connection or access their email accounts, they will see only the data that is
meant for them.
Creating Burst Reports Using Dimensional Data SourcesYou can burst a report using a dimensional data source by using burst information that is stored
in the data source. Because you do not want to append bursting information to existing dimensional
data sources, you can create a relational data source that contains the burst information.
Report bursting is limited when the underlying data source is a cube (MOLAP data source such as
IBM Cognos PowerCube, Microsoft Analysis Services, Hyperion Essbase, or IBM DB2/OLAP). The
burst report must be a grouped report, and the burst is restricted to the outermost grouping in the
report. For example, if you have a report grouped on Country and State, then you can burst the
report only on Country.
To burst a report using a dimensional data source, do the following:
❑ In Framework Manager, include both the dimensional data source that is the basis for reporting
and the relational burst table in the model.
For more information about models, see the Framework Manager User Guide.
❑ In Report Studio, create a master detail report in which the master query drives the report and
the detail query contains the burst information.
You must group the master query on the data item on which you are bursting. This data item
must have a corresponding data item in the relational burst table.
450 Report Studio
Chapter 14: Bursting Reports
Author the detail query against the relational burst table. The burst table must contain two
columns: the data item corresponding to the data item used in the master report for bursting
and the data item that contains the recipient information. The recipient can be an email address
or an expression that results in a search path to an object in Content Manager, such as an
account, group, role, contact, or distribution list.
For more information about master detail queries, see "Create a Master Detail Relation-
ship" (p. 221).
❑ Ensure that the detail query, which must be evaluated by IBM Cognos 8 when the report is
executed, is not visible:
● Place a list that is based on the detail query in a conditional block with a box type of None.
● Link the master and detail queries using the following expression:
[Master Burst Key] = [Detail Burst Key]
When you set the burst options for the report, the master query provides the data items for the
burst key and the detail report provides the data items for the burst recipients.
Example - Burst a ReportYou are a report author at The Great Outdoors Company, which sells sporting equipment. You
are requested to create a report that lists product sales for each sales representative. The report is
to be emailed to each sales representative, but they only need to see the data that pertains to them.
You create a list report that you burst to each sales representative.
Steps
1. Open Report Studio with the GO Data Warehouse (query) package.
2. In the Welcome dialog box, click Create a new report or template.
3. In the New dialog box, click List and click OK.
4. In the Insertable Objects pane, on the Source tab , expand Sales and marketing (query) and
Sales (query). Add the following data items:
● Expand Employee by organization and add Employee name.
● Expand Product and add Product line, Product type, and Product name.
● Expand Sales fact and add Quantity and Revenue.
5. Group the Employee name, Product line, and Product type columns.
6. Click the Employee name column, click the headers and footers button , and then click
Create Header.
Employee name appears as a header in the list. You no longer need to keep the data item as a
list column.
7. In the list, click Employee name and click the delete button .
Professional Authoring User Guide 451
Chapter 14: Bursting Reports
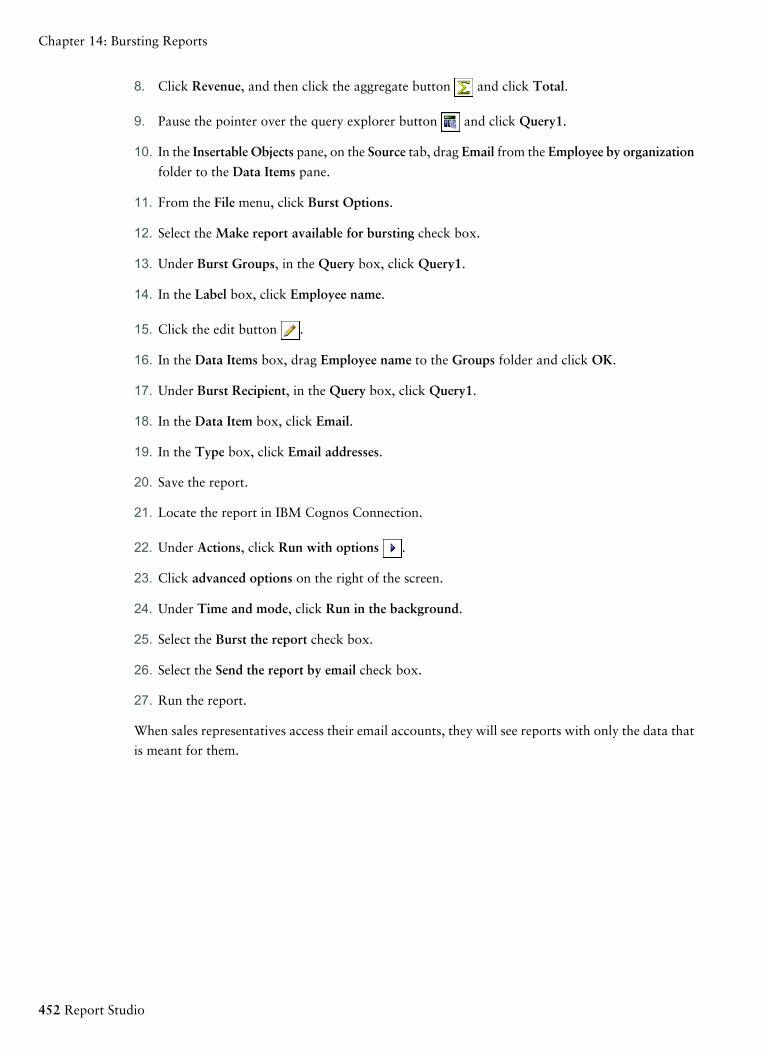
8. Click Revenue, and then click the aggregate button and click Total.
9. Pause the pointer over the query explorer button and click Query1.
10. In the Insertable Objects pane, on the Source tab, drag Email from the Employee by organization
folder to the Data Items pane.
11. From the File menu, click Burst Options.
12. Select the Make report available for bursting check box.
13. Under Burst Groups, in the Query box, click Query1.
14. In the Label box, click Employee name.
15. Click the edit button .
16. In the Data Items box, drag Employee name to the Groups folder and click OK.
17. Under Burst Recipient, in the Query box, click Query1.
18. In the Data Item box, click Email.
19. In the Type box, click Email addresses.
20. Save the report.
21. Locate the report in IBM Cognos Connection.
22. Under Actions, click Run with options .
23. Click advanced options on the right of the screen.
24. Under Time and mode, click Run in the background.
25. Select the Burst the report check box.
26. Select the Send the report by email check box.
27. Run the report.
When sales representatives access their email accounts, they will see reports with only the data that
is meant for them.
452 Report Studio
Chapter 14: Bursting Reports
Chapter 15: Format Data
Format data in a report to improve readability. For example, you can show all date values in the
order year, month, and day. If you do not set Data Format properties here, data is formatted
according to the properties set in the model. If the properties were not set in the model, data is
formatted according to the International Components for Unicode (ICU) formats.
Special cells, such as overflow or underflow, errors, or not applicable values appear with two dash
(--) characters unless you override them.
You can also format data based on a condition (p. 431) or specify the format for a particular object
(p. 454).
Formatting data includes
● setting default data formats
● understanding the data format for numbers
● specify the data format for an object
● understanding locale-sensitive properties
● suppressing empty cells
● specify what appears for data containers that have no data
● use patterns to format data
If you create a calculation that uses mixed currency values, an asterisk character (*) appears as the
unit of measure. To remove the asterisk character, change the format of the corresponding row or
column.
Set the Default Data FormatsSet the default data properties for each type of data, including text, number, currency, percent,
date, time, date/time, and time interval.
Steps
1. From the Data menu, click Default Data Formats.
2. In the Format type box, click a format type.
The properties that you can set for the selected format type appear in the Properties box.
3. If you clicked the Currency format type and require different currencies in the report, click the
add button and select currency check boxes.
For example, you may have one column with values are in euros and another column whose
values are in US dollars.
Professional Authoring User Guide 453
4. Set the properties.
If you added currencies in step 3, click each one and set the properties. If you did not add any
currencies, any properties you set will apply to all currencies.
For properties in which you type meta-characters that represent certain types of information,
such as YYYY-MM-DD for dates, the meta-characters that are required depend on the
authoring language specified for the report. For more information, see "Using Patterns to
Format Data" (p. 458).
If you set a value for the Pattern property, all other formatting properties are ignored with the
following exceptions:
● Missing Value Characters
● Zero Value Characters
● Negative Pattern
Some properties are language-sensitive and should be changed only with caution.
The data formatting properties you set are applied to objects only in the current layout. If a data
item contains values in multiple currencies but only a subset of those currencies have defined formats,
the default format for the locale in which you are working is applied to values with no specified
format.
Specifying the Number of Decimals in NumbersWhen specifying the number of decimals, IBM Cognos 8 uses the IEEE 754 default rounding mode
known as half even. With half even rounding, numbers are rounded toward the nearest truncated
value, unless both truncated values are equidistant, in which case the value ending in an even digit
is chosen, as follows:
● If the digit immediately after the precision to be shown is greater than 5, the number is rounded
up.
● If the digit immediately after the precision to be shown is less than 5, the number is rounded
down.
● If the digit immediately after the precision is a 5, the number is rounded down when the pre-
ceding digit is even and rounded up when the preceding digit is odd.
For example, the number 78.5 is rounded to 78, while the number 73.5 is rounded to 74.
In addition, if the maximum number of decimals is lower than the actual number of decimals in
the number, the number is rounded to the maximum number of decimals.
Specify the Data Format for an ObjectSpecify the format for a particular object if you are not getting the results you want. For example,
you add a measure to a report and you want to see two decimals when you run the report. You set
the number of decimals to two for the Number format type for the current layout. However, when
454 Report Studio
Chapter 15: Format Data
you run the report, you see more than two decimals for the measure. To get the results you want,
you must map the measure to the Number format type.
Steps
1. Click the object.
2. In the Properties pane, double-click the Data Format property.
3. Under Format type, click the format type to apply to the object.
4. To override any of the properties of the format type that were defined for the current layout,
in the Properties box, click the property and specify its value.
Locale-sensitive PropertiesReport Studio contains an extensive library of customized properties adapted to users from different
regions who speak different languages. For example, if a modeler specifies that a given data item
is a currency, only the proper currency symbol must be specified. When reports are created, Report
Studio automatically adapts the format of the currency numbers to each user according to the
content language specified in IBM Cognos Connection.
When modelers or report authors specify properties, these properties override user preferences and
risk creating inconsistent formatting for users of other cultures. It is usually much easier and safer
to let Report Studio take care of formatting. For example, for the date format type, different regions
use different characters to represent the date separator. If you specify a date separator, you may
confuse users in other regions.
The following data formatting properties are locale-sensitive:
● Currency Symbol Position
● Date Separator
● Date Ordering
● Calendar Type
● Time Separator
● Display AM/PM Symbols
● Clock
● Decimal Symbol
● Negative Sign Position
● Thousands Separator
● Group Size (digits)
● Secondary Group Size (digits)
● Missing Value Characters
Professional Authoring User Guide 455
Chapter 15: Format Data
● Zero Value Characters
● Pattern
● Negative Pattern
Suppress Empty CellsSparse data may result in crosstabs showing empty cells. For example, a crosstab that matches
employees with products results in many rows of empty values for the revenue measure if the
employee does not sell those products.
You can suppress rows, columns, or rows and columns based on divide by zero, missing, and
overflow values. Suppressing rows or columns without data gives you a more concise view or your
report.
Calculations are performed before suppression is applied. If you have multiple crosstabs or charts,
you must select one in order to access suppression options.
Within a list report, suppression applies only to rows and is based on non-grouped data items. If
details of a group are null but the header or footer is not null, the group value is not suppressed.
Suppression can also be applied to charts, repeaters, and repeater tables.
Access to the suppression feature depends on the settings in your modeling component, IBM Cognos 8
Transformer, Framework Manager, and IBM Cognos 8 Administration.
Steps
1. From the Data menu, click Suppress and click Suppression Options.
2. Under Suppress, choose what sections to suppress.
3. Under Suppress the following, choose which values to suppress.
Limitations When Formatting Empty Cells in SAP BW Data SourcesWhen working with SAP BW data sources, if the SAP BW server administrator configured custom
formatting for empty cells on the SAP BW server, this custom format does not appear in IBM
Cognos 8 reports. Ask your administrator to configure the formatting of empty cells in IBM
Cognos 8.
Example - Suppress Zeros in Rows and Columns in an Existing ReportYou are a report writer at The Great Outdoors Company, which sells sporting equipment. You
have a report that compares current year data to previous year data. You want to suppress zeros
in the report to make the report more concise. You use the zero suppression tool to set the level of
suppression.
Steps
1. Open the Great Outdoors Company Balance Sheet as at Dec. 31, 2006 report.
456 Report Studio
Chapter 15: Format Data
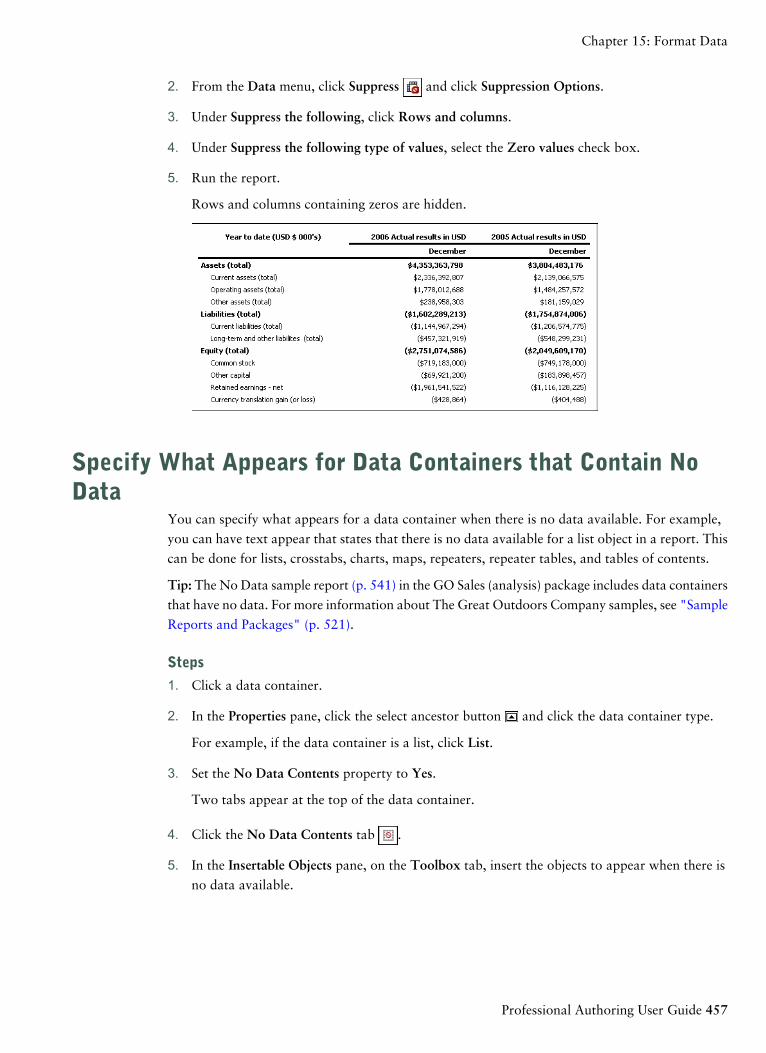
2. From the Data menu, click Suppress and click Suppression Options.
3. Under Suppress the following, click Rows and columns.
4. Under Suppress the following type of values, select the Zero values check box.
5. Run the report.
Rows and columns containing zeros are hidden.
Specify What Appears for Data Containers that Contain NoData
You can specify what appears for a data container when there is no data available. For example,
you can have text appear that states that there is no data available for a list object in a report. This
can be done for lists, crosstabs, charts, maps, repeaters, repeater tables, and tables of contents.
Tip: The No Data sample report (p. 541) in the GO Sales (analysis) package includes data containers
that have no data. For more information about The Great Outdoors Company samples, see "Sample
Reports and Packages" (p. 521).
Steps
1. Click a data container.
2. In the Properties pane, click the select ancestor button and click the data container type.
For example, if the data container is a list, click List.
3. Set the No Data Contents property to Yes.
Two tabs appear at the top of the data container.
4. Click the No Data Contents tab .
5. In the Insertable Objects pane, on the Toolbox tab, insert the objects to appear when there is
no data available.
Professional Authoring User Guide 457
Chapter 15: Format Data
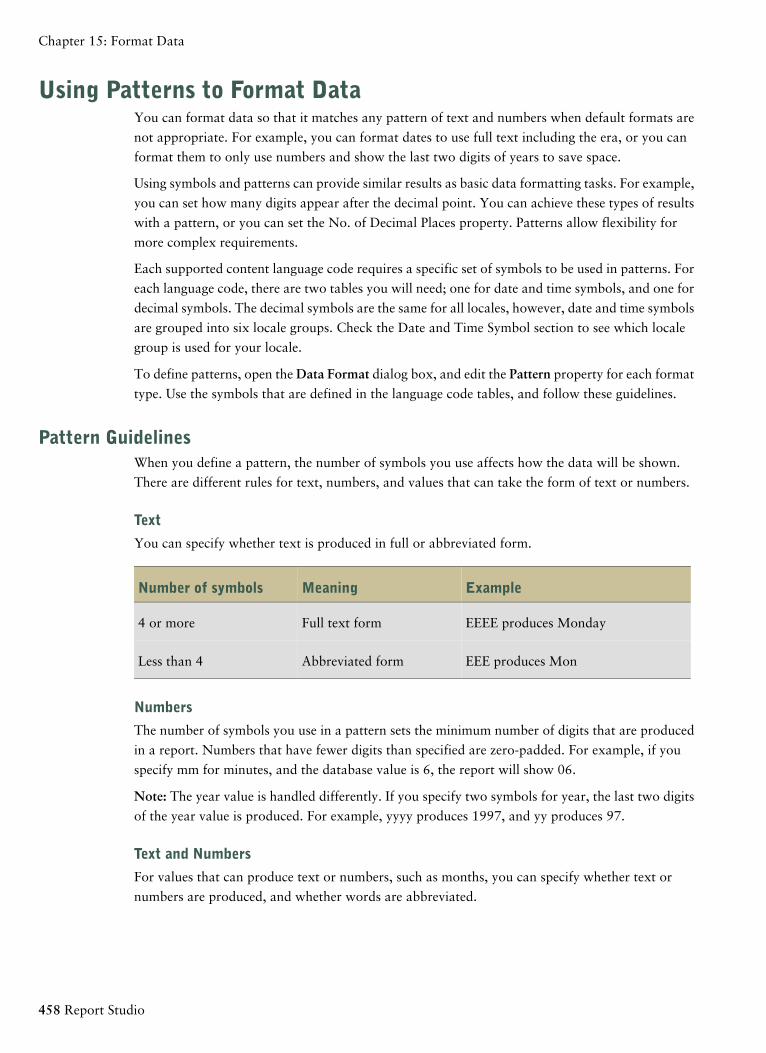
Using Patterns to Format DataYou can format data so that it matches any pattern of text and numbers when default formats are
not appropriate. For example, you can format dates to use full text including the era, or you can
format them to only use numbers and show the last two digits of years to save space.
Using symbols and patterns can provide similar results as basic data formatting tasks. For example,
you can set how many digits appear after the decimal point. You can achieve these types of results
with a pattern, or you can set the No. of Decimal Places property. Patterns allow flexibility for
more complex requirements.
Each supported content language code requires a specific set of symbols to be used in patterns. For
each language code, there are two tables you will need; one for date and time symbols, and one for
decimal symbols. The decimal symbols are the same for all locales, however, date and time symbols
are grouped into six locale groups. Check the Date and Time Symbol section to see which locale
group is used for your locale.
To define patterns, open the Data Format dialog box, and edit the Pattern property for each format
type. Use the symbols that are defined in the language code tables, and follow these guidelines.
Pattern GuidelinesWhen you define a pattern, the number of symbols you use affects how the data will be shown.
There are different rules for text, numbers, and values that can take the form of text or numbers.
Text
You can specify whether text is produced in full or abbreviated form.
ExampleMeaningNumber of symbols
EEEE produces MondayFull text form4 or more
EEE produces MonAbbreviated formLess than 4
Numbers
The number of symbols you use in a pattern sets the minimum number of digits that are produced
in a report. Numbers that have fewer digits than specified are zero-padded. For example, if you
specify mm for minutes, and the database value is 6, the report will show 06.
Note: The year value is handled differently. If you specify two symbols for year, the last two digits
of the year value is produced. For example, yyyy produces 1997, and yy produces 97.
Text and Numbers
For values that can produce text or numbers, such as months, you can specify whether text or
numbers are produced, and whether words are abbreviated.
458 Report Studio
Chapter 15: Format Data
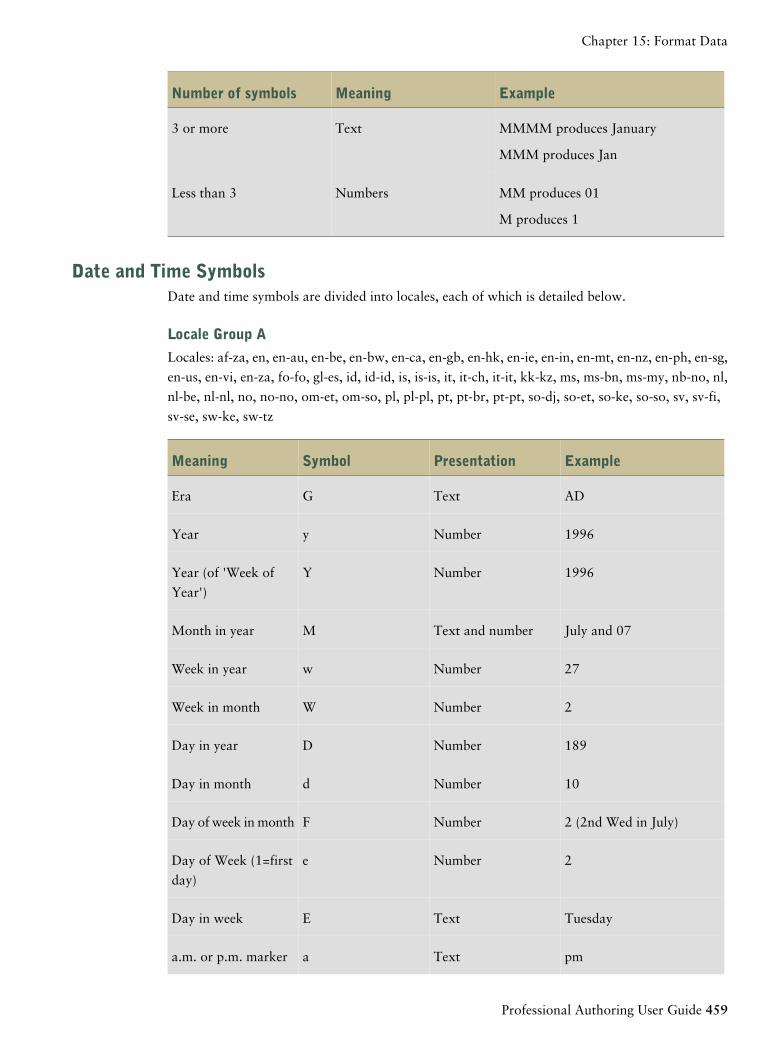
ExampleMeaningNumber of symbols
MMMM produces JanuaryText3 or more
MMM produces Jan
MM produces 01NumbersLess than 3
M produces 1
Date and Time SymbolsDate and time symbols are divided into locales, each of which is detailed below.
Locale Group A
Locales: af-za, en, en-au, en-be, en-bw, en-ca, en-gb, en-hk, en-ie, en-in, en-mt, en-nz, en-ph, en-sg,
en-us, en-vi, en-za, fo-fo, gl-es, id, id-id, is, is-is, it, it-ch, it-it, kk-kz, ms, ms-bn, ms-my, nb-no, nl,
nl-be, nl-nl, no, no-no, om-et, om-so, pl, pl-pl, pt, pt-br, pt-pt, so-dj, so-et, so-ke, so-so, sv, sv-fi,
sv-se, sw-ke, sw-tz
ExamplePresentationSymbolMeaning
ADTextGEra
1996NumberyYear
1996NumberYYear (of 'Week of
Year')
July and 07Text and numberMMonth in year
27NumberwWeek in year
2NumberWWeek in month
189NumberDDay in year
10NumberdDay in month
2 (2nd Wed in July)NumberFDay of week in month
2NumbereDay of Week (1=first
day)
TuesdayTextEDay in week
pmTextaa.m. or p.m. marker
Professional Authoring User Guide 459
Chapter 15: Format Data
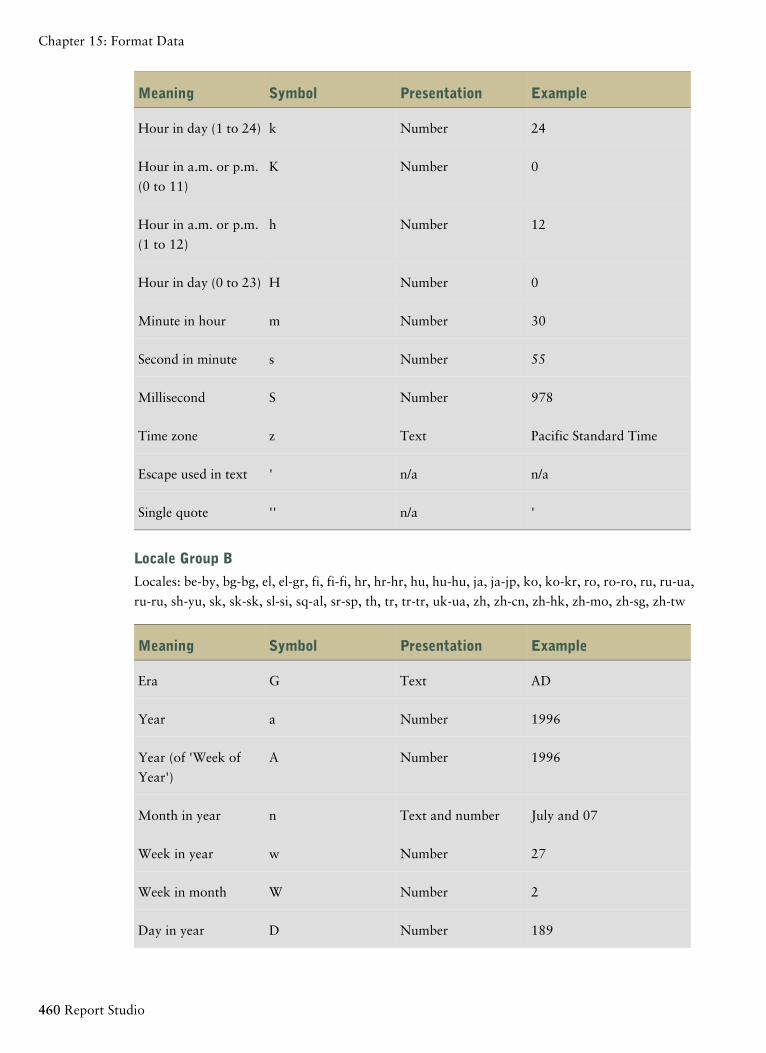
ExamplePresentationSymbolMeaning
24NumberkHour in day (1 to 24)
0NumberKHour in a.m. or p.m.
(0 to 11)
12NumberhHour in a.m. or p.m.
(1 to 12)
0NumberHHour in day (0 to 23)
30NumbermMinute in hour
55NumbersSecond in minute
978NumberSMillisecond
Pacific Standard TimeTextzTime zone
n/an/a'Escape used in text
'n/a''Single quote
Locale Group B
Locales: be-by, bg-bg, el, el-gr, fi, fi-fi, hr, hr-hr, hu, hu-hu, ja, ja-jp, ko, ko-kr, ro, ro-ro, ru, ru-ua,
ru-ru, sh-yu, sk, sk-sk, sl-si, sq-al, sr-sp, th, tr, tr-tr, uk-ua, zh, zh-cn, zh-hk, zh-mo, zh-sg, zh-tw
ExamplePresentationSymbolMeaning
ADTextGEra
1996NumberaYear
1996NumberAYear (of 'Week of
Year')
July and 07Text and numbernMonth in year
27NumberwWeek in year
2NumberWWeek in month
189NumberDDay in year
460 Report Studio
Chapter 15: Format Data
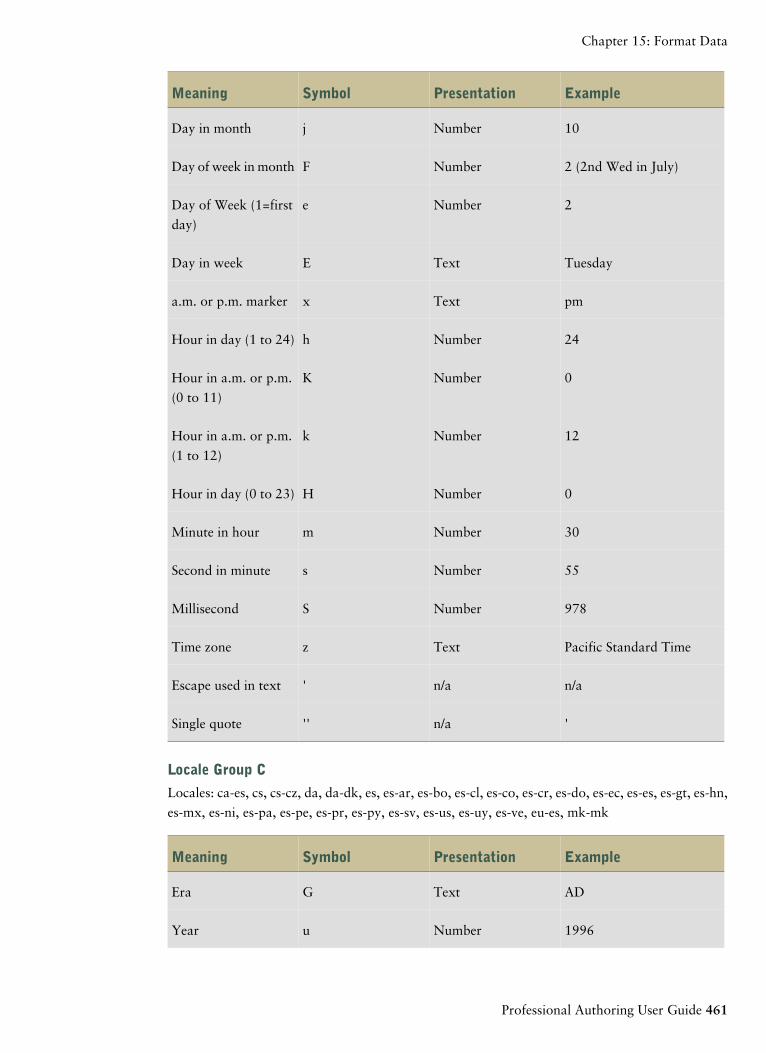
ExamplePresentationSymbolMeaning
10NumberjDay in month
2 (2nd Wed in July)NumberFDay of week in month
2NumbereDay of Week (1=first
day)
TuesdayTextEDay in week
pmTextxa.m. or p.m. marker
24NumberhHour in day (1 to 24)
0NumberKHour in a.m. or p.m.
(0 to 11)
12NumberkHour in a.m. or p.m.
(1 to 12)
0NumberHHour in day (0 to 23)
30NumbermMinute in hour
55NumbersSecond in minute
978NumberSMillisecond
Pacific Standard TimeTextzTime zone
n/an/a'Escape used in text
'n/a''Single quote
Locale Group C
Locales: ca-es, cs, cs-cz, da, da-dk, es, es-ar, es-bo, es-cl, es-co, es-cr, es-do, es-ec, es-es, es-gt, es-hn,
es-mx, es-ni, es-pa, es-pe, es-pr, es-py, es-sv, es-us, es-uy, es-ve, eu-es, mk-mk
ExamplePresentationSymbolMeaning
ADTextGEra
1996NumberuYear
Professional Authoring User Guide 461
Chapter 15: Format Data
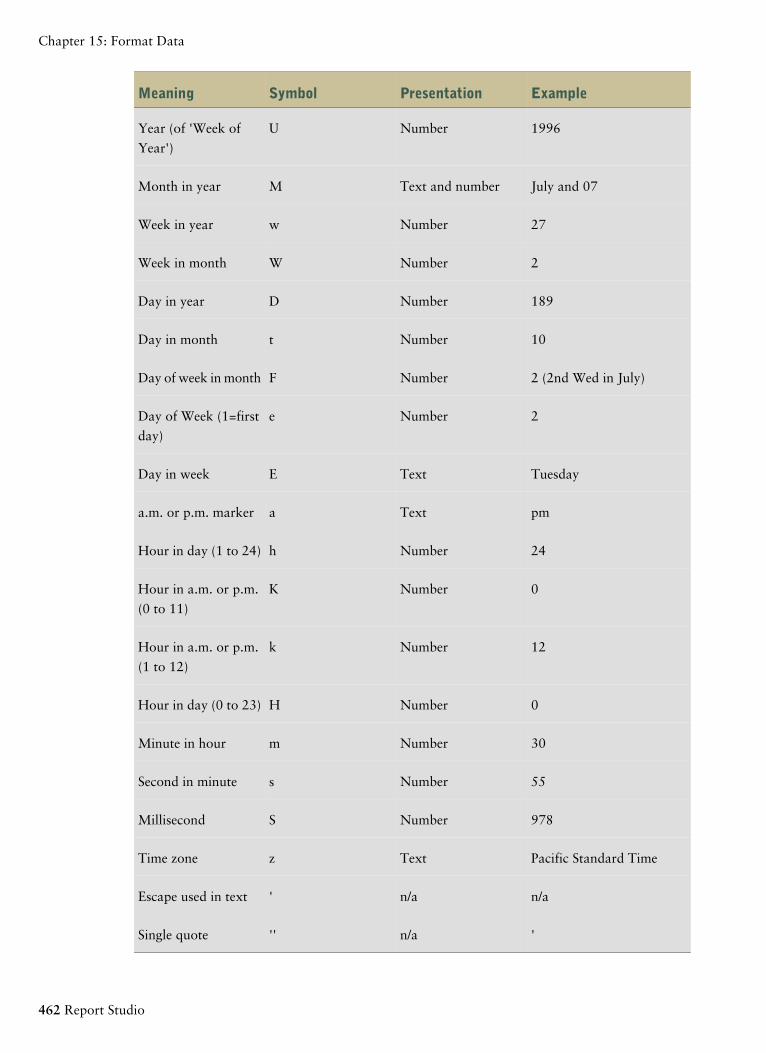
ExamplePresentationSymbolMeaning
1996NumberUYear (of 'Week of
Year')
July and 07Text and numberMMonth in year
27NumberwWeek in year
2NumberWWeek in month
189NumberDDay in year
10NumbertDay in month
2 (2nd Wed in July)NumberFDay of week in month
2NumbereDay of Week (1=first
day)
TuesdayTextEDay in week
pmTextaa.m. or p.m. marker
24NumberhHour in day (1 to 24)
0NumberKHour in a.m. or p.m.
(0 to 11)
12NumberkHour in a.m. or p.m.
(1 to 12)
0NumberHHour in day (0 to 23)
30NumbermMinute in hour
55NumbersSecond in minute
978NumberSMillisecond
Pacific Standard TimeTextzTime zone
n/an/a'Escape used in text
'n/a''Single quote
462 Report Studio
Chapter 15: Format Data
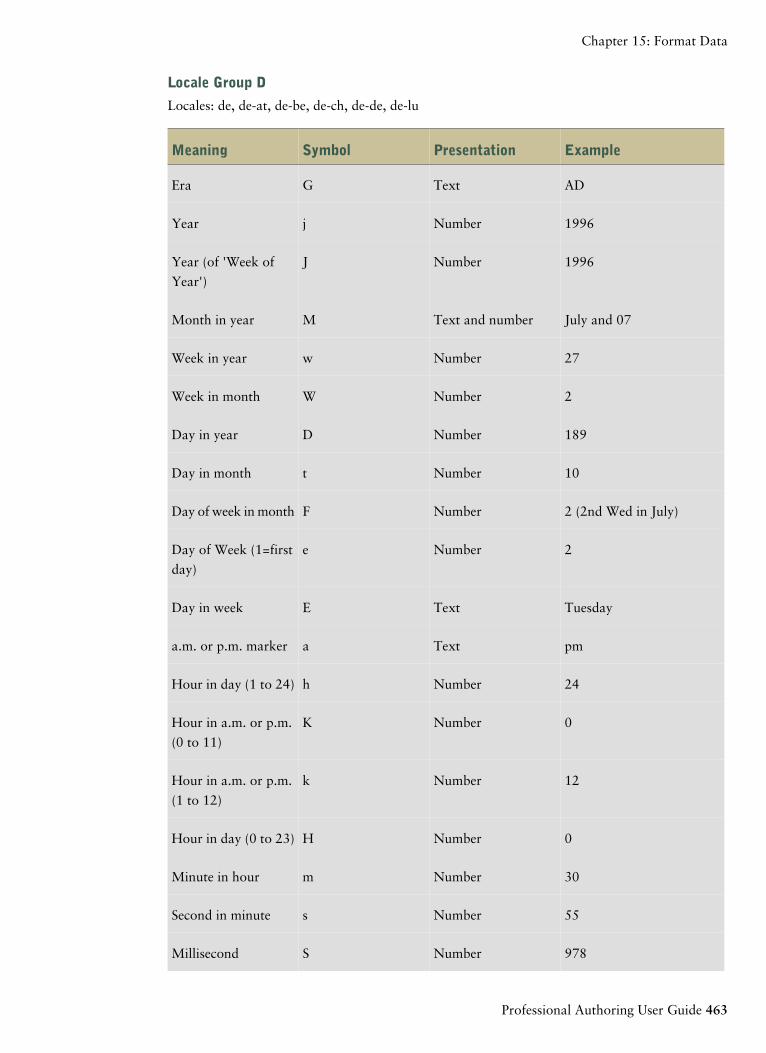
Locale Group D
Locales: de, de-at, de-be, de-ch, de-de, de-lu
ExamplePresentationSymbolMeaning
ADTextGEra
1996NumberjYear
1996NumberJYear (of 'Week of
Year')
July and 07Text and numberMMonth in year
27NumberwWeek in year
2NumberWWeek in month
189NumberDDay in year
10NumbertDay in month
2 (2nd Wed in July)NumberFDay of week in month
2NumbereDay of Week (1=first
day)
TuesdayTextEDay in week
pmTextaa.m. or p.m. marker
24NumberhHour in day (1 to 24)
0NumberKHour in a.m. or p.m.
(0 to 11)
12NumberkHour in a.m. or p.m.
(1 to 12)
0NumberHHour in day (0 to 23)
30NumbermMinute in hour
55NumbersSecond in minute
978NumberSMillisecond
Professional Authoring User Guide 463
Chapter 15: Format Data
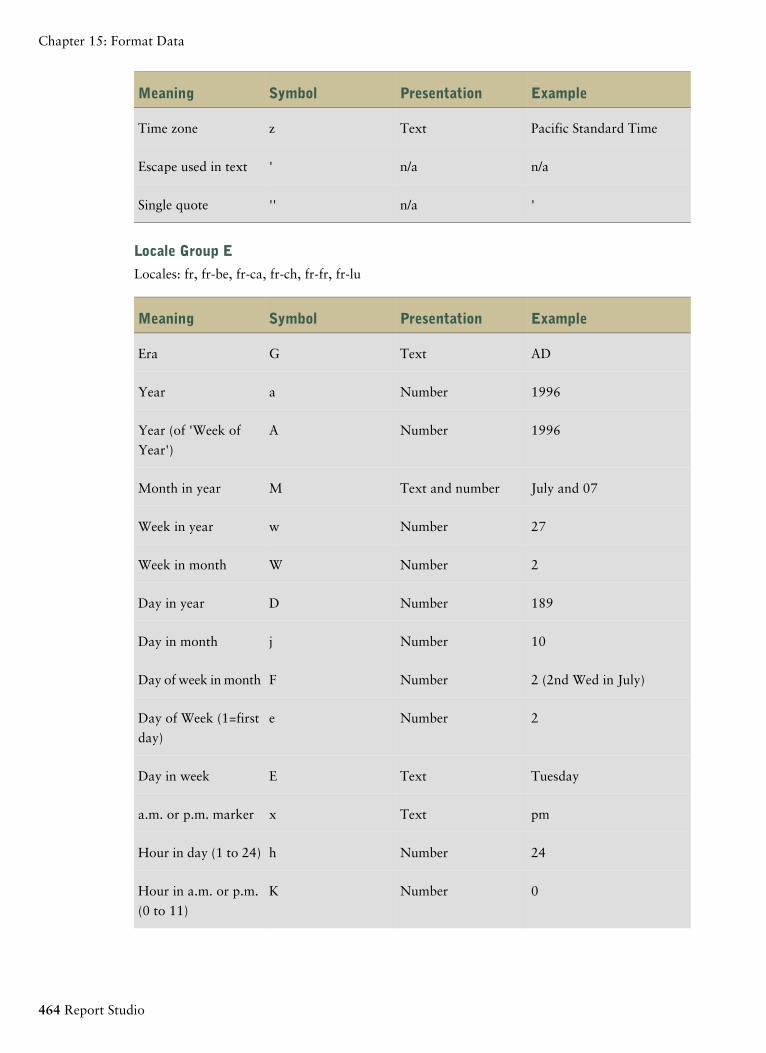
ExamplePresentationSymbolMeaning
Pacific Standard TimeTextzTime zone
n/an/a'Escape used in text
'n/a''Single quote
Locale Group E
Locales: fr, fr-be, fr-ca, fr-ch, fr-fr, fr-lu
ExamplePresentationSymbolMeaning
ADTextGEra
1996NumberaYear
1996NumberAYear (of 'Week of
Year')
July and 07Text and numberMMonth in year
27NumberwWeek in year
2NumberWWeek in month
189NumberDDay in year
10NumberjDay in month
2 (2nd Wed in July)NumberFDay of week in month
2NumbereDay of Week (1=first
day)
TuesdayTextEDay in week
pmTextxa.m. or p.m. marker
24NumberhHour in day (1 to 24)
0NumberKHour in a.m. or p.m.
(0 to 11)
464 Report Studio
Chapter 15: Format Data
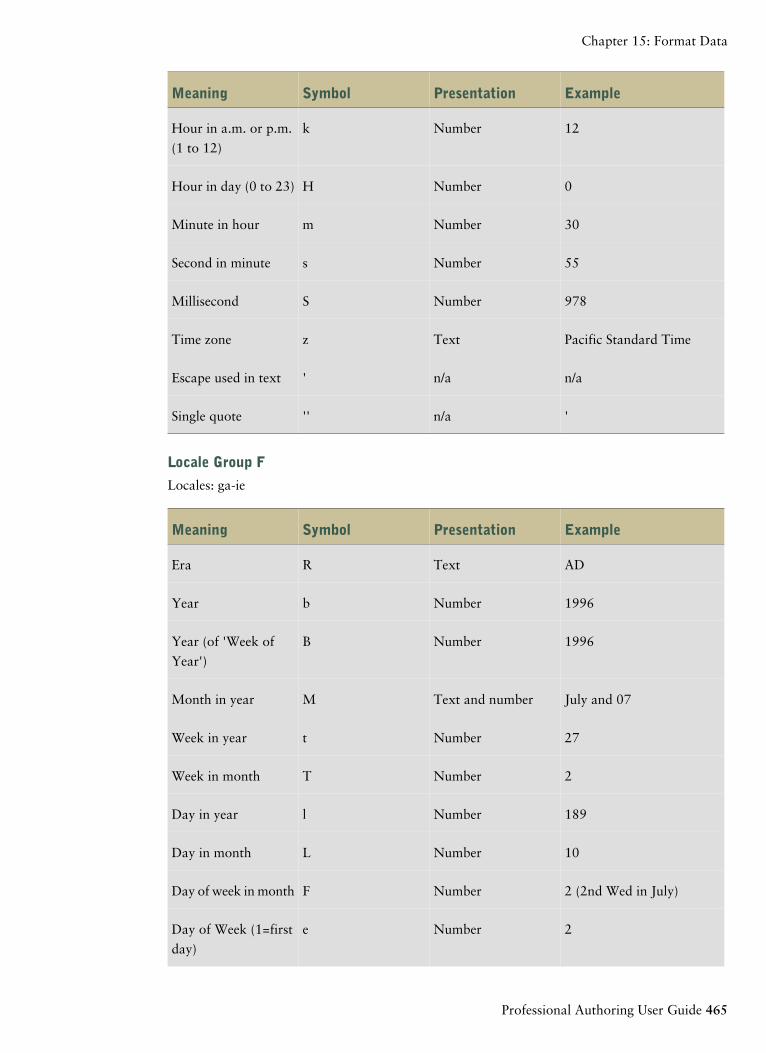
ExamplePresentationSymbolMeaning
12NumberkHour in a.m. or p.m.
(1 to 12)
0NumberHHour in day (0 to 23)
30NumbermMinute in hour
55NumbersSecond in minute
978NumberSMillisecond
Pacific Standard TimeTextzTime zone
n/an/a'Escape used in text
'n/a''Single quote
Locale Group F
Locales: ga-ie
ExamplePresentationSymbolMeaning
ADTextREra
1996NumberbYear
1996NumberBYear (of 'Week of
Year')
July and 07Text and numberMMonth in year
27NumbertWeek in year
2NumberTWeek in month
189NumberlDay in year
10NumberLDay in month
2 (2nd Wed in July)NumberFDay of week in month
2NumbereDay of Week (1=first
day)
Professional Authoring User Guide 465
Chapter 15: Format Data
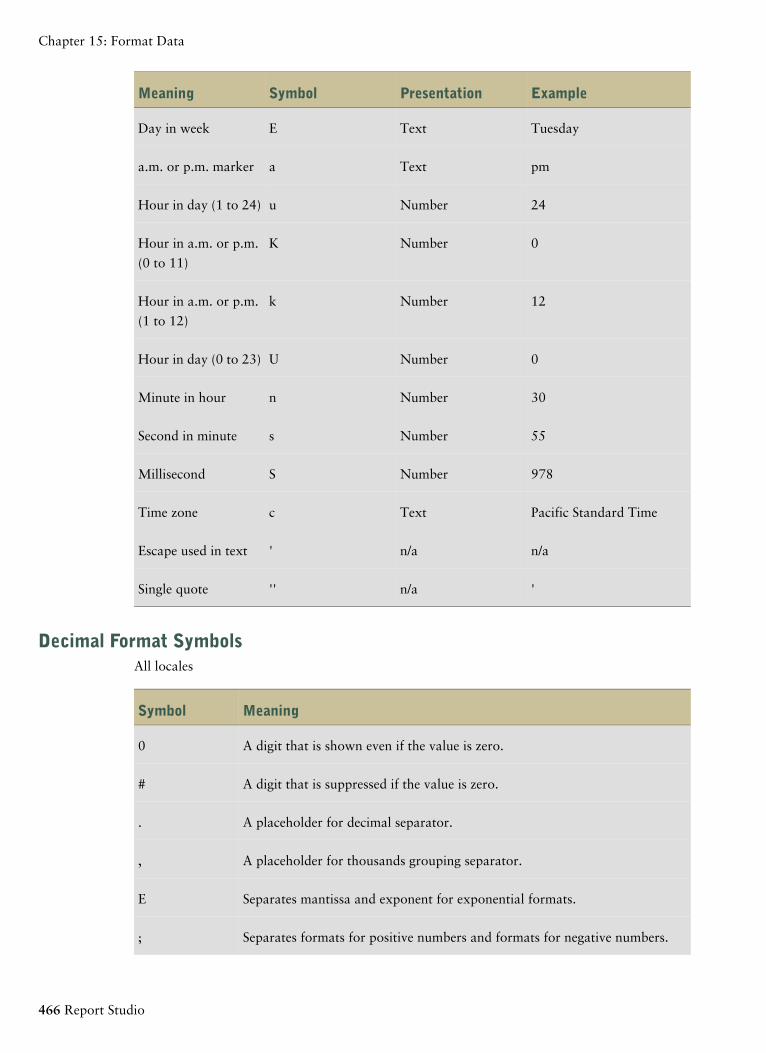
ExamplePresentationSymbolMeaning
TuesdayTextEDay in week
pmTextaa.m. or p.m. marker
24NumberuHour in day (1 to 24)
0NumberKHour in a.m. or p.m.
(0 to 11)
12NumberkHour in a.m. or p.m.
(1 to 12)
0NumberUHour in day (0 to 23)
30NumbernMinute in hour
55NumbersSecond in minute
978NumberSMillisecond
Pacific Standard TimeTextcTime zone
n/an/a'Escape used in text
'n/a''Single quote
Decimal Format SymbolsAll locales
MeaningSymbol
A digit that is shown even if the value is zero.0
A digit that is suppressed if the value is zero.#
A placeholder for decimal separator..
A placeholder for thousands grouping separator.,
Separates mantissa and exponent for exponential formats.E
Separates formats for positive numbers and formats for negative numbers.;
466 Report Studio
Chapter 15: Format Data
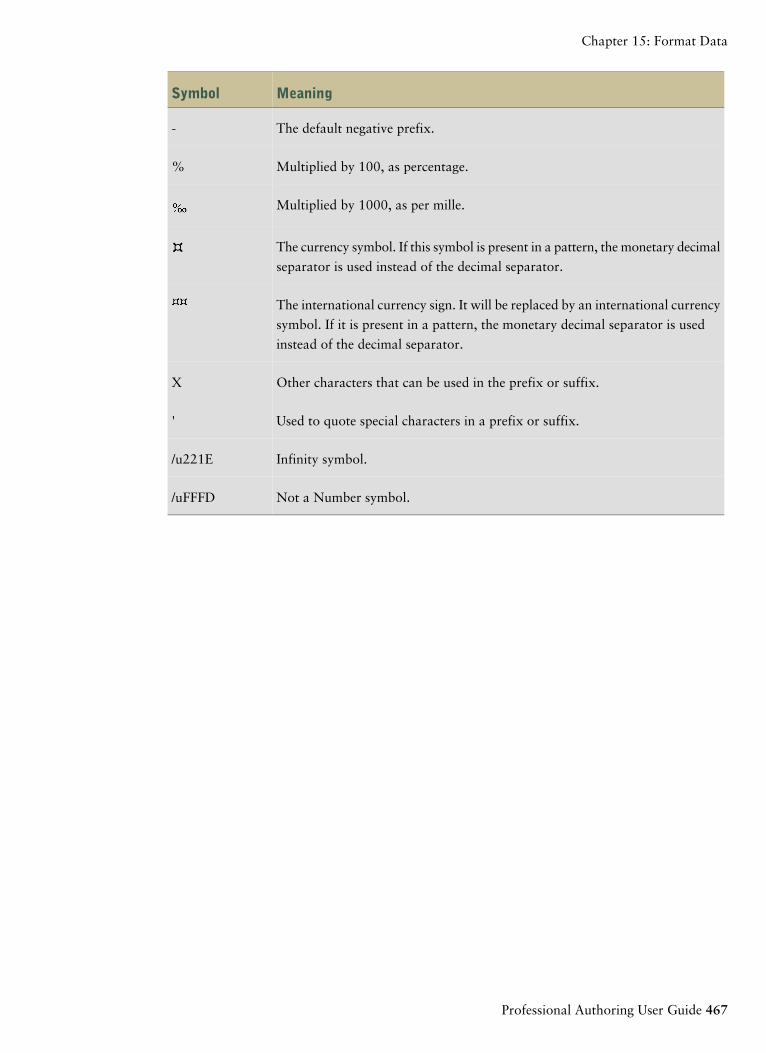
MeaningSymbol
The default negative prefix.-
Multiplied by 100, as percentage.%
Multiplied by 1000, as per mille.
The currency symbol. If this symbol is present in a pattern, the monetary decimal
separator is used instead of the decimal separator.
The international currency sign. It will be replaced by an international currency
symbol. If it is present in a pattern, the monetary decimal separator is used
instead of the decimal separator.
Other characters that can be used in the prefix or suffix.X
Used to quote special characters in a prefix or suffix.'
Infinity symbol./u221E
Not a Number symbol./uFFFD
Professional Authoring User Guide 467
Chapter 15: Format Data

468 Report Studio
Chapter 15: Format Data
Chapter 16: Using Query Macros
A macro is a fragment of code that you can insert in the Select statement of a query or in an
expression. For example, add a macro to insert a new data item containing the user's name.
You can also add query macros to the Framework Manager model. For more information, including
examples, see the Framework Manager User Guide.
Support for query macros in Report Studio includes the same capabilities as macros used in
Framework Manager, including support for parameter maps defined within the Framework Manager
model. However, Report Studio query macros do not extend to the layout. Therefore, when making
changes to the query using macros, you must bear in mind the side-effects on the layout. For example,
if a macro removes a column from the query that the layout refers to, a run-time error will occur.
Using query macros includes
● adding query macros
● creating prompts using query macros
Add a Query MacroAdd a query macro to allow run-time changes to be made to SQL queries.
Steps
1. Pause the pointer over the query explorer button and click Queries.
2. If the query to which you are adding a macro was built by using your own SQL, do the following:
● Click the SQL object that is linked to the query.
● In the Properties pane, double-click the SQL property.
● In the SQL dialog box, type the macro.
3. If the query to which you are adding a macro was not built by using your own SQL, do the
following:
● Click the query.
● In the Properties pane, double-click the Generated SQL/MDX property.
● In the Generated SQL/MDX dialog box, click Convert.
● In the SQL dialog box, type the macro.
Tip: For a list of supported macro functions, see "Using the Expression Editor" (p. 245).
Professional Authoring User Guide 469
Creating Prompts Using Query MacrosYou can create mandatory and optional prompts in reports using query macros. Use the prompt
macro functions prompt and promptmany to create single-value and multiple-value prompts. You
can use prompt macro functions when working with a relational data source or a dimensionally-
modeled relational (DMR) data source.
The prompt and promptmany functions have the following mandatory and optional parameters.
All argument values must be specified as strings.
Name
This mandatory parameter is the name of the prompt. Name can also refer to the name of a parameter
on a user-created prompt page, in which case the user-created prompt page appears when the report
is run instead of the default prompt page that the macro would generate.
Datatype
This optional parameter is the prompt value data type. The default value is string. Prompt values
are validated. In the case of strings, the provided value is enclosed in single quotation marks and
embedded single quotation marks are doubled.
Values include the following:
● boolean
● date
● datetime
● decimal
● double
● float
● int
● integer
● interval
● long
● memberuniquename
Memberuniquename is not an actual data type. This value must be used when the data type of
the parameter is member unique name (MUN).
● numeric
● real
● short
● string
470 Report Studio
Chapter 16: Using Query Macros
● time
● timeinterval
● timestamp
● token
Token is not an actual data type. It is a way to pass SQL. A token does not pass values.
● xsddate
● xsddatetime
● xsddecimal
● xsddouble
● xsdduration
● xsdfloat
● xsdint
● xsdlong
● xsdshort
● xsdstring
● xsdtime
DefaultText
This optional parameter is the text to be used by default. If a value is specified, the prompt is
optional.
If you use a space and no values are provided in the Prompt Value dialog box, a Where clause is
usually not generated.
If you use text and no values are provided in the Prompt Value dialog box, a Where clause is usually
generated using the default value.
Ensure that the text you provide results in a valid SQL statement.
Note: If the data type is memberuniquename, a value for the DefaultText parameter must be
provided. For example:
(#prompt('WhichLevel', 'memberuniquename', '[goSalesAgain].[PRODUCT1].[PRODUCT].
[PRODUCT(All)]->[all]')#)
Text
This optional parameter is text that precedes any user-provided values, such as 'and column1 = '.
QueryItem
This parameter is optional. The prompt engine can take advantage of the Prompt Info properties
of the query item. Descriptive information can be shown, although the prompt value is a code.
Professional Authoring User Guide 471
Chapter 16: Using Query Macros
TextFollowing
This optional parameter is the closing parenthesis that is used most often for the promptmany
function. This parameter is also useful when the prompt is optional and is followed by hardcoded
filters in the SQL statement.
Example - Select a Country PromptYou are a report author at The Great Outdoors Company, which sells sporting equipment. You
are requested to create a report that will prompt users to choose the country for which they want
to see data.
The following code shows how to use macros to create a prompt:
select
COUNTRY_MULTILINGUAL.COUNTRY_CODEas COUNTRY_CODE,
COUNTRY_MULTILINGUAL.COUNTRY as COUNTRY,
COUNTRY_MULTILINGUAL."LANGUAGE" as LANGUAGE1,
COUNTRY_MULTILINGUAL.CURRENCY_NAMEas CURRENCY_NAME
from
gosales.gosales.dbo.COUNTRY_MULTILINGUAL COUNTRY_MULTILINGUAL
where COUNTRY_MULTILINGUAL.COUNTRY = #prompt('CountryName')#
Notes
● Because the <Datatype> argument is not specified, valid prompt values must be strings, which
is correct in this case.
● Because the <DefaultText> argument is not specified, the CountryName prompt is a required
prompt.
472 Report Studio
Chapter 16: Using Query Macros
Chapter 17: Using Drill-through Access
Using drill-through access, you can move from one report to another within a session while main-
taining your focus on the same piece of data. For example, you select a product in a sales report
and move to an inventory report about that product.
Drill-through access helps you to build business intelligence applications that are bigger than a
single report. Drill-through applications are a network of linked reports that users can navigate,
retaining their context and focus, to explore and analyze information.
Drill-through access works by defining the target report or object and then using information from
the source report to filter the target. IBM Cognos 8 can match data from the source to metadata
in the target report, or you can define parameters in the target for greater control.
Note: In the dimensional reporting style, you can also enable drilling up and drilling down. For
more information about drilling up and drilling down, see "Create a Drill-up/Drill-down
Report" (p. 239).
Using drill-through access includes
● understanding drill-through concepts
● setting up drill-through access
● specifying the drill-through text
What You Should Know
For a drill-through link to work, it is necessary to know
● the source
● the target
● how the data in the packages that contain these objects is related
Depending on the underlying data, you may create a drill-through definition and have IBM
Cognos 8 match the data (dynamic drill-through) or create parameters in the target (paramet-
erized drill-through).
● whether to run the target report or to open it
The target of drill-through access is usually a saved report definition. The report can be created
in Report Studio, Query Studio, PowerPlay Studio, or Analysis Studio. The target of drill-
through access can also be a package that contains a PowerCube, in which case a default view
of the PowerCube is created.
● whether the users of the drill-through link in the source report have the appropriate permissions
to view or run the target report
● if the target is being run, in what format to run it, and what filters to use on the target
Professional Authoring User Guide 473
If you do not want to run the target report on demand, you may link to a bookmark in the saved
output instead of running the report. For more information, see the IBM Cognos 8 BI Administration
and Security Guide.
Sources and Targets
In IBM Cognos 8, there are many different examples of source and target. For example, you can
drill through
● between reports created in different packages against different data source types, such as from
an analysis against a package that contains a PowerCube to a detailed report against a package
based on a relational data source
● from one existing report to another report using definitions created in Report Studio (p. 481)
● between Cognos Viewer reports authored in Report Studio, Query Studio, and Analysis Studio
● to and from a package built on a PowerCube
● from IBM Cognos Series 7 to IBM Cognos 8 reports (p. 491)
● from Metric Studio to other IBM Cognos 8 reports by passing parameters using URLs
For more information, see the Metric Studio User Guide.
Tip: In the GO Data Warehouse (analysis) package, the Positions to Fill sample report (p. 533) is a
drill-through target report and the Recruitment Report sample report (p. 534) is a drill-through
source report. For more information about The Great Outdoors Company samples, see "Sample
Reports and Packages" (p. 521).
Understanding Drill-through ConceptsBefore you set up drill-through access, you must understand the key concepts about drilling through.
Knowing these concepts will help you to avoid errors so that report consumers drill through as
efficiently as possible.
Drill-through PathsYou can create a drill-through path in a source report in Report Studio (Professional authoring
mode), or using Drill-through Definitions in IBM Cognos Connection. A drill-through path is the
definition of the path that is taken when moving from one report to another, including how the
data values are passed between the reports.
Using Drill-through Definitions, you can create a drill-through path from any report in the source
package to any target report in any other package in IBM Cognos Connection. This type of drill-
through definition is stored in the source package. Users of any report in the package can use the
drill-through definition to drill between any combination of Analysis Studio, Query Studio,
PowerPlay Studio, or Cognos Viewer reports in any package.
For any target report that contains parameters, you should map the target parameters to the correct
metadata in the drill-through path. This ensures that the values from the source report are passed
474 Report Studio
Chapter 17: Using Drill-through Access
to the correct parameter values, and that the target report is filtered correctly. If you do not map
parameters, then the users may be prompted for values when the target report is run.
A report-based drill-through path refers to a path created and stored in a Report Studio source
report (Professional authoring mode). This type of drill-through path is also called "authored drill
through". The path is associated with a specific data column, chart, or cross tab in the source report,
and is available only when users select that area of the report. If an authored drill-through definition
is available, a hyperlink appears in the source report when it is run.
Report-based drill-through is limited to Report Studio source reports (Professional authoring mode)
and any target reports. Use this type of drill-through access when you want to pass data item values
or parameter results from within a source report to the target report, pass the results of a report
expression to a target report, or a use URL link as a part of the drill-through definition.
Selection ContextsThe selection context represents the structure of the values selected by the user in the source. In
Analysis Studio, this includes the context area. When a package drill-through definition is used,
the selection context is used to give values for mapped parameters (parameterized drill-through) or
also to map the appropriate data items and values.
Drill-through links can also be defined to open the target object at a bookmark. The content of this
bookmark may also specified by the selection context.
Drill-through access is possible between most combinations of the IBM Cognos 8 studios. Each
studio has been optimized for the goals and skills of the audience that uses it, and in some cases
for the type of data source it is designed for. Therefore, you may need to consider how the various
studios manage the selection context when you drill through between objects created in different
studios, and how the data sources are conformed. During testing or debugging, you can see how
source values are being mapped in different contexts using the drill-through assistant.
Drilling Through to Different Report FormatsThe settings in the drill-through definition determine how users see the report results. For example,
the users may see the reports in Cognos Viewer as an HTML Web page, or the reports may open
in Query Studio, PowerPlay Studio, or Analysis Studio. If your users have PowerPlay Studio, then
they may also see the default view of a PowerCube.
Reports can be opened as HTML pages, or as PDF, XML, CSV, or Excel formats. When you define
a drill-through path, you can choose the output format. This can be useful if the expected use of
the target report is something other than online viewing. If the report will be printed, output it as
PDF; if it will be exported to Excel for further processing, output it as Excel or CSV, and so on.
If you define a drill-through path to a report that is created in Analysis Studio, PowerPlay Studio,
or Query Studio, consumers can open the report in its studio instead of in Cognos Viewer. This
can be useful if you expect a consumer to use the drill-through target report as the start of an analysis
or query session to find more information.
For example, if an application contains a dashboard style report of high-level data, you can define
a drill-through link to Analysis Studio to investigate items of interest. The Analysis Studio view can
then be drilled through to a PDF report for printing.
Professional Authoring User Guide 475
Chapter 17: Using Drill-through Access
Note: Drilling through to open the target in Report Studio is not supported for the Express
Authoring mode. The Report Studio Professional authoring mode does not display data results.
Drilling Through Between PackagesYou can set up drill-through access between different packages. The two packages can be based on
different types of data source, but there are some limits.
The following table shows the data source mappings that support drill-through access.
Target data sourceSource data source
OLAPOLAP
Note: OLAP to OLAP drill through is supported only if
the data source type is the same, for example, SSAS to
SSAS.
Dimensionally modeled relationalOLAP
Relational dataOLAP
Note: For more information, see "Business Keys" (p. 479).
Dimensionally modeled relationalDimensionally modeled relational
RelationalDimensionally modeled relational
RelationalRelational
Bookmark ReferencesWhen you drill through, the values that you pass are usually, but not always, used to filter the
report. IBM Cognos 8 Business Intelligence supports bookmarks within saved PDF and HTML
reports so that a user can scroll a report to view the relevant part based on a URL parameter. For
example, you have a large inventory report scheduled to run daily or weekly during off hours
because of resource considerations. Your users may want to view this report as a target because it
contains detailed information, but you want them to view the saved output rather than run this
large report. Using this Action option and bookmark settings, users can drill through from another
source location based on products to open the saved report to the page that shows the product they
want to focus on.
When a bookmark in the source report is used in a drill-through definition, it provides the value
for the URL parameter. When report consumers drill through using this definition, they see the
relevant section of the target report.
Bookmark references are limited to previously run reports that are output as PDF or HTML and
contain bookmark objects.
476 Report Studio
Chapter 17: Using Drill-through Access
Members and ValuesDimensionally modeled data, whether stored in cubes or stored as Dimensionally Modeled Relational
(DMR) data, organizes data into dimensions. These dimensions contain hierarchies. The hierarchies
contain levels. And the levels contain members.
An example of a dimension is Locations. A Locations dimension may contain two hierarchies:
Locations by Organization Structure and Locations by Geography. Either of these hierarchies may
contain levels like Country and City.
Members are the instances in a level. For example, New York and London are members in the City
level. A member may have multiple properties, such as Population, Latitude, and Longitude.
Internally, a member is identified by a Member Unique Name (MUN) (p. 477). The method by which
a MUN is derived depends on the cube vendor.
Relational data models are made up of data subjects, such as Employees, which are made up of
data items, such as Name or Extension. These data items have values, such as Peter Smith.
In IBM Cognos 8, the methods of drilling through available are
● Dimensional (member) to Dimensional (member)
● Dimensional (member) to Relational (data item value)
● Relational (data item value) to Relational (data item value)
If the target parameter is a member, the source must be a member. The source and target should
usually be from a conformed dimension (p. 478). However, if the data will support it, you may also
choose to define a mapping using different properties of the source metadata item.
If the target parameter is a value, the source can be either a value or a member. If the source is a
dimensional member, you must ensure that the level or dimension is mapped to the target data item
correctly in the drill-through definition. The business key from which the member is sourced should
usually match the relational target value, which is most often the business key (p. 479). However,
if the data will support it, you may also choose to define a mapping from the caption of the source
metadata item.
Member Unique NamesThe member unique name (MUN) is a unique identifier for a member in IBM Cognos reports. It is
stored in the report specification when the member is referenced in the report directly. The MUN
is used in drill-through between OLAP data sources. The member keys in the MUN for the different
OLAP data sources must match.
The MUN is used to find the member in the data source, which is similar to how business keys are
used to find records in a table. For example, when you create OLAP dimension Products, you use
the Product Line database column as s label for the members in your Product Line level. However,
you use the Product Line Code business key from the database table to ensure that all the Product
lines are unique in that level. The source value that you used to create the members is used in
combination with the data source name, hierarchy, and level information in the member unique
name.
Professional Authoring User Guide 477
Chapter 17: Using Drill-through Access
If the MUN changes, members that are directly referenced in expressions, filters, or reports are no
longer found. Changes to the MUN may be related to other changes. For example, changes to the
hierarchy and level structures may change the level unique name, and changes to the business key
values may change the member key path. Other factors that can affect the MUN are application
changes during the design stage or over time, IBM Cognos PowerCube category codes that are
unpredictably unique, the production environment that has more members than the test environment,
or removing the member from the data source.
To avoid potential problems, we recommend the following best practices when you build OLAP
data sources:
● Use unique codes and keys within a dimension for the member keys.
● Define your OLAP and relational packages using unique conformed values for the source values
(business keys) within similar dimensions or data values where drill-through between applications
may be required.
● Ensure that the business keys and dimension metadata structure are the same in the production
and test environments.
● Do not change the business keys in Framework Manager in the production environment.
● Resolve the non-unique keys in a dimension in the data source before you build the cube.
Ensure that there are no duplicate source values in all levels of a dimension before you build a
PowerCube. We do not recommend using the tilde character (~) in the category codes.
For more information, see the section about uniqueness in the IBM Cognos Series 7 Step-by-
Step Transformer.
For information about PowerCubes migrated from IBM Cognos Series 7, see the IBM Cognos 8 BI
PowerPlay Migration and Administration Guide.
Conformed DimensionsIf you work with more than one dimensional data source, you may notice that some dimensions
are structured the same, and some are not. The reason that dimensions can be structured differently
is that the data sources may serve different purposes.
For example, a Customer dimension appears in a Revenue data store, but not in an Inventory data
store. However, the Products dimension and the Time dimension appear in both data stores.
Dimensions that appear in multiple data stores are conformed if their structure is identical for all
of the following:
● hierarchy names
● level names
● level order
● internal keys
Drilling through is possible between different dimensional data stores only if the dimensions are
conformed, and if the dimension data store is of the same vendor type, such as IBM Cognos
478 Report Studio
Chapter 17: Using Drill-through Access
PowerCube as the source and the target. For example, in two data stores for Revenue and Inventory
that contain Products and Time dimensions, it is possible to define the Products and Time dimensions
differently for each data store. However, for drill-through between the Products and Time dimensions
to work, their structures must be identical in each data store.
If you are not sure whether your dimensions are conformed, then you should check with the data
modeler to ensure that the drilling through will produce meaningful results.
Dimensionally-modeled Relational Data Sources
Ensure that each level contains a business key that has values that match your PowerCube or other
DMR models. Also, you must also ensure that the Root Business Key property is set and uses the
business key of the first level in the hierarchy. This helps to ensure that you have a conformed
member unique name when attempting to drill through using members from this dimension.
Business KeysWhen drill-through access is defined from a member to a relational value, the business key of the
member is passed by default. This means that your relational target parameter must be set up using
the data item with a matching value, which is most often the business key data item. You can also
choose to pass the caption of the source metadata item.
For example, employees are usually uniquely identified by an employee number, not by their name,
because their name is not necessarily unique. When you drill through from a dimensional member
to a relational data item, the value provided is the business key. Therefore, the parameter in the
target report must be defined to accept a business key value. The exact logic used to define the
business key value supplied depends on the cube vendor. For IBM Cognos PowerCubes, the business
key value is the Source property defined for the level in IBM Cognos Transformer. IBM Cognos
Series 7 Transformer PowerCubes pass the source value if the drill-through flag was enabled before
the cube was built. Otherwise, the category code is used.
In Report Studio (Professional authoring mode), you can determine what the member business key
is using an expression such as roleValue('_businessKey',[Camping Equipment]). This
expression is case sensitive.
SSAS 2005 multi-part business keys are not supported in drill-through operations.
Tip: When other users run your drill-through report, you may not want them to be prompted for
a business key. In Report Studio, you can build a prompt page with a text that is familiar to the
users, but filters on the business key. Your Framework Manager modeler can also set the Display
Item Reference option for the Prompt Info property to use the business key when the data item is
used in a prompt.
ScopeScope is specific to drill-through definitions created using Drill-through Definitions in IBM Cognos
Connection (package drill-through definitions). The scope you set defines when the target report
is shown to the users, based on the items they have in the source report.
Usually, you define the scope of a drill-through path to match a parameter that it passes. For
example, if a target report contains a list of employees, typically you only want to display the report
Professional Authoring User Guide 479
Chapter 17: Using Drill-through Access
as an available drill-through choice when a user is viewing employee names in a source report. If
employee names are not in the source report and the scope was set on the employee name in the
drill-through definition, the employee report does not appear on the list of available drill-through
target reports in the Go To page. You can set the scope to a measure or to an item in the report.
In report-based drill-through access, where the drill-through path is associated with a specific report
column, the column serves as the scope.
Mapped ParametersDrill-through targets may contain existing parameters, or you may choose to add parameters to
the target for greater control over the drill-through link. You usually map all parameters in a drill-
through target to items from the source.
When you map source items that are OLAP or DMR members to target parameters, you can select
from a set of related member properties to satisfy the requirements of the target parameter. For a
dimensional target, a dimensional source item uses the member unique name by default. For a
relational target, a dimensional source item uses the business key by default.
For example, you could change the source member property that is used for a mapping to the
member caption instead of the business key to match the parameter in a relational target. For a
dimensional target, you could define a parameter that accepts a particular property (such as business
key or parent unique name), then pass the appropriate source property to satisfy that target.
Note that if you define drill through between non-conformed dimensions, you should test carefully
to ensure that the results behave as expected.
If you do not specify parameter mappings, then by default, you will be prompted for any parameters
required in the target when you use the drill-through link. To customize this behavior, use the display
prompt pages setting.
When the action is set to "Run using dynamic filtering", then additional filtering is applied if names
from the context in the source report match names of items in the target. Use this action as well
when there are no parameters defined in the target.
If parameters are not mapped correctly, then you may receive an empty report, the wrong results,
or an error message.
The source and target cannot contain identical parameter names when they are from different
packages, even if the data structure is conformed. If the source and target are from the same package,
there is no restriction.
If you have the necessary permissions, you can use the drill-through assistant to look at what source
parameters are passed, and what target parameters are mapped for a given drill-through link.
Drilling Through on Dates Between PowerCubes and Relational PackagesUsually, drilling through from OLAP to relational packages requires that the target report parameter
is set using the business key in the relational data. However, this method does not work well for
dates. OLAP data sources typically view dates as members, such as Quarter 1 2006, while relational
data sources view dates as ranges, such as 1/Jan/2006 to 31/March/2006.
480 Report Studio
Chapter 17: Using Drill-through Access
A special feature exists for drilling through between PowerCubes and relational packages. Ensure
that the target report parameter is set up using in_range. Note that the parameter must be of type
date-time, and not integer.
An example follows:
[gosales_goretailers].[Orders].[Order date] in_range?Date?
Also ensure that the drill-through definition maps the parameter at the dimension level and that
the PowerCube date level is not set to suppress blank categories. Enabling the option to suppress
blank categories in the Transformer model before you build the cube may cause the drill-through
on dates to be unsuccessful. This happens because there are missing values in the range.
Set Up Drill-through Access in a ReportSet up drill-through access in a source report to link two reports containing related information.
You can then access related or more detailed information in one report (the target) by selecting one
or more data item values from another report (the source). IBM Cognos passes values from the
source to the target and uses the passed values to filter the target object. If the data in the source
and target is conformed or if the data item names are the same, then the system may map the source
values to filter the target (dynamic drill-through). If you require greater control, you may define
parameters in the target object (parameterized drill-through). For instructions about creating
parameters in other kinds of targets, see the IBM Cognos Administration and Security Guide.
When you define the drill-through path in Report Studio (Professional authoring mode), you can
pass a value from a different data item that is hidden from the user for display purposes but still in
the query. For example, users see the Product Name data item and can drill through on that item,
but the drill-through definition passes the Product Number value for the product name the user
chose. You can also define the target parameter to accept multiple values or a range of values from
the data item in the drill-through source report or to accept a value from a parameter in the source
report.
Drill-through definitions that have been authored inside a Report Studio report appear in the source
report as blue underlined links. Users click the hyperlink to select the value they want passed to the
target and to drill through to the target report. If a user selects multiple items within a single column
then when the drill-through target report is run, the values from each selected row are passed to
the target parameters. This occurs as an and condition.
You can also drill through within the same report by creating bookmarks (p. 498). As well, you can
create drill-through definitions in the source package instead of the Report Studio report. Users can
use package drill-through definitions to navigate to a target report from an Analysis Studio analysis,
a Query Studio report, a PowerPlay Studio report or PowerCube package, or a Report Studio report.
For more information, see the Administration and Security Guide.
If you have the IBM Cognos 8 software development kit (SDK) (p. 57), you can use URLs to set
up drill-through access to and from third-party sources.
You can also drill through from a map (p. 146).
Professional Authoring User Guide 481
Chapter 17: Using Drill-through Access
If you are using an SAP BW data source for the target report and the target report contains a variable
for a hierarchy node, values from the source report can be values only of the data item representing
the leaf-level identifier of the hierarchy.
Before you begin, ensure that you have a report that will serve as the source report and another
report that will serve as the target report.
Steps to Create a Parameter in the Target
1. In Report Studio (Professional authoring mode), open the target report.
2. Create a parameter that will serve as the drill-through column or that will filter the report.
For example, to drill through or filter Product line, create the following parameter:
[Product line]=?prodline_p?
Tip: Use the operators in or in_range to enable the target report to accept multiple values or
a range of values.
3. In the Usage box, specify what to do when a value for the target parameter is not passed as
part of a drill through:
● To specify that users must select a value, click Required.
If a value for the target parameter is not passed, users are prompted to choose a value.
● To specify that users do not need to select a value, click Optional.
Users are not prompted to choose a value and so the value is unfiltered.
● To specify not to use the parameter, click Disabled.
The parameter is not used during the drill-through. It will also not be used in the report
for any other purposes.
Tip: If the parameter is needed in the report for other reasons, then you can also specify
not to use it in the drill-through definition (Parameters table, Method, Do not use para-
meter).
Steps to Create the Drill-through Definition
1. Check the drill-through target:
● Confirm that the drill-through users have access to the target.
● If necessary, check what parameters exist in the target.
2. Open the source report.
3. Click the element in the report that will serve as the starting point for the drill-through link.
You can select a data item that your report users are likely to choose to drill on for more detailed
information, such as an Employee Name data item.
Tip: If you are passing only parameter values to the target report, you do not have to drill on
a data item. Instead, you can drill on any object in the report, such as the report title. Therefore,
you can drill from outside the context of a query.
482 Report Studio
Chapter 17: Using Drill-through Access
4. Click the drill-through definitions button, or, from the Properties pane, double-click the Drill-
Through Definitions property.
5. Click the new drill-through definition button.
A drill-through definition is created.
Tip: To change the drill-through name, click the rename button, type the new name, and click
OK.
6. On the Target Report tab, click the ellipsis (...) button next to the Report box and select the
drill-through target report.
7. In the Action box, decide how users will view the target report when they click the drill-through
link in the parent report:
● To view the latest data in Cognos Viewer, select Run the report.
● To edit a Query Studio, Analysis Studio, or PowerPlay Studio target, select Edit the report.
● To have IBM Cognos 8 match values from the selection context with data in the target
(dynamic filtering), select Run the report using dynamic filtering.
Note: If you chose this option, any parameters in the target report are still used for the
drill-through access.
● To view the most recently saved output version of the target report from IBM Cognos
Connection, select View the most recent report.
● To use the default action specified for the report in IBM Cognos Connection, select (Default).
8. If the target report contains parameters, then, under the Parameters box, click the edit button.
Each required and optional parameter defined in the target report appears in the Parametersdialog box.
9. For each parameter, specify the Method of treatment:
● To specify not to pass any value, click (Default).
● To specify not to use this parameter, click Do not use parameter.
The target report will not be filtered by this parameter.
● To pass values from a data item, click Pass data item value, click Value, and then click the
data item.
Values for the selected data item are passed to the target report.
● To pass values from a source report parameter, click Pass parameter value, click Value,and then click the parameter.
Values for the selected parameter are passed to the target report.
● If you choose to pass parameters, and the source report is based on a dimensional package,
then click an item from the drop-down list in the Source metadata item properties column.
Professional Authoring User Guide 483
Chapter 17: Using Drill-through Access
You can pass the default property of the source metadata item (business key) or another
property, such as the member caption.
10. Click OK.
11. If you chose to run the target report, in the Format box, click the output format for your report.
Tip: Click (Default) to run the report using the default format specified for the report in IBM
Cognos Connection.
12. To open the target report in a new window, select the Open in new window check box.
13. In the Display prompt pages box, choose how to display prompt pages:
● To always display prompt pages when the drill-through action occurs regardless of whether
values were specified for the required parameter values, click Always.
● To use the prompt settings of the target report (specified by the Prompt for Values check
box in IBM Cognos Connection, Report Properties, Report tab) to determine whether to
show the prompt pages, click Based on the default prompt settings of the target report.
● To not display prompt pages when the required parameter values are provided by the drill-
through definition, click Only when required parameter values are missing. This is the
default setting.
The drill-through text appears as a blue hyperlink in text items in the non-chart areas of the report.
Report consumers can also start the drill-through action by clicking the Go To button or by right-
clicking the item and clicking Go To, Related links. If you have the necessary permissions, you can
view which parameters were passed from the source and how they are mapped in the target object
from the Go To page using the drill-through assistant.
For more information, see the IBM Cognos Administration and Security Guide.
Specify the Drill-through TextYou can specify the drill-through text that appears when users can drill through to more than one
target. For example, if users from different regions view the report, you can show text in a different
language for each region.
Steps
1. Right-click the drill-through object and click Drill-Through Definitions.
2. If more than one drill-through definition exists for the object, in the Drill-Through Definitionsbox, click a drill-through definition.
3. Click the Label tab.
4. To link the label to a condition, in the Condition box, do the following:
● Click Variable and click an existing variable or create a new one.
● Click Value and click one of the possible values for the variable.
484 Report Studio
Chapter 17: Using Drill-through Access
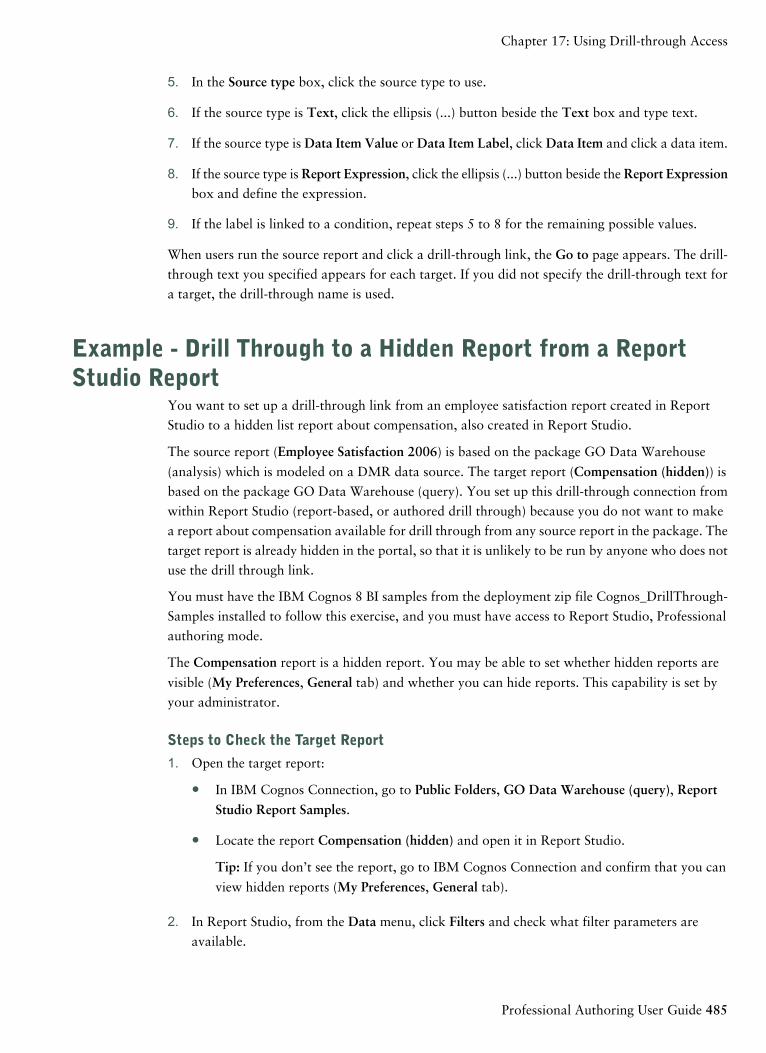
5. In the Source type box, click the source type to use.
6. If the source type is Text, click the ellipsis (...) button beside the Text box and type text.
7. If the source type is Data Item Value or Data Item Label, click Data Item and click a data item.
8. If the source type is Report Expression, click the ellipsis (...) button beside the Report Expressionbox and define the expression.
9. If the label is linked to a condition, repeat steps 5 to 8 for the remaining possible values.
When users run the source report and click a drill-through link, the Go to page appears. The drill-
through text you specified appears for each target. If you did not specify the drill-through text for
a target, the drill-through name is used.
Example - Drill Through to a Hidden Report from a ReportStudio Report
You want to set up a drill-through link from an employee satisfaction report created in Report
Studio to a hidden list report about compensation, also created in Report Studio.
The source report (Employee Satisfaction 2006) is based on the package GO Data Warehouse
(analysis) which is modeled on a DMR data source. The target report (Compensation (hidden)) is
based on the package GO Data Warehouse (query). You set up this drill-through connection from
within Report Studio (report-based, or authored drill through) because you do not want to make
a report about compensation available for drill through from any source report in the package. The
target report is already hidden in the portal, so that it is unlikely to be run by anyone who does not
use the drill through link.
You must have the IBM Cognos 8 BI samples from the deployment zip file Cognos_DrillThrough-
Samples installed to follow this exercise, and you must have access to Report Studio, Professional
authoring mode.
The Compensation report is a hidden report. You may be able to set whether hidden reports are
visible (My Preferences, General tab) and whether you can hide reports. This capability is set by
your administrator.
Steps to Check the Target Report
1. Open the target report:
● In IBM Cognos Connection, go to Public Folders, GO Data Warehouse (query), Report
Studio Report Samples.
● Locate the report Compensation (hidden) and open it in Report Studio.
Tip: If you don’t see the report, go to IBM Cognos Connection and confirm that you can
view hidden reports (My Preferences, General tab).
2. In Report Studio, from the Data menu, click Filters and check what filter parameters are
available.
Professional Authoring User Guide 485
Chapter 17: Using Drill-through Access
You want to filter from the source report on department, not time, so you will only use the
pPosition parameter in the drill-through definition.
3. In the report body, select the list column body Position-department (level 3) and review the
data item properties.
Because the drill-through definition goes from DMR to relational, the data item values will
need to match.
4. Close the Compensation (hidden) report.
Steps to Create and Test the Drill-Through Definition
1. Open the source report:
● In IBM Cognos Connection, go to Public Folders, GO Data Warehouse (analysis), Report
Studio Report Samples.
● Locate the Employee Satisfaction 2006 report and open it in Report Studio.
2. Save the Employee Satisfaction 2006 report with a new name, such as Employee Satisfaction
2006 New.
This is to keep the original report and drill-through definition intact for comparison.
3. In the table Employee rankings and terminations by department, select the column Position-
department (level 3).
4. In the properties pane, review the data item properties, to confirm that the data item names
match values in the target report.
5. In the properties pane, under Data, double-click Drill-through definitions.
6. Select the definition DrilltoHiddenRep and delete it.
Note: In the following steps, you recreate the drill-through definition. For comparison, use the
original sample report.
7. In the Drill-through Definitions box, click the new drill-through definition button.
8. Click the rename button, and type a name for the drill-through definition.
Tip: This is the name that consumers see when they select from a list of possible drill-through
definitions in the final report.
9. In the Target Report tab, select the target report:
● Under Report, click the ellipsis button (...).
● Navigate to GO Data Warehouse (query), Report Studio Report Samples, and select the
Compensation (hidden) report.
Tip: If you don’t see the report, go to IBM Cognos Connection and confirm that you can
see hidden reports (My Preferences, General tab).
10. Under Action, select Run the report.
486 Report Studio
Chapter 17: Using Drill-through Access
11. Under Parameters, click the edit button.
A table of parameters available in the target report appears, showing the parameter pPosition.
12. Map the parameter from the Compensation (Hidden) report to the metadata in the Employee
Satisfaction 2006 report:
● In the Method column, select Pass data item value, because the target report is based on a
relational data source.
● In the Value column, select Position-department (level 3).
Tip: In this report, you pass values from the column where the drill-through is defined. In
other cases, you might pass a related parameter. For example, you could drill through on
employee name, but pass the employee number.
13. Save the report.
14. Run the report, and click a department to test the drill-through definition.
When you test the drill-through link, the Compensation (hidden) report appears, filtered by the
department you selected. The report appears as a drill-through target whether or not it is hidden
in IBM Cognos Connection.
If your administrator has given you the capability to debug drill through, then you can see additional
information you right-click on the link and select Go To see a list of drill-through targets. From
the Go To page, you can see what source values are passed, and what target parameters are mapped.
Try It Yourself - Create a Report with Drill-through Access toItself
Create a report that drills to itself so that users can view detailed information in the same report.
In this topic, you learn how to create a report that shows revenue by each retailer. Users can access
detailed order information for a particular retailer.
It should take 20-25 minutes to complete this topic, and your report will look like this.
Professional Authoring User Guide 487
Chapter 17: Using Drill-through Access
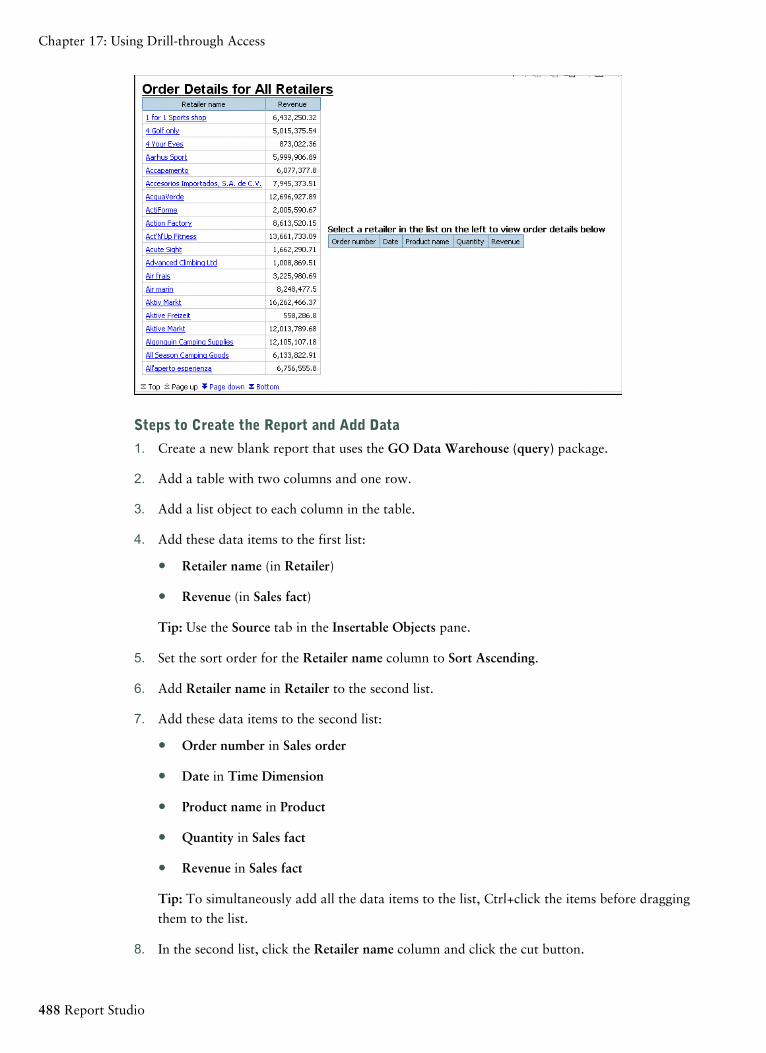
Steps to Create the Report and Add Data
1. Create a new blank report that uses the GO Data Warehouse (query) package.
2. Add a table with two columns and one row.
3. Add a list object to each column in the table.
4. Add these data items to the first list:
● Retailer name (in Retailer)
● Revenue (in Sales fact)
Tip: Use the Source tab in the Insertable Objects pane.
5. Set the sort order for the Retailer name column to Sort Ascending.
6. Add Retailer name in Retailer to the second list.
7. Add these data items to the second list:
● Order number in Sales order
● Date in Time Dimension
● Product name in Product
● Quantity in Sales fact
● Revenue in Sales fact
Tip: To simultaneously add all the data items to the list, Ctrl+click the items before dragging
them to the list.
8. In the second list, click the Retailer name column and click the cut button.
488 Report Studio
Chapter 17: Using Drill-through Access
9. In the second list, create the following parameterized filter:
[Retailer name]=?Selected retailer?
10. Save the report.
Steps to Set up Drill-through Access
1. In the left list, right-click a Retailer name column (and not the column title) and click Drill-
Through Definitions.
2. Create a new drill-through definition.
3. Specify the report as the target report.
4. Under Parameters, click the edit button.
5. Set the Selected retailer parameter to pass data item values using the Retailer name data item.
Steps to Add a Prompt
1. In the Toolbox tab, add a value prompt under the table.
Because you are setting up drill-through access to the same report, you must add a prompt with
a default value so that users are not prompted when they run the report.
2. In the Prompt Wizard, specify that the prompt is to use the existing parameter named Selected
retailer, and click Finish.
3. Click the value prompt.
4. In the Properties pane, double-click the Default Selections property and add a simple selection
named NoRetailer.
5. Set the following properties:
● Required to No
● Hide Adornments to Yes
● Visible to No
Steps to Add a Report Title
1. Double-click the report title and type the following text, adding a blank space at the end:
Order Details for
2. In the Toolbox tab, add the following layout calculation to the right of the report title:
if(ParamDisplayValue('Selected retailer')='NoRetailer') then 'All Retailers' else (ParamDisplay-
Value('Selected retailer'))
When the report is run, the report title changes to reflect the retailer selected by the user. If no
retailer is selected, 'All Retailers' appears.
Professional Authoring User Guide 489
Chapter 17: Using Drill-through Access
3. Click the layout calculation and, in the Properties pane, set the class to Report title text.
Steps to Add Conditional Formatting
1. Pause the pointer over the condition explorer button and click Variables.
Use conditional formatting to show a message above the second list when users have not
selected a retailer from the first list.
2. Create this boolean variable named HighLevel:
ParamDisplayValue('Selected retailer')<>'NoRetailer'
3. Pause the pointer over the page explorer button and click Page1.
4. In the Toolbox tab, add a block above the second list.
5. Insert a text item in the block with the following text:
Select a retailer in the left list to view order details below
6. Set the font style for the text to bold.
7. Click the text item and, in the Properties pane, set the Style Variable property to the HighLevelvariable.
8. Pause the pointer over the condition explorer and click the Yes value for the HighLevel variable.
9. Set the Visible property for the text item to No.
10. Triple-click the explorer bar to turn off conditional formatting.
11. Run the report to view what it will look like for your users.
A list appears on the left that shows revenue for each retailer. When users click a retailer, order
information for the selected retailer appears in the second list.
Need More Help?
● Use a Table to Control Where Objects Appear
● Add Relational Data to a Report
● Create a Parameter to Produce a Prompt
● Set Up Drill-through Access in a Report
● Create a Prompt Directly in a Report Page
● Using Relational Calculations
● Using the Expression Editor
● Add a Variable
● Hide or Show an Object
490 Report Studio
Chapter 17: Using Drill-through Access
Drilling Through from IBM Cognos Series 7 to IBM Cognos 8You can set up drill-through access from IBM Cognos Series 7 to IBM Cognos 8. Specifically, you
can drill through to an IBM Cognos 8 report from a PowerPlay Web report or IBM Cognos Visu-
alizer report. Drill through is supported for both PowerCubes and other cubes.
You must complete steps in both IBM Cognos Series 7 and IBM Cognos 8 to enable drill through.
Refer to the IBM Cognos Series 7 documentation for the specific steps you must complete in the
IBM Cognos Series 7 components. Cross references to the appropriate IBM Cognos Series 7 docu-
ments are included below.
Setting Up Drill-through Access from IBM Cognos VisualizerSetting up drill-through access from IBM Cognos Visualizer to IBM Cognos 8 involves
❑ specifying the IBM Cognos 8 target and selecting the filters to add to the target report
You must configure drill through to IBM Cognos 8 for individual IBM Cognos Visualizer
reports. For more information, see the IBM Cognos Visualizer User Guide.
❑ creating and testing the target report (p. 491)
Setting Up Drill-through Access from PowerPlay WebSetting up drill-through access from PowerPlay Web to IBM Cognos 8 involves
❑ for PowerCubes, specifying drill-through targets for IBM Cognos 8 reports in the Transformer
model
For more information, see the Transformer documentation.
❑ for other cubes, specifying drill-through targets for IBM Cognos 8 reports in PowerPlay Connect.
For more information, see the PowerPlay OLAP Server Connection Guide.
❑ configuring drill-through access in PowerPlay Server Administration
In addition to enabling drill-through access to IBM Cognos 8, you must specify the location of
the IBM Cognos 8 server and the IBM Cognos 8 folder that contains the target reports. For
more information, see the PowerPlay Enterprise Server Guide.
❑ selecting the filters to add to the target report
In PowerPlay Enterprise Server Administration, enable and use IBM Cognos 8 Assistance to
identify the filter expressions required in the target report. For more information, see the
PowerPlay Enterprise Server Guide.
❑ creating and testing the target report (p. 491)
Create and Test the Target for a Series 7 ReportThe target report must be based on a published package that contains the metadata items that you
want to filter on, or contains items that are mapped to those metadata items.
Professional Authoring User Guide 491
Chapter 17: Using Drill-through Access
When you create the target report, ensure that the names of the parameters you add are identical
to the parameter names listed in the Drill Through Assistant page in IBM Cognos Series 7. However,
the metadata item that you use in the target report for that parameter name does not have to be
the identical label. The data values between the target parameter and the source value shown in the
drill assistant must match. You may also need to change the type of operator in the target parameter
from what is recommended in the Drill Through Assistant. For example, if the assistant recommends
an = operator but you want to pass a date range, you should change the parameter operator in the
target to in_range.
Steps
1. Start Report Studio (Professional authoring mode) and create a new report.
2. Add the data items and other objects you want.
3. From the Data menu, click Filters.
4. In the Detail Filters tab, click the add button.
5. In the Expression Definition box, create the parameterized filter you want by typing the filter
expression.
6. Click OK.
7. In the Usage box, click Optional.
If you do not make the filter optional, a prompt page appears when you drill through to the
report.
8. Repeat steps 4 to 7 for other parameterized filters you want to add.
9. Save the report.
The report name must match what you specified as a target in the PowerCube, other cube, or
IBM Cognos Visualizer report.
10. Test the drill through in the PowerPlay report or IBM Cognos Visualizer report.
492 Report Studio
Chapter 17: Using Drill-through Access
Chapter 18: Working with Multiple Pages
Divide a report into multiple pages and add navigation elements to make it easier to use.
Working with multiple pages includes
● adding a page to a report
● creating page breaks and page sets
● joining nested page sets
● adding bookmarks
● creating a table of contents
● inserting page numbers
● controlling page breaks and page numbering
Note: The pages that you see in the Page Explorer differ from physical, printed pages. For example,
if you create page breaks in a long report, the Page Explorer could show only one page, but your
report could include several physical pages when you print it.
Add a Page to a ReportReports may contain pages with a variety of content. Pages may be added to create a multiple-page
report. For example, you are creating a sales report and you want to include general information
about the company. You decide to create an introduction page to show this information. When
you run the report, page 1 of the report is the introduction page and the following pages contain
data.
Tip: The TOC Report sample report (p. 539) in the GO Data Warehouse (query) package includes
multiple pages. For more information about The Great Outdoors Company samples, see "Sample
Reports and Packages" (p. 521).
You can also create page sets to control the rendering of pages in a report.
Steps
1. Pause the pointer over the page explorer button and click Report Pages.
Tip: Click Prompt Pages to add a prompt page (p. 391).
2. In the Insertable Objects pane, on the Toolbox tab , drag Page to the work area.
3. To change the order of pages, drag pages above or below other pages.
4. To associate a query to the page, in the Properties pane, set the Query property to the query.
Associate the page to a query to add data-related objects directly to the page header, body, or
footer, such as data items and filters.
Professional Authoring User Guide 493
5. Double-click the page to open it in page design view (p. 406).
6. Add objects to the page.
Create a Page Break or Page SetYou can create simple page breaks, or you can create advanced page sets to associate pages with a
query structure to force page breaks. For example, a query contains the data item Product line,
which is grouped. Creating a page set that is associated with this query adds page breaks for each
product line. When working with dimensional data, you can use the Page layers area to show values
on a separate page for each member (p. 506).
Tip: The Global Bonus Report sample report (p. 531) in the GO Data Warehouse (analysis) package
includes page sets. For more information about The Great Outdoors Company samples, see "Sample
Reports and Packages" (p. 521).
Steps to Create Simple Page Breaks
1. Click the data item at which the report should break to a new page.
2. From the Structure menu, do one of the following:
● To create a page break without creating a master detail relationship, click Set Page Break.
This option only works if the data item is in a list or repeater. If the data item is in a crosstab
or chart, Report Studio creates a page break using a master detail relationship. Setting page
breaks without using master detail relationships can improve performance when running
the report.
● To create a page break using a master detail relationship, click Set Page Break Using
Master/Detail.
Report Studio confirms the page break setting.
Tip: To modify simple page break settings, pause the pointer over the page explorer button
and click Report Pages, and then select and modify the page set.
Steps to Create Advanced Page Sets
1. Pause the pointer over the page explorer button and click Report Pages.
2. Create the report pages (p. 493).
3. In the Insertable Objects pane, on the Toolbox tab , drag the Page Set object to the Report
Pages pane.
4. In the Properties pane, set the Query property to the query to associate with the page set.
5. Organize the pages in the report by dragging report pages to page sets.
6. Insert the page containing details in the Detail Pages folder.
Detail pages are the pages that repeat based on the items by which you group in the following
step.
494 Report Studio
Chapter 18: Working with Multiple Pages
Tip: You can insert multiple detail pages into the same page set and link them using a master
detail relationship (p. 221).
7. Define the grouping structure for the page set:
● Click the page set.
● In the Properties pane, double-click the Grouping & Sorting property.
● In the Data Items pane, drag the data item by which to group data items to the Groups
folder in the Groups pane.
● To sort the data within each group, in the Data Items pane, drag the data item by which
to sort to the Detail Sort List folder, and then click the sort order button to specify
the sort order. For more information about sorting data, see "Sorting Relational
Data" (p. 170) or "Sorting Dimensional Data" (p. 211).
8. Repeat steps 3 to 7 to create other page sets.
Tip: You can nest page sets and join them (p. 495) by defining a master detail relationship.
Create nested page sets to have pages occur within other pages. For example, you want pages
containing product type information to occur within pages containing product line information.
Note: Grouping an item for a page set is not the same as grouping a column in the layout (p. 150).
Grouping a column in the layout visually shows groups in a report. Grouping an item for a page
set groups the item in the query. If you want to use an item that is already grouped in the layout,
you must still perform step 7.
Join Nested Page SetsIf you have nested page sets in your report, define a master detail relationship between them to see
data in the nested page set that is related to the data in the parent page set. For example, you have
a page set that shows pages of product line information. The page set contains a nested page set
that shows pages of product type information. For each product line page, you want to see the
related product type pages, as shown below:
Product line_1
● Product type_1
● Product type_2
● Product type_3
Product line_2
● Product type_4
● Product type_5
Professional Authoring User Guide 495
Chapter 18: Working with Multiple Pages
● Product type_6
Steps
1. Pause the pointer over the page explorer button and click Report Pages.
2. In the Report Pages pane, click the nested page set.
3. In the Properties pane, double-click the Master Detail Relationships property.
4. Click the New Link button.
5. In the Master Query box, click the data item that provides the primary information.
6. Link the master data item to the details by doing one of the following:
● To link to another data item in the detail query, in the Detail Query box, click the data
item that provides the detailed information.
● To link to a parameter, in the Parameters box, click the parameter that provides the detailed
information.
7. Repeat steps 4 to 6 to create other links.
Tip: To delete a link, select it and press the Delete key.
For more information about master detail relationships, see "Create a Master Detail Relation-
ship" (p. 221).
Example - Preparing a Product List ReportYou are a report author at The Great Outdoors Company, which sells sporting equipment. You
are requested to create a multiple-page report showing all products sold by the company. You are
asked to create title and end pages and to have each product line appear on a new page preceded
by a header page and followed by a footer page.
Steps
1. Open Report Studio with the GO Data Warehouse (query) package.
2. In the Welcome dialog box, click Create a new report or template.
3. In the New dialog box, click List and click OK.
4. In the Insertable Objects pane, on the Source tab , expand Sales and Marketing (query),
Sales (query), and Product, and double-click the following:
● Product line
● Product type
● Product name
5. Expand Sales fact and double-click Product cost.
496 Report Studio
Chapter 18: Working with Multiple Pages
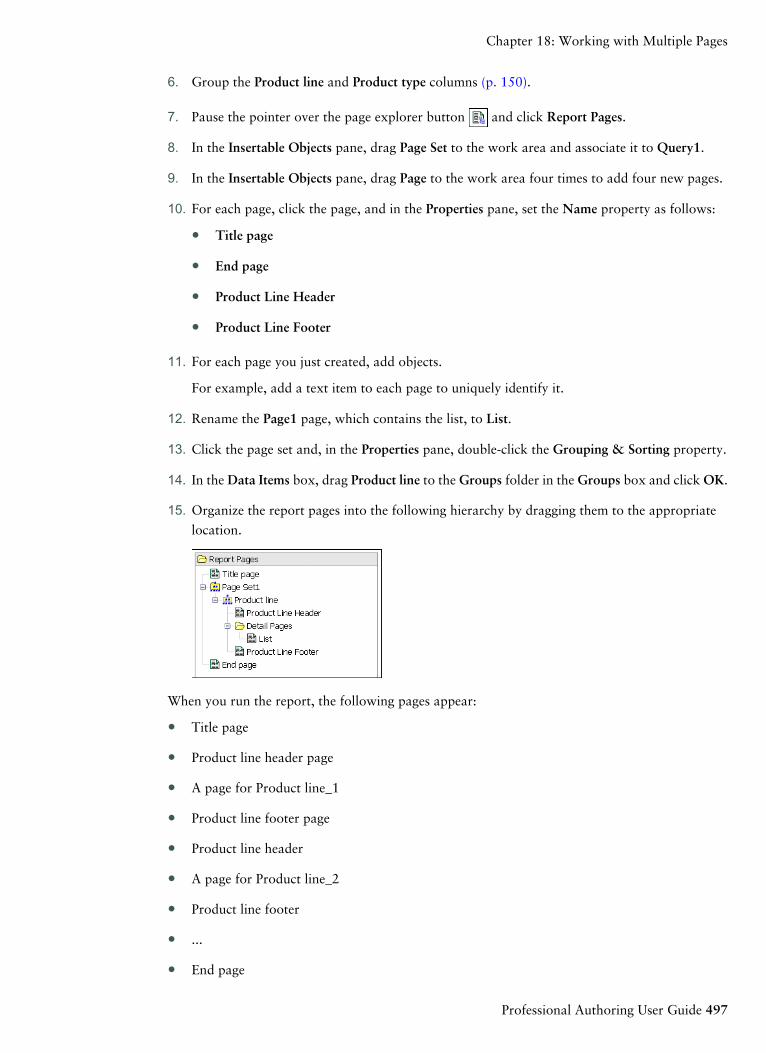
6. Group the Product line and Product type columns (p. 150).
7. Pause the pointer over the page explorer button and click Report Pages.
8. In the Insertable Objects pane, drag Page Set to the work area and associate it to Query1.
9. In the Insertable Objects pane, drag Page to the work area four times to add four new pages.
10. For each page, click the page, and in the Properties pane, set the Name property as follows:
● Title page
● End page
● Product Line Header
● Product Line Footer
11. For each page you just created, add objects.
For example, add a text item to each page to uniquely identify it.
12. Rename the Page1 page, which contains the list, to List.
13. Click the page set and, in the Properties pane, double-click the Grouping & Sorting property.
14. In the Data Items box, drag Product line to the Groups folder in the Groups box and click OK.
15. Organize the report pages into the following hierarchy by dragging them to the appropriate
location.
When you run the report, the following pages appear:
● Title page
● Product line header page
● A page for Product line_1
● Product line footer page
● Product line header
● A page for Product line_2
● Product line footer
● ...
● End page
Professional Authoring User Guide 497
Chapter 18: Working with Multiple Pages
Add a BookmarkAdd a bookmark so that users can quickly move from one part of a report to another. For example,
a list report contains many rows of data. You add bookmarks so that users can move to specific
rows.
You can also drill through to another report (p. 481).
If you want to use page numbers to move from one part of a report to another, you can also create
a table of contents (p. 500).
Bookmarks work for reports produced in HTML format or PDF. In HTML format, they work best
when viewing saved report outputs, as the entire report appears in a single HTML page. When
reports are run interactively, more than one HTML page may be generated, and a bookmark works
only if the target exists in the page currently being viewed.
Tip: You can reduce the number of HTML pages generated when a report is run interactively by
specifying a value for the Rows Per Page property for a data container in the report.
Tip:The Briefing Book sample report (p. 540) in the GO Sales (analysis) package includes bookmarks.
For more information about The Great Outdoors Company samples, see "Sample Reports and
Packages" (p. 521).
Steps
1. In the Insertable Objects pane, click the Toolbox tab .
2. Drag a Bookmark object to the report.
3. Click the bookmark and, in the Properties pane, set the Source Type property to a source type.
DescriptionSource type
Creates a static bookmark using a text value.Text
For example, a list has sections and you want users to jump
from each section to the top of the report.
Creates a dynamic bookmark whose values are derived from
an expression that you define.Report Expression
Creates a dynamic bookmark that has data as possible values.
This is useful for creating a context-based bookmark.Data Item Value
For example, a list has sections and you want users to jump
from the top of the report to a specific section.
Note: This source type appears only if the bookmark is inserted
next to a data item.
498 Report Studio
Chapter 18: Working with Multiple Pages
DescriptionSource type
Creates a bookmark that has the label of a data item as its
value. Use this source type to jump to the first occurrence of
a data item label.
Data Item Label
For example, a list is divided into sections using Product line.
You want users to jump to the first product line section that
appears in the list rather than to a specific section, such as
Camping Equipment.
Note: This source type appears only if the bookmark is inserted
next to a data item.
In a crosstab, creates a dynamic bookmark that uses member
captions as possible values.Member Caption
In a crosstab, creates a dynamic bookmark that uses cell values
as possible values.Cell Value
4. Set the property that appears under the source type you chose to the bookmark value.
For example, if the source type is Data Item Value, set the Data Item Value property to the
data item.
5. Right-click the object that will jump to the bookmark and click Drill-Through Definitions.
For example, right-click a data item, image, chart, or text item.
Tip: The object can exist in a different report, so you can jump from one report to another.
6. Click the new drill-through definition button .
7. Click the Bookmark tab.
8. Click Source type and click one of the source types described in step 3.
Click the source type to use to produce the value needed to jump to the bookmark. For example,
click Data Item Values if you want the value to come from a data item such as Product line.
9. If you clicked one of the following source types, specify the value to use to jump to the book-
mark.
● For Text, click the ellipsis (...) button next to Text and type a text value.
● For Data Item Value or Data Item Label, in the Data item list, choose a data item.
● For Report Expression, click the ellipsis (...) button next to Report expression and define
the expression.
Professional Authoring User Guide 499
Chapter 18: Working with Multiple Pages
Create a Table of ContentsYou can create a table of contents that appears in the rendered output of your report. A table of
contents is useful for reports that include sectioned items, grouped items, or multiple pages in the
layout. The report output indicates page numbers and allows for easy navigation.
You can include multiple tables of contents in your report, which are useful if your report contains
grouped lists. You can also add section numbers in front of entries in the table of contents by
modifying the heading level property.
Table of contents entries are logical markers placed anywhere in a report. For example, you can
place entries at the top of a page or in a list group header to mark each grouped data value. Although
table of contents entries are visible in Report Studio, they cannot be seen when a report is run.
A table of contents works only for reports produced in PDF or non-interactive HTML format. In
HTML format, they work best when viewing saved report outputs, as the entire report appears in
a single HTML page. When reports are run interactively, more than one HTML page may be gen-
erated, and a table of contents works only if the target exists in the page currently being viewed.
Tip: You can reduce the number of HTML pages generated when a report is run interactively by
specifying a value for the Rows Per Page property for a data container in the report.
If you want to quickly move from one part of a report to another without using page numbers, you
can add bookmarks (p. 498).
You must first create a table of contents before adding entries in the report. All entries must be
inserted after the table of contents in the report layout.
Tip: The Briefing Book sample report (p. 540) in the GO Sales (analysis) package includes a table
of contents. For more information about The Great Outdoors Company samples, see "Sample
Reports and Packages" (p. 521).
Steps
1. In the Insertable Objects pane, click the Toolbox tab.
2. Drag the Table of Contents object to the new location, which can be anywhere in the report.
A table of contents placeholder appears.
3. Drag the Table of Contents Entry object to the location of your first table of contents marker.
Tip: You can also click Insert Table of Contents Entry from the Structure menu.
The new entry appears in the table of contents.
4. Double-click the Double click to edit text box of the new marker.
5. In the Text box, type the text to appear in the table of contents and click OK.
6. To edit the heading level of a table of contents entry, click the entry and, in the Properties pane,
set the Heading Level property to the level.
The heading level is used to insert section numbers in front of entries in the table of contents
using layout calculations.
500 Report Studio
Chapter 18: Working with Multiple Pages
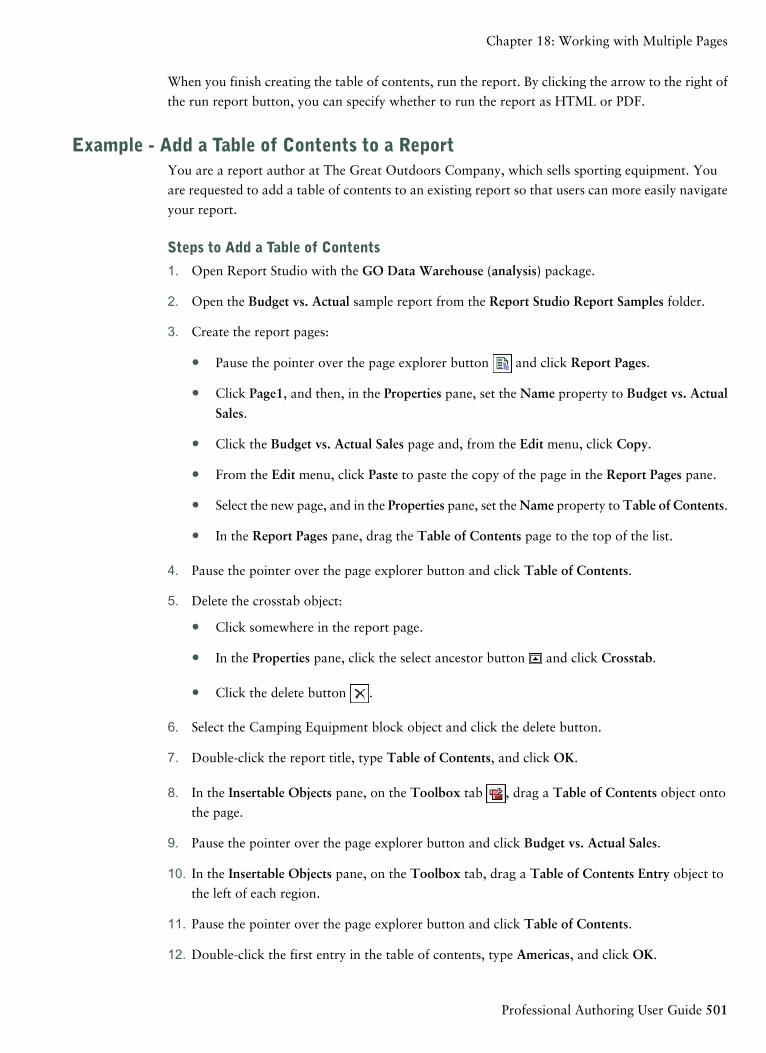
When you finish creating the table of contents, run the report. By clicking the arrow to the right of
the run report button, you can specify whether to run the report as HTML or PDF.
Example - Add a Table of Contents to a ReportYou are a report author at The Great Outdoors Company, which sells sporting equipment. You
are requested to add a table of contents to an existing report so that users can more easily navigate
your report.
Steps to Add a Table of Contents
1. Open Report Studio with the GO Data Warehouse (analysis) package.
2. Open the Budget vs. Actual sample report from the Report Studio Report Samples folder.
3. Create the report pages:
● Pause the pointer over the page explorer button and click Report Pages.
● Click Page1, and then, in the Properties pane, set the Name property to Budget vs. Actual
Sales.
● Click the Budget vs. Actual Sales page and, from the Edit menu, click Copy.
● From the Edit menu, click Paste to paste the copy of the page in the Report Pages pane.
● Select the new page, and in the Properties pane, set the Name property to Table of Contents.
● In the Report Pages pane, drag the Table of Contents page to the top of the list.
4. Pause the pointer over the page explorer button and click Table of Contents.
5. Delete the crosstab object:
● Click somewhere in the report page.
● In the Properties pane, click the select ancestor button and click Crosstab.
● Click the delete button .
6. Select the Camping Equipment block object and click the delete button.
7. Double-click the report title, type Table of Contents, and click OK.
8. In the Insertable Objects pane, on the Toolbox tab , drag a Table of Contents object onto
the page.
9. Pause the pointer over the page explorer button and click Budget vs. Actual Sales.
10. In the Insertable Objects pane, on the Toolbox tab, drag a Table of Contents Entry object to
the left of each region.
11. Pause the pointer over the page explorer button and click Table of Contents.
12. Double-click the first entry in the table of contents, type Americas, and click OK.
Professional Authoring User Guide 501
Chapter 18: Working with Multiple Pages
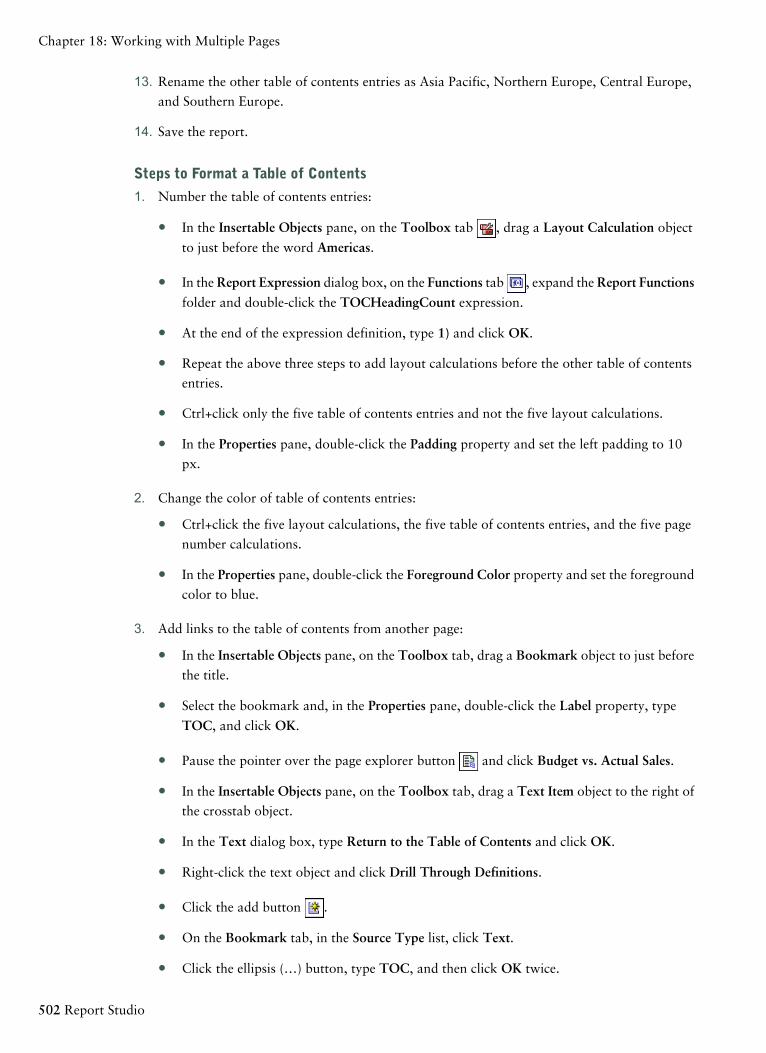
13. Rename the other table of contents entries as Asia Pacific, Northern Europe, Central Europe,
and Southern Europe.
14. Save the report.
Steps to Format a Table of Contents
1. Number the table of contents entries:
● In the Insertable Objects pane, on the Toolbox tab , drag a Layout Calculation object
to just before the word Americas.
● In theReport Expression dialog box, on the Functions tab , expand theReport Functions
folder and double-click the TOCHeadingCount expression.
● At the end of the expression definition, type 1) and click OK.
● Repeat the above three steps to add layout calculations before the other table of contents
entries.
● Ctrl+click only the five table of contents entries and not the five layout calculations.
● In the Properties pane, double-click the Padding property and set the left padding to 10
px.
2. Change the color of table of contents entries:
● Ctrl+click the five layout calculations, the five table of contents entries, and the five page
number calculations.
● In the Properties pane, double-click the Foreground Color property and set the foreground
color to blue.
3. Add links to the table of contents from another page:
● In the Insertable Objects pane, on the Toolbox tab, drag a Bookmark object to just before
the title.
● Select the bookmark and, in the Properties pane, double-click the Label property, type
TOC, and click OK.
● Pause the pointer over the page explorer button and click Budget vs. Actual Sales.
● In the Insertable Objects pane, on the Toolbox tab, drag a Text Item object to the right of
the crosstab object.
● In the Text dialog box, type Return to the Table of Contents and click OK.
● Right-click the text object and click Drill Through Definitions.
● Click the add button .
● On the Bookmark tab, in the Source Type list, click Text.
● Click the ellipsis (…) button, type TOC, and then click OK twice.
502 Report Studio
Chapter 18: Working with Multiple Pages
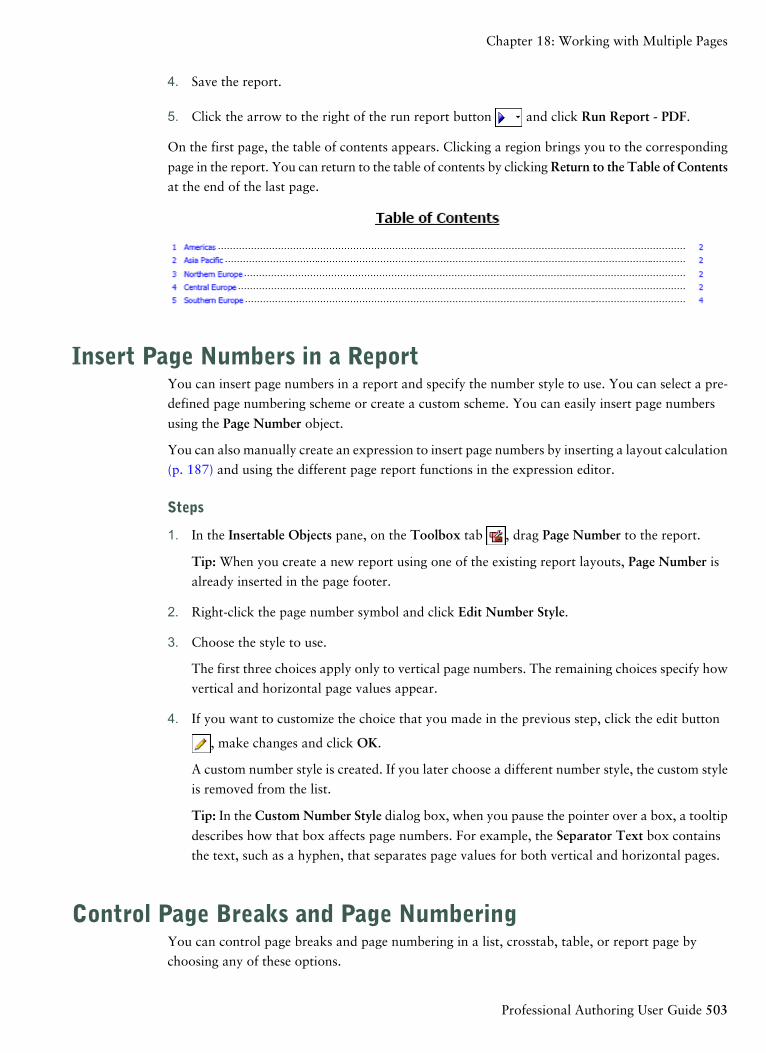
4. Save the report.
5. Click the arrow to the right of the run report button and click Run Report - PDF.
On the first page, the table of contents appears. Clicking a region brings you to the corresponding
page in the report. You can return to the table of contents by clickingReturn to the Table of Contentsat the end of the last page.
Insert Page Numbers in a ReportYou can insert page numbers in a report and specify the number style to use. You can select a pre-
defined page numbering scheme or create a custom scheme. You can easily insert page numbers
using the Page Number object.
You can also manually create an expression to insert page numbers by inserting a layout calculation
(p. 187) and using the different page report functions in the expression editor.
Steps
1. In the Insertable Objects pane, on the Toolbox tab , drag Page Number to the report.
Tip: When you create a new report using one of the existing report layouts, Page Number is
already inserted in the page footer.
2. Right-click the page number symbol and click Edit Number Style.
3. Choose the style to use.
The first three choices apply only to vertical page numbers. The remaining choices specify how
vertical and horizontal page values appear.
4. If you want to customize the choice that you made in the previous step, click the edit button
, make changes and click OK.
A custom number style is created. If you later choose a different number style, the custom style
is removed from the list.
Tip: In the Custom Number Style dialog box, when you pause the pointer over a box, a tooltip
describes how that box affects page numbers. For example, the Separator Text box contains
the text, such as a hyphen, that separates page values for both vertical and horizontal pages.
Control Page Breaks and Page NumberingYou can control page breaks and page numbering in a list, crosstab, table, or report page by
choosing any of these options.
Professional Authoring User Guide 503
Chapter 18: Working with Multiple Pages
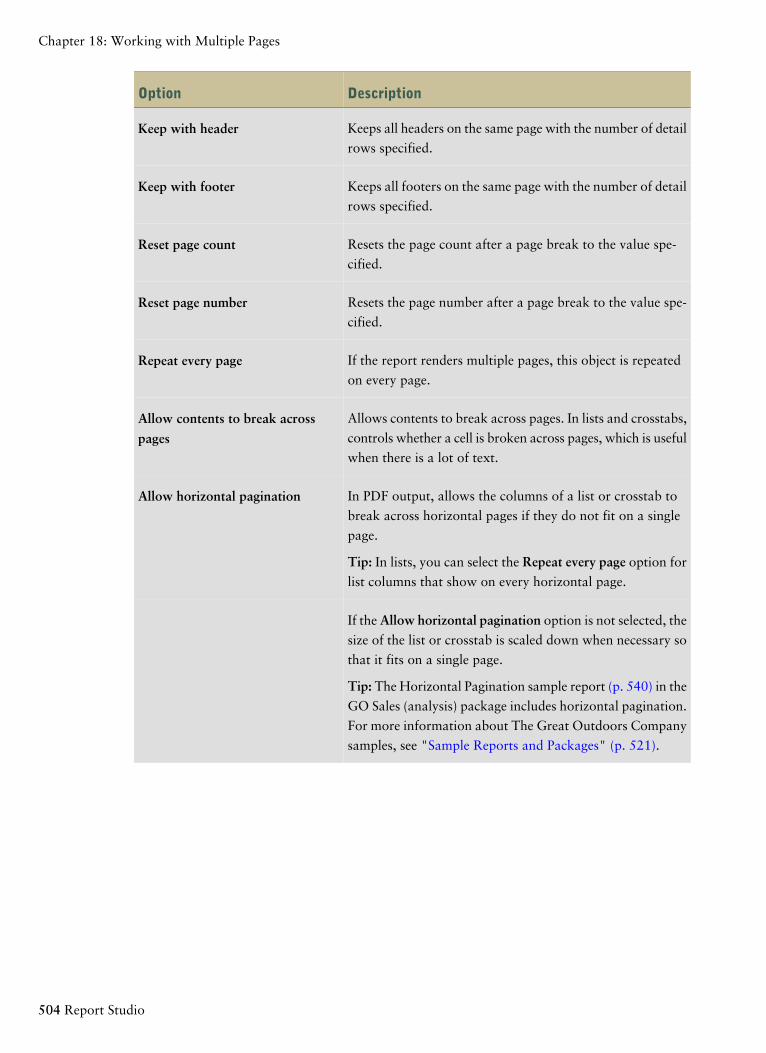
DescriptionOption
Keeps all headers on the same page with the number of detail
rows specified.Keep with header
Keeps all footers on the same page with the number of detail
rows specified.Keep with footer
Resets the page count after a page break to the value spe-
cified.Reset page count
Resets the page number after a page break to the value spe-
cified.Reset page number
If the report renders multiple pages, this object is repeated
on every page.Repeat every page
Allows contents to break across pages. In lists and crosstabs,
controls whether a cell is broken across pages, which is useful
when there is a lot of text.
Allow contents to break across
pages
In PDF output, allows the columns of a list or crosstab to
break across horizontal pages if they do not fit on a single
page.
Allow horizontal pagination
Tip: In lists, you can select the Repeat every page option for
list columns that show on every horizontal page.
If the Allow horizontal pagination option is not selected, the
size of the list or crosstab is scaled down when necessary so
that it fits on a single page.
Tip: The Horizontal Pagination sample report (p. 540) in the
GO Sales (analysis) package includes horizontal pagination.
For more information about The Great Outdoors Company
samples, see "Sample Reports and Packages" (p. 521).
504 Report Studio
Chapter 18: Working with Multiple Pages
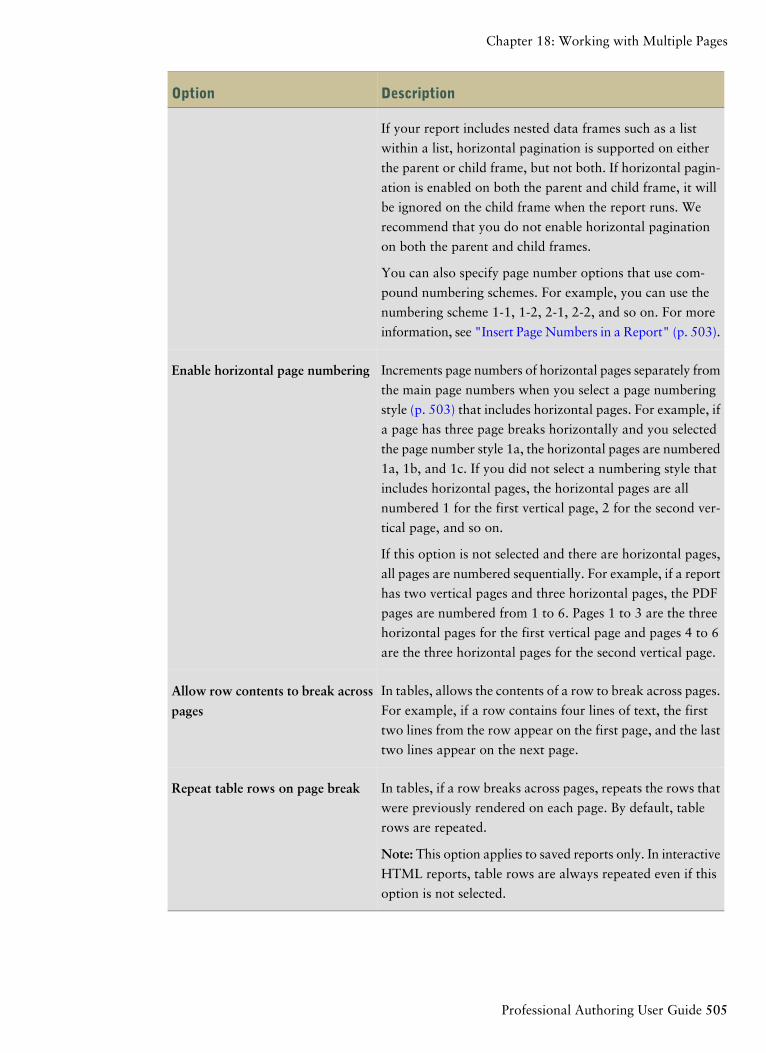
DescriptionOption
If your report includes nested data frames such as a list
within a list, horizontal pagination is supported on either
the parent or child frame, but not both. If horizontal pagin-
ation is enabled on both the parent and child frame, it will
be ignored on the child frame when the report runs. We
recommend that you do not enable horizontal pagination
on both the parent and child frames.
You can also specify page number options that use com-
pound numbering schemes. For example, you can use the
numbering scheme 1-1, 1-2, 2-1, 2-2, and so on. For more
information, see "Insert Page Numbers in a Report" (p. 503).
Increments page numbers of horizontal pages separately from
the main page numbers when you select a page numbering
style (p. 503) that includes horizontal pages. For example, if
a page has three page breaks horizontally and you selected
the page number style 1a, the horizontal pages are numbered
1a, 1b, and 1c. If you did not select a numbering style that
includes horizontal pages, the horizontal pages are all
numbered 1 for the first vertical page, 2 for the second ver-
tical page, and so on.
Enable horizontal page numbering
If this option is not selected and there are horizontal pages,
all pages are numbered sequentially. For example, if a report
has two vertical pages and three horizontal pages, the PDF
pages are numbered from 1 to 6. Pages 1 to 3 are the three
horizontal pages for the first vertical page and pages 4 to 6
are the three horizontal pages for the second vertical page.
In tables, allows the contents of a row to break across pages.
For example, if a row contains four lines of text, the first
two lines from the row appear on the first page, and the last
two lines appear on the next page.
Allow row contents to break across
pages
In tables, if a row breaks across pages, repeats the rows that
were previously rendered on each page. By default, table
rows are repeated.
Repeat table rows on page break
Note: This option applies to saved reports only. In interactive
HTML reports, table rows are always repeated even if this
option is not selected.
Professional Authoring User Guide 505
Chapter 18: Working with Multiple Pages
You can also specify the style to use for page numbers (p. 503).
Steps
1. Click an object.
2. In the Properties pane, double-click the Pagination property.
3. Specify the page break and numbering options.
Create Page LayersWhen working with dimensional data, you can create page layers in a report to show values for
each member on a separate page. For example, your report contains payroll information for the
entire company. You want to view values for each department on a separate page.
After you create page layers, a caption appears in the header to indicate the contents of each page.
You can navigate between the different pages using links below the report.
Creating page layers is similar to filtering using context (p. 208). However, with context filters,
values are filtered according to the member you add to the Context filter area. With page layers,
the report is split into a separate page for each child of the member you add to the Page layers area.
To create more complex page layers in your reports, such as a report book with title and end pages,
create page sets (p. 494).
Steps
1. In the source tree, select or search for one or more items on which to filter.
2. Drag the item into the Page layers section of the overview area.
The crosstab shows the results for the children of the selected item on separate pages, and a
list appears under Page layers.
Tip: To navigate between pages, click Page down and Page up below the report.
3. To replace the page breaks with items from the same dimension, select an item from the list.
To delete the page breaks, from the list, click Delete. To delete all the page breaks, right-click
the Page layers area and click Delete All.
506 Report Studio
Chapter 18: Working with Multiple Pages
Chapter 19: Creating Report Templates
A report template is a pattern you use to build reports. Create your own report templates when
you frequently produce the same type of report. A template can include the report objects that are
described in "Laying Out a Report" (p. 405).
To create a report template, you can
● convert a report to a template
● create a new template
For more information about how to create a report template, see the Report Studio Quick Tour.
In addition, you can use sample reports provided with Report Studio.
Tip: You can add your own report templates to the New dialog box. For more information, see
the Administration and Security Guide.
Convert a Report to a TemplateConvert a new or existing report to a template so it can be reused.
Steps
1. Create a new report or open an existing report.
2. Add objects to the work area.
3. From the File menu, click Convert To Template.
Any query-related information in the original report, such as data items, calculations, and filters,
is removed from the template.
4. From the File menu, click Save As to save the template as a new file and keep the original report
intact.
Create a New TemplateCreate a new template to provide Query Studio and Analysis Studio users with a layout that they
can use to create reports or they can apply to existing reports. You can also use the template in
Query Studio to define a layout for prompt pages.
Steps
1. From the File menu, click New.
2. Click Report Template and click OK.
3. Pause the pointer over the page explorer button and click the report page or prompt page
to format.
Professional Authoring User Guide 507

Tip: To create a new report page or prompt page, click the Report Pages or Prompt Pages folder
and drag the page to the Report Pages or Prompt Pages pane.
4. In the Insertable Objects pane, click the Toolbox tab .
5. Add the objects to the work area.
If you add objects that are not supported by Query Studio, the objects will be ignored when
you apply the template.
6. Save the template.
508 Report Studio
Chapter 19: Creating Report Templates
Chapter 20: Managing Existing Reports
After you have created a report, you can make changes or enhancements, such as setting up the
report for bursting.
Before you modify an existing report, ensure that you have the proper security permissions. For
more information, see the Administration and Security Guide.
You can
● open and save reports locally
● open reports from the clipboard
● open files from other Studios
● manage changes in the package
Open and Save a Report LocallyBy default, the reports you create are stored on the IBM Cognos 8 server. You can, however, open
and save reports on your computer. This is useful to send a report to a report author who is
working in a different environment or to save the report to a source code controlled directory on
a local network or drive.
Steps
1. Obtain the LFA.dll from your IBM Cognos 8 administrator.
The DLL is located in the bin directory where IBM Cognos 8 is installed.
2. Open a command prompt window.
3. Register the LFA.dll file by typing the following:
regsvr32 LFA.dll
4. In Internet Explorer, set your computer and the IBM Cognos 8 server as trusted sites:
● From the Tools menu, click Internet Options.
● On the Security tab, click Trusted sites.
● Click Sites.
● Clear the Require server verification (https:) for all sites in this zone check box.
● In the Add this Web site to the zone box, type http://localhost and click Add.
Tip: If the IBM Cognos 8 server is not on the same computer as the browser, type
http://<computer name> instead.
● Repeat the above step for http://<IBM Cognos 8 servername>.
Professional Authoring User Guide 509
5. In Report Studio, from the Tools menu, click Options.
6. Click the Advanced tab.
7. Select the Allow local file access check box and click OK.
The menu items (Local) Open and (Local) Save As appear in the File menu.
8. Close and restart Report Studio.
You can now open and save reports on your computer. The first time you try to open or save a
report locally, Internet Explorer asks you whether you want to allow an ActiveX control on the
page to interact with other parts of the page. Click Yes to continue.
Open a Report from the ClipboardYou can open a report specification (p. 57) that was previously copied to the clipboard (from the
Tools menu, click Copy To Clipboard). This is useful for importing an XML report specification
from outside the IBM Cognos 8 environment.
Although Report Studio attempts to validate the report specification, it is your responsibility to
ensure that it is correct. For more information, see the IBM Cognos 8 SDK Developer Guide.
Step
● From the Tools menu, click Open Report from Clipboard.
Open a File from Another StudioYou can open reports, templates, or analyses that were created in Query Studio or Analysis Studio
in Report Studio. All the capabilities of Report Studio are available to you so you can change
formatting, layout, calculations, and queries.
You can also open a report, template, or analysis in Report Studio from IBM Cognos Connection
with the Open with Report Studio action .
Steps
1. From the File menu, click Open.
2. Click the report, template, or analysis.
3. Click Open.
Note: If you make and save changes to a Query Studio report or an Analysis Studio analysis in
Report Studio, the report or analysis can no longer be opened in Query Studio and Analysis Studio.
Analysis Studio Query SpecificationAnalysis Studio defines each group of rows and columns as a set. When you import an analysis into
Report Studio, the report will have one query that processes all the sets found on the crosstab. Each
set is defined by 18 data items that segment and summarize the base set definition. To maintain
510 Report Studio
Chapter 20: Managing Existing Reports
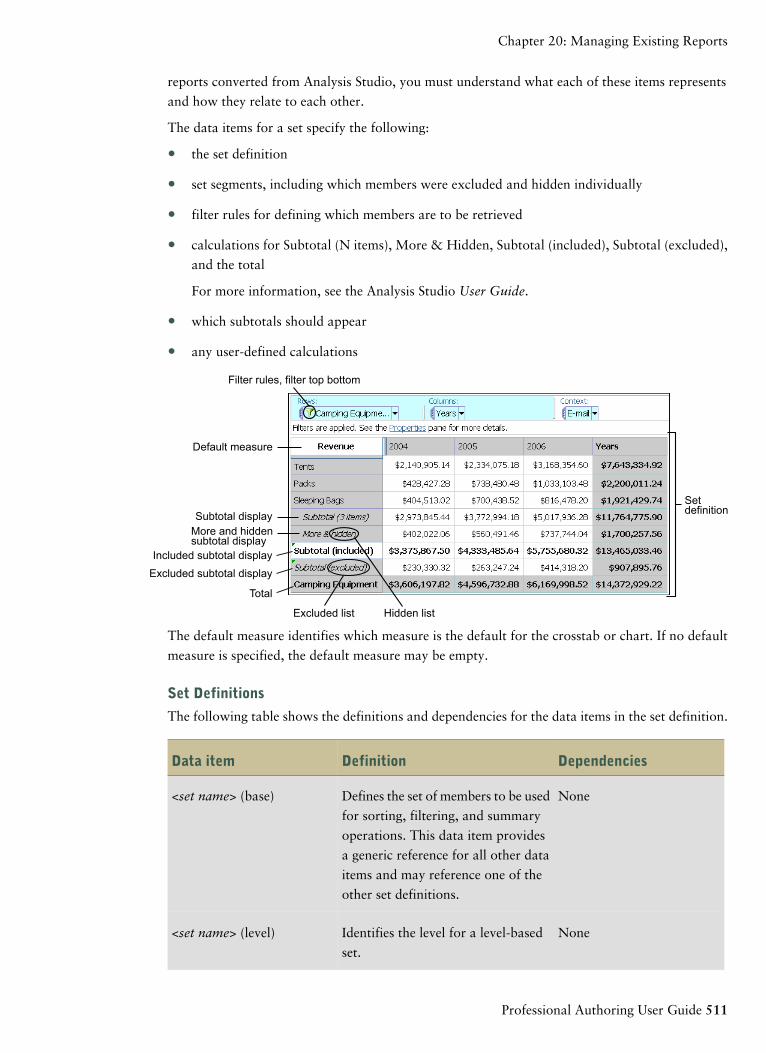
reports converted from Analysis Studio, you must understand what each of these items represents
and how they relate to each other.
The data items for a set specify the following:
● the set definition
● set segments, including which members were excluded and hidden individually
● filter rules for defining which members are to be retrieved
● calculations for Subtotal (N items), More & Hidden, Subtotal (included), Subtotal (excluded),
and the total
For more information, see the Analysis Studio User Guide.
● which subtotals should appear
● any user-defined calculations
Filter rules, filter top bottom
Default measure
Subtotal display
Included subtotal display
More and hiddensubtotal display
Excluded subtotal display
Total
Setdefinition
Excluded list Hidden list
The default measure identifies which measure is the default for the crosstab or chart. If no default
measure is specified, the default measure may be empty.
Set Definitions
The following table shows the definitions and dependencies for the data items in the set definition.
DependenciesDefinitionData item
NoneDefines the set of members to be used
for sorting, filtering, and summary
operations. This data item provides
a generic reference for all other data
items and may reference one of the
other set definitions.
<set name> (base)
NoneIdentifies the level for a level-based
set.
<set name> (level)
Professional Authoring User Guide 511
Chapter 20: Managing Existing Reports
DependenciesDefinitionData item
NoneDefines the list of members in a
selection-based set.
<set name> (list)
NoneDefines the set of members at N,
number of levels down.
<set name> (depth N)
NoneReferences a predefined set.<set name> (named set)
Set Segments Definitions
The following table shows the definitions and dependencies for the data items in the set segment
definition.
DependenciesDefinitionData item
<set definition>Lists the members that are manually
hidden using the Hide command in
Analysis Studio. This set appears
when you try to unhide a member.
<set definition> (hidden list)
<set definition> (hidden list)Lists the set of members after filters
are applied and hidden items are
excluded, but before the More limit
is applied. Sort or order operations,
if any, are defined in this data item.
<set definition> (included set)
<set definition> (included set)Limits the set to show the number of
members according to the More limit
with a small tolerance. The tolerance
allows showing the last two members
if they are all that remain in the Moreportion of the set.
<set definition> (visible items
set)
The choice of visible members can be
based on a sort order.
<set definition>Identifies members that were manu-
ally excluded from the analysis. If no
members were manually excluded,
the expression defines an emptySet().
This set appears when you try to
remove a member from the Excluded
items list in the Properties pane.
<set definition> (excluded
list)
512 Report Studio
Chapter 20: Managing Existing Reports
Filters
The following table shows the definitions and dependencies for the data items in the filter.
DependenciesDefinitionData item
<set definition>Specifies the user-defined filter rules
to reduce the set definition using
operators such as greater than or less
than based on measures, calculations,
or attributes.
<set definition> (filter rules)
<set definition> (excluded
list), <set definition> (filter
rules)
Removes members that were manu-
ally excluded from the results after
applying the user-defined rules.
<set definition> (excluded
filters)
<set definition> (excluded
filters) and totals for sets on
the opposite axis
Focuses on the members based on top
/ bottom / first n where n can be a
count or a percentile. For more
information about Top/Bottom
filters, see the Analysis Studio User
Guide.
<set definition> (filter top
bottom)
<set definition>Specifies the user-defined filter rules
to reduce the set definition using
operators such as greater than or less
than based on measures, calculations,
or attributes.
<set definition> (filter rules)
Subtotals and Related Conditions
The following table shows the definitions and dependencies for the data items in the subtotals and
related conditions.
DependenciesDefinitionData item
<set definition> (visible items
set)
Aggregates the visible items in the set.<set definition> (subtotal)
<set definition> (visible items
set), <set definition>
(included set), <set defini-
tion> (subtotal)
Shows the subtotal if the number of
included items is greater than the
number of visible items.
<set definition> (subtotal
display)
Professional Authoring User Guide 513
Chapter 20: Managing Existing Reports
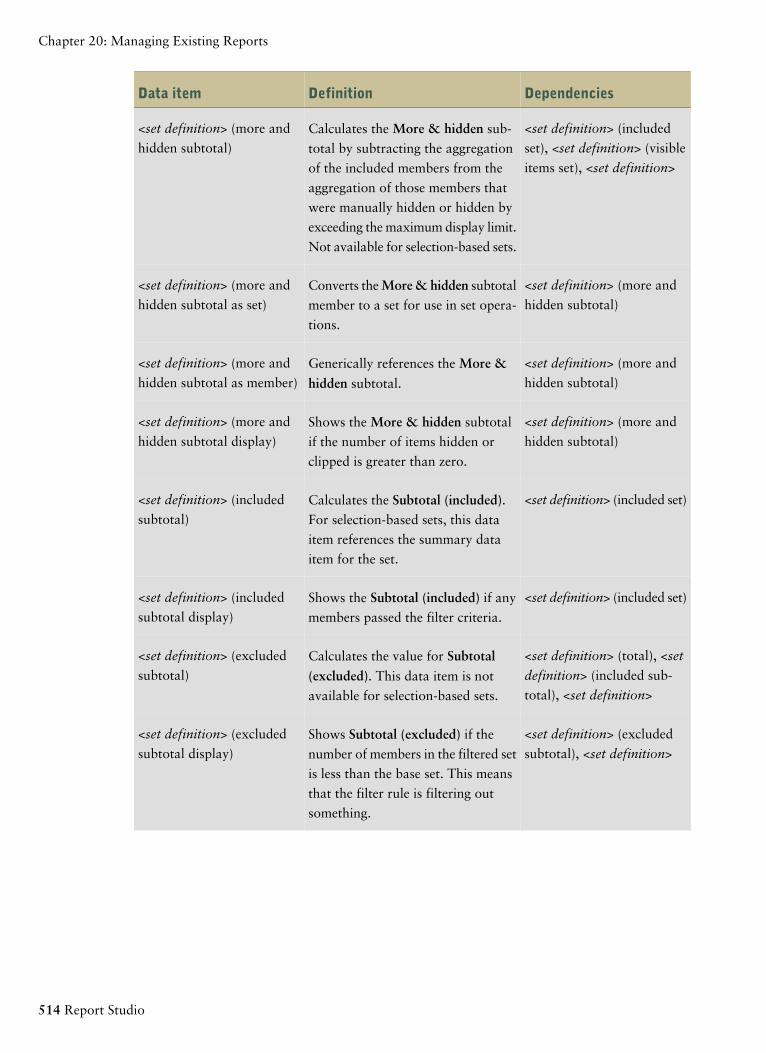
DependenciesDefinitionData item
<set definition> (included
set), <set definition> (visible
items set), <set definition>
Calculates the More & hidden sub-
total by subtracting the aggregation
of the included members from the
aggregation of those members that
were manually hidden or hidden by
exceeding the maximum display limit.
Not available for selection-based sets.
<set definition> (more and
hidden subtotal)
<set definition> (more and
hidden subtotal)Converts theMore& hidden subtotal
member to a set for use in set opera-
tions.
<set definition> (more and
hidden subtotal as set)
<set definition> (more and
hidden subtotal)Generically references the More &
hidden subtotal.
<set definition> (more and
hidden subtotal as member)
<set definition> (more and
hidden subtotal)Shows the More & hidden subtotal
if the number of items hidden or
clipped is greater than zero.
<set definition> (more and
hidden subtotal display)
<set definition> (included set)Calculates the Subtotal (included).For selection-based sets, this data
item references the summary data
item for the set.
<set definition> (included
subtotal)
<set definition> (included set)Shows the Subtotal (included) if any
members passed the filter criteria.
<set definition> (included
subtotal display)
<set definition> (total), <set
definition> (included sub-
total), <set definition>
Calculates the value for Subtotal
(excluded). This data item is not
available for selection-based sets.
<set definition> (excluded
subtotal)
<set definition> (excluded
subtotal), <set definition>Shows Subtotal (excluded) if the
number of members in the filtered set
is less than the base set. This means
that the filter rule is filtering out
something.
<set definition> (excluded
subtotal display)
514 Report Studio
Chapter 20: Managing Existing Reports
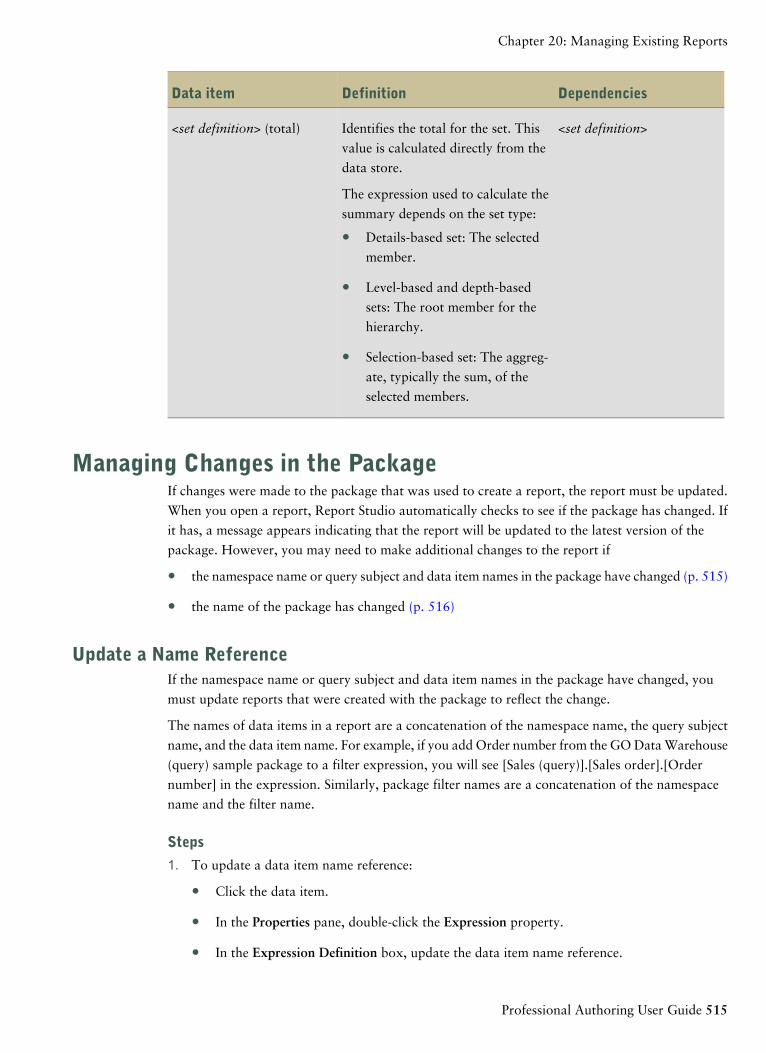
DependenciesDefinitionData item
<set definition>Identifies the total for the set. This
value is calculated directly from the
data store.
<set definition> (total)
The expression used to calculate the
summary depends on the set type:
● Details-based set: The selected
member.
● Level-based and depth-based
sets: The root member for the
hierarchy.
● Selection-based set: The aggreg-
ate, typically the sum, of the
selected members.
Managing Changes in the PackageIf changes were made to the package that was used to create a report, the report must be updated.
When you open a report, Report Studio automatically checks to see if the package has changed. If
it has, a message appears indicating that the report will be updated to the latest version of the
package. However, you may need to make additional changes to the report if
● the namespace name or query subject and data item names in the package have changed (p. 515)
● the name of the package has changed (p. 516)
Update a Name ReferenceIf the namespace name or query subject and data item names in the package have changed, you
must update reports that were created with the package to reflect the change.
The names of data items in a report are a concatenation of the namespace name, the query subject
name, and the data item name. For example, if you add Order number from the GO Data Warehouse
(query) sample package to a filter expression, you will see [Sales (query)].[Sales order].[Order
number] in the expression. Similarly, package filter names are a concatenation of the namespace
name and the filter name.
Steps
1. To update a data item name reference:
● Click the data item.
● In the Properties pane, double-click the Expression property.
● In the Expression Definition box, update the data item name reference.
Professional Authoring User Guide 515
Chapter 20: Managing Existing Reports
2. To update a package filter name reference:
● From the Data menu, click Filters .
● Double-click the package filter.
● In the Expression Definition box, update the namespace name.
Change the PackageIf the name of the package that were used to create a report has changed, you must change the
package connection to update the report.
At the same time, you can also change the authoring language for the report.
Steps
1. From the File menu, click Report Package.
2. Click Another package and choose the new package.
3. To change the authoring language, click the ellipsis (...) button beside the Language box and
choose a different report language.
You may need to update the report to reflect the change. For example, any filter expressions
in the report must be modified to reflect the syntax rules of the new language.
4. Click OK.
The new package is loaded and the report is validated. If errors are found, the Validation Errorsdialog box appears, showing the elements that must be updated to reflect the package change.
5. Click Close.
6. Make any required changes in the report to support the new package.
For example, you may need to link the data items in the report to the new package.
Tip: You can use Query Explorer to make the changes.
516 Report Studio
Chapter 20: Managing Existing Reports

Chapter 21: Upgrading Reports
When you open a report that was created in a previous version of Report Studio, it is automatically
upgraded. Any problems detected during the upgrade process appear as information messages
and error messages in the Upgrade Information dialog box. You must fix any errors in the
report and then validate the report before you can run it. In some cases, the information or error
message is linked to the location of the issue in your report. To go to the location of the issue, click
the message, and then click Select. If only warnings and information appear in the dialog box, these
will disappear when you click OK.
Tip: To view this dialog box again, from the File menu, click Upgrade Information.
Once a report is upgraded to the most recent version of IBM Cognos 8, you can no longer open it
with a previous version of IBM Cognos 8.
For more information about changes in the product behavior, see Upgrading to IBM Cognos 8 BI
8.3: Changes in Product Behavior on the IBM Cognos Resource Center (http://www.ibm.com/
software/data/support/cognos_crc.html).
Upgrading reports includes
● upgrading reports from IBM Cognos 8 version 8.1 or 8.2
● upgrading reports from IBM Cognos ReportNet
Upgrading Reports from IBM Cognos 8 Version 8.1 or 8.2When you upgrade IBM Cognos 8 to version 8.3, some reports may look or behave differently after
the upgrade. This section describes changes that you may encounter in your reports.
Product Behavior After UpgradeWhen you upgrade from IBM Cognos 8 BI version 8.2 to version 8.3, some features in IBM Cognos 8
may behave differently after the upgrade. When you upgrade reports, for example, changes in
behavior may cause validation errors. Documentation is available about the behavior changes. This
documentation includes examples of the changed behavior and solutions for issues that may occur
during the upgrade. For more information, see Upgrading to IBM Cognos 8 BI 8.3: Changes in
Product Behavior on the IBM Cognos Resource Center (http://www.ibm.com/software/data/support/
cognos_crc.html).
Members Containing No Data Are Not Suppressed for SAP BWIf you upgrade a crosstab report that uses a SAP BW data source and includes calculations, filters,
or nesting, the suppression of null values may not occur as expected. You may see additional empty
rows and columns.
By default, null values are suppressed for list and grouped list reports.
Professional Authoring User Guide 517
To effectively remove null values in crosstabs that use a SAP BW data source, insert individual
members to create the report. You can also ensure that SAP BW members are assigned to proper
dimension hierarchies and levels within the BW cube.
Thousands Separators MissingYou may encounter missing thousands separators in your reports in the following circumstances:
● The report contains an item that does not specify an explicit data format.
● The report item refers to another item in the same report.
● That second report item refers to an item in the Framework Manager model withUsage property
set to Identifier or Attribute.
● The model item does not specify an explicit format.
To restore the data formats, specify an explicit format either in the report item properties or in the
model item properties.
Upgrading Reports from IBM Cognos ReportNetWhen you upgrade IBM Cognos 8, some reports may look or behave differently after the upgrade.
The upgrade does not account for the following issues.
Undocumented and Unsupported FeaturesIf advanced report authors used undocumented and unsupported features such as Javascript that
refer to IBM Cognos HTML objects, they may have to recreate the features to complete the upgrade
of the report.
No Sort OrderData may appear in a different order after upgrading. If sort order is important, ensure that the
report or model specifies a sort order before upgrading.
Layout ErrorsLayout errors are suppressed by default in ReportNet. IBM Cognos 8 does not suppress layout
errors. Users may have to correct or remove report layout expressions that cause errors.
Report FormatIf you used the default format in ReportNet, upgraded reports will retain that format. However,
new reports in IBM Cognos 8 will use the IBM Cognos 8 format. If you want a consistent style
across all reports, you must edit the styles property in each report and select or deselect the Use 1.x
report styles option.
518 Report Studio
Chapter 21: Upgrading Reports
Customized Style SheetsIf you edited the ReportNet style sheet (default_layout.css) or the IBM Cognos 8 stylesheet (glob-
alreportstyles.css), reports will lose the formatting after upgrading. You must reapply the changes
to the IBM Cognos 8 stylesheets and copy the stylesheets to the IBM Cognos 8 server and the Web
server.
PDF ReportsPDF rendering in IBM Cognos 8 behaves like HTML rendering. After upgrading, PDF reports may
have different font size, column wrapping, or word wrapping. You may have to change each affected
report or change the default font in the IBM Cognos 8 style sheet.
IF-THEN-ELSE StatementsIf you use assignments of different data types after THEN and ELSE in ReportNet, the reports will
generate invalid coercion errors after upgrading. You may have to recast the variables or change
the assignments in the affected reports.
Solve OrderIn previous versions of IBM Cognos 8, you could specify the solve order for objects such as crosstab
node members . Solve order is now specified for data items. When you upgrade a report, solve
orders specified in the report are moved to data items. For more information about solve order, see
"Resolve Multiple Calculations for Crosstabs and Charts" (p. 236).
Chart BehaviorIn ReportNet, if a chart is created with a user-specified minimum value and all data values are
below the minimum value, the chart starts at the user-specified minimum value and contains no
data.
In IBM Cognos 8, the same parameters result in a chart that ignores the user-specified minimum
value and uses a range that includes all of the data values for the chart.
Database Only Processing of QueriesIf you specified in ReportNet that the processing for a query should be Database Only, when you
upgrade your report to IBM Cognos 8, some processing may now occur locally.
Changes in the Behavior of Count Between IBM Cognos ReportNet® 1.1 and IBMCognos 8
In IBM Cognos ReportNet 1.1, double counting could occur when applying Count or Count Distinct
to a query item. This occurred primarily when querying multiple query subjects that were joined
1-to-N in the model if the counted item existed in the query subject on the 1 side of the join. The
explanation is that Count or Count Distinct was applied after the join operation.
Professional Authoring User Guide 519
Chapter 21: Upgrading Reports
Count Distinct worked only when the item to which Count Distinct was applied was the column
used in the join. In this case, the column to be counted could have identical values for the different
values used in the join condition.
In IBM Cognos 8, improvements to the count functionality cannot be handled through an automatic
upgrade. The new approach avoids double counting on the 1 side of a 1-to-N join. The explanation
is that Count or Count Distinct is now applied before the join operation.
There is now a lesser need to use Count Distinct and, when used, it will be successful more often.
Count Distinct is no longer required to overcome double counting. Instead, it can be used as
intended to select distinct values that exist in a query subject.
When you want to count repeated occurrences of a value, we recommend that you do one of the
following:
● Apply a count operation on a column based on a query in which an explicit join occurs.
This applies the count after the join.
● Count rows in a report by using a layout calculation object (p. 413) or by counting the literal
value 1.
520 Report Studio
Chapter 21: Upgrading Reports
Chapter 22: Sample Reports and Packages
Sample reports are included with IBM Cognos 8. When installed, you can find them in the Public
Folders tab in IBM Cognos Connection.
The Great Outdoors Company SamplesThe Great Outdoors Company samples illustrate product features and technical and business best
practices. You can also use them for experimenting with and sharing report design techniques and
for troubleshooting.
For examples related to different kinds of businesses, see the product blueprints at (http://www.
ibm.com/software/data/support/cognos_crc.html). For information about specific installation choices
and environments, see the Architecture and Deployment Guide, or the Proven Practices and the
IBM Cognos Implementation Roadmaps on the IBM Cognos Resource Center (http://www.ibm.
com/software/data/support/cognos_crc.html). For information about audit samples, see the
Administration and Security Guide.
Where to Find the Samples
The samples are included with the product and the samples for each studio are described in the
related user guide and online help. To use the samples, you must set up and configure them or
contact your administrator to find out where they are installed. For instructions on how to set up
and configure samples, see the Installation and Configuration Guide or the Administration and
Security Guide.
What Samples Exist
The samples consist of
● two databases that contain all corporate data, the related sample models for query and analysis,
and sample cubes, reports, queries, query templates, and dashboards
● a metrics database and the associated metrics, including a strategy map for the consolidated
company
Note: You must have Metric Studio installed to use the metrics database and associated metrics.
● interactive reports that let you hover over report features to learn how the features work and
why they were included
Note: These reports are stored in the Interactive Samples folder of the IBM Cognos 8 installation.
Security
You can add security to the samples using an employee list included with the product. The list is
in the form of an LDIF file that can be imported into any directory server, such as the Sun Java
System Directory Server.
Professional Authoring User Guide 521
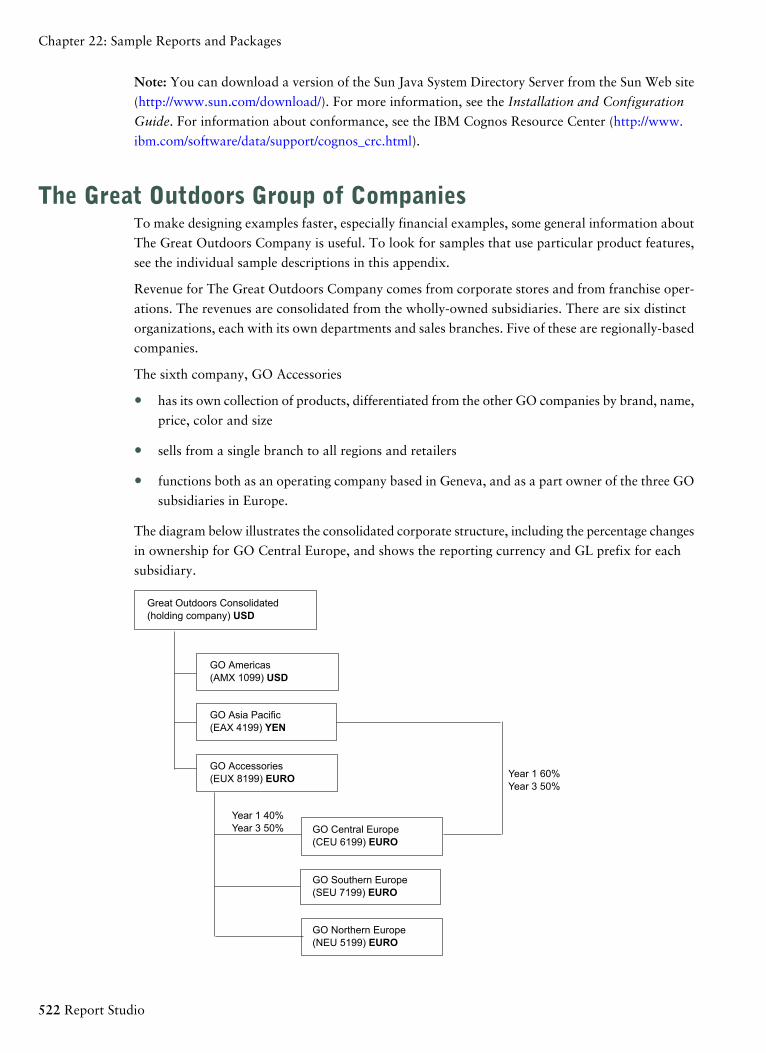
Note: You can download a version of the Sun Java System Directory Server from the Sun Web site
(http://www.sun.com/download/). For more information, see the Installation and Configuration
Guide. For information about conformance, see the IBM Cognos Resource Center (http://www.
ibm.com/software/data/support/cognos_crc.html).
The Great Outdoors Group of CompaniesTo make designing examples faster, especially financial examples, some general information about
The Great Outdoors Company is useful. To look for samples that use particular product features,
see the individual sample descriptions in this appendix.
Revenue for The Great Outdoors Company comes from corporate stores and from franchise oper-
ations. The revenues are consolidated from the wholly-owned subsidiaries. There are six distinct
organizations, each with its own departments and sales branches. Five of these are regionally-based
companies.
The sixth company, GO Accessories
● has its own collection of products, differentiated from the other GO companies by brand, name,
price, color and size
● sells from a single branch to all regions and retailers
● functions both as an operating company based in Geneva, and as a part owner of the three GO
subsidiaries in Europe.
The diagram below illustrates the consolidated corporate structure, including the percentage changes
in ownership for GO Central Europe, and shows the reporting currency and GL prefix for each
subsidiary.
GO Americas(AMX 1099) USD
Great Outdoors Consolidated(holding company) USD
GO Central Europe(CEU 6199) EURO
GO Accessories(EUX 8199) EURO
GO Asia Pacific(EAX 4199) YEN
GO Northern Europe(NEU 5199) EURO
GO Southern Europe(SEU 7199) EURO
Year 1 60%Year 3 50%
Year 1 40%Year 3 50%
522 Report Studio
Chapter 22: Sample Reports and Packages
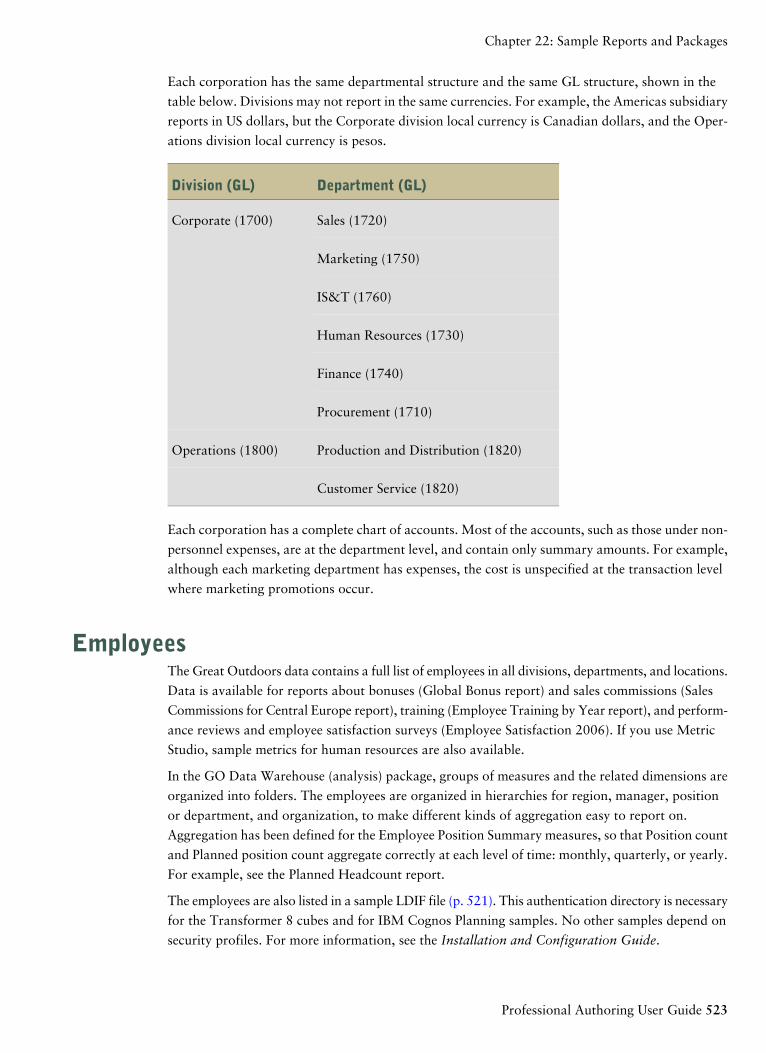
Each corporation has the same departmental structure and the same GL structure, shown in the
table below. Divisions may not report in the same currencies. For example, the Americas subsidiary
reports in US dollars, but the Corporate division local currency is Canadian dollars, and the Oper-
ations division local currency is pesos.
Department (GL)Division (GL)
Sales (1720)Corporate (1700)
Marketing (1750)
IS&T (1760)
Human Resources (1730)
Finance (1740)
Procurement (1710)
Production and Distribution (1820)Operations (1800)
Customer Service (1820)
Each corporation has a complete chart of accounts. Most of the accounts, such as those under non-
personnel expenses, are at the department level, and contain only summary amounts. For example,
although each marketing department has expenses, the cost is unspecified at the transaction level
where marketing promotions occur.
EmployeesThe Great Outdoors data contains a full list of employees in all divisions, departments, and locations.
Data is available for reports about bonuses (Global Bonus report) and sales commissions (Sales
Commissions for Central Europe report), training (Employee Training by Year report), and perform-
ance reviews and employee satisfaction surveys (Employee Satisfaction 2006). If you use Metric
Studio, sample metrics for human resources are also available.
In the GO Data Warehouse (analysis) package, groups of measures and the related dimensions are
organized into folders. The employees are organized in hierarchies for region, manager, position
or department, and organization, to make different kinds of aggregation easy to report on.
Aggregation has been defined for the Employee Position Summary measures, so that Position count
and Planned position count aggregate correctly at each level of time: monthly, quarterly, or yearly.
For example, see the Planned Headcount report.
The employees are also listed in a sample LDIF file (p. 521). This authentication directory is necessary
for the Transformer 8 cubes and for IBM Cognos Planning samples. No other samples depend on
security profiles. For more information, see the Installation and Configuration Guide.
Professional Authoring User Guide 523
Chapter 22: Sample Reports and Packages
Sales and MarketingData about sales and marketing is available for all of the companies in the Great Outdoors group.
GO Accessories has richer details to support analysis examples. For example, see the Revenue vs
% Gross Profit by Product Brand analysis, based on the Sales and Marketing cube. Marketing and
sales campaigns are tied to the Great Outdoors regional companies.
Overall, the GO companies have experienced solid growth across most product lines (Sales Growth
Year Over Year), in all regions (Revenue by GO Subsidiary 2005), because of factors like an increase
in repeat business and new or improved products, such as the high margin sunglasses product line.
In the product lines sold by the five regional companies (all but GO Accessories) promotions have
had mixed success (Promotion Success by Campaign, Bundle and Quarter). If you use Metric Studio,
this can also be seen in the sample metrics.
Customer Surveys
The data also contains information from customer surveys. For example, the product line that
includes bug spray, sun screen, and so on has not been successful (Product Satisfaction - Outdoor
Protection 2005) and a source of retailer dissatisfaction may be the level of customer service rather
than the returns (Customer Returns and Satisfaction). If you use Metric Studio, this information
can also be monitored in metrics.
Sales Outlets
Revenue from the corporate outlets is available at the transaction level. Revenue from the franchise
outlets is available at the consolidated level only (Sales and Marketing cube). Metrics about retailers
show that the number of new retail outlets has dropped over the time period covered by this data.
GO Accessories sells worldwide, and sells only accessories. Transaction data for GO Accessories
is the primary source for analysis of product by brand, color and size. The other five subsidiaries
in the group of companies are regional and sell all product lines for retailers in their region. For
example, the report Top 10 Retailers in 2005 uses sparklines and list data to review revenues at
the retailer level.
Great Outdoors Database, Models, and PackagesThe Great Outdoors models illustrate modeling techniques and support the samples. The models
are based on the GO data warehouse and the GO sales transactional database and are the basis for
the sample reports and queries. Each model contains two packages for publishing analysis (dimen-
sional) and query views of the data.
For a description of each sample report or query, see the user guide for the studio that you open
the sample in. For more information about modeling techniques, see the Guidelines for Modeling
Metadata, or the Framework Manager User Guide.
You must have access to Framework Manager, the modeling tool in IBM Cognos 8, to look at the
sample models. You may also need to set up the sample databases and connections. For instructions,
see the Administration and Security Guide or the Installation and Configuration Guide.
524 Report Studio
Chapter 22: Sample Reports and Packages
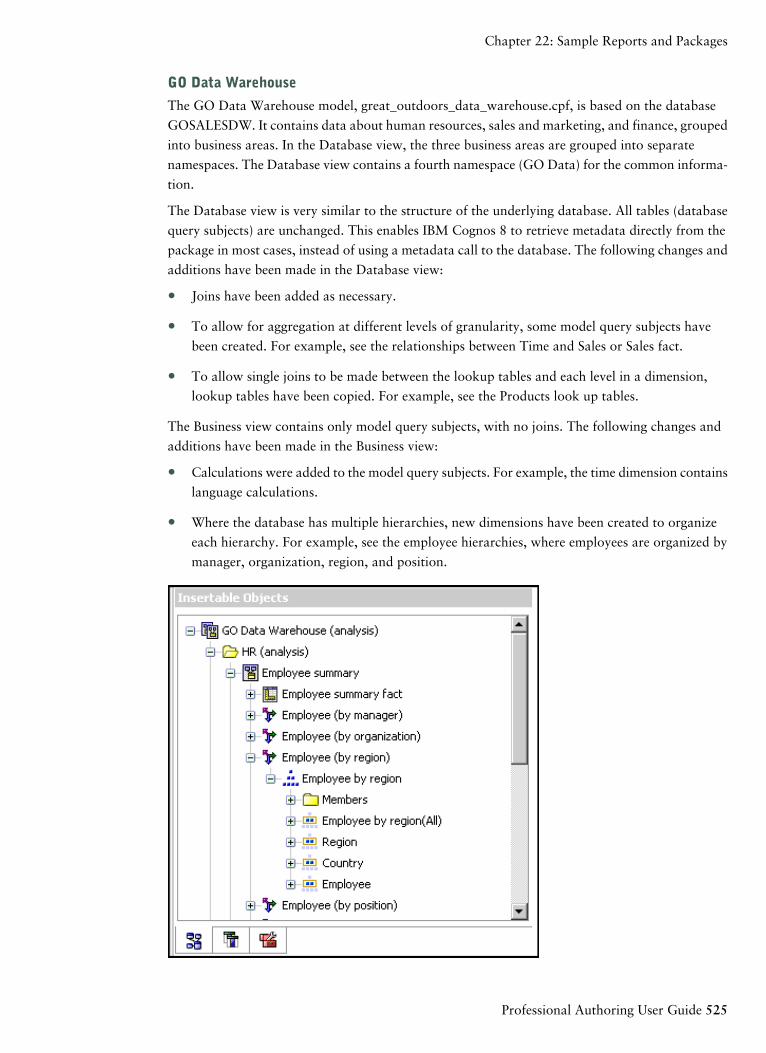
GO Data Warehouse
The GO Data Warehouse model, great_outdoors_data_warehouse.cpf, is based on the database
GOSALESDW. It contains data about human resources, sales and marketing, and finance, grouped
into business areas. In the Database view, the three business areas are grouped into separate
namespaces. The Database view contains a fourth namespace (GO Data) for the common informa-
tion.
The Database view is very similar to the structure of the underlying database. All tables (database
query subjects) are unchanged. This enables IBM Cognos 8 to retrieve metadata directly from the
package in most cases, instead of using a metadata call to the database. The following changes and
additions have been made in the Database view:
● Joins have been added as necessary.
● To allow for aggregation at different levels of granularity, some model query subjects have
been created. For example, see the relationships between Time and Sales or Sales fact.
● To allow single joins to be made between the lookup tables and each level in a dimension,
lookup tables have been copied. For example, see the Products look up tables.
The Business view contains only model query subjects, with no joins. The following changes and
additions have been made in the Business view:
● Calculations were added to the model query subjects. For example, the time dimension contains
language calculations.
● Where the database has multiple hierarchies, new dimensions have been created to organize
each hierarchy. For example, see the employee hierarchies, where employees are organized by
manager, organization, region, and position.
Professional Authoring User Guide 525
Chapter 22: Sample Reports and Packages
The GO Sales Transactional Database
The GO Sales model, great_outdoors_sales.cpf, is based on the GOSALES database, which is
structured as a transactional database. It contains principally sales data.
The Database view is very similar to the underlying database structure. The following changes and
additions have been made in the Database view:
● To make it possible to join the fact tables to the time dimension, model query subjects and
multipart joins have been used.
● Other joins have been added as necessary.
The Business view contains only model query subjects, with no joins. The following changes and
additions have been made in the Business view:
● Calculations were added to the model query subjects.
● Model query subjects that were created in the Database view to enable joins on the time
dimension have been linked as reference shortcuts.
● Where the database has multiple hierarchies, new dimensions have been created to organize
each hierarchy.
● Sales Staff is a subset of the slowly changing Employee dimension.There is no unique Employee
key in GO Sales, so a filter retrieves the current record only. This model does not use historical
data.
The Samples Cubes
The following cubes are delivered with the Great Outdoors samples in English, French, German,
Japanese and Chinese:
● sales_and_marketing.mdc
● employee_expenses.mdc
● go_accessories.mdc
● go_americas.mdc
● go_asia_pacific.mdc
● great_outdoor_sales.mdc
The Samples Packages
The Great Outdoors samples include seven packages. Below is a brief description of each available
package.
Go Data Warehouse (analysis) is a dimensionally modeled view of the GOSALESDW database.
This package can be used in all studios, including Analysis Studio. Using this package you can drill
up and down.
Go Sales (analysis) is a dimensionally modeled view of the GOSALES database. This package can
be used in all studios, including Analysis Studio. Using this package you can drill up and down.
526 Report Studio
Chapter 22: Sample Reports and Packages
Go Data Warehouse (query) is a non-dimensional view of the GOSALESDW database. This package
can be used in all studios except Analysis Studio, and is useful for reporting when there is no need
for drilling up and down.
Go Sales (query) is a non-dimension view of the GOSALES database. This package can be used in
all studios except Analysis Studio, and is useful for reporting when there is no need for drilling up
and down.
Sales and Marketing (conformed) is based on the GOSALESDW database. Dimensions are conformed
with the dimensions found in the Sales and Marketing (cube) package, in order to enable drill-
through from the cube package to the dimensional package.
Sales and Marketing (cube) is an OLAP package, based on the sales_and_marketing.mdc cube.
Great Outdoor Sales (cube) is an OLAP package, based on the great_outdoor_sales.mdc cube.
Note: The OLAP packages, Great Outdoor Sales (cube) and Sales and Marketing (cube), are not
multilingual. The Cognos_PowerCube.zip archive contains five versions of each package; one in
English, French, German, Japanese and Chinese.
Samples in the Sales and Marketing (Cube) PackageThe following reports are some of the reports found in the Sales and Marketing (Cube) package.
Actual vs. Planned RevenueThis report shows the actual revenue versus planned revenue by order method and year. This report
is also a target for the measure based scope drill-through from other reports in the same package.
This report uses the following features:
● lists (p. 77)
● filters (p. 165)
● multiple prompts (p. 399)
● grouping (p. 150)
● sorting (p. 211)
● summarizing (p. 197)
Historical RevenueThis prompted report shows a 13-month rolling forecast of monthly and year-to-date revenue. This
report uses the following features:
● filters (p. 165)
● cascading prompts (p. 391)
● combination charts (p. 102)
● axis titles (p. 133)
Professional Authoring User Guide 527
Chapter 22: Sample Reports and Packages
Revenue by Date RangeThis report shows revenue for a date range that is specified on a prompt page. This report uses the
following features:
● lists (p. 77)
● crosstabs (p. 83)
● context filters (p. 208)
● custom headers and footers (p. 407)
● multiple prompts (p. 399)
● expressions (p. 245)
Revenue by Product Brand (2005)This report shows the revenue and gross profit by product filtered by the product brand. There is
always product turnover, so the report conditionally highlights products that are discontinued. This
report uses the following features:
● lists (p. 77)
● filters (p. 165)
● prompts (p. 399)
● combination charts (p. 102)
● bar charts (p. 100)
● HTML items (p. 413)
● grouping (p. 150)
● sorting (p. 211)
● axis titles (p. 133)
Same Month Prior YearThis report shows sales volume by product line in one or more months. The report is filtered by a
prompt for month. The report generates totals for the selected months and for the same months in
the prior year. This report uses the following features:
● crosstabs (p. 83)
● prompts (p. 399)
● custom headers and footers (p. 407)
528 Report Studio
Chapter 22: Sample Reports and Packages
Selected Retailer CountryThis report uses the revenue from a selected country as a baseline value for a set of countries. A
chart shows the difference in revenue for each country as it compares to the base country. The
report is filtered by a prompt for country. This report uses the following filters:
● crosstabs (p. 83)
● bar charts (p. 93)
● tables to control where objects appear (p. 418)
Top Retailers by CountryThis report shows the top 10 retailers by country. It is used as source for drill-through to the Total
Revenue by Country report. This report uses the following features:
● crosstabs (p. 83)
● prompts (p. 399)
● filters (p. 165)
● line charts (p. 101)
● prompt pages (p. 391)
● query calculations (p. 187)
● expressions (p. 245)
● singletons (p. 62)
● bar charts (p. 100)
● custom headers and footers (p. 407)
Samples in the GO Data Warehouse (analysis) PackageThe following reports are some of the reports found in the GO Data Warehouse (analysis) package.
Budget vs. ActualThis report shows three years of data by retailer and retailer site for the camping equipment product
line. Each year includes budget and actual data. This report uses the following features:
● summarizing (p. 197)
● crosstabs (p. 83)
● context filters (p. 208)
Professional Authoring User Guide 529
Chapter 22: Sample Reports and Packages
Customer Returns and SatisfactionThis report shows the customer satisfaction survey results for Asia Pacific in 2007. It highlights the
customers who are the least satisfied. It also provides information about customers with the highest
number of product returns. This report uses the following features:
● combination charts (p. 102)
● customizing the color and size of a chart (p. 111)
● lists (p. 77)
● formatting a list (p. 77)
● conditional highlighting (p. 431)
● filters (p. 165)
● custom headers and footers (p. 407)
● colors (p. 430)
● lineage (p. 71)
● text items (p. 409)
● grouping (p. 150)
● baselines (p. 120)
● summarizing (p. 197)
● expressions (p. 245)
● drilling through (p. 473)
Employee Satisfaction 2006This report shows employee satisfaction survey results by department, compared to targets and
industry standards. It also shows employee rankings and terminations. This report uses the following
features:
● crosstabs (p. 83)
● conditional highlighting (p. 431)
● combination charts (p. 102)
● lineage (p. 71)
● text items (p. 409)
● expressions (p. 245)
530 Report Studio
Chapter 22: Sample Reports and Packages
Employee Training by YearThis report shows employee training data for the selected year and quarter(s). A bar chart shows
training costs by region and a crosstab shows data for the selected quarter(s). This report uses the
following features:
● context filters (p. 208)
● cascading prompts (p. 391)
● bar charts (p. 93)
● customizing the color of a chart (p. 111)
● crosstabs (p. 83)
● expressions (p. 245)
Eyewear Revenue by Brand and SizeThis report shows a summary of eyewear revenue by brand and compares two prompted retailer
sites. The report is filtered by prompts for region, retailer type, and year. This report uses the fol-
lowing features:
● prompts (p. 391)
● bar charts (p. 93)
● lists (p. 77)
● conditional styles (p. 431)
● expressions (p. 245)
● text items (p. 409)
● custom headers and footers (p. 407)
● combination charts (p. 102)
● axis titles (p. 133)
● crosstabs (p. 83)
● grouping (p. 150)
Global Bonus ReportThis list report shows employees who received more than $2,500 bonus in a year by region. It is
grouped by country. It also shows how much the sales target was exceeded for each region. This
report uses the following features:
● lists (p. 77)
● page sets (page breaks by country with different sorting and grouping) (p. 494)
● multiple prompts and parameters (p. 399)
Professional Authoring User Guide 531
Chapter 22: Sample Reports and Packages
● expressions (p. 245)
● filters (p. 165)
● conditional highlighting (p. 431)
● hidden objects (p. 438)
● lineage (p. 71)
GO Balance Sheet as at Dec 31 2006This is the Balance sheet report for Americas where current year data is compared to the previous
year data. Analysts can see negative trends under Variance where negative percentages are highlighted.
This report uses the following features:
● conditional highlighting (p. 431)
● padding (p. 419)
● crosstabs (p. 83)
● text items (p. 409)
● context filters (p. 208)
Great Outdoors Company Balance Sheet as at Dec 31 2006This report shows a simple balance sheet with assets, liabilities, and equity for 2006 with a 2005
comparative. It uses the Report Studio Express authoring mode. The Getting Started guide provides
a step-by-step example of how to create this report. This report uses the following features:
● crosstabs (p. 83)
Manager ProfileThis report shows information about managers, including salary, bonuses, and all compensations
grouped by year. This report uses the following features:
● charts (p. 93)
● lists (p. 77)
● grouping (p. 150)
● summarizing (p. 197)
● custom chart palette (p. 118)
● prompts (p. 391)
Planned HeadcountThis chart report shows headcount variance compared to the plan for each organization for 2004.
This report uses the following features:
532 Report Studio
Chapter 22: Sample Reports and Packages
● progressive column charts (p. 99)
● templates (p. 507)
● hidden objects (p. 438)
● custom headers and footers (p. 407)
● lists (p. 77)
● baselines (p. 120)
Positions to FillThis report shows a list of department names, positions, longest days to fill the positions, and
ranking. The report uses a prompt for the year and is a drill-through target for the Recruitment
report. This report uses the following features:
● charts (p. 93)
● lists (p. 77)
● prompts (p. 391)
● baselines (p. 120)
Promotion SuccessThis report shows the financial results of the company's promotions. It shows how much of the
company's total revenue is attributable to each promotional campaign. This report uses the following
features:
● prompt pages (p. 391)
● HTML items (p. 413)
● summarizing (p. 197)
● axis titles (p. 133)
● bar charts (p. 100)
● lists (p. 77)
● grouping (p. 150)
Quantity Sold vs. Shipped and InventoryThis report compares the quantity of goods sold and shipped with the opening and closing inventory
levels. This report uses the following features:
● filters (p. 165)
● combination charts (p. 102)
● defined y-axes (p. 111)
Professional Authoring User Guide 533
Chapter 22: Sample Reports and Packages
● custom headers and footers (p. 407)
Recruitment ReportThis report shows a variety of recruitment techniques for certain positions or organizations. This
report uses the following features:
● drilling through (p. 473)
● crosstabs (p. 83)
● prompt pages (p. 391)
● colors (p. 118)
● floating object adjustment (p. 426)
● custom headers and footers (p. 407)
Return Quantity by Order MethodThis report shows quantity sold, number of returns, and percentage of returns (with those greater
than 5% highlighted) by return reason for each product in the Outdoor Protection product line.
This report uses the following features:
● filters (p. 165)
● lists (p. 77)
● conditional highlighting (p. 431)
● grouping (p. 150)
Returned ItemsThis report shows the number of returned items by return reason and retailer type. A column chart
shows returned items by product line and region for the selected date range. This report uses the
following features:
● date and time prompts (p. 392)
● crosstabs (p. 83)
● bar charts (p. 93)
● drilling down (p. 239)
● text items (p. 409)
● sorting (p. 211)
Returns by Damage, Failed Orders and Complaints in 2006This report shows quality measures based on product returns. This report uses the following features:
● pie charts (p. 93)
534 Report Studio
Chapter 22: Sample Reports and Packages
● crosstabs (p. 83)
● indented text (p. 89)
● singletons (p. 62)
● calculations (p. 187)
● drilling through (p. 473)
● text items (p. 409)
● custom headers and footers (p. 407)
Returns by Failed Orders in 2006This report shows quality measures based on product returns and focuses on failed orders. This
report uses the following features:
● pie charts (p. 93)
● crosstabs (p. 83)
● indented text (p. 89)
● singletons (p. 62)
● drilling through (p. 473)
● calculations, including the tuple() function (p. 187)
Returns by Order MethodThis report shows product returns and reasons filtered on the order method. The Getting Started
guide provides a step-by-step example of how to create this report. This report uses the following
features:
● bar charts (p. 93)
● prompts (p. 391)
● crosstabs (p. 83)
● filters (p. 165)
● custom headers and footers (p. 407)
Revenue by GO Subsidiary 2005This prompted chart report shows 2005 quarterly revenues for each GO subsidiary. This report
uses the following features:
● templates (p. 507)
● colors (p. 430)
Professional Authoring User Guide 535
Chapter 22: Sample Reports and Packages
● prompts (p. 391)
● hyperlinks (p. 413)
● customizing charts (p. 111)
● singletons (p. 62)
● bar charts (p. 93)
● drilling through (p. 473)
● layout calculations (p. 187)
● pie charts (p. 93)
● expressions (p. 245)
● combination charts (p. 102)
● text items (p. 409)
● blocks (p. 413)
● sorting (p. 211)
Sales Commissions for Central EuropeThis report shows an annual summary of sales commissions, revenues, and gross profit for each
branch in Central Europe. It also compares actual commission expenses with planned commission
expenses. This report uses the following features:
● prompts (p. 391)
● expressions (p. 245)
● bar charts (p. 93)
● lists (p. 77)
● conditional highlighting (p. 431)
● drilling through (p. 473)
● custom headers and footers (p. 407)
● axis titles (p. 133)
Sales Growth Year Over YearThis report shows annual sales growth in both percentage and dollar amounts. This report uses the
following features:
● bar charts (p. 93)
● lists (p. 77)
536 Report Studio
Chapter 22: Sample Reports and Packages
● filters (p. 165)
● sorting (p. 211)
● baselines (p. 120)
● axis titles (p. 133)
Succession ReportThis report shows the succession data by department and status for percent ready in a column chart.
It also contains a detailed crosstab for the managers associated with the possible successors. This
report uses the following features:
● drilling through to the Manager Profile report (p. 473)
● filters (p. 165)
● lists (p. 77)
● grouping (p. 150)
Top 10 Retailers for 2005This report shows the top 10 retailers for 2005 by revenue and sales target. This report uses the
following features:
● bar charts (p. 93)
● lists (p. 77)
● filters (p. 165)
● multiple queries (p. 218)
● combination charts (p. 102)
● line charts (p. 101)
● notes (p. 125)
● axis titles (p. 133)
● text items (p. 409)
● custom headers and footers (p. 407)
Samples in the GO Data Warehouse (query) PackageThe following reports are some of the reports found in the GO Data Warehouse (query) package.
Professional Authoring User Guide 537
Chapter 22: Sample Reports and Packages
Bursted Sales Performance ReportThis list report shows how to burst a product sales report to a sales manager for Northern Europe
sales staff. To successfully burst this report, IBM Cognos 8 must be configured to use an email
server. This report uses the following features:
● lists (p. 77)
● bursting (p. 445)
● conditional highlighting (p. 431)
● filters (p. 165)
● calculations (p. 187)
● summarizing (p. 156)
● blocks (p. 413)
● custom headers and footers (p. 407)
● sorting (p. 170)
● grouping (p. 150)
Employee ExpensesThis report is used as a data source for the Employee Expenses Power Cube. This report uses the
following features:
● lists (p. 77)
Health InsuranceThis report is used as a data source for the Employee Expenses Power Cube. This report uses the
following features:
● lists (p. 77)
● filters (p. 165)
Pension PlanThis report is used as a data source for the Employee Expenses Power Cube. This report uses the
following features:
● lists (p. 77)
● filters (p. 165)
Regular SalaryThis report is used as a data source for the Employee Expenses Power Cube. This report uses the
following features:
538 Report Studio
Chapter 22: Sample Reports and Packages
● lists (p. 77)
● filters (p. 165)
TOC ReportThis report takes advantage of the bookmark object to allow a user to navigate through this report
easily. This report should be run in PDF or saved HTML format. The report contents show a
product order table and an expected volume fact table. This report uses the following features:
● lists (p. 77)
● bookmarks (p. 498)
● background color (p. 77)
● multiple pages (p. 493)
● grouping (p. 150)
Total Revenue by CountryThis report summarizes revenue for Retailer Country and Product Line. It is also a drill-through
target for the Top Retailers by Country and Revenue by Order Method reports. This report uses
the following features:
● crosstabs (p. 83)
● combination charts (p. 102)
● summarizing (p. 156)
● tables to control where objects appear (p. 418)
Samples in the GO Sales (analysis) PackageThe following reports are some of the reports found in the GO Sales (analysis) package.
2005 Quarterly Sales ForecastThis report shows the sales forecast by product line and region for each quarter in 2005. This report
uses the following features:
● lists (p. 77)
● summarizing (p. 197)
● grouping (p. 150)
● sorting (p. 211)
Professional Authoring User Guide 539
Chapter 22: Sample Reports and Packages
2005 Sales SummaryThis report summarizes revenue and gross profit for 2005 and shows the top sales representatives
by revenue and quantity sold. This report uses the following features:
● lists (p. 77)
● filters (p. 165)
● combination charts (p. 102)
● axis titles (p. 133)
● custom headers and footers (p. 407)
● conditions (p. 431)
Briefing BookThis report shows a Briefing Book style of report. This report uses the following features:
● multiple pages (p. 493)
● crosstabs (p. 83)
● multiple queries (p. 218)
● filters (p. 165)
● pie charts (p. 93)
● singletons (p. 62)
● tables of contents (p. 500)
● bookmarks (p. 498)
● PDF options (p. 70)
● horizontal pagination (p. 503)
● sorting (p. 211)
● custom headers and footers (p. 407)
● text items (p. 413)
Horizontal PaginationThis report shows crosstabs rendered across several horizontal pages. The first crosstab shows the
fit-to-page behavior while the second crosstab shows the horizontal pagination. This report uses
the following features:
● multiple pages (p. 493)
● horizontal pagination (p. 503)
● crosstabs (p. 83)
540 Report Studio
Chapter 22: Sample Reports and Packages
● custom headers and footers (p. 407)
No DataEach page of this report presents a different option for dealing with a No Data condition. It also
generates invoices of sales for the Order Invoices - Donald Chow, Sales Person report in the GO
Sales (query) package. This report uses the following features:
● crosstabs (p. 83)
● custom headers and footers (p. 407)
● no data (p. 457)
● lists (p. 77)
PDF Page PropertiesThe two pages of this report appear with different Page Orientation (portrait and landscape) when
the report is run in PDF format. This report uses the following features:
● crosstabs (p. 83)
● lists (p. 77)
● page orientation (p. 70)
● PDF options (p. 70)
● custom headers and footers (p. 407)
Singletons on Page BodyThis report uses singleton results to display information with no data relationship in the same layout
context. This report uses the following features:
● singletons (p. 62)
● tables (p. 418)
● custom headers and footers (p. 407)
Table of ContentsThis report shows two Tables of Contents: one for the main pages and another for the appendices.
This report uses the following features:
● crosstabs (p. 83)
● pie charts (p. 93)
● bookmarks (p. 498)
● tables (p. 418)
● tables of contents (p. 500)
Professional Authoring User Guide 541
Chapter 22: Sample Reports and Packages
● custom headers and footers (p. 407)
● hyperlinks (p. 413)
Samples in the GO Sales (query) PackageThe following reports are some of the reports found in the GO Sales (query) package.
Order Invoices - Donald Chow, Sales PersonThis report generates invoices for all the sales by Donald Chow. This report uses the following
features:
● lists (p. 77)
● adding list row cells (p. 407)
● calculations (p. 187)
● formatting tables (p. 418)
● expressions (p. 245)
● filters (p. 165)
● grouping (p. 150)
● tables to control where objects appear (p. 418)
Interactive SamplesThe following reports are some of the reports found in the Interactive Samples folder.
Bursted Sales Performance ReportThis list report shows how to burst a product sales report to a sales manager for Northern Europe
sales staff. To successfully burst this report, IBM Cognos 8 must be configured to use an email
server. This report uses the following features:
● lists (p. 77)
● bursting (p. 445)
● conditional highlighting (p. 431)
● filters (p. 165)
● calculations (p. 187)
● summarizing (p. 156)
● blocks (p. 413)
● custom headers and footers (p. 407)
542 Report Studio
Chapter 22: Sample Reports and Packages
● sorting (p. 170)
● grouping (p. 150)
Recruitment ReportThis report shows a variety of recruitment techniques for certain positions or organizations. This
report uses the following features:
● drilling through (p. 473)
● crosstabs (p. 83)
● prompt pages (p. 391)
● colors (p. 118)
● floating object adjustment (p. 426)
● custom headers and footers (p. 407)
Revenue by GO Subsidiary 2005This prompted chart report shows 2005 quarterly revenues for each GO subsidiary. This report
uses the following features:
● templates (p. 507)
● colors (p. 430)
● prompts (p. 391)
● hyperlinks (p. 413)
● customizing charts (p. 111)
● singletons (p. 62)
● bar charts (p. 93)
● drilling through (p. 473)
● layout calculations (p. 187)
● pie charts (p. 93)
● expressions (p. 245)
● combination charts (p. 102)
● text items (p. 409)
● blocks (p. 413)
● sorting (p. 211)
Professional Authoring User Guide 543
Chapter 22: Sample Reports and Packages
Rolling and Moving AveragesThis report shows the rolling and moving average count for the return quantity. A prompt uses a
macro to provide static choices within a time dimension. This report uses the following features:
● prompts (p. 391)
● calculations (p. 187)
● crosstabs (p. 83)
● combination charts (p. 102)
544 Report Studio
Chapter 22: Sample Reports and Packages
Chapter 23: Limitations When Producing Reportsin Microsoft Excel Format
There are limitations when producing reports in Microsoft Excel format.
Unable to Load Images from the IBM Cognos 8 Content Storein a Report
If a report contains an image whose URL points to the IBM Cognos 8 content store, Microsoft
Excel generates an access violation error and shuts down.
This problem is a known issue in the Microsoft knowledge base, and Microsoft is currently invest-
igating the problem. This problem occurs only in Excel 2000 and 2002.
Blank Worksheet Is OpenedIf Microsoft Excel cannot download a worksheet within a timeout period, Excel may instead open
a blank worksheet.
WarningMessage AppearsWhen Excel Opens an IBMCognos 8Report
Each time Microsoft Excel opens an IBM Cognos 8 report, the following message appears:
Some of the files in this Web page aren’t in the expected location. Do you want to download them
anyway? If you’re sure the Web page is from a trusted source, click Yes.
The Excel workbook in HTML/XML format requires the presence of the file filelist.xml. IBM
Cognos 8 does not allow the creation of local files on the client side. In addition, a local file that
contains URLs introduces a security issue. Consequently, this message will appear whenever you
open an IBM Cognos 8 report in Excel. If you see this error message, click Yes to open the report.
Error Message Appears in an Excel 2000 Single Sheet ReportIf you create a report in the Excel 2000 Single Sheet format, [RSV-RND-0017] may appear on the
last line of your report because Report Studio could not generate all the data in your report in this
format. If you see this error message, we recommend checking your report carefully for changes.
Professional Authoring User Guide 545
Spreadsheet Content Not Saved for Reports Saved in XLSFormat
If you open a report that was saved in XLS format or run a report in XLS format, and security
settings in your browser are set so that you are prompted to open or save the report, do not click
Save. If you save the report, the spreadsheet content will not be saved. This is because Excel reports
in Office 2000 HTML format use relative paths to the spreadsheets. The relative URL paths are no
longer available when you open a saved XLS report.
Instead, click Open first and then choose to save the report.
Unable to Load Excel Report in Netscape 7.01This version of IBM Cognos 8 does not support loading Microsoft Excel reports in Netscape 7.01.
Unable to Nest Labels in ChartsCurrently, it is not possible to specify nested labels for the category axis via XML.
Data Series Are TruncatedMicrosoft Excel may group data series or categories differently when compared to a chart produced
by IBM Cognos 8.
A 1 KB buffer limit in Excel limits the maximum number of data series per chart to 120. Data series
over 120 are truncated.
Colors in Excel Different From Those in HTML or PDFIf an IBM Cognos 8 report contains a chart that uses custom colors, Excel may not be able to add
the custom color to the Excel color palette. Excel will attempt to match the custom color to one of
its available standard colors. As a result, colors in Excel may vary from those seen in HTML or
PDF.
We recommend that you use standard colors in charts.
Repeating Pie ChartsIf you have a report that has repeating pie charts and you define a chart title, Excel will show each
pie with a title that is a concatenation of the chart title and the data series. For example, if the chart
title is Quantity Sold by Order Method and Product Line and the data series is Order method, the
title of each pie in Excel will be Quantity Sold by Order Method and Product Line, order method.
546 Report Studio
Chapter 23: Limitations When Producing Reports in Microsoft Excel Format
Unable to Skip Discrete Axis LabelsIn IBM Cognos 8 charts, you can control the skipping of discrete axis labels. This feature is not
supported in Excel charts.
Unsupported IBM Cognos 8 FormattingAbout 30% of the formatting functions available in IBM Cognos 8 are not supported in Microsoft
Excel. In particular, Excel does not allow changing locale-dependent formatting attributes, such as
the following:
● Decimal Separator
● Exponential Symbol
● Group Separator
● Monetary Decimal Separator
● AM String
● Day Name
● Day Short Name
● Decimal Delimiter Symbol
● Month Name
● Month Short Name
● PM String
In addition, Excel does not support the following:
● Format Width
● International Currency Symbol
● List Separator
● Percent Symbol (Excel does not support percent symbols for charts)
● Multiplier
● Overline Text Format
● PerMill Symbol
● Plus Sign
● Scale (Excel has a different scaling formula than IBM Cognos 8)
● Calendar (Excel does not allow changing the calendar)
● Era Name
Professional Authoring User Guide 547
Chapter 23: Limitations When Producing Reports in Microsoft Excel Format
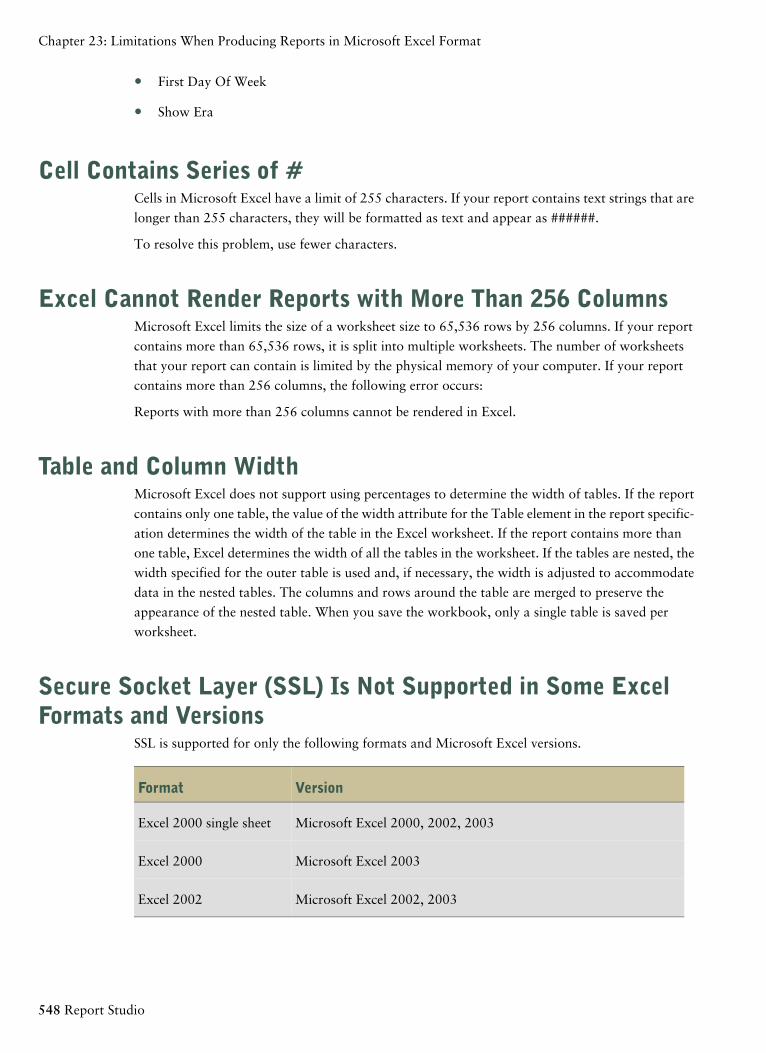
● First Day Of Week
● Show Era
Cell Contains Series of #Cells in Microsoft Excel have a limit of 255 characters. If your report contains text strings that are
longer than 255 characters, they will be formatted as text and appear as ######.
To resolve this problem, use fewer characters.
Excel Cannot Render Reports with More Than 256 ColumnsMicrosoft Excel limits the size of a worksheet size to 65,536 rows by 256 columns. If your report
contains more than 65,536 rows, it is split into multiple worksheets. The number of worksheets
that your report can contain is limited by the physical memory of your computer. If your report
contains more than 256 columns, the following error occurs:
Reports with more than 256 columns cannot be rendered in Excel.
Table and Column WidthMicrosoft Excel does not support using percentages to determine the width of tables. If the report
contains only one table, the value of the width attribute for the Table element in the report specific-
ation determines the width of the table in the Excel worksheet. If the report contains more than
one table, Excel determines the width of all the tables in the worksheet. If the tables are nested, the
width specified for the outer table is used and, if necessary, the width is adjusted to accommodate
data in the nested tables. The columns and rows around the table are merged to preserve the
appearance of the nested table. When you save the workbook, only a single table is saved per
worksheet.
Secure Socket Layer (SSL) Is Not Supported in Some ExcelFormats and Versions
SSL is supported for only the following formats and Microsoft Excel versions.
VersionFormat
Microsoft Excel 2000, 2002, 2003Excel 2000 single sheet
Microsoft Excel 2003Excel 2000
Microsoft Excel 2002, 2003Excel 2002
548 Report Studio
Chapter 23: Limitations When Producing Reports in Microsoft Excel Format
Number Format Becomes Currency Format in Japanese ExcelA report uses the Number data format and you save it as Microsoft Excel output. When you open
the report in the Japanese version of Microsoft Excel, the data format is listed as Currency rather
than Number. This occurs because Japanese Excel interprets the standard Number data format
slightly differently than other versions of Excel.
The value appears correctly in Number format. For example, if you specified five digits as your
number format, five digits still appear. In Excel, click the Custom number format to see the exact
format string being used.
Report Shows Data in Wrong ColumnsA report contains a large amount of data that is presented using a large number of nested report
objects, such as tables and blocks. When the report is produced in Excel format, some of the data
appears in the wrong columns. This occurs because Excel has a 64K limit on how many nested cell
objects can appear in a single spreadsheet.
To solve this problem, you can redesign the report to present the data using non-nested structures.
Unable to Access a Report on a Remote ServerYou cannot access a report in Excel format on a remote server.
To resolve this problem, you must change the hostname portion of the gateway URI from localhost
to either the IP address of the computer or the computer name. You do this using IBM Cognos
Configuration.
Drill-through Reports Are Not Supported in ExcelIBM Cognos 8 does not support drill-through for reports in Excel format.
Map Reports Are Not Supported in ExcelIBM Cognos 8 does not support map reports in Excel format.
Unsupported Excel FormattingIBM Cognos 8 does not support the following formatting functions available in Excel:
● background images in table cells
● Excel-specific headers and footers
● text flow and justification
● floating text objects
● white space, normal, and wrap text formatting
Professional Authoring User Guide 549
Chapter 23: Limitations When Producing Reports in Microsoft Excel Format
● maximum characters
Some layouts do not show exactly in HTML and PDF due to Microsoft Excel limitations.
Hyperlink Buttons Are Not Supported in ExcelMicrosoft Excel does not support hyperlink buttons.
Unable to View Reports in Excel Format Sent as Email Attach-ments
IBM Cognos 8 can send Excel reports in HTML and XML format by email. However, you cannot
open them directly from the email message.
Save the Excel email attachments to your computer and view them from there.
Unsupported Chart Properties in ExcelThe following IBM Cognos 8 chart properties are not supported in Microsoft Excel:
● tool tips
● conditional text
● depth
● visual angle
● show values
● marker text location
● show baseline
● new note
● new marker
● truncation text and allow n-degrees rotation category labels
● border
● margin
● box type
● font and font alignment
● footer
● subtitle
● regression line
550 Report Studio
Chapter 23: Limitations When Producing Reports in Microsoft Excel Format
● baseline
In addition, IBM Cognos 8 makes sure that Excel reuses the same color palette that is defined in
IBM Cognos 8. However, Excel can only use the first 16 colors from the IBM Cognos 8 palette. If
the number of categories in a chart exceeds 16, the rest of the colors are taken from the default
Excel palette.
Unsupported Chart Types in ExcelAbout 30% of the chart types available in IBM Cognos 8 are not matched in Microsoft Excel.
The following chart types appear differently or are not supported. Charts that are not supported
appear as a default column chart in Microsoft Excel.
● Bubble charts
Excel does not support regression lines.
● Combination charts
In Excel, combination charts appear as two-dimensional. If a three-dimensional or two-
dimensional combination chart includes only an area, column, or line chart, only the one chart
appears.
● Gauge charts
● Donut charts
Excel may fill in the donut hole to accommodate extra measures. Excel shows donut three-
dimensional charts as donut charts.
● Maps
In Excel, no chart appears.
● Metrics range charts
In Excel, they appear as combination charts with two line charts for the tolerance bars.
● Pareto charts
In Excel, the cumulative line is not displayed.
● Pie charts
Excel shows only one type of pie chart and may show it at a different angle.
● Progressive column charts
● Polar charts
In Excel, a scatter chart appears instead.
● Quadrant charts
● Radar charts
Professional Authoring User Guide 551
Chapter 23: Limitations When Producing Reports in Microsoft Excel Format
Excel does not support stacked area radar charts. Excel names area radar charts as filled radar
charts. Excel shows radar charts as radar with markers.
● Scatter charts
In Excel, three-dimensional scatter charts appear as two-dimensional scatter charts. The z-axis
is dropped.
552 Report Studio
Chapter 23: Limitations When Producing Reports in Microsoft Excel Format

Chapter 24: Report Studio Object and PropertyReference
This appendix contains definitions of the objects and properties found in Report Studio. They are
available contextually, by pressing F1 when an object or property is active in the Report Studio
authoring environment.
The following objects and properties are referenced:
● Report Studio Objects
These objects are visible in the Report Studio work area. They can be inserted from the Toolbox
tab .
● Report Studio Properties
These properties can be set on Report Studio objects. They are available in the lower-left pane
of Report Studio.
● Data Formatting Properties
These properties can be set on data values by selecting Layout Data Format from the Data
menu, or by editing the Data Format property for Report Studio objects.
Report Studio ObjectsThe following is a list of objects available in Report Studio.
3-D AreaA chart in which members of a data series are represented by three-dimensional areas of varying
size and color. The three-dimensional area chart is one of three chart types that can be included in
a three-dimensional combination chart.
Properties of 3-D Area
Border Color, Borders, Chart Type, Values
3-D BarA chart in which members of a data series are represented by three-dimensional bars of varying
length and color. The three-dimensional bar chart is one of three chart types that can be included
in a three-dimensional combination chart.
Properties of 3-D Bar
Border Color, Borders, Chart Type, Values
Professional Authoring User Guide 553
3-D Combination ChartA chart that includes any number and combination of three-dimensional bar charts, line charts,
and area charts. This chart plots any number of data series against one common measure on the
vertical numeric axis and one or two common data series on ordinal axes.
Properties of 3-D Combination Chart
3-D Viewing Angle, Background Color, Background Image, Baselines, Border, Box Type, Classes,
Conditional Palette, Conditional Styles, Drill-Through Definitions, Floating, Font, Footer, Foreground
Color, Generated Background Image, Margin, Master Detail Relationships, Maximum Hotspots,
Name, No Data Contents, Notes, Numerical Axis, Padding, Pagination, Palette, Query, Relative
Alignment, Render Page when Empty, Render Variable, Series Color, Size & Overflow, Style
Variable, Subtitle, Suppression, Title, Tooltips, Visible, X Axis, Y Axis
3-D LineA chart in which members of a data series are represented by three-dimensional lines of varying
colors. The three-dimensional line chart is one of three chart types that can be included in a three-
dimensional combination chart.
Properties of 3-D Line
Border Color, Borders, Chart Type, Values
3-D Scatter ChartA chart that plots three measures against one or more data series on a three-dimensional X-Y-Z
graph.
Properties of 3-D Scatter Chart
3-D Viewing Angle, Background Color, Background Image, Baselines, Border, Border Color, Borders,
Box Type, Classes, Conditional Palette, Conditional Styles, Drill-Through Definitions, Floating,
Font, Footer, Foreground Color, Generated Background Image, Legend, Margin, Marker Size (pt),
Master Detail Relationships, Maximum Hotspots, Name, No Data Contents, Notes, Padding,
Pagination, Palette, Point Shape, Query, Relative Alignment, Render Page when Empty, Render
Variable, Show Feelers, Size & Overflow, Style Variable, Subtitle, Suppression, Title, Tooltips,
Values, Visible
Angular AxisThe angular numeric axis for a polar chart, including labels, titles, range, and scale.
Properties of Angular Axis
Axis Labels, Axis Line, Axis Title, Classes, Conditional Styles, Data Format, Font, Foreground
Color, Gridlines, Include Zero For Auto Scale, Maximum Value, Minimum Value, Minor Gridlines,
Scale, Scale Interval, Style Variable, Use Same Range For All Instances, Visible
554 Report Studio
Chapter 24: Report Studio Object and Property Reference
Angular MeasureThe measure that determines the angular position of each data marker on a polar chart.
Properties of Angular Measure
Aggregate Function, Conditional Styles, Custom Label, Data Format, Expression, Hierarchy,
Hierarchy Unique Name, Label, Level, Level Unique Name, Member, Member Unique Name,
Name, Property Unique Name, Rollup Aggregate Function, Root Members Only, Set Sorting, Style
Variable, Type
AreaThe data marker used to represent data series in an area chart.
Properties of Area
Axis Assignment, Border Color, Borders, Chart Type, Grouping Type, Value Location, Values,
Value Type
As of Time ExpressionAn expression that produces a Date-Time value. This expression can be used to show report results
for a specific time period that is defined by an expression that you create.
Properties of As of Time Expression
Report Expression
Axis TitleThe title for an axis of the chart.
Properties of Axis Title
Box Type, Classes, Conditional Styles, Default Title, Font, Foreground Color, Master Detail Rela-
tionships, Properties, Query, Style Variable, Visible
BarA chart in which members of a data series are represented by bars of varying length and color.
Properties of Bar
Axis Assignment, Border Color, Borders, Chart Type, Connecting Lines, Grouping Type, Value
Location, Values, Value Type
BaselineA baseline to be rendered on a chart.
Professional Authoring User Guide 555
Chapter 24: Report Studio Object and Property Reference
Properties of Baseline
Aggregate Function, Axis Assignment, Bar, Line, or Area Index, Box Type, Data Item Value,
Expression, Hierarchy, Hierarchy Unique Name, Label, Label, Legend Label, Level, Level Unique
Name, Line Styles, Master Detail Relationships, Member, Member Offset (%), Member Unique
Name, Name, Numeric Value, Percentile, Percent of Axis, Position type, Properties, Property Unique
Name, Query, Report Expression, Report Expression, Rollup Aggregate Function, Root Members
Only, Set Sorting, Standard Deviations, Type
BaselineA baseline for a polar chart, scatter chart, or bubble chart.
Properties of Baseline
Aggregate Function, Axis Assignment, Data Item Value, Expression, Hierarchy, Hierarchy Unique
Name, Label, Label, Legend Label, Level, Level Unique Name, Line Styles, Master Detail Relation-
ships, Member, Member Unique Name, Name, Numeric Value, Percentile, Percent of Axis, Position
type, Properties, Property Unique Name, Query, Report Expression, Rollup Aggregate Function,
Root Members Only, Set Sorting, Standard Deviations, Type
BaselineA baseline for a three-dimensional combination chart.
Properties of Baseline
Aggregate Function, Bar, Line, or Area Index, Box Type, Data Item Value, Expression, Hierarchy,
Hierarchy Unique Name, Label, Level, Level Unique Name, Line Styles, Master Detail Relationships,
Member, Member Unique Name, Name, Numeric Value, Percentile, Percent of Axis, Position type,
Properties, Property Unique Name, Query, Report Expression, Rollup Aggregate Function, Root
Members Only, Set Sorting, Standard Deviations, Type
BaselineA baseline for a three-dimensional scatter chart.
Properties of Baseline
Aggregate Function, Box Type, Data Item Value, Expression, Hierarchy, Hierarchy Unique Name,
Label, Level, Level Unique Name, Line Styles, Master Detail Relationships, Member, Member
Unique Name, Name, Numeric Value, Percentile, Percent of Axis, Position type, Properties, Property
Unique Name, Query, Report Expression, Rollup Aggregate Function, Root Members Only, Set
Sorting, Standard Deviations, Type
BlockA container into which you can insert other objects.
556 Report Studio
Chapter 24: Report Studio Object and Property Reference
Properties of Block
Background Color, Background Image, Border, Box Type, Classes, Conditional Styles, Floating,
Font, Foreground Color, Generated Background Image, Horizontal Alignment, Margin, Name,
Padding, Render Variable, Size & Overflow, Spacing & Breaking, Style Variable, Text Flow &
Justification, Visible, White Space
BookmarkA link to another area within the same report. The link can be defined as a static value, a query
item, or as the result of a report expression.
Properties of Bookmark
Data Item Label, Data Item Value, Label, Report Expression, Source Type
Bubble ChartA point chart that plots one or more data series against three measures: a Y-value, an X-value, and
a bubble whose relative size represents the third measure. Multiple points are plotted for each cat-
egory.
To help distinguish values, set the Tool Tips property of this object to Yes.
Properties of Bubble Chart
Background Color, Background Image, Baselines, Border, Border Color, Borders, Box Type, Bubble
Size, Classes, Conditional Palette, Conditional Styles, Drill-Through Definitions, Floating, Font,
Footer, Foreground Color, Generated Background Image, Legend, Margin, Markers, Marker Text
Location, Master Detail Relationships, Maximum Hotspots, Name, No Data Contents, Notes,
Padding, Pagination, Palette, Point Shape, Query, Regression Line, Relative Alignment, Render
Page when Empty, Render Variable, Size & Overflow, Style Variable, Subtitle, Suppression, Title,
Tooltips, Value Location, Values, Visible, X Axis, Y Axis
Bubble MeasureThe measure that determines the size of each bubble on a bubble chart.
Properties of Bubble Measure
Aggregate Function, Conditional Styles, Custom Label, Data Format, Expression, Hierarchy,
Hierarchy Unique Name, Label, Level, Level Unique Name, Member, Member Unique Name,
Name, Property Unique Name, Rollup Aggregate Function, Root Members Only, Set Sorting, Style
Variable, Type
Calculated MeasureA data item that is a calculated member.
Properties of Calculated Measure
Calculation Intersection, Dimension, Expression, Label, Name, Solve Order, Type
Professional Authoring User Guide 557
Chapter 24: Report Studio Object and Property Reference
Calculated MemberAn item, within a dimension, that represents an occurrence of schema data defined as a calculation
of two or more members.
Properties of Calculated Member
Caption, Data Item, Name
Calculated MemberA data item that is a calculated member.
Properties of Calculated Member
Calculation Intersection, Dimension, Expression, Hierarchy, Label, Name, Solve Order, Type
CaptionThe caption on a Field Set object.
Properties of Caption
Background Color, Background Image, Border, Classes, Conditional Styles, Font, Foreground
Color, Margin, Padding, Style Variable
Chart BodyDefines the body style of the chart itself. The style of the body can be set independently of the chart
itself.
Properties of Chart Body
Background Color, Background Image, Conditional Styles, Fill Effects, Font, Foreground Color,
Horizontal Alignment, Style Variable
Chart FooterA footer for the chart.
Properties of Chart Footer
Box Type, Classes, Conditional Styles, Font, Foreground Color, Generated Background Image,
Horizontal Alignment, Master Detail Relationships, Properties, Query, Style Variable, Visible
Chart Node MemberA data item, and its accompanying text, to render on the chart.
Properties of Chart Node Member
Aggregate Function, Custom Label, Data Format, Data Item Label, Data Item Label, Data Item
Label, Data Item Label, Data Item Value, Data Item Value, Data Item Value, Data Item Value,
Expression, Hierarchy, Hierarchy Unique Name, HTML, HTML Source Variable, Label, Label,
558 Report Studio
Chapter 24: Report Studio Object and Property Reference
Level, Level Unique Name, Member, Member Unique Name, Name, Properties, Property Unique
Name, Report Expression, Report Expression, Report Expression, Report Expression, Rollup
Aggregate Function, Root Members Only, Set Sorting, Sorting, Source Type, Source Type, Source
Type, Source Type, Text, Text Source Variable, Type, URL, URL Source Variable
Chart SubtitleThe subtitle for a chart.
Properties of Chart Subtitle
Box Type, Classes, Conditional Styles, Font, Foreground Color, Generated Background Image,
Horizontal Alignment, Master Detail Relationships, Properties, Query, Style Variable, Visible
Chart Text ItemThe data source and format for a text item, such as a legend item, legend title, axis label, or axis
title.
Properties of Chart Text Item
Aggregate Function, Conditional Styles, Data Format, Data Item Label, Data Item Value, Expression,
Hierarchy, Hierarchy Unique Name, Label, Level, Level Unique Name, Member, Member Unique
Name, Name, Property Unique Name, Report Expression, Rollup Aggregate Function, Root
Members Only, Set Sorting, Source Type, Style Variable, Text, Text Source Variable, Type
Chart TitleThe title text that appears at the top of the chart.
Properties of Chart Title
Box Type, Classes, Conditional Styles, Font, Foreground Color, Generated Background Image,
Horizontal Alignment, Master Detail Relationships, Properties, Query, Style Variable, Visible
ClassThe HTML class name for a layout object. Use this attribute to indicate the type of styling to apply
to the object when the report is rendered.
Properties of Class
Background Color, Background Image, Border, Box Type, Description, Floating, Font, Foreground
Color, Generated Background Image, Horizontal Alignment, Label, Label, Margin, Padding, Relative
Alignment, Size & Overflow, Spacing & Breaking, Table Properties, Text Flow & Justification,
Vertical Alignment, Visible, White Space
Combination ChartA chart that uses combinations of column charts, area charts, and line charts as data markers to
plot multiple data series.
Professional Authoring User Guide 559
Chapter 24: Report Studio Object and Property Reference
Properties of Combination Chart
Background Color, Background Image, Baselines, Border, Box Type, Chart Orientation, Classes,
Conditional Palette, Conditional Styles, Depth, Drill-Through Definitions, Floating, Font, Footer,
Foreground Color, Generated Background Image, Legend, Margin, Markers, Marker Text Location,
Master Detail Relationships, Maximum Hotspots, Name, No Data Contents, Notes, Ordinal Axis,
Padding, Pagination, Palette, Query, Relative Alignment, Render Page when Empty, Render Variable,
Rotate Values, Series Color, Size & Overflow, Style Variable, Subtitle, Suppression, Title, Tooltips,
Value Location, Visible, Visual Angle, Y1 Axis, Y2 Axis, Y2 Axis Position
Component OverrideOverrides a child object of the Layout Component Reference object.
Properties of Component Override
Component Reference
Conditional BlockA block that can be used for conditional display.
Properties of Conditional Block
Background Color, Background Image, Block Variable, Border, Box Type, Classes, Conditional
Styles, Current Block, Floating, Font, Foreground Color, Generated Background Image, Horizontal
Alignment, Margin, Padding, Size & Overflow, Spacing & Breaking, Style Variable, Text Flow &
Justification, Visible, White Space
Conditional BlockContains the default set of layout objects to render based on a report variable.
Properties of Conditional Block
Background Color, Background Image, Block Variable, Border, Box Type, Classes, Conditional
Styles, Current Block, Floating, Font, Foreground Color, Generated Background Image, Horizontal
Alignment, Margin, Padding, Size & Overflow, Spacing & Breaking, Style Variable, Text Flow &
Justification, Visible, White Space
Context Item TextThe text associated with a context area item.
Properties of Context Item Text
Background Color, Background Image, Border, Box Type, Classes, Conditional Styles, Floating,
Font, Foreground Color, Margin, Padding, Relative Alignment, Render Variable, Separator, Size
& Overflow, Spacing & Breaking, Style Variable, Text Flow & Justification, Visible
560 Report Studio
Chapter 24: Report Studio Object and Property Reference
CrosstabA layout object used to render the results of a query that aggregates data, and then arranges it in
a two-dimensional grid.
Properties of Crosstab
Background Color, Background Image, Border, Box Type, Classes, Conditional Styles, Default
Measure, Drop Shadow, Fact Cells Precedence, Floating, Font, Foreground Color, Has Fact Cells,
Horizontal Alignment, Margin, Master Detail Relationships, Name, No Data Contents, Pagination,
Query, Relative Alignment, Render Page when Empty, Render Variable, Rows Per Page, Size &
Overflow, Style Variable, Suppression, Table Properties, Text Flow & Justification, Visible
Crosstab ColumnsOverrides the style for Crosstab Column Member objects that is defined in the GlobalReportStyles.
css file.
Properties of Crosstab Columns
Background Color, Background Image, Border, Box Type, Conditional Styles, Data Format, Font,
Foreground Color, Generated Background Image, Horizontal Alignment, Padding, Size & Overflow,
Spacing & Breaking, Style Variable, Text Flow & Justification, Vertical Alignment, White Space
Crosstab ColumnsA list of columns in a crosstab.
Properties of Crosstab Columns
Background Color, Background Image, Border, Box Type, Conditional Styles, Data Format, Font,
Foreground Color, Generated Background Image, Horizontal Alignment, Padding, Size & Overflow,
Spacing & Breaking, Style Variable, Text Flow & Justification, Vertical Alignment, White Space
Crosstab CornerThe top-left corner of a crosstab, on top of the row labels and to the left of the column labels. It is
generally used to represent crosstab members.
Properties of Crosstab Corner
Aggregate Function, Background Color, Background Image, Border, Box Type, Classes, Conditional
Styles, Data Format, Data Item Label, Data Item Label, Data Item Label, Data Item Label, Data
Item Value, Data Item Value, Data Item Value, Data Item Value, Expression, Font, Foreground
Color, Generated Background Image, Hierarchy, Hierarchy Unique Name, Horizontal Alignment,
HTML, HTML Source Variable, Label, Label, Level, Level Unique Name, Member, Member Unique
Name, Name, Padding, Property Unique Name, Report Expression, Report Expression, Report
Expression, Report Expression, Rollup Aggregate Function, Root Members Only, Set Sorting, Size
& Overflow, Source Type, Source Type, Source Type, Source Type, Spacing & Breaking, Style
Variable, Text, Text Flow & Justification, Text Source Variable, Type, URL, URL Source Variable,
Vertical Alignment, White Space
Professional Authoring User Guide 561
Chapter 24: Report Studio Object and Property Reference
Crosstab Fact CellsThe contents of the fact cells of the crosstab. There is only one fact cell definition for the crosstab,
regardless of the number of measures.
Properties of Crosstab Fact Cells
Aggregate Function, Apply Single Class, Background Color, Background Image, Border, Box Type,
Classes, Conditional Styles, Data Format, Data Item Label, Data Item Label, Data Item Label, Data
Item Label, Data Item Value, Data Item Value, Data Item Value, Data Item Value, Drill-Through
Definitions, Expression, Font, Foreground Color, Generated Background Image, Hierarchy, Hierarchy
Unique Name, Horizontal Alignment, HTML, HTML Source Variable, Label, Label, Level, Level
Unique Name, Member, Member Unique Name, Name, Padding, Property Unique Name, Report
Expression, Report Expression, Report Expression, Report Expression, Rollup Aggregate Function,
Root Members Only, Set Sorting, Size & Overflow, Source Type, Source Type, Source Type, Source
Type, Spacing & Breaking, Style Variable, Text, Text Flow & Justification, Text Source Variable,
Type, URL, URL Source Variable, Vertical Alignment, White Space
Crosstab IntersectionAn intersection in a crosstab. The cell contents of a specific intersection can be overridden and the
style defined.
Properties of Crosstab Intersection
Aggregate Function, Background Color, Background Image, Border, Box Type, Classes, Column
Coordinate, Conditional Styles, Data Format, Data Item Label, Data Item Label, Data Item Label,
Data Item Label, Data Item Value, Data Item Value, Data Item Value, Data Item Value, Define
Contents, Drill-Through Definitions, Expression, Font, Foreground Color, Generated Background
Image, Hierarchy, Hierarchy Unique Name, Horizontal Alignment, HTML, HTML Source Variable,
Label, Label, Level, Level Unique Name, Member, Member Unique Name, Name, Padding, Property
Unique Name, Report Expression, Report Expression, Report Expression, Report Expression,
Rollup Aggregate Function, Root Members Only, Row Coordinate, Set Sorting, Size & Overflow,
Source Type, Source Type, Source Type, Source Type, Spacing & Breaking, Style Variable, Text,
Text Flow & Justification, Text Source Variable, Type, URL, URL Source Variable, Vertical
Alignment, White Space
Crosstab Member Fact CellsThe contents of the fact cells of a crosstab node member.
Properties of Crosstab Member Fact Cells
Aggregate Function, Background Color, Background Image, Border, Box Type, Classes, Conditional
Styles, Data Format, Data Item Label, Data Item Label, Data Item Label, Data Item Label, Data
Item Value, Data Item Value, Data Item Value, Data Item Value, Define Contents, Drill-Through
Definitions, Expression, Font, Foreground Color, Generated Background Image, Hierarchy, Hierarchy
Unique Name, Horizontal Alignment, HTML, HTML Source Variable, Label, Label, Level, Level
Unique Name, Member, Member Unique Name, Name, Padding, Property Unique Name, Report
Expression, Report Expression, Report Expression, Report Expression, Rollup Aggregate Function,
562 Report Studio
Chapter 24: Report Studio Object and Property Reference
Root Members Only, Set Sorting, Size & Overflow, Source Type, Source Type, Source Type, Source
Type, Spacing & Breaking, Style Variable, Text, Text Flow & Justification, Text Source Variable,
Type, URL, URL Source Variable, Vertical Alignment, White Space
Crosstab Node MemberA member in the crosstab node.
Properties of Crosstab Node Member
Aggregate Function, Background Color, Background Image, Border, Box Type, Classes, Conditional
Styles, Data Format, Data Item, Data Item Label, Data Item Label, Data Item Label, Data Item
Label, Data Item Value, Data Item Value, Data Item Value, Data Item Value, Drill-Through
Definitions, Expression, Font, Foreground Color, Generated Background Image, Hierarchy, Hierarchy
Unique Name, Horizontal Alignment, HTML, HTML Source Variable, Label, Label, Level, Level
Indentation, Level Unique Name, Member, Member Unique Name, Name, Node Coordinate,
Padding, Pagination, Properties, Property Unique Name, Report Expression, Report Expression,
Report Expression, Report Expression, Rollup Aggregate Function, Root Members Only, Set
Sorting, Size & Overflow, Sorting, Source Type, Source Type, Source Type, Source Type, Spacing
& Breaking, Style Variable, Text, Text Flow & Justification, Text Source Variable, Type, URL,
URL Source Variable, Vertical Alignment, White Space
Crosstab RowsOverrides the style for Crosstab Row Member objects that is defined in the GlobalReportStyles.css
file.
Properties of Crosstab Rows
Background Color, Background Image, Border, Box Type, Conditional Styles, Data Format, Font,
Foreground Color, Generated Background Image, Horizontal Alignment, Padding, Size & Overflow,
Spacing & Breaking, Style Variable, Text Flow & Justification, Vertical Alignment, White Space
Crosstab RowsA list of rows in a crosstab.
Properties of Crosstab Rows
Background Color, Background Image, Border, Box Type, Conditional Styles, Data Format, Font,
Foreground Color, Generated Background Image, Horizontal Alignment, Padding, Size & Overflow,
Spacing & Breaking, Style Variable, Text Flow & Justification, Vertical Alignment, White Space
Crosstab SpaceInserts an empty cell on a crosstab edge. Allows for the insertion of non-data cells on an edge.
Properties of Crosstab Space
Background Color, Background Image, Border, Box Type, Classes, Conditional Styles, Data Format,
Data Item Label, Data Item Label, Data Item Label, Data Item Label, Data Item Value, Data Item
Professional Authoring User Guide 563
Chapter 24: Report Studio Object and Property Reference
Value, Data Item Value, Data Item Value, Drill-Through Definitions, Font, Foreground Color,
Generated Background Image, Horizontal Alignment, HTML, HTML Source Variable, Label, Node
Coordinate, Padding, Pagination, Render Fact Cells, Report Expression, Report Expression, Report
Expression, Report Expression, Size & Overflow, Source Type, Source Type, Source Type, Source
Type, Spacing & Breaking, Style Variable, Text, Text Flow & Justification, Text Source Variable,
URL, URL Source Variable, Vertical Alignment, White Space
Cumulation LineA line that shows the cumulative effect of multiple series members on a measure in a pareto chart.
Properties of Cumulation Line
Cumulation Axis, Cumulation Label, Line Styles, Marker Shape, Marker Size (pt), Properties, Value
Location, Values
Cumulation Line AxisThe axis for the cumulation line in a pareto chart.
Properties of Cumulation Line Axis
Axis Labels, Axis Line, Axis Title, Classes, Conditional Styles, Data Format, Font, Foreground
Color, Gridlines, Minor Gridlines, Scale Interval, Style Variable, Visible
Cumulation Line LabelA label that is rendered with the cumulation line in a pareto chart.
Properties of Cumulation Line Label
Aggregate Function, Data Item Label, Data Item Value, Expression, Hierarchy, Hierarchy Unique
Name, Label, Level, Level Unique Name, Member, Member Unique Name, Name, Property Unique
Name, Report Expression, Rollup Aggregate Function, Root Members Only, Set Sorting, Source
Type, Text, Text Source Variable, Type
Data ItemA set of data values or members.
Properties of Data Item
Aggregate Function, Calculation Intersection, Detail, Expression, Label, Name, Pre-Sort, Rollup
Aggregate Function, Solve Order, Type
DateThe date when the report runs.
Properties of Date
Background Color, Classes, Data Format, Font, Foreground Color, Margin, Relative Alignment
564 Report Studio
Chapter 24: Report Studio Object and Property Reference
Date & Time PromptA prompt control with which you can select a date and time value.
Properties of Date & Time Prompt
Box Type, Calendar Type, Clock Mode, Conditional Styles, Default Selections, Display Milliseconds,
Display Seconds, First Date, Floating, Hide Adornments, Last Date, Multi-Select, Name, Parameter,
Range, Render Variable, Required, Select UI, Style Variable, Visible
Date PromptA prompt control with which you can to select a date value.
Properties of Date Prompt
Box Type, Calendar Type, Conditional Styles, Default Selections, First Date, Floating, Hide
Adornments, Last Date, Multi-Select, Name, Parameter, Range, Relative Alignment, Render Variable,
Required, Select UI, Style Variable, Visible
Default MeasureA default measure for the chart. If the chart measure cannot be determined by the data series
rendered on the chart edges, the default measure is used.
Properties of Default Measure
Aggregate Function, Conditional Styles, Custom Label, Data Format, Expression, Hierarchy,
Hierarchy Unique Name, Label, Level, Level Unique Name, Member, Member Unique Name,
Name, Property Unique Name, Rollup Aggregate Function, Root Members Only, Set Sorting, Style
Variable, Type
Detail FilterA set of conditions in a query that narrow the scope of the data returned. A detail filter is applied
before aggregation is complete.
Properties of Detail Filter
Application, Expression, Usage
DimensionA grouping of descriptive information about an aspect of a business. Dimensions contain levels,
whose order defines the hierarchy of organizational structures and data. Dimensions and levels are
values by which measures can be viewed, filtered, or aggregated.
Properties of Dimension
Name
Professional Authoring User Guide 565
Chapter 24: Report Studio Object and Property Reference
Display LayerA map layer that is there for appearance only. Display layers do not correspond to data series or
measures.
Properties of Display Layer
Border Color, Borders, Conditional Styles, Fill Effects, Labels, Style Variable
Explicit Member SetA set of data items that define an explicit set of members.
Properties of Explicit Member Set
Dimension, Hierarchy, Label, Members, Name, Set Sorting, Type
FactThe central values that are aggregated and analyzed. Also known as measures, they are special
business measurement values, such as sales or inventory levels.
Properties of Fact
Data Item, Name
Field SetA container with a caption, into which you can insert other objects. It is similar to a block object,
except that it also has a caption.
Properties of Field Set
Background Color, Background Image, Border, Box Type, Classes, Conditional Styles, Floating,
Font, Foreground Color, Horizontal Alignment, Margin, Name, Relative Alignment, Render Variable,
Show Caption, Size & Overflow, Style Variable, Visible
Gauge ChartA chart that plots a data series against a measure using a dial or gauge for the measure, and needles
or indicators for the series members.
Properties of Gauge Chart
Axis Title, Background Color, Background Image, Border, Border Color, Borders, Box Type, Classes,
Conditional Palette, Conditional Styles, Dial Outline Color, Drill-Through Definitions, Face Color,
Floating, Font, Footer, Foreground Color, Gauge Labels, Gauge Palette, Generated Background
Image, Legend, Margin, Master Detail Relationships, Maximum Hotspots, Name, No Data Contents,
Notes, Numerical Axis, Padding, Pagination, Palette, Query, Relative Alignment, Render Page when
Empty, Render Variable, Size & Overflow, Style Variable, Subtitle, Suppression, Title, Tooltips,
Visible
566 Report Studio
Chapter 24: Report Studio Object and Property Reference
Gauge LabelsA label for each gauge in a multiple gauge chart.
Properties of Gauge Labels
Classes, Conditional Styles, Drill-Through Definitions, Font, Foreground Color, Horizontal
Alignment, Maximum Truncation Characters, Style Variable, Truncation, Truncation Text, Visible
Gauge Numerical AxisThe numeric axis for the gauge chart, including labels, titles, range, and scale.
Properties of Gauge Numerical Axis
Conditional Styles, Data Format, Font, Foreground Color, Gridlines, Include Zero For Auto Scale,
Maximum Value, Minimum Value, Minor Gridlines, Scale, Scale Interval, Style Variable, Use Same
Range For All Instances, Visible
Generated PromptA control that acts as a placeholder. The report server will replace this control with an appropriate
generated prompt control, as if it was on a generated prompt page.
Properties of Generated Prompt
Hide Adornments, Name, Parameter, Render Variable, Required
Hierarchy SetA set of data items that define the members of a hierarchy.
Properties of Hierarchy Set
Dimension, Hierarchy, Hierarchy Unique Name, Label, Name, Root Members Only, Set Sorting,
Type
HTML ItemA container into which you can add HTML, such as a link to a multimedia file. HTML items will
only appear when you run the report in HTML format.
When you upgrade to the next version of IBM Cognos 8, the report upgrade processes do not
account for the use of undocumented and unsupported mechanisms or features such as JavaScript
that refers to IBM Cognos HTML items.
Properties of HTML Item
Aggregate Function, Data Item Label, Data Item Value, Description, Expression, Hierarchy, Hier-
archy Unique Name, HTML, HTML Source Variable, Label, Level, Level Unique Name, Member,
Member Unique Name, Name, Name, Property Unique Name, Render Variable, Report Expression,
Rollup Aggregate Function, Root Members Only, Set Sorting, Source Type, Type
Professional Authoring User Guide 567
Chapter 24: Report Studio Object and Property Reference
HyperlinkA hyperlink that can be defined as a static value, a query item, or as the result of a report expression.
If a report expression is used, then the other values are ignored.
Properties of Hyperlink
Background Color, Background Image, Border, Box Type, Classes, Conditional Styles, Data Item
Label, Data Item Label, Data Item Value, Data Item Value, Floating, Font, Foreground Color,
Margin, Name, Padding, Relative Alignment, Render Variable, Report Expression, Report
Expression, Size & Overflow, Source Type, Source Type, Spacing & Breaking, Style Variable, Text,
Text Flow & Justification, Text Source Variable, URL, URL Source Variable, Visible
Hyperlink ButtonA hyperlink that is formatted as a button. The hyperlink can be defined as a static value, a query
item, or as the result of a report expression. If a report expression is used, then the other values are
ignored.
Properties of Hyperlink Button
Background Color, Background Image, Border, Classes, Conditional Styles, Data Item Label, Data
Item Label, Data Item Value, Data Item Value, Floating, Foreground Color, Margin, Name, Padding,
Relative Alignment, Render Variable, Report Expression, Report Expression, Size & Overflow,
Source Type, Source Type, Style Variable, Text, Text Source Variable, URL, URL Source Variable
ImageA link to an image file. The link can be a static value, or it can come from a report expression or
query item. Use the URL source properties of the image object to define the link.
Properties of Image
Aggregate Function, Background Color, Background Image, Border, Box Type, Classes, Conditional
Styles, Data Item Label, Data Item Value, Drill-Through Definitions, Expression, Floating, Hierarchy,
Hierarchy Unique Name, Label, Level, Level Unique Name, Margin, Member, Member Unique
Name, Name, Name, Property Unique Name, Relative Alignment, Render Variable, Report
Expression, Rollup Aggregate Function, Root Members Only, Set Sorting, Size & Overflow, Source
Type, Style Variable, Type, URL, URL Source Variable, Visible
Intersection (Tuple)A data item obtained from the combination of two or more members that you specify. An intersection
appears as a single, unified member instead of its component members. Each member must be from
a different dimension.
Properties of Intersection (Tuple)
Dimension, Hierarchy, Label, Members, Name, Type
568 Report Studio
Chapter 24: Report Studio Object and Property Reference
Interval PromptAn advanced prompt control that allows you to enter time duration values.
Properties of Interval Prompt
Box Type, Conditional Styles, Default Selections, Display Milliseconds, Display Seconds, Floating,
Hide Adornments, Multi-Select, Name, Parameter, Range, Render Variable, Required, Style Variable,
Visible
JoinA relationship between a field in one table or query and a field of the same data type in another
table or query.
Properties of Join
Join Relationships
KeyAn object that uniquely identifies members of a level.
If the unique identifier is a primary or alternate key, you need only one key object. If the unique
identifier is a composite key, you need one key object for every data item that participates in making
the members of a level unique.
Properties of Key
Data Item, Name
Layout Component ReferenceA reference to another layout object. Before you can reference an object, its ID property must be
set.
Properties of Layout Component Reference
Component Reference, Embed, Overrides
LegendA key to the patterns or colors assigned to the data series in a chart.
Properties of Legend
Absolute Position, Auto Truncation, Background Color, Background Image, Border Color, Borders,
Bottom Position (px), Box Type, Classes, Conditional Styles, Drill-Through Definitions, Fill Effects,
Font, Font Auto-Sizing, Foreground Color, Horizontal Alignment, Left Position (px), Legend Title,
Maximum Characters, Position, Right Position (px), Separator, Show Legend Values, Style Variable,
Top Position (px), Truncation Text, Visible
Professional Authoring User Guide 569
Chapter 24: Report Studio Object and Property Reference
Legend TitleThe title for the legend, including the title text and text style. If this object is empty, a default title
is rendered, if available.
Properties of Legend Title
Box Type, Classes, Conditional Styles, Default Title, Font, Foreground Color, Horizontal Alignment,
Master Detail Relationships, Properties, Query, Style Variable, Visible
LevelA set of members with a predefined set of similar characteristics. For example, the members Year
1999 and Year 2000 in the Time dimension form a year level, while the corresponding quarters
form a quarter level.
Properties of Level
Caption, Name, Sorting
Level HierarchySpecifies how the levels in a dimension are logically ordered.
Properties of Level Hierarchy
Name
Level SetA set of data items that define the members of a level.
Properties of Level Set
Dimension, Hierarchy, Label, Level, Level Unique Name, Name, Set Sorting, Type
LineThe data marker used to represent a data series in a line chart.
Properties of Line
Axis Assignment, Border Color, Borders, Chart Type, Grouping Type, Line, Line Style, Line Type,
Line Weight (pt), Show Data Points, Value Location, Values, Value Type
ListA layout object that is used to present query results in a list fashion.
Properties of List
Background Color, Background Image, Border, Box Type, Classes, Column Titles, Conditional
Styles, Contents Height, Drop Shadow, Floating, Font, Foreground Color, Grouping & Sorting,
Horizontal Alignment, Margin, Master Detail Relationships, Name, No Data Contents, Pagination,
570 Report Studio
Chapter 24: Report Studio Object and Property Reference
Properties, Query, Relative Alignment, Render Page when Empty, Render Variable, Rows Per Page,
Share Result Set, Size & Overflow, Style Variable, Suppression, Table Properties, Text Flow &
Justification, Visible
List CellA cell in a row, you can use for a list header or footer.
Properties of List Cell
Aggregate Function, Background Color, Background Image, Border, Box Type, Classes, Conditional
Styles, Data Format, Data Item Label, Data Item Label, Data Item Label, Data Item Label, Data
Item Value, Data Item Value, Data Item Value, Data Item Value, Expression, Font, Foreground
Color, Generated Background Image, Hierarchy, Hierarchy Unique Name, Horizontal Alignment,
HTML, HTML Source Variable, Label, Label, Level, Level Unique Name, Member, Member Unique
Name, Name, Padding, Property Unique Name, Report Expression, Report Expression, Report
Expression, Report Expression, Rollup Aggregate Function, Root Members Only, Set Sorting, Size
& Overflow, Source Type, Source Type, Source Type, Source Type, Spacing & Breaking, Style
Variable, Text, Text Flow & Justification, Text Source Variable, Type, URL, URL Source Variable,
Vertical Alignment, White Space
List ColumnA column in a list. Generally, the column will contain a query item, but it may also contain any
number of layout objects. For example, the To column in a statement list may present the address
in a table format. If the column only contains a query items, then the column will automatically
span the group if the query item is grouped.
Properties of List Column
Background Color, Background Image, Border, Box Type, Conditional Styles, Data Format, Font,
Foreground Color, Generated Background Image, Horizontal Alignment, Padding, Pagination,
Render Variable, Size & Overflow, Spacing & Breaking, Style Variable, Text Flow & Justification,
Vertical Alignment, White Space
List Column BodyThe contents of a column in a list report.
Properties of List Column Body
Aggregate Function, Background Color, Background Image, Border, Box Type, Classes, Conditional
Styles, Data Format, Data Item Label, Data Item Label, Data Item Label, Data Item Label, Data
Item Value, Data Item Value, Data Item Value, Data Item Value, Drill-Through Definitions,
Expression, Font, Foreground Color, Generated Background Image, Group Span, Hierarchy,
Hierarchy Unique Name, Horizontal Alignment, HTML, HTML Source Variable, Label, Label,
Level, Level Unique Name, Member, Member Unique Name, Name, Padding, Property Unique
Name, Report Expression, Report Expression, Report Expression, Report Expression, Rollup
Aggregate Function, Root Members Only, Set Sorting, Size & Overflow, Source Type, Source Type,
Professional Authoring User Guide 571
Chapter 24: Report Studio Object and Property Reference
Source Type, Source Type, Spacing & Breaking, Style Variable, Text, Text Flow & Justification,
Text Source Variable, Type, URL, URL Source Variable, Vertical Alignment, White Space
List ColumnsA set of columns in a list.
Properties of List Columns
Background Color, Background Image, Border, Box Type, Conditional Styles, Data Format, Font,
Foreground Color, Generated Background Image, Horizontal Alignment, Padding, Size & Overflow,
Spacing & Breaking, Style Variable, Text Flow & Justification, Vertical Alignment, White Space
List ColumnsOverrides the style for List Column objects that is defined in the GlobalReportStyles.css file.
Properties of List Columns
Background Color, Background Image, Border, Box Type, Conditional Styles, Data Format, Font,
Foreground Color, Generated Background Image, Horizontal Alignment, Padding, Size & Overflow,
Spacing & Breaking, Style Variable, Text Flow & Justification, Vertical Alignment, White Space
List Columns Body StyleOverrides the style for List Column Body objects that is defined in the GlobalReportStyles.css file.
Properties of List Columns Body Style
Background Color, Background Image, Border, Box Type, Conditional Styles, Data Format, Font,
Foreground Color, Generated Background Image, Horizontal Alignment, Padding, Size & Overflow,
Spacing & Breaking, Style Variable, Text Flow & Justification, Vertical Alignment, White Space
List Columns Title StyleOverrides the style for List Column Title objects that is defined in the GlobalReportStyles.css file.
Properties of List Columns Title Style
Background Color, Background Image, Border, Box Type, Conditional Styles, Data Format, Font,
Foreground Color, Generated Background Image, Horizontal Alignment, Padding, Size & Overflow,
Spacing & Breaking, Style Variable, Text Flow & Justification, Vertical Alignment, White Space
List Column TitleThe title of a list column.
Properties of List Column Title
Aggregate Function, Background Color, Background Image, Border, Box Type, Classes, Conditional
Styles, Data Format, Data Item Label, Data Item Label, Data Item Label, Data Item Label, Data
Item Value, Data Item Value, Data Item Value, Data Item Value, Drill-Through Definitions,
Expression, Font, Foreground Color, Generated Background Image, Hierarchy, Hierarchy Unique
572 Report Studio
Chapter 24: Report Studio Object and Property Reference
Name, Horizontal Alignment, HTML, HTML Source Variable, Label, Label, Level, Level Unique
Name, Member, Member Unique Name, Name, Padding, Property Unique Name, Report Expression,
Report Expression, Report Expression, Report Expression, Rollup Aggregate Function, Root
Members Only, Set Sorting, Size & Overflow, Source Type, Source Type, Source Type, Source
Type, Spacing & Breaking, Style Variable, Text, Text Flow & Justification, Text Source Variable,
Type, URL, URL Source Variable, Vertical Alignment, White Space
List FooterThe footer that appears at the end of a list on each page on which the list is rendered. It is useful
for presenting page totals.
Properties of List Footer
Background Color, Background Image, Border, Box Type, Conditional Styles, Data Format, Font,
Foreground Color, Generated Background Image, Horizontal Alignment, Padding, Properties, Push
To Bottom, Size & Overflow, Spacing & Breaking, Style Variable, Text Flow & Justification,
Vertical Alignment, White Space
List HeaderThe header that appears at the start of a list on each page that the list is rendered. It is useful for
presenting carry forward totals.
Properties of List Header
Background Color, Background Image, Border, Box Type, Conditional Styles, Data Format, Font,
Foreground Color, Generated Background Image, Horizontal Alignment, Padding, Pagination,
Properties, Size & Overflow, Spacing & Breaking, Style Variable, Text Flow & Justification, Vertical
Alignment, White Space
List Page FooterThe footer that appears at the bottom of every page of a list report. This object is rendered after
the list details and other list footers.
Properties of List Page Footer
Push To Bottom
List Page HeaderThe header in the list that will appear on every page rendered. It occurs after the column titles and
before the overall group header of the list.
Properties of List Page Header
Display After Overall Header
List RowA row in a list.
Professional Authoring User Guide 573
Chapter 24: Report Studio Object and Property Reference
Properties of List Row
Background Color, Background Image, Border, Box Type, Conditional Styles, Data Format, Font,
Foreground Color, Generated Background Image, Horizontal Alignment, Padding, Size & Overflow,
Spacing & Breaking, Style Variable, Text Flow & Justification, Vertical Alignment, White Space
List Row Cells StyleOverrides the style for Row Cells Style objects that is defined in the GlobalReportStyles.css file.
Properties of List Row Cells Style
Background Color, Background Image, Border, Box Type, Conditional Styles, Data Format, Font,
Foreground Color, Generated Background Image, Horizontal Alignment, Padding, Size & Overflow,
Spacing & Breaking, Style Variable, Text Flow & Justification, Vertical Alignment, White Space
MapA chart that uses a map to show data.
Properties of Map
Axis Title, Background Color, Background Image, Border, Box Type, Classes, Conditional Styles,
Data Language, Dictionary, Drill-Through Definitions, Expand Features, Floating, Font, Footer,
Foreground Color, Generated Background Image, Ignore Data with No Features, Legend, Map &
Layers, Margin, Master Detail Relationships, Maximum Hotspots, Name, No Data Contents, No
Data Features Size (pt), Notes, Padding, Pagination, Query, Relative Alignment, Render Page when
Empty, Render Variable, Size & Overflow, Style Variable, Subtitle, Suppression, Title, Tooltips,
Visible
Map LocationAssociates a data series with regions on the region layer of the map.
Properties of Map Location
Aggregate Function, Expression, Hierarchy, Hierarchy Unique Name, Label, Level, Level Unique
Name, Member, Member Unique Name, Name, Property Unique Name, Rollup Aggregate Function,
Root Members Only, Set Sorting, Type
Map LocationAssociates a data series with points on the point layer of the map.
Properties of Map Location
Aggregate Function, Expression, Hierarchy, Hierarchy Unique Name, Label, Level, Level Unique
Name, Member, Member Unique Name, Name, Property Unique Name, Rollup Aggregate Function,
Root Members Only, Set Sorting, Type
Map Refinement LocationQualifies the data series members that are associated with regions on the map.
574 Report Studio
Chapter 24: Report Studio Object and Property Reference
Properties of Map Refinement Location
Aggregate Function, Expression, Hierarchy, Hierarchy Unique Name, Label, Level, Level Unique
Name, Member, Member Unique Name, Name, Property Unique Name, Rollup Aggregate Function,
Root Members Only, Set Sorting, Type
Map Refinement LocationQualifies the data series members that are associated with points on the map.
Properties of Map Refinement Location
Aggregate Function, Expression, Hierarchy, Hierarchy Unique Name, Label, Level, Level Unique
Name, Member, Member Unique Name, Name, Property Unique Name, Rollup Aggregate Function,
Root Members Only, Set Sorting, Type
Marimekko ChartA type of bar chart that can show three levels of data.
Properties of Marimekko Chart
Background Color, Background Image, Baselines, Border, Border Color, Borders, Box Type, Classes,
Conditional Palette, Conditional Styles, Depth, Drill-Through Definitions, Floating, Font, Footer,
Foreground Color, Generated Background Image, Legend, Margin, Marimekko Totals, Markers,
Marker Text Location, Master Detail Relationships, Maximum Hotspots, Name, No Data Contents,
Notes, Ordinal Axis, Padding, Pagination, Palette, Query, Relative Alignment, Render Page when
Empty, Render Variable, Size & Overflow, Style Variable, Subtitle, Suppression, Title, Tooltips,
Values, Visible, Visual Angle, Y Axis
MarkerAn additional marker that can be placed at a static point on a chart.
Properties of Marker
Aggregate Function, Axis Assignment, Bar, Line, or Area Index, Box Type, Data Item Value,
Expression, Hierarchy, Hierarchy Unique Name, Label, Label, Level, Level Unique Name, Marker
Color, Marker Shape, Marker Size (pt), Master Detail Relationships, Member, Member Unique
Name, Name, Numeric Value, Percentile, Percent of Axis, Position type, Properties, Property Unique
Name, Query, Report Expression, Report Expression, Rollup Aggregate Function, Root Members
Only, Set Sorting, Standard Deviations, Type
MarkerA marker on a point chart. Point charts include scatter charts, polar charts, radar charts, and bubble
charts.
Professional Authoring User Guide 575
Chapter 24: Report Studio Object and Property Reference
Properties of Marker
Box Type, Data Item Value, Expression, Label, Marker Color, Marker Shape, Marker Size (pt),
Master Detail Relationships, Numeric Value, Percentile, Percent of Axis, Position type, Position
type, Properties, Query, Report Expression, Standard Deviations
MDXA multidimensional expression (MDX) query against an OLAP data source.
Properties of MDX
Catalog, Data Source, MDX, Name
MeasureA data item that defines a measure.
Properties of Measure
Dimension, Label, Member, Member Unique Name, Name, Type
MemberA data item that defines a member.
Properties of Member
Dimension, Hierarchy, Label, Member, Member Unique Name, Name, Type
Member Children SetA set of data items that define the children set of a member.
Properties of Member Children Set
Dimension, Hierarchy, Label, Member, Member Unique Name, Name, Set Sorting, Type
Member HierarchyThe organization of a dimension's members into a logical tree structure, with each member having
one or more "parent" members and an arbitrary number of "child" members.
Properties of Member Hierarchy
Name
Member PropertyA property that is associated with members of a level. Attributes can be used to refine a search
within level members, or to provide additional information about members.
Properties of Member Property
Data Item, Name
576 Report Studio
Chapter 24: Report Studio Object and Property Reference
Member PropertyA member property from either a level or a hierarchy.
Properties of Member Property
Dimension, Hierarchy, Label, Level, Name, Property, Property Unique Name, Type
Member SetA data item that represents a named set. Member sets supply the context for expressions that require
evaluation for multiple dimensions. For example, they determine the contexts for which you can
apply analytical functions such as rank.
Properties of Member Set
Data Item, Name
Metrics Range ChartA chart that superimposes target value markers, target range markers, and tolerance range markers
over any number or combination of bar, line, and area charts.
Properties of Metrics Range Chart
Background Color, Background Image, Baselines, Border, Box Type, Classes, Conditional Palette,
Conditional Styles, Depth, Drill-Through Definitions, Floating, Font, Footer, Foreground Color,
Generated Background Image, Legend, Margin, Marker Color, Marker Label, Markers, Marker
Text Location, Master Detail Relationships, Maximum Hotspots, Name, No Data Contents, Notes,
Ordinal Axis, Padding, Pagination, Palette, Performance Pattern, Query, Range Label, Relative
Alignment, Render Page when Empty, Render Variable, Size & Overflow, Style Variable, Subtitle,
Suppression, Target Color, Target Marker, Target Marker Border Color, Target Marker Position,
Target Range (%), Title, Tolerance Color, Tolerance Label, Tooltips, Upper Range Skew (%),
Value Location, Visible, Visual Angle, Y1 Axis
Metric Studio DiagramA Metric Studio history chart rendered as an image.
Properties of Metric Studio Diagram
Description, Diagram Identifier
Named SetA reference to a named set from the model.
Properties of Named Set
Dimension, Hierarchy, Label, Name, Set Sorting, Type
Professional Authoring User Guide 577
Chapter 24: Report Studio Object and Property Reference
NoteA note on a chart. The source of the note text can be static text, a query item, or a report expression.
Properties of Note
Bottom Position (px), Height (px), Left Position (px), Note Border, Width (px)
Note ContentThe content and style of a note.
Properties of Note Content
Background Color, Box Type, Classes, Conditional Styles, Font, Foreground Color, Horizontal
Alignment, Master Detail Relationships, Properties, Query, Style Variable, Visible
Numerical AxisThe numeric axis for a progressive chart, including labels, titles, range, scale, and gridlines.
Properties of Numerical Axis
Axis Labels, Axis Line, Axis Title, Classes, Conditional Styles, Data Format, Font, Foreground
Color, Gridlines, Include Zero For Auto Scale, Maximum Value, Minimum Value, Minor Gridlines,
Scale, Scale Interval, Style Variable, Use Same Range For All Instances, Visible
Numerical AxisThe numeric axis for a pareto chart, including labels, titles, and gridlines.
Properties of Numerical Axis
Axis Labels, Axis Line, Axis Title, Classes, Conditional Styles, Data Format, Font, Foreground
Color, Gridlines, Include Zero For Auto Scale, Maximum Value, Minimum Value, Minor Gridlines,
Scale, Scale Interval, Style Variable, Use Same Range For All Instances, Visible
Ordinal AxisThe axis line for an ordinal, or non-numeric, axis.
Properties of Ordinal Axis
Allow 45° Rotation, Allow 90° Rotation, Allow Skip, Allow Stagger, Axis Labels, Axis Line, Axis
Title, Classes, Conditional Styles, Display Frequency, Drill-Through Definitions, First Label Index,
Font, Foreground Color, Gridlines, Horizontal Alignment, Label Control, Maximum Truncation
Characters, Minor Gridlines, Style Variable, Truncation, Truncation Text, Visible
PageA page in a layout.
578 Report Studio
Chapter 24: Report Studio Object and Property Reference
Properties of Page
Background Color, Background Image, Border, Classes, Conditional Styles, Font, Foreground
Color, Gradient, Horizontal Alignment, Margin, Master Detail Relationships, Name, Pagination,
PDF Page Setup, Properties, Query, Render Variable, Size & Overflow, Style Variable, Text Flow
& Justification
Page BodyThe main body of a page.
Properties of Page Body
Background Color, Background Image, Border, Box Type, Classes, Conditional Styles, Font, Fore-
ground Color, Generated Background Image, Horizontal Alignment, Padding, Size & Overflow,
Spacing & Breaking, Style Variable, Text Flow & Justification, Vertical Alignment, White Space
Page Break TextThe text associated with a page break.
Properties of Page Break Text
Background Color, Background Image, Border, Box Type, Classes, Conditional Styles, Floating,
Font, Foreground Color, Margin, Padding, Relative Alignment, Render Variable, Size & Overflow,
Spacing & Breaking, Style Variable, Text Flow & Justification, Visible
Page FooterThe footer of a page.
Properties of Page Footer
Background Color, Background Image, Border, Box Type, Classes, Conditional Styles, Font, Fore-
ground Color, Generated Background Image, Horizontal Alignment, Padding, Size & Overflow,
Spacing & Breaking, Style Variable, Text Flow & Justification, Vertical Alignment, White Space
Page HeaderThe header of a page.
Properties of Page Header
Background Color, Background Image, Border, Box Type, Classes, Conditional Styles, Font, Fore-
ground Color, Generated Background Image, Horizontal Alignment, Padding, Size & Overflow,
Spacing & Breaking, Style Variable, Text Flow & Justification, Vertical Alignment, White Space
Page NumberThe number of a page.
Properties of Page Number
Background Color, Classes, Font, Foreground Color, Margin, Number Style, Relative Alignment
Professional Authoring User Guide 579
Chapter 24: Report Studio Object and Property Reference
Page SetThe set of pages to render according to a grouping structure.
Properties of Page Set
Grouping & Sorting, Master Detail Relationships, Name, Pagination, Properties, Query
Pareto ChartA chart in which data series appear as colored sections stacked in columns or bars. The maximum
of each column or bar represents the series total as a percentage of the overall total of all data series
in the chart.
Negative values are not supported in pareto charts.
Properties of Pareto Chart
Background Color, Background Image, Baselines, Border, Border Color, Borders, Box Type, Chart
Orientation, Classes, Conditional Palette, Conditional Styles, Connecting Lines, Cumulative Line,
Depth, Drill-Through Definitions, Floating, Font, Footer, Foreground Color, Generated Background
Image, Legend, Margin, Markers, Marker Text Location, Master Detail Relationships, Maximum
Hotspots, Name, No Data Contents, Notes, Ordinal Axis, Padding, Pagination, Palette, Pareto
Axis, Query, Relative Alignment, Render Page when Empty, Render Variable, Rotate Values, Size
& Overflow, Style Variable, Subtitle, Suppression, Title, Tooltips, Value Location, Values, Visible,
Visual Angle
Pie ChartA chart that uses sections of a circle as data markers to plot one or more data series. The size of
each section is proportional to the value of each data series for a given category value. Each pie
corresponds to a category value.
Properties of Pie Chart
Avoid Label Collision, Axis Title, Background Color, Background Image, Border, Border Color,
Borders, Box Type, Classes, Conditional Palette, Conditional Styles, Depth, Drill-Through Defini-
tions, Floating, Font, Footer, Foreground Color, Generated Background Image, Hole Size (%),
Labels, Legend, Margin, Master Detail Relationships, Maximum Hotspots, Name, No Data Contents,
Notes, Padding, Pagination, Palette, Pie Labels, Query, Relative Alignment, Render Page when
Empty, Render Variable, Size & Overflow, Style Variable, Subtitle, Suppression, Title, Tooltips,
Value Representation, Values, Visible
Pie LabelsThe labels that will be drawn if multiple pie charts are rendered. If this object does not exist, no
labels will be rendered.
Properties of Pie Labels
Classes, Conditional Styles, Drill-Through Definitions, Font, Foreground Color, Horizontal
Alignment, Maximum Truncation Characters, Style Variable, Truncation, Truncation Text, Visible
580 Report Studio
Chapter 24: Report Studio Object and Property Reference

Point Color Legend TitleThe title for the point color legend. If this object is empty, a default title is rendered, if available.
Properties of Point Color Legend Title
Master Detail Relationships, Properties, Query
Point LayerA map layer that includes points, such as cities. The color and size of each point is determined by
their respective measure.
Properties of Point Layer
Border Color, Borders, Color Legend Title, Conditional Palette, Conditional Styles, Fill Effects,
Labels, Map Drills, Palette, Show Data Range in Legend, Show Features with No Data, Size Legend
Title, Style Variable, Values
Point MeasureThe measure that determines the colors of points on a map chart.
Properties of Point Measure
Aggregate Function, Conditional Styles, Custom Label, Data Format, Expression, Hierarchy,
Hierarchy Unique Name, Label, Level, Level Unique Name, Member, Member Unique Name,
Name, Property Unique Name, Rollup Aggregate Function, Root Members Only, Set Sorting, Style
Variable, Type
Point Size Legend TitleThe title for the point size legend. If this object is empty, a default title is rendered, if available.
Properties of Point Size Legend Title
Master Detail Relationships, Properties, Query
Point Size MeasureThe measure that determines the size of the points on a map chart.
Properties of Point Size Measure
Aggregate Function, Conditional Styles, Custom Label, Data Format, Expression, Hierarchy,
Hierarchy Unique Name, Label, Level, Level Unique Name, Maximum Size (pt), Member, Member
Unique Name, Minimum Size (pt), Name, Property Unique Name, Rollup Aggregate Function,
Root Members Only, Set Sorting, Style Variable, Type
Polar ChartA point chart that plots one or more data series against two measures. The radius of a data series
is determined by one measure and the arc is determined by the other measure. Multiple points are
Professional Authoring User Guide 581
Chapter 24: Report Studio Object and Property Reference
plotted for each category. They can be distinguished with the help of tool tips if the Tool Tip
property is set to Yes.
Properties of Polar Chart
Angular Axis, Background Color, Background Image, Baselines, Border, Border Color, Borders,
Box Type, Classes, Conditional Palette, Conditional Styles, Drill-Through Definitions, Floating,
Font, Footer, Foreground Color, Generated Background Image, Legend, Margin, Markers, Marker
Size (pt), Marker Text Location, Master Detail Relationships, Maximum Hotspots, Name, No Data
Contents, Notes, Padding, Pagination, Palette, Point Shape, Query, Radial Axis, Relative Alignment,
Render Page when Empty, Render Variable, Size & Overflow, Spider Effects, Style Variable, Subtitle,
Suppression, Title, Tooltips, Value Location, Values, Visible
Progressive ChartA chart that uses columns as data markers to plot one category across a single measure. The top
of the first column represents the starting value for the second column. This chart emphasizes the
positive or negative contribution of each value to the total.
Properties of Progressive Chart
Background Color, Background Image, Baselines, Border, Border Color, Borders, Box Type, Chart
Orientation, Classes, Conditional Palette, Conditional Styles, Connecting Lines, Depth, Drill-
Through Definitions, First Column Color, Floating, Font, Footer, Foreground Color, Generated
Background Image, Margin, Markers, Marker Text Location, Master Detail Relationships, Maximum
Hotspots, Name, Negative Column Color, No Data Contents, Notes, Ordinal Axis, Padding,
Pagination, Palette, Positive Column Color, Progressive Axis, Query, Relative Alignment, Render
Page when Empty, Render Variable, Rotate Values, Size & Overflow, Style Variable, Subtitle,
Suppression, Title, Tooltips, Total Column, Value Location, Values, Visible, Visual Angle
Prompt ButtonA predefined button used in prompt pages. Its usage changes according to its Type property, which
can be set to Cancel, Back, Next, Finish, or Reprompt.
Properties of Prompt Button
Background Color, Background Image, Border, Classes, Conditional Styles, Floating, Font, Fore-
ground Color, Margin, Name, Padding, Relative Alignment, Size & Overflow, Style Variable, Type
QueryThe data that is to be retrieved from the database. The query consists of a source, a selection,
detailed and summary filters, and dimension information.
Properties of Query
Auto Group & Summarize, Auto-Sort, Avoid Division by Zero, Cross Product Allowed, Define
Member Sets, Execution Method, Execution Optimization, Generated SQL, Maximum Execution
Time, Maximum Rows Retrieved, Maximum Tables, Maximum Text Blob Characters, Name,
Outer Join Allowed, Override Dimension Info, Processing, Rollup Processing, SQL Join Syntax,
582 Report Studio
Chapter 24: Report Studio Object and Property Reference
Suppress, Use 1.x Behavior, Use Aggregate Cache, Use for Parameter Info, Use Local Cache, User
SAP Member Cache, Use SAP MUN as Business Key, Use SQL Parameters, Use SQL With Clause
Query OperationUnion, Intersect, Except (minus) operations on one or more queries that result in a projection list
upon which other queries can be based.
Properties of Query Operation
Duplicates, Name, Projection List, Set Operation
Query ReferenceA reference to another query defined in the same query set.
Properties of Query Reference
Cardinality
Radar ChartA chart that integrates multiple axes into a single radial figure as lines or stacked areas.
Properties of Radar Chart
Background Color, Background Image, Baselines, Border, Border Color, Borders, Box Type, Classes,
Conditional Palette, Conditional Styles, Drill-Through Definitions, Floating, Font, Footer, Foreground
Color, Generated Background Image, Legend, Margin, Markers, Marker Size (pt), Marker Text
Location, Master Detail Relationships, Maximum Hotspots, Name, No Data Contents, Notes,
Ordinal Axis, Padding, Pagination, Palette, Point Shape, Query, Radar Type, Radial Axis, Relative
Alignment, Render Page when Empty, Render Variable, Size & Overflow, Spider Effects, Style
Variable, Subtitle, Suppression, Title, Tooltips, Value Location, Values, Visible
Radial AxisThe radial numeric axis for a polar chart or radar chart, including labels, titles, range, and scale.
Properties of Radial Axis
Axis Labels, Axis Line, Axis Title, Classes, Conditional Styles, Data Format, Font, Foreground
Color, Gridlines, Include Zero For Auto Scale, Maximum Value, Minimum Value, Minor Gridlines,
Scale, Scale Interval, Style Variable, Use Same Range For All Instances, Visible
Radial MeasureThe measure that determines the distance between the center of the chart and each data marker.
Properties of Radial Measure
Aggregate Function, Conditional Styles, Custom Label, Data Format, Expression, Hierarchy,
Hierarchy Unique Name, Label, Level, Level Unique Name, Member, Member Unique Name,
Professional Authoring User Guide 583
Chapter 24: Report Studio Object and Property Reference
Name, Property Unique Name, Rollup Aggregate Function, Root Members Only, Set Sorting, Style
Variable, Type
Region Color Legend TitleThe title for the region color legend. If this object is empty, a default title is rendered, if available.
Properties of Region Color Legend Title
Master Detail Relationships, Properties, Query
Region LayerA map layer that includes regions, such as provinces.
Properties of Region Layer
Border Color, Borders, Color Legend Title, Conditional Palette, Conditional Styles, Fill Effects,
Labels, Map Drills, Palette, Show Data Range in Legend, Show Features with No Data, Style
Variable, Values
Region MeasureThe measure that determines the colors of regions on a map chart.
Properties of Region Measure
Aggregate Function, Conditional Styles, Custom Label, Data Format, Expression, Hierarchy,
Hierarchy Unique Name, Label, Level, Level Unique Name, Member, Member Unique Name,
Name, Property Unique Name, Rollup Aggregate Function, Root Members Only, Set Sorting, Style
Variable, Type
Regression LineA regression line for a bubble chart or scatter chart.
Properties of Regression Line
Box Type, Line Styles, Number of Regression Lines, Polynomial Exponent, Properties, Regression
Type
RepeaterA table into which you can insert items that will be repeated.
Properties of Repeater
Grouping & Sorting, Master Detail Relationships, Name, No Data Contents, Pagination, Properties,
Query, Render Page when Empty, Render Variable, Rows Per Page, Share Result Set, Suppression
Repeater TableRenders query data in a table.
584 Report Studio
Chapter 24: Report Studio Object and Property Reference
Properties of Repeater Table
Across, Background Color, Background Image, Border, Box Type, Classes, Conditional Styles,
Down, Drop Shadow, Floating, Font, Foreground Color, Grouping & Sorting, Horizontal Alignment,
Margin, Master Detail Relationships, Name, No Data Contents, Pagination, Properties, Query,
Relative Alignment, Render Page when Empty, Render Variable, Repeater Direction, Share Result
Set, Size & Overflow, Style Variable, Suppression, Table Properties, Text Flow & Justification,
Visible
Repeater Table CellThe contents of a repeater table object.
Properties of Repeater Table Cell
Background Color, Background Image, Border, Box Type, Classes, Conditional Styles, Font, Fore-
ground Color, Generated Background Image, Horizontal Alignment, Padding, Render Variable,
Size & Overflow, Spacing & Breaking, Style Variable, Text Flow & Justification, Vertical Alignment,
White Space
Rich Text ItemInserts an object that is used to render a subset of HTML in the layout. The HTML may come from
either a static or dynamic source, and the object will also render in PDF output. For information
about what elements are allowed in rich text items, see Inserting Other Objects.
Properties of Rich Text Item
Aggregate Function, Data Item Label, Data Item Value, Description, Expression, Hierarchy, Hier-
archy Unique Name, HTML, HTML Source Variable, Label, Level, Level Unique Name, Member,
Member Unique Name, Name, Name, Property Unique Name, Render Variable, Report Expression,
Rollup Aggregate Function, Root Members Only, Set Sorting, Source Type, Type
Row NumberShows the row numbers in a column.
Properties of Row Number
Background Color, Classes, Data Format, Font, Foreground Color, Margin, Relative Alignment
Scatter ChartA point chart that plots one or more data series against two measures. Multiple points are plotted
for each category.
Properties of Scatter Chart
Background Color, Background Image, Baselines, Border, Border Color, Borders, Box Type, Classes,
Conditional Palette, Conditional Styles, Drill-Through Definitions, Floating, Font, Footer, Foreground
Color, Generated Background Image, Legend, Margin, Markers, Marker Size (pt), Marker Text
Location, Master Detail Relationships, Maximum Hotspots, Name, No Data Contents, Notes,
Professional Authoring User Guide 585
Chapter 24: Report Studio Object and Property Reference
Padding, Pagination, Palette, Point Shape, Query, Regression Line, Relative Alignment, Render
Page when Empty, Render Variable, Size & Overflow, Style Variable, Subtitle, Suppression, Title,
Tooltips, Value Location, Values, Visible, X Axis, Y Axis
Select & Search PromptAn advanced prompt control that allows you to search for values. You cannot use this prompt
control with SAP BW data sources.
Properties of Select & Search Prompt
Box Type, Cascade Source, Case Insensitive, Conditional Styles, Data Format, Display Value,
Floating, Hide Adornments, Multi-Select, Name, Parameter, Properties, Query, Render Variable,
Required, Rows Per Page, Sorting, Static Choices, Style Variable, Use Value, Visible
Set ExpressionA set of members.
Properties of Set Expression
Dimension, Expression, Hierarchy, Label, Name, Set Sorting, Type
SingletonA query item that you can insert anywhere in the layout of your report where there is no query
associated. When the report is run, the singleton object retrieves only the first row value for that
query. Singletons are useful for adding boilerplate text to a report, such as a company name or
address, to add overall calculations in a report, or to add multidimensional cell calculations in a
report.
Properties of Singleton
Name, Properties, Query, Render Variable
Slicer Member SetA set expression that returns members from a single hierarchy of a single dimension.
Properties of Slicer Member Set
Expression
SQLAn SQL query against a relational data source.
Properties of SQL
Data Source, Name, SQL, SQL Syntax
586 Report Studio
Chapter 24: Report Studio Object and Property Reference
Summary FilterA set of conditions in a query that narrow the scope of the data returned. A summary filter is applied
after aggregation is complete.
Properties of Summary Filter
Expression, Scope, Usage
TableA collection of cells in which objects can be organized in a grid fashion.
Properties of Table
Background Color, Background Image, Border, Box Type, Classes, Conditional Styles, Drop Shadow,
Floating, Font, Foreground Color, Horizontal Alignment, Margin, Name, Pagination, Relative
Alignment, Render Variable, Size & Overflow, Style Variable, Table Properties, Text Flow & Jus-
tification, Visible
Table CellThe cells within a row.
Properties of Table Cell
Background Color, Background Image, Border, Box Type, Classes, Conditional Styles, Font, Fore-
ground Color, Generated Background Image, Horizontal Alignment, Padding, Size & Overflow,
Spacing & Breaking, Style Variable, Text Flow & Justification, Vertical Alignment, White Space
Table of ContentsA collection of Table of Contents Entry objects that refer the same table of contents. The table of
contents is generated in the rendered output.
Properties of Table of Contents
Background Color, Background Image, Border, Box Type, Classes, Conditional Styles, Floating,
Font, Foreground Color, Horizontal Alignment, Margin, No Data Contents, Padding, Render Page
when Empty, Render Variable, Size & Overflow, Spacing & Breaking, Style Variable, Table of
Contents Name, Text Flow & Justification, Visible, White Space
Table of Contents EntryAn entry in the table of contents.
Properties of Table of Contents Entry
Background Color, Background Image, Border, Box Type, Classes, Conditional Styles, Floating,
Font, Foreground Color, Heading Level, Horizontal Alignment, Margin, Padding, Render Variable,
Size & Overflow, Spacing & Breaking, Style Variable, Table of Contents, Text Flow & Justification,
Visible, White Space
Professional Authoring User Guide 587
Chapter 24: Report Studio Object and Property Reference
Table RowThe rows in a table.
Properties of Table Row
Background Color, Background Image, Box Type, Classes, Conditional Styles, Font, Foreground
Color, Horizontal Alignment, Style Variable, Vertical Alignment
Target MeasureThe target measure for a metrics range chart.
Properties of Target Measure
Aggregate Function, Conditional Styles, Custom Label, Data Format, Expression, Hierarchy,
Hierarchy Unique Name, Label, Level, Level Unique Name, Member, Member Unique Name,
Name, Property Unique Name, Rollup Aggregate Function, Root Members Only, Set Sorting, Style
Variable, Type
Text Box PromptA prompt control that allows you to type in a value.
Properties of Text Box Prompt
Background Color, Border, Box Type, Conditional Styles, Default Selections, Floating, Font,
Foreground Color, Hide Adornments, Hide Text, Multi-Line, Multi-Select, Name, Numbers Only,
Parameter, Range, Relative Alignment, Render Variable, Required, Size & Overflow, Style Variable,
Use Thousands Separator, Visible
Text ItemA text item in a report. The content can be static text, or it can come from a query item or report
expression.
Properties of Text Item
Aggregate Function, Background Color, Background Image, Border, Box Type, Classes, Conditional
Styles, Data Format, Data Item Label, Data Item Value, Drill-Through Definitions, Expression,
Floating, Font, Foreground Color, Hierarchy, Hierarchy Unique Name, Label, Level, Level Unique
Name, Margin, Maximum Characters, Member, Member Unique Name, Name, Name, Padding,
Property Unique Name, Relative Alignment, Render Variable, Report Expression, Rollup Aggregate
Function, Root Members Only, Set Sorting, Size & Overflow, Source Type, Spacing & Breaking,
Style Variable, Text, Text Flow & Justification, Text Source Variable, Type, Use Detail Value on
Page, Visible
TimeThe time when the report runs.
588 Report Studio
Chapter 24: Report Studio Object and Property Reference
Properties of Time
Background Color, Classes, Data Format, Font, Foreground Color, Margin, Relative Alignment
Time PromptAn advanced prompt control that allows you to select a time value.
Properties of Time Prompt
Box Type, Clock Mode, Conditional Styles, Default Selections, Display Milliseconds, Display
Seconds, Floating, Hide Adornments, Multi-Select, Name, Parameter, Range, Render Variable,
Required, Select UI, Style Variable, Visible
Tolerance MeasureThe tolerance measure for a metrics chart.
Properties of Tolerance Measure
Aggregate Function, Conditional Styles, Custom Label, Data Format, Expression, Hierarchy,
Hierarchy Unique Name, Label, Level, Level Unique Name, Member, Member Unique Name,
Name, Property Unique Name, Rollup Aggregate Function, Root Members Only, Set Sorting, Style
Variable, Type
Total ColumnA column or bar representing the total cumulative value of all other columns or bars in a progressive
chart.
Properties of Total Column
Aggregate Function, Data Format, Data Item Value, Expression, Hierarchy, Hierarchy Unique
Name, Label, Level, Level Unique Name, Member, Member Unique Name, Name, Properties,
Property Unique Name, Report Expression, Rollup Aggregate Function, Root Members Only, Set
Sorting, Text, Total Column Color, Type
Total Column LabelThe label to be rendered for the total column.
Properties of Total Column Label
Properties
Tree PromptA data driven prompt control that shows hierarchical information and allows you to select one or
more members.
Professional Authoring User Guide 589
Chapter 24: Report Studio Object and Property Reference
Properties of Tree Prompt
Cascade Source, Conditional Styles, Default Selections, Floating, Hide Adornments, Multi-Select,
Name, Parameter, Pre-populate, Pre-populate Levels, Query, Render Variable, Required, Rows Per
Page, Size & Overflow, Sorting, Style Variable, Use Value, Visible
Value PromptA prompt control that allows you to select one or more values from a list.
Properties of Value Prompt
Auto-Submit, Background Color, Box Type, Cascade Source, Conditional Styles, Data Format,
Default Selections, Display Value, Floating, Font, Foreground Color, Hide Adornments, Multi-
Select, Name, Parameter, Pre-populate, Properties, Query, Range, Relative Alignment, Render
Variable, Required, Rows Per Page, Select UI, Size & Overflow, Sorting, Static Choices, Style
Variable, Use Value, Visible
VariableA report variable.
Properties of Variable
Name, Report Expression, Type
Win-Loss ChartA microchart in which the value of each column is either 1 or -1, often denoting a win or a loss.
Properties of Win-Loss Chart
Allow Ties, Axis Line, Background Color, Background Image, Border, Border Color, Borders, Box
Type, Chart Orientation, Classes, Conditional Styles, Drill-Through Definitions, Floating, Font,
Footer, Foreground Color, Generated Background Image, Loss Color, Margin, Master Detail
Relationships, Maximum Hotspots, Name, No Data Contents, Padding, Pagination, Query, Relative
Alignment, Render Page when Empty, Render Variable, Size & Overflow, Style Variable, Subtitle,
Suppression, Title, Tooltips, Visible, Win Color, Win-Loss Threshold
Win-Loss MeasureThe measure for a win-loss chart.
Properties of Win-Loss Measure
Aggregate Function, Custom Label, Data Format, Expression, Hierarchy, Hierarchy Unique Name,
Label, Level, Level Unique Name, Member, Member Unique Name, Name, Property Unique Name,
Rollup Aggregate Function, Root Members Only, Set Sorting, Type
X AxisThe horizontal numeric axis for the chart, including labels, titles, range, and scale.
590 Report Studio
Chapter 24: Report Studio Object and Property Reference
Properties of X Axis
Axis Labels, Axis Line, Axis Title, Classes, Conditional Styles, Data Format, Font, Foreground
Color, Gridlines, Include Zero For Auto Scale, Maximum Value, Minimum Value, Minor Gridlines,
Scale, Scale Interval, Style Variable, Use Same Range For All Instances, Visible
X AxisThe axis line for an ordinal, or non-numeric, axis.
Properties of X Axis
Allow 45° Rotation, Allow 90° Rotation, Allow Skip, Allow Stagger, Axis Labels, Axis Line, Axis
Title, Classes, Conditional Styles, Display Frequency, Drill-Through Definitions, First Label Index,
Font, Foreground Color, Gridlines, Horizontal Alignment, Label Control, Maximum Truncation
Characters, Minor Gridlines, Style Variable, Truncation, Truncation Text, Visible
X Axis MeasureThe measure for the horizontal axis of a scatter chart or bubble chart.
Properties of X Axis Measure
Aggregate Function, Conditional Styles, Custom Label, Data Format, Expression, Hierarchy,
Hierarchy Unique Name, Label, Level, Level Unique Name, Member, Member Unique Name,
Name, Property Unique Name, Rollup Aggregate Function, Root Members Only, Set Sorting, Style
Variable, Type
Y1 AxisThe numeric axis of a metrics chart, or the primary numeric axis of a combination chart.
Properties of Y1 Axis
Axis Labels, Axis Line, Axis Title, Classes, Conditional Styles, Data Format, Font, Foreground
Color, Gridlines, Include Zero For Auto Scale, Maximum Value, Minimum Value, Minor Gridlines,
Scale, Scale Interval, Style Variable, Use Same Range For All Instances, Visible
Y2 AxisThe secondary numeric axis of a combination chart.
Properties of Y2 Axis
Axis Labels, Axis Line, Axis Title, Classes, Conditional Styles, Data Format, Font, Foreground
Color, Gridlines, Include Zero For Auto Scale, Maximum Value, Minimum Value, Minor Gridlines,
Scale, Scale Interval, Style Variable, Use Same Range For All Instances, Visible
Y AxisThe vertical numeric axis for the chart, including labels, titles, range, and scale.
Professional Authoring User Guide 591
Chapter 24: Report Studio Object and Property Reference
Properties of Y Axis
Axis Labels, Axis Line, Axis Title, Classes, Conditional Styles, Data Format, Font, Foreground
Color, Gridlines, Include Zero For Auto Scale, Maximum Value, Minimum Value, Minor Gridlines,
Scale, Scale Interval, Style Variable, Use Same Range For All Instances, Visible
Y AxisThe axis line for an ordinal, or non-numeric, axis.
Properties of Y Axis
Allow 45° Rotation, Allow 90° Rotation, Allow Skip, Allow Stagger, Axis Labels, Axis Line, Axis
Title, Classes, Conditional Styles, Display Frequency, Drill-Through Definitions, First Label Index,
Font, Foreground Color, Gridlines, Horizontal Alignment, Label Control, Maximum Truncation
Characters, Minor Gridlines, Style Variable, Truncation, Truncation Text, Visible
Y Axis MeasureThe measure for the vertical axis of a scatter chart or bubble chart.
Properties of Y Axis Measure
Aggregate Function, Conditional Styles, Custom Label, Data Format, Expression, Hierarchy,
Hierarchy Unique Name, Label, Level, Level Unique Name, Member, Member Unique Name,
Name, Property Unique Name, Rollup Aggregate Function, Root Members Only, Set Sorting, Style
Variable, Type
Z AxisThe third numeric axis for a three-dimensional scatter chart, including labels, titles, range, and
scale.
Properties of Z Axis
Axis Labels, Axis Line, Axis Title, Classes, Conditional Styles, Data Format, Font, Foreground
Color, Gridlines, Include Zero For Auto Scale, Maximum Value, Minimum Value, Minor Gridlines,
Scale, Scale Interval, Style Variable, Use Same Range For All Instances, Visible
Z AxisThe vertical numeric axis for a three-dimensional combination chart, including labels, titles, range,
and scale.
Properties of Z Axis
Axis Labels, Axis Line, Axis Title, Classes, Conditional Styles, Data Format, Font, Foreground
Color, Gridlines, Include Zero For Auto Scale, Maximum Value, Minimum Value, Minor Gridlines,
Scale, Scale Interval, Style Variable, Use Same Range For All Instances, Visible
Z Axis MeasureThe measure for the third axis of a three-dimensional scatter chart.
592 Report Studio
Chapter 24: Report Studio Object and Property Reference
Properties of Z Axis Measure
Aggregate Function, Conditional Styles, Custom Label, Data Format, Expression, Hierarchy,
Hierarchy Unique Name, Label, Level, Level Unique Name, Member, Member Unique Name,
Name, Property Unique Name, Rollup Aggregate Function, Root Members Only, Set Sorting, Style
Variable, Type
Report Studio PropertiesThe following is a list of properties available in the lower left pane of Report Studio.
3-D Viewing AngleSpecifies the 3-D viewing angle of the chart.
Applies to
3-D Combination Chart, 3-D Scatter Chart
Absolute PositionSpecifies that the legend will be positioned absolutely, by setting its pixel position.
Applies to
Legend
AcrossSets the number of times across, or horizontally, that the contents of the object may be rendered.
The default value depends on the setting of the Repeater Direction property. If it is set to Left to
right, top to bottom, the default is one. If it is set to Top to bottom, left to right, the default is 20.
Applies to
Repeater Table
Aggregate FunctionSpecifies the type of aggregation to apply. The Automatic setting means that the application groups
or summarizes based on the data type. The Summarize setting means that any setting found in the
model will be used to determine the type of aggregation. The default setting is Automatic. For more
information about each summary function, see the Report Studio Professional Authoring User
Guide.
Applies to
Angular Measure, Baseline, Baseline, Baseline, Baseline, Bubble Measure, Chart Node Member,
Chart Text Item, Crosstab Corner, Crosstab Fact Cells, Crosstab Intersection, Crosstab Member
Fact Cells, Crosstab Node Member, Cumulation Line Label, Data Item, Default Measure, HTML
Item, Image, List Cell, List Column Body, List Column Title, Map Location, Map Location, Map
Refinement Location, Map Refinement Location, Marker, Point Measure, Point Size Measure,
Professional Authoring User Guide 593
Chapter 24: Report Studio Object and Property Reference
Radial Measure, Region Measure, Rich Text Item, Target Measure, Text Item, Tolerance Measure,
Total Column, Win-Loss Measure, X Axis Measure, Y Axis Measure, Z Axis Measure
Allow 45° RotationSpecifies whether the labels can be rotated 45 degrees if the labels are long.
Applies to
Ordinal Axis, X Axis, Y Axis
Allow 90° RotationSpecifies whether the labels can be rotated 90 degrees if the labels are long.
Applies to
Ordinal Axis, X Axis, Y Axis
Allow SkipSpecifies whether some labels can be skipped if they are long.
Applies to
Ordinal Axis, X Axis, Y Axis
Allow StaggerSpecifies whether the labels can be staggered if they are long.
Applies to
Ordinal Axis, X Axis, Y Axis
Allow TiesSpecifies whether data values that equal the Win Loss Threshold property are converted to zero
and mapped on the zero line.
Applies to
Win-Loss Chart
Angular AxisSpecifies whether the axis is rendered.
Applies to
Polar Chart
594 Report Studio
Chapter 24: Report Studio Object and Property Reference
ApplicationSpecifies if the condition will be applied before or after aggregation and summarization. When true,
the condition will apply to the summarized rows, and a fact, or aggregate, in the expression will
be interpreted as the aggregated value of the summarized rows. When false, the condition will apply
to the detail database rows from the tabular result set prior to aggregation or summarization, and
a fact, or aggregate, in the expression will be interpreted as the individual database value before it
has been summarized. This property has no effect on OLAP data sources, on references to non-
aggregate items, or when automatic summarization is disabled.
Applies to
Detail Filter
Apply Single ClassSpecifies whether to apply all of the classes defined or only one class. When set to Yes, the last class
that was applied is used. For example, if you applied a class to a crosstab intersection and another
class to the member fact cells of a crosstab row, the class applied to the intersection is the last class
applied to the fact cells. For information about the order in which classes are applied, see the Report
Studio Professional Authoring User Guide.
This property is set to Yes when you are upgrading a report so that the upgraded report will look
the same as the original report. This is because objects in reports created using earlier versions of
IBM Cognos 8 support only one class.
Applies to
Crosstab Fact Cells
Auto Group & SummarizeSpecifies whether the application will apply suggested aggregate functions to aggregate data items
and group all non-aggregate data items, producing groups and summary rows. If it is set to No,
detail rows will be rendered.
Applies to
Query
Auto-SortWhen running the report, specifies whether to automatically sort based on data type.
Applies to
Query
Auto-SubmitSpecifies whether the application submits the prompt page automatically, as soon as a value is
changed.
Professional Authoring User Guide 595
Chapter 24: Report Studio Object and Property Reference
Applies to
Value Prompt
Auto TruncationSpecifies whether to allow truncation of text.
Applies to
Legend
Avoid Division by ZeroSpecifies whether the application will return a null value when it encounters a division by zero.
This property applies only to relational data sources.
Applies to
Query
Avoid Label CollisionControls how labels are arranged. If set to false, the chart uses the default positions. If set to true,
the chart uses a different layout to avoid label collision. To keep existing reports unchanged, set
this property to false.
Applies to
Pie Chart
Axis AssignmentSpecifies the numeric axis to use.
Applies to
Area, Bar, Baseline, Line, Marker
Axis AssignmentSpecifies which numeric axis to use.
Applies to
Baseline
Axis LabelsSpecifies whether to show or hide axis labels.
Applies to
Angular Axis, Cumulation Line Axis, Numerical Axis, Numerical Axis, Ordinal Axis, Radial Axis,
X Axis, X Axis, Y1 Axis, Y2 Axis, Y Axis, Y Axis, Z Axis, Z Axis
596 Report Studio
Chapter 24: Report Studio Object and Property Reference
Axis LineSpecifies the properties of the axis line in a chart.
Applies to
Angular Axis, Cumulation Line Axis, Numerical Axis, Numerical Axis, Ordinal Axis, Radial Axis,
Win-Loss Chart, X Axis, X Axis, Y1 Axis, Y2 Axis, Y Axis, Y Axis, Z Axis, Z Axis
Axis TitleSpecifies whether an axis title will be rendered.
Applies to
Angular Axis, Cumulation Line Axis, Gauge Chart, Map, Numerical Axis, Numerical Axis, Ordinal
Axis, Pie Chart, Radial Axis, X Axis, X Axis, Y1 Axis, Y2 Axis, Y Axis, Y Axis, Z Axis, Z Axis
Background ColorSpecifies the background color for the object.
Applies to
3-D Combination Chart, 3-D Scatter Chart, Block, Bubble Chart, Caption, Chart Body, Class,
Combination Chart, Conditional Block, Conditional Block, Context Item Text, Crosstab, Crosstab
Columns, Crosstab Columns, Crosstab Corner, Crosstab Fact Cells, Crosstab Intersection, Crosstab
Member Fact Cells, Crosstab Node Member, Crosstab Rows, Crosstab Rows, Crosstab Space,
Date, Field Set, Gauge Chart, Hyperlink, Hyperlink Button, Image, Legend, List, List Cell, List
Column, List Column Body, List Columns, List Columns, List Columns Body Style, List Columns
Title Style, List Column Title, List Footer, List Header, List Row, List Row Cells Style, Map,
Marimekko Chart, Metrics Range Chart, Note Content, Page, Page Body, Page Break Text, Page
Footer, Page Header, Page Number, Pareto Chart, Pie Chart, Polar Chart, Progressive Chart, Prompt
Button, Radar Chart, Repeater Table, Repeater Table Cell, Row Number, Scatter Chart, Table,
Table Cell, Table of Contents, Table of Contents Entry, Table Row, Text Box Prompt, Text Item,
Time, Value Prompt, Win-Loss Chart
Background ImageSpecifies an image to be used as the background for the object.
Applies to
3-D Combination Chart, 3-D Scatter Chart, Block, Bubble Chart, Caption, Chart Body, Class,
Combination Chart, Conditional Block, Conditional Block, Context Item Text, Crosstab, Crosstab
Columns, Crosstab Columns, Crosstab Corner, Crosstab Fact Cells, Crosstab Intersection, Crosstab
Member Fact Cells, Crosstab Node Member, Crosstab Rows, Crosstab Rows, Crosstab Space, Field
Set, Gauge Chart, Hyperlink, Hyperlink Button, Image, Legend, List, List Cell, List Column, List
Column Body, List Columns, List Columns, List Columns Body Style, List Columns Title Style,
List Column Title, List Footer, List Header, List Row, List Row Cells Style, Map, Marimekko
Chart, Metrics Range Chart, Page, Page Body, Page Break Text, Page Footer, Page Header, Pareto
Professional Authoring User Guide 597
Chapter 24: Report Studio Object and Property Reference
Chart, Pie Chart, Polar Chart, Progressive Chart, Prompt Button, Radar Chart, Repeater Table,
Repeater Table Cell, Scatter Chart, Table, Table Cell, Table of Contents, Table of Contents Entry,
Table Row, Text Item, Win-Loss Chart
Bar, Line, or Area IndexSpecifies which combination object to use when calculating the position. When multiple series exist,
the index of 0 represents the topmost bar, line, or area in the Series drop zone, the index of 1 rep-
resents the second one, and so on.
Applies to
Baseline, Baseline, Marker
BaselinesAdds reference lines to a chart based on numeric or statistical values, calculations, or layout calcu-
lations.
Applies to
3-D Combination Chart, 3-D Scatter Chart, Bubble Chart, Combination Chart, Marimekko Chart,
Metrics Range Chart, Pareto Chart, Polar Chart, Progressive Chart, Radar Chart, Scatter Chart
Block VariableSpecifies a variable based on which the block can be conditionally rendered.
Applies to
Conditional Block, Conditional Block
BorderSpecifies the width, style, and color for the border of the object.
Applies to
3-D Combination Chart, 3-D Scatter Chart, Block, Bubble Chart, Caption, Class, Combination
Chart, Conditional Block, Conditional Block, Context Item Text, Crosstab, Crosstab Columns,
Crosstab Columns, Crosstab Corner, Crosstab Fact Cells, Crosstab Intersection, Crosstab Member
Fact Cells, Crosstab Node Member, Crosstab Rows, Crosstab Rows, Crosstab Space, Field Set,
Gauge Chart, Hyperlink, Hyperlink Button, Image, List, List Cell, List Column, List Column Body,
List Columns, List Columns, List Columns Body Style, List Columns Title Style, List Column Title,
List Footer, List Header, List Row, List Row Cells Style, Map, Marimekko Chart, Metrics Range
Chart, Page, Page Body, Page Break Text, Page Footer, Page Header, Pareto Chart, Pie Chart, Polar
Chart, Progressive Chart, Prompt Button, Radar Chart, Repeater Table, Repeater Table Cell,
Scatter Chart, Table, Table Cell, Table of Contents, Table of Contents Entry, Text Box Prompt,
Text Item, Win-Loss Chart
598 Report Studio
Chapter 24: Report Studio Object and Property Reference
Border ColorSpecifies the color of the border rendered around specific chart elements, such as bars, stacks, areas,
points, or pie slices.
Applies to
3-D Area, 3-D Bar, 3-D Line, 3-D Scatter Chart, Area, Bar, Bubble Chart, Display Layer, Gauge
Chart, Legend, Line, Marimekko Chart, Pareto Chart, Pie Chart, Point Layer, Polar Chart, Progress-
ive Chart, Radar Chart, Region Layer, Scatter Chart, Win-Loss Chart
BordersSpecifies whether borders are rendered around specific chart elements, such as bars, stacks, areas,
points, or pie slices.
Applies to
3-D Area, 3-D Bar, 3-D Line, 3-D Scatter Chart, Area, Bar, Bubble Chart, Display Layer, Gauge
Chart, Legend, Line, Marimekko Chart, Pareto Chart, Pie Chart, Point Layer, Polar Chart, Progress-
ive Chart, Radar Chart, Region Layer, Scatter Chart, Win-Loss Chart
Bottom Position (px)Specifies the pixel position of the bottom edge of the note measured from the bottom of the chart.
Applies to
Note
Bottom Position (px)Specifies the pixel position of the bottom edge of the legend measured from the bottom of the chart.
Applies to
Legend
Box TypeSpecifies whether to override the default box type for the object. When set to None, the object is
not rendered and its space is not reserved in the report. When set to Inline, you can insert other
objects on the same line as the object. When set to Block, you can insert other objects only on the
lines above and below the object.
Applies to
3-D Combination Chart, 3-D Scatter Chart, Block, Bubble Chart, Class, Combination Chart,
Conditional Block, Conditional Block, Context Item Text, Crosstab, Field Set, Gauge Chart,
Hyperlink, Image, List, Map, Marimekko Chart, Metrics Range Chart, Page Break Text, Pareto
Chart, Pie Chart, Polar Chart, Progressive Chart, Radar Chart, Repeater Table, Scatter Chart,
Table, Table of Contents, Table of Contents Entry, Text Item, Win-Loss Chart
Professional Authoring User Guide 599
Chapter 24: Report Studio Object and Property Reference
Box TypeSpecifies whether to override the default box type for the object.
Applies to
Axis Title, Baseline, Baseline, Baseline, Chart Footer, Chart Subtitle, Chart Title, Crosstab Columns,
Crosstab Columns, Crosstab Corner, Crosstab Fact Cells, Crosstab Intersection, Crosstab Member
Fact Cells, Crosstab Node Member, Crosstab Rows, Crosstab Rows, Crosstab Space, Date & Time
Prompt, Date Prompt, Interval Prompt, Legend, Legend Title, List Cell, List Column, List Column
Body, List Columns, List Columns, List Columns Body Style, List Columns Title Style, List Column
Title, List Footer, List Header, List Row, List Row Cells Style, Marker, Marker, Note Content,
Page Body, Page Footer, Page Header, Regression Line, Repeater Table Cell, Select & Search Prompt,
Table Cell, Table Row, Text Box Prompt, Time Prompt, Value Prompt
Bubble SizeSpecifies how the bubble size is computed. Minimum-Based assigns the smallest bubble to the
minimum data value. Zero-Based computes the bubble size relative to 0. This option is compatible
with Excel 2002. Zero-Based with Negatives shows negative bubbles as hollow, and the bubbles
get larger as they get further from 0. This option is compatible with Excel 2007.
Applies to
Bubble Chart
Calculation IntersectionSpecifies whether to suppress calculated values that occur at the intersection of a data source calcu-
lated member and a query-defined calculated member. When values are suppressed, the characters
specified for the Not Applicable characters data format appear in the cells.
Applies to
Calculated Measure, Calculated Member, Data Item
Calendar TypeSpecifies the type of calendar to show. The date values are mapped to the selected calendar before
being formatted. The default value is inherited from the user's content language.
Applies to
Date & Time Prompt, Date Prompt
CaptionSpecifies the caption for the level.
Applies to
Level
600 Report Studio
Chapter 24: Report Studio Object and Property Reference
CaptionSpecifies the caption.
Applies to
Calculated Member
CardinalitySpecifies the cardinality for this join operand.
Applies to
Query Reference
Cascade SourceSpecifies the parameter whose value is used to filter the values displayed in this control.
Applies to
Select & Search Prompt, Tree Prompt, Value Prompt
Case InsensitiveSpecifies whether to perform a case insensitive search by default.
Applies to
Select & Search Prompt
CatalogSpecifies the OLAP catalog.
Applies to
MDX
Chart OrientationSpecifies whether the chart is rendered vertically or horizontally.
Applies to
Combination Chart, Pareto Chart, Progressive Chart, Win-Loss Chart
Chart TypeSpecifies whether the data may be rendered as either a bar, line, or area.
Applies to
Area, Bar, Line
Professional Authoring User Guide 601
Chapter 24: Report Studio Object and Property Reference
Chart TypeSpecifies whether the data may be rendered as either a bar, line or area.
Applies to
3-D Area, 3-D Bar, 3-D Line
ClassesSpecifies a class to apply to the object. The class provides a default style. If you apply more than
one class, the style properties from all classes are merged together when they are applied. However,
if the classes have style properties in common, the style properties from the last class applied override
those from previous classes.
Applies to
3-D Combination Chart, 3-D Scatter Chart, Angular Axis, Axis Title, Block, Bubble Chart, Caption,
Chart Footer, Chart Subtitle, Chart Title, Combination Chart, Conditional Block, Conditional
Block, Context Item Text, Crosstab, Crosstab Corner, Crosstab Fact Cells, Crosstab Intersection,
Crosstab Member Fact Cells, Crosstab Node Member, Crosstab Space, Cumulation Line Axis,
Date, Field Set, Gauge Chart, Gauge Labels, Hyperlink, Hyperlink Button, Image, Legend, Legend
Title, List, List Cell, List Column Body, List Column Title, Map, Marimekko Chart, Metrics Range
Chart, Note Content, Numerical Axis, Numerical Axis, Ordinal Axis, Page, Page Body, Page Break
Text, Page Footer, Page Header, Page Number, Pareto Chart, Pie Chart, Pie Labels, Polar Chart,
Progressive Chart, Prompt Button, Radar Chart, Radial Axis, Repeater Table, Repeater Table Cell,
Row Number, Scatter Chart, Table, Table Cell, Table of Contents, Table of Contents Entry, Table
Row, Text Item, Time, Win-Loss Chart, X Axis, X Axis, Y1 Axis, Y2 Axis, Y Axis, Y Axis, Z Axis,
Z Axis
Clock ModeSpecifies whether the arms of the clock move.
Applies to
Date & Time Prompt, Time Prompt
Color Legend TitleSpecifies a title within the legend above the palette for the region color. If this object is not defined,
no additional title is drawn. If no legend is drawn, this object is ignored. Styling for this object is
inherited from the legend title.
Applies to
Region Layer
602 Report Studio
Chapter 24: Report Studio Object and Property Reference
Color Legend TitleSpecifies a title within the legend above the palette for the point color. If this object is not defined,
no additional title is drawn. If no legend is drawn, this object is ignored. Styling for this object is
inherited from the legend title.
Applies to
Point Layer
Column CoordinateUniquely identifies the column of a node member or spacer on an edge of the crosstab. You cannot
modify this value.
Applies to
Crosstab Intersection
Column TitlesSpecifies where or whether column titles may be rendered.
Applies to
List
Component ReferenceSpecifies the layout object that is referenced. An object is a reusable component only if it has a
name.
Applies to
Layout Component Reference
Component ReferenceSpecifies the layout object that is referenced. An object is a reusable component only if it has a
name. You cannot modify this value.
Applies to
Component Override
Conditional PaletteSpecifies a conditional palette for the chart.
Applies to
3-D Combination Chart, 3-D Scatter Chart, Bubble Chart, Combination Chart, Gauge Chart,
Marimekko Chart, Metrics Range Chart, Pareto Chart, Pie Chart, Point Layer, Polar Chart, Pro-
gressive Chart, Radar Chart, Region Layer, Scatter Chart
Professional Authoring User Guide 603
Chapter 24: Report Studio Object and Property Reference
Conditional StylesSpecifies the conditions and styles used to style the object.
Applies to
3-D Combination Chart, 3-D Scatter Chart, Angular Axis, Angular Measure, Axis Title, Block,
Bubble Chart, Bubble Measure, Caption, Chart Body, Chart Footer, Chart Subtitle, Chart Text
Item, Chart Title, Combination Chart, Conditional Block, Conditional Block, Context Item Text,
Crosstab, Crosstab Columns, Crosstab Columns, Crosstab Corner, Crosstab Fact Cells, Crosstab
Intersection, Crosstab Member Fact Cells, Crosstab Node Member, Crosstab Rows, Crosstab Rows,
Crosstab Space, Cumulation Line Axis, Date & Time Prompt, Date Prompt, Default Measure,
Display Layer, Field Set, Gauge Chart, Gauge Labels, Gauge Numerical Axis, Hyperlink, Hyperlink
Button, Image, Interval Prompt, Legend, Legend Title, List, List Cell, List Column, List Column
Body, List Columns, List Columns, List Columns Body Style, List Columns Title Style, List Column
Title, List Footer, List Header, List Row, List Row Cells Style, Map, Marimekko Chart, Metrics
Range Chart, Note Content, Numerical Axis, Numerical Axis, Ordinal Axis, Page, Page Body, Page
Break Text, Page Footer, Page Header, Pareto Chart, Pie Chart, Pie Labels, Point Layer, Point
Measure, Point Size Measure, Polar Chart, Progressive Chart, Prompt Button, Radar Chart, Radial
Axis, Radial Measure, Region Layer, Region Measure, Repeater Table, Repeater Table Cell, Scatter
Chart, Select & Search Prompt, Table, Table Cell, Table of Contents, Table of Contents Entry,
Table Row, Target Measure, Text Box Prompt, Text Item, Time Prompt, Tolerance Measure, Tree
Prompt, Value Prompt, Win-Loss Chart, X Axis, X Axis, X Axis Measure, Y1 Axis, Y2 Axis, Y
Axis, Y Axis, Y Axis Measure, Z Axis, Z Axis, Z Axis Measure
Connecting LinesSpecifies the properties of the lines that connect the segments of a stacked bar. This property is
ignored for clustered bars.
Applies to
Bar, Pareto Chart, Progressive Chart
Contents HeightSpecifies the relative height of list rows. This property is used only when a list has a height defined
in the Size and Overflow property.
Stretched means that the rows will be evenly sized to fit in the list's height. This is default HTML
behavior.
Minimal means that rows will take up only as much space as they need, and be compressed at the
top of the list. You can position a footer at the bottom of the list by setting the Push To Bottom
property to Yes on a footer object inside the list.
Applies to
List
604 Report Studio
Chapter 24: Report Studio Object and Property Reference
Cross Product AllowedSpecifies whether the query will be allowed to run if there is a cross join between database tables.
This type of query generates a result set that includes all possible unique combinations of values
from the first and second table. The default value is Deny.
Applies to
Query
Cumulation AxisSpecifies whether the cumulation axis may be rendered.
Applies to
Cumulation Line
Cumulation LabelSpecifies whether a label for the cumulation line may be rendered.
Applies to
Cumulation Line
Cumulative LineSpecifies whether the cumulation line is rendered.
Applies to
Pareto Chart
Current BlockSpecifies which block is currently being authored.
Applies to
Conditional Block, Conditional Block
Custom LabelOverrides the default label for the data item.
Applies to
Angular Measure, Bubble Measure, Chart Node Member, Default Measure, Point Measure, Point
Size Measure, Radial Measure, Region Measure, Target Measure, Tolerance Measure, Win-Loss
Measure, X Axis Measure, Y Axis Measure, Z Axis Measure
Data FormatSpecifies the data format of the object.
Professional Authoring User Guide 605
Chapter 24: Report Studio Object and Property Reference
Applies to
Angular Axis, Angular Measure, Bubble Measure, Chart Node Member, Chart Text Item, Crosstab
Columns, Crosstab Columns, Crosstab Corner, Crosstab Fact Cells, Crosstab Intersection, Crosstab
Member Fact Cells, Crosstab Node Member, Crosstab Rows, Crosstab Rows, Crosstab Space,
Cumulation Line Axis, Date, Default Measure, Gauge Numerical Axis, List Cell, List Column, List
Column Body, List Columns, List Columns, List Columns Body Style, List Columns Title Style,
List Column Title, List Footer, List Header, List Row, List Row Cells Style, Numerical Axis,
Numerical Axis, Point Measure, Point Size Measure, Radial Axis, Radial Measure, Region Measure,
Row Number, Select & Search Prompt, Target Measure, Text Item, Time, Tolerance Measure,
Total Column, Value Prompt, Win-Loss Measure, X Axis, X Axis Measure, Y1 Axis, Y2 Axis, Y
Axis, Y Axis Measure, Z Axis, Z Axis, Z Axis Measure
Data ItemSpecifies a reference to a data item. You cannot modify this value.
Applies to
Crosstab Node Member, Member Set
Data ItemSpecifies a reference to a data item.
Applies to
Calculated Member, Fact, Key, Member Property
Data Item LabelSpecifies the data item label that defines the text to render.
Applies to
Chart Node Member, Chart Text Item, Crosstab Corner, Crosstab Fact Cells, Crosstab Intersection,
Crosstab Member Fact Cells, Crosstab Node Member, Crosstab Space, Cumulation Line Label,
Hyperlink, Hyperlink Button, List Cell, List Column Body, List Column Title, Text Item
Data Item LabelSpecifies the data item label that defines the HTML to render.
Applies to
Chart Node Member, Crosstab Corner, Crosstab Fact Cells, Crosstab Intersection, Crosstab
Member Fact Cells, Crosstab Node Member, Crosstab Space, HTML Item, List Cell, List Column
Body, List Column Title, Rich Text Item
Data Item LabelSpecifies the data item label that defines the URL.
606 Report Studio
Chapter 24: Report Studio Object and Property Reference
Applies to
Chart Node Member, Crosstab Corner, Crosstab Fact Cells, Crosstab Intersection, Crosstab
Member Fact Cells, Crosstab Node Member, Crosstab Space, Hyperlink, Hyperlink Button, Image,
List Cell, List Column Body, List Column Title
Data Item LabelSpecifies the data item label that defines the bookmark. The value used as the bookmark reference
must match this value.
Applies to
Bookmark, Chart Node Member, Crosstab Corner, Crosstab Fact Cells, Crosstab Intersection,
Crosstab Member Fact Cells, Crosstab Node Member, Crosstab Space, List Cell, List Column Body,
List Column Title
Data Item ValueSpecifies the data item value that defines the text to render.
Applies to
Chart Node Member, Chart Text Item, Crosstab Corner, Crosstab Fact Cells, Crosstab Intersection,
Crosstab Member Fact Cells, Crosstab Node Member, Crosstab Space, Cumulation Line Label,
Hyperlink, Hyperlink Button, List Cell, List Column Body, List Column Title, Text Item, Total
Column
Data Item ValueSpecifies the data item value that defines the HTML to render.
Applies to
Chart Node Member, Crosstab Corner, Crosstab Fact Cells, Crosstab Intersection, Crosstab
Member Fact Cells, Crosstab Node Member, Crosstab Space, HTML Item, List Cell, List Column
Body, List Column Title, Rich Text Item
Data Item ValueSpecifies the data item value that defines the URL.
Applies to
Chart Node Member, Crosstab Corner, Crosstab Fact Cells, Crosstab Intersection, Crosstab
Member Fact Cells, Crosstab Node Member, Crosstab Space, Hyperlink, Hyperlink Button, Image,
List Cell, List Column Body, List Column Title
Data Item ValueSpecifies the data item value that defines the bookmark. The value used as the bookmark reference
must match this value.
Professional Authoring User Guide 607
Chapter 24: Report Studio Object and Property Reference
Applies to
Bookmark, Chart Node Member, Crosstab Corner, Crosstab Fact Cells, Crosstab Intersection,
Crosstab Member Fact Cells, Crosstab Node Member, Crosstab Space, List Cell, List Column Body,
List Column Title
Data Item ValueSpecifies the numeric position by using a data item value.
Applies to
Baseline, Baseline, Baseline, Baseline, Marker
Data Item ValueSpecifies the numeric position of a data item.
Applies to
Marker
Data LanguageSpecifies the language of the data.
Applies to
Map
Data SourceSpecifies the query data source.
Applies to
MDX, SQL
Default MeasureSpecifies the default measure to use for a crosstab or chart. If the measures of the crosstab or chart
cannot be determined by what is being rendered on the edges, then the default measure will be
rendered.
Applies to
Crosstab
Default SelectionsSpecifies the collection of default selections for a prompt control.
608 Report Studio
Chapter 24: Report Studio Object and Property Reference
Applies to
Date & Time Prompt, Date Prompt, Interval Prompt, Text Box Prompt, Time Prompt, Tree Prompt,
Value Prompt
Default TitleSpecifies whether the default title may be generated.
Applies to
Axis Title, Legend Title
Define ContentsOverrides the content of the selected crosstab intersection. Use this property to hide measure values
for individual cells or to define custom content.
Applies to
Crosstab Intersection, Crosstab Member Fact Cells
Define Member SetsSpecifies the set structure of a query. If it is not defined, it is assumed that each data item defines
an unrelated set.
Applies to
Query
DepthSpecifies the depth of the chart. A value of zero indicates a flat chart.
Applies to
Combination Chart, Marimekko Chart, Metrics Range Chart, Pareto Chart, Pie Chart, Progressive
Chart
DescriptionSpecifies a description for the object, that is used to assist authoring.
Applies to
Class, HTML Item, Metric Studio Diagram, Rich Text Item
DetailSpecifies whether the data item is to be used for calculating aggregates or not. When set to Yes, the
data item is used to aggregate the lowest level details.
Professional Authoring User Guide 609
Chapter 24: Report Studio Object and Property Reference
Applies to
Data Item
Diagram IdentifierIdentifies a diagram in Metric Studio.
Applies to
Metric Studio Diagram
Dial Outline ColorSpecifies the dial outline color in a gauge chart.
Applies to
Gauge Chart
DictionarySpecifies the aliases to use when matching data values to feature names in the map.
Applies to
Map
DimensionSpecifies a reference to a dimension. You cannot modify this value.
Applies to
Calculated Measure, Calculated Member, Explicit Member Set, Hierarchy Set, Intersection (Tuple),
Level Set, Measure, Member, Member Children Set, Member Property, Named Set, Set Expression
Display After Overall HeaderSpecifies whether the list page header is to be rendered after the overall header.
Applies to
List Page Header
Display FrequencySpecifies the frequency for which chart labels are to be rendered. If set to 3, for example, every third
label will be rendered.
Applies to
Ordinal Axis, X Axis, Y Axis
610 Report Studio
Chapter 24: Report Studio Object and Property Reference
Display MillisecondsSpecifies whether to show the milliseconds. The format of the milliseconds can be controlled by
selecting a specific format. This property is ignored if seconds are not rendered. The default value
is inherited from the user's content language.
Applies to
Date & Time Prompt, Interval Prompt, Time Prompt
Display SecondsSpecifies whether to show the seconds. The format of the seconds can be controlled by selecting a
specific format. The default value is inherited from the user's content language.
Applies to
Date & Time Prompt, Interval Prompt, Time Prompt
Display ValueSpecifies the values rendered to the report user when the prompt is used. These values can be different
than the ones that are actually used by the report.
Applies to
Select & Search Prompt, Value Prompt
DownSpecifies the number of times down, or rows, that the frame contents may be rendered.
The default value depends on the setting of the Repeater Direction property. If it is set to Left to
right, top to bottom, the default is 20. If it is set to Top to bottom, left to right, the default is one.
Applies to
Repeater Table
Drill-Through DefinitionsSpecifies report-to-report drill-through definitions, bookmarks, and drill-through text for the object.
Applies to
3-D Combination Chart, 3-D Scatter Chart, Bubble Chart, Combination Chart, Crosstab Fact Cells,
Crosstab Intersection, Crosstab Member Fact Cells, Crosstab Node Member, Crosstab Space, Gauge
Chart, Gauge Labels, Image, Legend, List Column Body, List Column Title, Map, Marimekko
Chart, Metrics Range Chart, Ordinal Axis, Pareto Chart, Pie Chart, Pie Labels, Polar Chart, Pro-
gressive Chart, Radar Chart, Scatter Chart, Text Item, Win-Loss Chart, X Axis, Y Axis
Drop ShadowDefines a drop shadow that is rendered around a container.
Professional Authoring User Guide 611
Chapter 24: Report Studio Object and Property Reference
Applies to
Crosstab, List, Repeater Table, Table
DuplicatesSpecifies whether duplicate rows will be preserved or removed.
Applies to
Query Operation
EmbedSpecifies how to embed the reference object. A reference, or pointer, to the object is stored, by
default. Alternatively, a copy of the external object can be stored in the report.
Applies to
Layout Component Reference
Execution MethodSpecifies whether the query is a candidate to run concurrently. If set to Concurrent, the query may
still execute sequentially based on other factors. If not explicitly set, the query will execute
sequentially. Concurrent query execution may improve performance in some cases.
Applies to
Query
Execution OptimizationSpecifies how much of the query processing is performed by the client and how much is performed
by the database server. If the database server can perform all the query processing, it does.
If All Rows is selected, the optimizer adopts a plan that retrieves all rows of the result set in the
least amount of time. This value is generally used in a batch environment.
If First Rows is selected, the optimizer adopts a plan that retrieves the first row as quickly as possible.
This value is generally used in an interactive environment.
If Incremental is selected, the optimizer retrieves the first N rows, and then retrieves the next N
rows.
Applies to
Query
Expand FeaturesSpecifies whether to center and expand the feature in the map chart. When set to Yes, the map
feature is centered and expanded to take up all available space in the chart. When set to No, the
map feature is not expanded.
612 Report Studio
Chapter 24: Report Studio Object and Property Reference
Applies to
Map
ExpressionSpecifies the expression to evaluate when filtering the data.
Applies to
Detail Filter, Summary Filter
ExpressionSpecifies the expression that defines the slicer member set.
Applies to
Slicer Member Set
ExpressionSpecifies the numeric position for a data marker in a scatter chart.
Applies to
Marker
ExpressionSpecifies the expression used to populate the data item.
Applies to
Angular Measure, Baseline, Baseline, Baseline, Baseline, Bubble Measure, Calculated Measure,
Calculated Member, Chart Node Member, Chart Text Item, Crosstab Corner, Crosstab Fact Cells,
Crosstab Intersection, Crosstab Member Fact Cells, Crosstab Node Member, Cumulation Line
Label, Data Item, Default Measure, HTML Item, Image, List Cell, List Column Body, List Column
Title, Map Location, Map Location, Map Refinement Location, Map Refinement Location, Marker,
Point Measure, Point Size Measure, Radial Measure, Region Measure, Rich Text Item, Set
Expression, Target Measure, Text Item, Tolerance Measure, Total Column, Win-Loss Measure, X
Axis Measure, Y Axis Measure, Z Axis Measure
Face ColorSpecifies the color to show on the face of each gauge in a gauge chart.
Applies to
Gauge Chart
Professional Authoring User Guide 613
Chapter 24: Report Studio Object and Property Reference
Fact Cells PrecedenceSpecifies which style property will override the other style property for intersecting cells in a crosstab,
the row's properties, or the column's properties.
This property only applies to style properties that are both set, but to different values. For example,
if the row's background color is set to yellow and the column's background color is set to red, you
can select which of these properties will override the other. If only the row or the column has a set
background color, then that color will be used on the intersecting cell, regardless of this setting.
Applies to
Crosstab
Fill EffectsSpecifies the fill effects for the object.
Applies to
Chart Body, Display Layer, Legend, Point Layer, Region Layer
First Column ColorSpecifies the color, gradient, or pattern to be used for the first column in the progressive chart.
Applies to
Progressive Chart
First DateSpecifies the earliest date to render in the control, and the earliest date that can be selected.
Applies to
Date & Time Prompt, Date Prompt
First Label IndexSpecifies which label will be rendered first. If set to 5, for example, the fifth label will be the first
label rendered. Subsequent labels will be rendered as defined in the Display Frequency property.
Applies to
Ordinal Axis, X Axis, Y Axis
FloatingSpecifies how objects flow around an object.
Float controls the way the content that follows the selected object will flow around or below it.
Clear controls where the selected object is positioned, relative to other floating objects.
614 Report Studio
Chapter 24: Report Studio Object and Property Reference
Applies to
3-D Combination Chart, 3-D Scatter Chart, Block, Bubble Chart, Class, Combination Chart,
Conditional Block, Conditional Block, Context Item Text, Crosstab, Date & Time Prompt, Date
Prompt, Field Set, Gauge Chart, Hyperlink, Hyperlink Button, Image, Interval Prompt, List, Map,
Marimekko Chart, Metrics Range Chart, Page Break Text, Pareto Chart, Pie Chart, Polar Chart,
Progressive Chart, Prompt Button, Radar Chart, Repeater Table, Scatter Chart, Select & Search
Prompt, Table, Table of Contents, Table of Contents Entry, Text Box Prompt, Text Item, Time
Prompt, Tree Prompt, Value Prompt, Win-Loss Chart
FontSpecifies the font family, size, weight, style, and effects used to display the object's text.
Applies to
3-D Combination Chart, 3-D Scatter Chart, Angular Axis, Axis Title, Block, Bubble Chart, Caption,
Chart Body, Chart Footer, Chart Subtitle, Chart Title, Class, Combination Chart, Conditional
Block, Conditional Block, Context Item Text, Crosstab, Crosstab Columns, Crosstab Columns,
Crosstab Corner, Crosstab Fact Cells, Crosstab Intersection, Crosstab Member Fact Cells, Crosstab
Node Member, Crosstab Rows, Crosstab Rows, Crosstab Space, Cumulation Line Axis, Date, Field
Set, Gauge Chart, Gauge Labels, Gauge Numerical Axis, Hyperlink, Legend, Legend Title, List,
List Cell, List Column, List Column Body, List Columns, List Columns, List Columns Body Style,
List Columns Title Style, List Column Title, List Footer, List Header, List Row, List Row Cells
Style, Map, Marimekko Chart, Metrics Range Chart, Note Content, Numerical Axis, Numerical
Axis, Ordinal Axis, Page, Page Body, Page Break Text, Page Footer, Page Header, Page Number,
Pareto Chart, Pie Chart, Pie Labels, Polar Chart, Progressive Chart, Prompt Button, Radar Chart,
Radial Axis, Repeater Table, Repeater Table Cell, Row Number, Scatter Chart, Table, Table Cell,
Table of Contents, Table of Contents Entry, Table Row, Text Box Prompt, Text Item, Time, Value
Prompt, Win-Loss Chart, X Axis, X Axis, Y1 Axis, Y2 Axis, Y Axis, Y Axis, Z Axis, Z Axis
Font Auto-SizingSpecifies whether to allow automatic resizing of the font.
Applies to
Legend
FooterSpecifies whether a chart footer is rendered.
Applies to
3-D Combination Chart, 3-D Scatter Chart, Bubble Chart, Combination Chart, Gauge Chart, Map,
Marimekko Chart, Metrics Range Chart, Pareto Chart, Pie Chart, Polar Chart, Progressive Chart,
Radar Chart, Scatter Chart, Win-Loss Chart
Professional Authoring User Guide 615
Chapter 24: Report Studio Object and Property Reference
Foreground ColorSpecifies the color of the object's text.
Applies to
3-D Combination Chart, 3-D Scatter Chart, Angular Axis, Axis Title, Block, Bubble Chart, Caption,
Chart Body, Chart Footer, Chart Subtitle, Chart Title, Class, Combination Chart, Conditional
Block, Conditional Block, Context Item Text, Crosstab, Crosstab Columns, Crosstab Columns,
Crosstab Corner, Crosstab Fact Cells, Crosstab Intersection, Crosstab Member Fact Cells, Crosstab
Node Member, Crosstab Rows, Crosstab Rows, Crosstab Space, Cumulation Line Axis, Date, Field
Set, Gauge Chart, Gauge Labels, Gauge Numerical Axis, Hyperlink, Hyperlink Button, Legend,
Legend Title, List, List Cell, List Column, List Column Body, List Columns, List Columns, List
Columns Body Style, List Columns Title Style, List Column Title, List Footer, List Header, List
Row, List Row Cells Style, Map, Marimekko Chart, Metrics Range Chart, Note Content, Numerical
Axis, Numerical Axis, Ordinal Axis, Page, Page Body, Page Break Text, Page Footer, Page Header,
Page Number, Pareto Chart, Pie Chart, Pie Labels, Polar Chart, Progressive Chart, Prompt Button,
Radar Chart, Radial Axis, Repeater Table, Repeater Table Cell, Row Number, Scatter Chart, Table,
Table Cell, Table of Contents, Table of Contents Entry, Table Row, Text Box Prompt, Text Item,
Time, Value Prompt, Win-Loss Chart, X Axis, X Axis, Y1 Axis, Y2 Axis, Y Axis, Y Axis, Z Axis,
Z Axis
Gauge LabelsSpecifies whether gauge labels are rendered.
Applies to
Gauge Chart
Gauge PaletteSpecifies the palette that controls the look of the dial portion of a gauge.
Applies to
Gauge Chart
Generated Background ImageSpecifies the characteristics of a generated background.
Applies to
3-D Combination Chart, 3-D Scatter Chart, Block, Bubble Chart, Chart Footer, Chart Subtitle,
Chart Title, Class, Combination Chart, Conditional Block, Conditional Block, Crosstab Columns,
Crosstab Columns, Crosstab Corner, Crosstab Fact Cells, Crosstab Intersection, Crosstab Member
Fact Cells, Crosstab Node Member, Crosstab Rows, Crosstab Rows, Crosstab Space, Gauge Chart,
List Cell, List Column, List Column Body, List Columns, List Columns, List Columns Body Style,
List Columns Title Style, List Column Title, List Footer, List Header, List Row, List Row Cells
Style, Map, Marimekko Chart, Metrics Range Chart, Page Body, Page Footer, Page Header, Pareto
616 Report Studio
Chapter 24: Report Studio Object and Property Reference
Chart, Pie Chart, Polar Chart, Progressive Chart, Radar Chart, Repeater Table Cell, Scatter Chart,
Table Cell, Win-Loss Chart
Generated SQLShows the generated SQL or MDX.
Applies to
Query
GradientSpecifies a color gradient for the page.
Applies to
Page
GridlinesSpecifies the properties of the gridlines in a chart.
Applies to
Angular Axis, Cumulation Line Axis, Gauge Numerical Axis, Numerical Axis, Numerical Axis,
Ordinal Axis, Radial Axis, X Axis, X Axis, Y1 Axis, Y2 Axis, Y Axis, Y Axis, Z Axis, Z Axis
Grouping & SortingSpecifies the grouping and sorting structure.
Applies to
List, Page Set, Repeater, Repeater Table
Grouping TypeSpecifies whether the absolute, stacked, or 100 percent stacked data may be drawn.
Applies to
Area, Bar, Line
Group SpanSpecifies the group that this cell should visually span.
Applies to
List Column Body
Professional Authoring User Guide 617
Chapter 24: Report Studio Object and Property Reference
Has Fact CellsSpecifies the contents of the fact cells of the crosstab. There is only one fact cell definition for the
crosstab, regardless of the number of measures.
Applies to
Crosstab
Heading LevelSpecifies the heading level of the table of contents entry.
Applies to
Table of Contents Entry
Height (px)Specifies the height of the note, in pixels.
Applies to
Note
Hide AdornmentsSpecifies whether to hide the asterisk (*) on required prompts and arrow (->) on type-in prompts
that are in an error state.
Applies to
Date & Time Prompt, Date Prompt, Generated Prompt, Interval Prompt, Select & Search Prompt,
Text Box Prompt, Time Prompt, Tree Prompt, Value Prompt
Hide TextSpecifies whether to replace characters entered in the prompt control with asterisk (*) characters.
Applies to
Text Box Prompt
HierarchySpecifies a reference to a hierarchy. You cannot modify this value.
Applies to
Angular Measure, Baseline, Baseline, Baseline, Baseline, Bubble Measure, Calculated Member,
Chart Node Member, Chart Text Item, Crosstab Corner, Crosstab Fact Cells, Crosstab Intersection,
Crosstab Member Fact Cells, Crosstab Node Member, Cumulation Line Label, Default Measure,
Explicit Member Set, Hierarchy Set, HTML Item, Image, Intersection (Tuple), Level Set, List Cell,
List Column Body, List Column Title, Map Location, Map Location, Map Refinement Location,
618 Report Studio
Chapter 24: Report Studio Object and Property Reference
Map Refinement Location, Marker, Member, Member Children Set, Member Property, Named
Set, Point Measure, Point Size Measure, Radial Measure, Region Measure, Rich Text Item, Set
Expression, Target Measure, Text Item, Tolerance Measure, Total Column, Win-Loss Measure, X
Axis Measure, Y Axis Measure, Z Axis Measure
Hierarchy Unique NameSpecifies the Hierarchy Unique Name (HUN) of the hierarchy to which the data item belongs.
Applies to
Angular Measure, Baseline, Baseline, Baseline, Baseline, Bubble Measure, Chart Node Member,
Chart Text Item, Crosstab Corner, Crosstab Fact Cells, Crosstab Intersection, Crosstab Member
Fact Cells, Crosstab Node Member, Cumulation Line Label, Default Measure, Hierarchy Set, HTML
Item, Image, List Cell, List Column Body, List Column Title, Map Location, Map Location, Map
Refinement Location, Map Refinement Location, Marker, Point Measure, Point Size Measure,
Radial Measure, Region Measure, Rich Text Item, Target Measure, Text Item, Tolerance Measure,
Total Column, Win-Loss Measure, X Axis Measure, Y Axis Measure, Z Axis Measure
Hole Size (%)Specifies the size of the hole in a donut chart. A value of zero indicates a pie chart.
Applies to
Pie Chart
Horizontal AlignmentSpecifies how the contents of the selected object is aligned horizontally.
Applies to
Block, Chart Body, Chart Footer, Chart Subtitle, Chart Title, Class, Conditional Block, Conditional
Block, Crosstab, Crosstab Columns, Crosstab Columns, Crosstab Corner, Crosstab Fact Cells,
Crosstab Intersection, Crosstab Member Fact Cells, Crosstab Node Member, Crosstab Rows,
Crosstab Rows, Crosstab Space, Field Set, Gauge Labels, Legend, Legend Title, List, List Cell, List
Column, List Column Body, List Columns, List Columns, List Columns Body Style, List Columns
Title Style, List Column Title, List Footer, List Header, List Row, List Row Cells Style, Note Content,
Ordinal Axis, Page, Page Body, Page Footer, Page Header, Pie Labels, Repeater Table, Repeater
Table Cell, Table, Table Cell, Table of Contents, Table of Contents Entry, Table Row, X Axis, Y
Axis
HTMLSpecifies the static text used as HTML.
Professional Authoring User Guide 619
Chapter 24: Report Studio Object and Property Reference
Applies to
Chart Node Member, Crosstab Corner, Crosstab Fact Cells, Crosstab Intersection, Crosstab
Member Fact Cells, Crosstab Node Member, Crosstab Space, HTML Item, List Cell, List Column
Body, List Column Title, Rich Text Item
HTML Source VariableSpecifies a variable based on which the HTML source is chosen.
Applies to
Chart Node Member, Crosstab Corner, Crosstab Fact Cells, Crosstab Intersection, Crosstab
Member Fact Cells, Crosstab Node Member, Crosstab Space, HTML Item, List Cell, List Column
Body, List Column Title, Rich Text Item
Ignore Data with No FeaturesSpecifies whether to allow data that has no corresponding features. When set to Yes, data with no
corresponding features will be ignored. When set to No, the map will not run if it contains data
with no corresponding features.
Applies to
Map
Include Zero For Auto ScaleSpecifies whether the value zero is included in the automatic calculation of the numeric scale.
Applies to
Angular Axis, Gauge Numerical Axis, Numerical Axis, Numerical Axis, Radial Axis, X Axis, Y1
Axis, Y2 Axis, Y Axis, Z Axis, Z Axis
Join RelationshipsSpecifies how to join the two queries.
Applies to
Join
LabelSpecifies the static text that defines the bookmark. The value used as the bookmark reference must
match this value.
Applies to
Bookmark, Chart Node Member, Crosstab Corner, Crosstab Fact Cells, Crosstab Intersection,
Crosstab Member Fact Cells, Crosstab Node Member, Crosstab Space, List Cell, List Column Body,
List Column Title
620 Report Studio
Chapter 24: Report Studio Object and Property Reference
LabelSpecifies the class label for a local class.
Applies to
Class
LabelSpecifies the class label for a global class. You cannot modify this label.
Applies to
Class
LabelSpecifies whether a label is rendered for the baseline.
Applies to
Baseline, Baseline
LabelSpecifies whether a label is rendered for the marker.
Applies to
Marker, Marker
LabelSpecifies the label of the object.
Applies to
Angular Measure, Baseline, Baseline, Baseline, Baseline, Bubble Measure, Calculated Measure,
Calculated Member, Chart Node Member, Chart Text Item, Crosstab Corner, Crosstab Fact Cells,
Crosstab Intersection, Crosstab Member Fact Cells, Crosstab Node Member, Cumulation Line
Label, Data Item, Default Measure, Explicit Member Set, Hierarchy Set, HTML Item, Image,
Intersection (Tuple), Level Set, List Cell, List Column Body, List Column Title, Map Location, Map
Location, Map Refinement Location, Map Refinement Location, Marker, Measure, Member,
Member Children Set, Member Property, Named Set, Point Measure, Point Size Measure, Radial
Measure, Region Measure, Rich Text Item, Set Expression, Target Measure, Text Item, Tolerance
Measure, Total Column, Win-Loss Measure, X Axis Measure, Y Axis Measure, Z Axis Measure
Label ControlControls how the labels in a chart are rendered.
Professional Authoring User Guide 621
Chapter 24: Report Studio Object and Property Reference
Applies to
Ordinal Axis, X Axis, Y Axis
LabelsSpecifies whether labels are rendered in the chart.
Applies to
Display Layer, Point Layer, Region Layer
LabelsSpecifies whether labels are rendered.
Applies to
Pie Chart
Last DateSpecifies the latest date rendered in the control, and the last date that can be selected.
Applies to
Date & Time Prompt, Date Prompt
Left Position (px)Specifies the pixel position of the bottom edge of the note measured from the left edge of the chart.
The position is measured from the left edge of the note.
Applies to
Note
Left Position (px)Specifies the pixel position of the left edge of the legend measured from the left edge of the chart.
Applies to
Legend
LegendSpecifies whether the legend is rendered.
Applies to
3-D Scatter Chart, Bubble Chart, Combination Chart, Gauge Chart, Map, Marimekko Chart,
Metrics Range Chart, Pareto Chart, Pie Chart, Polar Chart, Radar Chart, Scatter Chart
622 Report Studio
Chapter 24: Report Studio Object and Property Reference
Legend LabelSpecifies whether to render the baseline in the legend.
Applies to
Baseline, Baseline
Legend TitleSpecifies whether a legend title is rendered.
Applies to
Legend
LevelSpecifies a reference to a level. You cannot modify this value.
Applies to
Angular Measure, Baseline, Baseline, Baseline, Baseline, Bubble Measure, Chart Node Member,
Chart Text Item, Crosstab Corner, Crosstab Fact Cells, Crosstab Intersection, Crosstab Member
Fact Cells, Crosstab Node Member, Cumulation Line Label, Default Measure, HTML Item, Image,
Level Set, List Cell, List Column Body, List Column Title, Map Location, Map Location, Map
Refinement Location, Map Refinement Location, Marker, Member Property, Point Measure, Point
Size Measure, Radial Measure, Region Measure, Rich Text Item, Target Measure, Text Item, Tol-
erance Measure, Total Column, Win-Loss Measure, X Axis Measure, Y Axis Measure, Z Axis
Measure
Level IndentationControls the indentation of the contents of node members in a crosstab.
Applies to
Crosstab Node Member
Level Unique NameSpecifies the Level Unique Name (LUN) of the level to which the data item belongs.
Applies to
Angular Measure, Baseline, Baseline, Baseline, Baseline, Bubble Measure, Chart Node Member,
Chart Text Item, Crosstab Corner, Crosstab Fact Cells, Crosstab Intersection, Crosstab Member
Fact Cells, Crosstab Node Member, Cumulation Line Label, Default Measure, HTML Item, Image,
Level Set, List Cell, List Column Body, List Column Title, Map Location, Map Location, Map
Refinement Location, Map Refinement Location, Marker, Point Measure, Point Size Measure,
Radial Measure, Region Measure, Rich Text Item, Target Measure, Text Item, Tolerance Measure,
Total Column, Win-Loss Measure, X Axis Measure, Y Axis Measure, Z Axis Measure
Professional Authoring User Guide 623
Chapter 24: Report Studio Object and Property Reference
LineSpecifies whether a line may be rendered. This allows you to show markers without lines.
Applies to
Line
Line StyleSpecifies the style of the line.
Applies to
Line
Line StylesSpecifies the line style, color, and weight of the line.
Applies to
Baseline, Baseline, Baseline, Baseline, Cumulation Line, Regression Line
Line TypeSpecifies the type of line used to connect data values.
Applies to
Line
Line Weight (pt)Specifies the line thickness in points. A value of zero indicates the thinnest possible line.
Applies to
Line
Loss ColorSpecifies a color, color gradient, or pattern to apply to the loss values.
Applies to
Win-Loss Chart
Map & LayersSets the map and layers for a map chart.
Applies to
Map
624 Report Studio
Chapter 24: Report Studio Object and Property Reference
Map DrillsControls the drill definitions in a map. It is possible to define different drill targets for each region
or point.
Applies to
Point Layer, Region Layer
MarginSpecifies the margin properties for the object.
Applies to
3-D Combination Chart, 3-D Scatter Chart, Block, Bubble Chart, Caption, Class, Combination
Chart, Conditional Block, Conditional Block, Context Item Text, Crosstab, Date, Field Set, Gauge
Chart, Hyperlink, Hyperlink Button, Image, List, Map, Marimekko Chart, Metrics Range Chart,
Page, Page Break Text, Page Number, Pareto Chart, Pie Chart, Polar Chart, Progressive Chart,
Prompt Button, Radar Chart, Repeater Table, Row Number, Scatter Chart, Table, Table of Contents,
Table of Contents Entry, Text Item, Time, Win-Loss Chart
Marimekko TotalsSpecifies whether to show totals for each column at the top of the chart.
Applies to
Marimekko Chart
Marker ColorSpecifies a color for the target value markers in a metrics chart.
Applies to
Metrics Range Chart
Marker ColorSpecifies the color of the markers.
Applies to
Marker, Marker
Marker LabelSpecifies whether the label for the Target Marker will appear in the legend.
Applies to
Metrics Range Chart
Professional Authoring User Guide 625
Chapter 24: Report Studio Object and Property Reference
MarkersAdds reference points to a chart based on numeric or statistical values, calculations, or layout cal-
culations.
Applies to
Bubble Chart, Combination Chart, Marimekko Chart, Metrics Range Chart, Pareto Chart, Polar
Chart, Progressive Chart, Radar Chart, Scatter Chart
Marker ShapeSpecifies the shape of the markers.
Applies to
Cumulation Line, Marker, Marker
Marker Size (pt)Specifies the size of markers in points. A value of zero means do not show markers.
Applies to
3-D Scatter Chart, Cumulation Line, Marker, Marker, Polar Chart, Radar Chart, Scatter Chart
Marker Text LocationSpecifies where the text of the marker is rendered.
Applies to
Bubble Chart, Combination Chart, Marimekko Chart, Metrics Range Chart, Pareto Chart, Polar
Chart, Progressive Chart, Radar Chart, Scatter Chart
Master Detail RelationshipsSpecifies relationships between the master data container and the detail data container. Specifically,
specifies how query items in the master query are linked to query items or parameters in the detail
query.
Applies to
3-D Combination Chart, 3-D Scatter Chart, Axis Title, Baseline, Baseline, Baseline, Baseline, Bubble
Chart, Chart Footer, Chart Subtitle, Chart Title, Combination Chart, Crosstab, Gauge Chart,
Legend Title, List, Map, Marimekko Chart, Marker, Marker, Metrics Range Chart, Note Content,
Page, Page Set, Pareto Chart, Pie Chart, Point Color Legend Title, Point Size Legend Title, Polar
Chart, Progressive Chart, Radar Chart, Region Color Legend Title, Repeater, Repeater Table,
Scatter Chart, Win-Loss Chart
Maximum CharactersSpecifies the maximum number of characters to show before the text is truncated.
626 Report Studio
Chapter 24: Report Studio Object and Property Reference
Applies to
Legend, Text Item
Maximum Execution TimeSpecifies the maximum period, in seconds, that the query can spend to open the database cursor
and to retrieve the first row of data. An error is returned if the specified time is exceeded. Note that
this property is not for the total time required to execute the query. If no value is specified, no error
is returned and the query runs until complete.
Applies to
Query
Maximum HotspotsSpecifies the maximum number of hotspots generated in a chart. If specified, this value overrides
the hotspot configuration settings in IBM Cognos Administration.
Applies to
3-D Combination Chart, 3-D Scatter Chart, Bubble Chart, Combination Chart, Gauge Chart, Map,
Marimekko Chart, Metrics Range Chart, Pareto Chart, Pie Chart, Polar Chart, Progressive Chart,
Radar Chart, Scatter Chart, Win-Loss Chart
Maximum Rows RetrievedSpecifies the maximum number of database rows that the query can retrieve. An error is returned
if the number of database rows returned exceeds the specified value. If no value is specified, no
error is returned and the query returns all rows.
Applies to
Query
Maximum Size (pt)Specifies the maximum size used for map point features that have corresponding data. For example,
if the minimum size is 2pt and the maximum size is 12pt, the size of each point is calculated using
linear interpolation that is based on its measure value.
Applies to
Point Size Measure
Maximum TablesSpecifies the maximum number of tables that the query can retrieve. An error is returned if the
number of tables in the generated Cognos SQL exceeds the specified value. If no value is specified,
no error is returned and there is no restriction on the number of tables that can be queried.
Professional Authoring User Guide 627
Chapter 24: Report Studio Object and Property Reference
Applies to
Query
Maximum Text Blob CharactersSpecifies the maximum number of characters that the query is allowed to retrieve for each text
BLOB. An error is returned if the number of characters retrieved exceeds the specified value. If no
value is specified, no error is returned and text BLOBs can be of any size.
Applies to
Query
Maximum Truncation CharactersSpecifies the maximum number of characters to show before the label is truncated.
If the Allow Truncation property is set to Yes and no value is specified in this property, the
application will automatically determine the optimum number of characters after which to truncate.
Use this property only if you want explicit control over the truncation level. Note that regardless
of this property's setting, no truncation will occur if there is sufficient space.
Applies to
Gauge Labels, Ordinal Axis, Pie Labels, X Axis, Y Axis
Maximum ValueSpecifies the maximum value for the numeric scale. If no value is specified, one will be calculated
based on the data.
Applies to
Angular Axis, Gauge Numerical Axis, Numerical Axis, Numerical Axis, Radial Axis, X Axis, Y1
Axis, Y2 Axis, Y Axis, Z Axis, Z Axis
MDXThe text of the typed-in MDX. It is assumed to be appropriate for the type and data source. If it is
not the query may fail or produce unexpected results.
Applies to
MDX
MemberSpecifies a reference to a member. You cannot modify this value.
Applies to
Angular Measure, Baseline, Baseline, Baseline, Baseline, Bubble Measure, Chart Node Member,
Chart Text Item, Crosstab Corner, Crosstab Fact Cells, Crosstab Intersection, Crosstab Member
628 Report Studio
Chapter 24: Report Studio Object and Property Reference
Fact Cells, Crosstab Node Member, Cumulation Line Label, Default Measure, HTML Item, Image,
List Cell, List Column Body, List Column Title, Map Location, Map Location, Map Refinement
Location, Map Refinement Location, Marker, Measure, Member, Member Children Set, Point
Measure, Point Size Measure, Radial Measure, Region Measure, Rich Text Item, Target Measure,
Text Item, Tolerance Measure, Total Column, Win-Loss Measure, X Axis Measure, Y Axis Measure,
Z Axis Measure
Member Offset (%)Specifies a position relative to the next item in the chart. This is a percentage value. Negative values
indicate before the member and positive values indicate after the member.
Applies to
Baseline
MembersSpecifies the members of the intersection (tuple).
Applies to
Intersection (Tuple)
MembersSpecifies the members in the member set.
Applies to
Explicit Member Set
Member Unique NameSpecifies the Member Unique Name (MUN) of the member.
Applies to
Angular Measure, Baseline, Baseline, Baseline, Baseline, Bubble Measure, Chart Node Member,
Chart Text Item, Crosstab Corner, Crosstab Fact Cells, Crosstab Intersection, Crosstab Member
Fact Cells, Crosstab Node Member, Cumulation Line Label, Default Measure, HTML Item, Image,
List Cell, List Column Body, List Column Title, Map Location, Map Location, Map Refinement
Location, Map Refinement Location, Marker, Measure, Member, Member Children Set, Point
Measure, Point Size Measure, Radial Measure, Region Measure, Rich Text Item, Target Measure,
Text Item, Tolerance Measure, Total Column, Win-Loss Measure, X Axis Measure, Y Axis Measure,
Z Axis Measure
Minimum Size (pt)Specifies the minimum size used for map point features that have corresponding data. For example,
if the minimum size is 2pt and the maximum size is 12pt, the size of each point is calculated using
linear interpolation that is based on its measure value.
Professional Authoring User Guide 629
Chapter 24: Report Studio Object and Property Reference
Applies to
Point Size Measure
Minimum ValueSpecifies the minimum value for the numeric scale. If no value is specified, one will be calculated
based on the data.
Applies to
Angular Axis, Gauge Numerical Axis, Numerical Axis, Numerical Axis, Radial Axis, X Axis, Y1
Axis, Y2 Axis, Y Axis, Z Axis, Z Axis
Minor GridlinesSpecifies the properties of the minor gridlines in a chart.
Applies to
Angular Axis, Cumulation Line Axis, Gauge Numerical Axis, Numerical Axis, Numerical Axis,
Ordinal Axis, Radial Axis, X Axis, X Axis, Y1 Axis, Y2 Axis, Y Axis, Y Axis, Z Axis, Z Axis
Multi-LineSpecifies whether to allow multi-line editing in the text control
Applies to
Text Box Prompt
Multi-SelectSpecifies whether the control allows the selection of multiple values. Note that an associated para-
meterized filter expression will override this object’s setting. If you edit this property but do not
get the expected results, check the associated expression for the presence of an operator that specifies
how many items can be selected. Examples of multiple selection operators are "in" and "not in";
examples of single selection operators are equal (=), less than (<) and greater than (>).
For example, if you used the prompt wizard to create a parameterized filter expression and selected
one of the operators that specify selection rules, changing the value of this property is not sufficient
to change this restriction. You must also edit the filter’s expression to remove the offending operator.
To edit a filter expression, you must select the filter, which is accessible from the Query view, using
the Explorer bar.
Applies to
Date & Time Prompt, Date Prompt, Interval Prompt, Select & Search Prompt, Text Box Prompt,
Time Prompt, Tree Prompt, Value Prompt
NameSpecifies the name of the object.
630 Report Studio
Chapter 24: Report Studio Object and Property Reference
Applies to
Angular Measure, Baseline, Baseline, Baseline, Baseline, Bubble Measure, Calculated Measure,
Calculated Member, Chart Node Member, Chart Text Item, Crosstab Corner, Crosstab Fact Cells,
Crosstab Intersection, Crosstab Member Fact Cells, Crosstab Node Member, Cumulation Line
Label, Data Item, Default Measure, Dimension, Explicit Member Set, Fact, Hierarchy Set, HTML
Item, Image, Intersection (Tuple), Level, Level Set, List Cell, List Column Body, List Column Title,
Map Location, Map Location, Map Refinement Location, Map Refinement Location, Marker,
Measure, Member, Member Children Set, Member Property, Member Set, Named Set, Page, Page
Set, Point Measure, Point Size Measure, Query, Radial Measure, Region Measure, Rich Text Item,
Set Expression, Target Measure, Text Item, Tolerance Measure, Total Column, Variable, Win-Loss
Measure, X Axis Measure, Y Axis Measure, Z Axis Measure
NameSpecifies a unique name that allows layout objects to be reused, usually to take advantage of any
applied styling.
Applies to
3-D Combination Chart, 3-D Scatter Chart, Block, Bubble Chart, Combination Chart, Crosstab,
Date & Time Prompt, Date Prompt, Field Set, Gauge Chart, Generated Prompt, HTML Item,
Hyperlink, Hyperlink Button, Image, Interval Prompt, List, Map, Marimekko Chart, Metrics Range
Chart, Pareto Chart, Pie Chart, Polar Chart, Progressive Chart, Prompt Button, Radar Chart,
Repeater, Repeater Table, Rich Text Item, Scatter Chart, Select & Search Prompt, Singleton, Table,
Text Box Prompt, Text Item, Time Prompt, Tree Prompt, Value Prompt, Win-Loss Chart
NameSpecifies the unique name identifier for a query operation.
Applies to
Query Operation
NameSpecifies the unique name identifier for an SQL object.
Applies to
SQL
NameSpecifies the unique name identifier for an MDX object.
Applies to
MDX
Professional Authoring User Guide 631
Chapter 24: Report Studio Object and Property Reference
NameSpecifies a unique name that allows layout objects to be reused, usually to take advantage of any
applied formatting.
Applies to
Calculated Member, Key, Level Hierarchy, Member Hierarchy, Member Property
Negative Column ColorSpecifies the color, gradient, or pattern to be used for columns in the progressive chart that represent
negative values.
Applies to
Progressive Chart
No Data ContentsSpecifies whether to show the no data contents tab for the selected query frame. When set to Yes,
you can specify on this tab what to show when there is no data. When set to No, the tab is hidden
and the query frame reverts to the default behavior.
Applies to
3-D Combination Chart, 3-D Scatter Chart, Bubble Chart, Combination Chart, Crosstab, Gauge
Chart, List, Map, Marimekko Chart, Metrics Range Chart, Pareto Chart, Pie Chart, Polar Chart,
Progressive Chart, Radar Chart, Repeater, Repeater Table, Scatter Chart, Table of Contents, Win-
Loss Chart
No Data Features Size (pt)Specifies the point size used for map point features that do not have corresponding data.
Applies to
Map
Node CoordinateUniquely identifies a node member or spacer on an edge of a crosstab. Used by the Crosstab Inter-
section object to uniquely identify the intersection of elements from each edge. You cannot modify
this value.
Applies to
Crosstab Node Member, Crosstab Space
Note BorderSpecifies the properties for the border of a note.
632 Report Studio
Chapter 24: Report Studio Object and Property Reference
Applies to
Note
NotesSpecifies a block of text that you can position on a chart.
Applies to
3-D Combination Chart, 3-D Scatter Chart, Bubble Chart, Combination Chart, Gauge Chart, Map,
Marimekko Chart, Metrics Range Chart, Pareto Chart, Pie Chart, Polar Chart, Progressive Chart,
Radar Chart, Scatter Chart
Number of Regression LinesSpecifies whether there will be one regression line for all the data or one for each series.
Applies to
Regression Line
Numbers OnlySpecifies whether the Text Box Prompt allows numbers only.
Applies to
Text Box Prompt
Number StyleSpecifies the style to use for page numbers.
Applies to
Page Number
Numerical AxisSpecifies whether the axis is rendered.
Applies to
3-D Combination Chart
Numerical AxisSpecifies whether the numeric axis of a gauge chart is rendered.
Applies to
Gauge Chart
Professional Authoring User Guide 633
Chapter 24: Report Studio Object and Property Reference
Numeric ValueSpecifies the numeric position by using a number.
Applies to
Baseline, Baseline, Baseline, Baseline, Marker
Numeric ValueSpecifies the value of the numeric position.
Applies to
Marker
Ordinal AxisSpecifies whether the axis is rendered.
Applies to
Combination Chart, Marimekko Chart, Metrics Range Chart, Pareto Chart, Progressive Chart,
Radar Chart
Outer Join AllowedSpecifies whether outer joins are allowed on the object. This property applies to a single query and
overrides the setting in Framework Manager, the modeling tool.
Applies to
Query
Override Dimension InfoSpecifies dimension information for a query.
Applies to
Query
OverridesSpecifies whether to override child objects. Before you can override child objects, they must have
a name.
Applies to
Layout Component Reference
PaddingSpecifies the space between the object and the margin. If there is a border then it specifies the space
between the object and the border.
634 Report Studio
Chapter 24: Report Studio Object and Property Reference
Applies to
3-D Combination Chart, 3-D Scatter Chart, Block, Bubble Chart, Caption, Class, Combination
Chart, Conditional Block, Conditional Block, Context Item Text, Crosstab Columns, Crosstab
Columns, Crosstab Corner, Crosstab Fact Cells, Crosstab Intersection, Crosstab Member Fact
Cells, Crosstab Node Member, Crosstab Rows, Crosstab Rows, Crosstab Space, Gauge Chart,
Hyperlink, Hyperlink Button, List Cell, List Column, List Column Body, List Columns, List Columns,
List Columns Body Style, List Columns Title Style, List Column Title, List Footer, List Header, List
Row, List Row Cells Style, Map, Marimekko Chart, Metrics Range Chart, Page Body, Page Break
Text, Page Footer, Page Header, Pareto Chart, Pie Chart, Polar Chart, Progressive Chart, Prompt
Button, Radar Chart, Repeater Table Cell, Scatter Chart, Table Cell, Table of Contents, Table of
Contents Entry, Text Item, Win-Loss Chart
PaginationSpecifies pagination rules, such as page breaks, keep-with properties, page counts, and numbering.
Applies to
3-D Combination Chart, 3-D Scatter Chart, Bubble Chart, Combination Chart, Crosstab, Crosstab
Node Member, Crosstab Space, Gauge Chart, List, List Column, List Header, Map, Marimekko
Chart, Metrics Range Chart, Page, Page Set, Pareto Chart, Pie Chart, Polar Chart, Progressive
Chart, Radar Chart, Repeater, Repeater Table, Scatter Chart, Table, Win-Loss Chart
PaletteSpecifies the palette to use for the chart.
Applies to
3-D Combination Chart, 3-D Scatter Chart, Bubble Chart, Combination Chart, Gauge Chart,
Marimekko Chart, Metrics Range Chart, Pareto Chart, Pie Chart, Polar Chart, Progressive Chart,
Radar Chart, Scatter Chart
PaletteMap layers use the numeric palette, in which the color of a region or point is based on its numeric
value.
Applies to
Point Layer, Region Layer
ParameterSpecifies the parameter that is satisfied by values chosen in the prompt control.
Applies to
Date & Time Prompt, Date Prompt, Generated Prompt, Interval Prompt, Select & Search Prompt,
Text Box Prompt, Time Prompt, Tree Prompt, Value Prompt
Professional Authoring User Guide 635
Chapter 24: Report Studio Object and Property Reference
Pareto AxisSpecifies whether the axis is rendered.
Applies to
Pareto Chart
PDF Page SetupSpecifies the orientation and paper size for PDF documents.
Applies to
Page
PercentileSpecifies a position based on a data percentile value. This value must be greater than zero.
Applies to
Baseline, Baseline, Baseline, Baseline, Marker, Marker
Percent of AxisSpecifies a position based on a percentage along the numeric axis. This value must be greater than
zero.
Applies to
Baseline, Baseline, Baseline, Baseline, Marker, Marker
Performance PatternControls what portions of the range markers for tolerance and target ranges are rendered on a
metrics chart.
Applies to
Metrics Range Chart
Pie LabelsSpecifies whether pie labels are rendered.
Applies to
Pie Chart
Point ShapeSpecifies the shape of the markers. If you choose a value of series or category, the marker shape
varies accordingly.
636 Report Studio
Chapter 24: Report Studio Object and Property Reference
Applies to
3-D Scatter Chart, Bubble Chart, Polar Chart, Radar Chart, Scatter Chart
Polynomial ExponentSpecifies the highest exponential value to use in the regression calculation.
Applies to
Regression Line
PositionSpecifies where to position the legend.
Applies to
Legend
Position typeSpecifies the source type for the numeric position.
Applies to
Baseline, Baseline, Baseline, Baseline, Marker
Position typeSpecifies the type of numeric position.
Applies to
Marker
Position typeSpecifies a type of numeric position.
Applies to
Marker
Positive Column ColorSpecifies the color, gradient, or pattern to be used for columns in the progressive chart that represent
positive values.
Applies to
Progressive Chart
Professional Authoring User Guide 637
Chapter 24: Report Studio Object and Property Reference
Pre-populateSpecifies whether to pre-populate the control with values, but only if the parent of this prompt
control is optional. This only applies to prompt controls that have a parent in a cascade.
Applies to
Tree Prompt, Value Prompt
Pre-populate LevelsSpecifies the number of levels to pre-populate the prompt with. The default value is 1, which will
pre-populate the prompt with only the root members.
Applies to
Tree Prompt
Pre-SortSorts the data that is used by the query to produce a temporary cube when needed, such as for a
crosstab against a relational data source. This property affects the default order of members of a
level populated from the data item.
Applies to
Data Item
ProcessingSpecifies whether the query engine will pick up a minimal amount of processing. Local processing
only occurs if the database cannot handle the load.
Applies to
Query
Progressive AxisSpecifies whether the axis is rendered.
Applies to
Progressive Chart
Projection ListShows the list of projected data items for the set operation. You can automatically generate the list
or manually add data items.
Applies to
Query Operation
638 Report Studio
Chapter 24: Report Studio Object and Property Reference
PropertiesSpecifies a list of data items from the query in scope to associate to the selected object. This is
necessary when you want to reference a data item that is in the associated query, but not used in
the layout. For more information, see the Report Studio Professional Authoring User Guide.
Applies to
Axis Title, Baseline, Baseline, Baseline, Baseline, Chart Footer, Chart Node Member, Chart Subtitle,
Chart Title, Crosstab Node Member, Cumulation Line, Legend Title, List, List Footer, List Header,
Marker, Marker, Note Content, Page, Page Set, Point Color Legend Title, Point Size Legend Title,
Region Color Legend Title, Regression Line, Repeater, Repeater Table, Select & Search Prompt,
Singleton, Total Column, Total Column Label, Value Prompt
PropertySpecifies a reference to a member property. You cannot modify this value.
Applies to
Member Property
Property Unique NameSpecifies the Member Property Unique Name (MPUN) of the member property.
Applies to
Angular Measure, Baseline, Baseline, Baseline, Baseline, Bubble Measure, Chart Node Member,
Chart Text Item, Crosstab Corner, Crosstab Fact Cells, Crosstab Intersection, Crosstab Member
Fact Cells, Crosstab Node Member, Cumulation Line Label, Default Measure, HTML Item, Image,
List Cell, List Column Body, List Column Title, Map Location, Map Location, Map Refinement
Location, Map Refinement Location, Marker, Member Property, Point Measure, Point Size Measure,
Radial Measure, Region Measure, Rich Text Item, Target Measure, Text Item, Tolerance Measure,
Total Column, Win-Loss Measure, X Axis Measure, Y Axis Measure, Z Axis Measure
Push To BottomSpecifies whether to position the footer as low as possible inside the parent object.
Applies to
List Footer, List Page Footer
QuerySpecifies a reference to a query.
Applies to
3-D Combination Chart, 3-D Scatter Chart, Axis Title, Baseline, Baseline, Baseline, Baseline, Bubble
Chart, Chart Footer, Chart Subtitle, Chart Title, Combination Chart, Crosstab, Gauge Chart,
Legend Title, List, Map, Marimekko Chart, Marker, Marker, Metrics Range Chart, Note Content,
Professional Authoring User Guide 639
Chapter 24: Report Studio Object and Property Reference
Page, Page Set, Pareto Chart, Pie Chart, Point Color Legend Title, Point Size Legend Title, Polar
Chart, Progressive Chart, Radar Chart, Region Color Legend Title, Repeater, Repeater Table,
Scatter Chart, Select & Search Prompt, Singleton, Tree Prompt, Value Prompt, Win-Loss Chart
Radar TypeSpecifies how the radar chart is rendered.
Applies to
Radar Chart
Radial AxisSpecifies whether the axis is rendered.
Applies to
Polar Chart, Radar Chart
RangeSpecifies whether this control accepts ranges. The setting of the associated parameterized expression
for this property will override the setting of this object. If you edit this property but do not get the
expected results, check the associated expression for the presence or absence of an in_range operator.
For example, if you created this prompt control with the prompt wizard and set up an associated
parameterized filter that accepts ranges, changing the value of this property is not sufficient to
change this restriction. You must also edit the filter’s expression and remove the in_range operator.
To edit a filter expression, you must select the filter, which is accessible from the Query view, using
the Explorer bar.
Applies to
Date & Time Prompt, Date Prompt, Interval Prompt, Text Box Prompt, Time Prompt, Value Prompt
Range LabelSpecifies whether the label for the Target Range will appear in the legend.
Applies to
Metrics Range Chart
Regression LineSpecifies whether a regression line is rendered.
Applies to
Bubble Chart, Scatter Chart
640 Report Studio
Chapter 24: Report Studio Object and Property Reference
Regression TypeSpecifies the type of regression used.
Applies to
Regression Line
Relative AlignmentSpecifies how to vertically align this object, relative to its siblings.
Applies to
3-D Combination Chart, 3-D Scatter Chart, Bubble Chart, Class, Combination Chart, Context
Item Text, Crosstab, Date, Date Prompt, Field Set, Gauge Chart, Hyperlink, Hyperlink Button,
Image, List, Map, Marimekko Chart, Metrics Range Chart, Page Break Text, Page Number, Pareto
Chart, Pie Chart, Polar Chart, Progressive Chart, Prompt Button, Radar Chart, Repeater Table,
Row Number, Scatter Chart, Table, Text Box Prompt, Text Item, Time, Value Prompt, Win-Loss
Chart
Render Fact CellsSpecifies whether to render values in the fact cells of the spacer on an edge of the crosstab.
Applies to
Crosstab Space
Render Page when EmptySpecifies whether to render a page when data containers on a page contain no data. If all data
containers on a page have this property set to No and do not have any data to render, the page is
not rendered. If any data container on a page has data or has this property set to Yes, the page is
rendered.
Applies to
3-D Combination Chart, 3-D Scatter Chart, Bubble Chart, Combination Chart, Crosstab, Gauge
Chart, List, Map, Marimekko Chart, Metrics Range Chart, Pareto Chart, Pie Chart, Polar Chart,
Progressive Chart, Radar Chart, Repeater, Repeater Table, Scatter Chart, Table of Contents, Win-
Loss Chart
Render VariableSpecifies a variable based on which the object can be conditionally rendered.
Applies to
3-D Combination Chart, 3-D Scatter Chart, Block, Bubble Chart, Combination Chart, Context
Item Text, Crosstab, Date & Time Prompt, Date Prompt, Field Set, Gauge Chart, Generated Prompt,
HTML Item, Hyperlink, Hyperlink Button, Image, Interval Prompt, List, List Column, Map,
Marimekko Chart, Metrics Range Chart, Page, Page Break Text, Pareto Chart, Pie Chart, Polar
Professional Authoring User Guide 641
Chapter 24: Report Studio Object and Property Reference
Chart, Progressive Chart, Radar Chart, Repeater, Repeater Table, Repeater Table Cell, Rich Text
Item, Scatter Chart, Select & Search Prompt, Singleton, Table, Table of Contents, Table of Contents
Entry, Text Box Prompt, Text Item, Time Prompt, Tree Prompt, Value Prompt, Win-Loss Chart
Repeater DirectionSpecifies the direction in which to populate the rendered repeater cells.
Applies to
Repeater Table
Report ExpressionSpecifies the report expression that defines the text to render.
Applies to
Chart Node Member, Chart Text Item, Crosstab Corner, Crosstab Fact Cells, Crosstab Intersection,
Crosstab Member Fact Cells, Crosstab Node Member, Crosstab Space, Cumulation Line Label,
Hyperlink, Hyperlink Button, List Cell, List Column Body, List Column Title, Text Item, Total
Column
Report ExpressionSpecifies the report expression used to define the HTML to render.
Applies to
Chart Node Member, Crosstab Corner, Crosstab Fact Cells, Crosstab Intersection, Crosstab
Member Fact Cells, Crosstab Node Member, Crosstab Space, HTML Item, List Cell, List Column
Body, List Column Title, Rich Text Item
Report ExpressionSpecifies the report expression that defines the URL.
Applies to
Chart Node Member, Crosstab Corner, Crosstab Fact Cells, Crosstab Intersection, Crosstab
Member Fact Cells, Crosstab Node Member, Crosstab Space, Hyperlink, Hyperlink Button, Image,
List Cell, List Column Body, List Column Title
Report ExpressionSpecifies the report expression that defines the bookmark. The value used as the bookmark reference
must match this value.
Applies to
Bookmark, Chart Node Member, Crosstab Corner, Crosstab Fact Cells, Crosstab Intersection,
Crosstab Member Fact Cells, Crosstab Node Member, Crosstab Space, List Cell, List Column Body,
List Column Title
642 Report Studio
Chapter 24: Report Studio Object and Property Reference
Report ExpressionSpecifies the numeric position by using a report expression.
Applies to
Baseline, Baseline, Baseline, Baseline, Marker
Report ExpressionSpecifies the report expression for the member position.
Applies to
Baseline, Marker
Report ExpressionSpecifies a report expression.
Applies to
As of Time Expression
Report ExpressionSpecifies the expression to evaluate when determining the value for this variable.
Applies to
Variable
Report ExpressionSpecifies the numeric position from a report expression.
Applies to
Marker
RequiredSpecifies whether the prompt is required or optional. If this property is set to required, the prompt
must have a value entered before the report can be run. The Usage setting of the associated para-
meterized filter for this property will override the setting of this object. If you edit this property,
but do not get the expected results, verify the Usage setting of the associated filter.
For example, if you created this prompt control with the prompt wizard and set the associated
parameterized filter to be optional, changing the value of this property is not sufficient to change
this setting. You must also edit the filter’s Required property to match the setting for this object’s
Required property.
To edit a filter expression, you must select the filter, which is accessible from the Query view, using
the Explorer bar.
Professional Authoring User Guide 643
Chapter 24: Report Studio Object and Property Reference
Applies to
Date & Time Prompt, Date Prompt, Generated Prompt, Interval Prompt, Select & Search Prompt,
Text Box Prompt, Time Prompt, Tree Prompt, Value Prompt
Right Position (px)Specifies the pixel position of the right edge of the legend measured from the left edge of the chart.
Applies to
Legend
Rollup Aggregate FunctionSpecifies the type of aggregation to apply to summarized values. These values appear at the higher
levels of lists and crosstabs.
Applies to
Angular Measure, Baseline, Baseline, Baseline, Baseline, Bubble Measure, Chart Node Member,
Chart Text Item, Crosstab Corner, Crosstab Fact Cells, Crosstab Intersection, Crosstab Member
Fact Cells, Crosstab Node Member, Cumulation Line Label, Data Item, Default Measure, HTML
Item, Image, List Cell, List Column Body, List Column Title, Map Location, Map Location, Map
Refinement Location, Map Refinement Location, Marker, Point Measure, Point Size Measure,
Radial Measure, Region Measure, Rich Text Item, Target Measure, Text Item, Tolerance Measure,
Total Column, Win-Loss Measure, X Axis Measure, Y Axis Measure, Z Axis Measure
Rollup ProcessingSpecifies where to compute aggregates. The Extended setting means that aggregates are computed
using an extended aggregate operation. The Database setting means that aggregates are computed
by the database software. The Local setting means that aggregates are computed by the data retrieval
software in the report server, using a running aggregate.
Applies to
Query
Root Members OnlySpecifies whether the set contains the root members or all of the members of the hierarchy.
Applies to
Angular Measure, Baseline, Baseline, Baseline, Baseline, Bubble Measure, Chart Node Member,
Chart Text Item, Crosstab Corner, Crosstab Fact Cells, Crosstab Intersection, Crosstab Member
Fact Cells, Crosstab Node Member, Cumulation Line Label, Default Measure, Hierarchy Set, HTML
Item, Image, List Cell, List Column Body, List Column Title, Map Location, Map Location, Map
Refinement Location, Map Refinement Location, Marker, Point Measure, Point Size Measure,
Radial Measure, Region Measure, Rich Text Item, Target Measure, Text Item, Tolerance Measure,
Total Column, Win-Loss Measure, X Axis Measure, Y Axis Measure, Z Axis Measure
644 Report Studio
Chapter 24: Report Studio Object and Property Reference
Rotate ValuesControls whether or not the values displayed on the chart are rotated when the Chart Orientation
property is set to Horizontal. May help make values easier to read on horizontal charts.
Applies to
Combination Chart, Pareto Chart, Progressive Chart
Row CoordinateUniquely identifies the row of a node member or spacer on an edge of the crosstab. You cannot
modify this value.
Applies to
Crosstab Intersection
Rows Per PageSpecifies the maximum number of rows to show at one time.
Applies to
Crosstab, List, Repeater, Select & Search Prompt, Tree Prompt, Value Prompt
ScaleSpecifies whether the numeric scale is logarithmic or linear.
Applies to
Angular Axis, Gauge Numerical Axis, Numerical Axis, Numerical Axis, Radial Axis, X Axis, Y1
Axis, Y2 Axis, Y Axis, Z Axis, Z Axis
Scale IntervalSpecifies the interval between ticks on the numeric scale. If no value is specified, one will be calculated
based on the data.
Applies to
Angular Axis, Cumulation Line Axis, Gauge Numerical Axis, Numerical Axis, Numerical Axis,
Radial Axis, X Axis, Y1 Axis, Y2 Axis, Y Axis, Z Axis, Z Axis
ScopeSpecifies the scope of the filter in terms of the number of levels.
Applies to
Summary Filter
Professional Authoring User Guide 645
Chapter 24: Report Studio Object and Property Reference
Select UISpecifies which interface the prompt control renders.
Applies to
Date & Time Prompt, Date Prompt, Time Prompt, Value Prompt
SeparatorSpecifies the separator to use when showing multiple values.
Applies to
Context Item Text, Legend
Series ColorSpecifies whether the graphs for a series will have the same color for each combination measure.
Applies to
3-D Combination Chart, Combination Chart
Set OperationSpecifies the set operation to apply to one or more queries, that results in a projection list on which
other queries can be based.
Applies to
Query Operation
Set SortingSpecifies how the set is sorted. By default, the set is not sorted.
Applies to
Angular Measure, Baseline, Baseline, Baseline, Baseline, Bubble Measure, Chart Node Member,
Chart Text Item, Crosstab Corner, Crosstab Fact Cells, Crosstab Intersection, Crosstab Member
Fact Cells, Crosstab Node Member, Cumulation Line Label, Default Measure, Explicit Member
Set, Hierarchy Set, HTML Item, Image, Level Set, List Cell, List Column Body, List Column Title,
Map Location, Map Location, Map Refinement Location, Map Refinement Location, Marker,
Member Children Set, Named Set, Point Measure, Point Size Measure, Radial Measure, Region
Measure, Rich Text Item, Set Expression, Target Measure, Text Item, Tolerance Measure, Total
Column, Win-Loss Measure, X Axis Measure, Y Axis Measure, Z Axis Measure
Share Result SetSpecifies whether to share an identical query between data containers that use it. To share a query,
data containers must be lists, repeaters, or repeater tables and must use the same grouping structure
and list of properties. The data containers cannot be part of a master detail relationship. When set
646 Report Studio
Chapter 24: Report Studio Object and Property Reference
to Yes, the query sends only one request to the database and shares the result. When set to No, the
query is not shared.
Applies to
List, Repeater, Repeater Table
Show CaptionSpecifies whether, or where, to show the caption.
Applies to
Field Set
Show Data PointsSpecifies whether to show data points and value markers and how they are formatted.
Applies to
Line
Show Data Range in LegendSpecifies whether to show the full range of data in the legend. If set to No, only the values from the
palette will be shown.
Applies to
Point Layer, Region Layer
Show Features with No DataIndicates whether to show the features of a map that do not have corresponding data.
Applies to
Point Layer, Region Layer
Show FeelersSpecifies whether feeler lines are rendered for each marker.
Applies to
3-D Scatter Chart
Show Legend ValuesSpecifies whether and how to show legend values.
Applies to
Legend
Professional Authoring User Guide 647
Chapter 24: Report Studio Object and Property Reference
Size & OverflowSpecifies the height and width of the object, as well as how overflow content should be treated,
using scroll bars and clipping.
Applies to
3-D Combination Chart, 3-D Scatter Chart, Block, Bubble Chart, Class, Combination Chart,
Conditional Block, Conditional Block, Context Item Text, Crosstab, Crosstab Columns, Crosstab
Columns, Crosstab Corner, Crosstab Fact Cells, Crosstab Intersection, Crosstab Member Fact
Cells, Crosstab Node Member, Crosstab Rows, Crosstab Rows, Crosstab Space, Field Set, Gauge
Chart, Hyperlink, Hyperlink Button, Image, List, List Cell, List Column, List Column Body, List
Columns, List Columns, List Columns Body Style, List Columns Title Style, List Column Title, List
Footer, List Header, List Row, List Row Cells Style, Map, Marimekko Chart, Metrics Range Chart,
Page, Page Body, Page Break Text, Page Footer, Page Header, Pareto Chart, Pie Chart, Polar Chart,
Progressive Chart, Prompt Button, Radar Chart, Repeater Table, Repeater Table Cell, Scatter Chart,
Table, Table Cell, Table of Contents, Table of Contents Entry, Text Box Prompt, Text Item, Tree
Prompt, Value Prompt, Win-Loss Chart
Size Legend TitleSpecifies a title within the legend above the palette for the point size. If this object is not defined,
no additional title is drawn. If no legend is drawn, this object is ignored. Styling for this object is
inherited from the legend title.
Applies to
Point Layer
Solve OrderSpecifies the solve order in crosstabs and charts. The item with the lowest solve order value is cal-
culated first, followed by the next lowest value, and so on. For identical values, in crosstabs, column
items are calculated first, then row items, and then the measure. In charts, x-axis items are calculated
first and then legend items.
Applies to
Calculated Measure, Calculated Member, Data Item
SortingSpecifies the desired sort sequence.
Applies to
Chart Node Member, Crosstab Node Member, Level, Select & Search Prompt, Tree Prompt, Value
Prompt
Source TypeSpecifies the source type of the text.
648 Report Studio
Chapter 24: Report Studio Object and Property Reference
Applies to
Chart Node Member, Chart Text Item, Crosstab Corner, Crosstab Fact Cells, Crosstab Intersection,
Crosstab Member Fact Cells, Crosstab Node Member, Crosstab Space, Cumulation Line Label,
Hyperlink, Hyperlink Button, List Cell, List Column Body, List Column Title, Text Item
Source TypeSpecifies the source type of the HTML text.
Applies to
Chart Node Member, Crosstab Corner, Crosstab Fact Cells, Crosstab Intersection, Crosstab
Member Fact Cells, Crosstab Node Member, Crosstab Space, HTML Item, List Cell, List Column
Body, List Column Title, Rich Text Item
Source TypeSpecifies the source type of the URL.
Applies to
Chart Node Member, Crosstab Corner, Crosstab Fact Cells, Crosstab Intersection, Crosstab
Member Fact Cells, Crosstab Node Member, Crosstab Space, Hyperlink, Hyperlink Button, Image,
List Cell, List Column Body, List Column Title
Source TypeSpecifies the source type of the bookmark.
Applies to
Bookmark, Chart Node Member, Crosstab Corner, Crosstab Fact Cells, Crosstab Intersection,
Crosstab Member Fact Cells, Crosstab Node Member, Crosstab Space, List Cell, List Column Body,
List Column Title
Spacing & BreakingSpecifies text properties such as line height, letter spacing, and word breaking.
Applies to
Block, Class, Conditional Block, Conditional Block, Context Item Text, Crosstab Columns, Crosstab
Columns, Crosstab Corner, Crosstab Fact Cells, Crosstab Intersection, Crosstab Member Fact
Cells, Crosstab Node Member, Crosstab Rows, Crosstab Rows, Crosstab Space, Hyperlink, List
Cell, List Column, List Column Body, List Columns, List Columns, List Columns Body Style, List
Columns Title Style, List Column Title, List Footer, List Header, List Row, List Row Cells Style,
Page Body, Page Break Text, Page Footer, Page Header, Repeater Table Cell, Table Cell, Table of
Contents, Table of Contents Entry, Text Item
Professional Authoring User Guide 649
Chapter 24: Report Studio Object and Property Reference
Spider EffectsSpecifies whether the chart is rendered with web-like flat concentric circles. The Radial Axis property
must be set to Show for this property to take effect.
Applies to
Polar Chart, Radar Chart
SQLThe text of the typed-in SQL. It is assumed to be appropriate for the type and data source. If it is
not the query may fail, or produce unexpected results.
Applies to
SQL
SQL Join SyntaxControls the syntax to generate for joins. Click Implicit to generate joins in the WHERE clause.
Click Explicit to generate INNER JOIN syntax. If unspecified, the value of the corresponding
governor in the model is used.
Applies to
Query
SQL SyntaxSpecifies the syntax of the SQL in the query. A value of Cognos SQL indicates that IBM Cognos
extended SQL-92 syntax is used. A value of Native SQL indicates that native database SQL is used.
You cannot use Cognos SQL if the Processing property for the query is set to Database Only; it
must have a value of Limited Local. A value of Pass-Through indicates that a standalone query text
syntax is used. The default value is Native SQL.
Applies to
SQL
Standard DeviationsSpecifies a distance from the mean in standard deviations. This value can be positive or negative.
A value of zero indicates the mean value.
Applies to
Baseline, Baseline, Baseline, Baseline, Marker, Marker
Static ChoicesRepresents a collection of static choices used by the prompt object.
650 Report Studio
Chapter 24: Report Studio Object and Property Reference
Applies to
Select & Search Prompt, Value Prompt
Style VariableSpecifies a variable based on which the object can be conditionally styled.
Applies to
3-D Combination Chart, 3-D Scatter Chart, Angular Axis, Angular Measure, Axis Title, Block,
Bubble Chart, Bubble Measure, Caption, Chart Body, Chart Footer, Chart Subtitle, Chart Text
Item, Chart Title, Combination Chart, Conditional Block, Conditional Block, Context Item Text,
Crosstab, Crosstab Columns, Crosstab Columns, Crosstab Corner, Crosstab Fact Cells, Crosstab
Intersection, Crosstab Member Fact Cells, Crosstab Node Member, Crosstab Rows, Crosstab Rows,
Crosstab Space, Cumulation Line Axis, Date & Time Prompt, Date Prompt, Default Measure,
Display Layer, Field Set, Gauge Chart, Gauge Labels, Gauge Numerical Axis, Hyperlink, Hyperlink
Button, Image, Interval Prompt, Legend, Legend Title, List, List Cell, List Column, List Column
Body, List Columns, List Columns, List Columns Body Style, List Columns Title Style, List Column
Title, List Footer, List Header, List Row, List Row Cells Style, Map, Marimekko Chart, Metrics
Range Chart, Note Content, Numerical Axis, Numerical Axis, Ordinal Axis, Page, Page Body, Page
Break Text, Page Footer, Page Header, Pareto Chart, Pie Chart, Pie Labels, Point Layer, Point
Measure, Point Size Measure, Polar Chart, Progressive Chart, Prompt Button, Radar Chart, Radial
Axis, Radial Measure, Region Layer, Region Measure, Repeater Table, Repeater Table Cell, Scatter
Chart, Select & Search Prompt, Table, Table Cell, Table of Contents, Table of Contents Entry,
Table Row, Target Measure, Text Box Prompt, Text Item, Time Prompt, Tolerance Measure, Tree
Prompt, Value Prompt, Win-Loss Chart, X Axis, X Axis, X Axis Measure, Y1 Axis, Y2 Axis, Y
Axis, Y Axis, Y Axis Measure, Z Axis, Z Axis, Z Axis Measure
SubtitleSpecifies whether a chart subtitle is rendered.
Applies to
3-D Combination Chart, 3-D Scatter Chart, Bubble Chart, Combination Chart, Gauge Chart, Map,
Marimekko Chart, Metrics Range Chart, Pareto Chart, Pie Chart, Polar Chart, Progressive Chart,
Radar Chart, Scatter Chart, Win-Loss Chart
SuppressFor SAP BW and DB2 OLAP data sources, specifies the type of suppression to apply to the query
results. This property overrides the corresponding governor in the model. If unspecified, the value
of the governor in the model is used.
Applies to
Query
Professional Authoring User Guide 651
Chapter 24: Report Studio Object and Property Reference
SuppressionSpecifies zero suppression options for the object.
Applies to
3-D Combination Chart, 3-D Scatter Chart, Bubble Chart, Combination Chart, Crosstab, Gauge
Chart, List, Map, Marimekko Chart, Metrics Range Chart, Pareto Chart, Pie Chart, Polar Chart,
Progressive Chart, Radar Chart, Repeater, Repeater Table, Scatter Chart, Win-Loss Chart
Table of ContentsSpecifies the name of the table of contents to which the entry belongs.
Applies to
Table of Contents Entry
Table of Contents NameSpecifies the name that uniquely identifies the table of contents.
Applies to
Table of Contents
Table PropertiesSpecifies the properties for the table object.
Applies to
Class, Crosstab, List, Repeater Table, Table
Target ColorSpecifies a color for the vertical lines that mark the target ranges for target measure values in a
metrics chart.
Applies to
Metrics Range Chart
Target MarkerSpecifies whether the status indicators will appear in the legend.
Applies to
Metrics Range Chart
Target Marker Border ColorSpecifies a color for the borders around target value markers in a metrics chart.
652 Report Studio
Chapter 24: Report Studio Object and Property Reference
Applies to
Metrics Range Chart
Target Marker PositionSpecifies whether the status indicators will be rendered over the first bar in the cluster or the middle
of the cluster. Does not apply to stacked charts.
Applies to
Metrics Range Chart
Target Range (%)Specifies target ranges centered around target measure values.
Applies to
Metrics Range Chart
TextSpecifies the static text to render.
Applies to
Chart Node Member, Chart Text Item, Crosstab Corner, Crosstab Fact Cells, Crosstab Intersection,
Crosstab Member Fact Cells, Crosstab Node Member, Crosstab Space, Cumulation Line Label,
Hyperlink, Hyperlink Button, List Cell, List Column Body, List Column Title, Text Item, Total
Column
Text Flow & JustificationSpecifies text flow properties, such as direction, writing mode, and justification.
Applies to
Block, Class, Conditional Block, Conditional Block, Context Item Text, Crosstab, Crosstab Columns,
Crosstab Columns, Crosstab Corner, Crosstab Fact Cells, Crosstab Intersection, Crosstab Member
Fact Cells, Crosstab Node Member, Crosstab Rows, Crosstab Rows, Crosstab Space, Hyperlink,
List, List Cell, List Column, List Column Body, List Columns, List Columns, List Columns Body
Style, List Columns Title Style, List Column Title, List Footer, List Header, List Row, List Row
Cells Style, Page, Page Body, Page Break Text, Page Footer, Page Header, Repeater Table, Repeater
Table Cell, Table, Table Cell, Table of Contents, Table of Contents Entry, Text Item
Text Source VariableSpecifies a variable based on which the text source can be chosen.
Professional Authoring User Guide 653
Chapter 24: Report Studio Object and Property Reference
Applies to
Chart Node Member, Chart Text Item, Crosstab Corner, Crosstab Fact Cells, Crosstab Intersection,
Crosstab Member Fact Cells, Crosstab Node Member, Crosstab Space, Cumulation Line Label,
Hyperlink, Hyperlink Button, List Cell, List Column Body, List Column Title, Text Item
TitleSpecifies whether a chart title is rendered.
Applies to
3-D Combination Chart, 3-D Scatter Chart, Bubble Chart, Combination Chart, Gauge Chart, Map,
Marimekko Chart, Metrics Range Chart, Pareto Chart, Pie Chart, Polar Chart, Progressive Chart,
Radar Chart, Scatter Chart, Win-Loss Chart
Tolerance ColorSpecifies a color for the vertical lines that mark the tolerance ranges for target measure values in a
metrics chart.
Applies to
Metrics Range Chart
Tolerance LabelSpecifies whether the label for the Target Tolerance will appear in the legend.
Applies to
Metrics Range Chart
TooltipsSpecifies whether tooltips are rendered in the chart. Tooltips are not supported in PDF documents.
Applies to
3-D Combination Chart, 3-D Scatter Chart, Bubble Chart, Combination Chart, Gauge Chart, Map,
Marimekko Chart, Metrics Range Chart, Pareto Chart, Pie Chart, Polar Chart, Progressive Chart,
Radar Chart, Scatter Chart, Win-Loss Chart
Top Position (px)Specifies the pixel position of the top edge of the legend measured from the bottom of the chart.
Applies to
Legend
Total ColumnSpecifies whether a total column is rendered.
654 Report Studio
Chapter 24: Report Studio Object and Property Reference
Applies to
Progressive Chart
Total Column ColorRepresents the color, gradient, or pattern of the total column on the progressive chart.
Applies to
Total Column
TruncationSpecifies whether labels can be truncated.
Applies to
Gauge Labels, Ordinal Axis, Pie Labels, X Axis, Y Axis
Truncation TextSpecifies the text to append when a label is truncated.
Applies to
Gauge Labels, Legend, Ordinal Axis, Pie Labels, X Axis, Y Axis
TypeSpecifies the type of variable.
Applies to
Variable
TypeSpecifies the behavior of the prompt button.
Applies to
Prompt Button
TypeSpecifies the type of object.
Applies to
Angular Measure, Baseline, Baseline, Baseline, Baseline, Bubble Measure, Calculated Measure,
Calculated Member, Chart Node Member, Chart Text Item, Crosstab Corner, Crosstab Fact Cells,
Crosstab Intersection, Crosstab Member Fact Cells, Crosstab Node Member, Cumulation Line
Label, Data Item, Default Measure, Explicit Member Set, Hierarchy Set, HTML Item, Image,
Intersection (Tuple), Level Set, List Cell, List Column Body, List Column Title, Map Location, Map
Professional Authoring User Guide 655
Chapter 24: Report Studio Object and Property Reference
Location, Map Refinement Location, Map Refinement Location, Marker, Measure, Member,
Member Children Set, Member Property, Named Set, Point Measure, Point Size Measure, Radial
Measure, Region Measure, Rich Text Item, Set Expression, Target Measure, Text Item, Tolerance
Measure, Total Column, Win-Loss Measure, X Axis Measure, Y Axis Measure, Z Axis Measure
Upper Range Skew (%)Specifies a percentage that affects the positioning of tolerance bar and range with respect to the
target value.
Applies to
Metrics Range Chart
URLSpecifies the URL, using static text.
Applies to
Chart Node Member, Crosstab Corner, Crosstab Fact Cells, Crosstab Intersection, Crosstab
Member Fact Cells, Crosstab Node Member, Crosstab Space, Hyperlink, Hyperlink Button, Image,
List Cell, List Column Body, List Column Title
URL Source VariableSpecifies a variable based on which the URL source can be chosen.
Applies to
Chart Node Member, Crosstab Corner, Crosstab Fact Cells, Crosstab Intersection, Crosstab
Member Fact Cells, Crosstab Node Member, Crosstab Space, Hyperlink, Hyperlink Button, Image,
List Cell, List Column Body, List Column Title
UsageSpecifies whether the usage of this object is Optional, Required, or Disabled. When Optional, this
condition applies if all parameters referenced by the expression are provided with values. If the
expression does not refer to any parameters, then this condition is always applied. When Disabled,
this condition is never applied, which is useful for authoring and testing purposes.
Applies to
Detail Filter, Summary Filter
Use 1.x BehaviorSpecifies that IBM Cognos ReportNet query semantics are used if they differ from IBM Cognos 8
query rules.
Applies to
Query
656 Report Studio
Chapter 24: Report Studio Object and Property Reference
Use Aggregate CacheFor SAP BW data sources, specifies whether to use the aggregation cache. We recommend that you
use the default value.
Applies to
Query
Use Detail Value on PageSpecifies whether to render a detail value or an aggregate value for a text item that uses a data item
as its source. Use this property only when you want to render the value that appears in the first or
last detail row of a list, repeater or repeater table on the same page as the text item.
Applies to
Text Item
Use for Parameter InfoSpecifies whether the query should be given priority when determining parameter information.
Queries with this property set to Yes are checked for parameter information first, followed by
queries with this property set to Default. Queries with this property set to No will not be checked
for parameter information unless it is referenced in a query that will be checked. Setting this property
to Yes on parameterized queries can improve performance in displaying prompt pages.
Applies to
Query
Use Local CacheSpecifies whether a query is a candidate for query reuse. If set to Yes, the query engine can reuse
an existing SQL result. If set to No, the query is executed rather than using cached results.
Applies to
Query
User SAP Member CacheSignals to the SAP BW provider whether the query associated with this property is cached to the
IBM Cognos 8 member cache. When set to Yes, the member cache is populated with the dimensions
in the query, encrypted, and saved for later use.
Applies to
Query
Professional Authoring User Guide 657
Chapter 24: Report Studio Object and Property Reference
Use Same Range For All InstancesSpecifies that all instances of the chart use the same maximum value. When set to No, the axis
maximum value is recalculated for each chart instance. It is only relevant if the chart is involved in
a master detail relationship.
Applies to
Angular Axis, Gauge Numerical Axis, Numerical Axis, Numerical Axis, Radial Axis, X Axis, Y1
Axis, Y2 Axis, Y Axis, Z Axis, Z Axis
Use SAP MUN as Business KeySpecifies whether to return the full SAP MUN as the value for the business key. Use this query hint
to allow a drill-down on a business key for a non-leaf member of an external hierarchy. When set
to Yes, the full MUN appears in the report output.
Applies to
Query
Use SQL ParametersSpecifies whether the generated SQL uses parameter markers or literal values. When set to Marker,
specifies that the generated SQL uses markers to denote that the value will be provided later. When
set to Literal, uses literal values in the generated SQL. If not specified, the server determines the
behavior.
Applies to
Query
Use SQL With ClauseSpecifies whether to send a request to the database using an SQL WITH clause. When set to Yes,
and if the database supports WITH clauses, a WITH clause request is generated. When set to No,
or if the database does not support WITH clauses, a request using derived tables is generated.
Applies to
Query
Use Thousands SeparatorSpecifies whether to delimit digit groups with the thousands separator.
Applies to
Text Box Prompt
Use ValueSpecifies the values used by the prompt object.
658 Report Studio
Chapter 24: Report Studio Object and Property Reference
Applies to
Tree Prompt
Use ValueSpecifies the values used by the prompt object. These values can be different than the ones that are
rendered to the user.
Applies to
Select & Search Prompt, Value Prompt
Value LocationSpecifies where values and labels are to be rendered in the chart.
Applies to
Area, Bar, Bubble Chart, Combination Chart, Cumulation Line, Line, Metrics Range Chart, Pareto
Chart, Polar Chart, Progressive Chart, Radar Chart, Scatter Chart
Value RepresentationSpecifies whether values are rendered as percentages.
Applies to
Pie Chart
ValuesSpecifies what values to show in the chart and whether to show the corresponding measure, series,
or category label.
Applies to
3-D Scatter Chart, Bubble Chart, Polar Chart, Scatter Chart
ValuesSpecifies whether values are rendered in the chart.
Applies to
3-D Area, 3-D Bar, 3-D Line, Area, Bar, Cumulation Line, Line, Marimekko Chart, Pareto Chart,
Point Layer, Progressive Chart, Radar Chart, Region Layer
ValuesSpecifies whether values are rendered.
Applies to
Pie Chart
Professional Authoring User Guide 659
Chapter 24: Report Studio Object and Property Reference
Value TypeSpecifies whether absolute values are rendered rather than cumulative values.
Applies to
Area, Bar, Line
Vertical AlignmentSpecifies how objects contained in this object are vertically aligned.
Applies to
Class, Crosstab Columns, Crosstab Columns, Crosstab Corner, Crosstab Fact Cells, Crosstab
Intersection, Crosstab Member Fact Cells, Crosstab Node Member, Crosstab Rows, Crosstab Rows,
Crosstab Space, List Cell, List Column, List Column Body, List Columns, List Columns, List
Columns Body Style, List Columns Title Style, List Column Title, List Footer, List Header, List
Row, List Row Cells Style, Page Body, Page Footer, Page Header, Repeater Table Cell, Table Cell,
Table Row
VisibleSpecifies whether to display the object. When set to No, the object is hidden but a fixed space is
reserved in the report.
Applies to
3-D Combination Chart, 3-D Scatter Chart, Angular Axis, Axis Title, Block, Bubble Chart, Chart
Footer, Chart Subtitle, Chart Title, Class, Combination Chart, Conditional Block, Conditional
Block, Context Item Text, Crosstab, Cumulation Line Axis, Date & Time Prompt, Date Prompt,
Field Set, Gauge Chart, Gauge Labels, Gauge Numerical Axis, Hyperlink, Image, Interval Prompt,
Legend, Legend Title, List, Map, Marimekko Chart, Metrics Range Chart, Note Content, Numerical
Axis, Numerical Axis, Ordinal Axis, Page Break Text, Pareto Chart, Pie Chart, Pie Labels, Polar
Chart, Progressive Chart, Radar Chart, Radial Axis, Repeater Table, Scatter Chart, Select & Search
Prompt, Table, Table of Contents, Table of Contents Entry, Text Box Prompt, Text Item, Time
Prompt, Tree Prompt, Value Prompt, Win-Loss Chart, X Axis, X Axis, Y1 Axis, Y2 Axis, Y Axis,
Y Axis, Z Axis, Z Axis
Visual AngleSpecifies the angle, in degrees, in which the chart objects will be displayed when the chart has 3-D
effects.
Applies to
Combination Chart, Marimekko Chart, Metrics Range Chart, Pareto Chart, Progressive Chart
White SpaceSpecifies how white space inside the object is handled.
660 Report Studio
Chapter 24: Report Studio Object and Property Reference
Applies to
Block, Class, Conditional Block, Conditional Block, Crosstab Columns, Crosstab Columns, Crosstab
Corner, Crosstab Fact Cells, Crosstab Intersection, Crosstab Member Fact Cells, Crosstab Node
Member, Crosstab Rows, Crosstab Rows, Crosstab Space, List Cell, List Column, List Column
Body, List Columns, List Columns, List Columns Body Style, List Columns Title Style, List Column
Title, List Footer, List Header, List Row, List Row Cells Style, Page Body, Page Footer, Page Header,
Repeater Table Cell, Table Cell, Table of Contents, Table of Contents Entry
Width (px)Specifies the width of the note, in pixels.
Applies to
Note
Win ColorSpecifies a color, color gradient, or pattern to apply to the win values.
Applies to
Win-Loss Chart
Win-Loss ThresholdSpecifies the win-loss value in a win-loss chart. It represents values that are ties, which are mapped
on the zero line.
Applies to
Win-Loss Chart
X AxisSpecifies whether the axis is rendered.
Applies to
3-D Combination Chart, Bubble Chart, Scatter Chart
Y1 AxisSpecifies whether the axis is rendered.
Applies to
Combination Chart, Metrics Range Chart
Y2 AxisSpecifies whether the axis is rendered.
Professional Authoring User Guide 661
Chapter 24: Report Studio Object and Property Reference
Applies to
Combination Chart
Y2 Axis PositionSpecifies how the second Y axis is rendered.
Applies to
Combination Chart
Y AxisSpecifies whether the axis is rendered.
Applies to
3-D Combination Chart, Bubble Chart, Marimekko Chart, Scatter Chart
Data Formatting PropertiesThe following is a list of properties available in the data formatting dialog.
"Not Applicable" CharactersSpecifies the characters to be displayed when the value to be formatted was not applicable. The
default value is two dashes (--). Note that the format will be applied only if the data source supports
this error condition.
Any Error CharactersSpecifies the characters to be displayed when the value to be formatted was not available because
of an error. This property is overridden by the more specific formatting error conditions, such as
Security Error Characters. The default value is two dashes (--). Note that the format will be applied
only if the data source supports this error condition.
Calendar TypeSpecifies the type of calendar to be displayed. The date values will be mapped to the selected calendar
before being formatted. The default value is inherited from the user's content language. Note that
the Japanese Imperial setting is only applicable for Japanese languages.
ClockSpecifies whether to display the time in 12-hour or 24-hour format. The default value is inherited
from the user's content language.
662 Report Studio
Chapter 24: Report Studio Object and Property Reference
CurrencySpecifies the currency to be used. The default currency symbol will be displayed unless the values
of the Currency Display and Currency Symbol properties are changed. The default value is inherited
from the model.
Currency DisplaySpecifies whether to display the international or local currency symbol. By default, the local currency
symbol is displayed.
Currency SymbolSpecifies a character or characters to use as the symbol to identify the local currency. This symbol
will precede the number and any sign, even if it is a leading sign. A space between the symbol and
the numeric value can be specified by entering it in this property, after the symbol. The default
value is inherited from the user's content language.
Currency Symbol PositionSpecifies where the currency symbol will appear. If End is selected, any spaces that follow the
character or characters in the Currency Symbol or International Currency Symbol properties will
be rendered between the number and the symbol. The default value is inherited from the user's
content language.
Date OrderingSpecifies the order in which to display the day, month, and year. The default value is inherited from
the user's content language.
Date SeparatorSpecifies the character to be displayed between the year, month, and day. The default value is
inherited from the user's content language.
Date StyleSpecifies the date style. The results rendered are determined by the language. Generally, Short uses
only numbers, Medium uses some abbreviated words, Long uses complete words, and Full includes
all available details.
Decimal SeparatorSpecifies the character that will separate non-decimal numbers from decimals. This property is
ignored if no decimals are displayed. The default value is inherited from the user's content language.
Display AM / PM SymbolsSpecifies whether to display the AM or PM symbols. The default value is inherited from the user's
content language.
Professional Authoring User Guide 663
Chapter 24: Report Studio Object and Property Reference
Display As ExponentSpecifies whether to render values in scientific notation, using exponents. If this property is set to
No, scientific notation will not be used. If this property is not specified, scientific notation will be
used only when values exceed the maximum number of digits. The default value is inherited from
the user's content language.
Display DaysSpecifies whether to display the day. The format of the day can be controlled by selecting one of
the specific formats. Selecting Julian means that the 3-digit day of the year will be displayed. The
default value is inherited from the user's content language.
Display ErasSpecifies whether to display the era. The default value is inherited from the user's content language.
Display HoursSpecifies whether to display the hours. The default value is inherited from the user's content language.
Display MillisecondsSpecifies whether to display the milliseconds. The format of the milliseconds can be controlled by
selecting one of the specific formats. This property is ignored if seconds are not displayed. The
default value is inherited from the user's content language.
Display MinutesSpecifies whether to display the minutes. The format of the minutes can be controlled by selecting
one of the specific formats. The default value is inherited from the user's content language.
Display MonthsSpecifies whether to display the month. The format of the month can be controlled by selecting one
of the specific formats. The default value is inherited from the user's content language.
Display MonthsSpecifies whether to display the month.
Display SecondsSpecifies whether to display the seconds. The format of the seconds can be controlled by selecting
one of the specific formats. The default value is inherited from the user's content language.
Display Time ZoneSpecifies whether to display the time zone. The default value is inherited from the user's content
language.
664 Report Studio
Chapter 24: Report Studio Object and Property Reference
Display WeekdaysSpecifies whether to display the weekday. The format of the weekday can be controlled by selecting
one of the specific formats. The default value is inherited from the user's content language.
Display YearsSpecifies whether to display the year. The first two digits of the year, which indicate the century,
can be controlled by selecting one of the associated property values. The default value is inherited
from the user's content language.
Display YearsSpecifies whether to display the year.
Divide By Zero CharactersSpecifies the characters to be displayed when a numeric value is the result of a division by zero. The
default value is /0. Note that the format will be applied only if the data source supports this error
condition.
Exponent SymbolSpecifies the character to be displayed to identify exponents if the scientific notation is used. The
symbol will be rendered after the number, separated by a space. The default value is inherited from
the user's content language.
Group Size (digits)Specifies the primary grouping size. If a value is specified it represents the number of digits to the
left of the decimal point to be grouped together and separated by the thousands separator. The
default value is inherited from the user's content language.
International Currency SymbolSpecifies a character or characters to use as a symbol to identify the international currency. This
symbol will replace the currency symbol. A space between the symbol and the numeric value can
be specified by entering it in this property, after the symbol. The default value is inherited from the
user's content language.
Mantissa (digits)Specifies the number of digits to be displayed following the exponent symbol if the scientific notation
is used.
Maximum No. of DigitsSpecifies the maximum number of digits that can be displayed. If the maximum number of digits
is not sufficient to display the value, a scientific notation will be used. The default value is inherited
from the user's content language.
Professional Authoring User Guide 665
Chapter 24: Report Studio Object and Property Reference
Minimum No. of DigitsSpecifies the minimum number of digits that can be displayed. If the minimum number of digits is
too high to display a value, the padding character will be used. The default value is inherited from
the user's content language.
Missing Value CharactersSpecifies the character or characters to be displayed when the value is missing. If no value is entered
for this property, an empty string will be displayed.
Negative PatternSpecifies a presentation format, based on patterns, for negative numbers. Some restrictions exist.
The numerical part of the negative pattern is ignored. Only the suffix and the prefix are used. For
example, in the pattern ABC#,##0.#EFG, ABC is the prefix, EFG is the suffix and #,##0.# is the
numerical part of the pattern.
Negative Sign PositionSpecifies where the negative sign will appear. The default value is inherited from the user's content
language.
Negative Sign SymbolSpecifies how to display negative numbers. The default value is inherited from the user's content
language.
No. of Decimal PlacesSpecifies the number of digits to be displayed to the right of the decimal point. If this property is
not set, the number of decimal places will vary depending on the number rendered.
Numeric Overflow CharactersSpecifies the characters to be displayed when a numeric value is the result of a numeric overflow.
The default value is two dashes (--). Note that the format will be applied only if the data source
supports this error condition.
Padding CharacterSpecifies the character that will be used to pad values that have fewer digits than the minimum
number of digits. The default value is inherited from the user's content language.
PatternSpecifies a presentation format that is based on patterns.
666 Report Studio
Chapter 24: Report Studio Object and Property Reference
Percentage SymbolSpecifies whether to display the values per hundred (percent) or per thousand. The symbol will be
appended to the number and any trailing sign. A space between the numeric value and the symbol
can be specified by entering it in this property, after the symbol. The default value is inherited from
the user's content language.
Percent Scale (integer)Scale to be applied to value after formatting. If omitted, no percent scale will be applied and the
value will formatted according the normal decimal positioning associated with the percent (or per
mille) symbol.
ScaleSpecifies how many digits to move the decimal delimiter for formatting purposes. For example,
move the decimal three spaces to present values in thousands. The default value is inherited from
the database field.
Secondary Group Size (digits)Specifies the secondary grouping size. If a value is specified it represents the number of digits to the
left of the primary group that will be grouped together and separated by the thousands separator.
If this property is left blank, the secondary grouping of digits is the same number as the primary
group size, as specified by the Group Size (digits) property. The default value is inherited from the
user's content language.
Security Error CharactersSpecifies the characters to be displayed when the value to be formatted was not available for
security reasons. The default value is #!Security. Note that the format will be applied only if the
data source supports this error condition.
Thousands SeparatorSpecifies how to delimit digit groups, such as thousands. This property is only used if the Use
Thousands Separator property is set to Yes. The default value is inherited from the user's content
language.
Time SeparatorSpecifies the character to be displayed between the hour, minute, and second. The default value is
inherited from the user's content language.
Time StyleSpecifies the time style to be displayed. The exact results that will be rendered are determined by
the language. Generally, Short means that the minimum details will be displayed, Long adds seconds,
and Full means that all details are displayed, including the time zone. The default value is inherited
from the user's content language.
Professional Authoring User Guide 667
Chapter 24: Report Studio Object and Property Reference
Time UnitSpecifies the unit of measure of the value. This property will be ignored if any day or time compon-
ents are shown. The default value is inherited from the user's content language.
Use Thousands SeparatorSpecifies whether the grouping delimiter will be applied as defined by the Group Size property. The
default value is inherited from the user's content language.
Zero Value CharactersSpecifies the character or characters to be displayed when the value is zero (0). If no value is entered
for this property, the Maximum No. of Digits property determines how many zero digits are dis-
played.
668 Report Studio
Chapter 24: Report Studio Object and Property Reference
Appendix A: Troubleshooting
This chapter describes some common problems you may encounter. For more troubleshooting
problems, see the Troubleshooting section of the Administration & Security Guide.
Problems Creating ReportsThe topics in this section document problems you may encounter when creating reports.
Division by Zero Operation Appears Differently in Lists and CrosstabsIf you have a list that accesses a relational data source, a calculation containing a division by zero
operation appears as a null value, such as an empty cell. In a crosstab, the division by zero operation
appears as /0. This happens when the Avoid Division by Zero property is set to Yes, which is the
default.
To have a consistent display of null values in lists and crosstabs, define an if-then-else statement in
the expression in the crosstab cell that changes the value /0 to the value null.
Application Error Appears When Upgrading a ReportWhen upgrading a report, the following error appears if the report contains data items in the page
layout that are not in a data container:
RSV-SRV-0040 An application error has occurred. Please contact your Administrator.
This error occurs when IBM Cognos 8 cannot determine the query reference for a data item. Such
data items are identified by a small red circle with a white x icon that appears in the lower left
corner.
To correct the error, drag the data items into a container. If the container is a list, we recommend
that you drag the data items into the list page header or footer, or the overall header or footer. If
you want to see the first row of the item on each page or in the overall report, drag the item to the
list page header or overall header. If you want to see the item’s last row on each page or in the
overall report, drag the item to the list page footer or overall footer. Tip: If a header or footer does
not exist, create it.
Nested List Report Containing a Data Item That is GroupedMore Than Once DoesNot Run After Upgrade
When you upgrade a nested list report that contains a data item that is grouped in both lists, the
report does not run and an error such as the following appears:
OP-ERR-0199: The query is not supported. The dimensions on the edge are inconsistent. The
dataItems from dimension="[Product line]" must be adjacent.
This error occurs when the report is run against a dimensional data source and both lists are using
the same query. This error does not occur if the report is run against a relational data source.
Professional Authoring User Guide 669
For example, you have a list that contains the grouped items Product line and Product type and a
nested list that contains the data items Year, Quarter, and Unit sale price. Year, Quarter, and
Product line are grouped items in the nested list.
To resolve the issue, delete the data item that is grouped in both lists from the inner list.
Steps to Delete a Grouped Data Item From an Inner List
1. Click anywhere in the report.
2. In the Properties pane, click the select ancestor button and click the List link that represents
the inner list.
3. Double-click the Grouping & Sorting property.
4. In the Groups pane, select the data item that you want and click the delete button.
Background Color in Template Does not AppearWhen creating a Query Studio template in Report Studio, if you add a list object and change its
background color, the color change does not appear when you apply the template to a Query Studio
report.
To work around this issue, do one of the following:
● Edit the style sheet (CSS) classes for lists in Report Studio.
● Do not add any objects to the page body when you are creating a Query Studio template.
● Leave the page body blank.
Subtotals in Grouped ListsWhen using a PowerCube that contains a ragged hierarchy, if you group on the first level in the
hierarchy, subtotals may appear in the wrong place or show wrong values.
To resolve the issue, group on the second level.
Chart Labels Overwrite One AnotherIn Report Studio and Query Studio, if you define a chart and render it in HTML or PDF format
using the default sizes, the axis labels of the chart may overwrite each other.
To avoid this problem, make the chart wider or taller by modifying the height and width properties
of the chart or enable the Allow Skip property.
Chart Shows Only Every Second LabelYou create a report that includes a chart. The Allow Skip option is set to false, but when you run
the report, labels are skipped.
This can occur if there is not enough room for all labels and the options Allow 45 Degree Rotation,
Allow 90 Degree Rotation, and Allow Stagger are also set to false. IBM Cognos 8 has no options
for making the labels fit, so it skips every second label.
670 Report Studio
Appendix A: Troubleshooting
The solution is to select either Allow 45 Degree Rotation, Allow 90 Degree Rotation, or Allow
Stagger.444936
Chart Gradient Backgrounds Appear GrayIn Report Studio, you can define a custom palette for a chart that includes a gradient. When the
chart is rendered in HTML format, the chart background appears gray. This is a Microsoft Web
browser issue.
To avoid this problem, select the chart and define the color white as the chart background.
For more information, see the Microsoft Knowledge Base article at http://support.microsoft.com/
kb/294714.
Metadata Change in Essbase Not Reflected in Reports and in the StudiosWhen there is a metadata change on the Essbase server, the change is not immediately reflected in
the metadata tree in the studios. In addition, when a report is run, the report does not pick up the
republished changes.
To view the new structure, you must restart the Content Manager server.545114
Relationships Not Maintained in a Report With Overlapping Set LevelsIn a report, the relationship between nested or parallel sets at overlapping levels in the same
dimension may not always be maintained.
For example, a named set in the data source that contains members from both a Year and Month
member is nested under Year, but is not properly grouped by year.
In another example, an error message such as this appears: "OP-ERR-0201 Values cannot be
computed correctly in the presence of multiple hierarchies ([Product].[B1], [Product].[Product])
that each have a level based on the same attribute (Product)."
This problem occurs in the following scenarios involving non-measure data items X and Y, that
overlap in the same dimension:
● X and Y together as ungrouped report details
● Y nested under X
● Y appended as an attribute of a group based on X
When using named sets, or sets that cover more than one level of a hierarchy, do not use sets from
the same dimension in more than one place in the same report. They should appear on only one
level of one edge.567492
Professional Authoring User Guide 671
Appendix A: Troubleshooting
Count Summaries in Query Calculations Include Nulls with SAP BWData SourcesWhen using an SAP BW data source in Report Studio, null values in the database are returned in
the result set and the Count summary function includes the empty cells in the following scenarios:
● A query calculation includes an arithmetic calculation where one or more NULL operands and
an aggregation is performed on the calculation.
● The result of a query calculation is a constant, such as current_time() and current_date().
The Count summary function should normally exclude NULL values.
To avoid this problem, for the first scenario, ensure that both operands do not return null values.
For example, the original expression is [num1]+[num2]. Instead, use the following expression:
if([num1] is null) then ( 0 ) else ([num1])
if([num2] is null) then ( 0 ) else ([num2])
There is no workaround for the second scenario.564890, 570900, 568001
Creating Sections on Reports That Access SAP BW Data SourcesSAP BW data sources may have problems with sections in reports under different circumstances:
If a section in a report uses the lowest-level query item in a ragged hierarchy, such as the children
of the "not assigned" node, the following BAPI error may appear:
BAPI error occurred in function module BAPI_MDDATASET_SELECT_DATA. Value <valueName>
for characteristic <cubeName> unknown
For more information about working with ragged or unbalanced hierarchies, see the Report Studio
Professional Authoring User Guide.
If you create a section in a report using conformed multicubes with SAP variables, an SAP error
message may appear.
Lowest-level Query Item in a Ragged Hierarchy
The solution is to remove the section from the lowest-level query item.443696
Several Multicubes with SAP Variables
The solution is to use one multicube when creating sections in reports.437613
Saving a Report Takes a Long TimeWhen you save a report, the Save As dialog box appears with a Loading message. The report will
not be saved until it has finished loading, and this can take a long time.
This issue will be resolved in the next version of IBM Cognos 8.593393
672 Report Studio
Appendix A: Troubleshooting
Error Characters (--) Appear in ReportsWhen you run a report, you see two dash (--) characters in your report instead of values.
These characters may appear if you use an OLAP data sources other than PowerCube and Microsoft
SQL Server 2005 Analysis Services (SSAS), and you apply aggregation to calculations and measures
that use rollups other than Sum (Total), Maximum, Minimum, First, Last, and Count.
All other types of rollup either fail or return error cells, which typically display as two dash characters
(--).
This problem occurs in, but is not limited to, the following:
● footers
● aggregate function
● summary filters and detail filters that use a summary
● detail, summary, and context filters that select more than one member of a hierarchy that is
used elsewhere on the report
If you are working with a SSAS 2005 data source, these characters may also appear in summary
cells if you use an OR filter in the summary. To avoid this problem, do not use OR filters in sum-
maries.595858
Columns, Rows, or Data Disappear With SSAS 2005 CubesMicrosoft SQL Server 2005 Analysis Services (SSAS) has a feature called AutoExists that removes
tuples that have no facts at the intersection of two hierarchies of the same dimension.
Columns, rows, or data can disappear if you set the default member of a hierarchy to a member
that does not exist with every other member in the dimension. To avoid this problem, change the
default member that caused the disappearance to a member that exists with all other members in
the dimension.
Columns, rows, or data can also disappear if members are specified that result in one or more non-
existent tuples. There is currently no workaround for this scenario. For more information, see the
Microsoft Knowledge Base article at http://support.microsoft.com/kb/944527.567839, 569506
You may also encounter unexpected results if the default member of a hierarchy is a member that
doesn't also exist in all other hierarchies in the dimension, and if you query members from different
hierarchies in the same dimension.
For example a Report Studio crosstab includes the following (using the Adventure Works cube):
● Rows: Generate([Adventure_Works].[Account].[Accounts],set([Balance Sheet],[Units])) nested
with
children([Adventure_Works].[Department].[Departments]->:[YK].[[Department]].[Departments]].
&[1]]])
● Column: [Adventure_Works].[Account].[Account Number].[Account Number]
Professional Authoring User Guide 673
Appendix A: Troubleshooting
● Measure: [Adventure_Works].[Measures].[Amount]
You run the report and notice that the query renders with some blanks cells. You then apply the
simple detail filter [Amount]>1 and run the report. Only row labels are displayed and all data and
columns are missing.
In the Adventure Works cube, the [Account].[Accounts] attribute has a default member set to [Net
Income]. When evaluating the GENERATE set expression, SSAS looks in the entire cube space and
looks at all coordinates for the [Account] dimension. These coordinates include both
[Account][Account Type].&[] and [Account].[Accounts].[Net Income]. Because these two
coordinates don't exist within the same hierarchy, SSAS returns an empty set.
To avoid this problem the SSAS administrator must set the default member in the cube to a member
that exists in all other hierarchies.567839, 569506 565153
Descendants Function Unreliable with SetsIf you create an expression that uses the descendants function with sets, you may encounter
unpredictable results. Some expected members may be missing or may have blank captions or labels.
This problem occurs if the descendants function uses a set as its first parameter instead of a single
member and if the descendants function is nested under another data item from the same hierarchy.
To avoid this problem, replace the first parameter in the descendants function with the function
currentmember(H), where H is the hierarchy of the desired set and under which the expression is
nested. For example, use descendants(currentmember(H).
564561
Report Differences Between TM1 Executive Viewer and IBM Cognos 8 with TM1Data Sources
When using a TM1 data source, comparable reports created in an IBM Cognos 8 studio and in
TM1 Executive Viewer may contain different cell values. This occurs because the TM1 Executive
Viewer product uses an algorithm for selecting default members for non-projected dimensions that
differs slightly from traditional OLAP clients.
To avoid this problem, when filtering your reports in the IBM Cognos studios, use context filters
that match the default selections shown in the Executive Viewer user interface. This ensures that
the cell values in IBM Cognos 8 match the values in Executive Viewer.592662
Order of Metadata Tree Differs for TM1 Data SourcesWhen using a TM1 data source, the order of members in the metadata tree of the Insertable Objectspane of an IBM Cognos 8 studio may differ from the order shown in TM1 Architect.
By default, TM1 Architect renders members of hierarchies using a slightly different algorithm than
does IBM Cognos 8. IBM Cognos 8 automatically renders member metadata from TM1 data sources
in hierarchical order.
674 Report Studio
Appendix A: Troubleshooting
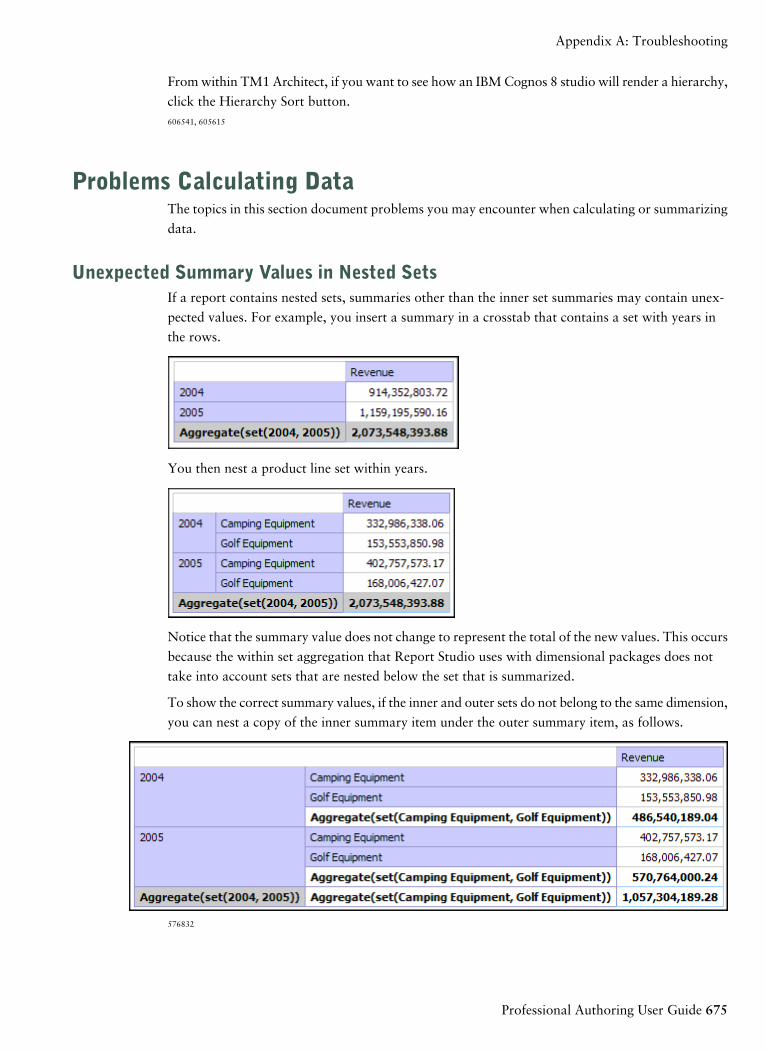
From within TM1 Architect, if you want to see how an IBM Cognos 8 studio will render a hierarchy,
click the Hierarchy Sort button.606541, 605615
Problems Calculating DataThe topics in this section document problems you may encounter when calculating or summarizing
data.
Unexpected Summary Values in Nested SetsIf a report contains nested sets, summaries other than the inner set summaries may contain unex-
pected values. For example, you insert a summary in a crosstab that contains a set with years in
the rows.
You then nest a product line set within years.
Notice that the summary value does not change to represent the total of the new values. This occurs
because the within set aggregation that Report Studio uses with dimensional packages does not
take into account sets that are nested below the set that is summarized.
To show the correct summary values, if the inner and outer sets do not belong to the same dimension,
you can nest a copy of the inner summary item under the outer summary item, as follows.
576832
Professional Authoring User Guide 675
Appendix A: Troubleshooting
Incorrect Results with IBM Cognos PowerCubes and Time MeasuresIf a report uses an IBM Cognos PowerCube data source and the following combination of data
items, you will encounter incorrect results:
● a measure with a Time State Rollup set to Average or Weighted Average
● an aggregate( members from time dimension ) expression
● an intersection with a member in a relative time hierarchy
To avoid incorrect results, do not use this combination in your reports.592225
Problems Filtering DataYou can use filters to specify the subset of records that the report retrieves. Any data that does not
meet the filter criteria is eliminated from the report.
The topics in this section document problems you may encounter when using filters in reports.
In general, when creating filters, select functions that are available from the Vendor Specific list.
You must use Tabular SQL for other functions.
Tip: If combining internal functions and vendor functions, set processing to Limited Local.
HRESULT= DB_E_CANTCONVERTVALUE Error When Filtering on a_make_timestamp Column
You cannot filter on a _make_timestamp column, and the following error messages appear:
UDA-SQL-0114 The cursor supplied to the operation "sqlOpenResult" is inactive
UDA-SQL-0206 TheOLEDB driver returned the following value: HRESULT=DB_E_CANTCON-
VERTVALUE "
RSV-SRV-0025 Unable to execute this request
The solution is to apply the filter after aggregation and not before.
Problems Running ReportsThe topics in this section document problems you may encounter when viewing or running reports.
Summaries in Report Do not Correspond to the Visible MembersIf a crosstab or chart created in Report Studio using a dimensional data source has a context-
dependent set function such as filter or topCount on an edge, summaries do not correspond to
the visible members. This occurs when the summaries use the within set aggregation mode.
This problem occurs because a summary that uses the within set aggregation mode uses a set
that is dependent on the members that it intersects with on the opposite edge. For example, the
following crosstab has as columns the top three products returned. The expression used to generate
the columns is
676 Report Studio
Appendix A: Troubleshooting
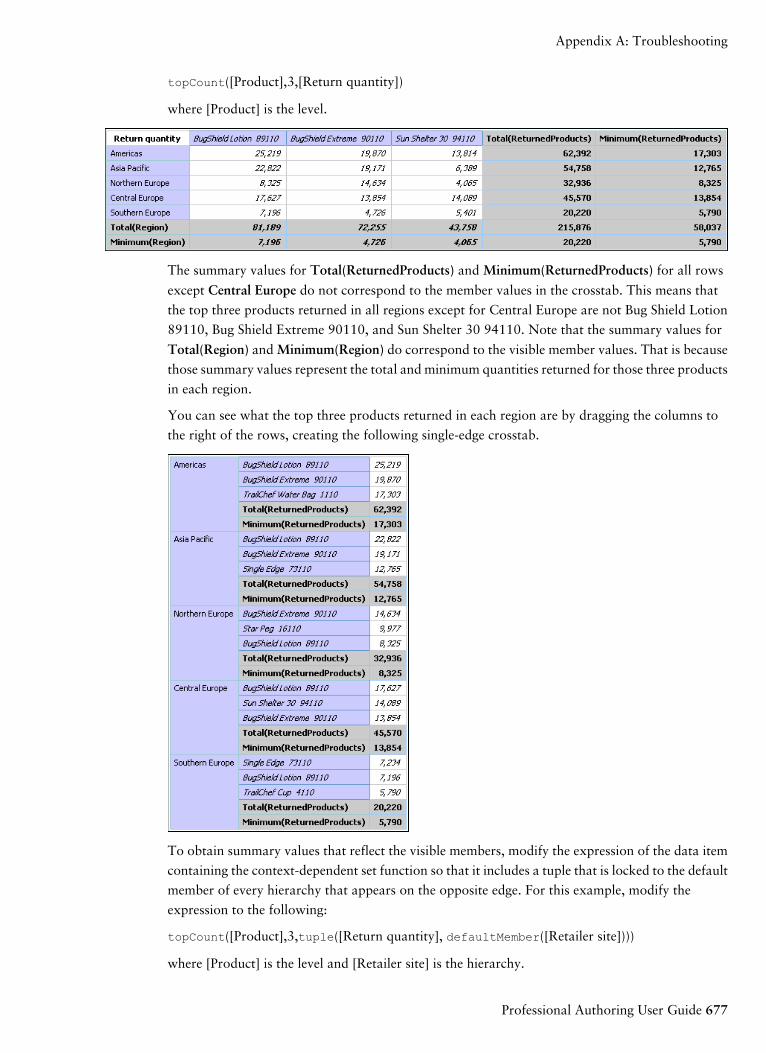
topCount([Product],3,[Return quantity])
where [Product] is the level.
The summary values for Total(ReturnedProducts) and Minimum(ReturnedProducts) for all rows
except Central Europe do not correspond to the member values in the crosstab. This means that
the top three products returned in all regions except for Central Europe are not Bug Shield Lotion
89110, Bug Shield Extreme 90110, and Sun Shelter 30 94110. Note that the summary values for
Total(Region) and Minimum(Region) do correspond to the visible member values. That is because
those summary values represent the total and minimum quantities returned for those three products
in each region.
You can see what the top three products returned in each region are by dragging the columns to
the right of the rows, creating the following single-edge crosstab.
To obtain summary values that reflect the visible members, modify the expression of the data item
containing the context-dependent set function so that it includes a tuple that is locked to the default
member of every hierarchy that appears on the opposite edge. For this example, modify the
expression to the following:
topCount([Product],3,tuple([Return quantity], defaultMember([Retailer site])))
where [Product] is the level and [Retailer site] is the hierarchy.
Professional Authoring User Guide 677
Appendix A: Troubleshooting
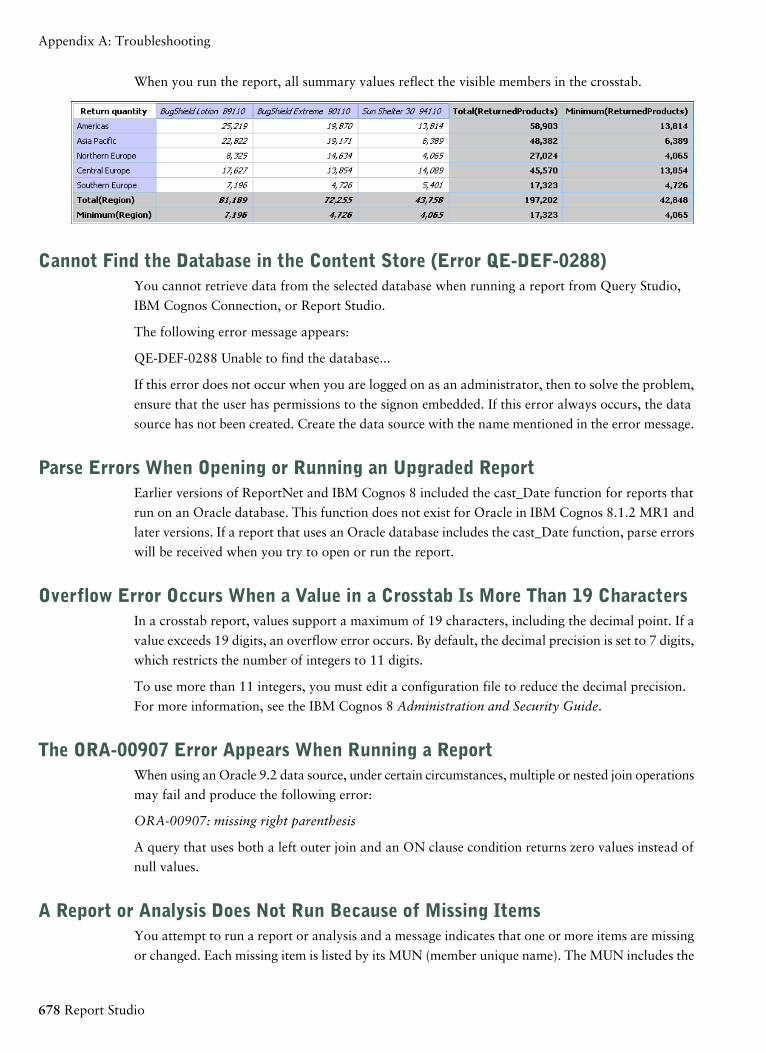
When you run the report, all summary values reflect the visible members in the crosstab.
Cannot Find the Database in the Content Store (Error QE-DEF-0288)You cannot retrieve data from the selected database when running a report from Query Studio,
IBM Cognos Connection, or Report Studio.
The following error message appears:
QE-DEF-0288 Unable to find the database...
If this error does not occur when you are logged on as an administrator, then to solve the problem,
ensure that the user has permissions to the signon embedded. If this error always occurs, the data
source has not been created. Create the data source with the name mentioned in the error message.
Parse Errors When Opening or Running an Upgraded ReportEarlier versions of ReportNet and IBM Cognos 8 included the cast_Date function for reports that
run on an Oracle database. This function does not exist for Oracle in IBM Cognos 8.1.2 MR1 and
later versions. If a report that uses an Oracle database includes the cast_Date function, parse errors
will be received when you try to open or run the report.
Overflow Error Occurs When a Value in a Crosstab Is More Than 19 CharactersIn a crosstab report, values support a maximum of 19 characters, including the decimal point. If a
value exceeds 19 digits, an overflow error occurs. By default, the decimal precision is set to 7 digits,
which restricts the number of integers to 11 digits.
To use more than 11 integers, you must edit a configuration file to reduce the decimal precision.
For more information, see the IBM Cognos 8 Administration and Security Guide.
The ORA-00907 Error Appears When Running a ReportWhen using an Oracle 9.2 data source, under certain circumstances, multiple or nested join operations
may fail and produce the following error:
ORA-00907: missing right parenthesis
A query that uses both a left outer join and an ON clause condition returns zero values instead of
null values.
A Report or Analysis Does Not Run Because of Missing ItemsYou attempt to run a report or analysis and a message indicates that one or more items are missing
or changed. Each missing item is listed by its MUN (member unique name). The MUN includes the
678 Report Studio
Appendix A: Troubleshooting
complete path within the hierarchy for the item. When you place your cursor on an item in the
Insertable Objects pane, the MUN for that item is displayed in a tooltip. This situation may occur
if members have been removed from or changed in the data source. It may also occur when you
attempt to run a report that uses items to which you do not have access. For example, an adminis-
trator may create an analysis that includes items that you don't have the correct permission to
access.
The solution is to find a suitable replacement in the Insertable Objects pane, and drag it to the New
Item column. The report or analysis will then run.
Cannot View Burst ReportWhen you burst a report, each burst output is sent to the associated list of recipients. If a list of
recipients contains invalid entries, the following occurs:
● The burst output is not saved to Content Manager.
Consequently, you cannot view the burst output in IBM Cognos Connection.
● If you choose to send the output by email, only valid recipients will receive an email. Although
the output is sent as an attachment if you select the Attach the report check box, no link is
generated if you select the Include a link to the report check box.
● The following error message appears in the run history for the report, where parameter 1 is
the burst key, parameter 2 is the list of recipients, and parameter 3 contains the error messages
returned by Content Manager:
An error occurred while saving the output for the burst instance <param type="string"
index="1"/> with the recipients (<param type="string" index="2"/>). Here are the details:
<param type="string" index="3"/>
Note: The list of recipients includes both the valid and invalid recipients.
For example, a report is set up to burst on Country, and the recipients are managers. Running the
report produces the following countries and recipients:
● Canada: John, Mary
● US: Peter, Frank
● France: Danielle, Maryse
Frank is an invalid recipient. The burst outputs for Canada and France are saved to Content Man-
ager, but not the U.S. output. If you choose to send an email to each recipient and you selected the
Include a link to the report check box, the email to Peter will not contain a link to the output for
US. The error message that is generated will contain Peter and Frank as values for parameter 2 with
no indication as to which is invalid.
Steps to Correct or Remove Burst Recipients
1. View the error message in the run history for the report.
2. From the list of recipients, determine which recipients are invalid.
You may need to consult with your administrator to find out which recipients are invalid.
Professional Authoring User Guide 679
Appendix A: Troubleshooting
3. Correct or remove the invalid recipients.
Correcting or removing invalid recipients will depend on how the list of recipients was defined,
such as through a calculated field or a burst table.
4. Run the report again.
A Report Upgraded from ReportNet Does Not Retain its Original LookWhen you upgrade a report to IBM Cognos 8, a new style sheet is applied that changes the look
of the report.
To preserve the formatting that was used in the original report, you can select a different style sheet.
This retains the original look of the report and specifies that any new items added to the report,
such as list columns or crosstab levels, have the original formatting applied to them.
Steps
1. In Report Studio, from the File menu, click Report Properties.
2. Click Report styles and select 1.x styles.
Drill-through Links Not Active in the Safari BrowserWhen viewing a PDF report in the Macintosh Safari browser, you cannot open hyperlinks. This is
because the Macintosh Safari browser does not have the necessary Adobe Acrobat plug-in.
To avoid this problem, use the HTML format when creating drill-through reports that may be
viewed in Safari.
A Running Total in Grouped Reports Gives Unexpected ResultsYou have a running total calculation in a grouped report that returns unexpected values.
Because tabulation of the running total calculation depends on the order in which the grouping is
executed, you must ensure that the grouped totals are tabulated before applying the running total.
To ensure that the grouping is executed in correct order, define a running total calculation as a
freestanding calculation outside the query subject in Framework Manager, and ensure that the
Regular Aggregate property is set to Automatic.
This may also be an issue with other running, moving, and ranking aggregations.
PCA-ERR-0057 Recursive Evaluation ErrorYou run a report and encounter the following error:
PCA-ERR-0057 Recursive evaluation has exceeded limit. Calculated member trace: COG_OQP_
USR_Aggregate(Retailer Type): COG_OQP_INT_m2: COG_OQP_INT_m1: COG_OQP_USR_
Aggregate(Retailer Type): COG_OQP_INT_m2: COG_OQP_INT_m1: COG_OQP_USR_Aggregate
(Retailer Type): COG_OQP_INT_m2: COG_OQP_INT_m1: COG_OQP_USR_Aggregate(Retailer
Type): COG_OQP_INT_m2: COG_OQP_INT_m1
680 Report Studio
Appendix A: Troubleshooting
You may encounter this error when two or more data items form a recursive evaluation. For example,
in the above error, the calculation of Aggregate(Retailer Type) is dependent on a column expression
while at the same time the column expression is dependent on Aggregate(Retailer Type). Therefore,
the cyclic relationship cannot be resolved.
To avoid this problem, ensure that calculations do not have cyclic relationships.585236
Arithmetic Overflow Error When Running a Report in PDF FormatIf you use a Microsoft SQLServer 2005 data source and your report includes aggregations, you
may encounter the following error when you run your report in PDF format:
RQP-DEF-0177 An error occurred while performing operation 'sqlOpenResult' status='-28'. UDA-
SQL-0114 The cursor supplied to the operation "sqlOpenResult" is inactive. UDA-SQL-0564
[Microsoft OLE DB Provider for SQL Server] Arithmetic overflow error converting expression to
data type int. (SQLSTATE=22003, SQLERRORCODE=8115)
This error occurs because the action is performed in the database, and the database data type is too
small.
This error did not occur in IBM Cognos 8 version 8.3 or earlier because aggregation was processed
locally, by the BI server. In version 8.4 or later, aggregation is processed at the database level.
To avoid this problem, increase the size of the the database data type.587166
Problems When Drilling ThroughThe topics in this section document problems you may encounter when drilling through reports.
Cannot Drill Between PowerCubes Because MUNs Do Not MatchAn IBM Cognos PowerCube has category codes and source values that are different. Its source
values are conformed with another PowerCube however the category codes in both PowerCubes
are different. You cannot drill between shared dimensions in these PowerCubes because their
Member Unique Names (MUN) do not match. The source value for a PowerCube member is used
as the member business key in IBM Cognos 8. If the source value business key is conformed between
PowerCubes, you can pass the business key in a calculation to drill through between two cubes
where the MUN does not match.
This technique works only if the business keys are unique. If the business keys are not unique, then
the result may be unexpected. For example, drilling through from London, England in the source
may produce a drill-through report that contains both London, England and London, Ontario.
If drilling through was not enabled at build time, the source cube will pass the category code instead
of the source value.
To pass the business key to the target, do the following:
● Create the target report parameter by typing:
roleValue('_businessKey',[member])=?prompt?
Professional Authoring User Guide 681
Appendix A: Troubleshooting
When you drill through, the business key is passed.
For more information about drill-through access, see the IBM Cognos 8 Administration and
Security Guide.
Unexpected or Empty Results When Drilling ThroughWhen you drill from a source report to a drill-through target, sometimes no value is found. If there
is no data that corresponds to the drill-through selections, or if you do not have permission to view
the data, this may be the correct result. In other cases, or if the wrong data item appears, it may be
that the source item is not correctly mapped to the target.
If you have the necessary permissions, you can debug drill-through definitions by using the drill-
through assistant from the Goto page. (Right-click the selection in the source report, and select Go
To.) You can view the passed source information, and the mapping to the target report or object.
You use this tool for both authored and package drill-through definitions.
You may be able to correct the problem by modifying the parameter mapping in the drill-through
definition. For example, when you drill from a cube to a relational data source, sometimes no value
is found, or the wrong data item appears, because the business key values in the two data sources
do not match. You can change the drill-through definition to pass the caption of the PowerCube
member instead of the business key.
Step to Pass the Caption from a PowerCube to a Relational Source
● Edit the drill-through definition as follows:
● If the drill-through definition was created in Report Studio (Professional authoring mode),
open the report, and go to the drill-through definition associated with the drill-through
source object. On the parameter mapping page, select Member Caption in the Property to
pass column.
● If the drill-through definition was created in the source package, go to IBM Cognos Con-
nection, Drill-Through Definitions, and open the package drill-through definition. On the
Target tab of the drill-through definition, select Member Caption in the Property to passcolumn for the appropriate parameter.
When you drill through, instead of the business key, the caption is passed to the target.
For more information about drill-through access, see the IBM Cognos 8 Administration and
Security Guide.
Cannot Drill From a Relational Source to a CubeYou cannot drill through from a relational data source to a cube. This is because a cube expects a
Member Unique Name (MUN) as a parameter value and relational sources do not use MUNs.
Members have several properties such as a business key and a caption. If either of these match data
items within the relational source, drilling through can be performed as long as the cube target
report is authored in Report Studio.
682 Report Studio
Appendix A: Troubleshooting
If the source data source has a query item, for example display name, that corresponds to a member
property in the target cube, for example caption, you must create the parameter on the caption in
the target report.
To pass the data item to the cube target, do the following:
● In the cube target report, create a parameter that accepts the caption of the member. Type the
following
caption([member])=?prompt?
When you drill through, the selected value is passed to the target.
For more information about drill-through access, see the IBM Cognos 8 Administration and
Security Guide.
Professional Authoring User Guide 683
Appendix A: Troubleshooting

684 Report Studio
Appendix A: Troubleshooting
Glossary
attribute
In relational models, a query item that is not a measure or identifier. When a query item is an
attribute, it is not intended to be aggregated, or used for grouping or generating prompt pick lists.
In dimensional models, attributes provide qualitative information about members of a level in a
dimension. For example, the Store level within the Retailer dimension might have properties such
as "address" or "retail space." In general, dimensional attributes do not have measure values or
rollups associated with them, but are used to locate or filter members.
burst
To create many report results by running a single report once. For example, you can create a report
that shows sales for each employee, and run it once, sending different results to regional managers
by bursting on region. You set up bursting in Report Studio and enable it in the portal.
calculated member
A member of a dimension whose measure values are not stored but are calculated at run time using
an expression.
cardinality
For OLAP data sources, cardinality is the number of members in a hierarchy. The cardinality
property for a hierarchy is used to assign solve orders to expressions. For relational data sources,
cardinality indicates the nature of the relationship between two query subjects, query items, or
other model objects.
cascading prompt
A prompt that uses values from a previous prompt to filter the values in the current prompt or
picklist.
condition
An expression that yields a boolean value. Conditions are used in query expressions, query filters,
and boolean report variables that can be used for conditional formatting, styles, data sources, layouts
and blocks.
Content Manager
The IBM Cognos 8 service that manages the storage of customer applications, including application-
specific security, configuration data, models, metrics, reports, and report output. Content Manager
is needed to publish models, retrieve or store report specifications, manage scheduling information,
and manage the Cognos namespace.
Professional Authoring User Guide 685
cube
A physical data source containing a multidimensional representation of data. A cube contains
information organized into dimensions and optimized to provide faster retrieval and navigation in
reports. In IBM Cognos Planning, a cube (see also D-Cube) corresponds to a tab on Contributor
client user interface.
data source
A relational database, dimensional cube, file, or other physical data store that can be accessed
through IBM Cognos 8.
data tree
Within a studio, contains objects such as query subjects, query items, dimensions, levels, and
members. A data tree is used as a palette of the available data that can be inserted into calculations,
filters, display areas, and other authoring gestures.
dimension
In IBM Cognos Planning, the rows, columns, and pages of a cube are created from dimensions.
Dimensions are lists of related items such as Profit and Loss items, months, products, customers,
and cost centers. Dimensions also contain all the calculations. One dimension can be used by many
cubes.
In IBM Cognos 8 BI, a dimension is a broad grouping of descriptive data about a major aspect of
a business, such as products, dates, or locations. Each dimension includes different levels of members
in one or more hierarchies and an optional set of calculated members or special categories.
dimensional data source
A term used to apply to both OLAP data sources and dimensionally modeled relational data sources.
Also known as multidimensional data source.
drill down
In IBM Cognos Planning, drill down is a technique used to analyze D-Cube data that was imported
by a D-Link. You can drill down on any single cell in a D-Cube. If the cell contains data transferred
by a D-Link, drill down opens a view of the source data. If the data was imported from another D-
Cube, drill down opens the appropriate selection from the source D-Cube. If the data was imported
from an external source (a mapped ASCII file or an ODBC database), drill down extracts the relevant
data from the source file and displays it in a special drill-down results dialog box.
In IBM Cognos 8 BI, drill down refers to the act of navigating from one level of data to a more
detailed level. The levels are set by the structure of the data. See also drill up.
drill up
The act of navigating from one level of data to a less detailed level. The levels are set by the structure
of the data.
See also drill down.
686 Report Studio
Glossary
group
In security, a list of users or other groups that can be used to assign access permissions and capab-
ilities.
Groups can be referenced from other authentication sources or can be local to IBM Cognos 8. Local
groups are managed from the administration portal. The list of groups that an authentication user
is a member of is part of the user's passport for an IBM Cognos 8 session.
In reporting, grouping is the action of organizing common values of query item together and only
displaying the value once. Headers and footers often appear after each instance of a common value
in a grouped column
hierarchy
A hierarchy represents a collection of dimensional members organized into a tree structure, with
each member having one or more parent members and an arbitrary number of child members.
The root of a hierarchy has no parent, and leaf members of a hierarchy have no children.
layout
In reporting, layout defines the appearance of the report, including formatting, style, and design.
In report specifications, layout is the portion of the specification that defines how the data returned
by queries is presented.
level
A level is a set of members that have common attributes. For example, a geographical dimension
might contain levels for country, region, and city. Levels are used to define the structure of hierarchies
in a dimension.
locale
A code that is used to set the language or dialect used for browsers, report text, and so on; and the
regional preferences, such as formats for time, date, money, and money expressions.
For IBM Cognos products, you can specify a locale for the product interface (product locale) and
for the data in the report (content locale).
MDX
An abbreviation for multidimensional expression language, MDX is the multidimensional equivalent
of SQL.
measure
A performance indicator that is quantifiable and used to determine how well a business is operating.
For most business purposes, the aggregate values of a measure are more useful than individual
values. For example, measures can be Revenue, Revenue/Employee, and Profit Margin %. In
relational modeling, this is also called a "fact."
Professional Authoring User Guide 687
Glossary
member
A member is a unique item within a hierarchy. For example, Camping Equipment and 4 Man tent
are members of the Products hierarchy.
See also member unique name.
member property
See attribute (for dimensional models).
Metric Studio application
A set of metric types, metrics, and scorecards that monitor the performance of an organization.
Each organization may have several Metric Studio applications monitoring distinct units, such as
operating companies or divisions that have different user communities, metric types or reporting
calendars.
model
A physical or business representation of the structure of the data from one or more data sources.
A model describes data objects, structure, and grouping, as well as relationships and security.
In IBM Cognos 8 BI, a design model is created and maintained in Framework Manager. The design
model or a subset of the design model must be published to the IBM Cognos 8 server as a package
for users to create and run reports.
In IBM Cognos Planning, a model is a group of D-Cubes, D-Lists, D-Links, and other objects stored
in a library. A model may reside in one or more libraries, with a maximum of two for Contributor.
package
A subset of a model, which can be the whole model, to be made available to the IBM Cognos 8
server.
For Metric Studio users, see metric package.
page set
A set of pages associated with a specified group or level that indicates the page set is to be repeated
for that group or level. For example, render a specified set of pages for each customer in the query.
prompt
A report element that asks for parameter values before the report is run.
properties pane
Within a studio, the properties pane provides an overview of the properties for selected data. You
can also use the properties pane to make several changes and apply them at the same time, instead
of repeating several different commands.
query
A specification for a set of data retrieved from a data source. A report specification can contain
one or more queries.
688 Report Studio
Glossary

In Query Studio, the type of object created and edited. A query is a subtype of report.
In Transformer, models can contain multiple queries as data sources. A query or data source appears
as a cylinder icon in the Data Sources list.
query item
A representation of a column of data in a data source. It contains a reference to a database column,
a reference to another query item, or a calculation. Query items may appear in a model or in a
report.
query subject
One of the types of objects inside a model. A query subject can be defined as a collection of references
to items of other query subjects, or expressed as an SQL expression that represents selected query
items. These query items will be retrieved from objects such as tables, synonyms, views, and so on.
Query subjects contain query items.
repeater
In Report Studio, a cell container that repeats values within itself with no predefined internal
structure.
repeater table
In Report Studio, a table-like container that repeats cells across and down the page for row in the
associated query.
report
A set of data deliberately laid out to communicate business information. Depending on the context,
"report" may refer to report specification or report output.
Report (more precisely, report specification) is the generic term for the objects created or edited by
Query Studio, Report Studio, and Analysis Studio.
report output
Report output combines data at the point in time when the report was run with a report specification.
It is a document that can be displayed, printed, or emailed. IBM Cognos 8 can produce report
outputs in HTML, PDF, Excel, or CSV formats.
report specification
The definition of queries, prompts, layouts, and styles that make up a report. A report specification
is combined with data by a run operation to create report outputs. You create report specifications
by using Report Studio, Query Studio, Analysis Studio, or through the Software Development Kit.
style sheet
A file that defines the formatting and appearance of data or a document. In XML, style sheets may
be extensible style sheet language (XSL) files or extensible style sheet language transformation
(XSLT) files.
In HTML, style sheets are cascading style sheet (CSS) files.
Professional Authoring User Guide 689
Glossary
XSL and CSS style sheets can be embedded inside any XML document or referenced as an external,
separate file.
summary
In reporting and analysis, summaries are aggregate values that are calculated for all the values of
a particular level or dimension. Examples of summaries include total, minimum, maximum, average,
and count.
template
A reusable report layout or style that can be used to set the presentation of a query or report.
work area
The area within a studio that contains the report, analysis, query or agent currently being used.
690 Report Studio
Glossary
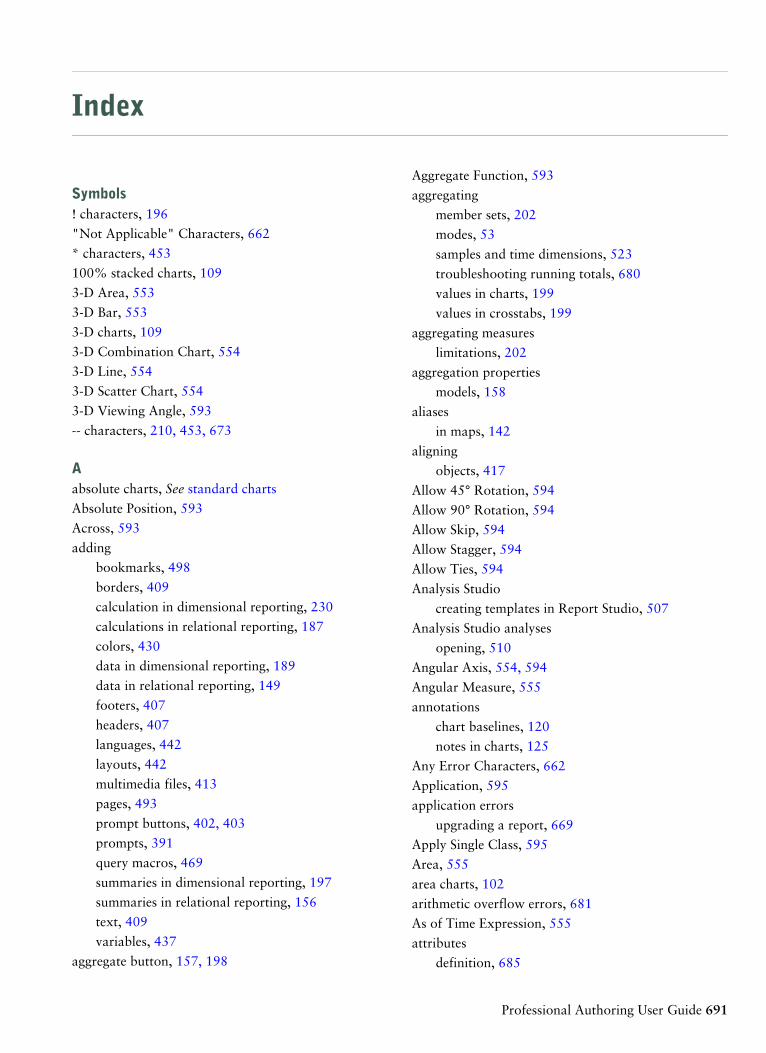
Index
Symbols! characters, 196
"Not Applicable" Characters, 662
* characters, 453
100% stacked charts, 109
3-D Area, 553
3-D Bar, 553
3-D charts, 109
3-D Combination Chart, 554
3-D Line, 554
3-D Scatter Chart, 554
3-D Viewing Angle, 593
-- characters, 210, 453, 673
Aabsolute charts, See standard charts
Absolute Position, 593
Across, 593
adding
bookmarks, 498
borders, 409
calculation in dimensional reporting, 230
calculations in relational reporting, 187
colors, 430
data in dimensional reporting, 189
data in relational reporting, 149
footers, 407
headers, 407
languages, 442
layouts, 442
multimedia files, 413
pages, 493
prompt buttons, 402, 403
prompts, 391
query macros, 469
summaries in dimensional reporting, 197
summaries in relational reporting, 156
text, 409
variables, 437
aggregate button, 157, 198
Aggregate Function, 593
aggregating
member sets, 202
modes, 53
samples and time dimensions, 523
troubleshooting running totals, 680
values in charts, 199
values in crosstabs, 199
aggregating measures
limitations, 202
aggregation properties
models, 158
aliases
in maps, 142
aligning
objects, 417
Allow 45° Rotation, 594
Allow 90° Rotation, 594
Allow Skip, 594
Allow Stagger, 594
Allow Ties, 594
Analysis Studio
creating templates in Report Studio, 507
Analysis Studio analyses
opening, 510
Angular Axis, 554, 594
Angular Measure, 555
annotations
chart baselines, 120
notes in charts, 125
Any Error Characters, 662
Application, 595
application errors
upgrading a report, 669
Apply Single Class, 595
Area, 555
area charts, 102
arithmetic overflow errors, 681
As of Time Expression, 555
attributes
definition, 685
Professional Authoring User Guide 691
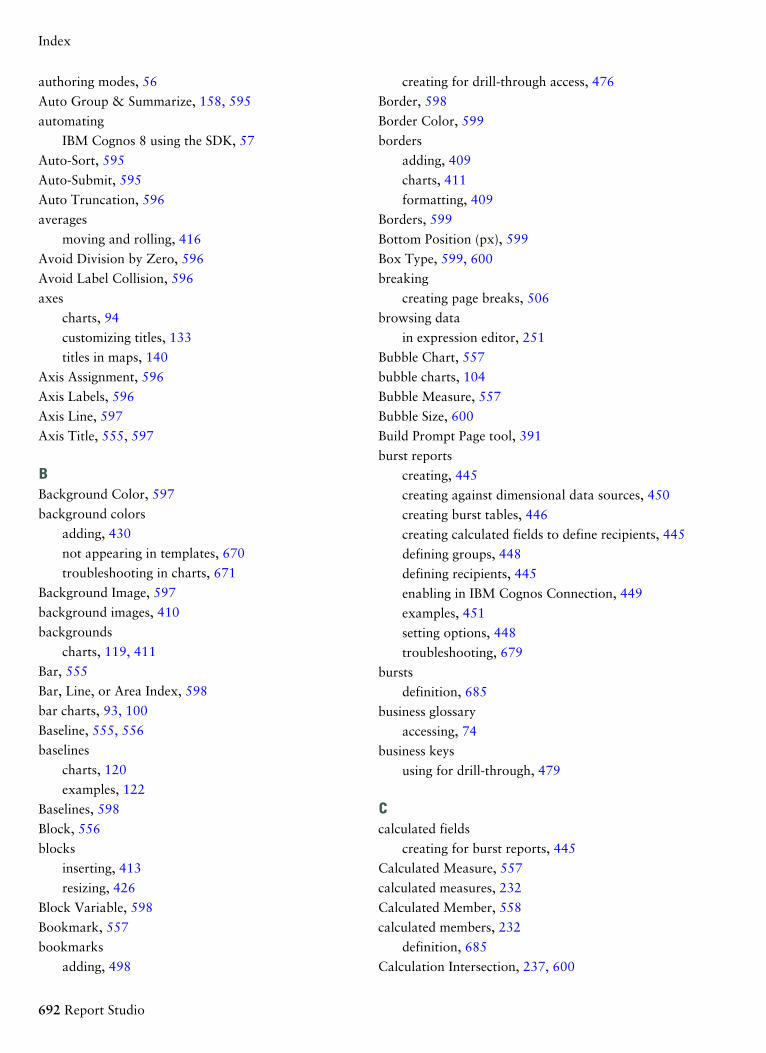
authoring modes, 56
Auto Group & Summarize, 158, 595
automating
IBM Cognos 8 using the SDK, 57
Auto-Sort, 595
Auto-Submit, 595
Auto Truncation, 596
averages
moving and rolling, 416
Avoid Division by Zero, 596
Avoid Label Collision, 596
axes
charts, 94
customizing titles, 133
titles in maps, 140
Axis Assignment, 596
Axis Labels, 596
Axis Line, 597
Axis Title, 555, 597
BBackground Color, 597
background colors
adding, 430
not appearing in templates, 670
troubleshooting in charts, 671
Background Image, 597
background images, 410
backgrounds
charts, 119, 411
Bar, 555
Bar, Line, or Area Index, 598
bar charts, 93, 100
Baseline, 555, 556
baselines
charts, 120
examples, 122
Baselines, 598
Block, 556
blocks
inserting, 413
resizing, 426
Block Variable, 598
Bookmark, 557
bookmarks
adding, 498
creating for drill-through access, 476
Border, 598
Border Color, 599
borders
adding, 409
charts, 411
formatting, 409
Borders, 599
Bottom Position (px), 599
Box Type, 599, 600
breaking
creating page breaks, 506
browsing data
in expression editor, 251
Bubble Chart, 557
bubble charts, 104
Bubble Measure, 557
Bubble Size, 600
Build Prompt Page tool, 391
burst reports
creating, 445
creating against dimensional data sources, 450
creating burst tables, 446
creating calculated fields to define recipients, 445
defining groups, 448
defining recipients, 445
enabling in IBM Cognos Connection, 449
examples, 451
setting options, 448
troubleshooting, 679
bursts
definition, 685
business glossary
accessing, 74
business keys
using for drill-through, 479
Ccalculated fields
creating for burst reports, 445
Calculated Measure, 557
calculated measures, 232
Calculated Member, 558
calculated members, 232
definition, 685
Calculation Intersection, 237, 600
692 Report Studio
Index
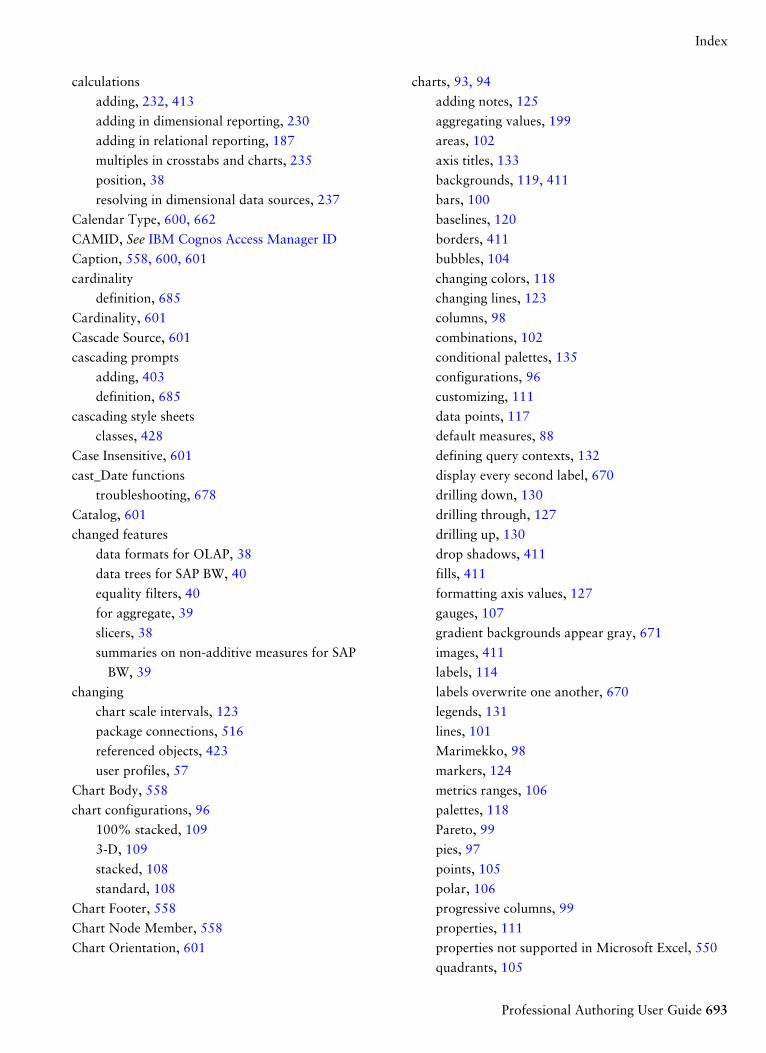
calculations
adding, 232, 413
adding in dimensional reporting, 230
adding in relational reporting, 187
multiples in crosstabs and charts, 235
position, 38
resolving in dimensional data sources, 237
Calendar Type, 600, 662
CAMID, See IBM Cognos Access Manager ID
Caption, 558, 600, 601
cardinality
definition, 685
Cardinality, 601
Cascade Source, 601
cascading prompts
adding, 403
definition, 685
cascading style sheets
classes, 428
Case Insensitive, 601
cast_Date functions
troubleshooting, 678
Catalog, 601
changed features
data formats for OLAP, 38
data trees for SAP BW, 40
equality filters, 40
for aggregate, 39
slicers, 38
summaries on non-additive measures for SAP
BW, 39
changing
chart scale intervals, 123
package connections, 516
referenced objects, 423
user profiles, 57
Chart Body, 558
chart configurations, 96
100% stacked, 109
3-D, 109
stacked, 108
standard, 108
Chart Footer, 558
Chart Node Member, 558
Chart Orientation, 601
charts, 93, 94
adding notes, 125
aggregating values, 199
areas, 102
axis titles, 133
backgrounds, 119, 411
bars, 100
baselines, 120
borders, 411
bubbles, 104
changing colors, 118
changing lines, 123
columns, 98
combinations, 102
conditional palettes, 135
configurations, 96
customizing, 111
data points, 117
default measures, 88
defining query contexts, 132
display every second label, 670
drilling down, 130
drilling through, 127
drilling up, 130
drop shadows, 411
fills, 411
formatting axis values, 127
gauges, 107
gradient backgrounds appear gray, 671
images, 411
labels, 114
labels overwrite one another, 670
legends, 131
lines, 101
Marimekko, 98
markers, 124
metrics ranges, 106
palettes, 118
Pareto, 99
pies, 97
points, 105
polar, 106
progressive columns, 99
properties, 111
properties not supported in Microsoft Excel, 550
quadrants, 105
Professional Authoring User Guide 693
Index
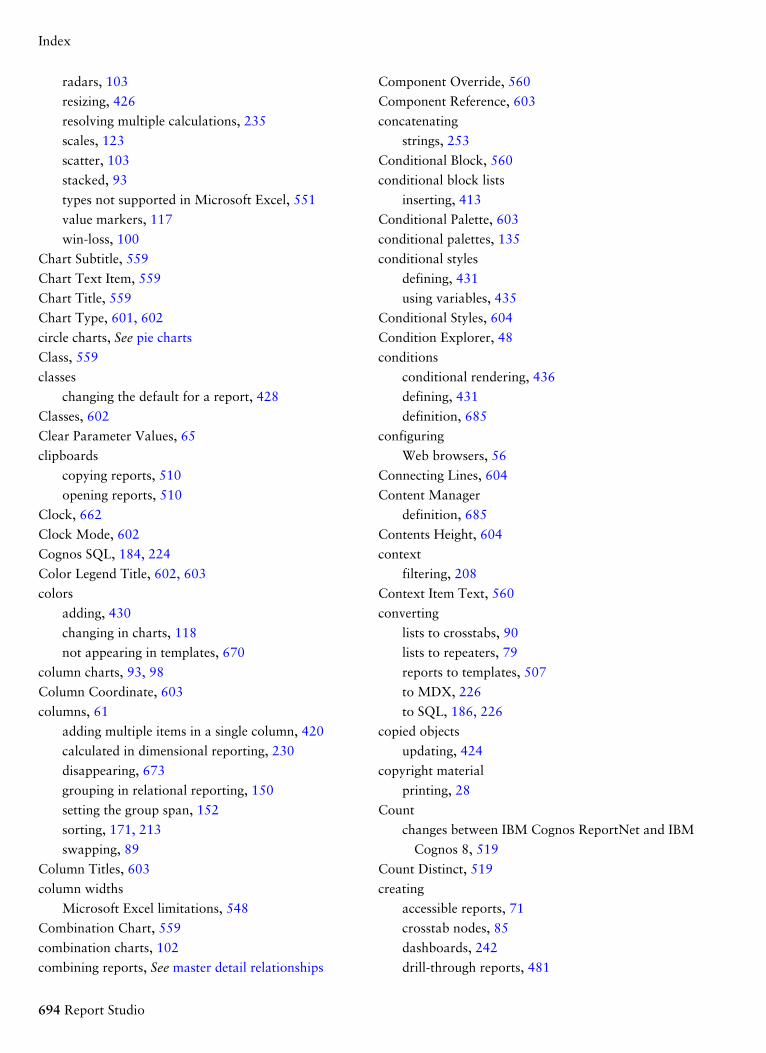
radars, 103
resizing, 426
resolving multiple calculations, 235
scales, 123
scatter, 103
stacked, 93
types not supported in Microsoft Excel, 551
value markers, 117
win-loss, 100
Chart Subtitle, 559
Chart Text Item, 559
Chart Title, 559
Chart Type, 601, 602
circle charts, See pie charts
Class, 559
classes
changing the default for a report, 428
Classes, 602
Clear Parameter Values, 65
clipboards
copying reports, 510
opening reports, 510
Clock, 662
Clock Mode, 602
Cognos SQL, 184, 224
Color Legend Title, 602, 603
colors
adding, 430
changing in charts, 118
not appearing in templates, 670
column charts, 93, 98
Column Coordinate, 603
columns, 61
adding multiple items in a single column, 420
calculated in dimensional reporting, 230
disappearing, 673
grouping in relational reporting, 150
setting the group span, 152
sorting, 171, 213
swapping, 89
Column Titles, 603
column widths
Microsoft Excel limitations, 548
Combination Chart, 559
combination charts, 102
combining reports, See master detail relationships
Component Override, 560
Component Reference, 603
concatenating
strings, 253
Conditional Block, 560
conditional block lists
inserting, 413
Conditional Palette, 603
conditional palettes, 135
conditional styles
defining, 431
using variables, 435
Conditional Styles, 604
Condition Explorer, 48
conditions
conditional rendering, 436
defining, 431
definition, 685
configuring
Web browsers, 56
Connecting Lines, 604
Content Manager
definition, 685
Contents Height, 604
context
filtering, 208
Context Item Text, 560
converting
lists to crosstabs, 90
lists to repeaters, 79
reports to templates, 507
to MDX, 226
to SQL, 186, 226
copied objects
updating, 424
copyright material
printing, 28
Count
changes between IBM Cognos ReportNet and IBM
Cognos 8, 519
Count Distinct, 519
creating
accessible reports, 71
crosstab nodes, 85
dashboards, 242
drill-through reports, 481
694 Report Studio
Index
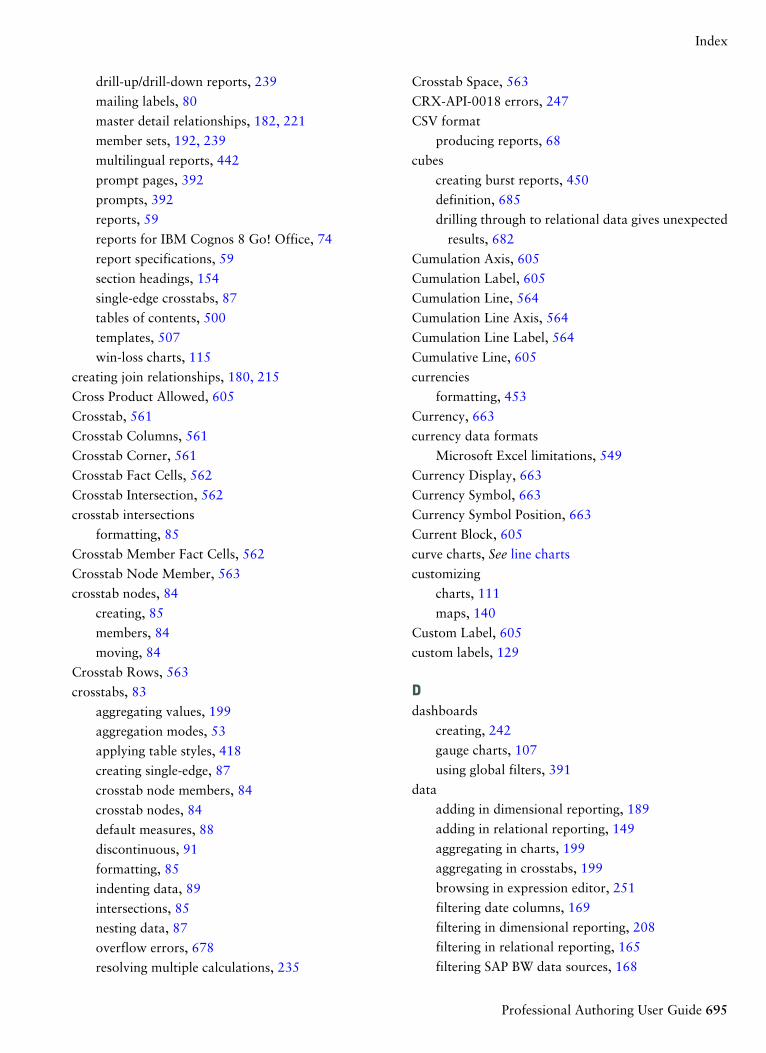
drill-up/drill-down reports, 239
mailing labels, 80
master detail relationships, 182, 221
member sets, 192, 239
multilingual reports, 442
prompt pages, 392
prompts, 392
reports, 59
reports for IBM Cognos 8 Go! Office, 74
report specifications, 59
section headings, 154
single-edge crosstabs, 87
tables of contents, 500
templates, 507
win-loss charts, 115
creating join relationships, 180, 215
Cross Product Allowed, 605
Crosstab, 561
Crosstab Columns, 561
Crosstab Corner, 561
Crosstab Fact Cells, 562
Crosstab Intersection, 562
crosstab intersections
formatting, 85
Crosstab Member Fact Cells, 562
Crosstab Node Member, 563
crosstab nodes, 84
creating, 85
members, 84
moving, 84
Crosstab Rows, 563
crosstabs, 83
aggregating values, 199
aggregation modes, 53
applying table styles, 418
creating single-edge, 87
crosstab node members, 84
crosstab nodes, 84
default measures, 88
discontinuous, 91
formatting, 85
indenting data, 89
intersections, 85
nesting data, 87
overflow errors, 678
resolving multiple calculations, 235
Crosstab Space, 563
CRX-API-0018 errors, 247
CSV format
producing reports, 68
cubes
creating burst reports, 450
definition, 685
drilling through to relational data gives unexpected
results, 682
Cumulation Axis, 605
Cumulation Label, 605
Cumulation Line, 564
Cumulation Line Axis, 564
Cumulation Line Label, 564
Cumulative Line, 605
currencies
formatting, 453
Currency, 663
currency data formats
Microsoft Excel limitations, 549
Currency Display, 663
Currency Symbol, 663
Currency Symbol Position, 663
Current Block, 605
curve charts, See line charts
customizing
charts, 111
maps, 140
Custom Label, 605
custom labels, 129
Ddashboards
creating, 242
gauge charts, 107
using global filters, 391
data
adding in dimensional reporting, 189
adding in relational reporting, 149
aggregating in charts, 199
aggregating in crosstabs, 199
browsing in expression editor, 251
filtering date columns, 169
filtering in dimensional reporting, 208
filtering in relational reporting, 165
filtering SAP BW data sources, 168
Professional Authoring User Guide 695
Index
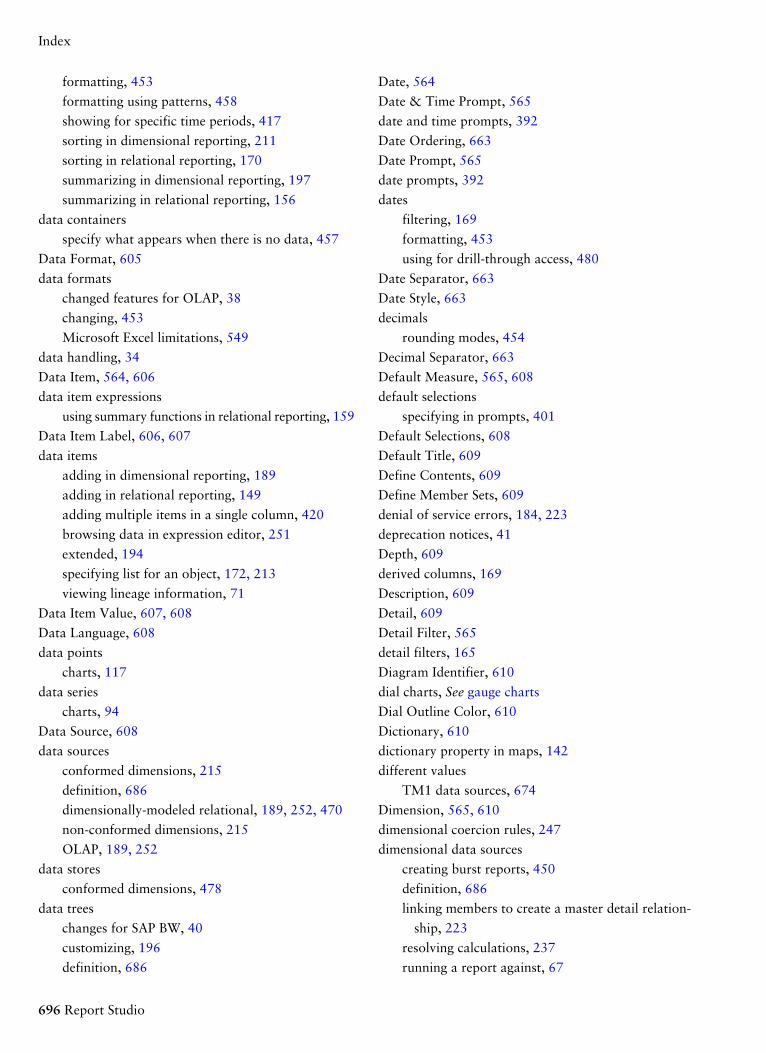
formatting, 453
formatting using patterns, 458
showing for specific time periods, 417
sorting in dimensional reporting, 211
sorting in relational reporting, 170
summarizing in dimensional reporting, 197
summarizing in relational reporting, 156
data containers
specify what appears when there is no data, 457
Data Format, 605
data formats
changed features for OLAP, 38
changing, 453
Microsoft Excel limitations, 549
data handling, 34
Data Item, 564, 606
data item expressions
using summary functions in relational reporting, 159
Data Item Label, 606, 607
data items
adding in dimensional reporting, 189
adding in relational reporting, 149
adding multiple items in a single column, 420
browsing data in expression editor, 251
extended, 194
specifying list for an object, 172, 213
viewing lineage information, 71
Data Item Value, 607, 608
Data Language, 608
data points
charts, 117
data series
charts, 94
Data Source, 608
data sources
conformed dimensions, 215
definition, 686
dimensionally-modeled relational, 189, 252, 470
non-conformed dimensions, 215
OLAP, 189, 252
data stores
conformed dimensions, 478
data trees
changes for SAP BW, 40
customizing, 196
definition, 686
Date, 564
Date & Time Prompt, 565
date and time prompts, 392
Date Ordering, 663
Date Prompt, 565
date prompts, 392
dates
filtering, 169
formatting, 453
using for drill-through access, 480
Date Separator, 663
Date Style, 663
decimals
rounding modes, 454
Decimal Separator, 663
Default Measure, 565, 608
default selections
specifying in prompts, 401
Default Selections, 608
Default Title, 609
Define Contents, 609
Define Member Sets, 609
denial of service errors, 184, 223
deprecation notices, 41
Depth, 609
derived columns, 169
Description, 609
Detail, 609
Detail Filter, 565
detail filters, 165
Diagram Identifier, 610
dial charts, See gauge charts
Dial Outline Color, 610
Dictionary, 610
dictionary property in maps, 142
different values
TM1 data sources, 674
Dimension, 565, 610
dimensional coercion rules, 247
dimensional data sources
creating burst reports, 450
definition, 686
linking members to create a master detail relation-
ship, 223
resolving calculations, 237
running a report against, 67
696 Report Studio
Index
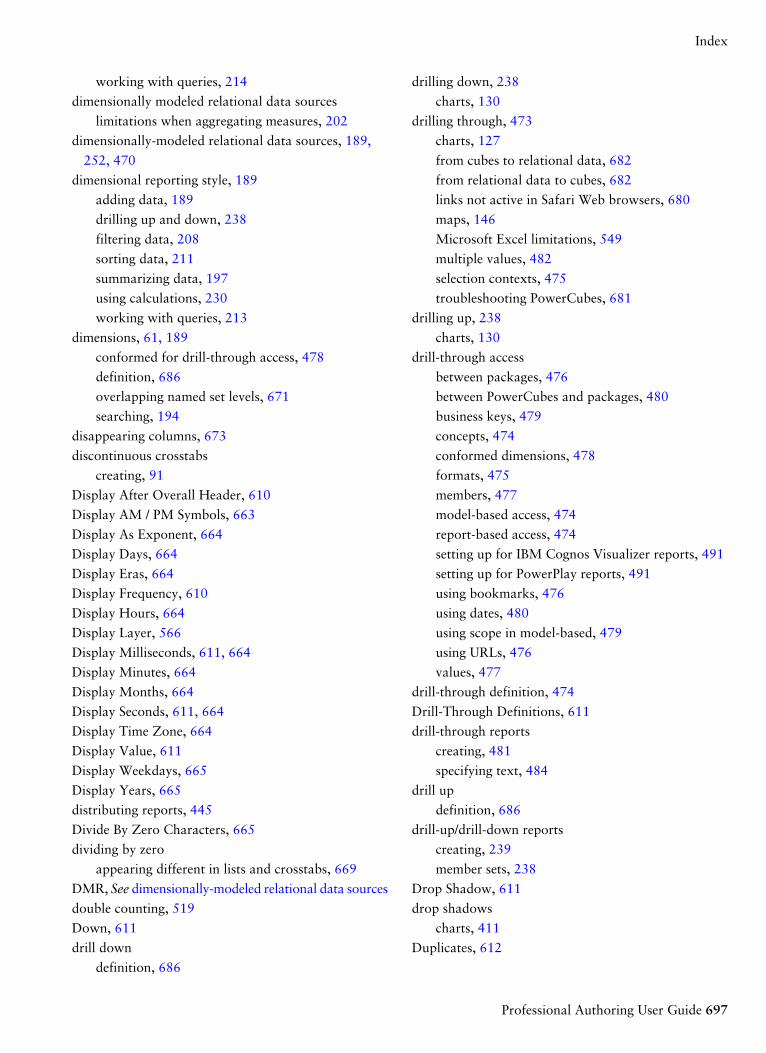
working with queries, 214
dimensionally modeled relational data sources
limitations when aggregating measures, 202
dimensionally-modeled relational data sources, 189,
252, 470
dimensional reporting style, 189
adding data, 189
drilling up and down, 238
filtering data, 208
sorting data, 211
summarizing data, 197
using calculations, 230
working with queries, 213
dimensions, 61, 189
conformed for drill-through access, 478
definition, 686
overlapping named set levels, 671
searching, 194
disappearing columns, 673
discontinuous crosstabs
creating, 91
Display After Overall Header, 610
Display AM / PM Symbols, 663
Display As Exponent, 664
Display Days, 664
Display Eras, 664
Display Frequency, 610
Display Hours, 664
Display Layer, 566
Display Milliseconds, 611, 664
Display Minutes, 664
Display Months, 664
Display Seconds, 611, 664
Display Time Zone, 664
Display Value, 611
Display Weekdays, 665
Display Years, 665
distributing reports, 445
Divide By Zero Characters, 665
dividing by zero
appearing different in lists and crosstabs, 669
DMR, See dimensionally-modeled relational data sources
double counting, 519
Down, 611
drill down
definition, 686
drilling down, 238
charts, 130
drilling through, 473
charts, 127
from cubes to relational data, 682
from relational data to cubes, 682
links not active in Safari Web browsers, 680
maps, 146
Microsoft Excel limitations, 549
multiple values, 482
selection contexts, 475
troubleshooting PowerCubes, 681
drilling up, 238
charts, 130
drill-through access
between packages, 476
between PowerCubes and packages, 480
business keys, 479
concepts, 474
conformed dimensions, 478
formats, 475
members, 477
model-based access, 474
report-based access, 474
setting up for IBM Cognos Visualizer reports, 491
setting up for PowerPlay reports, 491
using bookmarks, 476
using dates, 480
using scope in model-based, 479
using URLs, 476
values, 477
drill-through definition, 474
Drill-Through Definitions, 611
drill-through reports
creating, 481
specifying text, 484
drill up
definition, 686
drill-up/drill-down reports
creating, 239
member sets, 238
Drop Shadow, 611
drop shadows
charts, 411
Duplicates, 612
Professional Authoring User Guide 697
Index
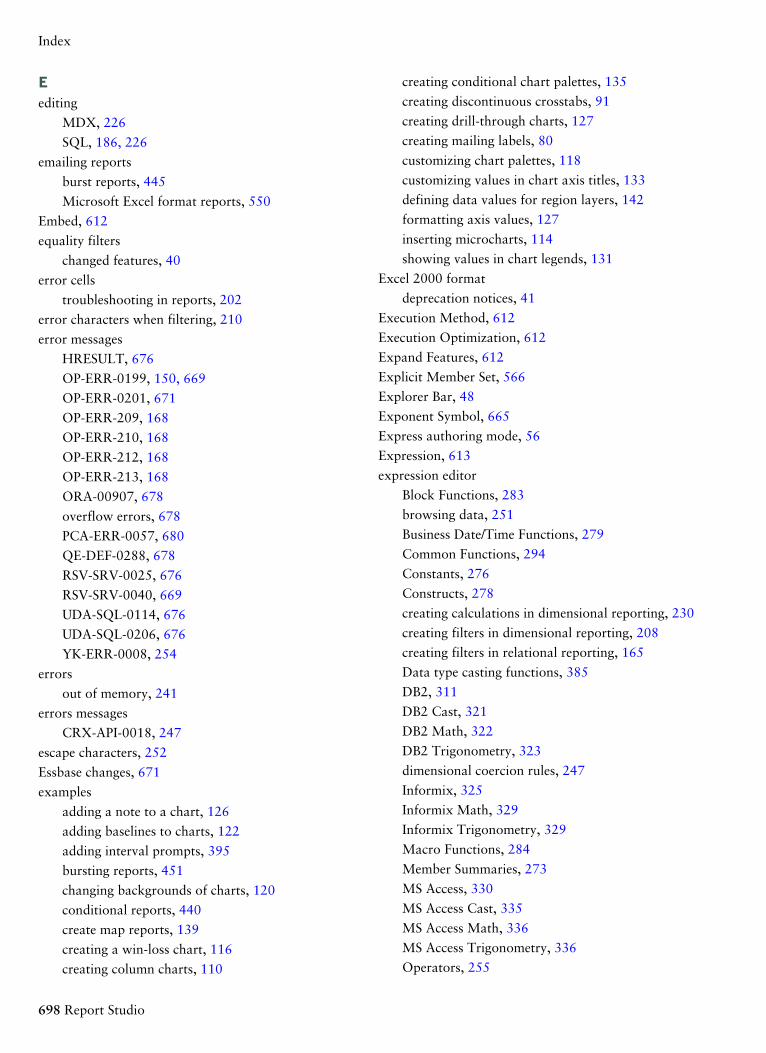
Eediting
MDX, 226
SQL, 186, 226
emailing reports
burst reports, 445
Microsoft Excel format reports, 550
Embed, 612
equality filters
changed features, 40
error cells
troubleshooting in reports, 202
error characters when filtering, 210
error messages
HRESULT, 676
OP-ERR-0199, 150, 669
OP-ERR-0201, 671
OP-ERR-209, 168
OP-ERR-210, 168
OP-ERR-212, 168
OP-ERR-213, 168
ORA-00907, 678
overflow errors, 678
PCA-ERR-0057, 680
QE-DEF-0288, 678
RSV-SRV-0025, 676
RSV-SRV-0040, 669
UDA-SQL-0114, 676
UDA-SQL-0206, 676
YK-ERR-0008, 254
errors
out of memory, 241
errors messages
CRX-API-0018, 247
escape characters, 252
Essbase changes, 671
examples
adding a note to a chart, 126
adding baselines to charts, 122
adding interval prompts, 395
bursting reports, 451
changing backgrounds of charts, 120
conditional reports, 440
create map reports, 139
creating a win-loss chart, 116
creating column charts, 110
creating conditional chart palettes, 135
creating discontinuous crosstabs, 91
creating drill-through charts, 127
creating mailing labels, 80
customizing chart palettes, 118
customizing values in chart axis titles, 133
defining data values for region layers, 142
formatting axis values, 127
inserting microcharts, 114
showing values in chart legends, 131
Excel 2000 format
deprecation notices, 41
Execution Method, 612
Execution Optimization, 612
Expand Features, 612
Explicit Member Set, 566
Explorer Bar, 48
Exponent Symbol, 665
Express authoring mode, 56
Expression, 613
expression editor
Block Functions, 283
browsing data, 251
Business Date/Time Functions, 279
Common Functions, 294
Constants, 276
Constructs, 278
creating calculations in dimensional reporting, 230
creating filters in dimensional reporting, 208
creating filters in relational reporting, 165
Data type casting functions, 385
DB2, 311
DB2 Cast, 321
DB2 Math, 322
DB2 Trigonometry, 323
dimensional coercion rules, 247
Informix, 325
Informix Math, 329
Informix Trigonometry, 329
Macro Functions, 284
Member Summaries, 273
MS Access, 330
MS Access Cast, 335
MS Access Math, 336
MS Access Trigonometry, 336
Operators, 255
698 Report Studio
Index
Oracle, 337
Oracle Math, 343
Oracle Trigonometry, 343
prompts, 397
quotation marks in literal strings, 252
Red Brick, 345
Report Functions, 371
SAP BW, 362
SAP BW Math, 364
SAP BW Trigonometry, 362
searching for values, 252
SQL Server, 350
SQL Server Cast, 354
SQL Server Math, 355
SQL Server Trigonometry, 355
Summaries, 262
Sybase, 364
Sybase Math, 369
Sybase Trigonometry, 370
Teradata, 357
Teradata Trigonometry, 361
expressions
calculations, 232
functions not available, 253
length, 247
limitations in list reports, 78
quotation marks in literal strings, 252
extended data items, 54, 194, 427
FFace Color, 613
Fact, 566
fact cells
formatting, 85
Fact Cells Precedence, 614
facts, 61
Field Set, 566
field sets
inserting, 413
Fill Effects, 614
fills
charts, 411
filter expressions
creating for drilling through from IBM Cognos Series
7 to IBM Cognos 8, 491
filtering
data from SAP BW data sources, 168
data in dimensional reporting, 208
data in relational reporting, 165
date columns, 169
-- error characters, 210
limitations when specifying the scope, 168
limitations with dimensional data sources, 210
multiple-fact queries, 215
slicers, 208
using context filters, 208
filters
make_timestamp columns, 676
finding
information, 28
finding objects
in reports, 53
First Column Color, 614
First Date, 614
First Label Index, 614
first-rows optimization, 186, 226
Floating, 426, 614
focusing data
in dimensional reporting, 208
in relational reporting, 165
Font, 615
Font Auto-Sizing, 615
fonts
colors, 430
in maps, 140
specifying, 410
Footer, 615
footers
adding, 407
formatting, 407
in maps, 140, 141
for clauses
limitations when using in summary functions, 159
Foreground Color, 616
foreground colors
adding, 430
formats
drill-through access, 475
not supported for Microsoft Excel, 549
reports, 65
Professional Authoring User Guide 699
Index
formatting
borders, 409
chart axis values, 127
colors, 430
crosstabs, 85
currencies, 453
data, 453
data using patterns, 458
dates, 453
footers, 407
headers, 407
limitations for Microsoft Excel outputs, 547
lists, 77
reports in page structure view, 406
single object, 454
tables, 418
text, 409
values in map legends, 140
functions
Microsoft Excel, 254
GGauge Chart, 566
gauge charts, 107
Gauge Labels, 567, 616
Gauge Numerical Axis, 567
Gauge Palette, 616
Generated Background Image, 616
Generated Prompt, 567
generated prompts, 392
Generated SQL, 617
global filters in dashboards, 391
Gradient, 617
graphs, See charts
Great Outdoors samples, 521
gridlines
charts, 94
major and minor, 123
Gridlines, 617
grouped data items
troubleshooting, 669
grouped lists
subtotals, 670
grouped reports
troubleshooting incorrect running totals, 680
grouping
data in relational reporting, 150
Grouping & Sorting, 617
Grouping Type, 617
groups
defining for burst reports, 448
definition, 686
Group Size (digits), 665
Group Span, 617
group spans
setting, 152
guidelines
laying out reports, 405
HHas Fact Cells, 618
headers
adding, 407
formatting, 407
Heading Level, 618
Height (px), 618
heights
specifying for objects, 426
help
getting, 28
Hide Adornments, 618
Hide Text, 618
hiding
objects, 438
hierarchies, 61
definition, 687
inserting, 192
Hierarchy, 618
Hierarchy Set, 567
Hierarchy Unique Name, 619
highlighting
adding colors, 430
conditional styles, 431
Hole Size (%), 619
Horizontal Alignment, 619
horizontal charts, See bar charts
horizontal pagination, 503
specifying the number style, 503
HRESULT errors, 676
HTML, 619
700 Report Studio
Index
HTML format
producing reports, 65
HTML Item, 567
HTML items
inserting, 413
HTML Source Variable, 620
Hyperlink, 568
Hyperlink Button, 568
hyperlink buttons
inserting, 413
not supported for Microsoft Excel, 550
hyperlinks
inserting, 413
IIBM Cognos 8 Go! Office
creating reports for, 74
IBM Cognos 8 Software Development Kit, 57
IBM Cognos Access Manager ID, 446
IBM Cognos Resource Center, 28
IBM Cognos Visualizer reports
setting up drill-through access to IBM Cognos 8, 491
IBM WebSphere Business Glossary, 74
icons, 61
Ignore Data with No Features, 620
ignoring data with no features
in maps, 141
Image, 568
images
charts, 411
inserting, 410
inserting in the background, 410
Microsoft Excel limitations, 545
Include Zero For Auto Scale, 620
indenting
data in crosstabs, 89
objects, 419
information
finding, 28
inheritance
objects, 52
Insertable Objects pane, 47, 48
inserting
background images, 410
blocks, 413
calculations, 413
conditional block lists, 413
dates, 413
field sets, 413
hierarchies, 192
HTML items, 413
hyperlink buttons, 413
hyperlinks, 413
images, 410
layout component references, 413
member properties, 193
microcharts, 114
page numbers, 503
page sets, 494
repeaters, 413
rich text items, 413
row numbers, 413
tables, 413, 418
International Currency Symbol, 665
Intersection (Tuple), 568
intersection of members, 235
Interval Prompt, 569
interval prompts, 392
adding, 395
JJapanese
Microsoft Excel limitations, 549
Join, 569
joining
nested page sets, 495
join relationships
creating, 180, 215
Join Relationships, 620
KKey, 569
LLabel, 620, 621
Label Control, 621
labels
specifying, 130
specifying in charts, 114, 129
Labels, 622
languages
adding to reports, 442
Professional Authoring User Guide 701
Index
Last Date, 622
laying out reports, 405
guidelines, 405
layout component cache, 424
Layout Component Reference, 569
layout component references
inserting, 413
layouts
adding, 442
choosing report, 60
definition, 687
description, 50
pages, 50
relating to queries, 172, 214
report objects, 51
using the page structure view, 406
Left Position (px), 622
Legend, 569, 622
Legend Label, 623
legends
charts, 94
customizing, 131
in maps, 140, 144
positioning, 131
Legend Title, 570, 623
Level, 570, 623
level hierarchies, 189
Level Hierarchy, 570
Level Indentation, 623
levels, 61, 189
definition, 687
member unique names, 477
Level Set, 570
Level Unique Name, 623
LFA.dll file, 509
limitations
aggregating measures in DMR or relational data
sources, 202
calculations with SAP BW data sources, 231
-- error characters when filtering, 210
expressions in list reports, 78
filtering dimensional reports, 210
filtering using SAP BW data sources, 168
grouping data in relational reporting, 150
inserting multiple hierarchies, 192
Microsoft Excel output, 545
ragged or unbalanced hierarchies, 195
resolving query calculations in SSAS, 237
running and moving summaries, 230
scope of summary filters, 168
sorting SAP BW data sources, 212
using the FOR clause, 159
Line, 570, 624
lineage information, 71
linear scales
showing, 123
line breaks, 425
line charts, 93, 101
lines
changing in charts, 123
Line Style, 624
Line Styles, 624
Line Type, 624
Line Weight (pt), 624
linking data items for drilling, 239
List, 570
List Cell, 571
List Column, 571
List Column Body, 571
List Columns, 572
List Columns Body Style, 572
List Columns Title Style, 572
List Column Title, 572
List Footer, 573
list footers
adding, 407
List Header, 573
list headers
adding, 407
list of data items
specifying for an object, 172, 213
List Page Footer, 573
List Page Header, 573
list reports
limitations, 78
List Row, 573
List Row Cells Style, 574
lists, 77
applying table styles, 418
converting to crosstabs, 90
converting to repeaters, 79
formatting, 77
702 Report Studio
Index
grouping data, 150
headers and footers, 407
single-edge crosstabs, 87
subtotals in grouped lists, 670
literal strings
in expressions, 252
live data, 56
loading message
saving a report takes a long time, 672
locales
definition, 687
locale-sensitive properties, 455
locking objects, 52
logarithmic scales
showing, 123
Loss Color, 624
Mmailing labels
creating, 80
managing
changes in packages, 515
Mantissa (digits), 665
Map, 574
Map & Layers, 624
Map Drills, 625
Map Location, 574
Map Refinement Location, 574, 575
maps, 137
aliases, 142
creating, 139
customizing, 140
dictionary property, 142
drilling through, 146
footers, 141
ignoring data with no features, 141
legends, 144
matching data values, 142
Microsoft Excel limitations, 549
notes, 145
parts of a map report, 138
point layers, 143
region layers, 142
resizing, 426
size of points, 141
subtitles, 141
titles, 141
Margin, 625
margins
setting, 419
Marimekko Chart, 575
Marimekko charts, 98
Marimekko Totals, 625
Marker, 575
Marker Color, 625
Marker Label, 625
markers
charts, 124
Markers, 626
Marker Shape, 626
Marker Size (pt), 626
Marker Text Location, 626
master detail relationships
creating, 182, 221
linking members from two dimensional data
sources, 223
using to join page sets, 495
Master Detail Relationships, 626
Maximum Characters, 626
Maximum Execution Time, 627
Maximum Hotspots, 627
Maximum No. of Digits, 665
Maximum Rows Retrieved, 627
Maximum Size (pt), 627
Maximum Tables, 627
Maximum Text Blob Characters, 628
Maximum Truncation Characters, 628
Maximum Value, 628
MDX, 576, 628
adding your own, 224
converting to, 226
definition, 687
editing, 226
viewing, 224
working with, 224
Measure, 576
measures, 61
creating calculations, 232
definition, 687
specifying defaults, 88
Member, 576, 628
Member Children Set, 576
Professional Authoring User Guide 703
Index
member fact cells
formatting, 85
Member Hierarchy, 576
member intersections, 235
Member Offset (%), 629
member properties, 189
definition, 688
inserting, 193
Member Property, 576, 577
members, 61
creating calculations, 232
definition, 687
drill-through access, 477
inserting properties, 193
linking from two dimensional data sources to create
a master detail relationship, 223
Members, 629
Member Set, 577
member sets
aggregating, 202
creating, 192, 239
members folders, 189
Member Unique Name, 629
member unique names, 252
relational metadata, 477
troubleshooting, 678
Metrics Range Chart, 577
metrics range charts, 106
Metric Studio applications
definition, 688
Metric Studio Diagram, 577
microcharts
inserting, 114
Microsoft Excel
functions, 254
report limitations, 545
Microsoft Excel format
producing a report, 69
Microsoft Excel limitations
nested report objects, 549
Minimum No. of Digits, 666
Minimum Size (pt), 629
Minimum Value, 630
Minor Gridlines, 630
missing items in a report or analysis, 678
Missing Value Characters, 666
missing values
dividing by zero, 669
mobile devices
creating reports for, 76
model-based drill-through access
using scope, 479
modeling
sample models and packages, 524
models, 61
aggregation properties, 158
definition, 688
using design filters, 65
moving
crosstab nodes, 84
moving averages, 416
Multi-Line, 630
multilingual reports, 442
multimedia files
adding, 413
multiple-fact queries
filters, 215
multiple-page reports, 493
multiple values
selecting in prompts, 400
Multi-Select, 630
MUN, See member unique names
NName, 630, 631, 632
Named Set, 577
named sets
limitations when summarizing, 198
nested or parallel sets overlapping, 671
names
updating references, 515
native SQL, 184, 224
Negative Column Color, 632
Negative Pattern, 666
Negative Sign Position, 666
Negative Sign Symbol, 666
nested list reports
not running after upgrading, 669
nested report objects
Microsoft Excel limitations, 549
nested sets
unexpected summary values, 675
704 Report Studio
Index
nesting
data in crosstabs, 87
No. of Decimal Places, 666
no data
specify what appears for a data container, 457
No Data Contents, 34, 457, 632
No Data Features Size (pt), 632
Node Coordinate, 632
Note, 578
Note Border, 632
Note Content, 578
notes
adding to charts, 125
adding to maps, 145
Notes, 633
null values
included in count summaries, 672
number data formats
Microsoft Excel limitations, 549
number of decimals
rounding modes, 454
Number of Regression Lines, 633
Numbers Only, 633
Number Style, 633
Numerical Axis, 578, 633
Numeric Overflow Characters, 666
Numeric Value, 634
Oobjects, 51
adding, 51
aligning, 417
as containers, 52
finding in reports, 53
formatting, 454
hiding and showing, 438
hierarchies, 52
indenting, 419
inheritance, 52
inserting, 413
reusing, 422
types, 52
updating, 424
OLAP
data sources, 189, 252
OLAP data sources
limitations when relational functions are used, 196
opening
Analysis Studio analyses, 510
Query Studio reports, 510
reports locally, 509
OP-ERR-0049 errors, 150
OP-ERR-0199 errors, 150, 669
OP-ERR-0201 errors, 671
OP-ERR-209 errors, 168
OP-ERR-210 errors, 168
OP-ERR-212 errors, 168
OP-ERR-213 errors, 168
options
setting, 53
ORA-00907 errors, 678
Oracle data sources
troubleshooting, 678
Ordinal Axis, 578, 634
Outer Join Allowed, 634
out of memory errors, 241
overflow, 426
overflow errors in crosstab report, 678
Override Dimension Info, 634
Overrides, 634
Ppackages, 61, 189
changing connections, 516
definition, 688
drilling-through, 476
managing changes, 515
referencing items in child queries, 181
refreshing, 60
specifying, 59
padding
applying, 419
Padding, 634
Padding Character, 666
Page, 578
Page Body, 579
page breaks, 503
controlling, 427
page breaks, See page sets
Page Break Text, 579
Page Explorer, 48
Professional Authoring User Guide 705
Index
Page Footer, 579
Page Header, 579
page layers
creating, 506
Page Number, 579
page numbers, 503
inserting, 503
specifying the number style, 503
pages, 50
adding, 493
associating queries, 493
not rendering when there is no data, 67
Page Set, 580
page sets
definition, 688
inserting, 494
joining nested page sets, 495
pagination, 427, 503
Pagination, 635
Palette, 635
palettes
charts, 118
conditional, 135
Parameter, 635
parameters
for prompts, 391, 397
using in master detail relationships, 182, 221
Pareto Axis, 636
Pareto Chart, 580
Pareto charts, 99
parse errors
opening or running upgraded reports, 678
Pattern, 666
patterns
using to format data, 458
PCA-ERR-0057 errors, 680
PDF format
producing reports, 65
PDF page options
setting, 70
PDF Page Setup, 636
Percentage Symbol, 667
Percentile, 636
Percent of Axis, 636
Percent Scale (integer), 667
Performance Pattern, 636
Pie Chart, 580
pie charts, 97
limitations for Microsoft Excel outputs, 546
Pie Labels, 580, 636
point charts, 105
Point Color Legend Title, 581
Point Layer, 581
point layers, 143
Point Measure, 581
Point Shape, 636
Point Size Legend Title, 581
Point Size Measure, 581
points layers, 141
Polar Chart, 581
polar charts, 106
Polynomial Exponent, 637
position
calculations, 38
Position, 637
Position type, 637
Positive Column Color, 637
PowerCubes
incorrect results, 676
troubleshooting drilling through, 681
PowerPlay reports
setting up drill-through access to IBM Cognos 8, 491
Pre-populate, 638
Pre-populate Levels, 638
Pre-Sort, 638
printing copyright material, 28
Processing, 638
Professional authoring mode, 56
profiles
changing, 57
Progressive Axis, 638
Progressive Chart, 582
progressive column charts, 99
Projection List, 638
Prompt Button, 582
prompt buttons
adding, 402, 403
prompt controls
changing interfaces, 399
date and time prompts, 392
date prompts, 392
generated prompts, 392
706 Report Studio
Index
interval prompts, 392
select and search prompts, 392
text box prompts, 392
time prompts, 392
tree prompts, 392
value prompts, 392
See Also prompts
prompting, 211
prompt pages
creating your own, 392
prompts
adding, 391
adding prompt buttons, 402
cascading, 403
changing prompt control interfaces, 399
creating, 392
creating in a report page, 398
creating using query macros, 470
definition, 688
interval, 395
modifying, 399
pages, 391
parameters, 391, 397
required, 399
requiring user input, 399
selecting multiple values, 400
showing and hiding status, 401
specifying default selections, 401
specifying values, 401
tree, 404
using the Build Prompt Page tool, 391
properties
charts, 111
locale-sensitive, 455
Properties, 639
Properties pane, 47
properties panes
definition, 688
Property, 639
Property Unique Name, 639
Push To Bottom, 639
QQE-DEF-0288 errors, 678
quadrant charts, 105
queries, 51
associating to pages, 493
definition, 688
dimensional data sources, 214
in dimensional reporting, 213
in relational reporting, 171
master detail,, 182, 221
referencing package items in child queries, 181
relating to layouts, 172, 214
working with MDX, 224
working with SQL, 184, 224
See master detail relationships
Query, 582, 639
query calculations
null values included in count summaries, 672
query context
defining in charts, 132
Query Explorer, 48, 171, 213
query items
definition, 689
query macros
adding, 469
using to create prompts, 470
Query Operation, 583
Query Reference, 583
Query Studio
creating templates in Report Studio, 507
Query Studio reports
opening, 510
query subjects
definition, 689
quick tours
using, 28
quotation marks
in literal strings, 252
RRadar Chart, 583
radar charts, 103
Radar Type, 640
Radial Axis, 583, 640
Radial Measure, 583
ragged hierarchies, 195
Range, 640
Range Label, 640
Professional Authoring User Guide 707
Index
recipients
defining for burst reports, 445
recommendations
drilling down, 241
recursive evaluation errors, 680
referenced objects
changing, 423
updating, 424
referencing
data items, 172, 213
package items in child queries, 181
refreshing
packages, 60
Region Color Legend Title, 584
Region Layer, 584
region layers, 142
Region Measure, 584
Regression Line, 584, 640
regression lines, 123
Regression Type, 641
related documentation, 27
relational data
drilling through to cubes, 682
relational data sources
limitations when aggregating measures, 202
relational functions
limitations when used with OLAP data sources, 196
relational reporting
creating group reports, 150
relational reporting style, 149
adding data, 149
filtering data, 165
grouping data, 150
sorting data, 170
summarizing data, 156
using calculations, 187
working with queries, 171
relationships
creating joins, 180, 215
Relative Alignment, 641
removing
section headings, 155
Render Fact Cells, 641
Render Page when Empty, 67, 641
Render Variable, 641
Repeater, 584
Repeater Direction, 642
repeaters
converting from lists, 79
definition, 689
formatting, 418
inserting, 413
Repeater Table, 584
Repeater Table Cell, 585
repeater tables
definition, 689
Report Expression, 642, 643
report layout
choosing, 60
ReportNet reports
upgraded reports look different, 680
report objects
as containers, 52
hierarchy, 52
locking and unlocking, 52
types, 52
working with, 51
report outputs
definition, 689
report properties
changing, 427
reports
accessible, 71
adding colors, 430
basic structure, 50
building using your own MDX, 224
building using your own SQL, 185, 224
bursting, 445
combining,, 182, 221
controlling rows per page, 68
converting to templates, 507
copying to the clipboard, 510
creating, 59
creating for IBM Cognos 8 Go! Office, 74
creating for mobile devices, 76
creating prompts in a report page, 398
creating section headings, 154
creating sections for dimensional data, 506
defining conditions, 431
definition, 689
drill-through access, 481
drill-through text, 484
708 Report Studio
Index
drill-up/drill-down, 239
finding objects, 53
formats, 65
formatting changes when upgrading, 680
guidelines for layouts, 405
laying out, 405
multilingual, 442
not rendering pages when there is no data, 67
opening and saving locally, 509
opening from the clipboard, 510
pages, 50
producing in CSV format, 68
producing in Microsoft Excel format, 69
producing in XML format, 70
removing section headings, 155
reusing styles, 407
running, 65
running against dimensional data sources, 67
running against SAP BW, 67
running in Report Studio, 65
saving in Report Studio, 64
setting PDF page options, 70
troubleshooting error cells produced, 202
upgrading, 517
validating, 63
See master detail relationships
report samples, 521
report specifications
creating, 59
definition, 689
viewing, 57
Report Studio
changing default classes, 428
Insertable Objects pane, 47, 48
nulls included in count summaries, 672
Properties pane, 47
saving reports, 64
setting options, 53
unexpected summary values when using nested
sets, 675
user interface, 46
visual aids, 48
report types
charts, 93
crosstabs, 83
lists, 77
Required, 643
required prompts, 399
resizing
objects, 426
reusing
objects, 422
styles, 407
Rich Text Item, 585
rich text items
inserting, 413
supported elements, 415
Right Position (px), 644
rolling averages, 416
Rollup Aggregate Function, 644
Rollup Processing, 644
Root Members Only, 644
Rotate Values, 645
rounding modes
number of decimals, 454
Row Coordinate, 645
Row Number, 585
row numbers
inserting, 413
rows
swapping, 89
rows per page
controlling, 68
Rows Per Page, 65, 645
RQP-DEF-0177 errors, 681
RSV-SRV-0025 errors, 676
RSV-SRV-0040 errors, 669
running reports, 65
against dimensional data sources, 67
against SAP BW, 67
cannot find database, 678
ORA-00907 error, 678
running totals
dimensional functions, 230
troubleshooting, 680
run options
setting, 65
SSafari Web browsers
drill-through links not active, 680
Professional Authoring User Guide 709
Index
samples, 521
general employee information, 523
general financial information, 522
general sales and marketing information, 524
GO data warehouse, 525
GO Sales transactional database, 526
Great Outdoors, 521
Great Outdoors company structure, 522
model design, 524
SAP BW data sources
creating burst reports, 450
limitations when calculating data, 231
limitations when creating expressions, 253
limitations when sorting data, 212
query calculations, 672
running reports against, 67
sectioning reports, 672
SAP variable properties
unsupported, 67
saving
reports, 64
reports locally, 509
taking a long time, 672
Scale, 645, 667
Scale Interval, 645
scales
changing intervals, 123
linear, 123
logarithmic, 123
Scatter Chart, 585
scatter charts, 103
scope
setting in summary filters, 165
using in drill-through access, 479
Scope, 645
screen resolution requirements, 46
scrollbars
adding to block objects, 426
SDK, See IBM Cognos 8 Software Development Kit
searching
dimensions, 194
searching for values
unexpected results, 252
searching reports, See finding objects
Secondary Group Size (digits), 667
section headings
creating, 154
removing, 155
sectioning reports
SAP BW data sources, 672
sections
creating for dimensional data, 506
sector charts, See pie charts
Secure Socket Layer
Microsoft Excel limitations, 548
Security Error Characters, 667
Select & Search Prompt, 586
select and search prompts, 392
Select UI, 646
Separator, 646
Series Color, 646
Set Expression, 586
set expressions, 234
Set Operation, 646
sets
creating, 192
nested or parallel sets overlapping, 671
Set Sorting, 646
Share Result Set, 646
Show Caption, 647
Show Data Points, 647
Show Data Range in Legend, 647
Show Features with No Data, 647
Show Feelers, 647
showing
objects, 438
report specifications, 57
Show Legend Values, 647
single-edge crosstabs
creating, 87
Singleton, 586
singletons
inserting, 62
Size & Overflow, 426, 648
Size Legend Title, 648
sizes
specifying for objects, 426
slicer filters
prompting, 211
Slicer Member Set, 586
710 Report Studio
Index
slicers, 208
changed features, 38
solve order, 235
combined with calculated rollup aggregate func-
tion, 236
dimensional data sources, 237
Solve Order, 648
sorting
data in dimensional reporting, 211
data in relational reporting, 170
multiple columns, 171, 213
Sorting, 648
source trees
customizing, 196
Source Type, 648, 649
spaces
adding around objects, 419
Spacing & Breaking, 649
Spacing and Breaking, 425
special values, 37
specifying
fonts, 410
labels, 130
packages, 59
spider charts, See radar charts
Spider Effects, 650
SQL, 586, 650
adding your own, 185, 224
converting to, 186, 226
editing, 186, 226
first-rows optimization, 186, 226
IBM Cognos, 184, 224
native, 184, 224
viewing, 184, 224
working with, 184, 224
SQL Join Syntax, 650
SQL Syntax, 650
SSAS cubes
problems when very large, 241
SSL, See Secure Socket Layer, 548
stacked charts, 108
standard charts, 108
Standard Deviations, 650
star charts, See radar charts
Static Choices, 650
status
showing and hiding in prompts, 401
strings
concatenating, 253
studios
Essbase changes, 671
styles
conditional, 431
reusing, 407
style sheets
definition, 689
Style Variable, 651
Subtitle, 651
subtotals
grouped lists, 670
summaries
adding in dimensional reporting, 197
adding in relational reporting, 156
automatic, 160, 203
average, 160, 203
calculated, 160, 203, 236
count, 160, 203
count distinct, 160, 203
custom, 160, 203
definition, 690
maximum, 160, 203
median, 160, 203
minimum, 160, 203
none, 160, 203
not applicable, 160, 203
rolling and moving averages, 416
standard deviation, 160, 203
summarize, 160, 203
total, 160, 203
troubleshooting, 676
variance, 160, 203
summarizing
data in dimensional reporting, 197
data in relational reporting, 156
Summary Filter, 587
summary filters, 165
summary functions
limitations when using for clauses, 159
using in data item expressions in relational report-
ing, 159
Professional Authoring User Guide 711
Index
summary values
unexpected when using nested sets, 675
Suppress, 651
suppressing
data, 236
empty cells, 456
Suppression, 652
swapping
columns and rows, 89
TTable, 587
Table Cell, 587
table of contents, 34
creating, 500
Table of Contents, 587, 652
Table of Contents Entry, 587
Table of Contents Name, 652
Table Properties, 652
Table Row, 588
tables
applying styles, 418
inserting, 413, 418
table widths
Microsoft Excel limitations, 548
tabular data
viewing, 65
Target Color, 652
Target Marker, 652
Target Marker Border Color, 652
Target Marker Position, 653
Target Measure, 588
Target Range (%), 653
target reports
creating for drilling through from IBM Cognos Series
7, 491
templates
background colors not appearing, 670
converting from reports, 507
creating, 507
definition, 690
text
adding, 409
formatting, 409
Text, 653
Text Box Prompt, 588
text box prompts, 392
Text Flow & Justification, 653
Text Flow and Justification, 424
Text Item, 588
Text Source Variable, 653
Thousands Separator, 667
Time, 588
Time Prompt, 589
time prompts, 392
Time Separator, 667
Time Style, 667
Time Unit, 668
Title, 654
titles
chart axis, 133
in maps, 140
TM1 data sources
differences, 674
differences in data tree, 674
TM1 Executive Viewer, 674
TOC
creating, 500
Tolerance Color, 654
Tolerance Label, 654
Tolerance Measure, 589
tooltips
in maps, 140
Tooltips, 654
Top Position (px), 654
Total Column, 589, 654
Total Column Color, 655
Total Column Label, 589
totals
troubleshooting running totals, 680
Tree Prompt, 589
tree prompts, 392
controlling the data that appears, 404
trees
customizing, 196
trend lines, 123
troubleshooting
summaries in reports, 676
Truncation, 655
Truncation Text, 655
tuples, 235
Type, 655
712 Report Studio
Index
UUDA-SQL-0114 errors, 676, 681
UDA-SQL-0206 errors, 676
UDA-SQL-0564 errors, 681
unbalanced hierarchies, 195
ungrouping
data, 150
union query
creating, 177
units of measure, 453
units of measure notation, 67
unlocking objects, 52
unsupported SAP variable properties, 67
updating
copied objects, 424
name references, 515
referenced objects, 424
upgrade messages
removing, 517
upgrading
changes to product behaviors, 37, 517
upgrading reports
applications errors, 669
formatting not retained, 680
members not suppressed for SAP BW, 517
removing upgrade messages, 517
report will not open, 678
thousands separators, 518
Upper Range Skew (%), 656
URL, 656
URL Source Variable, 656
Usage, 656
Use 1.x Behavior, 656
Use Aggregate Cache, 657
Use Detail Value on Page, 657
Use for Parameter Info, 657
Use Local Cache, 657
user input
requiring in prompts, 399
user profiles, 56
changing, 57
User SAP Member Cache, 657
Use Same Range For All Instances, 658
Use SAP MUN as Business Key, 658
Use SQL Parameters, 658
Use SQL With Clause, 658
Use Thousands Separator, 658, 668
Use Value, 658, 659
Vvalidating
reports, 63
Value Location, 659
value markers
charts, 117
Value Prompt, 590
value prompts, 392
Value Representation, 659
values
special, 37
specifying in prompts, 401
suppressing when missing, 456
Values, 659
Value Type, 660
Variable, 590
variables
adding, 437
conditional rendering, 436
conditional styles, 435
Vertical Alignment, 660
vertical bar charts, See column charts
viewing
MDX, 224
report specifications, 57
SQL, 184, 224
tabular data, 65
Visible, 660
visual aids, 48
Visual Angle, 660
Wwaterfall charts, See progressive column charts
Web browsers
configuring, 56
Web-safe
color palettes, 430
White Space, 660
white spaces
margins, 419
padding, 419
Width (px), 661
Professional Authoring User Guide 713
Index
widths
Microsoft Excel limitations, 548
specifying for objects, 426
Win Color, 661
Win-Loss Chart, 590
win-loss charts, 100
creating, 115
Win-Loss Measure, 590
Win-Loss Threshold, 661
word breaks, 425
work areas
definition, 690
XX Axis, 590, 591, 661
X Axis Measure, 591
XLS format
limitations, 545
XML
producing a report, 70
report specifications, 57
XY charts, See scatter charts
YY1 Axis, 591, 661
Y2 Axis, 591, 661
Y2 Axis Position, 662
Y Axis, 591, 592, 662
Y Axis Measure, 592
YK-ERR-0008 errors, 254
ZZ Axis, 592
Z Axis Measure, 592
zeros
suppressing, 456
Zero Value Characters, 668
714 Report Studio
Index