Report of Financial Ratio of Malaysia Airlines System Berhad FIN 670
32
Financial Ratio of Malaysia Airlines System Berhad 1 Report of Financial Ratio of Malaysia Airlines System Berhad FIN 670 Universiti Teknologi MARA Prepared by: A’imullah bin Abd Halim 2010336497 Eva Salmee Mohd Salleh 2009713479 Mohd Khairil bin Mahmood 2010177225 Nurunnadiah binti ab Aziz 2010532647 Shaila Shermin bt Kamaluddin 2010566071 Ruzaimah Rubain 2010710629 Supervised by: Dr Jaafar Pyeman
Transcript of Report of Financial Ratio of Malaysia Airlines System Berhad FIN 670

Financial Ratio of Malaysia Airlines System Berhad 1
Report of Financial Ratio of Malaysia Airlines System Berhad
FIN 670
Universiti Teknologi MARA
Prepared by:
A’imullah bin Abd Halim 2010336497
Eva Salmee Mohd Salleh 2009713479
Mohd Khairil bin Mahmood 2010177225
Nurunnadiah binti ab Aziz
2010532647
Shaila Shermin bt Kamaluddin 2010566071
Ruzaimah Rubain 2010710629
Supervised by:
Dr Jaafar Pyeman
Financial Ratio of Malaysia Airlines System Berhad 2
Objectives
Analysis and investigation of financial ratios for MAS has
been done from five year annual report starting from 2005 to
2009. Thus the objectives are:
1. Study of liquidity of MAS from 2005 to 2009
2. Study of activity of MAS from 2005 to 2009
3. Study of profitability of MAS from 2005 to 2009
4. Study of leverage of MAS from 2005 to 2009
5. Forecast the future performance of MAS in terms of
liquidity, operating activity, profitability,
shareholders equity and leverage.
Introduction
Malaysia Airlines is listed on the stock exchange of Bursa
Malaysia under the name Malaysian Airline System Berhad (MYX:
3786). Its parent company is Penerbangan Malaysia Berhad. The
airline has suffered high losses over the years as a result of
fuel price increases and poor management. The Government of
Malaysia overhauled the operations of the airline and Idris
Jala was appointed as the new CEO in 1st December 2005. Under
his leadership, Malaysia Airlines unveiled its Business
Turnaround Plan (BTP) in February 2006 which highlighted low
yield, an inefficient network and low productivity
(overstaffing). The airline headquarters building in downtown
Financial Ratio of Malaysia Airlines System Berhad 3
Kuala Lumpur has been sold. The new corporate headquarters is
now at Sultan Abdul Aziz Shah Airport in Subang, Petaling.
The airline is owned by Penerbangan Malaysia Berhad
(PMB) (69.34%), Employees Provident Fund Board (10.72%),
Amanah Raya Nominees (Tempatan) Sdn Bhd (5.69%), State
Financial Secretary Sarawak (2.71%) and Warisan Harta Sabah
(2.4%). It has 19,546 employees (in March 2007)
In the past, MAS is believed to have over expanded its
routes and airlines fleet. It is also said to have embarked on
aggressive cost cutting, which caused negative impact on its
service quality and marketing plan. A previous restructuring
saw it disposing of aircraft assets and domestic losses to a
Khazanah Nasional Bhd owned entity.
Today, MAS fuel cost are insufficiently hedged. The
airline also struggled to come up with an effective pricing
systems which would enable it to past on the fuel cost to
customers. To make matters more challenging MAS has faced
intense competition from low cost airlines company, AirAsia,
on the domestic front, which led MAS to cut fares, a move that
had likely affect its profitability.
Therefore this study will explore the MAS financial
performance by using ratio analysis that focus on liquidity,
activity, debt and profitability ratio.
Results and discussions
Financial Ratio of Malaysia Airlines System Berhad 4
1. Liquidity ratio
Liquidity ratio is used to measure a firm ability to satisfy
its short-term obligations as they come due. In addition,
liquidity refers to solvency of the firm’s overall financing
position- the ease with which it can pay its bills. In short
it reflects to answer; can the firm pay its bills? The two
basic measures of liquidity are the current ratio and the
quick (acid-test) ratio.
1.1. Current ratio
The current ratio is the indication of company’s ability to
meet short-term debt obligations. The higher the ratio, the
more liquid the company is. The current ratio is calculated as
equal to current assets divided by current liabilities. On
others hand, the current ratio also can gives an investor a
better idea of how much safety a company has in paying its
current liabilities regardless of the size of the company.
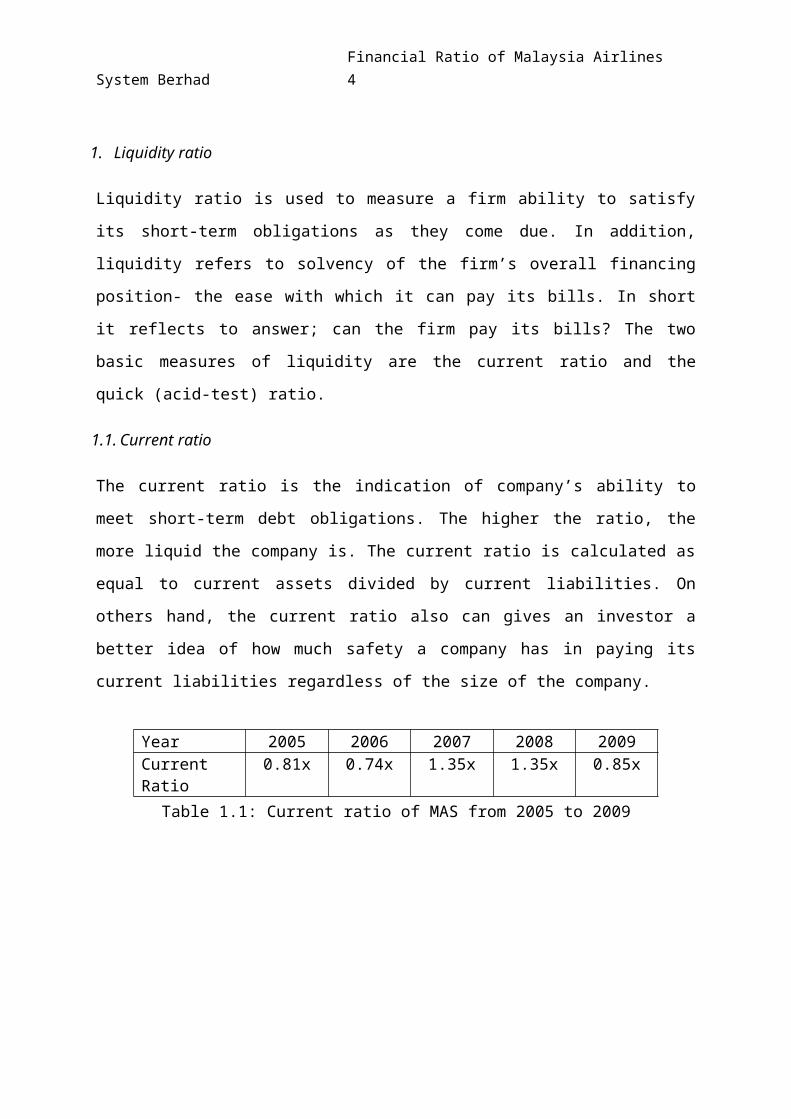
Table 1.1: Current ratio of MAS from 2005 to 2009
Year 2005 2006 2007 2008 2009Current Ratio
0.81x 0.74x 1.35x 1.35x 0.85x
Financial Ratio of Malaysia Airlines System Berhad 5
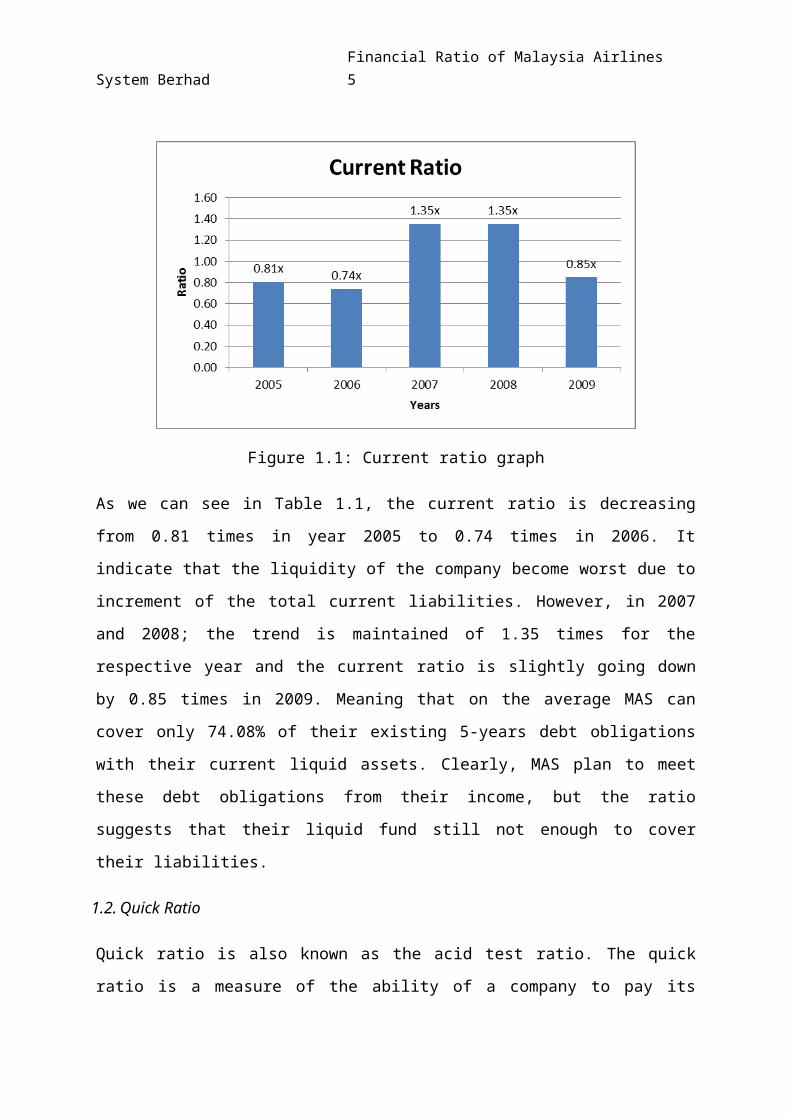
Figure 1.1: Current ratio graph
As we can see in Table 1.1, the current ratio is decreasing
from 0.81 times in year 2005 to 0.74 times in 2006. It
indicate that the liquidity of the company become worst due to
increment of the total current liabilities. However, in 2007
and 2008; the trend is maintained of 1.35 times for the
respective year and the current ratio is slightly going down
by 0.85 times in 2009. Meaning that on the average MAS can
cover only 74.08% of their existing 5-years debt obligations
with their current liquid assets. Clearly, MAS plan to meet
these debt obligations from their income, but the ratio
suggests that their liquid fund still not enough to cover
their liabilities.
1.2. Quick Ratio
Quick ratio is also known as the acid test ratio. The quick
ratio is a measure of the ability of a company to pay its
Financial Ratio of Malaysia Airlines System Berhad 6
short-term debts. As with all ratios, how high a quick ratio
should be varies among industries, but usually a quick ratio
of 1:1 or higher is considered good. In other words, a quick
ratio of 100% tells creditors that the company could pay its
immediate bills even if no inventory is converted to cash.
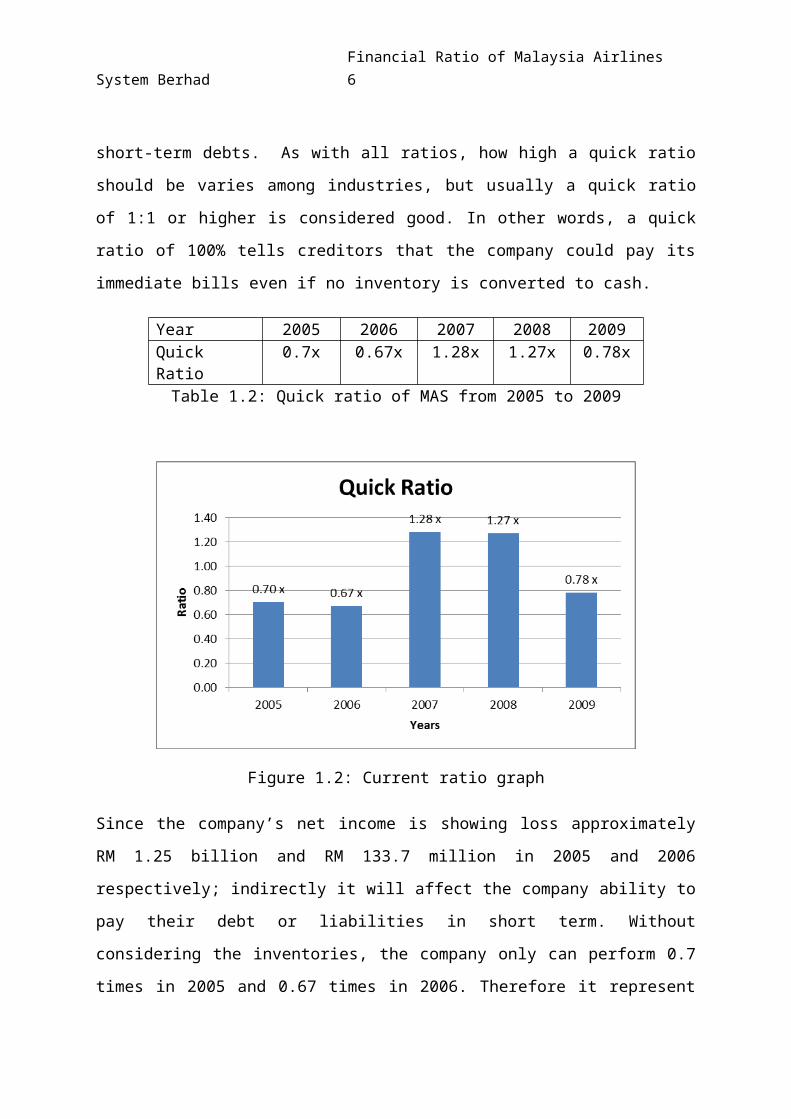
Year 2005 2006 2007 2008 2009Quick Ratio
0.7x 0.67x 1.28x 1.27x 0.78x
Table 1.2: Quick ratio of MAS from 2005 to 2009
Figure 1.2: Current ratio graph
Since the company’s net income is showing loss approximately
RM 1.25 billion and RM 133.7 million in 2005 and 2006
respectively; indirectly it will affect the company ability to
pay their debt or liabilities in short term. Without
considering the inventories, the company only can perform 0.7
times in 2005 and 0.67 times in 2006. Therefore it represent
Financial Ratio of Malaysia Airlines System Berhad 7
that MAS is doing fairly poor in managing their yield. However
in 2007 and 2008, the company liquidity is maintained at 1.28
times and 1.27 times for respective year. In 2008, the quick
ratio is higher thus the company financial performance in term
of liquidity is considered good. Moreover, due to large amount
of current liabilities; the company quick ratio is totally
drops to 0.78 times in 2009. It indicates the company had a
problem in managing their assets fund. The overall liquidity
of the firm seems to exhibit that MAS had a better improvement
in term of managing the cost or cost control. Even though the
current assets are low and being said as not efficiently
manages; MAS still be able to meet its short term obligations.
2. Activity ratio
Activity ratio defines as an accounting ratio that measure a
firm's ability to convert different accounts within their
balance sheets into cash or sales. Companies will typically
try to turn their production into cash or sales as fast as
possible because this will generally lead to higher revenues.
Such ratios are frequently used when performing fundamental
analysis on different companies. The asset turnover ratio and
inventory turnover ratio are good examples of activity ratios.
2.1. Total assets turnover
The amount of sales generated for every dollar's worth of
assets. Asset turnover measures a firm's efficiency at using
Financial Ratio of Malaysia Airlines System Berhad 8
its assets in generating sales or revenue - the higher the
number the better. It also indicates pricing strategy:
companies with low profit margins tend to have high asset
turnover, while those with high profit margins have low asset
turnover.
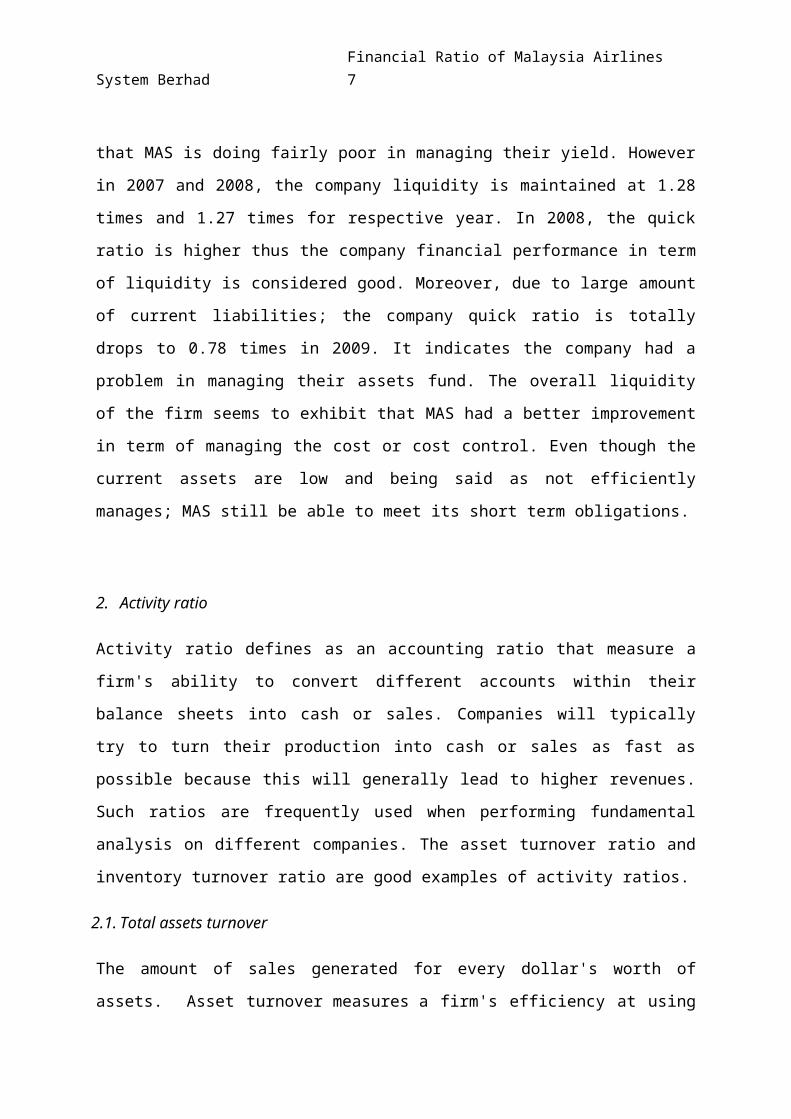
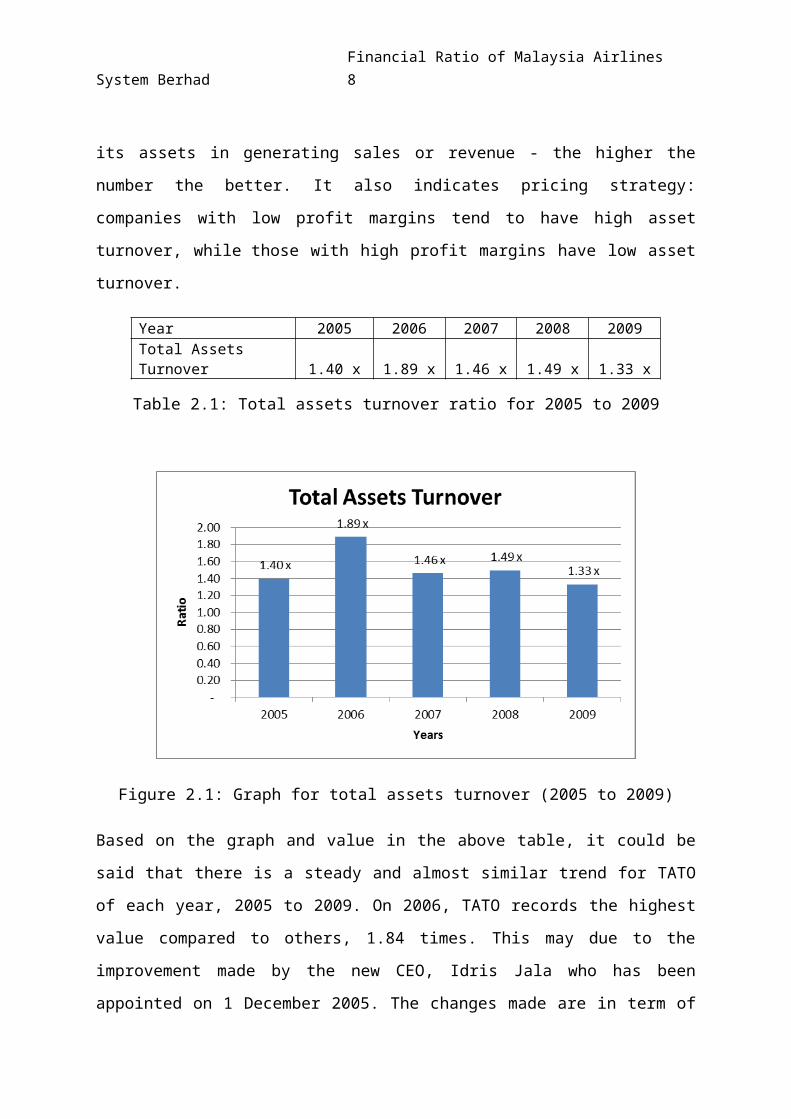
Year 2005 2006 2007 2008 2009Total Assets Turnover 1.40 x 1.89 x 1.46 x 1.49 x 1.33 x
Table 2.1: Total assets turnover ratio for 2005 to 2009
Figure 2.1: Graph for total assets turnover (2005 to 2009)
Based on the graph and value in the above table, it could be
said that there is a steady and almost similar trend for TATO
of each year, 2005 to 2009. On 2006, TATO records the highest
value compared to others, 1.84 times. This may due to the
improvement made by the new CEO, Idris Jala who has been
appointed on 1 December 2005. The changes made are in term of
Financial Ratio of Malaysia Airlines System Berhad 9
MAS’s corporate culture and in operations definitely helps to
increase TATO for year 2006. One of the most significant
things done by MAS for the year 2006 is when MAS sell their
headquarters office which later helps to increase their cash
balance. In 2009, MAS’s TATO records the lowest value ever as
the economic crisis which occurred in 2008. Almost every
industry got affected due to the recession.
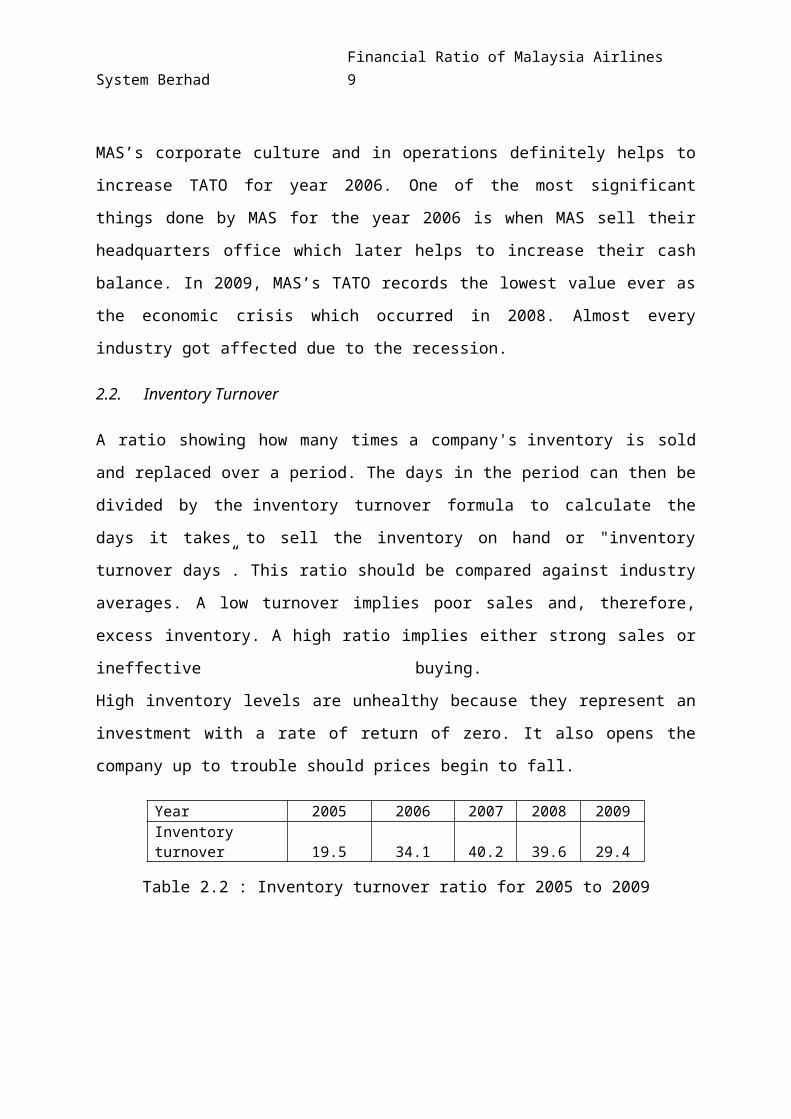
2.2. Inventory Turnover
A ratio showing how many times a company's inventory is sold
and replaced over a period. The days in the period can then be
divided by the inventory turnover formula to calculate the
days it takes to sell the inventory on hand or "inventory
turnover days”. This ratio should be compared against industry
averages. A low turnover implies poor sales and, therefore,
excess inventory. A high ratio implies either strong sales or
ineffective buying.
High inventory levels are unhealthy because they represent an
investment with a rate of return of zero. It also opens the
company up to trouble should prices begin to fall.
Year 2005 2006 2007 2008 2009Inventory turnover 19.5 34.1 40.2 39.6 29.4
Table 2.2 : Inventory turnover ratio for 2005 to 2009

Financial Ratio of Malaysia Airlines System Berhad 10
Figure 2.2 : Graph for inventories turnover (2005 to 2009)
Based on the graph above, we can see that from the year 2005
to 2008, there’s been an increment of ITO value. By referring
to year 2005, we can see that it recorded the lowest ITO value
ever as MAS are struggling with their bad financial situations
due to debts, higher costs and poor sales. It starts to
increase from year 2006 onwards and for the year 2007, ITO
value for MAS records the highest value ever compared to 5
year period (2005-2009). This is due to the changes made by
the new management team led by Dato Sri Idris Jala. Year 2007
and 2008 is slightly similar in term of ITO thanks to the good
management and business decision. For the year 2009, ITO value
for MAS declined as it was the effect of the global economic
crisis for year 2008.
2.3. Average collection period
Financial Ratio of Malaysia Airlines System Berhad 11
The average collection period has to do with the relationship
between Accounts Receivable and the time frame in which those
outstanding payments are received. The information of ACP
allows the company to anticipate cash flow generated by
services rendered. It is easier for the company to schedule
payments for services rendered to their own vendor partners,
as well as arranges to keep funds on hand to handle day to day
operations, meet payrolls, and other important aspects of
doing business. The collection period or average collection
period must be compared to competitors to see whether the
credit given, and customer risk, is in line with the industry.
A high collection period shows a high cost in extending credit tocustomers.
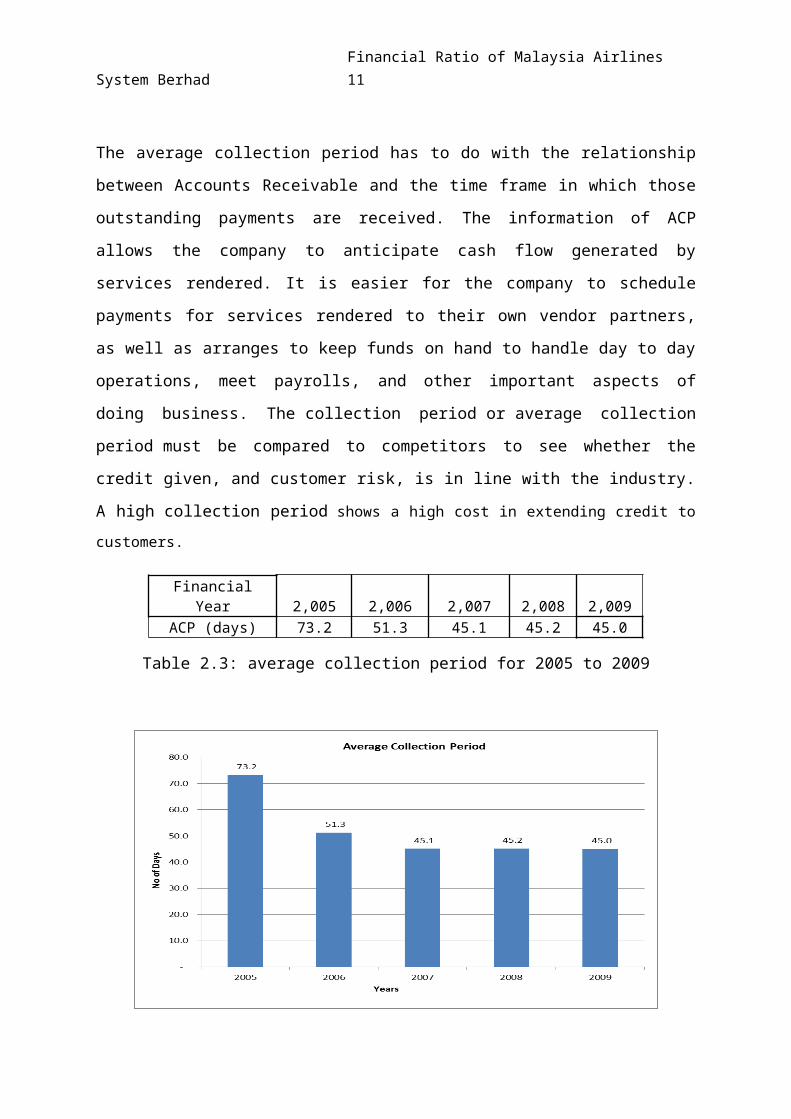
FinancialYear 2,005 2,006 2,007 2,008 2,009
ACP (days) 73.2 51.3 45.1 45.2 45.0
Table 2.3: average collection period for 2005 to 2009
Financial Ratio of Malaysia Airlines System Berhad 12
Figure 2.3 : Graph for average collection period for 2005 to
2009
In the year 2005, MAS was having the highest ACP which is 73.2
days. However, it was declining to 51.3 days on 2006 as well
as year 2007 onwards which they maintain the ACP around 45
days. During this period, MAS had a lot changes in their
account policy where they had adopted of new and revised
Financial Reporting Standard (FRS). However, in year after
2006, the revision made is lesser.
3. Profitability ratio
A class of financial metrics that are used to assess a
business's ability to generate earnings as compared to its
expenses and other relevant costs incurred during a specific
period of time. For most of these ratios, having a higher
value relative to a competitor's ratio or the same ratio from
a previous period is indicative that the company is doing
well.
3.1. Net profit margin
Net profit margin is after-tax net income divided by net saleswhich is a measure of management's ability to carry a dollar of
sales down to the bottom line for the stockholders. In other words,
net profit margin refers to that which is left for the owners from a
dollar of sales after all expenses and taxes have been paid.

Financial Ratio of Malaysia Airlines System Berhad 13
Year 2005 2006 2007 2008 2009
GPM-
13.9% -2.5% 3.8% 2.0% -5.4%
NPM-
14.0% -1.0% 5.8% 1.6% 4.6%Table 3.1: GPM and NPM of MAS for 5 years
Figure 3.1: Graph of Net Profit Margin
Based on the figure above, it shown that MAS incur highest
losses on 2005 where the net profit margin for year 2005 is
-14%. In 2005, MAS identified several weaknesses which cause
RM1.3 billion loss. The weaknesses include escalating fuel
price, increased maintenance and repair cost, staff cost,
low yield per available seat kilometers via poor yield
management and inefficient route network. On 1st December
2005, Government of Malaysia appointed Idris Jala as the new
CEO of MAS. The sales and profit had increased then, year by
year. The highest net profit margin is in 2007 where the
profit in 2007 is the highest compared to other 5 years.
Financial Ratio of Malaysia Airlines System Berhad 14
However, in 2008 the net profit slightly decline due to the
global economic crisis and affected our country.
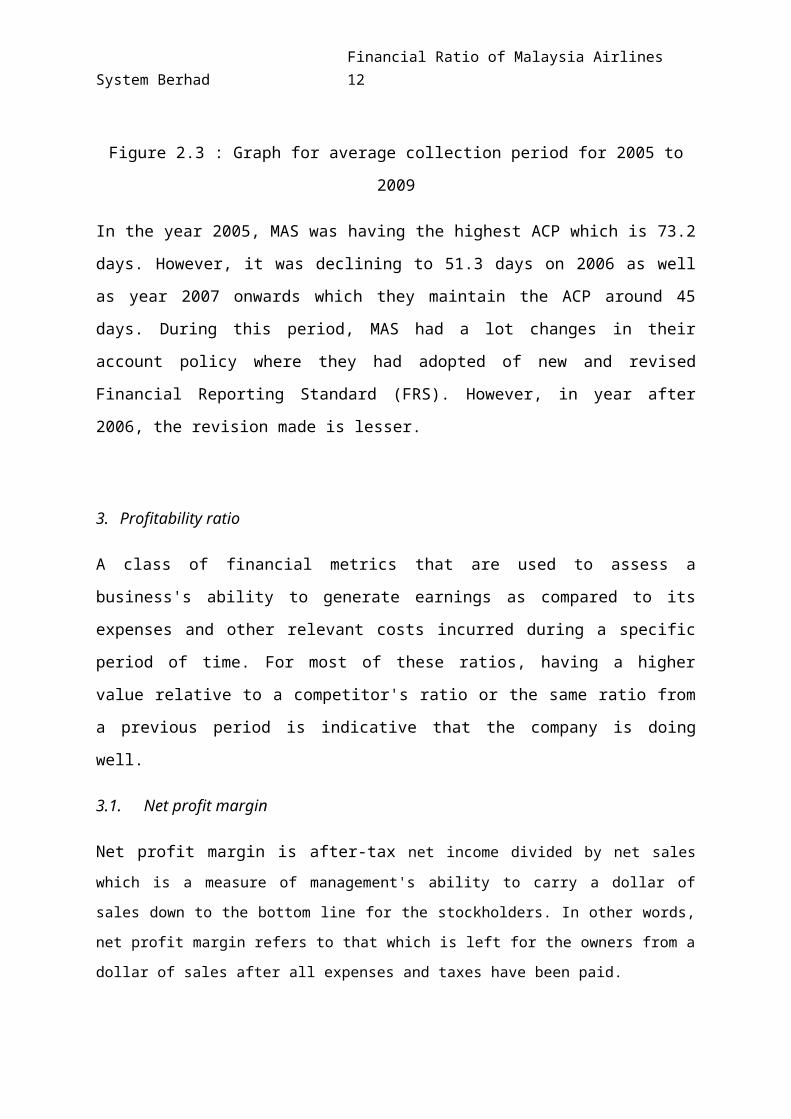
3.2. GPM versus NPM
Figure 3.2: Graph of GPM versus NPM
Referring to the figure above, NPM and GPM for 5 years are
almost the same except for year 2009. This situation is due to
derivative gain incurred by MAS on 2009. Derivative gain
consists of realized gain or loss on settlement of hedging
contracts during the quarter and the fair value changes due to
movement mark-to-market (MTM) position on non-designated
hedging contracts and ineffective portion of cash flow hedges
at 31st December 2009 compared to 1st January 2009.
3.3. Return on assets

Financial Ratio of Malaysia Airlines System Berhad 15
Return on assets (ROA) is a measure of asset intensity which
is , it will indicates how much profit a company generated for
each dollar in assets brought to the company. In other word,
it showed an effectiveness of a company in generating profits
with its available assets.
YEAR RETURN ON ASSET RETURN ON EQUITY 2005 -20.0% -62.1%2006 -1.9% -7.1%2007 8.5% 21.6%2008 2.4% 5.9%2009 5.8% 66.0%
Table 3.3 : Return on assets and return on equity of MAS for
2005 to 2009
Figure 3.3: Graph of Return on Assets
Like MAS (as an aircraft company) considered as a very asset-
intensive, meaning they required big, expensive machinery or
equipment to generate more profit. A measure of profit show
how a percentage of the capital that is handled. The lower
the profit per dollar of assets, the more asset-intensive a

Financial Ratio of Malaysia Airlines System Berhad 16
business is. High profit margin indicates good cost control,
whereas a high asset turnover ratio demonstrates efficient use
of the assets on the balance sheet. If refers to Figure 3.3,
in year of 2005 ROA of MAS is -20.0%, indicates inefficient
use of the assets in the company since the net income in that
year is the lowest compare with others 5 years. During that
year, MAS is concentrate more in escalating fuel price,
increased maintenance and repair cost, staff cost, low yield
per available seat kilometers via poor yield management and
inefficient route network instead of focusing on utilising
their assets to generate more profits. After taken over by
Idris Jala on 1st December 2005, MAS started to recover from
2005 until 2009. Year of 2007 shown huge improvement of assets
handling in MAS since in that year ROA value is the highest
(8.5%) due to very high net income generated from the wisely
utilization of assets in the company.
3.4 Return on equity
Return in equity (ROE) reveals how much profit a company
earned in comparison to the total amount of shareholder equity
found on the balance sheet. A business that has high return on
equity is more likely to be one that is capable of generating
cash internally. Companies that boost a high return on equity
with little or no debt are able to grow without large capital
expenditures, allowing the owners of the business to
withdrawal cash and reinvest in elsewhere.
Financial Ratio of Malaysia Airlines System Berhad 17
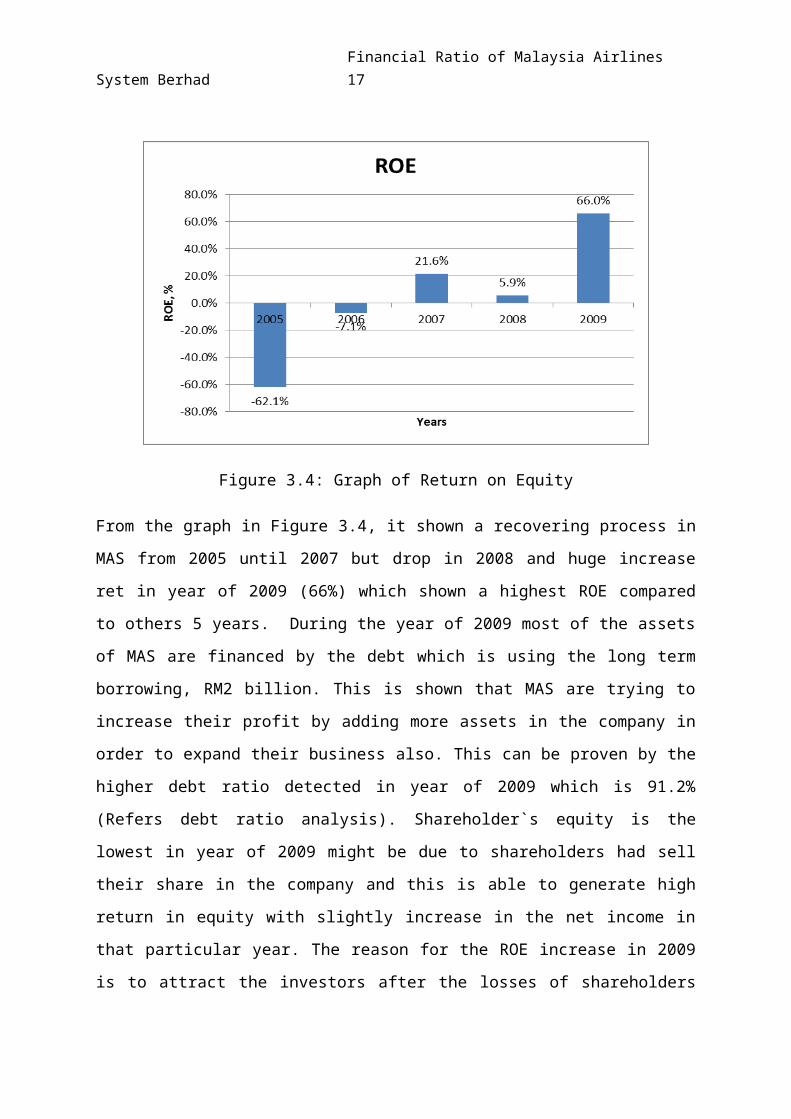
Figure 3.4: Graph of Return on Equity
From the graph in Figure 3.4, it shown a recovering process in
MAS from 2005 until 2007 but drop in 2008 and huge increase
ret in year of 2009 (66%) which shown a highest ROE compared
to others 5 years. During the year of 2009 most of the assets
of MAS are financed by the debt which is using the long term
borrowing, RM2 billion. This is shown that MAS are trying to
increase their profit by adding more assets in the company in
order to expand their business also. This can be proven by the
higher debt ratio detected in year of 2009 which is 91.2%
(Refers debt ratio analysis). Shareholder`s equity is the
lowest in year of 2009 might be due to shareholders had sell
their share in the company and this is able to generate high
return in equity with slightly increase in the net income in
that particular year. The reason for the ROE increase in 2009
is to attract the investors after the losses of shareholders
Financial Ratio of Malaysia Airlines System Berhad 18
in 2009. From the ROA and ROE calculation, it can be conclude
that MAS are trying to improve their assets management in
order to get higher returns from year to year by using
internal and external financial sources.
4. Leverage ratio
The financial leverage of a company is to get an idea of the
company's methods of financing or to measure its ability to
meet financial obligations. There are several different
ratios, but the main factors looked at include debt, equity,
assets and interest expenses.
4.1. Debt to total assets ratio
Debt to total asset ratio indicates the financial leverage of
the company.it is percentage of total asset that financed by
creditor, liabilities and debt. High debt ratio shows that a
corporation has a high level of financial leverage.
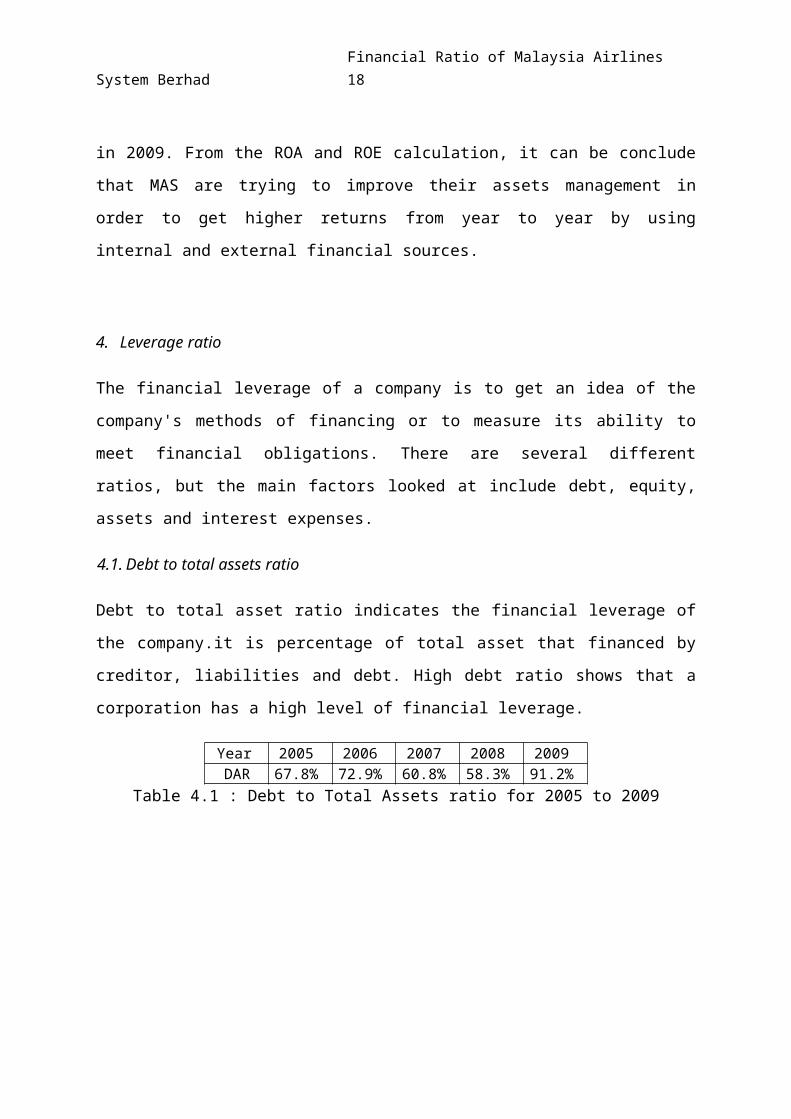
Year 2005 2006 2007 2008 2009DAR 67.8% 72.9% 60.8% 58.3% 91.2%
Table 4.1 : Debt to Total Assets ratio for 2005 to 2009
Financial Ratio of Malaysia Airlines System Berhad 19
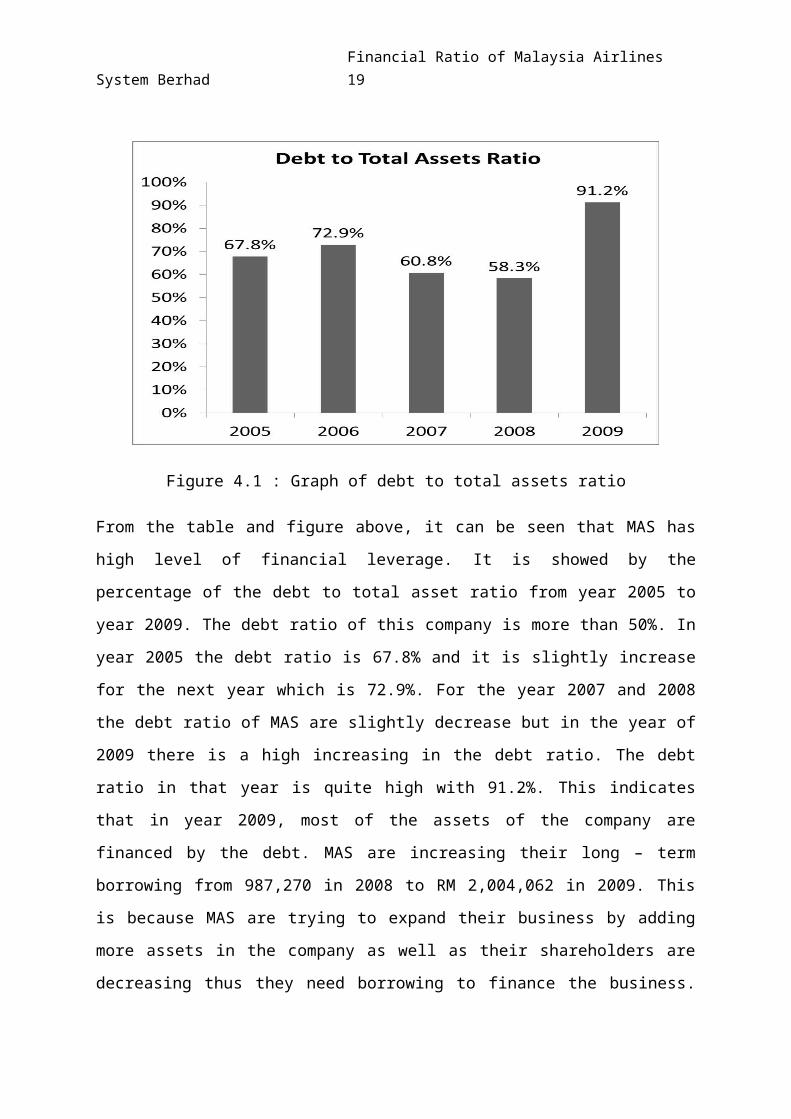
Figure 4.1 : Graph of debt to total assets ratio
From the table and figure above, it can be seen that MAS has
high level of financial leverage. It is showed by the
percentage of the debt to total asset ratio from year 2005 to
year 2009. The debt ratio of this company is more than 50%. In
year 2005 the debt ratio is 67.8% and it is slightly increase
for the next year which is 72.9%. For the year 2007 and 2008
the debt ratio of MAS are slightly decrease but in the year of
2009 there is a high increasing in the debt ratio. The debt
ratio in that year is quite high with 91.2%. This indicates
that in year 2009, most of the assets of the company are
financed by the debt. MAS are increasing their long – term
borrowing from 987,270 in 2008 to RM 2,004,062 in 2009. This
is because MAS are trying to expand their business by adding
more assets in the company as well as their shareholders are
decreasing thus they need borrowing to finance the business.
Financial Ratio of Malaysia Airlines System Berhad 20
The debt ratio in year 2009 indicates that MAS are facing the
high risk of the bankruptcy because they are depending too
much on debt in order to finance their assets.
4.2 Time interest earn
Time interest earned (TIE) used to measure company ability to
meets its obligation. It indicates how many times a company
can cover the interest charges on pretax basis. The high ratio
can indicate the company has an undesirable lack of debt or is
paying down too much debit with earning that could be used for
other project.
Year 2005 2006 2007 2008 2009
TIE
-214.6x
6.13x
18.67x
5.03x
1.47x
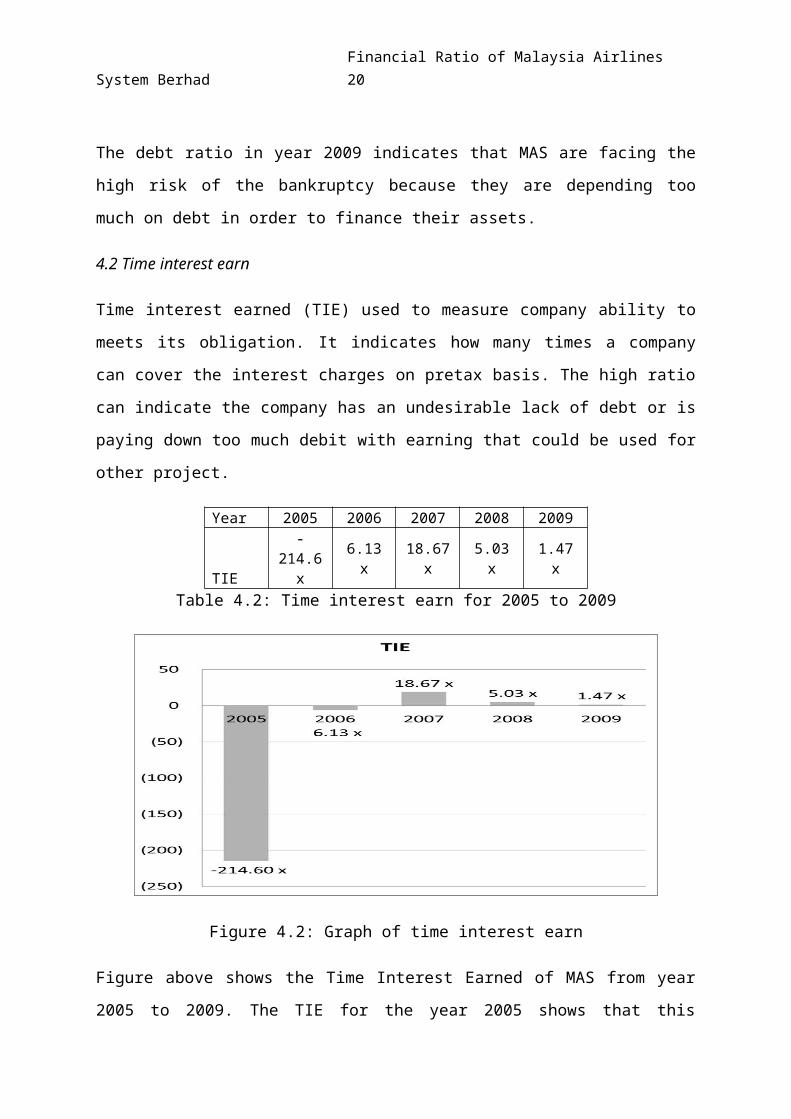
Table 4.2: Time interest earn for 2005 to 2009
Figure 4.2: Graph of time interest earn
Figure above shows the Time Interest Earned of MAS from year
2005 to 2009. The TIE for the year 2005 shows that this

Financial Ratio of Malaysia Airlines System Berhad 21
company is making loss. The TIE for that year is -214.60 times
showing that the losses cannot cover the interest charge for
that year. In year 2006, the TIE was increase but still making
a loss. The TIE for that year is -6.13. The company is
improved but still makes a loss. The TIE for the year 2007 is
increase to 18.67 and this indicates that the company able to
pay 18.67 times the interest using their earning. For the year
2008 and 2009 the TIE slightly decrease. From the year 2005
until 2009, we can see that the company is growing and keep
making the profit since they can cover their interest using
their earned except for the earlier year 2005 and 2006.
However, in 2009 TIE is declining and it indicates the high
interest of the borrowing that they made in 2009. Thus, it
leads to the high risk of bankruptcy.
5. Forecast of ratios
There are a few factors in order to forecast the financial
ratio of MAS based on reports, expectations, strategy, annual
reports, present economic situations, share price and
etcetera. The good factors that effected the decision of
forecasting MAS are:
i. KLCI is boomed from July 2010 to December 2010 between
1300 to 1500 points respectively. Within year 2011, it
maintained at approximately slightly more than 1500. Thus,
it indicates a good economic situation and stability.
Financial Ratio of Malaysia Airlines System Berhad 22
ii. There is growth in Asia Pacific region in airlines
industry as well as other region especially Middle East
Asia showed rapid growth of airlines industry.
iii. MAS bought new aircrafts Airbus A330-300s and A330-300.
iv. “Everyday low fares” had been introduced in May 2008 in
order to increase the average capacity seated, 70%.
v. Partnership codeshare agreement with 31 Airlines companies
in July 2010.
vi. A330-300s will reduce cost 15% by 2015 as it has fewer
seats, low fuel and maintenance cost. With fewer seats it
can turn around faster, ply more routes and longer range.
vii. Newly changes in boardroom, thus it gives fresh and new
air within the company.
viii. Increased 11% passengers in India, and MAS are targeting
20% increase a year.
The bad factors that MAS has to face and might affect the
performance of the company are:
i. Jet fuel surcharges are soared at 10%.
ii. Japan tragedy of earthquakes, tsunami and nuclear in March
2011 and MAS had to stop the flight from 7 to 11 times a
week.

Financial Ratio of Malaysia Airlines System Berhad 23
iii. MAS share price fell to RM 1.84 in March 23th, 2011.
However, the trends showed that it always drop at 1st
quarter or the year and increase back in 2nd quarter and so
on.
iv. Internal Air Travel Association predicted that in 2011,
the airlines company net profit decrease 50% due to many
factors such as increasing of fuel, Japan’s disaster and
many more.
5.1 Forecast of Quick Ratio
Figure 5.1: Quick Ratio for 2011 onwards (including 2009 and
2010)
From the graph above, it can be seen the quick ratio of 2009
declined from 0.78 times to 0.65 times after being calculated
Financial Ratio of Malaysia Airlines System Berhad 24
from 4th quarter of annual report of 2010. The declining is
because of the highly debt of MAS from previous year to
finance the new investment of assets bought to the company.
However, in 2011 onwards it will keep increasing as they
manage to finance the current asset with current liability,
however due to the increase in fixed assets by increasing the
large number of airbus in 2011 as well as long-term debt to
but with maintaining the current assets, the quick ratio
decline slightly in 2013 and 2014. The quick ratio at average
0.68 times because MAS has less account payable due to the
cash transactions and operations as well as less cash in hand.
The current liability is more sensitive towards changes
because they are in period of expanding, thus including short
term borrowing that finance the assets. However, if the
forecast extended, it will increase from year to year and will
exceed more than 1 times in significant year.
5.2 Forecast of Total Assets Turnover
Financial Ratio of Malaysia Airlines System Berhad 25
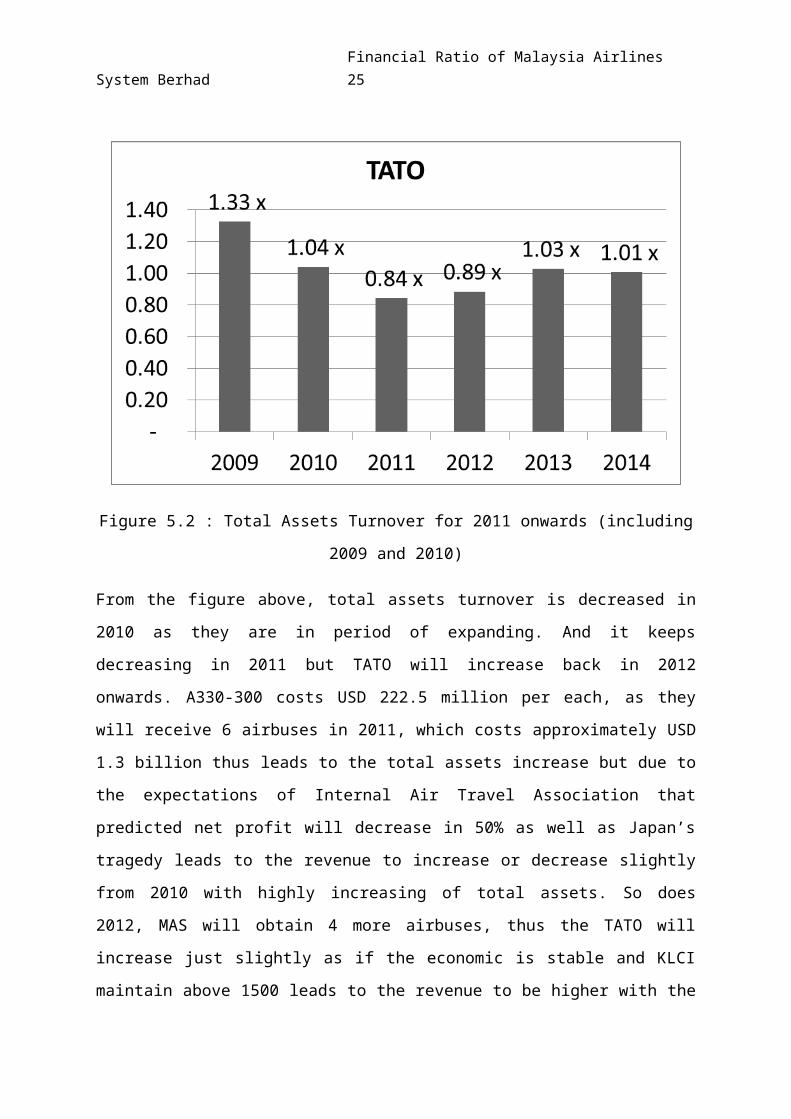
Figure 5.2 : Total Assets Turnover for 2011 onwards (including
2009 and 2010)
From the figure above, total assets turnover is decreased in
2010 as they are in period of expanding. And it keeps
decreasing in 2011 but TATO will increase back in 2012
onwards. A330-300 costs USD 222.5 million per each, as they
will receive 6 airbuses in 2011, which costs approximately USD
1.3 billion thus leads to the total assets increase but due to
the expectations of Internal Air Travel Association that
predicted net profit will decrease in 50% as well as Japan’s
tragedy leads to the revenue to increase or decrease slightly
from 2010 with highly increasing of total assets. So does
2012, MAS will obtain 4 more airbuses, thus the TATO will
increase just slightly as if the economic is stable and KLCI
maintain above 1500 leads to the revenue to be higher with the

Financial Ratio of Malaysia Airlines System Berhad 26
higher total assets in 2012. With the cost of reductions,
growth in airlines industry especially Asia Pacific, more
aircrafts that offers more potential revenue, strategy and
partnership TATO can keep increasing and will maintain at
certain level until economic situation changes.
5.3 Debt to Assets Ratio
Figure 5.3 : Debt to Assets Turnover for 2011 onwards
(including 2009 and 2010)
From Figure 5.3 above, Debt to Assets ratio is the highest in
2009 as we discussed above due to the increase in borrowing as
well as decline in shareholders. However, in 2010 it decreased
to 71.7% calculated from 4th quarter report of MAS. It will
slightly increase in 2011 as they obtain 6 new airbuses but in
2012 it will decrease significantly due to the higher assets
as 4 new airbuses obtain that year and make it as total of 10
new airbuses bought. Thus, it leads to the lower debt to

Financial Ratio of Malaysia Airlines System Berhad 27
assets turnover. It will maintain at certain level as only one
to two airbuses will be received in each year. Eventually, the
debt to assets ratio can be slightly increased if they loss
shareholders as it happened in 2009 thus, in order to finance
the incoming assets, they have to make borrowing. But if there
will be rapid increase in shareholders the debt to assets
ratio will decrease significantly.
5.4 Net profit ratio
Figure 5.4: Net Profit Margin for 2011 onwards (including 2009
and 2010)
The net profit of 2010 is declined because the expenditure is
much higher in 2010 and it has less derivative gain in 2010
compared to 2009. However, it maintain at low level of NPM in
2011 because of the expectation of Internal Air Travel
Financial Ratio of Malaysia Airlines System Berhad 28
Association (IATA), Japan’s tragedy and soar of fuel
surcharges. Those factors leads to the lower increase of
revenue and higher expenditure and results lower net profit
margin. However, from 2012 onwards it is expected for net
profit margin to be increase because by new airbuses bought,
MAS can increase the revenue as well as profit due to its less
seats and more frequent travel as it turn around faster and
increase the average sold seats above 70% per airbus. The new
airbuses also have lower fuel costs and maintenance cost, so
it reduces the expenditure as well as increase NPM.
5.5 Forecast of Return on Assets

Financial Ratio of Malaysia Airlines System Berhad 29
Figure 5.4: Return on Assets for 2011 onwards (including 2009
and 2010)
The graph above shows the return on assets from 2009 to 2011.
ROA in 2010 is declined based on 4th quarter of report. It is
predicted that in 2011 ROA will decline as well due to the new
airbuses bought and increase the total assets in MAS but with
the IATA expectations and tragedy in Japan, the net profit
will reduce 50% so it indicates that the total revenue of MAS
will probably just slight increase or decrease thus leads to
lower ROA in 2011. However, in 2012 onwards ROA will keep
rising each year. It indicates that the total revenue of those
following years will increase significantly as the assets
increase and bought into the company. With the growth of Asia
Pacific region in airline business as well as Middle East
would help MAS to increase the revenue. Furthermore, with the

Financial Ratio of Malaysia Airlines System Berhad 30
new airbuses it helps MAS to increase the frequent of
travelling; more routes and “Everyday low fares” can be
successfully done. With partnership and codeshare agreement
with 31 airlines, it also increases the revenue of MAS. It was
11% passengers increase in India as well as expected to be
increase 20% each year. There is also increase in passengers
domestically approximately around 11.1%. Thus, all these
factors help MAS to increase its revenue as well as ROA.
Conclusions
From the discussions and results, it can be seen MAS having a
problem especially in 2005 but it had redeem back the
reputation after Idris Jala being selected as a new director,
and several changes had made and MAS is improving from 2006.
However, in 2008 and 2009 it seems like a slight downfall of
MAS due to the global economic crisis and leads to loss of
shareholders in 2009. Thus, in order to finance its assets,
MAS have high leverage by borrowing the long-term debts. Even
though it indicates MAS having high leverage as well as high
risk of bankruptcy, it is actually have slight advantages
where its ROE is much higher. It happened because to attract
the investors after several losses of shareholders in 2009.
The performance of MAS is quite fluctuating, both internal and
external factors that lead to the fluctuation of MAS
Financial Ratio of Malaysia Airlines System Berhad 31
performance. When MAS change its policy and cost reduction, it
shows some improvement but external factors such as global
crisis can also affected the performance of MAS. Thus, in
order to forecast, external factors is one of the important
role as well as internal factors that can be changed anytime
due to the strategies, policies and investments. Whereas,
external factors like global crisis, natural disaster and
expectation cannot be determined accurately but with
assumptions, forecast can be done approximately accurate.
Policy and strategy need to be adjusted from time to time
depends on economic situations, competitions, opportunities,
visions, and input price that effected the expenditures and
inventories.
Now, MAS shows some positive side and potential to be
successful as they move forward and growth. From enormous
investment in 2009, they see the clearer picture of the vision
that they made and expanding it to concur the airlines
industry. With the suitable strategies and policies, perhaps,
MAS will continue to expand as well as give highly appraisable
and comfortable services

Financial Ratio of Malaysia Airlines System Berhad 32
References
Dato Sri Idris Jala & Dato' Dr Mohd Munir. (2006). Annual Report
2006. Kuala Lumpur: Malaysia Airline System Berhad.
Dato' Sri Idris Jala & Tan Sri Dr. Mohd Munir. (2008). 2008
Annual Report. Kuala Lumpur: Malaysia Airline System Berhad.
Dato' Sri Idris Jala. (2005). Annual Report 2005. Kuala Lumpur:
Malaysian Airline System Berhad.
Munir, T. D. (2010). Quartely Report on the Fourth Quarter Ended 31
December 2010. Kuala Lumpur: Malaysia Airlines.
Shahjanaz binti Kamaruddin. (2010). Investing in the Future. Kuala
Lumpur: Malaysia Airlines.
Tengku Dato' Azmil Zahiruddin & Tan Sri Dr. Mohd Munir.
(2009). 2009 Annual Report - Investing in Growth. Kuala Lumpur:
Malaysia Airlines.
Tengku Dato' Azmil Zahruddin. (2007). 2007 Annual Report. Kuala
Lumpur: Malaysia Airline System Berhad.
Wikipedia. (n.d.). Wikipedia. Retrieved April 2011, from
Malaysia Airlines:
http://en.wikipedia.org/wiki/Malaysia_Airlines