REPORT Nutritional Composition and Labelling Practices of ...
36
REPORT Nutritional Composition and Labelling Practices of Growing-up Milks (GUMs) Launched in Indonesia between January 2017 and May 2019
-
Upload
khangminh22 -
Category
Documents
-
view
0 -
download
0
Transcript of REPORT Nutritional Composition and Labelling Practices of ...

REPORTNutritional Composition and Labelling Practices of Growing-up Milks (GUMs) Launched in Indonesia between January 2017 and May 2019

Practices of Growing-up Milks (GUMs) | Indonesia2 Page
TABLE OF CONTENTSABBREVIATIONS ..................................................................................................................................................................................................................3LIST OF TABLES ..................................................................................................................................................................................................................3LIST OF FIGURES .................................................................................................................................................................................................................31 EXECUTIVE SUMMARY ......................................................................................................................................................................................42. INTRODUCTION AND STUDY JUSTIFICATION ..................................................................................................................................63. BACKGROUND TO THE STUDY ....................................................................................................................................................................94. STUDY AIMS AND OBJECTIVES ................................................................................................................................................................12 4.1 Study Aims...................................................................................................................................................................................................12 4.2 Study Objectives ....................................................................................................................................................................................135. METHODOLOGY ...................................................................................................................................................................................................14 5.1 Study Design and Database Characteristics ..................................................................................................................14 5.2 Identifying and Purchasing of the GUMs ............................................................................................................................15
5.3 Selecting the GUMs .............................................................................................................................................................................15 5.4 Collection and Coding of the GUM labels ..........................................................................................................................15 5.5 Data Analysis of the GUMs ............................................................................................................................................................156. RESEARCH SIGNIFICANCE ...........................................................................................................................................................................187. FINDINGS AND THEIR IMPLICATIONS ................................................................................................................................................ 207.1 Sample Descriptives ....................................................................................................................................................................................... 207.2 Objective 1: To assess the mono- and disaccharide, excluding lactose, composition and content
(determined using the ingredient list and nutrition information provided on the product label) of cow’s milk GUMs, launched in different cities across Indonesia, against 2018 global guidance [draft 2018 CODEX STAN (CXS 156-1987)] ....................................................................................................................................22 7.2.1 Sub-objective 1: To assess the compliance of GUMs with the mono- and disaccharide, excluding lactose, criteria of the draft 2018 CODEX STAN (CXS 156-1987). ..........................................22
7.2.2 Sub-objective 2: To assess the compliance of GUMs with the draft 2018 CODEX STAN (CXS 156-1987) that these products should not contain added fructose and sucrose .................22
7.2.3 Sub-objective 3: To assess the types of sugars/sweeteners added to GUMs ...................................237.3 Objective 2: To determine (using declared nutrition information) the nutrient profile of cow’s milk
GUMs launched in different cities across Indonesia using the UK FSA NPM ......................................................24 7.3.1 Sub-objective 1: To nutrient profile the GUMs using the UK FSA Nutrient Profiling Model to determine their healthfulness ...............................................................................................................................................24
7.3.2 Sub-objective 2: To assess the GUMs against the UK Front-of-Pack (FoP) Algorithm for sugar .......................................................................................................................................................................................................25
7.3.3 Objective 2: Finding implications ..............................................................................................................................................257.4 Objective 3: To determine if nutrient content claims are made on the labels of cow’s milk GUMs,
and for which nutrients ..................................................................................................................................................................................26 7.4.1 Sub-objective 1: To assess the frequency of all types of nutrient content claims on GUMs ....26 7.4.2 Sub-objective 2: To assess GUMs making all types of nutrient content claims, stratified by
their nutrient profile score ..............................................................................................................................................................28 7.4.3 Sub-objective 3: Sub-objective 3: To assess GUMs making all types of nutrient content
claims, stratified by their FoP analysis score ..................................................................................................................28 7.4.4 Objective 3: Finding implications ..............................................................................................................................................287.5 Objective 4: To provide a snapshot/indication of the cost of cow’s milk GUMs, launched in
different cities across Indonesia compared to whole cow’s milk, which is recommended for non-breastfed children older than 1 year ........................................................................................................................................29
7.5.1 Objective 4: Finding implications ............................................................................................................................................29REFERENCES ...................................................................................................................................................................................................................... 30ADDENDA ................................................................................................................................................................................................................................32Addendum 1: The UK FSA Nutrient Profiling Model in detail ............................................................................................................32Addendum 2: UK FSA Front-of-pack (FoP) Algorithm ...........................................................................................................................34
Giacomo Pirozzi | Alive & Thrive.Front Cover Image

Practices of Growing-up Milks (GUMs) | Indonesia Page 3
ABBREVIATIONS
LIST OF TABLES
LIST OF FIGURES
ARCH Assessment and Research on Child Feeding Project of Helen Keller InternationalBMS Breast-milk substitutes CAGR Compound Annual Growth RateCCNFSDU Codex Committee on Nutrition and Foods for Special Dietary Uses Codex Codex AlimentariusCODEX STAN(CXS 156-1987) Codex Draft Revised Standard for Follow-up Formula (CXS 156-1987)CPCF Commercially produced complementary foods FoP Front-of-packFUF Follow-up formulaGUM Growing-up milk IDHS Indonesian Demographic and Health SurveyLMIC Low-middle-income countriesNGOs Non-governmental organisationsRISKESDAS Basic Health Research (Riset Kesehatan Dasar)The Code International Code of Marketing of Breast-milk SubstitutesUK FSA NPM United Kingdom Food Standards Agency Nutrient Profiling ModelWHA World Health AssemblyWHA 69.9 World Health Assembly Resolution number 69.9 of 2016WHO World Health OrganisationWHO Guidance World Health Organisation Guidance on Ending the Inappropriate Promotion of Foods for Infants and Young Children
Table 1: Volume and value data for growing-up milk formula in Indonesia 2011-2016 ...................................... 10Table 2: Percentage volume growth and percentage current value growth for growing-up milk in
Indonesia 2011-2016 ........................................................................................................................................................................... 10Table 3: Forecast by volume and value sales for growing-up milk in Indonesia 2016-2021 ........................... 10Table 4: Forecast percentage volume growth and percentage current annual (value) growth for
growing-up milk in Indonesia 2016 – 2021 ........................................................................................................................ 10Table 5: Manufacturers and Brands of GUMs .....................................................................................................................................21Table 6: Compliance of GUMs with the mono- and disaccharide, excluding lactose, criteria of
draft 2018 CODEX STAN (CXS 156-1987) (n=88) ..........................................................................................................22Table 7: Compliance of GUMs with the draft 2018 CODEX STAN (CXS 156-1987) requirements on
sucrose and fructose content (n=100) .................................................................................................................................23Table 8: Types of added sugars/sweeteners listed in the ingredients of GUMs as a percentage
of the total sample in descending order (n=100) .........................................................................................................23Table 9: Frequency of ‘source of’ and ‘high in’ nutrient content claims on GUMs in descending
order (n=100) ............................................................................................................................................................................................26Table 10: GUMs making nutrient content claims, stratified by their nutrient profile using the
UK FSA NPM (n=29) ..............................................................................................................................................................................28
Figure 1: Compliance of GUMs with draft 2018 Codex mono- and disaccharide, excluding lactose, requirement of ≤2.5g per 100kcal (n=100) .........................................................................................................................22
Figure 2: UK FSA FoP Algorithm total sugar results of GUMs that could be assessed (n=93) ........................25Figure 3: Products making some type of nutrient content claim, stratified by their FoP sugar
content using the UK FSA FoP algorithm (n=90) ...........................................................................................................28

Practices of Growing-up Milks (GUMs) | Indonesia4 Page
Only half the children in Indonesia meet the World Health Organisation (WHO) recommendation of exclusive breastfeeding to six months and continued breastfeeding until the age of 2 years and beyond. In addition, stunting remains a significant public health problem. In 2014 under-5 stunting in Indonesia (30%) was the second highest in South East Asia1. This means that many infants and young children in Indonesia are not being fed optimally and in accordance with global guidance at a critical time in life.
Data from Euromonitor International shows a 40% volume growth of the milk formula category (comprised of infant formula, follow-up formula, growing-up milk and special milk formula) between 2011 and 2016, with the greatest increase in the growing-up milk category (products intended for children 1-3 years of age). Recently published research by Hadihardjono et al.2 reported that over three quarters of growing-up milks in Bandung City were being promoted at points-of-sale.
In 2016, the World Health Assembly (WHA), the highest health policy setting body in the world, endorsed Resolution 69.9 that urged all Member States “(1) to take all necessary measures in the interest of public health to end the inappropriate promotion of foods for infants and young children, including, in particular, implementation of the WHO guidance recommendations while taking into account existing legislation and policies, as well as international obligations; (2) to establish a system for monitoring and evaluation of the implementation of the guidance recommendations.” Recommendation 2 of the WHO Guidance referred to here, confirms that products that function as breast-milk substitutes, including follow-up formula and growing-up milks, should not be promoted as they are covered by the International Code of Marketing of Breast-milk Substitutes (the Code) and subsequent relevant WHA resolutions.
Evidence regarding the appropriateness of the composition of growing-up milks for their target age group is useful to determine the place of these products in commercial marketing of foods to children, and to assist the Indonesian government in potentially updating their national regulations/standards and programme recommendations.
This study determined the level and appropriateness of the declared sugar content and nutritional quality, based on nutrient profiling3, of growing-up milks launched in different cities across Indonesia between January 2017 and May 2019. The study also produced a snapshot of the costs of growing-up milks as compared to whole cow’s milk, which is recommended for children of this age if they are not breastfed.
1. EXECUTIVE SUMMARY
UN04232 :© UNICEF/UN04232/Estey

Practices of Growing-up Milks (GUMs) | Indonesia Page 5
The findings are cause for concern. 1. Based on the findings that assessed the
mono- and disaccharide, excluding lactose, composition and content of the growing-up milks against the draft 2018 CODEX STAN (CXS 156-1987), few of the products meet the requirements both for the level of mono- and disaccharide, excluding lactose, and the non-addition of fructose and sucrose. Almost eighty percent of GUMs contained added sucrose and/or fructose, which is non-compliant with the recommendation that GUMs should contain neither. The current mono- and disaccharide, excluding lactose, composition and content make growing-up milks inappropriate for inclusion in the diets of young children.
2. Currently, almost three quarters of growing-up milks do not provide sufficient information to be assessed against the UK Food Standards Agency Nutrient Profiling Model and, of those that could be profiled, over one third were not considered to be healthy, based on their energy density, saturated fat, total sugar, and sodium content. In addition, almost three quarters of growing-up milks that provided sugar information had high sugar levels that warrant a red warning label based on the UK Food Standards Agency front-of-pack sugar classification. These assessments result in growing-up milks being considered unsuitable for feeding young children.
3. Indonesian regulations permit products for children aged 1-3 years to make nutrient
content claims, provided they meet specific criteria. Almost all the growing-up milks made nutrient content claims. Yet this study found that a third of the products (that provided sufficient information to review) are in fact not considered to be healthy when they undergo nutrient profiling. In addition, almost three quarters of products that provided the product’s sugar content are classified as having a high sugar content (red category) when assessed using the UK Food Standards Agency front-of-pack algorithm4. It is clear that without a mandatory nutrient profiling model in Indonesia, many growing-up-milks are sold as being suitable for children aged 12-36 months, and make nutrient content claims highlighting a health benefit when their overall nutrient composition is not considered to be healthy. This is misleading to consumers.
4. The average cost per 100ml of the growing-up milks was approximately 9 times that of the cost of whole cow’s milk, which is globally recommended for children older than 1 year who are no longer breastfed. Recognising the limitations of the price data used for the calculations, growing-up milks are very expensive compared to whole cow’s milk. Considering that the other aspects of this research showed most growing-up milks to be nutritionally inappropriate for this age group and they are globally not recommended, their high cost further adds to concerns on their use and relevance for feeding young children.
1 Development Initiatives, 2017. Global Nutrition Report 2017: Nourishing the SDGs. Bristol, UK: Development Initiatives.2 Hadihardjono DN, Green M, Stormer A, Agustino, Izwardy D, Champeny M (2019). Promotions of breast-milk substitutes,
commercial complementary food and commercial snack products commonly fed to young children are frequently found in point-of-sale in Bandung City, Indonesia. Matern Child Nutr. 2019; 15(S4).
3 Nutrient Profiling Technical Guidance; Food Standards Agency (FSA): London, United Kingdom, 2009.4 Department of Health, the Food Standards Agency, administrations in Scotland, Northern Ireland and Wales in collaboration
with the British Retail Consortium (2016). Guide to creating a front of pack (FoP) nutrition label for pre-packed products sold through retail outlets.
In Indonesia, despite some improvement in nutrition outcomes over the course of the last 10 years, much remains to be done. Indonesia has also not yet implemented WHA 69.9. This study showed that the composition of the growing-up milks launched in Indonesia over a 28 month period neither comply with the draft 2018 Codex Revised Standard on Follow-up Formula nor meet many of the criteria of the United Kingdom Food Standards Authority nutrient profiling model.
Strong political commitment needs to be demonstrated to ensure optimal infant and young child feeding in Indonesia and reverse the current high levels of stunting. Any revision of the existing outdated Indonesian infant and young child nutrition regulations to align with new global guidance will need to withstand opposition from segments of the private sector that continue to promote growing-up milks and threaten the protection, promotion and support of breastfeeding and violate the International Code of Marketing of Breast-milk Substitutes and subsequent relevant WHA resolutions.

Practices of Growing-up Milks (GUMs) | Indonesia6 Page
While progress has been made on decreasing levels of hunger and acute malnutrition, globally 22% of all children under the age of five still suffer from chronic malnutrition in the form of stunting, and an increasing number of young children are becoming overweight and obese. A third form of malnutrition exists alongside under and overnutrition, particularly in low-middle-income countries (LMIC): micronutrient deficiency (Development Initiatives, 2017). Increased intake of energy-dense, micronutrient-poor foods and displaced intake of breastmilk in children under five are factors driving the triple burden of malnutrition in this age group.
The WHO states that optimal infant and young child feeding includes exclusive breastfeeding from birth to 6 months, with appropriate complementary feeding and continued breastfeeding thereafter (WHA 2002). Any product that potentially replaces the consumption of breastmilk before the age of 36 months is considered a breast-milk substitute (BMS). International regulations need to respect, protect, and promote breastfeeding, and national policy and legislation are encouraged to do the same, by incorporating and implementing the Code and subsequent WHA resolutions.
In 2016 the WHA passed resolution WHA 69.9 related to maternal, infant, and young child nutrition and makes reference to The WHO Guidance on Ending the Inappropriate Promotion of Foods for Infants and Young Children (WHO Guidance). The resolution urges all Member States “(1) to take all necessary measures in the interest of public health to end the inappropriate promotion of foods for infants and young children, including, in particular, implementation of the guidance recommendations while taking into account existing legislation and policies, as well as international obligations; (2) to establish a system for monitoring and evaluation of the implementation of the guidance recommendations” (WHO, 2016).
Recommendation 2 of the WHO Guidance (see Box 1 for full text), confirms that products that function as BMS, including follow-up formula (FUF) and growing-up milks (GUMs), should not be promoted as they are covered by the International Code of Marketing of Breast-milk Substitutes (the Code) and subsequent relevant WHA resolutions. FUFs (intended for children aged 6-12 months) and GUMs (intended for children aged 12 – 36 months) are not specifically named in the Code although, by definition, are covered by the Code. For this reason, these products have often fallen into a ‘grey area’ and have been allowed to be promoted in many countries, and manufacturers have exploited the lack of direct reference in the Code to these specific products. This lack of clarity has been addressed by the specific inclusion of these products in the definition of BMS in the WHO Guidance.
2. INTRODUCTION AND STUDY JUSTIFICATION
UNI152348:© UNICEF/UNI152348/Ferguson

Practices of Growing-up Milks (GUMs) | Indonesia Page 7
BOX 1: Recommendation 2 and 3 of the WHO Guidance on Ending the Inappropriate Promotion of Foods for Infants and Young Children (2016):
* Foods for infants and young children are defined as commercially produced food or beverage products that are specifically marketed as suitable for feeding children up to 36 months of age.
** Promotion is broadly interpreted to include the communication of messages that are designed to persuade or encourage the purchase or consumption of a product or raise awareness of a brand. Promotional messages may be communicated through traditional mass communication channels, the Internet and other marketing media using a variety of promotional methods. In addition to promotional techniques aimed directly at consumers, measures to promote products to health workers or to consumers through other intermediaries are included. There does not have to be a reference to a brand name of a product for the activity to be considered as advertising or promotion.
Recommendation 2: Products that function as breast-milk substitutes should not be promoted. A breast-milk substitute should be understood to include any milks (or products that could be used to replace milk, such as fortified soy milk), in either liquid or powdered form, that are specifically marketed for feeding infants and young children up to the age of 3 years (including follow-up formula and growing-up milks). It should be clear that the implementation of the International Code of Marketing of Breast-milk Substitutes and subsequent relevant Health Assembly resolutions covers all these products.
Recommendation 3. Foods for infants and young children* that are not products that function as breast-milk substitutes should be promoted** only if they meet all the relevant national, regional and global standards for composition, safety, quality and nutrient levels and are in line with national dietary guidelines. Nutrient profile models should be developed and utilized to guide decisions on which foods are inappropriate for promotion. Relevant Codex standards and guidelines should be updated, and additional guidelines developed in line with WHO’s Guidance to ensure that products are appropriate for infants and young children, with a particular focus on avoiding the addition of free sugars and salt.
UN0248736:© UNICEF/UN0248736/Noorani
Practices of Growing-up Milks (GUMs) | Indonesia8 Page
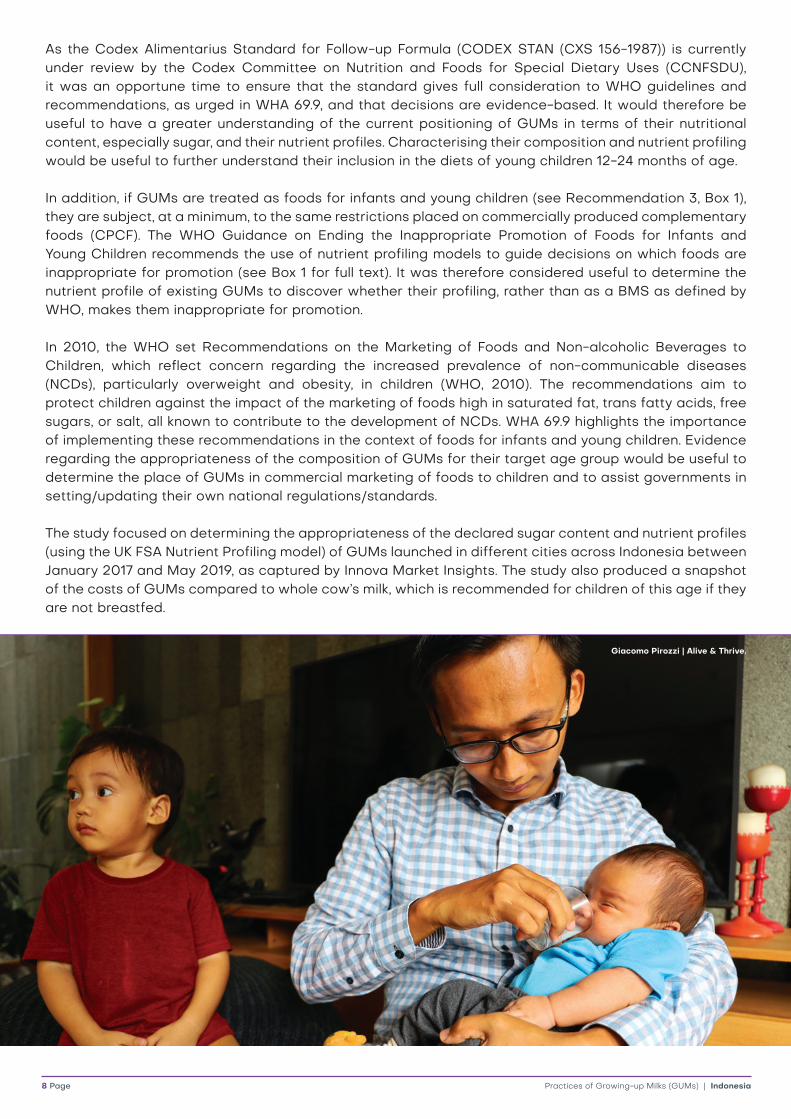
As the Codex Alimentarius Standard for Follow-up Formula (CODEX STAN (CXS 156-1987)) is currently under review by the Codex Committee on Nutrition and Foods for Special Dietary Uses (CCNFSDU), it was an opportune time to ensure that the standard gives full consideration to WHO guidelines and recommendations, as urged in WHA 69.9, and that decisions are evidence-based. It would therefore be useful to have a greater understanding of the current positioning of GUMs in terms of their nutritional content, especially sugar, and their nutrient profiles. Characterising their composition and nutrient profiling would be useful to further understand their inclusion in the diets of young children 12-24 months of age.
In addition, if GUMs are treated as foods for infants and young children (see Recommendation 3, Box 1), they are subject, at a minimum, to the same restrictions placed on commercially produced complementary foods (CPCF). The WHO Guidance on Ending the Inappropriate Promotion of Foods for Infants and Young Children recommends the use of nutrient profiling models to guide decisions on which foods are inappropriate for promotion (see Box 1 for full text). It was therefore considered useful to determine the nutrient profile of existing GUMs to discover whether their profiling, rather than as a BMS as defined by WHO, makes them inappropriate for promotion.
In 2010, the WHO set Recommendations on the Marketing of Foods and Non-alcoholic Beverages to Children, which reflect concern regarding the increased prevalence of non-communicable diseases (NCDs), particularly overweight and obesity, in children (WHO, 2010). The recommendations aim to protect children against the impact of the marketing of foods high in saturated fat, trans fatty acids, free sugars, or salt, all known to contribute to the development of NCDs. WHA 69.9 highlights the importance of implementing these recommendations in the context of foods for infants and young children. Evidence regarding the appropriateness of the composition of GUMs for their target age group would be useful to determine the place of GUMs in commercial marketing of foods to children and to assist governments in setting/updating their own national regulations/standards.
The study focused on determining the appropriateness of the declared sugar content and nutrient profiles (using the UK FSA Nutrient Profiling model) of GUMs launched in different cities across Indonesia between January 2017 and May 2019, as captured by Innova Market Insights. The study also produced a snapshot of the costs of GUMs compared to whole cow’s milk, which is recommended for children of this age if they are not breastfed.
Giacomo Pirozzi | Alive & Thrive.

Practices of Growing-up Milks (GUMs) | Indonesia Page 9
This study forms part of the third phase (ARCH 3) of Helen Keller International’s Assessment and Research on Child Feeding (ARCH) Project, which generates country-specific evidence that can be used to guide and improve national, regional and global infant and young child feeding policies and guidelines.
In the South East Asia region, only 25% of countries include products up to the age of 36 months as BMS in their national regulations (Walters et al., 2016). Indonesia has numerous different regulations that include some provisions of the Code, among them regulations regarding infant formula and follow-up formula for children 0-12 months of age. Indonesian Article 28 of Government Regulation Number 33 from 2012 addresses exclusive breastfeeding and further refers to the Ministerial Regulation 39 for regulations on infant milk and other baby products but does not cover children above the age of 12 months (Hidayana et al., 2017).
While the Indonesian Demographic and Health Survey (IDHS) 2017 provides an exclusive breastfeeding rate of 51.5%, Basic Health Research (Riset Kesehatan Dasar) (RISKESDAS) 2018 gives a figure of 37.3%, indicating some disparity in the figures but showing that exclusive breastfeeding remains low. Only 55% of young children in Indonesia continue to be breastfed at 2 years of age (BKKBN, BPS, Kemenkes, & USAID 2018; Kementerian Kesehatan Republik Indonesia, 2018). The WHO recommendation of breastfeeding until the age of 2 years and beyond is therefore applied to only half of the children in Indonesia (BKKBN, BPS, Kemenkes, & USAID 2018).
Data from The Euromonitor International Report on Baby Food in Indonesia for 2016 shows the percentage volume growth of milk formula (comprising standard milk formula, follow-on milk formula, growing-up milk formula and special baby milk formula) as 40% between 2011 and 2016 (Euromonitor International, 2016). The same report shows that the greatest increase of BMS use is in the GUM category and provides: volume and value data for GUMs (Table 1); percentage volume growth and percentage current value growth of GUMs (Table 2) and; forecast volume and value sales data for GUMs (Table 3) in Indonesia for the period 2011-2016. Forecast percentage volume growth and percentage current annual (value) growth from 2016-2021 is shown in Table 4.
3. BACKGROUND TO THE STUDY
UN0200177 :© UNICEF/UN0200177/van Oorsouw

Practices of Growing-up Milks (GUMs) | Indonesia10 Page
Table 1 Volume and value data for growing-up milk formula in Indonesia 2011-2016
Table 2 Percentage volume growth and percentage current value growth for growing-up milk in Indonesia 2011-2016
2011 2012 2013 2014 2015 2016
Volume in ‘000 tonnes 146.3 161.7 176.2 191.2 204.6 216.2
Value in IDR billion 12,297.4 14,265.0 16,476.0 19,277.0 21,590.2 23,965.1
2015/16 2011-16 CAGR* 2011/16 Total
% volume growth 5.7 8.1 47.8
% current value growth 11.0 14.3 94.9
Table 3 Forecast by volume and value sales for growing-up milk in Indonesia 2016-2021
Table 4 Forecast percentage volume growth and percentage current annual (value) growth for growing-up milk in Indonesia 2016 – 2021
2016 2017 2018 2019 2020 2021
Volume in ‘000 tonnes 216.2 225.5 233.4 241.1 248.9 256.3
Value in IDR billion 23,965.1 25,115.4 26,245.6 27,374.2 28,469.2 29,465.6
2016/17 2016-21 CAGR* 2016/21 Total
% volume growth 4.3 3.5 18.5
% current value growth 4.8 4.2 23.0* Compound Annual Growth Rate
* Compound Annual Growth Rate
Both the breastfeeding rates and the volume sales growth of GUMs in Indonesia indicate a clear need for regulatory reform to encompass BMS products beyond 12 months in Code regulations.
In 2014, the global market size of BMS was over USD 44.8 billion and this was expected to rise to USD 70.6 billion in 2019, with greatest growth coming from LMIC (Rollins, 2016). Globally, there is an increase in the promotion of FUF and GUM for older infants and young children (WHO, 2018). In Indonesia, where the BMS market is already at a high of USD 1.1 billion, this trend was noticeable in 2015 where two thirds of BMS for children under 24 months were being advertised (Alive and Thrive, 2017). In 2017, ARCH 2 research reported that over three quarters (77%) of GUMs available in Bandung City were being promoted (Hadihardjono, 2019).
The reasons for the increase of FUF and GUM sales include a growing lower- middle-class population, more women joining the workforce, and accelerated economic growth (Research and Markets, 2018).
Globally, there is an increasein the promotion of
follow-up formula and growing-up milkfor older infants and young children
(WHO, 2018)
Practices of Growing-up Milks (GUMs) | Indonesia Page 11
Suboptimal infant and young child nutrition in Indonesia are further evident in the high prevalence of malnutrition throughout the country. In 2014 under-5 stunting in Indonesia was the second highest (30%) in South East Asia (Development Initiatives, 2017). Underweight and wasting in the country have decreased since the 2012 Demographic Health Survey but are still at undesirable levels of over 10% of all children under the age of five (BKKBN, BPS, Kemenkes, & USAID 2018). Despite some improvement in nutrition outcomes over the course of the last 10 years, much remains to be done. Strong political commitment needs to be demonstrated and any revision of the existing outdated Indonesian infant and young child nutrition regulations will have to withstand strong opposition from segments of the private sector that continue to threaten the protection and promotion of optimal young child feeding, in particular breastfeeding.
The Euromonitor International report on Baby Food in Indonesia for 2016, notes three trends:1. The Ministry of Health prohibits any form of
promotion of milk formula, particularly infant and follow-on products. Manufacturers are only allowed to advertise growing-up milk formula. Yet in order to promote their products, manufacturers advertise heavily in the media. Companies compete by highlighting the nutritional content of their products, emphasising how they can help a child’s brain development. The advertisements are deemed to be effective as more Indonesian families are becoming aware of brain development. Several below-the-line5 activities, such as trade shows and social media competitions, were also being used during 2016.
2. A growing awareness of the brain and physical development of their children has made high quality, nutritious baby food popular among Indonesian families. Thus, private labels still have a negligible presence in baby food. Middle- to lower-income consumers prefer standard products; those targeted to them include Dancow from Nestlé Indonesia, and SGM from Sarihusada. Middle- to high-end consumers prefer premium brands such as Nutrilon Royal, Enfagrow A+, Chil Kid Platinum, S-26 Procal Gold and PediaSure Complete.
3. The Indonesian government, through the Ministry of Health, the Paediatrician Association, and other non-governmental organisations (NGOs), will continue to promote breastfeeding and thus enforce stricter regulations regarding infant milk formula. This issue, along with the declining birth rate, is likely to drive a slowdown in the volume growth of milk formula, and therefore all baby food, over the forecast period. Baby food is expected to post a compound annual growth rate (CAGR) of 4% at constant 2016 prices over the forecast period. While infant formula may struggle due to the aggressive promotion of breastfeeding, growing-up milk formula is likely to achieve robust volume growth.
5 Below-the-line advertising is an advertising strategy where products are promoted in media other than mainstream radio, television, billboards, print and film formats. The main types of below-the-line advertising systems include direct mail campaigns, trade shows, catalogues, and targeted search engine marketing. https://www.investopedia.com/terms/b/below-the-line-advertising.asp

Practices of Growing-up Milks (GUMs) | Indonesia12 Page
4. STUDY AIMS AND OBJECTIVES
4.1 Study Aims
Using data on GUMs launched in different cities across Indonesia between January 2017 and May 2019 (28 months), this study aimed:1. To assess using the label information the mono- and disaccharide, excluding lactose, composition and
content of cow’s milk GUMs against global guidance.2. To undertake nutrient profiling using the United Kingdom Food Standards Agency (UK FSA) Nutrient
Profiling Model (NPM), to assess the healthfulness of cow’s milk GUMs.3. To assess, using the label information, the frequency and types of nutrient content claims made on
these products.4. To provide a snapshot of the cost of cow’s milk GUMs compared to whole cow’s milk.
UN04229 : © UNICEF/UN04229/Estey

Practices of Growing-up Milks (GUMs) | Indonesia Page 13
6 For GUMs for young children the draft 2018 Codex Revised Standard for Follow-Up Formula (CXS 156-1987) requires that mono- and disaccharides, other than lactose, should not exceed 2.5 g/100kcal (0.60 g/100kJ). The text further permits national and/or regional authorities to limit this level to 1.25 g/100 kcal (0.30 g/100 kJ).
4.2 Study Objectives
Objective 1: To assess the mono- and disaccharide, excluding lactose6, composition and content (determined using the ingredient list and nutrition information provided on the product label) of cow’s milk GUMs, launched in different cities across Indonesia, against global guidance [draft 2018 CODEX STAN (CXS 156-1987)]. Sub-objective 1.1: To assess the compliance of GUMs with the
mono- and disaccharide, excluding lactose, criteria of the draft 2018 CODEX STAN (CXS 156-1987).
Sub-objective 1.2: To assess the compliance of GUMs with the
draft 2018 CODEX STAN (CXS 156-1987) that these products should not contain added fructose and sucrose.
Sub-objective 1.3: To assess the types of sugars/sweeteners
added to GUMs.
Objective 2: To determine (using declared nutrition information) the nutrient profile of cow’s milk GUMs, launched in different cities across Indonesia, using the UK FSA NPM. This model was selected in lieu of any existing models for young children specifically because it has been validated and can be used for any given food or drink (Arambepola, Scarborough, & Rayner, 2008). Sub-objective 2.1: To nutrient profile the GUMs using the UK FSA
NPM to determine their healthfulness. Sub-objective 2.2: To assess the GUMs against the UK FoP
(Front-of-pack) algorithm for sugar.
Objective 3: To determine if nutrient content claims are made on the labels of cow’s milk GUMs, and for which nutrients. Sub-objective 3.1: To assess the frequency of all types of nutrient
content claims on GUMs. Sub-objective 3.2: To assess GUMs making all types of nutrient
content claims, stratified by their nutrient profile score.
Sub-objective 3.3: To assess GUMs making all types of nutrient
content claims, stratified by their FoP sugar classification.
Objective 4: To provide a snapshot of the cost of cow’s milk GUMs, launched in different cities across Indonesia, compared to whole cow’s milk, which is recommended for non-breastfed children older than 1 year.
Giacomo Pirozzi | Alive & Thrive.

Practices of Growing-up Milks (GUMs) | Indonesia14 Page
5.1 Study Design and Database Characteristics
A database of GUMs (defined in Box 2) that had been launched in different cities across Indonesia between January 2017 and May 2019 (28 months) was purchased from Innova Market Insights, a market research company (www.innovamarketinsights.com). The database of 102 GUMs included the cost and label information required to assess the declared sugar content and nutrient content claims made on the labels, and to determine the nutrient profile of the products. Ultimately 100 cow’s milk GUMs were included in the analysis (see exclusion criteria under 5.3).
Box 2:Definition of GUMs as used in this study.
Growing Up Milk (GUMs): Growing-up milks, ‘toddler milks’ and similar products intended for children aged 1–3 years include drinks (either in liquid form or powder form to be reconstituted) based on cow’s milk, with or without modification of the protein composition or content and supplementation of fatty acids, micronutrients or other substances with a potential nutritional effect, such as probiotics, prebiotics or symbiotics (adapted from EFSA 2013).
5. METHODOLOGY
Giacomo Pirozzi | Alive & Thrive.
Practices of Growing-up Milks (GUMs) | Indonesia Page 15
5.2 Identifying and Purchasing of the GUMs
The Innova Market Insights database of new product launches7 for the category of GUMs launched in different cities across Indonesia, for the period January 2017 until the end of May 2019, was purchased. The products were captured by Innova network members from different retailers of various channels located in cities across Indonesia based on weekly visiting at the minimum. Product records were checked by local and regional editors via several editing and quality control procedures.
5.3. Selecting the GUMs
Innova Market Insights provided only products that were labelled in Bahasa Indonesia, that they had translated into English, or that were originally labelled in English.
All the products included in the Innova Market Insights database that were identified as meeting the definition in Box 2 were included in the analysis. Products were excluded from analysis if they were not cow’s milk-based8 as comparisons were to be made against the composition and price of cow’s milk only.
The database included 102 GUMs. Analysis was conducted on 100 GUMs after the exclusion criteria were applied. The two GUMs that were excluded were soymilk based (2%). No products were excluded because of label language or because they were for special medical purposes.
5.4 Collection and Coding of the GUM Labels
The raw data extracted from the GUM labels were received from Innova Market Insights as Microsoft Excel spreadsheets which were adapted for analysis. In addition to cost, purchase date, product identifiers (e.g. manufacturer and brand name) and packaging information, the following label information was extracted and used in the analysis: ingredients list, nutritional information, nutrient content claims, age range for use, serving size information and recommended number of servings. Further nutritional information included reconstituted values per 100ml or powdered values per 100g and per serving (where available/relevant): energy (KJ), saturated fat (g), sugar (g) (all information regarding sugar content, in whichever form, was captured e.g. total sugar, added/free sugar, sucrose, lactose etc.), sodium (g), dietary fibre (g) and protein (g).
5.5 Data Analysis of the GUMs
Data were analysed in Microsoft Excel and nutrient profiling and FoP sugar assessments were carried out using STATA, with description of analysis for each objective detailed below.
If the label of a product did not provide the necessary information to perform the objective, that product was excluded from the analysis. In such a case, the total number of products that were assessed represented the number of GUMs that provided sufficient label information. The number of products assessed therefore differ for each objective and sub-objective: Objective 1: If the label of a product did not provide the necessary information on the amount of different sugars/sweeteners contained, the product could not be assessed and was excluded from the analysis.
Objective 2: If the label information did not provide nutritional information on energy density, saturated fat, total sugar, sodium, fibre, protein or % of fruit/vegetables/nuts, the product was excluded from the UK FSA nutrient profiling analysis. If the label information did not provide the total amount of sugar or indicate a serving size, the product was excluded from the UK FSA FoP sugar warning assessment.
Objective 3: Inclusion in the analysis was dependent on whether the products could be assessed for objective 1 and 2. Products that were excluded from analyses in objective 1 and 2 were likewise excluded in objective 3.
7 New product launches include new products (local and imported), new product packaging, reformulation.8 The percentage of GUMs from milk types other than cow’s milk (e.g. soya, oats, almond, goat or sheep) excluded from the study
was calculated.

Practices of Growing-up Milks (GUMs) | Indonesia16 Page
Objective 1: To assess the mono- and disaccharide, excluding lactose, composition and content (determined using the ingredient list and nutrition information provided on the product label) of cow’s milk GUMs, launched in different cities across Indonesia, against 2018 global guidance [draft 2018 CODEX STAN (CXS 156-1987)].
Sub-objective 1.1: To assess the compliance of GUMs with the mono- and disaccharide, excluding lactose, criteria of the draft 2018 CODEX STAN (CXS 156-1987).Sub-objective 1.2: To assess the compliance of GUMs with the draft 2018 CODEX STAN (CXS 156-1987) that these products should not contain added fructose and sucrose.Sub-objective 1.3: To assess the types of sugars/sweeteners added to GUMs.
• If not provided on the label, the free sugar content of the GUMs was calculated by subtracting the declared lactose composition of the product from the total sugar content per 100g of reconstituted/ready-to-drink GUMs. If the lactose composition of the product was not provided, a standard value of lactose content in cow’s milk (5.1g per 100g9) was used. To facilitate calculation from volume to grams, sugar values per 100ml of milk were converted to values per 100g using the density of cow’s milk as being 1.03 g/cc10 (100ml of milk equals 103g).
• If the label of the GUM provided nutrition information per mono- and disaccharide, these were added together, excluding lactose, to determine the sugar content.
• The mono- and disaccharide, excluding lactose, content of the GUMs in grams per 100kcal and per 100kJ was calculated.
• The mono- and disaccharide, excluding lactose, content of the GUMs per 100kcal and per 100kJ was assessed for compliance with 2018 global guidance [draft 2018 CODEX STAN (CXS 156-1987)]. Products were classified as prudent, compliant, or non-compliant according to their mono- and disaccharide, excluding lactose,11 content:
• Prudent: ≤ 1.25g/100kcal (≤0.3g/100kJ) • Compliant: > 1.25g to ≤ 2.5g/100kcal (> 0.3g to ≤ 0.6g/100kJ) • Non-compliant: > 2.5 g/100kcal (>0.6g/100kJ). • The ingredients list was checked for sucrose and fructose. The presence of these ingredients was
classified as ‘non-compliant’ with the draft 2018 CODEX STAN (CXS 156-1987), which states that sucrose and/or fructose should not be added.
• All added sugars/sweeteners ingredients named in the ingredients list were reported, using descriptive statistics.
Objective 2: To determine (using declared nutrition information) the nutrient profile of cow’s milk GUMs, launched in different cities across Indonesia, using the UK FSA NPM.
Sub-objective 2.1: To nutrient-profile the GUMs using the UK FSA NPM, to determine their healthfulness.Sub-objective 2.2: To assess the GUMs against the UK FoP algorithm for sugar.• The nutritional information per 100g of reconstituted GUMs (energy (KJ), saturated fat (g), total sugar
(g), sodium (g), dietary fibre (g), protein (g)) were used to determine the nutrient profile using the UK FSA NPM (Addendum 1), which categorises products as ‘healthy’ or ‘less healthy’. As the model required grams of the product and the information captured was in millilitres, a conversion was undertaken using the density of cow’s milk as being 1.03g/cc (100ml of milk equals 103g). Descriptive statistics were used to present the characteristics of the GUMs.
• The total sugar content (g) of the GUMs was assessed against the UK FSA Algorithm FoP colour coding (Addendum 2). Depending on the serving size, the algorithm assesses total sugar (g) per 100ml or per serving. Each product was classified as either green (low), amber (medium), or red (high) in sugar.

Practices of Growing-up Milks (GUMs) | Indonesia Page 17
Objective 3:To determine if nutrient content claims are made on the labels of cow’s milk GUMs, and for which nutrients.
Sub-objective 3.1: To assess the frequency of all types of nutrient content claims on GUMs.Sub-objective 3.2: To assess GUMs making all types of nutrient content claims, stratified by their nutrient profile score.Sub-objective 3.3: To assess GUMs making all types of nutrient content claims, stratified by their FoP sugar classification.• Descriptive statistics were used to present the nutrient content claims made on GUM labels. Frequencies
of nutrient content claims per nutrient were calculated. Products making nutrient content claims were stratified by their nutrient profile score category (‘healthy’ vs ‘less healthy’) and FoP sugar classification (‘low’, ‘medium’ ‘high’).
Objective 4: To provide a snapshot of the cost of cow’s milk GUMs, launched in different cities across Indonesia, compared to whole cow’s milk, which is recommended for non-breastfed children older than 1 year.• The price of the GUMs was the price when purchased by Innova Market Insights during the period
that the data was collected. The price of whole milk was the price of 1 litre of whole milk in Jakarta in Indonesian Rupiah (Rp) on 11th October 2019 as listed on the website https://www.expatistan.com/price/milk/jakarta.
• Given the limitations of the methodology for the price data, this information is considered no more than a snapshot of the price of GUMs compared to whole cow’s milk.
• Descriptive statistics were used to compare the cost of GUMs to whole cow’s milk, which is recommended for children older than 1 year of age if they are not breastfed12.
9 The lactose composition of cow’s milk per 100g was calculated as a mean of the lactose composition of whole milk, 2% fat milk, 1% fat milk and non-fat milk, specifically: USDA: cow – food code 01211 “Milk, whole, 3.25% milkfat, without added vitamin A and vitamin D”; USDA: cow – food code 01174 “Milk, reduced fat, fluid, 2% milkfat, without added vitamin A and Vitamin D”; USDA: cow – food code 01175 “Milk, fluid, 1% fat, without added vitamin A and vitamin D”; USDA: cow – food code 01151 “Milk, nonfat, fluid, without added vitamin A and vitamin D (fat free or skim)” (FAO, 2013).
10 The density of cow’s milk was calculated as a mean of the density of whole milk, reduced fat milk, 1% fat milk and non-fat milk, specifically: USDA: cow – food code 01211 “Milk, whole, 3.25% milkfat, without added vitamin A and vitamin D”; USDA: cow – food code 01174 “Milk, reduced fat, fluid, 2% milkfat, without added vitamin A and vitamin D”; USDA: cow – food code. 01175 “Milk, fluid, 1% fat, without added vitamin A and vitamin D”; USDA: cow – food code 01151 “Milk, nonfat, fluid, without added vitamin A and vitamin D (fat free or skim)” (www.aqua-calc.com).
11 For GUMs for young children the Codex Draft Revised Standard for Follow-Up Formula (CXS 156-1987) requires that mono- and di-saccharides, other than lactose, should not exceed 2.5g/100kcal (0.60g/100kJ). For the purposes of this study, the calculated free sugar content (total sugar – lactose composition of cow’s milk = free sugar) represents mono- and di-saccharides, other than lactose. National and/or regional authorities may limit this level to 1.25g/100 kcal (0.30g/100kJ).
12 Healthy Eating Research (2019) Healthy Beverage Consumption in Early Childhood: Recommendations from Key National Health and Nutrition Organizations https://healthyeatingresearch.org/wp-content/uploads/2019/09/HER-HealthyBeverages-ConseunsusStatement.pdf
Giacomo Pirozzi | Alive & Thrive.

Practices of Growing-up Milks (GUMs) | Indonesia18 Page
• The study is considered to be useful for the CCNFSDU in its review of the FUF Standard. Specifically, it provides a greater understanding of the current positioning of the products for the 12-36 months age group, referred to in this study as GUMs, in terms of: their nutritional content, especially sugar; their nutrient profile; and their cost.
• The study also assists Indonesian policy makers to better assess the appropriateness and place of GUMs in the diet of children aged 12 – 36 months and generates evidence to aid the strengthening of national infant and young child feeding policies and regulations.
6 RESEARCH SIGNIFICANCE
Giacomo Pirozzi | Alive & Thrive.

Practices of Growing-up Milks (GUMs) | Indonesia Page 19
The suboptimal breastfeeding ratesand the volume sales growth ofgrowing-up milks in Indonesia
indicate a clear need forregulatory reform to encompass
breast-milk substitutes beyond 12 monthsin national Code regulations.

Practices of Growing-up Milks (GUMs) | Indonesia20 Page
7.1 Sample Descriptives
The dataset of GUMs represented products from 17 different manufacturers and 29 different brands. Nutricia, Nestlé and Sarihusada produced the largest number of products, while the most common brands included Bebelac (Nutricia), SGM (Sarihusada – Danone), and Dancow (Nestlé) (Table 5). Just over one third (31%) were produced by Indonesian companies.
7 FINDINGS AND THEIR IMPLICATIONS
Giacomo Pirozzi | Alive & Thrive.

Practices of Growing-up Milks (GUMs) | Indonesia Page 21
Manufacturer International or national company
Brand Number of products (%)*
Nutricia InternationalBebelac 18 (18%)Nutricia 1 (1%)Nutrilon 6 (6%)
Sub-total 25 (25%)
Nestlé International
Batita 4 (4%)Dancow 10 (10%)Lactogrow 6 (6%)Nan 1 (1%)
Sub-total 21 (21%)Sarihusada National SGM 14 (14%)
Sub-total 14 (14%)Tempo Scan Pacific National Vidoran 7 (7%)
Sub-total 7 (7%)Frisian Flag International Frisian Flag 5 (5%)
Sub-total 5 (5%)
Dumex InternationalDugro 2 (2%)Mamex 1 (1%)Mamil 1 (1%)
Sub-total 4 (4%)
Mead Johnson Nutrition International Enfagrow 3 (3%)Sustagen 1 (1%)
Sub-total 4 (4%)
Kalbe Morinaga National Chil Go 1 (1%)Chil Kid 1 (1%)Kalbe Morinaga 1 (1%)
Sub-total 3 (3%)Morinaga International Morinaga 3 (3%)
Sub-total 3 (3%)
Ultrajaya Milk National Ultrajaya 1 (1%)Ultra Mimi 2 (2%)
Sub-total 3 (3%)Wyeth International S26 3 (3%)
Sub-total 3 (3%)
Kalbe Farma International Kasih 1 (1%)Zee 1 (1%)
Sub-total 2 (2%)Mirota National Lactona 2 (2%)
Sub-total 2 (2%)Fonterra International Anmum 1 (1%)
Sub-total 1 (1%)Friesland Campina International Friso 1 (1%)
Sub-total 1 (1%)Mirota Ksm National Lactona 1 (1%)
Sub-total 1 (1%)Pt Kalbe Farma National Kalbe 1 (1%)
Sub-total 1 (1%)Total sample 100
Table 5 Manufacturers and Brands of GUMs
* As the number of products included in the analysis was 100, the numbers and percentages are the same.

Practices of Growing-up Milks (GUMs) | Indonesia22 Page
7.2 Objective 1: To assess the mono- and disaccharide, excluding lactose, composition and content (determined using the ingredient list and nutrition information provided on the product label) of cow’s milk GUMs, launched in different cities across Indonesia, against 2018 global guidance [draft 2018 CODEX STAN (CXS 156-1987)].
Of the 100 GUM products assessed, 9 were ready to drink GUMs and 91 were powdered milk products requiring reconstituting with water. The GUMs came in 7 flavour variants, the most common being vanilla (n=37), honey (n=35) and plain (n=14). Other flavours included chocolate, fruity and strawberry.
7.2.1 Sub-objective 1: To assess the compliance of GUMs with the mono- and disaccharide, excluding lactose, criteria of the draft 2018 CODEX STAN (CXS 156-1987).
The draft 2018 CODEX STAN (CXS 156-1987) states that the mono- and disaccharide, excluding lactose content should be less than or equal to 2.5g/100kcal, and that countries can restrict this to even less than 1.25g/100kcal.
The overall results are shown in Figure 1.
Compliance of products with the draft 2018 Codex mono- and disaccharide, excluding lactose, content recommendations are presented in Table 6. Twelve products (12%) did not provide the information necessary to determine the mono- and disaccharides, excluding lactose, content. Of the products that provided the necessary information on their labels, 38.6% (n=34/88) had a mono- and disaccharide, excluding lactose, content greater than 2.5g/100kcal and therefore did not comply with the draft 2018 Codex criteria, while 61.4% (n=54/88) were found to be compliant.
Assessed GUMs compliance with draft 2018 Codex mono- and disaccharide, excluding lactose, content of ≤ 2.5g/100kcal
Number of products (%) *
Total that complied: 54 (61.4%)
Compliant: > 1.25g to ≤ 2.5g/100kcal 33 (37%)
Prudent: ≤ 1.25g/100 kcal 21 (24%)
Total that did not comply: 34 (38.6%)
7.2.2 Sub-objective 2: To assess the compliance of GUMs with the draft 2018 CODEX STAN (CXS 156-1987) that these products should not contain added fructose and sucrose13.
Compliance of products with the draft 2018 Codex requirement that they should not contain added fructose and sucrose are presented in Table 7. Three quarters (77%) of GUMs were found to be non-compliant. Almost three quarters (73%, n=73) contained sucrose but no fructose, and four percent (n=4) contained both fructose and sucrose.
Close to a quarter of the products (23%, n=23) did not contain added sucrose and fructose, however 88% of these products contained other added sugars/sweeteners. Only 2 products contained no added sugar/sweetener.
Table 6 Compliance of GUMs with the mono- and disaccharide, excluding lactose, criteria of draft 2018 CODEX STAN (CXS 156-1987) (n=88)
* Among products whose mono- and disaccharide, excluding lactose, content could be assessed based on label information.
Compliant ≤2.5g per 100kcal
Not compliant
Could not be assessed
54+34+1254%34%
12%
Figure 1: Compliance of GUMs with draft 2018 Codex mono- and disaccharide, excluding lactose, requirement of ≤2.5g per 100kcal (n=100)

Practices of Growing-up Milks (GUMs) | Indonesia Page 23
7.2.3 Sub-objective 3: To assess the types of sugars/sweeteners added to GUMs.
Almost all GUMs (98%) contained one or more added sugars/sweeteners, while two products (2%) did not report containing sucrose, fructose or other sweetening agents according to the information provided in the ingredient list (Table 8).
Sucrose, lactose, honey derivatives, fructooligosaccharide, galactooligosaccharide and solid glucose syrup were the 6 most common sugars/sweeteners added to GUMs and were added to almost a quarter and up to three quarters of these products. Over three quarters (77%) of GUMs contained sucrose.
Most GUMs contained between 1 and 10 added sugars/sweeteners to sweeten the product, the average being 5 different added sugars/sweeteners.
GUMs compliance with draft 2018 Codex guideline of no added fructose or sucrose
Numbers of products (%)*
Total that complied: 23 (23%)
GUMs with added sugar, excluding sucrose/fructose
21 (21%)
GUMs without any added sugar/sweetener 2 (2%)
Total that did not comply: 77 (77%)
GUMs with added sucrose but no fructose 73 (73%)
GUMs with added sucrose and fructose 4 (4%)
Added sugar/sweeteners Number of products (%)*
GUMs with added sugars/sweeteners: 98 (98%)
Sucrose 77 (77%)
Lactose 70 (70%)
Honey derivatives: 34 (34%)
Honey Powder 20 (20%)
Honey 11 (11%)
Natural Honeycomb 3 (3%)
Fructooligosaccharide 31 (31%)
Galactooligosaccharide 30 (30%)
Solid Glucose Syrup 23 (23%)
Inositol 11 (11%)
Oligofructose 7 (7%)
Polyfructose 5 (5%)
Fructose 4 (4%)
Solid Corn Syrup 3 (3%)
Isomaltulose 2 (2%)
GUMs with no added sugar/sweetener 2 (2%)
Table 7 Compliance of GUMs with the draft 2018 CODEX STAN (CXS 156-1987) requirements on sucrose and fructose content (n=100)
Table 8 Types of added sugars/sweeteners listed in the ingredients of GUMs as a percentage of the total sample in descending order (n=100)
* As the number of products included in the analysis was 100, the numbers and percentages are the same.
13 The words sugar and sucrose both refer to table sugar and therefore will both be referred to as sucrose in this study. In objectives 1.2 and 1.3, consider all products that used the word sugar to be sucrose.
* As the number of products included in the analysis was 100, the numbers and percentages are the same.

Practices of Growing-up Milks (GUMs) | Indonesia24 Page
UN0248737:© UNICEF/UN0248737/Noorani
7.2.4 Objective 1: Finding implications
Based on the findings that assessed the mono- and disaccharides, excluding lactose, composition and content of the GUMs against the draft 2018 CODEX STAN (CXS 156-1987), very few of the products meet the requirements both for the level of mono- and disaccharides, excluding lactose, and the non-addition of fructose and sucrose.
Major product re-formulation of GUMs will be required for them to comply with the sugar/sweetener requirements being set in the 2018 of the CODEX STAN (CXS 156-1987).
The current sugar/sweetener composition and content makes GUMs inappropriate for inclusion in the diets of young children.
7.3 Objective 2: To determine (using declared nutrition information) the nutrient profile of cow’s milk GUMs launched in different cities across Indonesia using the UK FSA NPM.
7.3.1 Sub-objective 1: To nutrient profile the GUMs using the UK FSA Nutrient Profiling Model to determine their healthfulness.
Nutrient profile modelling was used to determine if a product was classified as either healthy or less healthy. This objective was to nutrient profile the GUMs included in this study, using the UK FSA Nutrient Profiling Model to determine their healthfulness. The UK FSA NPM is used to determine the appropriateness of products to be promoted to children and classifies products as either ‘healthy’ or ‘less healthy’ based on ‘negative nutrient’ content (energy density, saturated fat, total sugar, and sodium) versus ‘positive nutrient’ content (proportion of the food that is from fruit/vegetables/nuts, fibre, and protein). Nutrient content for these nutrients must therefore be present on the labels to use the UK FSA NPM.
Almost three quarters of GUMs (71%, n=71) did not provide sufficient information to be assessed against the UK FSA NPM. Of the 29 products which did provide sufficient information to be assessed, 19 GUMs (66%) were classified as ‘healthy’ and 10 GUMs (34%) were considered ‘less healthy’.

Practices of Growing-up Milks (GUMs) | Indonesia Page 25
5+25+7025%
70%
5%
Low (≤2.5g/100ml)
Medium (>2.5g to ≤11.25g/100ml)
High (>11.25g/100ml / Very high (>13.5g/portion)
Figure 2: UK FSA FoP Algorithm total sugar results of GUMs that could be assessed (n=93).
7.3.2 Sub-objective 2: To assess the GUMs against the UK Front-of-Pack (FoP) Algorithm for sugar.
The UK FSA FoP Algorithm assesses different components of a product (total fat, saturated fat, total sugars and salt) and scores each component into low (green), medium (amber), and high (red) levels, which then appear on the front of the product packaging. The FoP assessment is designed to complement the UK FSA NPM. This sub-objective assessed the GUMs against the UK FoP Algorithm, specifically for sugar levels.
Seven GUMs (7%) could not be assessed due to the label providing insufficient sugar information. For those that could be assessed (n=93), almost three quarters (70%, n=65) had high (>11.25g/100ml/>13.5g/portion) total sugar levels, 25% (n=23) had medium (>2.5g to ≤11.25g/100ml) total sugar levels, and only 5% (n=5) had low (≤2.5g/100ml) total sugar levels (Figure 2).
7.3.3 Objective 2: Finding implications
Currently, almost three quarters (71%) of GUMs do not provide sufficient information to be assessed against the UK FSA NPM.
Of those that could be nutrient profiled, over one third (34%) were not considered to be healthy, based on their energy density, saturated fat, total sugar, and sodium content.
In addition, almost three quarters (70%) of GUMs that provided sugar information had high sugar levels that warrant a red warning label based on the UK FSA FoP sugar classification.
Furthermore, the Codex categorisation of free sugar in the draft Revised Standard for Follow-up Formula showed that just over a third (36%) of GUMs had high free sugar levels.
These assessments clarify that GUMs are considered unsuitable for feeding young children.

Practices of Growing-up Milks (GUMs) | Indonesia26 Page
7.4 Objective 3: To determine if nutrient content claims are made on the labels of cow’s milk GUMs, and for which nutrients.
7.4.1 Sub-objective 1: To assess the frequency of all types of nutrient content claims on GUMs.
Codex Alimentarius (Codex) states that “nutrition and health claims shall not be permitted for foods for infants and young children except where specifically provided for in relevant Codex standards or national legislation.” No Codex document makes such provision. The Code and subsequent relevant WHA resolutions prohibit nutrition and health claims on BMS.
In order to assess compliance with the prohibition on the sub-category of nutrition and health claims referred to as ‘nutrient content claims’ (describes the level of a nutrient contained in a food), the presence and frequency of all types of nutrient content claims on GUMs were assessed.
Almost all (97%) GUMs made some type of nutrient content claim. These claims are not permitted on foods for infants and young children according to Codex.
GUMs were found to make ‘Source of’ claims most frequently for inulin (18%), vitamin A (17%), vitamin B2 (16%), vitamin D (16%) and vitamin E (16%). ‘High in/rich in’ claims were most commonly used for zinc (18%), vitamin A (14%), vitamin C (14%), calcium (14%), and vitamin E (12%). ‘Low’ claims related to sugar content. It is important to note that the product that claimed, ‘low sucrose’, on analysis using the FoP algorithm was in fact categorized as high in total sugar. See Table 9 for the full list.
Nutrient content claimNumber of products (%)*
‘Source of’Inulin 18 (18%)Vitamin A 17 (17%)Vitamin B2 (Riboflavin) 16 (16%)Vitamin D 16 (16%)Vitamin E 16 (16%)Vitamin C 15 (15%)Phosphorus 15 (15%)Calcium 14 (14%)Vitamin B12 14 (14%)Vitamin B6 (Pyridoxine) 13 (13%)Iron 13 (13%)Magnesium 12 (12%)Zinc 12 (12%)Selenium 11 (11%)Vitamin B1 (Thiamine) 10 (10%)Vitamin B3 (Niacin) 10 (10%)Vitamin B5 (Pantothenic acid) 10 (10%)Vitamin B9 (Folate) 10 (10%)Choline 8 (8%)Iodine 8 (8%)Vitamin B7 (Biotin) 7 (7%)Potassium 7 (7%)Omega 6 7 (7%)Vitamin K 6 (6%)
Table 9 Frequency of ‘source of’ and ‘high in’ nutrient content claims on GUMs in descending order (n=100)

Practices of Growing-up Milks (GUMs) | Indonesia Page 27
Sodium 6 (6%)Omega 3 5 (5%)Copper 4 (4%)Fish oil 3 (3%)Manganese 3 (3%)Chloride 2 (2%)Cod liver oil 2 (2%)Optimized protein 2 (2%)Dietary fibre 1 (1%)‘High in’/’Rich in’Zinc 18 (18%)Vitamin A 14 (14%)Vitamin C 14 (14%)Calcium 14 (14%)Vitamin E 12 (12%)Vitamin D 7 (7%)Iron 7 (7%)Selenium 7 (7%)Vitamin B1 (Thiamine) 4 (4%)Vitamin B2 (Riboflavin) 4 (4%)Vitamin B3 (Niacin) 4 (4%)Vitamin B6 (Pyridoxine) 4 (4%)Vitamin B12 4 (4%)Phosphorus 4 (4%)Iodine 4 (4%)Vitamin B5 (Pantothenic acid) 3 (3%)Dietary fibre 3 (3%)Omega 6 3 (3%)Fish oil 2 (2%)Omega 3 2 (2%)Protein 2 (2%)Vitamin B7 (Biotin) 1 (1%)Vitamin B9 (Folate) 1 (1%)Magnesium 1 (1%)‘Low’/’Free’Low sucrose 1 (1%)
* As the number of products included in the analysis was 100, the numbers and percentages are the same.
The Code and subsequent relevant WHA resolution (WHA 58.32)
urges Member States to ensure thatnutrition and health claims are
not permitted for breast-milk substitutes

Practices of Growing-up Milks (GUMs) | Indonesia28 Page
7.4.2 Sub-objective 2: To assess GUMs making all types of nutrient content claims, stratified by their nutrient profile score.
While almost all (97%, n=97) GUMs made some type of nutrient content claim, only a third (29%, n=29) provided sufficient label information to determine their overall healthfulness using the UK FSA NPM. Of the 29 that underwent UK FSA nutrient profiling, 66% (n=19) were classified as ‘healthy’ and just over a third (34%; n=10) were classified as ‘less healthy’ (Table 10).
Sixty-eight products which made some type of nutrient content claim provided insufficient information to be assessed for its healthfulness using the UK FSA NPM.
7.4.3 Sub-objective 3: To assess GUMs making all types of nutrient content claims, stratified by their FoP analysis score.
The findings of the GUMs that made some type of nutrient content claim that could be assessed (n=90) for their sugar content14 using the UK FSA FoP algorithm are shown in Figure 3. Five percent (n=5) of products which made some type of nutrient content claim and could be assessed had a ‘low’ sugar content according UK FSA FoP algorithm. Twenty-six (n=23) had medium levels of sugar, 69% (n=62) had high sugar levels.
GUMs making nutrient content claims stratified by nutrient profile Number of products (%)*
Nutrient Profile: Healthy 19 (66%)
Nutrient Profile: Less healthy 10 (34%)
Table 10 GUMs making nutrient content claims, stratified by their nutrient profile using the UK FSA NPM (n=29).
Low (≤2.5g/100ml):
Medium (>2.5g to ≤11.25g/100ml)
High (>11.25g/100ml / Very high (>13.5g/portion)
Figure 3: Products making some type of nutrient content claim, stratified by their FoP sugar content using the UK FSA FoP algorithm (n=90)
7.4.4 Objective 3: Finding implications
GUMs use nutrient content claims extensively. This study showed that 97% of products made a nutrient content claim. Such claims are used by manufacturers and considered by consumers to indicate that the product offers a health benefit(s).
The findings of this study show that in a third (34%) of cases with sufficient information to review, the GUMs making nutrient content claims are, in fact, not considered to be healthy when they undergo nutrient profiling using the UK FSA NPM.
In addition, 69% that provided the product’s sugar content, are classified as having a high sugar content (red category) when assessed using the UK FSA FoP sugar calculation.
5+26+6926%
69%
5%

Practices of Growing-up Milks (GUMs) | Indonesia Page 29
The Code and subsequent relevant WHA resolutions urge Member States to ensure that nutrition and health claims are not permitted for BMS. Codex does not permit nutrition and health claims on foods for infants and young children unless specifically provided for in national legislation.
It is important to note that, based on the Indonesian regulations, some categories of claims including nutrient content claims that meet specific criteria, are permitted on products for young children aged 1-3 years. No claims are permitted on the labels of foods for infants aged 6-12 months. Thus, all the nutrient content claims described in this study would in theory be permitted. It would, however, be necessary to determine if the nutrient content stated on the label 1) complied with the Indonesian regulatory criteria for those claims and 2) when laboratory tested, contained the levels stated on the product label. This was not within the scope of this research. It is clear that without a nutrient profiling model being mandatory in Indonesia, many GUMs are sold as suitable for children aged 12-36 months despite their overall nutrient composition not being considered healthy.
Appropriate nutrient profiling should be mandatory for any product to make nutrition claims (including nutrient content claims), in order to prevent products with an overall nutrient composition that is not considered healthy from misleading consumers.
7.5 Objective 4: To provide a snapshot/indication of the cost of cow’s milk GUMs, launched in different cities across Indonesia compared to whole cow’s milk, which is recommended for non-breastfed children older than 1 year.
The average cost per 100ml of the GUMs (n=100) was USD 1.39. The cost of whole cow’s milk per 100ml was USD 0.14. Thus, as a snapshot, GUMs cost approximately 9 times what whole cow’s milk costs per 100ml.
7.5.1 Objective 4: Finding implications
Recognising the limitations of the price data used for the calculations, a snapshot/indication of the cost of GUMs versus whole cow’s milk (which is globally recommended for children older than 1 year that are no longer breastfed), shows that GUMs cost 9 times more than whole cow’s milk per 100ml. This makes GUMs very expensive compared to whole cow’s milk.
Considering that the other aspects of this research showed most GUMs to be nutritionally inappropriate for this age group of children and they are globally not recommended, their high cost further adds to concerns as to their use and relevance for feeding young children in Indonesia.
14 Low (green) category: ≤2.5g/100ml; medium (amber) category: >2.5g to ≤11.25g/100ml; High (red) category: >11.25g/100ml or >13.5g/portion. Guide to creating a front of pack (FoP) nutrition label for prepacked products sold through retail outlets (UK Ministry of Health, 2016).
Giacomo Pirozzi | Alive & Thrive.

Practices of Growing-up Milks (GUMs) | Indonesia30 Page
Alive and Thrive (2017). Maternal, Infant, and Young Child Nutrition and Nutrition-Sensitive Practices in Indonesia – Desk Review.
Arambepola C., Scarborough P., Rayner M (2008) Validating a nutrient profile model. Public Health Nutrition 11(4):371-8.
Codex Alimentarius (2018). Draft Codex Standard for Follow-Up Formula, CODEX STAN CXS 156-1987.
Department of Health, the Food Standards Agency, administrations in Scotland, Northern Ireland and Wales in collaboration with the British Retail Consortium (2016). Guide to creating a front of pack (FoP) nutrition label for pre-packed products sold through retail outlets.
Development Initiatives (2017). Global Nutrition Report 2017: Nourishing the SDGs. Bristol, UK: Development Initiatives.
REFERENCES
Giacomo Pirozzi | Alive & Thrive.

Practices of Growing-up Milks (GUMs) | Indonesia Page 31
Euromonitor International (2016). Passport, Baby Food in Indonesia.
European Food Safety Authority (EFSA) (2013) Report of “data collection with respect to the availability of nutritional composition of different types of milk-based drinks and similar products for young children with the denomination of ‘growing-up milks’ or ‘toddler’ milks or with similar terminology currently on the market in EU Member States”.
Food and Agriculture Organization of The United Nations (FAO) (2013). Milk and dairy products in human nutrition.
Hadihardjono DN, Green M, Stormer A, Agustino, Izwardy D, Champeny M (2019). Promotions of breast-milk substitutes, commercial complementary food and commercial snack products commonly fed to young children are frequently found in point-of-sale in Bandung City, Indonesia. Matern Child Nutr. 2019; 15 (S4).
Healthy Eating Research (2019) Healthy Beverage Consumption in Early Childhood: Recommendations from Key National Health and Nutrition Organizations.
Hidayana, I., Februhartanty, J., & Parady, V. A. (2017). Violations of the International Code of Marketing of Breast-milk Substitutes: Indonesia context. Public Health Nutr, 20(1), 165-173.
Kementerian Kesehatan Republik Indonesia. (2018). Laporan Nasional RISKESDAS 2018. Jakarta, Indonesia. Badan Penelitian dan Pengembangan Kesehatan Kementerian Kesehatan RI.
National Population and Family Planning Board (BKKBN), Central Bureau of Statistics (BPS), Ministry of Health (Kemenkes), and USAID. (2018). Indonesia Demographic and Health Survey 2017. Jakarta, Indonesia: BKKBN, BPS, Kemenkes, and USAID: Jakarta, Indonesia.
Food Standards Agency (FSA) (2009) Nutrient Profiling Technical Guidance.
Research and Markets (2018) Global Infant Formula Market: Industry Analysis & Outlook (2018-2022) [online] Available at: www.researchandmarkets/reports/4471575/hlobal-infants-formula-market-industry-analysis.
Rollins NC., Bhandari N., Hajeebhoy N., Horton S., Lutter CK., Martines JC. (2016) Why invest, and what it will take to improve breastfeeding practices. Lancet (2016) 387(10017), 491-504.
Walters D., Horton S., Yudistirma A., Siregar., Pitriyan P et al. (2016) The cost of not breastfeeding in Southeast Asia. Health Policy and Planning (2016) 31(8), 1107-1116. World Health Assesmbly (WHA) 2002. Infant and young child nutrition: Global strategy on infant and young child feeding. Geneva.
World Health Assembly (WHA) 2016. End inappropriate promotion of foods for infants and young children. WHA 69.9.
World Health Organization (WHO) (2010) Marketing of foods and non-alcoholic beverages to children. Geneva.
World Health Organization (WHO) (2016). Maternal, infant and young child nutrition. Guidance on ending the inappropriate promotion of foods for infants and young children.
World Health Organization (WHO) (2018). Marketing of breast-milk substitutes: national implementation of the international code, status report 2018. Geneva.

Practices of Growing-up Milks (GUMs) | Indonesia32 Page
Addendum 1: The UK FSA Nutrient Profiling Model in detail
The model provides a single score for any given food product, based on calculating the number of points for ‘negative’ nutrients which can be offset by points for ‘positive’ nutrients. Points are allocated on the basis of the nutritional content in 100g of a food or drink.
There are three steps to working out the overall score for the food or drink.
1. Calculate the total ‘A’ pointsA maximum of ten points can be awarded for each ingredient (energy, saturated fat, sugar and sodium). The total ‘A’ points are the sum of the points scored for each ingredient.
ADDENDA
Points Energy (kJ) Sat Fat (g) Total Sugar (g) Sodium (mg)
0 ≤ 335 ≤ 1 ≤ 4.5 ≤ 90
1 >335 >1 >4.5 >90
2 >670 >2 >9 >180
3 >1005 >3 >13.5 >270
4 >1340 >4 >18 >360
5 >1675 >5 >22.5 >450
6 >2010 >6 >27 >540
7 >2345 >7 >31 >630
8 >2680 >8 >36 >720
9 >3015 >9 >40 >810
10 >3350 >10 >45 >900
Total ‘A’ points = [points for energy] + [points for saturated fat] + [points for sugars] + [points for sodium]
Giacomo Pirozzi | Alive & Thrive.

Practices of Growing-up Milks (GUMs) | Indonesia Page 33
If a food or drink scores 11 or more ‘A’ points then it cannot score points for protein unless it also scores 5 points for fruit, nuts and vegetables.
2. Calculate the total ‘C’ points
A maximum of five points can be awarded for each ingredient. The total ‘C’ points are the sum of the points for each ingredient (note that you should choose one or other of the dietary fibre columns according to how the fibre content of the food or beverage was calculated).
Total ‘C’ points = [points for fruit, vegetable and nut content] + [points for fibre (either NSP or AOAC)] + [points for protein]
NB: Guidance on scoring fruit, vegetable and nut content is available from the Food Standards Agency.
3. Calculate the overall score If a food scores less than 11 ‘A’ points, then the overall score is calculated as follows: Overall score = [total ‘A’ points] minus [total ‘C’ points].
If a food scores 11 or more ‘A’ points but scores 5 points for fruit, vegetables and nuts then the overall score is calculated as follows: Overall score = [total ‘A’ points] minus [total ‘C’ points]
If a food scores 11 or more ‘A’ points but also scores less than 5 points for fruit, vegetables and nuts, then the overall score is calculated without reference to the protein value, as follows: Overall score = [total ‘A’ points] minus [fibre points + fruit, vegetables and nuts points only]
The model can be adjusted to take account of changes in public health nutritional policy. Within the model any threshold can be defined according to the judgment of the policy makers and their scientific advisers. For the purposes of the advertising controls introduced in the United Kingdom: a food is classified as ‘less healthy’ where it scores 4 points or more, and a drink is classified as ‘less healthy’ where it scores 1 point or more.
There are a number of frequently asked questions about how to use the model to calculate scores for products. One of them is: ‘What counts as a food and what as a drink?’ For the purpose of the model, a drink is defined as ‘any liquid food, excluding oils, soups, condiments (vinegar, salad cream etc.) and dressings.’
Answers to other questions such as ‘Should scores be calculated for products as eaten or as sold?’, ‘How do you calculate the scores for foods where nutritional information is provided by volume rather than weight?’, and worked examples, are available in the technical advice provided by the Food Standards Agency.
The model can be adjusted so that points for foods and drinks fall on a scale from 1 to 100 where 1 is the least healthy and 100 is the most healthy product using a simple formula: NEW SCORE = (-2) *OLD SCORE + 70
Points Fruit, Veg & Nut (%) NSP Fibre (g) or AOAC Fibre (g) Protein (g)
0 ≤ 40 ≤ 0.7 ≤ 0.9 ≤ 1.6
1 >40 >0.7 >0.9 >1.6
2 >60 >1.4 >1.9 >3.2
3 - >2.1 >2.8 >4.8
4 - >2.8 >3.7 >6.4
5 >80 >3.5 >4.7 >8.0

Practices of Growing-up Milks (GUMs) | Indonesia34 Page
Addendum 2: UK FSA Front-of-pack (FoP) Algorithm
Text LOW9 MEDIUM HIGH
Colour code Green Amber Red
>12.5% of Reference Intakes (RIs)
>15% ofReference Intakes (RIs)
Fat ≤ 1.5g/100ml > 1.5g to≤ 8.75g/100ml
> 8.75g/100ml >10.5g/portion
Saturates ≤ 0.75g/100ml > 0.75g to≤ 2.5g/100ml
> 2.5g/100ml > 3g/portion
(Total) Sugars ≤ 2.5g/100ml > 2.5g to≤ 11.25g/100ml
> 11.25g/100ml > 13.5g/portion
Salt ≤ 0.3g/100ml >0.3g to≤0.75g/100ml
> 0.75g/100ml > 0.9g/portion
Note: Portion size criteria apply to portions/serving sizes greater than 150ml.

Practices of Growing-up Milks (GUMs) | Indonesia Page 35
UNI95796:© UNICEF/UNI95796/EsteyBack Cover Image