Réponse du bouleau glanduleux (Betula glandulosa Michx ...
168
Réponse du bouleau glanduleux (Betula glandulosa Michx.) aux changements climatiques récents Implications pour l’écotone forêt boréale-toundra, Nunavik Thèse Pascale Ropars Doctorat en biologie Philosophiae Doctor (Ph.D.) Québec, Canada © Pascale Ropars, 2015
-
Upload
khangminh22 -
Category
Documents
-
view
1 -
download
0
Transcript of Réponse du bouleau glanduleux (Betula glandulosa Michx ...

Réponse du bouleau glanduleux (Betula glandulosa Michx.) aux changements climatiques récents
Implications pour l’écotone forêt boréale-toundra, Nunavik
Thèse
Pascale Ropars
Doctorat en biologie Philosophiae Doctor (Ph.D.)
Québec, Canada
© Pascale Ropars, 2015


iii
Résumé
Au cœur des changements environnementaux enregistrés dans les régions arctiques et
subarctiques, la densification de la strate arbustive est probablement l’un des plus
importants. Cette thèse propose d’en étudier la dynamique récente à l’écotone forêt boréale-
toundra (Nunavik) afin de mieux en cerner les causes et d’en évaluer les conséquences.
Dans un premier temps, la comparaison d’images aériennes (1957 et 2008) nous révèle une
densification importante de la strate arbustive dans la région d’étude. Largement attribuée à
Betula glandulosa, cette densification a été plus importante sur les terrasses que sur les
sommets et hétérogène à l’échelle du paysage. Par la suite, je me suis attardée aux causes
de l’hétérogénéité de la densification de la strate arbustive et ai trouvé que celle-ci était
principalement attribuable à un ensemble de facteurs historiques et topographiques. De
plus, j’ai pu montrer que la densification de la strate arbustive a une influence négative sur
l’abondance des espèces arbustives non impliquées dans ce phénomène, mais qu’aucune
relation n’a été décelée avec la diversité spécifique (richesse spécifique et indice de
diversité de Shannon). Finalement, j’ai montré que la croissance radiale et axiale de B.
glandulosa était fortement associée aux températures estivales chez les individus établis sur
des sites bien drainés et aux précipitations hivernales chez ceux établis dans les combes à
neige (milieu mal drainé où la neige persiste dans la saison de croissance). De surcroît, la
forte augmentation de la croissance radiale de B. glandulosa entre 1990 et 2002 suggère
que la densification de la strate arbustive observée dans la région d’étude est un phénomène
récent. En somme, cette thèse a permis de mieux comprendre la dynamique de l’écotone
forêt boréale-toundra au Québec subarctique dans un contexte de changements climatiques.
Elle a aussi contribué à saisir toute l’importance d’une analyse à fine échelle de la
croissance des espèces impliquées dans la densification de la strate arbustive ainsi qu’à
approfondir nos connaissances sur une espèce structurante du Québec subarctique, B.
glandulosa.


v
Abstract
One of the major changes observed in northern terrestrial regions in response to climate
change is arguably the recent shrub expansion. This thesis aims to study the recent dynamic
of the shrub expansion at the forest tundra ecotone, northern Québec, in order to find its
causes and evaluate its consequences on plant community. First, I compared two sets of
aerial photographs (taken in 1957 and 2008) and found an increase in shrub cover that was
mainly attributed to Betula glandulosa, a largely distributed erect shrub species. This
increase was higher on terraces than on hilltops and strongly heterogeneous at the regional
scale. Second, I found that the heterogeneity of the shrub expansion depended on both
historical and topographic variables. Moreover, I showed that an increase in B. glandulosa
cover had a negative influence on the abundance of other shrub species, but not on their
diversity (species richness and Shannon diversity index). Finally, I found that B. glandulosa
radial and axial growth were strongly associated with summer temperature when growing
on well-drained sites, whereas they were mainly associated with winter precipitation when
growing in snowbeds (well-watered sites where snow cover persist in the growing season).
Dendrochronological analyses showed a sharp B. glandulosa growth increase between 1990
and 2002, therefore suggesting that the shrub expansion observed in the study region is
quite recent. Overall, this thesis significantly improved our knowledge of the recent
dynamic of the forest tundra ecotone in northern Québec. It also contributed to underline
the importance of studying shrub expansion at the local scale and to improve our
knowledge of B. glandulosa.


vii
Table des matières
Résumé ................................................................................................................................. iii Abstract ................................................................................................................................. v Table des matières .............................................................................................................. vii Liste des tableaux ................................................................................................................. xi Liste des figures ................................................................................................................. xiii Remerciements ................................................................................................................... xix Avant-propos ................................................................................................................... xxiii CHAPITRE 1 Introduction générale .................................................................................. 1
1.1 Les changements environnementaux récents ................................................................ 2 1.2 La limite latitudinale des arbres .................................................................................... 3 1.3 La strate arbustive ......................................................................................................... 5
1.3.1 Changements récents .............................................................................................. 7 1.3.2 Cause principale de la densification de la strate arbustive : l’augmentation récente des températures .............................................................................................................. 9 1.3.3 Autres causes potentielles de la densification de la strate arbustive .................... 13 1.3.4 Effets de la densification de la strate arbustive sur les communautés végétales .. 14
1.4 Le bouleau glanduleux : espèce structurante de l’EFT ............................................... 17 1.5 Objectifs de la thèse .................................................................................................... 18
CHAPITRE 2 Shrub expansion at the forest-tundra ecotone: spatial heterogeneity linked to local topography .................................................................................................. 21
2.1 Résumé ........................................................................................................................ 22 2.2 Abstract ....................................................................................................................... 23 2.3 Introduction ................................................................................................................. 24 2.4 Methods ....................................................................................................................... 26
2.4.1 Study area ............................................................................................................. 26 2.4.2 Ortho-photo analyses ............................................................................................ 26 2.4.3 Ground truthing .................................................................................................... 28 2.4.4 Statistical analysis ................................................................................................ 29
2.5 Results ......................................................................................................................... 30 2.5.1 Shrub cover change .............................................................................................. 30 2.5.2 Species implicated ................................................................................................ 30
2.6 Discussion ................................................................................................................... 32 2.6.1 Betula glandulosa, a key species for shrub expansion ......................................... 32 2.6.2 Potential causes of shrub expansion: climate change, fire or caribou? ................ 32
2.7 Conclusion .................................................................................................................. 35 2.8 Acknowledgments ....................................................................................................... 36

viii
2.9 Tables .......................................................................................................................... 37 2.10 Figures ...................................................................................................................... 39
CHAPITRE 3 Shrub densification in western Nunavik: the relative influence of historical and topographic variables ................................................................................ 45
3.1 Résumé ....................................................................................................................... 46 3.2 Abstract ....................................................................................................................... 47 3.3 Introduction ................................................................................................................ 48 3.4 Methods ...................................................................................................................... 51
3.4.1 Study area ............................................................................................................. 51 3.4.2 Site selection ........................................................................................................ 52 3.4.3 Data collection ..................................................................................................... 52 3.4.4 Statistical analyses ............................................................................................... 53
3.5 Results ........................................................................................................................ 56 3.5.1 Shrub communities .............................................................................................. 56 3.5.2 Candidate models to explain shrub densification ................................................ 56 3.5.3 Influence of shrub densification on the shrub community ................................... 57
3.6 Discussion ................................................................................................................... 59 3.6.1 Drivers of Betula glandulosa densification .......................................................... 59 3.6.2 Consequences on shrub community ..................................................................... 61
3.7 Conclusion .................................................................................................................. 63 3.8 Acknowledgments ...................................................................................................... 64 3.9 Tables .......................................................................................................................... 65 3.10 Figures ...................................................................................................................... 67
CHAPITRE 4 How do climate and topography influence the greening of the forest tundra ecotone in northwestern Québec? A dendrochronological analysis of Betula glandulosa ............................................................................................................................ 73
4.1 Résumé ....................................................................................................................... 74 4.2 Abstract ....................................................................................................................... 75 4.3 Introduction ................................................................................................................ 76 4.4 Methods ...................................................................................................................... 79
4.4.1 Study area ............................................................................................................. 79 4.4.2 Site selection and field sampling ......................................................................... 80 4.4.3 Radial growth and climatic data .......................................................................... 81 4.4.4 Axial elongation ................................................................................................... 83 4.4.5 NDVI data ............................................................................................................ 83
4.5 Results ........................................................................................................................ 85 4.5.1 Radial growth and climate ................................................................................... 85 4.5.2 Axial growth and climate ..................................................................................... 86 4.5.3 Dwarf birch radial growth and NDVI .................................................................. 87

ix
4.6 Discussion ................................................................................................................... 88 4.6.1 Topographic factors influencing dwarf birch growth ........................................... 88 4.6.2 Dwarf birch influence on regional greening ......................................................... 91
4.7 Conclusion .................................................................................................................. 92 4.8 Acknowledgments ....................................................................................................... 93 4.9 Tables .......................................................................................................................... 94 4.10 Figures ....................................................................................................................... 96 4.11 Supporting information ........................................................................................... 102
CHAPITRE 5 Conclusions générales .............................................................................. 111
5.1 Retour sur les résultats, contributions et limites ....................................................... 112 5.1.1 Étendue de la densification de la strate arbustive à l’écotone forêt boréale-toundra ..................................................................................................................................... 112 5.1.2 Causes et conséquences de la densification de la strate arbustive ...................... 114 5.1.3 La relation entre le climat et la croissance de Betula glandulosa ...................... 116
5.2 Perspectives ............................................................................................................... 119 Bibliographie ..................................................................................................................... 123

xi
Liste des tableaux
Table 2.1 Shrub cover change results for terraces (33 sites) and hilltops (26 sites). ........... 37 Table 2.2 Results of the validation analyses. First, shrub cover was evaluated on the non-
degraded (0.5m resolution) and the degraded (1m resolution) 2008 ortho-photos. Second, shrub cover evaluated on the 2008 ortho-photo (1m2 cell) was compared to ground thruthing results (total shrub cover and dwarf birch cover). ............................. 38
Table 3.1 Mean cover (± standard deviation) and occurrence of the 13 shrub species encountered in 2009 surveys in the Boniface river region, western Nunavik, Québec. The occurrence of a shrub species is defined as the percentage of sites on which the species was found over the total number of terraces (n = 33) and hilltops (n = 26). .... 65
Table 3.2 Akaike’s information criterion corrected for small sample size (AICc), differences (ΔAICc), weight (wAICc), cumulative weight (cumul. wAICc) and number of parameters (K) from the linear mixed models explaining the recent densification of Betula glandulosa in the Boniface River region, western Nunavik, Québec. The modelisation followed three steps: (a) the first step includes all sites (n = 59) but only 5 variables, (b) the second step includes the 44 sites for which the time elapsed since last fire was known and (c) the third step includes all sites for which all environmental variables were known (n = 27). Height corresponds to the erect shrub height and is used as a proxy for minimal snow depth; the age correspond to the time elapsed since the last wildfire; the geographic position combine the latitude and longitude of one site. ................................................................................................................................ 66
Table S3.1 Environmental information, Betula glandulosa cover in 1957 and Betula glandulosa cover change (densification) between 1957 and 2008 for the 59 sites (terraces n = 33, hilltops n = 26) surveyed in the Boniface River region, western Nunavik, Québec. The age of one site is the time elapsed since the last wildfire whereas the shrub mean height is used as an estimation of the minimum snow depth. 71
Table 4.1 Description of the nine Betula glandulosa ring width chronologies built for the different study sites at Boniface River station, subarctic Québec, Canada. .................. 94
Table 4.2 Relation between Normalized Difference Vegetation Index (NDVI) and Betula glandulosa radial growth for the 1986-2009 and 1986-2002 periods at Boniface River station, subarctic Québec, Canada. NDVI data were extracted from the Canadian long term satellite data record (LTDR) derived from 1-km resolution Advanced Very High Resolution Radiometer (AVHRR) produced by the Canada Center for Remote Sensing
xii
(Latifovic et al. 2005). We used the NDVI data of the 21-30 July period. All regressions were significant at the 0.05 level. .............................................................. 95
Table S4.1 Pearson correlation coefficients amongst the nine Betula glandulosa ring width chronologies from Boniface River station, subarctic Québec, Canada. ..................... 102
Table S4.2 Pearson correlation coefficients amongst the nine Betula glandulosa axial growth chronologies from Boniface River station, subarctic Québec, Canada. ......... 103
xiii
Liste des figures
Figure 1.1 État des populations arbustives à l’échelle circumpolaire. La figure a été
modifiée et mise à jour à partir d’une recension des études traitant de la dynamique récente de la strate arbustive présentée dans l’article de Myers-Smith et collaborateurs (2011a). ............................................................................................................................ 6
Figure 2.1 Satellite image of the Boniface River region at the forest tundra ecotone in subarctic Québec. The terraces (circles, 33) and hilltops (triangles, 26) used in this study are identified on the map. The study region is located at the forest-tundra ecotone, ca. 10km south of the treeline. ........................................................................ 39
Figure 2.2 Detail of the 2008 ortho-photo showing (a) tree-covered areas, (b) shrub-covered areas, and (c) open areas mostly colonized by lichens, herbaceous species and some shrubs. .................................................................................................................. 40
Figure 2.3 Satellite image of a sandy terrace (Site 1) over which a 16m2-cell grid was overlaid. The two perpendicular lines represent transects along which linear surveys were conducted. Outer black line shows the site’s perimeter. ...................................... 41
Figure 2.4 Shrub cover on terraces and hilltops in 1957, in 2008 and the increase from 1957 to 2008 as evaluated on the two ortho-photos. Mean ± 1 st. dev. ........................ 42
Figure 2.5 Frequency distribution of each delta value (2008 cover - 1957 cover) for terraces and hilltops. Percentage represents the average of the 33 terraces and 26 hilltops, respectively. ..................................................................................................... 43
Figure 3.1 WorldView-1 satellite image of the Boniface River region in the Boniface River region, western Nunavik, Québec. Terraces (circles, n = 33) and hilltops (triangles, n = 26) are identified on the map. White circles (n = 6) and triangles (n = 9) represent sites for which the time elapsed since the last fire is unknown. ............................................ 67
Figure 3.2 Total shrub cover, species richness, Shannon diversity index, and evenness index for terraces (n = 33) and hilltops (n = 26) in the Boniface River region, western Nunavik, Québec. Significant (* P < 0.01) differences are indicated above each graph. ....................................................................................................................................... 68
Figure 3.3 (a) Influence of the 1957 shrub cover on the densification of Betula glandulosa for 59 sites (terraces: n = 33, hilltops: n = 26), (b) influence of time elapsed since the last wildfire (i.e. the age of one site) on the densification of Betula glandulosa for 44 sites (terraces: n = 27, hilltops: n = 17) and (c) influence of time elapsed since the last wildfire (i.e. the age of one site) on the 1957 shrub cover for 44 sites (terraces: n = 27, hilltops: n = 17) in the Boniface River region, western Nunavik, Québec. Terraces and hilltops are represented by black and white diamonds, respectively. ............................ 69

xiv
Figure 3.4 Influence of Betula glandulosa densification on other shrub species cover, species richness, Shannon diversity index, and evenness index for the 59 sites (terraces: black diamond, n = 33 and hilltops: black diamond, n = 26) in the Boniface River region, western Nunavik, Québec. Betula glandulosa densification had a significant negative and positive influence on other shrub cover and evenness index, respectively. .................................................................................................................. 70
Figure 4.1 (a) Mean annual temperature (black line) and mean July temperature (dotted line), (b) total annual precipitation, (c) July Standardized Precipitation-Evapotranspiration Index (SPEI) and ........................................................................... 96
Figure 4.2 Response functions analysis showing the relationship between the different Betula glandulosa ring width chronologies and the monthly mean temperature, the monthly total precipitation and the SPEI for the growing season. Temperature and precipitation data were recorded at the Inukjuak Meteorological Station (130 km northwest of the study site, subarctic Québec, Canada). SPEI values were extracted for the Boniface River station (0.5 degrees spatial resolution grid) from the Global SPEI database (http://sac.csic.es/spei/database.html). The three chronologies of a same type of environment are presented in a unique graph. A p preceding a month stands for previous year. All significant coefficients (0.05) are indicated by an asterisk. ............ 98
Figure 4.3 (a) Mean axial growth rates and (b) cumulative axial growth for each of the 9 sites studied at Boniface River region, subarctic Québec, Canada. Axial growth rates were inferred from the stem analysis for each branch. The annual mean axial growth rate was calculated when at least five individual branches were included. .................. 99
Figure 4.4 Response functions analysis showing the relationship between Betula glandulosa mean axial growth rate for each site and the monthly mean temperatures, the monthly total precipitations and the SPEI for the growing season. Temperature and precipitation data were recorded at the Inukjuak Meteorological Station (130 km northwest of the study site, subarctic Québec, Canada). SPEI values were extracted for the Boniface River station (0.5 degrees spatial resolution grid) from the Global SPEI database (http://sac.csic.es/spei/database.html). The three chronologies of a same type of environment are presented in a single graph. A p preceding a month stands for previous year. All significant coefficients (0.01) are indicated by an asterisk. .......... 100
Figure 4.5 (a) Normalized difference vegetation index (NDVI) trend and July mean temperature (dotted line), (b) Betula glandulosa ring width chronologies (left: terrace, right: snowbed) and (c) regressions between NDVI and ring width chronologies for both the 1986-2002 and 1986-2009 periods. Dark dots represent the values for the 1986-2002 period, whereas the white ones represent the values for the remaining years (2003-2009). ................................................................................................................ 101
xv
Figure S4.1 Age-growth relationships for each individual ring width chronologies per sites for (a) terraces, (b) hilltops and (c) snowbeds studied in the Boniface River region, northern Québec, Canada. Inset figures represent the age distribution of individual root collars included in the mean chronology. .................................................................... 106
Figure S4.2 Age-growth relationships for each individual stem per sites for (a) terraces, (b) hilltops and (c) snowbeds studied in the Boniface River region, northern Québec, Canada. Inset figures represent the age distribution of individual stem used to calculate the mean axial growth rate. ......................................................................................... 109

xvi

xvii
À Jeanne et Léo

xviii

xix
Remerciements
Je m’en voudrais de commencer mes remerciements par une autre personne que Stéphane
Boudreau, mon directeur de thèse. Dès le tout début, il a cru en moi, m’a donné de belles
opportunités et a su créer un environnement de travail riche et stimulant. Avec lui, j’ai
découvert les joies de la recherche en milieu nordique, une passion qui s’est développée dès
ma première expérience et qui restera, j’en suis convaincue, pour le restant de mes jours.
Merci, Stéphane, d’avoir su m’épauler, même si je ne me suis pas donné la tâche facile en
ajoutant à mes travaux doctoraux une grande implication dans les différentes associations
universitaires et scientifiques ainsi que deux grossesses.
Merci aussi à Esther Lévesque, ma co-directrice, qui m’a épaulé tout au long du projet et
qui m’a éclairé de ces nombreux conseils. Merci, Esther, d’être la personne enthousiaste et
passionnée que tu es. C’est toujours un plaisir de discuter avec toi, que ce soit de science ou
de tout autre sujet.
Je remercie Jean-Pierre Tremblay qui a siégé à mon comité d’encadrement aux côtés de
Stéphane et Esther. Merci pour tes commentaires avisés, surtout en ce qui a trait aux
analyses statistiques. Je tiens également à remercier les membres de mon jury : Martin
Simard, Line Lapointe et Isla Myers-Smith. Ce fût un réel plaisir de lire vos commentaires
et suggestions. Ceux-ci m’auront permis, j’en suis convaincue, d’améliorer la qualité de ce
travail.
Merci également à Serge Payette qui a gravité autour de mon projet depuis le début. Merci
de m’avoir donné l’occasion de connaître la magnifique région de la rivière Boniface et de
m’avoir transmis ta passion pour celle-ci. Tu resteras toujours pour moi une source
d’inspiration et de profond respect.
En huit ans passés dans le LaBoudreau, j’ai eu la chance de côtoyer plusieurs personnes
exceptionnelles et je veux ici les remercier d’avoir partagé avec moi les hauts comme les
bas de la vie d’étudiants gradués. Merci à (attention ici, la liste est longue !) Ian Boucher,

xx
Marie-Pascale Villeneuve-Simard, Catherine Dumais, Mélyssa Vachon, Ludivine Mas,
Geneviève Dufour-Tremblay, Vanessa Duclos, Marie-Pier Denis, Caroline Mercier, Sandra
Angers-Blondin, Mélissa Paradis, Clara Morrissette-Boileau, Valérie Massé, Annie Girard,
Pauline Portal, Anne Cotton-Gagnon et Marianne Gagnon. Merci pour les belles
discussions, pour les nombreux fous rires sur les heures de dîner et pour votre soutien de
tous les jours. Ces nombreuses heures passées avec vous se sont souvent transformées en
amitiés durables.
Je souhaite aussi remercier chaleureusement les merveilleuses personnes avec qui j’ai passé
mes étés sur le terrain à Boniface : Marie-Pascale Villeneuve-Simard, Ludivine Mas,
Francis St-Amour, Mélanie Jean, Alexandre Truchon-Savard, Chalotte Lin, Jérémie
Tremblay-Cormier, Marie-Pier Denis, Sandra Angers-Blondin et Caroline Mercier. Ces
semaines dans le Nord n’auraient pas été les mêmes sans votre enthousiasme et vos folies.
Lorsque je pense à Boniface, j’ai de magnifiques souvenirs qui me viennent en tête : les
Noëls du campeur, les « party pas de parents » et les nombreuses heures passées à laver les
toilettes sont parmi ceux qui resteront à jamais gravés dans ma mémoire. Non seulement j’y
ai récolté des échantillons qui me permettent maintenant de rédiger les dernières lignes de
ma thèse, mais j’y ai aussi développé de belles et grandes amitiés qui me suivront pour le
restant de mes jours.
Merci également à tous les professionnels de recherche m’ayant aidée au cours de ces
années d’études : Ann Delwaide pour ses précieux conseils sur les analyses
dendrochronologiques, Pierre Racine pour son aide sur ArcGIS, Mael LeCorre pour le
traitement des données NDVI, Carl Barette et Jonathan Roger pour les données climatiques
et j’en passe. Le travail en vase clos n’existe pas et c’est lorsque l’on travaille sur un projet
de l’envergure d’un doctorat que l’on apprécie tous les bienfaits de s’entourer de bons
collaborateurs.
Merci à tout le personnel du Département de biologie : Martine Boucher, Josée Verret,
Jocelyne Roy, Louise Lapointe. Vous avez réellement été d’une aide indispensable au cours
de toutes ces années et je vous en serai éternellement reconnaissante.

xxi
Un projet de recherche, qui se déroule au beau milieu de la toundra arbustive de surcroît,
nécessite toujours des appuis financiers. Je veux donc remercier les nombreux organismes
subventionnaires qui m’ont permis de mener à terme mes études doctorales : le Conseil de
recherches en sciences naturelles et en génie (CRSNG), le Fonds de recherche du Québec –
Nature et technologies, le programme de formation interdisciplinaire EnviroNord, la Chaire
de recherche en écologie des perturbations ainsi que le Programme de formation
scientifique dans le Nord. Du fond du cœur, je remercie également le Centre d’études
nordiques et tout son personnel pour son soutien logistique.
Finalement, je remercie ma famille et mes amis qui m’ont offert un soutien de tous les
jours. Les mots me manquent pour exprimer ma gratitude infinie envers trois personnes en
particulier, trois personnes extraordinaires qui m’épaulent au quotidien. Christian, merci
pour les nombreux programmes MathLab que tu m’as écrits, mais surtout pour les fous
rires que nous avons ensemble, pour être un père aussi attentif et pour me soutenir dans les
bons comme dans les mauvais moments. Léo, depuis que j’ai aperçu le bout de ton nez, j’ai
su que tu illuminerais chacune des journées que je passerai à tes côtés. Du haut de tes trois
ans, tu ne te rends pas compte de tout le bonheur que tu me donnes. Jeanne, tu seras arrivée
presque en même temps que l’aboutissement de cette thèse. Je suis fière du travail accompli
pour cette dernière, mais jamais autant que de toi. Ton charmant sourire et ta curiosité sans
bornes me remplissent de bonheur. Du plus profond de mon cœur, je vous aime. Merci de
faire partie de ma vie.


xxiii
Avant-propos
Cette thèse est organisée en cinq chapitres, dont le premier et le dernier représentent
l’introduction et la conclusion générale, respectivement. Les trois autres chapitres sont
présentés sous forme d’articles scientifiques, dont un est publié et les deux autres sont en
cours d’évaluation.
Le chapitre 2 est publié sous la référence : Ropars P, Boudreau S (2012) Shrub expansion at
the forest-tundra ecotone: spatial heterogeneity linked to local topography. Environmental
Research Letters 7 : 015501. Cet article a été publié dans le cadre d’un numéro spécial
intitulé : Recent dynamics of arctic and subarctic vegetation.
Le chapitre 3 a été soumis à la revue Écoscience sous la référence : Ropars P, Lévesque E,
Boudreau S (2014) Shrub densification in western Nunavik: the relative influence of
historical and topographic variables. L’article a été accepté pour publication avec
corrections.
Le chapitre 4 est publié sous la référence : Ropars P, Lévesque E, Boudreau S (2015) How
do climate and topography influence the greening of the forest tundra ecotone in northern
Québec? A dendrochronological analysis of Betula glandulosa. Journal of Ecology 103 :
679-690.
En tant qu’auteure principale des trois articles, j’ai élaboré les objectifs de recherche,
planifié et organisé la récolte des données, effectué les analyses statistiques et rédigés les
manuscrits. Stéphane Boudreau, mon directeur de thèse, a contribué activement à toutes les
étapes de la réalisation de ces trois articles. Esther Lévesque a contribué à l’écriture des
articles relatant les principaux résultats des chapitres 3 et 4.


1
CHAPITRE 1 Introduction générale

2
1.1 Les changements environnementaux récents
Le réchauffement planétaire ne fait maintenant plus l’objet de controverses au sein de la
communauté scientifique. Les nombreux indicateurs utilisés afin d’inférer les variations du
climat arrivent tous à la même conclusion : les températures annuelles moyennes au cours
du dernier siècle ont non seulement connu une hausse marquée, mais cette dernière s’est
faite à un rythme accéléré (IPCC 2013). En effet, les trois dernières décennies ont
successivement enregistré les températures les plus chaudes depuis 1850. Outre
l’augmentation de la température atmosphérique, l’augmentation de la température des
masses d’eau océaniques, l’augmentation du niveau des océans, le raccourcissement de la
période de gel des lacs et des rivières, la diminution de la quantité de glace et de neige ainsi
que le changement dans la phénologie de nombreuses espèces témoignent d’une planète en
pleine mutation (Parmesan 2006, IPCC 2013). Ces nombreux constats appuient tous la
thèse qu’un réchauffement climatique est en cours et qu’il aura sans contredit de
nombreuses conséquences sur l’ensemble du monde vivant.
Bien que certains sceptiques tentent toujours de le nier, tout indique que la majeure partie
du réchauffement observé est attribuable aux émissions anthropiques de gaz à effet de serre
(GES ; IPCC 2013). La concentration atmosphérique de ces derniers n’a cessé de croître
depuis l’avènement de l’aire industrielle, permettant à certains gaz comme le CO2 et le CH4
d’atteindre des sommets inégalés au cours des derniers 650 000 ans (IPCC 2013). De 1750
à 2011, les concentrations de CO2 et de NO2 ont augmenté de 40 % et 20 %,
respectivement, tandis que celle de CH4 a enregistré une augmentation de plus de 150 %.
Par conséquent, l’effet combiné de ces GES a augmenté le budget énergétique planétaire de
2,29 W/m2 au cours de cette période, tandis que l’effet de l’activité solaire n’aurait
augmenté que de 0,05 W/m2 (IPCC 2013). De ce fait, la majeure partie du réchauffement
climatique actuel serait expliquée par l’augmentation de la concentration des GES d’origine
anthropique, plutôt que par des variations naturelles de l’activité solaire.
Les observations effectuées sur le terrain ainsi que la grande majorité des modèles
développés afin de prédire les variations futures du climat suggèrent fortement que les
régions arctiques et subarctiques sont et seront les plus affectées par le réchauffement

3
climatique (Serreze et al 2000, IPCC 2013). En effet, il est prédit que ce dernier se fera
ressentir plus hâtivement, se fera à un rythme plus élevé et aura des effets plus importants
dans les hautes latitudes de l’hémisphère nord (IPCC 2013).
1.2 La limite latitudinale des arbres
Au cœur de ces régions nordiques, l’écotone forêt boréale toundra (EFT) revêt un intérêt
particulier. Cette vaste zone de transition entre la forêt boréale continue et la toundra
arbustive (Payette et al 2001) pourrait en effet être le théâtre de profondes modifications.
Certains changements, comme la dégradation du pergélisol et la formation de mares de
thermokarst qui lui est associée (Allard et Séguin 1987) ainsi que l’augmentation de
l’activité des micro-organismes du sol et, par conséquent, l’accélération de la
minéralisation des nutriments (Grogan et Chapin 2000) sont d’ailleurs déjà observées. Une
autre conséquence potentielle d’une élévation des températures est le déplacement vers le
nord de l’aire de répartition des espèces végétales. En effet, le lien étroit entre le climat et la
répartition des différents types de végétation est connu depuis fort longtemps. Les bases
scientifiques de cette association ont été établies par Alexander von Humboldt au début du
19e siècle lorsque ce dernier a montré la concordance entre certaines isothermes et les
limites des grandes zones de végétation. Or, avec le réchauffement climatique observé et
appréhendé, ces isothermes devraient se déplacer vers les pôles, tout comme les grandes
zones de végétation. Par exemple, la limite des arbres en Amérique du Nord et en Eurasie,
qui correspond selon Larsen (1980) à la position de l’isotherme de 13 °C en juillet, devrait
se déplacer vers le nord avec un adoucissement des températures. Ces prédictions sont en
accord avec de nombreuses études paléoécologiques ayant montré des déplacements de la
limite des arbres associés à des variations du climat (MacDonald et al 1993, Tinner et
Lotter 2001, Shuman et al 2004). De plus, des travaux récents relatent que de nombreuses
espèces arborescentes sont limitées physiologiquement par la température à leur limite
septentrionale de répartition (Sveinbjörnsson 2000, Sveinbjörnsson et al 2002), suggérant
ainsi qu’un adoucissement du climat pourrait leur permettre d’étendre leur limite de
répartition vers le nord.
4
Malgré ces évidences, la réponse de la limite latitudinale des arbres aux changements
climatiques actuels ne semble pas être uniforme à l’échelle circumpolaire. En effet, une
synthèse d’une quarantaine d’études traitant de la dynamique récente de nombreuses limites
latitudinales des arbres montre que seulement la moitié de celles-ci se sont déplacées vers
les pôles en réponse au réchauffement climatique récent (21 sur 40), alors qu’aucun
changement n’a été détecté pour les autres (Harsch et al 2009). Ce résultat laisse supposer
que la dynamique des espèces arborescentes présentes à l’EFT ne serait pas contrôlée
uniquement par la température, mais plutôt par un ensemble de variables climatiques et
écologiques. Notons, par exemple, l’influence de la microtopographie sur les
caractéristiques édaphiques locales (quantité de matière organique, humidité ; MacDonald
et Yin 1999) ainsi que celle du pergélisol sur l’épaisseur de la couche active du sol (Camill
et Clark 1998, Frost et al 2012). Ces deux facteurs ont le potentiel de freiner l’avancée de
la limite des arbres en limitant l’établissement ou la croissance de certaines espèces
arborescentes (Frost et Epstein 2014). Quoi que la remise en circulation des nutriments
qu’entraine la dégradation du pergélisol soit généralement favorable à la croissance et à
l’établissement des espèces ligneuses (Lantz et al 2009), une étude récente présente un fort
déclin du couvert forestier suite aux changements hydriques au centre de l’Alaska, États-
Unis (Jorgenson et al 2001). De plus, la présence d’un décalage entre le début du
réchauffement et la réponse des espèces végétales est souvent énoncée pour expliquer
l’apparente immobilité de la limite des arbres (Chapin et Starfield 1997, Lloyd et al 2002),
notamment celui nécessaire à la production de graines viables (Lescop-Sinclair et Payette
1995, MacDonald et al 1998). L’inertie de certaines limites septentrionales des arbres
pourrait donc être que transitoire.
Outre les exemples présentés ci-dessus, les interactions entre les espèces arborescentes et
celles de sous-étage, dont les arbustes, pourraient elles aussi influencer la réponse des
espèces arborescentes au réchauffement climatique actuel (Lloyd et Fastie 2003). En effet,
de plus en plus de recherches suggèrent que certains arbustes ont une influence sur le
recrutement et la croissance des espèces arborescentes des forêts boréales (Empetrum
hermaphroditum : Nilsson et al 2000, DeLuca et al 2002, Wardle et al 2003 ; Kalmia
angustifolia : Krause 1986, Mallik 1994, 1995) ainsi qu’à la limite septentrionale des arbres
5
(Senfeldr et al 2014). Parmi les hypothèses avancées, les arbustes pourraient limiter la
croissance de certaines espèces arborescentes par la libération de composés allélopathiques
(Nilsson et Wardle 2005) ou en modifiant les conditions de croissance (humidité, durée du
couvert de neige, accès à la lumière ; Soukupova et al 2001, Dullinger et al 2005, Senfeldr
et al 2014). D’un autre côté, le couvert arbustif pourrait aussi protéger les jeunes plantules
arborescentes des dommages causés par le vent et le froid (Senfeldr et al 2014) et diminuer
la pression exercée par les herbivores (Dullinger et al 2005). Qu’elle soit positive ou
négative, l’influence des arbustes sur la strate supérieure pourrait s’accentuer au cours des
prochaines années puisque certaines espèces de la strate arbustive sont considérées comme
étant plus promptes à réagir à l’augmentation des températures (Epstein et al 2004a, Tape
et al 2006, Frost et Epstein 2014).
1.3 La strate arbustive
La strate arbustive, dont le rôle fonctionnel dans la dynamique des écosystèmes
subarctiques a longtemps été ignoré, suscite maintenant un intérêt grandissant au sein de la
communauté scientifique. De nombreuses études, utilisant diverses méthodologies et
indicateurs, se sont intéressées depuis le début des années 2000 à la dynamique récente de
la strate arbustive. L’augmentation souvent importante de la biomasse, du couvert et de
l’abondance de différentes espèces arbustives a piqué la curiosité de plusieurs et moussé
l’intérêt pour découvrir les causes de ce phénomène et en mesurer les conséquences. Je
détaillerai donc dans cette section les changements observés dans la dynamique de la strate
arbustive à l’échelle circumpolaire, exposerai les différentes méthodes pour les quantifier et
présenterai les causes potentielles ainsi que les conséquences sur leur environnement
biotique et abiotique.
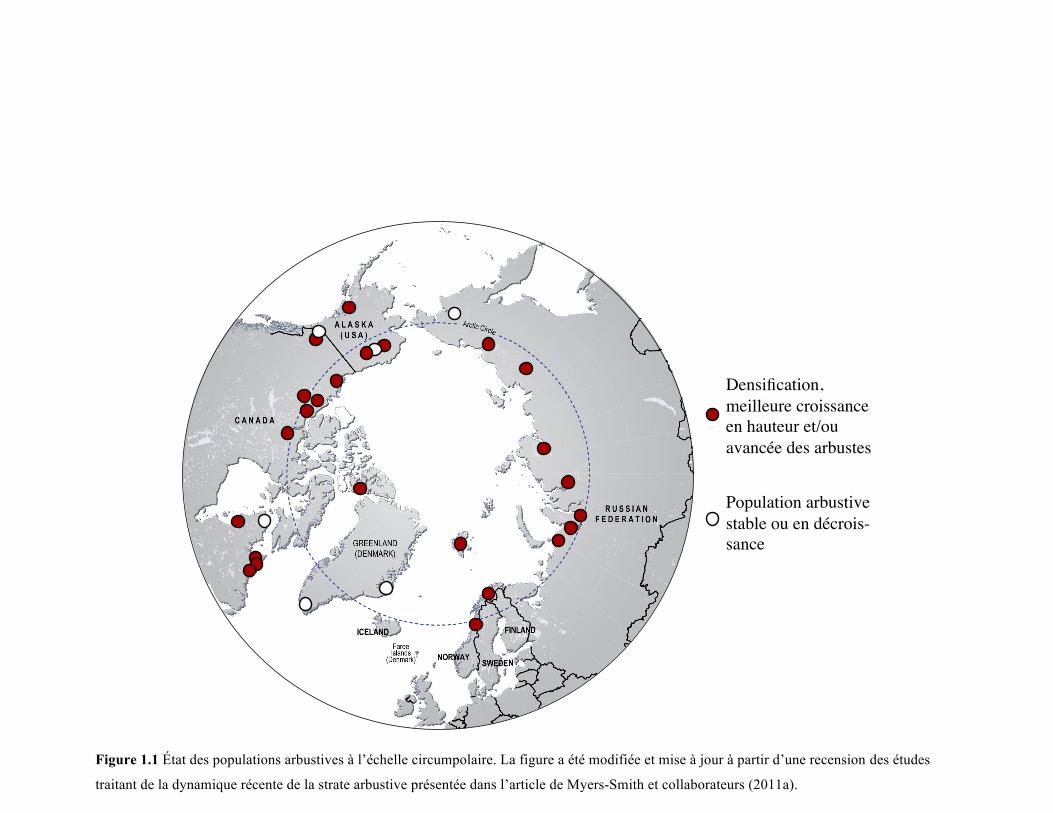
Figure 1.1 État des populations arbustives à l’échelle circumpolaire. La figure a été modifiée et mise à jour à partir d’une recension des études
traitant de la dynamique récente de la strate arbustive présentée dans l’article de Myers-Smith et collaborateurs (2011a).
7
1.3.1 Changements récents
Dans bon nombre de régions arctiques et subarctiques, la strate arbustive a connu une
expansion importante au cours des dernières décennies (Figure 1.1). Cette expansion se
manifeste généralement de trois façons différentes : (1) une densification des arbustes déjà
en place grâce à une croissance latérale accrue, (2) une augmentation de la croissance
verticale des arbustes ou (3) une avancée latitudinale ou altitudinale de la limite des
arbustes, impliquant de ce fait la colonisation de nouveaux milieux (Myers-Smith et al
2011a).
Parmi les régions où la dynamique de la strate arbustive a été étudiée, notons par exemple
le nord de l’Alaska où l’aulne semble être le principal responsable de la densification
récente (Sturm et al 2001a, Tape et al 2006), l’Arctique canadien où le saule, l’aulne et
certaines espèces sempervirentes se sont récemment densifiés (Hudson et Henry 2011,
Lantz et al 2009, 2010, Hill et Henry 2011, Mackay et Burn 2011) et le nord du Québec où
le bouleau a été identifié comme principale espèce responsable de l’augmentation du
couvert arbustif (Tremblay et al 2012). La situation est similaire en Europe et en Russie, où
la grande majorité des études ont montré que la strate arbustive était en expansion (Forbes
et al 2010, Hallinger et al 2010, Senfeldr et al 2014). La plupart de ces études ont recensé
une densification des arbustes déjà en place grâce à une croissance latérale accrue, mais
certaines ont observé une avancée de la limite latitudinale ou altitudinale des arbustes
(Alaska : Dial et al 2007, Yukon : Myers-Smith 2011, Suède subarctique : Hallinger et al
2010, Alpes : Dullinger et al 2003, Anthelme et al 2007, Cannone et al 2007) et une
augmentation de la croissance en hauteur de plusieurs espèces arbustives (Myers-Smith et
al 2011b, Elmendorf et al 2012a). Notons également que plusieurs habitants de ces régions
nordiques ont observé une augmentation du couvert arbustif sur leur territoire dans les
dernières décennies (Thorpe et al 2002, Forbes et al 2009, Spiech 2014).
Bien que la plupart des régions étudiées aient enregistré une densification récente de leur
strate arbustive, certaines n’ont recensé aucun changement dans cette dernière (Figure 1.1).
Dans deux régions du Groenland par exemple, le couvert arbustif n’a subi aucun
changement significatif dans les dernières décennies (Daniëls et al 2010, Boulanger-

8
Lapointe et al 2014), tout comme dans un site de l’est de la Russie (Frost et Epstein 2013).
De plus, Tape et collaborateurs (2012) ont montré que dans une même région, certains
milieux peuvent supporter une densification importante de la strate arbustive en place
tandis que d’autres milieux adjacents peuvent n’enregistrer aucun changement de couvert
pour cette même strate. Bien que l’étendue de la densification de la strate arbustive suggère
un contrôle global, les exemples énoncés ci-dessus soulignent l’importance de certaines
caractéristiques locales pour expliquer, du moins en partie, le phénomène.
Afin de quantifier la densification de la strate arbustive, deux types d’analyses descriptives
ont été utilisés : l’analyse comparative de photographies aériennes ou obliques ainsi que
l’analyse d’indices d’activité photosynthétique évalués à partir d’images satellitaires.
L’analyse comparative de photographies aériennes permet d’apprécier l’évolution récente
du couvert végétal en effectuant un examen visuel direct. Pour ce faire, différents
ensembles de photographies d’une région sont comparés. Les photographies anciennes
proviennent notamment des vastes campagnes de reconnaissance du territoire nordique
québécois (Tremblay et al 2012) ainsi que des campagnes d’exploration pétrolifère
américaine (Sturm et al 2001a, Tape et al 2006) effectuées au milieu du 20e siècle. Ces
campagnes ont permis de photographier le territoire avec une qualité et une résolution
exceptionnelles permettant ainsi leur comparaison avec des photographies ou des images
satellitaires récentes. Jumelé à un traitement approprié des photographies
(orthorectification), ce type d’analyse permet de quantifier les changements observés dans
la strate arbustive avec une grande précision. De ce fait, cette technique permet non
seulement de quantifier l’augmentation du couvert arbustif, mais également de distinguer la
réponse de la strate arbustive dans différents types de milieux à travers le paysage. Bien
qu’elle ait donné des résultats fiables, cette technique comporte son lot de désavantages qui
peuvent, pour certains, être contournés. Parmi ces désavantages, notons par exemple le fait
que son utilisation est limitée aux régions pour lesquelles des photographies anciennes sont
disponibles et de bonne qualité, que cette technique nécessite un traitement relativement
long, restreignant ainsi l’étendue des régions étudiées et qu’elle doit être accompagnée
d’une validation exhaustive sur le terrain afin de s’assurer de la validité des résultats
obtenus et d’identifier les espèces responsables du changement observé. De plus, cette

9
technique ne permet pas d’identifier la ou les causes des changements enregistrés. Une
bonne connaissance des régions à l’étude est donc nécessaire (historique des perturbations,
caractéristiques édaphiques, climat, etc.) afin d’avancer des hypothèses écologiquement
valables.
L’analyse d’images satellitaires via différents indices tels que le Normalized Difference
Vegetation Index (NDVI) permet elle aussi d’apprécier les changements du couvert végétal.
Le NDVI est un rapport des réflectances dans le rouge (R) et dans le proche infrarouge
(IR ; NDVI = (IR – R) / (IR + R)) qui permet de distinguer entre la présence d’une
végétation saine et d’une végétation moribonde. En effet, la chlorophylle contenue dans les
feuilles des plantes saines absorbe le rouge, tandis qu’elle réfléchie l’infrarouge qui
augmenterait inutilement la température interne de la plante. Pour une même période, la
comparaison de ces indices d’une année à l’autre permet de suivre l’évolution de l’activité
photosynthétique, liée au développement et à l’augmentation de l’abondance des espèces
végétales dans une région donnée. À l’échelle circumpolaire, l’interprétation de tels indices
a permis de constater une augmentation de la biomasse photosynthétique dans les dernières
décennies qui serait principalement attribuable à l’expansion de la strate arbustive (Myneni
et al 1997, Silapaswan et al 2001, Stow et al 2004, Goetz et al 2005, Raynolds et al 2006).
Toutefois, ces conclusions sont bien souvent peu supportées par des données terrain. Bien
que cette méthode permette d’analyser de vastes territoires, il est donc essentiel de garder à
l’esprit qu’elle est une mesure indirecte de la performance des communautés végétales et
qu’elle a peu de valeur sans une validation rigoureuse sur le terrain. De plus, tout comme
pour l’analyse de photographies aériennes, cette méthode ne permet pas de déterminer les
causes des changements enregistrés.
1.3.2 Cause principale de la densification de la strate arbustive : l’augmentation récente des
températures
La densification de la strate arbustive a été recensée dans différentes régions arctiques et
subarctiques au cours des dernières décennies. Bien que non uniforme, l’étendue de ce
phénomène suggère qu’il est contrôlé par un facteur agissant à l’échelle planétaire, du

10
moins en partie. De ce fait, l’augmentation récente des températures est le facteur le plus
fréquemment proposé pour expliquer ce phénomène. Comme les études descriptives
utilisées pour quantifier la densification de la strate arbustive ne peuvent nous éclairer sur
les causes de ce phénomène, il devient nécessaire de s’appuyer sur d’autres évidences.
Parmi ces dernières, les études paléoécologiques suggèrent que les arbustes ont le potentiel
de répondre positivement à des conditions climatiques plus clémentes. En effet, des espèces
arbustives appartenant aux genres Salix, Betula et Alnus étaient présentes en plus grande
abondance en Arctique après le dernier maximum glaciaire, période où les conditions
climatiques sont connues pour avoir été plus chaudes et plus humides qu’actuellement
(Anderson et Brubaker 1994, Kullman 1995, Naito et Cairns 2011). Afin de confirmer ou
d’infirmer le lien entre le climat et la densification des arbustes, deux autres types d’études
ont été entreprises : des études expérimentales utilisant des serres expérimentales (« open-
top chambers ») d’une part et des études dendrochronologiques d’autre part. Je présenterai
donc dans cette section ces deux types d’analyses ainsi que les principales conclusions
qu’elles nous permettent de tirer sur les liens unissant la densification de la strate arbustive
et le climat.
L’utilisation de serres expérimentales permet de simuler l’augmentation des températures et
d’évaluer la réponse d’une espèce d’intérêt. En suivant la réponse de cette dernière au fil
des saisons de croissance subséquentes, il est possible d’inférer les changements dans la
performance de l’espèce sous de nouvelles conditions climatiques. Parmi les différents
indicateurs de performance mesurés, notons par exemple le pourcentage de
recouvrement (Wahren et al 2005), la croissance en hauteur (Chapin et al 1995, Elmendorf
et al 2012a) et l’effort reproducteur (Arft et al 1999). Bien que cette méthode soit souvent
utilisée sur de courtes périodes et donc qu’elle ne permette pas de tirer des conclusions à
long terme (Elmendorf et al 2012b), les résultats obtenus semblent montrer l’effet positif
d’un adoucissement du climat sur la performance globale de différentes espèces arbustives.
Cette réponse est toutefois maximale dans le Bas-Arctique, comparativement au Haut-
Arctique où les espèces semblent investir davantage dans la reproduction (Dormann et
Woodin 2002, Walker et al 2006). Une des hypothèses avancées pour expliquer cette
réponse différentielle entre les deux régions est liée à la compétition pour la lumière et les

11
nutriments. Comme ces derniers sont en quantité nettement supérieure dans le Bas-
Arctique, une meilleure croissance confèrerait un avantage compétitif dans ce milieu (Arft
et al 1999). La diminution du nombre d’individus et donc de la compétition apparente dans
le Haut-Arctique favoriserait quant à elle un plus grand investissement dans la reproduction
sexuée. Cependant, certains indices nous laissent croire que la compétition pourrait
également être importante dans ces régions (N. Boulanger-Lapointe, communication
personnelle). Parmi les arbustes du Bas-Arctique, les espèces décidues sont celles pour
lesquelles la réponse au réchauffement est la plus marquée. L’augmentation de leur
pourcentage de recouvrement (Chapin et al 1995, Bret-Harte et al 2002, Wahren et al 2005)
ainsi qu’une meilleure croissance en hauteur (Chapin et Shaver 1985, Jónsdóttir et al 2005,
Elmendorf et al 2012a) ont toutes deux été observées lors de telles études. Cette tendance
est d’autant plus prononcée lorsque l’utilisation des serres expérimentales est couplée à
l’ajout de nutriments (Chapin et Shaver 1996, Bret-Harte et al 2001). De plus, la
germination des graines de certaines espèces arbustives (Empetrum nigrum ssp.
hermaphroditum et Vaccinium uliginosum) et, par conséquent, l’établissement de nouveaux
individus semblent être favorisés par une augmentation des températures (Graae et al
2008).
En plus de confirmer le lien entre le climat et la croissance, les études
dendrochronologiques nous permettent d’identifier les différents paramètres climatiques
associés à une meilleure croissance. Cependant, bien que leur propension à former des
cernes annuels de croissance soit connue depuis le début du 20e siècle, les espèces
arbustives sont demeurées largement ignorées en dendrochronologie. Leur faible intérêt
économique, leur courte longévité (Schweingruber 2007) ainsi que les nombreuses
embuches encourues lors de leur traitement ne sont que quelques raisons pouvant expliquer
leur absence prolongée des analyses dendrochronologiques. Par exemple, le collet des
arbustes (c’est-à-dire la partie la plus vieille) est difficile à identifier sur le terrain et il est
souvent nécessaire de traiter les échantillons afin de distinguer leurs cernes annuels de
croissance (Au et Tardif 2007, Bär et al 2008). Ces derniers sont souvent étroits,
incomplets ou complètement absents (Callaghan 1973, Liang et Eckstein 2009, Hallinger et
al 2010). L’utilisation des arbustes en dendrochronologie est d’autant plus problématique

12
dans les régions arctiques et subarctiques, où les courtes saisons de croissance ne
permettent parfois pas au collet des vieux individus d’enregistrer une croissance radiale. En
effet, la croissance des arbustes est initiée dans les parties apicales des individus grâce à la
libération d’une hormone nommée auxine (Forest et al 2006). Cette hormone migre par la
suite le long des branches pour finalement se rendre au collet. Comme les branches
deviennent de plus en plus longues au fil des années, la croissance prend de plus en plus de
temps à être initiée dans les parties les plus vieilles de l’arbuste. Dans les années où les
conditions sont difficiles, le collet peut donc ne pas former de cellules et, par conséquent,
ne pas enregistrer de croissance radiale (Hallinger et al 2010). Néanmoins, le besoin criant
d’approfondir nos connaissances sur les variations récentes du climat des régions arctiques
et subarctiques où peu d’espèces arborescentes sont en mesure de croître a fortement
encouragé la communauté scientifique à développer des outils et techniques afin d’utiliser
les arbustes comme modèles d’études dendrochronologiques. Une revue de littérature
récente révèle que 76% des chronologies recensées sont sensibles à certaines variables
climatiques (Myers-Smith et al 2015). En effet, plusieurs espèces arbustives répondent
positivement aux températures estivales (Bär et al 2008, Liang et Eckstein 2009, Forbes et
al 2010, Hallinger et al 2010, Hantemirov et al 2011, Boudreau et Villeneuve-Simard 2012,
Jorgensen et al 2015), corroborant de ce fait les résultats obtenus grâce aux études
expérimentales détaillées plus haut. Dans les milieux arctiques et subarctiques où la saison
de croissance est courte, une amélioration des conditions climatiques estivales pourrait en
effet favoriser les réactions enzymatiques de la photosynthèse et permettre une meilleure
croissance. Cependant, les variations de croissance radiale des espèces arbustives ne sont
pas toutes expliquées par les températures de la saison de croissance en cours. Certaines
semblent en effet contrôlées par les températures printanières (Xiao et al 2007, Au et Tardif
2007) ou par les précipitations hivernales (Liang et Eckstein 2009; Hallinger et al 2010;
Schmidt et al 2010) ou estivales (Blok et al 2011). De plus, la relation croissance-climat
semble varier en fonction de la position géographique, de la hauteur des espèces arbustives
considérées et de la disponibilité en eau du sol (Myers-Smith et al 2015). Les espèces
arbustives érigées croissant à la limite entre le Haut-Arctique et le Bas-Arctique et dans un
milieu où la disponibilité en eau n’est pas limitante semblent être les plus sensibles au
climat (Myers-Smith et al 2015).
13
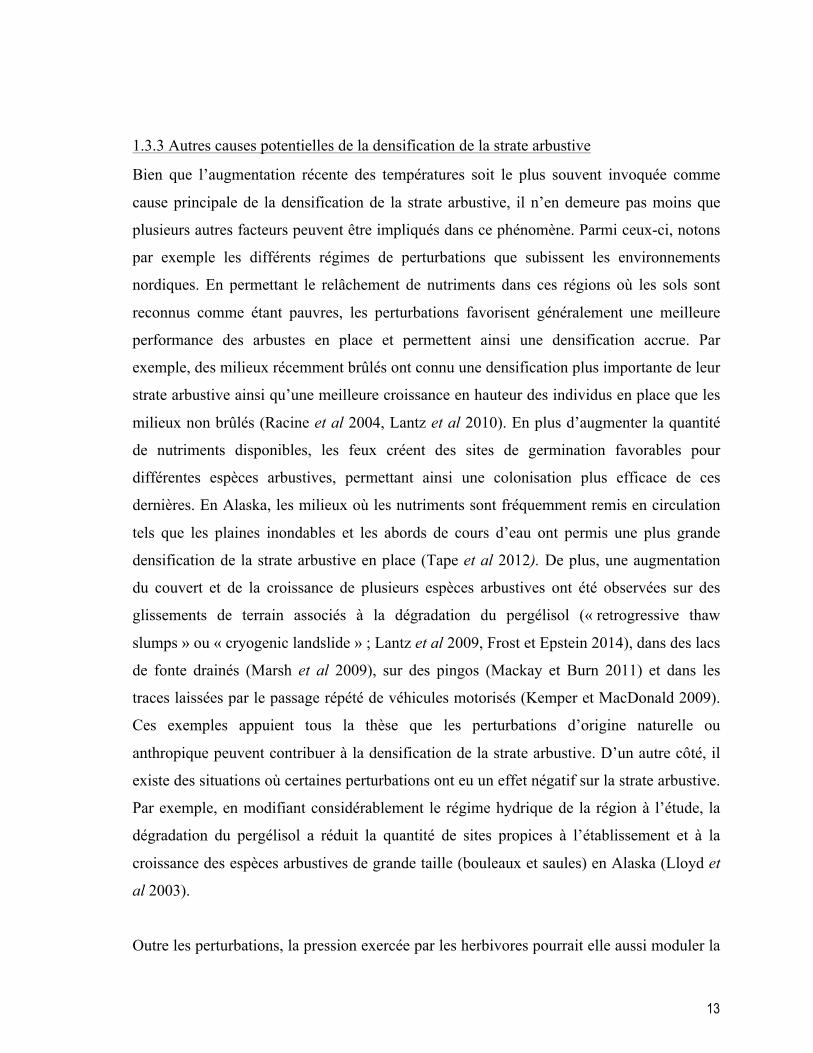
1.3.3 Autres causes potentielles de la densification de la strate arbustive
Bien que l’augmentation récente des températures soit le plus souvent invoquée comme
cause principale de la densification de la strate arbustive, il n’en demeure pas moins que
plusieurs autres facteurs peuvent être impliqués dans ce phénomène. Parmi ceux-ci, notons
par exemple les différents régimes de perturbations que subissent les environnements
nordiques. En permettant le relâchement de nutriments dans ces régions où les sols sont
reconnus comme étant pauvres, les perturbations favorisent généralement une meilleure
performance des arbustes en place et permettent ainsi une densification accrue. Par
exemple, des milieux récemment brûlés ont connu une densification plus importante de leur
strate arbustive ainsi qu’une meilleure croissance en hauteur des individus en place que les
milieux non brûlés (Racine et al 2004, Lantz et al 2010). En plus d’augmenter la quantité
de nutriments disponibles, les feux créent des sites de germination favorables pour
différentes espèces arbustives, permettant ainsi une colonisation plus efficace de ces
dernières. En Alaska, les milieux où les nutriments sont fréquemment remis en circulation
tels que les plaines inondables et les abords de cours d’eau ont permis une plus grande
densification de la strate arbustive en place (Tape et al 2012). De plus, une augmentation
du couvert et de la croissance de plusieurs espèces arbustives ont été observées sur des
glissements de terrain associés à la dégradation du pergélisol (« retrogressive thaw
slumps » ou « cryogenic landslide » ; Lantz et al 2009, Frost et Epstein 2014), dans des lacs
de fonte drainés (Marsh et al 2009), sur des pingos (Mackay et Burn 2011) et dans les
traces laissées par le passage répété de véhicules motorisés (Kemper et MacDonald 2009).
Ces exemples appuient tous la thèse que les perturbations d’origine naturelle ou
anthropique peuvent contribuer à la densification de la strate arbustive. D’un autre côté, il
existe des situations où certaines perturbations ont eu un effet négatif sur la strate arbustive.
Par exemple, en modifiant considérablement le régime hydrique de la région à l’étude, la
dégradation du pergélisol a réduit la quantité de sites propices à l’établissement et à la
croissance des espèces arbustives de grande taille (bouleaux et saules) en Alaska (Lloyd et
al 2003).
Outre les perturbations, la pression exercée par les herbivores pourrait elle aussi moduler la

14
réponse des espèces arbustives. L’effet des herbivores dépendra cependant de la taille et de
la densité des troupeaux et de l’intensité du broutement (Speed et al 2010). Par exemple, il
est raisonnable de croire que le caribou migrateur (Rangifer tarandus L) a le potentiel de
moduler l’effet du climat sur la croissance des espèces arbustives parce qu’il fait
généralement partie de grands troupeaux (ex. 430 000 individus dans le troupeau de la
Rivière-aux-Feuilles en 2011 : décompte aérien du Gouvernement du Québec, données non
publiées) et qu’il peut ingérer une grande quantité de tissus végétaux. En effet, des études
expérimentales ont montré que l’effet positif du réchauffement des températures semble
être largement contrebalancé par le broutement chez différentes espèces arbustives dont
Betula nana (Post et Pederson 2008, Olofsson et al 2009), Salix glauca (Post et Pederson
2008) et Vaccinium myrtillus (Rinnan et al 2009). Cette pression exercée peut de ce fait
favoriser la productivité des taxons non consommés, telles les poacées, et limiter la
croissance des espèces préférées par les herbivores (Manseau et al 1996, Brathen et
Oksanen 2001, Eskelinen et Oksanen 2006). En contrepartie, le passage répété des caribous
peut mettre à nu le sol minéral (Boudreau et Payette 2004, Vistness et Nellemann 2008),
créant de ce fait des lits de germination favorables pour différentes espèces arbustives
(Forbes et al 2001).
À l’échelle locale, les différences observées dans l’étendue de la densification arbustive
sont probablement associées à la topographie du terrain. En ayant une influence sur
l’exposition au vent, le couvert de neige (son épaisseur et sa persistance dans la saison de
croissance : Sonesson et Callaghan 1991, Shaver et al 1996), la disponibilité en nutriments
(Shaver et al 1996) ainsi que l’humidité (Schimel et al 1999) et la température du sol
(Romanovsky et Osterkamp, 1995), la topographie du paysage peut avoir un impact
important sur la croissance et le recrutement des espèces végétales. En effet, Tremblay et
collaborateurs (2012) ont mesuré une augmentation différentielle du couvert arbustif en
fonction de l’altitude et de la pente (degrés et orientation).
1.3.4 Effets de la densification de la strate arbustive sur les communautés végétales
Malgré le récent engouement pour les effets du réchauffement climatique sur les

15
écosystèmes nordiques, il demeure toutefois de nombreuses lacunes dans notre capacité à
prévoir les changements auxquels devra faire face l’EFT. Or, la compréhension de la
dynamique de cette région est primordiale afin de prédire l’évolution du paysage
subarctique. Parmi les différents impacts que la densification de la strate arbustive pourrait
avoir sur son environnement, notons par exemple son influence sur la neige et le pergélisol.
En effet, la hauteur et la densité de la strate arbustive peuvent sensiblement modifier
l’accumulation, la durée ainsi que les propriétés physiques de la neige (Liston et al 2002,
Pomeroy et al 2006, Marsh et al 2010). De ce fait, la neige s’accumule préférentiellement à
proximité des peuplements arbustifs, permettant ainsi de limiter la pénétration du froid dans
le sol (Sturm et al 2001b) et d’augmenter l’activité microbienne et la décomposition de la
litière (Sturm et al 2001b). À l’été cependant, l’ombre générée par un couvert arbustif
important diminuerait les températures du sol (Marsh et al 2010) et la profondeur de la
couche active (Blok et al 2010). Même si les processus hivernaux semblent plus
importants, il est nécessaire de considérer les effets de la strate arbustive en été et en hiver
afin de déterminer un bilan net sur le pergélisol. De plus, une densification des peuplements
arbustifs dans les régions arctiques et subarctiques pourrait augmenter la quantité de litière
(Cornelissen et al 2007) et le taux de minéralisation de l’azote (Buckeridge et al 2010).
Finalement, quoi que l’ombre produite par la strate arbustive puisse diminuer la pénétration
de la lumière jusqu’au sol et donc limiter l’évaporation (Walker et al 2003), la présence de
cette strate est généralement associée avec une augmentation de l’évapotranspiration,
asséchant de ce fait le sol (Myers-Smith et al 2011a, Cranston et Hermanutz 2013).
En modifiant leur environnement immédiat, les arbustes ont le potentiel d’influencer les
autres espèces végétales présentes dans les régions nordiques. Plusieurs études
expérimentales ont montré qu’une augmentation du couvert arbustif réduisait l’abondance
de plusieurs taxons végétaux (Pajunen et al 2012) ainsi que la richesse spécifique des sites
étudiés (Klein et al 2004). En effet, la plupart des espèces vasculaires et cryptogames sont
désavantagées lorsque la densité de la strate arbustive augmente (Cornelissen et al 2001,
Walker et al 2006, Pajunen et al 2011, 2012), tandis que les poacées sont plus abondantes
dans cette même situation (Walker et al 2006, Pajunen et al 2012). De plus, une forte
densité d’arbustes est généralement associée à un faible établissement des plantules
16
d’espèces arborescentes (Anschlag et al 2008, Pérez-Devesa et al 2008). Au Québec
subarctique, il a été montré que l’établissement des plantules d’épinette noire, principale
espèce présente à l’EFT, est largement favorisé par la mise à nu du sol minéral (Greene et
al 2004 ; Dufour-Tremblay et Boudreau 2011). Le rôle potentiel des espèces arbustives
dans la régénération des espèces arborescentes de l’EFT pourrait ainsi limiter la
transgression vers le nord de la limite des arbres, du moins à court terme.
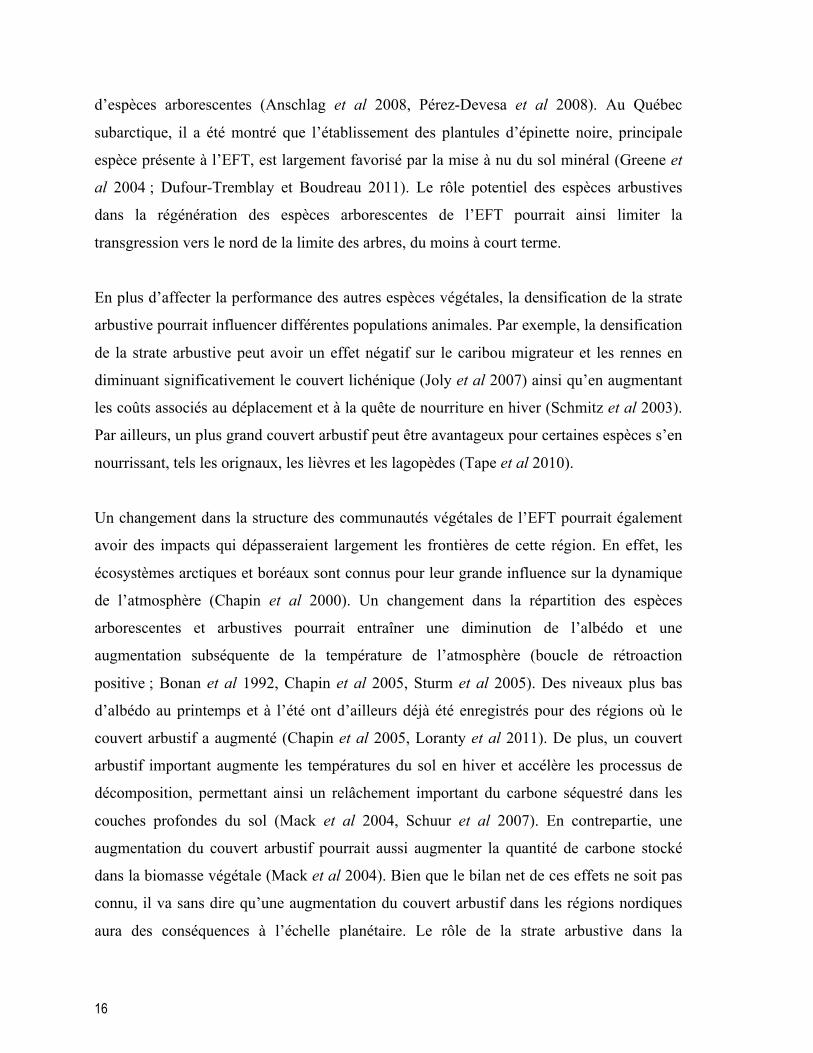
En plus d’affecter la performance des autres espèces végétales, la densification de la strate
arbustive pourrait influencer différentes populations animales. Par exemple, la densification
de la strate arbustive peut avoir un effet négatif sur le caribou migrateur et les rennes en
diminuant significativement le couvert lichénique (Joly et al 2007) ainsi qu’en augmentant
les coûts associés au déplacement et à la quête de nourriture en hiver (Schmitz et al 2003).
Par ailleurs, un plus grand couvert arbustif peut être avantageux pour certaines espèces s’en
nourrissant, tels les orignaux, les lièvres et les lagopèdes (Tape et al 2010).
Un changement dans la structure des communautés végétales de l’EFT pourrait également
avoir des impacts qui dépasseraient largement les frontières de cette région. En effet, les
écosystèmes arctiques et boréaux sont connus pour leur grande influence sur la dynamique
de l’atmosphère (Chapin et al 2000). Un changement dans la répartition des espèces
arborescentes et arbustives pourrait entraîner une diminution de l’albédo et une
augmentation subséquente de la température de l’atmosphère (boucle de rétroaction
positive ; Bonan et al 1992, Chapin et al 2005, Sturm et al 2005). Des niveaux plus bas
d’albédo au printemps et à l’été ont d’ailleurs déjà été enregistrés pour des régions où le
couvert arbustif a augmenté (Chapin et al 2005, Loranty et al 2011). De plus, un couvert
arbustif important augmente les températures du sol en hiver et accélère les processus de
décomposition, permettant ainsi un relâchement important du carbone séquestré dans les
couches profondes du sol (Mack et al 2004, Schuur et al 2007). En contrepartie, une
augmentation du couvert arbustif pourrait aussi augmenter la quantité de carbone stocké
dans la biomasse végétale (Mack et al 2004). Bien que le bilan net de ces effets ne soit pas
connu, il va sans dire qu’une augmentation du couvert arbustif dans les régions nordiques
aura des conséquences à l’échelle planétaire. Le rôle de la strate arbustive dans la
17
dynamique de cette région a été très peu étudié jusqu’à maintenant, et ce malgré le fait
qu’elle occupe une part prépondérante de l’EFT. Son abondance ainsi que sa capacité à
répondre rapidement aux changements environnementaux ont pourtant le potentiel de faire
de cette strate un acteur de premier plan.
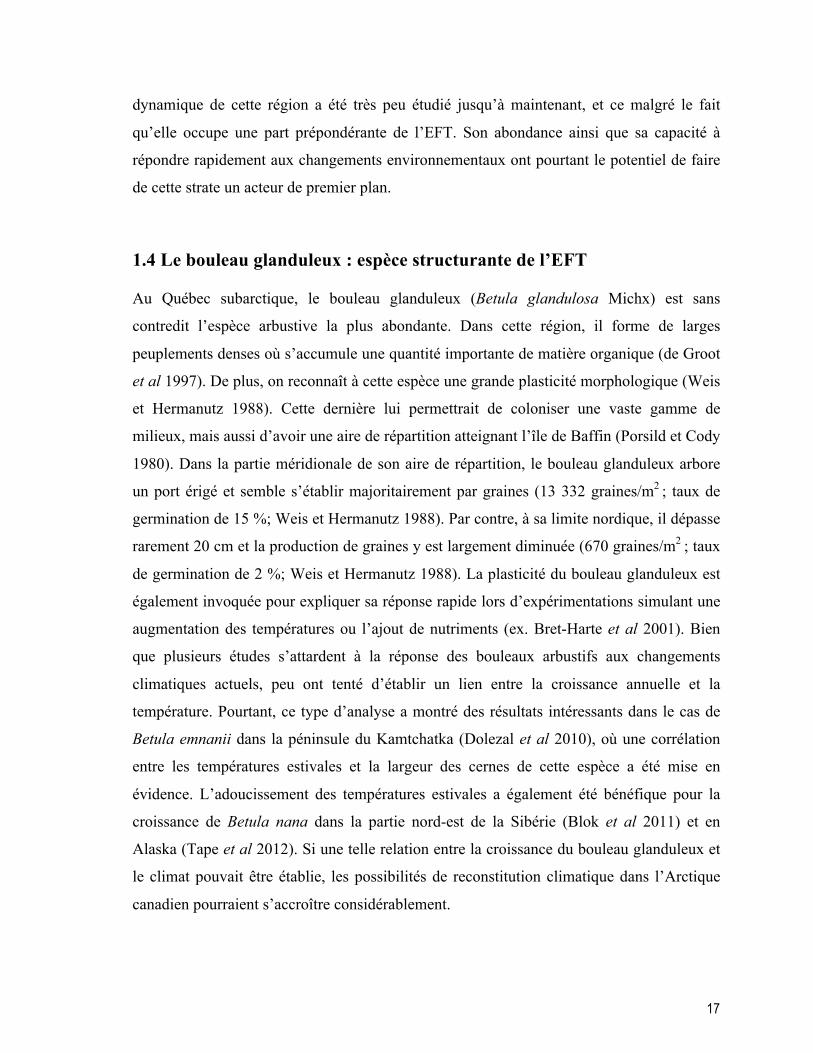
1.4 Le bouleau glanduleux : espèce structurante de l’EFT
Au Québec subarctique, le bouleau glanduleux (Betula glandulosa Michx) est sans
contredit l’espèce arbustive la plus abondante. Dans cette région, il forme de larges
peuplements denses où s’accumule une quantité importante de matière organique (de Groot
et al 1997). De plus, on reconnaît à cette espèce une grande plasticité morphologique (Weis
et Hermanutz 1988). Cette dernière lui permettrait de coloniser une vaste gamme de
milieux, mais aussi d’avoir une aire de répartition atteignant l’île de Baffin (Porsild et Cody
1980). Dans la partie méridionale de son aire de répartition, le bouleau glanduleux arbore
un port érigé et semble s’établir majoritairement par graines (13 332 graines/m2 ; taux de
germination de 15 %; Weis et Hermanutz 1988). Par contre, à sa limite nordique, il dépasse
rarement 20 cm et la production de graines y est largement diminuée (670 graines/m2 ; taux
de germination de 2 %; Weis et Hermanutz 1988). La plasticité du bouleau glanduleux est
également invoquée pour expliquer sa réponse rapide lors d’expérimentations simulant une
augmentation des températures ou l’ajout de nutriments (ex. Bret-Harte et al 2001). Bien
que plusieurs études s’attardent à la réponse des bouleaux arbustifs aux changements
climatiques actuels, peu ont tenté d’établir un lien entre la croissance annuelle et la
température. Pourtant, ce type d’analyse a montré des résultats intéressants dans le cas de
Betula emnanii dans la péninsule du Kamtchatka (Dolezal et al 2010), où une corrélation
entre les températures estivales et la largeur des cernes de cette espèce a été mise en
évidence. L’adoucissement des températures estivales a également été bénéfique pour la
croissance de Betula nana dans la partie nord-est de la Sibérie (Blok et al 2011) et en
Alaska (Tape et al 2012). Si une telle relation entre la croissance du bouleau glanduleux et
le climat pouvait être établie, les possibilités de reconstitution climatique dans l’Arctique
canadien pourraient s’accroître considérablement.

18
1.5 Objectifs de la thèse
Les études descriptives (analyses de photographies aériennes et interprétation du NDVI),
expérimentales (augmentation simulée des températures de l’air) et dendrochronologiques
suggèrent que les environnements arctiques et subarctiques sont en pleine mutation. Au
cœur de ces environnements, les espèces de la strate arbustive semblent avoir la capacité de
répondre rapidement à un réchauffement des températures. L’objectif principal de cette
thèse est donc d’étudier la dynamique récente de la strate arbustive dans un contexte de
réchauffement climatique, en mettant l’accent sur l’étude du bouleau glanduleux. Le corps
de cette thèse se divise en trois chapitres (chapitres 2 à 4), chacun ayant des objectifs
spécifiques qui nous permettront de dresser un portrait global de la dynamique de la strate
arbustive à l’écotone forêt boréale-toundra au Nunavik.
Le chapitre 2 a pour objectif spécifique de quantifier la densification de la strate arbustive
depuis les 50 dernières années dans la région d’étude à l’aide de la comparaison de
photographies aériennes datant de 1957 à une image satellitaire de 2008. Afin de distinguer
d’éventuelles différences dans l’étendue de cette densification, celle-ci a été évaluée dans
deux types d’environnement largement répandus dans l’aire d’étude : les terrasses
sablonneuses et les sommets rocheux de faible altitude. De plus, une validation exhaustive
sur le terrain nous permettra d’identifier la ou les espèces responsables de la densification
de la strate arbustive.
Le chapitre 3 vise à identifier les variables environnementales responsables de
l’hétérogénéité de la densification de la strate arbustive à l’échelle du paysage. Pour ce
faire, une approche par sélection de modèles avec critère d’information d’Akaike a été
utilisée. De surcroît, ce chapitre veut évaluer l’influence de cette densification sur
l’abondance et la diversité des espèces arbustives non impliquées dans ce phénomène.
L’objectif spécifique du chapitre 4 est d’identifier les facteurs climatiques contrôlant la
croissance radiale et axiale du bouleau glanduleux, principale espèce arbustive présente
dans la région d’étude. À l’aide de techniques dendrochronologiques, la relation entre le
climat et la croissance de cette espèce arbustive a été évaluée dans trois types

19
d’environnement différents (terrasses sablonneuses, sommets rocheux et combes à neige).
Pour terminer, ce chapitre vise également à évaluer si l’augmentation de l’activité
photosynthétique inférée par le NDVI (« Normalized Differential Vegetation Index ») dans
la région d’étude est expliquée par l’augmentation de la croissance du bouleau glanduleux.
Le chapitre 5 consiste en une conclusion générale où les résultats probants ainsi que les
perspectives qui en découlent seront exposés.

20

21
CHAPITRE 2 Shrub expansion at the forest-tundra ecotone: spatial heterogeneity linked to local topography
Publié sous : Ropars P & Boudreau S (2012) Environmental Research Letters 7: 015501

22
2.1 Résumé
La densification récente de la strate arbustive a été documentée dans plusieurs régions
arctiques. Cependant, peu d’études se sont intéressées aux variations de ce phénomène à
l’échelle locale. Cette étude a pour objectif de quantifier la densification de la strate
arbustive à l’écotone forêt boréale-toundra (Québec, Canada) dans deux types
d’environnements : les terrasses et les sommets (qui couvrent 70% de la superficie terrestre
de la région) et d’identifier les espèces impliquées dans ce phénomène. La comparaison
d’une mosaïque de photographies aériennes de 1957 (137 km2) et d’une image satellitaire
de 2008 (151 km2) nous a permis de constater une densification de la strate d’intérêt pour
les deux types d’environnement. La densification est cependant plus importante sur les
terrasses que sur les sommets (21.6% vs 11.6%). Une validation terrain exhaustive révèle
que Betula glandulosa Michx. est la principale espèce responsable de la densification
arbustive dans la région. De plus, les nombreuses plantules observées sur les sites d’études
suggèrent que le phénomène pourrait se poursuivre dans les prochaines années.

23
2.2 Abstract
Recent densification of shrub cover is now documented in many arctic regions. However,
most studies focus on global scale responses, yielding very little information on the local
patterns. This research aims to quantify shrub cover increase at northern treeline (Québec,
Canada) in two important types of environment: sandy terraces and hilltops (which cover
ca. 70% of the landscape) and to identify the species involved. The comparison of a mosaic
of two aerial photographs from 1957 (137km2) and one satellite image taken in 2008
(151km2) revealed that both hilltops and terraces recorded an increase in shrub cover.
However, the increase was significantly greater on terraces than on hilltops (21.6% vs
11.6%). According to ground truthing, the shrub cover densification is associated mainly
with an increase of Betula glandulosa Michx. The numerous seedlings observed during the
ground truthing suggest that shrub densification should continue over the next few years.

24
2.3 Introduction
Arctic and subarctic regions have been subjected to important changes over the last few
decades (IPCC 2007a). Among the rapid changes observed, Myneni and collaborators
(1997, 1998) were the first to report evidence of the pan-Arctic increase in vegetation
cover. By analysing worldwide NDVI trends between 1981 and 1991, they showed that the
greatest increase in photosynthetic activity occurred in regions above 50º N. Since then, this
phenomenon has been observed for different regions (Alaska: Silapaswan et al 2001, Jia et
al 2003, Verbyla 2008; Russia: Forbes et al 2010; Western Canada: Olthof and Pouliot
2010), over a longer time span (≥ 20 years: Jia et al 2003, Goetz et al 2005, Verbyla 2008,
Forbes et al 2010, Olthof and Pouliot 2010), and at a better resolution (= 1km2: Jia et al
2003, Olthof and Pouliot 2010). Moreover, recent NDVI studies revealed that the increase
in photosynthetic activity is more important in regions dominated by erect shrub species
(Raynolds et al 2006), a result corroborated by the comparison of aerial photographs and
satellite images which reported an increase in shrub cover in Alaska (Sturm et al 2001a,
Tape et al 2006) and northern Québec (Tremblay et al 2012).
Changes in shrub cover in arctic and subarctic regions are however likely to be spatially
heterogeneous. In these regions, minor differences in the abiotic environment could
translate into important differences in shrub survival, growth and reproduction. Local
topography, one of the most influential features at the landscape level (Shaver et al 1996),
will influence variables such as snow accumulation, duration of the snow cover (Sonesson
and Callaghan 1991, Shaver et al 1996), nutrient availability (Shaver et al 1996), soil
moisture (Schimel et al 1999) and soil temperature (Romanovsky and Osterkamp 1995),
which can all have major impacts on plant growth and recruitment. Increase in shrub cover
could then be a function of the different topographic features of the landscape. Such
observations have been reported in northern Alaska (Tape et al 2006), where shrub cover
increase was more important on hill slopes, in valleys and south-facing slopes. However,
most of the studies used a spatial scale that does not provide insights on the importance of
the local topography for shrub densification. Temporal NDVI analyses use NOAA-
AVHRR (National Oceanic and Atmospheric Administration-Advance Very High
Resolution Radiometer) satellite images with, at best, a 1km2-resolution (Jia et al 2003,

25
Olthof and Pouliot 2010). Furthermore, the NDVI reflects the change in photosynthetic
activity without any distinction of the taxa implied. As the shrub cover increases in many
arctic and subarctic regions (ACIA 2005, IPCC 2007b), it becomes necessary to understand
how and where the changes occur. A better understanding of the importance of the local
topography on the response of shrub communities is therefore important to refine our
ability to predict future response of shrub communities to climate change.
The objective of this study was to quantify the change in shrub cover in subarctic western
Québec over the last 50 years, if any. Specific objectives were (1) to determine if shrub
cover has increased, (2) to identify the species implied in the cover change, and (3) to
determine if the intensity of the change varies with the local topography (hilltops and
terraces). Based on current knowledge, we hypothesized that there has been a non-uniform
increase in shrub cover in the studied area, which is mostly attributable to Betula
glandulosa Michx., the main erect shrub species.
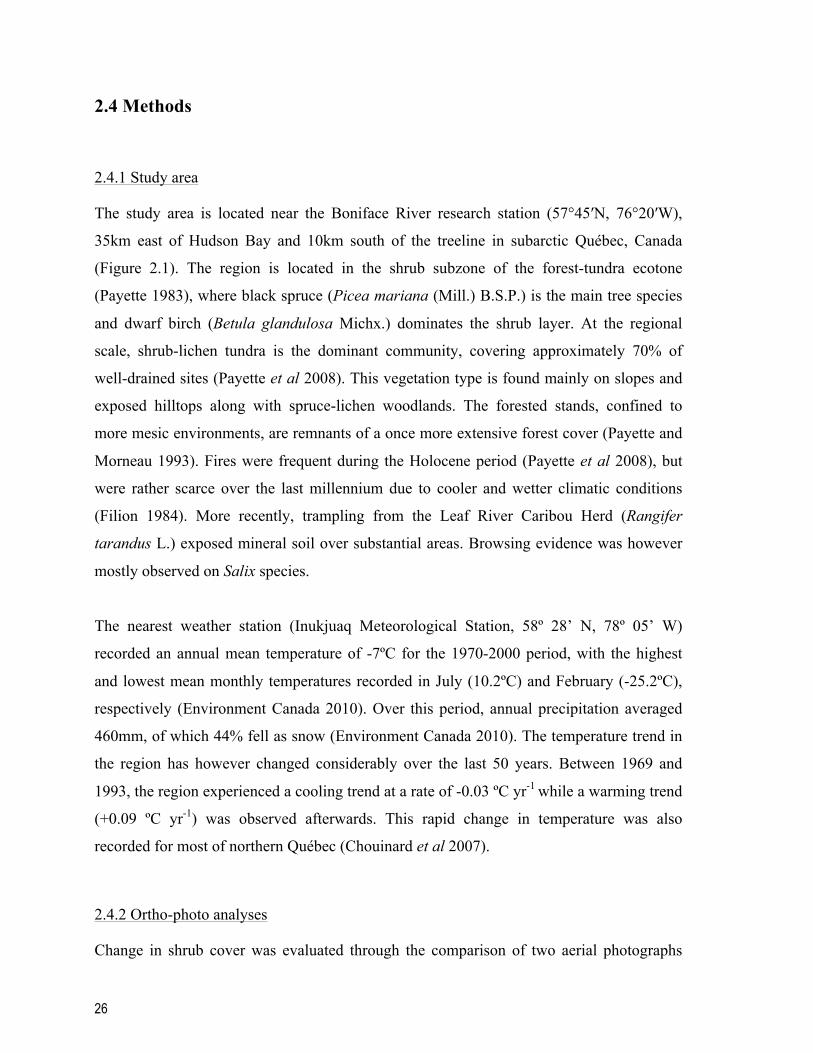
26
2.4 Methods
2.4.1 Study area
The study area is located near the Boniface River research station (57°45′N, 76°20′W),
35km east of Hudson Bay and 10km south of the treeline in subarctic Québec, Canada
(Figure 2.1). The region is located in the shrub subzone of the forest-tundra ecotone
(Payette 1983), where black spruce (Picea mariana (Mill.) B.S.P.) is the main tree species
and dwarf birch (Betula glandulosa Michx.) dominates the shrub layer. At the regional
scale, shrub-lichen tundra is the dominant community, covering approximately 70% of
well-drained sites (Payette et al 2008). This vegetation type is found mainly on slopes and
exposed hilltops along with spruce-lichen woodlands. The forested stands, confined to
more mesic environments, are remnants of a once more extensive forest cover (Payette and
Morneau 1993). Fires were frequent during the Holocene period (Payette et al 2008), but
were rather scarce over the last millennium due to cooler and wetter climatic conditions
(Filion 1984). More recently, trampling from the Leaf River Caribou Herd (Rangifer
tarandus L.) exposed mineral soil over substantial areas. Browsing evidence was however
mostly observed on Salix species.
The nearest weather station (Inukjuaq Meteorological Station, 58º 28’ N, 78º 05’ W)
recorded an annual mean temperature of -7ºC for the 1970-2000 period, with the highest
and lowest mean monthly temperatures recorded in July (10.2ºC) and February (-25.2ºC),
respectively (Environment Canada 2010). Over this period, annual precipitation averaged
460mm, of which 44% fell as snow (Environment Canada 2010). The temperature trend in
the region has however changed considerably over the last 50 years. Between 1969 and
1993, the region experienced a cooling trend at a rate of -0.03 ºC yr-1 while a warming trend
(+0.09 ºC yr-1) was observed afterwards. This rapid change in temperature was also
recorded for most of northern Québec (Chouinard et al 2007).
2.4.2 Ortho-photo analyses
Change in shrub cover was evaluated through the comparison of two aerial photographs

27
and a satellite image taken in July 1957 and 2008, respectively. The 2008 image is a
Worldview-1 Standard Ortho-Ready panchromatic satellite image taken on July 15th, which
covers 151km2. The 1957 photos are two adjacent 9” x 9” aerial photos produced from high
quality negatives stored at the National Air Photo Library of Canada and covering an area
of 137km2 (taken on July 29th, 1:40 000). Aerial photos were scanned at 1200 dpi for
further analysis.
Aerial photographs and the satellite image were orthorectified in order to remove
topographic distortions and to project them in the UTM 18 NAD 83 map projection. The
orthorectification of the 2008 satellite image was carried-out with PCI GEOMATICS
V.10.3 software and resulted in a 0.5m-resolution ortho-photo. The latter was then used as a
template to rigorously match the 1957 aerial photos to the UTM projection. A 15m-
resolution digital elevation model (DEM) of the study region generated by Natural
Resources Canada was used as an elevation output. These manipulations were performed
with the ALTA Photogrammetry Suite 7 software and resulted in a 1m-resolution 1957
ortho-photo. The spatial lag between the two ortho-photos is <1m. From here on, the
satellite image and aerial photos are both referred to as ortho-photos.
In general, erect shrub species were easily detected by their darker shade and the roundish
aspect of each individual (Figure 2.2), while trees were recognized by the triangular shape
of their projected shade. Pale areas were mostly characterized by lichen and graminoid
vegetation. Therefore, shrub cover identification was based on both the pixel colour and the
texture of the ortho-photo. Preliminary observations of both ortho-photos suggested that the
analyses should be restricted to non-forested, well-drained sites, because shrub cover was
difficult to evaluate with accuracy in-between trees and in wetlands, riparian ecosystems
and snowbeds. Of these non-forested well-drained sites, which cover ca. 70% of the
landscape, two broad categories were retained: hilltops and sandy terraces. Hilltops are
characterized by the presence of arctic-alpine species and exposed mineral soil. Sandy
terraces, located on the river’s margin, are low altitude sites dominated by shrub, lichen and
herbaceous species. Prior to the field season, the 113km2 overlapping zones of the two
ortho-photos were scrutinized to identify potential sites belonging to either category. Once

28
in the field, 59 of the 106 pre-identified sites were selected to evaluate shrub cover change
from 1957 to 2008 (26 hilltops and 33 terraces, Appendix A). Sites were excluded when
they: i. did not correspond with the given definition of one of the two environments, and/or
ii. were not easily accessible by foot from the river. On average, exposed hilltops and
terraces covered 1.2 ha and 1.1 ha, respectively. The 59 sites covered a total area of 671.7
ha, i.e. 58.2% of the total well-drained non-forested area of the study area.
In the laboratory, each of the 59 study sites was delimitated in respect to the ground
truthing and drawn using ArcGIS 9.3 (by ESRI; see section 2.3; Figure 2.3). The analyzed
area for each site, ranging from 0.5 ha to 2.1 ha, reflects the natural variability in site sizes.
Then, a grid consisting of a series of 16m2-cells (4m x 4m) was overlaid on both ortho-
photos. Inside the site’s perimeter, shrub cover was estimated within each cell and assigned
to one of the following cover classes: (1) 0%, (2) 1-25%, (3) 26-50%, (4) 51-75%, and (5)
76-100%. For every given site, shrub cover was calculated for both ortho-photos by
averaging the median value of the cover class assigned to each cell. Shrub cover change
over the last 50 years (delta) was then calculated as the difference in shrub cover between
2008 and 1957. The evaluation of shrub cover was carried-out by the same observer for
every site and was recorded in Excel tables with respect to the spatial position of each cell.
Rather than degrading the 2008 ortho-photos to match the resolution of the 1957 ortho-
photo, we decided to conduct the analyses at the finest resolution for each ortho-photo (1m
and 0.5m for 1957 and 2008, respectively) in order to retain as much information as
possible. However, to evaluate if different resolutions could influence shrub cover
evaluation, we conducted a supplemental analyses for ten sites after having degraded the
2008 ortho-photo to a 1.0m resolution (Aggregate tool in ArcGIS, which uses cubic
convolution resampling). Shrub cover evaluations for both the degraded and non-degraded
2008 ortho-photos were compared.
2.4.3 Ground truthing
An extensive ground truthing was carried-out in order to identify which species were

29
implicated in the shrub cover change, if any, and to evaluate our accuracy in evaluating
shrub cover on the 2008 ortho-photo. At each of the 59 sites, four 60m transects were
delimited from the centre of the site and extended respectively towards the four cardinal
points (N, E, S, W; Figure 2.3). The position of each transect was determined with a high-
precision GPS (Leica, Model GS20, ± 30 cm). Tree and shrub species were recorded at
every centimetre along the transects. Each species cover could then be calculated for each
site by dividing the number of centimetres on which it was recorded by the total number of
centimetres surveyed (24 000cm).
To determine our accuracy in evaluating shrub cover on the 2008 ortho-photo, we
conducted an additional photo-interpretation analysis. We overlaid a 1m2-cell grid over the
2008 ortho-photo (5 hilltops and 5 terraces) and we evaluated the shrub cover in every
single cell touching the linear transects surveyed in the field. We used 1m2 cells to optimize
the comparison with the results from the ground truthing exercise, as larger cell size would
include more variability.
2.4.4 Statistical analysis
Differences in shrub cover between terraces and hilltops (in 1957, in 2008 and for the delta
values) and in dwarf birch cover from ground truthing data were tested using one-sample t-
tests. Changes in shrub cover from 1957 to 2008 in both environments and between the
different validation procedures (resolution and field and ortho-photo results) were evaluated
using paired t-tests. The delta frequency distribution of terraces and hilltops were compared
using a Kolmogorov-Smirnov test.

30
2.5 Results
2.5.1 Shrub cover change
In 1957, hilltops had a greater shrub cover than terraces (35.3% vs 28.6%; Table 2.2; t(57)
= -2.39, P < 0.05; Figure 2.4, Table 2.1). From 1957 to 2008, shrub cover increased in most
of the studied sites (31/33 terraces, 23/26 hilltops), with a substantial increase (>15%) in 27
terraces and 10 hilltops. This increase resulted in a significant difference in shrub cover
between 1957 and 2008 in both environments (terraces: 28.6% vs 50.2%; t(32) = -10.27, P
< 0.01; hilltops: 35.3% vs 46.9%; t(25) = -6.67, P < 0.01). Moreover, terraces showed a
greater increase than hilltops (21.6% vs 11.6%; t(57) = -3.52, P < 0.05) and, as a result,
shrub cover in 2008 did not significantly differ between hilltops and terraces (46.9% vs
50.2%; t(57) = 1.68, P = 0.10; Figure 2.4). There was no significant difference between the
delta frequency distribution of terraces and hilltops (Kolmogorov-Smirnov test: P = 0.96).
However, terraces tended to have a higher proportion of cells showing a large increase in
shrub cover (delta = 2, 3, and 4; Figure 2.5).
Differential resolution between the 2008 and 1957 ortho-photos did not have a major
impact on shrub cover evaluation. On hilltops, 68.2% of the cells were assigned to the same
cover class, while 14.3% and 17.1% were assigned respectively to the cover classes directly
above or below. On terraces, 62.5% of the cells were assigned to the same cover class,
while 22.2% and 14.4% were respectively assigned to the cover classes above or below.
For both environments, <1% of the cells were assigned to other cover classes (± 2 classes).
Overall, the observed differences in shrub cover at the site scale ranged from -4.8% to
4.1%, shrub cover being under-evaluated for 6 sites and over-evaluated for 4 sites.
Differences in shrub cover were not statistically significant (t(9) = 0.89, P = 0.39).
2.5.2 Species implicated
Dwarf birch was the major shrub species recorded during ground truthing. On average,
dwarf birch covered 36.7% of the surveyed area. The cover of this species ranged from
13.2% to 58.6% and was significantly higher on terraces than on hilltops (40.1% vs 32.5%;

31
t(57) = 2.48, P < 0.05). Dwarf birch was the only species found at every site. Moreover,
several dwarf birch seedlings not detected on the ortho-photos were found in open areas in
both terraces and hilltops. The other most abundant species on terraces were Rhododendron
tomentosum Harmaja, Empetrum nigrum L., and R. groenlandicum Oeder, with a cover of
7.0%, 6.3% and 4.9%, respectively. On hilltops, R. tomentosum, E. nigrum, and Vaccinium
uliginosum L. were the other most abundant species, with a cover of 10.0%, 8.7% and
2.5%, respectively. Salix planifolia Pursh, S. glauca L., S. uva-ursi Pursh, Alnus viridis ssp.
crispa (Ait.) Turrill, Diapensia lapponica L., Kalmia procumbens L., Arctous sp., and
Rubus chamaemorus L. were also recorded in the vegetation surveys on both terraces and
hilltops, but covered less than 2.1% of the surveyed area.
Shrub cover evaluation inside the 1m2 cell touching the transects used for ground truthing
closely matched the dwarf birch cover evaluated in the field (differences ranging from -
5.5% to 5.5%, t(9) = 0.71, P = 0.49). However, it was lower than the total shrub cover
recorded in the field for 9 of the 10 sites (Table 2.2; t(9) = 5.16, P < 0.01). Such results
strongly suggest that the perceived shrub cover on the ortho-photos corresponds to the
dwarf birch cover and not to the total shrub cover.

32
2.6 Discussion
Our results indicate an increase in shrub cover over the past 50 years at the northern limit of
the forest-tundra ecotone in subarctic Québec. This finding corroborates other studies using
a similar method conducted in different regions of the Arctic (Alaska: Sturm et al 2001a,
Tape et al 2006; northern Québec: Tremblay 2010; Russia: Forbes et al 2010) and studies
which revealed a major increase of the NDVI over the last few decades (Jia et al 2003,
Verbyla 2008).
2.6.1 Betula glandulosa, a key species for shrub expansion
The observed increase in shrub cover is mainly attributable to dwarf birch, a species
previously identified as one of the key species in pan-arctic shrub densification (Tape et al
2006). Dwarf birch was found at all sites and was the dominant shrub species at 56 out of
59 sites.
Dwarf birch’s fast response to environmental change could be linked to its growth
plasticity, clonal growth and reproduction potential. As shown by Bret-Harte et al (2001),
dwarf birch generates numerous leaf-producing long shoots, which allows it to rapidly take
advantage of experimental fertilization and warming treatments. It can also reproduce
asexually via clonal growth, with stems producing adventitious roots when over-grown by
adjacent vegetation (Shaver and Cutler 1979). It also produces an abundant seed rain (>13
000 seeds/m2; Weis and Hermanutz 1988), and seed germination is higher under
experimental warming (Vaartaja 1959). In fact, several seedlings were observed in the
field, which suggest that the densification should continue in the upcoming years.
2.6.2 Potential causes of shrub expansion: climate change, fire or caribou?
The recent increase in temperature is the most likely factor explaining the shrub expansion
in the Boniface River region. To the best of our knowledge, climate warming is the only
large-scale disturbance recorded in the region over the last few decades and, therefore, the
only one able of promoting a regional response of such intensity. The warming trend

33
observed since the 1990s has already triggered an increase in black spruce seed viability in
the region (Dufour-Tremblay and Boudreau 2011) and preliminary dendrochronological
analyses revealed an important increase in radial growth since the mid 1990s. Many studies
have demonstrated a similar growth increase for other shrub species under extensive
warming (Hippophae rhamnoides L.: Xiao et al 2007, Empetrum nigrum ssp.
hermaphroditum Hagerup: Bär et al 2008, Artemisia tridentata Nutt.: Poore et al 2009,
Salix lanata L.: Forbes et al 2010, Juniperus nana Willd.: Hallinger et al 2010).
Besides improving radial and vertical growth, climate warming has many indirect effects
that can be beneficial for shrub species. For example, an increase in temperature is known
to enhance decomposition rate and nutrient cycling (Chapin and Shaver 1996, Hobbie 1996,
Bret-Harte et al 2001, 2002, Wahren et al 2005). Combined with the capacity of birch litter
to promote nitrogen availability (Buckeridge et al 2010), shrub growth can be largely
enhanced (Jonasson et al 1999, Gordon et al 2001, Sturm et al 2005).
Winter events could also play a major role in the observed pan-Arctic shrub densification.
The abrasive effect of windblown ice particles may limit the vertical growth of erect
species (Sonesson and Callaghan 1991). Thicker snow cover under large shrub patches
enhances decomposition during winter because of its insulating effect (Liston et al 2002)
and may also result in greater water availability at the beginning of the growing season. In
fact, differential snow accumulation, one of the most important environmental factors for
plant growth in subarctic regions (Payette et al 1973), could at least partially explain why
shrub cover increased significantly more on terraces than on hilltops. As they are more
exposed to wind, hilltops have thinner snow cover, which could result in greater winter
damage to aboveground biomass because of mechanical breakage of exposed tissues
(Marchand and Chabot 1978) and winter desiccation (Sonesson and Callaghan 1991). On
the other hand, individuals established on terraces are protected by a thicker snow cover
and the reduced importance of wind is believed to allow dwarf birch individuals to grow
rapidly and to expand.
Fire and large herbivores are among other disturbances that could be considered to explain
34
this shrub densification. The Boniface River area has experienced massive deforestation in
the last few millennia because of the combined effects of fire and climate. The climatic
cooling of the last 3000 years prevented black spruce from producing viable seeds that
would have ensured its regeneration after the frequent fires of the Holocene period (Payette
and Gagnon 1985, Gajewski et al 1993, Payette et al 2001). Fires are however unlikely to
have triggered the recent shrub densification, as few fires occurred over the last millennium
in the study region (Payette et al 2008). In fact, some of the study sites did not burn for at
least 1300 years.
On a shorter time scale, the role of large herbivores in shrub expansion might also be given
some consideration. Caribou (Rangifer tarandus L.) activity in the study area was high
from the mid-1990s to the mid-2000s. Although caribou browsing can inhibit shrub
performance, caribou trampling creates suitable seedbeds for dwarf birch by exposing the
mineral soil. In fact, numerous newly established seedlings were observed in old caribou
trails. The absence of suitable seedbeds was hypothesized by Parnikoza and collaborators
(2009) to explain the halted expansion of two shrub species in Antarctica. However,
because dwarf birch expansion was observed on sites with or without caribou activity
evidence, it strongly suggests that caribou activity did not trigger shrub expansion.

35
2.7 Conclusion
This research shows an increase in shrub cover in the last 50 years for the studied region.
Exhaustive ground truthing allowed us to identify dwarf birch as the main species
implicated in this phenomenon. We also demonstrated that the shrubification is non-
uniform across the landscape, with terraces promoting a higher shrub densification during
the last decades. Further studies are now warranted to understand the processes at play in
subarctic shrub densification. Does expansion rely mainly on clonal growth or on sexual
reproduction? What is the spatial pattern of shrub expansion? Our ability to predict changes
at the landscape level depends on our ability to understand the ecological processes
underlying the observed changes.

36
2.8 Acknowledgments
This research project was funded in part by Natural Sciences and Engineering Research
Council of Canada (NSERC), by the Fonds de Recherche sur la Nature et les Technologies
Québec (FQRNT) and by the Northern Research Chair on Disturbance Ecology. The
authors would like to thank Sandra Angers-Blondin and Caroline Mercier for their
assistance in the field and the Centre d’études nordiques for its logistical support.
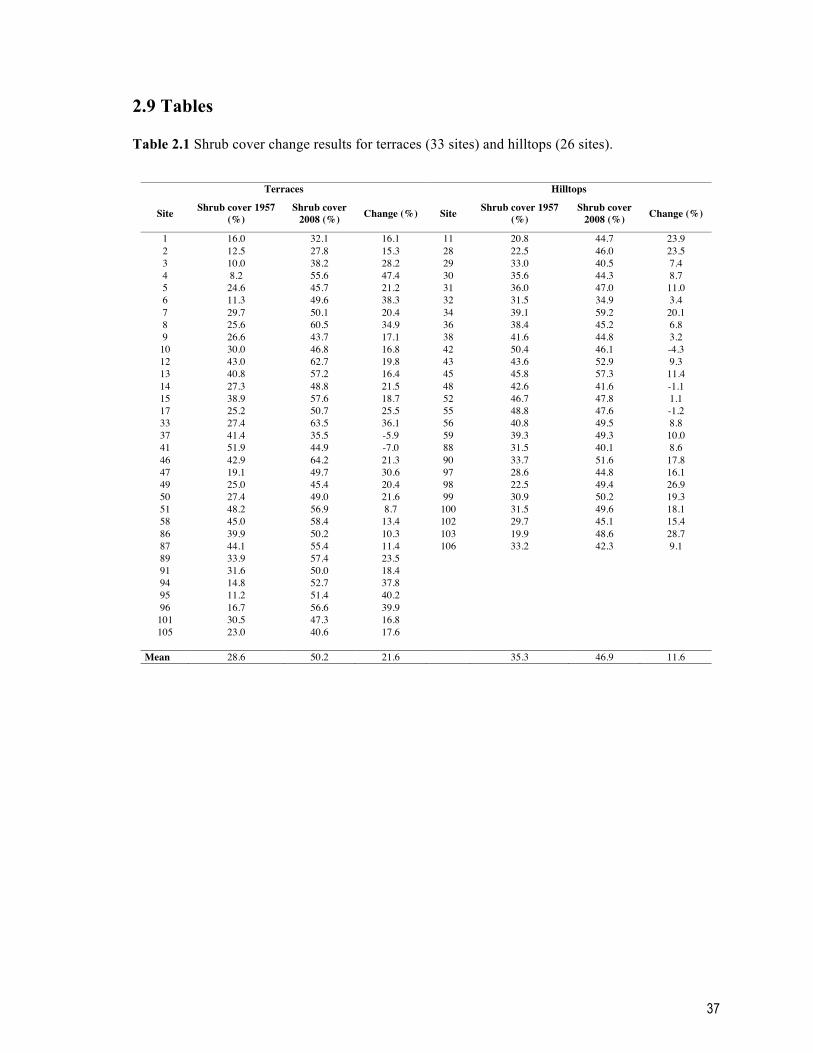
37
2.9 Tables
Table 2.1 Shrub cover change results for terraces (33 sites) and hilltops (26 sites).
Terraces Hilltops
Site Shrub cover 1957 (%)
Shrub cover 2008 (%) Change (%) Site Shrub cover 1957
(%) Shrub cover
2008 (%) Change (%)
1 16.0 32.1 16.1 11 20.8 44.7 23.9 2 12.5 27.8 15.3 28 22.5 46.0 23.5 3 10.0 38.2 28.2 29 33.0 40.5 7.4 4 8.2 55.6 47.4 30 35.6 44.3 8.7 5 24.6 45.7 21.2 31 36.0 47.0 11.0 6 11.3 49.6 38.3 32 31.5 34.9 3.4 7 29.7 50.1 20.4 34 39.1 59.2 20.1 8 25.6 60.5 34.9 36 38.4 45.2 6.8 9 26.6 43.7 17.1 38 41.6 44.8 3.2
10 30.0 46.8 16.8 42 50.4 46.1 -4.3 12 43.0 62.7 19.8 43 43.6 52.9 9.3 13 40.8 57.2 16.4 45 45.8 57.3 11.4 14 27.3 48.8 21.5 48 42.6 41.6 -1.1 15 38.9 57.6 18.7 52 46.7 47.8 1.1 17 25.2 50.7 25.5 55 48.8 47.6 -1.2 33 27.4 63.5 36.1 56 40.8 49.5 8.8 37 41.4 35.5 -5.9 59 39.3 49.3 10.0 41 51.9 44.9 -7.0 88 31.5 40.1 8.6 46 42.9 64.2 21.3 90 33.7 51.6 17.8 47 19.1 49.7 30.6 97 28.6 44.8 16.1 49 25.0 45.4 20.4 98 22.5 49.4 26.9 50 27.4 49.0 21.6 99 30.9 50.2 19.3 51 48.2 56.9 8.7 100 31.5 49.6 18.1 58 45.0 58.4 13.4 102 29.7 45.1 15.4 86 39.9 50.2 10.3 103 19.9 48.6 28.7 87 44.1 55.4 11.4 106 33.2 42.3 9.1 89 33.9 57.4 23.5 91 31.6 50.0 18.4 94 14.8 52.7 37.8 95 11.2 51.4 40.2 96 16.7 56.6 39.9
101 30.5 47.3 16.8 105 23.0 40.6 17.6
Mean 28.6 50.2 21.6 35.3 46.9 11.6

38
Table 2.2 Results of the validation analyses. First, shrub cover was evaluated on the non-degraded
(0.5m resolution) and the degraded (1m resolution) 2008 ortho-photos. Second, shrub cover
evaluated on the 2008 ortho-photo (1m2 cell) was compared to ground thruthing results (total shrub
cover and dwarf birch cover).
Shrub cover estimated
from ortho-photos Observer over- or underestimation
Cover estimated from linear releves (%) Type of
environment Site 1957 (%) 2008 (%) Cover estimated with 2008 ortho-
photo (%) Total shrub cover (%)
Dwarf birch cover (%)
Cover ortho-photo - total cover (%)
Cover ortho-photo - birch cover (%)
10 30.0 46.8 21.2 43.9 22.8 -22.7 -1.6 12 43.0 62.7 48.9 64.4 45.6 -15.5 3.3 14 27.3 48.8 34.7 42.5 33.0 -7.8 1.7 91 31.6 50.0 48.7 85.5 53.6 -36.8 -4.9
Terrace
95 11.2 51.4 30.2 28.3 27.6 1.9 2.6 36 38.4 45.2 44.4 90.4 44.3 -46.0 0.1 43 43.6 52.9 31.6 53.6 33.2 -22.0 -1.6 56 40.8 49.5 47.5 65.7 47.7 -18.2 -0.2 98 22.5 49.4 29.2 53.8 23.7 -24.6 5.5
Hilltop
106 33.2 42.3 28.0 49.8 33.5 -21.8 -5.5 !

39
2.10 Figures
Figure 2.1 Satellite image of the Boniface River region at the forest tundra ecotone in subarctic
Québec. The terraces (circles, 33) and hilltops (triangles, 26) used in this study are identified on the
map. The study region is located at the forest-tundra ecotone, ca. 10km south of the treeline.

40
Figure 2.2 Detail of the 2008 ortho-photo showing (a) tree-covered areas, (b) shrub-covered areas,
and (c) open areas mostly colonized by lichens, herbaceous species and some shrubs.

41
Figure 2.3 Satellite image of a sandy terrace (Site 1) over which a 16m2-cell grid was overlaid. The
two perpendicular lines represent transects along which linear surveys were conducted. Outer black
line shows the site’s perimeter.

42
Figure 2.4 Shrub cover on terraces and hilltops in 1957, in 2008 and the increase from 1957 to
2008 as evaluated on the two ortho-photos. Mean ± 1 st. dev.

43
Figure 2.5 Frequency distribution of each delta value (2008 cover - 1957 cover) for terraces and
hilltops. Percentage represents the average of the 33 terraces and 26 hilltops, respectively.

44

45
CHAPITRE 3 Shrub densification heterogeneity in subarctic regions: the relative influence of historical and topographic variables
Soumis sous :
Ropars P, Lévesque E & Boudreau S (2015) Ecoscience

46
3.1 Résumé
Bien que la densification de la strate arbustive soit un phénomène fréquemment observé
dans les régions nordiques, son ampleur varie à l’échelle du paysage. Au Québec
subarctique (Canada), où le bouleau glanduleux (Betula glandulosa Michx.) est la
principale espèce responsable de ce phénomène, les causes et les conséquences de
l’hétérogénéité de la densification de la strate arbustive sont méconnues. Cette étude a pour
objectifs d’identifier les facteurs environnementaux expliquant la densification
différentielle du bouleau glanduleux et d’évaluer l’influence de cette densification sur
l’abondance et la diversité des autres espèces arbustives présentes. Nous avons utilisé la
sélection de modèle avec critère d’Akaike pour classer différents modèles écologiquement
valables incluant des variables topographiques, historiques et édaphiques. L’influence de la
densification du bouleau glanduleux a été évaluée à l’aide de régressions linéaires. Nous
avons trouvé que le modèle le plus plausible pour expliquer l’hétérogénéité de la
densification du bouleau glanduleux dans l’ouest du Nunavik incluait des variables
historiques (couvert arbustif initial, temps écoulé depuis le dernier feu) et topographique
(type d’environnement). Parmi ces facteurs, seul le couvert initial d’arbustes avait une
influence significative et positive sur la densification du bouleau glanduleux. Une
augmentation du couvert de bouleau glanduleux a eu une influence négative sur le couvert
des autres espèces arbustives. Cependant, aucune relation n’a été trouvé entre la
densification du bouleau glanduleux et la richesse spécifique des autres espèces arbustives,
suggérant que la densification observée n’est pas suffisamment importante pour exclure
d’autres espèces moins compétitives.

47
3.2 Abstract
Expansion of erect shrub species is widely reported in northern regions, though its extent
varies across the landscape. In subarctic Québec (Canada), where dwarf birch (Betula
glandulosa Michx.) is the main species responsible for shrub expansion, little is known
about the causes and consequences of this phenomenon. This study aims to identify the
drivers of dwarf birch densification heterogeneity at the landscape level and to evaluate the
influence of this densification on other shrub species’ abundance and diversity. We used
model selection using Akaike’s information criterion to rank ecologically relevant
predefined models that includes topographic, historical and edaphic variables. The
influence of dwarf birch densification was evaluated through regression analysis. We found
that the best model explaining the heterogeneity in dwarf birch densification in western
Nunavik includes factors related to both historical conditions (initial shrub cover, time
elapsed since last wildfire) and topography (type of environment). Among these factors,
only the initial shrub cover had a significant positive influence on the shrub densification.
Increase in dwarf birch cover was found to negatively influence the cover of other shrub
species. However, no relation was found between dwarf birch densification and other shrub
species richness, suggesting that the densification did not yet lead to the exclusion of less
competitive shrub species.

48
3.3 Introduction
Greening of terrestrial ecosystems in response to climate change has been observed
throughout the northern circumpolar region (Myers-Smith et al 2011a and references cited
therein). Repeated aerial photograph comparisons (Sturm et al 2001a, Tape et al 2006,
Beck and Goetz 2011, Ropars and Boudreau 2012, Tremblay et al 2012) and NDVI
analyses derived from satellite images (Raynolds et al 2006, Forbes et al 2010, McManus
et al 2012, Fraser et al 2014) revealed that this greening trend is mainly associated with the
rapid expansion of erect shrub species. This expansion occurs either via (1) densification of
pre-existing shrub patches, (2) increase in vertical growth or (3) northward/upward advance
of the shrubline (Myers-Smith et al 2011a). These results are in accordance with numerous
experimental studies that identified deciduous shrubs as one of the most responsive plant
functional groups to warmer temperatures (Bret-Harte et al 2001; Jónsdóttir et al 2005;
Wahren et al 2005, Elmendorf et al 2012b).
An increase in the abundance (i.e. densification) of erect shrub species can lead to changes
in the abiotic environment, which in turn alters the dynamics of plant communities. In
winter for instance, erect shrubs favor greater snow accumulation and modify snow
properties, thereby influencing soil thermal regime, growing season length, soil humidity
and microbial activity (Sturm et al 2005), even if the link between the latter and shrub
abundance seems weaker than previously thought (Myers-Smith and Hik 2013).
Experimental studies showed that an increase in shrub cover resulted in a decrease in
understory plant species richness (Klein et al 2004) and cover (Cornelissen et al 2001,
Walker et al 2006, Pajunen et al 2011). On the other hand, forbs and graminoids were
positively correlated with shrub cover in other studies (Walker et al 2006, Pajunen, et al
2012), a phenomenon likely associated with their higher tolerance to light limitation
(Oksanen and Virtanen 1997). While other studies have focused on the impact of shrub
encroachment on understory plant species (Baez and Collins 2008, Pajunen et al 2011;
Pajunen et al 2012), few focus specifically on its influence on other shrub species (but see
Lavallée, 2013).
49
Although observed at several sites throughout the northern regions, shrub densification is
heterogeneous at both regional and local scales. At the regional scale, shrub expansion
heterogeneity is likely associated with species-specific responses to non-uniform warming
trends (Epstein et al 2004b), since species showing greater morphological plasticity appear
to be more responsive to improved environmental conditions (Bret-Harte et al 2001).
Spatial heterogeneity may also be associated with different herbivory pressures since large
herbivores can significantly reduce the abundance or, at least, inhibit the expansion of their
preferred species (Brathen and Oksanen 2001, Post and Pedersen 2008, Plante et al 2014).
At the local scale, the extent of shrub densification is likely associated with small
differences in local topography that result in site-specific abiotic environments. Indeed,
Tremblay et al (2012) showed that shrub densification occurred at varying degrees across
the landscape near Kangiqsualujjuaq (north-eastern Nunavik) in response to differences in
altitude, slope and aspect, while Ropars and Boudreau (2012) reported a greater increase in
shrub cover on low altitude terraces (21.6%) compared to exposed hilltops (11.6%) in the
Boniface River area (western Nunavik). In Northern Alaska, Tape et al (2012) explained
the differences observed in shrub densification with variable nutrient supply, which is
closely related to topography. Local topography modulates wind exposure, snow cover
(depth and duration; Sonesson and Callaghan 1991, Shaver et al 1996), nutrient availability
(Shaver et al 1996), soil moisture (Schimel et al 1999), as well as soil temperature
(Romanovsky and Osterkamp 1995) and, therefore, might have major impacts on plant
growth and recruitment. Recent disturbances, such as wildfire, have also been found to
facilitate shrub densification and vertical growth in Northwestern Alaska (Racine et al
2004) and in the Mackenzie Delta region, Northwest Territories (Lantz et al 2010). In the
shrub and forest tundra, wildfires expose new seedbeds, releasing nutrients trapped in the
living vegetation and creating opportunities for seedling establishment in communities
where recruitment is otherwise limited (Zasada et al 1983, Hobbie and Chapin 1998,
Gough 2006). Like wildfires, caribou trampling may also expose mineral soil (Boudreau
and Payette 2004, Vistness and Nellemann 2008) and therefore create suitable seedbeds for
shrub individuals.

50
In order to better predict the impacts of climate change on subarctic plant communities, it
becomes necessary to understand the causes and consequences of erect shrub species
densification. Therefore, this study aims to identify the abiotic variables driving the local
scale heterogeneity in the densification of Betula glandulosa Michx. (hereafter referred to
as dwarf birch), the main species responsible for shrub densification in Nunavik (Ropars &
Boudreau 2012). In addition, we aim to evaluate the influence of dwarf birch densification
on abundance and diversity of other shrub species. Based on current knowledge, we
hypothesize that (1) topographical variables will explain the heterogeneity in dwarf birch
densification and that (2) dwarf birch densification will negatively influence the abundance
and diversity of other shrub species.
51
3.4 Methods
3.4.1 Study area
The study area is located in subarctic Québec (Canada), 35 km east of Hudson Bay and 10
km south of the Arctic treeline (Figure 1, 57° 45′ N, 76° 20′ W). The area belongs to the
shrub subzone of the forest-tundra ecotone (FTE; Payette 1983). Dominant at the regional
scale, the shrub-lichen tundra community covers ca 70% of the well-drained sites (Payette
et al 2008) and is mainly found on sandy terraces and low altitude hilltops. Dwarf birch, the
most abundant shrub species, is mainly responsible for the recent shrub expansion in the
region (Ropars and Boudreau 2012) as well as in eastern subarctic Québec (Tremblay et al
2012). The remaining well-drained sites are colonized by lichen-spruce woodland and
krummholz (Picea mariana (Mill.) B.S.P), whereas spruce-moss stands are confined to
protected and well-watered areas (Payette and Morneau 1993). More widely distributed at
the beginning of the Holocene, these stands have been gradually decimated by the
combined effect of wildfires and harsher climatic conditions over the last 3000 y. Wildfires
were frequent in the region between 2040 and 890 cal. BP (Arseneault and Payette 1997a,
Arseneault and Sirois 2004), but the cooler and wetter conditions of the last 1000 y as well
as the reduced forested cover resulted in a lower wildfire frequency over the last
millennium (Filion 1984). Migratory caribou (Rangifer tarandus L.) were frequently
encountered until ca 2005 and their repeated trampling exposed patches of mineral soils
(Dufour-Tremblay and Boudreau 2011). While dwarf birch is part of the caribou diet (Crête
et al 1990, Manseau et al 1996), browsing evidences are mostly restricted to Salix species
in the studied region.
The nearest weather station (Inukjuaq Meteorological Station, 58º 28’ N 78º 05’ W; 130 km
northwest of the study site) recorded an annual mean temperature of -7ºC for the 1971-2000
period, with the highest and lowest mean monthly temperatures recorded in July (9.4ºC)
and February (-25.8ºC), respectively (Environment Canada 2013). Annual precipitation
averages 460 mm, of which 42% falls as snow (Environment Canada 2013). Known for its
relatively stable temperature during most of the 20th century, the region has experienced
extensive warming since the early 1990’s (Chouinard et al 2007).
52
3.4.2 Site selection
For this study, we focused on 2 types of well-drained non-forested sites, exposed hilltops
and sandy terraces. We focused on terraces and hilltops because they are widespread in the
study area, covering approximately 70% of the landscape. Sandy terraces (hereafter
referred to as terraces) are well-drained sites located along the Boniface River covered by
lichens and graminoids with large patches of shrub species. Low-altitude hilltops are
characterized by the presence of arctic-alpine plant species and evidence of periglacial
processes such as frost heaves. Prior to the field season, we pre-selected 106 potential sites
(53 terraces and 53 hilltops) using a 113-km2 Worldview-1 Standard Ortho-Ready
panchromatic orthorectified satellite image (resolution 0.5 m). Once in the field, 59 of these
sites were selected for further analysis (33 terraces and 26 hilltops; Figure 1). Sites were
excluded when they did not correspond with the given definition of one of the 2
environments and/or because they were not within walking distance (> 3km) of the river.
Initial shrub cover and shrub densification for these 59 sites were published in a previous
paper (Ropars and Boudreau 2012). Initial cover was evaluated on an aerial photograph
mosaic taken in July 1957, whereas shrub densification was calculated as the difference
between shrub cover inferred from the analysis of a satellite image taken in July 2008 and
the aerial photograph mosaic taken in 1957 (Table SI in Supplemental material section, see
Ropars and Boudreau 2012 for more details).
3.4.3 Data collection
During summer 2009, the geographic position of the 59 sites (latitude, longitude) was
determined at its central point, corresponding to the intersection of two 120 m
perpendicular linear transects (extending North-South and East-West) sampled to determine
shrub species composition and abundance at each site (adapted from Mueller-Dombois and
Ellenberg 1974). Shrub species were recorded at every centimeter along the transects (total
number of centimeters surveyed per site = 24 000 cm). Percentage cover of a species was
then calculated by dividing the number of centimeters on which it was recorded by the total
number of centimeters surveyed. If a species was seen but not recorded during the

53
vegetation surveys, it was given a cover of 1 cm to account for its presence on the site.
For a subset of 27 sites, mineral soil cover was visually estimated in 10 systematically
located 1-m2 quadrats (1 m x 1 m) and assigned to one of the following cover classes: 0-
1%, 2-5%, 6-10%, 11-25%, 26-50%, 51-75%, 76-90%, and 91-100%. Using the mean
value of each class, these 10 measurements were subsequently averaged to obtain a mean
value for each site. Organic horizon depth in each site was evaluated in 18 systematically
located dug holes and then averaged. As direct snow measurements are unavailable for the
studied region, we used the mean dwarf birch height to approximate the minimal snow
cover for each site (see Arseneault and Payette 1992). Indeed, erect shrub vertical growth is
limited to the snow-air interface because drifting ice particles abrade vegetal tissues above
the protecting snow cover (Marchand and Chabot 1978). Mean dwarf birch height for a
given site was averaged from ten height measurements on randomly selected living
individuals.
Back from the field, we derived the slope (in degrees), the slope aspect (in degrees), and the
altitude for each of the 59 sites from a 15 m-resolution digital elevation model (DEM) of
the study region (http://geogratis.cgdi.gc.ca/geogratis/en/index.html) generated by Natural
Resources Canada. We also determined the age of 44 of the 59 sites as the time elapsed
since the last wildfire based on the exhaustive wildfire cartography reported in Payette et al
(2008). The 15 remaining sites were located outside of the area covered by the cartography.
The shrub densification and site-specific environmental information are summarized in
Table I of the supplemental material section. The mean surface of the sites surveyed is 1.14
ha and ranges from 0.44 to 2.08 ha. All sites are less than 10 km apart from each other.
3.4.4 Statistical analyses
For each site, total shrub cover, species richness, species diversity and species evenness
were calculated (including dwarf birch). Species richness was defined as being the total
number of shrub species per site, while total shrub cover was obtained by adding every
species’ cover for each site. As 2 or more different shrub species can overlap, total shrub
54
cover could be > 100% for one site. Shrub species diversity and evenness were calculated
with the Shannon’s diversity and evenness indexes (as described in Magurran 1988). We
assessed the differences between terraces and hilltops in terms of diversity, evenness, total
shrub cover and species richness using the non-parametric Kruskal-Wallis test.
We built ecologically relevant statistical models that could explain the heterogeneity in
shrub densification between 1957-2008 in the study area using the environmental variables
we measured. Because we did not have all variables for the 59 sites, we divided our
modelisation effort in three steps. First, we built 8 models with the variables available for
all 59 sites (type of environment, 1957 cover, altitude, slope, aspect). Five models were
built with a single variable, one with 2 variables (1957 cover + type of environment), one
with 3 variables (1957 cover + type of environment + altitude). The last model includes all
five variables. Secondly, we added the age of the site to each of the models identified as
plausible in the first step. We also built a model with the age of the site as the only variable.
These models were run using the 44 sites for which the time elapsed since the last fire was
available. Lastly, in order to reduce the number of models tested in the third step, we chose
the plausible models identified in the second step that includes the more variables and built
four new models. The first three models were built by adding respectively one variable
(organic matter depth, the mineral soil cover and the dwarf birch height - used as a proxy of
snow depth) to the previously identified model while the last one was built by adding all
three variables. These individual variables were also used to build three models with a
single variable. These models were run using the 27 sites for which the organic matter
depth, the mineral soil cover and the dwarf birch height were available.
To determine the most plausible model(s) at each step, we used model selection based on
Akaike’s information criterion corrected for small sample size (AICc; Sugiura 1978). AICc
considers the fitting quality and the number of variables included in each competing model
and ranks them in terms of loss of information. The best model, i.e. the one having the
lowest AICc value, is therefore the one for which the loss of information is minimal
(Mazerolle 2006). Using the aictab function of the AICcmodavg package (Mazerolle
2014), we calculated the AICc for each of the competing models. The aictab function also

55
calculates delta AICc (ΔAICc), AICc weight (wAICc) and the cumulative AICc weight.
The ΔAICc is calculated as the difference between the AICc of one model and the lowest
AICc value, the best model having therefore a ΔAICc equals to 0. The AICc weight is the
likelihood of a given model to be the best one among a set of competing models (Johnson
and Omland 2004) whereas the cumulative AICc weight corresponds to the wAICc of one
model plus the wAICc values and all better models. Burnham and Anderson (2002) suggest
basing our conclusions on the best model only if it has a wAICc > 0.90. Otherwise, they
suggest basing the conclusions using the multimodel inference. This approach allows us to
compute a weighted average of the estimates of the variables of interest instead of relying
solely on the estimates of the best model. Using the modavg function of the AICcmodavg
package, we obtain the model-averaged estimate of the parameters, the unconditional
standard error and the 95% confidence interval. We can conclude that one variable has an
effect on densification when the confidence interval excludes 0.
The influence of dwarf birch densification (difference in dwarf birch cover between 1957
and 2008; independent variable) on other shrub species cover (total and individual cover, as
well as for evergreen and deciduous species), species richness, Shannon diversity index and
evenness index (dependant variables) was evaluated through generalized linear models
(GLMs). For this section, dwarf birch data were excluded to calculate the 4 variables of
interest. The dependent variables were tested for normality using the Shapiro-Wilk test and
appropriate distribution was assigned to the variables for which we rejected the null
hypothesis (binomial and Poisson distribution for species cover and richness, respectively).
The influence of dwarf birch densification on each species cover was evaluated using the
same procedure. All statistical analyses were performed in the R Environment (R
Development Core Team, version 3.0.2, http://www.r-project.org/).
56
3.5 Results
3.5.1 Shrub communities
Over the 59 sites surveyed, a total of 13 shrub species were recorded (Table I). Dwarf
birch, Rhododendron tomentosum, Empetrum nigrum and Vaccinium uliginosum were
ubiquitous, being found in > 95% of the sites, regardless of the environment. Other species
were mainly confined to hilltops, despite being recorded at least once on terraces
(Diapensia lapponica, Kalmia procumbens, Salix uva-ursi).
Shrub cover ranged between 28.7 and 119.1% (and between 20.1 and 52.4% when
excluding overlapping shrub species) and was not significantly different between terraces
and hilltops (Kruskal-Wallis, p = 0.55; Figure 2). On terraces, total shrub cover averaged
63.0% ± 21.7 (mean ± SD) and was largely dominated by B. glandulosa (40.1% ± 12.5)
followed by R. tomentosum (7.0% ± 6.2) and E. nigrum (6.3% ± 9.0). On hilltops, shrub
cover averaged 58.9% ± 17.0 and was also dominated by B. glandulosa (32.5% ± 10.4)
followed by R. tomentosum (10.1% ± 4.9), and E. nigrum (8.7% ± 9.0). There were no
significant differences in species richness (Kruskal-Wallis, p = 0.08; Figure 2) or in
Shannon diversity (Kruskal-Wallis, p = 0.17; Figure 2) between terraces and hilltops
(Figure 2). However, the evenness index (Kruskal-Wallis, p < 0.01) was significantly
higher on terraces than on hilltops (Figure 2).
3.5.2 Candidate models to explain shrub densification
Given the 8 candidate models we built in the first step for model selection using AIC, we
found that the model including the 1957 shrub cover and the type of environment (terrace
or hilltop) was the most plausible one (Table II). This model was 3 times more plausible
than the second best model (evidence ratio: wAICcbest model/wAICc2nd best model: 0.66/0.22).
However, the best model had a wAICc < 0.90, suggesting that we should use multimodel
inferences to obtain more accurate estimates (Burnham and Anderson 2002). We therefore
calculated the model-averaged estimate of the 3 variables included in the plausible models
(1957 shrub cover, type of environment and altitude). Among them, the 1957 shrub cover

57
(estimate: -0.7662, unconditional SE: 0.0891, 95% conf. int.: -0.9508, -0.6015) and the type
of environment (estimate: -4.5596, unconditional SE: 2.1976, 95% conf. int.: 0.2524,
8.8669) had significant impacts on shrub densification of dwarf birch.
For the second step, we found that the model including the 1957 shrub cover and the time
elapsed since the last fire was the most plausible one (Table II). However, this model was
only 1.3 times more plausible than the second best model (evidence ratio: wAICcbest
model/wAICc2nd best model: 0.46/0.36). Because the best model had a wAICc < 0.90, we
calculated the model-averaged estimate of the 4 variables included in the plausible models
(1957 shrub cover, type of environment, altitude and age). Among them, only the 1957
shrub cover (estimate: -0.7432, unconditional SE: 0.0985, 95% conf. int.: -0.9361, -0.5502)
had a significant negative effect on the recent densification of dwarf birch.
Lastly, in the third step, we found that the most plausible model was the one including the
1957 shrub cover, the type of environment, the altitude, the time elapsed since the last fire
and the organic matter depth. This model was 1.1 times more plausible than the second best
model (evidence ratio: wAICcbest model/wAICc2nd best model: 0.46/0.41). Once again, we
calculated the model-averaged estimate of the 7 variables included in the plausible models
(1957 shrub cover, type of environment, altitude, age, organic matter depth, mineral soil
cover, dwarf birch height) because the best model had a wAICc < 0.90. Only the 1957
shrub cover (estimate: -0.5521, unconditional SE: 0.1351, 95% conf. int.: -0.8169, -0.2874)
and the time elapsed since the last fire (estimate: 0.0116, unconditional SE: 0.0038, 95%
conf. int.: 0.0041, 0.0191) had respectively significant negative and positive effects on the
recent densification of dwarf birch (Figure 3b). The opposite effect of the 1957 shrub cover
and the time elapsed since the last fire could be explained by the negative relationship
between the two (Figure 3c).
3.5.3 Influence of shrub densification on the shrub community
Dwarf birch densification had a negative effect on the shrub cover of other species (GLM, p
= 0.02; Figure 4) but not on individual species cover (GLM, p > 0.46). The negative
influence of dwarf birch densification on the cover of evergreen shrub species was

58
significant (GLM, p = 0.02) and marginally significant for deciduous species (GLM, p =
0.05). Dwarf birch densification had no significant effect on shrub species richness (GLM,
p = 0.34; Figure 4) or on Shannon diversity (GLM, p = 0.40; Figure 4). The evenness
index was positively influenced by dwarf birch densification (GLM, p = 0.04; Figure 4).

59
3.6 Discussion
Shrub densification in subarctic and arctic ecosystems has been mainly associated with an
increased performance of shrub species in response to higher temperatures (Myers-Smith et
al 2011a). However, the observed densification of dwarf birch in North America over the
last decades is non-uniform across the landscape (Tape et al 2006, 2012 Ropars and
Boudreau 2012, Tremblay et al 2012), emphasizing the importance of local and historical
conditions on the performance of shrub species. Soil properties (Tape et al 2012) as well as
disturbances (Landhausser and Wein 1993, Racine et al 2004, Lantz et al 2010) were
shown to influence shrub densification. In this study, we found that variables best
explaining dwarf birch densification heterogeneity in western Nunavik include both
topographic (type of environment) and historical conditions (1957 shrub cover and time
elapsed since the fire). Among these factors, only the 1957 shrub cover had a significant
influence on recent densification in all three series of models we ran. Moreover, we found
that dwarf birch densification influences the shrub community in terms of abundance and
composition.
3.6.1 Local drivers of dwarf birch densification heterogeneity
Given the environmental variables we measured, the 1957 shrub cover appears to be the
main driver of dwarf birch densification heterogeneity at the landscape level in western
subarctic Québec. Despite the fact that dwarf birch found on terraces and hilltops display
the same response to climatic variables over the last decades (Ropars et al 2015),
densification was greater in sites with a lower shrub cover in 1957 (Figure 3). Although one
might argue that this result is merely the consequence of shrub cover saturation, i.e. a shrub
cover close to 100%, it is highly unlikely since the shrub cover in 2008 averaged only
48.8% ± 7.5 (mean + SD), suggesting that there is still space for shrub densification in our
studied sites.
The time elapsed since the last wildfire was also identified as significant positive influence
on dwarf birch densification. Wildfires are a common disturbance in northern regions and
they were shown to promote the spread of tall shrubs over the first few decades following
60
the fire through the increase in nutrient availability and in suitable seedbeds (Zasada et al
1983, Bliss and Matveyeva 1992, Landhausser and Wein 1993, Hobbie and Chapin 1998,
Racine et al 2004, Gough 2006). With an increasing time since the last wildfire, the
availability of major soil nutrients is known to decrease in boreal forests (Vitousek 2004),
resulting in a decline in vegetation biomass and ecosystem productivity (Walker et al 2001,
Wardle et al 2003) and with a shift from deciduous to evergreen dwarf shrub species
(Wardle et al 1997). The contradicting effect of the time elapsed since last wildfire on B.
glandulosa densification we observed could results from its influence on the 1957 shrub
cover. In fact, the 1957 shrub cover in our study sites is negatively associated with the time
elapsed since the last disturbance (Figure 3), suggesting that older fires have created
conditions that had long-lasting effects on shrub abundance. Wildfire severity is also
known for its influence on subsequent successional trajectories (Payette 1992) and could
have played a role in shrub abundance of our studied sites. However, no information on
wildfire severity is currently available for the Boniface River region (S. Payette, personal
communication).
The type of environment was the other variable identified as important to explain dwarf
birch densification. These findings corroborate the results of Shaver et al (1996) that
stressed the importance of topography and its impact on micro-climatic conditions for plant
establishment and growth in arctic regions. Even though they are both well-drained non-
forested sites, terrace and hilltop sites differ in terms of soil texture and occurrence of
periglacial processes, which can in turn influence plant performance. Soil properties were
indeed pointed out as the main factor explaining the presence of adjacent expanding and
stable shrub patches in Alaska (Tape et al 2012). According to Payette et al (2008), the
altitude influences wind velocity, occurrence of freeze-thaw processes and snow cover
protection during winter. As a consequence, hilltops, which are located at higher altitude
than terraces, should be a more stressful environment limiting plant establishment and
growth. However, the effect of the type of environment on shrub densification could only
be an indirect effect of the 1957 shrub cover. As shown by Ropars and Boudreau (2012),
shrub cover in 1957 was greater on hilltops (35.3% ± 8.5; mean + SD) than on terraces
(28.6% ± 12.1; mean + SD).
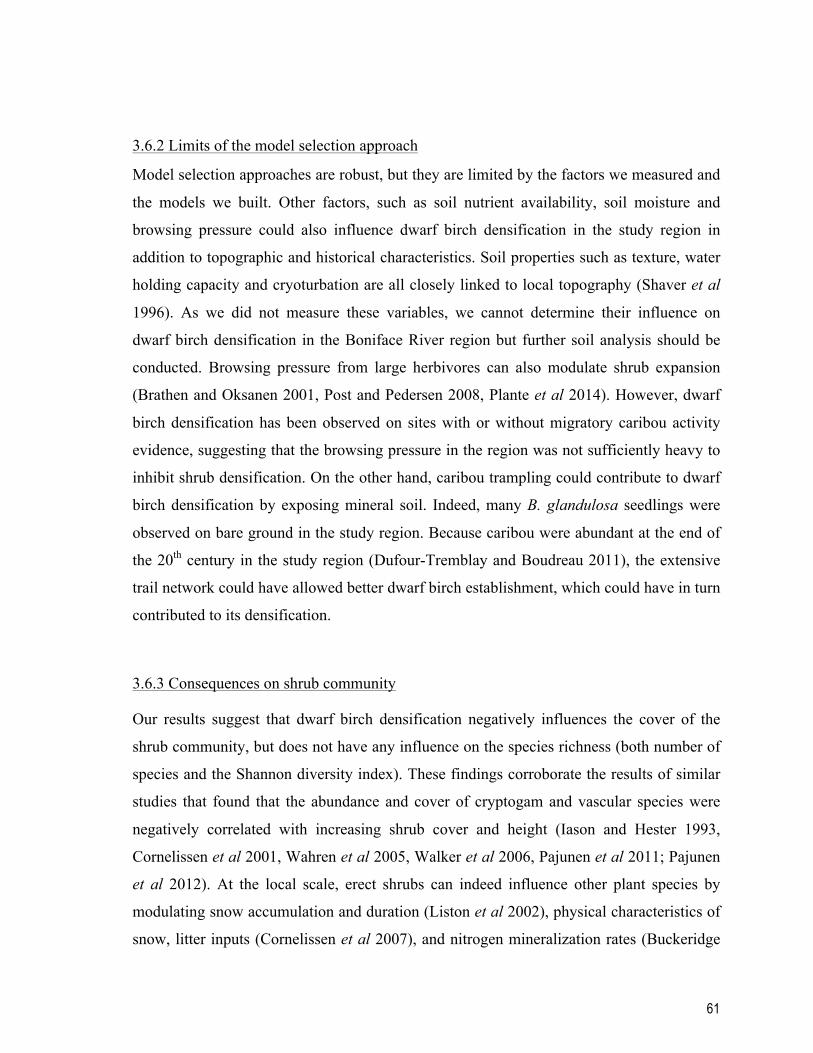
61
3.6.2 Limits of the model selection approach
Model selection approaches are robust, but they are limited by the factors we measured and
the models we built. Other factors, such as soil nutrient availability, soil moisture and
browsing pressure could also influence dwarf birch densification in the study region in
addition to topographic and historical characteristics. Soil properties such as texture, water
holding capacity and cryoturbation are all closely linked to local topography (Shaver et al
1996). As we did not measure these variables, we cannot determine their influence on
dwarf birch densification in the Boniface River region but further soil analysis should be
conducted. Browsing pressure from large herbivores can also modulate shrub expansion
(Brathen and Oksanen 2001, Post and Pedersen 2008, Plante et al 2014). However, dwarf
birch densification has been observed on sites with or without migratory caribou activity
evidence, suggesting that the browsing pressure in the region was not sufficiently heavy to
inhibit shrub densification. On the other hand, caribou trampling could contribute to dwarf
birch densification by exposing mineral soil. Indeed, many B. glandulosa seedlings were
observed on bare ground in the study region. Because caribou were abundant at the end of
the 20th century in the study region (Dufour-Tremblay and Boudreau 2011), the extensive
trail network could have allowed better dwarf birch establishment, which could have in turn
contributed to its densification.
3.6.3 Consequences on shrub community
Our results suggest that dwarf birch densification negatively influences the cover of the
shrub community, but does not have any influence on the species richness (both number of
species and the Shannon diversity index). These findings corroborate the results of similar
studies that found that the abundance and cover of cryptogam and vascular species were
negatively correlated with increasing shrub cover and height (Iason and Hester 1993,
Cornelissen et al 2001, Wahren et al 2005, Walker et al 2006, Pajunen et al 2011; Pajunen
et al 2012). At the local scale, erect shrubs can indeed influence other plant species by
modulating snow accumulation and duration (Liston et al 2002), physical characteristics of
snow, litter inputs (Cornelissen et al 2007), and nitrogen mineralization rates (Buckeridge
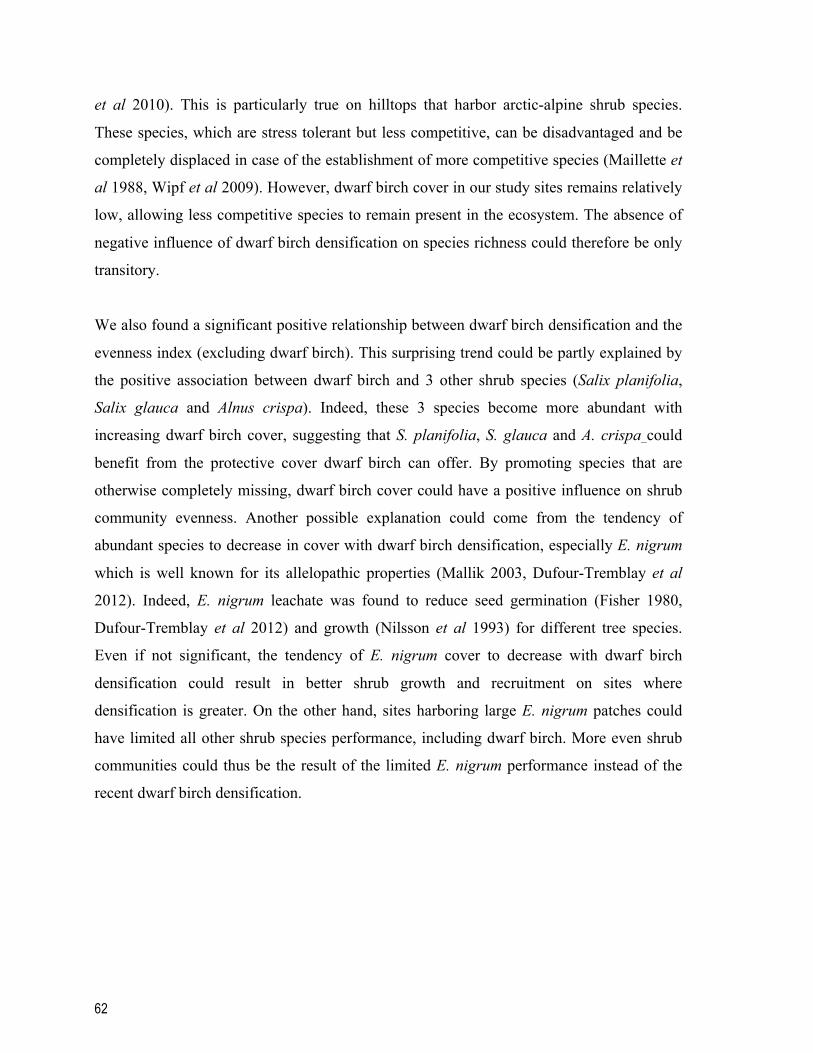
62
et al 2010). This is particularly true on hilltops that harbor arctic-alpine shrub species.
These species, which are stress tolerant but less competitive, can be disadvantaged and be
completely displaced in case of the establishment of more competitive species (Maillette et
al 1988, Wipf et al 2009). However, dwarf birch cover in our study sites remains relatively
low, allowing less competitive species to remain present in the ecosystem. The absence of
negative influence of dwarf birch densification on species richness could therefore be only
transitory.
We also found a significant positive relationship between dwarf birch densification and the
evenness index (excluding dwarf birch). This surprising trend could be partly explained by
the positive association between dwarf birch and 3 other shrub species (Salix planifolia,
Salix glauca and Alnus crispa). Indeed, these 3 species become more abundant with
increasing dwarf birch cover, suggesting that S. planifolia, S. glauca and A. crispa could
benefit from the protective cover dwarf birch can offer. By promoting species that are
otherwise completely missing, dwarf birch cover could have a positive influence on shrub
community evenness. Another possible explanation could come from the tendency of
abundant species to decrease in cover with dwarf birch densification, especially E. nigrum
which is well known for its allelopathic properties (Mallik 2003, Dufour-Tremblay et al
2012). Indeed, E. nigrum leachate was found to reduce seed germination (Fisher 1980,
Dufour-Tremblay et al 2012) and growth (Nilsson et al 1993) for different tree species.
Even if not significant, the tendency of E. nigrum cover to decrease with dwarf birch
densification could result in better shrub growth and recruitment on sites where
densification is greater. On the other hand, sites harboring large E. nigrum patches could
have limited all other shrub species performance, including dwarf birch. More even shrub
communities could thus be the result of the limited E. nigrum performance instead of the
recent dwarf birch densification.
63
3.7 Conclusion
Dwarf birch densification is widespread in Nunavik (McManus et al 2012, Ropars and
Boudreau 2012, Tremblay et al 2012), yet heterogeneous across the landscape. Our results
suggest that this heterogeneity is explained by both historical and topographic variables.
Among these, the time elapsed since the last wildfire had a significant and positive
influence on dwarf birch densification, suggesting that better soil formation is beneficial for
its performance. We also found that dwarf birch densification negatively influenced the
cover of other shrub species. On the other hand, we did not find any influence on shrub
species richness, suggesting that dwarf birch cover is still low enough to allow less
competitive shrub species to maintain themselves in the system. In future, detailed
pedological investigations would be needed to refine our comprehension of the causes of
dwarf birch densification heterogeneity.
64
3.8 Acknowledgments
We would like to thank Marie-Pier Denis, Sandra Angers-Blondin and Caroline Mercier for
their assistance in the field. We are also grateful to Émilie Saulnier-Talbot for English
revision, to Christian Tardif for the help with the data management and to the reviewers for
their valuable comments. This project was financially supported by the Natural Sciences
and Engineering Research Council of Canada, Fonds de Recherche Québec - Nature et
Technologies, by the Northern Scientific Training Program and by the Northern Research
Chair on Disturbance Ecology.

65
3.9 Tables
Table 3.1 Mean cover (± standard deviation) and occurrence of the 13 shrub species encountered in
2009 surveys in the Boniface river region, western Nunavik, Québec. The occurrence of a shrub
species is defined as the percentage of sites on which the species was found over the total number of
terraces (n = 33) and hilltops (n = 26).
Mean cover ± SD (%)
Occurrence (%)
Mean cover ± SD (%)
Occurrence (%)
Alnus crispa 0.0 ± 0.0 4 0.6 ± 0.8 42Betula glandulosa 32.5 ± 10.4 100 40.0 ± 12.5 100Rubus chamaemorus 0.1 ± 0.2 46 0.3 ± 0.4 82Salix glauca 0.1 ± 0.1 42 0.2 ± 0.6 27Salix planifolia 0.3 ± 0.4 58 0.7 ± 1.0 70Salix uva-ursi 0.3 ± 0.4 81 0.1 ± 0.3 24Vaccinium uliginosum 2.5 ± 2.0 96 2.0 ± 1.9 94
Arctous alpina 2.0 ± 2.4 77 0.8 ± 0.8 58Diapensia lapponica 0.0 ± 0.1 27 0.0 ± 0.0 6Empetrum nigrum 8.7 ± 9.0 100 6.3 ± 9.0 97Kalmia procumbens 0.6 ± 0.9 58 0.0 ± 0.0 3Rhododendron groenlandicum 1.7 ± 2.7 65 4.9 ± 3.5 100Rhododendron tomentosum 10.1 ± 4.9 100 7.0 ±6.2 94
Hilltops Terraces
Deciduous
Evergreen
SpeciesGrowth form
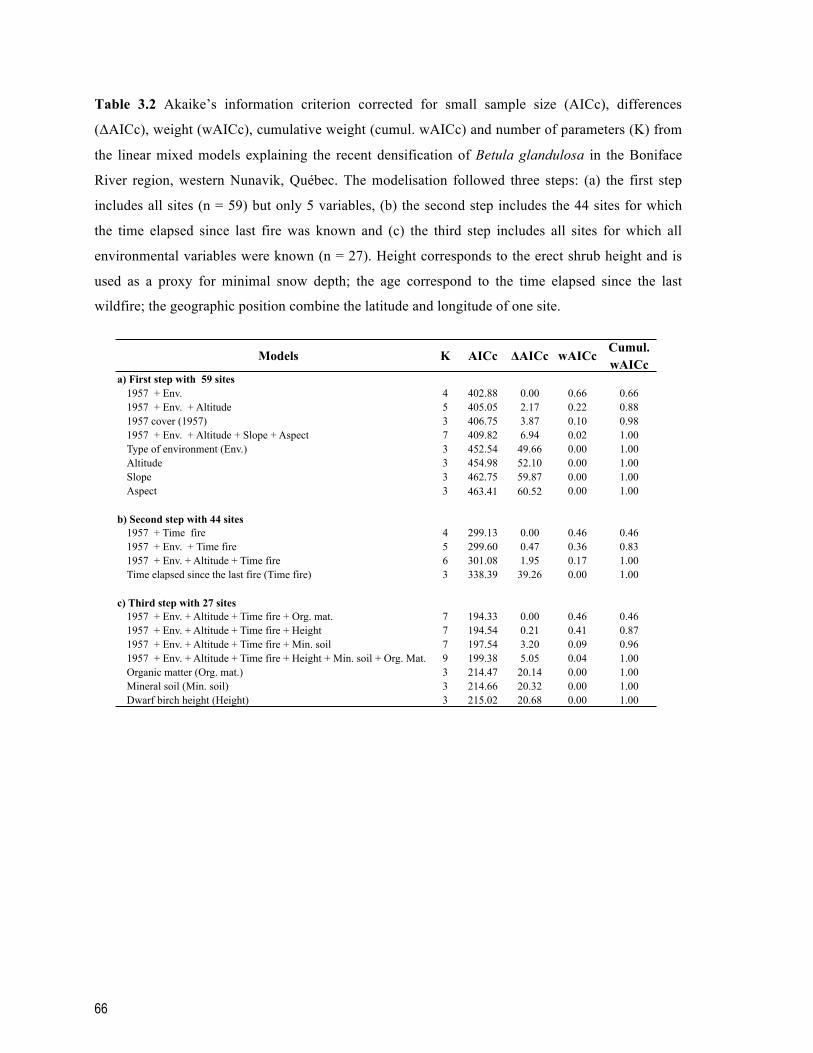
66
Table 3.2 Akaike’s information criterion corrected for small sample size (AICc), differences
(ΔAICc), weight (wAICc), cumulative weight (cumul. wAICc) and number of parameters (K) from
the linear mixed models explaining the recent densification of Betula glandulosa in the Boniface
River region, western Nunavik, Québec. The modelisation followed three steps: (a) the first step
includes all sites (n = 59) but only 5 variables, (b) the second step includes the 44 sites for which
the time elapsed since last fire was known and (c) the third step includes all sites for which all
environmental variables were known (n = 27). Height corresponds to the erect shrub height and is
used as a proxy for minimal snow depth; the age correspond to the time elapsed since the last
wildfire; the geographic position combine the latitude and longitude of one site.
Models K AICc ΔAICc wAICcCumul. wAICc
a) First step with 59 sites1957 + Env. 4 402.88 0.00 0.66 0.661957 + Env. + Altitude 5 405.05 2.17 0.22 0.881957 cover (1957) 3 406.75 3.87 0.10 0.981957 + Env. + Altitude + Slope + Aspect 7 409.82 6.94 0.02 1.00Type of environment (Env.) 3 452.54 49.66 0.00 1.00Altitude 3 454.98 52.10 0.00 1.00Slope 3 462.75 59.87 0.00 1.00Aspect 3 463.41 60.52 0.00 1.00
b) Second step with 44 sites1957 + Time fire 4 299.13 0.00 0.46 0.461957 + Env. + Time fire 5 299.60 0.47 0.36 0.831957 + Env. + Altitude + Time fire 6 301.08 1.95 0.17 1.00Time elapsed since the last fire (Time fire) 3 338.39 39.26 0.00 1.00
c) Third step with 27 sites1957 + Env. + Altitude + Time fire + Org. mat. 7 194.33 0.00 0.46 0.461957 + Env. + Altitude + Time fire + Height 7 194.54 0.21 0.41 0.871957 + Env. + Altitude + Time fire + Min. soil 7 197.54 3.20 0.09 0.961957 + Env. + Altitude + Time fire + Height + Min. soil + Org. Mat. 9 199.38 5.05 0.04 1.00Organic matter (Org. mat.) 3 214.47 20.14 0.00 1.00Mineral soil (Min. soil) 3 214.66 20.32 0.00 1.00Dwarf birch height (Height) 3 215.02 20.68 0.00 1.00

67
3.10 Figures
Figure 3.1 WorldView-1 satellite image of the Boniface River region in the Boniface River region,
western Nunavik, Québec. Terraces (circles, n = 33) and hilltops (triangles, n = 26) are identified on
the map. White circles (n = 6) and triangles (n = 9) represent sites for which the time elapsed since
the last fire is unknown.
N0 3000Meters
Québec
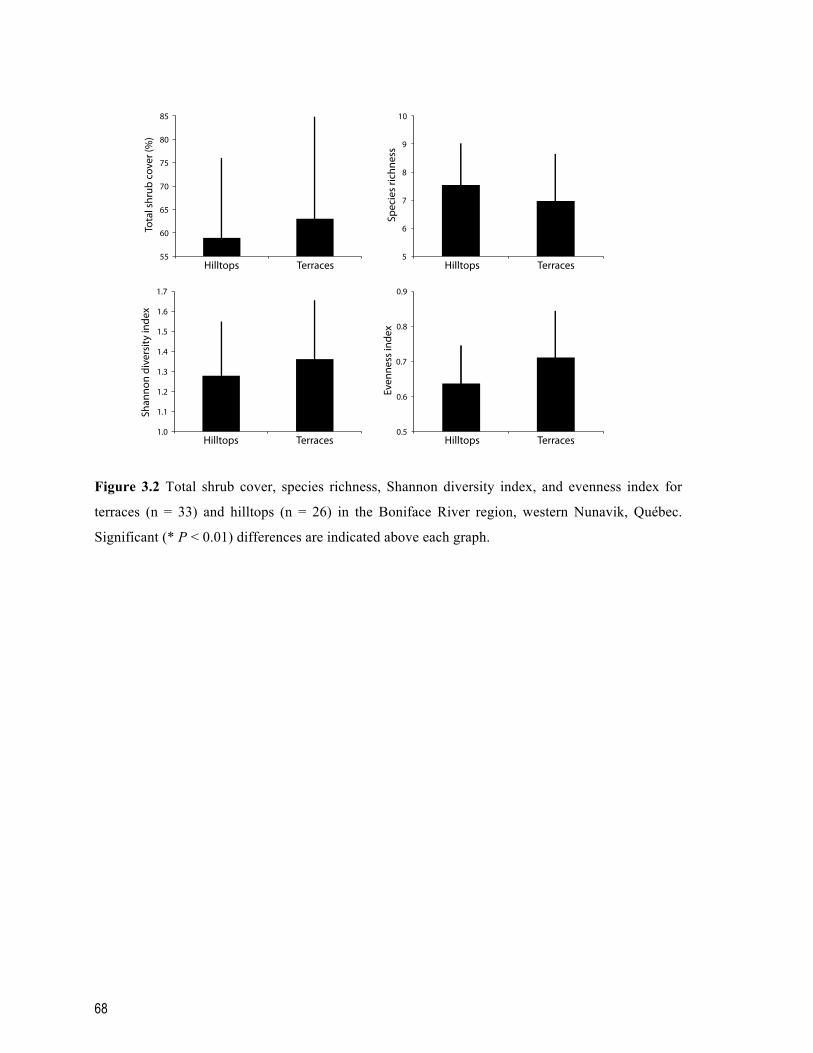
68
Figure 3.2 Total shrub cover, species richness, Shannon diversity index, and evenness index for
terraces (n = 33) and hilltops (n = 26) in the Boniface River region, western Nunavik, Québec.
Significant (* P < 0.01) differences are indicated above each graph.
5
6
7
8
9
10
55
60
65
70
75
80
85
1.0
1.1
1.2
1.3
1.4
1.5
1.6
1.7
0.5
0.6
0.7
0.8
0.9
Tota
l shr
ub c
over
(%)
Shan
non
dive
rsity
inde
x
Even
ness
inde
xSp
ecie
s ric
hnes
s
Hilltops Terraces Hilltops Terraces
Hilltops Terraces Hilltops Terraces

69
Figure 3.3 (a) Influence of the 1957 shrub cover on the densification of Betula glandulosa for 59
sites (terraces: n = 33, hilltops: n = 26), (b) influence of time elapsed since the last wildfire (i.e. the
age of one site) on the densification of Betula glandulosa for 44 sites (terraces: n = 27, hilltops: n =
17) and (c) influence of time elapsed since the last wildfire (i.e. the age of one site) on the 1957
shrub cover for 44 sites (terraces: n = 27, hilltops: n = 17) in the Boniface River region, western
Nunavik, Québec. Terraces and hilltops are represented by black and white diamonds, respectively.
y = -0.836x + 43.581 R² = 0.62207
-10
0
10
20
30
40
50
60
0 10 20 30 40 50 60 Sh
rub
dens
ifica
tion
(%)
1957 shrub cover (%)
y = 0.0163x + 6.9682 R² = 0.26191
-10
0
10
20
30
40
50
60
0 500 1000 1500 2000
Shru
b de
nsifi
catio
n (%
)
Time elapsed since the last disturbance (y)
y = -0.014x + 40.401 R² = 0.19829
0
10
20
30
40
50
60
0 500 1000 1500 2000
1957
shr
ub c
over
(%)
Time elapsed since the last disturbance (y)
a)
c)
b)

70
Figure 3.4 Influence of Betula glandulosa densification on other shrub species cover, species
richness, Shannon diversity index, and evenness index for the 59 sites (terraces: black diamond, n =
33 and hilltops: black diamond, n = 26) in the Boniface River region, western Nunavik, Québec.
Betula glandulosa densification had a significant negative and positive influence on other shrub
cover and evenness index, respectively.
0
20
40
60
80
-10 0 10 20 30 40 50 0
3
6
9
12
15
-10 0 10 20 30 40 50
0.4
0.8
1.2
1.6
2
-10 0 10 20 30 40 50 0.3
0.5
0.7
0.9
1.1
-10 0 10 20 30 40 50
Shru
b co
ver (
%)
Spec
ies
richn
ess
Shan
non
dive
rsity
inde
x
Even
ness
inde
x
Betula glandulosa densification (%) Betula glandulosa densification (%)
p = 0.02
p = 0.04

71
3.11 Supporting information
Table S3.1 Environmental information, Betula glandulosa cover in 1957 and Betula glandulosa
cover change (densification) between 1957 and 2008 for the 59 sites (terraces n = 33, hilltops n =
26) surveyed in the Boniface River region, western Nunavik, Québec. The age of one site is the
time elapsed since the last wildfire whereas the shrub mean height is used as an estimation of the
minimum snow depth.
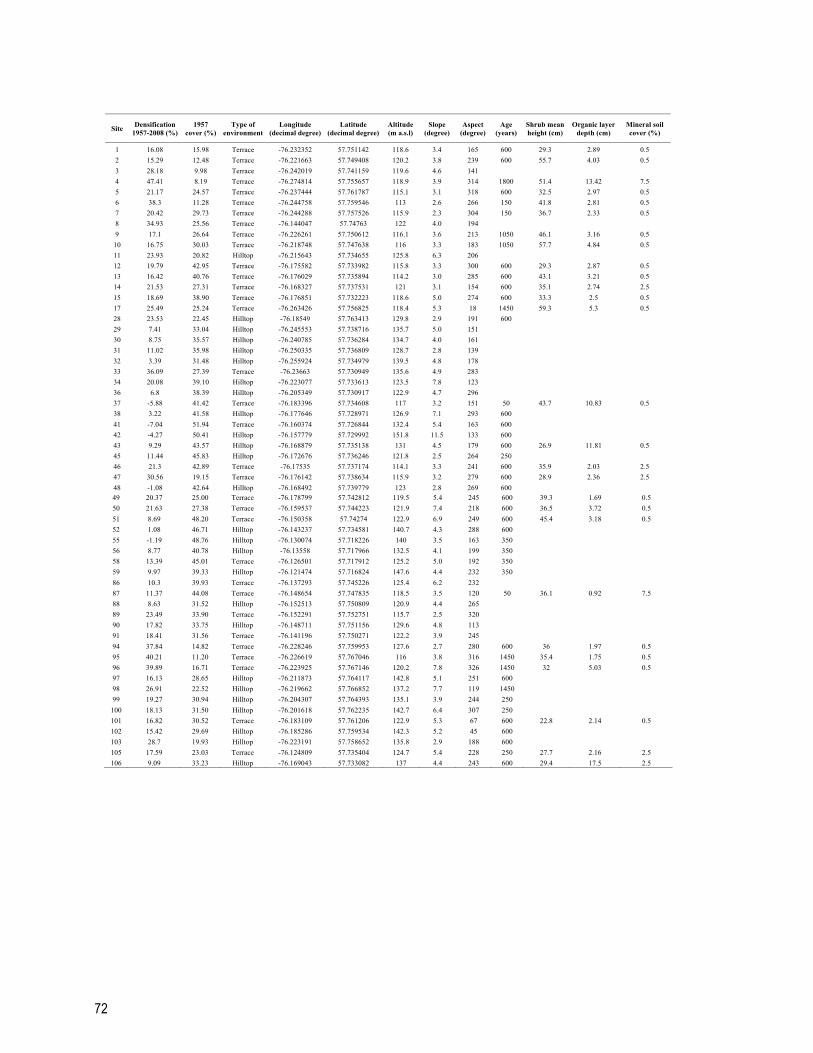
72
Site Densification 1957-2008 (%)
1957 cover (%)
Type of environment
Longitude (decimal degree)
Latitude (decimal degree)
Altitude (m a.s.l)
Slope (degree)
Aspect (degree)
Age (years)
Shrub mean height (cm)
Organic layer depth (cm)
Mineral soil cover (%)
1 16.08 15.98 Terrace -76.232352 57.751142 118.6 3.4 165 600 29.3 2.89 0.5 2 15.29 12.48 Terrace -76.221663 57.749408 120.2 3.8 239 600 55.7 4.03 0.5 3 28.18 9.98 Terrace -76.242019 57.741159 119.6 4.6 141 4 47.41 8.19 Terrace -76.274814 57.755657 118.9 3.9 314 1800 51.4 13.42 7.5 5 21.17 24.57 Terrace -76.237444 57.761787 115.1 3.1 318 600 32.5 2.97 0.5 6 38.3 11.28 Terrace -76.244758 57.759546 113 2.6 266 150 41.8 2.81 0.5 7 20.42 29.73 Terrace -76.244288 57.757526 115.9 2.3 304 150 36.7 2.33 0.5 8 34.93 25.56 Terrace -76.144047 57.74763 122 4.0 194 9 17.1 26.64 Terrace -76.226261 57.750612 116.1 3.6 213 1050 46.1 3.16 0.5
10 16.75 30.03 Terrace -76.218748 57.747638 116 3.3 183 1050 57.7 4.84 0.5 11 23.93 20.82 Hilltop -76.215643 57.734655 125.8 6.3 206 12 19.79 42.95 Terrace -76.175582 57.733982 115.8 3.3 300 600 29.3 2.87 0.5 13 16.42 40.76 Terrace -76.176029 57.735894 114.2 3.0 285 600 43.1 3.21 0.5 14 21.53 27.31 Terrace -76.168327 57.737531 121 3.1 154 600 35.1 2.74 2.5 15 18.69 38.90 Terrace -76.176851 57.732223 118.6 5.0 274 600 33.3 2.5 0.5 17 25.49 25.24 Terrace -76.263426 57.756825 118.4 5.3 18 1450 59.3 5.3 0.5 28 23.53 22.45 Hilltop -76.18549 57.763413 129.8 2.9 191 600 29 7.41 33.04 Hilltop -76.245553 57.738716 135.7 5.0 151 30 8.75 35.57 Hilltop -76.240785 57.736284 134.7 4.0 161 31 11.02 35.98 Hilltop -76.250335 57.736809 128.7 2.8 139 32 3.39 31.48 Hilltop -76.255924 57.734979 139.5 4.8 178 33 36.09 27.39 Terrace -76.23663 57.730949 135.6 4.9 283 34 20.08 39.10 Hilltop -76.223077 57.733613 123.5 7.8 123 36 6.8 38.39 Hilltop -76.205349 57.730917 122.9 4.7 296 37 -5.88 41.42 Terrace -76.183396 57.734608 117 3.2 151 50 43.7 10.83 0.5 38 3.22 41.58 Hilltop -76.177646 57.728971 126.9 7.1 293 600 41 -7.04 51.94 Terrace -76.160374 57.726844 132.4 5.4 163 600 42 -4.27 50.41 Hilltop -76.157779 57.729992 151.8 11.5 133 600 43 9.29 43.57 Hilltop -76.168879 57.735138 131 4.5 179 600 26.9 11.81 0.5 45 11.44 45.83 Hilltop -76.172676 57.736246 121.8 2.5 264 250 46 21.3 42.89 Terrace -76.17535 57.737174 114.1 3.3 241 600 35.9 2.03 2.5 47 30.56 19.15 Terrace -76.176142 57.738634 115.9 3.2 279 600 28.9 2.36 2.5 48 -1.08 42.64 Hilltop -76.168492 57.739779 123 2.8 269 600 49 20.37 25.00 Terrace -76.178799 57.742812 119.5 5.4 245 600 39.3 1.69 0.5 50 21.63 27.38 Terrace -76.159537 57.744223 121.9 7.4 218 600 36.5 3.72 0.5 51 8.69 48.20 Terrace -76.150358 57.74274 122.9 6.9 249 600 45.4 3.18 0.5 52 1.08 46.71 Hilltop -76.143237 57.734581 140.7 4.3 288 600 55 -1.19 48.76 Hilltop -76.130074 57.718226 140 3.5 163 350 56 8.77 40.78 Hilltop -76.13558 57.717966 132.5 4.1 199 350 58 13.39 45.01 Terrace -76.126501 57.717912 125.2 5.0 192 350 59 9.97 39.33 Hilltop -76.121474 57.716824 147.6 4.4 232 350 86 10.3 39.93 Terrace -76.137293 57.745226 125.4 6.2 232 87 11.37 44.08 Terrace -76.148654 57.747835 118.5 3.5 120 50 36.1 0.92 7.5 88 8.63 31.52 Hilltop -76.152513 57.750809 120.9 4.4 265 89 23.49 33.90 Terrace -76.152291 57.752751 115.7 2.5 320 90 17.82 33.75 Hilltop -76.148711 57.751156 129.6 4.8 113 91 18.41 31.56 Terrace -76.141196 57.750271 122.2 3.9 245 94 37.84 14.82 Terrace -76.228246 57.759953 127.6 2.7 280 600 36 1.97 0.5 95 40.21 11.20 Terrace -76.226619 57.767046 116 3.8 316 1450 35.4 1.75 0.5 96 39.89 16.71 Terrace -76.223925 57.767146 120.2 7.8 326 1450 32 5.03 0.5 97 16.13 28.65 Hilltop -76.211873 57.764117 142.8 5.1 251 600 98 26.91 22.52 Hilltop -76.219662 57.766852 137.2 7.7 119 1450 99 19.27 30.94 Hilltop -76.204307 57.764393 135.1 3.9 244 250
100 18.13 31.50 Hilltop -76.201618 57.762235 142.7 6.4 307 250 101 16.82 30.52 Terrace -76.183109 57.761206 122.9 5.3 67 600 22.8 2.14 0.5 102 15.42 29.69 Hilltop -76.185286 57.759534 142.3 5.2 45 600 103 28.7 19.93 Hilltop -76.223191 57.758652 135.8 2.9 188 600 105 17.59 23.03 Terrace -76.124809 57.735404 124.7 5.4 228 250 27.7 2.16 2.5 106 9.09 33.23 Hilltop -76.169043 57.733082 137 4.4 243 600 29.4 17.5 2.5
!

73
CHAPITRE 4 How do climate and topography influence the greening of the forest tundra ecotone in northwestern Québec? A dendrochronological analysis of Betula glandulosa
Publié sous : Ropars P, Lévesque E & Boudreau (2015) Journal of Ecology 103 : 679-690
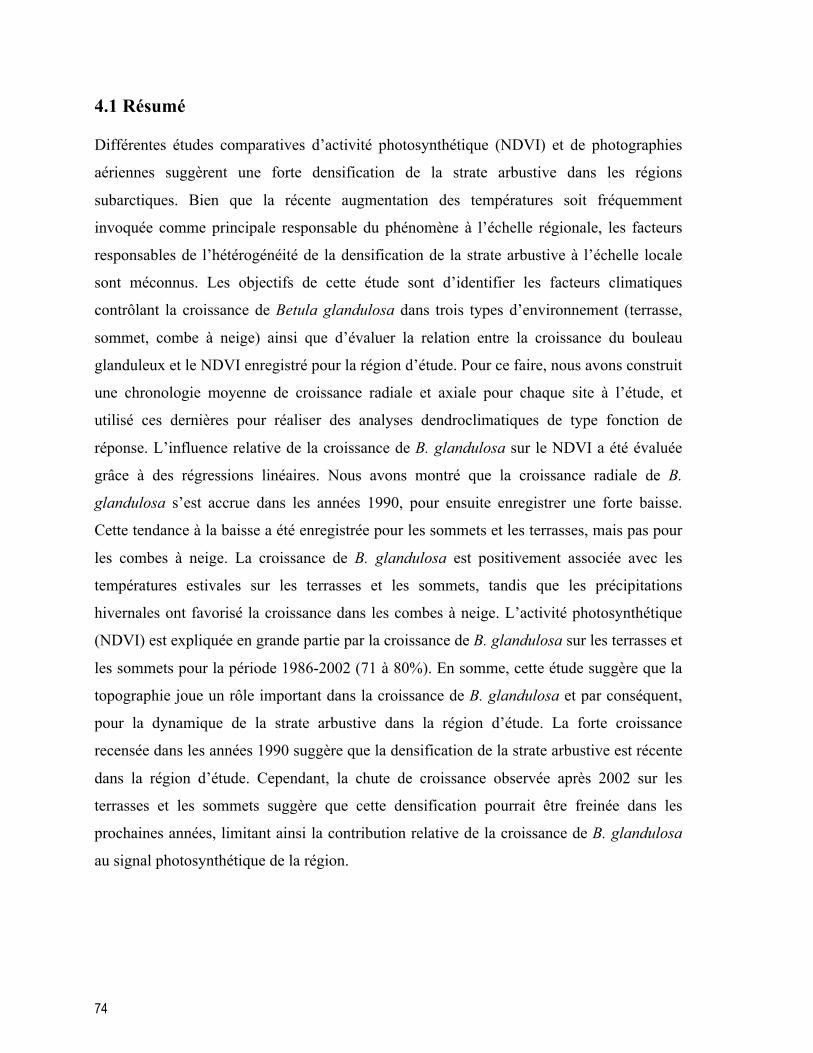
74
4.1 Résumé
Différentes études comparatives d’activité photosynthétique (NDVI) et de photographies
aériennes suggèrent une forte densification de la strate arbustive dans les régions
subarctiques. Bien que la récente augmentation des températures soit fréquemment
invoquée comme principale responsable du phénomène à l’échelle régionale, les facteurs
responsables de l’hétérogénéité de la densification de la strate arbustive à l’échelle locale
sont méconnus. Les objectifs de cette étude sont d’identifier les facteurs climatiques
contrôlant la croissance de Betula glandulosa dans trois types d’environnement (terrasse,
sommet, combe à neige) ainsi que d’évaluer la relation entre la croissance du bouleau
glanduleux et le NDVI enregistré pour la région d’étude. Pour ce faire, nous avons construit
une chronologie moyenne de croissance radiale et axiale pour chaque site à l’étude, et
utilisé ces dernières pour réaliser des analyses dendroclimatiques de type fonction de
réponse. L’influence relative de la croissance de B. glandulosa sur le NDVI a été évaluée
grâce à des régressions linéaires. Nous avons montré que la croissance radiale de B.
glandulosa s’est accrue dans les années 1990, pour ensuite enregistrer une forte baisse.
Cette tendance à la baisse a été enregistrée pour les sommets et les terrasses, mais pas pour
les combes à neige. La croissance de B. glandulosa est positivement associée avec les
températures estivales sur les terrasses et les sommets, tandis que les précipitations
hivernales ont favorisé la croissance dans les combes à neige. L’activité photosynthétique
(NDVI) est expliquée en grande partie par la croissance de B. glandulosa sur les terrasses et
les sommets pour la période 1986-2002 (71 à 80%). En somme, cette étude suggère que la
topographie joue un rôle important dans la croissance de B. glandulosa et par conséquent,
pour la dynamique de la strate arbustive dans la région d’étude. La forte croissance
recensée dans les années 1990 suggère que la densification de la strate arbustive est récente
dans la région d’étude. Cependant, la chute de croissance observée après 2002 sur les
terrasses et les sommets suggère que cette densification pourrait être freinée dans les
prochaines années, limitant ainsi la contribution relative de la croissance de B. glandulosa
au signal photosynthétique de la région.

75
4.2 Abstract
NDVI analysis and repeated aerial photographs have revealed significant shrub expansion
in many subarctic regions. While the recent increase in temperature is usually considered to
be the main driver of this phenomenon at regional scales, very little is known about the
local heterogeneity of shrub responses across the landscape. In this study, we aim to
identify the climatic factors controlling the growth of the largely distributed shrub species
Betula glandulosa in three types of environments (terrace, hilltop and snowbed). We also
aim to evaluate the relationship between B. glandulosa growth and the NDVI data for the
Boniface River region, in northwestern Québec, where the study took place. In the field, we
harvested 180 B. glandulosa individuals (20 per site, three sites per type of environment).
We constructed specific growth ring width chronologies and mean axial growth rate
chronologies for each site, and used them for dendroclimatic analysis (response functions).
We also used linear regressions to evaluate the relative influence of dwarf birch growth on
the NDVI trend. We found a sharp increase in B. glandulosa radial growth in the 1990s
followed by a sharp decreasing trend on terraces and hilltops, while growth remained high
in snowbeds. Betula glandulosa growth was positively correlated with summer
temperatures on terraces and hilltops, whereas winter precipitation promoted growth on
snowbeds. The NDVI trend was largely correlated to B. glandulosa growth on terraces and
hilltops for the period between 1986 and 2002 (71 to 80%). Our results suggest that
topography plays a major role in B. glandulosa growth and therefore, in shrub community
dynamics. Because terraces and hilltops represent 70% of the land surface, the sharp B.
glandulosa growth increase at these sites promoted an important overall expansion of the
shrub community in the region. However, the decline in B. glandulosa growth observed
after 2002 suggests that the expansion could be slowed down in the near future, therefore
limiting shrub growth contribution to the regional NDVI signal.
76
4.3 Introduction
Greening of terrestrial ecosystems has been observed throughout the northern circumpolar
region (Myers-Smith et al 2011), from North America (Sturm et al 2001, Tape et al 2006,
Olthof and Pouliot 2010, Ropars and Boudreau 2012, Tremblay et al 2012, Fraser et al
2014) to Eurasia (Forbes et al 2010, Hallinger et al 2010). Repeated aerial photograph
comparisons (Sturm et al 2001, Tape et al 2006, Beck and Goetz 2011, Ropars and
Boudreau 2012, Tremblay et al 2012, Fraser et al 2014) and Normalized Difference
Vegetation Index (NDVI) analyses derived from satellite images (Raynolds et al 2006,
Forbes et al 2010, McManus et al 2012, Fraser et al 2014) revealed that this greening trend
is mainly associated with the rapid expansion of erect shrub species. Resulting from an
increase in clonal growth and/or in seedling recruitment, this recent expansion of shrub
species occurs either via infilling of pre-existing shrub patches, increases in vertical growth
or advancing of the shrubline (Myers-Smith et al. 2011).
Encroachment of tall shrub individuals onto previously bare surfaces has profound
implications on arctic and subarctic ecosystems. Among them, shrub expansion can
decrease albedo (Chapin et al 2005), increase evapotranspiration (Swann et al 2010), alter
surface energy exchange and soil temperatures (Liston et al 2002, Pomeroy et al 2006,
Marsh et al 2010), modify biodiversity and ecosystem services (Cornelissen et al 2001,
Wilson and Nilsson 2009, Pajunen et al 2011), and reduce summer permafrost thaw (Blok
et al 2010). Shrub expansion can also influence animal forage availability, either by
decreasing lichen availability in caribou winter ranges (Joly et al 2007) or by increasing
shrub forage for moose, ptarmigan, and hare (Tape et al 2010).
Shrub expansion is commonly attributed to the recent increase in temperatures at high
latitudes (Myers-Smith et al 2011) through an overall increase in shrub growth. Indeed,
dendrochronological studies reveal positive relationships between shrub growth and
temperature (Xiao et al 2007, Bär et al 2008, Liang and Eckstein 2009, Forbes et al 2010,
Hallinger et al 2010, Blok et al 2011, Hantemirov et al 2011, Boudreau and Villeneuve-
Simard 2012), and, to a lesser extent, with winter (Liang and Eckstein 2009, Hallinger et al
2010, Schmidt et al 2010) and summer (Blok et al 2011) precipitation. These results are

77
corroborated by other studies that have shown an increase in deciduous shrub species
abundance when subjected to experimental warming (Hobbie and Chapin 1998b, Jónsdóttir
et al 2005, Walker et al 2006, Elmendorf et al 2012b), especially when combined with
nutrient addition (Chapin et al 1995, Chapin and Shaver 1996, Bret-Harte et al 2001,
Zamin and Grogan 2012, Paradis et al 2014). Vertical growth of deciduous shrubs is also
promoted by experimental warming (Chapin and Shaver 1996, Bret-Harte et al 2002,
Jónsdóttir et al 2005, Walker et al 2006, Elmendorf et al 2012b) as well as by higher snow
cover (Wahren et al 2005).
Despite the well-known influence of climate on shrub performance, the climatic control on
shrub growth is likely heterogeneous at the local scale. Topographic variations can promote
large differences in nutrient availability (Tape et al 2012) and/or in protecting snow cover
(Ropars and Boudreau 2012), which can in turn compromise shrub growth. Large-scale (1-
km2 to 8-km2 pixel size: Jia et al 2003, Goetz et al 2005, Raynolds et al 2006, Olthof and
Pouliot 2010) studies of vegetation change such as NDVI analyses might therefore
overlook the heterogeneity of shrub expansion across the landscape. On the other hand,
site-specific studies using a dendrochronological approach to assess shrub growth might
overlook important regional signals.
Even if shrub expansion and its relationship with climate change have been of growing
interest in the past decade, very few studies have used a multi-proxy approach to asses this
phenomenon (but see Forbes et al 2010). Here, we present a regional study integrating
dendrochronological analysis and NDVI data to evaluate the long-term growth of Betula
glandulosa Michx. (hereafter referred to as dwarf birch) and to quantify its contribution to
regional greening. Specifically, we aim (1) to identify the climatic factors controlling dwarf
birch radial and axial growth, if any, and to evaluate if these factors have a constant effect
across the landscape, and (2) to evaluate if the increase in photosynthetic activity in the
study area revealed by satellite imagery (NDVI data) can be explained by an increase in
dwarf birch growth. We hypothesize that radial and axial growth are respectively driven by
summer temperatures and winter precipitation, that the specific drivers of dwarf birch
growth vary across the landscape and that NDVI is correlated with dwarf birch growth.

78
79
4.4 Methods
4.4.1 Study area
The study site is located at the Boniface River research station of the Centre d’études
nordiques (CEN), about 10 km south of the Arctic treeline in subarctic Québec, Canada
(57° 45′ N, 76° 20′ W). The area belongs to the shrub subzone of the forest-tundra ecotone
(FTE; Payette 1983) and lies within the discontinuous permafrost zone (Payette 2001).
Covering ca. 70% of the well-drained sites (Payette et al 2008), shrub-lichen tundra
communities are found on slopes and low altitude hilltops. Forested stands are currently
restricted to well-watered protected sites, but were once part of a more extensive forest
cover (Payette and Morneau 1993). Wetlands, which include palsas and snowbeds, cover
approximately 7% of the terrestrial surface. At the regional scale, dwarf birch is the most
abundant shrub species and is responsible for most of the shrub expansion observed in
western (Ropars and Boudreau 2012) as well as in eastern subarctic Québec (Tremblay et al
2012) over the last decades.
Fires were frequent in the region during the Holocene period (Arseneault and Payette
1997b, Arseneault and Sirois 2004), but the colder and wetter conditions of the last 1000
years reduced their frequency (Filion 1984). The Rivière-aux-Feuilles migratory caribou
(Rangifer tarandus L.) herd (RFCH) declined sharply after peaking at 931 000 ± 427 000
individuals in July 2001 (Couturier et al 2004, Aerial migratory caribou count, Québec
Government, 2011, data not published). Being at the southern limit of the RFCH summer
range, the Boniface River region did not support high densities of caribou. Nevertheless,
caribou did expose patches of mineral soils following the destruction of the lichen cover
through repeated trampling (Dufour-Tremblay and Boudreau 2011) while evidence of
browsing are mostly restricted to Salix species.
Inukjuak Meteorological Station (58º 28’ N, 78º 05’ W; 130 km northwest of the study site)
recorded an annual mean temperature of -7 ºC for the 1971-2000 period, with the highest
and lowest mean monthly temperatures recorded in July (9.4º C) and February (-25.8 ºC),
respectively (Environment Canada 2013). Annual precipitation averaged 460 mm, of which
80
42% fell as snow (Environment Canada 2013). Like many regions of northern Québec,
Inukjuak has experienced an extensive warming trend since the early 1990’s (Chouinard et
al 2007, Bhiry et al 2011). Mean temperatures followed a significant increasing trend
between 1990 and 2009 (+ 0.14°C year-1, F1,13 = 6.92, p = 0.02) whereas no trend was
observed for the previous period (1946 and 1989; F1,40 = 0.11, p = 0.74). Total annual
precipitation increased for the 1946-2009 period (3.5 mm year-1, F1,48 = 29.88, p < 0.01),
whereas total summer precipitation decreased slightly but not significantly for the same
period (-0.17 mm year-1, F1,51 = 0.26, p = 0.61). Although some climate data are also
available for the Boniface River area, we decided to use the Inukjuak climate data for
subsequent analyses because (1) the mean monthly temperatures from Inukjuak and
Boniface were highly correlated (Pearson correlation coefficients ranging from 0.89 to
0.98, data not shown), (2) the period covered by the available climate data is longer for
Inukjuak (1946-2009) than for Boniface (1988-2009) and (3) no precipitation data were
available for Boniface.
4.4.2 Site selection and field sampling
In this study, we focused on three different types of environments: sandy terraces (hereafter
referred to as terraces), hilltops and snowbeds. Terraces are defined as well-drained low
altitude sites (ranging from 110 to 125 m a.s.l) located at the margin of the Boniface River.
They are characterized by lichens and graminoids and harbor large patches of shrub
species, mainly dwarf birch. Low altitude hilltops (ranging from 120 to 150 m a.s.l) are
characterized by the presence of arctic-alpine species and exposed mineral soil.
Experiencing harsher winter conditions, shrubs and trees growing at these sites have a
limited height. Indeed, drifting ice particles abrade plant stems and meristems at the snow-
air interface (Marchand and Chabot 1978), thus limiting erect shrub and tree growth above
the protective snow cover (Hadley and Smith 1989). Snowbeds are periglacial
environments where snow accumulates preferentially during winter and melts later in the
growing season, sometimes as late as in mid-July. Consequently, these environments are
characterized by plant species that are well adapted to winter conditions and an excess of
moisture (Payette and Lajeunesse 1980, Filion and Payette 1982, Payette et al 1985, Morin
and Payette 1986). High dwarf birch patches usually surround these environments.
81
Prior to the field season, we identified 50 terraces, 50 hilltops, and 47 snowbeds on a
WorldView-1 Standard Ortho-Ready panchromatic orthorectified satellite image of the
study area (resolution 0.5 m) taken on July 15th, 2008. Of these pre-selected sites, we
randomly chose three sites for each type of environment (i.e. 3 terraces, 3 hilltops, 3
snowbeds). At each site, we selected 20 dwarf birch individuals that we uprooted in July
and August 2009. Relatively isolated large individuals showing a circular form were
selected preferentially, as they were thought to be older individuals grown from seed. When
they were not available, particular attention was taken to discard individuals that seemed to
have grown from vegetative reproduction. The root collar and the two main branches of
each dwarf birch individual were collected, carefully cleaned, and left to dry at room
temperature for at least 3 months.
4.4.3 Radial growth and climatic data
Growth ring analysis was conducted to evaluate the effect of temperature, precipitation and
drought stress on radial growth. To do so, dwarf birch root collars were sliced (ca. 25 µm)
using a rotary microtome after being boiled for at least 3 hours. Thin sections were then
stained with safranin (1% solution, Safanin O, Fischer Science Education), dried and
permanently mounted with a 66% toluene solution (SHUR/mountTM liquid cover glass,
Triangle biomedical sciences). Digital photographs of each sample were taken using a
binocular-mounted camera (Olympus SZ61 with a SC100 camera). Root collars were
discarded if they could not be sliced perpendicularly (branches and roots were too
intermingled), or if they were rotten.
Using digital photographs, we aged each sample with the ImageJ freeware (v. 1.40g) while
ring widths were measured using the dendrochronological software LignoVision (v. 1.36,
Rinntech). When possible, ring widths along two radii were measured for each sample.
Growth measurements were visually examined and statistically verified with COFECHA, a
widely used statistical crossdating program (Holmes 1983). A horizontal line fitted to the
mean was applied to raw chronologies to allow comparison between individuals. This
standardization method was used because there was no general age trend among the

82
different individuals (see Figure S4.1 in Supporting Information), and because we wanted
to keep as much variability associated with the climate signal as possible (Weijers et al
2010). One growth-ring chronology was produced for each site by averaging the different
standardized individual ring width chronologies. The Expressed Population Signal (EPS)
was used as an indicator of the reliability of the chronologies (threshold: 0.85; Wigley et al
1984).
Response functions were performed with the bootRes package (dcc function) of the R
software (v. 3.0.2, R Development Core Team) to assess the influence of mean monthly
temperatures and total monthly precipitation, as well as drought stress during the growth
season on dwarf birch’s radial growth. Like the Dendroclim2002 software (Biondi and
Waikul 2004), the dcc function calculates multivariate estimates from a principal
component regression model in which tree-ring values are predicted from monthly climate
variables (Zang 2012). The significance of response function coefficients was tested using
the 95% percentile range method (Dixon 2001) from 1000 random bootstrapped samples.
We used the available mean monthly temperature and precipitation data available from the
Inukjuak Meteorological Station (1946 to 2009), but missing values constrained us to
discard the years 1952, 1979, 1994, 2001 and 2003 for temperature data and years 1952,
1979, 1994 to 2001, 2003, 2005 and 2007 for precipitation data.
To evaluate the potential effect of drought stress on dwarf birch radial growth during the
growth season (May to August), we used the Standardized Precipitation Evapotranspiration
Index (SPEI), a drought index commonly used in dendrochronological studies (Kharuk et al
2013, Martin-Benito et al 2013, Mendivelso et al 2014, Vicente-Serrano et al 2014; data
downloaded from the Global SPEI database: http://sac.csic.es/spei/database.html). Based on
the climate data of the Climatic Research Unit of the University of East Anglia, the SPEI is
calculated as the monthly difference between precipitation and potential evapotranspiration
(see Vicente-Serrano et al 2010 for more details). Values > 0 indicate months with positive
water balance (“wet months”) whereas values < 0 indicate months with negative water
balance (“dry months”). For the Boniface River area, a slight decreasing trend in the SPEI
was observed for the month of July since 1980 (-0.03 year-1). For this period, 20 years (out

83
of 30) were considered dry, and this trend was even more important when only considering
the last decade (7 dry years out of 10; Figure 4.1).
4.4.4 Axial elongation
A stem analysis (see Gamache and Payette 2004) was conducted on the two main branches
of the sampled dwarf birch individuals to infer the influence of climate on axial growth. To
do so, we sampled each branch at 25 cm intervals. Each section was then boiled, stained
and mounted on slides (see previous section) and aged under a dissecting binocular. As no
obvious age-growth trend was observed (Figure S4.2), we used raw measurements for
further analysis. Axial growth rates were interpolated by dividing the distance between two
samples (i.e. 25 cm) by the age difference between two consecutive sections. The annual
mean axial growth rate for each site was then calculated when at least 5 individual branches
were included.
Response functions were performed to evaluate the influence of temperature, precipitation
and drought stress on axial growth rate for each site, following the same procedure as the
one described in the previous section. However, because axial growth rates were
interpolated from the stem analysis, we used a more stringent significance level (0.01).
4.4.5 NDVI data
To determine if the greening observed in the study area is associated with dwarf birch
radial growth, we extracted 10-day composite NDVI data from the Canadian long term
satellite data record (LTDR) derived from 1-km resolution Advanced Very High Resolution
Radiometer (AVHRR) produced by the Canada Center for Remote Sensing (Earth
Observation Data Manager processing software; Latifovic et al 2005). We chose to use the
21-30 July period since the photosynthetic activity is believed to be at its maximum during
this period. We calculated the mean NDVI from the 140 pixels covering the study area, but
discarded pixels with values < 0 (water surfaces) and < 0.02 (cloud cover; Latifovic et al
2005). The period covered by the available data is 1986 to 2009. The contribution of dwarf
birch radial growth to the NDVI signal was evaluated through linear regressions, both for

84
the 1986-2009 period and for the 1986-2002 period; the latter being tested in order to
account for the radial growth decrease observed after 2002 on terraces and hilltops.
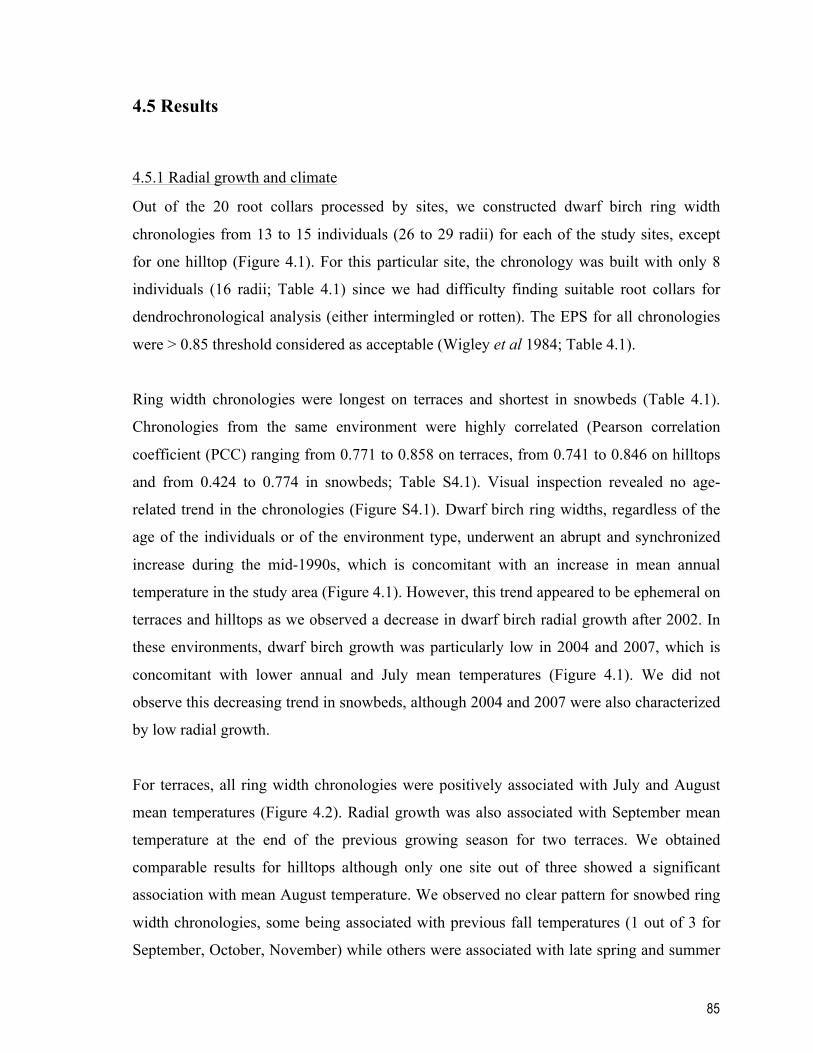
85
4.5 Results
4.5.1 Radial growth and climate
Out of the 20 root collars processed by sites, we constructed dwarf birch ring width
chronologies from 13 to 15 individuals (26 to 29 radii) for each of the study sites, except
for one hilltop (Figure 4.1). For this particular site, the chronology was built with only 8
individuals (16 radii; Table 4.1) since we had difficulty finding suitable root collars for
dendrochronological analysis (either intermingled or rotten). The EPS for all chronologies
were > 0.85 threshold considered as acceptable (Wigley et al 1984; Table 4.1).
Ring width chronologies were longest on terraces and shortest in snowbeds (Table 4.1).
Chronologies from the same environment were highly correlated (Pearson correlation
coefficient (PCC) ranging from 0.771 to 0.858 on terraces, from 0.741 to 0.846 on hilltops
and from 0.424 to 0.774 in snowbeds; Table S4.1). Visual inspection revealed no age-
related trend in the chronologies (Figure S4.1). Dwarf birch ring widths, regardless of the
age of the individuals or of the environment type, underwent an abrupt and synchronized
increase during the mid-1990s, which is concomitant with an increase in mean annual
temperature in the study area (Figure 4.1). However, this trend appeared to be ephemeral on
terraces and hilltops as we observed a decrease in dwarf birch radial growth after 2002. In
these environments, dwarf birch growth was particularly low in 2004 and 2007, which is
concomitant with lower annual and July mean temperatures (Figure 4.1). We did not
observe this decreasing trend in snowbeds, although 2004 and 2007 were also characterized
by low radial growth.
For terraces, all ring width chronologies were positively associated with July and August
mean temperatures (Figure 4.2). Radial growth was also associated with September mean
temperature at the end of the previous growing season for two terraces. We obtained
comparable results for hilltops although only one site out of three showed a significant
association with mean August temperature. We observed no clear pattern for snowbed ring
width chronologies, some being associated with previous fall temperatures (1 out of 3 for
September, October, November) while others were associated with late spring and summer

86
temperatures (1 out of 3 for May, June, July). Radial growth was constantly positively
associated with March precipitation, regardless of the environment (terraces: 2/3; hilltops:
2/3; snowbeds: 3/3). In some sites, radial growth was also positively associated with April
precipitation (H1, SB2, SB3) or negatively associated with July precipitation (T2, T3, H1,
SB2). Lastly, radial growth in all terraces and hilltops and in one snowbed was negatively
associated with the SPEI in July.
4.5.2 Axial growth and climate
Mean axial growth rate chronologies from the same environment were highly correlated
(PCC ranging from 0.870 to 0.969 on terraces, from 0.797 to 0.905 on hilltops and from
0.756 to 0.839 in snowbeds; Table S4.2). Visual inspection revealed no age-related trend in
the chronologies (Figure S4.2). Mean axial growth rate from terraces and hilltops followed
approximately the same trend, reaching a maximum value of 5 to 6 cm/year in the early
2000s, but declining afterwards (Figure 4.3a). Unlike terraces and hilltops, mean axial
growth curves in snowbeds showed more inter-site variation even if they all reached their
maximum values around the year 2000. Axial growth in SB1 reached a maximum value of
11.0 ± 6.3 cm/year whereas it reached a maximum value of 6.8 ± 4.9 cm/year in SB2 and
9.5 ± 4.1 cm/year in SB3. As observed for the radial growth, the declining trend detected on
terraces and hilltops in axial growth for the 2002-2009 period was not clearly identified in
snowbeds. Higher axial growth rates resulted in longer branches in snowbeds (148 to 175
cm compared to 92 to 114 cm on hilltops and 109 to 127 cm on terraces; Figure 4.3b). Even
if the SB2 cumulative axial growth chronology was older, its mean cumulative growth in
2009 was comparable to that of the other snowbeds. Terraces and hilltops cumulative axial
growth followed the same growth trend.
On terraces and hilltops, all mean axial growth rate chronologies were positively associated
with July temperatures, while two terraces were also positively associated with August
temperatures (Figure 4.4). Moreover, temperature during the previous month of December
also had a positive effect on axial growth in 2 terraces and 1 hilltop (Figure 4.4).
Associations between snowbed chronologies and temperatures were scarce and
heterogeneous, with only SB2 and SB3 being positively associated with July and previous

87
December temperatures, respectively. All chronologies (except H2 and T2) were associated
with March precipitation, whereas three out of nine chronologies were positively and
negatively associated with previous September (SB2, H1, H2) and July precipitation (SB2,
H3, T3), respectively. Overall, axial growth was not associated with the SPEI during the
growth season except on one hilltop and in one snowbed where it was negatively associated
with SPEI in July.
4.5.3 Dwarf birch radial growth and NDVI
NDVI data followed a significant increasing trend of 0.007 year-1 for the 1986-2009 period
(linear regression, F1,22 = 35.22, p < 0.01). One year had a particularly low value (2004;
Figure 4.5a), which is mirrored in the radial growth chronology (Figure 4.1). Regressions
between NDVI and dwarf birch radial growth on terraces and hilltops for the 1986-2009
period were all significant (Table 4.2). However, they were stronger when considering only
the period 1986-2002, i.e. before the radial growth decrease observed over the last seven
years of the chronologies (see R2 for the two periods in Table 4.2). For snowbeds, all
regressions were also significant. Unlike on terraces and hilltops, the association between
NDVI and dwarf birch radial growth were generally higher when using the 1986-2009
period (Table 4.2). Only the SB2 regression had a slightly higher regression coefficient
when using the 1986-2002 period (Table 4.2).

88
4.6 Discussion
As high latitude regions are facing rapid environmental change, the need for reliable
dendrochronological chronologies becomes necessary to better understand the mechanisms
that promote the performance of woody species. In this study, we present a detailed
dendroclimatological analysis of Betula glandulosa, a widely distributed yet little-studied
shrub species. We show that heterogeneity in local topography modulates the response of
this species to the regional climate. Moreover, we demonstrate that the greening observed
in the Boniface River area is correlated with dwarf birch growth.
4.6.1 Topographic factors influencing dwarf birch growth
Topography, mainly because of its influence on wind exposition and snow accumulation, is
one of the most important environmental factors for plant growth in subarctic regions
(Payette et al 1973). As hypothesized, our results show that the response of dwarf birch to
the regional climate is modulated by local topography. Differences in dwarf birch radial
and axial growth were mainly observed between terraces/hilltops and snowbeds. Terraces
and hilltops are well-drained sites characterized by coarse substrate with low pH, which
were previously found to promote dwarf birch growth and distribution (Ducruc and
Zarnovican 1976). On the other hand, snowbeds are characterized by important snow
accumulation, leading to shorter growing seasons but better frost protection and greater
water availability during the growing season.
The increase in radial growth observed on terraces and hilltops, and to a lesser extent in
snowbeds (Figure 4.1), corresponds to the significant warming observed in the region in the
1990s (Bhiry et al 2011). Warmer temperatures during the short growing season in high-
latitude regions are beneficial for both radial and axial growth (see Myers-Smith et al
2011), through direct (physiological activity) and indirect (increase soil microbial activity
and decomposition rates) effects, as long as other factors do not become limiting. Our
results corroborate many studies that have shown that shrub growth is positively correlated
with summer temperatures (Bär et al 2008, Liang and Eckstein 2009, Forbes et al 2010,
Hallinger et al 2010, Hantemirov et al 2011, Boudreau and Villeneuve-Simard 2012) and
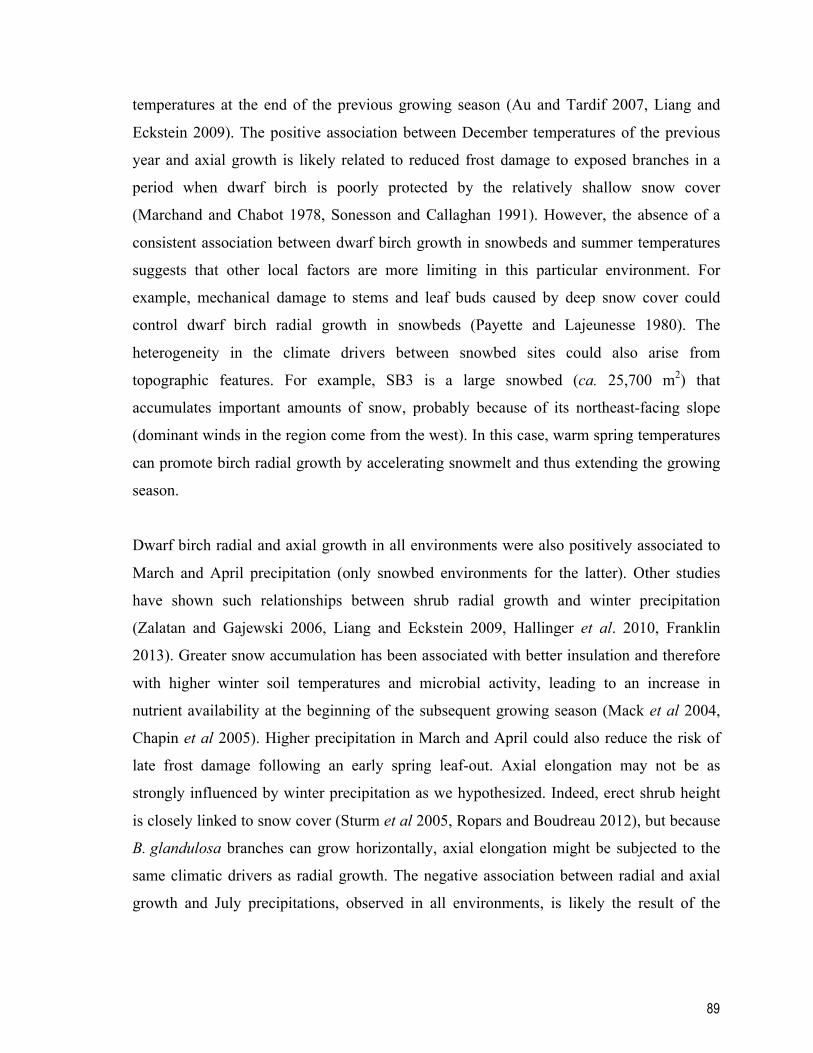
89
temperatures at the end of the previous growing season (Au and Tardif 2007, Liang and
Eckstein 2009). The positive association between December temperatures of the previous
year and axial growth is likely related to reduced frost damage to exposed branches in a
period when dwarf birch is poorly protected by the relatively shallow snow cover
(Marchand and Chabot 1978, Sonesson and Callaghan 1991). However, the absence of a
consistent association between dwarf birch growth in snowbeds and summer temperatures
suggests that other local factors are more limiting in this particular environment. For
example, mechanical damage to stems and leaf buds caused by deep snow cover could
control dwarf birch radial growth in snowbeds (Payette and Lajeunesse 1980). The
heterogeneity in the climate drivers between snowbed sites could also arise from
topographic features. For example, SB3 is a large snowbed (ca. 25,700 m2) that
accumulates important amounts of snow, probably because of its northeast-facing slope
(dominant winds in the region come from the west). In this case, warm spring temperatures
can promote birch radial growth by accelerating snowmelt and thus extending the growing
season.
Dwarf birch radial and axial growth in all environments were also positively associated to
March and April precipitation (only snowbed environments for the latter). Other studies
have shown such relationships between shrub radial growth and winter precipitation
(Zalatan and Gajewski 2006, Liang and Eckstein 2009, Hallinger et al. 2010, Franklin
2013). Greater snow accumulation has been associated with better insulation and therefore
with higher winter soil temperatures and microbial activity, leading to an increase in
nutrient availability at the beginning of the subsequent growing season (Mack et al 2004,
Chapin et al 2005). Higher precipitation in March and April could also reduce the risk of
late frost damage following an early spring leaf-out. Axial elongation may not be as
strongly influenced by winter precipitation as we hypothesized. Indeed, erect shrub height
is closely linked to snow cover (Sturm et al 2005, Ropars and Boudreau 2012), but because
B. glandulosa branches can grow horizontally, axial elongation might be subjected to the
same climatic drivers as radial growth. The negative association between radial and axial
growth and July precipitations, observed in all environments, is likely the result of the
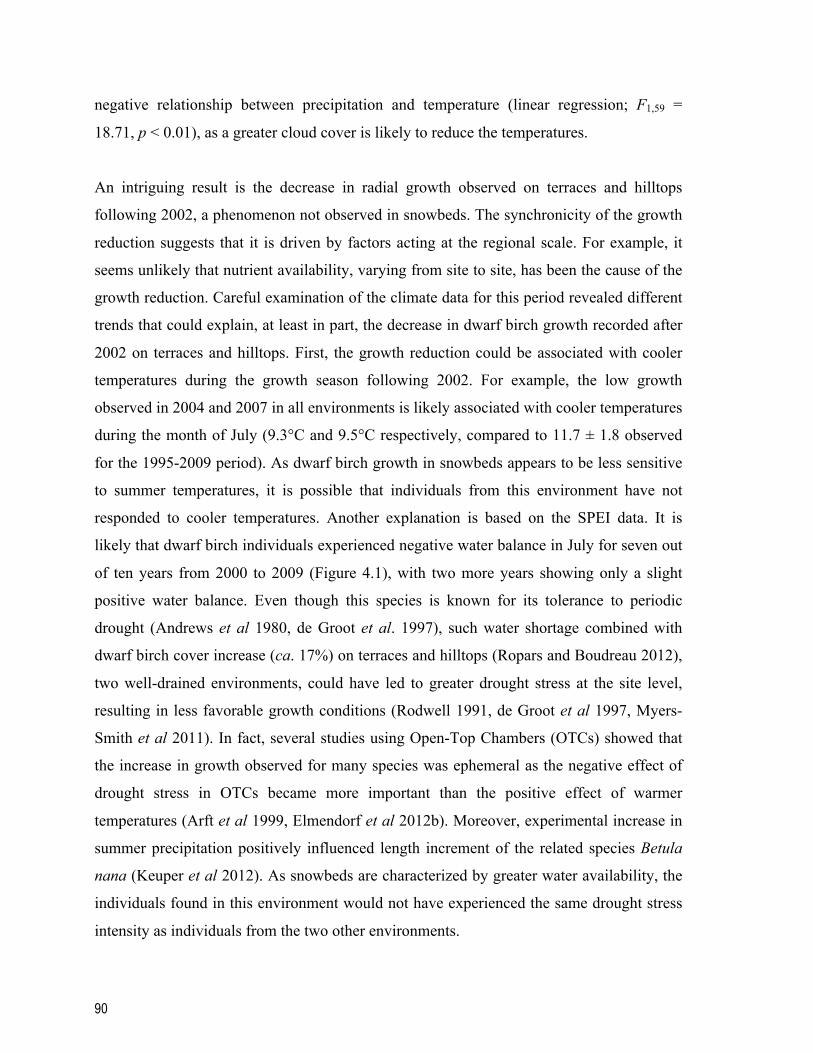
90
negative relationship between precipitation and temperature (linear regression; F1,59 =
18.71, p < 0.01), as a greater cloud cover is likely to reduce the temperatures.
An intriguing result is the decrease in radial growth observed on terraces and hilltops
following 2002, a phenomenon not observed in snowbeds. The synchronicity of the growth
reduction suggests that it is driven by factors acting at the regional scale. For example, it
seems unlikely that nutrient availability, varying from site to site, has been the cause of the
growth reduction. Careful examination of the climate data for this period revealed different
trends that could explain, at least in part, the decrease in dwarf birch growth recorded after
2002 on terraces and hilltops. First, the growth reduction could be associated with cooler
temperatures during the growth season following 2002. For example, the low growth
observed in 2004 and 2007 in all environments is likely associated with cooler temperatures
during the month of July (9.3°C and 9.5°C respectively, compared to 11.7 ± 1.8 observed
for the 1995-2009 period). As dwarf birch growth in snowbeds appears to be less sensitive
to summer temperatures, it is possible that individuals from this environment have not
responded to cooler temperatures. Another explanation is based on the SPEI data. It is
likely that dwarf birch individuals experienced negative water balance in July for seven out
of ten years from 2000 to 2009 (Figure 4.1), with two more years showing only a slight
positive water balance. Even though this species is known for its tolerance to periodic
drought (Andrews et al 1980, de Groot et al. 1997), such water shortage combined with
dwarf birch cover increase (ca. 17%) on terraces and hilltops (Ropars and Boudreau 2012),
two well-drained environments, could have led to greater drought stress at the site level,
resulting in less favorable growth conditions (Rodwell 1991, de Groot et al 1997, Myers-
Smith et al 2011). In fact, several studies using Open-Top Chambers (OTCs) showed that
the increase in growth observed for many species was ephemeral as the negative effect of
drought stress in OTCs became more important than the positive effect of warmer
temperatures (Arft et al 1999, Elmendorf et al 2012b). Moreover, experimental increase in
summer precipitation positively influenced length increment of the related species Betula
nana (Keuper et al 2012). As snowbeds are characterized by greater water availability, the
individuals found in this environment would not have experienced the same drought stress
intensity as individuals from the two other environments.
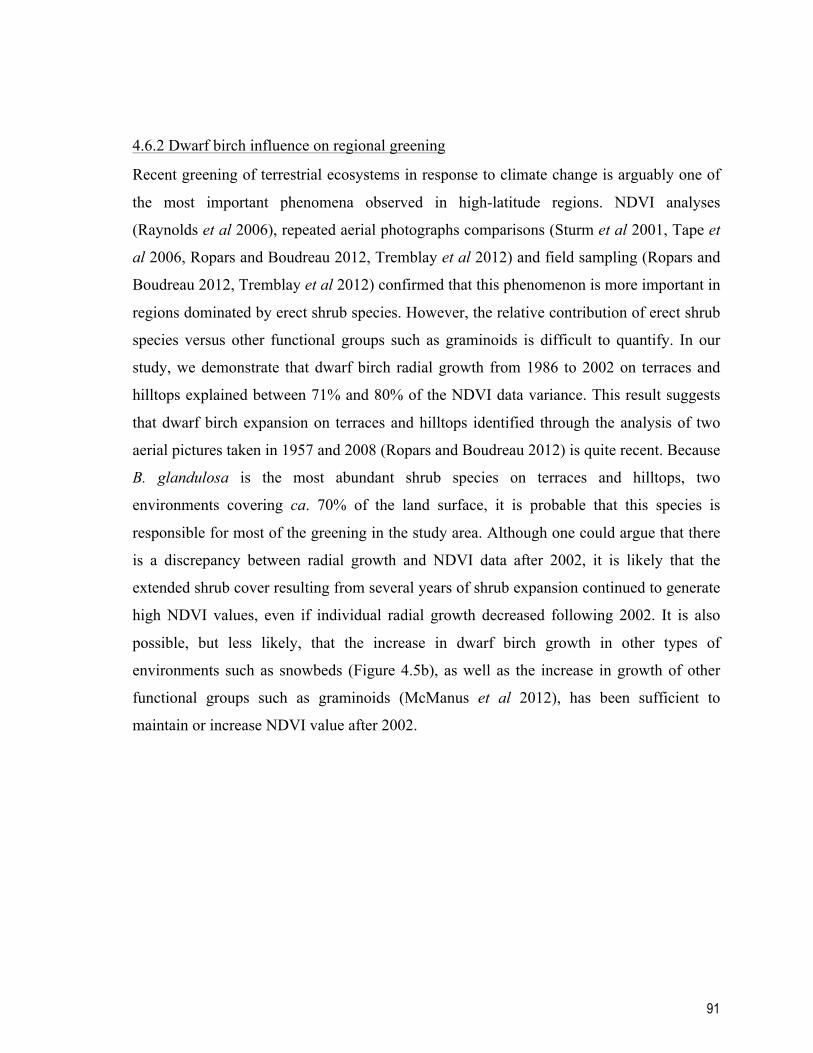
91
4.6.2 Dwarf birch influence on regional greening
Recent greening of terrestrial ecosystems in response to climate change is arguably one of
the most important phenomena observed in high-latitude regions. NDVI analyses
(Raynolds et al 2006), repeated aerial photographs comparisons (Sturm et al 2001, Tape et
al 2006, Ropars and Boudreau 2012, Tremblay et al 2012) and field sampling (Ropars and
Boudreau 2012, Tremblay et al 2012) confirmed that this phenomenon is more important in
regions dominated by erect shrub species. However, the relative contribution of erect shrub
species versus other functional groups such as graminoids is difficult to quantify. In our
study, we demonstrate that dwarf birch radial growth from 1986 to 2002 on terraces and
hilltops explained between 71% and 80% of the NDVI data variance. This result suggests
that dwarf birch expansion on terraces and hilltops identified through the analysis of two
aerial pictures taken in 1957 and 2008 (Ropars and Boudreau 2012) is quite recent. Because
B. glandulosa is the most abundant shrub species on terraces and hilltops, two
environments covering ca. 70% of the land surface, it is probable that this species is
responsible for most of the greening in the study area. Although one could argue that there
is a discrepancy between radial growth and NDVI data after 2002, it is likely that the
extended shrub cover resulting from several years of shrub expansion continued to generate
high NDVI values, even if individual radial growth decreased following 2002. It is also
possible, but less likely, that the increase in dwarf birch growth in other types of
environments such as snowbeds (Figure 4.5b), as well as the increase in growth of other
functional groups such as graminoids (McManus et al 2012), has been sufficient to
maintain or increase NDVI value after 2002.
92
4.7 Conclusion
This research demonstrates the dendrochronological potential of a structural shrub species
found in northern regions, Betula glandulosa. Our analysis revealed a rapid increase in B.
glandulosa growth in the second half of the 1990’s, especially on well-drained terrain.
Differences in topography across the landscape were found to promote differences in B.
glandulosa radial and axial growth. Our dendrochronological analysis revealed that
summer temperature play a major role in the growth of B. glandulosa situated on terraces
and hilltops whereas, the growth of individuals found in snowbeds is mostly promoted by
winter precipitation. Finally, we show that the greening of the region was mainly driven by
dwarf birch growth, and that shrub expansion in the region occurred after 1990. Further
studies are now needed to determine the drivers responsible for the decrease in B.
glandulosa radial growth after 2002. Moreover, future studies should aim at quantifying the
impact of this reduction in growth on the rate of shrub expansion in the region, as well as
characterizing its effects on factors such as thawing of permafrost, biodiversity and
ecosystem services.
93
4.8 Acknowledgments
This research was founded by Natural Sciences and Engineering Research Council of
Canada (NSERC), by the Fonds de Recherche Québec - Nature et Technologies (FRQNT),
by the Northern Scientific Training Program and by the Northern Research Chair on
Disturbance Ecology. The authors are grateful to Sandra Angers-Blondin and Caroline
Mercier for their help in the field as well as to Annie Girard, Mélody Dos Santos and
Mélissa Paradis for their lab assistance. The authors would also like to thank Steeve Côté
and Maël Le Corre for the NDVI data, Ann Delwaide for her valuable help with
dendrochronological analysis, Émilie Saulnier-Talbot and Christine Barnard for the
linguistic revision and the Centre d’études nordiques for its logistical support.

94
4.9 Tables
Table 4.1 Description of the nine Betula glandulosa ring width chronologies built for the different
study sites at Boniface River station, subarctic Québec, Canada.
Number of individuals
Period considered
Chronology length (yr)
EPS
T1 14 1931-2009 78 0.924T2 15 1936-2009 73 0.957T3 14 1928-2009 81 0.863
H1 15 1942-2009 67 0.941H2 8 1949-2009 60 0.894H3 14 1941-2009 68 0.949
SB1 13 1949-2009 60 0.967SB2 14 1956-2009 53 0.899SB3 14 1962-2009 47 0.95
Chronologies
Snowbeds
Hilltops
Terraces

95
Table 4.2 Relation between Normalized Difference Vegetation Index (NDVI) and Betula
glandulosa radial growth for the 1986-2009 and 1986-2002 periods at Boniface River station,
subarctic Québec, Canada. NDVI data were extracted from the Canadian long term satellite data
record (LTDR) derived from 1-km resolution Advanced Very High Resolution Radiometer
(AVHRR) produced by the Canada Center for Remote Sensing (Latifovic et al. 2005). We used the
NDVI data of the 21-30 July period. All regressions were significant at the 0.05 level.
Estimate F1, 22 p Adusted R2 Estimate F1, 15 pAdusted
R2
T1 0.06 9.58 0.005 0.30 0.07 61.76 <0.001 0.80T2 0.06 12.15 0.002 0.36 0.05 36.17 <0.001 0.71T3 0.04 7.22 0.014 0.25 0.05 44.99 <0.001 0.75
H1 0.05 9.39 0.006 0.30 0.06 39.40 <0.001 0.72H2 0.04 6.96 0.015 0.24 0.05 48.54 <0.001 0.76H3 0.06 14.91 0.001 0.40 0.06 44.57 <0.001 0.75
SB1 0.06 28.70 <0.001 0.57 0.06 9.67 0.007 0.39SB2 0.06 5.60 0.027 0.20 0.06 5.67 0.031 0.27SB3 0.08 28.56 <0.001 0.56 0.06 16.99 0.001 0.53
Snowbeds
Hilltops
Terraces
Segment 1986-2002
Relation between NDVI and Betula glandulosa radial growth
Chronologies Segment 1986-2009

96
4.10 Figures
Figure 4.1 (a) Mean annual temperature (black line) and mean July temperature (dotted line), (b)
total annual precipitation, (c) July Standardized Precipitation-Evapotranspiration Index (SPEI) and
Betula glandulosa ring width chronologies for (d) terraces, (e) hilltops and (f) snowbeds. All ring
width chronologies were standardized using a horizontal line fitted to the mean. Temperature and
-3
0
3
1925%9 % 1930% 1935% 1940%40% 1945% 1950% 1955%1955% 1960%60% 1965%19 % 1970% 1975%19 % 1980%80% 1985% 1990%0% 19 %19 % 000%000% 00 %
0
1
2
3
1925 1930 1935 1940 1945 1950 1955 1960 1965 1970 1975 1980 1985 1990 19 000 005 2010
Years
Rad
ial g
row
th
T1 T2 T3
0
1
2
3
1925% 1930% 1935% 1940% 1945% 1950% 1955% 1960% 1965% 1970% 1975% 1980% 1985% 1990% 199 % 000% 005% 2010%
Rad
ial g
row
th
H1 H2 H3
0
1
2
3
1925 1930 1935 1940 1945 1950 1955 1960 1965 1970 1975 1980 1985 1990 1995 2000 2005 2010
Rad
ial g
row
th
SB1 SB2 SB3
995%95% 20 %
995 20
95% 20 %
20 %
20
20 %
05%
5
5%
0
5
10
15
-12
-8
-4
0
4
1925 1930 1935 1940 1945 1950 1955 1960 1965 1970 1975 1980 1985 1990 199 95 00 200 2 05 200 5 2010 2
Tem
pera
ture
(°C
)
0
300
600
900
1925 92 92 3 1 3 1930 1935 1940 1945 1950 1955 1960 1965 1970 1975 1980 1985 1990 199 95 00 200 2005 20 5 2010
Prec
ipita
tion
(mm
) SP
EI -
July
Temperature (°C
)
(a)
(b)
(c)
(d)
(e)
(f)
97
precipitation data were recorded at the nearest weather station, the Inukjuak Meteorological Station
(130 km northwest of the study site, subarctic Québec, Canada). SPEI values were extracted for the
Boniface River area (0.5 degrees spatial resolution grid) from the Global SPEI database
(http://sac.csic.es/spei/database.html). Values under 0 indicate negative water balance (drought)
whereas values above 0 indicate positive water balance.

98
Figure 4.2 Response functions analysis showing the relationship between the different Betula
glandulosa ring width chronologies on (a) terraces, (b) hilltops and (c) snowbeds and the monthly
mean temperature (1946-2009 except 1952, 1979, 1994, 2001 and 2003), the monthly total
precipitation (1946-2009 except 1952, 1979, 1994-2001, 2003, 2005 and 2007) and the SPEI for the
growing season (1946-2009). Temperature and precipitation data were recorded at the Inukjuak
Meteorological Station (130 km northwest of the study site, subarctic Québec, Canada). SPEI
values were extracted for the Boniface River station (0.5 degrees spatial resolution grid) from the
Global SPEI database (http://sac.csic.es/spei/database.html). The three chronologies of a same type
of environment are presented in a unique graph. A p preceding a month stands for previous year.
All significant coefficients (0.05) are indicated by an asterisk.
-0.6
-0.3
0
0.3
0.6
pSep$p $pOct$pNov$N $pDec$p $D $ Jan$a $ Feb$F $e $ Mar$ Apr$p $r$ May$M $$ Jun$J $ Jul$ Aug$
-0.6
-0.3
0
0.3
0.6
May$M $M $M $M $M $M $a $y$ Jun$ u $u $u $l$ul$J $J $J $u $Ju $u $ Aug$A $u $g$
-0.6
-0.3
0
0.3
0.6
Res
pons
e co
effic
ient
-0.6
-0.3
0
0.3 0
0.6
1$1$ 2$ 3$3$ 4$4$ 5$5$ 6$6$ 7$ 8$ 9$9$ 10$ 1$1$1$1$1$1 $1 $1 $1 $1 $1 $ 12$12$
pSep
pOct
pNov
pDec
Jan
Feb
Mar
Apr
May
Jun Jul
Aug
*$*$ *$*$*$ *$
*$*$*$*$
*$
Temperature Precipitation
-0.6
-0.3
0
0.3
0.6
-0.6
-0.3
0
0.3
0.6
1$1$ 2$2$ 3$3$ 4$4$ 5$5$ 6$ 7$ 8$8$ 9$ 10$ 1$1$1$1$1$1 $1 $1 $1 $1 $1 $ 12$12$
*$*$ *$
*$*$*$
*$*$*$
*$*$
* *
-0.6
-0.3
0
0.3 0
0.6
1$1$1$1$1$ 2$2$ 3$3$ 4$4$ 5$ 6$6$ 7$ 8$ 9$9$ 10$ 1$1$1$1$1$1 $1 $1 $1 $1 $1 $ 12$12$
*$ *$ *$ *$ *$ *$ *$ *$*$ *$
*$
*$ C0.6$
C0.3$
0$
0.3$
0.6$
May M Ma y Jun J ul u u Ju J Ju Ju J J J u l Aug A u g
SPEI
* * *
*$
-0.6
-0.3
0
0.3
0.6
May$M $a $y$ Jun$u $ $$ul$u $u $l$J $u $J $J $u $l$ Aug$A $u $
*$*$
pSep
pOct
pNov
pDec
Jan
Feb
Mar
Apr
May
Jun Jul
Aug
May
Jun Jul
Aug
(a)
(b)
(c)

99
Figure 4.3 (a) Mean axial growth rates and (b) cumulative axial growth for each of the 9 sites
studied at Boniface River region, subarctic Québec, Canada. Axial growth rates were inferred from
the stem analysis for each branch. The annual mean axial growth rate was calculated when at least
five individual branches were included.
0
3
6
9
12
1960 1970 1980 1990 2000 2010
Hilltops
Years
Mea
n ax
ial g
row
th ra
te (c
m/y
ear)
H1 H2 H3
0
50
100
150
200
1960 1970 1980 1990 2000 2010
H1 H2 H3
Years
Cum
ulat
ive
axia
l gro
wth
(cm
)
(a) (b)
0
3
6
9
12
1960 1970 1980 1990 2000 2010
Terraces
T1 T2 T3
0
50
100
150
200
1960 1970 1980 1990 2000 2010
T1 T2 T3
0
3
6
9
12
1960 1970 1980 1990 2000 2010
Snowbeds
SB1 SB2 SB3
0
50
100
150
200
1960 1970 1980 1990 2000 2010
SB1 SB2 SB3

100
Figure 4.4 Response functions analysis showing the relationship between Betula glandulosa mean
axial growth rate on (a) terraces, (b) hilltops and (c) snowbeds and the monthly mean temperatures
(1946-2009 except 1952, 1979, 1994, 2001 and 2003), the monthly total precipitation (1946-2009
except 1952, 1979, 1994-2001, 2003, 2005 and 2007) and the SPEI for the growing season (1946-
2009). Temperature and precipitation data were recorded at the Inukjuak Meteorological Station
(130 km northwest of the study site, subarctic Québec, Canada). SPEI values were extracted for the
Boniface River station (0.5 degrees spatial resolution grid) from the Global SPEI database
(http://sac.csic.es/spei/database.html). The three chronologies of a same type of environment are
presented in a single graph. A p preceding a month stands for previous year. All significant
coefficients (0.01) are indicated by an asterisk.
-0.8
-0.4
0
0.4
0.8
1" 2" 3"3" 4"4" 5"5" 6" 7" 8" 9" 10"10" 11"1 "1 "11"11"1"1"1 " 12"12"
-0.8
-0.4
0
0.4
0.8
1" 2" 3"3" 4" 5"5" 6"6" 7" 8"8" 9"9" 10" 11" 12"
Res
pons
e co
effic
ient
*" *"*"*"*"*" *"
*"
*"
-0.8
-0.4
0
0.4
0.8
1" 2"2" 3"3" 4"4" 5"5" 6" 7" 8"8" 9" 10"10" 1"1"1"1"1"1 "1 "1 "1 "1 "1 " 12"12"
-0.8
-0.4
0
0.4
0.8
1" 2"2" 3"3" 4" 5"5" 6"6" 7" 8"8" 9"9" 10"10" 11" 12"
*"*" *"*"*" *"*" *"
*" *"
*"
-0.8
-0.4
0
0.4
0.8
1" 2" 3" 4" 5" 6"6" 7" 8" 9" 10"1 "1 " 1"1"1"1"1"1 "1 "1 "1 " 12"
-0.8
-0.4
0
0.4
0.8
1" 2" 3"3" 4" 5"5" 6"6" 7" 8" 9"9"9"9"9"9"9" 10" 11" 12"
*"*"
*"
*"
*"*"
*"
*"*"
*"
Temperature Precipitation SPEI
pSep
pOct
pNov
pDec
Jan
Feb
Mar
Apr
May
Jun Jul
Aug
pSep
pOct
pNov
pDec
Jan
Feb
Mar
Apr
May
Jun Jul
Aug
May
Jun Jul
Aug
(a)
(b)
(c)
-0.8"
-0.4"
0"
0.4"
0.8"
May"M "y" Jun"J """ """u""u "u """""Ju "u "Ju "J "u """ Aug"A "u "g"
-0.8"
-0.4"
0"
0.4"
0.8"
May"M "a "y" Jun"J "u "" Ju "J "J "u"""J "u""u""J "u """ Aug"A "u "g"
-0.8"
-0.4"
0"
0.4"
0.8"
ay"a "a "Ma "M "M "Ma "Ma "M "M "M "M "a "y" Jun"J "u "n" """u""u "u """""Ju "J "J "u "Ju "J "u """ ug""u "Au "A "Au "A "A "u "g"
*"
*"

101
Figure 4.5 (a) Normalized difference vegetation index (NDVI) trend and July mean temperature
(dotted line), (b) Betula glandulosa ring width chronologies (left: terrace, right: snowbed) and (c)
regressions between NDVI and ring width chronologies for both the 1986-2002 and 1986-2009
periods. Dark dots represent the values for the 1986-2002 period, whereas the white ones represent
the values for the remaining years (2003-2009).
7
9
11
13
15
0.2
0.3
0.4
0.5
1985 1990 1995 2000 2005 2010
July temperature (°C
)
ND
VI
Years
0
1
2
3
1985 1990 1995 2000 2005 2010
T3 ri
ng w
idth
inde
x
Years
0
1
2
3
1985 1990 1995 2000 2005 2010
SB1
ring
wid
th in
dex
Years
0.2
0.3
0.4
0.5
0 1 2 3
ND
VI
T3 ring width index
0.2 0 0
0.3
0.4
0.5
0 1 2 3
T3 ring width index
0.2
0.3
0.4
0.5
0 1 2 3
ND
VI
SB1 ring width index
0.2 0 0
0.3
0.4
0.5
0 1 2 3
SB1 ring width index
1986-2002 1986-2009 1986-2002 1986-2009
(a)
(b)
(c)
y = 0.054x + 0.241 R2 = 0.75
y = 0.043x + 0.28 R2 = 0.25
y = 0.058x + 0.279 R2 = 0.39
y = 0.059x + 0.278 R2 = 0.57
y = 0.007x - 12.696

102
4.11 Supporting information
Table S4.1 Pearson correlation coefficients amongst the nine Betula glandulosa ring width
chronologies from Boniface River station, subarctic Québec, Canada.
T1 T2 T3 H1 H2 H3 SB1 SB2 SB3T1 1 0.8576 0.771 0.7811 0.7768 0.6547 0.3715 0.5068 0.5855T2 1 0.8361 0.8632 0.8546 0.7408 0.4668 0.5504 0.7041T3 1 0.8527 0.8568 0.699 0.3641 0.4672 0.5643
H1 1 0.8463 0.7414 0.3155 0.6149 0.6587H2 1 0.7829 0.3542 0.5247 0.6329H3 1 0.4008 0.542 0.6552
SB1 1 0.4243 0.7736SB2 1 0.6988SB3 1
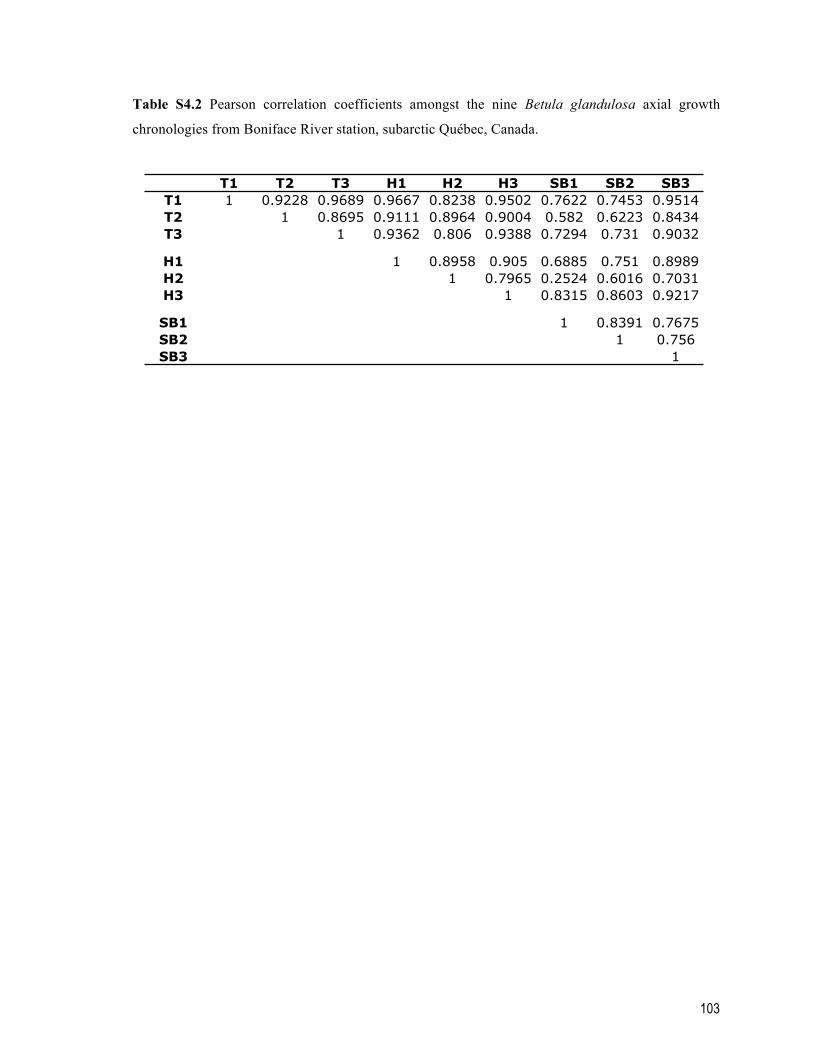
103
Table S4.2 Pearson correlation coefficients amongst the nine Betula glandulosa axial growth
chronologies from Boniface River station, subarctic Québec, Canada.
T1 T2 T3 H1 H2 H3 SB1 SB2 SB3T1 1 0.9228 0.9689 0.9667 0.8238 0.9502 0.7622 0.7453 0.9514T2 1 0.8695 0.9111 0.8964 0.9004 0.582 0.6223 0.8434T3 1 0.9362 0.806 0.9388 0.7294 0.731 0.9032
H1 1 0.8958 0.905 0.6885 0.751 0.8989H2 1 0.7965 0.2524 0.6016 0.7031H3 1 0.8315 0.8603 0.9217
SB1 1 0.8391 0.7675SB2 1 0.756SB3 1

104
0
1
2
3
4
5
6
7
1920 1930 1940 1950 1960 1970 1980 1990 2000 2010
0
1
2
3
4
5
1920 1930 1940 1950 1960 1970 1980 1990 2000 2010
0
1
2
3
4
5
1920 1930 1940 1950 1960 1970 1980 1990 2000 2010
Years
Rad
ial g
row
th (i
ndex
ed)
Rad
ial g
row
th (i
ndex
ed)
Rad
ial g
row
th (i
ndex
ed)
Nb
of in
divi
dual
s
Nb
of in
divi
dual
s
Nb
of in
divi
dual
s
Years
Years
Years
T1
T2
T3
0
5
10
15
1920 1935 1950 1965 1980 1995 2010
0
5
10
15
1920 1935 1950 1965 1980 1995 2010
0
5
10
15
1920 1935 1950 1965 1980 1995 2010
(a)

105
0
1
2
3
4
5
1940 1950 1960 1970 1980 1990 2000 2010
0
1
2
3
4
5
1940 1950 1960 1970 1980 1990 2000 2010
0
1
2
3
4
5
1940 1950 1960 1970 1980 1990 2000 2010
Years
Rad
ial g
row
th (i
ndex
ed)
Rad
ial g
row
th (i
ndex
ed)
Rad
ial g
row
th (i
ndex
ed)
Nb
of in
divi
dual
s N
b of
indi
vidu
als
Nb
of in
divi
dual
s
Years
Years
Years
H1
H2
H3
0
5
10
15
1940 1950 1960 1970 1980 1990 2000 2010
0
5
10
1940 1950 1960 1970 1980 1990 2000 2010
0
5
10
15
1940 1950 1960 1970 1980 1990 2000 2010
(b)

106
Figure S4.1 Age-growth relationships for each individual ring width chronologies per sites for (a)
terraces, (b) hilltops and (c) snowbeds studied in the Boniface River region, northern Québec,
Canada. Inset figures represent the age distribution of individual root collars included in the mean
chronology.
0
1
2
3
4
5
1940 1950 1960 1970 1980 1990 2000 2010
0 5
10 15
1940 1950 1960 1970 1980 1990 2000 2010
0
1
2
3
4
5
1940 1950 1960 1970 1980 1990 2000 2010
0
5
10
15
1940 1950 1960 1970 1980 1990 2000 2010
0
1
2
3
4
5
1940 1950 1960 1970 1980 1990 2000 2010
0
5
10
15
1940 1950 1960 1970 1980 1990 2000 2010
Years
Rad
ial g
row
th (i
ndex
ed)
Rad
ial g
row
th (i
ndex
ed)
Rad
ial g
row
th (i
ndex
ed)
Nb
of in
divi
dual
s
Nb
of in
divi
dual
s
Nb
of in
divi
dual
s
Years
Years
Years
SB1
SB2
SB3
(c)

107
0
50
100
150
200
1940 1950 1960 1970 1980 1990 2000 2010
0
50
100
150
200
1940 1950 1960 1970 1980 1990 2000 2010
0
50
100
150
200
1940 1950 1960 1970 1980 1990 2000 2010
Years
Stem
leng
th (c
m)
Stem
leng
th (c
m)
Stem
leng
th (c
m)
Nb
of in
divi
dual
s
Nb
of in
divi
dual
s
Nb
of in
divi
dual
s
Years
Years
Years
T1
T2
T3
(a)
0
20
40
1940 1950 1960 1970 1980 1990 2000 2010
0
20
40
1940 1950 1960 1970 1980 1990 2000 2010
0
20
40
1940 1950 1960 1970 1980 1990 2000 2010
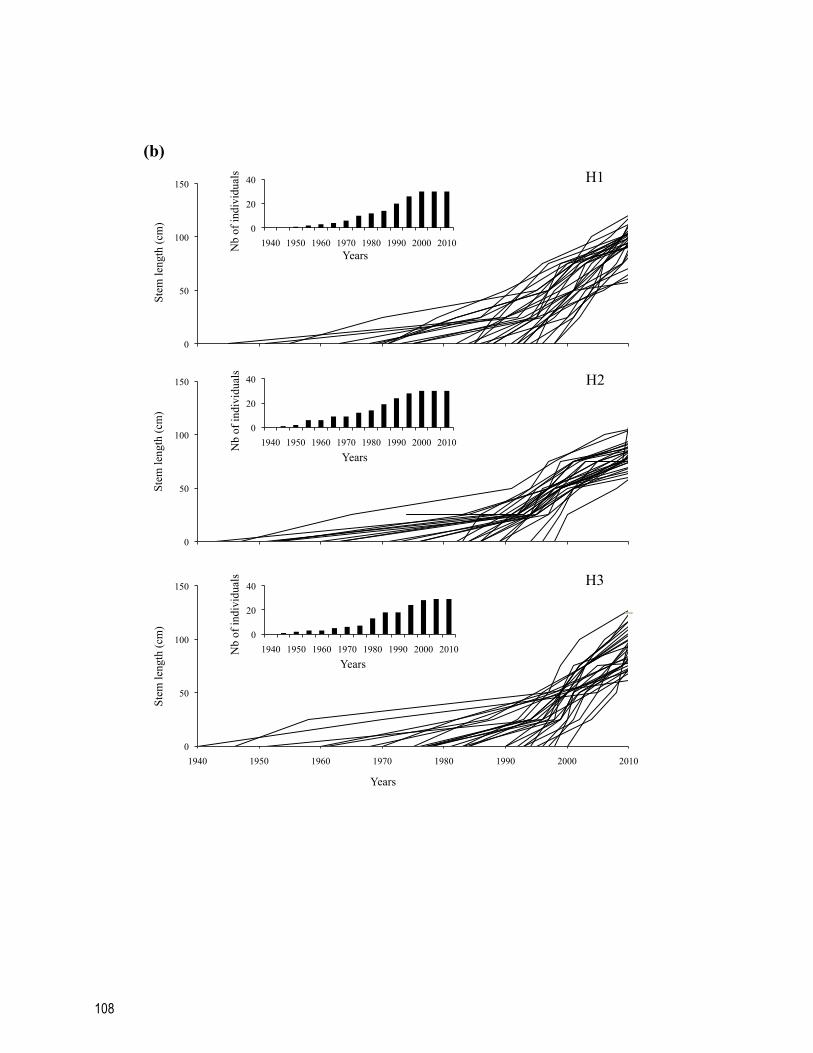
108
0
50
100
150
1940 1950 1960 1970 1980 1990 2000 2010
0
50
100
150
1940 1950 1960 1970 1980 1990 2000 2010
0
50
100
150
1940 1950 1960 1970 1980 1990 2000 2010
Years
Stem
leng
th (c
m)
Stem
leng
th (c
m)
Stem
leng
th (c
m)
Nb
of in
divi
dual
s N
b of
indi
vidu
als
Nb
of in
divi
dual
s
Years
Years
Years
H1
H2
H3
(b)
0
20
40
1940 1950 1960 1970 1980 1990 2000 2010
0
20
40
1940 1950 1960 1970 1980 1990 2000 2010
0
20
40
1940 1950 1960 1970 1980 1990 2000 2010
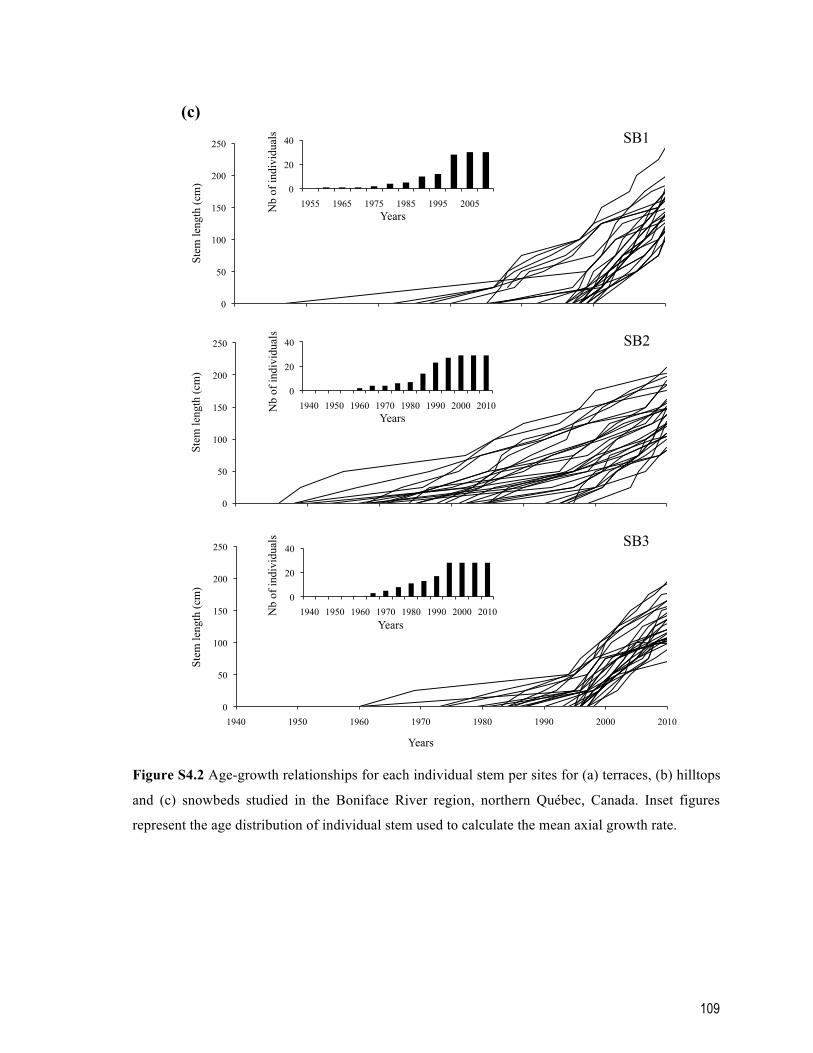
109
Figure S4.2 Age-growth relationships for each individual stem per sites for (a) terraces, (b) hilltops
and (c) snowbeds studied in the Boniface River region, northern Québec, Canada. Inset figures
represent the age distribution of individual stem used to calculate the mean axial growth rate.
0
50
100
150
200
250
1940 1950 1960 1970 1980 1990 2000 2010
0
50
100
150
200
250
1950 1960 1970 1980 1990 2000 2010
0
50
100
150
200
250
1950 1960 1970 1980 1990 2000 2010
Years
Stem
leng
th (c
m)
Stem
leng
th (c
m)
Stem
leng
th (c
m)
Nb
of in
divi
dual
s
Nb
of in
divi
dual
s
Nb
of in
divi
dual
s
Years
Years
Years
SB1
SB2
SB3
(c)
0
20
40
1955 1965 1975 1985 1995 2005
0
20
40
1940 1950 1960 1970 1980 1990 2000 2010
0
20
40
1940 1950 1960 1970 1980 1990 2000 2010

110

111
CHAPITRE 5 Conclusions générales

112
Les changements climatiques récents et leurs effets déjà observables à l’échelle planétaire
entrainent leur lot d’interrogations au sein de la communauté scientifique et de la
population en général. Les régions nordiques, où les conséquences de ces changements sont
parmi les plus importantes, sont au cœur des préoccupations environnementales. Dans ce
contexte, des efforts considérables ont été mis en branle pour mieux comprendre la
dynamique de ces environnements afin de mieux en prévoir les conséquences. Parmi les
grands changements en cours dans ces régions, la densification de la strate arbustive est
certainement l’un des plus importants.
Mon projet de thèse s’intègre dans cet effort de recherche en proposant une étude détaillée
de la dynamique récente de la strate arbustive dans une région où celle-ci était peu connue,
l’écotone forêt boréale-toundra du nord-ouest du Québec. De plus, mon projet s’intéresse
particulièrement à Betula glandulosa, une espèce arbustive largement répandue en
Amérique du Nord et qui a subit, au cours des dernières décennies, des changements
dramatiques. Dans cette conclusion générale, je détaillerai les principaux résultats obtenus
dans l’ensemble de mes travaux doctoraux, étayerai du même fait les principales
contributions de ma thèse et exposerai les différentes perspectives qui en découlent.
5.1 Retour sur les résultats, contributions et limites
5.1.1 Étendue de la densification de la strate arbustive à l’écotone forêt boréale-toundra
Le chapitre 2 m’a permis de confirmer que la région de la rivière Boniface a connu une
densification de sa strate arbustive au cours des dernières décennies. Cette densification a
été enregistrée dans la très grande majorité des sites étudiés (54 sur 59) et ce,
indépendamment du type d’environnement considéré. Bien qu’en moyenne la densification
de la strate arbustive soit de 17 %, l’étendue de celle-ci varie grandement d’un site à l’autre
(de -7,0 % à +47,4 % entre 1957 et 2008). Ces résultats suggèrent que la strate arbustive
réagit à un signal régional important, mais que cette réponse est modulée par des facteurs
113
locaux propres aux sites où croissent les espèces impliquées dans ce phénomène. Dans le
chapitre 2, j’ai également montré que B. glandulosa était la principale espèce responsable
de la densification de la strate arbustive dans la région d’étude. Connue pour sa grande
plasticité morphologique, cette espèce est aussi largement responsable de la densification
de la strate arbustive dans deux autres portions de l’écotone forêt boréale-toundra au
Québec subarctique (sud-est, région d’Umiujaq : Provencher-Nolet 2014 ; nord-est, région
de Kangiqsualujjuaq : Tremblay et al 2012).
L’un des points forts de l’analyse réalisée dans ce chapitre est la résolution spatiale avec
laquelle la densification de la strate arbustive a été quantifiée (mailles de 4 m x 4 m). En
plus de permettre une évaluation fine de ce phénomène, l’analyse utilisée nous suggère que
la densification de la strate arbustive dans la région d’étude avait un patron de répartition
fortement agrégée, ce qui laisse penser que la densification s’est principalement effectuée
grâce à une croissance clonale accrue. Sur le terrain cependant, plusieurs plantules de B.
glandulosa ont été observées, en particulier sur le sol minéral mis à nu par le passage répété
des caribous. Ceci suggère que le recrutement de nouveaux individus établis par graines
pourrait lui aussi avoir joué un rôle dans la densification de la strate arbustive ou qu’il y
jouera un rôle dans les décennies à venir. De plus, la présence importante de plantules de B.
glandulosa dans les milieux piétinés par le caribou porte à croire qu’une perturbation
préalable du milieu, que ce soit par les caribous ou par d’autres mécanismes (feu : Racine et
al 2004, Lantz et al 2010, inondations : Tape et al 2006, 2012), peut favoriser une réponse
positive des espèces arbustives face à l’adoucissement des températures de l’air.
Une autre force de l’analyse réalisée dans ce chapitre est la conjugaison de l’analyse de
photographies aériennes à une validation exhaustive sur le terrain. Dans ce type d’analyse,
une bonne connaissance du milieu ainsi qu’une validation sur le terrain sont nécessaires
afin de confirmer les résultats obtenus. D’aussi bonnes qualités soient elles, les
photographies utilisées lors de ce type d’analyse ne demeurent qu’un reflet de la réalité et
peuvent donc être trompeuses. Dans cette étude, l’important couvert du bouleau glanduleux
révélé par les relevés de végétation effectués sur le terrain suggérait déjà que cette espèce
était responsable de la densification de la strate arbustive. Mais c’est grâce à la
114
géolocalisation des transects le long desquels ces relevés ont été réalisés que nous avons pu
montrer hors de tout doute que le bouleau glanduleux en était bel et bien le principal
responsable. En effet, le pourcentage de recouvrement du bouleau glanduleux évalué sur le
terrain et celui évalué le long des mêmes transects sur l’image satellitaire de 2008 étaient
très similaires, confirmant ainsi que ce que j’identifiais comme des arbustes dans mon
analyse de photographies aériennes étaient bel et bien du bouleau glanduleux.
Il va sans dire cependant que l’analyse de photographies aériennes comporte certaines
limitations et que celles-ci doivent être connues afin d’apprécier à leur juste valeur les
résultats obtenus grâce à cette analyse. Premièrement, j’ai limité mon analyse de
photographies aériennes aux types d’environnements où la strate arbustive est facilement
distinguable des autres types de végétation. J’ai donc dû exclure les milieux humides ainsi
que les peuplements forestiers, car les arbustes pouvaient être confondus avec le couvert
muscinal ou arborescent. Bien que les milieux non forestiers et bien drainés représentent
une forte proportion du paysage dans la région d’étude (près de 70 % du milieu terrestre), il
n’en demeure pas moins que l’analyse réalisée ne donne aucune information sur la
dynamique récente de la strate arbustive dans les milieux exclus de l’analyse. De plus, ce
type d’analyse ne donne aucune information sur le moment où la densification de la strate
arbustive s’est produite, ni même sur ses causes. Grâce à différentes analyses réalisées dans
le cadre des deux autres chapitres, j’ai cependant réussi à répondre partiellement à ces
questions.
5.1.2 Causes et conséquences de la densification de la strate arbustive
Comme mentionné précédemment, l’étendue de la densification de la strate arbustive
montre une certaine hétérogénéité à l’échelle du paysage, et ce même à l’intérieur d’un
même type d’environnement. Bien que l’importance de la densification enregistrée dans la
région suggère un signal régional, cette hétérogénéité montre l’importance des
caractéristiques locales contrôlant la croissance des espèces en place.

115
Dans le chapitre 3, j’ai montré que les facteurs qui expliquent le plus vraisemblablement
l’hétérogénéité de la densification de la strate arbustive sont le temps écoulé depuis le
dernier feu (facteur historique), le type d’environnement, l’altitude et l’épaisseur du couvert
nival (facteurs topographiques). Parmi ces facteurs, le temps écoulé depuis le dernier feu
semble être le plus important. Plus celui-ci est long, plus la densification de la strate
arbustive est importante. Ceci suggère entre autres que des facteurs pédologiques reliés au
temps depuis la dernière grande perturbation pourraient être importants pour expliquer la
performance du bouleau glanduleux. Dans les milieux arctiques et subarctiques où tous les
processus biologiques sont ralentis par les conditions climatiques difficiles, une longue
période sans perturbation pourrait avoir favorisé un meilleur développement du sol,
permettant ainsi l’accumulation d’une plus grande quantité de nutriments. De ce fait, le
bouleau glanduleux aurait pu profiter de meilleures conditions de croissance sur les sites les
plus âgés lorsque les températures se sont réchauffées dans les années 1990. Le type
d’environnement, l’altitude ainsi que l’épaisseur du couvert nival pourraient eux aussi avoir
une influence sur les caractéristiques pédologiques d’un site, notamment en ce qui a trait à
la récurrence de phénomènes périglaciaires, à l’activité microbienne et à la rétention de
l’eau et des nutriments.
L’approche par sélection de modèles avec le critère d’information d’Akaike utilisée pour
déterminer les facteurs responsables de l’hétérogénéité de la densification de la strate
arbustive est une approche robuste permettant de comparer plusieurs hypothèses (modèles)
et d’en faire ressortir le ou les plus plausibles (c’est-à-dire ceux pour lesquels la perte
d’information est la moins grande). Il faut cependant garder en tête que cette approche nous
permet seulement de comparer les modèles que nous avons préalablement identifiés comme
étant écologiquement valables, considérant les variables que nous avons mesurées sur le
terrain. Dans mon analyse, le modèle le plus plausible pour expliquer l’hétérogénéité de la
densification de la strate arbustive (temps écoulé depuis le dernier feu + type
d’environnement + altitude + épaisseur du couvert nival) suggère que des facteurs reliés
aux conditions pédologiques du site pourraient être importants pour expliquer le
phénomène. Or, très peu de variables pédologiques ont été mesurées sur le terrain au
moment de la récolte des données, limitant ainsi notre compréhension du phénomène et

116
l’interprétation que l’on peut en faire. Afin de peaufiner cette analyse, il serait donc
pertinent d’inclure certaines variables reliées aux caractéristiques pédologiques déjà
identifiées comme influençant la réponse de certaines espèces impliquées dans la
densification arbustive (texture, humidité, densité, pH; Tape et al 2012).
Dans le chapitre 3, je me suis également intéressée aux conséquences de la densification du
bouleau glanduleux sur les autres espèces de la strate arbustive. À l’instar de plusieurs
autres études (Pajunen et al 2012), j’ai découvert qu’une augmentation du couvert de
bouleau glanduleux avait un effet négatif sur le couvert des autres taxons. Cependant,
aucune relation n’a été décelée entre la densification du bouleau glanduleux et différents
indicateurs de la richesse spécifique (nombre d’espèces et indice de diversité de Shannon).
Ce dernier résultat pourrait néanmoins qu’être simplement provisoire. En effet, le couvert
relativement faible de bouleau glanduleux (< 60 % sur les sites les plus densément peuplés)
pourrait ne pas être suffisant pour exclure complètement certaines espèces plus vulnérables
à une forte compétition interspécifique telles que les espèces arctiques alpines. Dans
l’éventualité où la densification de la strate arbustive se poursuivrait dans les prochaines
années, il est donc probable que les espèces arbustives les plus vulnérables puissent être
évincées de certains sites. Cependant, la diminution de croissance observée dans les
dernières années sur les terrasses et les sommets nous laisse croire que la densification
pourrait ne pas se poursuivre de façon aussi importante, à moins d’un fort recrutement ou
d’un autre changement dans la dynamique de ces écosystèmes.
5.1.3 La relation entre le climat et la croissance de Betula glandulosa
L’analyse de photographies aériennes réalisées dans le cadre du chapitre 2 nous a révélé
que la région de la rivière Boniface avait bel et bien connu une densification de sa strate
arbustive au cours des cinq dernières décennies. Bien que cette densification soit
généralement attribuée à l’augmentation récente des températures, cette analyse ne nous
permettait pas de vérifier cette relation causale. De surcroît, nous ne pouvions non plus
statuer sur la façon dont ce phénomène a évolué au cours des cinq décennies qui séparaient
les deux séries de photographies aériennes ; la strate arbustive s’était-elle densifiée peu à
117
peu ou avait-elle au contraire connu une augmentation importante durant une courte
période? L’analyse dendrochronologique exhaustive que j’ai réalisée dans le cadre du
quatrième chapitre m’a permis d’apporter des éléments de réponses à ces interrogations.
Dans un premier temps, j’ai pu constater une forte augmentation de la croissance radiale et
axiale du bouleau glanduleux entre les années 1990 et 2002, en particulier chez ceux
trouvés sur les milieux bien drainés (terrasses et sommets). Parce que ces derniers
représentent 70 % de la surface terrestre de la région à l’étude, ce résultat nous suggère que
la densification de la strate arbustive enregistrée entre 1957 et 2008 (analyse de
photographies aériennes) s’est produite en grande partie au cours des deux dernières
décennies. De plus, la baisse importante de croissance enregistrée après 2002 pourrait
signifier qu’un ralentissement dans la densification de la strate arbustive est en cours. Parmi
les facteurs potentiellement responsables de cette baisse, notons par exemple les
températures particulièrement froides du mois de juillet enregistrées en 2004 et 2007. De
plus, la récurrence des années pour lesquelles le mois de juillet a enregistré un déficit
d’humidité dans la dernière décennie (7 sur 10) pourrait expliquer le phénomène. La
densification récente du bouleau glanduleux combinée à ce manque à gagner en eau dans
des sites déjà bien drainés pourrait en effet entrainer une forte compétition intraspécifique
et ainsi limiter la croissance de chaque individu en place. Ceci expliquerait également
pourquoi la baisse de croissance chez le bouleau glanduleux n’est pas observée chez les
individus croissant dans les milieux humides (combes à neige).
Deuxièmement, j’ai déterminé que la croissance radiale et axiale des bouleaux glanduleux
présents dans les milieux bien drainés (terrasses et sommets) est fortement et positivement
associée aux températures estivales. Ce résultat suggère que la densification de la strate
arbustive observée dans la région d’étude est bel et bien associée au réchauffement
climatique récent, comme c’est le cas pour plusieurs autres espèces arbustives dans
différentes régions nordiques (voir Myers-Smith et al 2012 ainsi que les références qui y
sont citées). Cependant, il est important de mentionner que cette relation croissance-climat
n’est pas la même à l’échelle du paysage. En effet, la croissance radiale et axiale des
individus présents dans les combes à neige est plutôt associée aux précipitations hivernales,

118
suggérant ainsi que les températures durant la saison de croissance peuvent ne pas être le
facteur le plus limitant pour la croissance du bouleau glanduleux dans certains types
d’environnement.
Pour terminer, j’ai pu montrer que l’augmentation de l’activité photosynthétique (NDVI)
enregistrée dans la région de la rivière Boniface était fortement associée à la croissance du
bouleau glanduleux, et ce particulièrement pour la période 1986-2002. Ceci suggère que
cette espèce est la principale responsable de l’augmentation du NDVI dans la région, et
constitue de ce fait un des points forts de mon analyse. En effet, il est souvent difficile
d’estimer la contribution relative de chacun des groupes taxonomiques aux fluctuations du
NDVI. En comparant directement la croissance radiale du bouleau glanduleux aux valeurs
de NDVI, j’ai pu montrer que celle-ci expliquait jusqu’à 80 % de la variance de cet indice
d’activité photosynthétique. Cependant, il est également possible que chacun des groupes
taxonomiques répondent de la même façon à la hausse des températures. Bien que ceci se
traduirait par une relation positive entre la croissance et le NDVI dans tous les cas, il est
peu probable qu’un autre groupe taxonomique ait contribué autant que le bouleau
glanduleux à l’augmentation du NDVI dans la région d’étude. En effet, cette espèce est de
loin la plus abondante dans bon nombre de types d’environnement. Dans un autre ordre
d’idées, la chute de croissance observée chez le bouleau glanduleux après 2002 ne semble
pas s’être traduite pour une chute du NDVI ; cette apparente contradiction pourrait être
expliquée par le fait que l’imposant appareil photosynthétique mis en place lors de la
densification du bouleau glanduleux pourrait continuer à produire des valeurs élevées de
NDVI, et ce malgré une chute de croissance individuelle.
Un autre point fort de l’analyse effectuée dans ce chapitre vient de l’imposant dispositif mis
en place. En effet, la croissance radiale et axiale ont toutes deux été évaluées, et ce dans
différents types d’environnement. Ceci m’a donc permis de tirer des conclusions sur
l’ensemble de la croissance du bouleau glanduleux, en plus d’en apprécier les différences à
l’échelle du paysage. Il va sans dire que dans le contexte actuel, il devient primordial
d’avoir une bonne connaissance de la dynamique d’un acteur aussi important que la strate
arbustive dans son ensemble et du bouleau glanduleux en particulier dans le Québec
119
nordique. Comprendre cette dynamique implique à la fois de connaître les patrons
généraux, mais aussi d’en faire ressortir les différences locales. En évaluant la croissance
du bouleau glanduleux dans trois types d’environnement différents, j’ai donc pu contribuer
à peaufiner notre compréhension des patrons locaux de la dynamique de la strate arbustive.
Il demeure toutefois certains milieux où l’échantillonnage est difficile et donc pour lesquels
nous n’avons aucune information concernant la dynamique de la strate arbustive. Bien que
le bouleau glanduleux puisse y être présent en forte densité, les peuplements forestiers
demeurent des milieux pour lesquels il est souvent ardu de trouver le collet de l’arbuste,
c’est-à-dire sa partie la plus vieille. Dans certains cas, la base des plus grosses branches
peut être récoltée afin d’effectuer des analyses dendrochronologiques, mais de plus en plus
d’indices me portent à croire que ce type d’échantillonnage ne permet pas d’obtenir des
résultats qui reflètent la réponse de l’ensemble de l’individu.
5.2 Perspectives
L’intérêt pour la strate arbustive dans le contexte des changements climatiques récents est
grandissant depuis le début des années 2000 et souligne l’importance de celle-ci dans la
dynamique des écosystèmes nordiques. J’ai, à travers cette thèse, mis l’épaule à la roue afin
de peaufiner notre compréhension de la strate arbustive, en particulier celle d’une espèce
largement répandue en Amérique du Nord mais encore peu étudiée, Betula glandulosa.
Alors que ma thèse a permis, entre autres, de quantifier la densification de la strate
arbustive dans la région de la rivière Boniface ainsi que d’en identifier certaines causes et
conséquences, plusieurs questions restent en suspens ou ont émergé des résultats que j’ai
obtenus. J’étayerai donc dans cette dernière section les différentes avenues possibles dans
la poursuite de notre connaissance de la dynamique récente de la strate arbustive.
Comme je l’ai mentionné plus haut, l’analyse de photographies aériennes réalisée dans le
cadre du deuxième chapitre m’a permis de quantifier la densification du couvert arbustif,
mais également de constater que celle-ci s’était faite de façon agrégée. Ce résultat suggérait

120
que la densification s’était en grande partie effectuée grâce à une croissance clonale accrue,
mais en aucun cas ne le confirmait. La contribution relative de la croissance clonale et du
recrutement de nouveaux individus n’est donc pas connue pour la région à l’étude. Afin de
mieux prédire les changements auxquels fera face la région de la rivière Boniface, il serait
pertinent de connaître l’apport relatif de ces deux modes de recrutement. Des études
génétiques de peuplements arbustifs en expansion pourraient entre autres être menées pour
répondre à ces interrogations (voir Douhovnikoff et al 2010). De surcroît, nous connaissons
mal la biologie de la reproduction du bouleau glanduleux (mais voir Weis et Hermanutz
1988) ; la germination des graines est-elle limitée par la température ? Quelles conditions
édaphiques favorisent la production, la viabilité et la germination des graines de cette
espèce ? Peaufiner nos connaissances sur cette sphère de la dynamique du bouleau
glanduleux contribuerait à notre compréhension globale du phénomène.
Dans cette thèse, je me suis aussi intéressée à l’influence qu’un couvert plus important de
bouleau glanduleux pouvait avoir sur les espèces arbustives non impliquées dans la
densification récemment observée dans la région de la rivière Boniface. Bien que j’aie pu
constater l’influence négative du bouleau glanduleux sur le couvert occupé par les autres
espèces arbustives, il n’en demeure pas moins que nous avons peu d’information sur
l’influence de la densification de la strate arbustive sur les autres strates présentes dans la
région. Parmi ces dernières, notons par exemple la strate arborescente qui pourrait être
particulièrement affectée par ce phénomène. En effet, la limite des arbres dans la région ne
s’est pas déplacée vers le nord en réponse à l’adoucissement récent des températures. Cette
absence de réponse est souvent attribuée au temps nécessaire à la production de graines
viables de la principale espèce arborescente de la région (Picea mariana ; Lescop-Sinclair
et Payette 1995, MacDonald et al 1998), mais pourrait également être reliée à la diminution
du nombre et de l’étendue de sites propices à la germination des graines de cette espèce (sol
minéral ; Dufour-Tremblay et Boudreau 2011). En formant un couvert dense où une grande
quantité de litière s’accumule année après année, le bouleau glanduleux pourrait en effet
limiter le recrutement nécessaire à une avancée nordique de la limite des arbres, mais
également favoriser une plus grande récurrence des feux de forêts. Des études
121
expérimentales de germination sous différentes densités de bouleau glanduleux pourraient
entre autres nous éclairer sur le rôle potentiel du bouleau glanduleux sur la strate
arborescente et ainsi nous permettre de mieux prédire les changements à venir à l’écotone
forêt boréale-toundra.
Il va sans dire que la densification de la strate arbustive entraine son lot de conséquences
dans les milieux où elle se produit, tant sur les conditions biotiques qu’abiotiques. Une plus
grande densité d’arbustes érigés peut modifier les propriétés physiques de la neige (Liston
et al 2002, Pomeroy et al 2006, Marsh et al 2010) et de ce fait favoriser une plus grande
activité microbienne (Sturm et al 2005) ; elle peut également réduire la profondeur de dégel
du pergélisol en diminuant la quantité d’intrants solaires atteignant le sol en été (Blok et al
2011). Par contre, ces conséquences sur l’environnement biotique et abiotique pourraient
être modulées par l’architecture de croissance des espèces arbustives impliquées dans le
phénomène de densification. Plusieurs espèces arbustives préalablement identifiées comme
responsables étant à l’origine d’une densification récente de la strate arbustive à l’échelle
circumpolaire, dont le bouleau glanduleux, sont connues pour leur grande plasticité
morphologique (Bret-Harte et al 2001). Or, une croissance accrue en hauteur de ces espèces
n’aura pas les mêmes conséquences qu’une croissance plutôt horizontale, notamment sur
l’accumulation de neige. Une compréhension plus fine des stratégies de croissances
adoptées par les arbustes ainsi que les conditions (édaphiques, topographies) expliquant
l’adoption de l’une ou l’autre de ces stratégies me semblent essentielles afin de mieux
prédire les conséquences d’une densification de la strate arbustive dans les régions
nordiques.
Pour conclure, l’apport de ma thèse dans la compréhension de la dynamique de la strate
arbustive est considérable, mais reste somme toute localisé à la région de la rivière
Boniface. Il serait intéressant et primordial pour notre compréhension globale d’étendre
cette étude à l’ensemble du Québec nordique dans un premier temps. Une étude récente de
McManus et collaborateurs (2012) a révélé que l’activité photosynthétique (NDVI) avait

122
augmenté de façon particulièrement importante à l’écotone forêt boréale-toundra par
rapport aux autres régions du Québec et que cette augmentation était hétérogène. Ce
résultat soulève plusieurs questionnements, notamment en ce qui a trait à l’uniformité des
causes de la densification de la strate arbustive. Nous savons déjà que le bouleau
glanduleux est le principal responsable de ce phénomène dans différentes portions de
l’écotone forêt boréale-toundra (Tremblay et al 2012, Provencher-Nolet 2014), mais est-il
contrôlé par les mêmes facteurs climatiques qu’il l’est dans la région de la rivière
Boniface ? De plus, l’augmentation moins importante de l’activité photosynthétique dans
les autres régions est-elle expliquée par le fait que d’autres facteurs sont plus limitants que
la température pour la croissance du bouleau glanduleux ou est-ce simplement le résultat
d’un très faible couvert de la strate arbustive ? Un portrait général de la dynamique de la
strate arbustive du Québec nordique pourrait de ce fait nous permettre de mieux
comprendre l’influence d’un gradient latitudinal sur la croissance du bouleau glanduleux.
Je ne peux terminer cette thèse autrement qu’en spécifiant que la beauté de la recherche et
ce qui la rend si intéressante réside dans le fait qu’elle soulève souvent plus de
questionnements qu’elle n’y répond.
123
Bibliographie
ACIA (2005) Arctic climate impact assessment. Cambridge University Press, Cambridge,
UK. p. 1042.
Allard M, Séguin MK (1987) Le pergélisol au Québec nordique : bilan et perspectives.
Géographie physique et Quaternaire 41: 141-152.
Anderson PM, Brubaker LB (1994) Vegetation history of northcentral Alaska: a mapped
summary of late-quaternary pollen data. Quaternary Science Reviews 20: 194-214.
Andrews JT, Mode WN, Webber PJ, Miller GH, Jacobs JD (1980) Report on the
distribution of dwarf birches and present pollen rain, Baffin Island, N.W.T., Canada.
Arctic 33: 50-58.
Anschlag K, Broll G, Holtmeier FK (2008) Mountain birch seedlings in the treeline
ecotone, subarctic Findland: variation in above- and below-ground growth depending
on microtopography. Arctic, Antarctic and Alpine Research 40: 609-616.
Anthelme F, Villaret JC, Brun JJ (2007) Shrub encroachment in the Alps gives rise to the
convergence of subalpine communities on a regional scale. Journal of Vegetation
Science 18: 355-362.
Arft AM, Walker MD, Gurevitch J, Alatalo JM, Bret-Harte MS, Dale M, Diemer M,
Gugerli F, Henry GHR, Jones MH, Hollister RD, Jónsdóttir IS, Laine K, Lévesque E,
Marion GM, Molau U, Molgaard P, Nordenhäll U, Raszhivin V, Robinson CH, Starr
G, Stenström A, Totland O, Turner PL, Walker LJ, Webber PJ, Welker JM, Wookey
PA (1999) Responses of tundra plants to experimental warming: meta-analysis of the
international tundra experiment. Ecological Monographs 69: 491-511.
Arseneault D, Payette S (1992) A postfire shift from lichen spruce to lichen tundra
vegetation at tree line. Ecology 73: 1067-1081.
Arseneault D, Payette S (1997a) Landscape change following deforestation at the Arctic
tree line in Quebec, Canada. Ecology 78: 693-706.
Arseneault D, Payette S (1997b) Reconstruction of millennial forest dynamics from tree
remains in a subarctic tree line peatland. Ecology 78: 1873-1883.
Arseneault D, Sirois L (2004) The millennial dynamics of a boreal forest stand from buried
trees. Journal of Ecology 92: 490-504.

124
Au R, Tardif JC (2007) Allometric relationship and dendroecology of the dwarf shrub
Dryas integrifolia near Churchill, subarctic Manitoba. Canadian Journal of Botany
85: 585-597.
Baez S, Collins SL (2008) Shrub invasion decreases diversity and alters community
stability in northern Chihuahuan Desert plant communities. Plos One 3: e2332.
Bär A, Pape R, Brauning A, Loffler J (2008) Growth-ring variations of dwarf shrubs reflect
regional climate signals in alpine environments rather than topoclimatic differences
Journal of Biogeography 35: 625-636.
Beck PSA, Goetz SJ (2011) Satellite observations of high northern latitude vegetation
productivity changes between 1982 and 2008: ecological variability and regional
differences. Environmental Research Letters 6: 045501.
Berg EE, McDonnell-Hillman K, Dial R, Deruwe A (2009) Recent woody invasion of
wetlands on the Kenai Peninsula Lowlands, south-central Alaska: a major regime
shift after 18 000 years of wet Sphagnum-sedge peat recruitment. Canadian Journal
of Forestry Research 39: 2033-2046.
Bhiry N, Delwaide A, Allard M, Bégin Y, Filion L, Lavoie M, Nozais C, Payette S, Pienitz
R, Saulnier-Talbot E, Vincent W (2011) Environmental change in the Great Whale
River region: five decades of multidisciplinary research by Centre d’études nordiques
(CEN). Ecoscience 18: 182-203.
Biondi F, Waikul K (2004) DENDROCLIM2002: A C++ program for statistical calibration
of climate signals in tree-ring chronologies. Computers & Geosciences 30: 303-311.
Bliss LC, Matveyeva NV (1992) Circumpolar Arctic vegetation. Pages 59-89 in FS Chapin
III (ed). Arctic ecosystems in a changing climate: an ecophysiological perspective.
Academic Press, San Diego, CA, USA.
Blok D, Heijmans MMPD, Schaepman-Strub G, Kononov AV, Maximov TC, Berendse F
(2010) Shrub expansion may reduce summer permafrost thaw in Siberian tundra.
Global Change Biology 16: 1296-1305.
Blok D, Sass-Klaassen U, Schaepman-Strub G, Heijmans MMPD, Sauren P, Berendse F
(2011) What are the main climate drivers for shrub growth in Northeastern Siberian
tundra? Biogeosciences 8: 1169–1179.
Bonan GB, Pollard D, Thompson SL (1992) Effects of boreal forest vegetation on global

125
climate. Nature 359: 716-718.
Boudreau S, Payette S (2004) Caribou-induced changes in species dominance of lichen
woodlands: an analysis of plant remains. American Journal of Botany 91: 422-429.
Boudreau S, Villeneuve-Simard MP (2012) Dendrochronological evidence of shrub growth
suppression by trees in a subarctic lichen woodland. Botany 90: 151–156.
Boulanger-Lapointe N, Lévesque E, Boudreau S, Henre GHR, Schmidt NM (2014)
Population structure and dynamics of Arctic willow (Salix arctica) in the High Arctic.
Journal of Biogeography 41: 1967-1978.
Brathen KA, Oksanen J (2001) Reindeer reduce biomass of preferred plant species. Journal
of Vegetation Science 12: 473-480.
Bret-Harte MS, Shaver GR, Zoerner JP, Johnstone JF, Wagner JL, Chavez AS, Gunkelman
RF, Lippert SC, Laundre JA (2001) Developmental plasticity allows Betula nana to
dominate tundra subjected to an altered environment. Ecology 82: 18-32.
Bret-Harte MS, Shaver GR, Chapin III FS (2002) Primary and secondary stem growth in
arctic shrubs: implications for community response to environmental change. Journal
of Ecology 90: 251-267.
Buckeridge KM, Zufelt E, Chu HY, Grogan P (2010) Soil nitrogen cycling rates in low
arctic shrub tundra are enhanced by litter feedbacks. Plant and Soil 330: 407-21.
Burnham KP, Anderson DR (2002) Model selection and multimodel inference: a practical
information-theoric approach, 2nd edition. Springer, New York, USA.
Callaghan TV (1973) A comparison of the growth of tundra plant species at several widely
spaced sites. Institute of Terrestrial Ecology, Merlewood Research and Development
Paper, No. 53.
Camill P, Clark JS (1998) Long-term perspectives on lagged ecosystem responses to
climate change: permafrost in boreal peatlands and the grassland/woodland boundary.
Ecosystems 3: 534-544.
Cannone N, Sgorbati S, Guglielmin M (2007) Unexpected impacts of climate change on
alpine vegetation. Frontiers in Ecology and the Environment 5: 360-364.
Chapin FS III, Shaver GR (1985) Individualistic growth response of tundra plant species to
environmental manipulations in the field. Ecology 66: 564-576.
Chapin FS III, Shaver GR, Giblin AE, Nadelhoffer KJ, Laundre JA (1995) Responses of

126
arctic tundra to experimental and observed changes in climate. Ecology 76: 694–711.
Chapin FS III, Shaver GR (1996) Physiological and growth responses of arctic plants to a
field experiment simulating climatic change. Ecology 77: 822-840.
Chapin FS III, Starfield AM (1997) Time lags and novel ecosystems in response to
transient climatic change in arctic Alaska. Climatic Change 35: 449-461.
Chapin FS III, McGuire AD, Randerson J, Pielke R, Baldocchi D, Hobbie SE, Roulet N,
Eugster W, Kasischke E, Rastetter EB, Zimov SA, Running SW (2000) Arctic and
boreal ecosystems of western North America as components of the climate system.
Global Change Biology 6: 211-223.
Chapin FS III , Sturm M, Serreze MC, McFadden JP, Key JR, Lloyd AH, McGuire AD,
Rupp TS, Lynch AH, Schimel JP, Beringer J, Chapman WL, Epstein HE, Euskirchen
ES, Hinzman LD, Jia G, Ping CL, Tape KD, Thompson CDC, Walker DA, Welker
JM (2005) Role of land-surface changes in Arctic summer warming. Science 310:
657-660.
Chouinard C, Fortier R, Mareschal JC (2007) Recent climate variations in the subarctic
inferred from three borehole temperature profiles in northern Québec, Canada. Earth
and Planetary Science Letters 263: 355-369.
Couturier S, Jean D, Otto R, Rivard S (2004) Démographie des troupeaux de caribous
migrateurs-toundriques (Rangifer tarandus) au Nord-du-Québec et au Labrador.
Ministère des Ressources naturelles, de la Faune et des Parcs, Direction de
l’aménagement de la faune du Nord-du-Québec, Direction de la recherche sur la
faune, Québec, Canada.
Cornelissen JHC, Callaghan TV, Alatalo JM, Michelsen A, Graglia E, Hartley AE, Hik DS,
Hobbie SE, Press MC, Robinson CH, Henry GHR, Shaver GR, Phoenix GK, Jones
DG, Jonasson S, Chapin III FS, Molau U, Neill C, Lee JA, Melillo JM,
Sveinbjornsson B, Aerts R (2001) Global change and arctic ecosystems: is lichen
decline a function of increases in vascular plant biomass? Journal of Ecology 89:
984-994.
Cornelissen JHC, van Bodegom PM, Aerts R, Callaghan TV, van Logtestjin RSP, Alatalo
J, Chapin III FS, Gerdol R, Gudmundsson J, Gwynn-Jones D, Hartley AE, Hik DS,
Hofgaard A, Jónsdóttir IS, Karlsson S, Klein JA, Laundre J, Magnusson B, Michelsen

127
A, Molau U, Onipchenko VG, Quested HM, Sandvik SM, Schmidt IK, Shaver GR,
Solheim B, Soudzilovskaia NA, Stenstrom A, Tolvanen A, Totland O, Wada N,
Welker JM, Zhao XQ (2007) Global negative vegetation feedback to climate
warming responses of leaf litter decomposition rates in cold biomes. Ecology Letters
10: 619-627.
Cranston BH, Hermanutz L (2013) Seed-seedling in conifers as a result of plant-plant
interactions at the forest-tundra ecotone. Plant Ecology & Diversity 6: 319-327.
Crête M, Huot J, Gauthier L (1990) Food selection during early lactation by caribou calving
on the tundra in Québec. Arctic 43: 60-65.
Daniëls FJA, de Molenaar JG, Chytry M, Tichy L (2011) Vegetation change in Southeast
Greenland? Tasiilaq revisited after 40 years. Applied Vegetation Science 14: 230-241.
de Groot WJ, Thomas PA, Wein RW (1997) Betula nana L. and Betula glandulosa Michx.
Journal of Ecology 85: 241-264.
DeLuca TH, Nilsson MC, Zackrisson O (2002) Nitrogen mineralization and phenol
accumulation along a fire chronosequence in northern Sweden. Oecologia 133: 206-
214.
Dial RJ, Berg EE, Timm K, McMahon A, Geck J. 2007. Changes in the alpine forest-tundra
ecotone commensurate with recent warming in southcentral Alaska: evidence from
orthophotos and field plots. Journal of Geophysical Research 112: G04015.
Dixon PM (2001) Bootstrap resampling in AH El-Shaarawi & WW Piegorsch (eds). The
Encyclopedia of Environmetrics. Wiley, New York, USA.
Dolezal J, Ishii H, Kyncl T, Takahashi K, Vetrova VP, Homma K, Sumida A, Hara T
(2010) Climatic factors affecting radial growth of Betula ermanii platypylla in
Kamchatka. Canadian Journal of Forest Research 40: 273-285.
Dormann CF, Woodin SJ (2002) Climate change in the Arctic: using plant functional types
in a meta-analysis of field experiments. Functional Ecology 16: 4-17.
Douhovnikoff V, Goldsmith GR, Tape KD, Huang C, Sur N, Bret-Harte MS (2010) Clonal
diversity in an expanding community of arctic Salix spp. and a model for recruitment
modes of arctic plants. Arctic, Antarctic, and Alpine Research 42: 406-411.
Ducruc JP, Zarnovican R (1976) Notes sur l’écologie de trois espèces ligneuses à la
bordure méridionale de la baie d’Ungava, Nouveau-Québec: Betula glandulosa, Larix
128
laricina, Picea mariana. Canadian Journal of Botany 54: 1775-1783.
Dufour-Tremblay G, Boudreau S (2011) Black spruce regeneration at the treeline ecotone:
synergistic impacts of climate change and caribou activity. Canadian Journal of
Forestry Research 41: 460-68.
Dufour-Tremblay G, De Vriendt L, Lévesque E, Boudreau S (2012) The importance of
ecological constraints on the control of multi-species treeline dynamics in eastern
Nunavik, Québec. American Journal of Botany 99: 1638-1646.
Dullinger S, Dirnbock T, Grabherr G (2003) Patterns of shrub invasion into high mountain
grasslands of the Northern Calcareous Alps, Austria. Arctic, Antarctic, and Alpine
Reasearch 35: 434-441.
Dullinger S, Dirnbock T, Kock R, Hochbichler E, Englisch T, Sauberer N, Grabherr G
(2005) Interactions among tree-line conifers: differential effects of pine on spruce and
larch. Journal of Ecology 93: 948-957.
Elmendorf SC, Henry GHR, Hollister RD, Bjork RG, Boulanger-Lapointe N, Cooper EJ,
Cornelissen JHC, Day TA, Dorrepaal E, Elumeeva TG, Gill M, Gould WA, Harte J,
Hik DS, Hofgaard A, Johnson DR, Johnstone JF, Jonsdottir IS, Jorgensen JC,
Klanderud K, Klein JA, Koh S, Kudo G, Lara M, Levesque E, Magnusson B, May
JL, Mercado-Diaz JA, Michelsen A, Molau U, Myers-Smith IH, Oberbauer SF,
Onipchenko VG, Rixen C, Schmidt NM, Shaver GR, Spasojevic MJ, Porhallsdottir
PE, Tolvanen A, Troxler T, Tweedie CE, Villareal S, Wahren CH, Walker X, Webber
PJ, Welker JM, Wipf S (2012a) Plot-scale evidence of tundra vegetation change and
links to recent summer warming. Nature Climate Change 2: 453-457.
Elmendorf SC, Henry GHR, Hollister RD, Bjork RG, Bjorkman AD, Callaghan TV, Collier
LS, Cooper EJ, Cornelissen JHC, Day TA, Fosaa AM, Gould WA, Gretarsdottir J,
Harte J, Hermanutz L, Hik DS, Hofgaard A, Jarrad F, Jónsdóttir IS, Keuper F,
Klanderud K, Klein JA Koh S, Kudo G, Lang SI, Lowen V, May JL, Mercado J,
Michelsen A, Molau U, Myers-Smith IH, Oberbauer SF, Pieper S, Post E, Rixen C,
Robinson CH, Schmidt NM, Shaver GR, Stenstrom A, Tolvanen A, Totland O,
Troxler T, Wahren CH, Webber PJ, Welker JM, Wookey PA (2012b) Global
assessment of experimental climate warming on tundra vegetation: heterogeneity over
space and time. Ecology Letters 15: 164-175.

129
Environment Canada (2010) Canadian climate normals or averages 1971-2000 URL
http://www.climate.weatheroffice.ec.gc.ca/climate_normals.
Environment Canada (2013) Canadian climate normals or averages 1971-2000. URL
http://www.climate.weatheroffice.ec.gc.ca/climate_normals.
Epstein HE, Calef MP, Walker MD, Chapin III FS, Starfield AM (2004a) Detecting
changes in arctic tundra plant communities in response to warming over decadal time
scales. Global Change Biology 10: 1325-1334.
Epstein HE, Beringer J, Gould WA, Lloyd AH, Thompson CD, Chapin III FS, Michaelson
GJ, Ping CL, Rupp TS, Walker DA (2004b) The nature of spatial transitions in the
Arctic. Journal of Biogeography 31: 1917-1933.
Eskelinen A, Oksanen J (2006) Changes in the abundance, composition and species
richness of mountain vegetation in relation to summer grazing by reindeer. Journal of
Vegetation Science 17: 245-254.
Filion L, Payette S (1982) Régime nival et végétation chionophile à Poste-de-la-Baleine,
Nouveau-Québec. Naturaliste Canadien 109: 557-571.
Filion L (1984) A relationship between dunes, fire and climate recorded in the Holocene
deposits of Québec. Nature 309: 543-546.
Fisher RF (1980) Allelopathy: a potential cause of regeneration failure. Journal of Forestry
78: 346-350.
Forbes BC, Ebersole JJ, Strandberg B (2001) Anthropogenic disturbance and patch
dynamics in circumpolar arctic ecosystems. Conservation Biology 15: 954-969.
Forbes BC, Stammler F, Kumpula T, Meschtyb N, Pajunen A, Kaarlejarvia E (2009) High
resilience in the Yamal-Nenets social-ecological system, West Siberian Arctic,
Russia. Proceedings of the National Academy of Sciences of the United States 106:
22041-22048.
Forbes BC, Fauria MM, Zetterberg P (2010) Russian Arctic warming and “greening” are
closely tracked by tundra shrub willows. Global Change Biology 16: 1542-1554.
Forest L, Padilla F, Martinez S, Demongeot J, San Martin J (2006) Modelling of auxin
transport affected by gravity and differential radial growth. Journal of Theorical
Biology 241: 241-251.
Franklin RS (2013) Growth response of the alpine shrub, Linanthus pungens, to snowpack
130
and temperature at a rock glacier site in the eastern Sierra Nevada of California, USA.
Quaternary International 310: 20-33.
Fraser RH, Lantz TC, Olthof I, Kokelj SV, Sims RA (2014) Warming-induced shrub
expansion and lichen decline in the western Canadian arctic. Ecosystems, doi:
10.1007/s10021-014-9783-3.
Frost GV, Epstein HE, Walker DA, Matyshak G, Ermokhina K (2012) Linkages between
patterned ground, alder shrubland development, and active layer temperature in
Northwest Siberian Low Arctic. Proceedings of the Tenth International Conference
on Permafrost 1: 119-124.
Frost GV, Epstein HE (2014) Tall shrub and tree expansion in Siberian tundra ecotones
since the 1960s. Global Change Biology 20: 1264-1277.
Gamache I, Payette S (2004) Height growth response of tree line black spruce to recent
climate warming across the forest-tundra of eastern Canada. Journal of Ecology 92:
835-845.
Gajewski K, Payette S, Ritchie JC (1993) Holocene vegetation history at the boreal-forest-
shrub-tundra transition in north-western Québec. Journal of Ecology 81: 433-443.
Goetz SJ, Bunn AG, Fiske GJ, Houghton RA (2005) Satellite-observed photosynthetic
trends across boreal North America associated with climate and fire disturbance.
Proceedings of the National Academy of Science 102: 13521-13525.
Gordon C, Wynn JM, Woodin SJ (2001) Impacts of increased nitrogen supply on high
Arctic heath: the importance of bryophytes and phosphorus availability. New
Phytologist 149: 461-471.
Gough L (2006) Neighbor effects on germination, survival, and growth in two Arctic
tundra plant communities. Ecography 29: 44-56.
Graae BJ, Alsos IG, Ejrnaes R. (2008) The impact of temperature regimes on development,
dormancy breaking and germination of dwarf shrub seeds from arctic, alpine and
boreal sites. Plant Ecology 198: 275-284.
Greene DF, Noel J, Bergeron Y, Rousseau M, Gauthier S (2004) Recruitment of Picea
mariana, Pinus banksiana, and Populus tremuloides across a burn severity gradient
following wildfire in the southern boreal forest of Québec. Canadian Journal of
Forest Research 34: 1845-1857.

131
Grogan P, Chapin III FS (2000) Initial effects of experimental warming on above and
belowground components of net ecosystem CO2 exchange in arctic tundra.
Oechologia 125: 512-520.
Hadley JL, Smith WK (1989) Wind erosion of leaf surface wax in alpine timberline
conifers. Arctic and Alpine Research 21: 392-398.
Hallinger M, Manthey M, Wilmking M (2010) Establishing a missing link: warm summers
and winter snow cover promote shrub expansion into alpine tundra in Scandinavia.
New Phytologist 186: 890-899.
Hantemirov R, Shiyatov S, Gorlanova L (2011) Dendroclimatic study of Siberian juniper.
Dendrochronologia 29: 119-122.
Harsch MA, Hulme PE, McGlone MS, Duncan RP (2009) Are treelines advancing? A
global meta-analysis of treeline response to climate warming. Ecology Letters 12:
1040-1049.
Hill GB, Henry GHR (2011) Responses of High Arctic wet sedge tundra to climate
warming since 1980. Global Change Biology 17: 276-287.
Hobbie SE (1996) Temperature and plant species control over litter decomposition in
Alaskan tundra. Ecological Monographs 66: 503-522.
Hobbie SE, Chapin III FS (1998a) An experimental test of limits to tree establishment in
Arctic tundra. Journal of Ecology 86: 449-461.
Hobbie SE, Chapin III FS (1998b) Response of tundra plant biomass, aboveground
production, nitrogen, and CO2 flux to experimental warming. Ecology 79 : 1526–
1544.
Holmes RL (1983) Computer assisted quality control in tree ring dating and measurement.
Tree-Ring Bulletin 43: 69-78.
Hudson JMG, Henry GHR (2009) Increased plant biomass in a high arctic heath
community from 1981 to 2008. Ecology 90: 2657-2663.
Iason GR, Hester AJ (1993) The response of heather (Calluna vulgaris) to shade and
nutrients - predictions of the carbon-nutrient balance hypothesis. Journal of Ecology
81: 75-80.
IPCC (2007a) Climate Change 2007: The physical science basis. Cambridge University
Press, Cambridge, UK.
132
IPCC (2007b) Climate Change 2007: Impacts, adaptation and vulnerability. Cambridge
University Press, Cambridge, UK.
IPCC (2013) Climate Change 2013: The physical science basis. Cambridge University
Press, Cambridge, UK.
Jia GSJ, Epstein HE, Walker DA (2003) Greening of the arctic Alaska, 1981-2001.
Geophysical Research Letters 30: 2067.
Johnson JB, Omland KS (2004) Model selection in ecology and evolution. Trends in
Ecology and Evolution 19: 101-108.
Joly K, Jandt RR, Meyers CR, Cole MJ (2007) Changes in vegetation cover on Western
Arctic Herd winter range from 1981 to 2005; potential effects of grazing and climate
change. Rangifer 17: 199-206.
Jonasson S, Michelsen A, Schmidt IK, Nielsen EV (1999) Responses in microbes and
plants to changed temperature, nutrient, and light regimes in the arctic. Ecology 80:
1828-1843.
Jónsdóttir IS, Magnusson B, Gudmundsson J, Elmarsdottir A, Hjartarson H (2005) Variable
sensitivity of plant communities in Iceland to experimental warming. Global Change
Biology 11: 553-563.
Jorgenson MT, Racine CH, Walters JC, Osterkamp TE (2001) Permafrost degradation and
ecological changes associated with a warming climate in central Alaska. Climatic
Change 48: 551-579.
Jorgensen RH, Hallinger M, Ahlgrimm S, Friemel J, Kollmann J, Meilby (2015) Growth
response to climatic change over 120 years for Alnus viridis and Salix glauca in West
Greenland. Journal of Vegetation Science 26: 155-165.
Kemper JT, Macdonald SE (2009) Directional change in upland tundra plant communities
20-30 years after seismic exploration in the Canadian low-arctic. Journal of
Vegetation Science 20: 557-567.
Klein JA, Harte J, Zhao XQ (2004) Experimental warming causes large and rapid species
loss, dampened by simulated grazing, on the Tibetan Plateau. Ecology Letters 7:
1170-1179.
Koerner C (2000) Biosphere responses to CO2 enrichment. Ecological Applications 10:
1590-1619.

133
Kullman L (1995) Holocene tree-limit and climate history from the Scandes Mountains,
Sweden. Ecology 76: 2490-2502.
Krause HH (1986) Ericaceous vegetation as a site factor in jack pine growth of New
Brunswick plantation. Proceedings of IUFRO Workshop, Canadian Forest Service,
Fredericton. 182 p.
Landhausser SM, Wein RW (1993) Postfire vegetation recovery and tree establishment at
the arctic treeline: climate-change vegetation-response hypotheses. Journal of
Ecology 81: 665–672.
Lantz TC, Kokelj SV, Gergel SE, Henry GHR (2009) Relative impacts of disturbance and
temperature: persistent changes in microenvironment and vegetation in retrogressive
thaw slumps. Global Change Biology 15: 1664-1675.
Lantz TC, Gergel SE, Henry GHR (2010) Response of green alder (Alnus viridis subsp.
fruticosa) patch dynamics and plant community composition to fire and regional
temperature in north-western Canada. Journal of Biogeography 37: 1597-1610.
Larsen JA (1980) The boreal ecosystem. Academic Press, New York, USA.
Latifovic R, Trishchenko PA, Chen J, Park MW, Khlopenkov VK, Fernandes AR, Pouliot
D, Ungureanu C, Luo Y, Wang S, Davidson A, Cihlar J (2005) Generating historical
AVHRR 1-km baseline satellite data records over Canada suitable for climate change
studies. Canadian Journal of Remote Sensing 31: 324-346.
Lavallée C (2013) Impact de l’augmentation du couvert ligneux érigé et d’un
réchauffement expérimental sur la productivité d’Empetrum nigrum L., Vaccinium
uliginosum L. et V. vitis-idaea L. à Kangiqsujuaq et Kangiqsualujjuaq (Nunavik).
Mémoire de maîtrise, Université du Québec à Trois-Rivières, Trois-Rivières, Québec.
Lescop-Sinclair K, Payette S (1995) Recent advance of the arctic treeline along the eastern
coast of Hudson Bay. Journal of Ecology 83: 929-936.
Liang EY, Eckstein D (2009) Dendrochronological potential of the alpine shrub
Rhododendron nivale on the south-eastern Tibetan Plateau. Annals of Botany 104:
665-670.
Liston GE, McFadden JP, Sturm M, Pielke RA (2002) Modeled changes in arctic tundra
snow, energy and moisture fluxes due to increased shrubs. Global Change Biology 8:
17-32.

134
Lloyd AH, Rupp TS, Fastie CL, Starfield A (2002) Patterns and dynamics of treeline
advance on the Seward Peninsula, Alaska. Journal of Geophysical Research-
Atmospheres 107 (D2): 8161.
Lloyd AH, Fastie CL (2003) Recent changes in treeline forest distribution and structure in
interior Alaska. Ecoscience 10: 176-185.
Lloyd AH, Yoshikawa K, Fastie CL, Hinzman L, Fraver M (2003) Effects of permafrost
degradation on woody vegetation at Arctic treeline on the Seward Peninsula, Alaska.
Permafrost and Periglacial Processes 14: 93-101.
Loranty MM, Goetz SJ, Beck PSA (2011) Tundra vegetation effects on pan-arctic albedo.
Environmental Research Letters 6: 024014.
MacDonald GM, Edwards TWD, Moser KA, Pienitz R, Smol JP (1993) Rapid response of
treeline vegetation and lakes to past climate change. Nature 361: 243-246.
MacDonald GM, Case RA, Szeicz JM (1998) A 538-year record of climate and treeline
dynamics from the lower Lena River region of northern Siberia, Russia. Arctic and
Alpine Research 30: 334-339.
MacDonald SE, Yin FY (1999) Factors influencing size inequality in peatland black spruce
and tamarack: evidence from post-drainage release growth. Journal of Ecology 87:
404-412.
Mack M, Schuur EA, Bret-Harte MS, Shaver GR, Chapin FS III (2004) Ecosystem carbon
storage in arctic tundra reduced by long-term nutrient fertilization. Nature 431: 440-
443.
Mackay JR, Burn CR (2011) A century (1910-2008) of change in a collapsing pingo, Parry
Peninsula, Western Arctic Coast, Canada. Permafrost and Periglacial Processes 22:
266-272.
Maillette L, Bélisle L, Séguin MK (1988) Decrease in competitive ability through
adaptation to the physical environment, exemplified by Salix uva-ursi in the tundra of
northern Québec. Canadian Journal of Botany 66: 1532-1538.
Mallik AU (1994) Autecological response of Kalmia angustifolia to forest types and
disturbance regime. Forest Ecology Management 65: 231-249.
Mallik AU (1995) Conversion of temperate forests into heaths: role of ecosystem
disturbance and ericaceous plants. Environmental Management 19: 675-684.
135
Mallik AU (2003) Conifer regeneration problems in boreal and temperate forests with
ericaceous understory: role of disturbance, seedbed limitation, and keystone species
change. Critical Reviews in Plant Science 22: 341-366.
Manseau M, Huot J, Crête M (1996) Effects of summer grazing by caribou on composition
and productivity of vegetation: community and landscape level. Journal of Ecology
84: 503-513.
Marchand PJ, Chabot BF (1978) Winter water relations of tree-line plant species on Mt.
Washington, New Hampshire. Arctic and Alpine Research 10: 105-116.
Marsh P, Russel M, Pohl S, Haywood H, Onclin C (2009) Changes in thaw lake drainage in
the Western Canadian Arctic from 1950 to 2000. Hydrological Processes 23: 145-
158.
Marsh P, Bartlett P, MacKay M, Pohl S, Lantz T (2010) Snowmelt energetics at a shrub
tundra site in the western Canadian Arctic. Hydrological Processes 24: 3603–3620.
Mazerolle MJ (2006) Improving data analysis in herpetology: using Akaike’s Information
Criterion (AIC) to assess the strength of biological hypotheses. Amphibia-Reptilia 27:
169-180.
Mazerolle MJ (2014) Package ‘AICcmodavg’. http://cran.r-
project.org/web/packages/AICcmodavg/AICcmodavg.pdf
McManus KM, Morton DC, Masek JG, Wang DD, Sexton JO, Nagol JR, Ropars P,
Boudreau S (2012) Satellite-based evidence for shrub and graminoid tundra
expansion in northern Quebec from 1986 to 2010. Global Change Biology 18: 2313-
2323.
Morin H, Payette S (1986) The vegetation of snow patches from the Richmond Gulf,
northern Québec. Canadian Journal of Botany 64: 1515-1524.
Mueller-Dombois D, Ellenberg H (1974) Aims and methods of vegetation ecology. Wiley,
New York, USA.
Myers-Smith IH (2011) Shrub encroachment in arctic and alpine tundra: mechanisms of
expansion and ecosystem impacts. PhD thesis, University of Alberta, Edmonton,
Canada.
Myers-Smith IH, Forbes BC, Wilmking M, Hallinger M, Lantz T, Blok D, Tape KD,
Marcias-Fauria M, Sass-Klaassen U, Lévesque E, Boudreau S, Ropars P, Hermanutz
136
L, Trant A, Collier LS, Weijers S, Rozema J, Rayback SA, Schmidt NM, Schaepman-
Strub G, Wipf S, Rixen C, Menard CB, Venn S, Goetz S, Andreu-Hayles L,
Elmendorf S, Ravolainen V, Welker J, Grogan P, Epstein HE, Hik DS (2011a) Shrub
expansion in tundra ecosystems: dynamics, impacts and research priorities.
Environmental Research Letters 6: 045509.
Myers-Smith IH, Hik DS, Kennedy C, Cooley D, Johnstone JF, Kenney A, Krebs CJ
(2011b) Expansion of canopy-forming willows over the twentieth century on
Herschel Island, Yukon Territory, Canada. Ambio 40: 610-623.
Myers-Smith IH, Hik DS (2013) Shrub canopies influence soil temperatures but not
nutrient dynamics: an experimental test of tundra snow-shrub interactions. Ecology
and Evolution 3: 3683-3700.
Myers-Smith IH, Elmendorf SC, Beck PSA, Wilmking M, Hallinger M, Blok D, Tape KD,
Rayback SA, Macias-Fauria M, Forbes BC, Speed JDM, Boulanger-Lapointe N,
Rixen C, Lévesque E, Schmidt NM, Baittinger C, Trant AJ, Hermanutz L, Collier LS,
Dawes MA, Lantz TC, Weijers S, Jorgensen RH, Buchwal A, Buras A, Naito AT,
Ravolainen V, Schaepman-Strub G, Wheeler JA, Wipf S, Guay KC, Hik DS, Vellend
M (2015) Climate sensitivity of shrub growth across the tundra biome. Nature
Climate Change, DOI: 10.1038/NCLIMATE2697.
Myneni RB, Keeling CD, Tucker CJ, Asrar G, Nemani RR (1997) Increased plant growth
in the northern latitudes from 1981 to 1991. Nature 386: 698-702.
Myneni RB, Tucker CJ, Asrar G, Keeling CD (1998) Interannual variations in satellite-
sensed vegetation index data from 1981 to 1991. Journal of Geophysical Research-
Atmospheres 103: 19839.
Naito AT, Cairns DM (2011) Patterns and processes of global shrub expansion. Progress in
Physical Geography 35: 423-442.
Nilsson MC, Hogberg P, Zackrisson O, Wang FY (1993) Allelopathic effects by Empetrum
hermaphroditum on development and nitrogen uptake by roots and mycorrhizae of
Pinus sylvestris. Canadian Journal of Botany 71: 620-628.
Nilsson MC, Zackrisson O, Sterner O, Wallsted A (2000) Characterization of the
differential interference effects of two boreal dwarf shrub species. Oecologia 123:
122-128.

137
Nilsson MC, Wardle DA (2005) Understory vegetation as a forest ecosystem driver:
evidence from the northern Swedish boreal forest. Frontiers in Ecology and the
Environment 3: 421-428
Oksanen L, Virtanen R (1997) Adaptation to disturbance as a part of the strategy of arctic
and alpine plants. Perspectives for management and restoration. Pages 91-113 in
RMM Crawford (ed). Disturbance and recovery in arctic lands. Kluwer, Belgium.
Olofsson J, Oksanen L, Callaghan T, Hulme PE, Oksanen T, Suominen O (2009)
Herbivores inhibit climate-driven shrub expansion on the tundra. Global Change
Biology 15: 2681-2693.
Olthof I, Pouliot D (2010) Treeline vegetation composition and change in Canada’s western
subarctic from AVHRR and canopy reflectance modeling. Remote Sensing of
Environment 114: 805-815.
Pajunen A, Oksanen J, Virtanen R (2011) Impact of shrub canopies on understory
vegetation in western Eurasian tundra. Journal of Vegetation Science 22: 837-846.
Pajunen A, Virtanen R, Roininen H (2012) Browsing-mediated shrub canopy changes drive
composition and species richness in forest-tundra ecosystems. Oikos 121: 1544-1552.
Parmesan C (2006) Ecological and evolutionary responses to recent climate change. Annual
Review of Ecology, Evolution, and Systematics 37: 637-669.
Parnikoza I, Convey P, Dykyyz I, Trokhymets V, Milinevsky G, Tyschenko O,
Inozemtseva D, Kozeretska I (2009) Current status of the Antarctic tundra formation
in the Central Argentine Islands. Global Change Biology 15: 1685-1693.
Payette S, Filion L, Ouzilleau J (1973) Snow vegetation relationships in the forest tundra of
New-Québec Hudson Bay. Naturaliste Canadien 100: 493-508.
Payette S, Lajeunesse R (1980) Les combes à neige de la Rivière aux Feuilles (Nouveau-
Québec) : indicateurs paléoclimatiques holocènes. Géographie physique et
Quaternaire 34: 209-220.
Payette S (1983) The forest tundra and present tree-lines of the northern Québec-Labrador
peninsula. Tree-line Ecology, Proceedings of the Northern Québec Tree-line
Conference (Québec: Nordica) p. 3-23
Payette S, Boudreau F, Gagnon R (1985) Gélifluxion néoglaciaire dans une combe à neige
à la limite des arbres (Québec Nordique). Géographie physique et Quaternaire 39:
138
91-97.
Payette S, Gagnon R (1985) Late Holocene deforestation and tree regeneration in the
forest-tundra of Québec. Nature 313: 570-572.
Payette S (1992) Fire as a controlling process in the North American boreal forest. Pages
144-169 in HH Shugart, R Leemans & GB Bonan (eds). A systems analysis of the
global boreal forest. Cambridge University Press, Cambridge.
Payette S, Morneau C (1993) Holocene relict woodlands at the eastern Canadian tree line
Quaternary Research 39: 84-89.
Payette S (2001) Les processus et les formes périglaciaires. Pages 199-239 in S Payette &
L Rochefort (eds). Écologie des tourbières du Québec-Labrador. Presses de
l’Université Laval, Québec, Canada.
Payette S, Fortin MJ, Gamache I (2001) The subarctic forest-tundra: the structure of a
biome in a changing climate. BioScience 51: 709-718.
Payette S, Filion L, Delwaide A (2008) Spatially explicit fire-climate history of the boreal
forest-tundra (eastern Canada) over the last 2000 years. Philosophical Transactions of
the Royal Society B: Biological Sciences 363: 2301-2316.
Pérez-Devesa M, Cortina J, Vilagrosa A, Vallejo R (2008) Shrubland management to
promote Quercus suber L. establishment. Forest Ecology and Management 255: 374-
382.
Plante S, Champagne E, Ropars P, Boudreau S, Lévesque E, Tremblay B, Tremblay JP
(2014) Shrub cover in northern Nunavik: can herbivores limit shrub expansion? Polar
Biology 37: 611-619.
Pomeroy JW, Bewley DS, Essery RLH, Hedstrom NR, Link T, Granger RJ, Sicart JE, Ellis
CR, Janowicz JR (2006) Shrub tundra snowmelt. Hydrological Processes 20: 923–
941.
Poore RE, Lamanna CA, Ebersole JJ, Enquist BJ (2009) Controls on radial growth of
Mountain Big Sagebush and implications for climate change. Western North
American Naturalist 69: 556-562.
Porsild AE, Cody WJ (1980) Vascular plants of continental Northwest Territories, Canada.
National Museum of Natural Sciences, Natural Museums of Canada. Ottawa, Canada.
Post E, Pedersen C (2008) Opposing plant community responses to warming with and
139
without herbivores. Proceedings of the Natural Academy of Sciences 105: 12353-
12358.
Provencher-Nolet L (2014) Détection de changement à court terme de la toundra arbustive
à partir de photographies aériennes, region d’Umiujaq, Nunavik (Québec, Canada).
Mémoire de maîtrise, Institut national de la recherche scientifique, Québec.
Racine C, Jandt R, Meyers C, Dennis J (2004) Tundra fire and vegetation change along a
hillslope on the Seward Peninsula, Alaska, USA. Arctic, Antarctic and Alpine
Research 36: 1-10.
Raynolds MK, Walker DA, Maier HA (2006) NDVI patterns and phytomass distribution in
the circumpolar Arctic. Remote Sensing of Environment 102: 271-281.
Rinnan R, Stark S, Tolvanen A (2009) Responses of vegetation and soil microbial
communities to warming and simulated herbivory in a subarctic heath. Journal of
Ecology 97: 788-800.
Rodwell JS (1991) British plant communities, vol 2. Mires and heaths. Cambridge
University Press, Cambridge, UK.
Romanovsky VE, Osterkamp TE (1995) Interannual variations of the thermal regime of the
active layer and near-surface permafrost in northern Alaska. Permafrost and
Periglacial Processes 6: 313-315.
Ropars P, Boudreau S (2012) Shrub expansion at the forest tundra ecotone: spatial
heterogeneity linked to local topography. Environmental Research Letters 7: 015501.
Ropars P, Lévesque E, Boudreau S (2015) How do climate and topography influence the
greening of the forest-tundra ecotone in northern Quebec? A dendrochronological
analysis of Betula glandulosa. Journal of Ecology 103: 679-690.
Schimel JP, Gulledge JM, Clein-Curley JS, Lindstrom JE, Braddock JF (1999) Moisture
effects on microbial activity and community structure in decomposing birch litter in
the Alaskan taiga. Soil Biology and Biochemistry 31: 831-838.
Schmitz OJ, Post E, Burns CE, Johnstone KM (2003) Ecosystem responses to climate
change: moving beyond color mapping. Bioscience 53: 1199-1205.
Schmidt NM, Baittinger C, Kollman J, Forchhammer MC (2010) Consistent
dendrochronological response of the dioecious Salix arctica to variation in local snow
precipitations across gender and vegetation types. Arctic Antarctic and Alpine
140
Research 42: 471-475.
Schuur EAG, Crummer KG, Vogel JG, Mack MC (2007) Plant species composition and
productivity following permafrost thaw and thermokarst in Alaskan tundra.
Ecosystems 10: 280-292.
Senfeldr M, Treml V, Madera P, Volarik D (2014) Effects of prostrate dwarf pine on
Norway spruce clonal groups in the treeline ecotone of the Hruby Jesenik mountains,
Czech Republic. Arctic, Antarctic, and Alpine Research 46: 430-440.
Serreze MC, Walsh JE, Chapin III FS, Osterkamp T, Dyurgerov M, Romanovsky V,
Oechel WC, Morison J, Zhang T, Barry RG (2000) Observational evidence of recent
change in the northern high-latitude environment. Climatic Change 46: 159-207.
Shaver GR, Cutler JC (1979) The vertical distribution of live vascular phytomass in
cottongrass tussock tundra. Arctic and Alpine Research 11: 335-342.
Shaver GR, Laundre JA, Giblin AE, Nadelhoffer KJ (1996) Changes in live plant biomass,
primary production and species composition along a riverside toposequence in Arctic
Alaska, USA. Arctic and Alpine Research 28b: 363-379.
Shuman B, Newby P, Huang YS, Webb T (2004) Evidence for the close climatic control of
New England vegetation history. Ecology 85: 1297-1310.
Silapaswan CS, Verbyla DL, McGuire AD (2001) Land cover change on the Seward
Peninsula: the use of remote sensing to evaluate the potential influences of climate
warming on historical vegetation dynamics. Canadian Journal of Remote Sensing 27:
542-554.
Sonesson M, Callaghan TV (1991) Strategies of survival in plants of the Fennoscandian
tundra. Arctic 44: 95-105.
Soukupova L, Frantik T, Jenik J (2001) Grasslands versus krummholz in arctic-alpine
tundra of the Giant Mountains. Opera Corcontica 38: 63-76.
Speed JDM, Austrheim G, Hester AJ, Mysterud A (2010) Experimental evidence for
herbivore limitation of the treeline. Ecology 91: 3414-3420.
Spiech C (2014) Spatial distribution, abundance and productivity of berry producing shrubs
in the vicinity of Baker Lake, Nunavut: a baseline study linking science with local
knowledge. Mémoire de maîtrise, Université du Québec à Trois-Rivières, Trois-
Rivières, Québec.
141
Stow DA, Hope A, McGuire D, Verbyla D, Gamon J, Huemmrich F, Houston S, Racine, C,
Sturm M, Tape K, Hinzman L, Yoshikawa K, Tweedie C, Noyle B, Silapaswan C,
Douglas D, Griffith B, Jia G, Epstein H, Walker D, Daeschner S, Petersen A, Zhou L,
Myneni R (2004) Remote sensing of vegetation and land-cover change in Arctic
tundra ecosystems. Remote sensing of Environment 89: 281-308.
Sturm M, Racine C, Tape K (2001a) Increasing shrub abundance in the Arctic. Nature 411:
546-547.
Sturm M, McFadden JP, Liston GE, Chapin FS III, Racine CH, Holmgren J (2001b) Snow-
shrub interactions in Arctic tundra: A hypothesis with climatic implications. Journal
of Climate 14: 336-344.
Sturm M, Schimel J, Michaelson G, Welker JM, Oberbauer SF, Liston GE, Fahnestock J,
Romanovsky VE (2005) Winter biological processes could help convert arctic tundra
to shrubland. Bioscience 55: 17-26.
Sugiura N (1978) Further analysis of the data by Akaike’s information criterion and the
finite corrections. Communications in Statistics - Theory and Methods A7: 13-26.
Sveinbjörnsson B (2000) North American and European treelines: external forces and
internal processes controlling position. Ambio 29: 388-395.
Sveinbjörnsson B, Hofgaard A, Lloyd AH (2002) Natural causes of the tundra-taiga
boundary. Ambio, Special Report 12: 23-29.
Swann AL, Fung IY, Levis S, Bonan GB, Doney SC (2010) Changes in Arctic vegetation
amplify high-latitude warming through the greenhouse effect. Proceeding of the
National Academy of Science of the United States of America 107: 1295-1300.
Schweingruber FH (2007) Wood structure and environment. Springer-Verlag, Berlin,
Allemagne. 279 p.
Tape KD, Sturm M, Racine C (2006) The evidence for shrub expansion in northern Alaska
and the pan-Arctic. Global Change Biology 12: 686-702.
Tape KD, Lord R, Marshall HP, Ruess RW (2010) Snow-mediated ptarmigan browsing and
shrub expansion in Arctic Alaska. Ecoscience 17: 186-193.
Tape KD, Hallinger M, Welker JM, Ruess RW (2012) Landscape heterogeneity of shrub
expansion in arctic Alaska. Ecosystems 15: 711-724.
Thorpe N, Eyegetok S, Hakongak N, Elders K (2002) Nowadays it is not the same : Inuit

142
Quajimajatuqangit, climate caribou in the Kitikmeot région of Nunavut, Canada.
Pages 198-239 in I Krupnik & D Jolly (eds). Th Earth is faster : Indigenous
observations of Arctic environmental change. Arctic Research Consortium of the
United States and the Smithsonian Institution, Fairbanks, Alaska, USA.
Tinner W, Lotter AF (2001) Central European vegetation response to abrupt climate change
at 8.2 ka. Geology 29: 551-554.
Tremblay B, Lévesque E, Boudreau S (2012) Recent expansion of erect shrubs in the Low
Arctic: evidence from eastern Nunavik. Environmental Research Letters 7: 035501.
Vaartaja O (1959) Photoperiodic response in germination of four species of Betula. Bi-
monthly Progress Report, Forest Biology Division, Department of Agriculture,
Canada 15: 2.
Verbyla D (2008) The greening and browning of Alaska based on 1982-2003 satellite data.
Global Ecology and Biogeography 17: 547-555.
Vicente-Serrano SM, Begueria S, Lopez-Moreno JI (2010) A multiscalar drought index
sensitive to global warming: the standardized precipitation evapotranspiration index.
Journal of Climate 23: 1696-1718.
Vistness II, Nellemann C (2008) Reindeer winter grazing in alpine tundra: impacts on ridge
community composition in Norway. Arctic, Antarctic, and Alpine Research 40: 215-
224.
Vitousek PM (2004) Nutrient cycling and limitation. Hawaii as a model system. Princeton
University Press, New Jersey, USA.
Wahren CHA, Walker MD, Bret-Harte MS (2005) Vegetation responses in Alaskan arctic
tundra after 8 years of a summer warming and winter snow manipulation experiment.
Global Change Biology 11: 537-552.
Walker J, Thompson CH, Reddell P, Rapport DJ (2001) The importance of landscape age
in influencing landscape health. Ecosystem Health 7: 7-14.
Walker DA, Epstein HE, Jia GJ, Balser A, Copass C, Edwards EJ, Gould WA,
Hollingsworth J, Knudson J, Maier HA, Moody A, Raynolds MK (2003) Phytomass,
LAI, and NDVI in northern Alaska: Relationships to summer warmth, soil pH, plant
functional types, and extrapolation to the circumpolar Arctic. Journal of Geophysical
Research: Atmosphere 108: 8169.

143
Walker MD, Wahren CH, Hollister RD, Henry GHR, Ahlquist LE, Alatalo JM, Bret-Harte
MS, Calef MP, Callaghan TV, Carrol AB, Epstein HE, Jónsdóttir IS, Klein JA,
Magnusson B, Molau U, Oberbauer SF, Rewa SP, Robinson CH, Shaver GR, Suding
KN, Thompson CC, Tolvanen A, Totland O, Turner PL, Tweedie CE, Webber PJ,
Wookey PA (2006) Plant community responses to experimental warming across the
tundra biome. Proceedings of the Natural Academy of Sciences 103: 1342-1346.
Wardle DA, Zackrisson O, Hornberg G, Gallet C (1997) Influence of island area on
ecosystem properties. Science 277: 1296-1299.
Wardle DA, Hörnberg G, Zackrisson O, Kalela-Brundin M, Coomes DA (2003) Long-term
effects of wildfire on ecosystem properties across an island area gradient. Science
300: 972-975.
Weijers S, Broekman R, Rozema J (2010). Dendrochronology in the High Arctic: July air
temperatures reconstructed from annual shoot length growth of the circumarctic
dwarf shrub Cassiope tetragona. Quaternary Science Reviews 29: 3831-3842.
Weis IM, Hermanutz LA (1988) The population biology of the arctic dwarf birch Betula
glandulosa: seed rain and germinable seed bank. Canadian Journal of Botany 66:
2055-2061.
Wigley TML, Briffa KR, Jones PD (1984) On the average value of correlated time series,
with applications in dendroclimatology and hydrometeorology. Journal of Climate
and Applied Meteorology 23: 201-213.
Wilson SD, Nilsson C (2009) Arctic alpine vegetation change over 20 years. Global
Change Biology 15 : 1676–1684.
Wipf S, Stoeckli V, Bebi P (2009) Winter climate change in alpine tundra: plant responses
to changes in snow depth and snowmelt timing. Climate Change 94: 105-121.
Xiao SC, Xiao HL, Kobayashi O, Liu PX (2007) Dendrochronological investigations of sea
buckthorn (Hippophae rhamnoides) and reconstruction of the equilibrium line
altitude of the July first glacier in the Western Qilian Mountains, northwestern China.
Tree-Ring Research 63: 15-26.
Zalatan R, Gajewski K (2006) Dendrochronological potential of Salix alaxensis from the
Kuujju River area, Western Canadian Arctic. Tree-ring Research 62: 75-82.
Zamin TJ, Grogan P (2012) Birch shrub growth in the low Arctic: the relative importance

144
of experimental warming, enhanced nutrient availability, snow depth and caribou
exclusion. Environmental Research Letters 7: 034027.
Zang C (2012) The bootRes package for bootstrapped response and correlation functions.
http://cran.rproject.org/web/packages/bootRes/index.html [Consulted in june 2013].
Zasada JC, Norum RA, Vanveldhuizen RM, Teutsch CE (1983) Artificial regeneration of
trees and tall shrubs in experimentally burned upland black spruce feather moss
stands in Alaska. Canadian Journal of Forestry Research 13: 903-913.