Bacterioplankton in the littoral and pelagic zones of subtropical shallow lakes
Repeated landmass reformation limits diversification inthe widespread littoral zone mosquito Anophelessundaicus sensu lato in the Indo-Oriental Region
MAGDALENA ZAROWIECKI , * YVONNE-MARIE LINTON,† ‡ RORY J . POST,§MICHAEL J . BANGS,¶ PE THAN HTUN,** THAUNG HLAING,** CHANG MOH SENG,† †
VISUT BAIMAI ,‡ ‡ TRUNG HO DING,§§ THO SOCHANTHA¶¶ and CATHERINE WALTON***
*Parasite Genomics Group, Wellcome Trust Sanger Institute, Wellcome Trust Genome Campus, Hinxton, Cambridge CB10 1SA,
UK, †Walter Reed Biosystematics Unit, Smithsonian Institution Museum Support Center, 4210 Silverhill Road, Suitland, MD
20746, USA, ‡Walter Reed Army Institute of Research, Entomology Branch, 503 Robert Grant Avenue, Silver Spring, MD
20910-7500, USA, §School of Natural Sciences and Psychology, Liverpool John Moores University, Byrom Street, Liverpool L3
3AF, UK, ¶Public Health & Malaria Control, International SOS, Jl. Kertajasa, Kuala Kencana, Papua 99920, Indonesia,
**National Malaria Control Programme, Department of Health, Ministry of Health, Nay Pyi Taw, Myanmar, ††World Health
Organization Cambodia, #177-179 Pasteur Street (51), Phnom Penh, Cambodia, ‡‡Department of Biology, Faculty of Science,
Mahidol University, Rama VI Road, Bangkok 10400, Thailand, §§National Institute of Malariology, Parasitology & Entomology,
Luong The Vinh Street, BC 10.200, Tu Liem, Hanoi, Vietnam, ¶¶National Center for Malaria Control, Parasitology &
Entomology, 372 Monivong Blvd (Corner St 322), Phnom Penh, Cambodia, ***Faculty of Life Sciences, The University of
Manchester, Michael Simon Building, Oxford Road, Manchester M13 9PL, UK
Abstract
Southeast Asia harbours abundant biodiversity, hypothesized to have been generated
by Pliocene and Pleistocene climatic and environmental change. Vicariance between
the island of Borneo, the remaining Indonesian archipelago and mainland Southeast
Asia caused by elevated sea levels during interglacial periods has been proposed to
lead to diversification in the littoral zone mosquito Anopheles (Cellia) sundaicus(Rodenwaldt) sensu lato. To test this biogeographical hypothesis, we inferred the pop-
ulation history and assessed gene flow of A. sundaicus s.l. sampled from 18 popula-
tions across its pan-Asian species range, using sequences from mitochondrial
cytochrome c oxidase subunit 1 (CO1), the internal transcribed spacer 2 (ITS2) and the
mannose phosphate isomerase (Mpi) gene. A hypothesis of ecological speciation for
A. sundaicus involving divergent adaptation to brackish and freshwater larval habitats
was also previously proposed, based on a deficiency of heterozygotes for Mpi allozyme
alleles in sympatry. This hypothesis was not supported by Mpi sequence data, which
exhibited no fixed differences between brackish and freshwater larval habitats. Mpiand CO1 supported the presence of up to eight genetically distinct population group-
ings. Counter to the hypothesis of three allopatric species, divergence was often no
greater between Borneo, Sumatra/Java and the Southeast Asian mainland than it was
between genetic groupings within these landmasses. An isolation-with-migration (IM)
model indicates recurrent gene flow between the current major landmasses. Such gene
flow would have been possible during glacial periods when the current landmasses
merged, presenting opportunities for dispersal along expanding and contracting coast-
lines. Consequently, Pleistocene climatic variation has proved a homogenizing, rather
than diversifying, force for A. sundaicus diversity.
Correspondence: Dr Magdalena Zarowiecki,
Fax: +44 1223-494919; E-mail: [email protected]
© 2014 John Wiley & Sons Ltd
Molecular Ecology (2014) 23, 2573–2589 doi: 10.1111/mec.12761
Keywords: Anopheles epiroticus, biogeography, isolation with migration, mannose phosphate
isomerase (Mpi), speciation, vicariance
Received 19 January 2012; revision received 14 April 2014; accepted 16 April 2014
Introduction
The biogeographical regions of Indo-Burma and Sunda-
land in Southeast Asia are two of the largest and richest
biodiversity hotspots in the world (Myers et al. 2000).
Their high biodiversity has in part been attributed to
the complex geological history of this region involving
rapid changes in tectonics, topography, climate and
land and sea distributions that are expected to facilitate
speciation by a combination of vicariance and dispersal
(Hall 1998; Woodruff 2010). Sundaland comprises the
Malay Peninsula, the major islands of Borneo, Sumatra
and Java as well as numerous smaller islands which all
lie on the large and shallow continental Sunda Shelf
(Fig. 5). Throughout the Miocene, Borneo and mainland
Southeast Asia formed a single landmass. As they
uplifted, they became connected to Sumatra and Java
from 10–5 Ma (reviewed in Lohman et al. 2011), facili-
tating terrestrial dispersal (Heaney 1991). Mainland
Southeast Asia, Borneo, Sumatra and Java were subse-
quently separated during the Pliocene by elevated sea
levels, which reached their maximum height by 3 Ma
(Zhong et al. 2004). In the Pleistocene, these landmasses
were again connected periodically during the long gla-
cial periods when lowered sea levels exposed the Sunda
Shelf (Fig. 5; Voris 2000).
The extreme climatic changes of the Pleistocene led to
the much-debated Pleistocene pump hypothesis, origi-
nally in the context of the Neotropics (Haffer 1987).
This proposed that speciation rates should be increased
in the Pleistocene as populations diverged in allopatric
rainforest refugia during the cool, arid glacial periods
that restricted rainforest growth. Counter to this,
numerous studies have revealed that divergence
between closely related species on the different South-
east Asian landmasses dates predominantly to the Plio-
cene, for example in murine rodents (Gorog et al. 2004),
palm civets (Patou et al. 2010), Rafflesia (Bendiksby et al.
2010) and Asian barbets (den Tex & Leonard 2013). This
has been largely attributed to the substantial sea barri-
ers present during the Pliocene (see above). Although
there is some Pleistocene divergence of closely related
species, for example, in freshwater crabs (Klaus et al.
2013), most Pleistocene diversification between the land-
masses occurs at the level of subspecies or distinct
genetic lineages, for example clouded leopards (Wilting
et al. 2011) and yellow-vented bulbuls (Lohman et al.
2011).
In the case of rainforest species, Pleistocene diversifi-
cation among landmasses has been attributed to isola-
tion in glacial rainforest refugia restricted to mountain
ranges in northwest Borneo, Sumatra and peninsular
Malaysia (e.g. Gathorne-Hardy et al. 2002; Quek et al.
2007; Lim et al. 2011). This is consistent with the vegeta-
tion of the exposed Sunda Shelf during glacial periods
being dominated by savannah (Hope et al. 2004; Bird
et al. 2005). However, more recent palaeoclimatic mod-
els indicate, to the contrary, that during Pleistocene gla-
cial periods, the lowland evergreen rainforests in this
region expanded to cover much of the large landmass
of exposed Sundaland (Cannon et al. 2009). In support
of this, resumed gene flow during the Pleistocene has
been suggested for some species, such as rainforest
trees (Ohtani et al. 2013) and Tephritid fruit flies
(Schutze et al. 2012). The extent and causes of Pleisto-
cene divergence in Southeast Asia therefore remain con-
troversial. A contributing factor to this is the inability to
separate the effects of land and sea barriers during
glacial and interglacial periods (Lohman et al. 2011;
Klaus et al. 2013).
The mosquito taxon Anopheles sundaicus (Rodenwaldt
1925) s.l. has a predominantly coastal distribution and
is distributed across the mainland and islands of SE
Asia and India (Reid 1968). This makes it an excellent
system for studying the effect of Pleistocene interglacial
period sea barriers on diversification in the Indo-Burma
and Sundaic biodiversity hotspots, without the potential
confounding effects of factors relating to habitat. Dus-
four et al. (2007) have previously hypothesized that
Pleistocene climate change has driven speciation in this
taxon resulting in distinct species on mainland South-
east Asia, Borneo and Sumatra/Java. Their estimates
from mitochondrial sequences date species divergence
to the early to mid-Pleistocene, 1.8–0.78 Ma. Here, we
test this hypothesis based on the expectations of early
to mid-Pleistocene-dated divergence between landmas-
ses and lack of recent or ongoing gene flow, despite the
potential for this to occur during glacial periods. Alter-
natively, if historical high sea levels only intermittently
interrupted gene flow across these landmasses, we
would expect divergence times to be much shorter than
if isolation had been complete throughout Pleistocene,
and/or recent dispersal between landmasses dating up
to even the most recent last glacial maximum (LGM).
Anopheles sundaicus s.l. is a primary malaria vector
(Sinka et al. 2011), so studies of diversification within
© 2014 John Wiley & Sons Ltd
2574 M. ZAROWIECKI ET AL.
this taxon are also needed to inform epidemiological
studies (Morgan et al. 2013). Although there is no mor-
phological differentiation within the taxon, it has long
been suspected to comprise a species complex due to
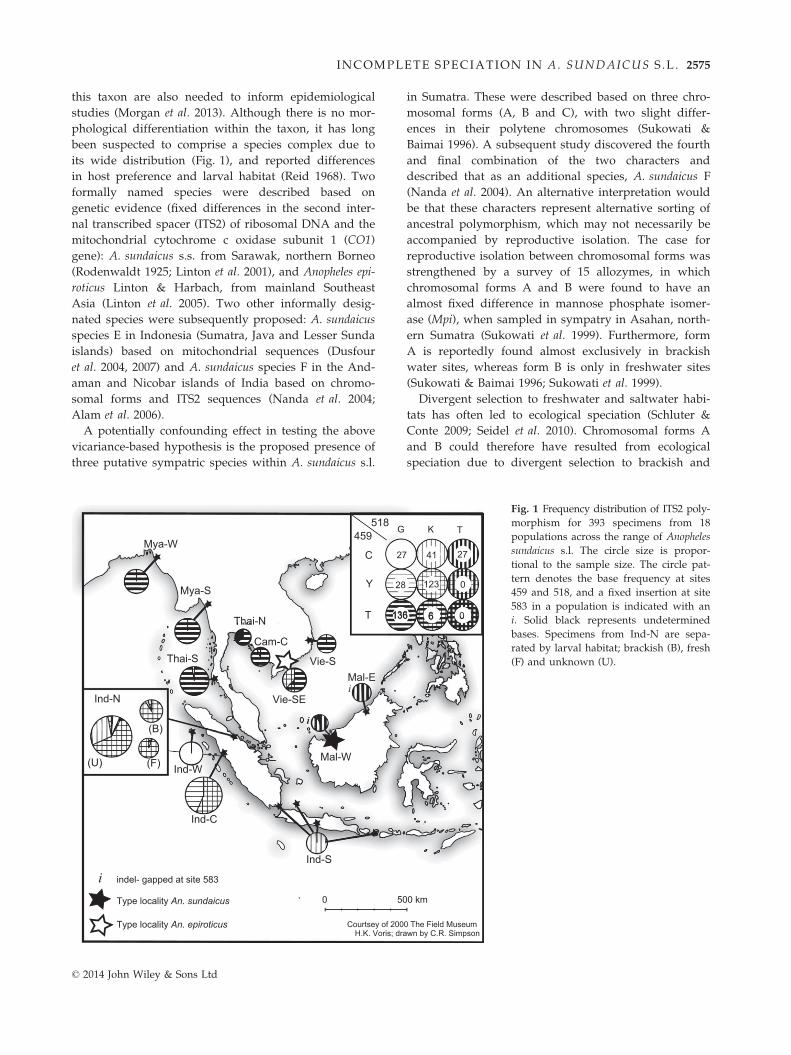
its wide distribution (Fig. 1), and reported differences
in host preference and larval habitat (Reid 1968). Two
formally named species were described based on
genetic evidence (fixed differences in the second inter-
nal transcribed spacer (ITS2) of ribosomal DNA and the
mitochondrial cytochrome c oxidase subunit 1 (CO1)
gene): A. sundaicus s.s. from Sarawak, northern Borneo
(Rodenwaldt 1925; Linton et al. 2001), and Anopheles epi-
roticus Linton & Harbach, from mainland Southeast
Asia (Linton et al. 2005). Two other informally desig-
nated species were subsequently proposed: A. sundaicus
species E in Indonesia (Sumatra, Java and Lesser Sunda
islands) based on mitochondrial sequences (Dusfour
et al. 2004, 2007) and A. sundaicus species F in the And-
aman and Nicobar islands of India based on chromo-
somal forms and ITS2 sequences (Nanda et al. 2004;
Alam et al. 2006).
A potentially confounding effect in testing the above
vicariance-based hypothesis is the proposed presence of
three putative sympatric species within A. sundaicus s.l.
in Sumatra. These were described based on three chro-
mosomal forms (A, B and C), with two slight differ-
ences in their polytene chromosomes (Sukowati &
Baimai 1996). A subsequent study discovered the fourth
and final combination of the two characters and
described that as an additional species, A. sundaicus F
(Nanda et al. 2004). An alternative interpretation would
be that these characters represent alternative sorting of
ancestral polymorphism, which may not necessarily be
accompanied by reproductive isolation. The case for
reproductive isolation between chromosomal forms was
strengthened by a survey of 15 allozymes, in which
chromosomal forms A and B were found to have an
almost fixed difference in mannose phosphate isomer-
ase (Mpi), when sampled in sympatry in Asahan, north-
ern Sumatra (Sukowati et al. 1999). Furthermore, form
A is reportedly found almost exclusively in brackish
water sites, whereas form B is only in freshwater sites
(Sukowati & Baimai 1996; Sukowati et al. 1999).
Divergent selection to freshwater and saltwater habi-
tats has often led to ecological speciation (Schluter &
Conte 2009; Seidel et al. 2010). Chromosomal forms A
and B could therefore have resulted from ecological
speciation due to divergent selection to brackish and
Courtsey of 2000 The Field MuseumH.K. Voris; drawn by C.R. Simpson
0 500 km
Cam-C
Mal-E
Ind-S
Mya-W
Thai-N
Vie-SE
Vie-S
Type locality An. sundaicus
Type locality An. epiroticus
Thai-S
Y
C
G K T
28
27 41
123
27
T 136 6
0
0
459518
Mal-W
Ind-C
Ind-N
Ind-W
Mya-S
(B)
(U) (F)
i
i
i indel- gapped at site 583
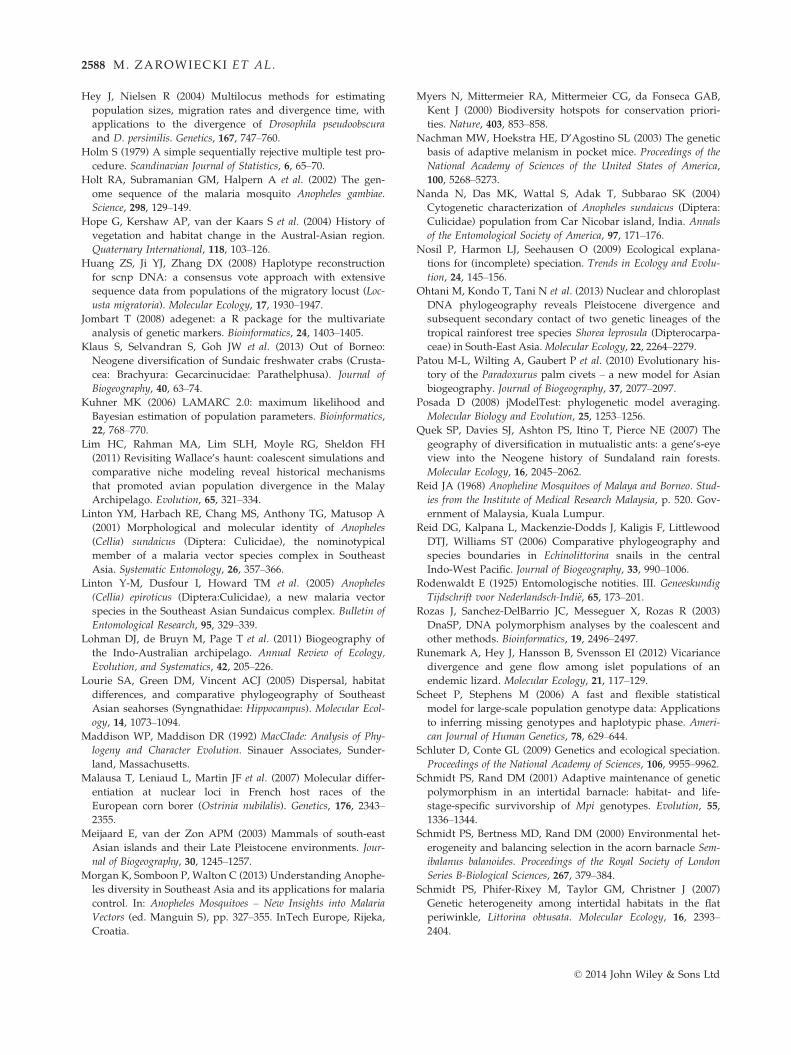
Fig. 1 Frequency distribution of ITS2 poly-
morphism for 393 specimens from 18
populations across the range of Anopheles
sundaicus s.l. The circle size is propor-
tional to the sample size. The circle pat-
tern denotes the base frequency at sites
459 and 518, and a fixed insertion at site
583 in a population is indicated with an
i. Solid black represents undetermined
bases. Specimens from Ind-N are sepa-
rated by larval habitat; brackish (B), fresh
(F) and unknown (U).
© 2014 John Wiley & Sons Ltd
INCOMPLETE SPECIATION IN A. SUNDAICUS S .L . 2575
fresh water, respectively, acting on either Mpi directly
or a region of the genome close to Mpi. An alternative
hypothesis is that chromosomal forms A and B do not
correspond to species and that Mpi is under balancing
selection, as has been proposed in barnacles (Schmidt
et al. 2000; Schmidt & Rand 2001) and periwinkles
(Schmidt et al. 2007), where Mpi genotypes differ in fit-
ness between habitats with different thermal and desic-
cation stress. Dusfour et al. (2007) found no population
structure between freshwater and brackish populations.
However, this does not disprove ecological speciation
because only those regions directly involved in diver-
gent selection will differentiate during the early stages
of the speciation process (Wu & Ting 2004). Here, we
use the Mpi gene to enable us to first test the hypothesis
of ecological differentiation within Sumatra. Having
eliminated the potential confounding effects of ecologi-
cal differentiation, we go on to use Mpi, CO1 and ITS2
sequences to test the above Pleistocene vicariance-based
hypothesis of Dusfour et al. (2007) of distinct species
among different landmasses. We predict we will have
greater power than Dusfour et al. (2007) to test the
hypothesis of allopatric speciation as we use a much
larger sample size (388 vs. 88 individuals) and employ
three loci rather than two.
Materials and methods
Samples used
Adult and immature mosquitoes were collected from 16
sites in six countries across the reported range of
Anopheles sundaicus s.l. (Fig 1, Table 1), including speci-
mens from the neotype series of A. sundaicus s.s.
(Malaysian Borneo, Mal-W) (Linton et al. 2001) and the
type series of Anopheles epiroticus (Vietnam, Vie-SE)
(Linton et al. 2005). In Asahan, larval specimens from
brackish (Ind-N-B) and fresh water (Ind-N-F) were col-
lected from habitats within a 2-km radius. Water salini-
ties of ≥3 ppm (parts per million) were classed as
brackish, and those ≤0.5 ppm as fresh. Anopheles subpic-
tus (Vietnam, Ho Chi Minh, n = 2) and Anopheles litoral-
is (Philippines, Luzon, Moron Bataan, n = 13) were
used as outgroup taxa. Sample sizes, exact localities
and GenBank accession numbers are given in Table S1
(Supporting Information).
DNA extraction, amplification and sequencing
DNA was extracted using either the phenol–chloroform
procedure of Linton et al. (2001) or the QIAGEN DNeasy
Tissue Kit (QIAGEN, Crawley, England). Amplification of
CO1 (442 bp) and ITS2 (619–620 bp) was conducted fol-
lowing Linton et al. (2001). Only those samples verified as
A. sundaicus s.l. by ITS2 sequence data were used. TheMpi
gene in A. sundaicus was identified by homology with
Anopheles gambiae (Ensembl ref. AGAP000053). A sequence
of 848 bp was generated for the Mpi gene from two over-
lapping PCR fragments (see Appendix S1, Supporting
Information for primer details).
PCR products were purified using either the QIA-
quick PCR Purification Kit (QIAGEN, Crawley, UK) or
ExoSAP-IT (USB, Cleveland, Ohio, USA) prior to bidi-
rectional sequencing using the Big Dye Terminator Kit
on an ABI 3730 automated sequencer (PE Applied Bio-
Systems, Foster City, CA, USA). Sequence chromato-
grams were assembled and edited manually in
Sequencher version 4.8 (Gene Codes Corporation, Ann
Arbor, Michigan, USA). Alignments were made in CLU-
STALW (Thompson et al. 1994) and checked manually in
MacClade version 4.06 (Maddison & Maddison 1992).
Data management and assembly
Despite high heterozygosity for Mpi in adult females
(114 heterozygotes from a total of 172 individuals), no
heterozygotes were encountered in the 20 adult males.
This complete lack of heterozygotes in males and the
mapping of Mpi to the X-chromosome in A. gambiae
(Holt et al. 2002) indicate that Mpi is located on the
X-chromosome in A. sundaicus s.l.Because there are no
morphological differences or genetic markers to deter-
mine the sex of larval mosquitoes, a sex had to be
assigned for the 14 larval homozygotes we found. Their
sexes were assigned based on the levels of heterozygous
vs. homozygous females in the adult population, in
order to minimize any errors in the estimated haplotype
frequencies of the populations.
Three different algorithms were used to infer the Mpi
haplotypes of heterozygous females from genotypic
sequences (n = 114): (i) a pseudo-Bayesian approach
(ELB; Excoffier, Laval, Balding) (Excoffier et al. 2003), as
implemented in Arlequin version 3.11 (Excoffier et al.
2005), (ii) the expectation–maximization (EM) method
fastPHASE (Scheet & Stephens 2006) and (iii) the simple
inference method in Beagle version 3.0 (Browning &
Browning 2009). The ELB solution was derived follow-
ing three independent runs generating 2000 sets of
inferred haplotypes, sampled with an interval of 5000,
heterozygous site influence zone 5, and Dirichlet prior,
gamma and epsilon value of 0.1. One million samples
were discarded as burn-in. Although the phase infer-
ence methods assume Hardy–Weinberg equilibrium
(HWE), deviation from HWE does not appear to greatly
affect the performance of these methods (Stephens &
Scheet 2005; Scheet & Stephens 2006).
In fastPHASE and Beagle, homozygotes were used to
guide the solutions, while the Arlequin ELB algorithm
© 2014 John Wiley & Sons Ltd
2576 M. ZAROWIECKI ET AL.
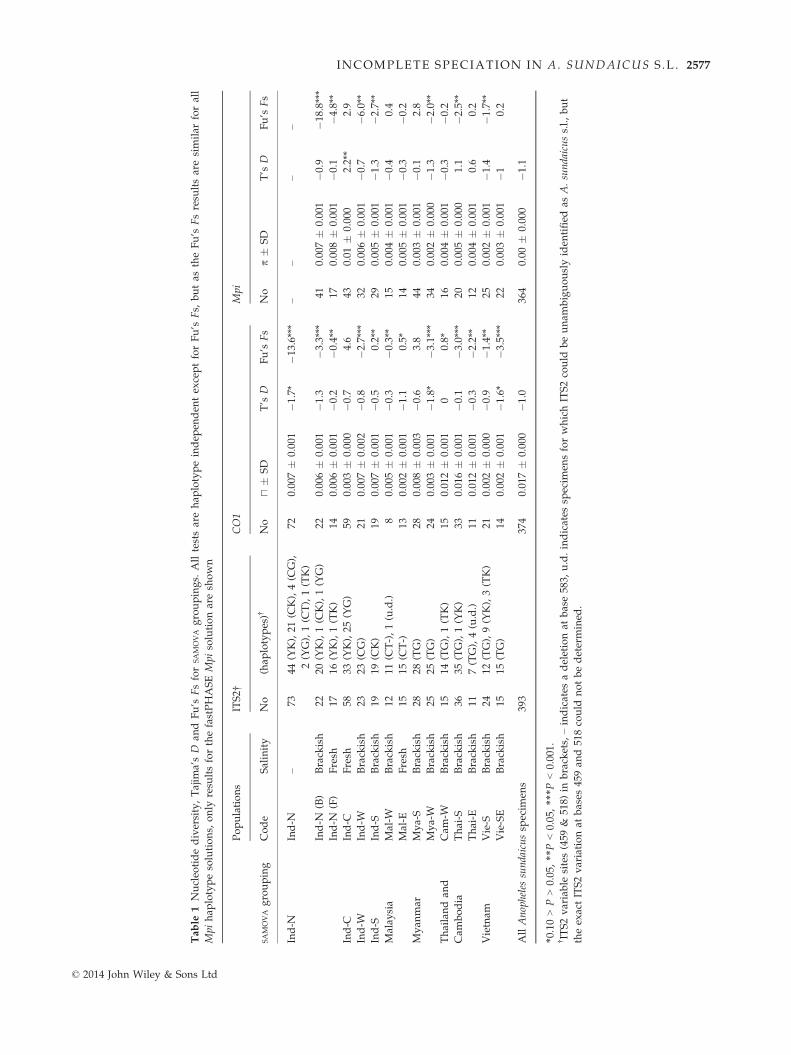
Table
1Nucleo
tidediversity,Tajim
a’sD
andFu’s
Fsfor
SAMOVAgroupings.
Alltestsarehap
lotypeindep
enden
texceptforFu’s
Fs,
butas
theFu’s
Fsresu
ltsaresimilar
forall
Mpi
hap
lotypesolutions,
only
resu
ltsforthefastPHASEMpi
solutionaresh
own
SAMOVAgrouping
Populations
ITS2†
CO1
Mpi
Code
Salinity
No
(hap
lotypes)†
No
u�
SD
T’s
DFu’s
Fs
No
p�
SD
T’s
DFu’s
Fs
Ind-N
Ind-N
–73
44(YK),21
(CK),4(C
G),
2(YG),1(C
T),1(TK)
720.007�
0.001
�1.7*
�13.6***
––
––
Ind-N
(B)
Brackish
2220
(YK),1(C
K),1(YG)
220.006�
0.001
�1.3
�3.3***
410.007�
0.001
�0.9
�18.8***
Ind-N
(F)
Fresh
1716
(YK),1(TK)
140.006�
0.001
�0.2
�0.4**
170.008�
0.001
�0.1
�4.8**
Ind-C
Ind-C
Fresh
5833
(YK),25
(YG)
590.003�
0.000
�0.7
4.6
430.01
�0.000
2.2**
2.9
Ind-W
Ind-W
Brackish
2323
(CG)
210.007�
0.002
�0.8
�2.7***
320.006�
0.001
�0.7
�6.0**
Ind-S
Ind-S
Brackish
1919
(CK)
190.007�
0.001
�0.5
0.2**
290.005�
0.001
�1.3
�2.7**
Malay
sia
Mal-W
Brackish
1211
(CT-),1(u.d.)
80.005�
0.001
�0.3
�0.3**
150.004�
0.001
�0.4
0.4
Mal-E
Fresh
1515
(CT-)
130.002�
0.001
�1.1
0.5*
140.005�
0.001
�0.3
�0.2
Myan
mar
Mya-S
Brackish
2828
(TG)
280.008�
0.003
�0.6
3.8
440.003�
0.001
�0.1
2.8
Mya-W
Brackish
2525
(TG)
240.003�
0.001
�1.8*
�3.1***
340.002�
0.000
�1.3
�2.0**
Thailandan
dCam
-WBrackish
1514
(TG),1(TK)
150.012�
0.001
00.8*
160.004�
0.001
�0.3
�0.2
Cam
bodia
Thai-S
Brackish
3635
(TG),1(YK)
330.016�
0.001
�0.1
�3.0***
200.005�
0.000
1.1
�2.5**
Thai-E
Brackish
117(TG),4(u.d.)
110.012�
0.001
�0.3
�2.2**
120.004�
0.001
0.6
0.2
Vietnam
Vie-S
Brackish
2412
(TG),9(YK),3(TK)
210.002�
0.000
�0.9
�1.4**
250.002�
0.001
�1.4
�1.7**
Vie-SE
Brackish
1515
(TG)
140.002�
0.001
�1.6*
�3.5***
220.003�
0.001
�10.2
AllAnophelessundaicussp
ecim
ens
393
374
0.017�
0.000
�1.0
364
0.00
�0.000
�1.1
*0.10>P>0.05,**P<0.05,***P
<0.001.
†ITS2variable
sites(459
&518)
inbrackets,
–indicates
adeletionat
base583,
u.d.indicates
specim
ensforwhichITS2could
beunam
biguouslyiden
tified
asA.sundaicuss.l.,but
theexactITS2variationat
bases
459an
d518could
notbedetermined
.
© 2014 John Wiley & Sons Ltd
INCOMPLETE SPECIATION IN A. SUNDAICUS S .L . 2577
did not allow for their incorporation. fastPHASE was
run with 30 random starts, 100 iterations and 200 sam-
ples from the posterior distribution. For each Beagle
run, four samples were taken per individual and 10
iterations performed, following the author’s recommen-
dations. Each calculation was repeated three times in
both fastPHASE and Beagle. Consistently resolved indi-
viduals in all three iterations were included in a new
input file as known haplotypes, and the calculations
were repeated a further three times. Solutions for any
remaining ambiguous individuals were deduced from
the consensus solution of the three estimations. To
assess the level of agreement both within and between
inference methods, resultant haplotypes were counted
and compared using individual resolving discrepancy
(IRD) statistics (Huang et al. 2008). All subsequent
analyses were performed using the optimal solutions
from each of the haplotype inference methods, unless
otherwise stated.
Models of sequence evolution were tested in jModel-
test version 0.1.1 using the Akaike information criterion
(Posada 2008). The resulting optimal substitution model
for the CO1 and both Mpi data sets was TIM + I + Γ.For the CO1 data, invariable sites (I) = 0.762 and
gamma (Γ) distribution shape parameter a = 0.936. For
alternative Mpi haplotype inferences, the corresponding
values were similar: ELB (I) = 0.834, a = 0.544; Beagle
(I) = 0.851, a = 0.647; fastPHASE (I) = 0.853, a = 0.655.
The ti/tv ratio was 4.4 for CO1 and 2.29 (ELB), 2.51
(Beagle) and 2.59 (fastPHASE) for Mpi.
Testing for divergent adaptation/balancing selection tofreshwater and brackish water habitats
To determine to what extent Mpi, or its genomic region,
is involved in divergent adaptation or balancing selec-
tion to freshwater and brackish water habitats, we con-
ducted an analysis of molecular variance (AMOVA) in
Arlequin version 3.11, with individuals grouped accord-
ing to their origin from brackish or freshwater larval
sites. Significance was tested using 10 000 permutations.
This analysis was only performed for Asahan (Ind-N),
as this is the only site containing sympatric brackish
and freshwater habitats. For this analysis, we increased
the length of the Mpi gene to comprise a contiguous
sequence of 1202 bp, almost the entire gene (excluding
only primer binding sites; 42 bp at the 50 end and 36 bp
at the 30 end). (See Appendix S1, Supporting Informa-
tion for primer details.) We refer to this as the extended
Mpi data set. The length of Mpi was increased for this
analysis as long-term balancing selection can generate
short-length linkage disequilibrium, which might result
in loss of the signal in the shorter fragment. Divergent
ecological adaptation (or balancing selection) was also
assessed by testing for heterozygote deficiency in Mpi
sequences from the female specimens from Asahan, the
site containing sympatric brackish and freshwater habi-
tats.
Population structure, polymorphism and haplotypegenealogy
As four of the small samples (n < 10) from southern
Indonesia (Java Island and Legundi Island, southern-
most Sumatra) were genetically very similar at all three
markers, they were merged into one population (Ind-S)
(detailed in Table S1, Supporting Information). Pairwise
differentiation between all populations was assessed
using analysis of molecular variance (AMOVA) and signif-
icance tested using 1000 permutations in Arlequin ver-
sion 3.11. Significance levels were corrected for multiple
testing using sequential Bonferroni correction (Holm
1979). Spatial analysis of molecular variance (SAMOVA)
(Dupanloup et al. 2002) was used to identify genetically
distinct groups of populations in which populations
were minimally differentiated within groups and
groups maximally genetically differentiated from each
other. Population divergence was visualized using a
principle components analysis (PCA) scatterplot gener-
ated using the R-package adegenet version 1.3.8 (Jom-
bart 2008). Nucleotide diversity (p) and Tajima’s D
were calculated in DnaSP version 4.90 (Rozas et al.
2003). Arlequin version 3.11 was used to estimate Fu’s
Fs (10 000 permutations) and to construct the mini-
mum-spanning haplotype networks (Excoffier et al.
1992).
Estimating divergence, gene flow and populationgrowth
To estimate the time of divergence and assess gene flow
between the three allopatric species previously pro-
posed within our study region (Dusfour et al. 2007), an
isolation-with-migration (IM) model was applied using
IMa (Hey & Nielsen 2004). Upper bounds for the prior
distribution were estimated from initial runs, and the
final Markov Chain Monte Carlo (MCMC) length was
approximately 5 000 000 million generations, sampling
every 200th generation and discarding a burn-in of
1 000 000 steps. IMa was only run with the Mpi fast-
PHASE solution (see Results). Analysis of the three
populations simultaneously was attempted using multi-
population IM, but the computations did not converge,
as the number of loci was too few to estimate this much
larger set of parameters. Confidence intervals were cal-
culated as the lower and upper bounds of the estimated
90% highest posterior density (HPD) intervals. In
order to get approximations of the divergence rates to
© 2014 John Wiley & Sons Ltd
2578 M. ZAROWIECKI ET AL.
compare to those previously reported (Dusfour et al.
2007), we used the same mutation rate for CO1, based
on the estimated rate of arthropod mitochondrial diver-
gence of 2.3% per Myr (Brower 1994). LAMARC 2.0
(Kuhner 2006) was also used to estimate gene flow and
effective population size, generating 100 000 samples,
sampling every 100 generations, from four heated
chains.
Results
Summary of ITS2, CO1 and Mpi data sets
ITS2 (619–620 bp) was sequenced from 393 Anopheles
sundaicus s.l. specimens (Fig. 1, Table S1, Supporting
Information), including all specimens sequenced for
Mpi and CO1. Three sites in ITS2 were variable: 459,
518 and 583 (Table 1, Fig. 1). The Borneo populations
(Mal-W, Mal-E) were most distinctive in having fixed
differences at sites 459, 518 and a deletion at site 583
relative to all other populations (Fig. 1). The mainland
populations are distinct from Borneo in having exclu-
sively or predominantly T and G at sites 459 and 518,
whereas the Ind-W population is fixed for C (459) and
G (518). However, we observed high levels of intraindi-
vidual variation at these bases in all Indonesian popula-
tions (except Ind-W) and in Vie-S. So while our results
are consistent with the ITS2 sequences reported previ-
ously for each species described from the mainland,
Borneo and Sumatra (Linton et al. 2001, 2005; Alam
et al. 2006; Dusfour et al. 2007; Surendran et al. 2010),
they also show that the distinction between them is less
marked than previously noted.
Haplotypes were inferred statistically for the main Mpi
data set (sequences of 848 bp) for use in population and
phylogeographical analysis. Haplotype inference was
most consistent between runs using the ELB method,
with an IRD of 0.04. The IRD values for Beagle and fast-
PHASE were 0.39 and 0.32, respectively, which improved
after the second round of solutions to 0.13 and 0.05. The
levels of discrepancy between optimal solutions from dif-
ferent methods are only slightly greater than those
between solutions of the same method; IRD = 0.13
between ELB and fastPHASE and IRD = 0.15 between
Beagle and ELB and between Beagle and fastPHASE.
This consistency between the haplotype inference meth-
ods was reflected in the similar numbers of unique haplo-
types inferred (147 unique haplotypes from ELB, 149
from fastPHASE and 146 from Beagle) with all the most
frequent haplotypes being recovered in similar numbers
in all three solutions (results not shown). The most
common phase-solving uncertainties were due either to
spurious placement of unique singleton mutations or to
the genuine difficulty of Beagle and fastPHASE to deal
consistently with individuals carrying two highly diver-
gent alleles (>10 polymorphic sites). All analyses (except
IMa) were conducted using the optimal solution for each
of the phase-solving methods, and no significant differ-
ences were observed. Consequently, we typically only
show the results obtained from the fastPHASE data set as
this had the lowest IRD value.
The main Mpi data set comprised 365 sequences
inferred from 192 sequenced specimens of A. sundaicus
(20 males and 172 females). The 848-bp Mpi fragment
had an average of 4.3 polymorphic sites within hetero-
zygote individuals (max = 16, min = 1). For a subset of
samples from northern Sumatra, an extended Mpi frag-
ment data set (see Materials and Methods) was gener-
ated; for Ind-N (F) n = 23; Ind-N (B) n = 34; and Ind-C
(F) n = 31 (Table S1, Supporting Information). The
extended Mpi fragment has 54 unique haplotypes with
4.4% variable sites. The CO1 sequences (442 bp) from
374 specimens of A. sundaicus s.l. display 116 haplo-
types and 14% variable sites. An additional 10 haplo-
types were found in 14 outgroup sequences (Table S1,
Supporting Information).
Testing for differentiation between larval habitats
We tested the hypothesis that Mpi is either directly
involved in divergent selection or linked to such a
region, by testing whether Mpi sequences display
greater genetic differentiation among habitats from the
same site than between geographically distant sites of
the same habitat. Neutral unlinked markers, that is,
CO1, may show the same pattern if there is some repro-
ductive isolation. Contrary to these expectations, AMOVA
using freshwater and brackish water samples (Ind-F
and Ind-B) from the same village (Asahan, northern
Sumatra) as groups revealed that genetic variation did
not segregate according to larval habitat; between-group
genetic variance is �0.06% (P = 0.18) for the extended
Mpi data set and 2.59% for CO1, which was also non-
significant (P = 0.31). However, the comparison of the
total Ind-N sample (i.e. individuals from both fresh and
brackish water) to the freshwater population, Ind-C (F)
~200 km away, revealed that a significant proportion of
variation was explained by geographical differentiation
(10.21%, P < 0.001 for Mpi; 37.74%, P = 0.02 for CO1).
Further, there was no evidence for heterozygote defi-
ciency in Mpi in the combined freshwater and brackish
water samples from Asahan (Ind-N) (Fig. S1, Support-
ing Information). This directly contradicts a previous
report of lack of HWE for Mpi allozyme genotypes from
this same location (Sukowati & Baimai 1996).
The lack of genetic differentiation at Mpi between
habitats does not support the involvement of this geno-
mic region in ecological differentiation, either related to
© 2014 John Wiley & Sons Ltd
INCOMPLETE SPECIATION IN A. SUNDAICUS S .L . 2579
speciation or to balancing selection within species.
Given this lack of evidence for selection on Mpi, we
therefore used the main Mpi data set to test the vicari-
ance-based hypothesis of A. sundaicus s.l. differentiation
throughout its known distribution.
Genetic diversity of CO1 and Mpi
There was a tendency for the peripheral populations to
have lower nucleotide diversity (p) (i.e. Vie-S, Vie-SE
and Mya-W for both CO1 and Mpi; Mya-S for Mpi
alone; and Mal-E for CO1 alone), whereas the popula-
tions that are more central in the current species distri-
bution (Cam-W, Thai-S and Thai-E) have higher genetic
diversity for CO1 (although not for Mpi) (Table 1). For
the majority of populations for both markers, Tajima’s
D and Fu’s Fs are negative, although only the values
for Fu’s Fs are significantly different from 0. Because
both CO1 and Mpi show this pattern, it suggests a sig-
nal of population expansion (rather than background
selection or a selective sweep of mtDNA as can com-
monly occur) (Bazin et al. 2006). The signal of expansion
in Fu’s Fs is strongest in the Ind-N population. Ind-C is
unusual in having positive values for Fu’s Fs for both
markers and a significant and positive value of Tajima’s
D for Mpi, which may indicate genetic admixture in this
population (Table 1).
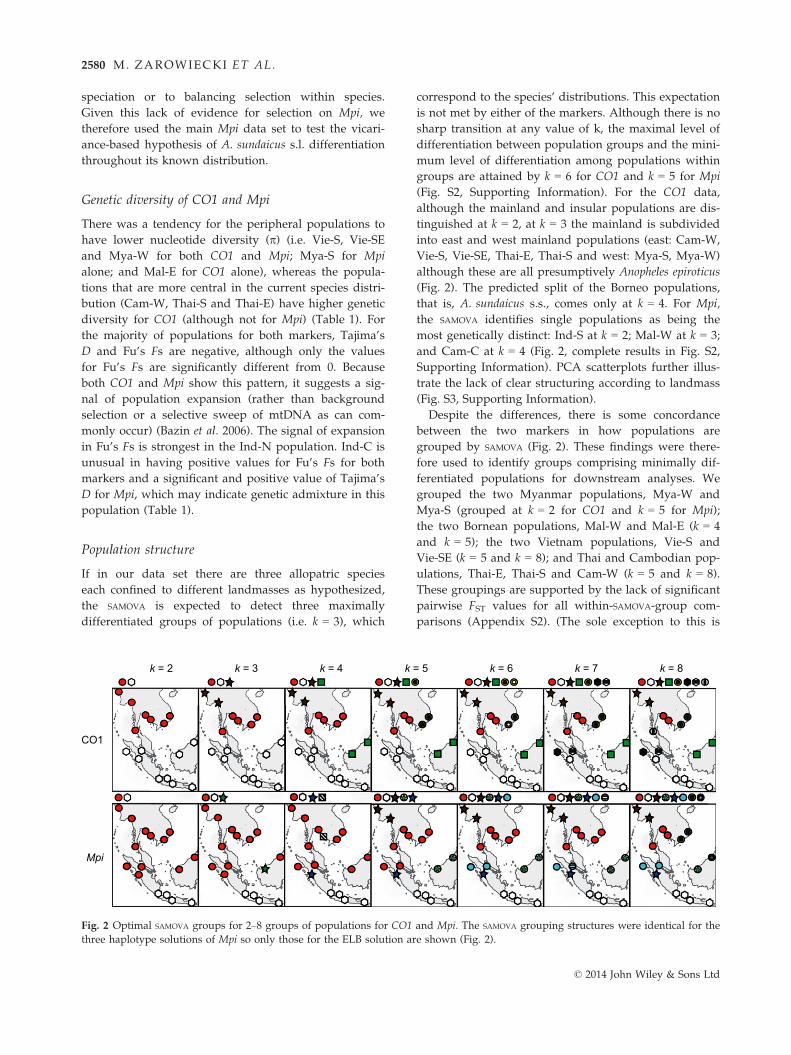
Population structure
If in our data set there are three allopatric species
each confined to different landmasses as hypothesized,
the SAMOVA is expected to detect three maximally
differentiated groups of populations (i.e. k = 3), which
correspond to the species’ distributions. This expectation
is not met by either of the markers. Although there is no
sharp transition at any value of k, the maximal level of
differentiation between population groups and the mini-
mum level of differentiation among populations within
groups are attained by k = 6 for CO1 and k = 5 for Mpi
(Fig. S2, Supporting Information). For the CO1 data,
although the mainland and insular populations are dis-
tinguished at k = 2, at k = 3 the mainland is subdivided
into east and west mainland populations (east: Cam-W,
Vie-S, Vie-SE, Thai-E, Thai-S and west: Mya-S, Mya-W)
although these are all presumptively Anopheles epiroticus
(Fig. 2). The predicted split of the Borneo populations,
that is, A. sundaicus s.s., comes only at k = 4. For Mpi,
the SAMOVA identifies single populations as being the
most genetically distinct: Ind-S at k = 2; Mal-W at k = 3;
and Cam-C at k = 4 (Fig. 2, complete results in Fig. S2,
Supporting Information). PCA scatterplots further illus-
trate the lack of clear structuring according to landmass
(Fig. S3, Supporting Information).
Despite the differences, there is some concordance
between the two markers in how populations are
grouped by SAMOVA (Fig. 2). These findings were there-
fore used to identify groups comprising minimally dif-
ferentiated populations for downstream analyses. We
grouped the two Myanmar populations, Mya-W and
Mya-S (grouped at k = 2 for CO1 and k = 5 for Mpi);
the two Bornean populations, Mal-W and Mal-E (k = 4
and k = 5); the two Vietnam populations, Vie-S and
Vie-SE (k = 5 and k = 8); and Thai and Cambodian pop-
ulations, Thai-E, Thai-S and Cam-W (k = 5 and k = 8).
These groupings are supported by the lack of significant
pairwise FST values for all within-SAMOVA-group com-
parisons (Appendix S2). (The sole exception to this is
CO1
k = 4
Mpi
k = 5 k = 6 k = 7 k = 8k = 2 k = 3
Fig. 2 Optimal SAMOVA groups for 2–8 groups of populations for CO1 and Mpi. The SAMOVA grouping structures were identical for the
three haplotype solutions of Mpi so only those for the ELB solution are shown (Fig. 2).
© 2014 John Wiley & Sons Ltd
2580 M. ZAROWIECKI ET AL.
the high FST value for the Borneo populations for Mpi
but we retained Borneo as a single group due to their
geographical proximity and lack of differentiation at
CO1.) The remaining populations, Ind-N, Ind-C, Ind-W
and Ind-S, were retained separately as they were not
grouped by the SAMOVA. Among these eight groups,
pairwise differentiation is generally very high with
good agreement between the CO1 and Mpi markers
(Table 2), further validating the choice of these eight
groupings for downstream analyses.
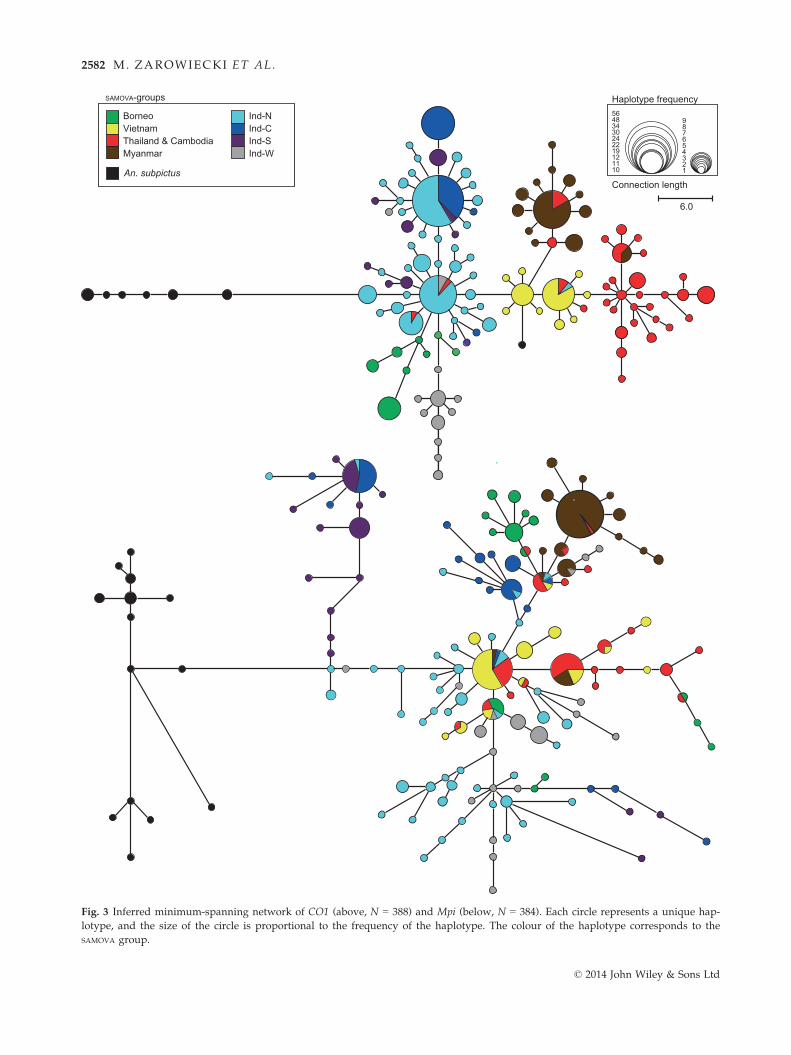
CO1 and Mpi networks
The minimum-spanning networks for the CO1 and the
Mpi genes are shown in Fig. 3. The multiple star-like
clusters in both the CO1 and the Mpi networks concur
with the neutrality tests in indicating demographic
expansion. In the Mpi network, the haplotypes from a
given SAMOVA group tend to occur at two or more places
around the network which, given the contrast with the
CO1 haplotype network, are most likely due to incom-
plete lineage sorting at the nuclear gene, as expected
for its larger effective population size. The relationships
between population groupings in the CO1 and Mpi net-
works are also similar. For both genes, the outgroup
haplotypes connect to the network via northern Suma-
tra (Ind-N) with the other Indonesian groupings, Ind-C,
Ind-W and Ind-S, all being derived from Ind-N. The
Borneo SAMOVA group is also derived from Ind-N for the
CO1 gene, although the Mpi haplotypes are distributed
across the network. In both cases, the Vietnam haplo-
types are more central in the network, whereas the
Myanmar, and Thailand & Cambodia haplotypes are
more external (Fig. 3), indicating that these latter popu-
lations may be the result of colonization from Vietnam.
Divergence and gene flow
If vicariance has generated three allopatric species in
this study region during the Pleistocene, as proposed
(Dusfour et al. 2007), we expect to observe Pleistocene-
dated divergence among landmasses. If merging coast-
lines during glacial periods facilitate dispersal among
landmasses, we expect to detect gene flow during the
Pleistocene. Divergence and gene flow were explored
using IMa and LAMARC analyses of the combined
CO1 and Mpi data sets. IMa was applied to the three
proposed species as a set of pairwise comparisons as
the application of multipopulation IMa to three popula-
tions failed to converge. As LAMARC is better suited to
the analysis of gene flow among multiple populations,
we were able to compare gene flow within and among
landmasses by applying LAMARC to the SAMOVA
groups.
Analysis using LAMARC showed that only a few
pairs of population groups had a minimum number of
migrants/generation significantly higher than zero
(Table 3). Most instances of gene flow were bidirec-
tional and between the geographically closest popula-
tions (Table 3), but LAMARC also detected migration
across the proposed allopatric species boundaries,
between Indonesia (Ind-N) (corresponding to A. sundai-
cus E) and the mainland populations of Thailand and
Cambodia and Vietnam (corresponding to A. epiroticus)
(Table 3, Fig. 5). IMa supports LAMARC’s finding of
bidirectional gene flow between the mainland and Indo-
nesia (Sumatra/Java) and dates this to the late Pleisto-
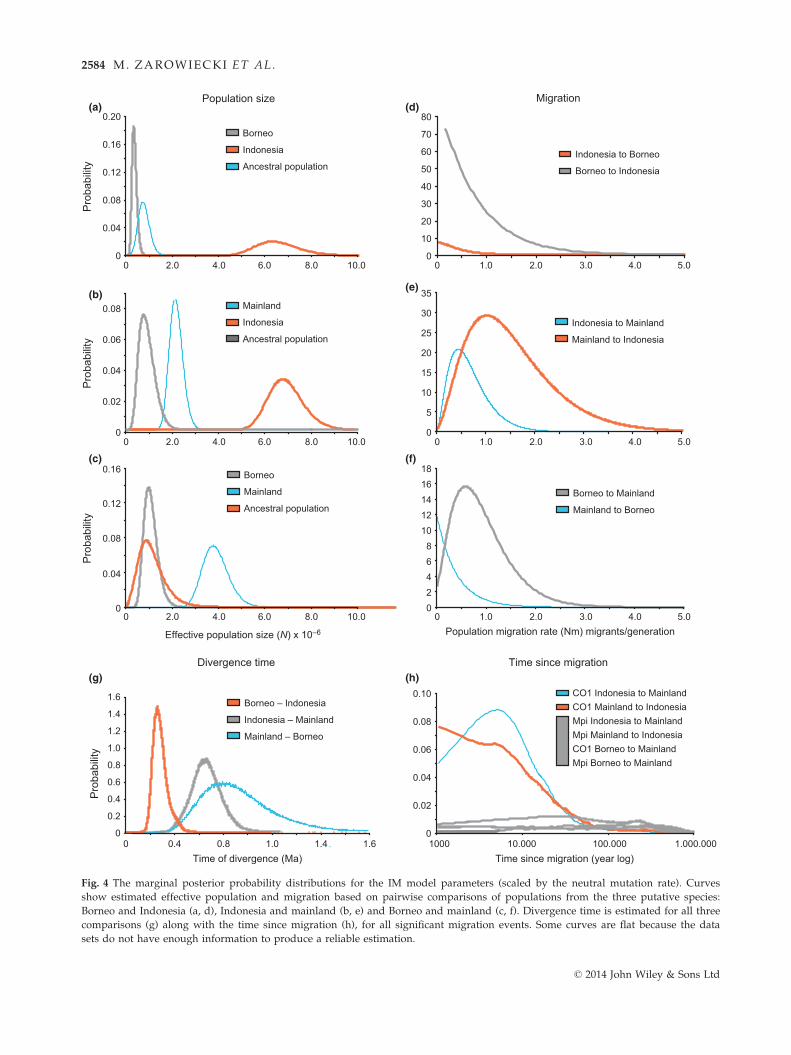
cene (Fig. 4e,h). IMa also detects unidirectional
migration from Borneo to the mainland (Fig. 4f), dating
to the late Pleistocene (but with wide confidence inter-
vals, Fig. 4h). Vicariance between Indonesia and Borneo
is estimated to be more recent, 0.26 Ma (H.P.D. 90%
0.19–0.37) (Fig. 4g), with no direct migration inferred
between Indonesia and Borneo (Fig. 4d). Splits between
putative species are estimated by IMa to occur during
the mid-Pleistocene (Fig. 4g); divergence times are 0.79
Ma (H.P.D. 90% 0.45–1.42) between the mainland
(Myanmar, Thailand and Cambodia, Vietnam) and Bor-
neo and 0.66 Ma (H.P.D. 90% 0.46–0.86) between the
mainland and Indonesia (Ind-C, Ind-N, Ind-W, Ind-S).
Table 2 Pairwise differentiation (FST) for SAMOVA grouping structure. CO1 below and Mpi above the diagonal
SAMOVA grouping Ind-N Ind-C Ind-W Ind-S Borneo Myanmar Thai & Cam Vietnam
Ind-N — 0.20 0.09 0.61 0.35 0.51 0.24 0.16
Ind-C 0.29 — 0.26 0.36 0.30 0.49 0.35 0.37
Ind-W 0.55 0.76 — 0.71 0.36 0.56 0.29 0.23
Ind-S 0.13 0.16 0.61 — 0.74 0.86 0.78 0.82
Borneo 0.58 0.79 0.66 0.64 — 0.46 0.38 0.51
Myanmar 0.71 0.81 0.78 0.74 0.78 — 0.53 0.64
Thailand and Cambodia 0.55 0.65 0.57 0.53 0.52 0.53 — 0.16
Vietnam 0.68 0.87 0.81 0.80 0.80 0.73 0.39 —
Mpi values shown are calculated from the ELB phase solution.
No value is nonsignificant after Holm’s Bonferroni correction, CO1 P (max) = 0.0046.
© 2014 John Wiley & Sons Ltd
INCOMPLETE SPECIATION IN A. SUNDAICUS S .L . 2581
56483430242219121110
987654321
Ind-NInd-CInd-SInd-W
BorneoVietnamThailand & CambodiaMyanmar
6.0
An. subpictus
SAMOVA-groups Haplotype frequency
Connection length
Fig. 3 Inferred minimum-spanning network of CO1 (above, N = 388) and Mpi (below, N = 384). Each circle represents a unique hap-
lotype, and the size of the circle is proportional to the frequency of the haplotype. The colour of the haplotype corresponds to the
SAMOVA group.
© 2014 John Wiley & Sons Ltd
2582 M. ZAROWIECKI ET AL.
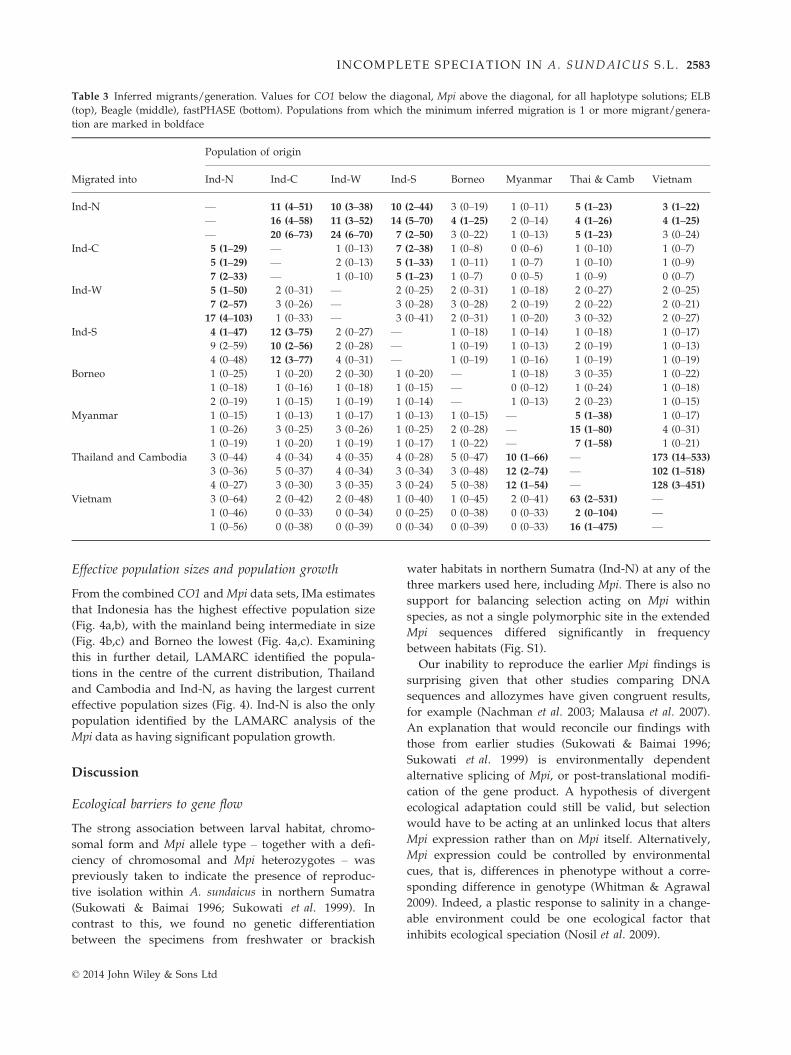
Effective population sizes and population growth
From the combined CO1 andMpi data sets, IMa estimates
that Indonesia has the highest effective population size
(Fig. 4a,b), with the mainland being intermediate in size
(Fig. 4b,c) and Borneo the lowest (Fig. 4a,c). Examining
this in further detail, LAMARC identified the popula-
tions in the centre of the current distribution, Thailand
and Cambodia and Ind-N, as having the largest current
effective population sizes (Fig. 4). Ind-N is also the only
population identified by the LAMARC analysis of the
Mpi data as having significant population growth.
Discussion
Ecological barriers to gene flow
The strong association between larval habitat, chromo-
somal form and Mpi allele type – together with a defi-
ciency of chromosomal and Mpi heterozygotes – was
previously taken to indicate the presence of reproduc-
tive isolation within A. sundaicus in northern Sumatra
(Sukowati & Baimai 1996; Sukowati et al. 1999). In
contrast to this, we found no genetic differentiation
between the specimens from freshwater or brackish
water habitats in northern Sumatra (Ind-N) at any of the
three markers used here, including Mpi. There is also no
support for balancing selection acting on Mpi within
species, as not a single polymorphic site in the extended
Mpi sequences differed significantly in frequency
between habitats (Fig. S1).
Our inability to reproduce the earlier Mpi findings is
surprising given that other studies comparing DNA
sequences and allozymes have given congruent results,
for example (Nachman et al. 2003; Malausa et al. 2007).
An explanation that would reconcile our findings with
those from earlier studies (Sukowati & Baimai 1996;
Sukowati et al. 1999) is environmentally dependent
alternative splicing of Mpi, or post-translational modifi-
cation of the gene product. A hypothesis of divergent
ecological adaptation could still be valid, but selection
would have to be acting at an unlinked locus that alters
Mpi expression rather than on Mpi itself. Alternatively,
Mpi expression could be controlled by environmental
cues, that is, differences in phenotype without a corre-
sponding difference in genotype (Whitman & Agrawal
2009). Indeed, a plastic response to salinity in a change-
able environment could be one ecological factor that
inhibits ecological speciation (Nosil et al. 2009).
Table 3 Inferred migrants/generation. Values for CO1 below the diagonal, Mpi above the diagonal, for all haplotype solutions; ELB
(top), Beagle (middle), fastPHASE (bottom). Populations from which the minimum inferred migration is 1 or more migrant/genera-
tion are marked in boldface
Migrated into
Population of origin
Ind-N Ind-C Ind-W Ind-S Borneo Myanmar Thai & Camb Vietnam
Ind-N — 11 (4–51) 10 (3–38) 10 (2–44) 3 (0–19) 1 (0–11) 5 (1–23) 3 (1–22)
— 16 (4–58) 11 (3–52) 14 (5–70) 4 (1–25) 2 (0–14) 4 (1–26) 4 (1–25)— 20 (6–73) 24 (6–70) 7 (2–50) 3 (0–22) 1 (0–13) 5 (1–23) 3 (0–24)
Ind-C 5 (1–29) — 1 (0–13) 7 (2–38) 1 (0–8) 0 (0–6) 1 (0–10) 1 (0–7)5 (1–29) — 2 (0–13) 5 (1–33) 1 (0–11) 1 (0–7) 1 (0–10) 1 (0–9)
7 (2–33) — 1 (0–10) 5 (1–23) 1 (0–7) 0 (0–5) 1 (0–9) 0 (0–7)Ind-W 5 (1–50) 2 (0–31) — 2 (0–25) 2 (0–31) 1 (0–18) 2 (0–27) 2 (0–25)
7 (2–57) 3 (0–26) — 3 (0–28) 3 (0–28) 2 (0–19) 2 (0–22) 2 (0–21)17 (4–103) 1 (0–33) — 3 (0–41) 2 (0–31) 1 (0–20) 3 (0–32) 2 (0–27)
Ind-S 4 (1–47) 12 (3–75) 2 (0–27) — 1 (0–18) 1 (0–14) 1 (0–18) 1 (0–17)9 (2–59) 10 (2–56) 2 (0–28) — 1 (0–19) 1 (0–13) 2 (0–19) 1 (0–13)
4 (0–48) 12 (3–77) 4 (0–31) — 1 (0–19) 1 (0–16) 1 (0–19) 1 (0–19)Borneo 1 (0–25) 1 (0–20) 2 (0–30) 1 (0–20) — 1 (0–18) 3 (0–35) 1 (0–22)
1 (0–18) 1 (0–16) 1 (0–18) 1 (0–15) — 0 (0–12) 1 (0–24) 1 (0–18)2 (0–19) 1 (0–15) 1 (0–19) 1 (0–14) — 1 (0–13) 2 (0–23) 1 (0–15)
Myanmar 1 (0–15) 1 (0–13) 1 (0–17) 1 (0–13) 1 (0–15) — 5 (1–38) 1 (0–17)1 (0–26) 3 (0–25) 3 (0–26) 1 (0–25) 2 (0–28) — 15 (1–80) 4 (0–31)
1 (0–19) 1 (0–20) 1 (0–19) 1 (0–17) 1 (0–22) — 7 (1–58) 1 (0–21)Thailand and Cambodia 3 (0–44) 4 (0–34) 4 (0–35) 4 (0–28) 5 (0–47) 10 (1–66) — 173 (14–533)
3 (0–36) 5 (0–37) 4 (0–34) 3 (0–34) 3 (0–48) 12 (2–74) — 102 (1–518)4 (0–27) 3 (0–30) 3 (0–35) 3 (0–24) 5 (0–38) 12 (1–54) — 128 (3–451)
Vietnam 3 (0–64) 2 (0–42) 2 (0–48) 1 (0–40) 1 (0–45) 2 (0–41) 63 (2–531) —1 (0–46) 0 (0–33) 0 (0–34) 0 (0–25) 0 (0–38) 0 (0–33) 2 (0–104) —
1 (0–56) 0 (0–38) 0 (0–39) 0 (0–34) 0 (0–39) 0 (0–33) 16 (1–475) —
© 2014 John Wiley & Sons Ltd
INCOMPLETE SPECIATION IN A. SUNDAICUS S .L . 2583
0
0.04
0.08
0.12
0.16
0.20
Borneo
Indonesia
Ancestral population
Effective population size (N) x 10–6
0
0.02
0.04
0.06
0.08 Mainland
Indonesia
Ancestral population
0
0.04
0.08
0.12
0.16 Borneo
Mainland
Ancestral population
0.2
0.4
0.6
0.8
1.0
1.2
1.4
1.6 Borneo – Indonesia
Indonesia – Mainland
Mainland – Borneo
Time of divergence (Ma)
0
5
10
15
20
25
30
35
Indonesia to Mainland
Mainland to Indonesia
02468
1012141618
Population migration rate (Nm) migrants/generation
Borneo to Mainland
Mainland to Borneo
0
10
20
30
40
50
60
70
80
Indonesia to Borneo
Borneo to Indonesia
0 2.0 4.0 6.0 8.0 10.0 0 1.0 2.0 3.0 4.0 5.0
0 2.0 4.0 6.0 8.0 10.0 0 1.0 2.0 3.0 4.0 5.0
0 2.0
0.4 0.8 1.0 1.4 1.6 1000 10.000 100.000 1.000.000
4.0 6.0 8.0 10.0 0 1.0 2.0 3.0 4.0 5.0
Time since migration (year log)
0.10
0.08
0.06
0.04
0.02
0
CO1 Indonesia to MainlandCO1 Mainland to IndonesiaMpi Indonesia to MainlandMpi Mainland to IndonesiaCO1 Borneo to MainlandMpi Borneo to Mainland
MigrationPopulation size
Time since migrationDivergence time
Pro
babi
lity
Pro
babi
lity
Pro
babi
lity
Pro
babi
lity
00
(a)
(b)
(c)
(d)
(e)
(f)
(g) (h)
Fig. 4 The marginal posterior probability distributions for the IM model parameters (scaled by the neutral mutation rate). Curves
show estimated effective population and migration based on pairwise comparisons of populations from the three putative species:
Borneo and Indonesia (a, d), Indonesia and mainland (b, e) and Borneo and mainland (c, f). Divergence time is estimated for all three
comparisons (g) along with the time since migration (h), for all significant migration events. Some curves are flat because the data
sets do not have enough information to produce a reliable estimation.
© 2014 John Wiley & Sons Ltd
2584 M. ZAROWIECKI ET AL.
Timing of Allopatric Diversification
While the divergence rate of 2.3% per Myr we applied
was estimated for the CO1 gene and for arthropod taxa
(Brower 1994), the accuracy of this rate in this specific
taxon, and of molecular clocks generally, is not known.
The divergence times estimated here should therefore be
interpreted with caution. However, because the diver-
gence rate used here is the same as that employed by
Dusfour et al. (2007), our estimates are directly compara-
ble to theirs. Dusfour et al. (2007) estimated a divergence
time for the three proposed allopatric species of 1.8–
0.78 Ma, which overlaps with our estimate for diver-
gence between the mainland and Borneo of 0.45–1.42 Ma.
By contrast, our estimates of divergence between the
mainland and Indonesia (0.46–0.86 Ma) and between
Indonesia and Borneo (0.19–0.37 Ma) are substantially
more recent. Even allowing for some error in the diver-
gence rate we have used, it seems highly likely that the
divergences and dispersals we discuss below date to the
Pleistocene and are therefore related to changes in land-
mass and sea configuration during this period.
Centre of origin and dispersal history
Reconstructing the population history of A. sundaicus
s.l. could help to determine the constraints to its dis-
persal. We found that the north Indonesian populations
are notable in having high molecular genetic diversity
at all three markers, Mpi, CO1 and ITS2, corresponding
to the high effective population sizes estimated by IMa,
as well as a greater diversity of chromosomal forms
(Sukowati & Baimai 1996). This, coupled with the posi-
tion of these populations at the core of both the CO1
and Mpi haplotype networks linked directly to the out-
group haplotypes (Fig. 3), indicates that the populations
in northern Sumatra retain more ancestral variation
than all other investigated extant populations. Popula-
tions on Borneo, Java and the mainland are therefore
likely to have been populated by dispersal from ances-
tral populations on Sumatra (Fig. 4).
As a predominantly littoral taxon, A. sundaicus s.l.
has most likely spread along the changing coastlines as
sea levels fluctuated during the Pleistocene. The dis-
persal of A. sundaicus s.l. from Sumatra to the mainland
could thus have occurred via a western coastal route; to
western Thailand and then Myanmar, or by an eastern
coastal route; in which the Sumatran coastline would
have expanded across the Gulf of Thailand ultimately
reaching Vietnam (Voris 2000). Initial spread from
Sumatra via this eastern coastal route to Vietnam is
indicated by the connection of Vietnamese haplotypes
to the northern Sumatran (Ind-N and Ind-C) haplotypes
at the core of both the CO1 and the Mpi networks
(Fig. 3) and by the shared ITS2 diversity (Fig. 1). In
both haplotype networks, the Thai and Myanmar haplo-
types are largely derived from the Vietnamese haplo-
types. This, together with the high migration rates from
Vietnam to Thailand and Cambodia inferred by LAM-
ARC (Table 3), indicates that the mainland was colo-
nized predominantly from Vietnam. As the Thai-S
population forms part of the Thailand and Cambodia
grouping yet is on the west, rather than the east coast,
there must have been some gene flow across the Thai
Peninsula. Such gene flow may be associated with inter-
glacial high stands when elevated sea levels would
have inundated much of the Isthmus of Kra, the low-
lying land spanning the peninsula ~200 km north of
population Thai-S (Woodruff & Turner 2009). Dispersal
from the mainland westwards into Myanmar is also
likely to have occurred via this route.
Gene flow across land and sea
Anopheles sundaicus s.l. has been inferred to be a species
complex comprising at least three allopatric species
resulting from vicariance due to a combination of cycli-
cal island and refugium creation due to Pleistocene sea
level changes (Dusfour et al. 2007). Our results agree
that there is some differentiation between the three allo-
patric lineages described by Dusfour et al. (2007), but
our more extensive sampling and use of additional
markers identified eight significantly divergent groups
of A. sundaicus s.l., no less differentiated than the three
purported species (Fig. 2, Table 2) and evidence of
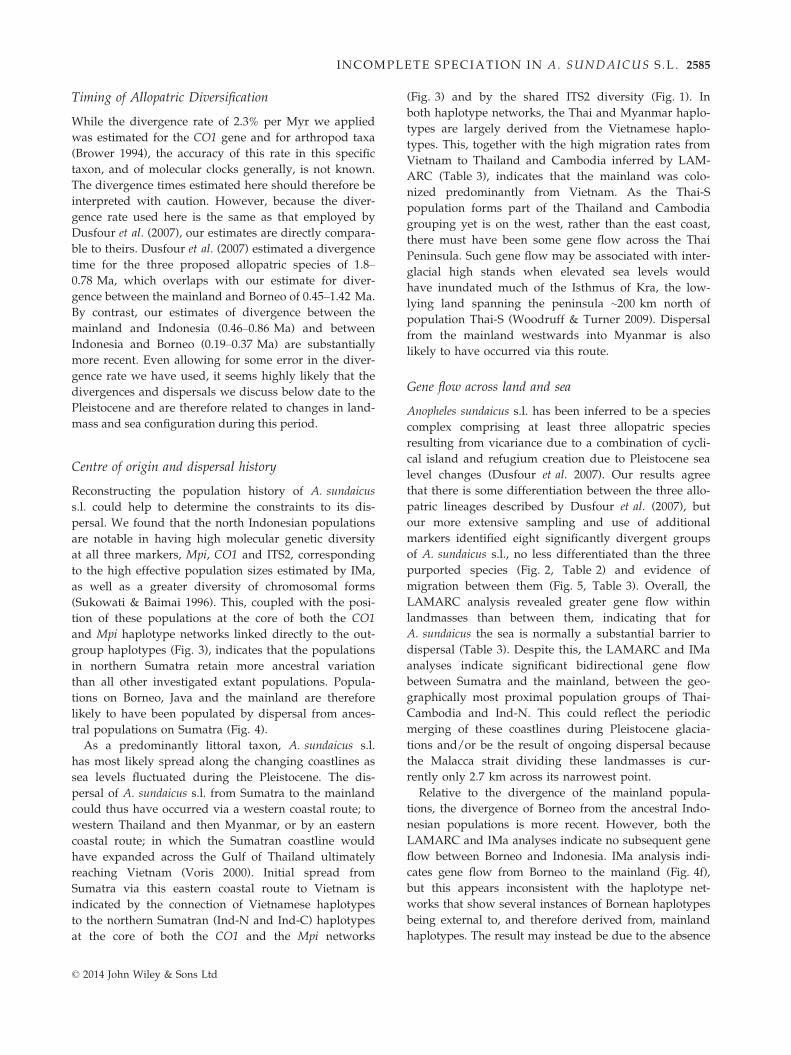
migration between them (Fig. 5, Table 3). Overall, the
LAMARC analysis revealed greater gene flow within
landmasses than between them, indicating that for
A. sundaicus the sea is normally a substantial barrier to
dispersal (Table 3). Despite this, the LAMARC and IMa
analyses indicate significant bidirectional gene flow
between Sumatra and the mainland, between the geo-
graphically most proximal population groups of Thai-
Cambodia and Ind-N. This could reflect the periodic
merging of these coastlines during Pleistocene glacia-
tions and/or be the result of ongoing dispersal because
the Malacca strait dividing these landmasses is cur-
rently only 2.7 km across its narrowest point.
Relative to the divergence of the mainland popula-
tions, the divergence of Borneo from the ancestral Indo-
nesian populations is more recent. However, both the
LAMARC and IMa analyses indicate no subsequent gene
flow between Borneo and Indonesia. IMa analysis indi-
cates gene flow from Borneo to the mainland (Fig. 4f),
but this appears inconsistent with the haplotype net-
works that show several instances of Bornean haplotypes
being external to, and therefore derived from, mainland
haplotypes. The result may instead be due to the absence
© 2014 John Wiley & Sons Ltd
INCOMPLETE SPECIATION IN A. SUNDAICUS S .L . 2585
of the Sumatran/Javan sequences in the IMa Borneo–
mainland pairwise comparison. Overall, however, the
Bornean populations are the least connected to the others
by gene flow and they have smaller estimated popula-
tion sizes. These factors are expected to contribute to the
fixation of unique mutations in ITS2. Overall therefore,
Borneo is currently the most isolated and genetically dis-
tinct grouping of A. sundaicus s.l., even though it is the
most recently formed. This is consistent with the high
endemism of many mammalian taxa on Borneo that
dates to the Pleistocene (Meijaard & van der Zon 2003;
Earl of Cranbrook 2010).
The western mainland populations (Myanmar) on the
Andaman coast were identified by the SAMOVA and the
pairwise FST comparisons to be genetically very distinct
from the eastern mainland populations (predominantly
bordering the Gulf of Thailand) (Fig. 2). Several marine
and littoral taxa [e.g. mangrove sea snakes (Alfaro et al.
2004), intertidal Echinolittorina snails (Reid et al. 2006)
and seahorses (Lourie et al. 2005)] also show genetic dis-
continuities between the Andaman Sea and the Gulf of
Thailand. Previous studies of A. sundaicus biogeography
have not allowed for east–west comparison (Dusfour
et al. 2004, 2007), but we can now conclude that there is
predominantly east–west differentiation in A. sundaicus
s.l. across mainland Southeast Asia, most likely as a
result of an interglacial landmass barrier to gene flow.
Conclusion
The formation of both land and sea barriers during
Pleistocene interglacials, as well as intrinsic limits to
species dispersal, has allowed some allopatric diversifi-
cation in this littoral taxon. This has previously been
interpreted as resulting in allopatric speciation generat-
ing at least three species. Our results cannot confirm that
conclusion, as we detect eight genetic and geographical
groupings within this study region and also evidence
for recent gene flow between them in all three genetic
markers, when Pleistocene sea level changes have so
allowed. Gene flow is generally considered to impede
speciation (Smadja & Butlin 2011), but speciation under
a vicariant scenario can proceed when there are small
amounts of gene flow, for example (Runemark et al.
2012). When there is gene flow, allopatric speciation is
expected to take longer to occur (Yamaguchi & Iwasa
0
Myanmar
Vietnam
Borneo
Thailand & Cambodia
Ind-S
Ind-W
Ind-N
Ind-C
Sea-level 75 m below present
Present sea-level
Migration event inferred by IM
Bi-directional migration inferred by Lamarc
Malacca strait
Isthmus of Kra
Sample locations
Uni-directional migration inferred by Lamarc
500 km
Fig. 5 Summary of the inferred migration
and population history of Anopheles sun-
daicus. The circles/ovals indicate each
SAMOVA group. The bold circles mark
where groups were inferred to have
undergone recent population expansion
by LAMARC and Bayesian skyline plots.
The arrows indicate inferred migration
events.
© 2014 John Wiley & Sons Ltd
2586 M. ZAROWIECKI ET AL.
2013), which is incompatible with our observation that
none of the genetic divergences, even among the land-
masses, are larger than those previously reported within
species between the mainland and Indonesian islands
(Zarowiecki et al. 2011). At present, the most genetically
isolated (but not the most divergent) Borneo populations
are most likely to be the best candidates for an indepen-
dently evolving lineage (De Queiroz 1999). However,
the dynamic Southeast Asian landmass reformation is
likely to continue to provide opportunities for recurrent
dispersal, which may delay, although not necessarily
ultimately prevent, diversification in this taxon. The
greater appreciation of genetic structure within A. sun-
daicus s.l. (both within and between landmasses) has
important implications for malaria control. It remains
important to determine whether there are any differ-
ences among genetically distinct groupings, which
should include the eight reported here and not only the
three purported species, in attributes relevant to malaria
epidemiology or vector control.
Acknowledgements
The authors wish to thank the Natural History Museum
(NHM), London, for funding the PhD study of MZZ. Most of
the work was carried out while MZZ, YML and RP were at
NHM. We would like to thank U Sein Minh, U Thi Ha and
other staff at the Department of Medical Research in Lower
Myanmar for help with fieldwork and Dr. Erling Pedersen for
providing specimens from Simeulue. This manuscript was pre-
pared in part while YML held a National Research Council
Research Associateship Award at the Walter Reed Army Insti-
tute of Research. The material to be published reflects the
views of the authors and should not be construed to represent
those of the US Department of the Army or the US Department
of Defence.
References
Alam MT, Das MK, Ansari MA, Sharma YD (2006) Molecular
identification of Anopheles (Cellia) sundaicus from the And-
aman and Nicobar islands of India. Acta Tropica, 97, 10–18.Alfaro ME, Karns DR, Voris HK, Abernathy E, Sellins SL
(2004) Phylogeny of Cerberus (Serpentes: Homalopsinae) and
phylogeography of Cerberus rynchops: diversification of a
coastal marine snake in Southeast Asia. Journal of Biogeogra-
phy, 31, 1277–1292.
Bazin E, Glemin S, Galtier N (2006) Population size does not
influence mitochondrial genetic diversity in animals. Science,
312, 570–572.Bendiksby M, Schumacher T, Gussarova G et al. (2010) Eluci-
dating the evolutionary history of the Southeast Asian, holo-
parasitic, giant-flowered Rafflesiaceae: Pliocene vicariance,
morphological convergence and character displacement.
Molecular Phylogenetics and Evolution, 57, 620–633.
Bird MI, Taylor D, Hunt C (2005) Environments of insular South-
east Asia during the Last Glacial Period: a savanna corridor in
Sundaland? Quaternary Science Reviews, 24, 2228–2242.
Brower AV (1994) Rapid morphological radiation and conver-
gence among races of the butterfly Heliconius erato inferred
from patterns of mitochondrial DNA evolution. Proceedings
of the National Academy of Sciences of the United States of Amer-
ica, 91, 6491–6495.
Browning BL, Browning SR (2009) A unified approach to geno-
type imputation and haplotype-phase inference for large
data sets of trios and unrelated individuals. American Journal
of Human Genetics, 84, 210–223.
Cannon CH, Morley RJ, Bush ABG (2009) The current refugial
rainforests of Sundaland are unrepresentative of their bioge-
ographic past and highly vulnerable to disturbance. Proceed-
ings of the National Academy of Sciences of the United States of
America, 106, 11188–11193.De Queiroz K (1999) The general lineage concept of species
and the defining properties of the species category. In: Spe-
cies: New Interdisciplinary Essays. (ed. Wilson RA) Ch. 3, pp.
49–89. MIT Press, Cambridge.
Dupanloup I, Schneider S, Excoffier L (2002) A simulated
annealing approach to define the genetic structure of popula-
tions. Molecular Ecology, 11, 2571–2581.
Dusfour I, Linton Y-M, Cohuet A et al. (2004) Molecular evi-
dence of speciation between island and continental popula-
tions of Anopheles (Cellia) sundaicus (Diptera: Culicidae), a
principal malaria vector taxon in Southeast Asia. Journal of
Medical Entomology, 41, 287–295.Dusfour I, Michaux JR, Harbach RE, Manguin S (2007) Specia-
tion and phylogeography of the Southeast Asian Anopheles
sundaicus complex. Infection, Genetics and Evolution, 7, 484–493.Earl of Cranbrook (2010) Late Quaternary turnover of mam-
mals in Borneo: the zooarchaeological record. Biodiversity and
Conservation, 19, 373–391.
Excoffier L, Smouse PE, Quattro JM (1992) Analysis of molecu-
lar variance inferred from metric distances among DNA
haplotypes: application to human mitochondrial DNA
restriction data. Genetics, 131, 479–491.
Excoffier L, Laval G, Balding D (2003) Gametic phase estima-
tion over large genomic regions using an adaptive window
approach. Human Genomics, 1, 7–19.Excoffier L, Laval G, Schneider S (2005) Arlequin ver. 3.0: an
integrated software package for population genetics data
analysis. Evolutionary Bioinformatics Online, 1, 47–50.
Gathorne-Hardy FJ, Syaukani, Davies RG, Eggleton P, Jones
DT (2002) Quaternary rainforest refugia in south-east Asia:
using termites (Isoptera) as indicators. Biological Journal of the
Linnean Society, 75, 453–466.
Gorog AJ, Sinaga MH, Engstrom MD (2004) Vicariance or dis-
persal? Historical biogeography of three Sunda shelf murine
rodents (Maxomys surifer, Leopoldamys sabanus and Maxomys
whiteheadi). Biological Journal of the Linnean Society, 81,
91–109.Haffer J (1987) Biogeography and Quaternary history in tropi-
cal America. In: Biogeography and Quaternary History in Tropi-
cal America (eds. Whitmore TC, Prance GT), pp. 1–18.
Clarendon Press, Oxford.
Hall R (1998) The plate tectonics of Cenozoic SE Asia and the
distribution of land and sea. In: Biogeography and Geological
Evolution of SE Asia(ed Hall RHJD), pp. 99–131. Backhuys
Publishers, Leiden.
Heaney LR (1991) A synopsis of climatic and vegetational
change in Southeast-Asia. Climatic Change, 19, 53–61.
© 2014 John Wiley & Sons Ltd
INCOMPLETE SPECIATION IN A. SUNDAICUS S .L . 2587
Hey J, Nielsen R (2004) Multilocus methods for estimating
population sizes, migration rates and divergence time, with
applications to the divergence of Drosophila pseudoobscura
and D. persimilis. Genetics, 167, 747–760.Holm S (1979) A simple sequentially rejective multiple test pro-
cedure. Scandinavian Journal of Statistics, 6, 65–70.Holt RA, Subramanian GM, Halpern A et al. (2002) The gen-
ome sequence of the malaria mosquito Anopheles gambiae.
Science, 298, 129–149.
Hope G, Kershaw AP, van der Kaars S et al. (2004) History of
vegetation and habitat change in the Austral-Asian region.
Quaternary International, 118, 103–126.Huang ZS, Ji YJ, Zhang DX (2008) Haplotype reconstruction
for scnp DNA: a consensus vote approach with extensive
sequence data from populations of the migratory locust (Loc-
usta migratoria). Molecular Ecology, 17, 1930–1947.Jombart T (2008) adegenet: a R package for the multivariate
analysis of genetic markers. Bioinformatics, 24, 1403–1405.Klaus S, Selvandran S, Goh JW et al. (2013) Out of Borneo:
Neogene diversification of Sundaic freshwater crabs (Crusta-
cea: Brachyura: Gecarcinucidae: Parathelphusa). Journal of
Biogeography, 40, 63–74.Kuhner MK (2006) LAMARC 2.0: maximum likelihood and
Bayesian estimation of population parameters. Bioinformatics,
22, 768–770.
Lim HC, Rahman MA, Lim SLH, Moyle RG, Sheldon FH
(2011) Revisiting Wallace’s haunt: coalescent simulations and
comparative niche modeling reveal historical mechanisms
that promoted avian population divergence in the Malay
Archipelago. Evolution, 65, 321–334.
Linton YM, Harbach RE, Chang MS, Anthony TG, Matusop A
(2001) Morphological and molecular identity of Anopheles
(Cellia) sundaicus (Diptera: Culicidae), the nominotypical
member of a malaria vector species complex in Southeast
Asia. Systematic Entomology, 26, 357–366.Linton Y-M, Dusfour I, Howard TM et al. (2005) Anopheles
(Cellia) epiroticus (Diptera:Culicidae), a new malaria vector
species in the Southeast Asian Sundaicus complex. Bulletin of
Entomological Research, 95, 329–339.Lohman DJ, de Bruyn M, Page T et al. (2011) Biogeography of
the Indo-Australian archipelago. Annual Review of Ecology,
Evolution, and Systematics, 42, 205–226.
Lourie SA, Green DM, Vincent ACJ (2005) Dispersal, habitat
differences, and comparative phylogeography of Southeast
Asian seahorses (Syngnathidae: Hippocampus). Molecular Ecol-
ogy, 14, 1073–1094.
Maddison WP, Maddison DR (1992) MacClade: Analysis of Phy-
logeny and Character Evolution. Sinauer Associates, Sunder-
land, Massachusetts.
Malausa T, Leniaud L, Martin JF et al. (2007) Molecular differ-
entiation at nuclear loci in French host races of the
European corn borer (Ostrinia nubilalis). Genetics, 176, 2343–
2355.
Meijaard E, van der Zon APM (2003) Mammals of south-east
Asian islands and their Late Pleistocene environments. Jour-
nal of Biogeography, 30, 1245–1257.
Morgan K, Somboon P, Walton C (2013) Understanding Anophe-
les diversity in Southeast Asia and its applications for malaria
control. In: Anopheles Mosquitoes – New Insights into Malaria
Vectors (ed. Manguin S), pp. 327–355. InTech Europe, Rijeka,
Croatia.
Myers N, Mittermeier RA, Mittermeier CG, da Fonseca GAB,
Kent J (2000) Biodiversity hotspots for conservation priori-
ties. Nature, 403, 853–858.
Nachman MW, Hoekstra HE, D’Agostino SL (2003) The genetic
basis of adaptive melanism in pocket mice. Proceedings of the
National Academy of Sciences of the United States of America,
100, 5268–5273.
Nanda N, Das MK, Wattal S, Adak T, Subbarao SK (2004)
Cytogenetic characterization of Anopheles sundaicus (Diptera:
Culicidae) population from Car Nicobar island, India. Annals
of the Entomological Society of America, 97, 171–176.
Nosil P, Harmon LJ, Seehausen O (2009) Ecological explana-
tions for (incomplete) speciation. Trends in Ecology and Evolu-
tion, 24, 145–156.Ohtani M, Kondo T, Tani N et al. (2013) Nuclear and chloroplast
DNA phylogeography reveals Pleistocene divergence and
subsequent secondary contact of two genetic lineages of the
tropical rainforest tree species Shorea leprosula (Dipterocarpa-
ceae) in South-East Asia.Molecular Ecology, 22, 2264–2279.
Patou M-L, Wilting A, Gaubert P et al. (2010) Evolutionary his-
tory of the Paradoxurus palm civets – a new model for Asian
biogeography. Journal of Biogeography, 37, 2077–2097.Posada D (2008) jModelTest: phylogenetic model averaging.
Molecular Biology and Evolution, 25, 1253–1256.Quek SP, Davies SJ, Ashton PS, Itino T, Pierce NE (2007) The
geography of diversification in mutualistic ants: a gene’s-eye
view into the Neogene history of Sundaland rain forests.
Molecular Ecology, 16, 2045–2062.
Reid JA (1968) Anopheline Mosquitoes of Malaya and Borneo. Stud-
ies from the Institute of Medical Research Malaysia, p. 520. Gov-
ernment of Malaysia, Kuala Lumpur.
Reid DG, Kalpana L, Mackenzie-Dodds J, Kaligis F, Littlewood
DTJ, Williams ST (2006) Comparative phylogeography and
species boundaries in Echinolittorina snails in the central
Indo-West Pacific. Journal of Biogeography, 33, 990–1006.Rodenwaldt E (1925) Entomologische notities. III. Geneeskundig
Tijdschrift voor Nederlandsch-Indi€e, 65, 173–201.Rozas J, Sanchez-DelBarrio JC, Messeguer X, Rozas R (2003)
DnaSP, DNA polymorphism analyses by the coalescent and
other methods. Bioinformatics, 19, 2496–2497.
Runemark A, Hey J, Hansson B, Svensson EI (2012) Vicariance
divergence and gene flow among islet populations of an
endemic lizard. Molecular Ecology, 21, 117–129.Scheet P, Stephens M (2006) A fast and flexible statistical
model for large-scale population genotype data: Applications
to inferring missing genotypes and haplotypic phase. Ameri-
can Journal of Human Genetics, 78, 629–644.Schluter D, Conte GL (2009) Genetics and ecological speciation.
Proceedings of the National Academy of Sciences, 106, 9955–9962.Schmidt PS, Rand DM (2001) Adaptive maintenance of genetic
polymorphism in an intertidal barnacle: habitat- and life-
stage-specific survivorship of Mpi genotypes. Evolution, 55,
1336–1344.Schmidt PS, Bertness MD, Rand DM (2000) Environmental het-
erogeneity and balancing selection in the acorn barnacle Sem-
ibalanus balanoides. Proceedings of the Royal Society of London
Series B-Biological Sciences, 267, 379–384.Schmidt PS, Phifer-Rixey M, Taylor GM, Christner J (2007)
Genetic heterogeneity among intertidal habitats in the flat
periwinkle, Littorina obtusata. Molecular Ecology, 16, 2393–
2404.
© 2014 John Wiley & Sons Ltd
2588 M. ZAROWIECKI ET AL.
Schutze MK, Krosch MN, Armstrong KF et al. (2012) Population
structure of Bactrocera dorsalis s.s., B. papayae and
B. philippinensis (Diptera: Tephritidae) in southeast Asia: evi-
dence for a single species hypothesis using mitochondrial
DNA and wing-shape data. BMC Evolutionary Biology, 12, 130.
Seidel RA, Lang BK, Berg DJ (2010) Salinity tolerance as a
potential driver of ecological speciation in amphipods
(Gammarus spp.) from the northern Chihuahuan Desert. Jour-
nal of the North American Benthological Society, 29, 1161–1169.
Sinka ME, Bangs MJ, Manguin S et al. (2011) The dominant
Anopheles vectors of human malaria in the Asia-Pacific
region: occurrence data, distribution maps and bionomic pre-
cis. Parasites and Vectors, 4, Artn 89.
Smadja CM, Butlin RK (2011) A framework for comparing pro-
cesses of speciation in the presence of gene flow. Molecular
Ecology, 20, 5123–5140.Stephens M, Scheet P (2005) Accounting for decay of linkage
disequilibrium in haplotype inference and missing-data
imputation. American Journal of Human Genetics, 76, 449–462.
Sukowati S, Baimai V (1996) A standard cytogenetic map for
Anopheles sundaicus (Diptera: Culicidae) and evidence for
chromosomal differentiation in populations from Thailand
and Indonesia. Genome, 39, 165–173.
Sukowati S, Baimai V, Harun S, Dasuki Y, Andris H, Efriwati
M (1999) Isozyme evidence for three sibling species in the
Anopheles sundaicus complex from Indonesia. Medical and Vet-
erinary Entomology, 13, 408–414.
Surendran S, Singh O, Jude P, Ramasamy R (2010) Genetic evi-
dence for malaria vectors of the Anopheles sundaicus complex
in Sri Lanka with morphological characteristics attributed to
Anopheles subpictus species B. Malaria Journal, 9, 343.
den Tex RJ, Leonard JA (2013) A molecular phylogeny of Asian
barbets: speciation and extinction in the tropics. Molecular
Phylogenetics and Evolution, 68, 1–13.
Thompson JD, Higgins DG, Gibson TJ (1994) CLUSTAL W:
improving the sensitivity of progressive multiple sequence
alignment through sequence weighting position specific gap
penalties and weight matrix choice. Nucleic Acids Research,
22, 4673–4680.Voris HK (2000) Maps of Pleistocene sea levels in Southeast
Asia: shorelines, river systems and time durations. Journal of
Biogeography, 27, 1153–1167.
Whitman DW, Agrawal AA (2009) What is phenotypic plastic-
ity and why is it important? In: Phenotypic Plasticity of Insects;
Mechanisms and Consequences. (eds Whitman D, Anantha-
krishnan TN), pp. 1–65. Science Publishers, Enfield, New
Hampshire.
Wilting A, Christiansen P, Kitchener AC, Kemp YJM, Ambu L,
Fickel J (2011) Geographical variation in and evolutionary
history of the Sunda clouded leopard (Neofelis diardi) (Mam-
malia: Carnivora: Felidae) with the description of a new sub-
species from Borneo. Molecular Phylogenetics and Evolution,
58, 317–328.Woodruff DS (2010) Biogeography and conservation in South-
east Asia: how 2.7 million years of repeated environmental
fluctuations affect today’s patterns and the future of the
remaining refugial-phase biodiversity. Biodiversity and Conser-
vation, 19, 919–941.
Woodruff DS, Turner LM (2009) The Indochinese-Sundaic zoo-
geographic transition: a description and analysis of terrestrial
mammal species distributions. Journal of Biogeography, 36,
803–821.Wu CI, Ting CT (2004) Genes and speciation. Nature Reviews
Genetics, 5, 114–122.Yamaguchi R, Iwasa Y (2013) First passage time to allopatric
speciation. Interface Focus, 3, 20130026.
Zarowiecki M, Walton C, Torres E et al. (2011) Pleistocene
genetic connectivity in a widespread, open-habitat-adapted
mosquito in the Indo-Oriental region. Journal of Biogeography,
38, 1422–1432.Zhong GF, Geng JH, Wong HK, Ma ZT, Wu NY (2004) A
semi-quantitative method for the reconstruction of eustatic
sea level history from seismic profiles and its application to
the southern South China Sea. Earth and Planetary Science
Letters, 223, 443–459.
M.Z., Y.-M.L., R.P. and C.W. conceived and designed
the study and wrote the manuscript. M.Z., Y.-M.L.,
C.W., M.J.B., P.T.H., T.H., C.M.S., V.B., T.H.D. and T.S.
conducted field research. M.Z. performed the laboratory
work and analysis.
Data accessibility
All sequence data have been submitted to GenBank; CO1
haplotypes with Accession nos. GQ395814–GQ395927,
Mpi as PopSet 262386140, Mpi (long) as PopSet 261599516
and ITS2 variants as PopSet 261599508. Alignments and
haplotype networks are available at Data Dryad doi:10.
5061/dryad.55qg0. Additional details on populations are
available in Table S1 (Supporting Information).
Supporting information
Additional supporting information may be found in the online ver-
sion of this article.
Table S1 This file contains exact locations and geographical
coordinates for all sampled populations.
Appendix S1 Mpi primers.
Fig. S1 Comparison of base frequencies at variable sites in Mpi
between larval specimens collected in fresh and brackish water
in Asahan, northern Sumatra (Indonesia), compared to Mpi al-
lozyme allele frequencies (Sukowati et al. 1999) for chromo-
somal forms A and B, from the same location.
Fig. S2 Complete SAMOVA results.
Fig. S3 PCA plots of population differentiation in Mpi and
CO1.
Appendix S2 Full FST values between all populations.
© 2014 John Wiley & Sons Ltd
INCOMPLETE SPECIATION IN A. SUNDAICUS S .L . 2589
Copyright © 2022 FDOKUMEN