A conductive polypyrrole based ammonium ion selective electrode

Desalination 249 (2009) 217–223
Contents lists available at ScienceDirect
Desalination
j ourna l homepage: www.e lsev ie r.com/ locate /desa l
Removal of total dissolved solids, nitrates and ammonium ions from drinking waterusing charge-barrier capacitive deionisation
Romain Broséus a,1, John Cigana b,2, Benoit Barbeau c,⁎, Catherine Daines-Martinez d,3, Hervé Suty d,4
a Centre de recherche, développement et validation des technologies et procédés de traitement des eaux (CREDEAU), École Polytechnique de Montréal, Département des Génies Civil,Géologique et des Mines, P.O. Box 6079, Succ. Centre-Ville, Montréal (Québec), Canada H3C 3A7b Veolia-Water North America Operating Services, LLC, 4105 rue Sartelon, Saint-Laurent (Québec), Canada H4S 2B3c NSERC Industrial Chair on Drinking Water, École Polytechnique de Montreal, Department of Civil, Geologic and Mining Engineering, P.O. Box 6079, Succ. Centre-Ville,Montreal (Quebec) Canada H3C 3A7d Anjou-Recherche, Veolia-Water, Chemin de la digue, BP 76, Maisons-Laffitte Cedex, 78603, France
⁎ Corresponding author. Tel.: +1 514 340 4711x2988E-mail addresses: [email protected] (R. Br
[email protected] (J. Cigana), [email protected] (C. Daines-Martinez), herv
1 Tel.: +1 514 340 4711x2194; fax: +1 514 340 5912 Tel.: +1 514 334 7230x3312; fax: +1 514 334 5073 Tel.: +33 1 34 93 31 94; fax: +33 1 34 93 31 10.4 Tel.: +33 1 34 93 31 31; fax: +33 1 34 93 31 10.
0011-9164/$ – see front matter © 2009 Elsevier B.V. Aldoi:10.1016/j.desal.2008.12.048
a b s t r a c t
a r t i c l e i n f oArticle history:Accepted 13 December 2008Available online 3 October 2009
Keywords:Drinking waterCapacitive deionisationElectrosorptionDesalinationNitratesAmmonium ions
A charge-barrier capacitive deionisation system was tested for electrochemical removal of Total DissolvedSolids (TDS), nitrates and ammonium ions. Several experiments were conducted with inorganic speciesspiked in tap water. The system efficiency was first evaluated using experimental statistical designs withdifferent concentrations of NaCl (150 to 3000 mg/L). The raw water conductivity and the targeted residualTDS in treated water were the key process variables. Power consumption increased linearly as the differencebetween these two values increased. Water recovery rate and electrical consumption, which variedrespectively from 63.9% to 95.8% and from 0.45 to 5.35 kWh/m3, were adequately described by a simplelinear regression model (R2: 0.98 and 0.99, respectively). Additional experiments performed on nitrates(100 mg N–NO3/L) and ammonium ions (1000 mg N–NH4/L) showed high levels of removal. A rise in TDSconcentration led to a decrease in their removal due to the competition for electrodes carbon adsorptionsites. It was concluded from this study that this technology offers an innovative alternative fordemineralising water. However, assays should be conducted in natural waters and in a steady-state mannerto confirm data obtained and get long-term performance.
; fax: +1 514 340 5918.oséus),[email protected] (B. Barbeau),[email protected] (H. Suty).8.0.
l rights reserved.
© 2009 Elsevier B.V. All rights reserved.
1. Introduction
Drinking water supply is a major concern in developed and devel-oping countries. Over the next 25 years, the number of individualsimpacted by severe water shortages is expected to increase fourfold[1]. Sea water or brackish water desalination is a reliable technique tosupply fresh water but low-cost technologies providing high waterrecovery rates are needed. The concentrations of salts in sea water andbrackish water are 35–50 g/L and 800–3200 mg/L respectively, but areduction of Total Dissolved Solids (TDS) to 500 mg/L is required toobtain palatable water. Industrial processes (semiconductor manu-facturing, nuclear power plants, and pharmaceutical industry) alsoinvolve strictly regulated water quality [2]. Therefore, several tech-nologies have been applied for the removal of TDS from sea andbrackish waters.
Multi-stage flash process (MSF) represents 43.5% of world produc-tion [3] but requires a significant amount of energy to vaporize thewater. Ion exchange (IX), electrodialysis (ED) and reverse osmosis(RO) are currently the most common techniques for water softeningand desalination. However, IX requires regeneration steps usingvarious chemicals and is not practical for high TDS concentrations. EDuses high electric potential and is susceptible to hardness scaling andorganic fouling, which can be limited by pre-treatment. RO is themostcost-effective method among membrane technologies for removingsalts but it requires pre-treatments and generates a high volume ofconcentrate.
Capacitive deionisation (CDI) has been developed recently. Itconsists of the process of removing ions through their adsorption onthe surface of two oppositely charged porous electrodes. This electro-chemical process is conducted at low voltage (typically 0.8–1.5 V)without high-pressure pumps and acts as a “flow-through” capacitor[4,5]. Theoretical aspects to CDI and basic electrochemical principleshave already been described elsewhere [6].
During the purification cycle, cations and anions from aqueoussolutions are drawn towards the cathode and anode, respectively,upon application of a voltage. The capacitive system collects ions overtime from the influent water and releases effluent of graduallyincreasing salinity due to the limited ion adsorption capacity of the

218 R. Broséus et al. / Desalination 249 (2009) 217–223
electrodes. Therefore, the purified water results from a blend ofwaters having various conductivities between the start and the end ofthe purification cycle. When (i) the electrodes are saturated with ionsor (ii) the effluent conductivity level rises above the requiredconductivity, the electrodes are regenerated by applying a reversepotential to allow the adsorbed ions to be released into a concentratedwaste stream. The loading cycle is repeated following the regenera-tion and purge cycle. The efficiency of CDI mainly depends on thesurface area and adsorption properties of electrodes. Despite the highelectrical conductivity and chemical stability of conventional activat-ed carbon materials, operational problems including binder degrada-tion and low overall capacity were observed [7,8]. Consequently,activated carbon cloth (ACC), a woven product of activated carbonfiber, has been improved and proposed [2,9]. Introduction of titania onthe surface of ACC enhanced electrosorption and decreased physicaladsorption. Carbon aerogels have also been studied extensivelybecause of their high surface area (400–100 m2/g), their low resis-tivity (<40 mΩ cm) and a nano-size porous structure [6,7]. Thisprocess is patented CDTTM (Capacitive Deionization TechnologyTM)and was first developed by Lawrence Livermore National Laboratories(Berkeley, USA) [10,11]. Its viability was recently tested on brackishgroundwater having TDS concentration of 5000 mg/L [12], showingthat further research would be required to improve the efficiency ofthe system for high levels of salinity.
The general purpose of this study was to determine the feasibilityand performance of electrochemical removal of TDS, nitrates andammonium ions by using proprietary charge-barrier CDI technology(DesEL Technology from ENPAR Tech. Inc.). Optimal operation con-ditions, salts removal rates and power consumption were determinedfor various influent TDS concentrations.
2. Objectives
The work described in this paper has been undertaken to validatethe charge-barrier CDI technology by pursuing two specific objectives:
– Study the TDS removal from raw waters having different concen-trations of NaCl. The system performance was evaluated usingexperimental statistical designs [13];
– Determine nitrates and ammonium ions removal and evaluate theinfluence of TDS (NaCl and sulfates) on their removal.
3. Materials and methods
3.1. Electrode material
The electrodes, manufactured using a proprietary process, aremainly composed of powdered activated carbon with an organicbinder. The electrodes are 0.250 mm thick. Previous designs of CDIsystems were limited to the treatment of low saline solutions(<3000 mg TDS/L). The DesEL technology employs the charge-barrierinnovation consisting of ion selective layers, which prevent cross-contamination of the purified effluent. These layers are used to adsorbthe ions selectively on the electrodes and are similar in compositionto ED membranes. One charge-barrier CDI stack has a dimension of298 mm diameter×366 mm height. A schematic diagram of thecharge-barrier CDI stack is shown in Fig. 1.
Fig. 1. Schematic of the charge-barrier CDI system: 1—Stack holder, 2—Currentcollector, 3—Electrode, 4—Charge-barrier, 5—Flow spacer.
3.2. The DesEL 9K pilot plant
The treatability tests were performed using a capacitive deionisa-tion pilot unit (DesEL 9K, ENPAR Tech. Inc., Ontario, CANADA). It wascomposed of four electrochemical stacks each including 10 m2 ofelectrode surface area (Fig. 2). The stacks were connected in parallelhydraulically and in series electrically. The DesEL 9K pilot systemrequired a 220 V AC, 20 A, single-phase electrical supply. Internalvolume of stacks was about 1.5 L for an approximate weight of 10 kg.Dimensions were 1.2(L)×1.0(W)×1.8(H) m. The operating potentialwas approximately DC 1.25 V per stack such that no electrolysisreactions occurred. The only pre-treatment required consisted of a10 µm prefilter to avoid contamination of the charge-barrier CDI stackwith particles.
The DesEL process was configured by specifying five parameterson the control panel through a Human Machine Interface (HMI):
• the adsorption (purification) time may range from 120 to 600 s;• the desorption (regeneration) time ranges from 60 to 240 s;• the purge time (s) is present at the end of the desorption time andshould be long enough to purge out the concentrate, before the nexttreatment cycle;
• the conductivity of the treated water (Low Conductivity Set Point,µS/cm) is set to a value that depends on the required removal ofinorganics from raw water and ranges from 0.01 to 1.0 mS/cm;
• the conductivity of the concentrated waste (High Conductivity SetPoint, mS/cm) ensures that sufficient concentrate is removed fromthe stacks and may range from 1.0 to 20.0 mS/cm.
These parameters are interrelated and their values must beoptimized to achieve a specific treatment objective [14].
3.3. System description
A process and instrumentation schematic is provided in Fig. 3. Thesystem automatically cycled through the purification, regeneration andpurge cycles. Cycle times, control valve operation and conductivity setpoints were controlled by a Programmable Logic Controller (PLC).During a purification cycle, aqueous solutions were pumped from aninfluent tank (total volume≈280 L) through the stacks by a magneticdrive centrifugal pump (Iwaki model MD-70RZ). If the conductivity ofthe treated solution was less than the required treatment set point(Low Conductivity Set Point), the Pure Out valve opened andwater wasdischarged in a 50 L carboy. If the conductivity rose above the set point,the Pure Recycle valve was opened (and Pure Out was closed) directingthe water stream back through the stacks. In the regeneration cycle,the polarity of the stack was reversed to remove the ions from theelectrodes. The purge step was used to flush the stack by using a givenquantity of influent water to form a concentrated solution. If theconductivity was above the desired waste outlet limit (High Conduc-tivity Set Point), the Purge Out valve was activated and the waste wassent to a reservoir. If the conductivity decreased below the waste outletlimit, the Purge Recycle valve was activated (Purge Out was closed) andthe water stream was returned to the source tank. A new purificationcycle started when the regeneration and purge cycles were completed.
In this study, the High Conductivity Set Point was specified at itsminimal value (1.0 mS/cm). During the purge cycle, the wholeconcentrated stream (Purge Out and Purge Recycle) was thus directedthrough 10 L carboys. This allowed a constant influent water qualityduring one experiment. Proportions of clean and concentrate streamsvaried depending on the composition of the raw water and thedesired composition of the treated water.
3.4. Experimental setup
Inorganic species (NaCl, NaNO3, NH4Cl) were spiked in prefilteredtap water (10 µm prefilter, Labcor, Canada) with a background TDS of

Fig. 2. Front view (left) and rear view (right) of the DesEL 9K pilot plant.
219R. Broséus et al. / Desalination 249 (2009) 217–223
about 150 mg/L. No prefilter fouling was observed during the courseof the study. All experiments were performed at room temperature(water temperature: 20 °C–22 °C). Two influent water tanks wereused, which gave experiment durations of 1 h–1.5 h, depending onwater quality and values of the five parameters. Purified water com-posite samples were collected in 50 L carboys during each purificationcycle. Concentrated wastes were sampled in 10 L carboys followingevery regeneration–purge stage. TDS and conductivity were mea-sured at the end of each cycle. Common physico-chemical analyseswere performed on influent water and on a general sample for treatedand purged water for the complete duration of the test. Anexperiment was considered complete when the system stopped i.e.when an alarm started indicating a low influent tank level. Therefore,the volume studied per experiment was about 280 L. The implemen-
Fig. 3. Process and instrumentation schematic of
tation of each test followed a strict procedure. Before each test, onepurification–regeneration–purge cycle was done to ensure that elec-trodes had the same adsorption capacity as the previous experiments.Purified water conductivity and intensity data measured at the end ofthe cycles were used for this purpose.
The evolution of purified and purged water conductivity (mS/cm),time (s), flowrate (L/min), pressure (psi), voltage (V), intensity (A),influent water pH and the volume of purified water and concentratedstream were logged by a laptop computer using DataWorx PLC datalogging software (Automation Direct). On-line flowrate, pH and con-ductivity (range: 0.0–10.0 mS/cm) values given by the pilot planttransmitters (Burkert model 8035, 8025 and 8225, respectively) wereconfirmed before starting the experiments. pH, total hardness andalkalinity analyses were performed according to standard methods
the DesEL 9K pilot plant (ENPAR Tech. Inc.).

Table 1Values of input variables.
Assay 1 Assay 2
Date 2006-05-25 2006-08-01Raw water conductivity (μS/cm) 1800 290Purification time (s) 400 300Regeneration time (s) 110 110Purge time (s) 25 25Total cycle time (s) 535 435Flowrate (L/min) 10 10Low Conductivity Set Point (μS/cm) 180 58
220 R. Broséus et al. / Desalination 249 (2009) 217–223
4500-H+, 2340 C and 2320 B, respectively [15]. Conductivity wasanalysed by a conductivity meter CMD 83 (Radiometer Copenhagen).Ion selective electrodes were used to analyse nitrates (4500-D) andammonium ions (4500-NH3 D). Sulfates were measured by theturbidimetricmethod 4500-E (photometerMilton Roy Spectronic 20D).
3.5. Design of experiments
The experimental designs were conducted in batches using NaClconcentrations of 150, 1000 and 3000 mg/L in order to establishoptimum operation conditions. This led to raw water conductivitiesvarying from 0.51 to 5.68 mS/cm. A design of experiments approachallowed (i) to perform statistically designed experiments, (ii) toidentify the key process variables and (iii) to predict the waterrecovery rate and the power consumption. The water recovery ratewas calculated using Eq. (1):
Y1 =Vt
Vr=
Vt
Vt + Vpurgeð1Þ
where Y1 is the water recovery rate (%), Vr is the raw water volume(L), Vt is the treated water volume (L), and Vpurge is the purged watervolume (L).
Statistically designing experiments is useful when many inputvariables may influence the performance of the process. Moreover,the interaction among the parameters can be evaluated with limitednumber of experiments [16]. Input and output variables are calledindependent and dependant variables, respectively. Four generalmodels are available in order to analyse the data obtained: linearterms, linear and quadratic terms, linear and interaction terms and ageneral model combining linear, quadratic and interaction terms. Thislast model would be described by the following equation where twoindependent variables are considered.
Y = β0 + β1x1 + β2x2 + β12x1x2 + β11x21 + β22x
22 ð2Þ
where β0 is the interception coefficient, β1 and β2 are the linearcoefficients, β12 is the interaction coefficient, β11 and β22 are thequadratic coefficients, x1 and x2 are the independent variables, and Yis the dependant variable. STATISTICA version 7.0 software was usedfor regression and graphical analysis of the obtained data.
Different designs were studied depending on the influent TDSconcentrations. For a NaCl concentration of 1000 mg/L, a centralcomposite design [13] was used (18 experiments). Independentvariables (xi) were the water flowrate (8–12 L/min), the purificationtime (300–500 s), the regeneration time (100–120 s) and the LowConductivity Set Point (100–300 µS/cm). Five values were tested foreach variable. For a NaCl concentration of 3000 mg/L, a 32 factorialdesign was considered (9 experiments). The water flowrate (8–12 L/min) and the Low Conductivity Set Point (550–1650 µS/cm) werechosen as independent variables with three values each. Specificadditional experiments were also conducted on a 150 mg/L NaClconcentration. Low Conductivity Set Point values were set to reachTDS (conductivity) removal rates of 90–92%, 85–95% and 70–90% for150, 1000 and 3000 mg/L TDS, respectively. Data obtained for thesethree TDS concentrations were combined in order to produce ageneral linear model including the raw water TDS concentration(from 150 mg/L to 3000 mg/L with a 150 mg/L TDS backgroundconcentration). Independent variables were the raw water conduc-tivity, the regeneration, the purge and purification times as well as thewater flowrate and the Low Conductivity Set Point. Additional assayswere performedwith drinking water spiked with nitrates (100 mg N–NO3/L) and ammonium ions (1000 mg N–NH4/L). The influence ofTDS concentration (sulfates and NaCl) on the removal of the targetcompounds was explored.
4. Results and discussion
4.1. Operation of the DesEL 9K pilot plant
Two assays were performed to illustrate the typical operation ofthe DesEL 9K pilot plant depending on whether a recirculation wasobserved during the purification cycle. The values of the inputvariables are presented in Table 1. Conductivity removal was set to90% and 80% for assays 1 and 2, respectively. Fig. 4 shows theconductivity changes for assay 1 composed of 6 treatment cycles(purification, regeneration and purge). Fig. 5 focuses on the first cycle.First, treated water conductivity decreased below raw water conduc-tivity due to ion adsorption (400 s). Then, the reverse potential wasapplied and electrodes were regenerated (110 s). Finally, ionsbeforehand adsorbed were removed from the surface of the electro-des during the purge cycle (25 s). As the Low Conductivity Set Pointwas exceeded during the purification cycle, a recirculation wasnoticed and the conductivity fluctuated: the Pure Recycle valve wasopened directing the water stream back through the stacks to reachthe Low Conductivity Set Point again. The Pure Recycle valve wasoperated about 5 times in each purification cycle (Figs. 4 and 5). Theduration of the purification cycle should be set so that the valves areactuated less than twice in a cycle [14]. During assay 2, norecirculation was noted because the Low Conductivity Set Point wasnever reached during each purification cycle (Fig. 6). The capacity ofelectrodes was not reached after 300 s of ionic adsorption and in thisspecific case, the adsorption time could have been increased. Intensityfluctuated depending on the saturation of electrodes: currentintensity exponentially decreased (from a maximum of 300 A)through purification cycles since less ions were adsorbed on theelectrodes with time. The use of ion-exchange membranes preventsion adsorption on the electrodes during the regeneration step. Thisenhances the salt removal capabilities, contrary to primary CDI [17].An additional advantage of the charge-barrier technology may bethe prevention of precipitation of minerals concentrated into theelectrodes.
4.2. Charge-barrier CDI performance
The treatability results of all experiments (N=27) conducted on1000 mg/L and 3000 mg/L TDS are presented in Table 2. The rawwater TDS concentration varied from 940 to 1290 mg/L due tovariations in tap water background TDS concentration. Conductivityremoval varied from 80.9% to 94.3% depending on the operationconditions. On average, the treatedwater showed reductions in TDS of90.3%, in hardness of 90.3% and in alkalinity of 84.4% for 1000 mg/LTDS. Removals were 81.7% and 76.2% for hardness and alkalinity,respectively, for experiments performed on 3000 mg/L TDS. In all theexperiments, the conductivity in the treated water was close to orlower than the conductivity required (Low Conductivity Set Point).Moreover, studying the conductivity changes and the volume of thetreated water composite samples showed that the steady-stateconditions were reached after a few treatment cycles. The treatment

Fig. 4. Conductivity changes during assay 1. 1–6: Adsorption cycles; a–f: Regeneration–purge cycles; E: End of experiment. Fig. 6. Conductivity and current intensity fluctuations during assay 2. E: end of
experiment.
221R. Broséus et al. / Desalination 249 (2009) 217–223
efficiency remained constant over multiple cycles. For the 3000 mg/LTDS concentration, TDS removal of 70% was easily achieved. Con-ductivity in the treated water never rose above 1.07 mS/cm whereasthe Low Conductivity Set Point was 1.65 mS/cm (Table 3). Conduc-tivity in the treated water was closer to the set points for the twogreater TDS removals required (80% and 90%). A higher flowrateyielded a higher conductivity in the treated water for identical LowConductivity Set Point (1.10 and 1.65 mS/cm) and raw water quality.These results already described [17] showed that the TDS removaldepends on the residence time of the solution on the electrodes. Thesalts removal increases when more time is available for mass transfer.However, no significant variations were observed in terms of waterrecovery rate and electrical consumption. Moreover, conductivityremoval varied from 90.2% to 94.8% when testing a 150 mg/L NaClconcentration. A greater flowrate also increased the TDS removal fromthe electrodes during the purge cycle. Overall, purge time should beraised since the conductivity following regeneration–purge cycleswas often greater than the raw water conductivity.
The DC power supply of the DesEL pilot plant was set to operate ata constant voltage output of 5.0 V, i.e. 1.25 V per stack. Previousstudies conducted at 40–100 mL/min showed that the optimal DCvoltage for ACC-based membrane CDI was 1.2 V in order to increasethe salt removal and limit the energy consumption [17]. The greatestsalt removal was measured at 1.2–1.3 V during experiments per-formed on NaCl solutions (from 4 to 5882 mg/L) at 15 mL/min [10].CDI performance was also studied using 2 M NaCl solution [18]. Theregeneration of the CDI unit (5 min) begun after the sorption phase(10 min). At a flowrate of 100 mL/min, the maximum salt removal(95%) was obtained at 1.4 V. The salt removal increased with theapplied DC voltage but electrolysis was observed above 1.6 V. In thisstudy, one experiment was performed using a DC voltage of 4.5 V(1.12 V per stack) instead of 5.0 V. The conductivity in the treated
Fig. 5. Conductivity changes during the first treatment cycle of assay 1. 1: Adsorptioncycle; A: Regeneration cycle; a: Purge cycle.
water was slightly higher at 4.5 V than the one at 5.0 V, with meanconductivities of 185 and 173 µS/cm, respectively, for seven treatmentcycles.
4.3. Regression models
The TDS removal was studied under different experimentalconditions. The application of statistics offers an empirical relation-ship between the independent variables and the dependant variables.Models were chosen according to the correlation coefficient R2, thelack of fit (p) criteria, the normal distribution of residues and thevariance homogeneity. For the 1000 mg/L TDS concentration, waterrecovery rate and electrical consumption were described by quadraticand interaction terms (R2: 0.99, p=0.40) and linear terms (R2: 0.68,p=0.16), respectively. For the 3000 mg/L TDS concentration, waterrecovery rate and electrical consumptionwere described by linear andquadratic terms (R2: 0.96 and 0.97, respectively). When combiningperformance data from all conditions (150, 1000 and 3000 mg/L), itwas observed that the dependant variables (water recovery rate andpower consumption) were described by a simple linear regressionmodel (R2: 0.98 and 0.99, respectively). The result of these models isrepresented by Eqs. (3) and (4) for water recovery rate (Y1) andelectrical consumption (Y2), respectively:
Y1 = 1:2−3:5 × 10−2X1 + 9:9 × 10−5X2−8:2 × 10−3X3
+ 8:4 × 10−5X4−7:4 × 10−3X5 + 9:2 × 10−2X6
ð3Þ
Y2 = −0:3 + 0:9X1−1:7 × 10−3X2 + 4:3 × 10−2X3
+ 2:7 × 10−4X4−5:5 × 10−2X5−1:5X6
ð4Þ
where X1 is the rawwater conductivity (mS/cm), X2 is the regenerationtime (s), X3 is the purge time (s), X4 is the purification time (s), X5 is theflowrate (L/min), and X6 is the Low Conductivity Set Point (mS/cm).
In the analysis of variance (ANOVA) and for the tested conditions,it was found that the duration of the regeneration cycle had no impacton the water recovery rate whereas the duration of the purification,
Table 2Minimum and maximum values of physico-chemical parameters.
Type ofwater
TDS (mg/L) Conductivity(mS/cm)
pH Total hardness(mg/L CaCO3)
Total alkalinity(mg/L CaCO3)
Raw 940–1290 1.72–2.04 7.70–8.02 110–130 79–88Treated 60–160 0.11–0.29 6.62–7.14 8–16 7–21Rejected 6980–12,620 11.22–17.50 7.72–8.37 1020–1520 655–1055
Raw ~3000 5.36–5.68 7.70–7.80 114–126 72–84Treated – 0.42–1.07 6.76–7.38 12–26 8–29Rejected – 13.80–18.10 7.55–8.19 500–1380 –
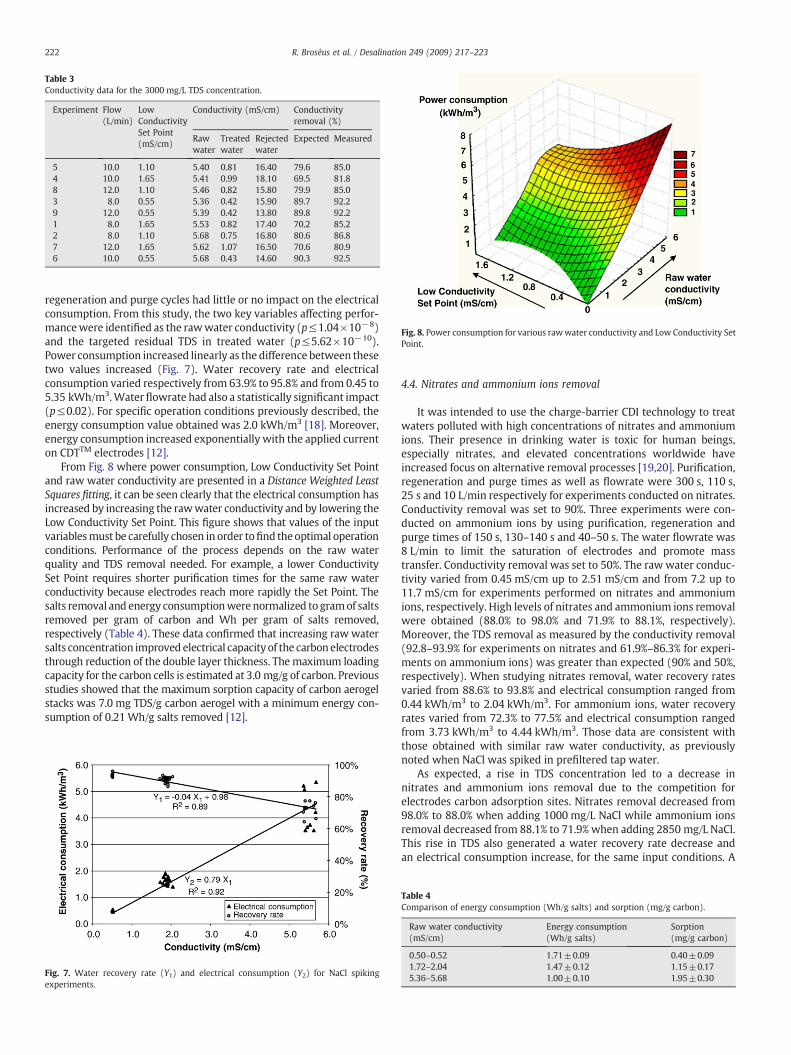
Table 3Conductivity data for the 3000 mg/L TDS concentration.
Experiment Flow(L/min)
LowConductivitySet Point(mS/cm)
Conductivity (mS/cm) Conductivityremoval (%)
Rawwater
Treatedwater
Rejectedwater
Expected Measured
5 10.0 1.10 5.40 0.81 16.40 79.6 85.04 10.0 1.65 5.41 0.99 18.10 69.5 81.88 12.0 1.10 5.46 0.82 15.80 79.9 85.03 8.0 0.55 5.36 0.42 15.90 89.7 92.29 12.0 0.55 5.39 0.42 13.80 89.8 92.21 8.0 1.65 5.53 0.82 17.40 70.2 85.22 8.0 1.10 5.68 0.75 16.80 80.6 86.87 12.0 1.65 5.62 1.07 16.50 70.6 80.96 10.0 0.55 5.68 0.43 14.60 90.3 92.5
Fig. 8. Power consumption for various rawwater conductivity and Low Conductivity SetPoint.
222 R. Broséus et al. / Desalination 249 (2009) 217–223
regeneration and purge cycles had little or no impact on the electricalconsumption. From this study, the two key variables affecting perfor-mancewere identified as the rawwater conductivity (p≤1.04×10⁻⁸)and the targeted residual TDS in treated water (p≤5.62×10⁻¹⁰).Power consumption increased linearly as the difference between thesetwo values increased (Fig. 7). Water recovery rate and electricalconsumption varied respectively from 63.9% to 95.8% and from 0.45 to5.35 kWh/m3.Waterflowrate had also a statistically significant impact(p≤0.02). For specific operation conditions previously described, theenergy consumption value obtained was 2.0 kWh/m3 [18]. Moreover,energy consumption increased exponentially with the applied currenton CDTTM electrodes [12].
From Fig. 8 where power consumption, Low Conductivity Set Pointand raw water conductivity are presented in a Distance Weighted LeastSquares fitting, it can be seen clearly that the electrical consumption hasincreased by increasing the rawwater conductivity and by lowering theLow Conductivity Set Point. This figure shows that values of the inputvariablesmust be carefully chosen in order tofind theoptimal operationconditions. Performance of the process depends on the raw waterquality and TDS removal needed. For example, a lower ConductivitySet Point requires shorter purification times for the same raw waterconductivity because electrodes reach more rapidly the Set Point. Thesalts removal and energy consumptionwere normalized to gramof saltsremoved per gram of carbon and Wh per gram of salts removed,respectively (Table 4). These data confirmed that increasing raw watersalts concentration improved electrical capacity of the carbon electrodesthrough reduction of the double layer thickness. The maximum loadingcapacity for the carbon cells is estimated at 3.0 mg/g of carbon. Previousstudies showed that the maximum sorption capacity of carbon aerogelstacks was 7.0 mg TDS/g carbon aerogel with a minimum energy con-sumption of 0.21Wh/g salts removed [12].
Fig. 7. Water recovery rate (Y1) and electrical consumption (Y2) for NaCl spikingexperiments.
4.4. Nitrates and ammonium ions removal
It was intended to use the charge-barrier CDI technology to treatwaters polluted with high concentrations of nitrates and ammoniumions. Their presence in drinking water is toxic for human beings,especially nitrates, and elevated concentrations worldwide haveincreased focus on alternative removal processes [19,20]. Purification,regeneration and purge times as well as flowrate were 300 s, 110 s,25 s and 10 L/min respectively for experiments conducted on nitrates.Conductivity removal was set to 90%. Three experiments were con-ducted on ammonium ions by using purification, regeneration andpurge times of 150 s, 130–140 s and 40–50 s. The water flowrate was8 L/min to limit the saturation of electrodes and promote masstransfer. Conductivity removal was set to 50%. The raw water conduc-tivity varied from 0.45 mS/cm up to 2.51 mS/cm and from 7.2 up to11.7 mS/cm for experiments performed on nitrates and ammoniumions, respectively. High levels of nitrates and ammonium ions removalwere obtained (88.0% to 98.0% and 71.9% to 88.1%, respectively).Moreover, the TDS removal as measured by the conductivity removal(92.8–93.9% for experiments on nitrates and 61.9%–86.3% for experi-ments on ammonium ions) was greater than expected (90% and 50%,respectively). When studying nitrates removal, water recovery ratesvaried from 88.6% to 93.8% and electrical consumption ranged from0.44 kWh/m3 to 2.04 kWh/m3. For ammonium ions, water recoveryrates varied from 72.3% to 77.5% and electrical consumption rangedfrom 3.73 kWh/m3 to 4.44 kWh/m3. Those data are consistent withthose obtained with similar raw water conductivity, as previouslynoted when NaCl was spiked in prefiltered tap water.
As expected, a rise in TDS concentration led to a decrease innitrates and ammonium ions removal due to the competition forelectrodes carbon adsorption sites. Nitrates removal decreased from98.0% to 88.0% when adding 1000 mg/L NaCl while ammonium ionsremoval decreased from 88.1% to 71.9% when adding 2850 mg/L NaCl.This rise in TDS also generated a water recovery rate decrease andan electrical consumption increase, for the same input conditions. A
Table 4Comparison of energy consumption (Wh/g salts) and sorption (mg/g carbon).
Raw water conductivity(mS/cm)
Energy consumption(Wh/g salts)
Sorption(mg/g carbon)
0.50–0.52 1.71±0.09 0.40±0.091.72–2.04 1.47±0.12 1.15±0.175.36–5.68 1.00±0.10 1.95±0.30

223R. Broséus et al. / Desalination 249 (2009) 217–223
higher rawwater conductivitywould require shorter purification cyclesas the saturation of electrodes is reached more rapidly. Moreover, theaddition of sulfates had a minor impact since nitrates removal was 98%,97.4% and 95.6% for rawwaters containing sulfates concentrations of 0,50 and 100 mg/L, respectively. Furtherworkwould be required to studythe effects of ion properties on electrosorption capacities of charge-barrier CDI. Previous researchwith carbon aerogel-based CDI suggestedthe occurrence of ion selectivity based on ionic size [10]. The impact ofion charge and atomic weight was already studied [8]. Experimentswere carried out using 0.005 M solutions at 1.4 V, 100 mL/min, ambientpH and a run time of 10 min. Data showed that the sorption of thedivalent species was limited when multiple ions of varying valenceswere present.
IX, RO and ED are suitable water treatment processes to treatnitrate-laden water. Charge-barrier CDI exhibited an alternative forremoving nitrates and ammonium ions from drinking water. The useof charge-barrier CDI did not require any chemical to regenerate thecarbon electrodes, which avoided the formation of a secondary wasteby-product. Concentrations of nitrates in treated water were reducedto less than 11.8 mg/L whereas the maximum concentration ofnitrate-N allowed based on US EPA guidelines is 10 mg/L. The DesELsystem is capable of removing nitrate-N to levels below thisconcentration in drinking water but for high rawwater conductivities,the Low Conductivity Set Point should be decreased. Deterioration ofthe carbon electrodes performance was not observed and the processcould be operated at various levels of conductivity removal and waterrecovery efficiencies without the electrolysis of capacitive carbonstacks. However, the use of several treatment stages could be neces-sary depending on the conductivity required in the treated water andthe rawwater conductivity. During experiments conducted on ammo-nium ions, the minimal concentration obtained in the treated waterwas 122.9 mg N–NH4/L with one treatment stage.
Finally, the experimental design focused on the removal of variousconcentrations of TDS, nitrates and ammonium ions in an influentwith low concentration (2.0–2.5 mg C/L) of Natural Organic Matter(NOM). It would be interesting to perform experiments with naturalwaters in order to verify the impact of higher NOM concentrationson ion selective layers and on the sorption capacity of electrodes.According to [8], the presence of NOM appeared to reduce theinorganic sorption capacity of the carbon aerogelmaterial. An increasein the NOM concentration also produced a reduction in the adsorptioncapacity of bromide with Ag-doped carbon aerogels [21]. This may bedue to the blocking of aerogel pores by adsorption of the organicmatter. High-surface-area carbons, such as activated carbon, stronglyadsorb organic material which may constitute nutrients supportingbacterial growth, resulting in biofouling [22].
5. Summary and conclusions
Charge-barrier capacitive deionisation was effective at removingTDS (80.9%–94.3%), nitrates (88%–98%) and ammonium ions (71.9%–88.1%) from water streams. Power consumption ranged between 0.45and 5.35 kWh/m3 by using a rawwater TDS concentration between 150and 3000 mg/L TDS. One of the main advantages is that no chemicalsare required for the regeneration of the electrodes. Preliminary resultsdemonstrated that this technology offers an innovative alternative fordemineralising water up to a certain level of salinity. The statisticalmodel developed to predict TDS removal is statistically highly sig-nificant but should be validated using other experimental conditions.Since experiments were conducted in spiked water, they may notrepresent a naturalwatermatrix. Assays should be conducted in naturalwaters and in a steady-state manner (hundreds of treatment cycles)to confirm data obtained. From a research perspective, further work
would also be required to understand and explore the long-termfouling of the electrodes. Longer time period testingwould be necessaryto fully answer this question. Chemicals may also be used for pre-treatment if raw waters contain high concentrations of NOM. Furtherwork would be beneficial to explore the interaction between theelectrically charged electrodes and the NOM present in some rawnatural waters.
Acknowledgments
Thewriters would like to acknowledge the staff of the NSERC Chairon DrinkingWater and CREDEAU, as well as Mélanie Bolduc and DenisBouchard, for their support in the laboratory work. They would alsolike to thank Leonard Seed and Dr. Gene Shelp (ENPAR Tech. Inc.,Ontario) for their technical support.
References
[1] J.E. Miller, Review of water resources and desalination technologies, SAND (2003)2003-0800.
[2] M.-W. Ryoo, G. Seo, Improvement in capacitive deionization function of activatedcarbon cloth by titania modification, Water Res. 37 (2003) 1527–1534.
[3] K.Z. Al-Subaie, Precise way to select a desalination technology, Desalination 206(2007) 29–35.
[4] S. Kuran, M. Bino, M. Andelman, B. Craft, Flow-through Capacitor Technology, TheInternational Workshop on Marine Pollution and the Impact of Seawater Desalina-tion Plants on the Coastal Environment, 1–3 December 2003, The InternationalCenter for Biosaline Agriculture Headquarters, 2003.
[5] M. Andelman, The flow through capacitor: a new tool in wastewater purification,Filtr. Sep. 35 (1998) 345–348.
[6] T.J. Welgemoed, C.F. Schutte, Capacitive deionization technologyTM: an alternativedesalination solution, Desalination 183 (2005) 327–340.
[7] J.C. Farmer, T.D. Tran, J.H. Richardson, D.V. Fix, S.C. May, S.L. Thomson, Theapplication of carbon aerogel electrodes to desalination & waste treatment. LosAngeles, California, USA, Annual Meeting of the American Institute of ChemicalEngineers (1997).
[8] C.J. Gabelich, T.D. Tran, H. Suffet, Electrosorption of inorganic salts from aqueoussolution using carbon aerogels, Environ. Sci. Technol. 36 (2002) 3010–3019.
[9] M.-W. Ryoo, J.H. Kim, G. Seo, Role of titania incorporated on activated carbon clothfor capacitive deionization of NaCl solution, J. Colloid Interface Sci. 264 (2003)414–419.
[10] J.C. Farmer, D.V. Fix, G.V. Mack, R.W. Pekala, J.F. Poco, Capacitive deionization ofNaCl and NaNO3 solutions with carbon aerogels electrodes, J. Electrochem. Soc.143 (1996) 159–169.
[11] J.C. Farmer, D.V. Fix, G.V. Mack, R.W. Pekala, J.F. Poco, Capacitive deionization ofNH4ClO4 solutions with carbon aerogel electrodes, J. Appl. Electrochem. 26 (1996)1007–1018.
[12] P. Xu, J.E. Drewes, D. Heil, G. Wang, Treatment of brackish produced water usingcarbon aerogel-based capacitive deionization technology, Water Res. 42 (2008)2605–2617.
[13] Statistica 7.0., Statsoft Inc., Tulsa, Okla. USA, 2005.[14] S. Garrido, M. Aviles, A. Ramirez, C. Calderon, A. Ramirez-Orozco, A. Nieto, G. Shelp,
L. Seed, M. Cebrian, E. Vera, Arsenic Removal from Water of Huautla, Morelos,Mexico Using Capacitive Deionization, Mexico-City, International Congress—Programme Natural Arsenic in Groundwaters of Latin American, 2006.
[15] APHA, StandardMethods for the Examination ofWater andWastewater, AmericanWater Works Association and the Water Environment Federation, Washington,DC, USA20th edition, 1998.
[16] P. Rana, N. Mohan, C. Rajagopal, Electrochemical removal of chromium fromwastewater by using carbon aerogel electrodes, Water Res. 38 (2004) 2811–2820.
[17] J.-B. Lee, K.-K. Park, H.-M. Eum, C.-W. Lee, Desalination of a thermal powerplant wastewater by membrane capacitive deionization, Desalination 196 (2006)125–134.
[18] J.-B. Lee, K.-K. Park, C.-W. Lee, Removal of inorganic ions from aqueous solution bycapacitive deionization, 206th Meeting of the Electrochemical Society, Inc, 2004.
[19] C. Della Rocca, V. Belgiorno, S. Meric, Overview of in-situ applicable nitrate removalprocesses, Desalination 204 (2007) 46–62.
[20] H. Kurama, J. Poetzschke, R. Haseneden, The application of membrane filtrationfor the removal of ammonium ions from potable water, Water Res. 36 (2002)2905–2909.
[21] M. Sánchez-Polo, J. Rivera-Utrilla, U. von Gunten, Bromide and iodide removalfrom waters under dynamic conditions by Ag-doped aerogels, J. Colloid InterfaceSci. 306 (2007) 183–186.
[22] Y. Oren, Capacitive deionization (CDI) for desalination and water treatment—past,present and future (a review), Desalination 228 (2008) 10–29.
Copyright © 2022 FDOKUMEN