Removal of nutrients and metals by constructed and naturally created wetlands in the Las Vegas...
17
Environ Monit Assess (2011) 180:97–113 DOI 10.1007/s10661-010-1775-y Removal of nutrients and metals by constructed and naturally created wetlands in the Las Vegas Valley, Nevada Achyut R. Adhikari · Kumud Acharya · Seth A. Shanahan · Xiaoping Zhou Received: 7 July 2010 / Accepted: 9 November 2010 / Published online: 2 December 2010 © Springer Science+Business Media B.V. 2010 Abstract Increased water use associated with rapid growth in the Las Vegas Valley has inad- vertently led to the creation of unique wetland systems in Southern Nevada with an abundance of biological diversity. Constructed and naturally created wetlands in the Las Vegas Valley water- shed were studied to characterize and understand their potential role for improving ecosystem ser- vices (i.e., water purification). Nutrient and metal removal was assessed at four sites including a natural urban runoff wetland, a constructed urban runoff wetland, a constructed wastewater wetland, and a natural urban runoff/wastewater wetland. Plant nutrient uptake was dependent on ambient nutrient concentrations in water and sediments of A. R. Adhikari · K. Acharya (B ) Desert Research Institute, 755 E. Flamingo Road, Las Vegas, NV 89119, USA e-mail: [email protected] S. A. Shanahan Southern Nevada Water Authority, 100 City Parkway, Suite 700, Las Vegas, NV 89106, USA X. Zhou Southern Nevada Water Authority, 1299 Burkholder Boulevard, Henderson, NV 89015, USA specific wetlands, irrespective of the type of plants present. Phosphorus was mostly concentrated in below-ground plant parts whereas nitrogen was concentrated in above-ground parts. As for met- alloids, bulrushes were more efficient than cattails at taking up arsenic and selenium. Averaging all the wetland sites and plant species, total nitrogen, phosphorus, arsenic and selenium removal was 924.2, 61.5, 0.30, and 0.38 kg/ha/year, respectively. Our findings suggest that natural and created wet- land systems can improve water quality in the Las Vegas Valley watershed for some com- mon pollutants, however, other measures are still needed to improve water quality below regulatory thresholds. Keywords Bulrush · Cattail · Constructed wetlands · Nutrients · Pollutant removal · Nevada Introduction Wetlands with a variety of hydrologic, vegetation, and soil conditions can occur naturally or be con- structed in many landscape positions (Kadlec and Wallace 2009). Wetlands are often highly produc- tive systems where numerous biological transfor- mations are taking place, driven by the natural energies of the sun, soil, wind, and by microor- ganisms, plants, and animals (Thullen et al. 2005).
-
Upload
independent -
Category
Documents
-
view
1 -
download
0
Transcript of Removal of nutrients and metals by constructed and naturally created wetlands in the Las Vegas...
Environ Monit Assess (2011) 180:97–113DOI 10.1007/s10661-010-1775-y
Removal of nutrients and metals by constructedand naturally created wetlands in the Las VegasValley, Nevada
Achyut R. Adhikari · Kumud Acharya ·Seth A. Shanahan · Xiaoping Zhou
Received: 7 July 2010 / Accepted: 9 November 2010 / Published online: 2 December 2010© Springer Science+Business Media B.V. 2010
Abstract Increased water use associated withrapid growth in the Las Vegas Valley has inad-vertently led to the creation of unique wetlandsystems in Southern Nevada with an abundanceof biological diversity. Constructed and naturallycreated wetlands in the Las Vegas Valley water-shed were studied to characterize and understandtheir potential role for improving ecosystem ser-vices (i.e., water purification). Nutrient and metalremoval was assessed at four sites including anatural urban runoff wetland, a constructed urbanrunoff wetland, a constructed wastewater wetland,and a natural urban runoff/wastewater wetland.Plant nutrient uptake was dependent on ambientnutrient concentrations in water and sediments of
A. R. Adhikari · K. Acharya (B)Desert Research Institute, 755 E. Flamingo Road,Las Vegas, NV 89119, USAe-mail: [email protected]
S. A. ShanahanSouthern Nevada Water Authority, 100 CityParkway, Suite 700, Las Vegas, NV 89106,USA
X. ZhouSouthern Nevada Water Authority, 1299 BurkholderBoulevard, Henderson, NV 89015, USA
specific wetlands, irrespective of the type of plantspresent. Phosphorus was mostly concentrated inbelow-ground plant parts whereas nitrogen wasconcentrated in above-ground parts. As for met-alloids, bulrushes were more efficient than cattailsat taking up arsenic and selenium. Averaging allthe wetland sites and plant species, total nitrogen,phosphorus, arsenic and selenium removal was924.2, 61.5, 0.30, and 0.38 kg/ha/year, respectively.Our findings suggest that natural and created wet-land systems can improve water quality in theLas Vegas Valley watershed for some com-mon pollutants, however, other measures are stillneeded to improve water quality below regulatorythresholds.
Keywords Bulrush · Cattail · Constructedwetlands · Nutrients · Pollutant removal ·Nevada
Introduction
Wetlands with a variety of hydrologic, vegetation,and soil conditions can occur naturally or be con-structed in many landscape positions (Kadlec andWallace 2009). Wetlands are often highly produc-tive systems where numerous biological transfor-mations are taking place, driven by the naturalenergies of the sun, soil, wind, and by microor-ganisms, plants, and animals (Thullen et al. 2005).
98 Environ Monit Assess (2011) 180:97–113
Performance efficiencies of constructed or naturalwetlands depend on several variables, such as thequality and quantity of effluent to be treated,and biological, physical, and chemical activities inthat particular wetland system (Greenway andWoolley 2001; Greenway 2003). Until recently, ni-trogen and phosphorus were primary constituentsof concern in wetland systems, with their con-centrations varying depending on the source ofwastewater and the extent of nonpoint source pol-lution (Vymazal 2006; Toet et al. 2005). However,recently, other pollutants such as heavy metals,radioactive chemicals, and pharmaceutical and in-dustrial organic chemicals have also emerged aspollutants of concern.
Wetland plants mediate important processes inconstructed wastewater treatment wetlands. Forexample, plant metabolic activity releases oxygeninto the rhizosphere, which aids in nitrificationthrough the direct uptake of nutrients (Brix 1997;Greenway and Woolley 2001). The access andavailability of nutrients affects plant growth re-sponse and resource allocation, which influencesremoval efficiency in wetlands (Tanner 2001).Emergent aquatic plant species such as cattails(Typha spp.), bulrushes (Schoenoplectus spp.),and reed (Phragmites australis) have been widelyused in the U.S. and elsewhere around the worldfor nutrient removal in constructed wetlands(Kadlec and Wallace 2009). Nutrient removalcan be optimized by selecting suitable specieswith higher capacities for absorption of inorganicnitrogen and phosphorus and conversion intoplant biomass (Greenway 2003; Vymazal 2007;Mitsch and Gosselink 2000). A basic understand-ing of the growth requirements and characteris-tics of wetland plants is essential for successfuldesign and operation of wastewater treatment.Several authors have studied the importance ofvegetation in removing metals from natural andconstructed wetlands for wastewater treatment(Lesage et al. 2007; Vymazal and Krása 2005;Vymazal 2007). Bioaccumulation processes arefound to be effective in reducing some metals suchas arsenic (As) and selenium (Se) into insolubleforms in some constructed wetlands (Zhang andMoore 1997; Zhang et al. 2007; Lin and Terry2003).
The Las Vegas Valley watershed located inSouthern Nevada, an arid region of the U.S., sup-ports many ecologically significant wetlands andis often regarded as an oasis in the desert(LVWCC 2009). Excessive erosion has resultedin the loss of wetlands and wildlife habitat, lossof property, damage to infrastructure, excessivesediment transport, and water quality concernsin Lake Mead (LVWCC 2009). Wetlands havedecreased significantly, from about 2000 acresin 1975 to about 300 acres in 1999 (Eckbergand Shanahan 2009). The multi-stakeholder LasVegas Wash Coordination Committee developeda management and enhancement plan to restorethe ecological services of the Las Vegas Valley’sprimary drainage channel, the Las Vegas Wash.As a restoration initiative, many erosion controlstructures are being built to stabilize the chan-nel and lands that are adjacent to these struc-tures are being revegetated with plants nativeto Mojave Desert riparian ecosystems. Like wet-lands in many other rapidly growing urban cen-ters, the wetlands in Las Vegas receive relativelyhigh amounts of nutrients from wastewater dis-charge and potential pollutants from nonpointsources. For example, selenium concentrations inurban runoff channels in the Las Vegas Valleyare above regulatory thresholds. Consequently,wetlands have been pursued as a low-cost solutionfor improving water quality in various locationsin the valley. Until now, performance of thesewetlands has not been cumulatively assessed.
The goal of this study was to compare andcontrast the key characteristics of various typesof wetlands in the Las Vegas Valley watershedto determine how well they function to improvewater quality. We investigated nutrient (nitrogenand phosphorus) and trace metal (selenium andarsenic) uptake by wetlands plants (one speciesof cattail and three species of bulrush) in fourdifferent wetlands. Above- and below-groundplant parts were compared between each site tounderstand nutrient and metalloid uptake andstorage with respect to the ambient concentrationin the water column and sediment. By determiningthe limits of wetland function, watershed manage-ment actions can be tailored to improve ecologicalservices in the Las Vegas Valley.
Environ Monit Assess (2011) 180:97–113 99
Methods
Site description
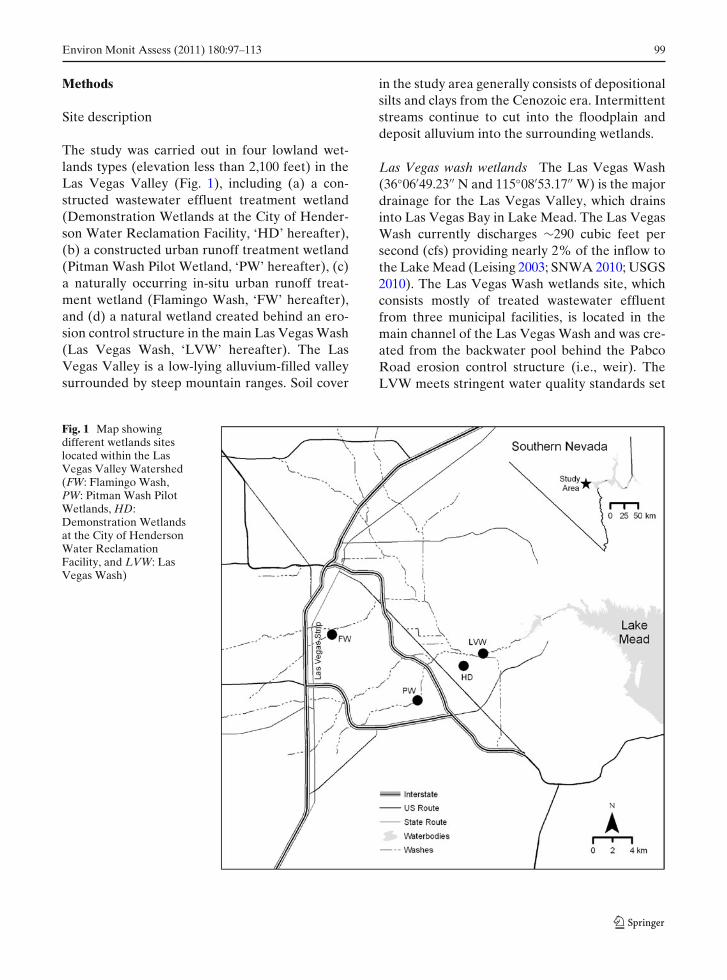
The study was carried out in four lowland wet-lands types (elevation less than 2,100 feet) in theLas Vegas Valley (Fig. 1), including (a) a con-structed wastewater effluent treatment wetland(Demonstration Wetlands at the City of Hender-son Water Reclamation Facility, ‘HD’ hereafter),(b) a constructed urban runoff treatment wetland(Pitman Wash Pilot Wetland, ‘PW’ hereafter), (c)a naturally occurring in-situ urban runoff treat-ment wetland (Flamingo Wash, ‘FW’ hereafter),and (d) a natural wetland created behind an ero-sion control structure in the main Las Vegas Wash(Las Vegas Wash, ‘LVW’ hereafter). The LasVegas Valley is a low-lying alluvium-filled valleysurrounded by steep mountain ranges. Soil cover
in the study area generally consists of depositionalsilts and clays from the Cenozoic era. Intermittentstreams continue to cut into the floodplain anddeposit alluvium into the surrounding wetlands.
Las Vegas wash wetlands The Las Vegas Wash(36◦06′49.23′′ N and 115◦08′53.17′′ W) is the majordrainage for the Las Vegas Valley, which drainsinto Las Vegas Bay in Lake Mead. The Las VegasWash currently discharges ∼290 cubic feet persecond (cfs) providing nearly 2% of the inflow tothe Lake Mead (Leising 2003; SNWA 2010; USGS2010). The Las Vegas Wash wetlands site, whichconsists mostly of treated wastewater effluentfrom three municipal facilities, is located in themain channel of the Las Vegas Wash and was cre-ated from the backwater pool behind the PabcoRoad erosion control structure (i.e., weir). TheLVW meets stringent water quality standards set
Fig. 1 Map showingdifferent wetlands siteslocated within the LasVegas Valley Watershed(FW: Flamingo Wash,PW: Pitman Wash PilotWetlands, HD:Demonstration Wetlandsat the City of HendersonWater ReclamationFacility, and LVW: LasVegas Wash)
100 Environ Monit Assess (2011) 180:97–113
by Nevada Division of Environmental Protectionat all times for the safe return of water to LakeMead and Colorado River. Land use type aroundthe LVW wetlands are dominated by undevelopeddesert areas and mixed riparian vegetation. Thewetlands area extends nearly 220 acres and thewetland vegetation in this area is dominated bycattail (Typha domingensis) and common reed(P. australis). The Las Vegas Wash also con-veys untreated urban runoff, groundwater, andstormwater (Zhou et al. 2004).
Flamingo wash wetlands These wetlands are lo-cated in the Flamingo Wash (36◦05′17.02′′ N, and114◦59′10.80′′ W), a tributary to the Las VegasWash, and consist of urban runoff with an av-erage discharge of ∼5 cfs. The adjacent landsare dominated by dense residential, commercial,and park/golf course uses. The Flamingo Washstretches for several miles but the wetlands aresomewhat patchy and sparsely located (∼5 acres).Dense vegetation of annual weeds mixed with cat-tails exists throughout the channel and provideshabitat to many aquatic and avian species.
Pittman wash pilot wetlands The Pittman Wash(36◦04′31.79′′ N and 115◦00′07.07′′ W) is ademonstration-type pilot wetland created to studywater quality improvements in urban runoff be-fore it enters the Las Vegas Wash. The PWwetlands are experimental (20 m by 20 m) andhave both surface and sub-surface flow compo-nents and a discharge of ∼5 cfs and total areaof 0.009 acres. The surrounding land use typeis similar to that of the FW. The main vege-tation in the PW wetlands is three species ofbulrushes (Schoenoplectus acutus, Schoenoplectusamericanus, and Schoenoplectus californicus).
Demonstration wetlands at the City of Hendersonwater reclamation facility This is anotherdemonstration-type wetlands located at theCity of Henderson Water Reclamation Facility(36◦02′48.29′′ N and 115◦03′13.06′′ W). This sitewas constructed to show how wetlands can im-prove partially treated wastewater effluent. Theland use type consists of residential and undevel-oped land. The 5.75-acre wetland is a triangular-shaped pond with 14 loafing and emergent
vegetation islands constructed with varying depthsof water coverage. Three species of bulrush (S.acutus, S. americanus, and S. californicus) wereplanted on eleven specially designed hummocks(Zhou and Van Dooremolen 2004).
Sampling and analyses
Water
Water samples were collected monthly from allfour sites from inlets and outlets beginning inJuly 2008 and ending in June 2009. Various pa-rameters, including total nitrogen (TN, measuredas NO3 + NO2 + NH4), total phosphorus (TP,measured as orthophosphate), dissolved oxygen(DO), pH, electrical conductance, and tempera-ture, were measured from the four sites. Nalgenebottles (1 l) used during sampling were acid rinsedprior to the sampling. Water samples were thenimmediately stored on ice. TP concentration wasdetermined using the colorimetric analysis afterpersulfate digestion (APHA 2005). TN was an-alyzed using an automated colorimetric methodusing a Lachat QC8000. Metal analysis of wa-ter samples were determined by ICP-MS using amethod based on USEPA Method 200.8 (USEPA2001).
Sediment
Sediment samples were collected from the sameinlet and outlet locations as the water samplesat all four wetlands seasonally. Vertically mixedsediment samples were collected using a plasticscoop up to ∼10 cm depth and transferred into100-ml glass bottles with polyvinyl caps. Sampleswere then dried in a convection oven at 70◦Cuntil they were completely dry. Subsamples ofdry sediment (∼1 g) were processed for metaldigestion following USEPA Method 3050B at theDesert Research Institute Ecological EngineeringLaboratory. Sediment samples were digested withrepeated addition of 70% HNO3 and 30% H2O2.A low-temperature thermostat (Lauda Ecoline,U.S. version) was used to provide uniform heat-ing of 95◦C. The resultant digest was diluted to100 ml, centrifuged, and stored at 4◦C until analy-sis. Samples were analyzed for trace metals using
Environ Monit Assess (2011) 180:97–113 101
inductively coupled plasma optical emission spec-trometry (ICP-OES) at the Goldwater Environ-mental Laboratory at Arizona State University.Sediment TP content was analyzed for 1 g dry sub-samples using the colorimetric method (APHA2005). Sediment TN content was analyzed on a drysubsample (∼1 g) using a PerkinElmer 2400 CHNanalyzer.
Plant
Plant samples were collected seasonally betweenthe inlet and outlet locations of all four wetlandsusing 0.5 m by 0.5 m quadrants. A total of 14quadrants were selected, 5 in LVW wetlands and3 each in HD, PW, and FW wetlands for veg-etation study and sampling purposes. The LVWwetlands was sampled at five quadrants due to itslarger size compared to the rest. All plant material(above- and below-ground) in each quadrant washarvested and measured for biomass, nutrients(TN and TP), and a suite of metals. Plant bio-mass was calculated using methods described inAPHA (2005) for dry plant weight by storing for72 h at 70◦C or until a consistent dry weight wasobtained. Dry plant samples were separated intoroots, stems, and leaves prior to sub-sampling fornutrients and metals analyses. A Cyclone SampleMill (UDY Corporation, Fort Collins, Colorado)was used to grind dry plant tissue to a homogenatesample of approximately 1 mm in size for nutrientand metal analyses. Plant TP and TN contentswere determined using the methods used for sedi-ment analyses. For metals, 1-g plant samples weredigested following USEPA Method 3050B. Di-gested samples were processed for metal concen-tration using ICP-OES. Twenty-nine trace metalswere analyzed in plant, sediment, and water sam-ples. Among the detected metals, selenium andarsenic were critically evaluated because of theirhigher concentrations, known presence in the val-ley, and potential adverse impact on water qual-ity and aquatic wildlife. QA/QC protocols werebased on standard methods and included reagentblanks, check standards, fortified samples, labora-tory and field duplicates and certified referencematerials for water, sediment and plant samples(APHA 2005). All samples were analyzed at anEPA certified laboratory.
Statistical analysis
Statistical analyses were carried out using JMPsoftware (SAS Institute, Cary, North Carolina).One-way analysis of variance (ANOVA) was usedto study the effect of wetlands type and plantspecies on the nutrient and metal concentrationsin plants. Two-way ANOVA was used to studythe interactions of wetlands type and species dis-tribution with TP, TN, and metal concentrations.Differences detected in ANOVAs from the wet-lands sites were compared using the Tukey pair-wise comparison test. For all of the tests, p values< 0.05 (95% confidence interval) were consideredsignificant. Plant, water, and sediment nutrientsand metals were regressed among sites to seecorrelations among them.
Results
Water quality parameters other than nutrients andmetals such as TSS, BOD, pH, temp, etc weregenerally consistent in all the wetlands. The treat-ment facilities are fitted with tertiary treatmentsystems and do a good job of keeping the TSS andBOD low in the LVW wetland similar to urbanand residential runoff fed wetlands (FW, HD, andPW wetlands). On average, pH and temperaturerange from 7.2–8.1 and 22 to 25◦C at all four wet-land sites. Similarly, average DO and TSS rangebetween 6–10 mg/L and 4 to 47 mg/L in all thewetlands.
Plant biomass
Most of the plants in the LVW and FW wet-lands were cattails, whereas the HD and PW wet-lands were dominated by three species of bulrush.
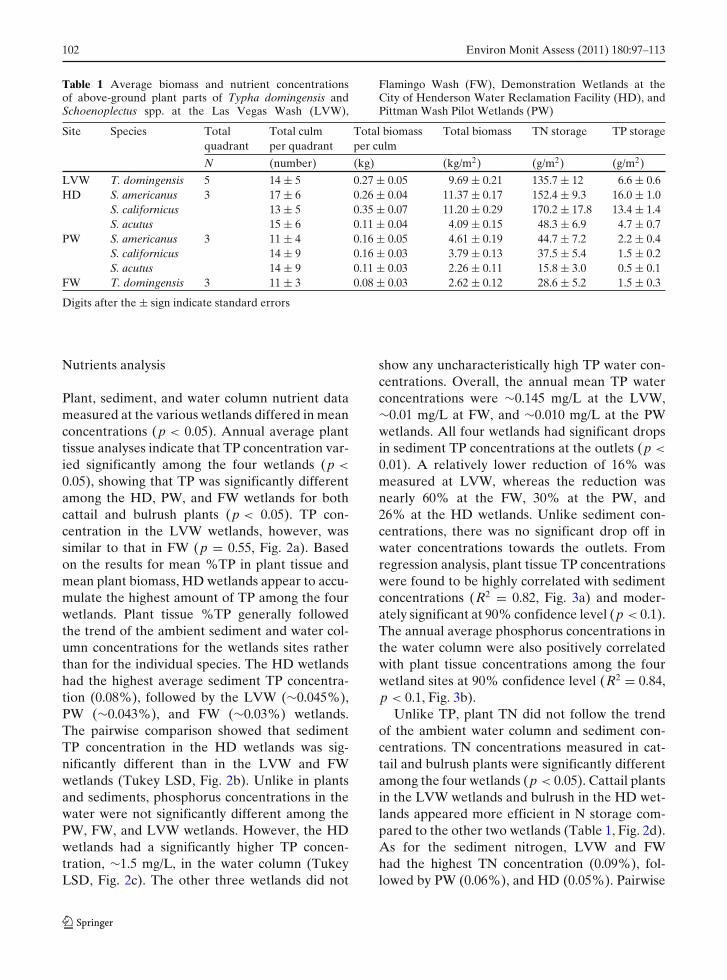
The total mass of cattails and bulrushes variedsignificantly among the four wetlands sites (Ta-ble 1). Of the two cattail dominated sites, LVWhad greater average biomass production than FW(Table 1). For the bulrush sites, all three bulrushspecies had higher biomass in HD than in PW.Overall, total biomass harvested per quadrant washighest in the HD wetlands compared to the otherthree wetlands (Table 1).
102 Environ Monit Assess (2011) 180:97–113
Table 1 Average biomass and nutrient concentrationsof above-ground plant parts of Typha domingensis andSchoenoplectus spp. at the Las Vegas Wash (LVW),
Flamingo Wash (FW), Demonstration Wetlands at theCity of Henderson Water Reclamation Facility (HD), andPittman Wash Pilot Wetlands (PW)
Site Species Total Total culm Total biomass Total biomass TN storage TP storagequadrant per quadrant per culm
N (number) (kg) (kg/m2) (g/m2) (g/m2)
LVW T. domingensis 5 14 ± 5 0.27 ± 0.05 9.69 ± 0.21 135.7 ± 12 6.6 ± 0.6HD S. americanus 3 17 ± 6 0.26 ± 0.04 11.37 ± 0.17 152.4 ± 9.3 16.0 ± 1.0
S. californicus 13 ± 5 0.35 ± 0.07 11.20 ± 0.29 170.2 ± 17.8 13.4 ± 1.4S. acutus 15 ± 6 0.11 ± 0.04 4.09 ± 0.15 48.3 ± 6.9 4.7 ± 0.7
PW S. americanus 3 11 ± 4 0.16 ± 0.05 4.61 ± 0.19 44.7 ± 7.2 2.2 ± 0.4S. californicus 14 ± 9 0.16 ± 0.03 3.79 ± 0.13 37.5 ± 5.4 1.5 ± 0.2S. acutus 14 ± 9 0.11 ± 0.03 2.26 ± 0.11 15.8 ± 3.0 0.5 ± 0.1
FW T. domingensis 3 11 ± 3 0.08 ± 0.03 2.62 ± 0.12 28.6 ± 5.2 1.5 ± 0.3
Digits after the ± sign indicate standard errors
Nutrients analysis
Plant, sediment, and water column nutrient datameasured at the various wetlands differed in meanconcentrations (p < 0.05). Annual average planttissue analyses indicate that TP concentration var-ied significantly among the four wetlands (p <
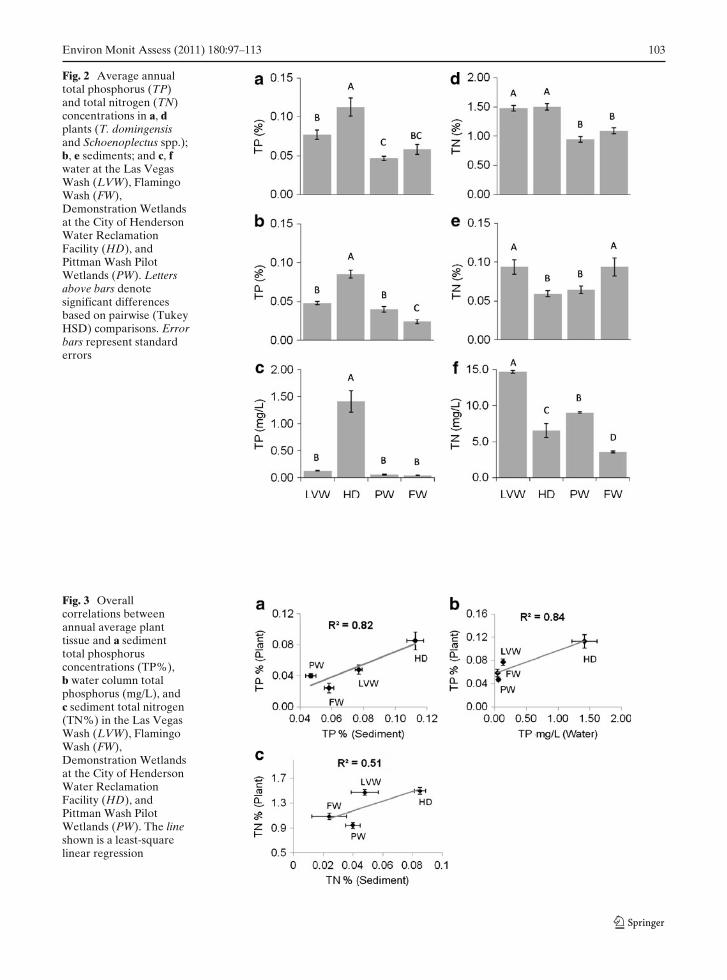
0.05), showing that TP was significantly differentamong the HD, PW, and FW wetlands for bothcattail and bulrush plants (p < 0.05). TP con-centration in the LVW wetlands, however, wassimilar to that in FW (p = 0.55, Fig. 2a). Basedon the results for mean %TP in plant tissue andmean plant biomass, HD wetlands appear to accu-mulate the highest amount of TP among the fourwetlands. Plant tissue %TP generally followedthe trend of the ambient sediment and water col-umn concentrations for the wetlands sites ratherthan for the individual species. The HD wetlandshad the highest average sediment TP concentra-tion (0.08%), followed by the LVW (∼0.045%),PW (∼0.043%), and FW (∼0.03%) wetlands.The pairwise comparison showed that sedimentTP concentration in the HD wetlands was sig-nificantly different than in the LVW and FWwetlands (Tukey LSD, Fig. 2b). Unlike in plantsand sediments, phosphorus concentrations in thewater were not significantly different among thePW, FW, and LVW wetlands. However, the HDwetlands had a significantly higher TP concen-tration, ∼1.5 mg/L, in the water column (TukeyLSD, Fig. 2c). The other three wetlands did not
show any uncharacteristically high TP water con-centrations. Overall, the annual mean TP waterconcentrations were ∼0.145 mg/L at the LVW,∼0.01 mg/L at FW, and ∼0.010 mg/L at the PWwetlands. All four wetlands had significant dropsin sediment TP concentrations at the outlets (p <
0.01). A relatively lower reduction of 16% wasmeasured at LVW, whereas the reduction wasnearly 60% at the FW, 30% at the PW, and26% at the HD wetlands. Unlike sediment con-centrations, there was no significant drop off inwater concentrations towards the outlets. Fromregression analysis, plant tissue TP concentrationswere found to be highly correlated with sedimentconcentrations (R2 = 0.82, Fig. 3a) and moder-ately significant at 90% confidence level (p < 0.1).The annual average phosphorus concentrations inthe water column were also positively correlatedwith plant tissue concentrations among the fourwetland sites at 90% confidence level (R2 = 0.84,p < 0.1, Fig. 3b).
Unlike TP, plant TN did not follow the trendof the ambient water column and sediment con-centrations. TN concentrations measured in cat-tail and bulrush plants were significantly differentamong the four wetlands (p < 0.05). Cattail plantsin the LVW wetlands and bulrush in the HD wet-lands appeared more efficient in N storage com-pared to the other two wetlands (Table 1, Fig. 2d).As for the sediment nitrogen, LVW and FWhad the highest TN concentration (0.09%), fol-lowed by PW (0.06%), and HD (0.05%). Pairwise
Environ Monit Assess (2011) 180:97–113 103
Fig. 2 Average annualtotal phosphorus (TP)and total nitrogen (TN)concentrations in a, dplants (T. domingensisand Schoenoplectus spp.);b, e sediments; and c, fwater at the Las VegasWash (LVW), FlamingoWash (FW),Demonstration Wetlandsat the City of HendersonWater ReclamationFacility (HD), andPittman Wash PilotWetlands (PW). Lettersabove bars denotesignificant differencesbased on pairwise (TukeyHSD) comparisons. Errorbars represent standarderrors
Fig. 3 Overallcorrelations betweenannual average planttissue and a sedimenttotal phosphorusconcentrations (TP%),b water column totalphosphorus (mg/L), andc sediment total nitrogen(TN%) in the Las VegasWash (LVW), FlamingoWash (FW),Demonstration Wetlandsat the City of HendersonWater ReclamationFacility (HD), andPittman Wash PilotWetlands (PW). The lineshown is a least-squarelinear regression
104 Environ Monit Assess (2011) 180:97–113
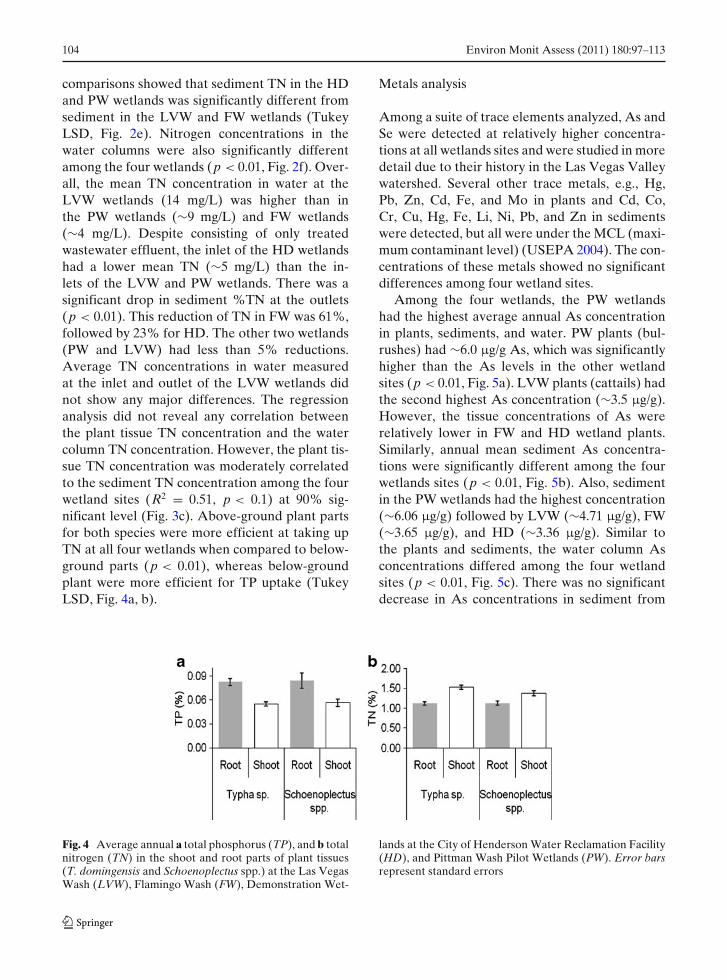
comparisons showed that sediment TN in the HDand PW wetlands was significantly different fromsediment in the LVW and FW wetlands (TukeyLSD, Fig. 2e). Nitrogen concentrations in thewater columns were also significantly differentamong the four wetlands (p < 0.01, Fig. 2f). Over-all, the mean TN concentration in water at theLVW wetlands (14 mg/L) was higher than inthe PW wetlands (∼9 mg/L) and FW wetlands(∼4 mg/L). Despite consisting of only treatedwastewater effluent, the inlet of the HD wetlandshad a lower mean TN (∼5 mg/L) than the in-lets of the LVW and PW wetlands. There was asignificant drop in sediment %TN at the outlets(p < 0.01). This reduction of TN in FW was 61%,followed by 23% for HD. The other two wetlands(PW and LVW) had less than 5% reductions.Average TN concentrations in water measuredat the inlet and outlet of the LVW wetlands didnot show any major differences. The regressionanalysis did not reveal any correlation betweenthe plant tissue TN concentration and the watercolumn TN concentration. However, the plant tis-sue TN concentration was moderately correlatedto the sediment TN concentration among the fourwetland sites (R2 = 0.51, p < 0.1) at 90% sig-nificant level (Fig. 3c). Above-ground plant partsfor both species were more efficient at taking upTN at all four wetlands when compared to below-ground parts (p < 0.01), whereas below-groundplant were more efficient for TP uptake (TukeyLSD, Fig. 4a, b).
Metals analysis
Among a suite of trace elements analyzed, As andSe were detected at relatively higher concentra-tions at all wetlands sites and were studied in moredetail due to their history in the Las Vegas Valleywatershed. Several other trace metals, e.g., Hg,Pb, Zn, Cd, Fe, and Mo in plants and Cd, Co,Cr, Cu, Hg, Fe, Li, Ni, Pb, and Zn in sedimentswere detected, but all were under the MCL (maxi-mum contaminant level) (USEPA 2004). The con-centrations of these metals showed no significantdifferences among four wetland sites.
Among the four wetlands, the PW wetlandshad the highest average annual As concentrationin plants, sediments, and water. PW plants (bul-rushes) had ∼6.0 μg/g As, which was significantlyhigher than the As levels in the other wetlandsites (p < 0.01, Fig. 5a). LVW plants (cattails) hadthe second highest As concentration (∼3.5 μg/g).However, the tissue concentrations of As wererelatively lower in FW and HD wetland plants.Similarly, annual mean sediment As concentra-tions were significantly different among the fourwetlands sites (p < 0.01, Fig. 5b). Also, sedimentin the PW wetlands had the highest concentration(∼6.06 μg/g) followed by LVW (∼4.71 μg/g), FW(∼3.65 μg/g), and HD (∼3.36 μg/g). Similar tothe plants and sediments, the water column Asconcentrations differed among the four wetlandsites (p < 0.01, Fig. 5c). There was no significantdecrease in As concentrations in sediment from
Fig. 4 Average annual a total phosphorus (TP), and b totalnitrogen (TN) in the shoot and root parts of plant tissues(T. domingensis and Schoenoplectus spp.) at the Las VegasWash (LVW), Flamingo Wash (FW), Demonstration Wet-
lands at the City of Henderson Water Reclamation Facility(HD), and Pittman Wash Pilot Wetlands (PW). Error barsrepresent standard errors
Environ Monit Assess (2011) 180:97–113 105
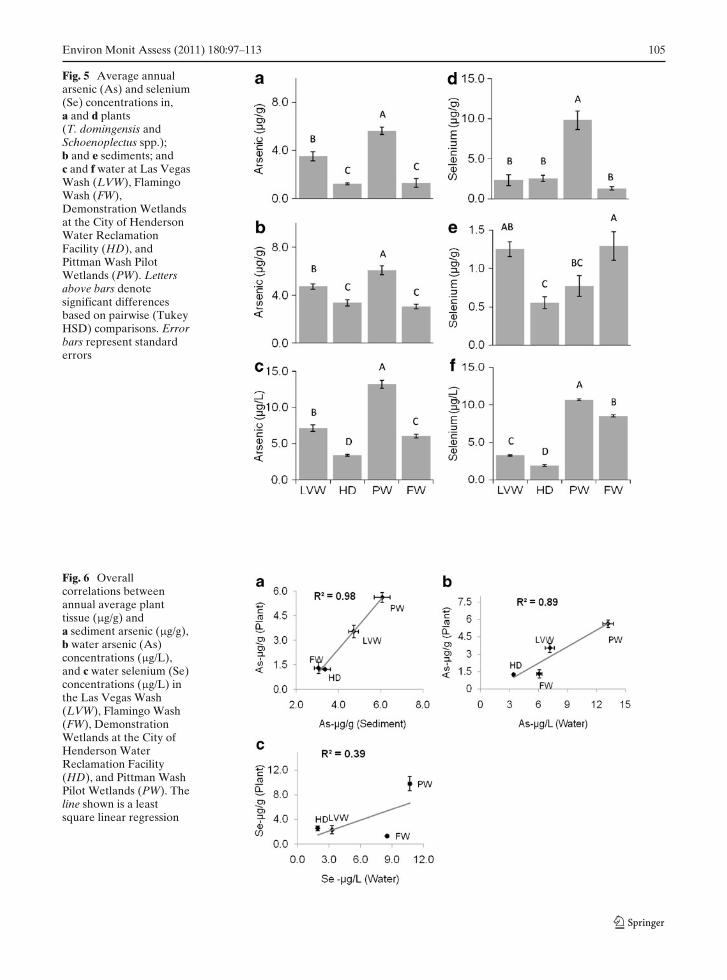
Fig. 5 Average annualarsenic (As) and selenium(Se) concentrations in,a and d plants(T. domingensis andSchoenoplectus spp.);b and e sediments; andc and f water at Las VegasWash (LVW), FlamingoWash (FW),Demonstration Wetlandsat the City of HendersonWater ReclamationFacility (HD), andPittman Wash PilotWetlands (PW). Lettersabove bars denotesignificant differencesbased on pairwise (TukeyHSD) comparisons. Errorbars represent standarderrors
Fig. 6 Overallcorrelations betweenannual average planttissue (μg/g) anda sediment arsenic (μg/g),b water arsenic (As)concentrations (μg/L),and c water selenium (Se)concentrations (μg/L) inthe Las Vegas Wash(LVW), Flamingo Wash(FW), DemonstrationWetlands at the City ofHenderson WaterReclamation Facility(HD), and Pittman WashPilot Wetlands (PW). Theline shown is a leastsquare linear regression
106 Environ Monit Assess (2011) 180:97–113
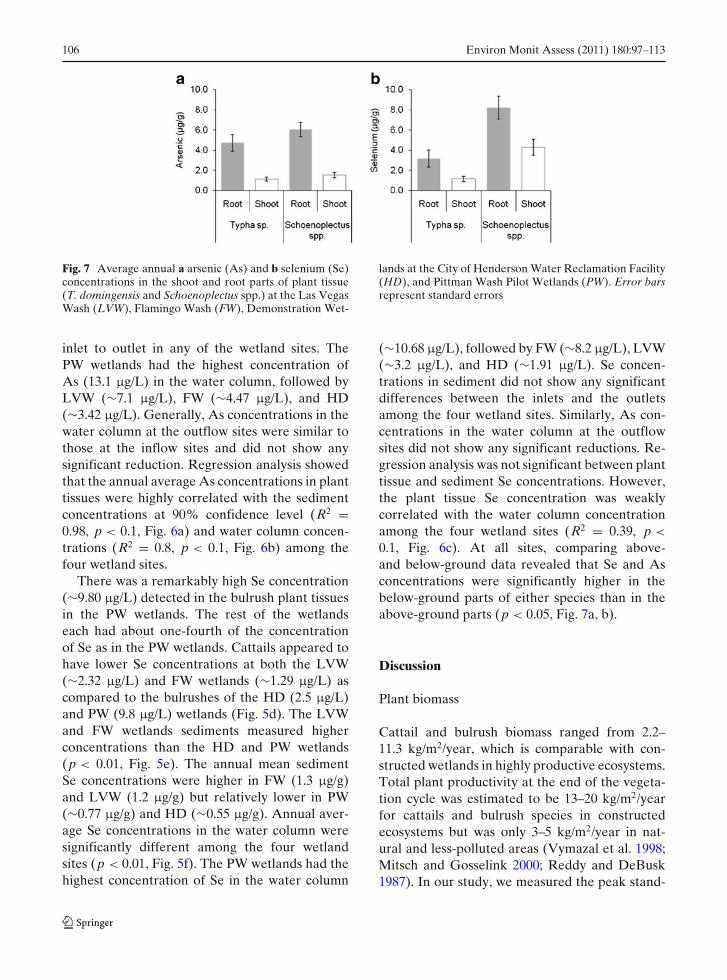
Fig. 7 Average annual a arsenic (As) and b selenium (Se)concentrations in the shoot and root parts of plant tissue(T. domingensis and Schoenoplectus spp.) at the Las VegasWash (LVW), Flamingo Wash (FW), Demonstration Wet-
lands at the City of Henderson Water Reclamation Facility(HD), and Pittman Wash Pilot Wetlands (PW). Error barsrepresent standard errors
inlet to outlet in any of the wetland sites. ThePW wetlands had the highest concentration ofAs (13.1 μg/L) in the water column, followed byLVW (∼7.1 μg/L), FW (∼4.47 μg/L), and HD(∼3.42 μg/L). Generally, As concentrations in thewater column at the outflow sites were similar tothose at the inflow sites and did not show anysignificant reduction. Regression analysis showedthat the annual average As concentrations in planttissues were highly correlated with the sedimentconcentrations at 90% confidence level (R2 =0.98, p < 0.1, Fig. 6a) and water column concen-trations (R2 = 0.8, p < 0.1, Fig. 6b) among thefour wetland sites.
There was a remarkably high Se concentration(∼9.80 μg/L) detected in the bulrush plant tissuesin the PW wetlands. The rest of the wetlandseach had about one-fourth of the concentrationof Se as in the PW wetlands. Cattails appeared tohave lower Se concentrations at both the LVW(∼2.32 μg/L) and FW wetlands (∼1.29 μg/L) ascompared to the bulrushes of the HD (2.5 μg/L)and PW (9.8 μg/L) wetlands (Fig. 5d). The LVWand FW wetlands sediments measured higherconcentrations than the HD and PW wetlands(p < 0.01, Fig. 5e). The annual mean sedimentSe concentrations were higher in FW (1.3 μg/g)and LVW (1.2 μg/g) but relatively lower in PW(∼0.77 μg/g) and HD (∼0.55 μg/g). Annual aver-age Se concentrations in the water column weresignificantly different among the four wetlandsites (p < 0.01, Fig. 5f). The PW wetlands had thehighest concentration of Se in the water column
(∼10.68 μg/L), followed by FW (∼8.2 μg/L), LVW(∼3.2 μg/L), and HD (∼1.91 μg/L). Se concen-trations in sediment did not show any significantdifferences between the inlets and the outletsamong the four wetland sites. Similarly, As con-centrations in the water column at the outflowsites did not show any significant reductions. Re-gression analysis was not significant between planttissue and sediment Se concentrations. However,the plant tissue Se concentration was weaklycorrelated with the water column concentrationamong the four wetland sites (R2 = 0.39, p <
0.1, Fig. 6c). At all sites, comparing above-and below-ground data revealed that Se and Asconcentrations were significantly higher in thebelow-ground parts of either species than in theabove-ground parts (p < 0.05, Fig. 7a, b).
Discussion
Plant biomass
Cattail and bulrush biomass ranged from 2.2–11.3 kg/m2/year, which is comparable with con-structed wetlands in highly productive ecosystems.Total plant productivity at the end of the vegeta-tion cycle was estimated to be 13–20 kg/m2/yearfor cattails and bulrush species in constructedecosystems but was only 3–5 kg/m2/year in nat-ural and less-polluted areas (Vymazal et al. 1998;Mitsch and Gosselink 2000; Reddy and DeBusk1987). In our study, we measured the peak stand-
Environ Monit Assess (2011) 180:97–113 107
ing crop, which is also known as the singlelargest value of plant material present during ayear’s growth (Richardson and Vymazal 2000).Plant productivity and nutrient accumulation inplant biomass varied widely for cattail and bul-rush species among the four different wetlandsites (Table 1). This variation could be due todifferences in environmental parameters such asincoming nutrients and hydrology in the wetlandsystems. For example, bulrushes, especially S.americanus, showed a high density of stem growthin the HD wetlands but relatively less density andbiomass in the PW wetlands.
Similarly, cattails in the LVW wetlands yieldedhigher plant density and biomass per quadrantcompared to the FW wetlands. The LVW andHD wetlands receive high nutrient loads fromwastewater treatment plants, whereas the PWand FW wetlands receive relatively lower nutrientloads as they are fed by urban runoff systems.In both of these cases, incoming nutrients mighthave played a role in the plant densities. Aquaticplants take up large quantities of nutrients andassimilate them efficiently (Cronk and Fennessy2001). The present results show that the plantsmay be capable of growing better by taking upmore nutrients (if available in the wetlands sys-tem) and producing more biomass. The biomassvalues measured in our study represent maximumseasonal biomass values and are higher than pro-ductivity estimates that include a carryover ofbiomass from the previous season. For HD, therestrictive nature of hummocks and multi seasonalgrowth might be the major reasons behind highplant biomass. Because we did not know the exactage of the plants, some plants might represent twoor more growing seasons in our random sampling.However, plants representing two growing sea-sons do not necessarily carry maximum nutrientconcentrations (Reddy and DeBusk 1987).
Nutrients analysis
Our data suggest that nutrient concentrationstended to be highest for S. californicus comparedto the other two bulrush species. Cattails werealso found to have relatively higher nutrient con-centrations. Cattail plants in our wetland sites
had high nutrient uptake compared with similarlyconstructed wetlands in other parts of the U.S(Kadlec and Wallace 2009). In a study similar toours, in two free-water surface treatment cells atthe Iron Bridge Wetland in Florida, S. californicusand Typha latifolia removed TN and TP to asimilar extent (USEPA 2000). Nitrogen uptake bycattails and bulrushes was in the range of 100–300 g N/m2 at different constructed treatment wet-lands in the U.S. (Kadlec and Wallace 2009); this iscomparable to our results. However, the nutrientstorage per m2 in our study differs significantly be-cause of the plant biomass values varying amongthe four wetlands (Table 1). High densities of bul-rush species carried large amount of nutrients inthe system, up to 170.2 g TN/m2 and 16.0 g TP/m2.Our results are on the high end compared to thefindings of Vymazal (2006), who reported thatthe nitrogen standing stock for emergent specieswas in the range of 14 to 156 g N/m2. Similarly,Tanner (2001) showed that bulrush plant tissuesaccumulated 8.8–13.4 g TP/m2 and 48–69 g TN/m2
in total biomass (root and shoot). These data arewithin a close range of our wetlands systems.
TN and TP contents of living biomass in dif-ferent wetlands vary considerably among species,plant parts, and wetland sites (Table 1). Despitetheir differences in total biomass, nutrient concen-trations in plant tissues were similar between cat-tail and bulrush species. Nutrient content per unitof biomass was generally more site-specific thanspecies-specific. This is not unique only to oursystem; for example, another study found that nu-trient removal efficiency of a system depends onthe plant type, growth rate, nutrient compositionof the water, and physicochemical environment inthe water-sediment system (Reddy and DeBusk1987). Also, in our study, below-ground parts ap-pear to be more efficient in phosphorus uptakecompared to the above-ground plant parts (ofboth cattails and bulrushes). However, in contrast,above-ground plant parts had higher nitrogen con-centrations compared to the below-ground partsfor both species. Our results are in agreement withGreenway (2005), who compared nitrogen andphosphorus in root/rhizomes and leaf/stem tissuesfor a variety of native wetlands species in con-structed wetlands in Queensland, Australia, andfound that the nitrogen content was highest in
108 Environ Monit Assess (2011) 180:97–113
the above-ground parts and the phosphorus washighest in the below-ground parts.
Species differences had little to no affect onTP uptake, rather the ambient concentration ofnutrients in the sediments appeared to drivedifferences among the specific wetland sites. Siteswith higher ambient nutrients also had generallyhigher nutrients in the plants. This is not com-pletely unexpected because plants have higherplasticity for nutrients. This has also been foundin many algal nutrient studies; for example, aprevious study found that algae grown in highernutrient concentrations have higher algal N andP concentrations due to weaker homeostasis inplants compared to other organisms (Acharya etal. 2004; Sterner and Elser 2002). There was anoticeable reduction between the inlet and out-let sediment TP concentration for all the wet-lands. However, reductions were less significantand highly variable for TP in water. Phosphorusremoval in the water column is highly variableand depends on many factors such as settling offine particles, among others. This is also suggestedin a study by Kadlec and Wallace (2009) of 250different free-water surface wetlands that showedthat the reduction of phosphorus from inflow tooutflow is unpredictable and variable.
Also, our data suggested that TP concentra-tions in plant tissue had relatively higher corre-lation with concentrations in the sediments andwater columns (Fig. 3a, b). Relative concentra-tions were particularly strong in the HD wet-lands (Fig. 2a, b, c). This is perhaps expectedconsidering that the HD wetland receives treatedeffluent from a wastewater treatment plant andthe wetland has a long retention time. Similarly,other previous studies suggest for TP removalcontact time may play a major role in the distri-bution within constructed wetlands (Drizo et al.2000), and it has been suggested that the removalefficiency of TP is positively correlated with reten-tion time (Klomjek and Nitisoravut 2005).
Total nitrogen measured in water and sedi-ments were higher in the LVW wetlands thanin other wetlands (Fig. 2e, f). The source of thehigher nitrogen input (∼14 mg/L) is the effluentcoming from the wastewater discharge (∼290 cfs)in the LVW wetlands. Whereas the FW wetland,which is a tributary of the LVW wetland, receives
much less discharge (∼5 cfs) and has much less ni-trogen in the system show higher difference in re-moval (between inlet and outlet concentrations).Both of these wetlands have similar hydrology andplant types. Comparing the difference betweeninlet and outlet measurements, the FW wetlandswere found to be more efficient in sediment nu-trient removal. Higher discharge might be toomuch to overcome for the wetlands in LVW tosubstantially increase removal of nitrogen fromthe system. Despite a loss in TN at the outletof the FW wetlands, cattails in the FW wetlandsgenerally had lower TN concentrations than inthe LVW wetlands. This may be due to a lessfavorable habitat for plants to flourish in channelwetlands combined with other means or nitro-gen removal such as denitrification. Furthermore,nutrient inputs can directly modify or changebiological communities. Fluctuations in hydrolog-ical conditions induce changes in nutrient inputs.Therefore, high dependence on hydrology is par-ticularly important in semi-arid and arid areas,where surface water levels fluctuate seasonally(Mitsch and Gosselink 2000).
In our study, nitrogen uptake by plants wasnot significantly correlated with either ambientwater and sediment concentrations, as suggestedby the weak regression coefficients for both thewater column and sediment (Fig. 3c). Differenthydrological regimes observed in our wetlandsmight have contributed to different TN and TPconcentrations in the plants, sediments, and watercolumns. Despite less nitrogen input and lowerwater and sediment concentrations, TN recoverythrough plant assimilation was remarkably high inthe HD wetlands as compared to PW wetlands.It may be due to the denitrifying of pond waterby the City of Henderson Water ReclamationFacility in March 2008 just prior to our samplingdate. Also, the plants have been growing in theHD wetlands for several years and thus weregrowing when TN concentrations in the water andsediment were much higher than during our studyperiod (Zhou and Van Dooremolen 2004). Betterperformance of the HD wetlands might also bedue to the better vegetation management practiceof using hummocks. A study in the southwesternU.S. found the properly configured hummocks inconstructed wastewater treatment wetlands can
Environ Monit Assess (2011) 180:97–113 109
be used to maintain the proper balance of veg-etation necessary to optimize treatment function(Thullen et al. 2005).
Metals analysis
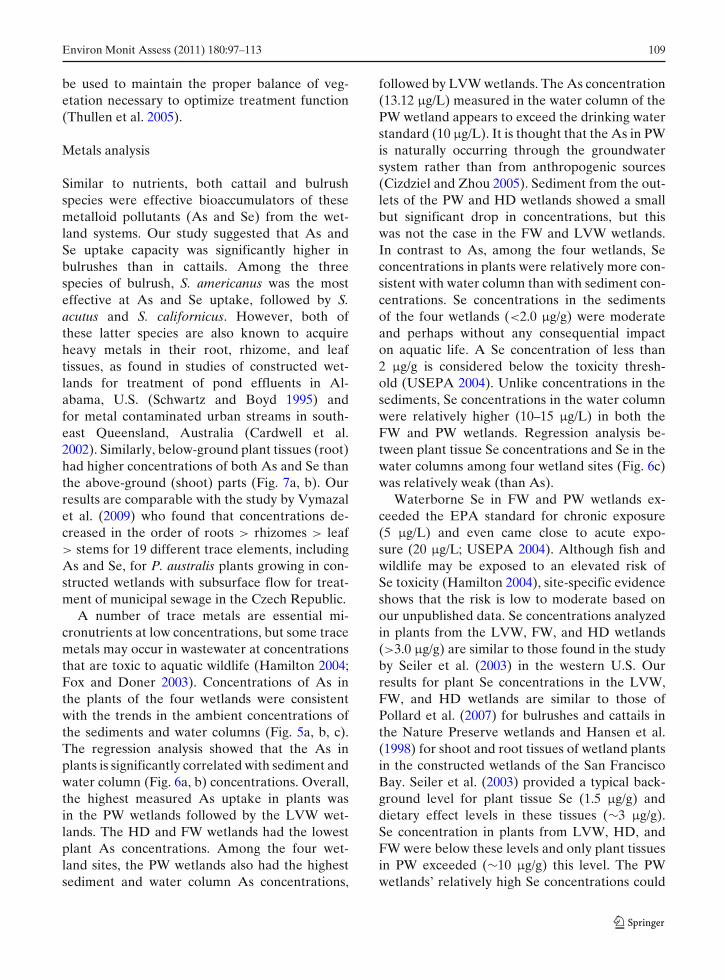
Similar to nutrients, both cattail and bulrushspecies were effective bioaccumulators of thesemetalloid pollutants (As and Se) from the wet-land systems. Our study suggested that As andSe uptake capacity was significantly higher inbulrushes than in cattails. Among the threespecies of bulrush, S. americanus was the mosteffective at As and Se uptake, followed by S.acutus and S. californicus. However, both ofthese latter species are also known to acquireheavy metals in their root, rhizome, and leaftissues, as found in studies of constructed wet-lands for treatment of pond effluents in Al-abama, U.S. (Schwartz and Boyd 1995) andfor metal contaminated urban streams in south-east Queensland, Australia (Cardwell et al.2002). Similarly, below-ground plant tissues (root)had higher concentrations of both As and Se thanthe above-ground (shoot) parts (Fig. 7a, b). Ourresults are comparable with the study by Vymazalet al. (2009) who found that concentrations de-creased in the order of roots > rhizomes > leaf> stems for 19 different trace elements, includingAs and Se, for P. australis plants growing in con-structed wetlands with subsurface flow for treat-ment of municipal sewage in the Czech Republic.
A number of trace metals are essential mi-cronutrients at low concentrations, but some tracemetals may occur in wastewater at concentrationsthat are toxic to aquatic wildlife (Hamilton 2004;Fox and Doner 2003). Concentrations of As inthe plants of the four wetlands were consistentwith the trends in the ambient concentrations ofthe sediments and water columns (Fig. 5a, b, c).The regression analysis showed that the As inplants is significantly correlated with sediment andwater column (Fig. 6a, b) concentrations. Overall,the highest measured As uptake in plants wasin the PW wetlands followed by the LVW wet-lands. The HD and FW wetlands had the lowestplant As concentrations. Among the four wet-land sites, the PW wetlands also had the highestsediment and water column As concentrations,
followed by LVW wetlands. The As concentration(13.12 μg/L) measured in the water column of thePW wetland appears to exceed the drinking waterstandard (10 μg/L). It is thought that the As in PWis naturally occurring through the groundwatersystem rather than from anthropogenic sources(Cizdziel and Zhou 2005). Sediment from the out-lets of the PW and HD wetlands showed a smallbut significant drop in concentrations, but thiswas not the case in the FW and LVW wetlands.In contrast to As, among the four wetlands, Seconcentrations in plants were relatively more con-sistent with water column than with sediment con-centrations. Se concentrations in the sedimentsof the four wetlands (<2.0 μg/g) were moderateand perhaps without any consequential impacton aquatic life. A Se concentration of less than2 μg/g is considered below the toxicity thresh-old (USEPA 2004). Unlike concentrations in thesediments, Se concentrations in the water columnwere relatively higher (10–15 μg/L) in both theFW and PW wetlands. Regression analysis be-tween plant tissue Se concentrations and Se in thewater columns among four wetland sites (Fig. 6c)was relatively weak (than As).
Waterborne Se in FW and PW wetlands ex-ceeded the EPA standard for chronic exposure(5 μg/L) and even came close to acute expo-sure (20 μg/L; USEPA 2004). Although fish andwildlife may be exposed to an elevated risk ofSe toxicity (Hamilton 2004), site-specific evidenceshows that the risk is low to moderate based onour unpublished data. Se concentrations analyzedin plants from the LVW, FW, and HD wetlands(>3.0 μg/g) are similar to those found in the studyby Seiler et al. (2003) in the western U.S. Ourresults for plant Se concentrations in the LVW,FW, and HD wetlands are similar to those ofPollard et al. (2007) for bulrushes and cattails inthe Nature Preserve wetlands and Hansen et al.(1998) for shoot and root tissues of wetland plantsin the constructed wetlands of the San FranciscoBay. Seiler et al. (2003) provided a typical back-ground level for plant tissue Se (1.5 μg/g) anddietary effect levels in these tissues (∼3 μg/g).Se concentration in plants from LVW, HD, andFW were below these levels and only plant tissuesin PW exceeded (∼10 μg/g) this level. The PWwetlands’ relatively high Se concentrations could
110 Environ Monit Assess (2011) 180:97–113
pose an elevated risk of bioaccumulation for birdsand wildlife and transfer to higher trophic levelsin the food chain. Se concentration in the PW wet-lands in bulrush plant tissue, sediments, and watercolumn is similar to Se concentrations in con-structed wetlands from other parts of the world(Kadlec and Wallace 2009). Kadlec and Wallace’sstudy compiled Se concentrations in vegetation intreatment wetlands exposed to Se, and found thatthey were typically in the range of 1–20 μg/g forplants and 1–10 μg/g for sediments.
Seasonal variation
Seasonal variation of nutrients (TN and TP) andmetals (As and Se) were also analyzed to seewhether there were any noticeable differences.There were only a few signals of variations butthese trends were not validated by statisticaltesting. For example, seasonal average TP con-centrations in the cattails were higher in LVWduring the summer season but there was no appar-ent difference between spring and winter. Similartrends were seen at HD and PW wetlands forTP% in bulrush plants with typically higher con-centrations in summer followed by lower concen-trations in spring and winter. Similarly, seasonalmean TN% in cattail and bulrush plant tissueswas similar to that of TP in all the wetlands.Also, seasonal As concentrations (μg/g) in cattailat the LVW wetlands appeared slightly higher in
summer followed by spring and winter seasons butwere not statistically significant. Three of our wet-land sites (LVW, HD, and PW) were somewhatsimilar in that winter samples (not particularlyfall) generally had higher Se concentrations inshoots for both plant types. This may be becauseof higher volatilization of Se in summer and springseason. These differences did not result in directcorrelations with sediment and water data.
Ecosystem function of wetlands
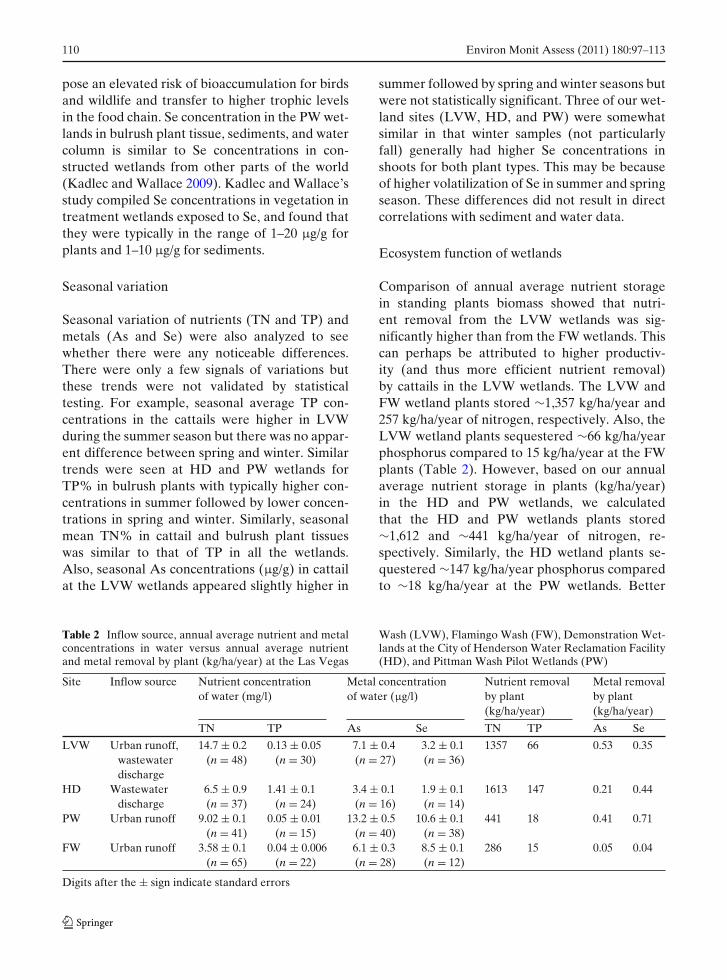
Comparison of annual average nutrient storagein standing plants biomass showed that nutri-ent removal from the LVW wetlands was sig-nificantly higher than from the FW wetlands. Thiscan perhaps be attributed to higher productiv-ity (and thus more efficient nutrient removal)by cattails in the LVW wetlands. The LVW andFW wetland plants stored ∼1,357 kg/ha/year and257 kg/ha/year of nitrogen, respectively. Also, theLVW wetland plants sequestered ∼66 kg/ha/yearphosphorus compared to 15 kg/ha/year at the FWplants (Table 2). However, based on our annualaverage nutrient storage in plants (kg/ha/year)in the HD and PW wetlands, we calculatedthat the HD and PW wetlands plants stored∼1,612 and ∼441 kg/ha/year of nitrogen, re-spectively. Similarly, the HD wetland plants se-questered ∼147 kg/ha/year phosphorus comparedto ∼18 kg/ha/year at the PW wetlands. Better
Table 2 Inflow source, annual average nutrient and metalconcentrations in water versus annual average nutrientand metal removal by plant (kg/ha/year) at the Las Vegas
Wash (LVW), Flamingo Wash (FW), Demonstration Wet-lands at the City of Henderson Water Reclamation Facility(HD), and Pittman Wash Pilot Wetlands (PW)
Site Inflow source Nutrient concentration Metal concentration Nutrient removal Metal removalof water (mg/l) of water (μg/l) by plant by plant
(kg/ha/year) (kg/ha/year)
TN TP As Se TN TP As Se
LVW Urban runoff, 14.7 ± 0.2 0.13 ± 0.05 7.1 ± 0.4 3.2 ± 0.1 1357 66 0.53 0.35wastewater (n = 48) (n = 30) (n = 27) (n = 36)discharge
HD Wastewater 6.5 ± 0.9 1.41 ± 0.1 3.4 ± 0.1 1.9 ± 0.1 1613 147 0.21 0.44discharge (n = 37) (n = 24) (n = 16) (n = 14)
PW Urban runoff 9.02 ± 0.1 0.05 ± 0.01 13.2 ± 0.5 10.6 ± 0.1 441 18 0.41 0.71(n = 41) (n = 15) (n = 40) (n = 38)
FW Urban runoff 3.58 ± 0.1 0.04 ± 0.006 6.1 ± 0.3 8.5 ± 0.1 286 15 0.05 0.04(n = 65) (n = 22) (n = 28) (n = 12)
Digits after the ± sign indicate standard errors
Environ Monit Assess (2011) 180:97–113 111
ecosystem function of the HD and LVW wetlandsis not only due to higher plant biomass and nu-trient concentrations but also due to the largersurface area of the wetlands.
Metal removal efficiency among the fourwetland plants suggests that the annual aver-age As uptake was higher at the LVW wet-land plants (0.53 kg/ha/year) compared to FW(0.05 kg/ha/year). Similarly, LVW wetland plantsstored (0.35 kg/ha/year) Se which was also higherthan at FW plants (0.04 kg/ha/year). It appearsthat the larger the surface area of wetland veg-etation, the higher the metal accumulation andtherefore the higher the flux, suggesting that wet-land acreage is important as well. However, thiswas contradicted to some extent by the PW wet-lands data which showed higher metal storage perunit area than any other wetlands in our study(Table 2).
Despite clear evidence that nutrients and met-als are taken up by the plants in our study, it is puz-zling that any significant water quality improve-ments are not seen between inlets and outlets.This could be because of the short residence timeof water or short distance between inflow/outflowsampling locations which needs further investiga-tion in future studies. However, it does appearthat annual harvesting of the plants from thesewetlands would provide significant removal of nu-trients and metals.
Conclusions
Constructed and naturally created wetlands inthe Las Vegas Valley watershed were studied tounderstand their potential for pollutant removal.Significant removal of nutrients was found in thewetlands receiving high nutrient loads and bothplant species in the four wetlands sites were quiteefficient in taking up large amounts of nutrientsand metals. The nutrient removal capacity of awetland system was more dependent on individ-ual plant biomass irrespective of plant type, i.e.,on the size of individual plants or plant density.The nitrogen concentration was higher in above-ground plant parts but the phosphorus was higherin the belowground parts, which suggests thatharvest of the root system would be necessary
for maximum phosphorus removal, but an above-ground harvest would be sufficient for nitrogenremoval from our wetlands systems. Plant nutri-ents in the four wetland sites correlated well withambient nutrient concentrations in the sedimentsand water columns, irrespective of the type ofplants present. Overall, this study suggests thatdifferent plant species have different capacitiesto take up nutrients, with these capacities mostlydetermined by the ambient nutrient and hydro-logic conditions. Bulrush species seem particularlyefficient for taking up metals such as As and Se,as compared to cattails. Also, the below-groundplants for both species seemed to store metalsmore efficiently than above-ground parts. Highermetal accumulation in the PW wetlands plantssuggested that there is a potential for wildlifeexposure. Better information on the bioaccumu-lative properties of the bulrush species found inthe wetlands in this study might provide cluesfor Se removal using existing wetland plants inthese wetlands. These findings have importantimplications for improving our ability to engineerecological solutions to problems associated withnutrient-rich wastewater and to implement sus-tainable wetlands management plans.
Acknowledgements This project was partially fundedby the Southern Nevada Water Authority (SNWA),Las Vegas, Nevada through a grant (No. 06FG300043) re-ceived by SNWA from the Bureau of Reclamation that wasdedicated to Las Vegas Wash Coordination Committeeprograms. We thank Debbie Van Dooremolen and CarolLane for providing thoughtful input to the study designand generous help during sample collection. Finally, wewould like to thank Tom Collela, Marisa Masles, and CathyKochert of the Goldwater Environmental Laboratory,Arizona State University, and Mary Miller of WaterQuality Laboratory, Desert Research Institute, Reno, fortheir help in sample analysis.
References
Acharya, K., Kyle, M., & Elser, J. (2004). Effects of sto-ichiometric dietary mixing on Daphnia growth andreproduction. Oecologia, 138, 333–340.
APHA (2005). Standard methods for the examination ofwater and wastewater. American Public Health Asso-ciation/Water Environment Federation, WashingtonD.C.
112 Environ Monit Assess (2011) 180:97–113
Brix, H. (1997). Do macrophytes play a role in constructedtreatment wetlands? Water Science and Technology,35, 11–17.
Cardwell, A. J., Hawker, D. W., & Greenway, M. (2002).Metal accumulation from aquatic macrophytes fromsoutheast Queensland, Australia. Chemosphere, 48,653–663.
Cizdziel, J. V., & Zhou, X. (2005). Sources and concentra-tions of mercury and selenium in compartments withinthe Las Vegas Wash during period of rapid change.Environmental Monitoring and Assessment, 107, 81–99.
Cronk, J. K., & Fennessy, M. S. (2001). Wetland plants:Biology and ecology. Florida: Lewis, Boca Raton.
Drizo, A., Frost, C. A., Grace, J., & Smith, K. A. (2000).Phosphate and ammonium distribution in a pilot-scaleconstructed wetland with horizontal subsurface flowusing shale as a substrate. Water Research, 39, 2438–2490.
Eckberg, J. R., & Shanahan, S. A. (2009). Las Vegas washvegetation monitoring report, 2008. Southern NevadaWater Authority, Las Vegas, Nevada.
Fox, P. M., & Doner, H. E. (2003). Accumulation, releaseand solubility of arsenic, molybdenum, and vanadiumin wetland sediments. Journal of Environmental Qual-ity, 32, 2428–2435.
Greenway, M. (2003). Suitability of macrophytes for nu-trient removal from surface flow constructed wet-lands receiving secondary treated sewage effluent inQueensland, Australia. Water Science and Technol-ogy, 48, 121–128.
Greenway, M. (2005). The role of constructed wetlands insecondary effluent treatment and water reuse in sub-tropical and arid Australia. Ecological Engineering,25, 501–509.
Greenway, M., & Woolley, A. (2001). Changes in plantbiomass and nutrient removal over 3 years in a con-structed wetland in Cairns, Australia. Water Scienceand Technology, 44, 303–320.
Hamilton, S. J. (2004). Review of selenium toxicity in theaquatic food chain. Science of the Total Environment,326, 1–3.
Hansen, D., Duda, P. J., Zayed, A., & Terry, N. (1998).Selenium removal by constructed wetlands: Role ofbiological volatilization. Environmental Science andTechnology, 32, 591–597.
Kadlec, R. H., & Wallace, S. D. (2009). Treatment wetlands(2nd ed.). Florida: CRC, Boca Raton.
Klomjek, P., & Nitisoravut, S. (2005). Constructed treat-ment wetland: A study of eight plant species undersaline conditions. Chemosphere, 5, 585–593.
Leising, J. F. (2003). Dye traces help quantify flow at LasVegas wash. Southwest Hydrology, 2, 8–9.
Lesage, E., Rousseau, D. P. L., Meers, E., Van de Moortel,A. M. K., Du Laing, G., Tack, F. M. G., et al. (2007).Accumulation of metals in the sediment and reed bio-mass of a combined constructed wetland treating do-mestic wastewater. Water, Air, and Soil Pollution, 183,253–264.
Lin, Z., & Terry, N. (2003). Selenium removal by con-structed wetlands: Quantitative importance of biolog-
ical volatilization in the treatment of selenium-ladenagricultural drainage water. Environmental Scienceand Technology, 3, 606–615.
LVWCC (2009). What is being done? Las Vegas washcoordinating committee website. Available via http://www.lvwash.org. Accessed 19 Dec 2009.
Mitsch, W. J., & Gosselink, J. G. (2000). Wetlands.New York: Wiley.
Pollard, J., Cizdziel, J., Stave, K., & Reid, M. (2007). Se-lenium concentrations in water and plant tissues ofa newly formed arid wetland in Las Vegas, Nevada.Environmental Monitoring and Assessment, 135, 447–457.
Reddy, K. R., & DeBusk, W. F. (1987). Nutrient storagecapabilities of aquatic and wetland plants. In: K. R.Reddy, & W. H. Smith (Eds.), Aquatic plants for watertreatment (pp. 337–357). Orlando, Florida: Magnolia.
Richardson, C. J., & Vymazal, J. (2000). Sampling macro-phytes in wetlands. In: R. B. Rader, D. P. Barter, &S. A. Wissinger (Eds.), Bioassessment and manage-ment of North American freshwater wetlands (pp. 297–337). New York: Wiley.
Schwartz, M. E., & Boyd, C. E. (1995). Constructed wet-lands for treatment of channel catfish pond effluents.The Progressive Fish-Culturist, 57, 255–266.
Seiler, R. L., Skorupa, J. P., Naftz, D. L., & Nolan, B. T.(2003). Irrigation-induced contamination of water, sed-iment, and biota in the Western United States: Synthesisof data from the national irrigation water quality pro-gram. USGS Professional Paper 1655.
SNWA (2010). What is the “Wash”? Las Vegas WashCoordination Committee, Las Vegas, Nevada. Avail-able via http://www.lvwash.org/wash/main. Accessed15 Jan 2010.
Sterner, R. W., & Elser, J. J. (2002). Ecological stoichiom-etry: The biology of elements from molecules to thebiosphere. Princeton University Press, Princeton, NJ.
Tanner, C. C. (2001). Growth and nutrient dynamicsof soft-stem bulrush in constructed wetlands treat-ing nutrient-rich wastewaters. Wetlands Ecology andManagement, 9, 49–73.
Thullen, J. S., Sartoris, J. J., & Nelson, S. M. (2005). Man-aging vegetation in surface-flow wastewater treatmentwetlands for optimal treatment performance. Ecolog-ical Engineering, 25, 583–593.
Toet, S., Bouwman, M., Cevaal, A., & Verhoeven, J.(2005). Nutrient removal through autumn harvest ofPhargmites australis and Typha latifolia shoots in rela-tion to nutrient loading in a wetland system used forpolishing sewage treatment plant effluent. Journal ofEnvironmental Science and Health, 40, 1133–1156.
USEPA (2000). Constructed wetlands treatment of munici-pal wastewaters, EPA 625/r-99/010. USEPA Office ofResearch and Development, Washington DC.
USEPA (2001). Determination of trace elements in watersand wastes by inductively coupled plasma mass spec-trophotometry, method 7473, U.S. Environmental Pro-tection Agency, Washington DC.
USEPA (2004). Water quality criteria, ambient aquaticlife, selenium. U.S. Environmental Protection Agency,Washington DC.
Environ Monit Assess (2011) 180:97–113 113
USGS (2010). Surface–Water Annual Statistics for theNation. United state Geological Survey. Availablevia http://waterdata.usgs.gov/nwis/annual. Accessed18 Jan 2010.
Vymazal, J. (2006). Constructed wetlands with emergentmacrophyte: From experiments to a high quality treat-ment technology. In: V. Dias, & J. Vymazal (Eds.),In Proceedings of the 10th international conferences onwetland systems for water pollution control (pp. 3–27).Lisbon, Portugal.
Vymazal, J. (2007). Removal of nutrients in various typesof constructed wetlands. Science of The Total Environ-ment, 380, 45–65.
Vymazal, J., Brix, H., Cooper, P. F., Green, M. B., &Haberl, R. (1998). Constructed wetlands for waste-water treatment in Europe. Backhuys, Leiden, TheNetherlands.
Vymazal, J., Krása, P. (2005). Heavy metals budget forconstructed wetland treating municipal sewage. In:J. Vymazal (Ed.), Natural and constructed wetlands:Nutrients, metals and management (pp. 135–142).Backhuys, Leiden, The Netherlands.
Vymazal, J., Kröpfelová, L., Švehla, J., Chrastny, V., &Štíchová, J. (2009). Trace elements in Phragmites aus-tralis growing in constructed wetlands for treatmentof municipal wastewater. Ecological Engineering, 35,303–309.
Zhang, Y., & Moore, J. N. (1997). Reduction potential ofselenate in wetland sediment. Journal of Environmen-tal Quality, 32, 910–916.
Zhang, Z., Rengel, Z., & Meney, K. (2007). Interac-tive effects of nitrogen and phosphorus loadingson nutrient removal from simulated wastewater us-ing Schoenoplectus validus in wetland microcosms.Chemosphere, 72, 1823–1828.
Zhou, X., Roefer, P., & Zikmund, K. (2004). LasVegas wash monitoring and characterization study: Re-sults for water quality in the wash and tributaries. Fi-nal Report 2004, Southern Nevada Water Authority,Las Vegas, Nevada.
Zhou, X., & Van Dooremolen, D. M. (2004). Demonstra-tion wetlands study in the city of Henderson water recla-mation facility. Final Report 2007, Southern NevadaWater Authority, Las Vegas, Nevada.