Reliability of tumor volume estimation from MR images in patients with malignant glioma. Results...
19
Reliability of tumor volume estimation from MR images in patients with malignant glioma. Results from the American College of Radiology Imaging Network (ACRIN) 6662 Trial Birgit B. Ertl-Wagner, Institute of Clinical Radiology, University of Munich— Grosshadern Campus, Marchioninistrasse 15, 81377 Munich, Germany, e-mail: [email protected], Tel.: +49-89-70953620, Fax: +49-89-70958832 Jeffrey D. Blume, Center for Statistical Sciences, Brown University, Providence, RI, USA Donald Peck, Department of Radiology, Henry Ford Hospital, Detroit, MI, USA Jayaram K. Udupa, Department of Radiology, University of Pennsylvania, Philadelphia, PA, USA Benjamin Herman, Center for Statistical Sciences, Brown University, Providence, RI, USA Anthony Levering, American College of Radiology Imaging Network, Philadelphia, PA, USA Ilona M. Schmalfuss, and Department of Radiology, University of Florida-Gainesville, Gainesville, FL, USA The members of the ACRIN 6662 study group Abstract Reliable assessment of tumor growth in malignant glioma poses a common problem both clinically and when studying novel therapeutic agents. We aimed to evaluate two software-systems in their ability to estimate volume change of tumor and/or edema on magnetic resonance (MR) images of malignant gliomas. Twenty patients with malignant glioma were included from different sites. Serial post-operative MR images were assessed with two software systems representative of the two fundamental segmentation methods, single-image fuzzy analysis (3DVIEWNIX-TV) and multi- spectral-image analysis (Eigentool), and with a manual method by 16 independent readers (eight MR-certified technologists, four neuroradiology fellows, four neuroradiologists). Enhancing tumor volume and tumor volume plus edema were assessed independently by each reader. Intraclass correlation coefficients (ICCs), variance components, and prediction intervals were estimated. There were no significant differences in the average tumor volume change over time between the software systems (p>0.05). Both software systems were much more reliable and yielded smaller prediction intervals than manual measurements. No significant differences were observed between the volume changes determined by fellows/neuroradiologists or technologists. Semi-automated software systems are reliable tools to serve as outcome parameters in clinical studies and the basis for therapeutic decision-making for malignant gliomas, whereas manual measurements are less reliable and should not be the basis for clinical or research outcome studies. Correspondence to: Birgit B. Ertl-Wagner. NIH Public Access Author Manuscript Eur Radiol. Author manuscript; available in PMC 2010 March 1. Published in final edited form as: Eur Radiol. 2009 March ; 19(3): 599–609. doi:10.1007/s00330-008-1191-7. NIH-PA Author Manuscript NIH-PA Author Manuscript NIH-PA Author Manuscript
-
Upload
independent -
Category
Documents
-
view
1 -
download
0
Transcript of Reliability of tumor volume estimation from MR images in patients with malignant glioma. Results...
Reliability of tumor volume estimation from MR images in patientswith malignant glioma. Results from the American College ofRadiology Imaging Network (ACRIN) 6662 Trial
Birgit B. Ertl-Wagner,Institute of Clinical Radiology, University of Munich— Grosshadern Campus, Marchioninistrasse 15,81377 Munich, Germany, e-mail: [email protected], Tel.:+49-89-70953620, Fax: +49-89-70958832
Jeffrey D. Blume,Center for Statistical Sciences, Brown University, Providence, RI, USA
Donald Peck,Department of Radiology, Henry Ford Hospital, Detroit, MI, USA
Jayaram K. Udupa,Department of Radiology, University of Pennsylvania, Philadelphia, PA, USA
Benjamin Herman,Center for Statistical Sciences, Brown University, Providence, RI, USA
Anthony Levering,American College of Radiology Imaging Network, Philadelphia, PA, USA
Ilona M. Schmalfuss, andDepartment of Radiology, University of Florida-Gainesville, Gainesville, FL, USA
The members of the ACRIN 6662 study group
AbstractReliable assessment of tumor growth in malignant glioma poses a common problem both clinicallyand when studying novel therapeutic agents. We aimed to evaluate two software-systems in theirability to estimate volume change of tumor and/or edema on magnetic resonance (MR) images ofmalignant gliomas. Twenty patients with malignant glioma were included from different sites. Serialpost-operative MR images were assessed with two software systems representative of the twofundamental segmentation methods, single-image fuzzy analysis (3DVIEWNIX-TV) and multi-spectral-image analysis (Eigentool), and with a manual method by 16 independent readers (eightMR-certified technologists, four neuroradiology fellows, four neuroradiologists). Enhancing tumorvolume and tumor volume plus edema were assessed independently by each reader. Intraclasscorrelation coefficients (ICCs), variance components, and prediction intervals were estimated. Therewere no significant differences in the average tumor volume change over time between the softwaresystems (p>0.05). Both software systems were much more reliable and yielded smaller predictionintervals than manual measurements. No significant differences were observed between the volumechanges determined by fellows/neuroradiologists or technologists. Semi-automated softwaresystems are reliable tools to serve as outcome parameters in clinical studies and the basis fortherapeutic decision-making for malignant gliomas, whereas manual measurements are less reliableand should not be the basis for clinical or research outcome studies.
Correspondence to: Birgit B. Ertl-Wagner.
NIH Public AccessAuthor ManuscriptEur Radiol. Author manuscript; available in PMC 2010 March 1.
Published in final edited form as:Eur Radiol. 2009 March ; 19(3): 599–609. doi:10.1007/s00330-008-1191-7.
NIH
-PA Author Manuscript
NIH
-PA Author Manuscript
NIH
-PA Author Manuscript
IntroductionIn the United States, approximately 17,000 patients are affected by primary brain tumors eachyear [1]. Approximately 60% of these are gliomas, with the majority belonging to the high-grade or WHO grade III and IV category. The median survival rate of a patient diagnosed witha high-grade glioma is still under 12 months. Cure rates are exceedingly low [2]. Despitemarked advances in surgery, chemotherapy, radiation therapy, and diagnostic radiology,survival rates in patients with high-grade gliomas appear largely unaffected [3-5]. There is apronounced need for new, effective therapeutic approaches to brain tumors. Magneticresonance (MR) imaging is a decisive factor in the assessment of the efficacy of new therapeuticstrategies and is, therefore, a paramount factor in the design of brain tumor therapy trials. MRimaging moreover plays a key role in the clinical evaluation of brain tumor patients both forthe primary diagnostic assessment and for surgical planning as well as post-operative follow-up.
The quantitative assessment of the tumor volume [6-8] is required for measurement of tumorresponse to a therapy and may also serve as a surrogate end-point in randomized clinical trials.(e.g., phase II trials). In addition, a quantitative assessment of the tumor volume also serves asa guide for the clinician and the patient in therapeutic decision-making both in clinical and instudy settings [8].
In the year 2000, guidelines to evaluate the response to treatment in solid tumors were publishedby a task force set up by the National Cancer Institute (NCI) of the United States, the EuropeanOrganization for Research and Treatment of Cancer (EORTC) and the National CancerInstitute of Canada Clinical Trials Group: the Response Evaluation Criteria in Solid Tumors(RECIST) [6]. RECIST guidelines recommend a manual metric measurement of the longestdiameter of the lesion by use of a ruler or calipers. If more than one lesion is present, the sumof the longest diameters of all target lesions should be calculated[6]. The RECIST criteria havethe advantage of being an easy, fast and readily available tool in the evaluation of tumorresponse [7]. They, however, solely focus on a monodimensional measurement and do not takeinto account the three-dimensionality and the complex and heterogeneous structure ofmalignant gliomas. Moreover, manual measurements can be expected to be highly operator-dependent and may vary widely, depending on the reporting neuroradiologist. Thus, a reliablevolumetric assessment of the tumor volume and of the volume of the surrounding T2 signalabnormality is desirable.
In the past, MR imaging-based tumor-volume assessment with manual segmentation wascumbersome and frequently unreliable. Previous reports have demonstrated rather large inter-and intra-rater variations with other segmentation techniques and have reported a casedependency for the accuracy of measurements [9]. However, the effects of reader expertiseand previous surgical treatment upon the inter- and intra-rater variability with computer-assisted techniques have not yet been reported. It is necessary to evaluate the variation ofsegmentation systems before their application in brain tumor therapy trials becomes feasible.
In recent years, computer-assisted systems for the assessment of brain tumor volumes havebeen developed, in which the reader marks the area of interest, while the system segments thevarious imaging regions and computes the respective volume.
Although there are many computer-assisted methods that have been developed, this studyutilizes two representative methods, Eigentool and 3DVIEWNIX-TV [10-16]. The twosoftware systems were selected due to the following reasons. First, the methods implementedin the two systems are representative of two classes of techniques available for image
Ertl-Wagner et al. Page 2
Eur Radiol. Author manuscript; available in PMC 2010 March 1.
NIH
-PA Author Manuscript
NIH
-PA Author Manuscript
NIH
-PA Author Manuscript
segmentation, particularly for delineating tumors in MR images. These two classes are single-image fuzzy analysis (3DVIEWNIX-TV) and multi-spectral-image analysis (Eigentool).Second, these techniques have been published and technically evaluated [17-19]. Third, thesoftware systems have been used in tumor volume estimation and other volume measurementapplications independently of this project [17-19].
Both systems minimize operator dependence on tumor-volume assessment. However, theextent of interobserver variability for the assessment of tumor volume remains to bedemonstrated. Moreover, the extent of the influence of the reader’s expertise and training levelon the reproducibility remains unclear. Such knowledge will aid in the design of multi-centerstudies, as the relevant level of reader training can be chosen beforehand.
The overall goal of this study was to assess and explore the value of two computer-assistedmethods for estimating the volumes of the contrast enhancing tissue and the hyperintensityseen on FLAIR images (i.e., the perifocal edema) in patients with recurrent malignant gliomain a multi-center multi-reader study.
Materials and methodsImaging, case selection and stratification
All institutions submitting images underwent study-specific IRB approval. A copy of the IRBapproval for each institution was filed at ACRIN headquarters. Moreover, the study protocolwas approved by the Cancer Therapy Evaluation Program (CTEP) of the National CancerInstitute (NCI).
The following inclusion criteria had to be met in order to be eligible for the study:
– A histologically proven diagnosis of WHO grade III or IV glioma, includingglioblastoma multiforme, anaplastic astrocytoma, anaplastic oligodendroglioma.
– Two subsequent post-operative scans demonstrating tumor recurrence; thesehad to be acquired at the first and at the second follow up 3 months and 6months post surgery, respectively.
– All cases had to be post-operative cases, in which tumor tissue had beenremoved with a macroscopically complete R0 resection.
– All cases had to demonstrate a tumor recurrence that was substantiated eitherby clinical follow-up, histological evidence, or FDG-PET.
Images were obtained on 1.5-T MR imaging systems. All studies included T1-weightedsequences before and after the intravenous administration of a gadolinium (Gd)-based contrastmedium (TR ≈ 500 ms, TE = minimum full, slice thickness 3.0 mm, matrix 256×192 mm, fieldof view 200×200 mm; standard dosage of a Gd-based contrast medium applied as a bolusinjection, i.e., 0.1 mmol (= 0.2 ml) Gd-DTPA per kg body weight, applied as a bolus injection),a FLAIR sequence (TR ≈ 10,000 ms, TE ≈ 150 ms, TI ≈ 2,200 ms, slice thickness 3.0 mm,matrix 256×192 mm, field of view 200×200 mm), and a T2-weighted sequence (TR ≈ 3,500ms, TE ≈ 90 ms, slice thickness 3.0 mm, matrix 256×192 mm, field of view 200×200 mm), allobtained in an axial plane. No interslice gaps and no interleaved acquisitions were used.
Eligible cases were identified through the databases of the submitting sites and consecutivecases were selected from among those with complete inclusion criteria. An excess of 87 caseswas submitted. Cases were evaluated by a panel of three board-certified neuroradiologists(advisory panel) regarding difficulty of assessment (i.e., presence or absence of necrosis andcomplexity of shape) and amount of change of tumor volume. The cases were graded on a scale
Ertl-Wagner et al. Page 3
Eur Radiol. Author manuscript; available in PMC 2010 March 1.
NIH
-PA Author Manuscript
NIH
-PA Author Manuscript
NIH
-PA Author Manuscript
from 1 to 10 regarding the above-mentioned criteria. Eight cases were randomly selected withineach of three strata formed by the Biostatistics Center (BC): the first with minimal change intumor volume and considered simple, the second was designated moderate, and the third wasdesignated difficult with a large change in tumor volume and complex shape.
Reader selection and reading set-upA total of 16 readers were recruited for the study; eight were radiology technologists, fourneuroradiology fellows, and four staff neuroradiologists. All reading was conducted at theAmerican College of Radiology Imaging Network (ACRIN) headquarters in Philadelphia, Pa.Two ACRIN representatives were trained on both Eigentool and 3DVIEWNIX-TV for thepurposes of training the study readers in both techniques.
Each reader was offered five training cases prior to entering the evaluation stage of the study.With these five training cases, readers were instructed to practice the applications and toperform volume measurements both for the Gd-enhancing tumor volume and for the FLAIRhyperintensity under the surveillance of the two ACRIN representatives. Practice with thetraining cases was performed for all three modalities, i.e., for Eigentool, 3DVIEWNIX-TV andfor manual measurements, by all readers. The readers entered the evaluation stage of the studyonly after they felt comfortable with the usage of all three modalities. The evaluation stage ofthe study consisted of 20 cases with two time-points evaluated with each system, resulting ina total of 120 dataset evaluations totaling a full week of readings per reader.
Image processing and volume determinationThe volume of the enhancing tissue and the hyperintensity seen on FLAIR images wasdetermined at each time-point for all cases with all modalities. To reduce heterogeneity andsave time, all image sets from a single acquisition time-point were pre-registered by using3DVIEWNIX-TV or Eigentool. For volumetric assessment with Eigentool, registration of allimages (pre- and post-T1, T2, FLAIR) was required. For volumetric assessment with3DVIEWNIX-TV, registration of only the pre- and post-contrast T1 images was necessary.Since 3DVIEWNIX-TV uses FLAIR images on their own, no registration is required for theseimages. The 3DVIEWNIX-TV software does not use T2 images in the analysis. Imageprocessing for 3DVIEWNIX-TV (www.mipg.upenn.edu) was performed on a 600 MHzPentium PC using the Linux operating system. For Eigentool, image processing was performedby using a SUN SPARC Workstation with the Solaris operating system (seewww.radiologyresearch.org, a Windows XP version is also available). The complete steps usedto segment tissue can be found on the respective software websites.
In addition to the volume determination with both software systems, the Gd enhancement andthe FLAIR hyperintensity were measured manually. Since the volume of the lesion is beingdetermined in this study, and the RECIST criteria only measure the longest diameter of thelesion, each reader identified the cross sectional image with the largest linear tumor dimensionson the FLAIR and on the contrast-enhanced T1-weighted images. The longest lesion diameterfor each lesion component was measured in the two orthogonal directions. The number ofsections and section spacing on which each lesion component was identified was also notedand from these values the volume of the Gd enhancement and FLAIR hyperintensity wasdetermined based on an ellipsoid shape.
The time measured to perform the volume estimations included the uploading of the imagesfor each modality.
Ertl-Wagner et al. Page 4
Eur Radiol. Author manuscript; available in PMC 2010 March 1.
NIH
-PA Author Manuscript
NIH
-PA Author Manuscript
NIH
-PA Author Manuscript
Statistical considerationsThe objective of the study was to assess the two systems for estimating volumes of brain tumorson MR images in patients with new, postoperative, and recurrent malignant gliomas. Theprimary endpoint of the study was the volume change of the Gd enhancement and FLAIRhyperintensity in milliliters (ml) for each case. The interclass correlation coefficient (ICC) wasestimated for each lesion component volume and the change in these volumes over time. TheICC is defined as the ratio of variance components; specifically, the variance components dueto cases divided by the sum of the variance components due to readers, cases, and error. TheICC was estimated under a standard regression model with normal errors containing a randomeffects term for readers and cases. Technically, this is a classic three-factor (cases, raters, andsystems) linear model without replication at three-way interaction level, but the model is easilyexpanded into a five-factor model (experience and tumor size change added) to exploresecondary aims. An analogous ICC with the variance component for readers in the numeratoris also of interest and was computed.
Because ICCs are percentages of total variance, it is important to examine and assess theindividual variance components themselves. Small components of variance due to readersindicate that the system is reliable over different readers. In addition, we estimated the lengthof a 95% prediction interval for the differences in volume measurements, which describes thevariation of a prediction over the entire population of cases. For example, a prediction intervallength of 20 ml, would indicate that the unknown volume measurements can appear as ± 10ml off the true volume. This should not be confused with reliability measurements, whichdescribe the repeatability of a specific case measurement by different readers.
The raters evaluated 20 case series, consisting of two time-points, under each system and usingthe manual method. The order in which images were read was randomized, separately for eachsystem and reader, to avoid recall bias and reduce any learning effect. Note that an ICC of atleast 0.60 is considered substantial reliability, an ICC of at least 0.75 or more is consideredexcellent reliability, and an ICC above 0.85 is considered almost perfect reliability. Samplesize projections were based on achieving sufficiently high lower confidence bound on theestimate of the ICC [16]. Note that the study was sufficiently large to estimate the reliabilityin the change of tumor volumes, absolute measures of tumor volume, as well as estimation ofreader specific reliability. Data were analyzed at the Center for Statistical Sciences at BrownUniversity, which serves as the Biostatistics Center for all ACRIN trials. Data wereprospectively monitored and cleaned in a collaborative effort with ACRIN data management.SAS v9.13 and Stata v7.0 were used to process data and facilitate statistical analyses.
ResultsThe average time to train on a software package until the operator felt comfortable with itsusage was 138.6 ± 49.6 min for Eigentool and 126.7±46.5 min for 3DVIEWNIX-TV. Themean time to complete a case, i.e., to estimate the volume of enhancing tumor and of tumorplus edema for a single time-point, was 14.85±0.72 min for Eigentool for MR technologistsand 14.67±1.42 min for staff neuroradiologists and neuroradiology fellows (i.e., Staff/Fellows). For 3DVIEWNIX-TV, the mean time to complete a case was 18.88±1.78 min forMR technologists and 14.68±0.71 min for Staff/ Fellows. Operating times to estimate tumorvolumes for a case overall were not significantly different between the two software systems(p>0.05). The mean time to complete a case using the manual method was 8.94 ± 1.48 min,with no significant differences between MR technologists (8.87±1.11 min) and Staff/Fellows(9.01±2.74 min).
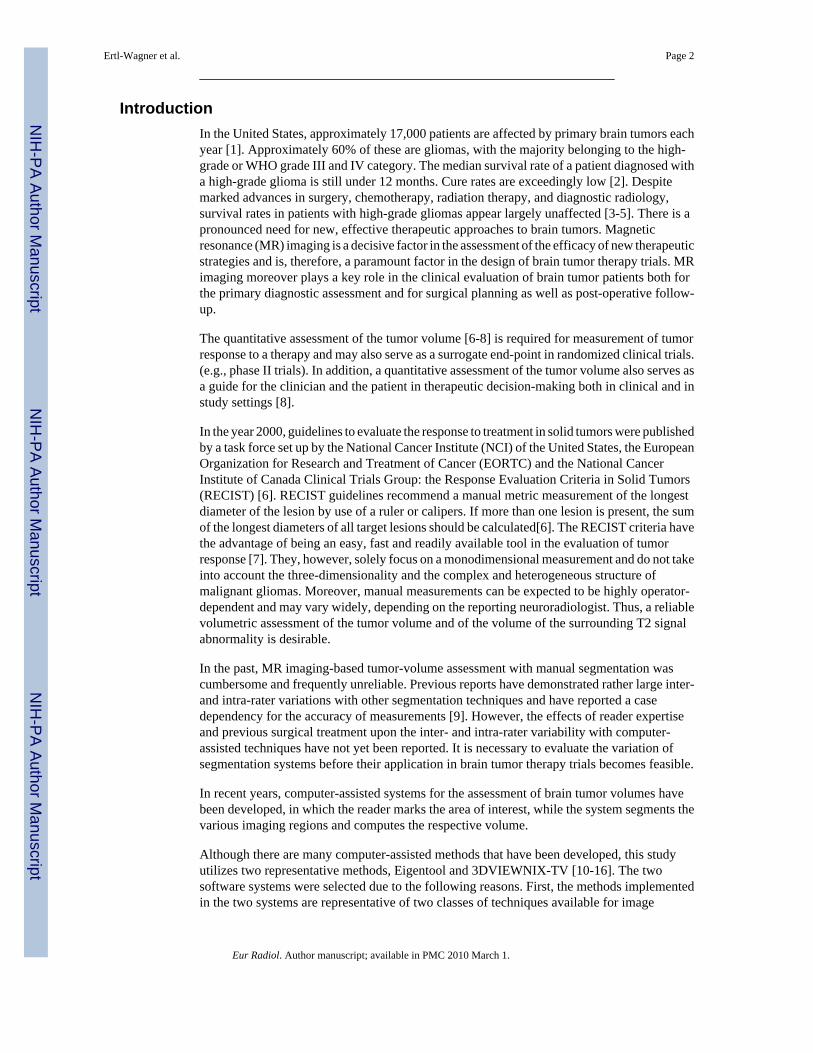
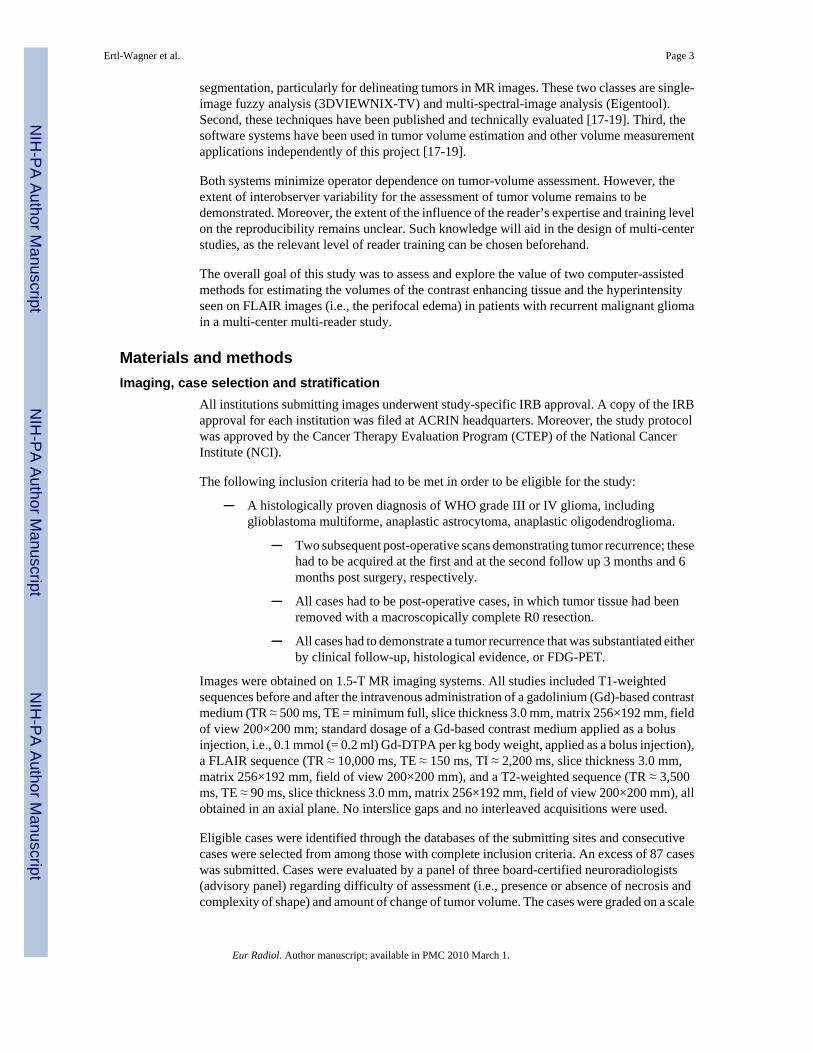
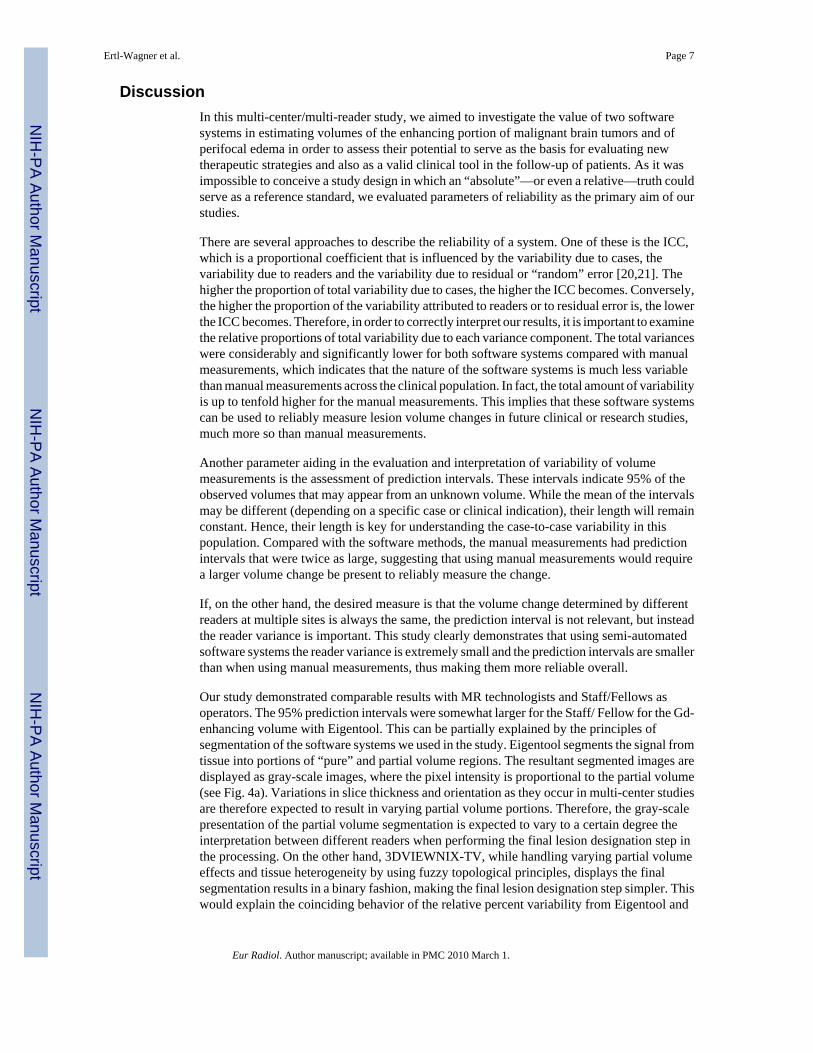
The actual volume change determined for the Gd enhancement and FLAIR hyperintensity forall cases and each reader is presented as box plots in Figs. 1 and 2. Overall there were no
Ertl-Wagner et al. Page 5
Eur Radiol. Author manuscript; available in PMC 2010 March 1.
NIH
-PA Author Manuscript
NIH
-PA Author Manuscript
NIH
-PA Author Manuscript
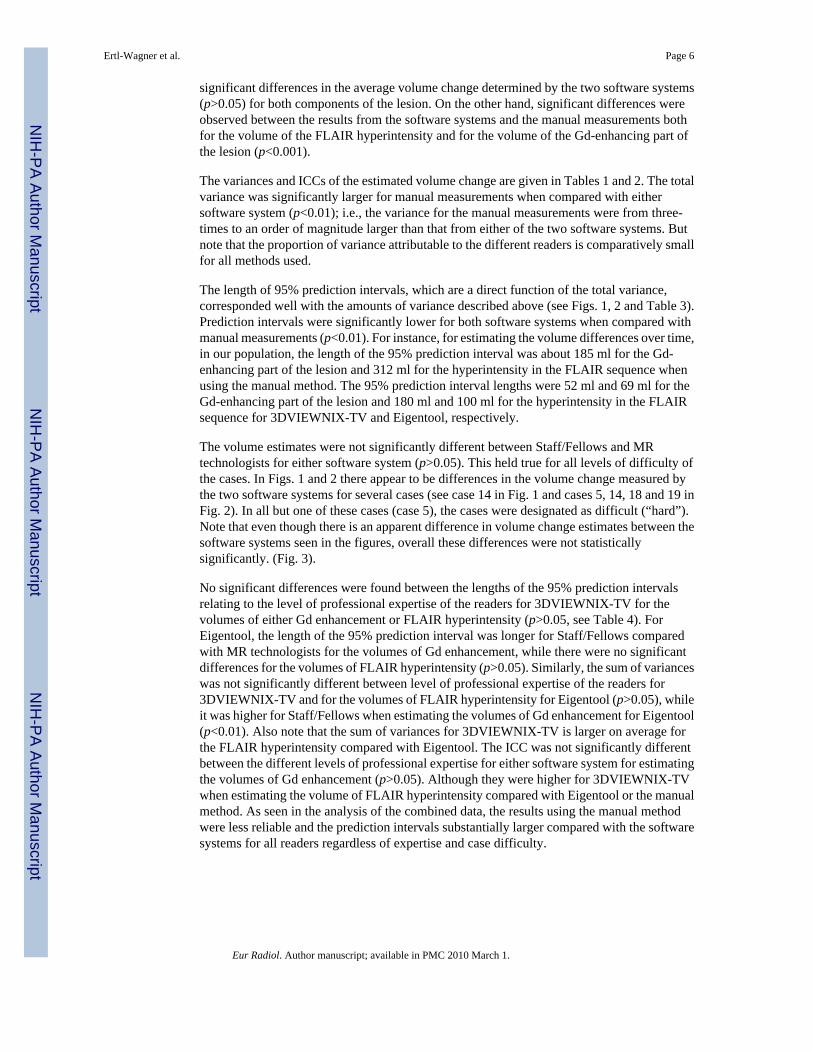
significant differences in the average volume change determined by the two software systems(p>0.05) for both components of the lesion. On the other hand, significant differences wereobserved between the results from the software systems and the manual measurements bothfor the volume of the FLAIR hyperintensity and for the volume of the Gd-enhancing part ofthe lesion (p<0.001).
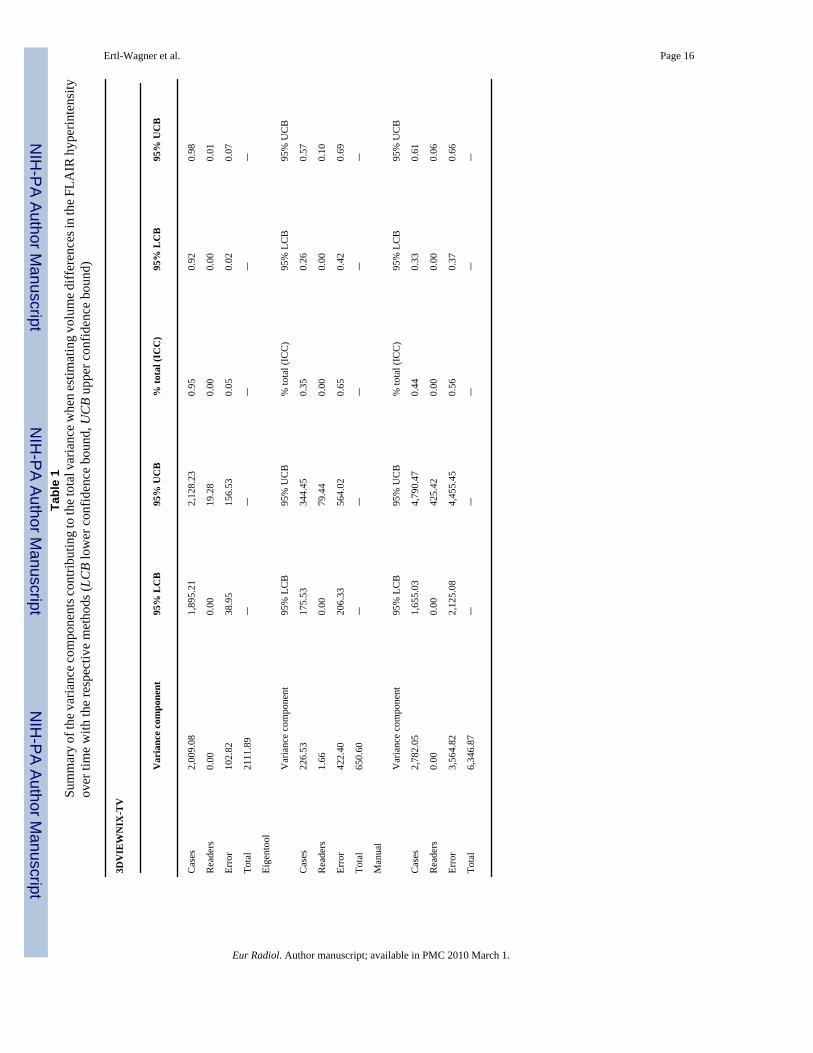
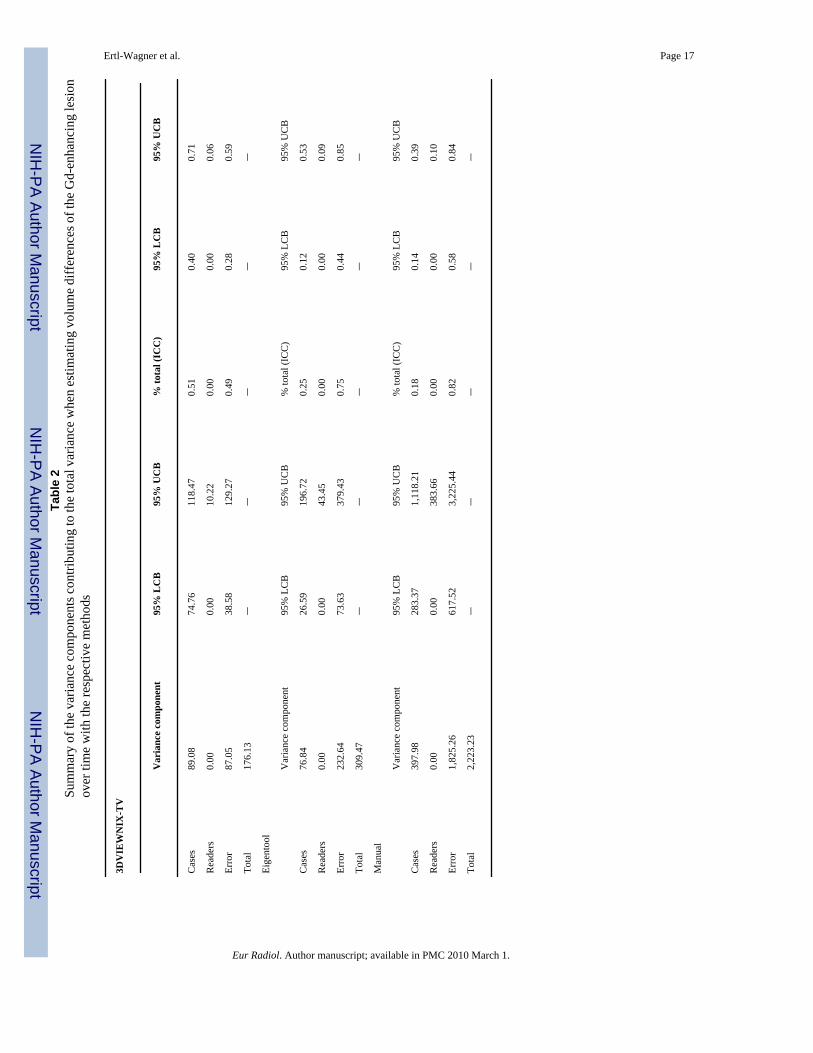
The variances and ICCs of the estimated volume change are given in Tables 1 and 2. The totalvariance was significantly larger for manual measurements when compared with eithersoftware system (p<0.01); i.e., the variance for the manual measurements were from three-times to an order of magnitude larger than that from either of the two software systems. Butnote that the proportion of variance attributable to the different readers is comparatively smallfor all methods used.
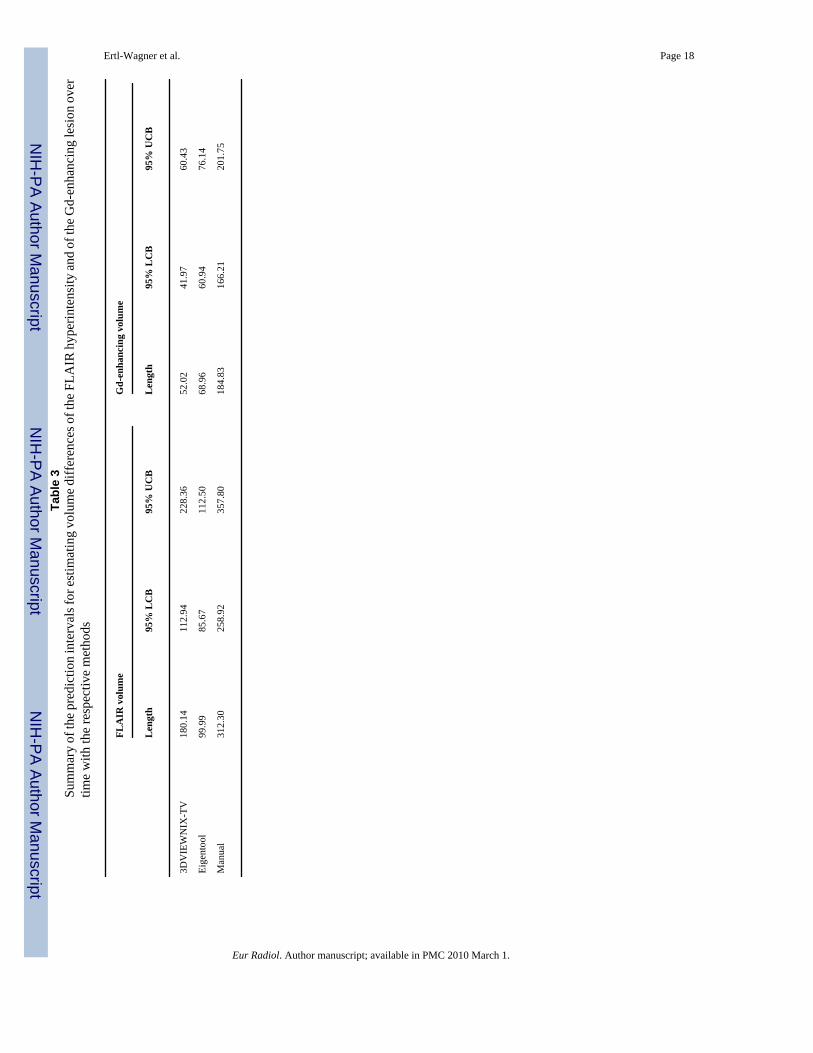
The length of 95% prediction intervals, which are a direct function of the total variance,corresponded well with the amounts of variance described above (see Figs. 1, 2 and Table 3).Prediction intervals were significantly lower for both software systems when compared withmanual measurements (p<0.01). For instance, for estimating the volume differences over time,in our population, the length of the 95% prediction interval was about 185 ml for the Gd-enhancing part of the lesion and 312 ml for the hyperintensity in the FLAIR sequence whenusing the manual method. The 95% prediction interval lengths were 52 ml and 69 ml for theGd-enhancing part of the lesion and 180 ml and 100 ml for the hyperintensity in the FLAIRsequence for 3DVIEWNIX-TV and Eigentool, respectively.
The volume estimates were not significantly different between Staff/Fellows and MRtechnologists for either software system (p>0.05). This held true for all levels of difficulty ofthe cases. In Figs. 1 and 2 there appear to be differences in the volume change measured bythe two software systems for several cases (see case 14 in Fig. 1 and cases 5, 14, 18 and 19 inFig. 2). In all but one of these cases (case 5), the cases were designated as difficult (“hard”).Note that even though there is an apparent difference in volume change estimates between thesoftware systems seen in the figures, overall these differences were not statisticallysignificantly. (Fig. 3).
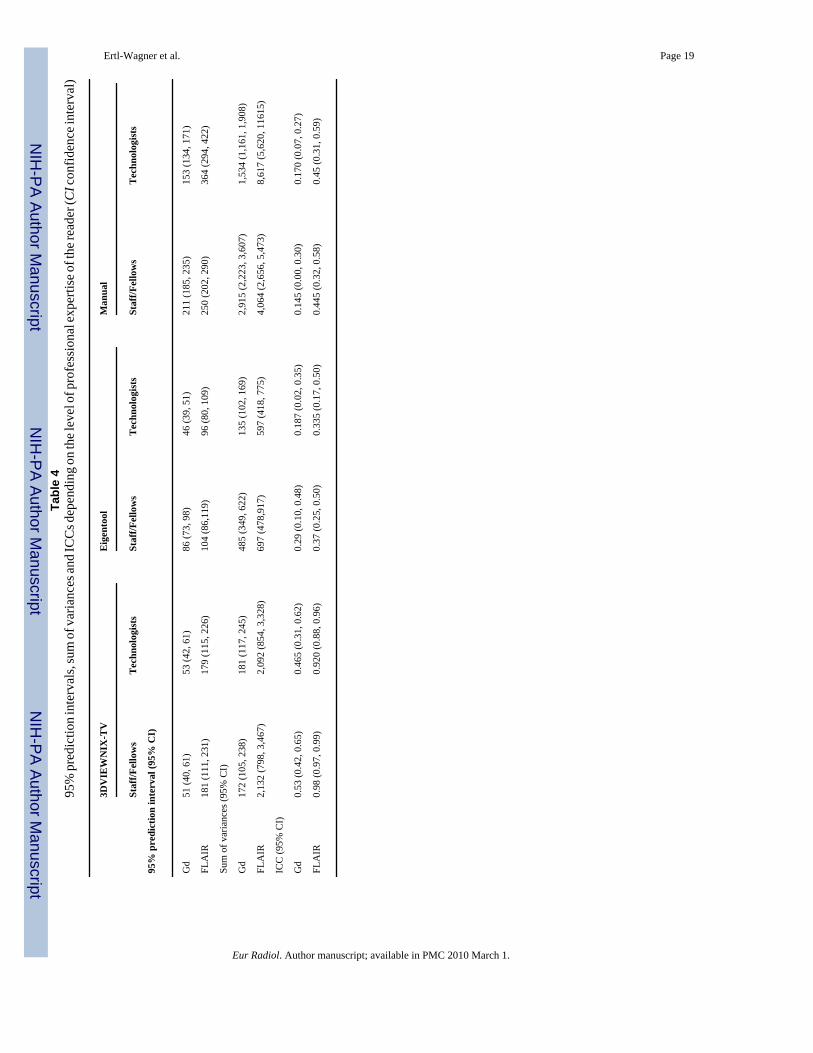
No significant differences were found between the lengths of the 95% prediction intervalsrelating to the level of professional expertise of the readers for 3DVIEWNIX-TV for thevolumes of either Gd enhancement or FLAIR hyperintensity (p>0.05, see Table 4). ForEigentool, the length of the 95% prediction interval was longer for Staff/Fellows comparedwith MR technologists for the volumes of Gd enhancement, while there were no significantdifferences for the volumes of FLAIR hyperintensity (p>0.05). Similarly, the sum of varianceswas not significantly different between level of professional expertise of the readers for3DVIEWNIX-TV and for the volumes of FLAIR hyperintensity for Eigentool (p>0.05), whileit was higher for Staff/Fellows when estimating the volumes of Gd enhancement for Eigentool(p<0.01). Also note that the sum of variances for 3DVIEWNIX-TV is larger on average forthe FLAIR hyperintensity compared with Eigentool. The ICC was not significantly differentbetween the different levels of professional expertise for either software system for estimatingthe volumes of Gd enhancement (p>0.05). Although they were higher for 3DVIEWNIX-TVwhen estimating the volume of FLAIR hyperintensity compared with Eigentool or the manualmethod. As seen in the analysis of the combined data, the results using the manual methodwere less reliable and the prediction intervals substantially larger compared with the softwaresystems for all readers regardless of expertise and case difficulty.
Ertl-Wagner et al. Page 6
Eur Radiol. Author manuscript; available in PMC 2010 March 1.
NIH
-PA Author Manuscript
NIH
-PA Author Manuscript
NIH
-PA Author Manuscript
DiscussionIn this multi-center/multi-reader study, we aimed to investigate the value of two softwaresystems in estimating volumes of the enhancing portion of malignant brain tumors and ofperifocal edema in order to assess their potential to serve as the basis for evaluating newtherapeutic strategies and also as a valid clinical tool in the follow-up of patients. As it wasimpossible to conceive a study design in which an “absolute”—or even a relative—truth couldserve as a reference standard, we evaluated parameters of reliability as the primary aim of ourstudies.
There are several approaches to describe the reliability of a system. One of these is the ICC,which is a proportional coefficient that is influenced by the variability due to cases, thevariability due to readers and the variability due to residual or “random” error [20,21]. Thehigher the proportion of total variability due to cases, the higher the ICC becomes. Conversely,the higher the proportion of the variability attributed to readers or to residual error is, the lowerthe ICC becomes. Therefore, in order to correctly interpret our results, it is important to examinethe relative proportions of total variability due to each variance component. The total varianceswere considerably and significantly lower for both software systems compared with manualmeasurements, which indicates that the nature of the software systems is much less variablethan manual measurements across the clinical population. In fact, the total amount of variabilityis up to tenfold higher for the manual measurements. This implies that these software systemscan be used to reliably measure lesion volume changes in future clinical or research studies,much more so than manual measurements.
Another parameter aiding in the evaluation and interpretation of variability of volumemeasurements is the assessment of prediction intervals. These intervals indicate 95% of theobserved volumes that may appear from an unknown volume. While the mean of the intervalsmay be different (depending on a specific case or clinical indication), their length will remainconstant. Hence, their length is key for understanding the case-to-case variability in thispopulation. Compared with the software methods, the manual measurements had predictionintervals that were twice as large, suggesting that using manual measurements would requirea larger volume change be present to reliably measure the change.
If, on the other hand, the desired measure is that the volume change determined by differentreaders at multiple sites is always the same, the prediction interval is not relevant, but insteadthe reader variance is important. This study clearly demonstrates that using semi-automatedsoftware systems the reader variance is extremely small and the prediction intervals are smallerthan when using manual measurements, thus making them more reliable overall.
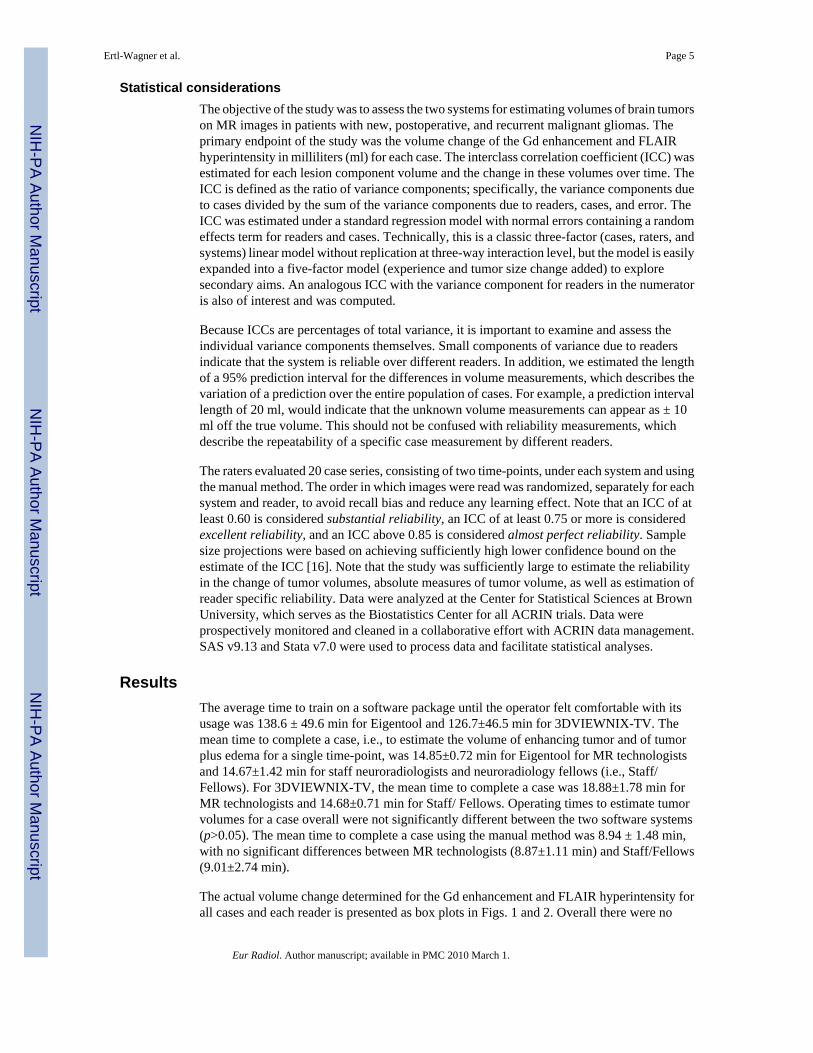
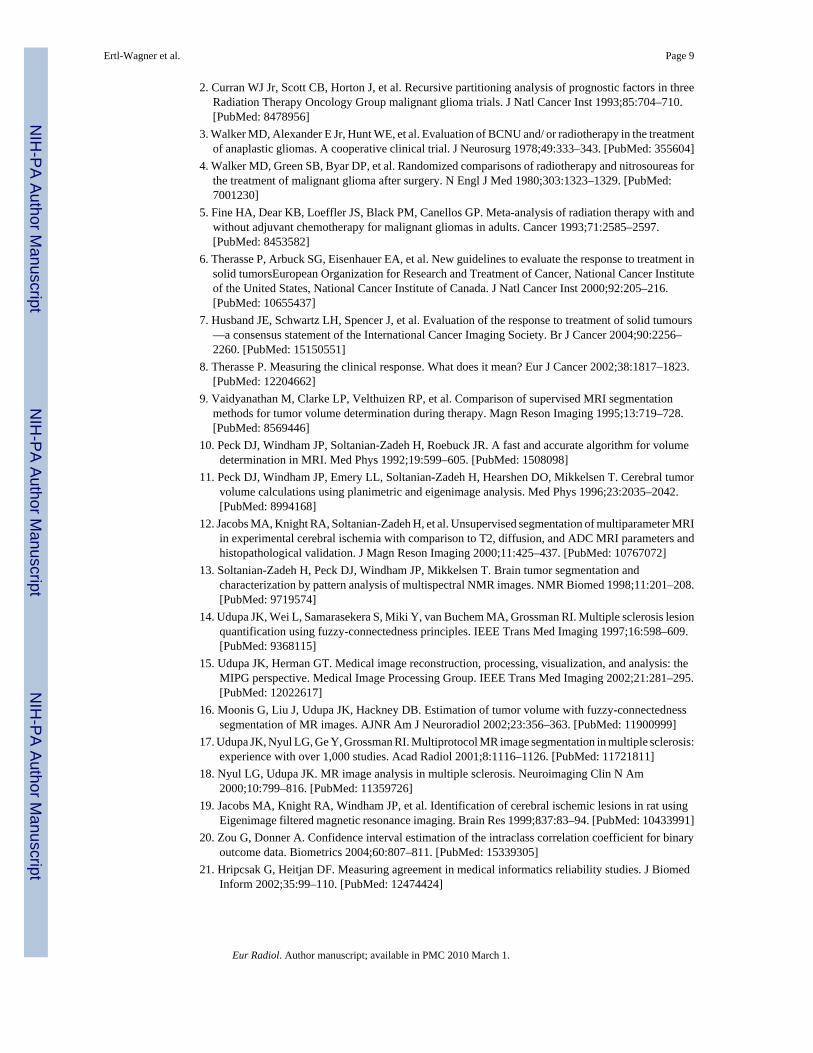
Our study demonstrated comparable results with MR technologists and Staff/Fellows asoperators. The 95% prediction intervals were somewhat larger for the Staff/ Fellow for the Gd-enhancing volume with Eigentool. This can be partially explained by the principles ofsegmentation of the software systems we used in the study. Eigentool segments the signal fromtissue into portions of “pure” and partial volume regions. The resultant segmented images aredisplayed as gray-scale images, where the pixel intensity is proportional to the partial volume(see Fig. 4a). Variations in slice thickness and orientation as they occur in multi-center studiesare therefore expected to result in varying partial volume portions. Therefore, the gray-scalepresentation of the partial volume segmentation is expected to vary to a certain degree theinterpretation between different readers when performing the final lesion designation step inthe processing. On the other hand, 3DVIEWNIX-TV, while handling varying partial volumeeffects and tissue heterogeneity by using fuzzy topological principles, displays the finalsegmentation results in a binary fashion, making the final lesion designation step simpler. Thiswould explain the coinciding behavior of the relative percent variability from Eigentool and
Ertl-Wagner et al. Page 7
Eur Radiol. Author manuscript; available in PMC 2010 March 1.
NIH
-PA Author Manuscript
NIH
-PA Author Manuscript
NIH
-PA Author Manuscript
the manual measurements, since they both use gray-scale images in defining the regionscompared with 3DVIEWNIX-TV, which utilizes a binary image for the final review.
There are limitations of our study that need to be taken into account when interpreting the data.The major limitation of any study assessing the value of volumetric estimations of brain tumorsis the lack of a reference standard. It is impossible to obtain an “absolute truth” of human braintumor volumes in an in-vivo situation. Even if surgery is performed directly after MR imaging,it is not feasible to resect the tumor in a fashion that would allow a sensible volumetricassessment. Moreover, the surrounding hyperintensity in the FLAIR or T2-weighted imagesusually cannot be completely resected. Histopathological studies have, however, demonstratedthis zone of abnormal signal intensity to contain viable tumor cells and to therefore also playa critical role in the prognosis of the patient [22-23]. The volumetric assessment of a malignantbrain tumor should, therefore, not only include the zone of enhancement after the intravenousinjection of a Gd-based contrast medium, but also the volume of the FLAIR hyperintensity.Moreover, even the correlation with an autopsy cannot be expected to provide reliable resultsdue to the very rapid growth dynamic of malignant gliomas [24-25]. As it was impossible todesign a study, in which an “absolute”—or even a surrogate—truth could serve as a referencestandard, we decided to evaluate parameters of reliability as the primary aim of our studies.
In addition, the sample size of our population was relatively small. This was, however,counterbalanced by a large number of readers and data stratification from a larger sample.Inclusion of a larger sample into the reading phase of the study would have been prohibitivedue to the extensive reading times. Sample size projections had been performed and the studywas sufficiently large to estimate the reliability in the change of tumor volumes, absolutemeasures of tumor volume, as well as estimation of reader specific reliability.
In summary, we were able to demonstrate in our multi-center multi-reader study that thereliability parameters of both software-based tumor-volume estimations were far superior tomanual measurements. We, therefore, conclude that semi-automated software systems similarto those used in this study are reliable tools to serve as outcome parameters in clinical studiesand as a basis for therapeutic decision-making in patients with malignant glioma, whereasmanual measurements are less reliable and should not be the sole basis for clinical or researchoutcome studies. In addition, since MR technologists and Staff/ Fellow neuroradiologistsdemonstrated comparable results, the way is paved for a more economical and time-efficientstudy design, especially in large multi-center trials. While the need for neuroradiologists tosupervise image analysis will certainly not be obviated, the time-consuming volume analysiscan be reliably performed by trained MR technologists, thus reducing costs and timeconstraints.
AcknowledgementsThis work was supported by the American College of Radiology Imaging Network (grant number CA80098–05). Wewould like to acknowledge Sharlene Snowdon for excellent technical assistance. In addition we would like to sincerelyacknowledge all our readers and the members of the consensus panel, namely Suresh Patel, M.D., Jeffrey Kochan,M.D., Yair Safriel, M.D., Gagamdeep Mangat, M.D., Jeff Bennett, M.D., Eric Lopez Del Valle, M.D., John Corrigan,M.D., Varun Nitroo, M.D., Chad Holder, M.D., Phil Kousourbris, M.D., Scott G. Hudson, R.T., Lisa M. Desiderio,R.T., Terence Slyman, R.T., Mary Ellen Bentham, R.T., Tony Festa, R.T., Glenn Ferrick, R.T., Maureen Perachio,R.T., Tom Hodge, R.T.
References1. Landis SH, Murray T, Bolden S, Wingo PA. Cancer statistics. CA Cancer J Clin 1999;49:8–31.
[PubMed: 10200775]
Ertl-Wagner et al. Page 8
Eur Radiol. Author manuscript; available in PMC 2010 March 1.
NIH
-PA Author Manuscript
NIH
-PA Author Manuscript
NIH
-PA Author Manuscript
2. Curran WJ Jr, Scott CB, Horton J, et al. Recursive partitioning analysis of prognostic factors in threeRadiation Therapy Oncology Group malignant glioma trials. J Natl Cancer Inst 1993;85:704–710.[PubMed: 8478956]
3. Walker MD, Alexander E Jr, Hunt WE, et al. Evaluation of BCNU and/ or radiotherapy in the treatmentof anaplastic gliomas. A cooperative clinical trial. J Neurosurg 1978;49:333–343. [PubMed: 355604]
4. Walker MD, Green SB, Byar DP, et al. Randomized comparisons of radiotherapy and nitrosoureas forthe treatment of malignant glioma after surgery. N Engl J Med 1980;303:1323–1329. [PubMed:7001230]
5. Fine HA, Dear KB, Loeffler JS, Black PM, Canellos GP. Meta-analysis of radiation therapy with andwithout adjuvant chemotherapy for malignant gliomas in adults. Cancer 1993;71:2585–2597.[PubMed: 8453582]
6. Therasse P, Arbuck SG, Eisenhauer EA, et al. New guidelines to evaluate the response to treatment insolid tumorsEuropean Organization for Research and Treatment of Cancer, National Cancer Instituteof the United States, National Cancer Institute of Canada. J Natl Cancer Inst 2000;92:205–216.[PubMed: 10655437]
7. Husband JE, Schwartz LH, Spencer J, et al. Evaluation of the response to treatment of solid tumours—a consensus statement of the International Cancer Imaging Society. Br J Cancer 2004;90:2256–2260. [PubMed: 15150551]
8. Therasse P. Measuring the clinical response. What does it mean? Eur J Cancer 2002;38:1817–1823.[PubMed: 12204662]
9. Vaidyanathan M, Clarke LP, Velthuizen RP, et al. Comparison of supervised MRI segmentationmethods for tumor volume determination during therapy. Magn Reson Imaging 1995;13:719–728.[PubMed: 8569446]
10. Peck DJ, Windham JP, Soltanian-Zadeh H, Roebuck JR. A fast and accurate algorithm for volumedetermination in MRI. Med Phys 1992;19:599–605. [PubMed: 1508098]
11. Peck DJ, Windham JP, Emery LL, Soltanian-Zadeh H, Hearshen DO, Mikkelsen T. Cerebral tumorvolume calculations using planimetric and eigenimage analysis. Med Phys 1996;23:2035–2042.[PubMed: 8994168]
12. Jacobs MA, Knight RA, Soltanian-Zadeh H, et al. Unsupervised segmentation of multiparameter MRIin experimental cerebral ischemia with comparison to T2, diffusion, and ADC MRI parameters andhistopathological validation. J Magn Reson Imaging 2000;11:425–437. [PubMed: 10767072]
13. Soltanian-Zadeh H, Peck DJ, Windham JP, Mikkelsen T. Brain tumor segmentation andcharacterization by pattern analysis of multispectral NMR images. NMR Biomed 1998;11:201–208.[PubMed: 9719574]
14. Udupa JK, Wei L, Samarasekera S, Miki Y, van Buchem MA, Grossman RI. Multiple sclerosis lesionquantification using fuzzy-connectedness principles. IEEE Trans Med Imaging 1997;16:598–609.[PubMed: 9368115]
15. Udupa JK, Herman GT. Medical image reconstruction, processing, visualization, and analysis: theMIPG perspective. Medical Image Processing Group. IEEE Trans Med Imaging 2002;21:281–295.[PubMed: 12022617]
16. Moonis G, Liu J, Udupa JK, Hackney DB. Estimation of tumor volume with fuzzy-connectednesssegmentation of MR images. AJNR Am J Neuroradiol 2002;23:356–363. [PubMed: 11900999]
17. Udupa JK, Nyul LG, Ge Y, Grossman RI. Multiprotocol MR image segmentation in multiple sclerosis:experience with over 1,000 studies. Acad Radiol 2001;8:1116–1126. [PubMed: 11721811]
18. Nyul LG, Udupa JK. MR image analysis in multiple sclerosis. Neuroimaging Clin N Am2000;10:799–816. [PubMed: 11359726]
19. Jacobs MA, Knight RA, Windham JP, et al. Identification of cerebral ischemic lesions in rat usingEigenimage filtered magnetic resonance imaging. Brain Res 1999;837:83–94. [PubMed: 10433991]
20. Zou G, Donner A. Confidence interval estimation of the intraclass correlation coefficient for binaryoutcome data. Biometrics 2004;60:807–811. [PubMed: 15339305]
21. Hripcsak G, Heitjan DF. Measuring agreement in medical informatics reliability studies. J BiomedInform 2002;35:99–110. [PubMed: 12474424]
Ertl-Wagner et al. Page 9
Eur Radiol. Author manuscript; available in PMC 2010 March 1.
NIH
-PA Author Manuscript
NIH
-PA Author Manuscript
NIH
-PA Author Manuscript
22. Tovi M, Hartman M, Lilja A, Ericsson A. MR imaging in cerebral gliomas. Tissue component analysisin correlation with histopathology of whole-brain specimens. Acta Radiol 1994;35:495–505.[PubMed: 8086262]
23. Dean BL, Drayer BP, Bird CR, et al. Gliomas: classification with MR imaging. Radiology1990;174:411–415. [PubMed: 2153310]
24. Lacroix M, Abi-Said D, Fourney DR, et al. A multivariate analysis of 416 patients with glioblastomamultiforme: prognosis, extent of resection, and survival. J Neurosurg 2001;95:190–198. [PubMed:11780887]
25. Hobbs SK, Shi G, Homer R, Harsh G, Atlas SW, Bednarski MD. Magnetic resonance image-guidedproteomics of human glioblastoma multiforme. J Magn Reson Imaging 2003;18:530–536. [PubMed:14579395]
Ertl-Wagner et al. Page 10
Eur Radiol. Author manuscript; available in PMC 2010 March 1.
NIH
-PA Author Manuscript
NIH
-PA Author Manuscript
NIH
-PA Author Manuscript
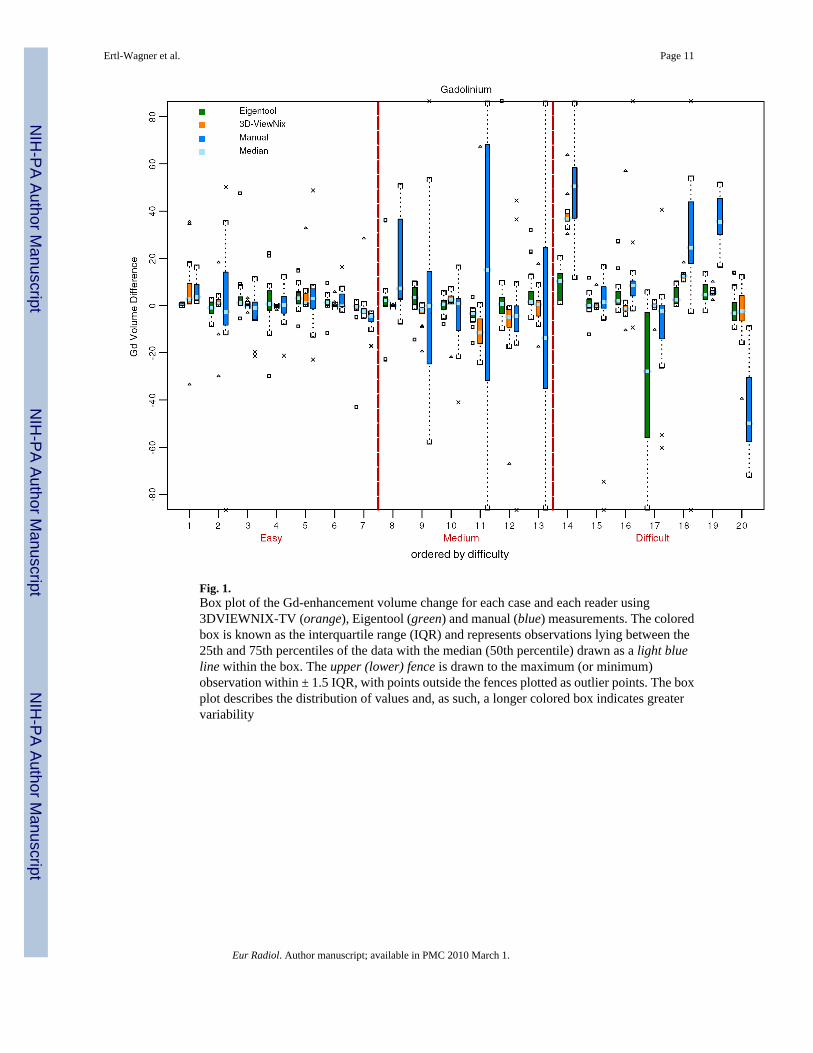
Fig. 1.Box plot of the Gd-enhancement volume change for each case and each reader using3DVIEWNIX-TV (orange), Eigentool (green) and manual (blue) measurements. The coloredbox is known as the interquartile range (IQR) and represents observations lying between the25th and 75th percentiles of the data with the median (50th percentile) drawn as a light blueline within the box. The upper (lower) fence is drawn to the maximum (or minimum)observation within ± 1.5 IQR, with points outside the fences plotted as outlier points. The boxplot describes the distribution of values and, as such, a longer colored box indicates greatervariability
Ertl-Wagner et al. Page 11
Eur Radiol. Author manuscript; available in PMC 2010 March 1.
NIH
-PA Author Manuscript
NIH
-PA Author Manuscript
NIH
-PA Author Manuscript
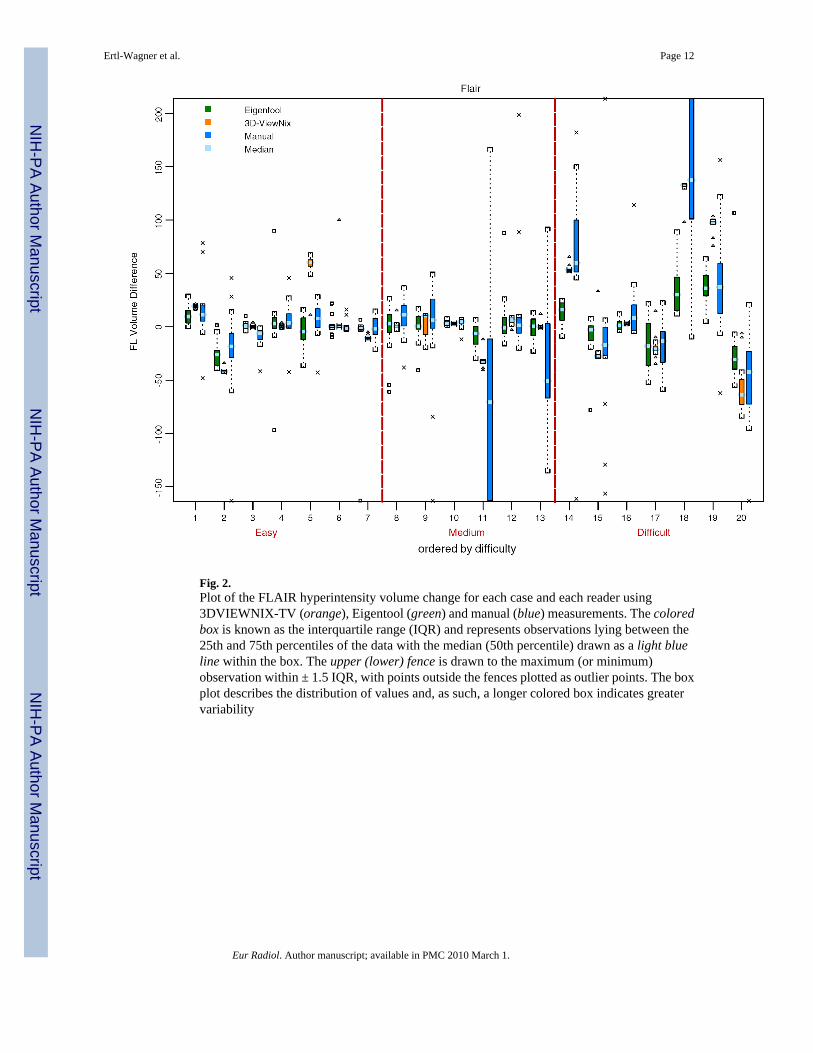
Fig. 2.Plot of the FLAIR hyperintensity volume change for each case and each reader using3DVIEWNIX-TV (orange), Eigentool (green) and manual (blue) measurements. The coloredbox is known as the interquartile range (IQR) and represents observations lying between the25th and 75th percentiles of the data with the median (50th percentile) drawn as a light blueline within the box. The upper (lower) fence is drawn to the maximum (or minimum)observation within ± 1.5 IQR, with points outside the fences plotted as outlier points. The boxplot describes the distribution of values and, as such, a longer colored box indicates greatervariability
Ertl-Wagner et al. Page 12
Eur Radiol. Author manuscript; available in PMC 2010 March 1.
NIH
-PA Author Manuscript
NIH
-PA Author Manuscript
NIH
-PA Author Manuscript
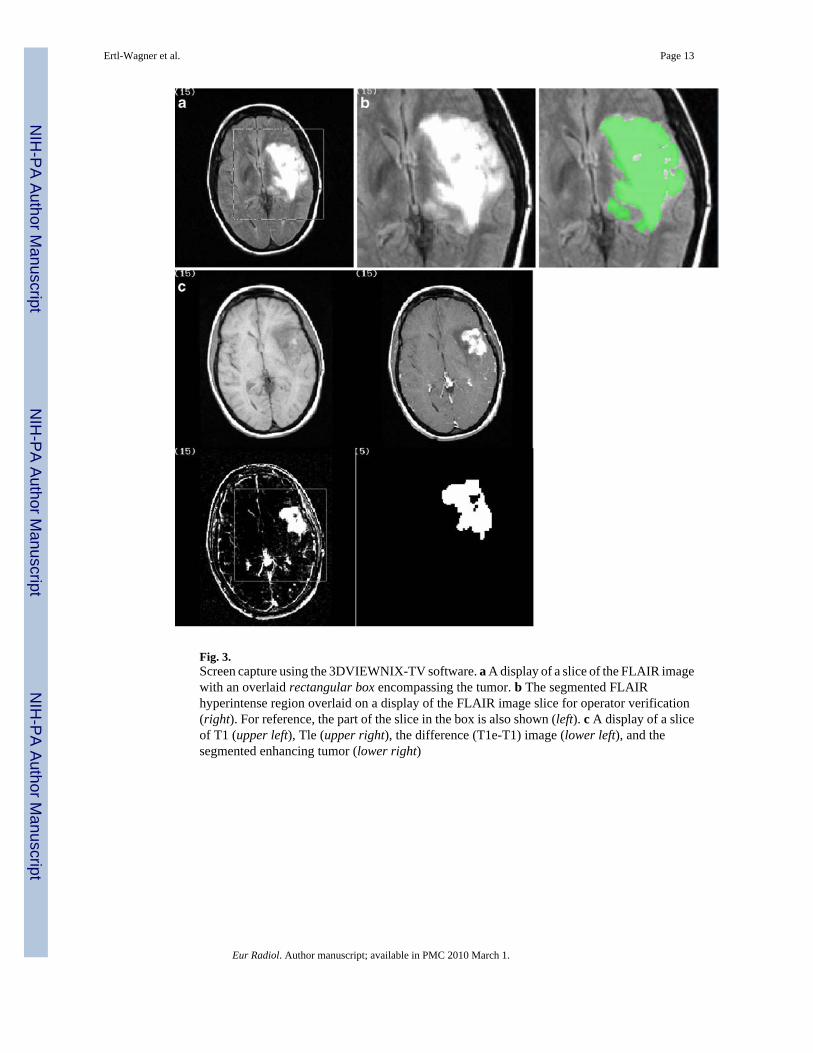
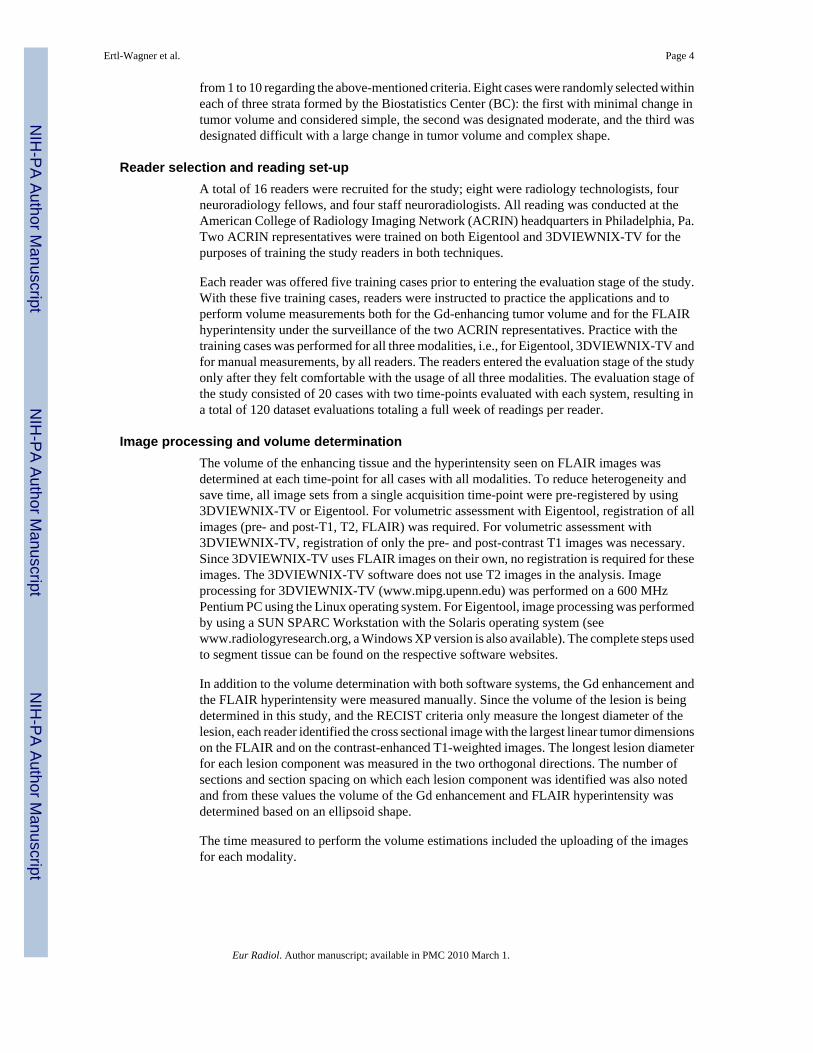
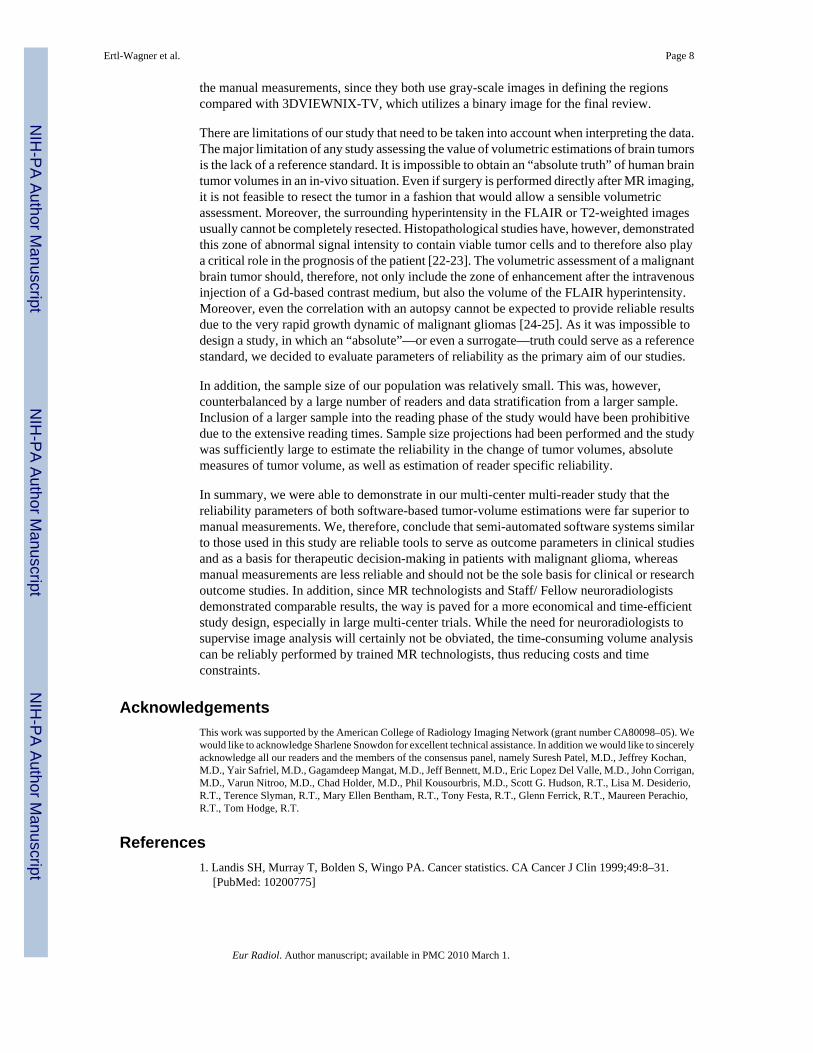
Fig. 3.Screen capture using the 3DVIEWNIX-TV software. a A display of a slice of the FLAIR imagewith an overlaid rectangular box encompassing the tumor. b The segmented FLAIRhyperintense region overlaid on a display of the FLAIR image slice for operator verification(right). For reference, the part of the slice in the box is also shown (left). c A display of a sliceof T1 (upper left), Tle (upper right), the difference (T1e-T1) image (lower left), and thesegmented enhancing tumor (lower right)
Ertl-Wagner et al. Page 13
Eur Radiol. Author manuscript; available in PMC 2010 March 1.
NIH
-PA Author Manuscript
NIH
-PA Author Manuscript
NIH
-PA Author Manuscript
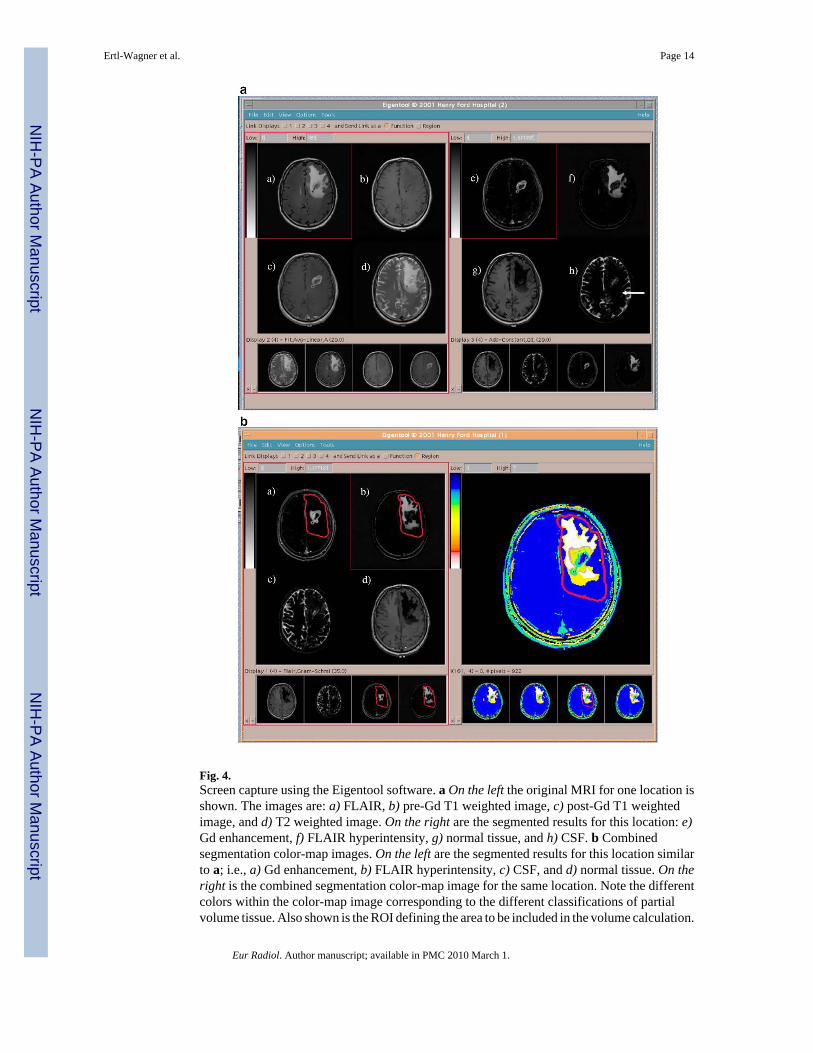
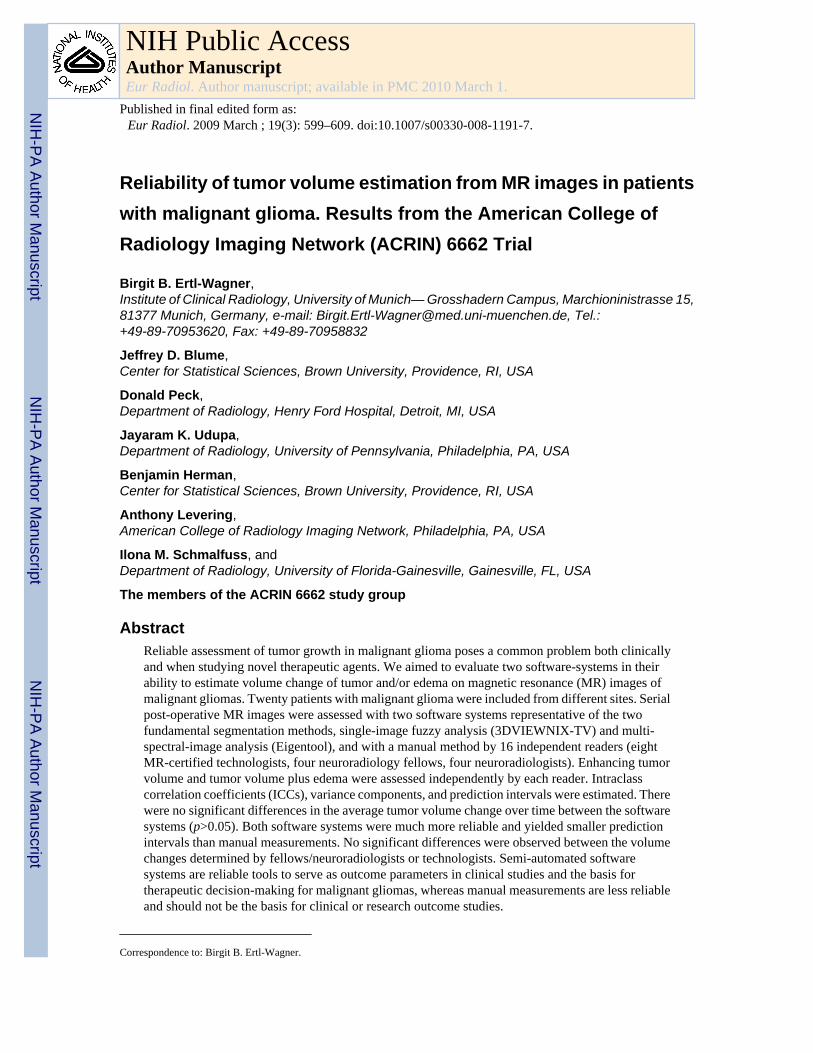
Fig. 4.Screen capture using the Eigentool software. a On the left the original MRI for one location isshown. The images are: a) FLAIR, b) pre-Gd T1 weighted image, c) post-Gd T1 weightedimage, and d) T2 weighted image. On the right are the segmented results for this location: e)Gd enhancement, f) FLAIR hyperintensity, g) normal tissue, and h) CSF. b Combinedsegmentation color-map images. On the left are the segmented results for this location similarto a; i.e., a) Gd enhancement, b) FLAIR hyperintensity, c) CSF, and d) normal tissue. On theright is the combined segmentation color-map image for the same location. Note the differentcolors within the color-map image corresponding to the different classifications of partialvolume tissue. Also shown is the ROI defining the area to be included in the volume calculation.
Ertl-Wagner et al. Page 14
Eur Radiol. Author manuscript; available in PMC 2010 March 1.
NIH
-PA Author Manuscript
NIH
-PA Author Manuscript
NIH
-PA Author Manuscript
Note that this ROI is also displayed on the segmented images and it does not include fat, skinetc. from outside the brain
Ertl-Wagner et al. Page 15
Eur Radiol. Author manuscript; available in PMC 2010 March 1.
NIH
-PA Author Manuscript
NIH
-PA Author Manuscript
NIH
-PA Author Manuscript
NIH
-PA Author Manuscript
NIH
-PA Author Manuscript
NIH
-PA Author Manuscript
Ertl-Wagner et al. Page 16Ta
ble
1Su
mm
ary
of th
e var
ianc
e com
pone
nts c
ontri
butin
g to
the t
otal
var
ianc
e whe
n es
timat
ing
volu
me d
iffer
ence
s in
the F
LAIR
hyp
erin
tens
ityov
er ti
me
with
the
resp
ectiv
e m
etho
ds (L
CB
low
er c
onfid
ence
bou
nd, U
CB
uppe
r con
fiden
ce b
ound
)
3DV
IEW
NIX
-TV
Var
ianc
e co
mpo
nent
95%
LC
B95
% U
CB
% to
tal (
ICC
)95
% L
CB
95%
UC
B
Cas
es2,
009.
081,
895.
212,
128.
230.
950.
920.
98
Rea
ders
0.00
0.00
19.2
80.
000.
000.
01
Erro
r10
2.82
38.9
515
6.53
0.05
0.02
0.07
Tota
l21
11.8
9–
––
––
Eige
ntoo
l
Var
ianc
e co
mpo
nent
95%
LC
B95
% U
CB
% to
tal (
ICC
)95
% L
CB
95%
UC
B
Cas
es22
6.53
175.
5334
4.45
0.35
0.26
0.57
Rea
ders
1.66
0.00
79.4
40.
000.
000.
10
Erro
r42
2.40
206.
3356
4.02
0.65
0.42
0.69
Tota
l65
0.60
––
––
–
Man
ual
Var
ianc
e co
mpo
nent
95%
LC
B95
% U
CB
% to
tal (
ICC
)95
% L
CB
95%
UC
B
Cas
es2,
782.
051,
655.
034,
790.
470.
440.
330.
61
Rea
ders
0.00
0.00
425.
420.
000.
000.
06
Erro
r3,
564.
822,
125.
084,
455.
450.
560.
370.
66
Tota
l6,
346.
87–
––
––
Eur Radiol. Author manuscript; available in PMC 2010 March 1.
NIH
-PA Author Manuscript
NIH
-PA Author Manuscript
NIH
-PA Author Manuscript
Ertl-Wagner et al. Page 17Ta
ble
2Su
mm
ary
of th
e va
rianc
e co
mpo
nent
s con
tribu
ting
to th
e to
tal v
aria
nce
whe
n es
timat
ing
volu
me
diff
eren
ces o
f the
Gd-
enha
ncin
g le
sion
over
tim
e w
ith th
e re
spec
tive
met
hods
3DV
IEW
NIX
-TV
Var
ianc
e co
mpo
nent
95%
LC
B95
% U
CB
% to
tal (
ICC
)95
% L
CB
95%
UC
B
Cas
es89
.08
74.7
611
8.47
0.51
0.40
0.71
Rea
ders
0.00
0.00
10.2
20.
000.
000.
06
Erro
r87
.05
38.5
812
9.27
0.49
0.28
0.59
Tota
l17
6.13
––
––
–
Eige
ntoo
l
Var
ianc
e co
mpo
nent
95%
LC
B95
% U
CB
% to
tal (
ICC
)95
% L
CB
95%
UC
B
Cas
es76
.84
26.5
919
6.72
0.25
0.12
0.53
Rea
ders
0.00
0.00
43.4
50.
000.
000.
09
Erro
r23
2.64
73.6
337
9.43
0.75
0.44
0.85
Tota
l30
9.47
––
––
–
Man
ual
Var
ianc
e co
mpo
nent
95%
LC
B95
% U
CB
% to
tal (
ICC
)95
% L
CB
95%
UC
B
Cas
es39
7.98
283.
371,
118.
210.
180.
140.
39
Rea
ders
0.00
0.00
383.
660.
000.
000.
10
Erro
r1,
825.
2661
7.52
3,22
5.44
0.82
0.58
0.84
Tota
l2,
223.
23–
––
––
Eur Radiol. Author manuscript; available in PMC 2010 March 1.
NIH
-PA Author Manuscript
NIH
-PA Author Manuscript
NIH
-PA Author Manuscript
Ertl-Wagner et al. Page 18Ta
ble
3Su
mm
ary
of th
e pre
dict
ion
inte
rval
s for
estim
atin
g vo
lum
e diff
eren
ces o
f the
FLA
IR h
yper
inte
nsity
and
of th
e Gd-
enha
ncin
g le
sion
ove
rtim
e w
ith th
e re
spec
tive
met
hods
FLA
IR v
olum
eG
d-en
hanc
ing
volu
me
Len
gth
95%
LC
B95
% U
CB
Len
gth
95%
LC
B95
% U
CB
3DV
IEW
NIX
-TV
180.
1411
2.94
228.
3652
.02
41.9
760
.43
Eige
ntoo
l99
.99
85.6
711
2.50
68.9
660
.94
76.1
4
Man
ual
312.
3025
8.92
357.
8018
4.83
166.
2120
1.75
Eur Radiol. Author manuscript; available in PMC 2010 March 1.
NIH
-PA Author Manuscript
NIH
-PA Author Manuscript
NIH
-PA Author Manuscript
Ertl-Wagner et al. Page 19Ta
ble
495
% p
redi
ctio
n in
terv
als,
sum
of v
aria
nces
and
ICC
s dep
endi
ng o
n th
e lev
el o
f pro
fess
iona
l exp
ertis
e of t
he re
ader
(CI c
onfid
ence
inte
rval
)
3DV
IEW
NIX
-TV
Eig
ento
olM
anua
l
Staf
f/Fel
low
sT
echn
olog
ists
Staf
f/Fel
low
sT
echn
olog
ists
Staf
f/Fel
low
sT
echn
olog
ists
95%
pre
dict
ion
inte
rval
(95%
CI)
Gd
51 (4
0, 6
1)53
(42,
61)
86 (7
3, 9
8)46
(39,
51)
211
(185
, 235
)15
3 (1
34, 1
71)
FLA
IR18
1 (1
11, 2
31)
179
(115
, 226
)10
4 (8
6,11
9)96
(80,
109
)25
0 (2
02, 2
90)
364
(294
, 422
)
Sum
of v
aria
nces
(95%
CI)
Gd
172
(105
, 238
)18
1 (1
17, 2
45)
485
(349
, 622
)13
5 (1
02, 1
69)
2,91
5 (2
,223
, 3,6
07)
1,53
4 (1
,161
, 1,9
08)
FLA
IR2,
132
(798
, 3,4
67)
2,09
2 (8
54, 3
,328
)69
7 (4
78,9
17)
597
(418
, 775
)4,
064
(2,6
56, 5
,473
)8,
617
(5,6
20, 1
1615
)
ICC
(95%
CI)
Gd
0.53
(0.4
2, 0
.65)
0.46
5 (0
.31,
0.6
2)0.
29 (0
.10,
0.4
8)0.
187
(0.0
2, 0
.35)
0.14
5 (0
.00,
0.3
0)0.
170
(0.0
7, 0
.27)
FLA
IR0.
98 (0
.97,
0.9
9)0.
920
(0.8
8, 0
.96)
0.37
(0.2
5, 0
.50)
0.33
5 (0
.17,
0.5
0)0.
445
(0.3
2, 0
.58)
0.45
(0.3
1, 0
.59)
Eur Radiol. Author manuscript; available in PMC 2010 March 1.