
relevance of organic nitrogen deposition and cutting edge ...
254
-
Upload
khangminh22 -
Category
Documents
-
view
0 -
download
0
Transcript of relevance of organic nitrogen deposition and cutting edge ...

F a c u l t a d d e C i e n c i a s
Facing challenges in the monitoring of atmospheric nitrogen pollution:
relevance of organic nitrogen deposition and cutting edge applications of mosses
as diagnostic bioindicators
Sheila Izquieta Rojano


F a c u l t a d d e C i e n c i a s
Facing challenges in the monitoring of atmospheric nitrogen pollution:
relevance of organic nitrogen deposition and cutting edge applications of mosses
as diagnostic bioindicators
Memoria presentada por Dª Sheila Izquieta Rojano para aspirar al grado de Doctor por la Universidad de Navarra.
El presente trabajo ha sido realizado bajo mi dirección en el Departamento de Química y autorizo su presentación ante el Tribunal que lo ha de juzgar.
Pamplona, 10 de mayo de 2016
Dr. Jesús Miguel Santamaría Ulecia Dr. David Elustondo Valencia


- Lo mejor será que bailemos.
- ¿Y que nos juzguen de locos, Sr. Conejo?
- ¿Usted conoce cuerdos felices?
- Tiene razón, ¡bailemos!
Las aventuras de Alicia en el país de las maravillas.
Lewis Carroll.
“What if I fall? Oh, but my darling, what if you fly?”
Erin Hanson.


A mi familia.
A Eneko.

Table of contents
Agradecimientos ......................................................................................................... 1
Abstract ....................................................................................................................... 7
Chapter 1. General Introduction ................................................................................ 11
Transformation of the nitrogen (N) cycle ................................................................ 13
Key drivers of change .......................................................................................... 16
Consequences of human alteration of the nitrogen cycle ....................................... 25
Atmosphere ........................................................................................................ 27
Aquatic ecosystems ............................................................................................ 29
Terrestrial ecosystems ........................................................................................ 31
The economics of nitrogen .................................................................................. 34
Nitrogen regulation ................................................................................................ 35
Nitrogen monitoring ............................................................................................... 38
Monitoring sites .................................................................................................. 39
Biomonitoring ..................................................................................................... 45
Thesis objectives and outline .................................................................................. 55
References .............................................................................................................. 59
Chapter 2. Throughfall and bulk deposition of dissolved organic nitrogen to holm oak
forests in the Iberian Peninsula: flux estimation and identification of potential
sources ...................................................................................................................... 85
Abstract .................................................................................................................. 86
Introduction ........................................................................................................... 87
Material and methods ............................................................................................ 89
Study sites and collection methods ..................................................................... 89
Sample treatment, preservation and analysis ..................................................... 90
Database validation ............................................................................................ 93
Air pollution monitoring ...................................................................................... 93
Data handling and statistical analysis .................................................................. 93
Results and discussion ............................................................................................ 94
Methodological implications ............................................................................... 94
Concentrations and deposition ........................................................................... 95
Potential sources and annual variability .............................................................. 98
N deposition implications for ecosystems ......................................................... 106
Conclusions .......................................................................................................... 109
Acknowledgements .............................................................................................. 109
References ........................................................................................................... 110
Chapter 3. Pleurochaete squarrosa (Brid.) Lindb. as an alternative moss species for
biomonitoring surveys of heavy metals, nitrogen deposition and 15N signatures in a
Mediterranean area ................................................................................................ 115
Abstract ................................................................................................................ 116
Introduction ......................................................................................................... 117
Material and methods .......................................................................................... 120
Site description ................................................................................................. 120
Species selection ............................................................................................... 121
Sampling design ................................................................................................ 122
Sample analysis ................................................................................................. 123
Enrichment factors ............................................................................................ 123
Statistical analysis ............................................................................................. 124
Results and discussion .......................................................................................... 125
Nitrogen and 15N natural abundance .............................................................. 125
Heavy metal accumulation and enrichment factors .......................................... 127
Conclusions .......................................................................................................... 133
Acknowledgements .............................................................................................. 133
References ............................................................................................................ 134
Chapter 4. Integrated eco-physiological response of the moss Hypnum cupressiforme
Hedw. to increased atmospheric ammonia concentrations .................................... 139
Abstract ................................................................................................................ 140
Introduction ......................................................................................................... 141
Material and methods .......................................................................................... 144
Site description and field sampling ................................................................... 144
Ammonia monitoring ........................................................................................ 145
Moss analyses ................................................................................................... 145
Shoot nutrient content and isotopic signatures ............................................ 146
Phosphomonoesterase (PME) and nitrate reductase (NR) enzyme activities . 147
Superoxide dismutase (SOD) enzyme activity and lipid peroxidation ............ 147
Soluble protein content and pigment composition ....................................... 148
Moss data handling and statistical analysis ....................................................... 149
Results .................................................................................................................. 149
Ammonia concentrations .................................................................................. 149
Physiological responses increased along the gradient ....................................... 152
Physiological responses decreased along the gradient ...................................... 158
Physiological responses unchanged along the gradient ..................................... 161
Discussion ............................................................................................................. 162
Influence of NH3 concentrations on the physiology of H. cupressiforme ............ 162
Evaluation of responsiveness and temporal variability ...................................... 168
Conclusions .......................................................................................................... 169
Acknowledgements .............................................................................................. 170
References ............................................................................................................ 171
Supplementary material ....................................................................................... 179
Chapter 5. Total N and C contents and stable isotopes (15N and 13C) in moss tissue
at a European scale: a preliminary insight into spatial distribution patterns and
feasibility of isotopic signatures as indicators of pollution sources and environmental
conditions ................................................................................................................ 185
Abstract ................................................................................................................ 186
Introduction ......................................................................................................... 187
Material and methods .......................................................................................... 190
Material selection ............................................................................................. 190
Elemental and isotopic analysis ......................................................................... 190
Statistical analysis ............................................................................................. 191
Maps ................................................................................................................. 191
Results and discussion .......................................................................................... 192
N elemental contents and 15N signatures ........................................................ 192
C elemental contents, C:N ratio and 13C signatures ......................................... 205
Conclusions .......................................................................................................... 217
Acknowledgements .............................................................................................. 218

References ............................................................................................................ 218
Chapter 6. Conclusions ............................................................................................ 229
Annex I. ................................................................................................................... 235
EDEN project ........................................................................................................ 235
ICP-Vegetation programme .................................................................................. 237
Annex II. .................................................................................................................. 239
Published papers .................................................................................................. 239
Agradecimientos
1
Agradecimientos
Aunque han pasado ya varios años, aún recuerdo el primer día que llegué a la
Universidad de Navarra como si fuera ayer. Siempre me había gustado la investigación,
pero nunca parecía el momento de comenzar una tesis: primero era demasiado joven,
había pocas becas, y no tenía ningún contacto; luego pasé a ser demasiado mayor,
había menos becas y realizar una tesis no era un ‘trabajo de verdad’. Por eso, cuando
decidí contactar con Jordi Puig para realizar el máster de Biodiversidad y asesorarme
sobre la posibilidad de realizar una tesis, gran parte de mi entorno creyó que me había
vuelto loca del todo. Tal vez fuera cierto, pero cuando me dieron esta oportunidad
sentí que era una loca feliz. También una loca asustada, nerviosa, llena de
incertidumbres y expectante ante este nuevo reto, por supuesto. Pero feliz, ilusionada
y tranquila por estar haciendo exactamente lo que quería hacer. Hay quien cree que
las casualidades no existen y que si algo está destinado a suceder lo hará en el
momento adecuado y por la mejor razón. En mi caso no sé si fue el destino el que me
trajo aquí ese día, pero lo cierto es que esta experiencia me ha dado no una, sino
múltiples razones por las que estar hoy enormemente agradecida. No solo he tenido la
oportunidad de formarme como investigadora con grandes profesionales, sino que
también he tenido la suerte de compartir esta experiencia con grandes personas
dentro y fuera de la universidad. A todas y cada una de ellas, gracias. Este apartado va
dedicado a vosotr@s.
A la Universidad de Navarra por la oportunidad de realizar esta tesis doctoral y a la
Asociación de Amigos de la Universidad de Navarra por el soporte económico recibido.
A mis directores de tesis, Chusmi y David, por acogerme en su grupo de investigación y
ofrecerme todos sus conocimientos y saber hacer. Ambos me habéis animado durante
este tiempo y habéis confiado en mi capacidad para sacar este proyecto adelante. Sin
vuestro apoyo, dedicación y cariño hoy no estaría redactando este capítulo. Chusmi,
gracias por mostrarme cómo funciona el mundo de la investigación, por permitirme
participar en grandes proyectos, por todos los recursos y oportunidades brindadas y
por enseñarme la importancia de confiar en uno mismo. De ti me quedo con tu
optimismo, tu sentido del humor, y tu gran espíritu de superación. Pero sobre todo
Agradecimientos
2
quería darte las gracias por inculcarme este sentimiento de inquietud hacia la ciencia y
de necesidad constante de búsqueda de la verdad. Y también por enseñarme que, tal y
como dice el refrán, ‘la paciencia es la madre de la ciencia’. A ti David quería dedicarte
un agradecimiento especial, ya que más que un director de tesis has sido un
compañero de a bordo durante todo este tiempo. Te has implicado sobremanera en
todos y cada uno de los capítulos que componen esta tesis, desde el trabajo de campo
hasta la discusión de los resultados. Si he podido evolucionar profesionalmente
durante estos años ha sido gracias a ti. También has sabido ser un gran apoyo en los
momentos de flaqueza (que no han sido pocos), ayudándome a ver la luz entre tanta
sombra. Gracias por ser director, psicólogo y amigo. De ti me quedo con tu capacidad
de trabajo, tu perseverancia y sobre todo tu gran calidad humana.
A Jordi Puig, por confiar en mí desde el principio. Esta aventura no hubiera podido
comenzar sin tu ayuda. Posees un don único que te permite ‘ver a las personas’, siendo
capaz de decir la palabra exacta en el momento exacto. Gracias por esas palabras
‘mágicas’; gracias por hacer que tu trabajo siempre vaya más allá de las aulas.
A Alicia Ederra y Juan José Irigoyen, por su inestimable ayuda en el desarrollo de varios
trabajos de esta tesis. A Juanjo también por su paciencia en el laboratorio y su buena
disposición en todo momento. Ha sido un placer trabajar contigo. Gracias.
A Adriana, Amaia, Isabel, Ibón y Óscar, por su amistad y cariño. No podría haber
tenido mejores compañeros de máster. Por sus ganas de aprender, su sonrisa y por
sacar siempre lo mejor de mí. En especial a Ibon, ya que han sido muchas las
confidencias, risas y buenos momentos compartidos desde entonces. Gracias por
contagiarme de tu entusiasmo y de tu manera única de ver la vida.
A mis compañeros del proyecto EDEN, ya que ha sido un auténtico lujo trabajar con
cada uno de vosotros. Anna y Rocío, gracias por compartir conmigo un poquito de
vuestra sabiduría; sois grandes profesionales y he aprendido mucho de vuestros
consejos. Pequeños Héctor y Laureison, mis queridos Edenitas, dudo que pudiera
haber encontrado mejores compañeros de fatigas. Si alguien conoce el esfuerzo y
trabajo que ha llevado esta tesis sois vosotros. Gracias por estar siempre ahí, por
vuestra disposición, por hacer el trabajo más fácil, por hacerme sentir que no estaba
Agradecimientos
3
‘sola ante el peligro’, por las interminables reuniones que acababan en locura máxima
y risas, por los pintxos y vinitos que hemos compartido, por vuestro cariño y amistad.
Sois muy grandes y estoy convencida de que llegaréis muy lejos (I EDEN).
A mis compañeros del Departamento de Química de la Universidad de Navarra, con
especial cariño a Esther, Carol, Marisa y Marta, por su gran corazón, por su disposición
para ayudar en todo momento y por todas las confidencias y apoyo recibidos. A Nerea,
Blanquita, Cristina S., Luzu, Gorka, Raúl y Yasser, por vuestra ayuda en el laboratorio,
vuestra compañía y vuestros sabios consejos. En definitiva gracias a todos por hacer
del grupo una gran familia y por hacer el día a día mucho más llevadero.
Al profesor J. Neil Cape y a Y. Sim Tang, del ‘Centre for Ecology and Hydrology’ de
Edimburgo. Gracias por la cálida acogida y por vuestra hospitalidad. Gracias por
compartir vuestros conocimientos y vuestro tiempo en el laboratorio, al final logramos
controlar al ANTEK. Gracias por vuestro apoyo, especialmente a Neil, ya que incluso
después de jubilado has seguido implicado en la supervisión de los trabajos que
quedaban pendientes. Gracias por vuestra amabilidad y por el afecto recibido durante
mi tiempo en Escocia, me hicieron sentir un poco más cerca de casa.
A mis ‘Marías’: Maite, Celia, Melissa y Josemi. Sí Josemi, te costó entrar en el grupo,
pero finalmente lo conseguiste. Si me hubiesen dicho que personas tan diferentes iban
a casar así de bien nunca lo habría creído. Gracias por todos y cada uno de los
momentos vividos dentro y fuera de la universidad, por las risas, los enfados, los
abrazos, las locuras, las canciones con mensaje, porque Carrascal y Etxeberri molan,
por cerdejo y la mona princesa, por Antonio y la barca de Mendavia, por los datos
desaparecidos de Carrascal; en definitiva, por todo lo que he aprendido con vuestra
amistad y por hacerme disfrutar del camino siempre que habéis estado a mi lado.
Estoy segura de aún nos queda mucho por recorrer juntas.
A Mikel, por tu gran empatía, por tener siempre una palabra amable y por ser capaz de
sacarnos una sonrisa en los peores momentos. Por enseñarme que no siempre las
primeras impresiones son las que cuentan, y que bajo esa ‘chulería’ se esconde una
gran persona. Gracias por tu espontaneidad, por tus historias y tus consejos. Pero
sobre todo, gracias por evitar esos incómodos silencios a la hora del almuerzo.

Agradecimientos
4
A Mery Ló, porque desde que llegaste fuiste un soplo de aire fresco. Gracias por
contagiarme de tu vitalidad, tu alegría, tu optimismo y tus ganas de trabajar. Gracias
por hacer el trabajo de laboratorio infinitamente más llevadero, por tu implicación en
los proyectos que hemos compartido, y por ayudarme a no rendirme cuando las cosas
no salían bien. Gracias por ofrecerme tu amistad, tu confianza, tu comprensión y tu
apoyo incondicional. Pero sobre todo, gracias por tu selección de grandes canciones en
español. Eres grande pequeña Mery.
A mi cuadrilla de ‘Pecheros y Pechericas’, por confiar siempre en mí. Para los que no
forman parte de este mundo es difícil entender lo que supone la realización de una
tesis. Sin embargo, vosotros habéis procurado estar ahí siempre, haciendo terapia con
nuestros saloncitos, e incluso cambiando el ‘mus’ por ‘musgo’. Esos momentos de risas
y complicidad no tienen precio. Gracias a tod@s por los ánimos y todo el cariño que
me habéis dado. Así el camino ha sido más fácil.
A todo el resto de cuadrillas ‘no oficiales’ que tengo la suerte de disfrutar: a mis
‘Sinfus’, por su manera de afrontar el día a día con una sonrisa, su alegría, su
optimismo y su capacidad de sacar siempre lo mejor de cualquier situación; a mis
‘Namainsas’, por ser únicos, por hacerme disfrutar al máximo de cada minuto que
pasamos juntos, por esas farras que se nos van de las manos, por toda vuestra
sabiduría sobre montes, música, pelis y teorías de la conspiración; a mi equipo ‘CESIG’,
por vuestro apoyo y confianza, por los estreses, las risas y los juevintxos compartidos;
a Naiara, por tu amistad única, sincera e incondicional. A Clarutxi y a Txaska por tantos
buenos momentos compartidos. A Javier E., por tu paciencia y ayuda. Mil gracias.
De manera muy especial, a todos los Rojano, por ser la mejor familia que alguien
podría desear. Gracias por confiar siempre en mí, por vuestro apoyo constante, por
sufrir mis fracasos y celebrar mis logros como si fueran los vuestros, por tanto amor y
cariño. Gracias por cada expedición, por todos los momentos de poco fundamento, por
cada una de vuestras sonrisas y abrazos. Gracias por formar esa gran piña en la que
poder refugiarme, gracias por darme la seguridad de sentirme acompañada.
Agradecimientos
5
A mis padres, Adolfo y Tere, porque cualquier logro en mi vida es gracias a ellos.
Gracias por estar a mi lado y quererme sin condición, por respetarme y aceptarme tal y
como soy. Gracias por darme la libertad de cometer mis propios errores, lo que me ha
ayudado a ser independiente y a saber elegir lo que quiero en la vida. Gracias por
mostrarme el valor del trabajo bien hecho, la responsabilidad y la honestidad. Gracias
por ser un ejemplo de esfuerzo, sacrificio y superación continuos, por no rendiros ni
tirar nunca la toalla aunque las cosas no sean fáciles. Gracias por ayudarme a ser mejor
persona. Gracias por mostraros siempre tan orgullosos de mí. Ojalá alguna vez pueda
devolveros una mínima parte de lo que me habéis dado vosotros. A mi hermana Lidia,
por su corazón limpio y sincero. Por su infinita bondad. Gracias por ser un ejemplo de
valentía y superación cada día. Gracias por estar siempre para mí, por quererme, por
tu complicidad, por ser mi hermana pequeña. A mi sobrina, Naiara, porque cuando
estoy con ella se me olvidan todas las preocupaciones. Gracias por traer tanta alegría a
esta casa.
A Eneko, por todos y cada uno de los momentos que compartimos juntos. Si hay
alguien que merece un agradecimiento especial eres tú. Gracias por animarme a
comenzar esta aventura y permanecer a mi lado todo el tiempo, sé que no siempre ha
sido un camino fácil. Gracias además por ser partícipe de ella, por tu ayuda, tu interés
sincero, por escucharme. Gracias por ser mi aliento en los momentos más
complicados, gracias por tirar de mi mano siempre hacia adelante. Gracias por tu
sencillez, tu humildad y tu predisposición a que todo salga bien. Gracias, porque a tu
lado todo parece más sencillo. Gracias por enseñarme a querer con el corazón. ¿Qué
más decir si cada parte de mi mente es tuya? Simplemente, gracias por ser tú.
Por último, y con especial cariño, a mis abuelos Antonio y Tere, por creer siempre en
mi y darme su amor de manera incondicional. Gran parte de lo que soy hoy en día es
gracias a ellos. Si hay algo que pueda entristecer la alegría de ver terminada esta tesis
es el hecho de no poder compartirla con ellos.
Gracias a tod@s por hacer esto posible.

Agradecimientos
6
Abstract
7
Abstract
Over the last century, the use of synthetic fertilizers and the fossil fuel combustion to
satisfy the increasing demand for food and energy of a growing population has
resulted in a massive alteration of the nitrogen (N) cycle. This modification of the N
natural dynamics entails the loss of large amounts of anthropogenic reactive nitrogen
(Nr) to the environment, causing significant impacts on human and ecosystems health.
To deal with the challenge of minimize unintended consequences of nitrogen
enrichment in the different environmental reservoirs, policy makers have developed
both national and international treaties and directives. In order to evaluate the
effectiveness of the proposed measures and continue investigating the potential
effects of N pollution, both monitoring networks and individual scientific surveys are
developed. The monitoring work can be carried out by using different approaches
depending on the objectives it pursues. In the present dissertation the study of
atmospheric N pollution has been performed by considering different monitoring
methods, which ultimately aimed at: 1) throwing light on those aspects of the nitrogen
cycle that currently remain poorly understood; 2) evaluating some techniques and
novel uses that could lead to a better understanding of N deposition-related issues.
Our first work was developed by using the instrumentation of four physical monitoring
sites in Spain and was focused on the study of the nitrogenous organic fraction of rain
samples. Even though in the last decades it has been observed that the organic
nitrogen (ON) may highly contribute to total N deposition, nowadays this fraction is
still not routinely assessed. Indeed, any of the most important rainfall monitoring
programs and networks worldwide includes the dissolved organic nitrogen (DON) in
their target compounds. This fact results in important information gaps in our
knowledge of budgets, chemical characterization and potential sources, limiting our
understanding of the N cycle and the implications for ecosystems’ functioning. In order
to cover the lack of data in the Mediterranean area, both canopy throughfall (TF) and
bulk deposition (BD) samples from four holm oak forests of the Iberian Peninsula were
analyzed for their DON content for a whole year. The results showed that the
contribution of the organic fraction to the total N budgets was significant at these
locations, ranging in BD from 34% in Barcelona to 56% in Navarra, and in TF from 38%

Abstract
8
to 72% in Barcelona and Madrid respectively. Data also revealed that agricultural
activities and traffic-related pollutants generated in metropolitan areas may play an
important role as potential sources of organic nitrogenous compounds. Finally, DON
canopy uptake was observed in Navarra in spring and autumn, what suggested that
some labile compounds could be directly assimilated by the canopy, being the organic
fraction an additional nutrient for this forests type.
The other three research surveys included in this thesis were carried out by employing
mosses as biomonitors of N pollution. The moss sampling technique constitutes a
useful alternative to physical monitoring sites for the study of N deposition when a
non-detailed indication of atmospheric levels and temporal variability of air pollutants
is required. The measurements performed with this indirect method represent the
accumulated response on the component being studied, thus providing an integrated
response of the environmental conditions to which the biomonitor is exposed. Despite
the fact that mosses have been used for more than 40 years for surveying atmospheric
pollution, nowadays this technique continues offering interesting challenges and novel
applications for the study of N deposition and its potential effects, some of which have
been addressed and investigated in this PhD work.
The Nordic countries were the pioneers in using the moss biomonitoring technique for
the establishment of spatial and temporal deposition trends of some atmospheric
pollutants, becoming a reference in this topic. Those first works set the basis for the
development of harmonized sampling protocols, which nowadays only recommend the
use of four pleurocarpous species: Hylocomium splendens, Pleurozium shreberi,
Hypnum cupressiforme and Scleropodium purum. However, climatic conditions in
shouthern Europe highly differ from those of northern and central Europe, and equally
do the distribution and abundance of the aforementioned moss species. As a
consequence, biomonitoring surveys in the Mediterranean area are scarce and
frequently limited to places where the recommended species appear. With these
concerns in mind, we carried out an interspecies comparison survey in the
Mediterranean area of Navarra, northern Spain, with the aim of finding an alternative
and suitable species for these dry and harsh areas. Two moss species were analyzed
for their heavy metals and N tissue contents: Pleurochaete squarrosa, a widespread

Abstract
9
and plentiful bryophyte in Mediterranean regions, and Hypnum cupressiforme, an
accepted and broadly used species in biomonitoring surveys. After applying the
Enrichment Factor approach, the results showed that both species were able to depict
the same spatial patterns for all the studied trace elements. Regarding N, both mosses
showed the same pollution hot-spots. Moreover, the analysis of the N isotopic
signatures demonstrated that Pleurochaete squarrosa was more accurate when it
comes to identifying N pollution sources in this area. All these findings suggested that
Pleurochaete squarrosa may be a feasible alternative for biomonitoring surveys in
southern Europe and other Mediterranean areas.
The absence of a well-developed cuticle and the lack of a true root system to acquire N
from substratum are the main characteristics that allow us to use mosses to
investigate spatial and temporal trends of atmospheric compounds. However, it is
those same features which confers on them special sensitivity to N deposition and
make it possible to use them as indicators of direct effects of air pollutants. Moreover,
being one of the most vulnerable organisms of ecosystems, the study of certain
parameters in mosses could be useful for establishing tipping points that help us to
identify and anticipate when a further change may happen at ecosystem level, playing
a vital role as early warning indicators of N-related impacts. Currently, ammonia is one
of the atmospheric pollutants of major concern and one of the target compounds of
national and international amendments. This gas is mainly released in agricultural
activities, especially in livestock-related activities, and has been linked to important
environmental problems. In the fourth chapter of this PhD we investigate how the
species Hypnum cupressiforme Hedw. responds to increasing air concentrations of NH3
by analyzing different parameters, such as: tissue contents of N, C, P and K; the activity
of metabolic and antioxidant enzymes; pigments; N and C isotopic signatures; and
accumulation of N-containing solutes (soluble proteins). The main aim of the study was
to evaluate the effects of enhanced ammonia on the mosses physiology from a
multivariate and temporal perspective, and to identify the most responsive variables
that could be used as early indicators of N impacts. The results evidenced an overall
influence of NH3 on a great number of internal functioning processes, causing
nutritional imbalances, membrane damages and photosynthesis impairment. The

Abstract
10
analysis of temporal data highlighted the importance of the sampling season when
monitoring particular physiological processes, especially those related to C and N
metabolism. Foliar N content, SOD and 13C were the most responsive variables,
showing significant exposure-response relationships with NH3 at all seasons. This fact
confers on them a great potential for anticipating ecological NH3-related effects.
Finally, isotopic signatures were found of particular interest, not only for their sensitive
answer to increasing NH3, but also for their usefulness in indentifying possible
damages in the cellular C metabolism (13C) and as biomarkers of NH3 gas uptake and
P-limitation (15N).
Consistent with the earlier point, the analysis of the N isotopic ratios has also been
proven to be a helpful tool in providing supplementary information about the nature
of the nitrogenous species and the attribution of potential pollution sources in
biomonitoring surveys. The method is mainly based on the differences in isotopic
signatures of the nitrogenous compounds: anthropogenic emissions of oxidized forms
are enriched in their heavier isotope (15N; more positive 15N value), whereas reduced
forms are more depleted in 15N (more negative 15N value than oxidized forms). If
mosses are considered an integrator of atmospheric chemistry, then their 15N values
should reflect the isotopic fractionation of the atmospheric N pollutants deposited in
the places where the vegetal samples were collected. Bearing in mind these premises,
we planned the last research work of the present dissertation. The main purpose of
this study was to evaluate the effectiveness of this technique applied at a regional
scale. To that end, approximately 1300 samples from 15 countries in Europe (all of
them participants of the 2005 ICP-Vegetation biomonitoring campaign) were analyzed
for their N and C content and 15N and 13C signatures. The results were compared
with deposition modeled data (EMEP) and the most frequent land-uses at the sampling
locations (CORINE Land Cover 2006). Our findings suggested that, along with foliar N
and C contents, the analysis of both 15N and 13C might be a useful tool for providing
additional information about atmospheric pollution sources and key ecological
processes, and thus, for getting valuable supplementary data in the moss surveys at
the European scale.

Chapter 1 General Introduction


General Introduction
13
Transformation of the nitrogen cycle
Nitrogen has the greatest total abundance in the Earth’s atmosphere, hydrosphere and
biosphere, amounting to approximately 4 x 10²¹ grams (g). Ironically, more than 99% of
this N is not directly available to more than 99% of living organisms. The reason for this
seeming contradiction is that while there is an abundance of N in nature, it is almost
entirely in the form of molecular nitrogen (N2), a chemical form that is not usable by
most organisms (Galloway et al., 2003). Historically, the creation of reactive nitrogen
(Nr; defined as all nitrogen species except N2) has taken place through natural limiting
processes such as lightning, biomass burning and biological nitrogen fixation (BNF),
being the latter the dominant source (Erisman et al., 2011; Butterbach-Balh et al.,
2011; Vitousek et al., 2013). The general chemical reaction for the fixation of N (N2 +
3H2 → 2NH3) requires large amounts of energy to break the triple bond of N and get
the subsequent union of three atoms of hydrogen with the N ones. Only certain
specialized microorganisms -rhizobial and actinorhizal symbioses, free-living and
symbiotic cyanobacterial fixers, and free-living and symbiotic (or associated)
heterotrophic bacteria,- have developed the ability of performing that reaction and
convert atmospheric N2 to Nr (Galloway et al., 2004; Reed et al., 2011; Vitousek et al.,
2013). For millennia the formation of reactive nitrogen was balanced by deep
sedimentation and the conversion of Nr back to N2 by denitrification, anammox and
other processes, leading to little accumulation of Nr in environmental reservoirs
(Vitousek et al., 2002; Kuenen and Gijs 2008; Galloway et al., 2013). Vitousek et al.
(2013) estimated that pre-industrial N fixation was 58 Tg N fixed yr-1 (range of 40 –
100). This capacity of biological N fixers is more than enough to maintain N pools in
ecosystems and replenish N losses (Butterbach-Balh et al., 2011). However, in spite of
this substantial supply, N has often been the limiting factor to increase production for
both terrestrial and aquatic ecosystems (Unrein and Tell 1994; Elser et al., 2007;
Vitousek et al., 2010). These conditions of low N availability have resulted in an
effective use of N as a resource, creating balanced interactions among environmental
compartments which have led to a good number of ecosystems with high species
diversity (Vitousek et al., 1997; Bobbink et al., 1998; Phoenix et al., 2006).
Chapter 1
14
In the last two centuries this natural functioning of the nitrogen cycle has been
dramatically altered by human action as a consequence of changes in the energy and
food production patterns, resulting in negative impacts for ecosystems and human
health (Galloway et al., 2003 and 2008; Erisman et al., 2013; Shibata et al., 2015).
Several authors have published interesting data that give us an idea of the magnitude
of this transformation. Kopáček and Posch (2011) estimated that from the introduction
of agriculture, ~8000 B.C., to the year 2000 A.D. the global cumulative anthropogenic
release of Nr to the atmosphere was ~17.4 Pg N (8.6 Pg NH3-N and 8.8 Pg NOx-N), 28%
of which was produced between 1850 and 2000, and 42% during 1 – 1850 A.D.
Approximations performed by Galloway et al. (2004 and 2008) suggested that in the
early 1990s, Nr creation by anthropogenic activities was 156 Tg N yr-1, a 10 fold
increase over 1860 estimates (~15 Tg N yr-1); from 1990 to 2005 a further growth was
experienced (187 Tg N yr-1). These authors also highlighted that since 1970 the world
population has increased by 78%, whereas nitrogen grew by 120%. Recent publications
from Fowler et al. (2013 and 2015) emphasized that by 2010 half of the global nitrogen
fixation of reactive nitrogen in terrestrial and marine ecosystems annually is due to
anthropogenic activities (210 of 413 Tg N), whilst human activities generate three-fold
more Nr than terrestrial processes do (75% of the Nr created on land is by human
action). Moreover, according to current trajectories, changes in climate and land use
might increase both the biological and the anthropogenic fixation to approximately
600 Tg N yr-1 by around 2100, an increase of 50% over values at the beginning of the
century, but subject to large uncertainties (Fowler et al., 2015). Finally, Galloway et al.
(2014) offered an evaluation of the influence of human action on the nitrogen cycle
using the metric of anthropogenic Nr creation on a per capita basis. They proposed
four eras: the first one comprises the period from 1850 to 1950, where Nr creation
increased roughly proportional to the population and per-capita Nr creation was
constant at ~12 kg N yr-1; during the second era, from 1950 to 1980, per-capita Nr
creation experienced a rapid increase to ~30 kg N yr-1; in the third era (approximately
from 1980 to the present) the global per-capita Nr creation remained at ~30 kg N yr-1
and an equilibrium between population growth and Nr creation was reached. The
fourth era (projections for 2050) considered an increase in Nr efficiency on a per-capita
basis, despite the increase of both Nr and population.

General Introduction
15
A good example to get an idea of the massive alteration of the nitrogen cycle in a
visual way is the graph published by Erisman et al. (2011) (Figure 1). This picture shows
global trends in human population, CO2 emissions and total anthropogenic reactive
nitrogen production throughout the 20th century. Moreover, average fertilizer
consumption and the increase in NOx emissions from fossil fuel burning are included.
As it can be observed, CO2 emissions and anthropogenic Nr depict a parallel trend
because of the similarity between the drivers (food, feed and energy) and, to some
extent, the sources (Erisman et al., 2011). Furthermore, there is a clear correlation
between nitrogen enrichment and world population growth, showing a direct
relationship between the two phenomena.
Figure 1. Global trends in human population, CO2 emissions in Tg C, total anthropogenic reactive
nitrogen consumption in Tg N, average fertilizer production and increase in NOx emissions from fossil
fuel burning throughout the 20th century. Graph from Erisman et al. (2011).
Chapter 1
16
Key drivers of change
The main milestones driving the dramatic change in the natural dynamics of the N
cycle (Figures 1 and 2) are related to the 18th and 19th century Industrial and
Agricultural Revolutions and the 20th century Green Revolution.
The Industrial Revolution (from about 1760 to approximately 1840) witnessed a
transition to new manufacturing processes that implied an increasing use of steam
power and the change from wood and other bio-fuels to coal to satisfy the increasing
demand of energy. The innovations that emerged during those decades contributed
greatly to set the basis for the technical progress and growth of the developed
societies we know today. However, energy production from fossil fuels combustion
also results in the unintended creation of Nr, specifically the formation of NOx (NO +
NO2) (Hameed and Dignon 1988; Hertel et al., 2011 and 2012). The sources of these
compounds during the fuel burning are twofold: oxidation of atmospheric N2 to NOx
(new Nr) and conversion of organic N in the fuel to inorganic oxidized molecules
(release of sequestered Nr) (Galloway and Cowling, 2002; Fowler et al., 2013).
Galloway et al. (1998) estimated that the global amount of fossil fuel use per person
has increased by more than a factor of 6 over the last 75 years, whereas the
Intergovernmental Panel on Climate Change (Ehhalt and Prather 2001) suggested that
global NOx emissions have increased 3 to 6 fold since the industrial revolution, mainly
due to the increasing use of fossil fuel and biomass. Concretely, van Aardenne et al.
(2001) showed an increase in emissions by a factor of 5, from 7 Tg N at the end of the
19th century to 35 Tg N in 1990, being the fossil fuel combustion the largest NOx
source (60% of the global emissions in 1990) from 1930 onwards. Current data from BP
verified that in 2014 oil remained the world’s leading fuel, accounting for 32.6% of
global energy consumption (BP statistical review 2015).

General Introduction
17
Figure 2. Sector trends in European NOx emissions 1880 – 2005 (Units: Tg NO2) (Vestreng et al., 2009).
There exists a number of inventories and datasets that focus on compiling atmospheric
pollution data, which are the basis for global and regional NOx emission estimates and
future predictions (Monks et al., 2009; Reis et al., 2009; Granier et al., 2011; van
Vuuren et al., 2011; Xing et al., 2015). Depending on the dataset used, numbers can
vary. By way of example, 1990 Olivier et al. (1998) calculated an annual NOx release of
31 Tg N from anthropogenic sources, whilst estimates from Lamarque et al. (2010)
were almost double (59 Tg N yr-1). For 2000, the approximation performed by Jaeglé et
al. (2005) concluded that the global budget of NOx was ~40 Tg N yr-1, whereas for the
same year Lamarque et al. (2010) estimated the global total amount of NOx emissions
in ~57 Tg N yr-1. If we compare current estimates with numbers for 1850 (1.24 Tg N yr-1;
Lamarque et al., 2010), it can be noted the great change in emission trends happened
since then. According to van Vuuren et al. (2011), by 2050 global emissions will range
from 30 to 50 Tg N yr-1, and from 20 to 50 Tg N yr-1 in 2100. Most future scenarios
predict a slow increase in the coming decades followed by a stabilization or decline.
However, that will ultimately depend on the control policies in different parts of the
world and the selection and improvement of combustion technologies in the energy
system (Isaksen et al., 2009; Monks et al., 2009; van Vuuren et al., 2011; BP statistical
review 2015). Isaksen et al. (2009) showed global estimates of source sector
contributions. In 2000, NOx emissions were mainly related to road
Chapter 1
18
transport (41%) and industrial combustion (38%). Yet, although their forecast for 2030
predicted an important decrease in the road transport sector (19-26% of total share), it
also anticipated a substantial increase in NOx emissions linked to industrial combustion
(approximately half of total emissions) due to the economical and technological
development of Asian countries.
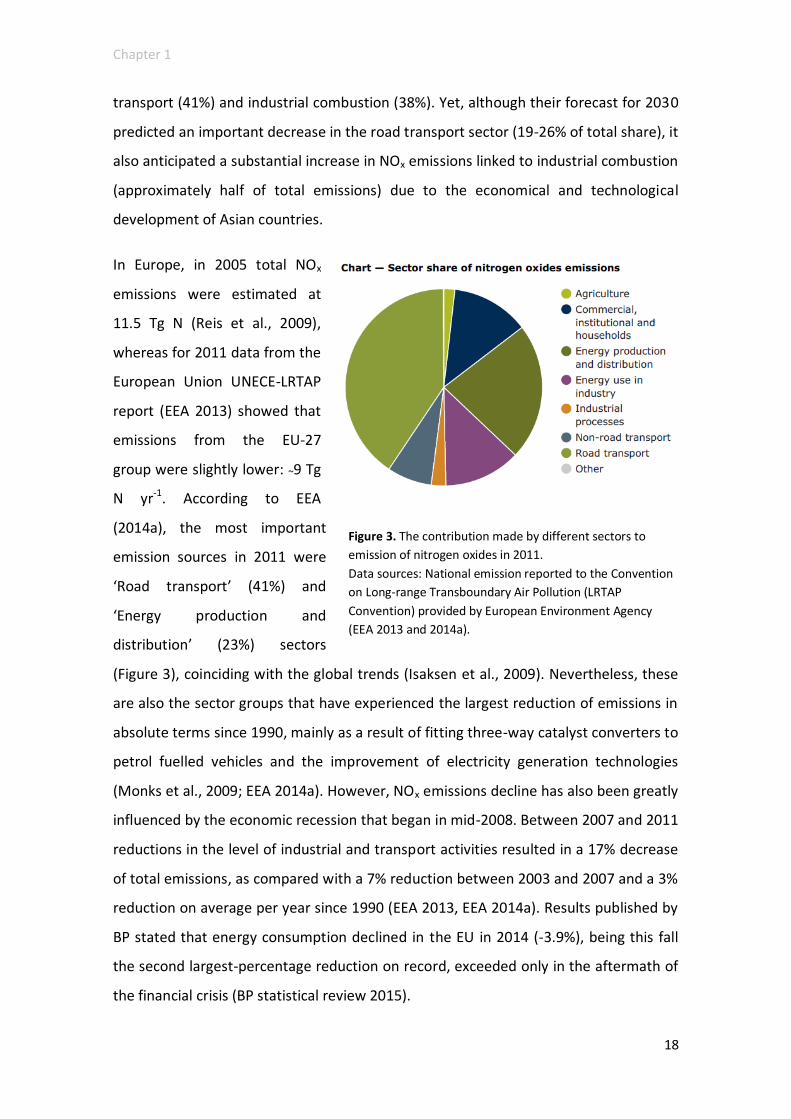
In Europe, in 2005 total NOx
emissions were estimated at
11.5 Tg N (Reis et al., 2009),
whereas for 2011 data from the
European Union UNECE-LRTAP
report (EEA 2013) showed that
emissions from the EU-27
group were slightly lower: ~9 Tg
N yr-1. According to EEA
(2014a), the most important
emission sources in 2011 were
‘Road transport’ (41%) and
‘Energy production and
distribution’ (23%) sectors
(Figure 3), coinciding with the global trends (Isaksen et al., 2009). Nevertheless, these
are also the sector groups that have experienced the largest reduction of emissions in
absolute terms since 1990, mainly as a result of fitting three-way catalyst converters to
petrol fuelled vehicles and the improvement of electricity generation technologies
(Monks et al., 2009; EEA 2014a). However, NOx emissions decline has also been greatly
influenced by the economic recession that began in mid-2008. Between 2007 and 2011
reductions in the level of industrial and transport activities resulted in a 17% decrease
of total emissions, as compared with a 7% reduction between 2003 and 2007 and a 3%
reduction on average per year since 1990 (EEA 2013, EEA 2014a). Results published by
BP stated that energy consumption declined in the EU in 2014 (-3.9%), being this fall
the second largest-percentage reduction on record, exceeded only in the aftermath of
the financial crisis (BP statistical review 2015).
Figure 3. The contribution made by different sectors to
emission of nitrogen oxides in 2011.
Data sources: National emission reported to the Convention
on Long-range Transboundary Air Pollution (LRTAP
Convention) provided by European Environment Agency
(EEA 2013 and 2014a).

General Introduction
19
Nitrogen availability is a key factor determining the productivity of crops for food,
feed, fibre and bio-energy, and hence for all human activity. In a N-limited world, the
agricultural revolution emerged as a result of the human need to overcome the
insufficient land productivity and satisfy the increasing demands for food and energy,
and thus to ensure the population’s sustenance (Galloway and Cowling, 2002;
Galloway et al., 2013). Practices such as crop rotation, use of legumes for BNF or
application of fertilizers such as livestock manure, guano or mineral nitrate deposits
were found to benefit crop production (Smil 2005; Galloway et al., 2013). However,
these techniques and the traditional recycling of organic wastes were not enough to
sustain higher crop yields and satisfy the rising demand for a better nutrition of
growing populations. Thus, it was not until the beginning of the 20th century when one
of the most significant scientific breakthroughs ever helped respond to this challenge:
the synthesis of ammonia by reacting atmospheric dinitrogen with hydrogen in the
presence of iron at high pressures and temperatures in what is known as the Haber-
Bosch process (Smil 2001; Erisman et al., 2008; Sutton et al., 2008a and 2013b). A
hundred years later we live on a world transformed by and highly dependent upon the
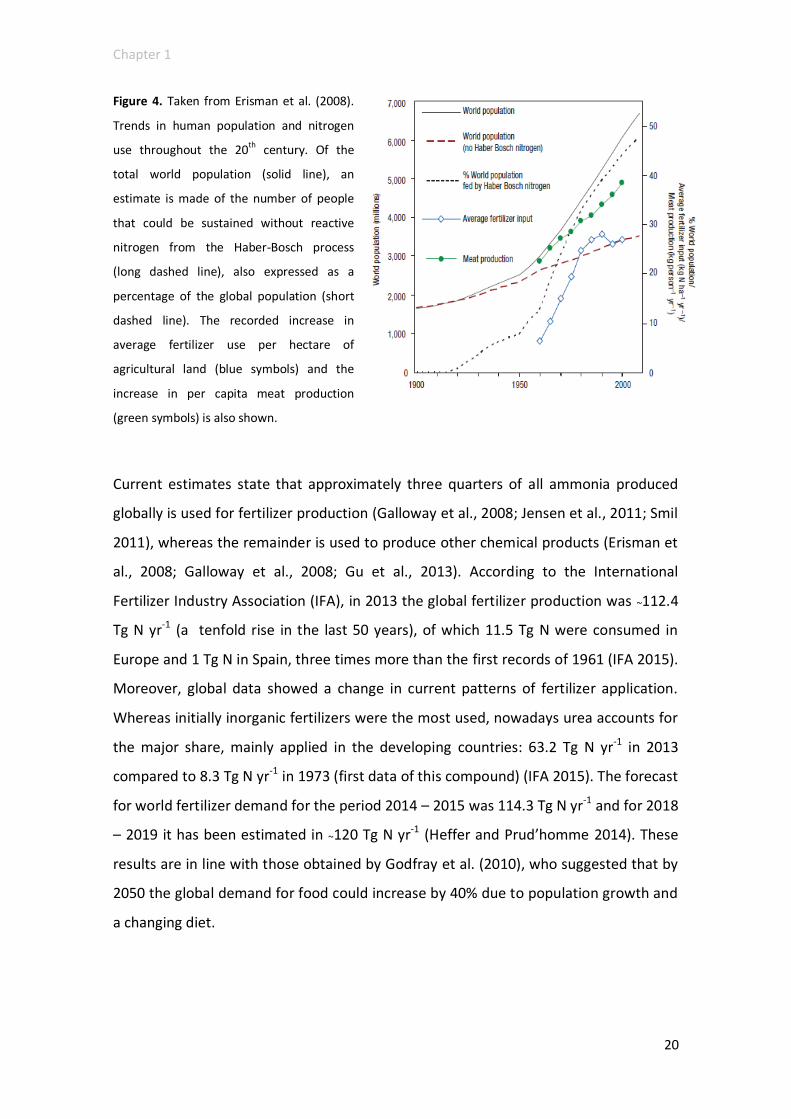
Haber-Bosch process. Erisman et al. (2008) showed interesting data on the extent of
this change (Figure 4). They estimated that in the last century the number of humans
supported per hectare of arable land had increased from 1.9 to 4.3, possibly because
of the Haber-Bosch process. Moreover, they suggested that, for the same period,
approximately 27% of the world’s population could survive (around 4 billion people
born) thanks to the use of synthetic fertilizers; in 2008, without the Haber-Bosch
process around half of humanity would not be alive. In fact, Aneja et al. (2008)
affirmed that the world’s population growth, from 1.5 billion at the beginning of the
20th century to 7.4 billion today would not have been possible without this process to
produce nitrogen fertilizer to enhance crop growth and maximize agricultural
production on limited land areas.
Chapter 1
20
Figure 4. Taken from Erisman et al. (2008).
Trends in human population and nitrogen
use throughout the 20th century. Of the
total world population (solid line), an
estimate is made of the number of people
that could be sustained without reactive
nitrogen from the Haber-Bosch process
(long dashed line), also expressed as a
percentage of the global population (short
dashed line). The recorded increase in
average fertilizer use per hectare of
agricultural land (blue symbols) and the
increase in per capita meat production
(green symbols) is also shown.
Current estimates state that approximately three quarters of all ammonia produced
globally is used for fertilizer production (Galloway et al., 2008; Jensen et al., 2011; Smil
2011), whereas the remainder is used to produce other chemical products (Erisman et
al., 2008; Galloway et al., 2008; Gu et al., 2013). According to the International
Fertilizer Industry Association (IFA), in 2013 the global fertilizer production was ~112.4
Tg N yr-1 (a tenfold rise in the last 50 years), of which 11.5 Tg N were consumed in
Europe and 1 Tg N in Spain, three times more than the first records of 1961 (IFA 2015).
Moreover, global data showed a change in current patterns of fertilizer application.
Whereas initially inorganic fertilizers were the most used, nowadays urea accounts for
the major share, mainly applied in the developing countries: 63.2 Tg N yr-1 in 2013
compared to 8.3 Tg N yr-1 in 1973 (first data of this compound) (IFA 2015). The forecast
for world fertilizer demand for the period 2014 – 2015 was 114.3 Tg N yr-1 and for 2018
– 2019 it has been estimated in ~120 Tg N yr-1 (Heffer and Prud’homme 2014). These
results are in line with those obtained by Godfray et al. (2010), who suggested that by
2050 the global demand for food could increase by 40% due to population growth and
a changing diet.
General Introduction
21
At present the nitrogen-use efficiency (NUE) in agriculture (the amount of nitrogen
retrieved in food produced per unit of nitrogen applied) is extremely low (Figure 5).
Volatilization, leaching, soil erosion and denitrification claim most of the applied
nutrient, and current field recoveries are rarely above 50% (Smil 2011). In Europe, in
2000, the NUE was on average 44% (Oenema et al., 2009), whereas in China a recent
report has showed that a massive 37-fold increase in N fertilizer rates from 1961 to
2009 has achieved only a 3.4-fold increase in yield (Zhang et al., 2012a). Interestingly
however, in the developed world the vast majority of crop production is currently
destined to feed livestock to provide the protein intake (Smil 2002; Godfray et al.,
2010). In Europe it has been estimated that only 15 – 20% of nitrogen in crops
harvested or imported into the EU is used directly to feed people, whilst the remaining
80 – 85% provides feeds to support livestock (Leip et al., 2011; Sutton et al., 2011a and
2011b). These data are striking if compared with global estimates which suggest that
one third of cereal production is fed to animals (Godfray et al., 2010). As a result
Sutton et al. (2011b) indicated that European nitrogen is not an issue of food security,
but one of luxury consumption. In fact, it has been stated that it is the human use of
livestock and the consequent need for large amount of animal feed the dominant
driver altering the nitrogen cycle in Europe (Sutton et al., 2011b). If proteins were
obtained from plants, only 30% of the crops growing currently would be needed, thus
reducing the fertilizer inputs and associated pollution by 70% (Sutton 2011a).
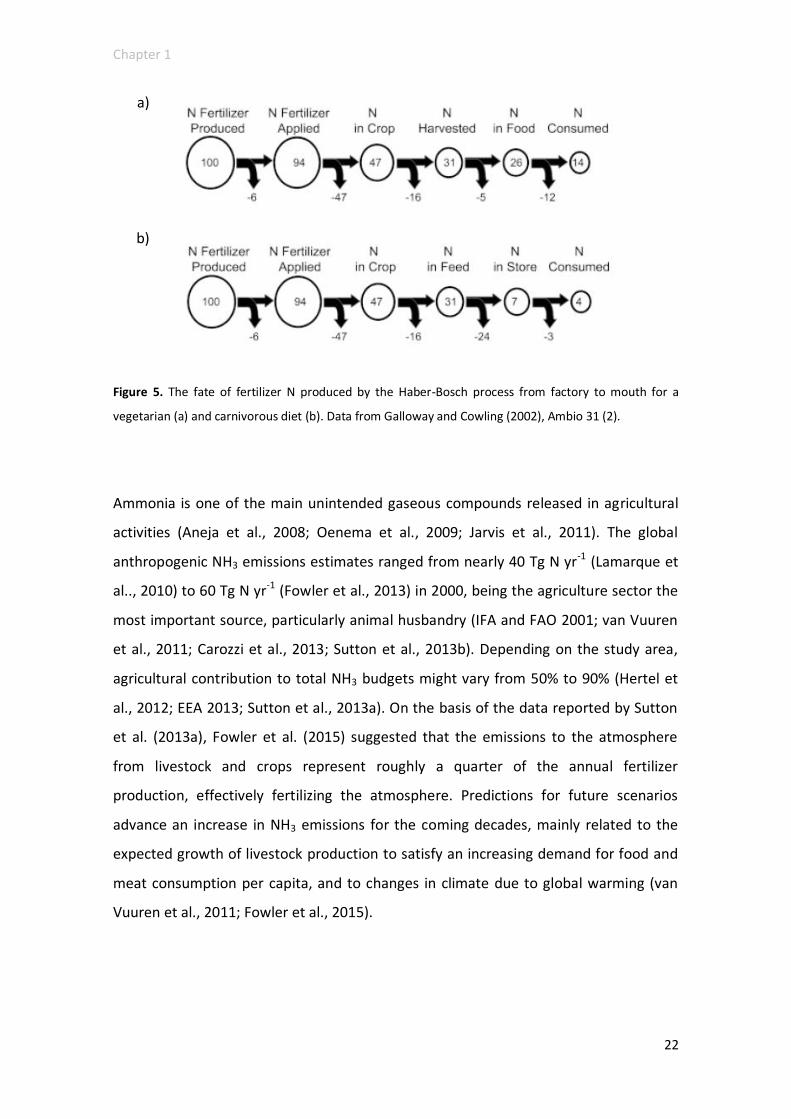
In this context, inherent inefficiencies of animal metabolism have contributed to the
increase in N losses to the environment (Figure 5). Considering the entire food
production-processing–consumption chain, Smil (2011) and Sutton et al. (2013a)
agreed in estimating that on average over 80% of N consumed ends up lost to the
environment, wasting the energy used to prepare it, and causing pollution via the
emissions of the greenhouse gas nitrous oxide (N2O) and ammonia (NH3) to the
atmosphere, plus losses of nitrate (NO3-) and organic N compounds to water.
Chapter 1
22
a)
b)
Figure 5. The fate of fertilizer N produced by the Haber-Bosch process from factory to mouth for a
vegetarian (a) and carnivorous diet (b). Data from Galloway and Cowling (2002), Ambio 31 (2).
Ammonia is one of the main unintended gaseous compounds released in agricultural
activities (Aneja et al., 2008; Oenema et al., 2009; Jarvis et al., 2011). The global
anthropogenic NH3 emissions estimates ranged from nearly 40 Tg N yr-1 (Lamarque et
al.., 2010) to 60 Tg N yr-1 (Fowler et al., 2013) in 2000, being the agriculture sector the
most important source, particularly animal husbandry (IFA and FAO 2001; van Vuuren
et al., 2011; Carozzi et al., 2013; Sutton et al., 2013b). Depending on the study area,
agricultural contribution to total NH3 budgets might vary from 50% to 90% (Hertel et
al., 2012; EEA 2013; Sutton et al., 2013a). On the basis of the data reported by Sutton
et al. (2013a), Fowler et al. (2015) suggested that the emissions to the atmosphere
from livestock and crops represent roughly a quarter of the annual fertilizer
production, effectively fertilizing the atmosphere. Predictions for future scenarios
advance an increase in NH3 emissions for the coming decades, mainly related to the
expected growth of livestock production to satisfy an increasing demand for food and
meat consumption per capita, and to changes in climate due to global warming (van
Vuuren et al., 2011; Fowler et al., 2015).

General Introduction
23
Even though NH3 emissions in the EU-27 decreased by 28 % between 1990 and 2011
(EEA 2013), data published by the European Environment Agency estimated that
roughly 4.3 Tg of NH3 were emitted in 2012 in Europe (EEA-33 country group), of which
93.5% was released from agricultural activities (EEA-European Environment Agency,
2015). Animal production and volatilization from livestock excreta (livestock housing,
manure storage, urine and dung deposition in grazed pastures or after manure
spreading into land) accounts for the major share, which was estimated for 2011 in
three quarters of agricultural ammonia emissions, whereas agricultural soils accounted
for the rest (Eurostat 2013). Inventories from China (Zhou et al., 2015) and North
America (Bittman and Mikkelsen, 2009) also found that livestock was the dominant
contributing source of NH3 emission, proving this is a global scale problem.
While NH3 is quantitatively the largest emission from agricultural operations, other
agricultural air pollutants are also of major environmental concern, including other
reactive nitrogen species such as nitrogen oxides (NOx) or nitrous oxide (N2O) (Oenema
et al., 2009; Jarvis et al., 2011).
Nitrous oxide is a potent greenhouse gas with a global warming potential
approximately 300 times greater than CO2 on a per molecule basis (Ehhalt and Prather
2001; Erisman et al., 2011). Generally, N2O emissions are strongly affected by nitrogen
availability in soil and are associated with denitrification conditions, which is an
important process occurring in agriculture (Oenema et al., 2009). According to data
compiled by Snyder et al. (2009) and Fowler et al. (2015), atmospheric concentrations
of N2O have risen from ~270 ppb during the pre-industrial era to 319 ppb in 2005.
Moreover, it is estimated that due to mankind activities emissions of this gas have
increased approximately 40-50% over pre-industrial levels. A recent survey quantified
the global natural N2O emissions from 10 to 12 Tg N yr-1, whereas the net
anthropogenic ones were considered currently about 5.3 Tg N yr-1 (Davidson and
Kanter 2014). Although several sources might contribute to this budget (Sutton et al.,
2011a; Davidson and Kanter 2014; Fowler et al., 2015), it is agriculture the sector that
accounts for the major share, mainly caused by the use of N fertilizers (Park et al.,
2012; Jamali et al., 2015). Future N2O emissions will thus depend on future agricultural
production, management practices and climate policy (van Vuuren et al., 2011).
Chapter 1
24
Another pathway for N loss in agricultural systems is nitrate leaching. Oenema et al.
(2009) suggested that in 2000 the Nr released as NO3- was roughly equal to that
emitted as NH3, highlighting the importance of this Nr income into the environment. In
fact, estimates for this year indicated that Europe is exporting 4.7 Tg N yr-1 to its seas
(Grizzeti et al., 2011). Nitrate leaching is not only an issue of concern in surface waters,
but also in groundwater and ultimately in coastal areas (Durand et al., 2011).
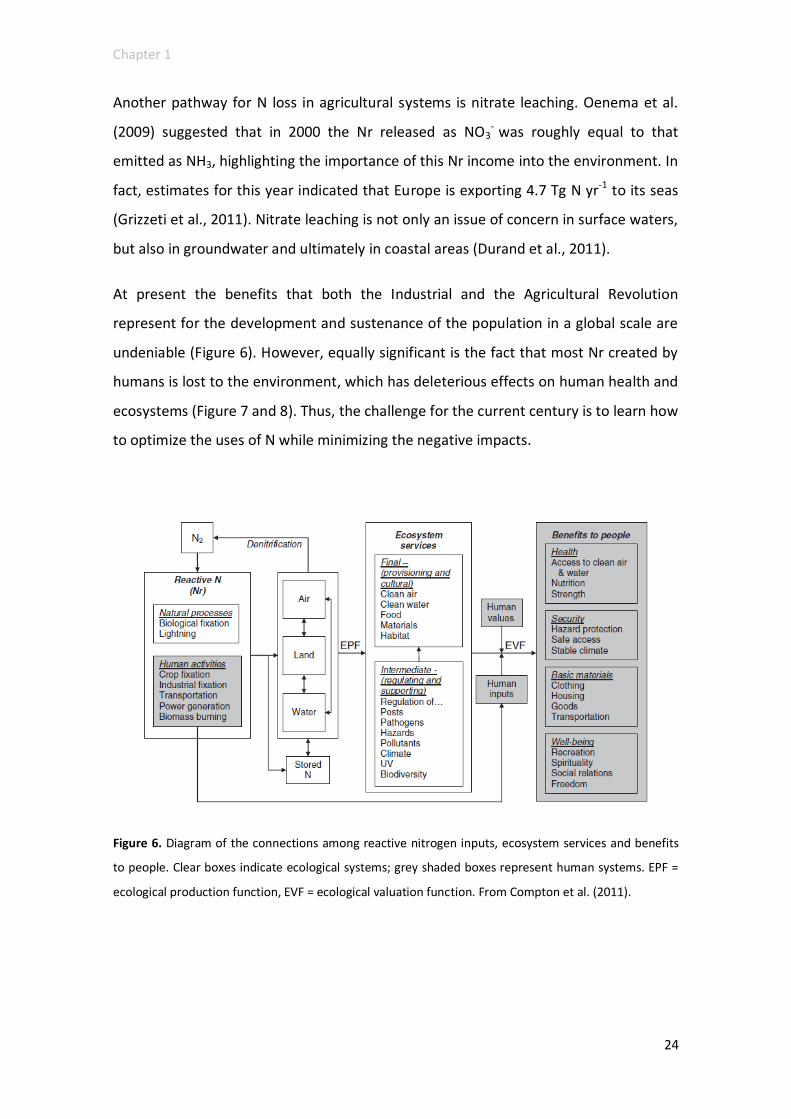
At present the benefits that both the Industrial and the Agricultural Revolution
represent for the development and sustenance of the population in a global scale are
undeniable (Figure 6). However, equally significant is the fact that most Nr created by
humans is lost to the environment, which has deleterious effects on human health and
ecosystems (Figure 7 and 8). Thus, the challenge for the current century is to learn how
to optimize the uses of N while minimizing the negative impacts.
Figure 6. Diagram of the connections among reactive nitrogen inputs, ecosystem services and benefits
to people. Clear boxes indicate ecological systems; grey shaded boxes represent human systems. EPF =
ecological production function, EVF = ecological valuation function. From Compton et al. (2011).
General Introduction
25
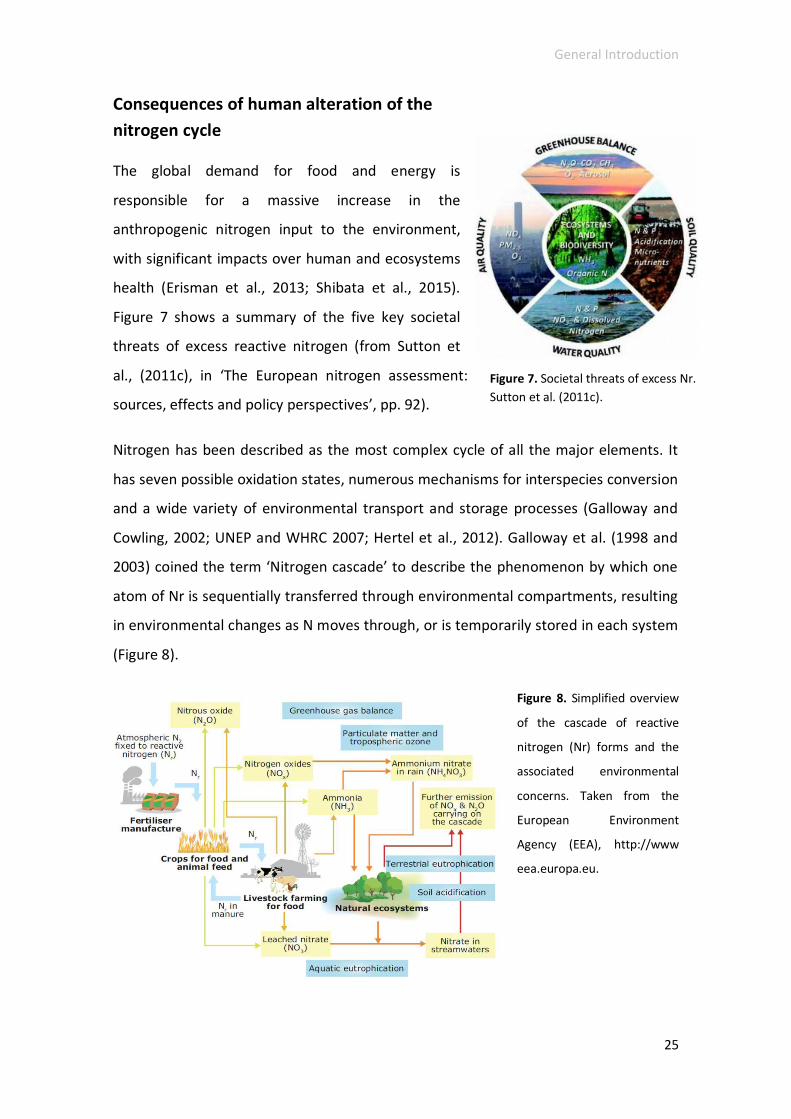
Consequences of human alteration of the
nitrogen cycle
The global demand for food and energy is
responsible for a massive increase in the
anthropogenic nitrogen input to the environment,
with significant impacts over human and ecosystems
health (Erisman et al., 2013; Shibata et al., 2015).
Figure 7 shows a summary of the five key societal
threats of excess reactive nitrogen (from Sutton et
al., (2011c), in ‘The European nitrogen assessment:
sources, effects and policy perspectives’, pp. 92).
Nitrogen has been described as the most complex cycle of all the major elements. It
has seven possible oxidation states, numerous mechanisms for interspecies conversion
and a wide variety of environmental transport and storage processes (Galloway and
Cowling, 2002; UNEP and WHRC 2007; Hertel et al., 2012). Galloway et al. (1998 and
2003) coined the term ‘Nitrogen cascade’ to describe the phenomenon by which one
atom of Nr is sequentially transferred through environmental compartments, resulting
in environmental changes as N moves through, or is temporarily stored in each system
(Figure 8).
Figure 8. Simplified overview
of the cascade of reactive
nitrogen (Nr) forms and the
associated environmental
concerns. Taken from the
European Environment
Agency (EEA), http://www
eea.europa.eu.
Figure 7. Societal threats of excess Nr.
Sutton et al. (2011c).
Chapter 1
26
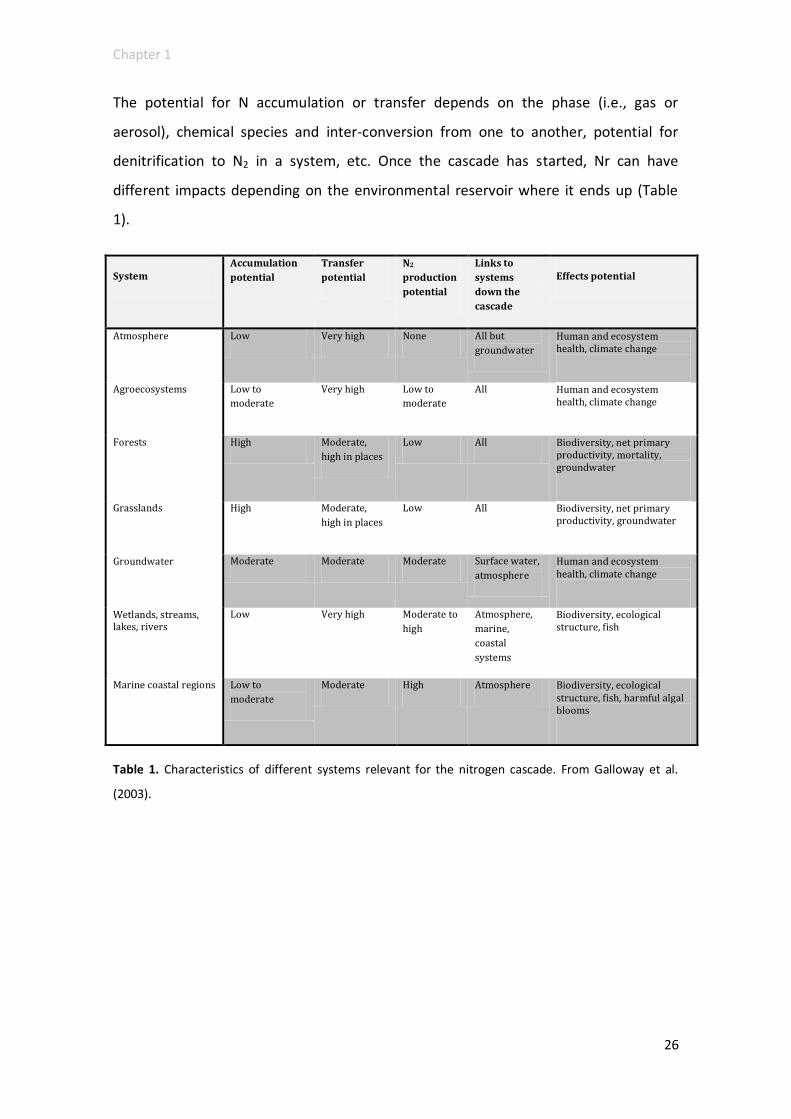
The potential for N accumulation or transfer depends on the phase (i.e., gas or
aerosol), chemical species and inter-conversion from one to another, potential for
denitrification to N2 in a system, etc. Once the cascade has started, Nr can have
different impacts depending on the environmental reservoir where it ends up (Table
1).
System
Accumulation
potential
Transfer
potential
N2
production
potential
Links to
systems
down the
cascade
Effects potential
Atmosphere Low Very high None All but
groundwater
Human and ecosystem health, climate change
Agroecosystems Low to
moderate
Very high Low to
moderate
All Human and ecosystem health, climate change
Forests High Moderate,
high in places
Low All Biodiversity, net primary productivity, mortality, groundwater
Grasslands High Moderate,
high in places
Low All Biodiversity, net primary productivity, groundwater
Groundwater
Moderate Moderate Moderate Surface water,
atmosphere
Human and ecosystem health, climate change
Wetlands, streams, lakes, rivers
Low Very high Moderate to
high
Atmosphere,
marine,
coastal
systems
Biodiversity, ecological structure, fish
Marine coastal regions Low to
moderate
Moderate High Atmosphere Biodiversity, ecological structure, fish, harmful algal blooms
Table 1. Characteristics of different systems relevant for the nitrogen cascade. From Galloway et al.
(2003).

General Introduction
27
Atmosphere
NOx are principally emitted to the atmosphere as nitric oxide (NO), although a small
fraction may be released as nitrogen dioxide (NO2) or be produced close to the point of
emission by means of the termomolecular reaction of NO with O2. However, under
most tropospheric conditions the dominant pathway by which NO is converted into
NO2 is via the reaction with O3 (Jenkin and Clemitshaw 2000). In sunlight NO2 photo-
dissociates to form NO and the very short-lived oxygen (O (3P)) radical. The latter will
again form O3 in reaction with free oxygen (O2) (Seinfeld and Pandis 2006). Moreover,
as a secondary air pollutant, O3 is also generated in photochemical reactions of volatile
organic compounds with NOx (Feng et al., 2015a). Therefore, NOx emissions are closely
related to ozone production in the lower atmosphere, which is an important pollutant
in urban and rural areas and affects human health (e.g. coughs and asthma, short-term
reductions in lung function and chronic respiratory disease) and terrestrial ecosystems,
both crops and forests (e.g. damage of cell walls and membranes causing cell death
and reduction in photosynthesis rates, affecting crop yields and CO2 uptake) (The Royal
Society 2008; Alonso et al., 2014; Calvete-Sogo et al., 2014; Feng et al., 2015b).
HNO3 is a major secondary pollutant from oxidation of NOx in precipitation (Fowler et
al., 2009; Hertel et al., 2012). Along with SO2 emissions, which lead to the subsequent
formation of sulphuric acid (H2SO4) under wet conditions, nitric acid is one of the most
important compounds associated with acid rain. This phenomenon has been
extensively studied not only owing to its effects on both aquatic and terrestrial
ecosystems but also on materials and patrimony (Schindler, 1988; Likens et al., 1996;
Larssen 2000 and 2006; Menz and Seip 2004; Compton et al., 2011). Although initial
efforts were mainly focused on SO2 emissions, the good trends and future perspectives
for this pollutant (EEA 2013) have turned the attention to N in regards to acid rain
issues (Moldanová et al., 2011).
In the atmosphere nitric acid reacts with ammonia to form new aerosol particles of
ammonium nitrate (NH4NO3) (Hertel et al., 2012). Changes in temperature and/or
humidity will lead to changes in the partitioning between the gas and aerosol phases,
with increasing humidity and decreasing temperature moving the partitioning towards

Chapter 1
28
the aerosol phase compounds. Ammonia also reacts with aerosol and other acid gases
such as H2SO4 and HCl to form ammonium-containing particles (Hertel et al., 2012).
Grantz et al. (2003) highlighted some of the ecological effects that the particulate
matter (PM) might cause, such as decrease of the photon flux reaching the
photosynthetic tissues, leaf surface injuries, or uptake of aerosol materials. Moreover,
PM may reduce radiation interception by plant canopies, which is directly associated
to climate change. Other authors have also investigated interactions of PM with
climate, suggesting that aerosol can provide substantial cooling both directly, due to
high reflectivity, and indirectly, by mediating cloud formation (Adams et al., 2001).
Regarding human health, PM has been considered the most significant contributor to
adverse health effects from air pollution (Erisman et al., 2013), and has been directly
associated with pulmonary diseases, cardiovascular mortality and morbidity, cancer,
atherosclerosis, diabetes, allergies, and so on (Townsend et al., 2003; WHO 2013). In
addition, it has been proved that ecological changes associated with nutrient
enrichment (not only PM) often exacerbate infections and diseases caused by
generalist parasites, including the West Nile virus, malaria and cholera (McKenzie et
al., 2007; Johnson et al., 2010).
Despite the fact that indirect impacts of NOx through O3 and PM formation are of vital
importance, the effects of direct exposure to these gases have also been documented
(Manninen et al., 2013; WHO 2013; Molnar et al., 2015), and should not be
disregarded. Equally, direct effects derived from ammonia gas exposure have been
observed in terrestrial ecosystems. The toxic action of NH3/NH4 has been related to
depletion of carbon supply, alterations in growth and productivity, deficiencies in
mineral cations, photosynthesis impairment, oxidative stress, shifts in the cellular pH,
etc. (Krupa 2003; Sheppard et al., 2011; Bittsánszky et al., 2015).
Nitrous oxide (N2O) is a powerful greenhouse gas, with a long atmospheric residence
time (minimum lifetime of about 20 years) and a global warming potential (GWP) 296
times higher than CO2 (Ehhalt et al., 2001). A positive forcing (more incoming energy
stays in the system) tends to warm the earth system, while a negative forcing (more
outgoing energy) tends to cool it (Erisman et al., 2011). The change in radiative forcing
(RF) due to increases in global atmospheric concentrations of N2O has been estimated

General Introduction
29
in +0.16 ± 0.02 W m-2 since the preindustrial era, and it is mainly attributed to human
activities (Forster et al., 2007). Therefore N2O emissions help anticipate damages of
climate change. Moreover, N2O has a strong ozone-depleting potential in the
stratosphere (Ehhalt et al., 2001; Forster et al., 2007). O3 depletion leads to UV
damages, such as skin cancer, cataracts, alteration of physiological and development
processes of plants, and changes of phytoplankton productivity in marine ecosystems
(UNEP 2010; US-EPA 2015).
Aquatic ecosystems
Reactive nitrogen can reach aquatic ecosystems through a number of ways:
atmospheric deposition (wet and dry) of both reduced and oxidized N species on the
catchment or directly on the water body; leaching, mainly in the form of nitrate (NO3-),
from diffuse sources (e.g. fertilized and manure application); runoff and sediment
erosion of N rich soils; and nitrogen fixation (Billen et al., 2011; Grizzeti et al., 2011;
Kopáček et al., 2013). The deposition and runoff processes principally affect surface
waters whereas leaching mostly impacts groundwater reservoirs.
Atmospheric deposition of acid compounds such as HNO3 can increase not only the
concentration of NO3-, but also the concentration of hydrogen ions in freshwater
ecosystems without much acid-neutralizing capacity (with low or moderate alkalinity),
resulting in acidification (Schindler 1988; Menz and Seip 2004). NH3/NH4 inputs can
also contribute to the acidification process since ammonium nitrification produces H+
ions (Vitousek et al., 1997). A decrease in the pH of water may have several
consequences on freshwater plants and animals, such as photosynthesis impairment in
planktonic and attached algae, increase of aluminium (and other metals)
bioaccumulation, decline of species diversity and loss of sensitive ones, respiratory and
metabolic disturbances in molluscs, insects, crustaceans, fish and amphibians, etc.
(Camargo et al., 2006). Nitrate pollution of waters also poses a recognized risk to
human health (van Grinsven et al., 2006; WHO 2011). The WHO standard for drinking
water is 50 mg NO3- l-1 for short-term exposure, and 3 mg NO3
- l-1 for chronic effects
(WHO 2011). In 1999 a total of 202 sites in 10 regions of Europe were studied to
predict future scenarios of water acidification. Now, these forecasts have been

Chapter 1
30
compared with measurements of 2010, showing water recovery from acidification
from initial data (Heliwell et al., 2014).
Eutrophication or overenrichment by nutrients is a key water quality issue triggered by
increasing nitrogen (N) and phosphorus (P) levels (Nixon et al., 1995; Grizzetti et al.,
2011; Lindim et al., 2015). Elevated concentrations of N compounds in waters
stimulate the development, maintenance and proliferation of primary producers
(phytoplankton, benthic algae, macrophytes), contributing to eutrophication (Camargo
et al., 2006). This phenomenon is highly related to dissolved oxygen in waters: while
increasing nutrients availability, primary producers use dissolved oxygen to transform
them into organic matter, which leads to oxygen depletion and hypoxic and anoxic
environments (Diaz et al., 2001). Although this problem has been observed in all kinds
of water ecosystems (Johnson et al., 2007; Azevedo et al., 2015; Cruz et al., 2015),
coastal eutrophication has emerged as a global issue of serious concern (Nixon et al.,
1995; Higashi et al., 2012; van Wijnen et al., 2015). Selman et al. (2008) performed a
global assessment of coastal areas suffering this problem. They identified 415
eutrophic and hypoxic coastal systems worldwide, with 169 documented hypoxic
areas, 223 areas of concern and 13 in recovery (Figure 9). These eutrophic, hypoxic and
anoxic waters result in several negative consequences, such as changes in species
composition and reduction in species diversity of zooplankton, marine macroalgae,
macrophytes and benthic invertebrates and fish; increased incidence of fish kills; loss
of fisheries; increases in gelatinous zooplankton; reduction in health and size of marine
coral populations, shifts to bloom-forming algal species that might be toxic or inedible;
and alteration of food webs (Diaz et al., 2001; Camargo et al., 2006; Grizzeti et al.,
2011). In Europe it is particularly noteworthy the case of the Baltic Sea, which is one of
the most endangered areas due to eutrophication (UNEP and WHRC 2007).

General Introduction
31
Figure 9. World eutrophic and hypoxic coastal areas (From Selman et al., 2008).
Terrestrial ecosystems
In terrestrial ecosystems atmospheric deposition is the main pathway of additional
anthropogenic Nr. The salts, aerosols and nitrogenous gases return to the earth’s
surface via wet or dry deposition and fertilize not only aquatic reservoirs and
agricultural lands, but also natural ecosystems. In the next paragraphs the impacts of
enhanced N deposition on terrestrial ecosystem processes and species richness are
described, which are summarized in Figure 10.
When Nr reaches the earth’s surface, it partially builds up in soils, which alters the
natural dynamics. It is well known that growth and reproduction of photosynthetic
biota as well as large scale ecosystem primary production are often limited by supplies
of nitrogen or phosphorus (Elser et al., 2007). Increase of N availability above a certain
level of primary productivity turns into biodiversity decline (Bobbink et al., 1998 and
2010; Suding et al., 2005; Clark and Tilman 2008; Lovett et al., 2009), competitive
exclusion of mesotrophic and oligotrophic species towards nitrophytic (van Dobben
and de Vries 2010; Pinho et al., 2012) and exotic ones (Allen et al., 2006), and
susceptibility to secondary stress and disturbance (Fenn et al., 2003; Allen et al., 2006;
Dise et al., 2011). Moreover, N fertilization reduces the plant’s dependence on
mycorrhizae for scavenging Nr from the soil, affecting productivity and species richness

Chapter 1
32
of the fungal communities (Egerton-Warburton et al., 2001; Treseder 2004). If N
eutrophication continues, the available N will exceed the total biological demand and
the ecosystem will end up nitrogen saturated (Aber et al., 1989; Fenn et al., 1996).
Diagnostic symptoms of N saturation are the accumulation of mineral nitrogen in soils
(generally as NH4) and leaching of nitrate below the rooting zone (Aber et al., 1989;
Gundersen et al., 1998). At this point the aforementioned impacts maximize. In order
to avoid such effects, critical loads and levels have been defined to characterize the
vulnerability of ecosystems in terms of a deposition or concentration (Bowman et al.,
2006; Bobbink et al., 2010; Clair et al., 2014; Fenn et al., 2014).
Equally to leakage from agricultural lands, nitrate leaching from forests and natural
ecosystems saturated in N usually gets into the water streams and groundwater,
resulting in the acidification and eutrophication as explained in the previous section. It
is noteworthy that mobilization of oxidized N through soils is generally accompanied
by basic cation (Mg, Ca) losses, which eventually originate soil acidification and result
in unbalanced systems (Fields 2004; Menz and Seip 2004). Depending on the buffering
capacity of each soil, acidification signs will take short periods or several decades to be
noted (Dise et al., 2011). Reduced N compounds, both applied as fertilizers in
agricultural lands or deposited from the atmosphere, also contribute to soil
acidification through nitrification and root exchange of NH4 for H+ (Bolan et al., 1991;
Erisman et al., 2007). Thus, soil acidification is a key issue in crop lands. By way of
example, in China about 90% of crop lands have suffered pH decline. Moreover,
approximately 40% has an average pH lower than 6.5, 12.4% is lower than 5.5 and
1.3% is lower than 4.4 (Norse and Ju, 2015, and references therein). As soil acidity
increases and pH declines different processes are affected. One of the major
consequences is the change in heavy metal dynamics, resulting in increasing
mobilization and bioavailability of these elements and shifts in speciation. Increases in
Al and Mn concentrations might result toxic to plant growth, whereas it has been
observed that Cd is the major heavy metal reaching the food chain through agriculture
(Bolan et al., 2003). Moreover, alteration of soil pH may contribute to changes in
species composition, being acid-resistant species the ones gradually promoted whilst
species adapted to intermediate - high pH disappeared (Bobbink and Hicks 2014).
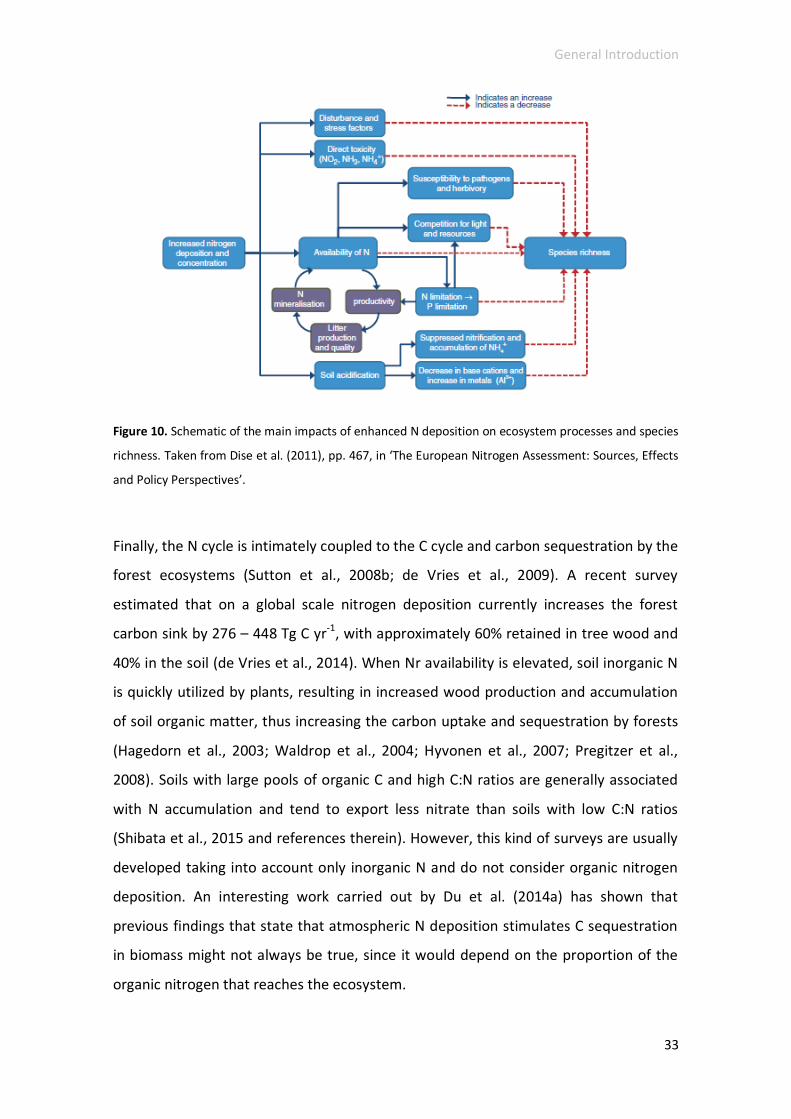
General Introduction
33
Figure 10. Schematic of the main impacts of enhanced N deposition on ecosystem processes and species
richness. Taken from Dise et al. (2011), pp. 467, in ‘The European Nitrogen Assessment: Sources, Effects
and Policy Perspectives’.
Finally, the N cycle is intimately coupled to the C cycle and carbon sequestration by the
forest ecosystems (Sutton et al., 2008b; de Vries et al., 2009). A recent survey
estimated that on a global scale nitrogen deposition currently increases the forest
carbon sink by 276 – 448 Tg C yr-1, with approximately 60% retained in tree wood and
40% in the soil (de Vries et al., 2014). When Nr availability is elevated, soil inorganic N
is quickly utilized by plants, resulting in increased wood production and accumulation
of soil organic matter, thus increasing the carbon uptake and sequestration by forests
(Hagedorn et al., 2003; Waldrop et al., 2004; Hyvonen et al., 2007; Pregitzer et al.,
2008). Soils with large pools of organic C and high C:N ratios are generally associated
with N accumulation and tend to export less nitrate than soils with low C:N ratios
(Shibata et al., 2015 and references therein). However, this kind of surveys are usually
developed taking into account only inorganic N and do not consider organic nitrogen
deposition. An interesting work carried out by Du et al. (2014a) has shown that
previous findings that state that atmospheric N deposition stimulates C sequestration
in biomass might not always be true, since it would depend on the proportion of the
organic nitrogen that reaches the ecosystem.

Chapter 1
34
The economics of nitrogen
Even though the unintended consequences of the N cycle alteration have been widely
studied, at present there is great uncertainty about the economic cost of the
environmental and human damages. A recent survey carried out by Norse and Ju
(2015) showed that the environmental impacts related to food security might account
for up to 7 – 10% of China’s agricultural gross product and 2% of gross national
income. In the United States, Compton et al. (2011) evaluated the costs of N-related
impacts using the metric of cost per unit of N following data published in previous
surveys. They include an extensive and disaggregated assessment of costs associated
to the main N-induced problems, being human health costs linked to NOx pollution
($23.07 kg-1 N), coastal eutrophication ($6.38 kg-1 N) and fisheries decline due to N
loading and eutrophication ($56.00 kg-1 N) the most substantial ones.
In Europe the negative effects of human N fixation have been estimated to be 70 – 320
billion € yr-1, equivalent to 150 – 750 € per capita. The 75% of this budget is related to
air pollution effects, whereas considering receptors impacts, effects on human health
involve the greatest costs (60%). This cost constitutes 1 – 4% of the European average
income (Sutton et al., 2011b; Brink et al., 2011). On the basis of cost per kg of N
emitted, this survey highlights that the highest costs were associated with the effects
of NOx on human health (10-30 € kg-1 N), followed by the Nr losses to aquatic
ecosystems (5-20€ kg-1) and the effects of ammonia (PM) on human health (0-4€ kg-1).
The lower costs were associated with the effects of nitrates in drinking water on
human health (5-20€ kg-1) and the effects of N2O on human health by depleting
stratospheric ozone (1-3€ kg-1) (Sutton et al., 2011b; Brink et al., 2011). Figure 11
shows the estimated cost of nitrogen pollution damage on human health, ecosystems
or climate, caused by different Nr species in the European Union (Sutton et al., 2011a).
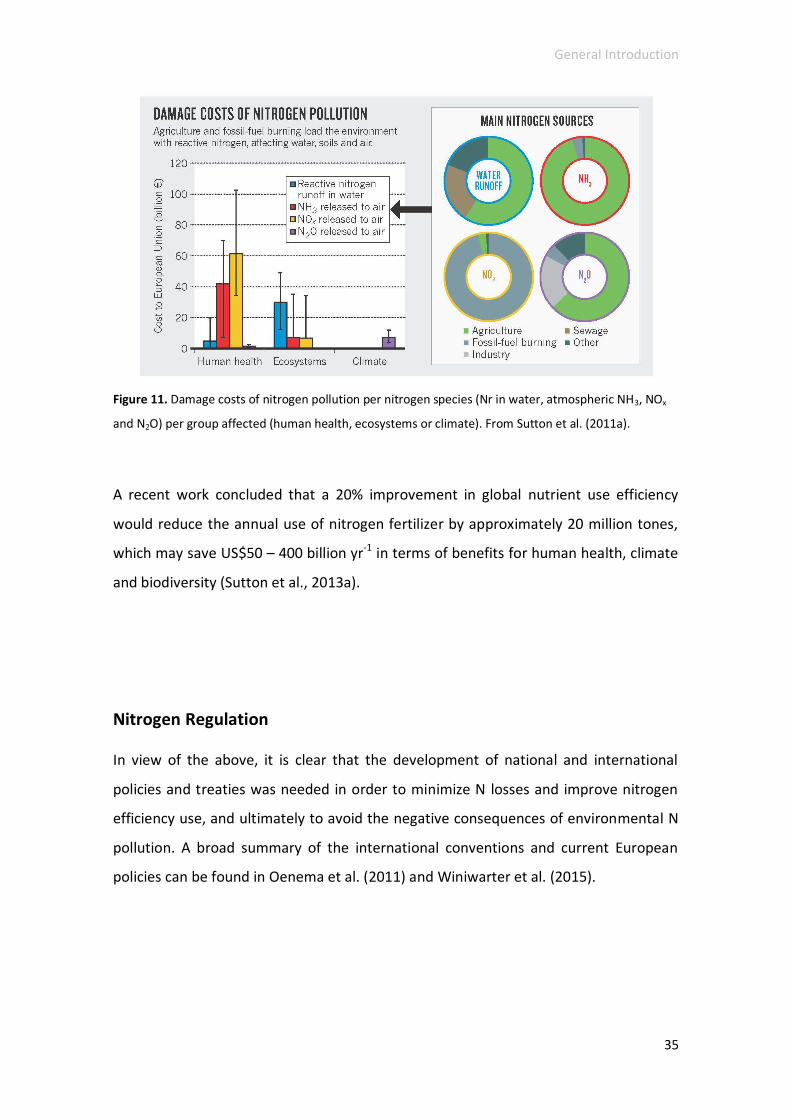
General Introduction
35
Figure 11. Damage costs of nitrogen pollution per nitrogen species (Nr in water, atmospheric NH3, NOx
and N2O) per group affected (human health, ecosystems or climate). From Sutton et al. (2011a).
A recent work concluded that a 20% improvement in global nutrient use efficiency
would reduce the annual use of nitrogen fertilizer by approximately 20 million tones,
which may save US$50 – 400 billion yr-1 in terms of benefits for human health, climate
and biodiversity (Sutton et al., 2013a).
Nitrogen Regulation
In view of the above, it is clear that the development of national and international
policies and treaties was needed in order to minimize N losses and improve nitrogen
efficiency use, and ultimately to avoid the negative consequences of environmental N
pollution. A broad summary of the international conventions and current European
policies can be found in Oenema et al. (2011) and Winiwarter et al. (2015).

Chapter 1
36
Considering the scope of the present thesis, three legislative instruments deserve
special attention:
- The Gothenburg protocol (1999) of the United Nations Economic Commission
for Europe’s (UNECE) Convention on Long-Range Transboundary Air Pollution
(LRTAP Convention; CLRTAP) to abate acidification, eutrophication and ground-
level ozone.
- The Directive 2001/81/EC (NECD) of the European parliament and of the
council of 23 October 2001 on national emission ceilings (NECD) for certain
atmospheric pollutants.
- The Directive 2010/75/EU of the European Parliament and of the Council on
industrial emissions (integrated pollution prevention and control).
Whereas the Directive 2010/75/EU aims at preventing or minimizing pollution
(including N pollution) of air, water or land from various industrial sources, both the
Gothenburg protocol and the NEC Directive set national emission ceilings for SO2, NOx,
volatil organic compounds (VOCs) and NH3 for each country to be met by 2010 (and
now by 2020 according to recent amendments).The ceilings proposed in the
Gothenburg protocol for the EU member states are generally either slightly less strict
than the ones specified in the NECD or the same. The aim of limiting the emission of
these pollutants is to protect the environment and human health against risks of
adverse effects from acidification, eutrophication and ground-level ozone. To achieve
this main long-term objective the directive proposes to avoid the exceedance of critical
levels (CLE) and loads (CLO) (NEC Directive 2001/81/EC).
At this point it is important to remark that by 2010, only three Member States, Finland,
Denmark and Spain, did not met their emission ceiling for NH3. Moreover, although on
average a decrease of ~30% in agricultural ammonia emissions across the EU-27 was
found between 1990 and 2010, in Spain an increase of 15% was registered for that
period, mainly due to increasing numbers of cattle, swine and poultry (Eurostat 2012).
With regard to NOx, by 2010 Spain also failed to comply with its emission ceiling (EEA
2014b). Between 1990 and 2011, a decrease of 48% in the EU-27 NOx emissions was

General Introduction
37
observed (44% in the EU-33). However, contrary to the general pattern, in 2011 Spain
increased its NOx emissions ~4% over 2010, accounting for more than 10% of the total
share (EEA 2013). What is more, according to the NEC Directive status report 2013
(EEA 2014b), in 2011 and 2012 the data indicated that Spain continued exceeding both
its NOx and NH3 ceilings.
The Critical Load is defined as a quantitative estimate of deposition of one or more
pollutants below which significant harmful effects on specified elements of the
environment do not occur according to present knowledge. Whereas the Critical Level
for air concentration of a pollutant gas is defined as the concentration in the
atmosphere above which direct adverse effects on receptors may occur according to
present knowledge (Cape et al., 2009). Therefore, the CLO refers to the quantity of
pollutant deposited from the air to the ground, whilst the CLE is the gaseous
concentration of a pollutant in the air. These thresholds are continuously revised and
updated according to new scientific evidences, and constitute an important tool for
policy makers to evaluate the progress and future necessities to ensure environment
and human health protection.
With the aim of meeting the requirements established in those regulations and avoid
N export to the environment, specific actions in both the energy and food sectors have
been developed with successful outcomes (Vestreng et al., 2009; Carozzi et al., 2013;
van der Heyden et al., 2015; de Vries et al., 2015; Vedrenne et al., 2015). Bittman et al.
(2014) published a comprehensive and interesting guidance which compiles multiple
options for ammonia mitigation, whereas Bluestein et al. (2008) gathered various
options for reducing NOx emissions. Sutton et al. (2013a) suggested key actions to
produce more food and energy with less pollution: the key actions for agriculture were
mainly related to the improvement of nutrient use efficiency in both crop and animal
production; the key actions for transport and industry implied low-emission
combustion and energy efficient systems (including renewable sources) and the
development of NOx capture and utilization technology; finally, the key actions for
societal consumption deal with energy and transport saving patterns and lowering the
individual consumption of animal protein.
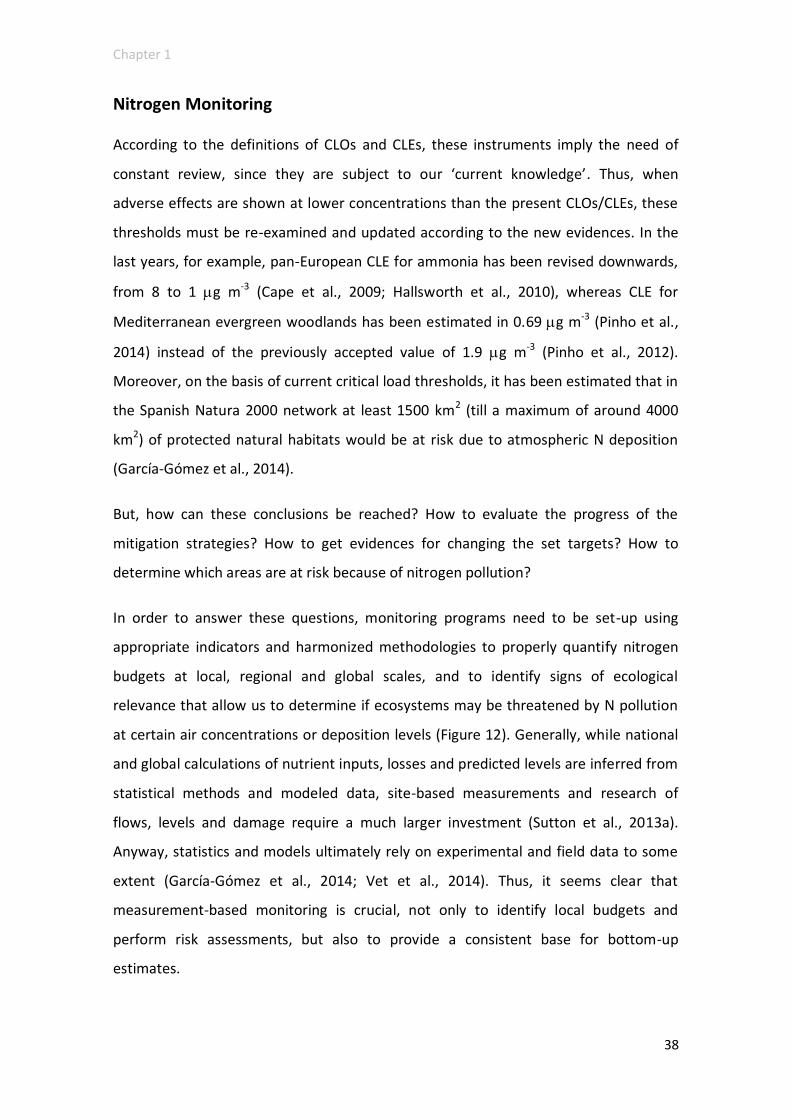
Chapter 1
38
Nitrogen Monitoring
According to the definitions of CLOs and CLEs, these instruments imply the need of
constant review, since they are subject to our ‘current knowledge’. Thus, when
adverse effects are shown at lower concentrations than the present CLOs/CLEs, these
thresholds must be re-examined and updated according to the new evidences. In the
last years, for example, pan-European CLE for ammonia has been revised downwards,
from 8 to 1 g m-3 (Cape et al., 2009; Hallsworth et al., 2010), whereas CLE for
Mediterranean evergreen woodlands has been estimated in 0.69 g m-3 (Pinho et al.,
2014) instead of the previously accepted value of 1.9 g m-3 (Pinho et al., 2012).
Moreover, on the basis of current critical load thresholds, it has been estimated that in
the Spanish Natura 2000 network at least 1500 km2 (till a maximum of around 4000
km2) of protected natural habitats would be at risk due to atmospheric N deposition
(García-Gómez et al., 2014).
But, how can these conclusions be reached? How to evaluate the progress of the
mitigation strategies? How to get evidences for changing the set targets? How to
determine which areas are at risk because of nitrogen pollution?
In order to answer these questions, monitoring programs need to be set-up using
appropriate indicators and harmonized methodologies to properly quantify nitrogen
budgets at local, regional and global scales, and to identify signs of ecological
relevance that allow us to determine if ecosystems may be threatened by N pollution
at certain air concentrations or deposition levels (Figure 12). Generally, while national
and global calculations of nutrient inputs, losses and predicted levels are inferred from
statistical methods and modeled data, site-based measurements and research of
flows, levels and damage require a much larger investment (Sutton et al., 2013a).
Anyway, statistics and models ultimately rely on experimental and field data to some
extent (García-Gómez et al., 2014; Vet et al., 2014). Thus, it seems clear that
measurement-based monitoring is crucial, not only to identify local budgets and
perform risk assessments, but also to provide a consistent base for bottom-up
estimates.
General Introduction
39
Figure 12. Simple representation of the intended working of governmental policy, from Oenema et al.,
(2011), pp 65, in ‘The European Nitrogen Assessment: sources, effects and policy perspectives’.
Monitoring sites
Atmospheric deposition is one of the key mechanisms in the causal chain between the
emission of air pollutants and their effects in forest ecosystems. Therefore, the
implementation of monitoring sites to characterize and quantify N deposition budgets
is a powerful research approach to understand the ecosystems’ behaviour when they
are influenced by both natural and anthropogenic drivers.
Policy
Instruments
Change in humans'
behaviour
Humans' objectives
Societal objectives
Monitoring
Tool box
- Regulation
- Stimulation
- Persuasion
Competences
- Capability
- Ability
- Willingness
Chapter 1
40
The works published by Fenn et al. (2009) in North America and Clarke et al. (2010) in
Europe in the framework of the UNECE-CLRTAP compiled a complete list of available
methods to measure atmospheric nitrogen deposition inputs in terrestrial ecosystems.
These references provided methods and criteria to perform harmonized sampling,
assessment, monitoring and analysis of the effects of air pollution on forests.
On the basis of the aforementioned publications, some of these methods are
summarized below. Some of the surveys that used each methodology are shown in
brackets.
- Wet-only deposition: to measure deposition in precipitation, excluding dry
deposition. Consequently, in arid ecosystems the total deposition quantified
this way is usually underestimated (Figure 13b) (Balestrini et al., 2007;
Izquierdo and Àvila 2012).
- Bulk deposition: to measure deposition in precipitation. However, as the
sampler is continuously opened, varying amounts of dry deposition are also
collected. This method is simple, cheap, and low-maintenance, which is an
advantage over ‘wet deposition’ methods (Balestrini and Tagliaferri 2001;
Izquierdo and Àvila 2012; Araujo et al., 2015).
- Throughfall: to estimate deposition sampled beneath the forest canopy. It is
usually collected as bulk throughfall, where samplers are continuously opened
and the samples contain bulk + leached + dry deposition. It provides data on
nutrient solution fluxes to soil. The main shortcoming of this method is the
canopy and throughfall water interactions of nitrogen (Figure 13a) (Balestrini
and Tagliaferri 2001; Balestrini et al., 2007).
- Inferential: indirect method to calculate dry deposition fluxes. It requires
intensive data collection such as meteorology and frequent monitoring of
atmospheric concentrations of all major pollutants. The use of passive samplers
gives time-averaged atmospheric concentrations and can extend the number of
sites monitored (Schmitt et al., 2005; Flechard et al., 2011; Bytnerowicz et al.,
2015).
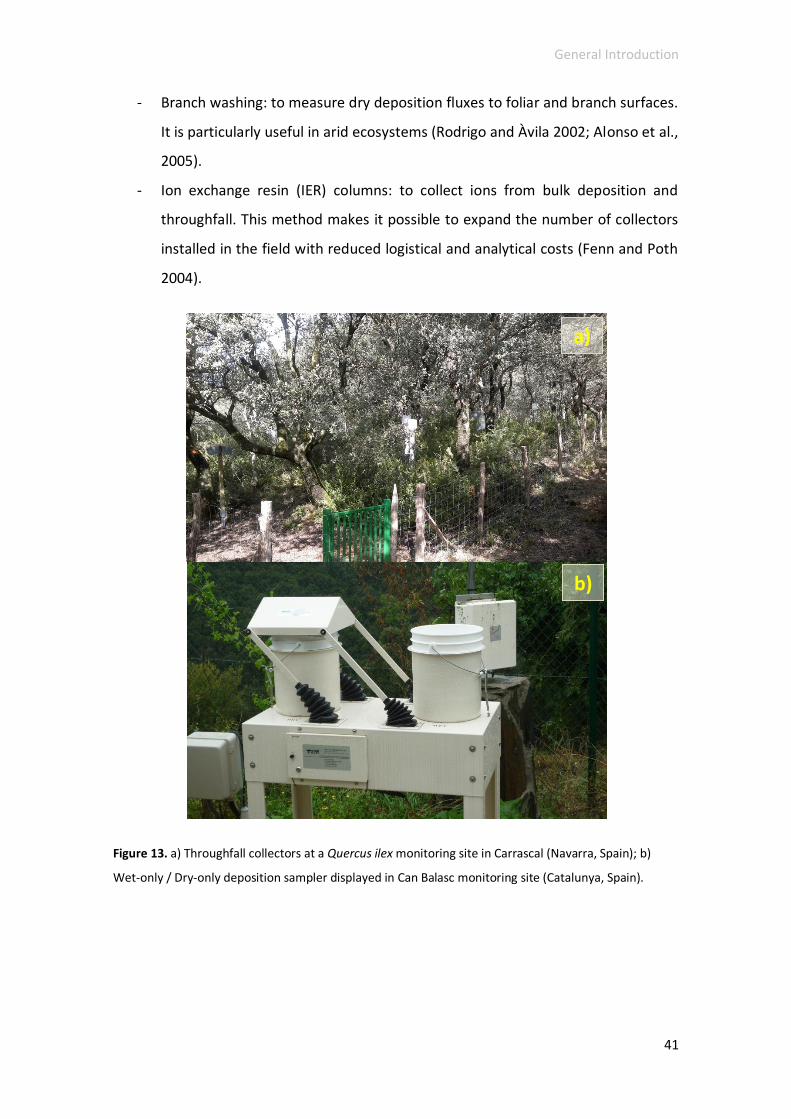
General Introduction
41
- Branch washing: to measure dry deposition fluxes to foliar and branch surfaces.
It is particularly useful in arid ecosystems (Rodrigo and Àvila 2002; Alonso et al.,
2005).
- Ion exchange resin (IER) columns: to collect ions from bulk deposition and
throughfall. This method makes it possible to expand the number of collectors
installed in the field with reduced logistical and analytical costs (Fenn and Poth
2004).
Figure 13. a) Throughfall collectors at a Quercus ilex monitoring site in Carrascal (Navarra, Spain); b)
Wet-only / Dry-only deposition sampler displayed in Can Balasc monitoring site (Catalunya, Spain).
a)
b)

Chapter 1
42
In the Iberian Peninsula, concretely in eastern Spain, nitrogen fluxes estimations have
been performed using wet-only, bulk deposition and throughfall collectors (Àvila et al.,
2010; Àvila and Rodà 2012). These surveys reported measured rates of 15-30 kg ha-1
yr-1 for total N (inorganic N), with almost 70% of this load accounting for dry
deposition. At a national level, and following the measurement-model approach,
García-Gómez et al. (2014) estimated total N (wet+dry) deposition in approximately 20
kg ha-1. To develop this approximation the authors utilized measured data from 25
monitoring sites belonging to the EMEP, ICP-Forests level II and Catalan networks. In
both the EMEP and the Catalan networks wet-only collectors were used, whereas bulk
and thoughfall samplers were selected in the ICP-Forests sites.
Although the monitoring sites can be established as individual measurement points to
carry out experimental research surveys at specific locations, this kind of installations
are frequently found being part of regional, national or international networks (Àvila et
al., 2010; Vet et al., 2014). In general, the plots in these networks utilize the same
methodology, which allows for an accurate comparison between sites, and are focused
on the study and characterization of the long-term patterns of the pollutants of
interest (Lajtha and Jones, 2013; Waldner et al., 2014). Data collected in these
networks enable defining spatial and temporal trends of dissolved ions, evaluating
chemical transport models, calculating critical loads and investigating atmospheric
processes, among others (Dentener et al., 2014).
Since the 1970s, continuous measurements of wet deposition have been made in both
national and international networks, such as the European Monitoring and Evaluation
Program (EMEP), or the United States National Atmospheric Deposition Program
(NADP).
Along with precipitation, these networks usually measure the concentration of the
following anions and cations: SO4-2, NO3
-, Cl-, H+, NH4+, Ca2+, Mg2+, Na+ and K+ (Dentener
et al., 2014). However, wet deposition budgets of nitrogen are usually incomplete
since the dissolved organic nitrogen (DON) measurements are missing (Cornell 2011).

General Introduction
43
In the early twenty-first century the scientific community highlighted the need to
include organic nitrogen (ON) in the study of N biogeochemistry (Cape et al., 2001;
Neff et al., 2002; Cornell et al., 2003). However, at present and after more than a
decade, the organic fraction continues being the less known and the less understood
component of the atmospheric N cycle (Jickells et al., 2013; Fowler et al., 2015). A
recent survey published by Walker et al. (2012) described some methodological
implications for samples preservation in what it seemed a previous research for
including ON measurements in the NADP network in the US. Cape et al. (2012) also
analyzed ON in samples from a European network in order to discern both spatial and
temporal patterns of this fraction over Europe. Surprisingly, to the authors’ knowledge,
these are the only works in the literature that show ON estimates in monitoring
programs (The ICP Forest programme monitorizes Total Nitrogen, but not ON). In fact,
nowadays the organic fraction is still not routinely assessed and all available
information about this subject comes from individual measurements. The reason does
not seem to be the relevance of the issue, since it has been proved that ON may
contribute substantially to N budgets in certain areas. For example, a broad analysis of
41 datasets carried out by Neff et al. (2002) showed that the organic fraction of
deposition can contribute between 7-80% of total N, with 60% of the studied samples
ranging between 10-40%. In Europe, ON varied from 2-38 % of total N (Cape et al.,
2012), whereas in the USA it was found that it only contributes between 6-8% (Keene
et al., 2002). In China this fraction was found to be highly variable, with areas receiving
less than 10% of ON in regard to total N deposition, whilst in others the contribution
rose to more than 60% (Zhang et al., 2012b). Jickells et al. (2013) estimated that the
organic component represents on average a quarter of the total atmospheric soluble
fixed nitrogen (DON + NO3 + NH4). The reasons for not performing regular
measurements of DON are likely associated to methodological uncertainties related to
the inherent nature of ON, which makes it difficult to address the matter. Besides
aspects related to sample collection and preservation (Cape et al., 2001 and 2004;
Walker et al., 2012), the most important issues are probably the lack of robust
methods to perform the analysis and the chemical characterization of the organic
fraction.
Chapter 1
44
Atmospheric ON is a complex mixture of multiple oxidized and reduced compounds
with different properties and origin (Cornell et al., 2003; Cape et al., 2011). Results
from Altieri et al. (2012) allow us to get an idea of this complexity, since these authors
found that rainfall samples might have more than two thousand N-containing
compounds. In view of these data, the analysis and identification of each compound to
account for the whole ON seems unfeasible. As a consequence, most surveys
addressing ON usually investigate the total water soluble organic nitrogen (WSON) in
the sample (‘top-down’ approach) instead of individual components (‘bottom-up’
approach). At present there is not a specific technology for quantifying this organic
fraction (González-Benítez et al., 2009). Thus, DON in water is commonly quantified by
using an inferential approach from total and inorganic nitrogen (NH4+ + NO2
- + NO3-)
estimates: WSON = total nitrogen measured (TN) – initial inorganic nitrogen
concentration (IN) (Cornell et al., 2003; Cape et al., 2004; González-Benítez et al., 2009;
Jickells et al., 2013). Nevertheless, this approach can be challenging when it comes to
identifying possible origin sources. According to Cape et al. (2011) source attribution
can be inferred by co-variation in time and/or space with other components of the air
masses, correlation analysis with other ions dissolved in the sample, N/C ratio in
airborne organic matter, using air-mass back trajectories, or by the study of isotope
ratios. Moreover, although individual measurements of some compounds are
insufficient to estimate the total budgets of ON, they are of great value in origin
identification surveys (Mace et al., 2003a, 2003b and 2003c; Chen et al., 2010; Violaki
and Mihalopoulos 2010). Finally, despite these methodological handicaps, it has been
possible to distinguish four important sources of ON: soil dust, biomass burning,
marine emissions and anthropogenic activities related to both combustion processes
and agricultural practices (Jickells et al., 2013).
Nevertheless, as a result of data sparseness and poor characterization, the role of ON
in ecosystems remains much less clear than that of other nitrogenous species. It is
well-known that some organic compounds such as urea or amino acids are labile and
easily taken by the biota in both aquatic and terrestrial ecosystems (Seitzinger and
Sanders 1999; Violaki et al., 2010; Uscola et al., 2014). Cape et al. (2011) and Cornell
(2011) highlighted that where deposition of inorganic N exceeds the CLO, the

General Introduction
45
additional input of organic N may result in even greater pressures towards
eutrophication or species composition change than predicted, and may pose a threat
to systems where the CLO is not exceeded.
It is clear that organic N is a complex and difficult issue to tackle. The limitations in
both methodological and technical approaches need to be overcome, and adequate
and standardized protocols need to be set before ON becomes routinely assessed in
monitoring networks. Until then, the dynamics of the organic fraction in the nitrogen
cycle will remain poorly understood.
Biomonitoring
Bioindicators/biomonitors may provide complementary information to that derived
from physical monitoring of atmospheric concentrations and deposition (Sutton et al.,
2004). Atmospheric measurements generally require regular repeated monitoring over
several months or years, since they aim at investigating the temporal variability (daily,
monthly or seasonal scales) in concentrations and deposition of atmospheric nitrogen
compounds. Conversely, biomonitor data can provide useful information from
measurements made only once, as they represent the accumulated response of the
component being studied. Therefore, if a quick undetailed indication of atmospheric
levels is required, application of biomonitors may be a useful alternative (Sutton et al.,
2004). Moreover, bioindication and biomonitoring are promising methods not only for
differentiating between polluted and unpolluted sites, but also for observing the
impact of external factors on ecosystems and their development over a long period,
being key pieces when we evaluate the effects of nitrogen deposition in ecosystems
(Bobbink and Roelofos 1995; Cape et al., 2009; Bobbink et al., 2010; Markert and
Wünschmann 2011; Pinho et al., 2012).
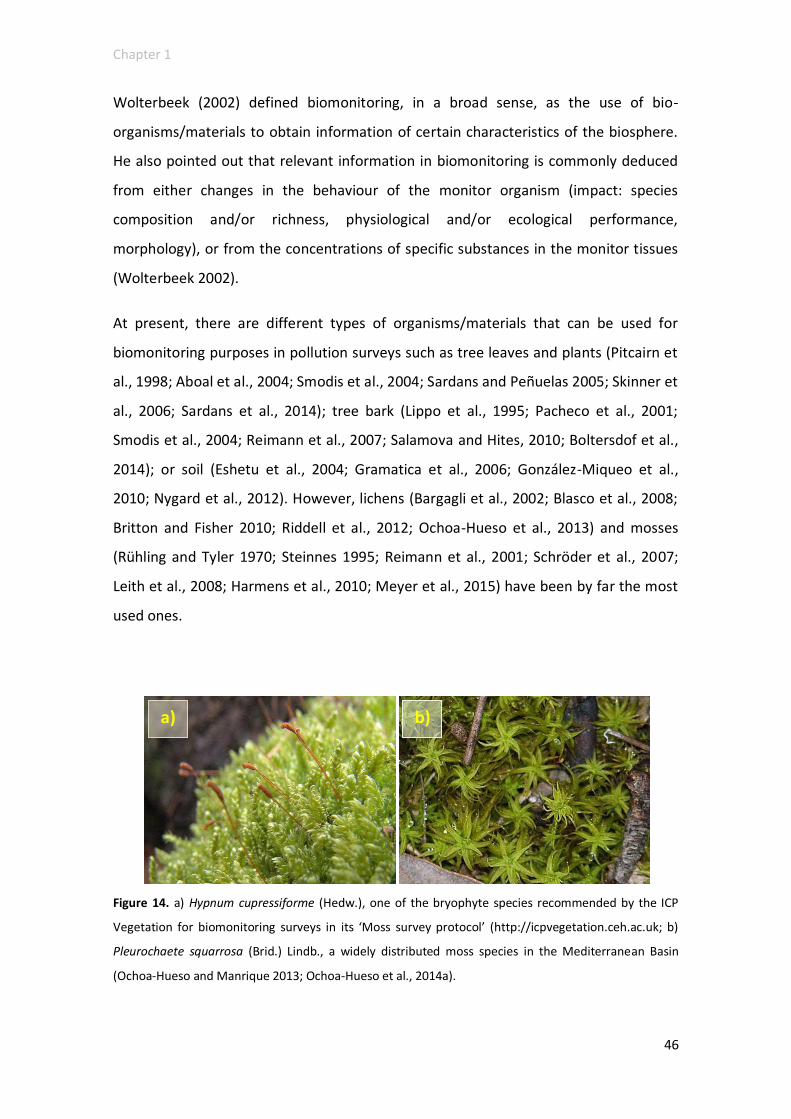
Chapter 1
46
Wolterbeek (2002) defined biomonitoring, in a broad sense, as the use of bio-
organisms/materials to obtain information of certain characteristics of the biosphere.
He also pointed out that relevant information in biomonitoring is commonly deduced
from either changes in the behaviour of the monitor organism (impact: species
composition and/or richness, physiological and/or ecological performance,
morphology), or from the concentrations of specific substances in the monitor tissues
(Wolterbeek 2002).
At present, there are different types of organisms/materials that can be used for
biomonitoring purposes in pollution surveys such as tree leaves and plants (Pitcairn et
al., 1998; Aboal et al., 2004; Smodis et al., 2004; Sardans and Peñuelas 2005; Skinner et
al., 2006; Sardans et al., 2014); tree bark (Lippo et al., 1995; Pacheco et al., 2001;
Smodis et al., 2004; Reimann et al., 2007; Salamova and Hites, 2010; Boltersdof et al.,
2014); or soil (Eshetu et al., 2004; Gramatica et al., 2006; González-Miqueo et al.,
2010; Nygard et al., 2012). However, lichens (Bargagli et al., 2002; Blasco et al., 2008;
Britton and Fisher 2010; Riddell et al., 2012; Ochoa-Hueso et al., 2013) and mosses
(Rühling and Tyler 1970; Steinnes 1995; Reimann et al., 2001; Schröder et al., 2007;
Leith et al., 2008; Harmens et al., 2010; Meyer et al., 2015) have been by far the most
used ones.
Figure 14. a) Hypnum cupressiforme (Hedw.), one of the bryophyte species recommended by the ICP
Vegetation for biomonitoring surveys in its ‘Moss survey protocol’ (http://icpvegetation.ceh.ac.uk; b)
Pleurochaete squarrosa (Brid.) Lindb., a widely distributed moss species in the Mediterranean Basin
(Ochoa-Hueso and Manrique 2013; Ochoa-Hueso et al., 2014a).
a) b)
General Introduction
47
Since the first works carried out by Rühling and Tyler at the end of the 60s, the moss
sampling technique has become a widely used indirect method in monitoring surveys
across Europe due to its economical, analytical and field deployment advantages
regarding the conventional precipitation analysis (Steinnes 1995; Harmens et al. 2008).
In fact, mosses are the organisms selected by the ‘International cooperative
programme on effects of air pollution on natural vegetation and crops’ (ICP
Vegetation), which was established in 1987 under the UNECE-CLRTAP to collect
deposition data of atmospheric pollutants and to make assessments about the current
and future state of the environment (ICP Vegetation, http://icpvegetation.ceh.ac.uk;
last accessed October 2015).
The lack of any root system or water-conducting tissue, the high cationic exchange
capacity, the high surface area to volume ratio and their widespread occurrence are
the main characteristics that led to the development of this technique (Berg and
Steinnes 1997; Szczepaniak and Biziuk 2003; Zechmeister et al., 2003).
Initially, the large majority of biomonitoring surveys with mosses were projected from
a quantitative approach, taking advantage of the high cumulative capacity of these
organisms (bioaccumulation) (Rüling and Tyler 1970; Harmens et al., 2015). The main
aim was to estimate the pollutants load reaching the monitoring areas and depict
spatial and temporal trends of atmospheric pollutants deposition. In fact, during the
first stages of the development of the moss technique it was thought that by using a
suitable methodology the analysis of bryophytes tissue could be interpreted as an
exact reflection of the atmospheric chemistry. Since then, several works have been
carried out in order to demonstrate the validity of this hypothesis. To that end,
comparisons among precipitation and mosses data collected at the same monitoring
sites have been extensively performed (Steinnes 1995; Thöni et al., 1996; Reimann et
al., 1999; Aboal et al., 2010; Harmens et al., 2014; Schröder et al., 2014). However,
results from these surveys showed that mosses are usually influenced by factors other
than the adsorption of precipitation, such as soil dust, throughfall, or the marine
aerosol (Bargagli et al., 1995; Steinnes 1995; de Caritat et al., 2001; Leith et al., 2008;
Samecka-Cymerman et al. 2010). Nevertheless, and according to Reimann et al. (2001),
there is no doubt that regional bio-geochemical mapping using the moss technique is

Chapter 1
48
able to provide valuable insights into the environmental processes, the origin of
important elements (natural or anthropogenic) and the relative ecosystem health of
large areas (although without truly reflecting the atmospheric chemistry).
The first works using mosses as bioaccumulators focused on trace elements (Rühling
and Tyler 1970; Steinnes 1980; Grodzinska et al., 1990), but they gradually expanded
to the study of other pollutants such as nitrogen (Poikolainen et al., 2009; Harmens et
al., 2011; Schröder et al., 2014), or persistent organic pollutants (POPs) (Ares et al.,
2009; Harmens et al., 2013; Foan et al., 2014). A good example of this trend is the
aforementioned ICP-Vegetation programme, which originally aimed at studying heavy
metal deposition across Europe, and nowadays it also provides data on nitrogen and
POPs (Harmens et al., 2015). Indeed, the ICP Vegetation monitoring network is
considered to be a reference in this kind of surveys and many field campaigns have
been developed following the guidelines reported in its ‘Moss survey protocol’ (ICP
Vegetation, http://icpvegetation.ceh.ac.uk; last accessed October 2015).
According to the ICP Vegetation manual, mosses should not be sampled at places close
to roads, populated areas or under the influence of tree canopies. Moreover, it is
recommended to make one composite sample from each sampling point (five to ten
subsamples) collected in an area of about 50 m x 50 m. Regarding species selection,
two pleurocarpous species are favoured: Hylocomium splendens and Pleurozium
schreberi. If these moss species cannot be found in the study area, the ICP Vegetation
manual recommends the use of Hypnum cupressiforme (Figure 14a) or
Pseudoscleropodium purum. These four species are widely distributed in Nordic
countries and central Europe (Poikolainen et al., 2004; Harmens et al., 2008). However,
in southern latitudes, where geographical and climatic conditions change notably and
become more extreme, those pleurocarpous species are scarce or nonexistent, or they
are simply relegated to more humid places within forests or microhabitats which are
not suitable for biomonitoring purposes because of the influence of the tree or shrub
canopy on the metal and nitrogen content (Gandois et al., 2014; Meyer et al., 2015).
Therefore, biomonitoring surveys based on the moss technique in these areas are
equally lacking. As an example, see the map from Harmens et al. (2008), which showed
the sampling sites and the corresponding moss species collected during the 2005/6 ICP

General Introduction
49
Vegetation survey. Similarly, several authors have already dealt with the species
selection problem when trying to use the moss technique to map atmospheric
deposition of different pollutants in Italy (Gerdol et al., 2000), Spain (Fernández et al.,
2002) or Croatia (Spiric et al., 2012). All these scientists agreed in highlighting the
necessity of getting a suitable moss species for monitoring purposes in drier areas of
southern Europe. Therefore, finding an alternative moss species for biomonitoring
surveys is nowadays one of the challenges that the Mediterranean countries need to
address.
In addition to biomonitoring surveys based on the accumulation properties of mosses,
which have been proven to be highly useful to identify pollution hot-spots, sources of
toxic elements or to depict spatial-temporal distribution patterns of pollutants of
concern, in the last years it has been recognized that mosses may have great value in
ecological risk assessment studies developed in areas threatened by nitrogen
deposition (Bragazza et al., 2004; Ochoa-Hueso et al., 2014b). As explained above,
characteristics such as the absence of a well-developed cuticle and the lack of a true
root system to acquire N from the substratum endow mosses with a special sensitivity
to N deposition and allow its use as indicators of the direct effects of this pollutant. In
fact, field experiments carried out with mosses have proved to be suitable in the
establishment of CLOs and CLEs (Bragazza et al., 2004; Cape et al., 2009).
N induced effects at ecosystem level have been addressed in several surveys (Vitousek
et al., 1997; Galloway et al., 2003; Botez et al., 2013; Erisman et al., 2015; Shibata et
al., 2015). Likewise, N enrichment impacts on mosses communities have also been
described: loss of biodiversity, decline in coverage and growth or reduced species
richness (Pearce et al., 2003; Pitcairn et al., 2003; Sephard et al., 2011; Verhoeven et
al., 2011; Song et al., 2012). However, the mechanisms occurring at species level that
lead to these changes are still poorly understood (Cape et al., 2009). In the recent
years there is a growing interest among the scientific community in discerning which
processes are involved in these responses, since the understanding and monitoring of
those processes could be implemented as a helpful tool to anticipate the ecosystems’
damages. Indeed, it has been observed that the physiological responses of mosses to
enhanced N deposition may be a promising instrument as early warning alerts of N
Chapter 1
50
impacts (Arróniz-Crespo et al., 2008). In this context, there are several works that were
performed with the purpose of investigating how mosses react when subjected to
determined N loads and levels. Among the most evaluated parameters are: changes in
metabolic enzymes behaviour, both phosphomonoesterase (PME) and nitrate
reductase (NR) (Pearce et al., 2003; Bragazza et al., 2004; Hogan et al., 2010a and
2010b); variations in tissue nutrient contents, especially N concentrations (Pitcairn et
al., 2003 and 2006; Liu et al., 2008a; Du et al., 2014b); differences in pigment
composition (Paoli et al., 2010; Ochoa-Hueso and Manrique 2013; Ochoa-Hueso et al.,
2014a); and measurements of photosynthesis performance (Arróniz-Crespo et al.,
2008; Munzi et al., 2013 and 2014). In spite of these efforts and their invaluable
contribution to provide clues about likely causes of bryophytes decline, in general only
one or few variables were studied at the same time. To this respect, Arróniz-Crespo et
al. (2008) highlighted the necessity of performing a broader analysis of physiological
responses, which may help us determine which variables are the most important
drivers of bryophyte loss and understand their relative importance compared with
those measured previously. However, to date, only their work (Arróniz-Crespo et al.,
2008) and those carried out by Ochoa-Hueso et al. (2014b) followed this integrative
approach. Hence, further research is needed in order to elucidate the key physiological
processes and the most responsive mechanisms in mosses subjected to enhanced
nitrogen deposition, and determine if those answers at species level could be used as
early warning indicators of possible future impacts at ecosystem level.
In line with the above, it has been shown that analysis of N and C isotope ratios (15N :
14N and 13C : 12C) in mosses provides relevant supplementary information which might
be helpful to better understand the N dynamics and processes observed in
biomonitoring surveys whatever the approach, both bioaccumulation and
bioindication (Pearson et al., 2000; Clarkson et al., 2005; Liu et al., 2008b and 2010;
Royles et al., 2014).
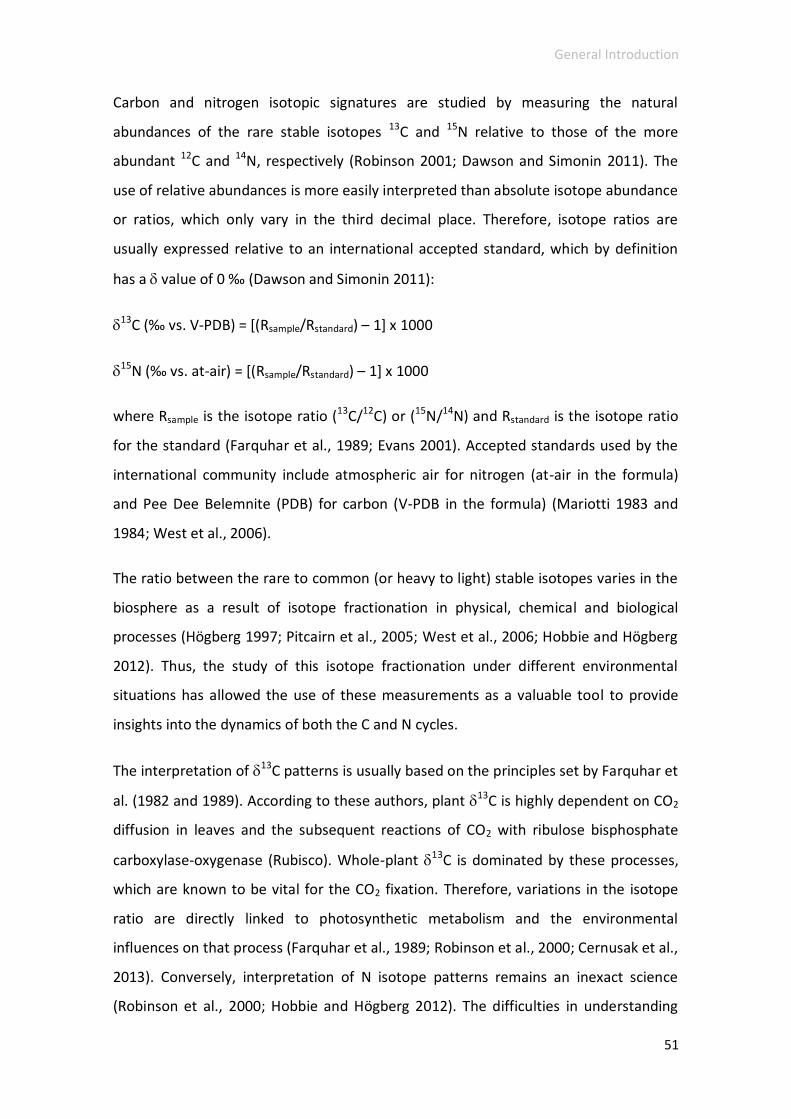
General Introduction
51
Carbon and nitrogen isotopic signatures are studied by measuring the natural
abundances of the rare stable isotopes 13C and 15N relative to those of the more
abundant 12C and 14N, respectively (Robinson 2001; Dawson and Simonin 2011). The
use of relative abundances is more easily interpreted than absolute isotope abundance
or ratios, which only vary in the third decimal place. Therefore, isotope ratios are
usually expressed relative to an international accepted standard, which by definition
has a value of 0 ‰ (Dawson and Simonin 2011):
13C (‰ vs. V-PDB) = [(Rsample/Rstandard) – 1] x 1000
15N (‰ vs. at-air) = [(Rsample/Rstandard) – 1] x 1000
where Rsample is the isotope ratio (13C/12C) or (15N/14N) and Rstandard is the isotope ratio
for the standard (Farquhar et al., 1989; Evans 2001). Accepted standards used by the
international community include atmospheric air for nitrogen (at-air in the formula)
and Pee Dee Belemnite (PDB) for carbon (V-PDB in the formula) (Mariotti 1983 and
1984; West et al., 2006).
The ratio between the rare to common (or heavy to light) stable isotopes varies in the
biosphere as a result of isotope fractionation in physical, chemical and biological
processes (Högberg 1997; Pitcairn et al., 2005; West et al., 2006; Hobbie and Högberg
2012). Thus, the study of this isotope fractionation under different environmental
situations has allowed the use of these measurements as a valuable tool to provide
insights into the dynamics of both the C and N cycles.
The interpretation of 13C patterns is usually based on the principles set by Farquhar et
al. (1982 and 1989). According to these authors, plant 13C is highly dependent on CO2
diffusion in leaves and the subsequent reactions of CO2 with ribulose bisphosphate
carboxylase-oxygenase (Rubisco). Whole-plant 13C is dominated by these processes,
which are known to be vital for the CO2 fixation. Therefore, variations in the isotope
ratio are directly linked to photosynthetic metabolism and the environmental
influences on that process (Farquhar et al., 1989; Robinson et al., 2000; Cernusak et al.,
2013). Conversely, interpretation of N isotope patterns remains an inexact science
(Robinson et al., 2000; Hobbie and Högberg 2012). The difficulties in understanding

Chapter 1
52
15N values stem from the great complexity of the N cycle itself. Plant 15N ultimately
reflects the high variability of external N sources and the 15N/14N fractionations which
occur during the assimilation, transport and loss of N (Högberg 1997; Evans 2001;
Robinson 2001; Templer et al., 2012). However, in spite of the lack of a robust theory
to explain N isotopic variation mechanistically like in 13C surveys, statistical
associations between plant 15N and environmental factors might be a suitable
method to establish testable hypotheses about the main causes of such associations
(Robinson et al., 2000).
In the mid-eighties, Heaton (1986) suggested the possibility of using isotope 15N/14N
data in atmospheric pollution surveys as a useful instrument for distinguishing
between the anthropogenic and natural sources of NOx gases. However, he pointed
out that this application needed yet to be proven. Almost 30 years on, the use of 15N
for N sources attribution in biomonitoring surveys is widely accepted (Pearson et al.,
2000; Gerdol et al., 2002; Stewart et al., 2002; Skinner et al., 2006; Solga et al., 2005
and 2006; Zechmeister et al., 2008; Xiao et al., 2010). The method is mainly based on
the differences in N isotopic signatures of the nitrogenous compounds, which are
eventually reflected in the tissues of mosses. In this case mosses are considered as an
integrator of the atmospheric chemistry, thus 15N of mosses are assumed to be a
reflection of the isotopic signatures of atmospheric N compounds; so measuring moss
15N and comparing these data to source 15N signatures could potentially determine
the sources of atmospheric N deposition. To this respect, the key issue is that, in
general, anthropogenic emissions of oxidized forms have a more positive 15N value
than the reduced forms (Moore 1977; Heaton 1986 and 1987; Högberg et al., 1997;
Zhang et al., 2008; Xiao et al., 2010). Therefore, on the basis of these premises, the
analysis of the spatial variations of N isotopic signatures and the correlations with
atmospheric components or the main N emitters might provide an integrated
approach to N pollution sources, where dominance of N-NHy forms in deposition is
expected to infer more negative 15N values in mosses, whereas the higher the N-NOx
concentrations in deposition the less negative 15N value in vegetal tissues (Gerdol et
al., 2002; Zechmeister et al., 2008). However, as explained above, 15N data cannot be
interpreted as a rule of thumb, since differences in source emission also produce
General Introduction
53
variations in 15N. For example, 15N/14N ratios of ammonia emitted from animal or
sewage sludge or from fertilizer application are not the same (Heaton 1986; Xiao et al.,
2010; Liu et al., 2013), and similarly atmospheric NOx may show different isotopic
signatures if it was generated in the vehicle engines or in power plants (Heaton 1987
and 1990). Hence, it could be expected that a better understanding of N isotope data
would be achieved if they were analyzed in a contextualized manner.
In addition to nitrogen source attribution, isotopic signatures have been found to be
efficient monitors of ecosystem N and C dynamics. Because of the narrow relationship
between N and C cycles, 15N and 13C are frequently used in combination to
investigate N supply and C fixation occurring from individual organisms to the
ecosystem level (Robinson 2000; Liu et al., 2010). In China Liu et al. (2010) investigated
tissue C, chlorophylls and 13C along a N deposition gradient from an urban site to a
rural one, finding that N supply caused a fertilizing effect on moss C fixation.
Conversely, Pintó-Marijuan et al. (2013), who also studied 13C signatures and
compared them with other indicators of photosynthesis performance along a NH3
transect, showed that enhanced ammonia, instead of favouring photosynthetic
activity, caused clear impacts on the C fixation machinery. In both studies 13C was
suggested as a good indicator of photosynthesis functioning, where the higher 13C
values were related to photosynthesis impairment. On the other hand, it is well known
that the effects of anthropogenic N deposition on ecosystems are partially dependent
on the amount of N retained in the system and its partitioning among plant and soil
pools. To this respect, it has been shown that isotopic signatures could be a valuable
indicator of N saturation and total ecosystem N retention (Templer et al., 2012).
Moreover, it has been observed that plant 15N becomes more depleted with
increasing N availability and with increasing P limitation (McKee et al., 2002; Clarkson
et al., 2005).
Hence, in view of the above, there can be little doubt that the C and N isotopic
signatures might play an important role in surveys aimed at identifying both N
emission sources and N pollution consequences.

Chapter 1
54
General Introduction
55
Thesis objectives and outline
The general objective of the present thesis is to investigate atmospheric nitrogen
deposition through the use of different monitoring approaches, both physical and
biomonitor-based ones, paying special attention to those issues that currently remain
poorly understood. To be more specific, we focused on the study of N deposition
budgets, with special emphasis on the organic fraction, and we evaluated the
suitability of different biomonitors and techniques to investigate N deposition fluxes,
to identify potential N sources and to assess N-related effects on ecosystems. In order
to achieve this general aim, we set the following particular objectives:
1. To determine the dissolved organic nitrogen (DON) fraction in both canopy
throughfall (TF) and bulk deposition (BD) samples collected at four evergreen
forests of Quercus ilex located in the Iberian Peninsula, in order to give a more
comprehensive characterization of the nitrogen fluxes that reach the selected
Mediterranean sites.
2. To evaluate the feasibility of the moss species Pleurochaete squarrosa (Brid.)
Lindb. as an alternative biomonitor for heavy metals and nitrogen atmospheric
pollution surveys in a Mediterranean area of southern Europe.
3. To investigate the ability of both Pleurochaete squarrosa (Brid.) Lindb. and
Hypnum cupressiforme Hedw. to discriminate potential nitrogen emission
sources in a Mediterranean area of southern Europe through the study of their
15N isotopic signatures.
4. To study the physiological response of the moss Hypnum cupressiforme Hedw.
to an ammonia concentration gradient from a multivariate, comprehensive and
temporal perspective, to better understand the mechanisms implied when
bryophytes cope with this pollutant.
5. To provide insight into the effects of enhanced ammonia on moss physiology,
identifying which variables are the most responsive, and therefore, which ones
are the most promising for the use of Hypnum cupressiforme Hedw. in
ecosystem surveys as an early warning indicator of NH3 impacts.

Chapter 1
56
6. To examine the temporal trends of the physiological variables and identify
which ones are kept homogeneous throughout the year or on the contrary,
depend on the seasonality, to get valid data on which to rely the
recommendations for developing sampling protocols and conducting
biomonitoring surveys based on the analysis of physiological parameters.
7. To identify the main N polluted areas across Europe by using mosses as
biomonitors.
8. To assess the suitability of moss stable C and N isotopes to identify the main
sources of carbon and nitrogen across Europe, thus getting complementary
information to that obtained in European moss surveys.
9. To investigate the use of isotopic signatures (15N and 13C) to monitor key
ecological processes at a regional scale.
The thesis has been structured in six chapters. The first one, ‘General Introduction’
(Chapter 1), gives state-of-the-art information on atmospheric nitrogen pollution,
gathering a short background review on the origin and evolution of the problem, as
well as current concerns. Moreover, ‘Chapter 1’ provides details on the different
monitoring approaches used to study atmospheric N deposition and their associated
advantages and limitations. Ultimately, this chapter summarizes the main objectives of
the present work, which were established in order to develop the potentialities of
certain monitoring techniques and methodologies and cover this way some
information gaps that could improve our knowledge of the nitrogen cycle.
In Chapter 2, ‘Throughfall and bulk deposition of dissolved organic nitrogen to holm
oak forests in the Iberian Peninsula: flux estimation and identification of potential
sources’, we aim at answering the particular objective nº 1. To that end, four
evergreen holm oak forests developed under different environmental conditions and
influenced by diverse anthropogenic activities were selected. For an entire year both
open-field and below-canopy rain samples were collected. Deposition data were
investigated not only to give estimates about total N budgets, but also to identify
potential sources of the organic fraction. Additionally, the net canopy throughfall was
General Introduction
57
calculated seasonally at each monitoring site in order to evaluate possible interactions
between the nitrogenous species and the forests canopies.
Chapter 3, ‘Pleurochaete squarrosa (Brid.) Lindb. as an alternative moss species for
biomonitoring surveys of heavy metal, nitrogen deposition and 15N signatures in a
Mediterranean area’, addresses the second and third particular objectives above-
mentioned. In order to achieve these goals we compare the response of Pleurochaete
squarrosa (Brid.) Lindb., the species whose suitability as an alternative biomonitor in
Mediterranean areas needs to be evaluated, with that of Hypnum cupressiforme
Hedw., a commonly used and accepted moss species in biomonitoring surveys. A total
of 20 samples of both species were collected at the same monitoring sites in a
Mediterranean area of Navarra (northern Spain) and were analyzed for their content in
heavy metals and nitrogen. In addition, N isotopic signatures (15N) from both species
were tested to determine their effectiveness when identifying nitrogen emission
sources.
The fourth, fifth and sixth particular objectives are covered in Chapter 4, ‘Integrated
eco-physiological response of the moss Hypnum cupressiforme Hedw. to increased
ammonia concentrations’. Ammonia emissions are considered one of the major
environmental problems related to atmospheric N pollution, and an increasing trend is
expected for the coming years. Even though this gas is linked to atmospheric processes
that ultimately have as a consequence negative effects on the health of ecosystems,
responses to exposure to NH3 at species level for them to be used directly as ecological
indicators are still insufficiently quantified. This chapter tries to throw light on this
respect by analyzing samples of Hypnum cupressiforme Hedw. collected along an
ammonia concentration gradient. The study was performed in a forested area close to
a swine livestock which counts with approximately 5000 heads and has been operating
for almost 50 years. In particular, moss samples were analyzed for tissue chemistry,
metabolic (phosphomonoesterase and nitrate reductase) and antioxidant (superoxide
dismutase) enzymatic activities, membrane damages, protein content, pigments and C
and N isotopic signatures.

Chapter 1
58
The study of the natural abundance of N and C isotopes in plants has been extensively
used to examine physiological and biogeochemical processes related to N and C cycles.
Furthermore, analysis of isotopic signatures in mosses has been used to infer N
emission sources, since N atmospheric compounds have different N15/N14
fractionation. Chapter 5, ‘Total N and C contents and stable isotopes (15N and 13C) in
moss tissue at a European scale: a preliminary insight into spatial distribution patterns
and feasibility of isotopic signatures as indicators of pollution sources and
environmental conditions’, relies on these premises and responds to the objectives 7 to
9. To accomplish those purposes more than 1300 bryophyte samples from 15 countries
have been analyzed for their C and N content and their isotopic signatures (13C and
15N). Results have been investigated along with land use data (CORINE Land Cover)
and deposition data (EMEP). Moreover, information about the moss species, the
altitude at which the samples were taken, or the annual mean precipitation at each
monitoring site was included in the final dataset.
Chapter 6 summarizes the main conclusions obtained in Chapters 2 to 5 and provides a
brief discussion about the implications of these findings.
Finally, in Annex I it is described in further detail the EDEN project, which set the
framework for Chapter 2 and constituted the basis for the development of two other
doctoral dissertations. In this section it has also been included a briefly explanation of
the ICP-Vegetation programme, since Chapter 5 has been developed in collaboration
with members of this monitoring network.
In Annex II a summary of the published papers related to this PhD can be found.
Note:
The four central chapters are presented in scientific paper format, which might result
in some redundancy in the introduction and methods information of the different
chapters.
General Introduction
59
References
Aber, J.D., Nadelhoffer, K.J., Steudler, P., Melillo, J.M., 1989. Nitrogen saturation in northern forest
ecosystems. BioScience, Vol. 39 (6), 378-386.
Aboal, J.R., Fernández, J.A., Carballeira, A., 2004. Oak leaves and pine needles as biomonitors of airborne
trace elements pollution. Environmental and Experimental Botany 51, 215-225.
Aboal, J.R., Fernández, J.A., Boquete, T., Carballeira, A., 2010. Is it possible to estimate atmospheric
deposition of heavy metals by analysis of terrestrial mosses? Science of the Total Environment 408,
6291-6297.
Adams, P.J., Seinfeld, J.H., Koch, D., Mickley, L., Jacob, D., 2001. General circulation model assessment of
direct radiative forcing by the sulfate-nitrate-ammonium-water inorganic aerosol system. Journal of
Geophysical Research-Atmospheres 106, 1097-1111.
Allen, E.B., Bytnerowizc, A., Fenn, M.E., Minnich, R.A., Allen, M.F., 2006. Impacts of Anthropogenic N
Deposition on Weed Invasion, Biodiversity and the Fire Cycle at Joshua Tree National Park. Final Report
PMIS Number: 72123 9/2003-9/2006.
Alonso, R., Bytnerowicz, A., Boarman, W.I., 2005. Atmospheric dry deposition in the vicinity of the Salton
Sea, California - I: Air pollution and deposition in a desert environment. Atmospheric Environment 39,
4671-4679.
Alonso, R., Elvira, S., González-Fernández, I., Calvete, H., García-Gómez, H., Bermejo, V., 2014. Drought
stress does not protect Quercus ilex L. from ozone effects: Results from a comparative study of two
subspecies differing in ozone sensitivity. Plant Biology 16, 375-384.
Altieri, K.E., Hastings, M.G., Peters, A.J., Sigman, D.M., 2012. Molecular characterization of water soluble
organic nitrogen in marine rainwater by ultra-high resolution electrospray ionization mass spectrometry.
Atmospheric Chemistry and Physics 12, 3557-3571.
Aneja, V. P., Blunden, J., Roelle, P. A., Schlesinger, W. H., Knighton, R., Niyogi, D., Gilliam, W., Jennings,
G., Duke, C. S., 2008. Workshop on Agricultural Air Quality: State of the science. Atmospheric
Environment 42, 3195–3208.
Araujo, T.G., Souza, M.F.L., de Mello, W.Z., da Silva, D.M.L., 2015. Bulk atmospheric deposition of major
ions and dissolved organic nitrogen in the lower course of a tropical river basin, southern Bahia, Brazil.
Journal of the Brazilian Chemical Society 26, 1692-1701.
Ares, A., Aboal, J.R., Fernández, J.A., Real, C., Carballeira, A., 2009. Use of the terrestrial moss
Pseudoscleropodium purum to detect sources of small scale contamination by PAHs. Atmospheric
Environment 43, 5501-5509.
Arróniz-Crespo, M., Leake, J.R., Horton, P., Phoenix, G.K., 2008. Bryophyte physiological responses to,
and recovery from, long-term nitrogen deposition and phosphorus fertilisation in acidic grassland. New
Phytologist. 180, 864-874. http://dx.doi.org/10.1111/j.1469-8137.2008.02617.
Àvila, A., Molowny-Horas, R., Gimeno, B.S., Penuelas, J., 2010. Analysis of decadal time series in wet N
concentrations at five rural sites in NE Spain. Water Air and Soil Pollution 207, 123-138.
Chapter 1
60
Àvila, A. and Rodà, F., 2012. Changes in atmospheric deposition and streamwater chemistry over 25
years in undisturbed catchments in a Mediterranean mountain environment. Science of the Total
Environment 434, 18-27.
Azevedo, L.B., van Zelm, R., Leuven, R.S.E.W., Hendriks, A.J., Huijbregts, M.A.J., 2015. Combined
ecological risks of nitrogen and phosphorus in european freshwaters. Environmental Pollution 200, 85-
92.
Balestrini, R. and Tagliaferri, A., 2001. Atmospheric deposition and canopy exchange processes in alpine
forest ecosystems (northern Italy). Atmospheric Environment 35, 6421-6433.
Balestrini, R., Arisci, S., Brizzio, M.C., Mosello, R., Rogora, M., Tagliaferri, A., 2007. Dry deposition of
particles and canopy exchange: Comparison of wet, bulk and throughfall deposition at five forest sites in
Italy. Atmospheric Environment 41, 745-756.
Bargagli, R., Brown, D.H., Nelli, L., 1995. Metal biomonitoring with mosses - procedures for correcting
for soil contamination. Environmental Pollution 89, 169-175.
Bargagli, R., Monaci, F., Borghini, F., Bravi, F., Agnorelli, C., 2002. Mosses and lichens as biomonitors of
trace metals. A comparison study on Hypnum cupressiforme and Parmelia caperata in a former mining
district in Italy. Environmental Pollution 116, 279-287.
Berg, T., and Steinnes, E., 1997. Use of mosses (Hylocomium splendens and Pleurozium schreberi) as
biomonitors of heavy metal deposition: from relative to absolute deposition values. Environmental
Pollution 98 (1), 61-71.
Billen, G., and contributing authors, 2011. Nitrogen flows from European regional watersheds to coastal
marine waters. In The European nitrogen assessment: sources, effects and policy perspectives (eds MA
Sutton, CM Howard, JW Erisman, G Billen, A Bleeker, P Grennfelt, H van Grinsven, B Grizzetti), pp. 271-
297. Cambridge, UK: Cambridge University Press.
Bittman, S., and Mikkelsen, R., 2009. Ammonia emissions from agricultural operations: Livestock. Better
Crops, Vol. 93 (Nº 1).
Bittman, S., Dedina, M., Howard C.M., Oenema, O., Sutton, M.A., (eds), 2014, Options for Ammonia
Mitigation: Guidance from the UNECE Task Force on Reactive Nitrogen, Centre for Ecology and
Hydrology, Edinburgh, UK.
Bittsánszky, A., Pilinszky, K., Gyulai, G., Komives, T., 2015. Overcoming ammonium toxicity. Plant Science
231, 184–190.
Blasco, M., Domeno, C., Nerin, C., 2008. Lichens biomonitoring as feasible methodology to assess air
pollution in natural ecosystems: Combined study of quantitative PAHs analyses and lichen biodiversity in
the Pyrenees mountains. Analytical and Bioanalytical Chemistry 391, 759-771.
Bluestein, J., Rackley, J., Baum, E., 2008. Sources and mitigation opportunities to reduce emission of
short-term Arctic climate forcers. AMAP Technical Report No. 2, Arctic Monitoring and Assessment
Programme (AMAP), Oslo, Norway. www.amap.no
General Introduction
61
Bobbink, R. and Roelofs, J.G.M., 1995. Nitrogen critical loads for natural and semi-natural ecosystems:
The empirical approach. Water Air and Soil Pollution 85, 2413-2418.
Bobbink, R., Hornung, M., Roelofs, J.G.M., 1998. The effects of air-borne nitrogen pollutants on species
diversity in natural and semi-natural european vegetation. Journal of Ecology 86, 717-738.
Bobbink, R., Hicks, K., Galloway, J., Spranger, T., Alkemade, R., Ashmore, M., Bustamante, M., Cinderby,
S., Davidson, E., Dentener, F., Emmett, B., Erisman, J.W., Fenn, M., Gilliam, F., Nordin, A., Pardo, L., de
Vries, W., 2010. Global assessment of nitrogen deposition effects on terrestrial plant diversity: a
synthesis. Ecological Applications 20 (1), 30-59.
Bobbink, R., and Hicks., K., 2014. Chapter 14: Factors Affecting Nitrogen Deposition Impacts on
Biodiversity: An Overview. In: Sutton, M.A., K.E. Mason, L.J. Sheppard, H. Sverdrup, R. Haeuber, and
W.K. Hicks (eds.), Nitrogen Deposition, Critical Loads and Biodiversity. Springer. pp. 127-138. ISBN 978-
94-007-79. DOI: 10.1007/978-94-007-7939-6_14.
Bolan, N.S., Hedley, M.J., White, R.E., 1991. Processes of soil acidification during nitrogen cycling with
emphasis on legume based pastures. Plant and Soil 134, 53-63.
Bolan, N.S., Adriano, D.C., Curtin, D., 2003. Soil acidification and liming interactions with nutrient and
heavy metal transformation and bioavailability. Advances in Agronomy, Vol 78, 215-272.
Boltersdorf, S.H., Pesch, R., Werner, W., 2014. Comparative use of lichens, mosses and tree bark to
evaluate nitrogen deposition in Germany. Environmental Pollution 189, 43-53.
Botez, F. and Postolache, C., 2013. Nitrogen deposition impact on terrestrial ecosystems. Romanian
Biotechnological Letters 18, 8723-8742.
Bowman, W.D., Gartner, J.R., Holland, K., Wiedermann, M., 2006. Nitrogen critical loads for alpine
vegetation and terrestrial ecosystem response: are we there yet? Ecological Applications 16 (3), 1183-
1193.
BP 2015. Statistical Review of World Energy. http://www.bp.com/en/global/corporate/energy-
economics/statistical-review-of-world-energy.html
Bragazza, L., Tahvanainen, T., Kutnar, L., Rydin, H., Limpens, J., Hajek, M., Grosvernier, P., Hajek, T.,
Hajkova, P., Hansen, I., Iacumin, P., Gerdol, R., 2004. Nutritional constraints in ombrotrophic Sphagnum
plants under increasing atmospheric nitrogen deposition in Europe. New Phytologist 163, 609-616.
Brink, C., van Grinsven, H., and contributing authors, 2011. Cost and benefits of nitrogen in the
environment. In The European nitrogen assessment: sources, effects and policy perspectives (eds MA
Sutton, CM Howard, JW Erisman, G Billen, A Bleeker, P Grennfelt, H van Grinsven, B Grizzetti), pp. 513-
540. Cambridge, UK: Cambridge University Press.
Britton, A.J. and Fisher, J.M., 2010. Terricolous alpine lichens are sensitive to both load and
concentration of applied nitrogen and have potential as bioindicators of nitrogen deposition.
Environmental Pollution 158, 1296-1302.
Chapter 1
62
Butterbach-Bahl, K., Gundersen, P., and contributing authors, 2011. Nitrogen processes in terrestrial
ecosystems. In The European nitrogen assessment: sources, effects and policy perspectives (eds MA
Sutton, CM Howard, JW Erisman, G Billen, A Bleeker, P Grennfelt, H van Grinsven, B Grizzetti), pp. 99–
125. Cambridge, UK: Cambridge University Press.
Bytnerowicz, A., Johnson, R.F., Zhang, L., Jenerette, G.D., Fenn, M.E., Schilling, S.L., González-Fernández,
I., 2015. An empirical inferential method of estimating nitrogen deposition to Mediterranean-type
ecosystems: The San Bernardino Mountains case study. Environmental Pollution 203, 69-88.
Calvete-Sogo, H., Elvira, S., Sanz, J., González-Fernández, I., García-Gómez, H., Sanchez-Martin, L.,
Alonso, R., Bermejo-Bermejo, V., 2014. Current ozone levels threaten gross primary production and yield
of Mediterranean annual pastures and nitrogen modulates the response. Atmospheric Environment 95,
197-206.
Camargo, J. A., Alonso, A., 2006. Ecological and toxicological effects of inorganic nitrogen pollution in
aquatic ecosystems: A global assessment. Environment International 32, 831–849.
Cape, J.N., Kirika, A., Rowland, A.P., Wilson, D.R., Jickells, T.D., Cornell, S., 2001. Organic nitrogen in
precipitation: Real problem or sampling artefact? The Scientific World Journal 1, 230-237.
Cape, J.N., Anderson, M., Rowland, A.P., Wilson, D., 2004. Organic nitrogen in precipitation across the
United Kingdom. Water, Air and Soil Pollution 4, 25-35.
Cape, J.N., van der Eerden, L.J., Sheppard, L.J., Leith, I.D., Sutton, M.A., 2009. Evidence for changing the
critical level for ammonia. Environmental Pollution 157, 1033-1037.
Cape, J.N., Cornell, S.E., Jickells, T.D., Nemitz, E., 2011. Organic nitrogen in the atmosphere - where does
it come from? A review of sources and methods. Atmospheric Research 102, 30-48.
Cape, J.N., Tang, Y.S., González-Benítez, J.M., Mitosinkova, M., Makkonen, U., Jocher, M., Stolk, A., 2012.
Organic nitrogen in precipitation across Europe. Biogeosciences 9, 4401-4409.
Carozzi, M., Ferrara, R. M., Rana, G., Acutis, M., 2013. Evaluation of mitigation strategies to reduce
ammonia losses from slurry fertilisation on arable lands. Science of the Total Environment 449 (2013)
126–133.
Cernusak, L.A., Ubierna, N., Winter, K., Holtum, J.A.M., Marshall, J.D., Farquhar, G.D., 2013.
Environmental and physiological determinants of carbon isotope discrimination in terrestrial plants.
New Phytologist 200, 950-965.
Chen, H., Chen, L., Chiang, Z., Hung, C., Lin, F., Chou, W., Gong, G., Wen, L., 2010. Size fractionation and
molecular composition of water-soluble inorganic and organic nitrogen in aerosols of a coastal
environment. Journal of Geophysical Research-Atmospheres 115, D22307.
Clair, T.A., Blett, T., Aherne, J., Aidar, M.P.M., Artz, R., Bealey, W.J., budd, W., Cape, J.N., Curtis, C.J.,
Duan, L., Fenn, M.E., Groffman, P., Haeuber, R., Hall, J.R., Hettelingh, J.P., López-Hernández, D.,
Mathieson, S., Pardo, L., Posch, M., Pouyat, R.V., Spranger, T., Sverdrup, H., van Dobben, H., van
Hinsbert, A., 2014. Chapter 50: The critical loads and level approach for nitrogen. In: Sutton, M.A., K.E.
Mason, L.J. Sheppard, H. Sverdrup, R. Haeuber, and W.K. Hicks (eds.), Nitrogen Deposition, Critical Loads
and Biodiversity. Springer. pp. 481-491. ISBN 978-94-007-79. DOI: 10.1007/978-94-007-7939-6_50.

General Introduction
63
Clark, C.M. and Tilman, D., 2008. Loss of plant species after chronic low-level nitrogen deposition to
prairie grasslands. Nature 451, 712-715.
Clarke N, Zlindra D, Ulrich E, Mosello R, Derome J, Derome K, Konig N, Lovblad G, Draaijers GPJ, Hansen
K, Thimonier A, Waldner P, 2010: Sampling and Analysis of Deposition. 66 pp. Part XIV. In: Manual on
methods and criteria for harmonized sampling, assessment, monitoring and analysis of the effects of air
pollution on forests. UNECE, ICP Forests, Hamburg. ISBN: 978-3-926301-03-1. [http://www.icp-
forests.org/Manual.htm]
Clarkson, B.R., Schipper, L.A., Moyersoen, B., Silvester, W.B., 2005. Foliar N-15 natural abundance
indicates phosphorus limitation of bog species. Oecologia 144, 550-557.
Compton, J.E., Harrison, J.A., Dennis, R.L., Greaver, T.L., Hill, B.H., Jordan, S.J., Walker, H., Campbell,
H.V., 2011. Ecosystem services altered by human changes in the nitrogen cycle: A new perspective for
US decision making. Ecology Letters 14, 804-815.
Cornell, S.E., Jickells, T.D., Cape, J.N., Rowland, A.P., Duce, R.A., 2003. Organic nitrogen deposition on
land and coastal environments: A review of methods and data. Atmospheric Environment 37, 2173-
2191.
Cornell, S.E., 2011. Atmospheric nitrogen deposition: Revisiting the question of the importance of the
organic component. Environmental Pollution 159, 2214-2222.
Cruz, J.V., Pacheco, D., Porteiro, J., Cymbron, R., Mendes, S., Malcata, A., Andrade, C., 2015. Sete cidades
and furnas lake eutrophication (sao miguel, azores): Analysis of long-term monitoring data and
remediation measures. Science of the Total Environment 520, 168-186.
Davidson, E.A. and Kanter, D., 2014. Inventories and scenarios of nitrous oxide emissions. Environmental
Research Letters 9, 105012.
Dawson, T.E. and Simonin, K.A., 2011. The roles of stable isotopes in forest hydrology and
biogeochemistry. Forest Hydrology and Biogeochemistry: Synthesis of Past Research and Future
Directions 216, 137-161.
de Caritat, P., Reimann, C., Bogatyrev, I., Chekushin, V., Finne, T.E., Halleraker, J.H., Kashulina, G.,
Niskavaara, H., Pavlov, V., Ayras, M., 2001. Regional distribution of Al, B, Ba, K, La, Mg, Mn, Na, P, Rb, Si,
Sr, Th, U and Y in terrestrial moss within a 188,000 km2 area of the Central Barents region: Influence of
geology, sea spray and human activity. Applied Geochemistry 16, 137-159.
de Vries, W., Solberg, S., Dobbertin, M., Sterba, H., Laubhann, D., van Oijen, M., Evans, C., Gundersen, P.,
Kros, J., Wamelink, G.W.W., Reinds, G.J., Sutton, M.A., 2009. The impact of nitrogen deposition on
carbon sequestration by european forests and heathlands. Forest Ecology and Management 258, 1814-
1823.
de Vries, W., Du, E., Butterbach-Bahl, K., 2014. Short and long-term impacts of nitrogen deposition on
carbon sequestration by forest ecosystems. Current Opinion in Environmental Sustainability 9-10, 90-
104.
Chapter 1
64
de Vries, W., Kros, J., Dolman, M.A., Vellinga, T.V., de Boer, H.C., Gerritsen, A.L., Sonneveld, M.P.W.,
Bouma, J., 2015. Environmental impacts of innovative dairy farming systems aiming at improved internal
nutrient cycling: A multi-scale assessment. The Science of the Total Environment 536, 432-42.
Dentener, F., Vet, R., Dennis, R.L., Du, E., Kulshrestha, U.C., Galy-Lacaux, C., 2014. Chapter 2: Progress in
Monitoring and Modelling Estimates of Nitrogen Deposition at Local, Regional and Global Scales. In:
Sutton, M.A., K.E. Mason, L.J. Sheppard, H. Sverdrup, R. Haeuber, and W.K. Hicks (eds.), Nitrogen
Deposition, Critical Loads and Biodiversity. Springer. pp. 7-22. ISBN 978-94-007-79. DOI: 10.1007/978-
94-007-7939-6_2.
Diaz, R.J., 2001. Overview of hypoxia around the world. Journal of environmental quality 30, 275-281.
Dise, N.B., and contributing authors, 2011. Nitrogen as a threat to European terrestrial biodiversity. In
The European nitrogen assessment: sources, effects and policy perspectives (eds MA Sutton, CM
Howard, JW Erisman, G Billen, A Bleeker, P Grennfelt, H van Grinsven, B Grizzetti), pp. 463-494.
Cambridge, UK: Cambridge University Press.
Du, Y., Guo, P., Liu, J., Wang, C., Yang, N., Jiao, Z., 2014a. Different types of nitrogen deposition show
variable effects on the soil carbon cycle process of temperate forests. Global Change Biology 20, 3222-
3228.
Du, E., Liu, X., Fang, J., 2014b. Effects of nitrogen additions on biomass, stoichiometry and nutrient pools
of moss Rhytidium rugosum in a boreal forest in northeast China. Environmental Pollution 188, 166-171.
Durand, P., Breuer, L., Johnes, P.J., and contributing authors, 2011. Nitrogen processes in aquatic
ecosystems. In The European nitrogen assessment: sources, effects and policy perspectives (eds MA
Sutton, CM Howard, JW Erisman, G Billen, A Bleeker, P Grennfelt, H van Grinsven, B Grizzetti), pp. 126–
146. Cambridge, UK: Cambridge University Press.
EEA European Environment Agency, 2013. EEA Technical report nº10/2013. European Union emission
inventory report 1990-2011 under the UNECE Convention on Long-range Transboundary Air Pollution
(LRTAP). ISBN 978-92-9213-400-6; ISSN 1725-2237; DOI: 10.2800/44480.
EEA European Environment Agency, 2014a. Indicator assessment, Data and maps: Nitrogen oxides (NOx)
emissions. Published Jan 2014, Last modified Sep 2015. http://www.eea.europa.eu/data-and-
maps/indicators/eea-32-nitrogenoxides-nox-emissions-1/assessment.2010-08-19.0140149032-3
EEA European Environment Agency 2014b. EEA Technical report nº10/2014. NEC Directive status report
2013. Reporting by Member States under Directive 2001/81/EC of the European Parliament and of the
Council of 23 October 2001 on national emission ceilings for certain atmospheric pollutants. ISBN 978-
92-9213-462-4; ISSN 1725-2237; DOI: 10.2800/18346.
EEA European Environment Agency, 2015. Emission of the main air pollutants in Europe (CSI 040/APE
010). http://www.eea.europa.eu/data-and-maps/indicators/main-anthropogenic-air-pollutant-
emissions/assessment
Egerton-Warburton, L.M., Graham, R.C., Allen, E.B., Allen, M.F., 2001. Reconstruction of the historical
changes in mycorrhizal fungal communities under anthropogenic nitrogen deposition. Proceedings of
the Royal Society B-Biological Sciences 268, 2479-2484.
General Introduction
65
Ehhalt, D., Prather, M., Dentener, F., Derwent, R., Dlugokencky, E., Holland, E., Isaksen, I., Katima, J.,
Kirchhoff, V., Matson, P., Midgley, P., Wang, M., 2001. Chapter 4: Atmospheric chemistry and
greenhouse gases. In: Climate change 2001: The Scientific Basis. Contribution of Working Group I to the
Third Assessment Report of the Intergovernmental Panel on Climate Change [Houghton, J.T.,Y. Ding, D.J.
Griggs, M. Noguer, P.J. van der Linden, X. Dai, K. Maskell, and C.A. Johnson (eds.)]. Cambridge University
Press, Cambridge, United Kingdom and New York, NY, USA, 881pp.
Elser, J.J., Bracken, M.E.S., Cleland, E.E., Gruner, D.S., Harpole, W.S., Hillebrand, H., Ngai, J.T., Seabloom,
E.W., Shurin, J.B., Smith, J.E., 2007. Global analysis of nitrogen and phosphorus limitation of primary
producers in freshwater, marine and terrestrial ecosystems. Ecology Letters 10, 1135-1142.
Erisman, J. W., Bleeker, A., Galloway, J., Sutton, M. S., 2007. Reduced nitrogen in ecology and the
environment. Environmental Pollution 150, 140-149.
Erisman, J.W., Sutton, M.A., Galloway, J., Klimont, Z., Winiwarter, W., 2008. How a century of ammonia
synthesis changed the world. Nature Geoscience 1, 636-639.
Erisman, J. W., Galloway, J., Seitzinger, S., Bleeker, A., Butterbach-Bahl, K., 2011. Reactive nitrogen in the
environment and its effect on climate change. Current Opinion in Environmental Sustainability, 3:281–
290.
Erisman JW, Galloway JN, Seitzinger S, Bleeker A, Dise NB, Petrescu AMR, Leach AM, de Vries W. 2013.
Consequences of human modification of the global nitrogen cycle. Philosophical Transactions of the
Royal Society B 368: 20130116. http://dx.doi.org/10.1098/rstb.2013.0116
Erisman, J.W., Dammers, E., van Damme, M., Soudzilovskaia, N., Schaap, M., 2015. Trends in EU nitrogen
deposition and impacts on ecosystems. An overview of the achievements and the current state of
knowledge on reactive nitrogen in Europe, focusing on deposition, critical load exceedances, and
modeled and measured trends. Air and waste management association. http://awma.org (September
2015).
Eshetu, Z., Giesler, R., Hogberg, P., 2004. Historical land use pattern affects the chemistry of forest soils
in the Ethiopian highlands. Geoderma 118, 149-165.
Eurostat, 2012. Agri-environmental indicator – ammonia emissions. Source: Statistics Explained.
http://ec.europa.eu/eurostat/statistics-explained/index.php/Agri-environmental_indicator_-
_ammonia_emissions
Eurostat, 2013. Agriculture – ammonia emission statistics. Source: Statistics Explained.
http://ec.europa.eu/eurostat/statistics-explained/index.php/Agriculture_-
_ammonia_emission_statistics
Evans, R.D., 2001. Physiological mechanisms influencing plant nitrogen isotope composition. Trends in
Plant Science 6, 121-126.
Farquhar, G., Oleary, M., Berry, J., 1982. On the relationship between carbon isotope discrimination and
the inter-cellular carbon-dioxide concentration in leaves. Australian Journal of Plant Physiology 9, 121-
137.

Chapter 1
66
Farquhar, G.D., Ehleringer, J.R., Hubick, K.T., 1989. Carbon isotope discrimination and photosynthesis.
Annual Review of Plant Physiology and Plant Molecular Biology 40, 503-537.
Fenn, M.E., Poth, M.A., Johnson, D.W., 1996. Evidence for nitrogen saturation in the San Bernardino
Mountains in southern California. Forest Ecology and Management 82, 211-230.
Fenn, M.E., Baron, J.S., Allen, E.B., Rueth, H.M., Nydick, K.R., Geiser, L., Bowman, W.D., Sickman, J.O.,
Meixner, T., Johnson, D.W., Neitlich, P., 2003. Ecological effects of nitrogen deposition in the western
United States. BioScience Vol. 53, 4.
Fenn, M.E. and Poth, M.A., 2004. Monitoring nitrogen deposition in throughfall using ion exchange resin
columns: A field test in the San Bernardino Mountains. Journal of Environmental Quality 33, 2007-2014.
Fenn, M.E., Sickman, J.O., Bytnerowicz, A., Clow, D.W., Molotch, N.P., Pleim, J.E., Tonnesen, G.S.,
Weathers, K.C., Padgett, P.E., Campbell, D.H., 2009. Chapter 8: Methods for measuring atmospheric
nitrogen deposition inputs in arid and montane ecosystems of western North America. In: Legge, A.H.
(editor), Developments in Environmental Science, Vol. 9. Elsevier Ltd. ISSN 1474-8177. DOI:
10.1016/S1474-8177(08)00208-8.
Fenn, M.E., Nagel, H.D., Koseva, I., Aherne, J., Jovan, S.E., Geiser, L.H., Schlutow, A., Scheuschner, T.,
Bytnerowicz, B.S., Gimeno, S.G., Yuan, F., Watmough, S.A., Allen, E.B., Johnson, R.F., Meixner, T., 2014.
Chapter 38: A comparison of Empirical and Modelled Nitrogen Critical Loads for Mediterranean Forests
and Shrublands in California. In: Sutton, M.A., K.E. Mason, L.J. Sheppard, H. Sverdrup, R. Haeuber, and
W.K. Hicks (eds.), Nitrogen Deposition, Critical Loads and Biodiversity. Springer. pp. 357-368. ISBN 978-
94-007-79. DOI: 10.1007/978-94-007-7939-6_38.
Feng, Z., Paoletti, E., Bytnerowicz, A., Harmens, H., 2015a. Ozone and plants. Environmental Pollution
202, 215-216.
Feng, Z., Hu, E., Wang, X., Jiang, L., Liu, X., 2015b. Ground-level O3 pollution and its impacts on food
crops in China: A review. Environmental Pollution 199, 42-48.
Fernández, J.A., Ederra, A., Nunez, E., Martínez-Abaigar, J., Infante, M., Heras, R., Elías, M.J., Mazimpaka,
V., Carballeira, A., 2002. Biomonitoring of metal deposition in northern Spain by moss analysis. Science
of the Total Environment 300, 115-127.
Fields, S., 2004. Global Nitrogen: Cycling out of Control. Environmental Health Perspectives. 112(10),
A556-A563.
Flechard, C. R., Nemitz, E., Smith, R. I., Fowler, D., Vermeulen, A. T., Bleeker, A., Erisman, J. W.,
Simpson, D., Zhang, L., Tang, Y. S., and Sutton, M. A., 2011. Dry deposition of reactive nitrogen to
European ecosystems: a comparison of inferential models across the NitroEurope network, Atmospheric
Chemistry and Physics, 11, 2703-2728, doi:10.5194/acp-11-2703-2011.
Foan, L., Leblond, S., Thöni, L., Raynaud, C., Santamaría, J.M., Sebilo, M., Simon, V., 2014. Spatial
distribution of PAH concentrations and stable isotope signatures (delta C-13, delta N-15) in mosses from
three European areas - characterization by multivariate analysis. Environmental Pollution 184, 113-122.
Forster, P., V. Ramaswamy, P. Artaxo, T. Berntsen, R. Betts, D.W. Fahey, J. Haywood, J. Lean, D.C. Lowe,
G. Myhre, J. Nganga, R. Prinn, G. Raga, M. Schulz and R. Van Dorland, 2007. Chapter 2: Changes in

General Introduction
67
Atmospheric Constituents and in Radiative Forcing. In: Climate Change 2007: The Physical Science Basis.
Contribution of Working Group I to the Fourth Assessment Report of the Intergovernmental Panel on
Climate Change [Solomon, S., D. Qin, M. Manning, Z. Chen, M. Marquis, K.B. Averyt, M.Tignor and H.L.
Miller (eds.)]. Cambridge University Press, Cambridge, United Kingdom and New York, NY, USA, 996pp.
Fowler, D., Pilegaard, K., Sutton, M.A., Ambus, P., Raivonen, M., Duyzer, J., Simpson, D., Fagerli, H., Fuzzi,
S., Schjoerring, J.K., Granier, C., Neftel, A., Isaksen, I.S.A., Laj, P., Maione, M., Monks, P.S., Burkhardt, J.,
Daemmgen, U., Neirynck, J., Personne, E., Wichink-Kruit, R., Butterbach-Bahl, K., Flechard, C., Tuovinen,
J.P., Coyle, M., Gerosa, G., Loubet, B., Altimir, N., Gruenhage, L., Ammann, C., Cieslik, S., Paoletti, E.,
Mikkelsen, T.N., Ro-Poulsen, H., Cellier, P., Cape, J.N., Horvath, L., Loreto, F., Niinemets, U., Palmer, P.I.,
Rinne, J., Misztal, P., Nemitz, E., Nilsson, D., Pryor, S., Gallagher, M.W., Vesala, T., Skiba, U.,
Brueggemann, N., Zechmeister-Boltenstern, S., Williams, J., O'Dowd, C., Facchini, M.C., de Leeuw, G.,
Flossman, A., Chaumerliac, N., Erisman, J.W., 2009. Atmospheric composition change: Ecosystems-
atmosphere interactions. Atmospheric Environment 43, 5193-5267.
Fowler D et al. 2013. The global nitrogen cycle in the twenty-first century. . Philosophical Transactions of
the Royal Society B 368: 20130164. http://dx.doi.org/10.1098/rstb.2013.0164.
Fowler, D., Steadman, C. E., Stevenson, D., Coyle, M., R. M. Rees, R. M., Skiba, U. M., Sutton, M. A.,1,
Cape, J. N., Dore, A. J., Vieno, M., Simpson, D., Zaehle, S., Stocker, B. D., Rinaldi, M., Facchini, M. C.,
Flechard, C. R.,Nemitz, E., Twigg, M., Erisman, J. W., Galloway, J. N., 2015. Effects of global change
during the 21st century on the nitrogen cycle. Atmospheric Chemistry and Physics Discussion 15, 1747–
1868. DOI:10.5194/acpd-15-1747-2015.
Galloway, J. N., 1998. The global nitrogen cycle: changes and consequences. Environmental Pollution
102, S1, 15-24.
Galloway, J. N., Cowling, E. B., 2002. Reactive Nitrogen and The World: 200 Years of Change. Ambio
31(2), 64-71. DOI: http://dx.doi.org/10.1579/0044-7447-31.2.64.
Galloway, J.N., Aber, J.D., Erisman, J.W., Seitzinger, S.P., Howarth, R.W., Cowling, E.B., Cosby, B.J., 2003.
The nitrogen cascade. Bioscience 53 (4), 341-356.
Galloway, J.N., Dentener, F.J., Capone, D.G., Boyer, E.W., Howarth, R.W., Seitzinger, S.P., Asner, G.P.,
Cleveland, C.C., Green, P.A., Holland, E.A., Karl, D.M., Michaels, A.F., Porter, J.H., Townsend, A.R.,
Vorosmarty, C.J., 2004. Nitrogen cycles: Past, present, and future. Biogeochemistry 70, 153-226.
Galloway, J.N., Townsend, A.R., Erisman, J.W., Bekunda, M., Cai, Z., Freney, J.R., Martinelli, L.A.,
Seitzinger, S.P., Sutton, M.A., 2008. Transformation of the nitrogen cycle: Recent trends, questions, and
potential solutions. Science 320, 889-892.
Galloway JN, Leach AM, Bleeker A, Erisman JW. 2013 A chronology of human understanding of the
nitrogen cycle. Philosophical Transactions of the Royal Society B 368: 20130120.
Galloway, J.N., Winiwarter, W., Leip, A., Leach, A.M., Bleeker, A., Erisman, J.W., 2014. Nitrogen
footprints: Past, present and future. Environmental Research Letters 9, 115003.
Gandois, L., Agnan, Y., Leblond, S., Sejalon-Delmas, N., Le Roux, G., Probst, A., 2014. Use of geochemical
signatures, including rare earth elements, in mosses and lichens to assess spatial integration and the
influence of forest environment. Atmospheric Environment 95, 96-104.

Chapter 1
68
García-Gómez, H., Garrido, J.L., Vivanco, M.G., Lassaletta, L., Rábago, I., Àvila, A., Tsyro, S., Sánchez, G.,
González Ortiz, A., González-Fernández, I., Alonso, R., 2014. Nitrogen deposition in Spain: Modeled
patterns and threatened habitats within the natura 2000 network. Science of the Total Environment
485, 450-460.
Gerdol, R., Bragazza, L., Marchesini, R., Alber, R., Bonetti, L., Lorenzoni, G., Achilli, M., Buffoni, A., De
Marco, N., Franchi, M., Pison, S., Giaquinta, S., Palmieri, F., Spezzano, P., 2000. Monitoring of heavy
metal deposition in northern Italy by moss analysis. Environmental Pollution 108, 201-208.
Gerdol, R., Bragazza, L., Marchesini, R., Medici, A., Pedrini, P., Benedetti, S., Bovolenta, A., Coppi, S.,
2002. Use of moss (Tortula muralis Hedw.) for monitoring organic and inorganic air pollution in urban
and rural sites in northern Italy. Atmospheric Environment 36, 4069-4075.
Godfray, H.C.J., Beddington, J.R., Crute, I.R., Haddad, L., Lawrence, D., Muir, J.F., Pretty, J., Robinson, S.,
Thomas, S.M., Toulmin, C., 2010. Food security: The challenge of feeding 9 billion people. Science 327,
812-818.
González-Benítez, J.M., Cape, J.N., Heal, M.R., van Dijk, N., Diez, A.V., 2009. Atmospheric nitrogen
deposition in south-east Scotland: Quantification of the organic nitrogen fraction in wet, dry and bulk
deposition. Atmospheric Environment 43, 4087-4094.
González-Miqueo, L., Elustondo, D., Lasheras, E., Bermejo, R., Santamaría, J.M., 2010. Heavy metal and
nitrogen monitoring using moss and topsoil samples in a Pyrenean forest catchment. Water Air and Soil
Pollution 210, 335-346.
Gramatica, P., Battaini, F., Giani, E., Papa, E., Jones, R.J.A., Preatoni, D., Cenci, R.M., 2006. Analysis of
mosses and soils for quantifying heavy metal concentrations in sicily: A multivariate and spatial
analytical approach. Environmental Science and Pollution Research 13, 28-36.
Granier, C., Bessagnet, B., Bond, T., D'Angiola, A., van der Gon, H.D., Frost, G.J., Heil, A., Kaiser, J.W.,
Kinne, S., Klimont, Z., Kloster, S., Lamarque, J., Liousse, C., Masui, T., Meleux, F., Mieville, A., Ohara, T.,
Raut, J., Riahi, K., Schultz, M., Smith, S.J., Thompson, A., van Aardenne J., van der Werf, G.R., van
Vuuren, D.P., 2011. Evolution of anthropogenic and biomass burning emissions of air pollutants at global
and regional scales during the 1980 – 2010 period. Climatic Change 109, 163-190. DOI 10.1007/s10584-
011-0154-1.
Grizzeti, B., and contributing authors, 2011. Nitrogen as a threat to European water quality. In The
European nitrogen assessment: sources, effects and policy perspectives (eds MA Sutton, CM Howard,
JW Erisman, G Billen, A Bleeker, P Grennfelt, H van Grinsven, B Grizzetti), pp. 379–404. Cambridge, UK:
Cambridge University Press.
Grantz, D.A., Garner, J.H.B., Johnson, D.W., 2003. Ecological effects of particulate matter. Environment
international 29, 213-239.
Grodzinska, K., Szarek, G., Godzik, B., 1990. Heavy-metal deposition in polish national-parks - changes
during 10 years. Water Air and Soil Pollution 49, 409-419.
Gu, B., Chang, J., Min, Y., Ge, Y., Zhu, Q., Galloway, J.N., Peng, C., 2013. The role of industrial nitrogen in
the global nitrogen biogeochemical cycle. Scientific Reports 3, 2579.
General Introduction
69
Gundersen, P., Callesen, I., de Vries, W., 1998. Nitrate leaching in forest ecosystems is related to forest
floor C/N ratios. Environmental Pollution 102, 403-407.
Hagedorn, F., Spinnler, D., Siegwolf, R., 2003. Increased N deposition retards mineralization of old soil
organic matter. Soil Biology & Biochemistry 35, 1683-1692.
Hallsworth, S., Dore, A.J., Bealey, W.I., Dragosits, U., Vieno, M., Hellsten, S., Tang, Y.S., Sutton, M.A.,
2010. The role of indicator choice in quantifying the threat of atmospheric ammonia to the 'Natura
2000' network. Environmental Science & Policy 13, 671-687.
Hameed, S. and Dignon, J., 1988. Changes in the geographical distributions of global emissions of NOx
and SOx from fossil-fuel combustion between 1966 and 1980. Atmospheric Environment 22, 441-449.
Harmens, H., Norris, D., and the participants of the moss survey Programme Coordination Centre for the
ICP Vegetation, 2008. Spatial and temporal trends in heavy metal accumulation in mosses in Europe
(1990-2005). Working Group (WGE) on Effects of the Convention on Long-range Transboundary Air
Pollution. Publisher: Centre for Ecology & Hydrology, Natural Environment Research Council, Bangor,
UK. ISBN: 978-1-85531-239-5.
Harmens, H., Norris, D.A., Steinnes, E., Kubin, E., Piispanen, J., Alber, R., Aleksiayenak, Y., Blum, O.,
Coskun, M., Dam, M., De Temmerman, L., Fernández, J.A., Frolova, M., Frontasyeva, M., González-
Miqueo, L., Grodzinska, K., Jeran, Z., Korzekwa, S., Krmar, M., Kvietkusr, K., Leblond, S., Liiv, S.,
Magnusson, S.H., Mankovska, B., Pesch, R., Ruehling, A., Santamaría, J.M., Schröder, W., Spiric, Z.,
Suchara, I., Thöni, L., Urumov, V., Yurukova, L., Zechmeister, H.G., 2010. Mosses as biomonitors of
atmospheric heavy metal deposition: Spatial patterns and temporal trends in Europe. Environmental
Pollution 158, 3144-3156.
Harmens, H., Norris, D.A., Cooper, D.M., Mills, G., Steinnes, E., Kubin, E., Thöni, L., Aboal, J.R., Alber, R.,
Carballeira, A., Coskun, M., De Temmerman, L., Frolova, M., González-Miqueo, L., Jeran, Z., Leblond, S.,
Liiv, S., Mankovska, B., Pesch, R., Poikolainen, J., Ruhling, A., Santamaría, J.M., Simoneie, P., Schröder,
W., Suchara, I., Yurukova, L., Zechmeister, H.G., 2011. Nitrogen concentrations in mosses indicate the
spatial distribution of atmospheric nitrogen deposition in Europe. Environmental Pollution 159, 2852-
2860.
Harmens, H., Foan, L., Simon, V., Mills, J., 2013. Terrestrial mosses as biomonitors of atmospheric POPs
pollution: A review. Environmental Pollution 173, 245-254.
Harmens, H., Schnyder, E., Thöni, L., Cooper, D.M., Mills, G., Leblond, S., Mohr, K., Poikolainen, J.,
Santamaría, J., Skudnik, M., Zechmeister, H.G., Lindroos, A., Hanus-Illnar, A., 2014. Relationship between
site-specific nitrogen concentrations in mosses and measured wet bulk atmospheric nitrogen deposition
across Europe. Environmental Pollution 194, 50-9.
Harmens, H., Mills, G., Hayes, F., Norris, D., Sharps, K., 2015. Twenty eight years of ICP Vegetation: an
overview of its activities. Annali di Botanica (Roma), 5, 31-43.
Heaton, T.H.E., 1986. Isotopic studies of nitrogen pollution in the hydrosphere and atmosphere - a
review. Chemical Geology 59, 87-102.
Heaton, T.H.E., 1987. 15N/14N ratios of nitrate and ammonium in rain at Pretoria South Africa.
Atmospheric Environment 21, 842-852.
Chapter 1
70
Heaton, T.H.E., 1990. 15
N/14
N ratios of nitrogen oxides from vehicle engines and coal-fired power
stations. Tellus Series B Chemical and Physical Meteorology 42, 304-307.
Heffer, P., and Prud’homme, M., 2014. International Fertilizer Industry Association (IFA). Fertilizer
outlook 2014 – 2018. www.fertilizer.org
Helliwell, R.C., Wright, R.F., Jackson-Blake, L.A., Ferrier, R.C., Aherne, J., Cosby, B.J., Evans, C.D., Forsius,
M., Hruska, J., Jenkins, A., Kram, P., Kopáček, J., Majer, V., Moldan, F., Posch, M., Potts, J.M., Rogora, M.,
Schoepp, W., 2014. Assessing recovery from acidification of european surface waters in the year 2010:
Evaluation of projections made with the MAGIC model in 1995. Environmental Science & Technology 48,
13280-13288.
Hertel,O., and contributing authors, 2011. Nitrogen processes in the atmosphere. In The European
nitrogen assessment: sources, effects and policy perspectives (eds MA Sutton, CM Howard, JW Erisman,
G Billen, A Bleeker, P Grennfelt, H van Grinsven, B Grizzetti), pp. 177–207. Cambridge, UK: Cambridge
University Press.
Hertel, O., Skjøth, C. A., Reis, S., Bleeker, A., Harrison, R. M., Cape, J. N., Fowler, D., Skiba, U., Simpson,
D., Jickells, T., Kulmala, M., Gyldenkærne, S., Sørensen, L. L., Erisman, J. W., Sutton, M. A., 2012.
Governing processes for reactive nitrogen compounds in the European atmosphere. Biogeosciences, 9,
4921–4954. doi:10.5194/bg-9-4921-2012.
Higashi, H., Koshikawa, H., Murakamib, S., Kohataa, K., Mizuochia, M., Tsujimotoc, T., 2012. Effects of
land-based pollution control on coastal hypoxia: a numerical case study of integrated coastal area and
river basin management in Ise Bay, Japan. Procedia Environmental Sciences 13, 232 – 241.
Hobbie, E.A. and Högberg, P., 2012. Nitrogen isotopes link mycorrhizal fungi and plants to nitrogen
dynamics. New Phytologist 196, 367-382.
Hogan, E. J., Minnullina, G., Sheppard, L. J., Leith, I. D., and Crittenden, P. D., 2010a. Response of
phosphomonoesterase activity in the lichen Cladonia portentosa to nitrogen and phosphorus
enrichment in a field manipulation experiment. New Phytologist. doi:10.1111/j.1469-
8137.2010.03221.x.
Hogan, E. J., Minullina, G., Smith, R. I., and Crittenden, P. D., 2010b. Effects of nitrogen enrichment on
phosphatase and nitrogen: phosphorus relationships in Cladonia portentosa. New Phytologist.
doi:10.1111/j.1469-8137.2010.03222.x.
Högberg, P., 1997. Tansley review no 95 - N-15 natural abundance in soil-plant systems. New Phytologist
137, 179-203.
Hyvonen, R., Agren, G.I., Linder, S., Persson, T., Cotrufo, M.F., Ekblad, A., Freeman, M., Grelle, A.,
Janssens, I.A., Jarvis, P.G., Kellomaki, S., Lindroth, A., Loustau, D., Lundmark, T., Norby, R.J., Oren, R.,
Pilegaard, K., Ryan, M.G., Sigurdsson, B.D., Stromgren, M., van Oijen, M., Wallin, G., 2007. The likely
impact of elevated [CO2], nitrogen deposition, increased temperature and management on carbon
sequestration in temperate and boreal forest ecosystems: A literature review. New Phytologist 173,
463-480.
General Introduction
71
IFA and FAO, 2001. International Fertilizer Industry Association and Food and Agriculture Organization of
the United Nations. Rome 2001. Global estimates of gaseous emissions of NH3, NO and N2O from
agricultural land. ISBN 92-5-104689-1.
IFA: International Fertilizer Industry Association statistics databases, 2015.
http://www.fertilizer.org/Statistics (last updated June 2015).
Isaksen, I.S.A., Granier, C., Myhre, G., Berntsen, T.K., Dalsoren, S.B., Gauss, M., Klimont, Z., Benestad, R.,
Bousquet, P., Collins, W., Cox, T., Eyring, V., Fowler, D., Fuzzi, S., Joeckel, P., Laj, P., Lohmann, U.,
Maione, M., Monks, P., Prevot, A.S.H., Raes, F., Richter, A., Rognerud, B., Schulz, M., Shindell, D.,
Stevenson, D.S., Storelvmo, T., Wang, W.-., van Weele, M., Wild, M., Wuebbles, D., 2009. Atmospheric
composition change: Climate-chemistry interactions. Atmospheric Environment 43, 5138-5192.
Izquierdo, R. and Àvila, A., 2012. Comparison of collection methods to determine atmospheric
deposition in a rural Mediterranean site (NE Spain). Journal of Atmospheric Chemistry 69, 351-368.
Jaegle, L., Steinberger, L., Martin, R.V., Chance, K., 2005. Global partitioning of NOx sources using
satellite observations: Relative roles of fossil fuel combustion, biomass burning and soil emissions.
Faraday discussions 130, 407-423.
Jamali, H., Quayle, W.C., Baldock, J., 2015. Reducing nitrous oxide emissions and nitrogen leaching losses
from irrigated arable cropping in australia through optimized irrigation scheduling. Agricultural and
Forest Meteorology 208, 32-39.
Jarvis, S., and contributing authors, 2011. Nitrogen flows in farming systems across Europe. In The
European nitrogen assessment: sources, effects and policy perspectives (eds MA Sutton, CM Howard,
JW Erisman, G Billen, A Bleeker, P Grennfelt, H van Grinsven, B Grizzetti), pp. 211–227. Cambridge, UK:
Cambridge University Press.
Jenkin, M.E. and Clemitshaw, K.C., 2000. Ozone and other secondary photochemical pollutants:
Chemical processes governing their formation in the planetary boundary layer. Atmospheric
Environment 34, 2499-2527.
Jensen, L.S., Schjoerring, J.K., and contributing authors, 2011. Benefits of nitrogen for food, fibre and
industrial production. In The European nitrogen assessment: sources, effects and policy perspectives
(eds MA Sutton, CM Howard, JW Erisman, G Billen, A Bleeker, P Grennfelt, H van Grinsven, B Grizzetti),
pp. 32–62. Cambridge, UK: Cambridge University Press.
Jickells, T., Baker, A.R., Cape, J.N., Cornell, S.E., Nemitz, E., 2013. The cycling of organic nitrogen through
the atmosphere. Philosophical Transactions of the Royal Society B-Biological Sciences 368.
Johnson, P.T.J., Townsend, A.R., Cleveland, C.C., Glibert, P.M., Howarth, R.W., McKenzie, V.J.,
Rejmankova, E., Ward, M.H., 2010. Linking environmental nutrient enrichment and disease emergence
in humans and wildlife. Ecological Applications 20, 16-29.
Johnson, P.T.J., Chase, J.M., Dosch, K.L., Hartson, R.B., Gross, J.A., Larson, D.J., Sutherland, D.R.,
Carpenter, S.R., 2007. Aquatic eutrophication promotes pathogenic infection in amphibians.
Proceedings of the National Academy of Sciences of the United States of America 104, 15781-15786.

Chapter 1
72
Keene, W.C., Montag, J.A., Maben, J.R., Southwell, M., Leonard, J., Church, T.M., Moody, J.L., Galloway,
J.N., 2002. Organic nitrogen in precipitation over eastern North America. Atmospheric Environment 36,
4529-4540.
Kopáček, J. and Posch, M., 2011. Anthropogenic nitrogen emissions during the holocene and their
possible effects on remote ecosystems. Global Biogeochemical Cycles 25, GB2017.
Kopáček, J., Hejzlar, J., Posch, M., 2013. Quantifying nitrogen leaching from diffuse agricultural and
forest sources in a large heterogeneous catchment. Biogeochemistry, 115:149–165 DOI
10.1007/s10533-013-9825-5.
Krupa, S. V., 2003. Effects of atmospheric ammonia (NH3) on terrestrial vegetation: a review.
Environmental Pollution 124, 179–221.
Kuenen, J.G., 2008. Anammox bacteria: From discovery to application. Nature Reviews Microbiology 6,
320-326.
Lamarque, J., Bond, T.C., Eyring, V., Granier, C., Heil, A., Klimont, Z., Lee, D., Liousse, C., Mieville, A.,
Owen, B., Schultz, M.G., Shindell, D., Smith, S.J., Stehfest, E., Van Aardenne, J., Cooper, O.R., Kainuma,
M., Mahowald, N., McConnell, J.R., Naik, V., Riahi, K., van Vuuren, D.P., 2010. Historical (1850-2000)
gridded anthropogenic and biomass burning emissions of reactive gases and aerosols: methodology and
application. Atmospheric Chemistry and Physics 10, 7017-7039.
Larssen, T., Lydersen, E., Tang, D.G., He, Y., Gao, J.X., Liu, H.Y., Duan, L., Seip, H.M., Vogt, R.D., Mulder, J.,
Shao, M., Wang, Y.H., Shang, H., Zhang, X.S., Solberg, S., Aas, W., Okland, T., Eilertsen, O., Angell, V., Liu,
Q.R., Zhao, D.W., Xiang, R.J., Xiao, J.S., Luo, J.H., 2006. Acid rain in China. Environmental science &
technology 40, 418-425.
Larssen, T. and Carmichael, G.R., 2000. Acid rain and acidification in China: The importance of base
cation deposition. Environmental Pollution 110, 89-102.
Lajtha, K. and Jones, J., 2013. Trends in cation, nitrogen, sulfate and hydrogen ion concentrations in
precipitation in the United States and Europe from 1978 to 2010: A new look at an old problem.
Biogeochemistry 116, 303-334.
Leith, I.D., Mitchell, R.J., Truscott, A., Cape, J.N., van Dijk, N., Smith, R.I., Fowler, D., Sutton, M.A., 2008.
The influence of nitrogen in stemflow and precipitation on epiphytic bryophytes, Isothecium
myosuroides Brid., Dicranum scoparium Hewd. and Thuidium tamariscinum (Hewd.) Schimp of Atlantic
oakwoods. Environmental Pollution 155, 237-246.
Leip, A., and contributing authors, 2011. Integrating nitrogen fluxes at the European scale. In The
European nitrogen assessment: sources, effects and policy perspectives (eds MA Sutton, CM Howard,
JW Erisman, G Billen, A Bleeker, P Grennfelt, H van Grinsven, B Grizzetti), pp. 345–376. Cambridge, UK:
Cambridge University Press.
Likens, G.E., Driscoll, C.T., Buso, D.C., 1996. Long-term effects of acid rain: Response and recovery of a
forest ecosystem. Science 272, 244-246.
General Introduction
73
Lindim, C., Becker, A., Grueneberg, B., Fischer, H., 2015. Modelling the effects of nutrient loads
reduction and testing the N and P control paradigm in a german shallow lake. Ecological Engineering 82,
415-427.
Lippo, H., Poikolainen, J., Kubin, E., 1995. The use of moss, lichen and pine bark in the nationwide
monitoring of atmospheric heavy metal deposition in Finland. Water Air and Soil Pollution 85, 2241-
2246.
Liu, X., Xiao, H., Liu, C., Li, Y., Xiao, H., 2008a. Tissue N content and N-15 natural abundance in epilithic
mosses for indicating atmospheric N deposition in the Guiyang area, SW China. Applied Geochemistry
23, 2708-2715.
Liu, X., Xiao, H., Liu, C., Li, Y., Xiao, H., 2008b. Stable carbon and nitrogen isotopes of the moss
Haplocladium microphyllum in an urban and a background area (SW China): The role of environmental
conditions and atmospheric nitrogen deposition. Atmospheric Environment 42, 5413-5423.
Liu, X., Xiao, H., Liu, C., Li, Y., Xiao, H., Wang, Y., 2010. Response of stable carbon isotope in epilithic
mosses to atmospheric nitrogen deposition. Environmental Pollution 158, 2273-2281.
Liu, X., Koba, K., Makabe, A., Li, X., Yoh, M., Liu, C., 2013. Ammonium first: Natural mosses prefer
atmospheric ammonium but vary utilization of dissolved organic nitrogen depending on habitat and
nitrogen deposition. New Phytologist 199, 407-419.
Lovett, G.M., Tear, T.H., Evers, D.C., Findlay, S.E.G., Cosby, B.J., Dunscomb, J.K., Driscoll, C.T., Weathers,
K.C., 2009. Effects of Air Pollution on Ecosystems and Biological Diversity in the Eastern United States.
The year in Ecology and Conservation Biology: Annals of the New York Academy of Sciences 1162, 99-
135. DOI: 10.1111/j.1749-6632.2009.04153.xc_2009
Mace, K.A., Artaxo, P., Duce, R.A., 2003a. Water-soluble organic nitrogen in Amazon Basin aerosols
during the dry (biomass burning) and wet seasons. Journal of Geophysical Research-Atmospheres 108,
D16, 4512. doi:10.1029/2003JD003557
Mace, K.A., Duce, R.A., Tindale, N.W., 2003b. Organic nitrogen in rain and aerosol at Cape Grim,
Tasmania, Australia. Journal of Geophysical Research-Atmospheres 108, D11, 4338.
doi:10.1029/2002JD003051
Mace, K.A., Kubilay, N., Duce, R.A., 2003c. Organic nitrogen in rain and aerosol in the eastern
Mediterranean atmosphere: An association with atmospheric dust. Journal of Geophysical Research-
Atmospheres 108, D10, 4320. doi:10.1029/2002JD002997
Manninen, S., Sassi, M., Loven, K., 2013. Effects of nitrogen oxides on ground vegetation, Pleurozium
schreberi and the soil beneath it in urban forests. Ecological Indicators 24, 485-493.
Mariotti, A., 1983. Atmospheric nitrogen as a reliable standard for natural N-15 abundance
measurements. Nature 303, 685-687.
Mariotti, A., 1984. Natural 15
N abundance measurements and atmospheric nitrogen standard
calibration. Nature 311, 251-252.

Chapter 1
74
Markert, B. and Wünschmann, S., 2011. Bioindicators and biomonitors: Use of organisms to observe the
influence of chemicals on the environment. Organic Xenobiotics and Plants: From Mode of Action to
Ecophysiology 8, 217-236.
McKee, K.L., Feller, I.C., Popp, M., Wanek, W., 2002. Mangrove isotopic (delta N-15 and delta C-13)
fractionation across a nitrogen vs. phosphorus limitation gradient. Ecology 83, 1065-1075.
McKenzie, V.J. and Townsend, A.R., 2007. Parasitic and infectious disease responses to changing global
nutrient cycles. Ecohealth 4, 384-396.
Menz, F.C. and Seip, H.M., 2004. Acid rain in Europe and the United States: An update. Environmental
Science & Policy 7, 253-265.
Meyer, M., Schröder, W., Nickel, S., Leblond, S., Lindroos, A., Mohr, K., Poikolainen, J., Santamaría, J.M.,
Skudnik, M., Thöni, L., Beudert, B., Dieffenbach-Fries, H., Schulte-Bisping, H., Zechmeister, H.G., 2015.
Relevance of canopy drip for the accumulation of nitrogen in moss used as biomonitors for atmospheric
nitrogen deposition in Europe. The Science of the Total Environment 538, 600-610.
Moldanová, J., Grennfelt, P., Jonsson, A., and contributing authors, 2011. Nitrogen as a threat to
European air quality. In The European nitrogen assessment: sources, effects and policy perspectives (eds
MA Sutton, CM Howard, JW Erisman, G Billen, A Bleeker, P Grennfelt, H van Grinsven, B Grizzetti), pp.
405–433. Cambridge, UK: Cambridge University Press.
Molnar, P., Stockfelt, L., Barregard, L., Sallsten, G., 2015. Residential NOx exposure in a 35-year cohort
study. changes of exposure, and comparison with back extrapolation for historical exposure assessment.
Atmospheric Environment 115, 62-69.
Monks, P. S., Granier, C., Fuzzi, S., Stohl, A., Williams, M. L., Akimoto, H., Amanni, M., Baklanov, A.,
Baltensperger, U., Bey, I., Blake, N., Blake, R. S., Carslawn, K., Cooper, O. R., Dentene, F., Fowler, D.,
Fragkou, E., Frost, G. J., Generoso, S., Ginoux, P., Grewet, V., Guenther, A., Hansson, H. C., Henne, S.,
Hjorth, J., Hofzumahaus, A., Huntrieser, H., Isaksen, I. S. A., Jenkin, M. E., Kaiser, J., Kanakidou, M.,
Klimont, Z., Kulmala, M., Laj, P., Lawrence, M. G., Lee, J. D., Liousse, C., Maione, M., McFiggans, G.,
Metzger, A., Mieville, A., Moussiopoulos, N., Orlando, J. J., O’Dowd, C. D., Palmer, P. I.,, D.D. Parrish, D.
D., Petzold, A., Platt, U., Pöschl, U., Prévôt, A. S. H., Reeves, C. E., Reimann, S., Rudich, Y., Sellegri, K.,
Steinbreche, R., Simpson, D., ten Brink, H., Thelok, J., van der Werf, G. R., Vautard, R., Vestreng, V.,
Vlachokostas, Ch., von Glasow, R., 2009. Atmospheric composition change – global and regional air
quality. Atmospheric Environment 43, 5268–5350.
Moore, H., 1977. The isotopic composition of ammonia, nitrogen dioxide and nitrate in the atmosphere.
Atmospheric Environment (1967) 11, 1239-1243.
Munzi, S., Pisani, T., Paoli, L., Renzi, M., Loppi, S., 2013. Effect of nitrogen supply on the C/N balance in
the lichen Evernia prunastri (L.) ach. Turkish Journal of Biology 37, 165-170.
Munzi, S., Cruz, C., Branquinho, C., Pinho, P., Leith, I.D., Sheppard, L.J., 2014. Can ammonia tolerance
amongst lichen functional groups be explained by physiological responses? Environmental Pollution 187,
206-209.
General Introduction
75
NEC Directive. National Emission Ceilings Directive 2001/81/EC. Directive of the European Parliament
and of the Council of 23 October 2001 on national emission ceilings for certain atmospheric pollutants.
European Commission.
Neff, J.C., Holland, E.A., Dentener, F.J., McDowell, W.H., Russell, K.M., 2002. The origin, composition and
rates of organic nitrogen deposition: A missing piece of the nitrogen cycle? Biogeochemistry 57, 99-136.
Nixon, S. W., 1995. Coastal marine eutrophication: a definition, social causes and future concerns.
Ophelia 41, 199-219.
Norse, D. and Ju, X., 2015. Environmental costs of china's food security. Agriculture Ecosystems &
Environment 209, 5-14.
Nygard, T., Steinnes, E., Royset, O., 2012. Distribution of 32 elements in organic surface soils:
Contributions from atmospheric transport of pollutants and natural sources. Water Air and Soil Pollution
223, 699-713.
Ochoa-Hueso, R., Mejias-Sanz, V., Pérez-Corona, M.E., Manrique, E., 2013a. Nitrogen deposition effects
on tissue chemistry and phosphatase activity in Cladonia foliacea (huds.) willd., a common terricolous
lichen of semi-arid Mediterranean shrublands. Journal of Arid Environments 88, 78-81.
Ochoa-Hueso, R. and Manrique, E., 2013b. Effects of nitrogen deposition on growth and physiology of
Pleurochaete squarrosa (Brid.) Lindb., a terricolous moss from Mediterranean ecosystems. Water Air
and Soil Pollution 224, 1492.
Ochoa-Hueso, R., Paradela, C., Pérez-Corona, M.E., Manrique, E., 2014a. Chapter 23: Pigment ratios of
the Mediterranean bryophyte Pleurochaete squarrosa respond to simulated nitrogen deposition. In:
Sutton, M.A., K.E. Mason, L.J. Sheppard, H. Sverdrup, R. Haeuber, and W.K. Hicks (eds.), Nitrogen
Deposition, Critical Loads and Biodiversity. Springer. pp. 207-216. ISBN 978-94-007-79. DOI:
10.1007/978-94-007-7939-6_23.
Ochoa-Hueso, R., Arróniz-Crespo, M., Bowker, M.A., Maestre, F.T., Esther Pérez-Corona, M., Theobald,
M.R., Vivanco, M.G., Manrique, E., 2014b. Biogeochemical indicators of elevated nitrogen deposition in
semiarid Mediterranean ecosystems. Environmental Monitoring and Assessment 186, 5831-5842.
Oenema, O., Witzke, H.P., Klimont, Z., Lesschen, J.P., Velthof, G.L., 2009. Integrated assessment of
promising measures to decrease nitrogen losses from agriculture in EU-27. Agriculture Ecosystems &
Environment 133, 280-288.
Oenema, O., and contributing authors, 2011. Nitrogen in current European policies. In The European
nitrogen assessment: sources, effects and policy perspectives (eds MA Sutton, CM Howard, JW Erisman,
G Billen, A Bleeker, P Grennfelt, H van Grinsven, B Grizzetti), pp. 62–81. Cambridge, UK: Cambridge
University Press.
Olivier, J. G. J., Bouwmana, A. F., Van der Hock, K. W., Berdowskib, J. J. M., 1998. Global air emission
inventories for anthropogenic sources of NOx, NH3, and N2O in 1990. Environmental Pollution 102, 135-
148.
Chapter 1
76
Pacheco, A.M.G., Freitas, M.C., Barros, L.I.C., Figueira, R., 2001. Investigating tree bark as an air-pollution
biomonitor by means of neutron activation analysis. Journal of Radioanalytical and Nuclear Chemistry
249, 327-331.
Paoli, L., Pirintsos, S.A., Kotzabasis, K., Pisani, T., Navakoudis, E., Loppi, S., 2010. Effects of ammonia
from livestock farming on lichen photosynthesis. Environmental Pollution 158, 2258-2265.
Park, S., Croteau, P., Boering, K.A., Etheridge, D.M., Ferretti, D., Fraser, P.J., Kim, K.-., Krummel, P.B.,
Langenfelds, R.L., van Ommen, T.D., Steele, L.P., Trudinger, C.M., 2012. Trends and seasonal cycles in the
isotopic composition of nitrous oxide since 1940. Nature Geoscience 5, 261-265.
Pearce I.S.K, Woodin S.J., van Der Wal R., 2003. Physiological and growth responses of the montane
bryophyte Racomitrium lanuginosum to atmospheric nitrogen deposition. New Phytologist 160, 145–
155.
Pearson, J., Wells, D.M., Seller, K.J., Bennett, A., Soares, A., Woodall, J., Ingrouille, M.J., 2000. Traffic
exposure increases natural N-15 and heavy metal concentrations in mosses. New Phytologist 147, 317-
326.
Phoenix, G. K., Hicks, W. K., Cinderby, S., Kuylenstierna, J. C. I., Stock, D. W., Dentener, F. J., Giller, K. E.,
Austin, A. T., Lefroy, R. D. B., Gimeno, B. S., Ashmore, M. R., Ineson, P., 2006. Atmospheric nitrogen
deposition in world biodiversity hotspots: the need for a greater global perspective in assessing N
deposition impacts. Global Change Biology 12, 470–476.
Pinho, P., Theobald, M.R., Dias, T., Tang, Y.S., Cruz, C., Martins-Loucao, M.A., Maguas, C., Sutton, M.,
Branquinho, C., 2012. Critical loads of nitrogen deposition and critical levels of atmospheric ammonia for
semi-natural Mediterranean evergreen woodlands. Biogeosciences 9, 1205-1215.
Pinho, P., Llop, E., Ribeiro, M.C., Cruz, C., Soares, A., Pereira, M.J., Branquinho, C., 2014. Tools for
determining critical levels of atmospheric ammonia under the influence of multiple disturbances.
Environmental Pollution 188, 88-93.
Pitcairn, C.E.R., Leith, I.D., Sheppard, L.J., Sutton, M.A., Fowler, D., Munro, R.C., Tang, S., Wilson, D.,
1998. The relationship between nitrogen deposition, species composition and foliar nitrogen
concentrations in woodland flora in the vicinity of livestock farms. Environmental Pollution 102, 41-48.
Pitcairn, C.E.R., Fowler, D., Leith, I.D., Sheppard, L.J., Sutton, M.A., Kennedy, V., Okello, E., 2003.
Bioindicators of enhanced nitrogen deposition. Environmental Pollution 126, 353-361.
Pitcairn, C.E.R., Fowler, D., Leith, I.D., Sheppard, L.J., Tang, S., Sutton, M.A., Famulari, D., 2006.
Diagnostic indicators of elevated nitrogen deposition. Environmental Pollution 144, 941–950.
Pitcairn, I.K., Teagle, D.A.H., Kerrich, R., Craw, D., Brewer, T.S., 2005. The behavior of nitrogen and
nitrogen isotopes during metamorphism and mineralization: Evidence from the Otago and alpine schists,
New Zealand. Earth and Planetary Science Letters 233, 229-246.
Poikolainen, J., Kubin, E., Piispanen, J., Karhu, J., 2004. Atmospheric heavy metal deposition in Finland
during 1985-2000 using mosses as bioindicators. The Science of the Total Environment 318, 171-185.

General Introduction
77
Poikolainen, J., Piispanen, J., Karhu, J., Kubin, E., 2009. Long-term changes in nitrogen deposition in
Finland (1990-2006) monitored using the moss Hylocomium splendens. Environmental Pollution 157,
3091-3097.
Pregitzer, K.S., Burton, A.J., Zak, D.R., Talhelm, A.F., 2008. Simulated chronic nitrogen deposition
increases carbon storage in northern temperate forests. Global Change Biology 14, 142-153.
Reed, S.C., Cleveland, C.C., Townsend, A.R., 2011. Functional ecology of free-living nitrogen fixation: A
contemporary perspective. Annual Review of Ecology, Evolution, and Systematics, Vol 42 42, 489-512.
Reimann, C., Halleraker, J.H., Kashulina, G., Bogatyrev, I., 1999. Comparison of plant and precipitation
chemistry in catchments with different levels of pollution on the Kola Peninsula, Russia. Science of the
Total Environment 243, 169-191.
Reimann, C., Niskavaara, H., Kashulina, G., Filzmoser, P., Boyd, R., Volden, T., Tomilina, O., Bogatyrev, I.,
2001. Critical remarks on the use of terrestrial moss (Hylocomium splendens and Pleurozium schreberi)
for monitoring of airborne pollution. Environmental Pollution 113, 41-57.
Reimann, C., Arnoldussen, A., Finne, T.E., Koller, F., Nordgulen, O., Englmaler, P., 2007. Element contents
in mountain birch leaves, bark and wood under different anthropogenic and geogenic conditions.
Applied Geochemistry 22, 1549-1566.
Reis, S., Pinder, R.W., Zhang, M., Lijie, G., Sutton, M.A., 2009. Reactive nitrogen in atmospheric emission
inventories. Atmospheric Chemistry and Physics 9, 7657-7677.
Riddell, J., Padgett, P.E., Nash, T.H.,III, 2012. Physiological responses of lichens to factorial fumigations
with nitric acid and ozone. Environmental Pollution 170, 202-210.
Robinson, D., Handley, L.L., Scrimgeour, C.M., Gordon, D.C., Forster, B.P., Ellis, R.P., 2000. Using stable
isotope natural abundances (delta N-15 and delta C-13) to integrate the stress responses of wild barley
(Hordeum spontaneum C. koch.) genotypes. Journal of Experimental Botany 51, 41-50.
Robinson, D., 2001. Delta N-15 as an integrator of the nitrogen cycle. Trends in Ecology & Evolution 16,
153-162.
Rodrigo, A. and Àvila, A., 2002. Dry deposition to the forest canopy and surrogate surfaces in two
Mediterranean holm oak forests in Montseny (NE Spain). Water Air and Soil Pollution 136, 269-288.
Ross, H.B., 1990. On the use of mosses (Hylocomium splendens and Pleurozium schreberi) for estimating
atmospheric trace-metal deposition. Water Air and Soil Pollution 50, 63-76.
Royles, J., Horwath, A.B., Griffiths, H., 2014. Interpreting bryophyte stable carbon isotope composition:
Plants as temporal and spatial climate recorders. Geochemistry Geophysics Geosystems 15, 1462-1475.
Rühling, A., and Tyler, G., 1970. Sorption and retention of heavy metals in the woodland moss
Hylocomium splendens (Hedw.) Br. Et Sch. Oikos 21, 92-97.
Salamova, A. and Hites, R.A., 2010. Evaluation of tree bark as a passive atmospheric sampler for flame
retardants, PCBs, and organochlorine pesticides. Environmental Science & Technology 44, 6196-6201.
Chapter 1
78
Samecka-Cymerman, A., Kolon, K., Kempers, A.J., 2010. Influence of Quercus robur throughfall on
elemental composition of Pleurozium schreberi (Brid.) Mitt. and Hypnum cupressiforme Hedw. Polish
Journal of Environmental Studies 19, 763-769.
Sardans, J. and Peñuelas, J., 2005. Trace element accumulation in the moss Hypnum cupressiforme
hedw. and the trees Quercus ilex L. and Pinus halepensis mill. in Catalonia. Chemosphere 60, 1293-1307.
Sardans, J., Janssens, I., Alonso, R., Veresoglou S.D., Rillig, M., Sanders, T.G.M., Carnicer, J., Filella, I.,
Farré-Armengol, G., and Peñuelas, J., 2014. Foliar elemental composition of European forest tree species
associated with evolutionary traits and present environmental and competitive conditions. Global
Ecology and Biogeography. John Wiley & Sons Ltd. DOI: 10.1111/geb.12253.
Schindler, D.W., 1988. Effects of acid-rain on fresh-water ecosystems. Science 239, 149-157.
Schmitt, M., Thöni, L., Waldner, P., Thimonier, A., 2005. Total deposition of nitrogen on Swiss long-term
forest ecosystem research (LWF) plots: Comparison of the throughfall and the inferential method.
Atmospheric Environment 39, 1079-1091.
Schröder, W., Hornsmann, I., Pesch, R., Schmidt, G., Markert, B., Fraenzle, S., Wuenschmann, S.,
Heidenreich, H., 2007. Nitrogen and metals in two regions in central Europe: Significant differences in
accumulation in mosses due to land use? Environmental monitoring and assessment 133, 495-505.
Schröder, W., Pesch, R., Schoenrock, S., Harmens, H., Mills, G., Fagerli, H., 2014. Mapping correlations
between nitrogen concentrations in atmospheric deposition and mosses for natural landscapes in
Europe. Ecological Indicators 36, 563-571.
Seinfeld, J. H. and Pandis, S. N., 2006. Atmospheric Chemistry and Physics: From Air Pollution to Climate
Change. 1232 pp. ISBN: 978-0-471-72018-8.
Seitzinger, S.P. and Sanders, R.W., 1999. Atmospheric inputs of dissolved organic nitrogen stimulate
estuarine bacteria and phytoplankton. Limnology and Oceanography 44, 721-730.
Selman, M., Greenhalgh, S., Diaz, R., Sug, Z., 2008. Eutrophication and hipoxia in coastal areas: a global
assessment of the state of knowledge. World resources institute.
Sheppard, L. J., Leith, I. D., Mizunuma, Cape, J. N., Crossley, A., Leeson, S., Sutton, M. A., Van Dijk, N.,
Fowler, D., 2011. Dry deposition of ammonia gas drives species change faster than wet deposition of
ammonium ions: evidence from a long-term field manipulation. Global Change Biology, 17, 3589–3607,
doi: 10.1111/j.1365-2486.2011.02478.x.
Shibata, H., Branquinho, C., McDowell, W. H., Mitchell, M. J., Monteith, D. T., Tang, J., Arvola, L., Cruz, C.,
Cusack, D. F., Halada, L., Kopàcek, J., Máguas, C., Sajidu, S., Schubert, H., Tokuchi, N., Záhora, J., 2015.
Consequence of altered nitrogen cycles in the coupled human and ecological system under changing
climate: The need for long-term and site-based research. Royal Swedish Academy of Sciences. DOI
10.1007/s13280-014-0545-4.
Skinner, R.A., Ineson, P., Jones, H., Sleep, D., Leith, I.D., Sheppard, L.J., 2006. Heathland vegetation as a
bio-monitor for nitrogen deposition and source attribution using delta N-15 values. Atmospheric
Environment 40, 498-507.

General Introduction
79
Smil, V., 2001. Enriching the Earth: Fritz Haber, Carl Bosch and the Transformation of World Food
Production. Cambridge, Massachusetts: MIT Press.
Smil, V., 2002. Nitrogen and food production: Proteins for human diets. Ambio 31, 126-131.
Smil, V. 2005. Nitrogen in modern European agriculture. In: Scholliers, P., L. Van Molle and C. Sarasua,
eds. Land, Shops and Kitchens: Technology and the Food Chain in Twentieth-century Europe. Brepols
Publishers, Turnhout, pp. 110-119.
Smil, V. 2011. Nitrogen cycle and world food production. World Agriculture 2:9-13.
Smodis, B., Pignata, M.L., Saiki, M., Cortes, E., Bangfa, N., Markert, B., Nyarko, B., Arunachalam, J., Garty,
J., Vutchkov, M., Wolterbeek, H.T., Steinnes, E., Freitas, M.C., Lucaciu, A., Frontasyeva, M., 2004.
Validation and application of plants as biomonitors of trace element atmospheric pollution - A co-
ordinated effort in 14 countries. Journal of Atmospheric Chemistry 49, 3-13.
Snyder, C. S., Bruulsema, T. W., Jensen, T. L., Fixen, P. E., 2009. Review of greenhouse gas emissions
from crop production systems and fertilizer management effects. Agriculture, Ecosystems and
Environment 133, 247–266.
Solga, A., Burkhardt, J., Zechmeister, H.G., Frahm, J.P., 2005. Nitrogen content, N-15 natural abundance
and biomass of two pleurocarpous mosses Pleurozium schreberi (Brid.) mitt. and Scleropodium purum
(Hedw.) Limpr. in relation to atmospheric nitrogen deposition. Environmental Pollution 134, 465-473.
Solga, A., Eichert, T., Frahm, J., 2006. Historical alteration in the nitrogen concentration and N-15 natural
abundance of mosses in Germany: Indication for regionally varying changes in atmospheric nitrogen
deposition within the last 140 years. Atmospheric Environment 40, 8044-8055.
Song, L., Liu, W.Y., Ma, W.Z., Qi, J.H., 2012. Response of epiphytic bryophytes to simulated N deposition
in a subtropical montane cloud forest in southwestern China. Global Change Ecology. Oecologia. DOI
10.1007/s00442-012-2341-9.
Spiric, Z., Frontasyeva, M., Steinnes, E., Stafilov, T., 2012. Multi-element atmospheric deposition study in
Croatia. International Journal of Environmental Analytical Chemistry 92, 1200-1214.
Stewart, G.R., Aidar, M.P.M., Joly, C.A., Schmidt, S., 2002. Impact of point source pollution on nitrogen
isotope signatures (delta N-15) of vegetation in SE Brazil. Oecologia 131, 468-472.
Steinnes, E., 1980. Atmospheric deposition of heavy-metals in Norway studied by the analysis of moss
samples using neutron-activation analysis and atomic-absorption spectrometry. Journal of
Radioanalytical Chemistry 58, 387-391.
Steinnes, E., 1995. A critical-evaluation of the use of naturally growing moss to monitor the deposition
of atmospheric metals. Science of the Total Environment 160-61, 243-249.
Suding, K.N., Collins, S.L., Gough, L., Clark, C., Cleland, E.E., Gross, K.L., Milchunas, D.G., Pennings, S.,
2005. Functional- and abundance-based mechanisms explain diversity loss due to N fertilization.
Proceedings of the National Academy of Sciences of the United States of America 102, 4387-4392.
Chapter 1
80
Sutton, M.A., Pitcairn, C.E.R., Whitfield, C.P., (Eds.), 2004. Bioindicator and biomonitor methods for
assessing the effects of atmospheric nitrogen on statutory nature conservation sites. JNCC Report nº
356. Report for contract nº F90-01-535.
Sutton, M.A., Erisman, J.W., Dentener, F., Möller, D., 2008a. Ammonia in the environment: from ancient
times to the present. Environmental Pollution 156, 583-604.
Sutton, M.A., Simpson, D., Levy, P.E., Smith, R.I., Reis, S., van Oijen, M., de Vries, W., 2008b.
Uncertainties in the relationship between atmospheric nitrogen deposition and forest carbon
sequestration. Global Change Biology 14, 2057-2063.
Sutton, M.A., Oenema, O., Erisman, J.W., Leip, A., van Grinsven, H., Winiwarter, W., 2011a. Too much of
a good thing. Nature 472, 159-161.
Sutton, M., van Grinsven, H., and contributing authors, 2011b. Summary for policy makers. In The
European nitrogen assessment: sources, effects and policy perspectives (eds MA Sutton, CM Howard,
JW Erisman, G Billen, A Bleeker, P Grennfelt, H van Grinsven, B Grizzetti), pp. xxiv–xxxiv. Cambridge, UK:
Cambridge University Press.
Sutton, M., van Grinsven, H., and contributing authors, 2011c. The challenge to integrate nitrogen
science and policies: the European Nitrogen Assessment approach. In The European nitrogen
assessment: sources, effects and policy perspectives (eds MA Sutton, CM Howard, JW Erisman, G Billen,
A Bleeker, P Grennfelt, H van Grinsven, B Grizzetti), pp. 82–96. Cambridge, UK: Cambridge University
Press.
Sutton M.A., Bleeker A., Howard C.M., Bekunda M., Grizzetti B., de Vries W., van Grinsven H.J.M., Abrol
Y.P., Adhya T.K., Billen G.,. Davidson E.A, Datta A., Diaz R., Erisman J.W., Liu X.J., Oenema O., Palm C.,
Raghuram N., Reis S., Scholz R.W., Sims T., Westhoek H. & Zhang F.S., with contributions from Ayyappan
S., Bouwman A.F., Bustamante M., Fowler D., Galloway J.N., Gavito M.E., Garnier J., Greenwood S.,
Hellums D.T., Holland M., Hoysall C., Jaramillo V.J., Klimont Z., Ometto J.P., Pathak H., Plocq Fichelet V.,
Powlson D., Ramakrishna K., Roy A., Sanders K., Sharma C., Singh B., Singh U., Yan X.Y. & Zhang Y.,
2013a. Our Nutrient World: The challenge to produce more food and energy with less pollution. Global
Overview of Nutrient Management. Centre for Ecology and Hydrology, Edinburgh on behalf of the
Global Partnership on Nutrient Management and the International Nitrogen Initiative.
Sutton MA et al. 2013b. Towards a climate-dependent paradigm of ammonia emission and deposition.
Philosophical Transactions of the Royal Society B 368: 20130166.
http://dx.doi.org/10.1098/rstb.2013.0166.
Szczepaniak, K. and Biziuk, M., 2003. Aspects of the biomonitoring studies using mosses and lichens as
indicators of metal pollution. Environmental Research 93, 221-230.
Templer, P.H., Mack, M.C., Chapin, F.S.,III, Christenson, L.M., Compton, J.E., Crook, H.D., Currie, W.S.,
Curtis, C.J., Dail, D.B., D'Antonio, C.M., Emmett, B.A., Epstein, H.E., Goodale, C.L., Gundersen, P., Hobbie,
S.E., Holland, K., Hooper, D.U., Hungate, B.A., Lamontagne, S., Nadelhoffer, K.J., Osenberg, C.W., Perakis,
S.S., Schleppi, P., Schimel, J., Schmidt, I.K., Sommerkorn, M., Spoelstra, J., Tietema, A., Wessel, W.W.,
Zak, D.R., 2012. Sinks for nitrogen inputs in terrestrial ecosystems: A meta-analysis of N-15 tracer field
studies. Ecology 93, 1816-1829.

General Introduction
81
The Royal Society, 2008. Ground-level ozone in the 21st century: future trends, impacts and policy
implications. The Royal Society, London. Science Policy Report 15/08.
Thöni, L., Schnyder, N., Krieg, F., 1996. Comparison of metal concentrations in three species of mosses
and metal freights in bulk precipitations. Fresenius Journal of Analytical Chemistry 354, 703-708.
Townsend, A.R., Howarth, R.W., Bazzaz, F.A., Booth, M.S., Cleveland, C.C., Collinge, S.K., Dobson, A.P.,
Epstein, P.R., Keeney, D.R., Mallin, M.A., Rogers, C.A., Wayne, P., Wolfe, A.H., 2003. Human health
effects of a changing global nitrogen cycle. Frontiers in Ecology and the Environment 1, 240-246.
Treseder, K.K., 2004. A meta-analysis of mycorrhizal responses to nitrogen, phosphorus, and
atmospheric CO2 in field studies. New Phytologist 164, 347-355.
UNEP and WHRC, 2007. Reactive Nitrogen in the Environment: Too Much or Too Little of a Good Thing.
United Nations Environment Programme, Paris. ISBN: 978-92-807-2783-8.
UNEP, 2010. Environmental Effects of Ozone Depletion and its Interactions with Climate Change: 2010
Assessment. United Nations Environment Programme. ISBN 92-807-2312-X.
Unrein, F. and Tell, G., 1994. Phytoplankton response to phosphorus and nitrogen enrichment in the
waters of a floodplain lake of the Parana river. Revue d'Hydrobiologie Tropicale 27, 315-328.
US-EPA, 2015. U.S. Environmental Protection Agency. Health and Environmental Effects of Ozone Layer
Depletion. http://www3.epa.gov/ozone/science/effects/
Uscola, M., Villar-Salvador, P., Oliet, J., Warren, C.R., 2014. Foliar absorption and root translocation of
nitrogen from different chemical forms in seedlings of two Mediterranean trees. Environmental and
Experimental Botany 104, 34-43.
Van Aardenne, J. A., Dentener, F. J., Olivier, J. G. J., Klein Goldewijk, C. G. M., Lelieveld, J., 2001. A 1ºx1º
resolution data set of historical anthropogenic trace gas emissions for the period 1890-1990. Global
Biogeochemical Cycles, Vol. 15, Nº. 4, pg. 909-928.
Van der Heyden, C., Demeyer, P., Volcke, E.I.P., 2015. Mitigating emissions from pig and poultry housing
facilities through air scrubbers and biofilters: State-of-the-art and perspectives. Biosystems Engineering
134, 74-93.
Van Dobben, H., de Vries, W., 2010. Relation between forest vegetation, atmospheric deposition and
site conditions at regional and European scales. Environmental Pollution 158, 921-933.
Van Grinsven, H.J.M., Ward, M.H., Benjamin, N., de Kok, T.M., 2006. Does the evidence about health
risks associated with nitrate ingestion warrant an increase of the nitrate standard for drinking water?
Environmental health: A Global Access Science Source 5, 26-26.
Van Vuuren, D. P., Bouwman, L. F., Smith, S. J., Dentene, F. 2011. Global projections for anthropogenic
reactive nitrogen emissions to the atmosphere: an assessment of scenarios in the scientific literature.
Current Opinion in Environmental Sustainability, 3:359–369.
Chapter 1
82
Van Wijnen, J., Ivens, W.P.M.F., Kroeze, C., Lohr, A.J., 2015. Coastal eutrophication in Europe caused by
production of energy crops. Science of the Total Environment 511, 101-111.
Vedrenne, M., Borge, R., Lumbreras, J., Conlan, B., Encarnacion Rodriguez, M., Manuel de Andres, J., de
la Paz, D., Pérez, J., Narros, A., 2015. An integrated assessment of two decades of air pollution policy
making in Spain: Impacts, costs and improvements. Science of the Total Environment 527, 351-361.
Verhoeven, J.T.A., Beltman, B., Dorland, E., Robat, S.A., Bobbink, R., 2011. Differential effects of
ammonium and nitrate deposition on fen phanerogams and bryophytes. Applied Vegetation Science 14,
149-157.
Vestreng, V., Ntziachristos, L., Semb, A., Reis, S., Isaksen, I.S.A., Tarrason, L., 2009. Evolution of NOx
emissions in Europe with focus on road transport control measures. Atmospheric Chemistry and Physics
9, 1503-1520.
Vet, R., Artz, R.S., Carou, S., Shaw, M., Ro, C., Aas, W., Baker, A., Bowersox, V.C., Dentener, F., Galy-
Lacaux, C., Hou, A., Pienaar, J.J., Gillett, R., Cristina Forti, M., Gromov, S., Hara, H., Khodzher, T.,
Mahowald, N.M., Nickovic, S., Rao, P.S.P., Reid, N.W., 2014. A global assessment of precipitation
chemistry and deposition of sulfur, nitrogen, sea salt, base cations, organic acids, acidity and pH, and
phosphorus. Atmospheric Environment 93, 3-100.
Violaki, K. and Mihalopoulos, N., 2010. Water-soluble organic nitrogen (WSON) in size-segregated
atmospheric particles over the eastern Mediterranean. Atmospheric Environment 44, 4339-4345.
Violaki, K., Zarbas, P., Mihalopoulos, N., 2010. Long-term measurements of dissolved organic nitrogen
(DON) in atmospheric deposition in the eastern Mediterranean: Fluxes, origin and biogeochemical
implications. Marine Chemistry 120, 179-186.
Vitousek, P.M., Aber, J. D., Howarth, R. W., Likens, G. E., Matson, P. A., Schindler, D. W., Schlesinger, W.
H., Tilman, D. G., 1997. Human alteration of the global nitrogen cycle: sources and consequences.
Ecological Applications 7(3), 737–750.
Vitousek, P.M., Cassman, K., Cleveland, C., Crews, T., Field, C.B., Grimm, N.B., Howarth, R.W., Marino, R.,
Martinelli, L., Rastetter, E.B., Sprent, J.I., 2002. Towards an ecological understanding of biological
nitrogen fixation. Biogeochemistry 57, 1-45.
Vitousek, P.M., Porder, S., Houlton, B. Z., Chadwick, O.A., 2010. Terrestrial phosphorus limitation:
mechanisms, implications, and nitrogen–phosphorus interactions. Ecological Applications, 20(1), pp. 5–
15.
Vitousek, P.M., Menge, D.N.L., Reed, S.C., Cleveland, C.C., 2013. Biological nitrogen fixation: Rates,
patterns and ecological controls in terrestrial ecosystems. Philosophical Transactions of the Royal
Society B 368: 20130119. http://dx.doi.org/10.1098/rstb.2013.0119
Waldner, P., Marchetto, A., Thimonier, A., Schmitt, M., Rogora, M., Granke, O., Mues, V., Hansen, K.,
Karlsson, G.P., Zlindra, D., Clarke, N., Verstraeten, A., Lazdins, A., Schimming, C., Iacoban, C., Lindroos,
A., Vanguelova, E., Benham, S., Meesenburg, H., Nicolas, M., Kowalska, A., Apuhtin, V., Napa, U.,
Lachmanova, Z., Kristoefel, F., Bleeker, A., Ingerslev, M., Vesterdal, L., Molina, J., Fischer, U., Seidling, W.,
Jonard, M., O'Dea, P., Johnson, J., Fischer, R., Lorenz, M., 2014. Detection of temporal trends in

General Introduction
83
atmospheric deposition of inorganic nitrogen and sulphate to forests in Europe. Atmospheric
Environment 95, 363-374.
Waldrop, M., Zak, D., Sinsabaugh, R., Gallo, M., Lauber, C., 2004. Nitrogen deposition modifies soil
carbon storage through changes in microbial enzymatic activity. Ecological Applications 14, 1172-1177.
Walker, J.T., Dombek, T.L., Green, L.A., Gartman, N., Lehmann, C.M.B., 2012. Stability of organic nitrogen
in NADP wet deposition samples. Atmospheric Environment 60, 573-582.
West, J.B., Bowen, G.J., Cerling, T.E., Ehleringer, J.R., 2006. Stable isotopes as one of nature's ecological
recorders. Trends in Ecology & Evolution 21, 408-414.
WHO, 2011. World Health Organization. Guidelines for Drinking-Water Quality. Fourth edition. ISBN 978
92 4 154815 1.
WHO, 2013. World Health Organization. Regional office for Europe. Review of evidence on health
aspects of air pollution – REVIHAAP Project. First results.
Winiwarter, W., Grizzeti, B., Sutton, M.A., 2015. Nitrogen Pollution in the UE. Best management
strategies, regulations, and science needs. Air and waste management association. http://awma.org
(September 2015).
Wolterbeek, B., 2002. Biomonitoring of trace element air pollution: Principles, possibilities and
perspectives. Environmental Pollution 120, 11-21.
Xiao, H., Tang, C., Xiao, H., Liu, X., Liu, C., 2010. Stable sulphur and nitrogen isotopes of the moss
Haplocladium microphyllum at urban, rural and forested sites. Atmospheric Environment 44, 4312-4317.
Xing, J., Mathur, R., Pleim, J., Hogrefe, C., Gan, C.-M., Wong, D. C., Wei, C., Gilliam, R., Pouliot, G., 2015.
Observations and modeling of air quality trends over 1990–2010 across the Northern Hemisphere:
China, the United States and Europe. Atmosheric Chemistry and Physics, 15, 2723–2747.
DOI:10.5194/acp-15-2723-2015.
Zechmeister, H.G., Grodzinska, K., Szarek-Lukaszewska, G., 2003. Chapter 10: Bryophytes. In: Markert,
B.A., Breure, A.M., Zechmeister, H.G. (Eds.), Bioindicators and biomonitors. Elsevier Science Ltd.,
Amsterdam. pp. 329-375.
Zechmeister, H.G., Richter, A., Smidt, S., Hohenwallner, D., Roder, I., Maringer, S., Wanek, W., 2008.
Total nitrogen content and 15N signatures in moss tissue: Indicative value for nitrogen deposition
patterns and source allocation on a nationwide scale. Environmental Science & Technology 42, 8661-
8667.
Zhang, Y., Liu, X.J., Fangmeier, A., Goulding, K.T.W., Zhang, F.S., 2008. Nitrogen inputs and isotopes in
precipitation in the north China Plain. Atmospheric Environment 42, 1436-1448.
Zhang, F., Cui, Z., Chen, X., Ju, X., Shen, J., Chen, Q., Liu, X., Zhang, W., Mi, G., Fan, M., Jiang, R., 2012a.
Chapter one: Integrated Nutrient Management for Food Security and Environmental Quality in China.
Advances in Agronomy, Volume 116. ISSN 0065-2113. DOI: 10.1016/B978-0-12-394277-7.00001-4.

Chapter 1
84
Zhang, Y., Song, L., Liu, X.J., Li, W.Q., Lu, S.H., Zheng, L.X., Bai, Z.C., Cai, G.Y., Zhang, F.S., 2012b.
Atmospheric organic nitrogen deposition in China. Atmospheric Environment 46, 195-204.
Zhou, Y., Cheng, S., Jianlei Lang, J., Chen, D., Zhao, B., Liu, C., Ran Xu, R., Li, T., 2015. A comprehensive
ammonia emission inventory with high-resolution and its evaluation in the Beijin-Tianji-Hebei (BTH)
region, China. Atmospheric Environment 106, 305-317.

Chapter 2 Throughfall and bulk deposition of dissolved organic nitrogen to holm oak forests in the Iberian Peninsula: Flux estimation and identification of potential sources
This chapter reproduces the text of the following manuscript:
Izquieta-Rojano, S., García-Gómez, H., Aguillaume, L., Santamaría, J.M., Tang, Y.S., Santamaría, C.,
Valiño, F., Lasheras, E., Alonso, R., Àvila, A., Cape, J.N., Elustondo, D., 2016. Throughfall and bulk
deposition of dissolved organic nitrogen to holm oak forests in the Iberian Peninsula: Flux estimation
and identification of potential sources. Environmental Pollution 210, 104-112.
Abstract
Deposition of dissolved organic nitrogen (DON) in both bulk precipitation (BD) and
canopy throughfall (TF) has been measured for the first time in the western
Mediterranean. The study was carried out over a year from 2012 to 2013 at four
evergreen holm oak forests located in the Iberian Peninsula: two sites in the Province
of Barcelona (Northeastern Spain), one in the Province of Madrid (central Spain) and
the fourth in the Province of Navarra (Northern Spain). In BD the annual volume
weighted mean (VWM) concentration of DON ranged from 0.25 mg l-1 in Madrid to
1.14 mg l-1 in Navarra, whereas in TF it ranged from 0.93 mg l-1 in Barcelona to 1.98 mg
l-1 in Madrid. The contribution of DON to total nitrogen deposition varied from 34% to
56% in BD in Barcelona and Navarra respectively, and from 38% in Barcelona to 72% in
Madrid in TF. Agricultural activities and pollutants generated in metropolitan areas
were identified as potential anthropogenic sources of DON at the study sites.
Moreover, canopy uptake of DON in Navarra was found in spring and autumn, showing
that organic nitrogen may be a supplementary nutrient for Mediterranean forests,
assuming that a portion of the nitrogen taken up is assimilated during biologically
active periods.
Keywords: Dissolved organic nitrogen, Canopy throughfall, Bulk deposition,
Anthropogenic nitrogen, Mediterranean ecosystems.

DON to holm oak forests in the Iberian Peninsula
87
Introduction
From 1950 to 2010, global reactive nitrogen (Nr) production on a per capita basis rose
from approximately 12 kg N y-1 to 30 kg N y-1, generating three-fold more Nr than
natural terrestrial processes do (Galloway et al., 2014). This massive alteration of the
nitrogen cycle has resulted in changes in atmospheric composition, with detectable
consequences for the climate system, food and energy security, human health and
ecosystem services (Erisman et al., 2011). In the 1970s two important monitoring
programs, the US National Atmospheric Deposition Program (NADP) and the European
Monitoring and Evaluation Program (EMEP), began to work on the study of nitrogen
deposition, but in both cases addressing only inorganic N (Cape et al., 2011). The first
serious discussions and analyses of organic nitrogen (ON) emerged with the work
carried out by Cape et al. (2001) and the reviews published by Neff et al. (2002) and
Cornell et al. (2003), who greatly contributed to the promotion of the subsequent
surveys developed in this field. In fact, since then, many surveys have been carried out
taking into account various aspects of ON: contributions to wet (Keene et al., 2002;
Cape et al., 2012) and dry deposition (Mace et al., 2003; Matsumoto et al., 2014);
elemental and functional characterization (Altieri et al., 2012; El Haddad et al., 2013);
interactions with vegetation (Hinko-Najera and Wanek, 2010), soil microorganisms
(Jones et al., 2004; Farrell et al., 2014) and climate (Du et al., 2014); and modelling and
prediction studies (Kanakidou et al., 2012; Im et al., 2013). These surveys have
highlighted the important contribution of the organic form to total N deposition,
ranging on average from 10 to 40% depending on the study area. However, even if
organic N has long been known to be a quantitatively significant component of
atmospheric nitrogen deposition, it is still not routinely assessed, nor are best-
estimates factored into quantitative evaluations of N fluxes (Cornell, 2011). To date,
only the work carried out by Walker et al. (2012) can be considered as a real attempt
to add ON measurements to the National Trends Network (NADP/NTN). Thus, in spite
of the progress achieved over recent years, reviews (Cape et al., 2011; Cornell, 2011;
Jickells et al., 2013) have underlined important gaps in our knowledge of budgets,
chemical characterization and source identification of the organic fraction. Indeed, we
Chapter 2
88
are still far from an understanding of the role that ON may play in human health,
ecosystems functioning and interactions in biogeochemical cycles.
Considering Mediterranean-type ecosystems, the information gap is even greater.
Although atmospheric nitrogen deposition is well known to cause nutritional
imbalances with negative consequences (Erisman et al., 2013; Shibata et al., 2015),
ecosystems from the Mediterranean Basin have been systematically neglected and are
strongly under-represented (Dias et al., 2011; Pinho et al., 2012) compared with
central and northern Europe and America (Fenn et al., 2003; Bobbink et al., 2010). At
present, little is known about the effects of anthropogenic nitrogen inputs in these
valuable regions (Bobbink et al., 2010; Ochoa-Hueso et al., 2011), and the scarcity of
data related to air pollution characterization and effects is presented as one of the
biggest concerns and challenges in the Mediterranean area. In the Iberian Peninsula,
nitrogen fluxes have been estimated using a variety of approaches (Àvila and Rodà,
2012; García-Gómez et al., 2014; Vet et al., 2014). However, in spite of these efforts,
there are still many unresolved matters, specifically related to dry deposition, which is
recognized as the main form of atmospheric input of N in Mediterranean systems (30-
70%), and up to 90% in certain areas (Sanz et al., 2002; Àvila and Rodà, 2012), but is
not usually assessed due to the difficulty of measurement.
The lack of ON data constitutes another factor that greatly increases the uncertainties
and hinders our knowledge of the nitrogen cycle in this region. A search of the
literature revealed few studies which addressed organic nitrogen deposition in the
Mediterranean Basin, and most of them were focused on the eastern Mediterranean
(Mace et al., 2003; Violaki et al., 2010; Violaki and Mihalopoulos, 2010). In the western
Mediterranean ON deposition has been measured in some coastal environments
(Markaki et al., 2010), and in model-based surveys (Im et al., 2013), but no evidence
has been found that considered inland deposition.
The aim of the present study is to determine the dissolved organic nitrogen (DON)
fraction in canopy throughfall (TF) and bulk precipitation deposition (BD) samples of
four evergreen holm oak forests located in Spain, and to give a more comprehensive
characterization of the nitrogen fluxes in these Mediterranean ecosystems.

DON to holm oak forests in the Iberian Peninsula
89
To the authors’ knowledge, this is the first effort to quantify the contribution of
atmospheric deposition of DON in total dissolved nitrogen (TDN) in forests and open
field sites of the western Mediterranean. This work was part of the EDEN project
(Effects of nitrogen deposition in Mediterranean evergreen holm oak forests), which
was developed with the purpose of determining the total nitrogen inputs to evergreen
holm oak forests in the Iberian Peninsula and studying the effects of this deposition in
the nitrogen biogeochemical cycle in this forest type.
Material and methods
Study sites and collection methods
The present work was carried out in four evergreen holm oak forests (Quercus ilex L.)
of the Iberian Peninsula: Barcelona (Can Balasc, CB, and La Castanya, LC), Madrid (Tres
Cantos, TC) and Navarra (Carrascal, CA). Although the vegetation type was common to
all locations, growing factors (climatic and edaphic conditions), landscapes,
management and anthropogenic activities affected each site differently, providing a
good opportunity to study ON deposition in forests developed and affected by
different situations, and thus to evaluate potential sources of ON. The main
characteristics of the sites and brief descriptions of the surroundings are shown in
Table 1. Meteorological variables were monitored onsite at CB, LC and TC, and data
from the closest meteorological station were collected for the CA site.
At each location two monitoring plots were set up with the purpose of collecting both
throughfall (TF) and bulk deposition (BD) samples. The instruments selected for
sampling of precipitation were those developed by the Norwegian Institute for Air
Research (Norsk institutt for luftforskning, NILU). Four replicates of NILU-type rain
gauges (20 cm diameter) were installed in the openfield plots and twelve replicates
were placed under the canopy. Criteria suggested by the UNECE-CLRTAP ICP Forests
manual, Part XIV (ICP Forests manual, 2010) were followed to avoid contamination and
to preserve samples. Sampling frequency was weekly or fortnightly in wet periods,
Chapter 2
90
whilst in CA and TC, during dry or less frequent rain periods samples were collected
after each rain event. The sampling campaign was extended for a whole year, from
June 2012 to June 2013.
Sample treatment, preservation and analysis
In the laboratory, two aliquots of unfiltered sample were reserved for pH and
conductivity determinations. A third aliquot was separated in Barcelona for alkalinity
estimates. The remaining sample was filtered using 0.45 m pore filters and
distributed in four subsamples for alkalinity (only in TC and CA), NH4+, anions and
cations, and TDN analysis. In Barcelona, anion and cation determinations were
performed in accordance with Izquierdo and Àvila (2012). In Navarra and Madrid,
ammonium and anion determinations were performed by ion chromatography (IC)
(NH4+: Dionex 1100, with column CS16 in Navarra and Dionex 2000 with column CG12
in Madrid; SO42-, NO3
-, NO2-, Cl-, PO4
3- anions: Dionex 2000, with column AS19 in
Navarra and Madrid), whereas cations were analyzed by inductively coupled plasma
mass spectrometry (ICP-MS) (Agilent 7500a).
Subsamples reserved for TDN were initially frozen at -20ᵒC and stored for 3-4 months.
The samples were then thawed at room temperature and carefully prepared for an
optimum preservation during the shipment to the Centre for Ecology & Hydrology
(CEH) in Edinburgh, UK where they were analyzed. Defrosted samples (1.5 ml aliquot)
were placed in 2 ml chromatography vials previously filled with 200 g of thymol
biocide. Moreover, hydrochloric acid (300 L 0.05 M in Barcelona and Navarra, and
100 L 0.01 M in Madrid) was added to lower the pH and avoid NH3 losses from the
vial. Criteria for selection of HCl volume and concentration for each site are explained
in the first section of ‘Results and discussion’. TDN measurements were made using
high-temperature chemiluminescence in flow injection mode (ANTEK 8060M) as
described in Cape et al. (2012).
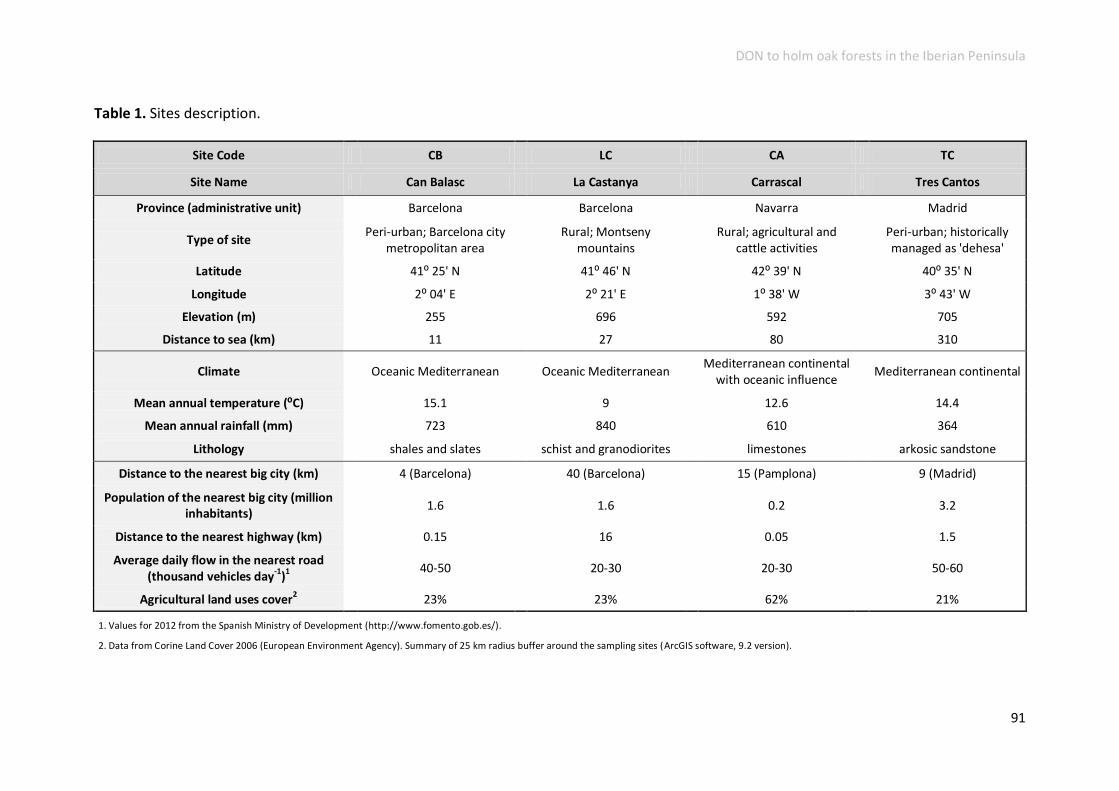
DON to holm oak forests in the Iberian Peninsula
91
Table 1. Sites description.
Site Code CB LC CA TC
Site Name Can Balasc La Castanya Carrascal Tres Cantos
Province (administrative unit) Barcelona Barcelona Navarra Madrid
Type of site
Peri-urban; Barcelona city metropolitan area
Rural; Montseny mountains
Rural; agricultural and cattle activities
Peri-urban; historically managed as 'dehesa'
Latitude
41⁰ 25' N
41⁰ 46' N
42⁰ 39' N
40⁰ 35' N
Longitude
2⁰ 04' E
2⁰ 21' E
1⁰ 38' W
3⁰ 43' W
Elevation (m)
255
696
592
705
Distance to sea (km)
11
27
80
310
Climate Oceanic Mediterranean Oceanic Mediterranean Mediterranean continental
with oceanic influence Mediterranean continental
Mean annual temperature (⁰C)
15.1
9
12.6
14.4
Mean annual rainfall (mm)
723
840
610
364
Lithology
shales and slates
schist and granodiorites
limestones
arkosic sandstone
Distance to the nearest big city (km) 4 (Barcelona) 40 (Barcelona) 15 (Pamplona) 9 (Madrid)
Population of the nearest big city (million inhabitants)
1.6
1.6
0.2
3.2
Distance to the nearest highway (km)
0.15
16
0.05
1.5
Average daily flow in the nearest road (thousand vehicles day
-1)
1
40-50
20-30
20-30
50-60
Agricultural land uses cover2 23% 23% 62% 21%
1. Values for 2012 from the Spanish Ministry of Development (http://www.fomento.gob.es/). 2. Data from Corine Land Cover 2006 (European Environment Agency). Summary of 25 km radius buffer around the sampling sites (ArcGIS software, 9.2 version).
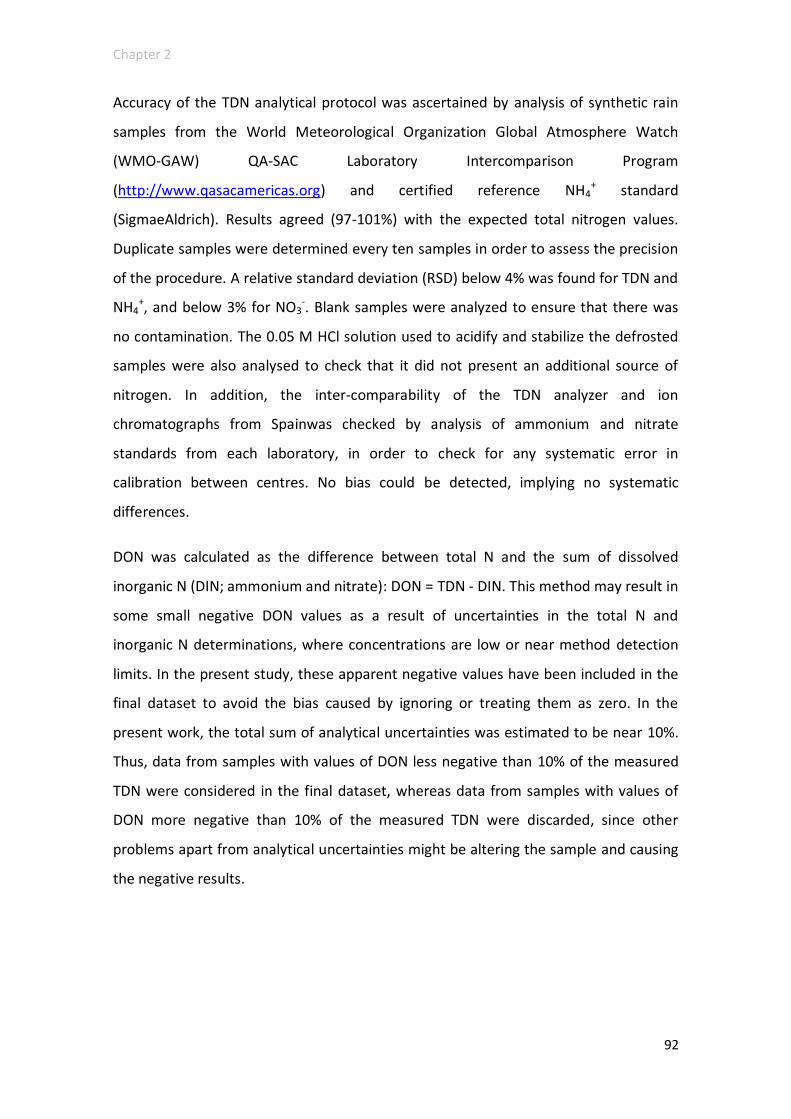
Chapter 2
92
Accuracy of the TDN analytical protocol was ascertained by analysis of synthetic rain
samples from the World Meteorological Organization Global Atmosphere Watch
(WMO-GAW) QA-SAC Laboratory Intercomparison Program
(http://www.qasacamericas.org) and certified reference NH4+ standard
(SigmaeAldrich). Results agreed (97-101%) with the expected total nitrogen values.
Duplicate samples were determined every ten samples in order to assess the precision
of the procedure. A relative standard deviation (RSD) below 4% was found for TDN and
NH4+, and below 3% for NO3
-. Blank samples were analyzed to ensure that there was
no contamination. The 0.05 M HCl solution used to acidify and stabilize the defrosted
samples were also analysed to check that it did not present an additional source of
nitrogen. In addition, the inter-comparability of the TDN analyzer and ion
chromatographs from Spainwas checked by analysis of ammonium and nitrate
standards from each laboratory, in order to check for any systematic error in
calibration between centres. No bias could be detected, implying no systematic
differences.
DON was calculated as the difference between total N and the sum of dissolved
inorganic N (DIN; ammonium and nitrate): DON = TDN - DIN. This method may result in
some small negative DON values as a result of uncertainties in the total N and
inorganic N determinations, where concentrations are low or near method detection
limits. In the present study, these apparent negative values have been included in the
final dataset to avoid the bias caused by ignoring or treating them as zero. In the
present work, the total sum of analytical uncertainties was estimated to be near 10%.
Thus, data from samples with values of DON less negative than 10% of the measured
TDN were considered in the final dataset, whereas data from samples with values of
DON more negative than 10% of the measured TDN were discarded, since other
problems apart from analytical uncertainties might be altering the sample and causing
the negative results.

DON to holm oak forests in the Iberian Peninsula
93
Database validation
The criteria used to identify valid precipitation samples were, on the one hand, those
described in the UNECE ICP Forests manual, Part XVI (ICP Forests manual, 2010): i) ion
balance; ii) measured conductivity vs estimated conductivity; iii) Na/Cl ratio; and iv)
nitrogen balance (TDN ≥ DIN). Additional criteria proposed by Cape et al. (2015) were
also applied, i) invalid sample due to evidence of contamination in BD (PO43- > 10 eq l-
1; NH4+ > 100 eq l-1 and K+ > 8 eq l-1) and ii) missing data (precipitation less than 2.1
mm).
Air pollution monitoring
Atmospheric concentrations of ozone (O3), ammonia (NH3) and nitrogen dioxide (NO2)
were monitored at the sampling sites using tube-type passive samplers (Radiello®).
Two replicate samplers per gaseous species were exposed at 2 m height in each plot at
fortnightly periods over two years (2011-2013). Laboratory analyses were performed
according to Radiello's specifications (Fondazione Salvatore Maugeri, 2006).
Data handling and statistical analysis
Annual volume weighted mean (VWM) concentrations were calculated as described in
Araujo et al. (2015). Yearly deposition fluxes were obtained as the product of these
VWM concentrations and the corresponding annual bulk/throughfall water volume.
Seasonal, monthly or per sampling period deposition fluxes were obtained following
the same procedure: VWM concentrations were calculated for each period and
multiplied by the corresponding BD/TF water volumes. In the validated data set, in
order to fill the gaps due to missing values, VWM concentrations were calculated with
the available samples, but the precipitation volume of excluded samples was included
in calculating annual precipitation (Cape et al., 2012; ICP Forests manual, 2010). Non
sea-salt (nss) concentrations were calculated according to Àvila (1996).
Given the strong inverse dependence of concentrations on precipitation amounts
(small amounts tend to have higher concentrations), within-site correlations were
analyzed using deposition data (mg m-2 month-1) rather than concentration data, as
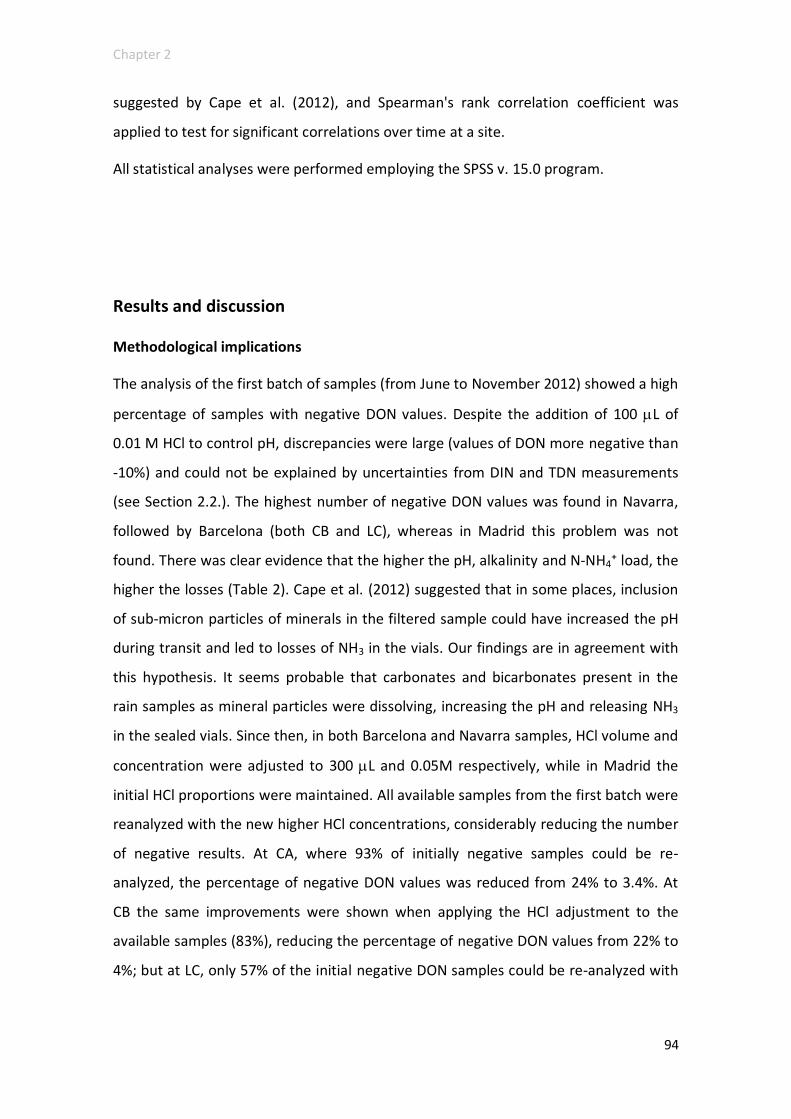
Chapter 2
94
suggested by Cape et al. (2012), and Spearman's rank correlation coefficient was
applied to test for significant correlations over time at a site.
All statistical analyses were performed employing the SPSS v. 15.0 program.
Results and discussion
Methodological implications
The analysis of the first batch of samples (from June to November 2012) showed a high
percentage of samples with negative DON values. Despite the addition of 100 L of
0.01 M HCl to control pH, discrepancies were large (values of DON more negative than
-10%) and could not be explained by uncertainties from DIN and TDN measurements
(see Section 2.2.). The highest number of negative DON values was found in Navarra,
followed by Barcelona (both CB and LC), whereas in Madrid this problem was not
found. There was clear evidence that the higher the pH, alkalinity and N-NH4⁺ load, the
higher the losses (Table 2). Cape et al. (2012) suggested that in some places, inclusion
of sub-micron particles of minerals in the filtered sample could have increased the pH
during transit and led to losses of NH3 in the vials. Our findings are in agreement with
this hypothesis. It seems probable that carbonates and bicarbonates present in the
rain samples as mineral particles were dissolving, increasing the pH and releasing NH3
in the sealed vials. Since then, in both Barcelona and Navarra samples, HCl volume and
concentration were adjusted to 300 L and 0.05M respectively, while in Madrid the
initial HCl proportions were maintained. All available samples from the first batch were
reanalyzed with the new higher HCl concentrations, considerably reducing the number
of negative results. At CA, where 93% of initially negative samples could be re-
analyzed, the percentage of negative DON values was reduced from 24% to 3.4%. At
CB the same improvements were shown when applying the HCl adjustment to the
available samples (83%), reducing the percentage of negative DON values from 22% to
4%; but at LC, only 57% of the initial negative DON samples could be re-analyzed with
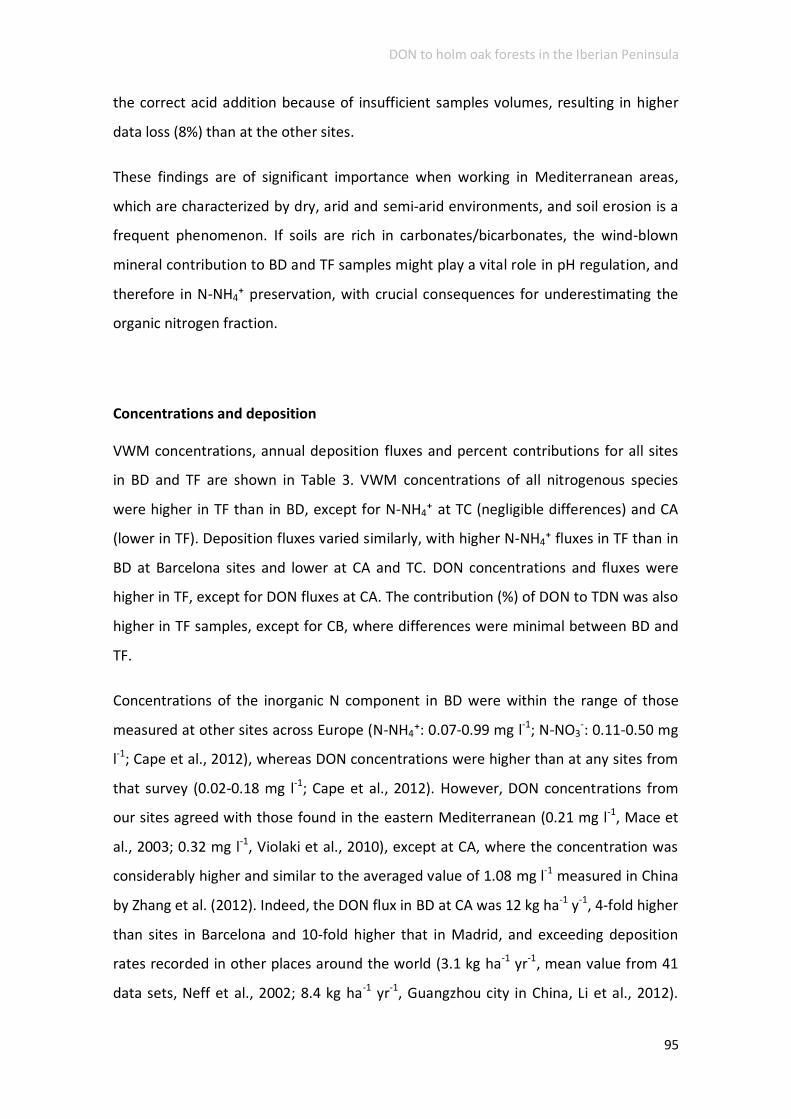
DON to holm oak forests in the Iberian Peninsula
95
the correct acid addition because of insufficient samples volumes, resulting in higher
data loss (8%) than at the other sites.
These findings are of significant importance when working in Mediterranean areas,
which are characterized by dry, arid and semi-arid environments, and soil erosion is a
frequent phenomenon. If soils are rich in carbonates/bicarbonates, the wind-blown
mineral contribution to BD and TF samples might play a vital role in pH regulation, and
therefore in N-NH4⁺ preservation, with crucial consequences for underestimating the
organic nitrogen fraction.
Concentrations and deposition
VWM concentrations, annual deposition fluxes and percent contributions for all sites
in BD and TF are shown in Table 3. VWM concentrations of all nitrogenous species
were higher in TF than in BD, except for N-NH4⁺ at TC (negligible differences) and CA
(lower in TF). Deposition fluxes varied similarly, with higher N-NH4⁺ fluxes in TF than in
BD at Barcelona sites and lower at CA and TC. DON concentrations and fluxes were
higher in TF, except for DON fluxes at CA. The contribution (%) of DON to TDN was also
higher in TF samples, except for CB, where differences were minimal between BD and
TF.
Concentrations of the inorganic N component in BD were within the range of those
measured at other sites across Europe (N-NH4⁺: 0.07-0.99 mg l-1; N-NO3-: 0.11-0.50 mg
l-1; Cape et al., 2012), whereas DON concentrations were higher than at any sites from
that survey (0.02-0.18 mg l-1; Cape et al., 2012). However, DON concentrations from
our sites agreed with those found in the eastern Mediterranean (0.21 mg l-1, Mace et
al., 2003; 0.32 mg l-1, Violaki et al., 2010), except at CA, where the concentration was
considerably higher and similar to the averaged value of 1.08 mg l-1 measured in China
by Zhang et al. (2012). Indeed, the DON flux in BD at CA was 12 kg ha-1 y-1, 4-fold higher
than sites in Barcelona and 10-fold higher that in Madrid, and exceeding deposition
rates recorded in other places around the world (3.1 kg ha-1 yr-1, mean value from 41
data sets, Neff et al., 2002; 8.4 kg ha-1 yr-1, Guangzhou city in China, Li et al., 2012).

Chapter 2
96
Table 2. Data from analysis of the first batch of samples: from June to November 2012. ‘Initial’ and ‘Final’ % of DON as negative values were
calculated as follows: Initial or Final number of samples with DON negative values / Total number of analyzed samples * 100. ‘Initial % of DON
as negative values’ includes the negative values from the nitrogen balance (DON =TDN - IN) calculated with the initial HCl additions, whereas
‘Final % of DON as negative values’ is the percentage of negative values in the final dataset, considering data from samples which remained as
negative DON values after re-analysis with the new HCl conditions, plus the initial negative DON values that could not be re-analyzed and thus,
corrected. For all % estimates both bulk (BD) and throughfall (TF) data were considered.
Bulk (BD) Throughfall (TF) Initial % of DON
as negative values
% of samples with DON negative
values which were re-analyzed
% of re-analyzed samples which
improved with the new HCl treatment
Final % of DON as negative values
pH Alk.
a, b N-NH4
c pH Alk. N-NH4
Carrascal (CA) 7.38 196.5 2.3 6.63 1478.9 0.79 24 93 93 3
La Castanya (LC) 5.86 90.7 1.05
5.65 150.9 0.48 19 57 100 7
Can Balasc (CB) 6.18 135.7 0.21
5.86 176.2 0.99 22 83 100 4
Tres Cantos (TC) 5.75 44.02 0.23 5.35 75.9 0.25 2 0
a. Alk. => Alkalinity.
b. VWM in eq l-1
for that period.
c. Load in kg ha-1
for that period.
DON to holm oak forest in the Iberian Peninsula
97
In terms of proportion, DON percentages ranged from 34% at LC to 56% at CA. These
values were in general higher than those found in Europe (2-38%, Cape et al., 2012),
USA (3-8%, Keene et al., 2002) and the eastern Mediterranean (17%, Mace et al., 2003;
23%, Violaki and Mihalopoulos, 2010), but agreed with those reported by Vanguelova
et al. (2010) for the UK (20-50%), and Markaki et al. (2010) for coastal locations in the
Mediterranean Basin (26-38%).
Considering the type of site (Table 1), the plot located in the agricultural region of
Carrascal (CA) registered the highest percentage of DON (56%), followed by the peri-
urban plots (40% at CB and 38% at TC) and ultimately by LC, the site located in the
Montseny mountains which was considered as a background point (34%). This gradient
is partially in accordance with data from other spatial networks, which also reported
higher contributions of DON to TDN in agricultural areas with elevated N deposition
fluxes, especially where organic fertilizer is applied (Zhang et al., 2008, 2012), and
lower percentages of DON in urban and sub-urban areas with lower N deposition rates
(Pacheco et al., 2004; Zhang et al., 2012). However, those networks also showed that
samples from remote areas registered the highest contribution of DON to TDN, with
percentages of 70-80% in the Tibetan Plateau (Zhang et al., 2008, 2012) and 92% in
Venezuela (Pacheco et al., 2004), although total N deposition was lower in comparison
to agricultural and urban areas. These data are opposed to those found at LC, where a
low DON to TDN ratio and high fluxes of N deposition were registered. A probable
explanation for this discrepancy is that LC is not a true background point far from the
influence of anthropogenic emissions, since recent research has found that local
sources and long-range transport of pollutants might be influencing rain chemistry at
this site (Izquierdo et al., 2012).
DON concentrations in samples from holm oak TF ranged from 0.93 to 1.98 mg l-1,
being amongst the highest values reported in throughfall surveys: 0.35 mg l-1 in boreal
forest (Piirainen et al., 1998), 0.27 mg l-1 in tropical wet forest (authors’ estimates from
deposition and precipitation data from Schwendenmann and Veldkamp, 2005), or
0.25-1.11 mg l-1 in temperate forest (Michalzik et al., 2001). No TF references for
comparison were found in the Mediterranean area or other semi-arid environments.
Annual deposition and percent contribution were within the range of those reported in
Chapter 2
98
the literature for non-water limited forests (56%, Piirainen et al., 1998; 1.2-11.5 kg ha-1
yr-1, Michalzik et al., 2001; 80%, Gaige et al., 2007; 31-48%, Mustajarvi et al., 2008).
Potential sources and annual variability
The DON inferred approach has the advantage of estimating the total amount of the
organic fraction, but the origin and identity of individual components of that fraction
have not been characterized. To identify the potential origins of DON, correlation
analysis between DON and other ions in solution (monthly deposition data),
meteorological variables and atmospheric concentrations of NO2, NH3 and O3 was
performed (Table 4). Only BD correlation data were taken into account, since TF data
may be influenced by canopy interactions and may lead to misinterpretations.
Moreover, monthly deposition patterns of the studied nitrogenous species for both BD
and TF plots were depicted in order to better understand variability over the year and
recognize temporal trends that helped us to support hypotheses about likely sources
of DON (Fig. 1).
In our study, precipitation amount was identified as an important meteorological
factor affecting the amount and annual distribution of both inorganic and organic
nitrogen deposition at all locations (Table 4). Other surveys also found a strong
dependence of deposition with rainfall patterns (Violaki et al., 2010; Li et al., 2012).
Positive relationships were found between DON and nss-Mg2+ and nss-Ca2+ at CB and
TC, and between DON and nss-Mg2+ at CA (BD data, Table 4). These ions have been
identified as dust indicators in previous surveys (Àvila et al., 1998; Mace et al., 2003;
Lesworth et al., 2010). However, their association with DON does not show if they
have the same origin or whether organic N from other sources has been adsorbed on
the mineral aerosol.

DON to holm oak forest in the Iberian Peninsula
99
Table 3. Annual volume weighted mean concentrations (VWM, mg N l-1), average bulk or throughfall deposition (Bulk Dep., TF Dep.; kg N ha-1)
and contributions (%) of measured nitrogen species at the monitoring sites. Minimum and maximum values of VWM concentrations and
contributions are shown to illustrate variability of these measurements over the year.
Can Balasc La Castanya Carrascal Tres Cantos
N-NH4 N-NO3 DON N-NH4 N-NO3 DON N-NH4 N-NO3 DON N-NH4 N-NO3 DON
Bu
lk (
BD
) si
te
VWM 0.23 0.35 0.38 0.27 0.37 0.33 0.61 0.30 1.14 0.15 0.25 0.25
Min 0.00 0.04 0.07
0.01 0.21 0.07
0.03 0.10 0.21
0.00 0.06 0.04
Max 0.43 0.93 1.28
1.51 1.50 1.42
2.88 2.59 9.14
0.62 1.39 1.89
% 24 36 40
28 38 34
30 14 56
24 38 38
Min 0.3 3 10
0.7 18.5 12
0.7 6 11
0 18.5 10
Max 41 61 69
43 58 67
60 81 76
46 69 78
Bulk Dep. 1.89 2.90 3.17
2.58 3.54 3.11
6.55 3.18 12.27
0.68 1.08 1.08
Thro
ugh
fall
(TF)
sit
e
VWM 0.46 1.08 0.93 0.48 1.30 1.75 0.43 0.44 1.38 0.16 0.62 1.98
Min 0.00 0.07 0.21
0.00 0.07 0.07
0.03 0.17 0.41
0.00 0.03 0.45
Max 2.64 7.56 3.13
1.65 8.23 3.42
1.11 4.91 9.73
2.38 14.99 58.57
% 19 43 38
13 37 50
19 20 61
6 22 72
Min 0.1 2 6
0.2 5 8
0.3 7 21
0 0.5 27.5
Max 39 77 98
44.5 83 92
51 71 87
17 61.5 97
TF Dep. 2.62 6.11 5.30 3.25 8.81 11.87 3.70 3.80 11.91 0.44 1.66 5.34

Chapter 2
100
In CA (agricultural area), BD deposition data showed significant positive relationships
of DON with N-NH4+ and N-NO3
- (Table 4). DON peaked in October, January, March and
June (Fig. 1), coinciding with peaks in ammonium and nitrate (except in June).
Although rainfall amounts may affect these peaks, it is likely that other factors are
involved, since variations in the size of the peaks are not proportional to the
precipitation amount. In fact, DON deposition peaks in October and March are higher
than the one in January, the month with the highest rainfall amount. Events in
agricultural practices appear to be correlated with peaks in inorganic N: sowing time in
October with ammonium-nitrate fertilization; from January to March additional
fertilizer is applied (generally twice, one in January with inorganic fertilizer and a
second one in March, usually with urea); late June or early July is the harvest season.
These findings are in agreement with those from Zhang et al. (2008, 2012), who saw a
clear influence of agricultural activities in the organic N budgets.
DON from CB and TC showed positive correlations with NO3- , but were negatively
correlated to atmospheric NO2 (BD data, Table 4). This relationship could indicate that
organic nitrates may be an important component of the DON at these sites. Organic
nitrates are formed as a result of photochemical reactions of hydrocarbons with NOx
(NO + NO2) (Atherton and Penner, 1990; Neff et al., 2002). When these reactions
occur, the expected products in precipitation are both organic nitrates and NO3-
(Keene et al., 2002), while a reduction in NO2 air concentrations may be predicted. CB
is located in the metropolitan area of Barcelona and TC is just 9 km away from Madrid.
These two cities are the biggest in Spain, with more than 3 million inhabitants in their
metropolitan areas (www.amb.cat and www.madrid.org). Therefore, polluted air
masses derived from combustion and vehicle exhaust might have been a starting point
for organic nitrate formation because of their enrichment in NOx (Salvador et al., 2015;
Malik and Tauler, 2015) and VOCs (Pérez et al., 2002), precursors of the nitrogen
containing organic compounds. The same phenomenon was found by Li et al. (2012) in
Guangzhou city.

DON to holm oak forest in the Iberian Peninsula
101
Moreover, the peaks of the dissolved nitrogenous species at certain periods seem to
corroborate this hypothesis (Fig. 1). At TC, DON and N-NO3- peaked together in
September, whereas N-NH4+ peaked in March. TF data also showed large co-occurring
DON and N-NO3- peaks at this site in September, while in May another DON peak was
found along with a smaller N-NO3- one. Thus, both BD and TF data at TC showed a
common trend for nitrate and DON which differed from the ammonium one. At CB,
maximum values of DON in December followed a N-NO3- peak in November, which
could imply the transformation of inorganic nitrate forms into organic ones (Roberts,
1990; Atkinson, 1990). However, BD graphical data also depicts a common temporal
trend of DON with both inorganic N ions, peaking together in March. TF data also
recorded this peak in spring. Therefore, it seems likely that not only nitrate but also
ammonium participated in the DON formation at site CB.
Indeed, according to visual observations of temporal patterns at CB, DON deposition
was also significantly related to N-NH4+ (BD data, Table 4). This may be attributable to
emissions from three way catalytic converters on motor vehicles, which are a source of
ammonia emissions (Kean et al., 2009). CB is sited only 150 m from the nearest
highway, which has an average traffic flow of 40-50 thousand vehicles per day.
Therefore, the relationship between DON and N-NH4+ may corroborate the hypothesis
that DON at this location is mainly generated in secondary processes linked to road
traffic emissions. At TC this association was not seen, probably because of the longer
distance between the monitoring site and the highway (1.5 km).
In addition, another correlation was found at CB. This plot, 11 km from the sea, was
the only site that showed significant correlations between DON and Na+ and Cl- (BD
data, Table 4), suggesting that part of the organic fraction at this site has a marine
origin (Violaki and Mihalopoulos, 2010), or at least is associated with marine aerosol.
Chapter 2
102
Table 4. Spearman correlation coefficients between fluxes of DON and other species in bulk deposition. Only significant correlations are shown.
Rainfall NH4+ NO3
- TDN Na+ Cl- nss-K+ nss-Ca+2 nss-Mg+2 nss-SO4-2 NO2
Can Balasc (CB) BD 0.808** 0.736** 0.753** 0.956** 0.720** 0.670* 0.742** 0.813** 0.852** - 0.786*
La Castanya (LC) BD 0.667*
0.817**
0.717*
0.733*
Carrascal (CA) BD 0.824** 0.802** 0.857** 0.973**
0.824**
0.571* 0.604*
Tres Cantos (TC) BD 0.758** 0.742** 0.863** 0.714** 0.610* 0.687** - 0.738*
* significant at p < 0.05; ** significant at p < 0.01.
TDN => Total dissolved nitrogen
nss => non sea salt

DON to holm oak forest in the Iberian Peninsula
103
Figure 1. Monthly bulk (BD) and throughfall (TF) deposition of nitrogenous species (kg N ha-1) and rainfall (mm) at the four monitoring sites in
the Iberian Peninsula.
0
50
100
150
200
250
0
0,5
1
1,5
2
2,5
6 7 8 9 10 11 12 1 2 3 4 5 6 6 7 8 9 10 11 12 1 2 3 4 5 6
BD TF
kg
N h
a-1
mm
Can Balasc (CB)
rainfall N-NH4 N-NO3 DON
0
50
100
150
200
250
0
0,5
1
1,5
2
2,5
6 7 8 9 10 11 12 1 2 3 4 5 6 6 7 8 9 10 11 12 1 2 3 4 5 6
BD TF
kg
N h
a-1
mm
La Castanya (LC)
rainfall N-NH4 N-NO3 DON
0
50
100
150
200
250
0
0,5
1
1,5
2
2,5
6 7 8 9 10 11 12 1 2 3 4 5 6 6 7 8 9 10 11 12 1 2 3 4 5 6
BD TF
kg
N h
a-1
mm
Carrascal (CA)
rainfall N-NH4 N-NO3 DON
0
50
100
150
200
250
0
0,5
1
1,5
2
2,5
7 8 9 10 11 12 1 2 3 4 5 6 7 7 8 9 10 11 12 1 2 3 4 5 6 7
BD TF
kg
N h
a-1
mm
Tres Cantos (TC)
rainfall N-NH4 N-NO3 DON
Chapter 2
104
Correlation data from LC showed no relationship between DON and inorganic N
components, being only related to nss-K+ and nss-SO42- (BD data, Table 4). Nss-SO4
2-
has widely been used as an anthropogenic tracer, directly linked to pollution emission
activities (Violaki et al., 2010; Li et al., 2012). LC site is located about 40 km from
Barcelona and it is relatively protected from the influence of the metropolitan area
and its industrial activities, being considered as a rural or background plot (Rodrigo et
al., 2003). So, it was not expected that anthropogenic emissions would affect this site.
However, recent work from Izquierdo et al. (2012) showed that both local sources and
long-range transport of SO42- generated in Central and Eastern Europe influence rain
chemistry at LC, which suggests that DON at this location may be linked to
anthropogenic activities rather than to natural processes. Nevertheless, it should be
taken into account that only 8 months of DON measurements were available at this
site for statistical analysis and this may potentially bias the correlations.
Finally, at all sampling sites DON deposition was strongly correlated with nss-K+ (BD
data, Table 4). Potassium salts are regarded as indicators of plant-derived particles
(Pölker et al., 2012). Matsumoto et al. (2014) suggested that correlation between the
DON and nss-K+ would indicate the influence of vegetation sources on the DON
budgets. In our study sites, where BD plots are surrounded by holm oak forests (and
also crop fields in CA), it seems probable that biogenic processes may be responsible to
some extent for the organic budgets at these locations. However, at CB and TC this
significant relationship between DON and nss-K+ deposition may have another
explanation. Pöhlker et al. (2012), besides identifying its biogenic origin, observed that
potassium salts served as initial seeds for the condensation of VOC oxidation products,
being directly related to secondary organic aerosol processes. Therefore, at these peri-
urban sites it seems probable that organic nitrogen may be associated with potassium
salts after being generated in secondary reactions. This hypothesis would explain why
Matsumoto et al. (2014) found significant correlations between DON and nss-K+ at an
urban site and not at a forested one as they expected.
DON to holm oak forest in the Iberian Peninsula
105
Regarding throughfall patterns, two important conclusions can be reached. On the one
hand, data showed that dry deposition also contributes to the total amount of organic
nitrogen that arrives at these sites, since DON fluxes were higher in TF than BD at all
sites except for CA, where differences were negligible (Table 3). In all TF plots, DON
peaks were registered after periods of little rain, both in precipitation events during
(CA) or just after the summer season (TC and LC) and also after the drier winter
months, in March (CB, LC and TC). This fact suggests that the dry organic nitrogen
previously deposited and accumulated in the forest canopy is washed out in
subsequent rain events, similarly to that reported in Violaki et al. (2010). Another
possible explanation would be that in dry conditions the canopy flora convert dry
deposited inorganic N to organic N (Cape et al., 2010). On the other hand, from March
to May, high DON rates were registered at the Barcelona and Madrid TF plots. It is
likely that this result is due to deposition of pollen, spores and plant debris that are
abundant during spring time (Zhang et al., 2008; Violaki et al., 2010). At CA there is a
DON maximum in March that does not match with any of the aforementioned
hypotheses: previous months were not especially dry and DON fluxes greatly
decreased in April, May and June in comparison with the March peak. A possible
explanation is that urea fertilizer applied during this month in the surrounding fields
also affects the forest canopy, and was recorded in the TF chemistry.
All these findings show the multiple sources and compounds that may participate in
the organic nitrogen budgets in the western Mediterranean, and highlight the
limitations in estimating the amount and mechanisms that contribute to those
budgets.
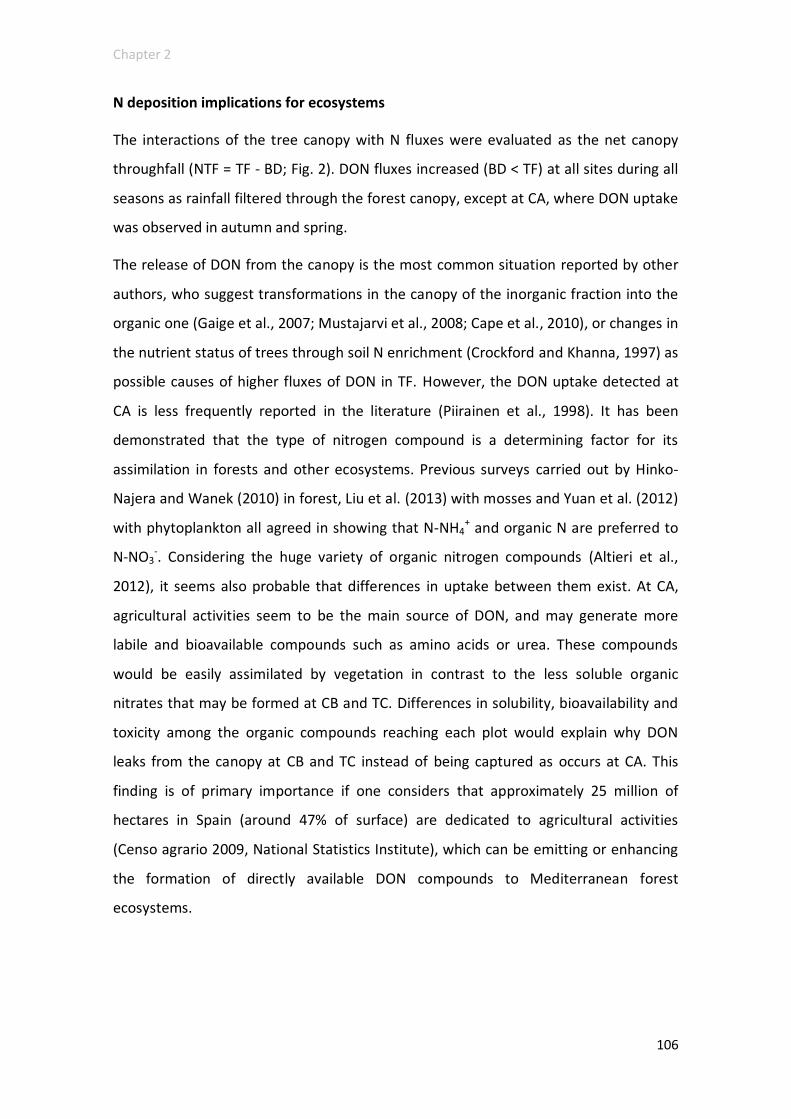
Chapter 2
106
N deposition implications for ecosystems
The interactions of the tree canopy with N fluxes were evaluated as the net canopy
throughfall (NTF = TF - BD; Fig. 2). DON fluxes increased (BD < TF) at all sites during all
seasons as rainfall filtered through the forest canopy, except at CA, where DON uptake
was observed in autumn and spring.
The release of DON from the canopy is the most common situation reported by other
authors, who suggest transformations in the canopy of the inorganic fraction into the
organic one (Gaige et al., 2007; Mustajarvi et al., 2008; Cape et al., 2010), or changes in
the nutrient status of trees through soil N enrichment (Crockford and Khanna, 1997) as
possible causes of higher fluxes of DON in TF. However, the DON uptake detected at
CA is less frequently reported in the literature (Piirainen et al., 1998). It has been
demonstrated that the type of nitrogen compound is a determining factor for its
assimilation in forests and other ecosystems. Previous surveys carried out by Hinko-
Najera and Wanek (2010) in forest, Liu et al. (2013) with mosses and Yuan et al. (2012)
with phytoplankton all agreed in showing that N-NH4+ and organic N are preferred to
N-NO3-. Considering the huge variety of organic nitrogen compounds (Altieri et al.,
2012), it seems also probable that differences in uptake between them exist. At CA,
agricultural activities seem to be the main source of DON, and may generate more
labile and bioavailable compounds such as amino acids or urea. These compounds
would be easily assimilated by vegetation in contrast to the less soluble organic
nitrates that may be formed at CB and TC. Differences in solubility, bioavailability and
toxicity among the organic compounds reaching each plot would explain why DON
leaks from the canopy at CB and TC instead of being captured as occurs at CA. This
finding is of primary importance if one considers that approximately 25 million of
hectares in Spain (around 47% of surface) are dedicated to agricultural activities
(Censo agrario 2009, National Statistics Institute), which can be emitting or enhancing
the formation of directly available DON compounds to Mediterranean forest
ecosystems.
DON to holm oak forest in the Iberian Peninsula
107
Figure 2. Seasonal net canopy throughfall (NTF = TF-BD; kg N ha-1) at the four evergreen holm oak forests studied in the Iberian Peninsula.
Negative values indicate canopy uptake, whereas positive values indicate release from the canopy.
-0,5
0
0,5
1
1,5
2
2,5
Summer Autumn Winter Spring
Can Balasc (CB)
N-NH4 N-NO3 DON
-1
-0,5
0
0,5
1
1,5
2
Summer Autumn Winter Spring
La Castanya (LC)
N-NH4 N-NO3 DON
-1,5
-1
-0,5
0
0,5
1
1,5
Summer Autumn Winter Spring
Carrascal (CA)
N-NH4 N-NO3 DON
-0,5
0
0,5
1
1,5
2
Summer Autumn Winter Spring
Tres Cantos (TC)
N-NH4 N-NO3 DON
Chapter 2
108
On the other hand, it is noteworthy that DON uptake at CA occurred in autumn and
spring. These are the periods when the greatest vegetation activity was expected.
Firstly, seasonal changes in the N behaviour of ecosystems are driven by seasonal
fluctuations of physical drivers (i.e. weather conditions) and biological factors (Shibata
et al., 2015). In the Mediterranean area, nitrogen dry deposition accumulates in soil
and on plant surfaces during dry periods, becoming available as high N concentration
pulses with rainfall events (Meixner and Fenn, 2004; Ochoa-Hueso et al., 2011). In our
study, those rainfall events were registered in autumn, allowing the uptake of the
nitrogen deposited during the summer. Secondly, spring is the main growing season,
and therefore a period of maximum biological demand. Thus, assuming a portion of
the nitrogen taken up is assimilated by vegetation, our finding would imply that certain
DON compounds constitute an additional nutrient supply in Mediterranean
ecosystems during biologically active periods.
These results may have significant implications when working with the critical load
approach, given that the additional input of organic N, which is not included in the risk
evaluation, may provide even greater pressures than predicted, and may pose a threat
to systems where the Critical Load does not appear to be exceeded (Cape et al., 2011;
Cornell, 2011). In aquatic ecosystems it has already been shown that DON is an
important source of nutrients that can stimulate the productivity of these
environments (Seitzinger and Sanders, 1999; Violaki et al., 2010). However, in
terrestrial ecosystems DON effects have been poorly studied and little is known about
the possible damage that deposition of the organic fraction may pose for them.
Moreover, recent findings have revealed that C sequestration and other processes of
the C cycle in soils might be dependent on the IN to ON ratio, highlighting the
importance of the organic fraction in controlling the ecological effect of N deposition
(Du et al., 2014).
Hence, quantification of the organic fraction is important to more fully represent the
nitrogen cycle in forest ecosystems and to evaluate unequivocally the possible
consequences of its alteration.

DON to holm oak forest in the Iberian Peninsula
109
Conclusions
Mediterranean regions have been overlooked in the study of nitrogen deposition and
its possible effects. The present survey has shown that DON may constitute another
factor that increases uncertainties in the knowledge of the nitrogen cycle in this area,
since it has not been routinely assessed and yet was found to contribute from 34% to
56% to TDN in BD. Specific methodological improvements were established in order to
avoid NH3 losses during sample preservation for TN determination that would
otherwise result in an underestimation of DON. The methodology developed here may
be useful for preservation of samples in other locations with similar characteristics.
Depending on the study site, different anthropogenic activities were identified as
potential sources of DON (agricultural practices and pollution derived from combustion
processes, among others), showing that the organic component is extremely complex
and currently poorly understood. Finally, DON uptake was observed at CA during
autumn and spring, two important seasons for the biological cycle, suggesting that at
least part of the organic fraction could be directly assimilated by Mediterranean
forests, which may have significant ecological implications.
Acknowledgments
This work was supported by the Spanish project EDEN (CGL2009-13188-C03-02).
Moreover, the research leading to these results has received funding from the COST
organism (European cooperation in science and technology), through the COST Action
FP0903 “Climate change and forest mitigation and adaptation in the polluted
environment” under the grant number COST-STSMECOST-STSM-FP0903-291012-
019757, and from the European Union Seventh Framework Programme (FP7/2007-
2013) under grant agreement no 262254. Equally, S. Izquieta-Rojano thanks all staff of
the Centre for Ecology & Hydrology of Edinburgh for their hospitality and kindness.
During this study S. Izquieta-Rojano was the recipient of a research grant from the
‘Asociación de Amigos de la Universidad de Navarra’ which is kindly acknowledged.

Chapter 2
110
References
Altieri, K.E., Hastings, M.G., Peters, A.J., Sigman, D.M., 2012. Molecular characterization of water soluble organic nitrogen in marine rainwater by ultra-high resolution electrospray ionization mass spectrometry. Atmos. Chem. Phys. 12, 3557-3571. Araujo, T., Souza, M., de Mello,W., da Silva, D., 2015. Bulk atmospheric deposition of major ions and dissolved organic nitrogen in the lower course of a tropical river basin, southern Bahia. Braz. J. Braz. Chem. Soc. 26 (8), 1692-1701. Atherton, C.S., Penner, J.E., 1990. The effects of biogenic hydrocarbons on the transformation of nitrogen-oxides in the troposphere. J. Geophys. Res. 95, 14027-14038. Atkinson, R., 1990. Gas-phase tropospheric chemistry of organic-compounds – a review. Atmos. Environ. 24, 1-41. Àvila, A., 1996. Time trends in the precipitation chemistry at a mountain site in northeastern Spain for the period 1983-1994. Atmos. Environ. 30 (9), 1363-1373. Àvila, A., Alarc_on, M., Queralt, I., 1998. The chemical composition of dust transported in red rains - its contribution to the biogeochemical cycle of a holm oak forest in Catalonia (Spain). Atmos. Environ. 32, 179-191. Àvila, A., Rod_a, F., 2012. Changes in atmospheric deposition and streamwater chemistry over 25 years in undisturbed catchments in a Mediterranean mountain environment. Sci. Total Environ. 434, 18-27. Bobbink, R., Hicks, K., Galloway, J., Spranger, T., Alkemade, R., Ashmore, M., Bustamante, M., Cinderby, S., Davidson, E., Dentener, F., Emmett, B., Erisman, J., Fenn, M., Gilliam, F., Nordin, A., Pardo, L., De Vries, W., 2010. Global assessment of nitrogen deposition effects on terrestrial plant diversity: a synthesis. Ecol. Appl. 20, 30-59. Cape, J.N., Smith, R.I., Leaver, D., 2015. Missing data in spatio-temporal datasets: the UK rainfall chemistry network. Geosci. Data J. http://dx.doi.org/10.1002/gdj3.24. Article first published online: 1 APR 2015. Cape, J.N., Tang, Y.S., González-Benítez, J.M., Mitosinkova, M., Makkonen, U., Jocher, M., Stolk, A., 2012. Organic nitrogen in precipitation across europe. Biogeosciences 9, 4401-4409. Cape, J.N., Cornell, S.E., Jickells, T.D., Nemitz, E., 2011. Organic nitrogen in the atmosphere - where does it come from? A review of sources and methods. Atmos. Res. 102, 30-48. Cape, J.N., Sheppard, L.J., Crossley, A., van Dijk, N., Tang, Y.S., 2010. Experimental field estimation of organic nitrogen formation in tree canopies. Environ. Pollut. 158, 2926-2933. Cape, J.N., Kirika, A., Rowland, A.P., Wilson, D.R., Jickells, T.D., Cornell, S., 2001. Organic nitrogen in precipitation: real problem or sampling artefact? Sci.World J. 1, 230-237. Cornell, S.E., Jickells, T.D., Cape, J.N., Rowland, A.P., Duce, R.A., 2003. Organic nitrogen deposition on land and coastal environments: a review of methods and data. Atmos. Environ. 37, 2173-2191. Cornell, S.E., 2011. Atmospheric nitrogen deposition: revisiting the question of the importance of the organic component. Environ. Pollut. 159, 2214-2222. Crockford, R.H., Khanna, P.K., 1997. Chemistry of throughfall, stemflow and litterfall in fertilized and irrigated Pinus radiata. Hydrol. Process. 11 (11), 1493-1507.
DON to holm oak forest in the Iberian Peninsula
111
Dias, T., Malveiro, S., Martins-Loucao, M.A., Sheppard, L.J., Cruz, C., 2011. Linking Ndriven biodiversity changes with soil N availability in a Mediterranean ecosystem. Plant Soil 341, 125-136. Du, Y., Guo, P., Liu, J., Wang, C., Yang, N., Jiao, Z., 2014. Different types of nitrogen deposition show variable effects on the soil carbon cycle process of temperate forests. Glob. Change Biol. 20, 3222-3228. El Haddad, I., Marchand, N., D'Anna, B., Jaffrezo, J.L., Wortham, H., 2013. Functional group composition of organic aerosol from combustion emissions and secondary processes at two contrasted urban environments. Atmos. Environ. 75, 308-320. Erisman, J.W., Galloway, J.N., Seitzinger, S., Bleeker, A., Dise, N.B., Petrescu, A.M.R., Leach, A.M., de Vries, W., 2013. Consequences of human modification of the global nitrogen cycle. Philos. Trans. R. Soc. B Biol. Sci. 368. Erisman, J.W., Galloway, J., Seitzinger, S., Bleeker, A., Butterbach-Bahl, K., 2011. Reactive nitrogen in the environment and its effect on climate change. Curr. Opin. Environ. Sustain. 3, 281-290. Farrell, M., Prendergast-Miller, M., Jones, D.L., Hill, P.W., Condron, L.M., 2014. Soil microbial organic nitrogen uptake is regulated by carbon availability. Soil Biol. Biochem. 77, 261-267. Fenn, M.E., Baron, J.S., Allen, E.B., Rueth, H.M., Nydick, K.R., Geiser, L., Bowman,W.D., Sickman, J.O., Meixner, T., Johnson, D.W., Neitlich, P., 2003. Ecological effects of nitrogen deposition in the western United States. Bioscience 53, 404-420. Fondazione Salvatore Maugeri, 2006. Instruction Manual for Radiello Sampler, Edition 01/2006. http://www.radiello.com. Gaige, E., Dail, D.B., Hollinger, D.Y., Davidson, E.A., Fernández, I.J., Sievering, H., White, A., Halteman, W., 2007. Changes in canopy processes following whole forest canopy nitrogen fertilization of a mature spruce-hemlock forest. Ecosystems 10, 1133-1147. Galloway, J.N., Winiwarter, W., Leip, A., Leach, A.M., Bleeker, A., Erisman, J.W., 2014. Nitrogen footprints: past, present and future. Environ. Res. Lett. 9, 11, 115003. García-Gómez, H., Garrido, J.L., Vivanco, M.G., Lassaletta, L., Rábago, I., Àvila, A., Tsyro, S., Sánchez, G., González Ortiz, A., González-Fernández, I., Alonso, R., 2014. Nitrogen deposition in Spain: modeled patterns and threatened habitats within the natural 2000 network. Sci. Total Environ. 485, 450-460. Hinko-Najera Umana, N., Wanek, W., 2010. Large canopy exchange fluxes of inorganic and organic nitrogen and preferential retention of nitrogen by epiphytes in a tropical lowland rainforest. Ecosystems 13, 367-381. Im, U., Christodoulaki, S., Violaki, K., Zarmpas, P., Kocak, M., Daskalakis, N., Mihalopoulos, N., Kanakidou, M., 2013. Atmospheric deposition of nitrogen and sulfur over southern Europe with focus on the Mediterranean and the Black sea. Atmos. Environ. 81, 660-670. International Co-operative Programme on Assessment and Monitoring of Air Pollution Effects on Forests operating under the UNECE Co. nvention on Longrange Transboundary Air Pollution. 2010. http://icp-forests.net/page/icpforests-manual. Izquierdo, R., Àvila, A., 2012. Comparison of collection methods to determine atmospheric deposition in a rural Mediterranean site (NE Spain). J. Atmos. Chem. 69, 351-368. Izquierdo, R., Àvila, A., Alarcón, M., 2012. Trajectory statistical analysis of atmospheric transport patterns and trends in precipitation chemistry of a rural site in NE Spain in 1984-2009. Atmos. Environ. 61, 400-408.
Chapter 2
112
Jickells, T., Baker, A.R., Cape, J.N., Cornell, S.E., Nemitz, E., 2013. The cycling of organic nitrogen through the atmosphere. Philos. Trans. R. Soc. B Biol. Sci. 368. Jones, D.L., Shannon, D., Murphy, D.V., Farrar, J., 2004. Role of dissolved organic nitrogen (DON) in soil N cycling in grassland soils. Soil Biol. Biochem. 36, 749-756. Kanakidou, M., Duce, R.A., Prospero, J.M., Baker, A.R., Benitez-Nelson, C., Dentener, F.J., Hunter, K.A., Liss, P.S., Mahowald, N., Okin, G.S., Sarin, M., Tsigaridis, K., Uematsu, M., Zamora, L.M., Zhu, T., 2012. Atmospheric fluxes of organic N and P to the global ocean. Glob. Biogeochem. Cycl. 26, GB3026. Kean, A.J., Littlejohn, D., Ban-Weiss, G.A., Harley, R.A., Kirchstetter, T.W., Lunden, M.M., 2009. Trends in on-road vehicle emissions of ammonia. Atmos. Environ. 43, 1565-1570. Keene, W.C., Montag, J.A., Maben, J.R., Southwell, M., Leonard, J., Church, T.M., Moody, J.L., Galloway, J.N., 2002. Organic nitrogen in precipitation over eastern North America. Atmos. Environ. 36, 4529-4540. Lesworth, T., Baker, A.R., Jickells, T., 2010. Aerosol organic nitrogen over the remote Atlantic Ocean. Atmos. Environ. 44, 1887-1893. Li, J., Fang, Y., Yoh, M., Wang, X., Wu, Z., Kuang, Y., Wen, D., 2012. Organic nitrogen deposition in precipitation in metropolitan Guangzhou city of southern China. Atmos. Res. 113, 57-67. Liu, X., Koba, K., Makabe, A., Li, X., Yoh, M., Liu, C., 2013. Ammonium first: Natural mosses prefer atmospheric ammonium but vary utilization of dissolved organic nitrogen depending on habitat and nitrogen deposition. New Phytologist 199, 407-419. Mace, K.A., Kubilay, N., Duce, R.A., 2003. Organic nitrogen in rain and aerosol in the eastern Mediterranean atmosphere: an association with atmospheric dust. J. Geophys. Res. 108, 4320. Malik, A., Tauler, R., 2015. Exploring the interaction between O3 and NOx pollution patterns in the atmosphere of Barcelona, Spain using the MCR-ALS method. Sci. Total Environ. 517, 151-161. Markaki, Z., Loye-Pilot, M.D., Violaki, K., Benyahya, L., Mihalopoulos, N., 2010. Variability of atmospheric deposition of dissolved nitrogen and phosphorus in the Mediterranean and possible link to the anomalous seawater N/P ratio. Mar. Chem. 120, 187-194. Matsumoto, K., Yamamoto, Y., Kobayashi, H., Kaneyasu, N., Nakano, T., 2014. Watersoluble organic nitrogen in the ambient aerosols and its contribution to the dry deposition of fixed nitrogen species in Japan. Atmos. Environ. 95, 334-343. Meixner, T., Fenn, M., 2004. Biogeochemical budgets in a Mediterranean catchment with high rates of atmospheric N deposition - importance of scale and temporal asynchrony. Biogeochemistry 70, 331-356. Michalzik, B., Kalbitz, K., Park, J.H., Solinger, S., Matzner, E., 2001. Fluxes and concentrations of dissolved organic carbon and nitrogen - a synthesis for temperate forests. Biogeochemistry 52, 173-205. Mustajarvi, K., Merila, P., Derome, J., Lindroos, A., Helmisaari, H., Nojd, P., Ukonmaanaho, L., 2008. Fluxes of dissolved organic and inorganic nitrogen in relation to stand characteristics and latitude in scots pine and Norway spruce stands in Finland. Boreal Environ. Res. 13, 3-21. National Statistics Institute (Spanish Statistical Office). http://www.ine.es/censoagrario Neff, J.C., Holland, E.A., Dentener, F.J., McDowell, W.H., Russell, K.M., 2002. The origin, composition and rates of organic nitrogen deposition: a missing piece of the nitrogen cycle? Biogeochemistry 57, 99-136.

DON to holm oak forest in the Iberian Peninsula
113
Ochoa-Hueso, R., Allen, E.B., Branquinho, C., Cruz, C., Dias, T., Fenn, M.E., Manrique, E., Esther Pérez-Corona, M., Sheppard, L.J., Stock,W.D., 2011. Nitrogen deposition effects on Mediterranean-type ecosystems: an ecological assessment. Environ. Pollut. 159, 2265-2279. Pacheco, M., Donoso, L., Sanhueza, E., 2004. Soluble organic nitrogen in Venezuelan rains. Tellus B 56, 393-395. Pérez, Pastor R.M., García Alonso, S., Quejido Cabezas, A.J., 2002. Volatile organic compounds in the area of Madrid: a chemometrical approach. Environ. Monit. Assess. 75, 33-50. Piirainen, S., Finer, L., Starr, M., 1998. Canopy and soil retention of nitrogen deposition in a mixed boreal forest in eastern Finland. Water Air Soil Pollut. 105, 165-174. Pinho, P., Theobald, M.R., Dias, T., Tang, Y.S., Cruz, C., Martins-Loucao, M.A., Maguas, C., Sutton, M., Branquinho, C., 2012. Critical loads of nitrogen deposition and critical levels of atmospheric ammonia for semi-natural Mediterranean evergreen woodlands. Biogeosciences 9, 1205-1215. Pöhlker, C., Wiedemann, K.T., Sinha, B., Shiraiwa, M., Gunthe, S.S., Smith, M., Su, H., Artaxo, P., Chen, Q., Cheng, Y., Elbert, W., Gilles, M.K., Kilcoyne, A.L.D., Moffet, R.C.,Weigand, M., Martin, S.T., Poeschl, U., Andreae, M.O., 2012. Biogenic potassium salt particles as seeds for secondary organic aerosol in the amazon. Science 337, 1075-1078. Roberts, J.M., 1990. The atmospheric chemistry of organic nitrates. Atmos. Environ. 24, 243-287. Rodrigo, A., Àvila, A., Rod_a, F., 2003. The chemistry of precipitation, throughfall and stemflow in two holm oak (Quercus ilex L) forests under a contrasted pollution environment in NE Spain. Sci. Total Environ. 305, 195-205. Salvador, P., Artinano, B., Viana, M.M., Alastuey, A., Querol, X., 2015. Multicriteria approach to interpret the variability of the levels of particulate matter and gaseous pollutants in the Madrid metropolitan area, during the 1999-2012 period. Atmos. Environ. 109, 205-216. Sanz, M.J., Carratala, A., Gimeno, C., Millán, M.M., 2002. Atmospheric nitrogen deposition on the east coast of Spain: relevance of dry deposition in semi-arid Mediterranean regions. Environ. Pollut. 118, 259-272. Schwendenmann, L., Veldkamp, E., 2005. The role of dissolved organic carbon, dissolved organic nitrogen, and dissolved inorganic nitrogen in a tropical wet forest ecosystem. Ecosystems 8, 339-351. Seitzinger, S.P., Sanders, R.W., 1999. Atmospheric inputs of dissolved organic nitrogen stimulate estuarine bacteria and phytoplankton. Limnol. Oceanogr. 44, 721-730. Shibata, H., Branquinho, C., McDowell, W.H., Mitchell, M.J., Monteith, D.T., Tang, J., Arvola, L., Cruz, C., Cusack, D.F., Halada, L., Kopáček, J., Maguas, C., Sajidu, S., Schubert, H., Tokuchi, N., Zahora, J., 2015. Consequence of altered nitrogen cycles in the coupled human and ecological system under changing climate: the need for long-term and site-based research. Ambio 44, 178-193. Vanguelova, E.I., Benham, S., Pitman, R., Moffat, A.J., Broadmeadow, M., Nisbet, T., Durrant, D., Barsoum, N., Wilkinson, M., Bochereau, F., Hutchings, T., Broadmeadow, S., Crow, P., Taylor, P., Houston, T.D., 2010. Chemical fluxes in time through forest ecosystems in the UK - soil response to pollution recovery. Environ. Pollut. 158, 1857-1869. Vet, R., Artz, R.S., Carou, S., Shaw, M., Ro, C., Aas, W., Baker, A., Bowersox, V.C., Dentener, F., Galy-Lacaux, C., Hou, A., Pienaar, J.J., Gillett, R., Cristina Forti, M., Gromov, S., Hara, H., Khodzher, T., Mahowald, N.M., Nickovic, S., Rao, P.S.P., Reid, N.W., 2014. A global assessment of precipitation chemistry and deposition of sulfur, nitrogen, sea salt, base cations, organic acids, acidity and pH, and phosphorus. Atmos. Environ. 93, 3-100.
Chapter 2
114
Violaki, K., Mihalopoulos, N., 2010. Water-soluble organic nitrogen (WSON) in size segregated atmospheric particles over the eastern Mediterranean. Atmos. Environ. 44, 4339-4345. Violaki, K., Zarbas, P., Mihalopoulos, N., 2010. Long-term measurements of dissolved organic nitrogen (DON) in atmospheric deposition in the eastern Mediterranean: fluxes, origin and biogeochemical implications. Mar. Chem. 120, 179-186. Walker, J.T., Dombek, T.L., Green, L.A., Gartman, N., Lehmann, C.M.B., 2012. Stability of organic nitrogen in NADP wet deposition samples. Atmos. Environ. 60, 573-582. Yuan, X., Glibert, P.M., Xu, J., Liu, H., Chen, M., Liu, H., Yin, K., Harrison, P.J., 2012. Inorganic and organic nitrogen uptake by phytoplankton and bacteria in Hong Kong waters. Estuar. Coasts 35, 325-334. Zhang, Y., Song, L., Liu, X.J., Li, W.Q., Lu, S.H., Zheng, L.X., Bai, Z.C., Cai, G.Y., Zhang, F.S., 2012. Atmospheric organic nitrogen deposition in China. Atmos. Environ. 46, 195-204. Zhang, Y., Zheng, L., Liu, X., Jickells, T., Cape, J.N., Goulding, K., Fangmeier, A., Zhang, F., 2008. Evidence for organic N deposition and its anthropogenic sources in China. Atmos. Environ. 42, 1035-1041.

Chapter 3 Pleurochaete squarrosa (Brid.) Lindb. as an alternative moss species for biomonitoring surveys of heavy metal, nitrogen deposition
and 15N signatures in a Mediterranean area
This chapter reproduces the text of the following manuscript:
Izquieta-Rojano, S., Elustondo, D., Ederra, A., Lasheras, E., Santamaría, C., Santamaría, J.M., 2016.
Pleurochaete squarrosa (Brid.) Lindb. as an alternative moss species for biomonitoring surveys of heavy
metal, nitrogen deposition and δ15N signatures in a Mediterranean area. Ecological Indicators 60, 1221-
1228.
Abstract
There is a significant lack of data in biomonitoring surveys from southern Europe and
other Mediterranean biogeographic areas. This scarcity is mainly due to the
impossibility of finding the commonly recommended species in a great portion of
these dry environments. The present work was carried out with the aim of assessing
the validity of the moss Pleurochaete squarrosa (Brid.) Lindb. (PS) as a feasible
alternative in these regions. The study was developed in the Mediterranean area of
Navarra, in northern Spain, where the response of PS to multiple atmospheric
pollutants (N, Al, As, Cd, Cr, Cu, Fe, Hg, Mn, Ni, Pb, Sb, Ti and Zn) was compared to that
of Hypnum cupressiforme Hedw. (HC), an accepted and widely used species in
biomonitoring surveys. Moreover, N isotopic signatures from both species were
studied to evaluate their effectiveness when identifying nitrogen emission sources.
The enrichment factor (EF) approach was used to evaluate the heavy metal uptake,
showing a similar behaviour for both species: low EF for Al, As, Cr and Fe; intermediate
for Mn, Ni, Pb and Sb; and high for Cd, Cr, Hg and Zn. Equally, both species depicted
the same N deposition patterns across the study area. However, regarding 15N, PS
gave a more congruent picture with the location of the main sources of N emissions in
the area. These data suggest that PS may be a suitable biomonitor to fill the
aforementioned gaps in Mediterranean biogeographic areas.
Keywords: Pleurochaete squarrosa, Hypnum cupressiforme, Biomonitoring, Nitrogen,
heavy metals, 15N isotopic signatures.

Pleurochaete squarrosa as an alternative species for biomonitoring surveys
117
Introduction
In trace element biomonitoring surveys the choice of moss species is of primary
importance, especially with respect to aspects such as distribution, abundance and
accumulation factors (Wolterbeek et al. 1995; Poikolainen et al. 2004). In northern and
central Europe, the most utilized ones are Hylocomium splendens (Hedw.) Schimp.,
Pleurozium schreberi (Willd. ex Brid.) Mitt., Hypnum cupressiforme Hedw. and
Pseudoscleropodium purum (Hedw.) M. Fleisch. The use of a single monitor species is
often common in local studies, but it becomes unusual when the scale of the research
is regional or national and, thus, the difficulty of finding the aforementioned moss
species at every sampling site increases (Galsomies et al. 2003).
Many authors, being aware of this fact, have conducted research on both interspecies
calibration and interspecies comparison with the purpose of 1) finding a calibration
factor that allows for the use, simultaneous or interchangeable, of different moss
species (Galsomies et al. 2003; Carballeira et al. 2008; Varela et al. 2013), and 2)
testing new biomonitors that could yield the same conclusions as the ones validated in
previous surveys (Coskun et al. 2009; Klos et al. 2011; Dmuchowski et al. 2011).
Despite the attempts of these authors to define a standardized method to compare
and to calibrate data when more than one moss species is included in a data set,
nowadays there is not an accurate procedure for doing that. Regression and
correlation statistical tests are by far the most used methods to convert data from one
species to the other, but its use is not recommended in most cases (Thöni et al. 1996;
Reimann et al. 2001), or must be carefully considered (Fernández et al. 2002;
Carballeira et al. 2008).
In the Mediterranean biogeographic area, characterized by two consecutive months of
dryness in the summer season where precipitation (P) is less than two times
temperature (T); P<2T (Rivas-Martínez 2004), the geographical and climatic conditions
change considerably and become more extreme, increasing the problems associated
with the selection of moss species. The above mentioned pleurocarpous mosses are
scarce or nonexistent. They are humidity-demanding species, so they usually thrive
within forests or in much protected microhabitats which are not suitable for

Chapter 3
118
biomonitoring because of the influence of the tree or shrub canopy on the metal and
nitrogen content (Leith et al. 2008; Samecka-Cymerman et al. 2010; Gandois et al.
2014). The availability of these mosses poses a major constraint on the development
of certain biomonitoring surveys in the Mediterranean regions. Several authors have
already dealt with this problem. Gerdol et al. (2000), when evaluating the feasibility of
the moss technique for mapping atmospheric heavy metal deposition in Italy, found
many difficulties to locate the collection sites because of the absence of species
commonly accepted as suitable biomonitors. Finally, they limited their sampling to
places where those species grew instead of selecting the ones where the estimation of
the atmospheric deposition would be desired; Fernández et al. (2002), in their
northern Spain study, highlighted the necessity of finding another alternative species
to Hypnum cupressiforme when sampling in drier areas. The same conclusion was
reached by Spiric et al. (2012) in Croatia. Therefore, finding an alternative moss species
for biomonitoring surveys it is nowadays one of the challenges that Mediterranean
countries need to face.
Tolerance, abundance and ease of sampling are three of the main characteristics that a
good biomonitor should satisfy. Given the special features of the Mediterranean
climate, the only species that fulfill the aforementioned conditions in southern Europe
are mostly acrocarpous. These species are much more tolerant of dry conditions. Thus,
they are much more abundant and widespread in the Mediterranean Basin (Zander
1993). However, they are, by definition, morphologically different from pleurocarpous
mosses. This fact is of primary importance, since the morphological features (closely
linked to the surface/area ratio) (Halleraker et al. 1998; Castello 2007), and the growth
habit (Zechmeister 1998; Gerdol et al. 2002; Szczepaniak and Biziuk 2003) have been
pointed out as the most important factors affecting heavy metal accumulation capacity
and retention efficiency when different moss species were compared. Pleurocarpous
species develop their sporophytes laterally from periquecial leaves, further increasing
their biomass by developing new branches with an exponential growth pattern (Glime
2007). This taxa grows prostrate and usually forms dense mats. Acrocarpous species
develop their sporophytes from the stem apice. They are unbranched or almost
unbranched, with an erect, linear growth (Glime 2007). A third classification includes

Pleurochaete squarrosa as an alternative species for biomonitoring surveys
119
cladocarpous species, which develop their sporophytes in the apice of lateral branches
and have an erect growth habit, similar to that of acrocarpous mosses. Consequently,
variation among pleurocarpous-acrocarpous-cladocarpous species reflects the
frequency of branching and speed of growth, resulting in dense or open aggregates of
plants that vary in size, rather than differences in branching architecture (Newton and
Tangney 2007). Thus, pleurocarpous species are usually carpet-forming mosses,
whereas acrocarpous bryophytes generally form lax, small tufts and cushions. These
differences in the growth form and branching patterns have made that pleurocarpous
species are preferred when working in biomonitoring surveys. However, in spite of the
possible disadvantages, some authors have used acrocarpous/cladocarpous species for
studying different atmospheric pollutants with successful results (Wilson et al. 2009;
Sert et al. 2011; Gerdol et al. 2014). Nevertheless, to date there is not any interspecies
calibration or comparison study to confirm their suitability for biomonitoring surveys.
Only Fabure et al. (2010) compared pleurocarpous and acrocarpous species by using
the active monitoring technique.
The present work focuses on the feasibility of the moss Pleurochaete squarrosa as a
biomonitor of heavy metals and nitrogen atmospheric pollution in southern Europe,
and more precisely in the administrative unit of Navarra, in the north of Spain. To that
end, we have compared native samples of this species with native samples of Hypnum
cupressiforme, an accepted and widely used pleurocarpous moss in biomonitoring
surveys, in order to determine if both bryophytes depict the same heavy metal and N
deposition patterns. Moreover, we studied the 15N signatures in both bryophytes to
evaluate their ability to discriminate potential nitrogen emission sources.
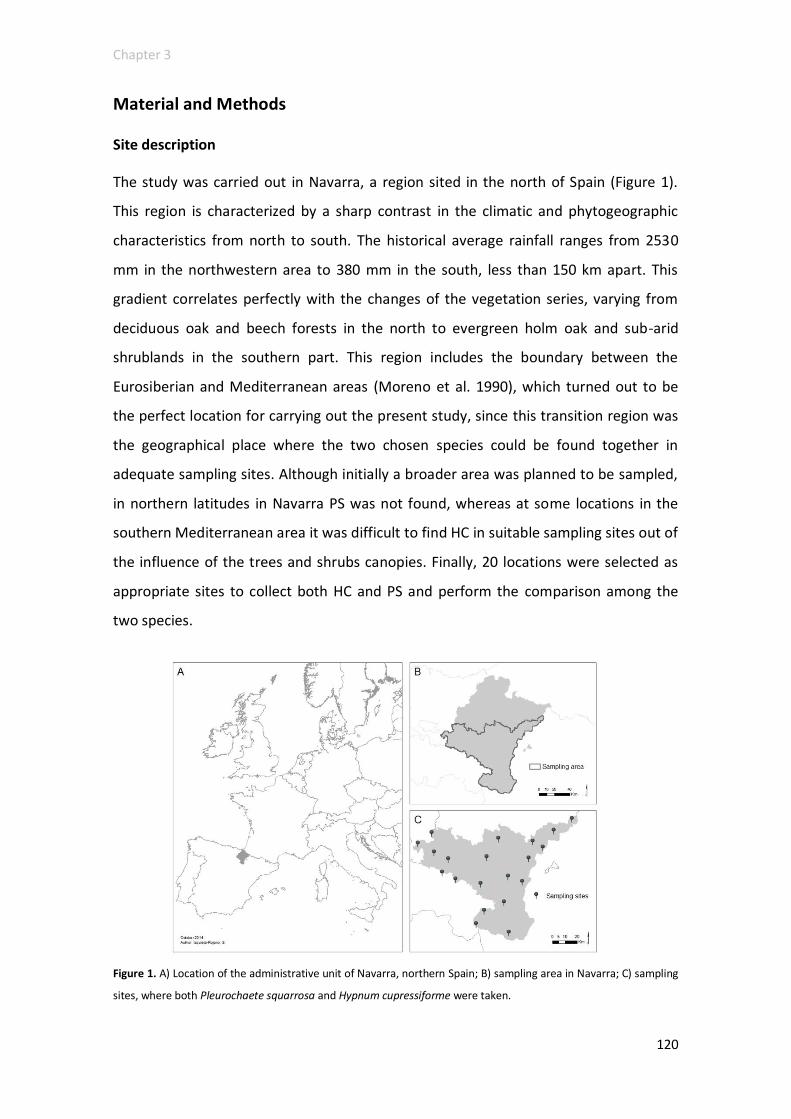
Chapter 3
120
Material and Methods
Site description
The study was carried out in Navarra, a region sited in the north of Spain (Figure 1).
This region is characterized by a sharp contrast in the climatic and phytogeographic
characteristics from north to south. The historical average rainfall ranges from 2530
mm in the northwestern area to 380 mm in the south, less than 150 km apart. This
gradient correlates perfectly with the changes of the vegetation series, varying from
deciduous oak and beech forests in the north to evergreen holm oak and sub-arid
shrublands in the southern part. This region includes the boundary between the
Eurosiberian and Mediterranean areas (Moreno et al. 1990), which turned out to be
the perfect location for carrying out the present study, since this transition region was
the geographical place where the two chosen species could be found together in
adequate sampling sites. Although initially a broader area was planned to be sampled,
in northern latitudes in Navarra PS was not found, whereas at some locations in the
southern Mediterranean area it was difficult to find HC in suitable sampling sites out of
the influence of the trees and shrubs canopies. Finally, 20 locations were selected as
appropriate sites to collect both HC and PS and perform the comparison among the
two species.
Figure 1. A) Location of the administrative unit of Navarra, northern Spain; B) sampling area in Navarra; C) sampling
sites, where both Pleurochaete squarrosa and Hypnum cupressiforme were taken.

Pleurochaete squarrosa as an alternative species for biomonitoring surveys
121
Species selection
Hypnum cupressiforme Hedw. (HC) and Pleurochaete squarrosa (Brid.) Lindb. (PS) were
the chosen species.
HC is one of the four pleurocarpous species recommended by the International
Cooperative Programme on Effects of Air Pollution on Natural Vegetation and Crops
(ICP Vegetation). It has been widely used to identify spatial patterns and temporal
trends in Europe (Harmens et al. 2010 and 2014), to make interspecies
calibrations/comparisons in countries with dry climates such as Italy (Tretiach et al.
2007), Turkey (Coskun et al. 2009) or Spain (Carballeira et al. 2008), and to assess
heavy metal and nitrogen deposition on a local scale in our study area (González-
Miqueo et al., 2009 and 2010). Although it is widespread across Europe and can be
found in both Eurosiberian and Mediterranean bioclimatic regions, its use for
biomonitoring purposes in the Mediterranean area is limited. Pleurocarpous mosses
are sensitive to dryness (Harmens et al., 2013), so in this region of southern Europe HC
is less frequent and it appears relegated to shaded, protected niches under the
canopy, searching for humid environments. This fact prevents it from being used in
biomonitoring surveys because of the influence of canopy trees and shrubs in its metal
and nitrogen content. Some authors working in these dry areas already faced this
problem and suggested the need of finding an alternative moss species that allow
them to perform extensive monitoring surveys instead of being limited to the
adequate sampling places where HC might grow (Gerdol et al., 2000; Fernández et al.,
2002).
PS is widely distributed in the Mediterranean Basin (Grundmann et al. 2007; Ochoa-
Hueso and Manrique 2013), as well as in north and east Africa, southern North
America and Asia. Moreover, it is currently spreading across central and north-western
Europe as a result of global warming (Grundmann et al. 2008). It develops in open and
unshaded areas, hence avoiding the influence of trees and shrubs in heavy metals
(HM) and nitrogen concentrations. It is defined as a terricolous, indifferent moss with
some calcicolous preference and gypsicolous tolerant (Guerra et al., 2006). As an
example, PS is distributed throughout the Iberian Peninsula no matter the type of
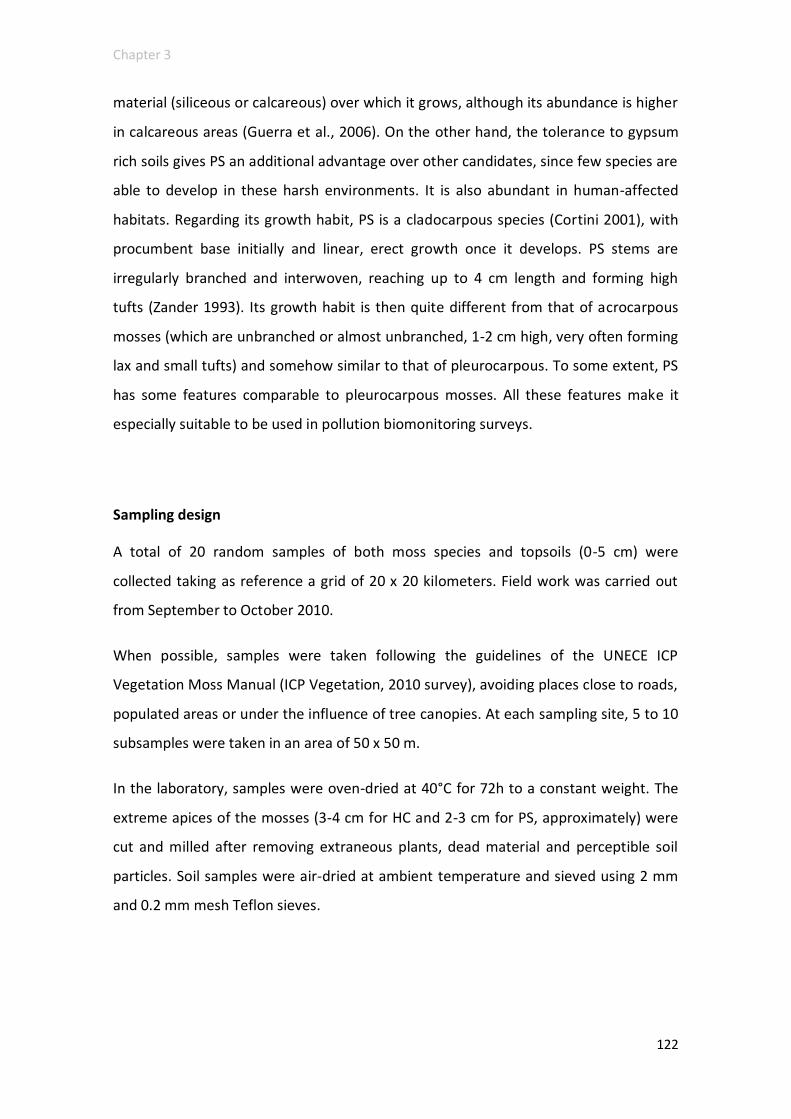
Chapter 3
122
material (siliceous or calcareous) over which it grows, although its abundance is higher
in calcareous areas (Guerra et al., 2006). On the other hand, the tolerance to gypsum
rich soils gives PS an additional advantage over other candidates, since few species are
able to develop in these harsh environments. It is also abundant in human-affected
habitats. Regarding its growth habit, PS is a cladocarpous species (Cortini 2001), with
procumbent base initially and linear, erect growth once it develops. PS stems are
irregularly branched and interwoven, reaching up to 4 cm length and forming high
tufts (Zander 1993). Its growth habit is then quite different from that of acrocarpous
mosses (which are unbranched or almost unbranched, 1-2 cm high, very often forming
lax and small tufts) and somehow similar to that of pleurocarpous. To some extent, PS
has some features comparable to pleurocarpous mosses. All these features make it
especially suitable to be used in pollution biomonitoring surveys.
Sampling design
A total of 20 random samples of both moss species and topsoils (0-5 cm) were
collected taking as reference a grid of 20 x 20 kilometers. Field work was carried out
from September to October 2010.
When possible, samples were taken following the guidelines of the UNECE ICP
Vegetation Moss Manual (ICP Vegetation, 2010 survey), avoiding places close to roads,
populated areas or under the influence of tree canopies. At each sampling site, 5 to 10
subsamples were taken in an area of 50 x 50 m.
In the laboratory, samples were oven-dried at 40°C for 72h to a constant weight. The
extreme apices of the mosses (3-4 cm for HC and 2-3 cm for PS, approximately) were
cut and milled after removing extraneous plants, dead material and perceptible soil
particles. Soil samples were air-dried at ambient temperature and sieved using 2 mm
and 0.2 mm mesh Teflon sieves.

Pleurochaete squarrosa as an alternative species for biomonitoring surveys
123
Sample Analysis
The concentrations of Al, As, Cd, Cr, Cu, Fe, Hg, Mn, Ni, Pb, Sb, Ti and Zn in mosses and
soils were determined by means of inductively coupled plasma-mass spectrometry
(ICP-MS; Agilent 7500a) after digestion in a microwave oven according to González-
Miqueo et al (2010). The quality control of the analytical procedure was carried out by
comparison with the interlaboratory reference material M2 and M3 (Steinnes et al.
1997) and the 0217-CM-7003 (silty clay loam soil) for moss and soil samples,
respectively. The recovery from reference material was generally within the range 88-
107% for mosses and 75-114% for soils. Duplicated samples were determined every
ten samples in order to assess the precision of the procedure. A relative standard
deviation (RSD) below 15% was found for all the elements analyzed. Blank samples
were also analyzed to ensure that there was no contamination.
N content and isotopic signatures (15N) were determined following the methodology
developed by Bermejo-Orduna et al (2014). Both accuracy and precision was found to
be within 2% for total concentration and isotopic signatures. Isotope data are given as
15N values, which represent the relative difference expressed per mil (‰) between
the isotopic composition of the sample and that of a standard (atmospheric N2 for
nitrogen):
15N (‰ vs. at-air) = [(Rsample/Rstandard) – 1] x 1000
where Rsample is the isotope ratio (15N/14N) and Rstandard is the isotope ratio for the
standard.
Enrichment Factors (EF)
The normalization of trace elements to the soil composition by calculating the EF is
very useful for providing clues to the origin of the metals found in mosses, and for
detecting the long-range transport of anthropogenic elements (Bargagli et al. 1995).
The EF for each heavy metal in the moss tissues was calculated using the following
expression:

Chapter 3
124
EF = (Xmoss / Timoss) / (Xsoil / Tisoil)
where X is the concentration of a given metal and titanium is the concentration of the
reference element in this study.
Reimann and de Caritat (2005) outlined several inherent limitations to using the EF to
discern between different pollution sources. They emphasized the impact of superficial
biogeochemical processes in the heavy metal bioavailability in a particular area and the
importance of working with data that represent the local background values. To that
end, superficial soil samples were taken at each sampling site as described before.
Statistical analysis
Statistical analyses were performed employing the SPSS v. 15.0 (SPSS Inc., Chicago,
Illinois, USA) software package. The studied variables (see table 1) were log
transformed to assure the normality of the distribution. t-Student test was used to
identify the significance between both species for the investigated variables and
Pearson’s correlation analysis was performed in order to evaluate the relationships
among the studied variables in PS and HC. Statistically significant differences were set
at p <0.05 unless otherwise stated.
On the other hand, geostatistical analysis to identify spatial patterns of N content and
15N signatures was performed by ‘kriging’, which is a geostatistical interpolation
technique that uses a linear combination of surrounding sampled values to generate
predicted values for unmeasured locations (Zechmeister et al., 2008). The model
applied here is simple kriging.

Pleurochaete squarrosa as an alternative species for biomonitoring surveys
125
Results and discussion
Nitrogen and 15N natural abundance
Total N content and 15N signatures for each species are summarized in Table 1. A
slight relationship was found for N content in both species (r=0.517, p<0.05), whereas
no interspecific differences in mean concentrations were observed and the average
ratio of their concentrations was virtually 1. Spatial distribution maps of N content
(Figure 2) highlighted a hot spot in the southwestern area. The results of nitrogen
percentage are in range with those presented by Delgado et al. (2013), who studied
herbarium material (1982) and native samples (2010) from different beech forests in
Navarra. Spatial patterns agreed with the NO2 distribution presented by Parra et al.
(2006), and are related to the presence of a heavily-trafficked motorway and a group
of big emitters of N, whose emissions, in the form of NOx or NH3, are registered in the
European Pollutants Release and Transfer Register (E-PRTR). The good correspondence
between the emission sources and the %N in mosses support the idea that both HC
and PS can be used to identify areas at risk from nitrogen pollution. Previous studies
have already shown the existence of a good correlation between the atmospheric N
deposition and the N concentrations in mosses (Pitcairn et al. 2006; Schroeder et al.
2014), including Hypnum cupressiforme. On the other hand, Ochoa-Hueso and
Manrique (2013) performed a fertilization study in semiarid Mediterranean
ecosystems which showed the ability of Pleurochaete squarrosa to accumulate N from
atmospheric deposition.
In the present study all the samples showed depletion of 15N. Average 15N was
significantly lower in PS than in HC, and no significant correlation was found between
both species. The results obtained for nitrogen signatures were in line with those
obtained by other authors (Liu et al. 2008; Varela et al. 2013). Several authors have
shown that the 15N signatures are good indicators of N sources in the environment
(Skinner et al. 2006; Zechmeister et al. 2008). However, according to the spatial
distribution of 15N showed in Figure 3, there was a discrepancy in the results obtained
depending on the species used. PS was more congruent with the expected, as it was
possible to distinguish between areas affected by oxidized or reduced nitrogen forms.

Chapter 3
126
Table 1. Summary statistics of heavy metal elemental concentrations (g g-1 dry wt.), nitrogen content (% dry weight) and 15N signatures (‰)
in Hypnum cupressiforme (Hedw.) and Pleurochaete squarrosa (Brid.) Lindb.
Hypnum cupressiforme Pleurochaete squarrosa
Element n Mean S.D. Range Mean S.D. Range t-Test Pearson's
correlations
Al 20 573 240 273-1116
1310 894 562-2186
-4.602** -0.173ns
As 20 0.22 0.18 0.09-0.85
0.36 0.24 0.14-1.17
-4.169** 0.530*
Cd 20 0.12 0.05 0.09-0.29
0.08 0.02 0.05-0.14
11.206** 0.826**
Cr 20 1.69 0.93 0.59-4.08
2.27 1.38 0.88-6.15
-1.659ns 0.024ns
Cu 20 4.48 1.68 2.80-9.81
6.46 1.60 4.96-12.07
-7.816** 0.693**
Fe 20 610 326 236-1449
1180 624 580-3153
-4.387** 0.011ns
Hg 20 0.03 0.01 0.02-0.04
0.03 0.01 0.02-0.08
1.148ns 0.189ns
Mn 20 32.33 13.36 17.29-75.99
48.37 24.79 20.83-116.88
-4.275** 0.634**
Ni 20 1.26 0.55 0.58-2.49
1.64 0.79 0.83-3.44
-2.145* 0.228ns
Pb 20 1.57 0.69 0.95-3.78
1.98 0.64 1.19-3.11
-3.012** 0.357ns
Sb 20 0.08 0.03 0.04-0.15
0.08 0.03 0.04-0.15
-1.398ns 0.886**
Ti 20 5.25 1.87 2.80-9.29
8.09 3.42 4.95-11.11
-3.533** -0.100ns
Zn 20 18.13 3.59 12.94-26.28 20.53 3.13 15.66-26.60 -2.633* 0.287ns
N 20 1.15 0.21 0.94-1.65 1.15 0.12 0.90-1.52
-0.416ns
0.517*
15N 20 -6.24 0.94 -8.91--4.53 -7.27 1.05 -9.27--5.22 4.298** 0.426ns
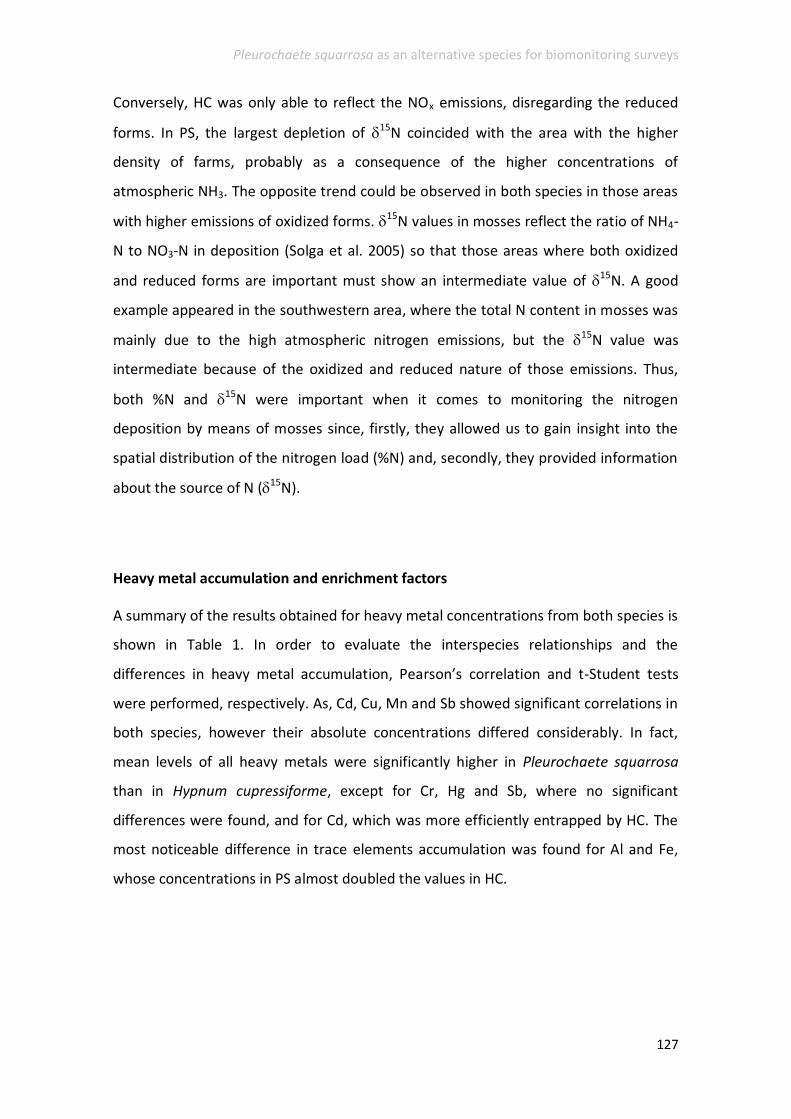
Pleurochaete squarrosa as an alternative species for biomonitoring surveys
127
Conversely, HC was only able to reflect the NOx emissions, disregarding the reduced
forms. In PS, the largest depletion of 15N coincided with the area with the higher
density of farms, probably as a consequence of the higher concentrations of
atmospheric NH3. The opposite trend could be observed in both species in those areas
with higher emissions of oxidized forms. 15N values in mosses reflect the ratio of NH4-
N to NO3-N in deposition (Solga et al. 2005) so that those areas where both oxidized
and reduced forms are important must show an intermediate value of 15N. A good
example appeared in the southwestern area, where the total N content in mosses was
mainly due to the high atmospheric nitrogen emissions, but the 15N value was
intermediate because of the oxidized and reduced nature of those emissions. Thus,
both %N and 15N were important when it comes to monitoring the nitrogen
deposition by means of mosses since, firstly, they allowed us to gain insight into the
spatial distribution of the nitrogen load (%N) and, secondly, they provided information
about the source of N (15N).
Heavy metal accumulation and enrichment factors
A summary of the results obtained for heavy metal concentrations from both species is
shown in Table 1. In order to evaluate the interspecies relationships and the
differences in heavy metal accumulation, Pearson’s correlation and t-Student tests
were performed, respectively. As, Cd, Cu, Mn and Sb showed significant correlations in
both species, however their absolute concentrations differed considerably. In fact,
mean levels of all heavy metals were significantly higher in Pleurochaete squarrosa
than in Hypnum cupressiforme, except for Cr, Hg and Sb, where no significant
differences were found, and for Cd, which was more efficiently entrapped by HC. The
most noticeable difference in trace elements accumulation was found for Al and Fe,
whose concentrations in PS almost doubled the values in HC.
Chapter 3
128
Figure 2. Spatial distribution of N contents (%) in the study area for Hypnum cupressiforme Hedw. and Pleurochaete squarrosa (Brid.) Lindb.,
and location of the main N sources registered in the European Pollutants Release and Transfer Register (E-PRTR) in 2009 and 2010.
Pleurochaete squarrosa as an alternative species for biomonitoring surveys
129
Figure 3. Spatial distribution of 15N signatures of Hypnum cupressiforme Hedw. and Pleurochaete squarrosa (Brid.) Lindb., and location of the
industrial and farming facilities registered in the E-PRTR because of their nitrogen emissions in 2009 and 2010 in the study area.
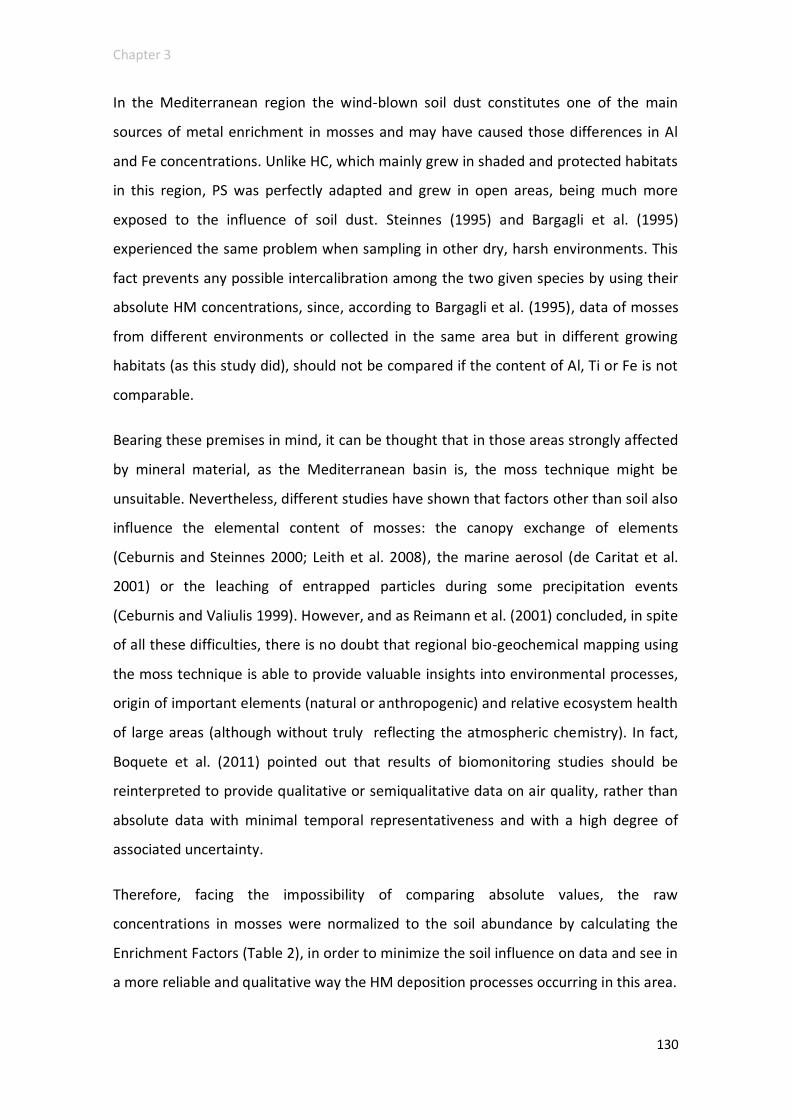
Chapter 3
130
In the Mediterranean region the wind-blown soil dust constitutes one of the main
sources of metal enrichment in mosses and may have caused those differences in Al
and Fe concentrations. Unlike HC, which mainly grew in shaded and protected habitats
in this region, PS was perfectly adapted and grew in open areas, being much more
exposed to the influence of soil dust. Steinnes (1995) and Bargagli et al. (1995)
experienced the same problem when sampling in other dry, harsh environments. This
fact prevents any possible intercalibration among the two given species by using their
absolute HM concentrations, since, according to Bargagli et al. (1995), data of mosses
from different environments or collected in the same area but in different growing
habitats (as this study did), should not be compared if the content of Al, Ti or Fe is not
comparable.
Bearing these premises in mind, it can be thought that in those areas strongly affected
by mineral material, as the Mediterranean basin is, the moss technique might be
unsuitable. Nevertheless, different studies have shown that factors other than soil also
influence the elemental content of mosses: the canopy exchange of elements
(Ceburnis and Steinnes 2000; Leith et al. 2008), the marine aerosol (de Caritat et al.
2001) or the leaching of entrapped particles during some precipitation events
(Ceburnis and Valiulis 1999). However, and as Reimann et al. (2001) concluded, in spite
of all these difficulties, there is no doubt that regional bio-geochemical mapping using
the moss technique is able to provide valuable insights into environmental processes,
origin of important elements (natural or anthropogenic) and relative ecosystem health
of large areas (although without truly reflecting the atmospheric chemistry). In fact,
Boquete et al. (2011) pointed out that results of biomonitoring studies should be
reinterpreted to provide qualitative or semiqualitative data on air quality, rather than
absolute data with minimal temporal representativeness and with a high degree of
associated uncertainty.
Therefore, facing the impossibility of comparing absolute values, the raw
concentrations in mosses were normalized to the soil abundance by calculating the
Enrichment Factors (Table 2), in order to minimize the soil influence on data and see in
a more reliable and qualitative way the HM deposition processes occurring in this area.
Pleurochaete squarrosa as an alternative species for biomonitoring surveys
131
Table 2. Enrichment Factors (EF) referring to Titanium, calculated for the mean concentration of heavy metals accumulated in both HC and PS.
Hypnum cupressiforme
Pleurochaete squarrosa
Element n Mean S.D. Range Mean S.D. Range t-Test Pearson's
correlations
Al 20 1.33 0.33 0.72-1.78 1.83 0.45 1.18-2.94 -5.832** 0.495*
As 20 1.68 1.10 0.83-5.53
1.70 0.65 1.02-3.40
-1.704ns
0.921**
Cd 20 44.70 25.72 17.39-132.32
18.30 6.35 8.06-32.16
6.816** 0.213
Cr 20 3.82 1.39 1.75-5.29
3.29 1.17 1.58-6.51
1.648ns
0.463*
Cu 20 50.04 41.29 10.78-194.19
45.31 27.92 14.09-122.87
0.248ns 0.806**
Fe 20 2.37 0.75 1.18-4.17
2.98 0.75 1.80-4.46 -4.485** 0.668**
Hg 20 119.55 91.10 16.32-345.41
71.30 67.91 22.31-302.93
3.989** 0.725**
Mn 20 8.08 3.70 4.32-16.00
7.14 1.70 4.45-10.80
0.959ns 0.736**
Ni 20 6.38 2.44 3.28-11.50
5.30 1.56 3.18-9.76
2.667* 0.638**
Pb 20 7.23 5.28 2.39-23.77
5.62 2.76 2.82-15.49
2.432* 0.867**
Sb 20 9.41 8.29 1.75-36.53
5.71 3.59 2.09-17.76
2.960** 0.703**
Zn 20 44.75 26.15 17.52-128.85 33.20 16.59 11.36-71.22 3.227** 0.687*
Chapter 3
132
According to the results, both PS and HC showed similar enrichment patterns in all the
elements. Low EF were found for Al, As, Cr and Fe; intermediate EF values were shown
for Mn, Ni, Pb and Sb, and the highest EF were reached by Cd, Cu, Hg and Zn.
Significant correlations were found between both sets of data for all the elements
except for Cd. Moreover, those elements with no significant correlation in raw data
(Al, Cr, Fe, Hg, Ni, Pb and Zn) showed a high correlation when the EF were contrasted.
It is assumed that elements with a crustal origin must have an enrichment factor close
to 1, but interpretation of EF data when they diverge “from few to many times” from
unity is not as clear as desirable. However, recent works have shown that elements
with values above 10 are commonly accepted as anthropogenic (Dragovic and
Mihailovic 2009; Klos et al. 2011; Coskun et al. 2011). In accordance with these
premises, it can be undoubtedly affirmed that Al, As, Cr and Fe have a lithogenic origin
in the studied area. Aluminium and iron were significantly more enriched in PS than in
HC, indicating a bigger influence of soil particles over the former moss, as it was
expected. On the other hand, the high EF value (> 10) associated to Cd, Cu, Hg and Zn
indicated an anthropogenic origin of these elements. Cd, Hg and Zn were significantly
more enriched in HC than in PS (p < 0.05). This difference might be related to tree
crown interferences over HC, since it sometimes grows under the protection of higher
plants at the sites located further south.
These results showed that Pleurochaete squarrosa was able to identify similar
deposition patterns which were highlighted by Hypnum cupressiforme, confirming that
this moss species may be a comparable biomonitor in the study area.
Pleurochaete squarrosa as an alternative species for biomonitoring surveys
133
Conclusions
The main conclusions of the interspecies comparison of Pleurochaete squarrosa and
Hypnum cupressiforme were:
Both species showed a similar geographical pattern of nitrogen deposition. For
this reason, their simultaneous use in extensive N monitoring surveys is
feasible.
15N signatures in PS proved to be a valuable tool to identify both oxidized and
reduced N pollution sources, whereas HC only seemed to highlight areas
affected by NOx emissions.
Absolute concentrations of HM showed a higher accumulation potential for PS
than for HC, but raw data are not recommended for comparison because of the
soil influence in their metallic content.
The two bryophytes showed similar enrichment patterns for all the elements
and showed an overall accordance in discriminating sites both highly and
scarcely affected by trace element deposition.
In light of the findings of the present work, we concluded that Pleurochaete squarrosa
is not only a feasible biomonitor for Southern Europe and other Mediterranean
regions, but it is even more advisable than any other pleurocarpous moss currently
used. This bryophyte might play an important role in the progress of biomonitoring
surveys in these regions, making up for the clear data deficiencies in this area.
However, further research is needed to confirm this statement.
Acknowledgments
The authors express their gratitude to the analytical staff of the Department of
Chemistry and Soil Science of the University of Navarra for its assistance. During this
study S. Izquieta-Rojano was recipient of a research grant from the ‘Asociación de
Amigos de la Universidad de Navarra’ which are kindly acknowledged.
Chapter 3
134
References
Bargagli, R., Brown, D.H., Nelli, L., 1995. Metal biomonitoring with mosses - procedures for correcting
for soil contamination. Environmental Pollution 89, 169-175.
Bermejo-Orduna, R., McBride, J.R., Shiraishi, K., Elustondo, D., Lasheras, E., Santamaría, J.M., 2014.
Biomonitoring of traffic-related nitrogen pollution using Letharia vulpina (L.) Hue in Sierra Nevada,
California. Science of the Total Environment 490, 205-212
Boquete, M.T., Fernández, J.A., Aboal, J.R., Carballeira, A., 2011. Analysis of temporal variability in the
concentrations of some elements in the terrestrial moss Pseudoscleropodium purum. Environmental and
Experimental Botany 72, 210-216.
Carballeira, C.B., Aboal, J.R., Fernández, J.A., Carballeira, A., 2008. Comparison of the accumulation of
elements in two terrestrial moss species. Atmospheric Environment 42, 4904-4917.
Castello, M., 2007. A comparison between two moss species used as transplants for airborne trace
element biomonitoring in NE Italy. Environmental Monitoring and Assessment 133, 267-276.
Ceburnis, D. and Steinnes, E., 2000. Conifer needles as biomonitors of atmospheric heavy metal
deposition: Comparison with mosses and precipitation, role of the canopy. Atmospheric Environment
34, 4265-4271.
Ceburnis, D. and Valiulis, D., 1999. Investigation of absolute metal uptake efficiency from precipitation in
moss. Science of the Total Environment 226, 247-253.
Cortini Pedrotti C. 2001. Flora dei muschi d’Italia. Sphagnopsida, Andreaeopsida, Bryopsida (I Parte).
ISBN 88-7287-250-2.
Coskun, M., Cayir, A., Coskun, M., Kilic, O., 2011. Heavy metal deposition in moss samples from east and
south Marmara region, Turkey. Environmental Monitoring and Assessment 174, 219-227.
Coskun, M., Steinnes, E., Coskun, M., Cayir, A., 2009. Comparison of epigeic moss (Hypnum
cupressiforme) and lichen (Cladonia rangiformis) as biomonitor species of atmospheric metal deposition.
Bulletin of Environmental Contamination and Toxicology 82, 1-5.
de Caritat, P., Reimann, C., Bogatyrev, I., Chekushin, V., Finne, T.E., Halleraker, J.H., Kashulina, G.,
Niskavaara, H., Pavlov, V., Ayras, M., 2001. Regional distribution of al, B, Ba, Ca, K, La, Mg, Mn, Na, P, Rb,
Si, Sr, Th, U and Y in terrestrial moss within a 188,000 km2 area of the central Barents region: Influence
of geology, seaspray and human activity. Applied Geochemistry 16, 137-159.
Delgado, V., Ederra, A., Santamaría, J.M., 2013. Nitrogen and carbon contents and 15
N and 13
C
signatures in six bryophyte species: Assessment of long-term deposition changes (1980-2010) in Spanish
beech forests. Global Change Biology 19, 2221-2228.
Dmuchowski, W., Gozdowski, D., Baczewska, A.H., 2011. Comparison of four bioindication methods for
assessing the degree of environmental lead and cadmium pollution. Journal of Hazardous Materials 197,
109-118.
Dragovic, S. and Mihailovic, N., 2009. Analysis of mosses and topsoils for detecting sources of heavy
metal pollution: Multivariate and enrichment factor analysis. Environmental Monitoring and Assessment
157, 383-390.

Pleurochaete squarrosa as an alternative species for biomonitoring surveys
135
Fabure, J., Meyer, C., Denayer, F., Gaudry, A., Gilbert, D., Bernard, N., 2010. Accumulation capacities of
particulate matter in an acrocarpous and a pleurocarpous moss exposed at three differently polluted
sites (industrial, urban and rural). Water Air and Soil Pollution 212, 205-217.
Fernández, J.A., Ederra, A., Nunez, E., Martínez-Abaigar, J., Infante, M., Heras, R., Elías, M.J., Mazimpaka,
V., Carballeira, A., 2002. Biomonitoring of metal deposition in northern Spain by moss analysis. Science
of the Total Environment 300, 115-127.
Galsomies, L., Ayrault, S., Carrot, F., Deschamps, C., Letrouit-Galinou, M.A., 2003. Interspecies
calibration in mosses at regional scale - heavy metal and trace elements results from Ile-de-France.
Atmospheric Environment 37, 241-251.
Gandois, L., Agnan, Y., Leblond, S., Sejalon-Delmas, N., Le Roux, G., Probst, A., 2014. Use of geochemical
signatures, including rare earth elements, in mosses and lichens to assess spatial integration and the
influence of forest environment. Atmospheric Environment 95, 96-104.
Gerdol, R., Marchesini, R., Iacumin, P., Brancaleoni, L., 2014. Monitoring temporal trends of air pollution
in an urban area using mosses and lichens as biomonitors. Chemosphere 108, 388-395.
Gerdol, R., Bragazza, L., Marchesini, R., 2002. Element concentrations in the forest moss Hylocomium
splendens: Variation associated with altitude, net primary production and soil chemistry. Environmental
Pollution 116, 129-135.
Gerdol, R., Bragazza, L., Marchesini, R., Alber, R., Bonetti, L., Lorenzoni, G., Achilli, M., Buffoni, A., De
Marco, N., Franchi, M., Pison, S., Giaquinta, S., Palmieri, F., Spezzano, P., 2000. Monitoring of heavy
metal deposition in northern Italy by moss analysis. Environmental Pollution 108, 201-208.
Glime, Janice M. 2007 Bryophyte Ecology. Volume 1. Physiological Ecology. Ebook sponsored by
Michigan Technological University and the International Association of Bryologists. Accessed on July
2012 at http://www.bryoecol.mtu.edu/
González-Miqueo, L., Elustondo, D., Lasheras, E., Bermejo, R., Santamaría, J.M., 2010. Heavy metal and
nitrogen monitoring using moss and topsoil samples in a Pyrenean forest catchment. Water Air and Soil
Pollution 210, 335-346.
González-Miqueo, L., Elustondo, D., Lasheras, E., Bermejo, R., Santamaría, J.M., 2009. Spatial trends in
heavy metals and nitrogen deposition in Navarra (northern Spain) based on moss analysis. Journal of
Atmospheric Chemistry 62, 59-72.
Grundmann, M., Ansell, S.W., Russell, S.J., Koch, M.A., Vogel, J.C., 2008. Hotspots of diversity in a clonal
world - the Mediterranean moss Pleurochaete squarrosa in Central Europe. Molecular Ecology 17, 825-
838.
Grundmann, M., Ansell, S.W., Russell, S.J., Koch, M.A., Vogel, J.C., 2007. Genetic structure of the
widespread and common Mediterranean bryophyte Pleurochaete squarrosa (Brid.) Lindb. (Pottiaceae) -
evidence from nuclear and plastidic DNA sequence variation and allozymes. Molecular Ecology 16, 709-
722.
Guerra, J., Cano, M.J., Ros, R.M. (Eds.), 2006. Flora briofítica Ibérica. Volumen III. Pottiales: Pottiaceae.
Encalyptales: Encalyptaceae. Universidad de Murcia. Sociedad española de briología. ISBN 84-609-9097-
4 (III).

Chapter 3
136
Halleraker, J.H., Reimann, C., de Caritat, P., Finne, T.E., Kashulina, G., Niskaavaara, H., Bogatyrev, I.,
1998. Reliability of moss (Hylocomium splendens and Pleurozium schreberi) as a bioindicator of
atmospheric chemistry in the Barents region: Interspecies and field duplicate variability. Science of the
Total Environment 218, 123-139.
Harmens, H., Schnyder, E., Thöni, L., Cooper, D.M., Mills, G., Leblond, S., Mohr, K., Poikolainen, J.,
Santamaría, J., Skudnik, M., Zechmeister, H.G., Lindroos, A., Hanus-Illnar, A., 2014. Relationship between
site-specific nitrogen concentrations in mosses and measured wet bulk atmospheric nitrogen deposition
across Europe. Environmental Pollution 194, 50-9.
Harmens, H., Foan, L., Simon, V., Mills, J., 2013. Terrestrial mosses as biomonitors of atmospheric POPs
pollution: A review. Environmental Pollution 173, 245-254.
Harmens, H., Norris, D.A., Steinnes, E., Kubin, E., Piispanen, J., Alber, R., Aleksiayenak, Y., Blum, O.,
Coskun, M., Dam, M., De Temmerman, L., Fernández, J.A., Frolova, M., Frontasyeva, M., González-
Miqueo, L., Grodzinska, K., Jeran, Z., Korzekwa, S., Krmar, M., Kvietkusr, K., Leblond, S., Liiv, S.,
Magnusson, S.H., Mankovska, B., Pesch, R., Ruehling, A., Santamaría, J.M., Schröder, W., Spiric, Z.,
Suchara, I., Thöni, L., Urumov, V., Yurukova, L., Zechmeister, H.G., 2010. Mosses as biomonitors of
atmospheric heavy metal deposition: Spatial patterns and temporal trends in Europe. Environmental
Pollution 158, 3144-3156.
International Cooperative Programme on Effects of Air Pollution on Natural Vegetation and Crops
operating under the UNECE Convention on Long-range Transboundary Air Pollution.
http://icpvegetation.ceh.ac.uk/manuals/moss_survey.html
Klos, A., Rajfur, M., Sramek, I., Waclawek, M., 2011. Use of lichen and moss in assessment of forest
contamination with heavy metals in praded and glacensis euroregions (Poland and Czech Republic).
Water Air and Soil Pollution 222, 367-376.
Leith, I.D., Mitchell, R.J., Truscott, A., Cape, J.N., van Dijk, N., Smith, R.I., Fowler, D., Sutton, M.A., 2008.
The influence of nitrogen in stemflow and precipitation on epiphytic bryophytes, Isothecium
myosuroides Brid., Dicranum scoparium Hewd. and Thuidium tamariscinum (Hewd.) Schimp of Atlantic
oakwoods. Environmental Pollution 155, 237-246.
Liu, X., Xiao, H., Liu, C., Li, Y., Xiao, H., 2008. Stable carbon and nitrogen isotopes of the moss
Haplocladium microphyllum in an urban and a background area (SW China): The role of environmental
conditions and atmospheric nitrogen deposition. Atmospheric Environment 42, 5413-5423.
Moreno, J.M., Pineda, F.D., Rivas-Martínez, S., 1990. Climate and vegetation at the Eurosiberian-
Mediterranean boundary in the Iberian Peninsula. Journal of Vegetation Science 1, 233-244.
Newton, A.E. and Tangney R.S. 2007. Pleurocarpous mosses: systematics and evolution. CRC Press. ISBN
9780849338564 – CAT#3856.
Ochoa-Hueso, R. and Manrique, E., 2013. Effects of nitrogen deposition on growth and physiology of
Pleurochaete squarrosa (Brid.) Lindb., a terricolous moss from Mediterranean ecosystems. Water Air
and Soil Pollution 224, 1-14.
Parra, M.A., González, L., Elustondo, D., Garrigo, J., Bermejo, R., Santamaría, J.M., 2006. Spatial and
temporal trends of volatile organic compounds (VOC) in a rural area of northern Spain. Science of the
Total Environment 370, 157-167.

Pleurochaete squarrosa as an alternative species for biomonitoring surveys
137
Pitcairn, C., Fowler, D., Leith, I., Sheppard, L., Tang, S., Sutton, M., Famulari, D., 2006. Diagnostic
indicators of elevated nitrogen deposition. Environmental Pollution 144, 941-950.
Poikolainen, J., Kubin, E., Piispanen, J., Karhu, J., 2004. Atmospheric heavy metal deposition in Finland
during 1985-2000 using mosses as bioindicators. The Science of the Total Environment 318, 171-185.
Reimann, C. and de Caritat, P., 2005. Distinguishing between natural and anthropogenic sources for
elements in the environment: Regional geochemical surveys versus enrichment factors. Science of the
Total Environment 337, 91-107.
Reimann, C., Niskavaara, H., Kashulina, G., Filzmoser, P., Boyd, R., Volden, T., Tomilina, O., Bogatyrev, I.,
2001. Critical remarks on the use of terrestrial moss (Hylocomium splendens and Pleurozium schreberi)
for monitoring of airborne pollution. Environmental Pollution 113, 41-57.
Rivas-Martínez, S., 2004. Worlwide bioclimatic classification system (Clasificación bioclimática de la
Tierra). Phytosociological Research Center. www.globalbioclimatics.org
Samecka-Cymerman, A., Kolon, K., Kempers, A.J., 2010. Influence of Quercus robur throughfall on
elemental composition of Pleurozium schreberi (Brid.) Mitt. and Hypnum cupressiforme Hedw. Polish
Journal of Environmental Studies 19, 763-769.
Schroeder, W., Pesch, R., Schoenrock, S., Harmens, H., Mills, G., Fagerli, H., 2014. Mapping correlations
between nitrogen concentrations in atmospheric deposition and mosses for natural landscapes in
Europe. Ecological Indicators 36, 563-571.
Sert, E., Ugur, A., Ozden, B., Sac, M.M., Camgoz, B., 2011. Biomonitoring of 210Po and 210Pb using
lichens and mosses around coal-fired power plants in western Turkey. Journal of Environmental
Radioactivity 102, 535-542.
Skinner, R.A., Ineson, P., Jones, H., Sleep, D., Leith, I.D., Sheppard, L.J., 2006. Heathland vegetation as a
bio-monitor for nitrogen deposition and source attribution using 15N values. Atmospheric Environment
40, 498-507.
Solga, A., Burkhardt, J., Zechmeister, H.G., Frahm, J.P., 2005. Nitrogen content, 15N natural abundance
and biomass of two pleurocarpous mosses Pleurozium schreberi (Brid.) Mitt. and Scleropodium purum
(Hedw.) Limpr. in relation to atmospheric nitrogen deposition. Environmental Pollution 134, 465-473.
Spiric, Z., Frontasyeva, M., Steinnes, E., Stafilov, T., 2012. Multi-element atmospheric deposition study in
Croatia. International Journal of Environmental Analytical Chemistry 92, 1200-1214.
Steinnes, E., Ruhling, A., Lippo, H., Makinen, A., 1997. Reference materials for large-scale metal
deposition surveys. Accreditation and Quality Assurance 2, 243-249.
Steinnes, E., 1995. A critical-evaluation of the use of naturally growing moss to monitor the deposition
of atmospheric metals. Science of the Total Environment 160-61, 243-249.
Szczepaniak, K. and Biziuk, M., 2003. Aspects of the biomonitoring studies using mosses and lichens as
indicators of metal pollution. Environmental Research 93, 221-230.
Thöni, L., Schnyder, N., Krieg, F., 1996. Comparison of metal concentrations in three species of mosses
and metal freights in bulk precipitations. Fresenius Journal of Analytical Chemistry 354, 703-708.
Chapter 3
138
Tretiach, M., Adamo, P., Bargagli, R., Baruffo, L., Carletti, L., Crisafulli, P., Giordano, S., Modenesi, P.,
Orlando, S., Pittao, E., 2007. Lichen and moss bags as monitoring devices in urban areas. Part I: Influence
of exposure on sample vitality. Environmental Pollution 146, 380-391.
Varela, Z., Carballeira, A., Fernández, J.A., Aboal, J.R., 2013. On the use of epigaeic mosses to biomonitor
atmospheric deposition of nitrogen. Archives of Environmental Contamination and Toxicology 64, 562-
572.
Wilson, D., Stock, W.D., Hedderson, T., 2009. Historical nitrogen content of bryophyte tissue as an
indicator of increased nitrogen deposition in the Cape Metropolitan Area, South Africa. Environmental
Pollution 157, 938-945.
Wolterbeek, H., Kuik, P., Verburg, T., Herpin, U., Markert, B., Thöni, L., 1995. Moss interspecies
comparisons in trace-element concentrations. Environmental Monitoring and Assessment 35, 263-286.
Zander, R.H. 1993. Genera of the pottiaceae: mosses of harsh environments. Bulletin of the Buffalo
Society of Natural Sciences. Volume 32. ISBN 0-944032-51-6.
Zechmeister, H.G., Richter, A., Midt, S., Hohenwallner, D., Roder, I., Maringer, S., Wanek, W., 2008. Total
Nitrogen Content and δ15N Signatures in Moss Tissue: Indicative Value for Nitrogen Deposition Patterns
and Source Allocation on a Nationwide Scale. Environmental Science and Technology 42, 8661-8667.
Zechmeister, H.G., 1998. Annual growth of four pleurocarpous moss species and their applicability for
biomonitoring heavy metals. Environmental Monitoring and Assessment 52, 441-451.

Chapter 4 Integrated eco-physiological response of the moss Hypnum cupressiforme Hedw. to increased atmospheric NH3 concentrations
This chapter reproduces the text of the following manuscript:
Izquieta-Rojano, S., López-Aizpún, M., Irigoyen, J.J., Lasheras, E., Santamaría, C., Santamaría, J.M.,
Ochoa-Hueso, R., Elustondo, D. Integrated eco-physiological response of the moss Hypnum
cupressiforme Hedw. to increased atmospheric ammonia concentrations. Submitted.
Abstract
Ammonia (NH3) emissions are linked to eutrophication, plant toxicity and
ecosystem shifts from N to P limitation. To understand the ecophysiological
consequences of increased NH3 in the moss Hypnum cupressiforme Hedw., and
assess the suitability of this species as bioindicator of NH3-related impacts, we
investigated moss samples from an oak woodland collected along a well-
defined NH3 concentration gradient.
This study has undertaken a comprehensive and temporal evaluation of tissue
chemistry (N, C, P, K, Ca, Mg), stoichiometry (C:N, N:P, N:K), metabolic enzymes
(phosphomonoesterase and nitrate reductase), antioxidant response
(superoxide dismutase, SOD), membrane damages, photosynthetic pigments,
soluble protein content and C and N isotopic fractionation (15N and 13C).
Except for P, K and Ca, all the studied parameters were susceptible to NH3
pollution, providing valuable information about the effects of enhanced NH3 on
moss physiology. The sampling season was determinant in the responsiveness
of certain physiological variables.
N accumulation and NH3-induced oxidative stress were the most important
drivers of the physiological functioning of Hypnum cupressiforme along the
gradient. SOD, tissue N and 13C showed the greatest potential for being used
as early warning indicators of NH3 toxicity and contribute to the identification
of NH3-related ecological end points.
Keywords: NH3 toxicity, bioindicators, enzyme activities, membrane damage, nitrogen
pollution, ecological stoichiometry, photosynthesis impairment, 15N/
13C stable
isotopes.

Integrated ecophysiological response of Hypnum cupressiforme to increasing NH3
141
Introduction
Bryophytes and lichens are among the most vulnerable organisms to nitrogen (N)
pollution (Cape et al., 2009; Bobbink et al., 2010). The absence of a well-developed
cuticle and the lack of a true root system to acquire N from substratum are the main
features which confers on them special sensitivity to atmospheric pollution and allow
its use as biomonitors of N deposition and indicators of direct effects of ammonia
(NH3) in the gas phase (Cape et al., 2009; Branquinho et al., 2010; Pinho et al., 2012). In
fact, The Critical Level (CLE) for NH3, which is described as ‘the concentration in the
atmosphere above which direct effects of this gas on receptors may occur according to
present knowledge’, has been established after experimental work carried out with
mosses and lichens (Cape et al., 2009; Pinho et al., 2012 and 2014). Although the N
deposition-induced effects on these communities are well-known (Pitcairn et al., 1998;
Sheppard et al., 2011; Verhoeven et al., 2011), the physiological responses linked to
those undesirable affections are still poorly understood. Several authors have tried to
throw light on this respect by associating the N-induced changes in species richness,
cover, growth or biomass production, with variations in the photosynthesis
performance, the appearance of nutritional constraints, shifts in the response of
metabolic enzymes or damages on the cell membrane (Pearce et al., 2003; Pitcairn et
al., 2003; Granath et al., 2009 and 2012; Du et al., 2014; Munzi et al., 2014; Paoli et al.,
2014; Wang et al., 2016). However, none of these studies provide a comprehensive
view of the mechanisms involved in the N response. An exception to this rule is the
work carried out by Arróniz-Crespo et al. (2008), who performed a broad analysis of
multiple physiological responses to N and P addition in two temperate bryophyte
species. Similarly, Ochoa-Hueso and Manrique (2013) and Ochoa-Hueso et al. (2014a)
developed comprehensive studies on the physiological consequences of N deposition
in two biocrust-forming species. On the other hand, and given the high sensitivity of
bryophytes to N pollution, the study of some physiological responses has also been
proposed as a potential tool for anticipating likely N-related impacts at ecosystem level
(Arróniz-Crespo et al., 2008). Contrary to higher plants, mosses would react quicker to
increased N loads, acting as an early warning indicator of risk. Equally, the use of very
Chapter 4
142
responsive physiological variables may be advisable to evaluate the ecosystems
recovery after N pollution declines (Arróniz-Crespo et al., 2008).
Currently, overall human perturbation of the nitrogen cycle in Europe is considered to
be primarily driven by agricultural activities (Jensen et al., 2011; Hertel et al. 2012). The
input of reactive N (Nr) for crop production is mainly supported by mineral fertilizer,
which is considered the most important source of the net increase of Nr in the
environment (about 65% worldwide). Surprisingly, only 20% of the Nr harvest in
European crops is used directly to feed people, whereas the remaining 80% provides
feeds to support livestock (Jensen et al., 2011). Therefore, it can be said that it is the
human use of livestock and the consequent need for large amount of animal feed the
dominant driver altering the nitrogen cycle in Europe. This massive dependence on
synthetic fertilizers to maintain our dietary patterns based on meat consumption,
added to the inefficiency in the food production process (Galloway et al. 2003; Jarvis et
al., 2011; Erisman et al. 2013 and references therein), have as a consequence
important Nr losses to the environment, being ammonia one of the emitted
compounds of major concern (Sutton et al. 2008; Van Damme et al. 2014). According
to the European Environment Agency (EEA), 4,324 Gg of NH3 were emitted in 2012 in
Europe (EEA-33 country group), of which 93.5% was released in agricultural activities
(EEA-European Environment Agency, 2015). Animal production and volatilization from
livestock excreta accounts for the major share, which was estimated for 2011 in three
quarters of agricultural NH3 emissions, whereas agricultural soils accounted for the
rest (Eurostat 2013). Inventories from China (Zhou et al., 2015) and North America
(Bittman and Mikkelsen, 2009) also found that livestock was the dominant contributing
source of NH3 emissions, showing this is a global-scale problem.
Once in the environment, unintended NH3 can potentially cause important damage,
including nutritional imbalances, ecosystem eutrophication and acidification, loss of
biodiversity, and/or toxic effects on vegetation and human health (Krupa et al. 2003;
Erisman et al. 2013; Bittsánszky et al. 2015; Shibata et al. 2015). To reduce these
negative consequences of atmospheric N pollution, many international treaties and
policies have been developed. The Gothenburg protocol and the National Emission
Ceilings Directive (2001/81/EC) are addressing NH3 emissions, setting upper limits for

Integrated ecophysiological response of Hypnum cupressiforme to increasing NH3
143
each Member State to be met by 2010, and by 2020 (more restrictive ceilings),
according to recent amendments. The main long-term objective is to avoid the
exceedance of critical levels and loads, and achieve an effective protection of people
against the recognized health risks from air pollution (NEC Directive 2001/81/EC).
Although on average a decrease of 30% in agricultural NH3 emissions across the EU-27
was found between 1990 and 2010, other countries like Spain have increased their
emissions for that period (Eurostat 2012; EEA 2014). Therefore, in spite of the efforts
of policy makers and the commitments made by different countries, nowadays
ammonia continues being a relevant atmospheric pollutant worldwide, whose impacts
are expected to persist and be magnified in response to the increasing Nr losses
projected for the next decades (Reis et al., 2009; van Vuuren et al., 2011; Fowler et al.,
2015).
The aim of the present study was to evaluate the physiological response of the
pleurocarpous moss Hypnum cupressiforme Hedw. (H. cupressiforme) to an NH3
concentration gradient from a multivariate and temporal perspective, to better
understand the mechanisms implied when bryophytes cope with this pollutant. The
parameters investigated were selected in order to gain information about: 1) the NH3-
induced alterations of the nutritional status and requirements of the moss; 2) the NH3
toxicity and anti-stress and detoxification strategies; 3) the impacts on the
photosynthetic machinery; 4) the possible deterioration of cell membranes. Joint
analysis of these data will provide insight into the effects of enhanced NH3 on moss
physiology, showing which variables are the most responsive, and therefore, which
ones are the most promising for the use of H. cupressiforme in ecosystem surveys as
early warning indicators of NH3 toxicity. Moreover, the temporal analysis will allow us
to establish if the answer of the studied variables is kept homogeneous along the year
or on the contrary it depends on the seasonality. These data are of primary importance
for developing sampling protocols and conducting biomonitoring surveys based on the
analysis of physiological parameters.
Chapter 4
144
The experiment was conducted in the vicinity of a swine farm which has been
operating for almost 50 years. Thus, the observed changes derived from this
continuous source of NH3 should reflect the integrated effect of this contaminant at
the ecosystem level (Pinho et al., 2012). Therefore, unlike N-addition and simulated
fertilization studies, which are not frequently performed with enough time and
reasonable N doses, the current study constitutes a more realistic approach for the
evaluation of the physiological response of H. cupressiforme to atmospheric NH3.
Additionally, to the author’s knowledge, so far no study has assessed the impacts of
gaseous NH3 on mosses from a multivariate, comprehensive and temporal perspective,
even though its effects are known to be significantly more deleterious than those
caused by wet-deposited N species (Leith et al., 2002; Sheppard et al., 2011).
Material and methods
Site description and field sampling
The study was carried out in Etxarren-Arakil (Navarra), a small village located in an area
of cattle tradition of northern Spain. This location is embedded in the transitional
region of the Mediterranean and the Oceanic climate, with a mean annual
precipitation and temperature of 1100 mm and 12.5ᵒC respectively (30 years historical
data series, Government of Navarra). A swine livestock, with a trajectory of 50 years
and more than 5500 heads, constituted the point source of NH3. Moss samples of the
species H. cupressiforme were collected in the surrounding forested area, an oakwood
dominated by Quercus robur L. This bryophyte is one of the four species recommended
by the International Cooperative Programme on Effects of Air Pollution on Natural
Vegetation and Crops (ICP Vegetation) for biomonitoring purposes. It has been widely
used in nitrogen monitoring surveys across Europe (Harmens et al., 2011; Schröder et
al., 2014) and it has been observed to be specially tolerant to high levels of
atmospheric pollution (González-Miqueo et al., 2010). Although it can be found on tree
trunks, soil, rocks and other surfaces, in our study site it only appeared on dead logs
and wood, which ensured that there was not any interference with soil particles.
Integrated ecophysiological response of Hypnum cupressiforme to increasing NH3
145
In total, 7 sites were surveyed along a decreasing NH3 concentration gradient from the
livestock building. The closest point was located at 30 m, whereas the farthest one was
placed at a distance of 1000 m from the farm (background point). At each sampling
site, composite samples (5 to 10 subsamples) of H. cupressiforme were collected at the
beginning of the following months: September 2013 (Summer), December 2013
(Autumn), March 2014 (Winter) and June 2014 (Spring).
Ammonia monitoring
Atmospheric NH3 was measured using high-sensitivity ALPHA passive samplers (Tang et
al., 2001) mounted on tree trunks at 1.5 m above the ground. At each sampling site
two replicates were displayed during 30 periods of two weeks, starting on July 2013.
The ALPHA samplers contained a cellulose filter impregnated with citric-acid as
adsorbent (13% w:v) and after being exposed in the field were extracted into deionized
water and analyzed for ammonium (N-NH4) by ion chromatography (Dionex 1100, with
column CS16). The reported atmospheric NH3 concentration values are the mean of
the 30 sampling periods, expressed in μg m−3 (Table 1). For temporal analyses and
correlation tests, the seasonal means were calculated.
Moss analyses
Once in the laboratory, the composite samples were divided into three replicates to
perform the analyses of interest. Only the apical green parts of the moss segments (3
cm approximately) were selected for measurements. When possible, all physiological
determinations were performed in 24 - 48h after moss collection, since some
examinations require to be developed with fresh material and prolonged periods could
significantly modify the sample (Turner et al., 2001). However, due to the big amount
of projected estimates, occasionally some tests needed to be postponed for the
coming days. In these cases, extractions of the vegetal tissue for pending
determinations were made on the optimum time and subsequently they were deep-
frozen (-80⁰C) stored till analysis. Reserved apices for tissue nutrient content and
Chapter 4
146
isotopic signatures determinations were air dried and then ball milled in the
laboratory. Powdered samples were kept until further analysis.
Moisture content of moss samples was estimated for each season at each sampling
site. Three replicates of 0.5 g of fresh material were oven dried at 105⁰C for 48h, what
allowed us to normalize data and report all physiological results referred to dry weight.
Shoot nutrient content and isotopic signatures
N and C content and isotopic signatures (13C and 15N) were determined following the
methodology developed by Delgado et al. (2013). Both accuracy and precision was
found to be within 2% for total concentration and isotopic signatures. Isotope data are
given as 13C and 15N values, which represent the relative difference expressed per
mil (‰) between the isotopic composition of the sample and that of a standard (Pee
Dee Belemnite (PDB) for carbon and atmospheric N2 for nitrogen):
13C (‰ vs. V-PDB) = [(Rsample/Rstandard) – 1] x 1000
15N (‰ vs. at-air) = [(Rsample/Rstandard) – 1] x 1000
where Rsample is the isotope ratio (13C/12C) or (15N/14N) and Rstandard is the isotope ratio
for the standard.
The concentrations of Na, K, Ca, Mg and P were determined by means of inductively
coupled plasma-mass spectrometry (ICP-MS; Agilent 7500a) after digestion in a
microwave according to González-Miqueo et al. (2010). The quality control of the
analytical procedure was carried out by comparison with the interlaboratory reference
material for mosses M2 and M3 (Steinnes et al. 1997). The recovery from reference
material was generally within the range 85-112%. Duplicated samples were
determined every ten samples in order to assess the precision of the procedure. A
relative standard deviation (RSD) below 10% was found for all the elements analyzed.
Blank samples were also analyzed to ensure that there was no contamination.
Integrated ecophysiological response of Hypnum cupressiforme to increasing NH3
147
Phosphomonoesterase (PME) and nitrate reductase (NR) enzyme activities
The PME activity was estimated on 15 mg of air dried moss material by
spectrophotometric determination (Shimadzu UVmini-1240) at 398 nm to measure the
release of p-nitrophenol (p-NP) from the phosphatase substrate p-nitrophenyl
phosphate disodium salt (p-NPP; Sigma-Aldrich, Química S.A.), as described by Phoenix
et al. (2004). The buffer was adjusted to pH 5, as this pH has been proven to be an
optimum for PME activity in a wide variety of bryophyte species (Turner et al., 2001;
Arróniz-Crespo et al., 2008). After some linearity tests, the reaction time was adjusted
to 90 minutes.
Due to analysis optimization problems, NR was only evaluated in June. Induced NR was
determined on 30 - 40 mg dry weight equivalent fresh apical samples. This material
was revitalized in a growth chamber for 24 h (10ᵒC, 12 h light / 12 h dark, 100 µmol m-2
s-1), where samples moisture was kept with distilled water. NR activity measurement
was performed in vivo following Pearce et al. (2003) and Arróniz-Crespo et al. (2008).
After 6 hours of induction process (dark storage in 5 ml 3mM KNO3), samples were
vacuum infiltrated with 5 ml buffer (50 mM KH2PO4, 100 mM KNO3, 100 mM
potassium acetate and 1.5% v:v propanol - 1- ol), and placed in a dark water bath at
26ᵒC for 1h. They were then removed and placed in a water bath at 80⁰C for 20 min.
After cooling, nitrite production was quantified by removing 1 ml solution and adding
this to 1 ml of 1% sulphanilic acid in 1.5 m HCl and 1 ml of 0.02% (w : v) n-(1-napthyl
ethylene diamine) and storing for 40 min in the dark before measurement of
absorbance at 540 nm (A540) in a spectrophotometer (Shimadzu UVmini-1240).
Superoxide dismutase (SOD) enzyme activity and lipid peroxidation
Fresh shoots, 40 - 50 mg dry weight equivalent, were ground in an ice-cold mortar
using 5 ml of 50 mM potassium phosphate buffer (pH 7.8; K2HPO4 + KH2PO4 + sodium
ethylene diamine tetra acetate (EDTA)). The homogenate was centrifuged at 18000 g
for 10 min at 4⁰C, and the supernatant was used as the crude extract for subsequent
assays of SOD activity and soluble protein content.
A volume of 0.4 ml of extract were removed and added to 4 ml of reactant, a mixture
composed of riboflavin, methionine and nitroblue tetrazolium (NBT), as described by
Chapter 4
148
Giannopolitis and Ries (1977). The glass test tubes were placed under a light source
(22-W circular fluorescent lamp) at 25⁰C. The reaction was initiated by turning the light
on and the reduction of NBT was followed by reading the A560 for 7 min; during this
period the reaction was linear. Two tubes without enzyme extract were taken as
control, developing maximal color. A non-irradiated complete reaction mixture which
did not develop color served as blank. One unit of SOD was defined as the amount of
plant extract which produced a 50% inhibition of NBT reduction under assay conditions
(NBT reduction per minute under assay conditions).
Membrane lipid peroxidation was determined by measuring the content of
malondialdehyde (MDA) (Heath and Packer 1968). 40 - 50 mg dry weight equivalent
fresh shoots were ground in a ball mill with 5 ml of trichlor-acetic acid 0.1% (w : v). The
homogenate was centrifuged at 18000 g for 10 min at 4⁰C, and the supernatant was
used as the crude extract for subsequent assays by the thiobarbituric acid reaction
(Heath and Packer 1968). 1 ml of homogenate was added to 1 ml of reactant (trichlor-
acetic acid 20% (w : v) and thiobarbituric acid 0.5% (w : v)). The mixture was heated at
95⁰C for 30 min. After cooling, the absorbance was read at 532 nm and corrected for
nonspecific absorption at 600 nm (Shimadzu UVmini-1240). The final data indicate the
amount of thiobarbituric acid-reacting substances per gram of tissue (TBARS, nmol g-1
DW).
Soluble protein content and pigment composition
The same extract obtained for SOD analysis was used to determine the soluble protein
content following the Coomassie blue dye-binding method (Bradford, 1976). The
content of soluble protein was estimated by mixing 0.1 ml of extract and 5 ml of
Coomassie blue reactant. After 10 min in dark conditions, absorbance was read at 630
nm (Shimadzu UVmini-1240). Bovine serum albumin was used for the calibration line.
Extraction of photosynthetic pigment from the moss samples (5 mg fresh weight) was
carried out in 5 ml of 95% ethanol in a ball mill. The homogenate was heated at 95⁰C
for 20 min. After cooling, absorbance values were read at 649 and 665 nm for
chlorophyll measurements, and at 470 nm for carotenoid estimates (Wintermans and
De Mots 1965).

Integrated ecophysiological response of Hypnum cupressiforme to increasing NH3
149
Moss data handling and statistical Analyses
Both seasonal and annual mean data were calculated for all the physiological variables
studied. Results were subjected to either correlation (Pearson’s correlation) or
regression analysis in regards to NH3 concentrations. Moreover, ANOVA analyses were
performed to evaluate differences between seasons. All data were checked for
normality and homogeneity of variances and where the test assumptions were not
met, either log-transformation or non-parametric correlation analysis were applied.
All statistical analyses were carried out with SPSS v. 15.0.
Results
A summary of the annual mean data and the standard deviation (SD) obtained for each
parameter at each sampling site is shown in Table 1. Pearson’s correlation coefficients
illustrating the relationships among NH3 and the studied physiological responses at
each season, as well as considering the annual means, are gathered in Table 2. In
addition, bar charts have been included to show the variations on the physiological
response throughout the year (Figures 1 to 3). Regression analyses with annual mean
data are available in the Supplementary material (SM1).
Ammonia concentrations
Annual mean [NH3] values declined exponentially with distance from the swine
livestock, which is in agreement with previous studies (Sutton et al., 1998; Olsen et al.,
2010). In approximately 1 km, NH3 concentrations varied from 48.8 g m-3 in the
closest sampling point to 1.65 g m-3 in the background area. These values are in the
range of other values reported around intensive agricultural areas: 1.6 - 59 g m-3
(Pitcairn et al., 1998); 2 – 60 g m-3 (Paoli et al., 2010); 1.4 - 34.0 g m-3 (Pinho et al.,
2012).

Chapter 4
150
Table 1. Annual mean data and standard deviation (± SD) of all the physiological variables analyzed in the present survey in samples of Hypnum
cupressiforme. Nutritional relationships (C:N, N:P and N:K) were calculated from annual mean data of the corresponding elements.
Site Code ETX-1 ETX-2 ETX-3 ETX-4 ETX-5 ETX-6 ETX-7
Distance to livestock (m) 30 80 100 170 330 700 1000
NH3 air concentrations (g m-3) 48.83 ± 13.96
38.19 ± 11.91
32.54 ± 9.75 25.29 ± 9.58
12.57 ± 8.82 4.64 ± 2.25 1.65 ± 1.16
Tissue chemistry
N (%)
2.50 ± 0.16
2.31 ± 0.15
2.15 ± 0.10
1.93 ± 0.24
1.42 ± 0.12
1.61 ± 0.17
1.33 ± 0.12
C (%)
43.26 ± 0.69
43.14 ± 0.55
43.56 ± 0.69
43.63 ± 0.45
43.88 ± 0.36
43.53 ± 0.53
44.26 ± 0.37
P (mg g-1
DW)
1.35 ± 0.30
1.79 ± 0.24
1.22 ± 0.12
1.24 ± 0.21
1.10 ± 0.19
1.16 ± 0.18
1.25 ± 0.10
K (mg g-1 DW)
4.20 ± 0.41
5.06 ± 0.31
4.14 ± 0.70
4.08 ± 0.49
4.51 ± 0.75
4.71 ± 0.41
4.52 ± 0.44
Ca (mg g-1 DW)
8.14 ± 1.07
7.22 ± 0.65
6.45 ± 1.05
8.21 ± 0.54
5.70 ± 1.06
6.40 ± 0.70
6.58 ± 0.34
Mg (mg g-1
DW)
1.01 ± 0.08
1.14 ± 0.10
1.20 ± 0.15
1.11 ± 0.15
1.18 ± 0.13
1.36 ± 0.14
1.21 ± 0.09
C:N
17.33
18.71
20.23
22.63
30.86
27.06
33.26
N:P
18.48
12.87
17.70
15.50
12.90
13.88
10.65
N:K
5.94
4.56
5.20
4.72 3.15
3.42
2.95
Metabolic enzymes
PME (p-NP release; nmol g-1 DW s-1)
333.1 ± 120.8
217.4 ± 62.9
300.9 ± 75.3
239.2 ± 62.2
196.5 ± 50.1
226.8 ± 39.5
150.0 ± 28.0
NR (nmol NO2 g-1 DW h-1)
13.25 ± 4.17
16.95 ± 8.11
1.35 ± 0.65
22.90 ± 3.40 70.85 ± 39.64
62.54 ± 10.43
79.92 ± 14.44
Oxidative stress markers
SOD (Inhibition unit g-1 DW)
322.3 ± 75.7
309.3 ± 76.4
264.0 ± 68.3
226.6 ± 88.5
199.7 ± 98.5
211.9 ± 89.8
155.1 ± 109.1
MDA (TBARS, nmol g-1 DW) 65.97 ± 20.86 62.86 ± 16.14 59.09 ± 17.37 51.15 ± 19.71 46.16 ± 17.31 51.78 ± 10.81 38.37 ± 7.76
N-containing organic compounds
Proteins (mg g-1 DW)
13.76 ± 2.34
11.92 ± 2.00
12.90 ± 3.25
11.85 ± 2.20
11.48 ± 2.60
10.46 ± 2.01
8.19 ± 1.87
Chla +b (mg g-1 DW)
4.05 ± 1.70
4.44 ± 1.12
3.66 ± 1.36
3.11 ± 1.19
2.24 ± 0.69
3.07 ± 1.55
2.61 ± 0.81
Carotenoids (mg g-1
DW) 0.52 ± 0.16 0.49 ± 0.13 0.42 ± 0.18 0.47 ± 0.11 0.24 ± 0.13 0.34 ± 0.19 0.24 ± 0.15
Isotopic signatures
13C (‰)
-28.15 ± 0.36
-28.33 ± 0.40
-28.75 ± 0.37
-28.61 ± 0.43
-28.99 ± 0.42
-29.47 ± 0.40
-29.40 ± 0.41
15N (‰) -10.19 ± 1.22 -8.99 ± 0.69 -10.06 ± 0.35 -10.23 ± 0.81 -8.36 ± 0.61 -6.30 ± 0.28 -6.42 ± 0.50

Integrated ecophysiological response of Hypnum cupressiforme to increasing NH3
151
Table 2. Pearson’s correlation coefficients between ammonia concentrations and the
physiological responses studied along the gradient.
Pearson's correlation coefficient
September December March June Annual
Distance -0.893** -0.880** -0.887** -0.899** -0.897**
N 0.948** 0.971** 0.981** 0.841* 0.967**
C -0.847* -0.474 0.050 -0.543 -0.794*
P 0.060 0.770* 0.474 0.289 0.555
K -0.702 -0.468 0.057 0.097 -0.211
Ca 0.422 0.830* 0.423 0.551 0.636
Mg -0.805* -0.859* -0.863* -0.432 -0.771*
C:N -0.894** -0.930** -0.993** -0.789* -0.936**
N:P 0.770* 0.521 0.501 0.737a 0.737a
N:K 0.920** 0.924** 0.875* 0.897** 0.937**
PME 0.817* 0.250 0.748a 0.796* 0.797*
NR
-0.908**
SOD 0.956** 0.930** 0.894** 0.917** 0.950**
MDA 0.762* 0.857* 0.960** -0.258 0.911**
Proteins 0.890** 0.457 0.866* 0.659 0.881**
Chla 0.655 0.793* 0.818* 0.909** 0.866*
Chlb 0.708 0.637 0.670 0.865* 0.798*
Chla+b 0.679 0.747 0.763* 0.857* 0.834*
Carotenoids 0.760* 0.846* 0.880** 0.890* 0.887**
15N -0.912** -0.577 -0.875** -0.816* -0.854*
13C 0.783* 0.951** 0.939** 0.767* 0.967**
* significant at p < 0.05; ** significant at p < 0.01; a significant at p < 0.055
Chapter 4
152
Physiological responses increased along the gradient
Considering annual mean data, the variables which showed an increasing trend along the
gradient and a significant relationship with NH3 concentrations were the tissue N content
and the associated N:K ratios (N:P at p<0.059), the enzymes PME and SOD, the MDA, the
pigments, the soluble protein content and 13C (Table 2 and 3).
Foliar N content was 2.5% close to the farm, declining with distance to 1.3% in the
farthest point (Table 1). This accumulation of N in mosses near the livestock building
inferred a clear gradient in the N:K ratios, which varied from 5.9 in ETX-1 to 2.9 in ETX-7.
Similarly, for PME, SOD and carotenoids, in the closest sampling sites NH3 enhanced
concentrations produced increases of ~50% over the values registered at the background
area, 1 km far away. Regarding MDA data, lipid peroxidation was increased from 38.4 to
66 nmol TBARS g-1 DW close to the farm. Carbon isotopic fractionation showed a
depletion of the heaviest stable C isotope (13C) in the area where lower NH3
concentrations were recorded, reaching a mean value of -29.4‰. Contrary to the linear
trend that followed these variables, the increase of proteins content was not
homogeneous along the gradient, being more pronounced in mosses from the
background area to 170 m, where this tendency becomes smoother (SM1).
ANOVA analyses revealed that the response of most of these variables was not
homogeneous throughout the year, being more or less exacerbated according to the
studied season. By way of example, carotenoids showed significantly higher values in
September than in the other months (Figure 1l), whereas the SOD answer was more
pronounced in December and June (Figure 1e). These variations were probably related to
changes in environmental factors such as temperature or sun light. Nevertheless, despite
these factors might have influenced the absolute value of the physiological answer, they
did it in the same way along the gradient, since those changes did not distort the overall
trend. Equally, the evaluation of temporal data not only confirmed changes in the
magnitude of the response during the year, but also highlighted differences in the
seasonal patterns for some of the studied variables. Unlike tissue N, N:K ratio, SOD and
13C, which behaved the same way at all seasons, the other responses were dependent
on the sampling period (Table 2; Figure 1).
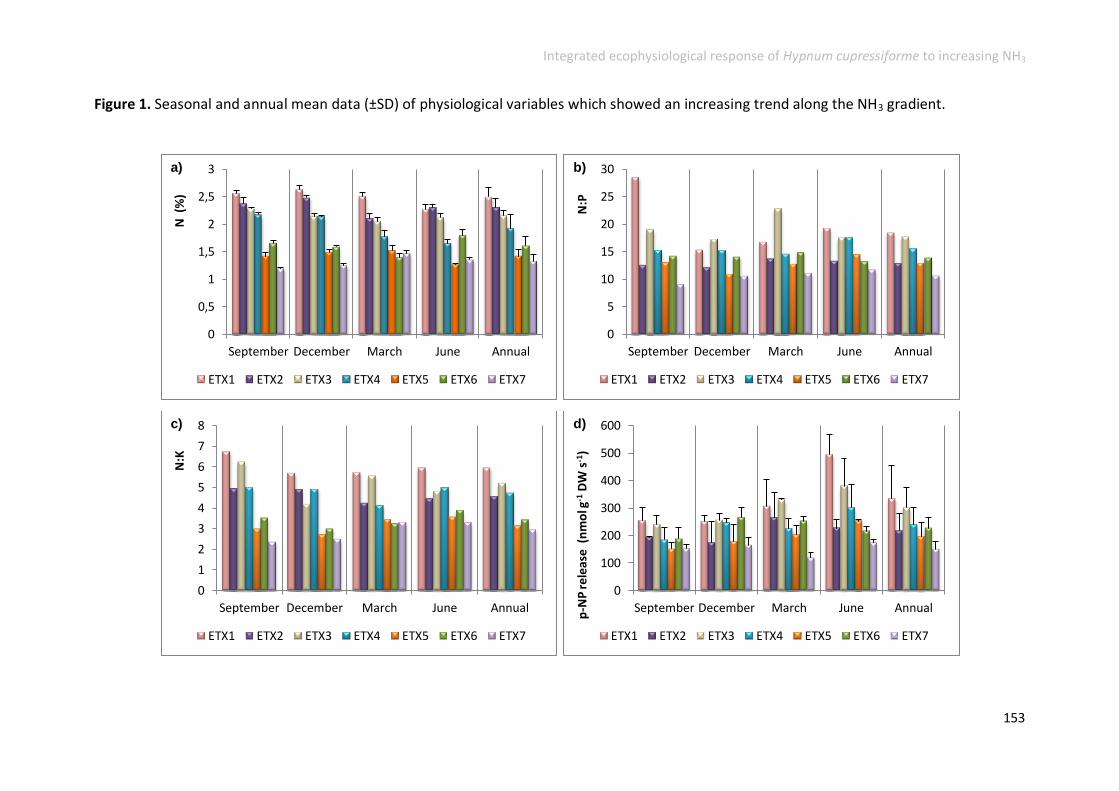
Integrated ecophysiological response of Hypnum cupressiforme to increasing NH3
153
Figure 1. Seasonal and annual mean data (±SD) of physiological variables which showed an increasing trend along the NH3 gradient.
0
0,5
1
1,5
2
2,5
3
September December March June Annual
N (
%)
ETX1 ETX2 ETX3 ETX4 ETX5 ETX6 ETX7
a)
0
5
10
15
20
25
30
September December March June Annual
N:P
ETX1 ETX2 ETX3 ETX4 ETX5 ETX6 ETX7
b)
0
1
2
3
4
5
6
7
8
September December March June Annual
N:K
ETX1 ETX2 ETX3 ETX4 ETX5 ETX6 ETX7
c)
0
100
200
300
400
500
600
September December March June Annual
p-N
P r
ele
ase
(n
mo
l g-1
DW
s-1
)
ETX1 ETX2 ETX3 ETX4 ETX5 ETX6 ETX7
d)
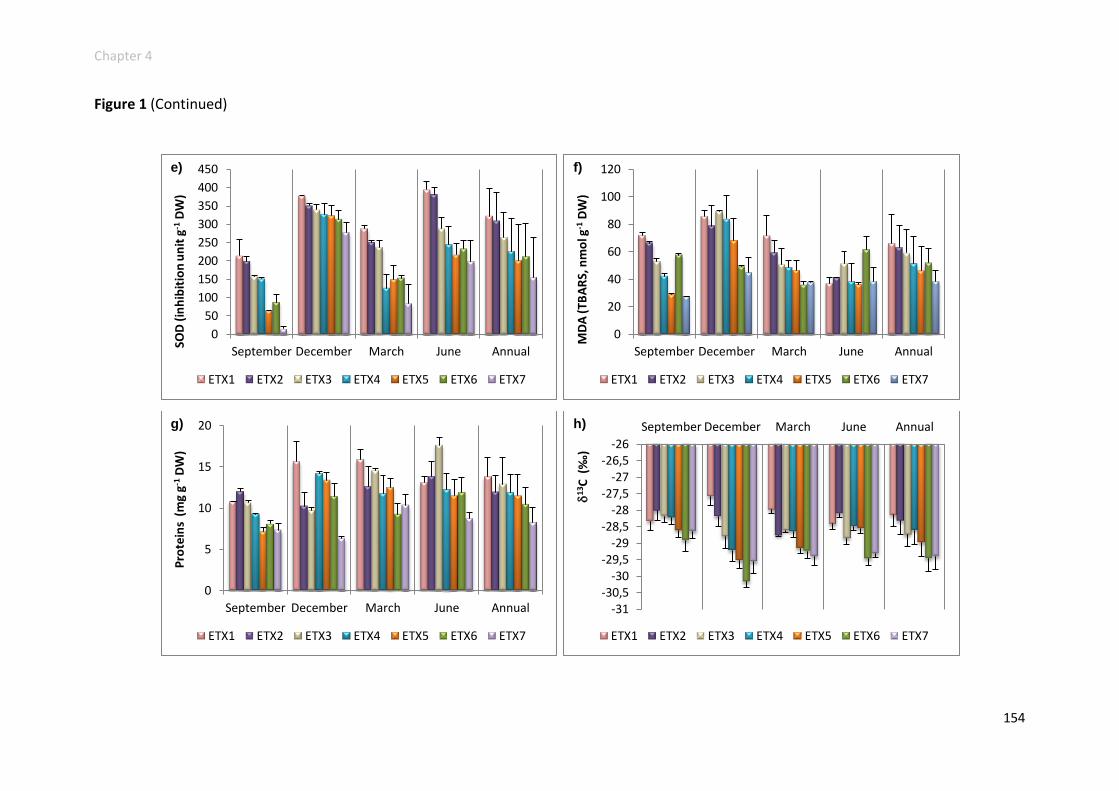
Chapter 4
154
Figure 1 (Continued)
0
50
100
150
200
250
300
350
400
450
September December March June Annual
SOD
(in
hib
itio
n u
nit
g-1
DW
)
ETX1 ETX2 ETX3 ETX4 ETX5 ETX6 ETX7
e)
0
20
40
60
80
100
120
September December March June Annual
MD
A (
TBA
RS,
nm
ol g
-1 D
W)
ETX1 ETX2 ETX3 ETX4 ETX5 ETX6 ETX7
f)
0
5
10
15
20
September December March June Annual
Pro
tein
s (
mg
g-1 D
W)
ETX1 ETX2 ETX3 ETX4 ETX5 ETX6 ETX7
g)
-31 -30,5
-30 -29,5
-29 -28,5
-28 -27,5
-27 -26,5
-26
September December March June Annual
1
3 C (
‰)
ETX1 ETX2 ETX3 ETX4 ETX5 ETX6 ETX7
h)
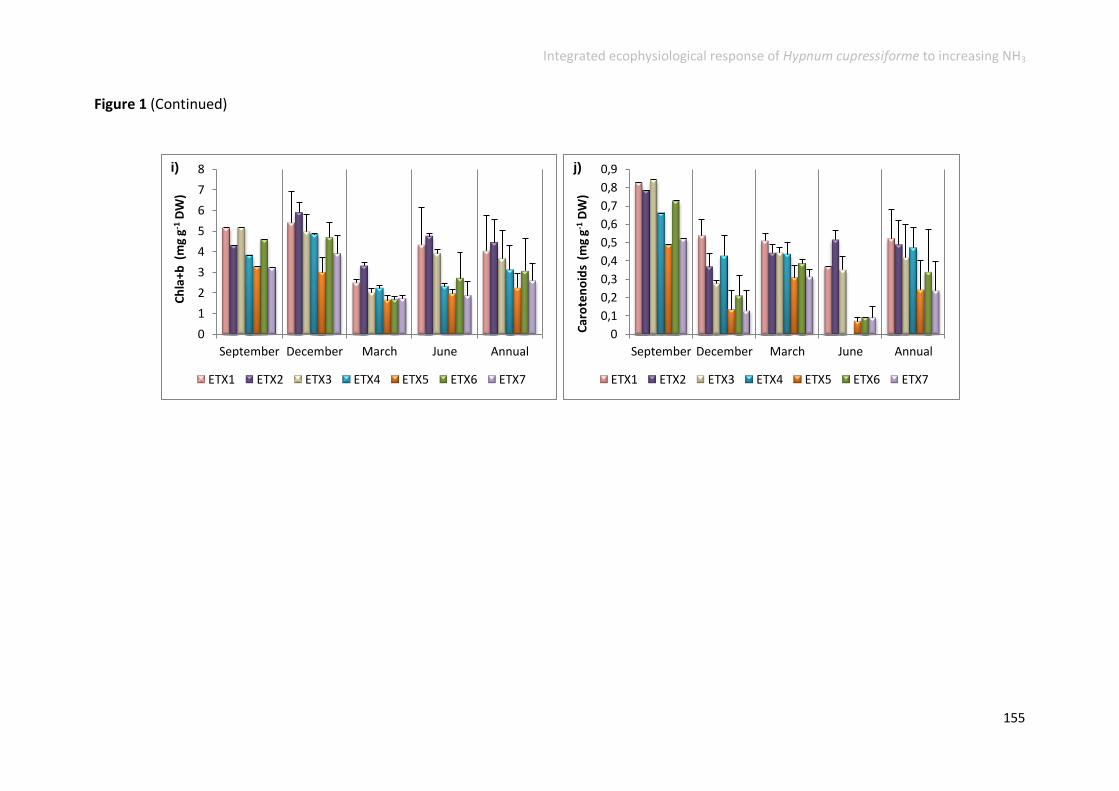
Integrated ecophysiological response of Hypnum cupressiforme to increasing NH3
155
Figure 1 (Continued)
0
1
2
3
4
5
6
7
8
September December March June Annual
Ch
la+b
(m
g g-1
DW
)
ETX1 ETX2 ETX3 ETX4 ETX5 ETX6 ETX7
i)
0
0,1
0,2
0,3
0,4
0,5
0,6
0,7
0,8
0,9
September December March June Annual
Car
ote
no
ids
(m
g g-1
DW
)
ETX1 ETX2 ETX3 ETX4 ETX5 ETX6 ETX7
j)

Chapter 4
156
Table 3. Summary of the physiological responses observed along the NH3 gradient in the present survey (based on annual means), their
statistical significance, and the processes that can be monitored through their analysis. A selection of references of previous surveys addressing
these variables is also provided.
Parameter Behaviour along the NH3
gradient in this survey
Significance of the answer
Indicative of References
N Increased p < 0.01 N accumulation Hicks et al. (2000); Pitcairn et al. (2003 and 2006); Olsen et al. (2010); Harmens
et al. (2011 and 2014); Boltersdorf et al. (2014); Izquieta-Rojano et al. (2016)
Nutritional constraints
(C:N, N:P, N:K)
Bragazza et al. (2004); Carfrae et al. (2007); Arróniz-Crespo et al. (2008); Fay et al. (2015); Ford et al. (2016); Wang et al. (2016)
C Decreased
p < 0.05
N-induced fertilizing effect
Granath et al. (2009); Liu et al. (2008 and 2010)
Photosynthesis impairment
Munzi et al. (2013 and 2014)
Nutritional constraints
(C:N, C:P) Gerdol et al. (2007); Munzi et al. (2013); Du et al. (2014)
P Unchanged n.s. P accumulation Du et al. (2014)
Nutritional constraints
(N:P, C:P)
Bragazza et al. (2004); Güsewell (2004); Vitousek et al. (2010); Sardans et al. (2015); Du et al. (2014); Fay et al. (2015); Ford et al. (2016); Wang et al. (2016)
K Unchanged
n.s.
Cell membrane damages (leakage)
Pearce et al. (2003); Arróniz-Crespo et al. (2008); Bignal et al. (2008)
Nutritional constraints
(N:K)
Bragazza et al. (2004); Carfrae et al. (2007); Sardans et al. (2015); Fay et al. (2015); Wang et al. (2016)
Ca Unchanged
n.s.
Shifts in the cellular pH
Soares et al. (1995); Soares and Pearson (1997); Britto et al. (2002); Bragazza et al. (2004)
Cell membrane damages (leakage) Bajji et al. (2002); Bignal et al. (2008); Berli et al. (2010)
Integrated ecophysiological response of Hypnum cupressiforme to increasing NH3
157
Table 3 (Continued)
Mg Decreased
p < 0.05
Shifts in the cellular pH
Soares et al. (1995); Soares and Pearson (1997); Britto et al. (2002); Bragazza et al. (2004)
Cell membrane damages (leakage) Bajji et al. (2002); Bignal et al. (2008); Berli et al. (2010)
PME Increased p < 0.05 P availability (P limitation) Treseder and Vitousek (2001); Turner et al. (2003); Arróniz-Crespo et al. (2008); Hogan et al. (2010a and b); Ochoa-Hueso and Manrique (2013);
Ochoa-Hueso et al. (2014a); Crittenden et al. (2015)
NR Decreased p < 0.01 N saturation Downs et al. (1993); Soares and Pearson (1997); Pearce et al. (2003);
Arróniz-Crespo et al. (2008); Ochoa-Hueso et al. (2014a)
SOD Increased p < 0.01 N toxicity (Oxidative stress) Mittler (2002); Dazy et al. (2009); Fernández-Crespo et al. (2014);
Bittsánszky et al. (2015); Liu et al. (2015)
MDA Increased p < 0.01 Cell membrane damages (lipid
peroxidation) and oxidative stress Sairam et al. (2002); Jie et al. (2010); Liu et al. (2015)
Proteins Increased p < 0.01 N investment in organic compounds Krupa et al. (2003); Koranda et al. (2007); Bittsánszky et al. (2015)
Chlorophyl a+b Increased p < 0.05 N investment in organic compounds Arróniz-Crespo et al. (2008); Granath et al. (2009); Ochoa-Hueso et al.
(2014b)
Carotenoids Increased p < 0.01 N toxicity (Oxidative stress) Edge et al. (1997); Triantaphylides and Havaux (2009); Ochoa-Hueso et al.
(2014b)
d15N Decreased
p < 0.05
Ammonia toxicity
Ariz et al. (2011)
NH3 uptake
Ariz et al. (2011)
P availability (P limitation) McKee et al. (2002); Clarkson et al. (2005)
d13
C Increased p < 0.01 Photosynthesis impairment Farquhar et al. (1989); Robinson et al. (2000); Dawson and Simonin (2011);
Pintó-Marijuan et al. (2013); Royles et al. (2014)

Chapter 4
158
Both PME and proteins did not show any significant change in December. Surprisingly,
the lack of response of this metabolic enzyme in this period was coincident with an
increase of the tissue P content towards the livestock building. In fact, it was in
December the only period where tissue P content was found to be increased along the
NH3 gradient (Table 2, Figure 3d). In addition, this dependent answer of the PME on
tissue P content was also observed at ETX-2. This site was especially enriched in P (all
seasons), showing similar values of PME to those found in the farthest points. The
MDA remained unaffected in June. Interestingly, in September, although MDA showed
a significant relationship with NH3, data from ETX-6 distorted the linear trend along the
gradient (Figure 1f). It was the same for pigments (Figure 1i and j), and SOD (in this
case the increasing values did not distort the overall trend; Figure 1e). Since ETX-6 did
not register higher NH3 concentrations for that period, these data suggested that other
stressor besides ammonia might have affected this site in September.
Physiological responses decreased along the gradient
Annual mean data showed that tissue C and Mg content, C:N ratio, and 15N were
negatively correlated with NH3 concentrations (Table 2 and 3). NR activity also
followed this trend (June data). Foliar C and Mg concentrations responded to a linear
fit in the regression analysis (SM1) and reached values of 44.3% and 1.2 mg g -1 DW
respectively in the background area. Moreover, tissue N accumulation inferred a
negative gradient in the C:N ratio, which ranged from 17.3 in ETX-1 to 33.4 in ETX-7. In
regards to NR and 15N, both variables registered their lower values in moss samples
from the vicinity of the livestock building. However, they did not follow a linear trend
(SM1), but a logarithmic adjustment was applied in the regression fitting. In the case of
these responses, the highest differences were found between sites located at 170 and
330 m respectively, where a reduction in NR activity of 68% was observed, and the
15N shifted from -10.2 to -8.4‰ (Table 1).
The evaluation of temporal data confirmed that physiological responses of these
parameters (except for NR, for which only data from June were available) were not
constant throughout the year, neither in magnitude nor in their behaviour along the

Integrated ecophysiological response of Hypnum cupressiforme to increasing NH3
159
gradient. 15N was not significantly correlated with NH3 in December, as it was
observed for PME. Moreover, it followed a logarithmic adjustment, the same used for
N:P ratios in the regression analysis. This fact suggested that N isotopic fractionation
might be influenced by P stoichiometry. Mg was unaffected in June, being coincident
with MDA patterns (Table 2). This is an interesting finding, since it suggested that Mg
leaching might be linked to cell membrane integrity. According to statistical results,
foliar C content was only significantly related to NH3 concentrations in September
(Table 2). However, a deeper analysis evidenced that C content values from ETX-6 in
June were especially low, hindering a possible correlation relationship. By ignoring this
point Pearson’s correlation became significant at p<0.05. It is noteworthy to mention
that, in this month, ETX-6 registered the highest MDA values of all sites. Thus, it
seemed probable that problems with C assimilation might be associated with damages
in the cell membrane. Moreover, although in September MDA values from ETX-6 were
also especially high in comparison with the other sites, C assimilation was not affected.
A likely explanation for this situation is that whilst in September anti-stress and
protection mechanisms were also activated (SOD and carotenoids), they were not in
June, leading to an impairment of the photosynthetic processes, and more probable of
the cellular CO2 diffusion processes.
Figure 2. Seasonal and annual mean data (±SD) of physiological variables which
showed a decreasing trend along the NH3 gradient.
0
20
40
60
80
100
June
NR
(nm
ol N
O2
g-1 D
W h
-1)
ETX1 ETX2 ETX3 ETX4 ETX5 ETX6 ETX7
a)

Chapter 4
160
Figure 2 (Continued)
40,5
41
41,5
42
42,5
43
43,5
44
44,5
45
September December March June Annual
C (
%)
ETX1 ETX2 ETX3 ETX4 ETX5 ETX6 ETX7
b)
0
5
10
15
20
25
30
35
40
September December March June Annual
C:N
ETX1 ETX2 ETX3 ETX4 ETX5 ETX6 ETX7
c)
0
0,2
0,4
0,6
0,8
1
1,2
1,4
1,6
1,8
September December March June Annual
Mg
(m
g g-1
DW
)
ETX1 ETX2 ETX3 ETX4 ETX5 ETX6 ETX7
d)
-14
-12
-10
-8
-6
-4
-2
0
September December March June Annual
1
5 N (
‰)
ETX1 ETX2 ETX3 ETX4 ETX5 ETX6 ETX7
e)

Integrated ecophysiological response of Hypnum cupressiforme to increasing NH3
161
Physiological responses unchanged along the gradient
The variables which resulted unaffected by increasing atmospheric NH3 were tissue
contents of K, Ca and P (Table 2 and 3).
Temporal data showed that both P and Ca did not follow this general trend in
December, being positively correlated to NH3 concentrations (Table 2; Figure 3). In
addition, by disregarding clearly discordant data, K showed a negative correlation
relationship along the gradient in September (p<0.01).
Figure 3. Seasonal and annual mean data (±SD) of physiological variables which
remained unchanged along the NH3 gradient.
0
1
2
3
4
5
6
7
September December March June Annual
K (
mg
g-1 D
W)
ETX1 ETX2 ETX3 ETX4 ETX5 ETX6 ETX7
a)
0
2
4
6
8
10
September December March June Annual
Ca
(m
g g-1
DW
)
ETX1 ETX2 ETX3 ETX4 ETX5 ETX6 ETX7
b)

Chapter 4
162
Discussion
Influence of NH3 concentrations on the physiology of H. cupressiforme
Tissue N content significantly increased from the background area towards the
livestock building, which is a common response to NH3 enrichment (Pitcairn et al.,
2003 and 2006; Branquinho et al., 2010). On the contrary, except for specific periods,
neither P, nor K was related to atmospheric NH3. Therefore, nutritional balances were
mainly influenced by tissue N accumulation. However, whereas N:K ratio showed a
clearly linear trend along the gradient (SM1), the N:P ratio depicted a steeper increase
at low atmospheric NH3 concentrations, tending to saturation from ETX-4 to ETX-1
(logarithmic fit, Figure 4a). This pattern was coincident with NR data (Figure 4b), which
revealed N-saturation signs at 25.3 g NH3 m-3 (Pearce et al., 2003; Arróniz-Crespo et
al., 2008; Ochoa-Hueso and Manrique 2013), and with protein content (Figure 4c;
SM1). These results suggested that protein synthesis may be closely related to NR
activity and P availability, being in accordance to Güsewell et al. (2003 and 2004),
Tessier and Raynal (2003), and Fay et al. (2015), who evidenced limitations in
increasing biomass and net productivity because of N-saturation effects and nutritional
constraints (especially P-limitation). According to the saturation point defined by NR,
N:P and protein regression curves, mosses with N:P ratios above 13 would be P-
limited, whereas N:K ratios above 3.2 might be interpreted as a sign of K limitation
(Bragazza et al., 2004).
0
0,5
1
1,5
2
2,5
September December March June Annual
P (
mg
g-1 D
W)
ETX1 ETX2 ETX3 ETX4 ETX5 ETX6 ETX7
c)

Integrated ecophysiological response of Hypnum cupressiforme to increasing NH3
163
Figure 4. Regression analyses of N:P ratios, NR activity and protein content along the
NH3 gradient in June (a, b and c). Annual mean data (±SD) are represented and a
logarithmic fit applied. Considering N:P ratios, data from ETX-2 were disregarded, since
this site showed particular characteristics of [P] that differed from the other sites (see
Results section).
y = 2,5056ln(x) + 9,0032
R² = 0,9583
0
5
10
15
20
25
0 10 20 30 40 50
N:P
NH3 (g m-3)
a)
y = -25,61ln(x) + 109,52
R² = 0,8322
0
10
20
30
40
50
60
70
80
90
100
0 10 20 30 40 50
NR
(n
mo
l N
O2 g
-1 D
W h
-1)
NH3 (g m-3)
b)
y = 1,8083ln(x) + 7,625
R² = 0,5584
0
2
4
6
8
10
12
14
16
18
20
0 10 20 30 40 50
Pro
tein
s (
mg
g-1
DW
)
NH3 (g m-3)
c)

Chapter 4
164
As a result of N income and the appearance of N:P imbalances, up-regulation of PME
activity was observed along the entire gradient. Changes in this enzyme responded to
the need of mosses for enhancing P uptake under N enrichment conditions and thus,
for compensating the N-induced nutritional constraints (Turner et al., 2003; Hogan et
al., 2010a and b; Ochoa-Hueso and Manrique 2013). Moreover, this enzyme was found
to be especially sensitive to changes in tissue P contents, varying its response
according to this parameter. This finding was in line with those from Press and Lee
(1983) and Arróniz-Crespo et al. (2008). Surprisingly, 15N trends were coincident with
PME, showing no correlation with NH3 concentrations in December, the only month
where tissue P contents were significantly increased towards the livestock. These
results suggest that N isotopic fractionation might depend on P availability, and thus,
depletion of the 15N isotope might be a good indicator of P-limitation, which is in
accordance to McKee et al. (2002) and Clarkson et al. (2005).
Going back to NR results, it is important to highlight that although these data
evidenced an N-saturation status in mosses exposed to [NH3] of 25.3 g m-3 or higher,
foliar N uptake was not affected, following an increasing trend beyond the saturation
point. This finding was opposite to those from previous studies, which showed
limitations in the tissue N accumulation as a result of an N-saturation induced effect
(Pearce et al., 2003; Arróniz-Crespo et al., 2008; Song et al., 2012). A possible
explanation for this apparent controversy might be related to the type of deposition
(wet or dry) to which the mosses are exposed and the means they use to acquire the
N. While the uptake of dissolved N compounds seems to be mediated by nutritional
regulators such as NR, which is inhibited under high N loads to avoid excessive
intracellular [N], ammonia gas appear to follow additional mechanisms to enter the
cell. Our hypothesis suggests that under elevated [NH3] conditions, uptake of this gas
might be driven by diffusion pathways through the cell wall. Contrary to higher plants,
which regulate NH3 or CO2 fluxes through stomata (Krupa et al., 2003 and references
therein), diffusion processes in mosses are uncontrolled and highly dependent on
environmental conditions (Royles et al., 2014). Our idea was supported by 15N results,
which showed more negative isotopic signatures in samples exposed to higher NH3
concentrations. Ariz et al. (2011) found that the highest depletion of 15N in plants

Integrated ecophysiological response of Hypnum cupressiforme to increasing NH3
165
under NH4 nutrition as the sole N source was caused by NH3 uptake in roots.
Therefore, increasing foliar N contents in samples beyond the N-saturation point might
be primarily due to a direct uptake of NH3 gas.
Although the fate of this extra N acquired through diffusion processes remained
unknown, it seemed probable that it was not invested in structural components, since
protein content turned moderate beyond N saturation point (Figure 4c, and SM1). This
fact, along with data from SOD, MDA, C, C:N and 13C, suggests that NH3 far from
participate positively in mosses nutrition, it might have led to toxic effects. NH3-related
adverse effects on vegetation occur when the rate of foliar uptake is greater than the
assimilation rate and the capacity for detoxification by the plants (Krupa et al., 2003;
Bittsánszky et al., 2015), and this situation appeared to be promoted by increasing NH3
concentrations along the studied gradient.
On the one hand, both SOD and MDA were significantly increased with enhanced NH3,
showing an N-induced disruption of the cellular red-ox status and membrane damages
according to [NH3]. N reduced compounds can cause oxidative stress (Fernández-
Crespo et al., 2014; Liu et al., 2015). As a response, induction of scavenging enzymes of
reactive oxygen species (ROS), including SOD, is the most common mechanism for
detoxifying ROS synthesized during stress responses (Bowler et al., 1994). However,
when detoxification strategies are surpassed, accumulation of ROS initiates lipid
peroxidation (among others), which results in deterioration of cell membranes that
finally can lead to the oxidative destruction of the cell (Mittler et al., 2002). In view of
these results, it was proved that mosses exposed to higher [NH3] suffer greater levels
of oxidative stress and thus, membrane damages. In this regard, as a consequence of
increasing lipid peroxidation, higher rates of solute leakage were expected in samples
from the vicinity of the livestock (Pearce et al., 2003; Bignal et al., 2008; Berli et al.,
2010). Surprisingly, only Mg was found to be significantly affected by changes in
membrane integrity.
Other indicators of NH3 toxicity were data from tissue C content and 13C analyses,
which revealed symptoms of photosynthesis impairment according to increasing NH3
concentrations. During C3 photosynthesis in mosses there are two main processes that
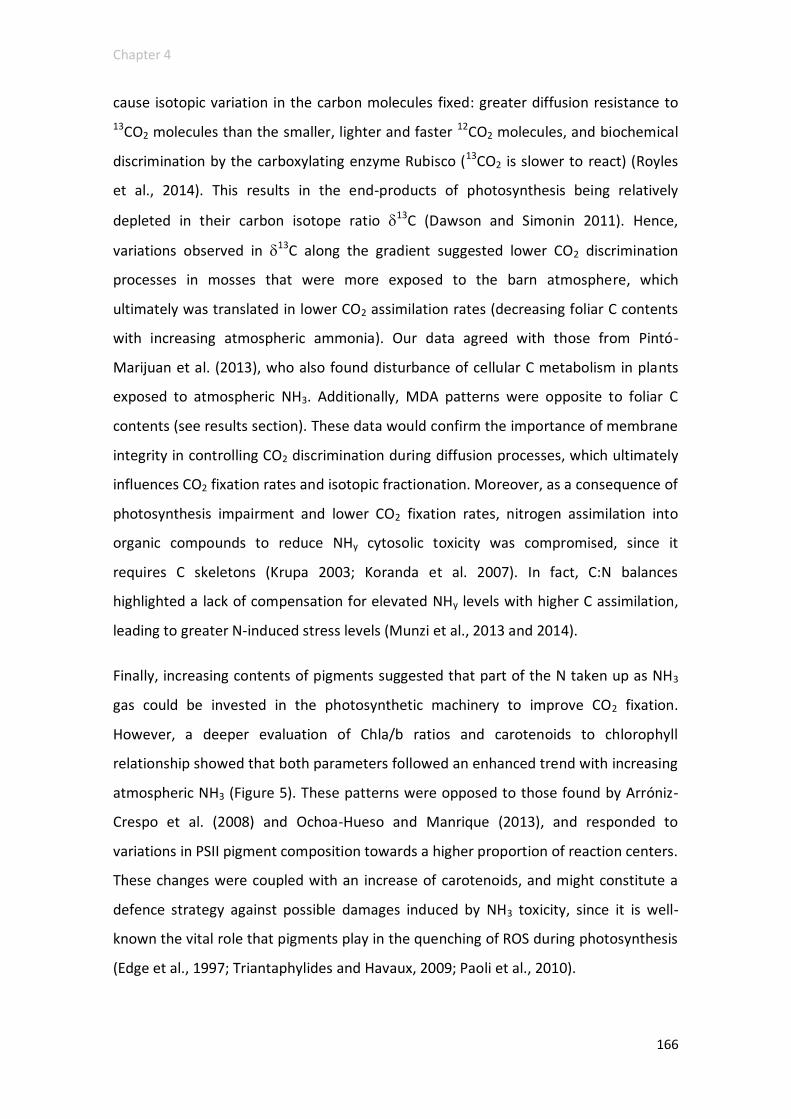
Chapter 4
166
cause isotopic variation in the carbon molecules fixed: greater diffusion resistance to
13CO2 molecules than the smaller, lighter and faster 12CO2 molecules, and biochemical
discrimination by the carboxylating enzyme Rubisco (13CO2 is slower to react) (Royles
et al., 2014). This results in the end-products of photosynthesis being relatively
depleted in their carbon isotope ratio 13C (Dawson and Simonin 2011). Hence,
variations observed in 13C along the gradient suggested lower CO2 discrimination
processes in mosses that were more exposed to the barn atmosphere, which
ultimately was translated in lower CO2 assimilation rates (decreasing foliar C contents
with increasing atmospheric ammonia). Our data agreed with those from Pintó-
Marijuan et al. (2013), who also found disturbance of cellular C metabolism in plants
exposed to atmospheric NH3. Additionally, MDA patterns were opposite to foliar C
contents (see results section). These data would confirm the importance of membrane
integrity in controlling CO2 discrimination during diffusion processes, which ultimately
influences CO2 fixation rates and isotopic fractionation. Moreover, as a consequence of
photosynthesis impairment and lower CO2 fixation rates, nitrogen assimilation into
organic compounds to reduce NHy cytosolic toxicity was compromised, since it
requires C skeletons (Krupa 2003; Koranda et al. 2007). In fact, C:N balances
highlighted a lack of compensation for elevated NHy levels with higher C assimilation,
leading to greater N-induced stress levels (Munzi et al., 2013 and 2014).
Finally, increasing contents of pigments suggested that part of the N taken up as NH3
gas could be invested in the photosynthetic machinery to improve CO2 fixation.
However, a deeper evaluation of Chla/b ratios and carotenoids to chlorophyll
relationship showed that both parameters followed an enhanced trend with increasing
atmospheric NH3 (Figure 5). These patterns were opposed to those found by Arróniz-
Crespo et al. (2008) and Ochoa-Hueso and Manrique (2013), and responded to
variations in PSII pigment composition towards a higher proportion of reaction centers.
These changes were coupled with an increase of carotenoids, and might constitute a
defence strategy against possible damages induced by NH3 toxicity, since it is well-
known the vital role that pigments play in the quenching of ROS during photosynthesis
(Edge et al., 1997; Triantaphylides and Havaux, 2009; Paoli et al., 2010).
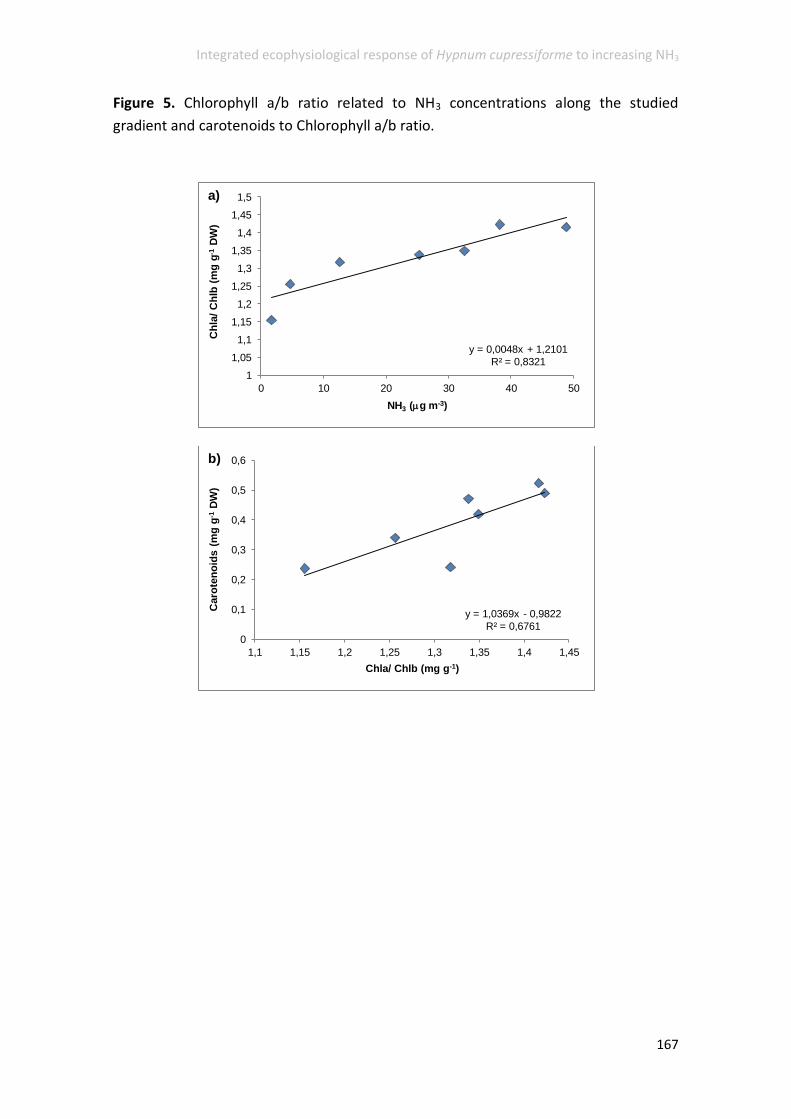
Integrated ecophysiological response of Hypnum cupressiforme to increasing NH3
167
Figure 5. Chlorophyll a/b ratio related to NH3 concentrations along the studied
gradient and carotenoids to Chlorophyll a/b ratio.
y = 0,0048x + 1,2101
R² = 0,8321
1
1,05
1,1
1,15
1,2
1,25
1,3
1,35
1,4
1,45
1,5
0 10 20 30 40 50
Ch
la/
Ch
lb (
mg
g-1
DW
)
NH3 (g m-3)
a)
y = 1,0369x - 0,9822
R² = 0,6761
0
0,1
0,2
0,3
0,4
0,5
0,6
1,1 1,15 1,2 1,25 1,3 1,35 1,4 1,45
Caro
ten
oid
s (
mg
g-1
DW
)
Chla/ Chlb (mg g-1)
b)
Chapter 4
168
Evaluation of responsiveness and temporal variability
Considering all the annual variability, correlation analyses showed that foliar N
content, SOD, MDA, proteins, carotenoids and isotopic signatures were the most
responsive parameters along the gradient, and therefore, the most promising for
monitoring atmospheric NH3. However, further analyses of temporal data highlighted
that most of the physiological answers were changing during the year, being less
exacerbated or even unexpressed at certain seasons. This fact limits their monitoring
potential to those periods where the answer to NH3 is clearly observed. In the case of
metabolic activities and C assimilation it was seen that spring and summer (late
summer) were the most advisable periods, which was coincident with the more active
periods of mosses. But, on the contrary, membrane damages and photosynthesis
impairment were most evident in autumn and winter, probably as a consequence of
restrictions on the detoxification pathways due to a lesser degree of mosses activity in
those periods. Nevertheless, unlike MDA, 13C differences along the NH3 gradient
emerged at any time. Indeed, only tissue N content, SOD and 13C showed the same
pattern during all seasons; although the magnitude of the answer could change, the
correlation with NH3 was kept regular and highly significant (p < 0.01 or 0.05). These
results suggested that N accumulation and oxidative damages are among the most
important stressors that mosses need to face when exposed to NH3 pollution,
whatever the season. Therefore, because of their responsiveness and homogeneous
patterns during the year, foliar N, SOD and 13C are probably the most useful markers
when it comes to monitoring atmospheric NH3 impacts. Moreover, these findings
highlighted the importance of having a good knowledge of the temporal dynamics to
establish appropriate sampling protocols, especially when aiming at studying particular
physiological processes.
Besides, the evaluation of regression models revealed that both proteins and 15N
better responded to a logarithmic adjustment, similarly to NR data from June. The
presence of saturation points in these answers might limit their use in biomonitoring
surveys of atmospheric NH3, making them advisable only for studying low and narrow
pollution gradients. All other physiological variables followed a linear fit, being
especially accurate for tissue N content (R2 = 0.936), 13C (R2 = 0.934) and SOD (R2 =

Integrated ecophysiological response of Hypnum cupressiforme to increasing NH3
169
0.902), which would offer the possibility of addressing broader pollution gradients.
Because of this fact, these parameters showed a greater potential for being used as
early warning indicators of NH3 toxicity in ecological studies.
Moreover, those variables which depicted an accurate linear curve in their exposure-
response relationship might have further applications in the estimates of NH3 CLE
(Cape et al., 2009; Scheffer et al., 2009). Determination of ‘no observed effect
concentration’ (NOEC) is challenging, especially in those areas where the background
concentration may be several g m-3 (agricultural areas), and significant ecological
changes may have happened years ago. In order to overcome these difficulties, Cape
et al. (2009) developed a statistical procedure based on well-fitted response functions,
principally linear and log-linear response curves. This method has been successfully
applied for establishing CLE of NH3 in Europe, Portugal or Spain (Cape et al., 2009;
Pinho et al., 2012; Aguillaume et al., 2015). Therefore, according to our results, it
seems that measurements of certain physiological responses at species level might be
a feasible option for setting site-specific NOEC.
Conclusions
This study has evaluated for the first time the effects of atmospheric NH3 on the
physiology of the moss H. cupressiforme from a multivariate, comprehensive and
temporal perspective. Moreover, the development of the experiment in the vicinity of
a swine livestock allowed us to work with a more realistic and representative approach
of the true conditions to which the moss is subjected.
Our results showed that, with the exception of some foliar tissue elements, all the
physiological variables considered in this study were sensitive to increasing NH3
concentrations, showing a great potential for biomonitoring purposes. However, the
analysis of temporal data revealed that not all answers were equally significant, nor
constant throughout the year. These findings not only highlighted the importance of
considering seasonal dynamics to develop appropriate sampling guidelines to obtain
accurate information about certain biological processes, but also were found really

Chapter 4
170
helpful to understand the physiological mechanisms involved in the NH3 response and
the likely interactions between them. In this respect, our data showed that N
accumulation and NH3-induced oxidative stress were the main drivers of the
physiological responses observed in the present work. Indeed, along with 13C, both
tissue N content and SOD were the most sensitive parameters, showing the better
correlations with atmospheric NH3 in all seasons. This fact, added to the linear fit in
their exposure-response relationship, pointed out these parameters as valuable
bioindicators for the study of NH3 toxicity and the development of critical thresholds.
In light of these findings, we conclude that integrated and temporal analyses of key
physiological processes at species level might be of vital importance in NH3 pollution
studies to understand and anticipate further ecological impacts.
Acknowledgements
The authors express their gratitude to the analytical staff of the Department of
Chemistry and the Department of Environmental Biology of the University of Navarra
for its assistance. During this study S. Izquieta-Rojano was recipient of a research grant
from the ‘Asociación de Amigos de la Universidad de Navarra’, which is kindly
acknowledge.

Integrated ecophysiological response of Hypnum cupressiforme to increasing NH3
171
References
Aguillaume, L., (2015) Efectos de la deposición de nitrógeno en encinares mediterráneos: cargas e indicadores. PhD Dissertation. Universitat Autonòma de Barcelona. Arróniz-Crespo, M., Leake, J.R., Horton, P., Phoenix, G.K., 2008. Bryophyte physiological responses to, and recovery from, long-term nitrogen deposition and phosphorus fertilisation in acidic grassland. New Phytologist. 180, 864e874. http://dx.doi.org/10.1111/j.1469-8137.2008.02617. Ariz, I., Cruz, C., Moran, J.F., González-Moro, M.B., García-Olaverri, C., González-Murua, C., Martins-Louçao, M.A., Aparicio-Tejo, P.M., 2011. Depletion of the heaviest stable N isotope is associated with NH4
+/NH3 toxicity in NH4+-fed plants. Bmc Plant Biology 11, 83.
Bajji, M., Kinet, J., Lutts, S., 2002. The use of the electrolyte leakage method for assessing cell membrane stability as a water stress tolerance test in durum wheat. Plant Growth Regulation 36, 61-70. Berli, F.J., Moreno, D., Piccoli, P., Hespanhol-Viana, L., Silva, M.F., Bressan-Smith, R., Cavagnaro, B., Bottini, R., 2010. Abscisic acid is involved in the response of grape (Vitis vinifera L.) cv. Malbec leaf tissues to ultraviolet-B radiation by enhancing ultraviolet-absorbing compounds, antioxidant enzymes and membrane sterols. Plant, Cell and Enviroment. 33, 1-10. doi: 10.1111/j.1365-3040.2009.02044.x Bignal, K.L., Ashmore, M.R., Headley, A.D., 2008. Effects of air pollution from road transport on growth and physiology of six transplanted bryophyte species. Environmental Pollution. 156, 332-340. Bittman, S., and Mikkelsen, R., 2009. Ammonia emissions from agricultural operations: Livestock. Better Crops, Vol. 93 (Nº 1). Bittsánszky, A., Pilinszky, K., Gyulai, G., Komives, T., 2015. Overcoming ammonium toxicity. Plant Science 231, 184-190. Bobbink, R., Hicks, K., Galloway, J., Spranger, T., Alkemade, R., Ashmore, M., Bustamante, M., Cinderby, S., Davidson, E., Dentener, F., Emmett, B., Erisman, J.W., Fenn, M., Gilliam, F., Nordin, A., Pardo, L., de Vries, W., 2010. Global assessment of nitrogen deposition effects on terrestrial plant diversity: a synthesis. Ecological Applications 20 (1), 30-59. Boltersdorf, S.H., Pesch, R., Werner, W., 2014. Comparative use of lichens, mosses and tree bark to evaluate nitrogen deposition in Germany. Environmental Pollution 189, 43-53. Bowler, C., Van Camp, W., Van Montagu, M., Inze, D., 1994. Superoxide dismutase in plants. Critical Reviews in Plant Sciences 13, 199-218. Bradford, M.M., 1976. Rapid and sensitive method for quantitation of microgram quantities of protein utilizing principle of protein-dye binding. Analytical Biochemistry 72, 248-254. Bragazza, L., Tahvanainen, T., Kutnar, L., Rydin, H., Limpens, J., Hajek, M., Grosvernier, P., Hajek, T., Hajkova, P., Hansen, I., Iacumin, P., Gerdol, R., 2004. Nutritional constraints in ombrotrophic Sphagnum plants under increasing atmospheric nitrogen deposition in Europe. New Phytologist 163, 609-616. Branquinho, C., Pinho, P., Dias, T., Cruz, C., Máguas, C., Martins-Loução, M.A., 2010. Lichen transplants at our service for measuring atmospheric NH3 deposition. Bibliotheca Lichenologica 105, 103-112. Britto, D.T. and Kronzucker, H.J., 2002. NH4
+ toxicity in higher plants: A critical review. Journal of Plant
Physiology 159, 567-584. Cape, J.N., van der Eerden, L.J., Sheppard, L.J., Leith, I.D., Sutton, M.A., 2009. Evidence for changing the critical level for ammonia. Environmental Pollution 157, 1033-1037.

Chapter 4
172
Carfrae JA, Sheppard LJ, Raven JA, Leith ID, Crossley A., 2007. Potassium and phosphorus additions modify the response of Sphagnum capillifolium growing on a Scottish ombrotrophic bog to enhanced nitrogen deposition. Applied Geochemistry, 22, 1111–1121. Clarkson, B.R., Schipper, L.A., Moyersoen, B., Silvester, W.B., 2005. Foliar 15N natural abundance indicates phosphorus limitation of bog species. Oecologia 144, 550-557. Crittenden, P.D., Scrimgeour, C.M., Minnullina, G., Sutton, M.A., Tang, Y.S., Theobald, M.R., 2015. Lichen response to ammonia deposition defines the footprint of a penguin rookery. Biogeochemistry 122, 295-311. Dawson, T.E. and Simonin, K.A., 2011. The roles of stable isotopes in forest hydrology and biogeochemistry. D.F. Levia et al. (eds.), Forest Hydrology and Biogeochemistry: Synthesis of Past Research and Future Directions, Ecological Studies 216, 137-161. DOI 10.1007/978-94-007-1363-5_7. Dazy, M., Masfaraud, J., Ferard, J., 2009. Induction of oxidative stress biomarkers associated with heavy metal stress in Fontinalis antipyretica Hedw. Chemosphere 75, 297-302. Delgado, V., Ederra, A., Miguel Santamaría, J., 2013. Nitrogen and carbon contents and delta N-15 and delta C-13 signatures in six bryophyte species: Assessment of long-term deposition changes (1980-2010) in Spanish beech forests. Global Change Biology 19, 2221-2228. Downs, M.R., Nadelhoffer, K.J., Melillo, J.M., Aber, J.D., 1993. Trees. 7, 233-236. Du, E., Liu, X., Fang, J., 2014. Effects of nitrogen additions on biomass, stoichiometry and nutrient pools of moss Rhytidium rugosum in a boreal forest in northeast China. Environmental Pollution 188, 166-171. Edge, R., McGarvey, D.J., Truscott, T.G., 1997. The carotenoids as anti-oxidants - a review. Journal of Photochemistry and Photobiology B-Biology 41, 189-200. Erisman, J.W., Galloway, J.N., Seitzinger, S., Bleeker, A., Dise, N.B., Petrescu, A.M.R., Leach, A.M., de Vries, W., 2013. Consequences of human modification of the global nitrogen cycle. Philosophical Transactions of the Royal Society B. Biological Sciences 368, 20130116. http://dx.doi.org/10.1098/rstb.2013.0116 EEA European Environment Agency 2015. Emission of the main air pollutants in Europe (CSI 040/APE 010). http://www.eea.europa.eu/data-and-maps/indicators/main-anthropogenic-air-pollutant-emissions/assessment EEA European Environment Agency 2014. EEA Technical report nº10/2014. NEC Directive status report 2013. Reporting by Member States under Directive 2001/81/EC of the European Parliament and of the Council of 23 October 2001 on national emission ceilings for certain atmospheric pollutants. ISBN 978-92-9213-462-4; ISSN 1725-2237; DOI: 10.2800/18346. Eurostat 2012. Agri-environmental indicator – ammonia emissions. Source: Statistics Explained. http://ec.europa.eu/eurostat/statistics-explained/index.php/Agri-environmental_indicator_-ammonia_emissions Eurostat 2013. Agriculture – ammonia emission statistics. Source: Statistics Explained. http://ec.europa.eu/eurostat/statistics-explained/index.php/Agriculture_-ammonia_emission_statistics Farquhar, G.D., Ehleringer, J.R., Hubick, K.T., 1989. Carbon isotope discrimination and photosynthesis. Annual Review of Plant Physiology and Plant Molecular Biology 40, 503-537. Fay, P.A., Prober, S.M., Harpole, W.S., Knops, J.M.H., Bakker, J.D., Borer, E.T., Lind, E.M., MacDougall, A.S., Seabloom, E.W., Wragg, P.D., Adler, P.B., Blumenthal, D.M., Buckley, Y.M., Chu, Chengjin., Cleland, E.E., Collins, S.L., Davies, K.F., Du, G., Feng X., Firn, J., Gruner, D.S., Hagenah, N., Hautier, Y., Heckman,

Integrated ecophysiological response of Hypnum cupressiforme to increasing NH3
173
R.W., Jin, V.L.., Kirkman, K.P., Klein, J., Ladwig, L.M., Li, Q., McCulley, R.L., Melbourne, B.A., Mitchell, C.E., Moore, J.L., Morgan, J.W., Risch, A.C., Schütz, M., Stevens, C.J., Wedin, D.A., Yang, L.H., 2015. Grassland productivity limited by multiple nutrients. Nature Plants 1, UNSP 15080. Fernández-Crespo, E., Gómez-Pastor, R., Scalschi, L., Llorens, E., Camanes, G., García-Agustín, P., 2014. NH4
+ induces antioxidant cellular machinery and provides resistance to salt stress in citrus plants. Trees-Structure and Function 28, 1693-1704. Ford, H., Roberts, A., Jones, L., 2016. Nitrogen and phosphorus co-limitation and grazing moderate nitrogen impacts on plant growth and nutrient cycling in sand dune grassland. Science of the Total Environment 542, 203-209. Fowler, D., Steadman, C. E., Stevenson, D., Coyle, M., R. M. Rees, R. M., Skiba, U. M., Sutton, M. A.,1, Cape, J. N., Dore, A. J., Vieno, M., Simpson, D., Zaehle, S., Stocker, B. D., Rinaldi, M., Facchini, M. C., Flechard, C. R.,nNemitz, E., Twigg, M., Erisman, J. W., Galloway, J. N., 2015. Effects of global change during the 21st century on the nitrogen cycle. Atmospheric Chemistry and Physics Discussion 15, 1747–1868. DOI:10.5194/acpd-15-1747-2015. Galloway, J. N., Aber, J. D., Erisman, J. W., Seitzinger, S. P., Howarth, R. W., Cowling, E. B., and Cosby, B. J., 2003. The nitrogen cascade, Bioscience, 53, 341–356. Gerdol, R., Petraglia, A., Bragazza, L., Iacumin, P., Brancaleoni, L., 2007. Nitrogen deposition interacts with climate in affecting production and decomposition rates in Sphagnum mosses. Global Change Biology 13, 1810-1821. Giannopolitis, C.N. and Ries, S.K., 1977. Superoxide dismutases: I. Occurrence in higher-plants. Plant Physiology 59, 309-314. González-Miqueo, L., Elustondo, D., Lasheras, E., Santamaría, J.M., 2010. Use of native mosses as biomonitors of heavy metals and nitrogen deposition in the surroundings of two steel works. Chemosphere 78, 965-971. Granath, G., Wiedermann, M.M., Strengbom, J., 2009. Physiological responses to nitrogen and sulphur addition and raised temperature in Sphagnum balticum. Oecologia 161, 481-490. Granath, G., Strengbom, J., Rydin, H., 2012. Direct physiological effects of nitrogen on Sphagnum: a greenhouse experiment. Functional Ecology 26, 353-364. Güsewell, S., 2004. N : P ratios in terrestrial plants: Variation and functional significance. New Phytologist 164, 243-266. Güsewell, S., Koerselman, W., Verhoeven, J.T.A., 2003. Biomass N:P ratios as indicators of nutrient limitation for plant populations in wetlands. Ecological Applications 13 (2), 372-384. Harmens, H., Schnyder, E., Thöni, L., Cooper, D.M., Mills, G., Leblond, S., Mohr, K., Poikolainen, J., Santamaría, J., Skudnik, M., Zechmeister, H.G., Lindroos, A., Hanus-Illnar, A., 2014. Relationship between site-specific nitrogen concentrations in mosses and measured wet bulk atmospheric nitrogen deposition across Europe. Environmental Pollution 194, 50-9. Harmens, H., Norris, D.A., Cooper, D.M., Mills, G., Steinnes, E., Kubin, E., Thöni, L., Aboal, J.R., Alber, R., Carballeira, A., Coskun, M., De Temmerman, L., Frolova, M., González-Miqueo, L., Jeran, Z., Leblond, S., Liiv, S., Mankovska, B., Pesch, R., Poikolainen, J., Ruhling, A., Santamaría, J.M., Simoneie, P., Schröder, W., Suchara, I., Yurukova, L., Zechmeister, H.G., 2011. Nitrogen concentrations in mosses indicate the spatial distribution of atmospheric nitrogen deposition in Europe. Environmental Pollution 159, 2852-2860.

Chapter 4
174
Heath, R.L. and Packer, L., 1968. Photoperoxidation in isolated chloroplasts: I. Kinetics and stoichiometry of fatty acid peroxidation. Archives of Biochemistry and Biophysics 125, 189-198. Hertel, O., Skjoth, C.A., Reis, S., Bleeker, A., Harrison, R.M., Cape, J.N., Fowler, D., Skiba, U., Simpson, D., Jickells, T., Kulmala, M., Gyldenkaerne, S., Sorensen, L.L., Erisman, J.W., Sutton, M.A., 2012. Governing processes for reactive nitrogen compounds in the European atmosphere. Biogeosciences 9, 4921-4954. Hicks, W.K., Leith, I.D., Woodin, S.J., Fowler, D., 2000. Can the foliar nitrogen concentration of upland vegetation be used for predicting atmospheric nitrogen deposition? Evidence from field surveys. Environmental Pollution 107, 367-376. Hogan, E. J., Minnullina, G., Sheppard, L. J., Leith, I. D., and Crittenden, P. D., 2010a. Response of phosphomonoesterase activity in the lichen Cladonia portentosa to nitrogen and phosphorus enrichment in a field manipulation experiment. New Phytologist. doi:10.1111/j.1469-8137.2010.03221.x. Hogan, E. J., Minullina, G., Smith, R. I., and Crittenden, P. D., 2010b. Effects of nitrogen enrichment on phosphatase and nitrogen: phosphorus relationships in Cladonia portentosa. New Phytologist. doi:10.1111/j.1469-8137.2010.03222.x. Izquieta-Rojano, S., Elustondo, D., Ederra, A., Lasheras, E., Santamaría, C., Santamaría, J.M., 2016. Pleurochaete squarrosa (Brid.) Lindb. as an alternative moss species for biomonitoring surveys of heavy metal, nitrogen deposition and δ15N signatures in a Mediterranean area. Ecological Indicators 60, 1221-1228. Jarvis, S., and contributing authors, 2011. Nitrogen flows in farming systems across Europe. In The European nitrogen assessment: sources, effects and policy perspectives (eds MA Sutton, CM Howard, JW Erisman, G Billen, A Bleeker, P Grennfelt, H van Grinsven, B Grizzetti), pp. 211–227. Cambridge, UK: Cambridge University Press. Jensen, L.S., Schjoerring, J.K., and contributing authors, 2011. Benefits of nitrogen for food, fibre and industrial production. In The European nitrogen assessment: sources, effects and policy perspectives (eds MA Sutton, CM Howard, JW Erisman, G Billen, A Bleeker, P Grennfelt, H van Grinsven, B Grizzetti), pp. 32–62. Cambridge, UK: Cambridge University Press. Jie, Z., Yun, K., Shaohui, W., Yuncong, Y., 2010. Activities of some enzymes associated with oxygen metabolism, lipid peroxidation and cell permeability in dehydrated Malus micromalus seedlings. African Journal of Biotechnology. Vol. 9 (17), 2521-2526. Koranda, M., Kerschbaum, S., Wanek, W., Zechmeister, H., Richter, A., 2007. Physiological responses of bryophytes Thuidium tamariscinum and Hylocomium splendens to increased nitrogen deposition. Annals of Botany 99, 161-169. Krupa, S.V., 2003. Effects of atmospheric ammonia (NH3) on terrestrial vegetation: A review. Environmental Pollution 124, 179-221. Leith, I.D., Pitcairn, C.E.R., Sheppard, L.J., Hill, P.W., Cape, J.N., Fowler, D., Tang, Y.S., Smith, R.I., Parrington, J.A., 2002. A comparison of impacts of N deposition applied as NH3 or as NH4Cl on ombrotrophic mire vegetation. Phyton Annales Rei Botanicae 42 (3), 83–88. Liu, B., Lei, C., Jin, J., Li, S., Zhang, Y., Liu, W., 2015. Physiological Responses of Two Moss Species to the Combined Stress of Water Deficit and Elevated Nitrogen Deposition. I. Secondary Metabolism. International Journal of Plant Sciences 176, 446-457.
Integrated ecophysiological response of Hypnum cupressiforme to increasing NH3
175
Liu, X., Xiao, H., Liu, C., Li, Y., Xiao, H., Wang, Y., 2010. Response of stable carbon isotope in epilithic mosses to atmospheric nitrogen deposition. Environmental Pollution 158, 2273-2281. Liu, X., Xiao, H., Liu, C.Q., Li, Y.Y., Xiao, H.W., 2008. Stable carbon and nitrogen isotopes of the moss Haplocladium microphyllum in an urban and a background area (SW China): The role of environmental conditions and atmospheric nitrogen deposition. Atmospheric Enviroment 42 (2008) 5431-5423. McKee, K.L., Feller, I.C., Popp, M., Wanek, W., 2002. Mangrove isotopic (delta N-15 and delta C-13) fractionation across a nitrogen vs. phosphorus limitation gradient. Ecology 83, 1065-1075. Mittler, R., 2002. Oxidative stress, antioxidants and stress tolerance. Trends in Plant Science 7, 405-410. Munzi, S., Cruz, C., Branquinho, C., Pinho, P., Leith, I.D., Sheppard, L.J., 2014. Can ammonia tolerance amongst lichen functional groups be explained by physiological responses? Environmental Pollution 187, 206-209. Munzi, S., Pisani, T., Paoli, L., Renzi, M., Loppi, S., 2013. Effect of nitrogen supply on the C/N balance in the lichen Evernia prunastri (L.) ach. Turkish Journal of Biology 37, 165-170. National Emission Ceilings Directive 2001/81/EC. Directive of the European Parliament and of the Council of 23 October 2001 on national emission ceilings for certain atmospheric pollutants. European Commission. Ochoa-Hueso, R., Arróniz-Crespo, M., Bowker, M.A., Maestre, F.T., Esther Pérez-Corona, M., Theobald, M.R., Vivanco, M.G., Manrique, E., 2014a. Biogeochemical indicators of elevated nitrogen deposition in semiarid Mediterranean ecosystems. Environmental monitoring and assessment 186, 5831-5842. Ochoa-Hueso, R., Paradela, C., Pérez-Corona, M.E., Manrique, E., 2014b. Chapter 23: Pigment ratios of the Mediterranean bryophyte Pleurochaete squarrosa respond to simulated nitrogen deposition. In: Sutton, M.A., K.E. Mason, L.J. Sheppard, H. Sverdrup, R. Haeuber, and W.K. Hicks (eds.), Nitrogen Deposition, Critical Loads and Biodiversity. Springer. pp. 207-216. ISBN 978-94-007-79. DOI: 10.1007/978-94-007-7939-6_23. Ochoa-Hueso, R. and Manrique, E., 2013. Effects of nitrogen deposition on growth and physiology of Pleurochaete squarrosa (Brid.) Lindb., a terricolous moss from Mediterranean ecosystems. Water Air and Soil Pollution 224, 1492. Olsen, H.B., Berthelsen, K., Andersen, H.V., Sochting, U., 2010. Xanthoria parietina as a monitor of ground-level ambient ammonia concentrations. Environmental Pollution 158, 455-461. Paoli, L., Benesperi, R., Pannunzi, D.P., Corsini, A., Loppi, S., 2014. Biological effects of ammonia released from a composting plant assessed with lichens. Environmental Science and Pollution Research 21, 5861-5872. Paoli, L., Pirintsos, S.A., Kotzabasis, K., Pisani, T., Navakoudis, E., Loppi, S., 2010. Effects of ammonia from livestock farming on lichen photosynthesis. Environmental Pollution 158, 2258-2265. Pearce I.S.K., Woodin S.J., van Der Wal R., 2003. Physiological and growth responses of the montane bryophyte Racomitrium lanuginosum to atmospheric nitrogen deposition. New Phytologist 160, 145–155. Phoenix, G.K., Booth, R.E., Leake, J.R., Read, D.J., Grime, J.P., Lee, J.A., 2004. Simulated pollutant nitrogen deposition increases P demand and enhances root-surface phosphatase activities of three plant functional types in a calcareous grassland. New Phytologist 161, 279-289.
Chapter 4
176
Pinho, P., Llop, E., Ribeiro, M.C., Cruz, C., Soares, A., Pereira, M.J., Branquinho, C., 2014. Tools for determining critical levels of atmospheric ammonia under the influence of multiple disturbances. Environmental Pollution 188, 88-93. Pinho, P., Theobald, M.R., Dias, T., Tang, Y.S., Cruz, C., Martins-Loucao, M.A., Maguas, C., Sutton, M., Branquinho, C., 2012. Critical loads of nitrogen deposition and critical levels of atmospheric ammonia for semi-natural Mediterranean evergreen woodlands. Biogeosciences 9, 1205-1215. Pintó-Marijuan, M., Da Silva, A.B., Flexas, J., Dias, T., Zarrouk, O., Martins-Louçao, M.A., Chaves, M.M., Cruz, C., 2013. Photosynthesis of Quercus suber is affected by atmospheric NH3 generated by multifunctional agrosystems. Tree physiology 33, 1328-1337. Pitcairn C, Fowler D, Leith I, Sheppard L, Tang S, Sutton M, Famulari D. 2006. Diagnostic indicators of elevated nitrogen deposition. Environmental Pollution 144, 941–950. Pitcairn, C.E.R., Fowler, D., Leith, I.D., Sheppard, L.J., Sutton, M.A., Kennedy, V., Okello, E., 2003. Bioindicators of enhanced nitrogen deposition. Environmental Pollution 126, 353-361. Pitcairn, C.E.R., Leith, I.D., Sheppard, L.J., Sutton, M.A., Fowler, D., Munro, R.C., Tang, S., Wilson, D., 1998. The relationship between nitrogen deposition, species composition and foliar nitrogen concentrations in woodland flora in the vicinity of livestock farms. Environmental Pollution 102, 41-48. Press, M.C. and Lee, J.A., 1983. Acid-phosphatase-activity in Sphagnum species in relation to phosphate nutrition. New Phytologist 93, 567-573. Reis, S., R. W. Pinder, M. Zhang, G. Lijie, and M. A. Sutton, 2009. Reactive nitrogen in atmospheric emission inventories. Atmospheric Chemistry and Physics 9 (19), 7657–7677, doi:10.5194/acp-9-7657-2009. Robinson, D., Handley, L.L., Scrimgeour, C.M., Gordon, D.C., Forster, B.P., Ellis, R.P., 2000. Using stable isotope natural abundances (delta N-15 and delta C-13) to integrate the stress responses of wild barley (Hordeum spontaneum C. koch.) genotypes. Journal of Experimental Botany 51, 41-50. Royles, J., Horwath, A.B., Griffiths, H., 2014. Interpreting bryophyte stable carbon isotope composition: Plants as temporal and spatial climate recorders. Geochemistry Geophysics Geosystems 15, 1462-1475. Sairam, R.K., Rao, K.V., Srivastava, G.C., 2002. Differential response of wheat genotypes to long term salinity stress in relation to oxidative stress, antioxidant activity and osmolyte concentration. Plant Science 163, 1037-1046. Sardans, J., Janssens, I.A., Alonso, R., Veresoglou, S.D., Rillig, M.C., Sanders, T.G.M., Carnicer, J., Filella, I., Farre-Armengol, G., Penuelas, J., 2015. Foliar elemental composition of European forest tree species associated with evolutionary traits and present environmental and competitive conditions. Global Ecology and Biogeography 24, 240-255. Scheffer, M., Bascompte, J., Brock, W.A., Brovkin, V., Carpenter, S.R., Dakos, V., Held, H., van Nes, E.H., Rietkerk, M., Sugihara, G., 2009. Early-warning signals for critical transitions. Nature 461, 53-59. Schroeder, W., Pesch, R., Schoenrock, S., Harmens, H., Mills, G., Fagerli, H., 2014. Mapping correlations between nitrogen concentrations in atmospheric deposition and mosses for natural landscapes in Europe. Ecological Indicators 36, 563-571. Sheppard LJ, Leith ID, Mizunuma T, Cape JN, Crossley A, Leeson S, Sutton MA, van Dijk N, Fowler D. 2011. Dry deposition of ammonia gas drives species change faster than wet deposition of ammonium ions: evidence from a long-term field manipulation. Global Change Biology 17, 3589–3607.

Integrated ecophysiological response of Hypnum cupressiforme to increasing NH3
177
Shibata, H., Branquinho, C., McDowell, W.H., Mitchell, M.J., Monteith, D.T., Tang, J., Arvola, L., Cruz, C., Cusack, D.F., Halada, L., Kopáček, J., Maguas, C., Sajidu, S., Schubert, H., Tokuchi, N., Zahora, J., 2015. Consequence of altered nitrogen cycles in the coupled human and ecological system under changing climate: The need for long-term and site-based research. Ambio 44, 178-193. Soares, A. and Pearson, J., 1997. Short-term physiological responses of mosses to atmospheric ammonium and nitrate. Water Air and Soil Pollution 93, 225-242. Soares, A., Ming, J.Y., Pearson, J., 1995. Physiological indicators and susceptibility of plants to acidifying atmospheric-pollution - a multivariate approach. Environmental Pollution 87, 159-166. Song, L., Liu, W.Y., Ma, W.Z., Qi, J.H., 2012. Response of epiphytic bryophytes to simulated N deposition in a subtropical montane cloud forest in southwestern China. Global Change Ecology. Oecologia. DOI 10.1007/s00442-012-2341-9. Steinnes, E., Ruhling, A., Lippo, H., Makinen, A., 1997. Reference materials for large-scale metal deposition surveys. Accreditation and Quality Assurance 2, 243-249. Sutton, M.A., Erisman, J.W., Dentener, F., Möller, D., 2008. Ammonia in the environment: from ancient times to the present. Environmental Pollution 156, 583-604. Sutton, M.A., Milford, C., Dragosits, U., Place, C.J., Singles, R.J., Smith, R.I., Pitcairn, C.E.R., Fowler, D., Hill, J., ApSimon, H.M., Ross, C., Hill, R., Jarvis, S.C., Pain, B.F., Phillips, V.C., Harrison, R., Moss, D., Webb, J., Espenhahn, S.E., Lee, D.S., Hornung, M., Ullyett, J., Bull, K.R., Emmett, B.A., Lowe, J., Wyers, G.P., 1998. Dispersion, deposition and impacts of atmospheric ammonia: Quantifying local budgets and spatial variability. Environmental Pollution 102, 349-361. Tang, Y.S., Cape, J.N., Sutton, M.A., 2001. Development and types of passive samplers for monitoring atmospheric NO2 and NH3 concentrations. The Scientific World Journal 1, 513-29. Tessier, J.T. and Raynal, D.J., 2003. Use of nitrogen to phosphorus ratios in plant tissue as an indicator of nutrient limitation and nitrogen saturation. Journal of Applied Ecology 40, 523-534. Treseder, K. and Vitousek, P., 2001. Effects of soil nutrient availability on investment in acquisition of N and P in Hawaiian rain forests. Ecology 82, 946-954. Triantaphylides, C. and Havaux, M., 2009. Singlet oxygen in plants: Production, detoxification and signaling. Trends in Plant Science 14, 219-228. Turner, B.L., Baxter, R., Ellwood, N.T.W., Whitton, B.A., 2003. Seasonal phosphatase activities of mosses from Upper Teesdale, northern England. Journal of Bryology 25, 189-200. Turner, B.L., Baxter, R., Ellwood, N.T.W., Whitton, B.A., 2001. Characterization of the phosphatase activities of mosses in relation to their environment. Plant Cell and Environment 24, 1165-1176. Van Damme, M., Kruit, R.J.W., Schaap, M., Clarisse, L., Clerbaux, C., Coheur, P., Dammers, E., Dolman, A.J., Erisman, J.W., 2014. Evaluating 4 years of atmospheric ammonia (NH3) over Europe using IASI satellite observations and LOTOS-EUROS model results. Journal of Geophysical Research-Atmospheres 119, 9549-9566. Van Vuuren, D.P., Bouwman, L.F., Smith, S.J., and Dentener, F., 2011. Global projections for anthropogenic reactive nitrogen emissions to the atmosphere: an assessment of scenarios in the scientific literature. Current Opinion in Environmental Sustainability 3, 359–369. DOI 10.1016/j.cosust.2011.08.014.
Chapter 4
178
Verhoeven, J.T.A., Beltman, B., Dorland, E., Robat, S.A., Bobbink, R., 2011. Differential effects of ammonium and nitrate deposition on fen phanerogams and bryophytes. Applied Vegetation Science 14, 149-157. Vitousek, P.M., Porder, S., Houlton, B.Z., Chadwick, O.A., 2010. Terrestrial phosphorus limitation: mechanisms, implications, and nitrogen-phosphorus interactions. Ecological Applications 20(1), pp. 5-15. Wang, M., Larmola, T., Murphy, M.T., Moore, T.R., Bubier, J.L., 2016. Stoichiometric response of shrubs and mosses to long-term nutrient (N, P and K) addition in an ombrotrophic peatland. Plant and Soil 400, 403-416. Wintermans, J.F.G.M., and De Mots, A., 1965. Spectrophotometric characteristics of chlorophylls a and b and their pheophytins in ethanol. Biochimica et Biophysica Acta 109, 448-453. Zhou, Y., Cheng, S., Lang, J., Chen, D., Zhao, B., Liu, C., Xu, R., Li, T., 2015. A comprehensive ammonia emission inventory with high-resolution and its evaluation in the Beijing-Tianjin-Hebei (BTH) region, China. Atmospheric Environment 106, 305-317.
Integrated ecophysiological response of Hypnum cupressiforme to increasing NH3
179
Supplementary Material 1. Regression analyses of all the physiological variables studied along the NH3 gradient. Annual mean data (±SD) are
represented.
y = 0,0246x + 1,3176
R² = 0,9358 0
0,5
1
1,5
2
2,5
3
0 10 20 30 40 50
N (
%)
NH3 (g m-3)
a)
y = 1,6661ln(x) + 10,093
R² = 0,5508 0
2
4
6
8
10
12
14
16
18
20
0 10 20 30 40 50
N:P
NH3 (g m-3)
b)
y = 0,0597x + 2,8811
R² = 0,8781 0
1
2
3
4
5
6
7
0 10 20 30 40 50
N:K
NH3 (g m-3)
c)
y = 2,7785x + 172,72
R² = 0,6353 0
50
100
150
200
250
300
350
400
450
500
0 10 20 30 40 50
PM
E (
p-N
P r
ele
ase;
nm
ol
g-1
DW
s-1
)
NH3 (g m-3)
d)
Chapter 4
180
y = 3,2319x + 165,68
R² = 0,9016
0
50
100
150
200
250
300
350
400
450
0 10 20 30 40 50
SO
D (
inh
ibit
ion
un
it g
-1 D
W)
NH3 (g m-3)
e)
y = 0,4977x + 41,987
R² = 0,8298
0
10
20
30
40
50
60
70
80
90
100
0 10 20 30 40 50
M D
A (
TB
AR
S,
nm
ol
g-1
DW
)
NH3 (g m-3)
f)
y = 1,3654ln(x) + 7,8403
R² = 0,9042
0
2
4
6
8
10
12
14
16
18
0 10 20 30 40 50
Pro
tein
s (
mg
g-1
DW
)
NH3 (g m-3)
g)
y = 0,0274x - 29,455
R² = 0,9337
-30
-29,5
-29
-28,5
-28
-27,5
0 10 20 30 40 50
13C
(‰
)
NH3 (g m-3)
h)
Integrated ecophysiological response of Hypnum cupressiforme to increasing NH3
181
y = 0,0254x + 1,3089
R² = 0,75
0
0,5
1
1,5
2
2,5
3
3,5
4
0 10 20 30 40 50
Ch
la (
mg
g-1
DW
)
NH3 (g m-3)
i)
y = 0,014x + 1,0992
R² = 0,6342
0
0,5
1
1,5
2
2,5
3
0 10 20 30 40 50
Ch
lb (
mg
g-1
DW
)
NH3 (g m-3)
j)
y = 0,0048x + 1,2101
R² = 0,8321
1
1,05
1,1
1,15
1,2
1,25
1,3
1,35
1,4
1,45
1,5
0 10 20 30 40 50
Ch
la/
Ch
lb (
mg
g-1
DW
)
NH3 (g m-3)
k)
y = 0,0059x + 0,2511
R² = 0,7913
0
0,1
0,2
0,3
0,4
0,5
0,6
0,7
0,8
0 10 20 30 40 50 C
aro
ten
oid
s (
mg
g-1
DW
)
NH3 (g m-3)
l)
Chapter 4
182
y = -0,0169x + 44,006
R² = 0,6329
42
42,5
43
43,5
44
44,5
45
0 10 20 30 40 50
C (
%)
NH3 (g m-3)
m)
y = -0,3261x + 31,925
R² = 0,8759 0
5
10
15
20
25
30
35
0 10 20 30 40 50
C:N
NH3 (g m-3)
n)
y = -0,0047x + 1,2828
R² = 0,594
0
0,2
0,4
0,6
0,8
1
1,2
1,4
1,6
0 10 20 30 40 50
Mg
(m
g g
-1 D
W)
NH3 (g m-3)
o)
y = -25,61ln(x) + 109,52
R² = 0,8322
0
10
20
30
40
50
60
70
80
90
100
0 10 20 30 40 50 N
R (
nm
ol
NO
2 g
-1 D
W h
-1)
NH3 (g m-3)
p)

Integrated ecophysiological response of Hypnum cupressiforme to increasing NH3
183
y = -1,25ln(x) - 5,2928
R² = 0,8396
-12
-10
-8
-6
-4
-2
0
0 10 20 30 40 50
15N
(‰
)
NH3 (g m-3)
q)
y = -0,0042x + 4,5578
R² = 0,0446
0
1
2
3
4
5
6
0 10 20 30 40 50
K (
mg
g-1
DW
)
NH3 (g m-3)
r)
y = 0,0338x + 6,167
R² = 0,404
0
1
2
3
4
5
6
7
8
9
10
0 10 20 30 40 50
Ca (
mg
g-1
DW
)
NH3 (g m-3)
s)
y = 0,0072x + 1,1345
R² = 0,3074
0
0,5
1
1,5
2
2,5
0 10 20 30 40 50 P
(m
g g
-1 D
W)
NH3 (g m-3)
t)

Chapter 4
184
Chapter 5 Total N and C contents and stable isotopes
(15N and 13C) in moss tissue at a European scale: a preliminary insight into spatial distribution patterns and feasibility of isotopic signatures as indicators of pollution sources and environmental conditions
Manuscript in preparation.
Santamaría, J.M., Izquieta-Rojano, S., Elustondo, D., and participants of the ICP-Vegetation programme
(2005-2006 campaign). Total N and C contents and stable isotopes (15N and 13C) in moss tissue at a
European scale: a preliminary insight into spatial distribution patterns and feasibility of isotopic
signatures as indicators of pollution sources and environmental conditions.

Abstract
Tissue N accumulation has been proven to be a good marker of increasing N
deposition. However, this measurement does not offer additional data about the
origin of pollution. In this respect, the analysis of the N isotopic ratios might be a
helpful tool in providing supplementary information about the nature of the
nitrogenous species in biomonitoring surveys. Furthermore, isotopic signatures have
been extensively used in the study of N and C biogeochemical cycles. The main
purpose of this study was to determine N and C elemental contents and their stable
isotopes in mosses to investigate atmospheric pollution patterns across Europe. We
aimed at identifying the main N polluted areas and evaluating the potential use of
isotopic signatures in the attribution of pollution sources at a regional scale. With
these objectives in mind, more than 1300 samples from 15 countries from Europe, all
of them participants of the ICP-Vegetation programme 2005-2006, were analyzed for
their C and N content and 15N and 13C. The results were compared to those from
EMEP (modeled deposition and emission data) and the most frequent land uses in the
sampling sites (CORINE Land Cover 2006). The preliminary evaluation of these data
suggested that additional measurements of C and N stable isotopes in mosses might
be a promising tool in European surveys, not only in providing useful information for
identifying likely pollution sources, but also as biological markers of key environmental
processes.
Keywords: Biomonitoring, Mosses, Nitrogen, Carbon, Stable isotopes, European scale,
EMEP, CORINE Land Cover.
Stable isotopes (15N and 13C) in mosses from Europe
187
Introduction
Nitrogen (N) has historically been a limiting nutrient in many natural and semi-natural
ecosystems (Vitousek et al., 2010; Fay et al., 2015). However, in the last decades, the
availability of nitrogen has significantly increased, thus modifying the global nitrogen
cycle (Galloway et al., 2008; Fowler et al., 2013). Anthropogenic activities, largely
through agriculture, but also through industry and the burning of fossil fuels, have had
a huge impact on the nitrogen budget of the Earth, causing serious impacts on
biodiversity and the functioning of ecosystems, climate, water quality, human health
and even the rate of population growth in developing countries (Erisman et al., 2008
and 2013; Godfray et al., 2010; Fowler et al., 2015).
In Europe, in order to palliate undesirable consequences of N pollution, several
regulatory policies have been implemented, such as the UNECE-CLRTAP Gothenburg
protocol or the National Emission Ceiling Directive (Oenema et al., 2011; Winiwarter et
al., 2015). In this context, the European Monitoring and Evaluation Programme
(EMEP), under the Convention on LRTAP, aims at solving transboundary air pollution
problems through the joint work of five expertise centers (www.emep.int). This
programme collects annual emission data of atmospheric pollutants from different
European countries with the purpose of investigating and modeling atmospheric
transport and deposition patterns (Fagerli and Aas 2008; Harmens et al., 2011;
Simpson et al., 2012). The results of models are validated with those from EMEP
stations, although measurement stations from this network are scarce at some areas,
especially in southern Europe (Harmens et al., 2011; García-Gómez et al., 2014).
Complementary to conventional monitoring sites, bioindicators can be highly useful for
investigating emission and deposition patterns of several pollutants, including N
(Sardans and Peñuelas 2005; Harmens et al., 2008 and 2011; Leith et al., 2008;
Boltersdorf et al., 2014). Because of their particular characteristics and special
sensitivity, mosses are among the most used organisms in biomonitoring surveys,
giving site-based information on atmospheric N concentrations, N deposition and/or
N-related ecological impacts (Zechmeister et al., 2003; Pitcairn et al., 2006; Arróniz-
Crespo et al., 2008; Harmens et al., 2014; Meyer et al., 2015). Indeed, the International

Chapter 5
188
Cooperative Programme on effects of air pollution on natural vegetation and crops
(ICP-Vegetation Programme) develops periodical monitoring campaigns using mosses,
which provides an indirect and time-integrated measure of atmospheric pollutants
deposition to ecosystem avoiding the need for deploying large number of precipitation
collectors and covering those areas where EMEP stations are absent (Harmens et al.,
2008 and 2015a). Since the 2005/2006 campaign, this biomonitoring European
network includes N in its target compounds, which has enabled mapping the spatial
distribution of atmospheric N deposition in Europe (Harmens et al., 2011 and 2015b).
Nevertheless, despite the suitability of mosses as indicators of N deposition, the
analysis of total N content in moss tissue does not provide additional information
about the origin of pollutants or relevant environmental processes influencing N
accumulation. This deficiency can be solved by the use of stable isotopes, which in the
last decades have become very popular in ecological and pollution studies (Robinson
2001; Bragazza et al., 2005; West et al., 2006; Alewell et al., 2011; Dawson and
Simonin 2011; Hobbie and Högberg 2012; Guerrieri et al., 2015).
Considering N pollution surveys, measurements of N stable isotopes have been
demonstrated to be particularly useful for establishing likely emission sources (Pearson
et al., 2000; Liu et al., 2008a; Xiao et al., 2010; Royles et al., 2014). The method is
mainly based on the differences in N isotopic signatures of the nitrogenous
compounds, which are eventually reflected in the tissues of mosses. The key issue is
that, in general, anthropogenic emissions of oxidized forms have a more positive 15N
value than the reduced forms (Heaton et al., 1986; Zhang et al., 2008). Therefore, on
the basis of these premises, the analysis of the spatial variations of N isotopic
signatures and the correlations with atmospheric components or the main N emitters
might provide an integrated approach to N pollution sources, where dominance of N-
NHy forms in deposition is expected to infer more negative 15N values in mosses,
whereas the higher the N-NOx concentrations in deposition the less negative 15N
value in vegetal tissues (Gerdol et al., 2002; Zechmeister et al., 2008). In the case of C
and 13C signatures, there is still few research focused on the interactions between
these parameters and N deposition in non-vascular plants. Whereas some authors

Stable isotopes (15N and 13C) in mosses from Europe
189
suggested a fertilizing effect of N deposition on the moss C fixation (Liu et al., 2010),
other findings reflected N-induced nutritional constraints (lower C:N ratios) and
photosynthesis impairment (higher 13C values) (Gerdol et al., 2007; Munzi et al., 2013
and 2014; Pintó-Marijuan et al., 2013). However, as a recorder of CO2 fixation, changes
in 13C signatures might not only be related to enhanced N deposition, but also reflect
CO2 potential emission sources or show variations in environmental conditions that
ultimately influence C metabolism (Menot and Burns 2001; Skrzypek et al., 2007; Liu et
al., 2008b).
In the present work we performed a preliminary evaluation of the spatial distribution
patterns of both N and C tissue contents and the associated 15N and 13C isotopic
signatures across Europe. The main purposes were to 1) identify the main N hot-spot
areas in the participating countries; 2) assess the suitability of moss stable C and N
signatures to identify the main sources of carbon and nitrogen across Europe, thus
getting complementary information to that obtained in European moss surveys; 3)
investigate the use of isotopic signatures to monitor key ecological processes at a
regional scale.
Despite the fact that previous evaluations of tissue N contents have already been
performed, to the author’s knowledge this is the first time that both tissue C
concentrations and N and C stable isotopes are investigated at a European scale.

Chapter 5
190
Material and methods
Material selection
In 2005/2006, approximately 3000 moss samples across 16 European countries were
collected during the ICP-Vegetation moss survey (Harmens et al., 2011). From these, a
total of 1313 samples, provided by 15 countries, were selected for the analysis of
nitrogen, carbon and their respective stable isotopes (15N and 13C) (Figure 1).
Hypnum cuppressiforme Hedw., Pleurozium
schreberi (Brid.) Mitt and Hylocomium
splendens (Hedw.) Schimp were the most
frequently selected species, accounting for
34%, 23% and 22% of the samples
respectively, followed by Scleropodium
purum (Hedw.) Limpr (8%). Other moss
species, to complete a total of twelve, made
up the remaining 13% of samples.
Both the sampling procedure as the further preparations for the analysis were
performed according to the guidelines described in the protocol for the 2005/2006
survey (ICP-Vegetation, 2005).
Elemental and isotopic analysis
Quantities of around 4 mg of dried moss samples were weighted and analyzed for N
and C content (%) and their respective isotopic signatures, 15N and 13C (‰). Analyses
were conducted by an elemental analyzer (Vario MICRO Cube, Elementar, Hanau,
Germany) coupled to an isotope ratio mass spectrometer (IsoPrime 100, Cheadle, UK),
according the methodology described in Delgado et al. (2013). The quality control of
the analytical method was performed using moss reference material M2 and M3
(Steinnes et al., 1997) and international isotopic standards (IAEA, Vienna, Austria).
Fig. 1. Moss species collected at each sampling point.

Stable isotopes (15N and 13C) in mosses from Europe
191
Both accuracy and precision was found to be below 2% for total concentration and
isotopic signatures.
Isotope data were given as 13C and 15N values, which represent the relative
difference expressed per mil (‰) between the isotopic composition of the sample and
that of a standard (Pee Dee Belemnite for carbon and atmospheric N2 for nitrogen):
13C (‰ vs. V-PDB) = [(Rsample/Rstandard) – 1] x 1000
15N (‰ vs. at-air) = [(Rsample/Rstandard) – 1] x 1000
where Rsample is the isotope ratio 13C/12C or 15N/14N and Rstandard is the isotope
ratio for the standard.
Statistical analysis
Relationships between concentrations of N and C in mosses, as well as their isotopic
signatures (15N and 13C), and a set of potential predictor variables (precipitation,
altitude, distribution of land use according to the Corine Land Cover 2006 (CLC 2006),
and EMEP modeled N depositions and air concentrations data 2005 (EMEP/CEIP 2014)
were explored. Since moss variables proved to be not normally distributed, the
nonparametric Spearman’s correlation test was applied. All statistical analyses were
performed employing the SPSS v. 15.0 software package (SPSS Inc., Chicago, IL, USA).
Maps
All geographical analyses and maps were performed using ArcGis for Desktop v. 10.2.
software package, taking as reference the EMEP 50 km x 50 km grid.
To produce the N, C, 15N and 13C maps, means were calculated and then displayed
for each grid cell. In the case of N deposition and air concentrations of the different
nitrogenous species considered for analysis, 2005 modeled data from the EMEP
network were selected and displayed in the same way (EMEP/CEIP 2014). Moreover,
Chapter 5
192
for each EMEP cell, the percentage of some coverages provided in the CORINE Land
Cover 2006 inventory was estimated and mapped (CLC 2006).
Results and discussion
N elemental contents and 15N signatures
Considering all available data from the 15 participating countries, the mean N content
in moss tissues was 1.27%, ranging from 0.40% to 3.95% (Table 1). The highest N
concentrations were detected in Croatia, Slovenia and Belgium, and locally in parts of
UK (south-east), Sweden (south), Bulgaria and Switzerland. On the contrary, the lowest
values were recorded in Finland, Sweden and UK. In these latter countries a clear
north-south gradient was observed, being the northernmost areas those with the
lowest N concentrations (Figure 2). These findings are in agreement with Poikolainen
et al. (2009), who observed the same pattern in a moss survey carried out in Finland.
Indeed, our results of the N spatial distribution patterns across Europe are very similar
to those from Harmens et al. (2011), thus corroborating that the subsample selected
for this study (35% of the total samples) can be considered statistically representative
of the moss survey carried out in 2005. Furthermore, in the present work data from
Sweden, Croatia and Macedonia are also provided for the same year, which were not
included in the ICP-Vegetation 2005/2006 campaign. The results from the next moss
survey (2010/2011 campaign) showed that central and eastern areas continue being
among the most exposed to high N deposition according to moss N contents (Harmens
et al., 2015b). However, not all participants of the 2005/2006 campaign reported data
in 2010, whereas new countries were incorporated in 2010/2011. Moreover, the
number of sampling sites per country also varied, being significantly different in
countries such as France or Slovenia (Harmens et al. 2015b). These facts prevented
further comparisons.
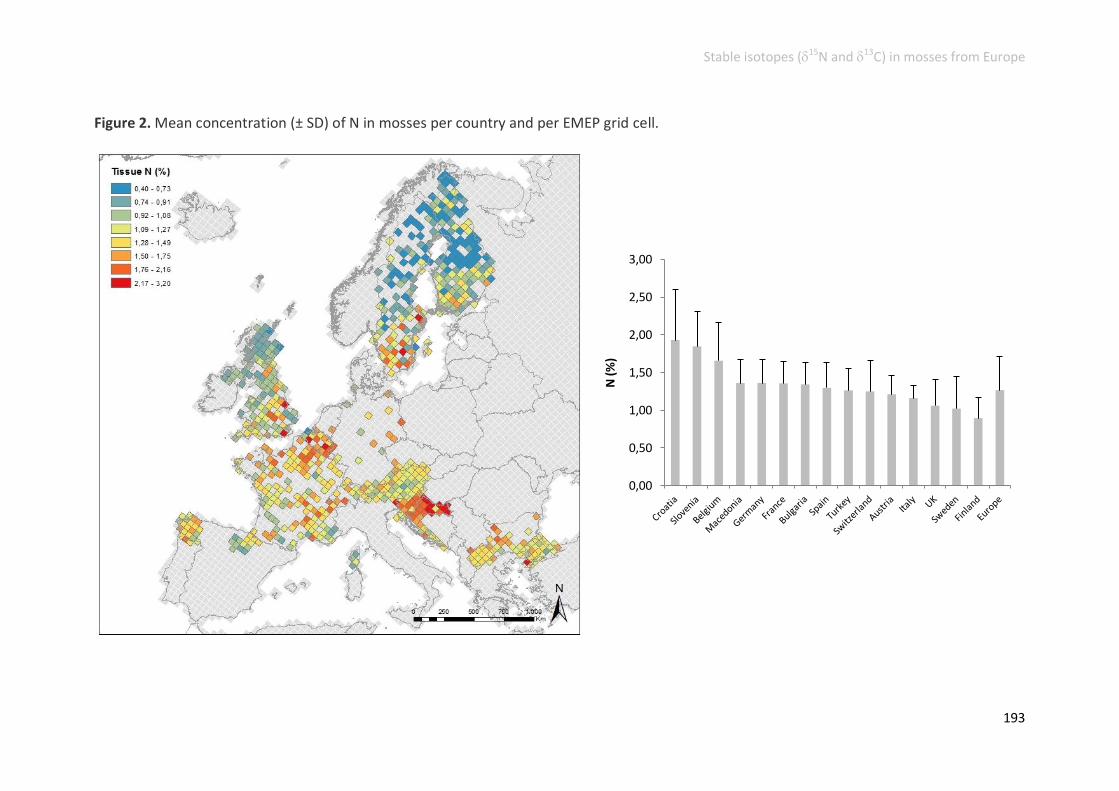
Stable isotopes (15N and 13C) in mosses from Europe
193
Figure 2. Mean concentration (± SD) of N in mosses per country and per EMEP grid cell.
0,00
0,50
1,00
1,50
2,00
2,50
3,00
N (
%)
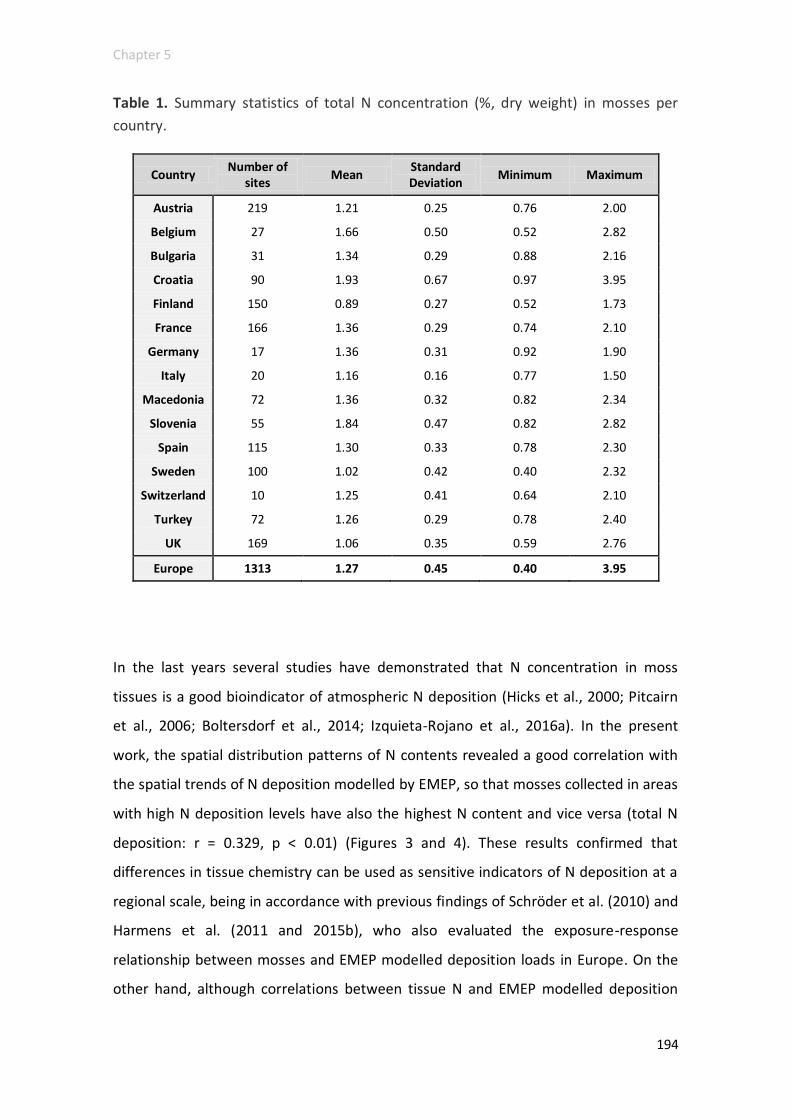
Chapter 5
194
Table 1. Summary statistics of total N concentration (%, dry weight) in mosses per
country.
Country Number of
sites Mean
Standard Deviation
Minimum Maximum
Austria 219 1.21 0.25 0.76 2.00
Belgium 27 1.66 0.50 0.52 2.82
Bulgaria 31 1.34 0.29 0.88 2.16
Croatia 90 1.93 0.67 0.97 3.95
Finland 150 0.89 0.27 0.52 1.73
France 166 1.36 0.29 0.74 2.10
Germany 17 1.36 0.31 0.92 1.90
Italy 20 1.16 0.16 0.77 1.50
Macedonia 72 1.36 0.32 0.82 2.34
Slovenia 55 1.84 0.47 0.82 2.82
Spain 115 1.30 0.33 0.78 2.30
Sweden 100 1.02 0.42 0.40 2.32
Switzerland 10 1.25 0.41 0.64 2.10
Turkey 72 1.26 0.29 0.78 2.40
UK 169 1.06 0.35 0.59 2.76
Europe 1313 1.27 0.45 0.40 3.95
In the last years several studies have demonstrated that N concentration in moss
tissues is a good bioindicator of atmospheric N deposition (Hicks et al., 2000; Pitcairn
et al., 2006; Boltersdorf et al., 2014; Izquieta-Rojano et al., 2016a). In the present
work, the spatial distribution patterns of N contents revealed a good correlation with
the spatial trends of N deposition modelled by EMEP, so that mosses collected in areas
with high N deposition levels have also the highest N content and vice versa (total N
deposition: r = 0.329, p < 0.01) (Figures 3 and 4). These results confirmed that
differences in tissue chemistry can be used as sensitive indicators of N deposition at a
regional scale, being in accordance with previous findings of Schröder et al. (2010) and
Harmens et al. (2011 and 2015b), who also evaluated the exposure-response
relationship between mosses and EMEP modelled deposition loads in Europe. On the
other hand, although correlations between tissue N and EMEP modelled deposition

Stable isotopes (15N and 13C) in mosses from Europe
195
values were highly significant, regression models showed considerable scatter and the
coefficient of determination was moderate (Figure 4). Harmens et al. (2015b) also
found the same behaviour when plotting [N] in mosses with EMEP deposition loads.
These authors observed that after disregarding grid cells where only one to three moss
samples were taken, the scatter was significantly improved. Therefore, the observed
scatter in this work might be probably related to an insufficient sample size for some
of the EMEP cells studied, which suggests further investigations considering only those
cells with a suitable number of sampling sites.
Regarding predominant land uses, the content of N in mosses was positively correlated
with the percentage of agricultural areas (r = 0.494, p < 0.01) and negatively associated
with the presence of forests (r = -0.176, p < 0.01) and wetlands (r = -0.543, p < 0.01)
(Figure 5). Other investigations showed similar relationships, indicating that agriculture
is one of the main drivers explaining variation of N concentrations in mosses (Pesch et
al., 2008; Schöder et al., 2010; Boltersdorf et al., 2013). Additionally, the narrow
association between wetlands and low N values in mosses might be expected, since
the highest percentages of these areas are located in northern countries, where the
lowest N deposition loads were estimated. Besides, although significant, the
relationship between forested areas and [N] was less pronounced. This might be
explained by differences in deposition loads to which forested areas are subjected.
According to Figure 5, two well-differentiated regions where the percentage of
forested coverage was above 50-60% were highlighted, one in Finland and Sweden,
and the other one in Austria and Slovenia. Whereas forests from the northern
countries received the lowest N deposition loads, some forested areas from central
Europe did not follow this trend, registering much higher tissue [N] according to EMEP
modelled fluxes (Figure 3). Nevertheless, there are other site-specific factors that may
also contribute to variations in N concentrations in mosses. It has been demonstrated
that mosses collected under the influence of the canopy drip are usually more N
enriched (Leith et al., 2008; Skudnik et al., 2015; Meyer et al., 2015).

Chapter 5
196
Figure 3. Total nitrogen deposition (mg N m-2 y-1) of reduced and oxidized compounds in 2005 as modelled by EMEP.

Stable isotopes (15N and 13C) in mosses from Europe
197
Figure 4. Regression analyses between EMEP modelled N deposition for 2005 and averaged N concentrations in mosses per EMEP grid cell.
y = 0,1823x0,3038 R² = 0,3586
0
1
2
3
4
0 500 1000 1500 2000
Tiss
ue
N (
%)
Total Wet N deposition (mg N m-2 y-1)
y = 0,2804x0,2595 R² = 0,35
0
1
2
3
4
0 500 1000 1500
Tiss
ue
N (
%)
NHy Wet Deposition (mg N m-2 y-1)
y = 0,1782x0,3538 R² = 0,3483
0
1
2
3
4
0 200 400 600
Tiss
ue
N (
%)
NOx Wet Deposition (mg N m-2 y-1)
y = 0,2721x0,2512 R² = 0,346
0
1
2
3
4
0 500 1000 1500
Tiss
ue
N (
%)
Total Dry N Deposition (mg N m-2 y-1)
y = 0,5441x0,1558 R² = 0,3038
0
1
2
3
4
0 200 400 600 800 1000 Ti
ssu
e N
(%
)
NHy Dry Deposition (mg N m-2 y-1)
y = 0,2291x0,3149 R² = 0,3311
0
1
2
3
4
0 200 400 600
Tiss
ue
N (
%)
NOx Dry Deposition (mg N m-2 y-1)
y = 0,1475x0,31 R² = 0,3912
0
1
2
3
4
0 500 1000 1500 2000 2500
Tiss
ue
N (
%)
Total N Deposition (wet + dry) (mg N m-2 y-1)
y = 0,2845x0,2364 R² = 0,3578
0
1
2
3
4
0 500 1000 1500 2000
Tiss
ue
N (
%)
Total NHy Deposition (mg N m-2 y-1)
y = 0,1208x0,3814 R² = 0,3907
0
1
2
3
4
0 200 400 600 800 1000
Tiss
ue
N (
%)
Total NOx Depostion (mg N m-2 y-1)

Chapter 5
198
Figure 5. Percentage of selected CLC 2006 coverages (agriculture, forests and wetlands) per EMEP grid cell.

Stable isotopes (15N and 13C) in mosses from Europe
199
In forested areas of central and southern Europe, where temperature and moisture
conditions highly differ from those of northern countries (Jones et al., 2004), it is
difficult to find suitable moss sampling sites far from the influence of the tree canopies
(Gerdol et al., 2000; Spiric et al., 2012), which might result in higher tissue N. Indeed,
results of the 2010/2011 moss survey showed a clear decline in [N] of mosses from
Slovenia mainly due to a higher effort in the sampling works rather to a truly decline in
the N deposition fluxes in those areas (Harmens et al., 2015b).
Similarly, altitude, precipitation, moss species selection, or proximity to local pollution
sources have been proven to influence moss tissue N (Hicks et al., 2000; Arróniz-
Crespo et al., 2008; Schöder et al., 2010; Harmens et al., 2011). In this respect15N
signatures have been proposed as bioindicators of N sources in the environment,
providing additional and valuable information to that obtained from elemental
analyses (Skinner et al., 2006; Zechmeister et al., 2008, Izquieta-Rojano et al., 2016a).
However, to date, their utility at a European scale has still not been validated.
The results of stable isotope signatures revealed that the European mean 15N value
was -4.85‰, ranging from -10.35 to 6.60‰ (Table 2). Spatially, mosses from eastern
countries, northern UK, Finland, Sweden and Galicia (western Spain) showed the
highest 15N values, whereas countries in the central belt of Europe were more
depleted in the 15N isotope (Figure 6). Regarding correlation relationships, 15N
signatures were negatively related to NHy/NOx deposition ratios (wet deposition ratios:
r = -0.465, p < 0.01; dry deposition ratios: r = -0.422, p < 0.01; Figures 7 and 8), the
proportion of agricultural lands (r = -0.496, p < 0.01; Figures 5 and 8) and to
atmospheric NH3 (r = -0.364, p < 0.01) (Figure 8).
Considering that mosses take almost all N from the atmosphere, 15N signatures of
moss shoots are assumed to be a reflection of the isotopic signatures of atmospheric
compounds (Xiao et al., 2010). On this basis, several studies have been associated the
more negative 15N values to predominant NH3/NH4 inputs, whereas slightly negative
to positive ones have been linked to NOx fluxes. In other words, the higher the share of
NH4 as nitrogen source for mosses, the more negative their 15N values, and the
opposite when the oxidized species are the dominant N sources (Pearson et al., 2000;

Chapter 5
200
Stewart et al., 2002; Solga et al., 2005 and 2006; Boltersdorf et al., 2014; Gerdol et al.,
2014). Additionally, in many of these studies NHy/NOx ratios in deposition budgets are
calculated to evaluate the influence of the different N compounds on the N stable
isotopes. The spatial distribution of 15N signatures and the bivariate correlation
coefficients found in this study were totally in accordance with these authors,
suggesting a clear association between 15N depletion in moss tissues and the
dominance of reduced N species in deposition, and 15N enrichment in mosses exposed
to proportionally greater NOx loads. Therefore, these data confirmed that 15N isotopic
signatures might be used in the attribution of N sources in biomonitoring surveys of
atmospheric pollution at the European scale.
Table 2. Summary statistics of 15N isotopic signatures (‰, dry weight) in mosses per
country.
Country Number of
sites Mean
Standard Deviation
Minimum Maximum
Austria 219 -6.04 1.28 -10.01 -2.45
Belgium 27 -4.21 4.26 -8.72 6.60
Bulgaria 31 -4.69 1.17 -8.71 -2.14
Croatia 90 -5.34 1.70 -9.18 1.63
Finland 150 -3.69 1.04 -6.69 -1.17
France 166 -6.00 1.33 -9.05 -2.10
Germany 17 -3.65 1.13 -6.17 -1.57
Italy 20 -5.62 0.83 -7.36 -3.96
Macedonia 72 -3.47 1.36 -6.03 -0.38
Slovenia 55 -6.15 1.20 -9.75 -3.70
Spain 115 -3.92 1.87 -7.25 1.85
Sweden 100 -4.17 1.50 -8.09 0.17
Switzerland 10 -6.75 1.90 -10.35 -4.80
Turkey 72 -4.43 1.64 -8.32 0.81
UK 169 -4.54 1.76 -8.89 3.64
Europe 1313 -4.85 1.92 -10.35 6.60
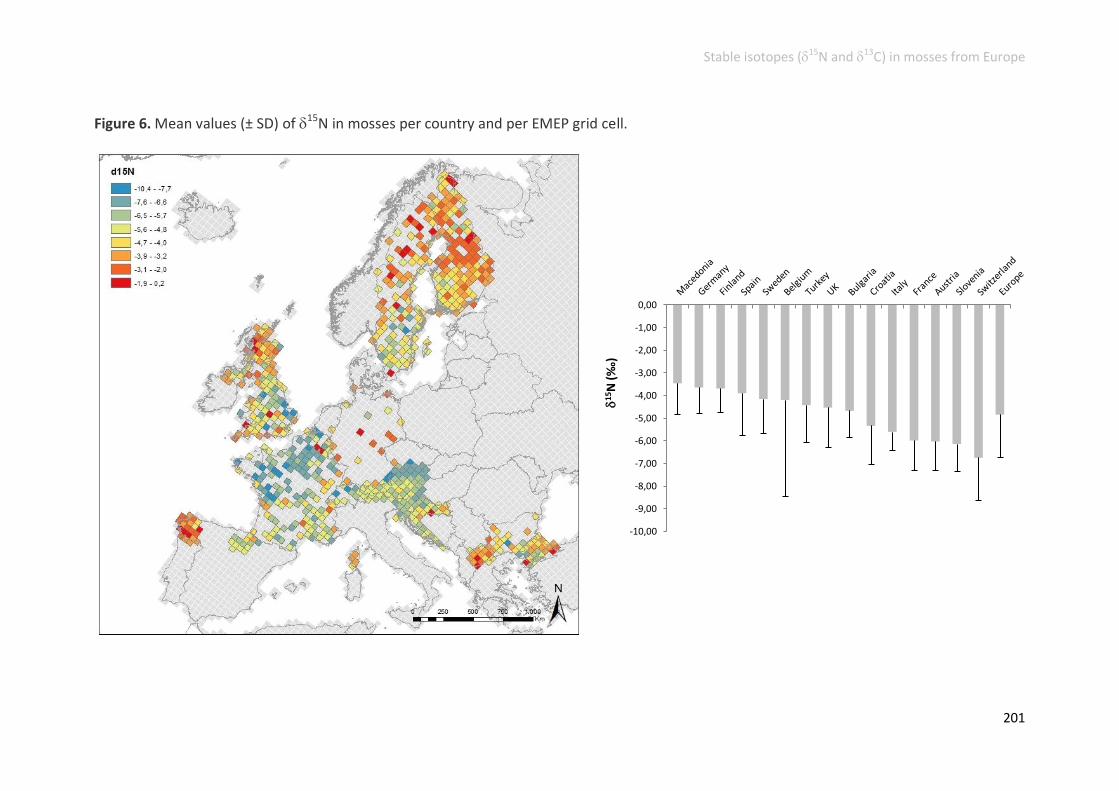
Stable isotopes (15N and 13C) in mosses from Europe
201
Figure 6. Mean values (± SD) of 15N in mosses per country and per EMEP grid cell.
-10,00
-9,00
-8,00
-7,00
-6,00
-5,00
-4,00
-3,00
-2,00
-1,00
0,00
1
5 N (
‰)

Chapter 5
202
Figure 7. Modelled spatial distribution of NHy/NOx ratios in total/wet/dry deposition per EMEP grid cell.

Stable isotopes (15N and 13C) in mosses from Europe
203
Figure 8. Regression analyses between 15N signatures and some of the evaluated predictors per EMEP grid cell.
y = -0,0027x - 3,4988 R² = 0,271
-12
-10
-8
-6
-4
-2
0
2
0 500 1000 1500 2000
15
N (‰
) Total NHy deposition (mg N m-2 y-1)
y = -0,0035x - 3,3588 R² = 0,1511 -12
-10
-8
-6
-4
-2
0
2
0 200 400 600 800 1000
15
N (‰
)
Total NOx deposition (mg N m-2 y-1)
y = -0,0018x - 3,2092 R² = 0,2554 -12
-10
-8
-6
-4
-2
0
2
0 500 1000 1500 2000 2500
15
N (‰
)
Total N deposition (mg N m-2 y-1)
y = -2,564ln(x) - 4,3881 R² = 0,2254
-12
-10
-8
-6
-4
-2
0
2
0 1 2 3 4
15
N (‰
)
Ratio Wet NHy/NOx
y = -0,881ln(x) - 5,1036 R² = 0,1841
-12
-10
-8
-6
-4
-2
0
2
0 2 4 6 8
15
N (‰
)
Ratio Dry NHy/NOx
y = -1,627ln(x) - 4,8208 R² = 0,2057
-12
-10
-8
-6
-4
-2
0
2
0 1 2 3 4 5
15
N (‰
)
Ratio Total NHy/NOx
y = -0,0004x - 4,3268 R² = 0,1322
-12
-10
-8
-6
-4
-2
0
2
0 2000 4000 6000 8000 10000
15
N (‰
)
Atmospheric NH3 (Mg)
y = -0,0297x - 3,8199 R² = 0,2462
-12
-10
-8
-6
-4
-2
0
2
0 20 40 60 80 100
15
N (‰
)
Agriculture (%)
y = 0,0383x - 6,3786 R² = 0,1317
-12
-10
-8
-6
-4
-2
0
2
0 50 100 150
15
N (‰
)
C:N ratio

Chapter 5
204
Nevertheless, it is noteworthy to mention that, whereas the most 15N depleted
signatures were clearly related to agricultural lands and high N deposition loads of
reduced compounds in central Europe, in the case of slightly negative or positive
signatures the association with NOx fluxes was less apparent. In fact, a deeper
evaluation of spatial distribution patterns allowed us to identify two well-
differentiated situations where 15N signatures showed 15N enrichment. On the one
hand, mosses from eastern countries (Macedonia, Turkia), Germany and Galicia were
subjected to high N deposition fluxes, including high loads of NOx compounds, and
showed high tissue N concentrations. It is well-known that Germany develops an
important industrial activity, and also Galicia has considerable industrial centers
(Varela et al., 2013). Indeed, nor Germany neither Spain met their emission ceilings in
2010 for NOx (EEA 2014). Moreover, eastern countries have experienced high NOx
emissions because of a late industrial development and less strict application of
regulation policies (Vestreng et al., 2009; Gaigalis and Skema 2015). Therefore, the less
negative 15N signatures observed in these countries seem to respond to the presence
of important NOx fluxes, according to the aforementioned premises. On the contrary,
although equally 15N enriched, mosses from northern UK, Finland and Sweden, were
exposed to the lowest N deposition loads in Europe and registered the lowest N
contents. In this case, the less negative 15N signatures might be a sign of N-limitation
in these ecosystems (Mckee et al., 2002; Clarkson et al., 2005; Hyodo et al., 2013). This
hypothesis was supported by the C:N results (Gerdol et al., 2007; Munzi et al., 2013),
which were positive related to 15N signatures (r = 0.339, p < 0.01; Figure 8), and
extremely elevated in those areas of northern Europe (Figure 10).
In addition, a significantly negative correlation between 15N signatures and tissue N
content was found, which indicated an important role of reduced nitrogenous species
on N accumulation in mosses. This finding agreed with Pitcairn et al. (2006), Solga and
Frahm (2006) or Liu et al. (2013), who concluded that N concentrations in moss tissues
better respond to NHy exposure, thus providing especially good indication of this kind
of atmospheric pollution. In this respect, our data also revealed a significant
relationship between 15N and C (r = 0.233, p < 0.01) and 13C (r = -0.187, p < 0.01).
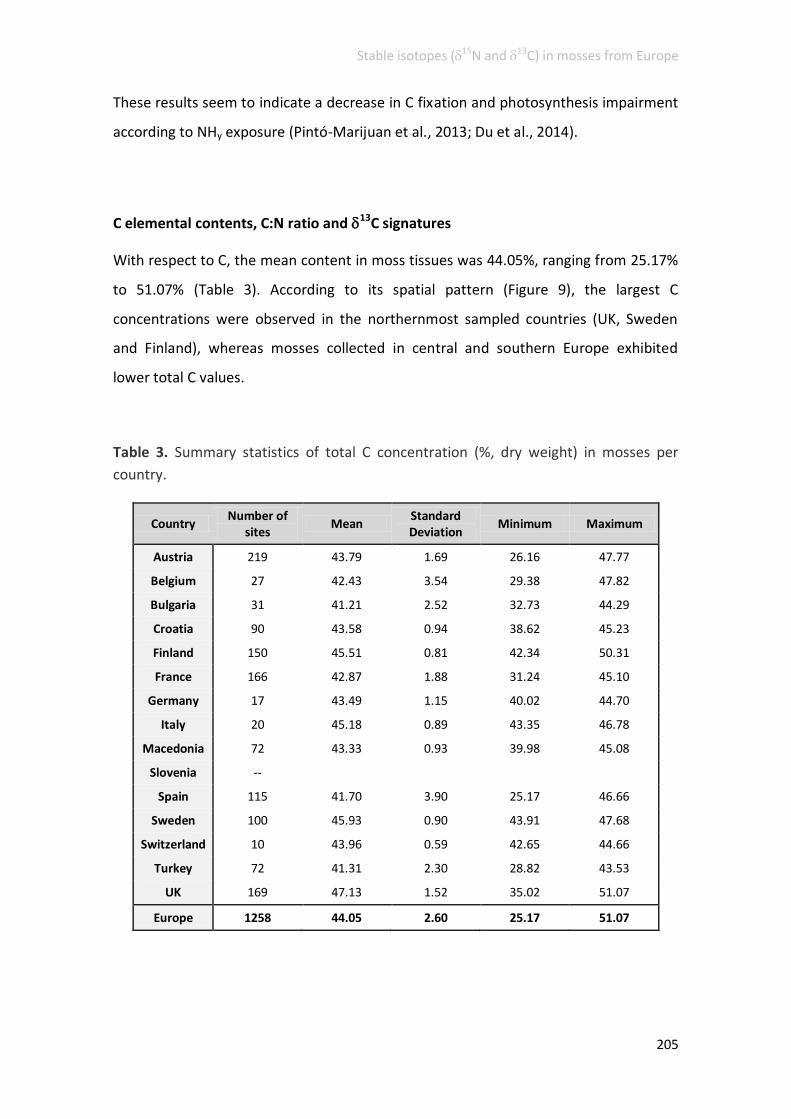
Stable isotopes (15N and 13C) in mosses from Europe
205
These results seem to indicate a decrease in C fixation and photosynthesis impairment
according to NHy exposure (Pintó-Marijuan et al., 2013; Du et al., 2014).
C elemental contents, C:N ratio and 13C signatures
With respect to C, the mean content in moss tissues was 44.05%, ranging from 25.17%
to 51.07% (Table 3). According to its spatial pattern (Figure 9), the largest C
concentrations were observed in the northernmost sampled countries (UK, Sweden
and Finland), whereas mosses collected in central and southern Europe exhibited
lower total C values.
Table 3. Summary statistics of total C concentration (%, dry weight) in mosses per
country.
Country Number of
sites Mean
Standard Deviation
Minimum Maximum
Austria 219 43.79 1.69 26.16 47.77
Belgium 27 42.43 3.54 29.38 47.82
Bulgaria 31 41.21 2.52 32.73 44.29
Croatia 90 43.58 0.94 38.62 45.23
Finland 150 45.51 0.81 42.34 50.31
France 166 42.87 1.88 31.24 45.10
Germany 17 43.49 1.15 40.02 44.70
Italy 20 45.18 0.89 43.35 46.78
Macedonia 72 43.33 0.93 39.98 45.08
Slovenia --
Spain 115 41.70 3.90 25.17 46.66
Sweden 100 45.93 0.90 43.91 47.68
Switzerland 10 43.96 0.59 42.65 44.66
Turkey 72 41.31 2.30 28.82 43.53
UK 169 47.13 1.52 35.02 51.07
Europe 1258 44.05 2.60 25.17 51.07

Chapter 5
206
Figure 9. Mean concentration (± SD) of C in mosses per country and per EMEP grid cell.
36,00
38,00
40,00
42,00
44,00
46,00
48,00
50,00
C (
%)

Stable isotopes (15N and 13C) in mosses from Europe
207
Considering correlation analyses, data showed a significantly negative relationship
between C concentrations in mosses and the N content (r = -0.480, p < 0.01), the
percentage of agricultural land per EMEP cell (r = -0.310, p < 0.01), as well as the total
deposition NHy/NOx ratios (r = -0.503, p < 0.01). These results were in line with those
from 15N signatures, and suggested harmful effects of N reduced compounds on C
fixation. To throw light on this respect the C:N ratio was explored, since changes in the
tissue stoichiometry have been linked to N pollution related impacts (Carfrae et al.,
2007; Arróniz-Crespo et al., 2008; Du et al., 2014).
In order to counterbalance the toxic action of NHy compounds, plants have developed
several mechanisms that operate at different levels. However, when the foliar uptake
of NHy exceeds the assimilation capacity, N begins to accumulate in the tissues,
causing adverse effects (Krupa 2003; Bittsánszky et al., 2015). A mean of detoxification
is N storage into organic compounds, such as amino acids (Krupa 2003; Paulissen et al.,
2005). This mechanism to reduce NHy cytosolic toxicity requires C skeletons (Koranda
et al., 2007). However, when the photosynthetic machinery is affected, C fixation is not
accurately performed, leading to decreasing C:N ratios and increasing stress levels
because of N accumulation (Munzi et al., 2013 and 2014).
The results of C:N ratios showed a European mean of 38.13, ranging from 11.15 to
118.21 (Table 4). Spatially, the highest ratios were found in Sweden, Finland and UK,
following a north-south gradient similar to that observed for tissue N concentrations.
On the contrary, the lowest C:N values were registered in central Europe, especially in
Belgium, Croatia and France, but also locally in southern UK, southern Sweden and in
the eastern countries (Figure 10). These patterns totally agreed with those found for
EMEP modeled N depositon (Figure 3). Statistical correlations and regression analyses
confirmed these findings, showing a significantly negative relationship between C:N
ratios and EMEP modeled N depositon (r = -0.597, p < 0.01) and N contents in mosses
(r = -0.980, p < 0.01) (Figure 11).
These data indicated that in N enriched areas there exists a lack of compensation for
elevated N uptake in mosses with higher C assimilation rates, which suggests an N-
induced deleterious effect on the photosynthetic machinery of the species growing in

Chapter 5
208
those locations. Indeed, according to regression analysis (Figure 11), mosses with
tissue N contents above ~1.1 – 1.2% might be suffering some kind of change to its
physiological functioning due to enhanced N deposition. Therefore, C:N ratios showed
a great potential to identify areas at risk because of atmospheric N pollution across
Europe.
Table 4. Summary statistics of C:N ratios in mosses per country.
Country Number of
sites Mean
Standard Deviation
Minimum Maximum
Austria 219 37.79 8.14 21.15 58.85
Belgium 27 27.28 7.34 15.81 46.34
Bulgaria 31 32.10 7.28 17.66 49.74
Croatia 90 25.29 8.48 11.15 44.81
Finland 150 55.70 15.85 25.51 88.10
France 166 33.15 7.49 21.20 55.34
Germany 17 33.82 8.53 22.94 47.91
Italy 20 39.70 6.17 30.21 57.96
Macedonia 72 33.59 7.96 18.71 53.43
Slovenia --
Spain 115 34.29 9.22 17.42 57.95
Sweden 100 52.37 20.24 19.10 118.21
Switzerland 10 38.76 13.51 20.30 69.79
Turkey 72 34.26 7.47 17.46 53.85
UK 169 47.96 11.13 15.80 69.78
Europe 1258 38.13 14.41 11.15 118.21
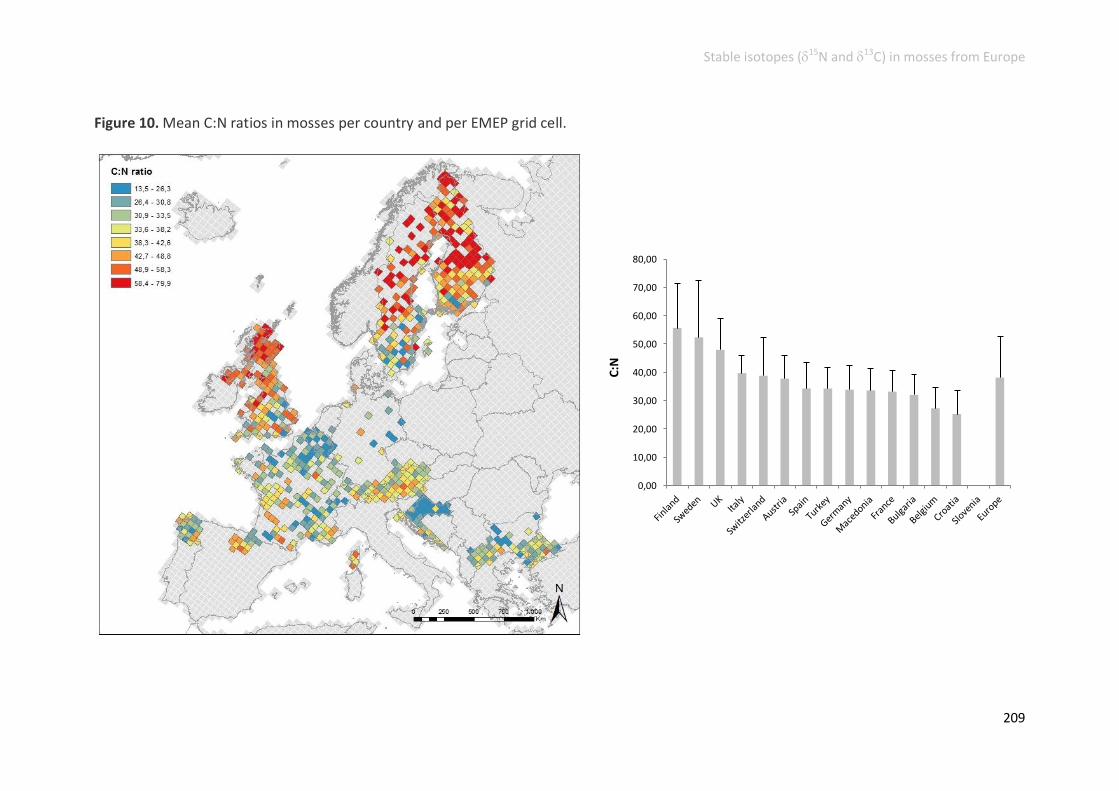
Stable isotopes (15N and 13C) in mosses from Europe
209
Figure 10. Mean C:N ratios in mosses per country and per EMEP grid cell.
0,00
10,00
20,00
30,00
40,00
50,00
60,00
70,00
80,00
C:N
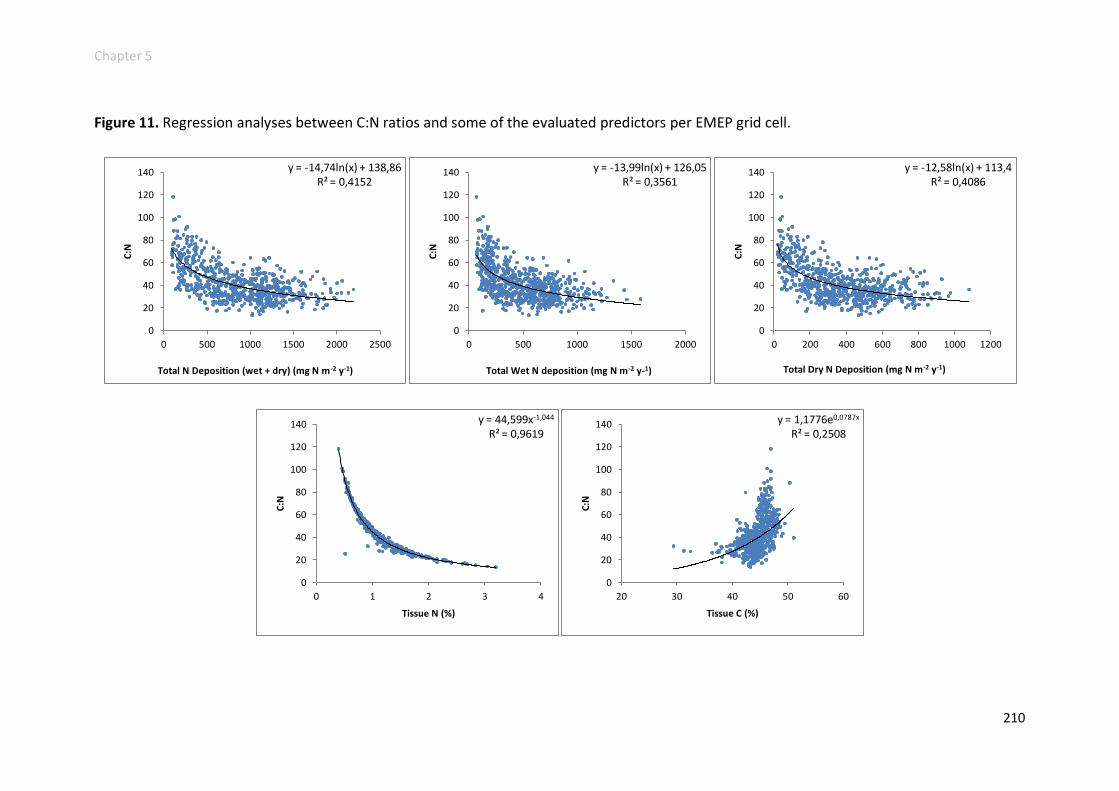
Chapter 5
210
Figure 11. Regression analyses between C:N ratios and some of the evaluated predictors per EMEP grid cell.
y = -14,74ln(x) + 138,86 R² = 0,4152
0
20
40
60
80
100
120
140
0 500 1000 1500 2000 2500
C:N
Total N Deposition (wet + dry) (mg N m-2 y-1)
y = -13,99ln(x) + 126,05 R² = 0,3561
0
20
40
60
80
100
120
140
0 500 1000 1500 2000
C:N
Total Wet N deposition (mg N m-2 y-1)
y = -12,58ln(x) + 113,4 R² = 0,4086
0
20
40
60
80
100
120
140
0 200 400 600 800 1000 1200
C:N
Total Dry N Deposition (mg N m-2 y-1)
y = 44,599x-1,044 R² = 0,9619
0
20
40
60
80
100
120
140
0 1 2 3 4
C:N
Tissue N (%)
y = 1,1776e0,0787x R² = 0,2508
0
20
40
60
80
100
120
140
20 30 40 50 60 C
:N
Tissue C (%)
Stable isotopes (15N and 13C) in mosses from Europe
211
Turning to tissue C results, the observed spatial distribution pattern was coincident
with that of topsoil organic C contents in Europe (Jones et al., 2005; de Brogniez et al.,
2014 and 2015), suggesting an influence of substrate on moss tissue chemistry. In this
way, although mosses obtain almost all their nutrients from the atmosphere, some
authors have reported that mosses are able to uptake carbon from the humus layer
(Rousk et al., 2013). Moreover, several authors have also demonstrated that the
bryosphere, existing within the boundary layer next to the ground, can capture an
estimated 10-36% of total forest floor CO2 efflux from decomposition and
heterotrophic soil respiration (Morén and Lindroth 2000; Swanson and Flanagan 2001;
DeLucia et al., 2003; Botting and Freeden 2006; Lindo and González, 2010). In
consequence, both processes could be acting together to increase the content of C in
mosses, being an extra C supply to that of atmospheric sources.
Additionally to elemental measurements, and similarly to 15N signatures, carbon
stable isotopes might play a key role in the attribution of C sources and also in the
identification of the main environmental factors influencing C fixation in mosses. The
13C/12C isotopic ratio of atmospheric CO2 has been proven to be dependent on its
origin, which has been utilized to trace potential CO2 emission sources in pollution
surveys (Townsend-Small et al., 2012; Lopez et al., 2013; Popa et al., 2014). Equally,
13C signatures of particulate matter have been found to be highly helpful in
elucidating carbonaceous aerosol sources (Cao et al., 2011; Gorka et al., 2014;
Masalaite et al., 2015; Guo et al., 2016; Pang et al., 2016). Results from these surveys
revealed a gradient in the 13C signatures, being more 13C enriched when predominant
emission sources are related to coal combustion (solid), and more 13C depleted (more
negative 13C values) when natural gas or methane is the predominant source (gas).
Intermediate values were described when there is a stronger influence of liquid fuel
use (gasoline or diesel) in the CO2 / particulate emissions. Despite this fact, there is a
few number of works that investigate 13C signatures in plants to evaluate their use as
potential bioindicators of pollution emission sources in monitoring surveys (Gleason
and Kyser, 1984; Lichtfouse et al., 2003; Norra et al., 2005; Liu et al., 2008b and 2010).
On the other hand, several authors have also reported that C isotopes can reflect the
variations of environmental factors, such as temperature, water availability or altitude
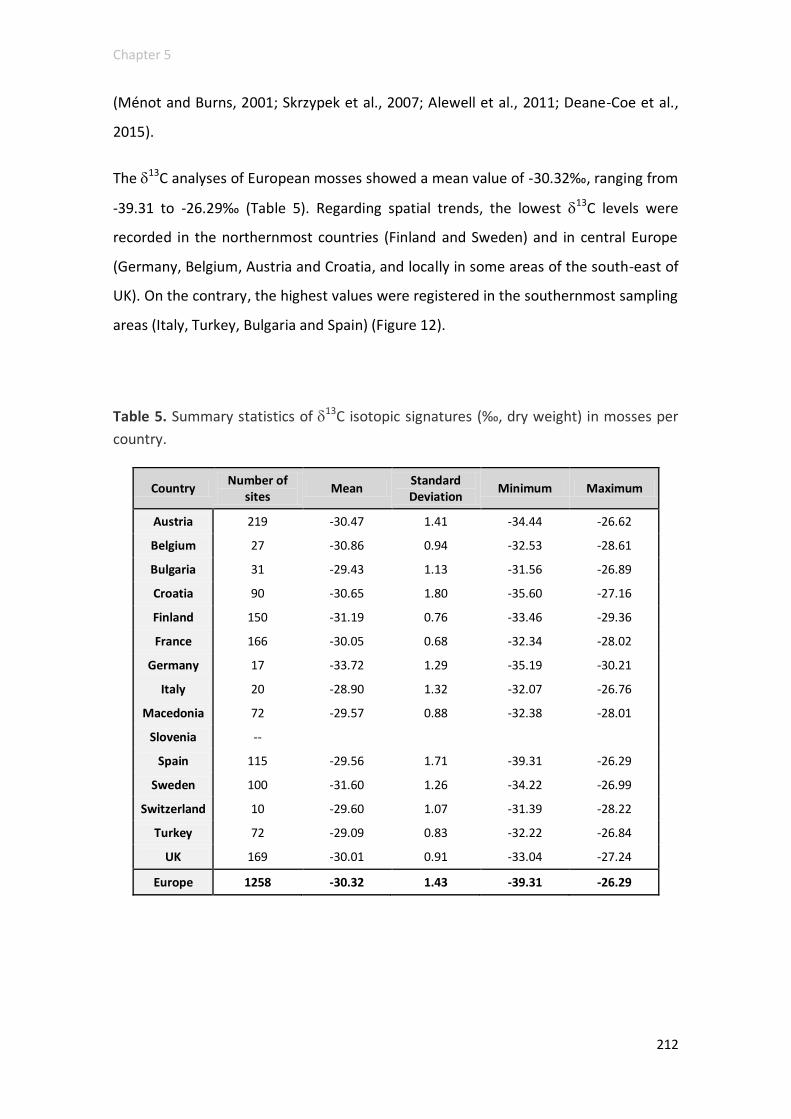
Chapter 5
212
(Ménot and Burns, 2001; Skrzypek et al., 2007; Alewell et al., 2011; Deane-Coe et al.,
2015).
The 13C analyses of European mosses showed a mean value of -30.32‰, ranging from
-39.31 to -26.29‰ (Table 5). Regarding spatial trends, the lowest 13C levels were
recorded in the northernmost countries (Finland and Sweden) and in central Europe
(Germany, Belgium, Austria and Croatia, and locally in some areas of the south-east of
UK). On the contrary, the highest values were registered in the southernmost sampling
areas (Italy, Turkey, Bulgaria and Spain) (Figure 12).
Table 5. Summary statistics of 13C isotopic signatures (‰, dry weight) in mosses per
country.
Country Number of
sites Mean
Standard Deviation
Minimum Maximum
Austria 219 -30.47 1.41 -34.44 -26.62
Belgium 27 -30.86 0.94 -32.53 -28.61
Bulgaria 31 -29.43 1.13 -31.56 -26.89
Croatia 90 -30.65 1.80 -35.60 -27.16
Finland 150 -31.19 0.76 -33.46 -29.36
France 166 -30.05 0.68 -32.34 -28.02
Germany 17 -33.72 1.29 -35.19 -30.21
Italy 20 -28.90 1.32 -32.07 -26.76
Macedonia 72 -29.57 0.88 -32.38 -28.01
Slovenia --
Spain 115 -29.56 1.71 -39.31 -26.29
Sweden 100 -31.60 1.26 -34.22 -26.99
Switzerland 10 -29.60 1.07 -31.39 -28.22
Turkey 72 -29.09 0.83 -32.22 -26.84
UK 169 -30.01 0.91 -33.04 -27.24
Europe 1258 -30.32 1.43 -39.31 -26.29

Stable isotopes (15N and 13C) in mosses from Europe
213
Figure 12. Mean values (± SD) of 13C in mosses per country and per EMEP grid cell.
-40,00
-35,00
-30,00
-25,00
-20,00
-15,00
-10,00
-5,00
0,00
1
3 C (
‰)

Chapter 5
214
The spatial distribution of 13C in central and eastern Europe was coincident with the
highest NOx deposition loads modeled by EMEP (Figure 3) in a such manner that the
lowest 13C values were registered in those areas receiving the most elevated fluxes of
oxidized compounds. Moreover, correlation analyses highlighted a positive association
between 13C signatures and atmospheric NHy/NOx ratios (r = 0.315, p < 0.01). Since
NOx atmospheric release is usually coupled with other gaseous emissions (Isaksen et
al., 2009; Gaffney and Marley, 2009), it can be expected that anthropogenic CO2
concentrations are also increased at those locations, which would be ultimately
reflected in the more negative 13C values of mosses. These results are in line with
those from Liu et al., (2008b and 2010) and Lichtfouse et al. (2003), who observed
lower 13C signatures in mosses from urban areas in comparison of those from rural
locations. Indeed, Pataki et al. (2007) demonstrated that 13C signatures of
atmospheric CO2 decreased along a rural to urban gradient. On the other hand, the
13C values in urban areas of China ranged approximately between -29.5 and -31‰
(Liu et al., 2008b and 2010), which are higher than the values recorded in some areas
of Germany or Croatia, where mosses reached values above -32‰ (Table 5, Figure 12),
being in range with those from Lichtfouse et al. (2003) in grasses collected in Paris. The
lower 13C values in those European sites might be explained by a greater proportion
of CO2 coming from the combustion of natural gas, since this source originates more
13C depleted CO2 (up to -41‰; Pang et al., 2016). In fact, Zondervan and Meijen (1996)
in The Netherlands or Lopez et al. (2013) in Paris determined that natural gas
combustion can contribute in more than 50% to total fossil fuel CO2 exhaust in these
areas. Hence, according to our findings, C stable isotopes might be a good marker of
anthropogenic CO2 in polluted areas.
On the contrary, following the above premises, the less negative 13C values found in
the other countries of central Europe and UK would respond to a lesser sequestration
of anthropogenic CO2 by mosses, which is in accordance to the lower NOx deposition
loads registered in those areas. Moreover, the ‘Moss Survey Protocol’
(http://icpvegetation.ceh.ac.uk/manuals/moss_survey.html) establish that samples are
collected in sites far from the influence of pollution sources. Therefore, 13C values
between ~-29.5 and -30.5‰ in this survey might be indicative of background areas. In

Stable isotopes (15N and 13C) in mosses from Europe
215
this respect, our values are in range with those from Lichtfouse et al. (2003), who
analyzed 13C signatures in grasses in a rural area in France. Additionally, a recent
survey carried out in northern Spain showed similar values of 13C isotopic ratios in a
background area (-29.4 ± 0.41‰; Izquieta-Rojano et al., 2016b).
The Nordic countries also registered low values of 13C signatures, although their
circumstances regarding atmospheric emissions are quite different to those from
central and eastern Europe (Figure 3). Thus, the observed 13C/12C ratios are probably
related to site-specific conditions rather than to atmospheric pollution. In this kind of
forests, feather mosses, sphagnum and pleurocarpous carpet-forming species are
widespread, being a key piece in the CO2 and water-exchange processes between the
terrestrial biosphere and the atmosphere (Williams and Flanagan, 1996). In fact, it has
been proven that at this type of boreal and sub-boreal ecosystems a significant portion
of the soil-respired CO2 can be assimilated by the understory moss layer, as explained
before (Morén and Lindroth, 2000; Swanson and Flanagan, 2001; Botting and Freeden,
2006). Therefore, the 13C signatures found at these locations might be indicative of
the soil-mosses interactions. In this regard, Flanagan et al. (1999) found a progressive
enrichment of 13C with depth in a moss/soil profile, being green mosses the most 13C
depleted (-31‰) in the surface area. Similarly, Clymo and Bryant (2008) showed that
dissolved gases in soil (CO2 and CH4) are more depleted nearer the surface than in
deeper zones, with a difference of more than 20‰. This pattern might occur as a
consequence of a preferential release of 12C during aerobic mineralization of soil
organic matter, which is more likely to occur in the first centimeters of the soil profile
(Bowling et al., 2002 and 2008; Alewell et al., 2011). Moreover, roots and microbial
respiration can also modify 13C signatures of total soil effux (Ehleringer et al., 2000;
Kuzyakov 2006). On the other hand, Scartazza et al. (2004) studied different ecosystem
compartments, from soil to leaves from the upper layer, and observed that whereas
soil 13C was the most 13C enriched, both buds and leaves from the bottom layer were
the most 13C depleted. According to these findings, it seems probable that lower 13C
signatures in mosses from Finland and Sweden might be reflecting 13C depleted
gaseous fluxes from soil.

Chapter 5
216
In any case, the considerably lower 13C signatures registered in the present survey at
some areas in the northern countries when comparing to other values from boreal
forests (-31‰; Flanagan et al., 1999) suggested that a more 13C depleted source might
be also influencing the C isotopic signatures of mosses at those locations. Although
forested areas constitute the predominant land use in these latitudes, wetlands and
peat bogs also accounts for a significant percentage. Indeed, the highest percentage of
wetlands and peat bogs in Europe are located in the Nordic countries (CLC 2006). This
type of ecosystems is among the most important natural sources of CH4 in the
atmosphere (Clymo and Bryant, 2008; Schaefer et al., 2016). In this context, mosses
growing in peatlands have shown the ability to utilize CH4 as a supplementary C source
(Raghoebarsing et al., 2005), which is known to have a 13C signature much negative
than that of atmospheric CO2 (13CCH4 ~-60 - -70‰; Chasar et al., 2000; Sriskantharajah
et al., 2012). Thus, the most 13C depleted signatures might be a sign of CH4 assimilation
by mosses in these environments.
At the other end, the highest 13C signatures in mosses were found in the
southernmost areas. Although N deposition was similarly low to Nordic countries,
climatic conditions highly differ, turning warmer and drier towards the south (Jones et
al., 2004). Several authors have investigated the influence of environmental conditions
on the 13C signatures of different environmental compartments (Ekblad et al., 2001;
Toet et al., 2006; Skrzypek et al., 2007; Werth and Kuzyakov, 2010; Royles et al., 2014;
Bramley-Alves et al., 2015), concluding that water availability and temperature are
important factors determining C isotopic partitioning. In this respect, it has been
shown that plants growing in dry habitats under hydric stress are more enriched in the
heaviest isotope (13C enriched) (Liu et al., 2007; Pinto et al., 2012). According to these
findings, the higher 13C values observed in southern Europe in this survey might
reflect conditions of lower water availability. Moreover, in dry, harsh environments
like those from the Mediterranean region, contribution of wind-blown soil dust to
mosses elemental contents has been already proved (Bargagli et al., 1995; Izquieta-
Rojano et al., 2016a). In this sense, C isotopic signatures of soil are 13C enriched
(Scartazza et al., 2004; Guo et al., 2016). Therefore, higher 13C values in these areas
might be partly due to the influence of soil particles deposited on mosses surface.

Stable isotopes (15N and 13C) in mosses from Europe
217
Conclusions
This work has evaluated the spatial distribution of N and C elemental contents in
mosses and their 15N and 13C isotopic signatures at the European scale. Moreover,
associations of these parameters to EMEP modeled N fluxes and land uses were also
investigated.
Results from total N concentrations were in accordance to previous surveys performed
in the framework of the ICP-Vegetation programme, showing that central Europe and
the eastern countries are the most affected areas because of N deposition. On the
other hand, 15N signatures were negatively correlated to NHy/NOx ratios, the
percentage of agricultural lands and to atmospheric NH3, which suggested an
association between 15N depletion in moss tissues and the dominance of reduced N
species in deposition, and 15N enrichment in mosses exposed to proportionally greater
NOx loads.
Regarding C contents, the spatial pattern was coincident with that of the underlying
parent material. This tendency seemed to be related to the uptake of CO2 from the
bryosphere, activity that is especially usual in areas like wetlands and peat bogs.
Combined results from total C and N contents highlighted the strong influence of
increasing N deposition loads on tissue stoichiometry, showing a great potential for
using C:N ratios to identify N-related ecological impacts at a regional scale. Besides,
analyses of 13C signatures suggested that more negative values in polluted areas
might reflect anthropogenic CO2 emissions. On the contrary, similar negative values in
non-polluted areas of northern Europe were linked to site-specific soil-mosses
relationships. Southern areas registered the less negative 13C values, which might
reflect drought stress and the presence of soil particles on the mosses surface.
According to these findings, the analysis of stable C and N isotopes in mosses can be
used as a proxy in source attribution studies. Both 13C and 15N signatures give
additional information to the analysis of C and N content in moss tissues, providing
valuable insights about the likely pollution sources of these elements. Furthermore,
both stable isotopes were found highly helpful for identifying key ecological processes.
Chapter 5
218
Acknowledgments
The authors express their gratitude to the analytical staff of the Department of
Chemistry of the University of Navarra for its assistance, and also to all participants of
the ICP-Vegetation programme that collaborate in this work. During this study S.
Izquieta-Rojano was recipient of a research grant from the ‘Asociación de Amigos de la
Universidad de Navarra’ which is kindly acknowledged.
References
Alewell, C., Giesler, R., Klaminder, J., Leifeld, J., Rollog, M., 2011. Stable carbon isotopes as indicators for
environmental change in palsa peats. Biogeosciences 8, 1769-1778.
Arróniz-Crespo, M., Leake, J.R., Horton, P., Phoenix, G.K., 2008. Bryophyte physiological responses to, and recovery from, long-term nitrogen deposition and phosphorus fertilisation in acidic grassland. New Phytologist. 180, 864e874. http://dx.doi.org/10.1111/j.1469-8137.2008.02617.
Bargagli, R., Brown, D.H., Nelli, L., 1995. Metal biomonitoring with mosses - procedures for correcting
for soil contamination. Environmental Pollution 89, 169-175.
Bittsánszky, A., Pilinszky, K., Gyulai, G., Komives, T., 2015. Overcoming ammonium toxicity. Plant Science 231, 184-190.
Boltersdorf, S. and Werner, W., 2013. Source attribution of agriculture-related deposition by using total
nitrogen and N-15 in epiphytic lichen tissue, bark and deposition water samples in Germany. Isotopes in
Environmental and Health Studies 49, 197-218.
Boltersdorf, S.H., Pesch, R., Werner, W., 2014. Comparative use of lichens, mosses and tree bark to
evaluate nitrogen deposition in Germany. Environmental Pollution 189, 43-53.
Botting, R.S. and Fredeen, A.L., 2006. Net ecosystem CO2 exchange for moss and lichen dominated
forest floors of old-growth sub-boreal spruce forests in central British Columbia, Canada. Forest Ecology
and Management 235, 240-251.
Bowling, D., McDowell, N., Bond, B., Law, B., Ehleringer, J., 2002. C-13 content of ecosystem respiration
is linked to precipitation and vapor pressure deficit. Oecologia 131, 113-124.
Bragazza, L., Limpens, J., Gerdol, R., Grosvernier, P., Hajek, M., Hajek, T., Hajkova, P., Hansen, I., Iacumin,
P., Kutnar, L., Rydin, H., Tahvanainen, T., 2005. Nitrogen concentration and 15N signature of
ombrotrophic Sphagnum mosses at different N deposition levels in Europe. Global Change Biology 11,
106-104. doi: 10.1111/j.1365-2486.2004.00886.x
Stable isotopes (15N and 13C) in mosses from Europe
219
Bramley-Alves, J., Wanek, W., French, K., Robinson, S.A., 2015. Moss delta C-13: An accurate proxy for
past water environments in polar regions. Global Change Biology 21, 2454-2464.
Cao, J.C., Chow, J.C., Tao, J., Lee, S., Watson, J.G., Ho, K., Wang, G., Zhu, C., and Han, Y., 2011. Stable
carbon isotopes in aerosols from Chinese cities: Influence of fossil fuels. Atmospheric Environment 45,
1359-1363.
Carfrae JA, Sheppard LJ, Raven JA, Leith ID, Crossley A., 2007. Potassium and phosphorus additions modify the response of Sphagnum capillifolium growing on a Scottish ombrotrophic bog to enhanced nitrogen deposition. Applied Geochemistry, 22, 1111–1121. Chasar, L.S., Chanton, J.P., Glaser, P.H., and Siegel, D.I., 2000. Methane Concentration and Stable Isotope Distribution as Evidence of Rhizospheric Processes: Comparison of a Fen and Bog in the Glacial Lake Agassiz Peatland Complex. Annals of Botany 86, 655-663. doi:10.1006/anbo.2000.1172.
Clarkson, B.R., Schipper, L.A., Moyersoen, B., Silvester, W.B., 2005. Foliar N-15 natural abundance
indicates phosphorus limitation of bog species. Oecologia 144, 550-557.
CLC (CORINE Land Cover) 2006. http://www.eea.europa.eu/data-and-maps/data/corine-land-cover-
2006-raster-3
Clymo, R.S. and Bryant, C.L., 2008. Diffusion and mass flow of dissolved carbon dioxide, methane, and
dissolved organic carbon in a 7-m deep raised peat bog. Geochimica et Cosmochimica Acta 72, 2048-
2066.
Dawson, T.E. and Simonin, K.A., 2011. The roles of stable isotopes in forest hydrology and
biogeochemistry. Forest Hydrology and Biogeochemistry: Synthesis of Past Research and Future
Directions 216, 137-161.
de Brogniez, D., Ballabio, C., van Wesemael, B., Jones, R.J.A., Stevens, A., Montanarella, L., 2014. Topsoil
Organic Carbon Map of Europe. 405.
de Brogniez, D., Ballabio, C., Stevens, A., Jones, R.J.A., Montanarella, L., van Wesemael, B., 2015. A map
of the topsoil organic carbon content of europe generated by a generalized additive model. European
Journal of Soil Science 66, 121-134.
de Lucia, E.H. and Schlesinger, W.H., 2003. Respiratory control of the carbon cycle in a changing
environment: Synthesis and discussion. Ecological Society of America Annual Meeting Abstracts 88, 83
ER.
Deane-Coe, K.K., Mauritz, M., Celis, G., Salmon, V., Crummer, K.G., Natali, S.M., Schuur, E.A.G., 2015.
Experimental warming alters productivity and isotopic signatures of tundra mosses. Ecosystems 18,
1070-1082.
Delgado, V., Ederra, A., Santamaría, J.M., 2013. Nitrogen and carbon contents and 15
N and 13
C signatures in six bryophyte species: Assessment of long-term deposition changes (1980-2010) in Spanish beech forests. Global Change Biology 19, 2221-2228.
Du, E., Liu, X., Fang, J., 2014. Effects of nitrogen additions on biomass, stoichiometry and nutrient pools
of moss Rhytidium rugosum in a boreal forest in northeast China. Environmental Pollution 188, 166-171.
Chapter 5
220
EEA European Environment Agency 2014. EEA Technical report nº10/2014. NEC Directive status report
2013. Reporting by Member States under Directive 2001/81/EC of the European Parliament and of the
Council of 23 October 2001 on national emission ceilings for certain atmospheric pollutants. ISBN 978-
92-9213-462-4; ISSN 1725-2237; DOI: 10.2800/18346.
Ehleringer, J.R., Buchmann, N., Flanagan, L.B., 2000. Carbon isotope ratios in belowground carbon cycle
processes. Ecological Applications 10, 412-422.
Ekblad, A. and Hogberg, P., 2001. Natural abundance of C-13 in CO2 respired from forest soils reveals
speed of link between tree photosynthesis and root respiration. Oecologia 127, 305-308.
EMEP/CEIP 2014. Present state of emissions as used in EMEP models;
http://www.ceip.at/webdab_emepdatabase/emissions_emepmodels/
Erisman, J.W., Sutton, M.A., Galloway, J., Klimont, Z., Winiwarter, W., 2008. How a century of ammonia
synthesis changed the world. Nature Geoscience 1, 636-639.
Erisman JW, Galloway JN, Seitzinger S, Bleeker A, Dise NB, Petrescu AMR, Leach AM, de Vries W. 2013.
Consequences of human modification of the global nitrogen cycle. Philosophical Transactions of the
Royal Society B 368: 20130116. http://dx.doi.org/10.1098/rstb.2013.0116
Fagerli, H. and Aas, W., 2008. Trends of nitrogen in air and precipitation: Model results and observations
at EMEP sites in europe, 1980-2003. Environmental Pollution 154, 448-461.
Fay, P.A., Prober, S.M., Harpole, W.S., Knops, J.M.H., Bakker, J.D., Borer, E.T., Lind, E.M., MacDougall,
A.S., Seabloom, E.W., Wragg, P.D., Adler, P.B., Blumenthal, D.M., Buckley, Y.M., Chu, Chengjin., Cleland,
E.E., Collins, S.L., Davies, K.F., Du, G., Feng X., Firn, J., Gruner, D.S., Hagenah, N., Hautier, Y., Heckman,
R.W., Jin, V.L.., Kirkman, K.P., Klein, J., Ladwig, L.M., Li, Q., McCulley, R.L., Melbourne, B.A., Mitchell, C.E.,
Moore, J.L., Morgan, J.W., Risch, A.C., Schütz, M., Stevens, C.J., Wedin, D.A., Yang, L.H., 2015. Grassland
productivity limited by multiple nutrients. Nature Plants 1, UNSP 15080.
Flanagan, L., Kubien, D., Ehleringer, J., 1999. Spatial and temporal variation in the carbon and oxygen
stable isotope ratio of respired CO2 in a boreal forest ecosystem. Tellus Series B-Chemical and Physical
Meteorology 51, 367-384.
Fowler D et al. 2013. The global nitrogen cycle in the twenty-first century. . Philosophical Transactions of
the Royal Society B 368: 20130164. http://dx.doi.org/10.1098/rstb.2013.0164.
Fowler, D., Steadman, C. E., Stevenson, D., Coyle, M., R. M. Rees, R. M., Skiba, U. M., Sutton, M. A.,1,
Cape, J. N., Dore, A. J., Vieno, M., Simpson, D., Zaehle, S., Stocker, B. D., Rinaldi, M., Facchini, M. C.,
Flechard, C. R., Nemitz, E., Twigg, M., Erisman, J. W., Galloway, J. N., 2015. Effects of global change
during the 21st century on the nitrogen cycle. Atmospheric Chemistry and Physics Discussion 15, 1747–
1868. DOI:10.5194/acpd-15-1747-2015.
Gaffney, J.S. and Marley, N.A., 2009. The impacts of combustion emissions on air quality and climate -
from coal to biofuels and beyond. Atmospheric Environment 43, 23-36.
Gaigalis, V. and Skema, R., 2015. Analysis of the fuel and energy transition in Lithuanian industry and its
sustainable development in 2005-2013 in compliance with the EU policy and strategy. Renewable &
Sustainable Energy Reviews 52, 265-279.

Stable isotopes (15N and 13C) in mosses from Europe
221
Galloway, J.N., Townsend, A.R., Erisman, J.W., Bekunda, M., Cai, Z., Freney, J.R., Martinelli, L.A.,
Seitzinger, S.P., Sutton, M.A., 2008. Transformation of the nitrogen cycle: Recent trends, questions, and
potential solutions. Science 320, 889-892.
García-Gómez, H., Garrido, J.L., Vivanco, M.G., Lassaletta, L., Rábago, I., Àvila, A., Tsyro, S., Sánchez, G.,
González Ortiz, A., González-Fernández, I., Alonso, R., 2014. Nitrogen deposition in Spain: modeled
patterns and threatened habitats within the natural 2000 network. Sci. Total Environ. 485, 450-460.
Gerdol, R., Bragazza, L., Marchesini, R., Alber, R., Bonetti, L., Lorenzoni, G., Achilli, M., Buffoni, A., De
Marco, N., Franchi, M., Pison, S., Giaquinta, S., Palmieri, F., Spezzano, P., 2000. Monitoring of heavy
metal deposition in northern Italy by moss analysis. Environmental Pollution 108, 201-208.
Gerdol, R., Bragazza, L., Marchesini, R., Medici, A., Pedrini, P., Benedetti, S., Bovolenta, A., Coppi, S.,
2002. Use of moss (Tortula muralis Hedw.) for monitoring organic and inorganic air pollution in urban
and rural sites in northern Italy. Atmospheric Environment 36, 4069-4075.
Gerdol, R., Petraglia, A., Bragazza, L., Iacumin, P., Brancaleoni, L., 2007. Nitrogen deposition interacts with climate in affecting production and decomposition rates in Sphagnum mosses. Global Change Biology 13, 1810-1821. Gerdol, R., Marchesini, R., Iacumin, P., Brancaleoni, L., 2014. Monitoring temporal trends of air pollution
in an urban area using mosses and lichens as biomonitors. Chemosphere 108, 388-395.
Gleason, J.D., and Kyser, T.K., 1984. Stable isotope compositions of gases and vegetation near naturally
burning coal. Nature 307, 254-257.
Godfray, H.C.J., Beddington, J.R., Crute, I.R., Haddad, L., Lawrence, D., Muir, J.F., Pretty, J., Robinson, S.,
Thomas, S.M., Toulmin, C., 2010. Food security: The challenge of feeding 9 billion people. Science 327,
812-818.
Gorka, M., Rybicki, M., Simoneit, B.R.T., Marynowski, L., 2014. Determination of multiple organic matter
sources in aerosol PM10 from Wroclaw, Poland using molecular and stable carbon isotope
compositions. Atmospheric Environment 89, 739-748.
Guerrieri, R., Vanguelova, E.I., Michalski, G., Heaton, T.H.E., Mencuccini, M., 2015. Isotopic evidence for
the occurrence of biological nitrification and nitrogen deposition processing in forest canopies. Global
Change Biology 21, 4613-4626.
Guo, Z., Jiang, W., Chen, S., Sun, D., Shi, L., Zeng, G., Rui, M., 2016. Stable isotopic compositions of
elemental carbon in PM1.1 in north suburb of Nanjing region, China. Atmospheric Research 168, 105
Harmens, H., Norris, D., and the participants of the moss survey Programme Coordination Centre for the
ICP Vegetation, 2008. Spatial and temporal trends in heavy metal accumulation in mosses in Europe
(1990-2005). Working Group (WGE) on Effects of the Convention on Long-range Transboundary Air
Pollution. Publisher: Centre for Ecology & Hydrology, Natural Environment Research Council, Bangor,
UK. ISBN: 978-1-85531-239-5.
Harmens, H., Norris, D.A., Cooper, D.M., Mills, G., Steinnes, E., Kubin, E., Thöni, L.,Aboal, J.R., Alber, R.,
Carballeira, A., Coskun, M., De Temmerman, L., Frolova,M., GonzáLez-Miqueo, L., Jeran, Z., Leblond, S.,
Liiv, S., Mankovská, B., Pesch, R.,Poikolainen, J., Rühling, Å., Santamaría, J.M., Simonèiè, P., Schröder,

Chapter 5
222
W., Suchara,I., Yurukova, L., Zechmeister, H.G., 2011. Nitrogen concentrations in mosses indicate the
spatial distribution of atmospheric nitrogen deposition in Europe. Environmental Pollution 159, 2852–
2860.
Harmens, H., Schnyder, E., Thöni, L., Cooper, D.M., Mills, G., Leblond, S., Mohr, K., Poikolainen, J.,
Santamaría, J., Skudnik, M., Zechmeister, H.G., Lindroos, A., Hanus-Illnar, A., 2014. Relationship between
site-specific nitrogen concentrations in mosses and measured wet bulk atmospheric nitrogen deposition
across Europe. Environmental Pollution 194, 50-9.
Harmens, H., Mills, G., Hayes, F., Norris, D., Sharps, K., 2015a. Twenty eight years of ICP Vegetation: an
overview of its activities. Annali di Botanica (Roma), 5, 31-43.
Harmens, H., Norris, D.A., Sharps, K., Mills, G., Alber, R., Aleksiayenak, Y., Blum, O., Cucu-Man, S., Dam,
M., De Temmerman, L., Ene, A., Fernández, J.A., Martínez-Abaigar, J., Frontasyeva, M., Godzik, B., Jeran,
Z., Lazo, P., Leblond, S., Liiv, S., Magnusson, S.H., Mankovska, B., Karlsson, G.P., Piispanen, J.,
Poikolainen, J., Santamaría, J.M., Skudnik, M., Spiric, Z., Stafilov, T., Steinnes, E., Stihi, C., Suchara, I.,
Thöni, L., Todoran, R., Yurukova, L., Zechmeister, H.G., 2015b. Heavy metal and nitrogen concentrations
in mosses are declining across Europe whilst some "hotspots" remain in 2010. Environmental Pollution
200, 93-104.
Heaton, T.H.E., 1986. Isotopic studies of nitrogen pollution in the hydrosphere and atmosphere - a
review. Chemical Geology 59, 87-102.
Hicks, W.K., Leith, I.D., Woodin, S.J., Fowler, D., 2000. Can the foliar nitrogen concentration of upland
vegetation be used for predicting atmospheric nitrogen deposition? Evidence from field surveys.
Environmental Pollution 107, 367-376.
Hobbie, E.A. and Högberg, P., 2012. Nitrogen isotopes link mycorrhizal fungi and plants to nitrogen
dynamics. New Phytologist 196, 367-382.
Hyodo, F., Kusaka, S., Wardle, D.A., Nilsson, M., 2013. Changes in stable nitrogen and carbon isotope
ratios of plants and soil across a boreal forest fire chronosequence. Plant and Soil 367, 111-119.
Isaksen, I.S.A., Granier, C., Myhre, G., Berntsen, T.K., Dalsoren, S.B., Gauss, M., Klimont, Z., Benestad, R.,
Bousquet, P., Collins, W., Cox, T., Eyring, V., Fowler, D., Fuzzi, S., Joeckel, P., Laj, P., Lohmann, U.,
Maione, M., Monks, P., Prevot, A.S.H., Raes, F., Richter, A., Rognerud, B., Schulz, M., Shindell, D.,
Stevenson, D.S., Storelvmo, T., Wang, W.-., van Weele, M., Wild, M., Wuebbles, D., 2009. Atmospheric
composition change: Climate-chemistry interactions. Atmospheric Environment 43, 5138-5192.
Izquieta-Rojano, S., Elustondo, D., Ederra, A., Lasheras, E., Santamaría, C., Santamaría, J.M., 2016a.
Pleurochaete squarrosa (Brid.) Lindb. as an alternative moss species for biomonitoring surveys of heavy
metal, nitrogen deposition and δ15N signatures in a Mediterranean area. Ecological Indicators 60, 1221-
1228.
Izquieta-Rojano, S., López-Aizpún, M., Irigoyen, J.J., Lasheras, E., Santamaría, C., Santamaría, J.M.,
Ochoa-Hueso, R., Elustondo, D., 2016b. Integrated eco-physiological response of the moss Hypnum
cupressiforme Hedw. to increased atmospheric ammonia concentrations. Submitted.
Jones, R.J.A., Hiederer, R., Rusco, E., Loveland, P.J. and Montanarella, L., 2004. The map of organic carbon in topsoils in Europe, Version 1.2, September 2003: Explanation of Special Publication Ispra 2004

Stable isotopes (15N and 13C) in mosses from Europe
223
No.72 (S.P.I.04.72). European Soil Bureau Research Report No.17, EUR 21209 EN, 26pp. and 1 map in ISO B1 format. Office for Official Publications of the European Communities, Luxembourg.
Jones, R.J.A., Hiederer, R., Rusco, E., Montanarella, L., 2005. Estimating organic carbon in the soils of
Europe for policy support. European Journal of Soil Science 56, 655-671.
Koranda, M., Kerschbaum, S., Wanek, W., Zechmeister, H., Richter, A., 2007. Physiological responses of bryophytes Thuidium tamariscinum and Hylocomium splendens to increased nitrogen deposition. Annals of Botany 99, 161-169. Krupa, S.V., 2003. Effects of atmospheric ammonia (NH3) on terrestrial vegetation: A review. Environmental Pollution 124, 179-221. Kuzyakov, Y., 2006. Sources of CO2 efflux from soil and review of partitioning methods. Soil Biology and Biochemistry 38, 425-448.
Leith, I.D., Mitchell, R.J., Truscott, A., Cape, J.N., van Dijk, N., Smith, R.I., Fowler, D., Sutton, M.A., 2008.
The influence of nitrogen in stemflow and precipitation on epiphytic bryophytes, Isothecium
myosuroides Brid., Dicranum scoparium Hewd. and Thuidium tamariscinum (Hewd.) Schimp of Atlantic
oakwoods. Environmental Pollution 155, 237-246.
Lichtfouse, E., Lichtfouse, M., Jaffrezic, A., 2003. Delta C-13 values of grasses as a novel indicator of
pollution by fossil-fuel-derived greenhouse gas CO2 in urban areas. Environmental Science & Technology
37, 87-89.
Lindo, Z. and González, A., 2010. The bryosphere: An integral and influential component of the earth's
biosphere. Ecosystems 13, 612-627.
Liu, X., Xiao, H., Liu, C., Li, Y., 2007. 13C and 15N of moss Haplocladium microphyllum (Hedw.) Broth. for indicating growing environment variation and canopy retention on atmospheric nitrogen deposition. Atmospheric Environment 41, 4897-4907. Liu, X., Xiao, H., Liu, C., Li, Y., Xiao, H., 2008a. Tissue N content and N-15 natural abundance in epilithic
mosses for indicating atmospheric N deposition in the Guiyang area, SW China. Applied Geochemistry
23, 2708-2715.
Liu, X., Xiao, H., Liu, C., Li, Y., Xiao, H., 2008b. Stable carbon and nitrogen isotopes of the moss
Haplocladium microphyllum in an urban and a background area (SW China): The role of environmental
conditions and atmospheric nitrogen deposition. Atmospheric Environment 42, 5413-5423.
Liu, X., Xiao, H., Liu, C., Li, Y., Xiao, H., Wang, Y., 2010. Response of stable carbon isotope in epilithic
mosses to atmospheric nitrogen deposition. Environmental Pollution 158, 2273-2281.
Liu, X., Koba, K., Makabe, A., Li, X., Yoh, M., Liu, C., 2013. Ammonium first: Natural mosses prefer
atmospheric ammonium but vary utilization of dissolved organic nitrogen depending on habitat and
nitrogen deposition. New Phytologist 199, 407-419.
Lopez, M., Schmidt, M., Delmotte, M., Colomb, A., Gros, V., Janssen, C., Lehman, S.J., Mondelain, D.,
Perrussel, O., Ramonet, M., Xueref-Remy, I., Bousquet, P., 2013. CO, NOx and (CO2)-C-13 as tracers for
fossil fuel CO2: Results from a pilot study in paris during winter 2010. Atmospheric Chemistry and
Physics 13, 7343-7358.
Chapter 5
224
Masalaite, A., Remeikis, V., Garbaras, A., Dudoitis, V., Uleviciusa, V., and Ceburnis, D., 2015. Elucidating
carbonaceous aerosol sources by the stable carbon δ13CTC ratio in size-segregated particles.
Atmospheric Research 158-159, 1-12.
McKee, K.L., Feller, I.C., Popp, M., Wanek, W., 2002. Mangrove isotopic (delta N-15 and delta C-13)
fractionation across a nitrogen vs. phosphorus limitation gradient. Ecology 83, 1065-1075.
Menot, G. and Burns, S.J., 2001. Carbon isotopes in ombrogenic peat bog plants as climatic indicators:
Calibration from an altitudinal transect in Switzerland. Organic Geochemistry 32, 233-245.
Meyer, M., Schröder, W., Nickel, S., Leblond, S., Lindroos, A., Mohr, K., Poikolainen, J., Santamaría, J.M.,
Skudnik, M., Thöni, L., Beudert, B., Dieffenbach-Fries, H., Schulte-Bisping, H., Zechmeister, H.G., 2015.
Relevance of canopy drip for the accumulation of nitrogen in moss used as biomonitors for atmospheric
nitrogen deposition in Europe. The Science of the Total Environment 538, 600-610.
Morén, A. and Lindroth, A., 2000. CO2 exchange at the floor of a boreal forest. Agricultural and Forest
Meteorology 101, 1-14.
Munzi, S., Pisani, T., Paoli, L., Renzi, M., Loppi, S., 2013. Effect of nitrogen supply on the C/N balance in the lichen Evernia prunastri (L.) ach. Turkish Journal of Biology 37, 165-170. Munzi, S., Cruz, C., Branquinho, C., Pinho, P., Leith, I.D., Sheppard, L.J., 2014. Can ammonia tolerance amongst lichen functional groups be explained by physiological responses? Environmental Pollution 187, 206-209. Norra, S., Handley, L.L., Berner, Z., Stuben, D., 2005. 13C and 15N natural abundances of urban soils and herbaceous vegetation in Karlsruhe, Germany. European Journal of Soil Science 56, 607-620.
Oenema, O., and contributing authors, 2011. Nitrogen in current European policies. In The European
nitrogen assessment: sources, effects and policy perspectives (eds MA Sutton, CM Howard, JW Erisman,
G Billen, A Bleeker, P Grennfelt, H van Grinsven, B Grizzetti), pp. 62–81. Cambridge, UK: Cambridge
University Press.
Pang, J., Wen, X., Sun, X., 2016. Mixing ratio and carbon isotopic composition investigation of
atmospheric CO2 in beijing, China. Science of the Total Environment 539, 322-330.
Pataki, D.E., Xu, T., Luo, Y.Q., Ehleringer, J.R., 2007. Inferring biogenic and anthropogenic carbon dioxide
sources across an urban to rural gradient. Oecologia 152, 307-322.
Paulissen, M.P.C.P., Besalu, L.E., De Bruijn, H., Van der Ven, P.J.M., Bobbink, R., 2005. Contrasting effects of ammonium enrichment on fen bryophytes. Journal of Bryology 27, 109-117. Pearson, J., Wells, D.M., Seller, K.J., Bennett, A., Soares, A., Woodall, J., Ingrouille, M.J., 2000. Traffic
exposure increases natural N-15 and heavy metal concentrations in mosses. New Phytologist 147, 317-
326.
Pesch, R., Schroeder, W., Schmidt, G., Genssler, L., 2008. Monitoring nitrogen accumulation in mosses in
central European forests. Environmental Pollution 155, 528-536.
Pinto, J.R., Marshall, J.D., Dumroese, R.K., Davis, A.S., Cobos, D.R., 2012. Photosynthetic response,
carbon isotopic composition, survival, and growth of three stock types under water stress enhanced by
Stable isotopes (15N and 13C) in mosses from Europe
225
vegetative competition. Canadian Journal of Forest Research-Revue Canadienne De Recherche
Forestiere 42, 333-344.
Pintó-Marijuan, M., Da Silva, A.B., Flexas, J., Dias, T., Zarrouk, O., Martins-Louçao, M.A., Chaves, M.M., Cruz, C., 2013. Photosynthesis of Quercus suber is affected by atmospheric NH3 generated by multifunctional agrosystems. Tree physiology 33, 1328-1337.
Pitcairn, C.E.R., Fowler, D., Leith, I.D., Sheppard, L.J., Tang, S., Sutton, M.A., Famulari, D., 2006.
Diagnostic indicators of elevated nitrogen deposition. Environmental Pollution 144, 941–950.
Poikolainen, J., Piispanen, J., Karhu, J., Kubin, E., 2009. Long-term changes in nitrogen deposition in
Finland (1990-2006) monitored using the moss Hylocomium splendens. Environmental Pollution 157,
3091-3097.
Popa, M.E., Vollmer, M.K., Jordan, A., Brand, W.A., Pathirana, S.L., Rother, M., and Rökmann, T., 2014.
Vehicle emissions of greenhouse gases and related tracers from a tunnel study: CO:CO2, N2O:CO2, CH4
:CO2, O2 :CO2 ratios, and the stable isotopes 13C and 18O in CO2 and CO. Atmospheric Chemistry and
Physics 14, 2105-2123.
Raghoebarsing, A.A., Smolders, A.J.P., Schmid, M.C., Rijpstra, W.I.C., Wolters-Arts, M., Derksen, J.,
Jetten, M.S.M., Schouten, S., Damste, J.S.S., Lamers, L.P.M., Roelofs, J.G.M., den Camp, H.J.M.O., Strous,
M., 2005. Methanotrophic symbionts provide carbon for photosynthesis in peat bogs. Nature 436, 1153-
1156.
Robinson, D., 2001. Delta N-15 as an integrator of the nitrogen cycle. Trends in Ecology & Evolution 16,
153-162.
Rousk, K; Rousk, J; Jones, DL; Zackrisson, O and DeLuca, TH., 2013. Feather moss nitrogen acquisition
across natural fertility gradients in boreal forests. Soil Biology & Biochemistry 61, 86-95.
Royles, J., Horwath, A.B., Griffiths, H., 2014. Interpreting bryophyte stable carbon isotope composition:
Plants as temporal and spatial climate recorders. Geochemistry Geophysics Geosystems 15, 1462-1475.
Sardans, J. and Peñuelas, J., 2005. Trace element accumulation in the moss Hypnum cupressiforme
hedw. and the trees Quercus ilex L. and Pinus halepensis mill. in Catalonia. Chemosphere 60, 1293-1307.
Scartazza, A., Mata, C., Matteucci, G., Yakir, D., Moscatello, S., Brugnoli, E., 2004. Comparisons of delta
C-13 of photosynthetic products and ecosystem respiratory CO2 and their response to seasonal climate
variability. Oecologia 140, 340-351.
Schaefer, H., Fletcher, S.E.M., Veidt, C., Lassey, K.R., Brailsford, G.W., Bromley, T.M., Dlugokencky, E.J.,
Michel, S.E., Miller, J.B., Levin, I., Lowe, D.C., Martin, R.J., Vaughn, B.H., White, J.W.C., 2016. A 21st-
century shift from fossil-fuel to biogenic methane emissions indicated by (CH4)-C-13. Science 352, 80-84.
Schröder, W., Holy, M., Pesch, R., Harmens, H., Fagerli, H., Alber, R., Cos¸ kun, M., DeTemmerman, L.,
Frolova, M., González-Miqueo, L., Jeran, Z., Kubin, E., Leblond,S., Liiv, S., Maˇnkovská, B., Piispanen, J.,
Santamaría, J.M., Simonèiè, P., Suchara, I.,Yurukova, L., Thöni, L., Zechmeister, H.G., 2010. First Europe-
wide correlation analysis identifying factors best explaining the total nitrogen concentration in mosses.
Atmospheric Environment 44, 3485–3491.
Chapter 5
226
Simpson, D., Benedictow, A., Berge, H., Bergstrom, R., Emberson, L.D., Fagerli, H., Flechard, C.R.,
Hayman, G.D., Gauss, M., Jonson, J.E., Jenkin, M.E., Nyiri, A., Richter, C., Semeena, V.S., Tsyro, S.,
Tuovinen, J.P., Valdebenito, A., Wind, P., 2012. The EMEP MSC-W chemical transport model - technical
description. Atmospheric Chemistry and Physics 12, 7825-7865.
Skinner, R.A., Ineson, P., Jones, H., Sleep, D., Leith, I.D., Sheppard, L.J., 2006. Heathland vegetation as a
bio-monitor for nitrogen deposition and source attribution using delta N-15 values. Atmospheric
Environment 40, 498-507.
Skrzypek, G., Kaluzny, A., Wojtun, B., Jedrysek, M., 2007. The carbon stable isotopic composition of
mosses: A record of temperature variation. Organic Geochemistry 38, 1770-1781.
Skudnik, M., Jeran, Z., Batic, F., Simoncic, P., Kastelec, D., 2015. Potential environmental factors that influence the nitrogen concentration and delta N-15 values in the moss Hypnum cupressiforme collected inside and outside canopy drip lines. Environmental Pollution 198, 78-85.
Solga, A., Burkhardt, J., Zechmeister, H.G., Frahm, J.P., 2005. Nitrogen content, N-15 natural abundance
and biomass of two pleurocarpous mosses Pleurozium schreberi (Brid.) mitt. and Scleropodium purum
(Hedw.) Limpr. in relation to atmospheric nitrogen deposition. Environmental Pollution 134, 465-473.
Solga, A. and Frahm, J.P., 2006. Nitrogen accumulation by six pleurocarpous moss species and their
suitability for monitoring nitrogen deposition. Journal of Bryology 28, 46-52.
Spiric, Z., Frontasyeva, M., Steinnes, E., Stafilov, T., 2012. Multi-element atmospheric deposition study in
Croatia. International Journal of Environmental Analytical Chemistry 92, 1200-1214.
Sriskantharajah, S., Fisher, R.E., Lowry, D., Aalto, T., Hatakka, J., Aurela, M., Laurila, T., Lohila, A.,
Kuitunen, E., and Nisbet, E.G., 2012. Stable carbon isotope signatures of methane from a Finnish
subarctic wetland. Tellus B 64, 18818, http://dx.doi.org/10.3402/tellusb.v64i0.18818.
Steinnes, E., Ruhling, A., Lippo, H., Makinen, A., 1997. Reference materials for large-scale metal
deposition surveys. Accreditation and Quality Assurance 2, 243-249.
Stewart, G.R., Aidar, M.P.M., Joly, C.A., Schmidt, S., 2002. Impact of point source pollution on nitrogen
isotope signatures (delta N-15) of vegetation in SE Brazil. Oecologia 131, 468-472.
Swanson, R.V. and Flanagan, L.B., 2001. Environmental regulation of carbon dioxide exchange at the
forest floor in a boreal black spruce ecosystem. Agricultural and Forest Meteorology 108, 165-181.
Toet, S., Cornelissen, J.H.C., Aerts, R., van Logtestijn, R.S.P., de Beus, M., Stoevelaar, R., 2006. Moss
responses to elevated CO2 and variation in hydrology in a temperate lowland peatland. Plant Ecology
182, 27-40.
Townsend-Small, A., Stanley, C.T., Pataky, D.E., Xu, X., and Christensen, L.E., 2012. Isotopic
measurements of atmospheric methane in Los Angeles, California, USA: Influence of ‘fugitive’ fossil fuel
emissions. Journal of Geophysical Research 117, D07308. doi:10.1029/2011JD016826.
Varela, Z., Carballeira, A., Fernández, J.A., Aboal, J.R., 2013. On the use of epigaeic mosses to biomonitor
atmospheric deposition of nitrogen. Archives of Environmental Contamination and Toxicology 64, 562-
572.

Stable isotopes (15N and 13C) in mosses from Europe
227
Vestreng, V., Ntziachristos, L., Semb, A., Reis, S., Isaksen, I.S.A., Tarrason, L., 2009. Evolution of NOx
emissions in Europe with focus on road transport control measures. Atmospheric Chemistry and Physics
9, 1503-1520.
Vitousek, P.M., Porder, S., Houlton, B. Z., Chadwick, O.A., 2010. Terrestrial phosphorus limitation:
mechanisms, implications, and nitrogen–phosphorus interactions. Ecological Applications, 20(1), pp. 5–
15.
Werth, M. and Kuzyakov, Y., 2010. C-13 fractionation at the root-microorganisms-soil interface: A review
and outlook for partitioning studies. Soil Biology & Biochemistry 42, 1372-1384.
West, J.B., Bowen, G.J., Cerling, T.E., Ehleringer, J.R., 2006. Stable isotopes as one of nature's ecological
recorders. Trends in Ecology & Evolution 21, 408-414.
Williams, T. and Flanagan, L., 1996. Effect of changes in water content on photosynthesis, transpiration
and discrimination against 13
CO2 and C18
O16
O in pleurozium and sphagnum. Oecologia 108, 38-46.
Winiwarter, W., Grizzeti, B., Sutton, M.A., 2015. Nitrogen Pollution in the UE. Best management
strategies, regulations, and science needs. Air and Waste Management Association. http://awma.org
(September 2015).
Xiao, H., Tang, C., Xiao, H., Liu, X., Liu, C., 2010. Stable sulphur and nitrogen isotopes of the moss
Haplocladium microphyllum at urban, rural and forested sites. Atmospheric Environment 44, 4312-4317.
Zechmeister, H.G., Grodzinska, K., Szarek-Lukaszewska, G., 2003. Chapter 10: Bryophytes. In: Markert,
B.A., Breure, A.M., Zechmeister, H.G. (Eds.), Bioindicators and biomonitors. Elsevier Science Ltd.,
Amsterdam. pp. 329-375.
Zechmeister, H.G., Richter, A., Smidt, S., Hohenwallner, D., Roder, I., Maringer, S., Wanek, W., 2008.
Total nitrogen content and 15N signatures in moss tissue: Indicative value for nitrogen deposition
patterns and source allocation on a nationwide scale. Environmental Science & Technology 42, 8661-866
Zhang, Y., Liu, X.J., Fangmeier, A., Goulding, K.T.W., Zhang, F.S., 2008. Nitrogen inputs and isotopes in
precipitation in the north China Plain. Atmospheric Environment 42, 1436-1448.
Zondervan, A. and Meijer, H.A.J., 1996. Isotopic characterisation of CO2 sources during regional pollution
events using isotopic and radiocarbon analysis. Tellus Series B-Chemical and Physical Meteorology 48,
601-612.

Chapter 5
228
Conclusions
229
Conclusions
The main outcomes of the present PhD thesis are:
Chapter 2
The study of the precipitation chemistry at four holm oak forests in the Iberian
Peninsula, and especially the nitrogenous organic fraction, showed that:
I. The contribution of dissolved organic nitrogen (DON) to total N budgets in the
Iberian Peninsula was significant, ranging from 34% in La Castanya to 56% in
Carrascal in bulk deposition rain samples, which in terms of deposition fluxes
were equivalent to 3 and 12 Kg ha-1 yr-1 respectively; and from 38% in Can
Balasc to 72% in Tres Cantos in throughfall deposition samples, which was
equivalent to 5 Kg ha-1 yr-1 at both sites.
II. In Mediterranean areas and other dry, arid and semi-arid environments where
soil erosion is a frequent phenomenon that can influence the precipitation
chemistry, pH regulation of rain samples intended to total N analysis is of vital
importance in order to preserve N-NH4+ and avoid the underestimation of the
dissolved organic fraction.
III. Anthropogenic activities, and more specifically agricultural practices and
pollutants generated in combustion processes in metropolitan areas, were
potential DON sources depending on the study site.
IV. Certain DON compounds can be directly assimilated by the canopy, and thus
may constitute an additional nutrient supply in Mediterranean ecosystems
during biologically active periods, which may have significant implications when
working with the critical load approach.
In view of these findings, there is no doubt about the important role that DON may
play in the N cycle at Mediterranean ecosystems. However, the scarcity of data and
the limited knowledge of this organic fraction did not allow establishing which
ecological functions of these forests are affected by the observed DON fluxes. Thus, a
first step to make progress in the investigation of organic nitrogen and cover the lack
of data in this field would be the inclusion of the DON in the target compounds of both
Chapter 6
230
national and international N deposition monitoring networks. On the other hand, the
uptake of part of the organic N load by the canopy indicates that some components of
the organic fraction might represent another nutrient supply for these forests.
Nevertheless, further research is needed to identify which are those compounds, or to
determine if the uptake is really developed in the leaves of trees or by epiphytic
organisms. In all cases, this is a highly interesting research field that should be
addressed in the near future since there is a great need to include the organic fraction
in the risk evaluations and throw light on the ecological implications it might have.
Moreover, it is clear that a significant portion of DON in rain samples has an
anthropogenic origin as both agricultural activities and combustion-related processes
contribute to alter the N natural dynamics. To determine how this organic fraction
interacts with natural vegetation is without question a major challenge for the next
years. Our work constitutes a first step in the knowledge of this fraction in the Iberian
Peninsula, but there are still a lot of unsolved questions.
Chapter 3
The interspecies comparison survey between the moss species Pleurochaete squarrosa
and Hypnum cupressiforme for some heavy metals, nitrogen and 15N signatures
allowed us to reach the following conclusions:
V. Both Pleurochaete squarrosa (PS) and Hypnum cupressiforme (HC) showed a
similar spatial deposition pattern for N, making possible their simultaneous use
in extensive biomonitoring works.
VI. The analysis of 15N signatures in Pleurochaete squarrosa was revealed as a
valuable tool for identifying N pollution sources in this Mediterranean area
since, contrary to Hypnum cupressiforme, PS was able to reflect both oxidized
and reduced emissions.
VII. The potential for heavy metal accumulation was found higher in PS than in HC.
However, the comparison of absolute concentrations was discarded because of
the soil particles influence in the metallic content of mosses.
Conclusions
231
VIII. The two bryophytes showed similar enrichment patterns for all the elements
and showed an overall capacity to discriminate sites both highly and scarcely
affected by trace element deposition.
This knowledge must be taken into account in the development of future
biomonitoring surveys in Southern Europe and other Mediterranean regions. Our
results suggest that the recommendation of using only pleurocarpous species to
perform regional monitoring surveys does not have to be strictly followed in these
areas, since endemic species well-adapted to climatic conditions such as Pleurochaete
squarrosa might provide even a better reflection of the atmospheric chemistry.
Nevertheless, broader pollution gradients (both N and heavy metal) and other spatial
scales should be investigated to confirm the suitability of this moss species under
other conditions. On the other hand, it was observed that soil dust highly contribute to
the heavy metal content in mosses in the Mediterranean area, thereby hindering the
estimates of anthropogenic-related fluxes. It suggests that a qualitative interpretation
of data might be more appropriate than a quantitative one in such environments. This
fact agrees with the findings in Chapter 2, which showed that soil particles might lead
to changes in the pH of rain samples, increasing the ammonia volatilization and
causing an underestimation of the dissolved organic fraction. Hence, particular
characteristics of the Mediterranean areas should be considered when monitoring N
deposition in order to obtain reliable data about pollution processes in these regions.
Chapter 4
The evaluation of the effects of atmospheric ammonia on the physiology of the moss
Hypnum cupressiforme from a multivariate, comprehensive and temporal perspective
evidenced that:

Chapter 6
232
IX. With the exception of some tissue elements, all the physiological variables
considered in this study were found sensitive to increasing atmospheric NH3,
which suggested a potential use for monitoring purposes.
X. The sampling period greatly conditioned the responsiveness of the evaluated
physiological processes, showing the importance of performing the monitoring
surveys in the suitable season to obtain accurate and valuable data.
XI. N accumulation and NH3-induced oxidative stress were the most important
drivers of the physiological functioning of Hypnum cupressiforme along the
gradient.
XII. Due to their high response capacity and homogeneous patterns during the
year, foliar N, SOD and 13C showed the greatest potential for being used as
early warning indicators of NH3 toxicity.
XIII. Integrated and temporal analyses of key physiological processes at species level
might play a vital role in NH3 pollution studies to understand and anticipate
further ecological impacts.
Despite ammonia emissions are considered one of the major environmental problems
in relation to atmospheric N pollution, at present there are still many uncertainties to
be clarified. In this respect, our results from Chapter 4 evidenced that the moss species
Hypnum cupressiforme was very sensitive to increasing atmospheric NH3, showing a
high potential for monitoring N-related impacts through the analysis of certain
physiological processes at species level. In biomonitoring surveys, the temporal
variability is commonly overlooked. However, our data suggested that the selection of
the sampling season might be of primary importance to obtain valuable and realistic
information about N pollution related effects. In this sense, SOD, C stable isotopes or N
contents were found the most promising parameters, since they showed the same
behaviour throughout the year. By contrast, PME, which has been evaluated in a
number of surveys in the recent years to investigate N-related impacts, varied
according to the moss active periods. Therefore, when testing a new parameter for
biomonitoring purposes, a temporal evaluation of its responsiveness is advisable.
Furthermore, the SOD answer was strongly activated according to increasing [NH3],

Conclusions
233
being the NH3-induced oxidative stress probably associated to some of the observed
effects on C fixation and nutritional imbalances. Thus, our findings open a door for
continuing the invesitigation in this field in order to achieve a better understanding of
the NH3 impacts on the physiology of mosses, which ultimately might provide insight
into NH3 impacts at ecosystem level. On the other hand, the accurate linear curve in
the exposure-response relationship between NH3 and some variables showed a great
potential for using the physiological responses in the estimates of CLE.
Chapter 5
The analysis of N and C tissue contents along with N and C isotopic signatures in
mosses from Europe, and their comparison with land uses and emission /deposition
data revealed that:
XIV. The analysis of tissue N contents showed that central and Eastern Europe, and
locally some areas in the south of UK and Sweden, were the most N polluted
areas, which agreed to other moss surveys carried out across Europe.
XV. 15N signatures reflected the chemistry of deposition, being more depleted in
the heaviest isotope (15N) when the dominant component was NHy (higher
NHy/NOx ratios), and 15N enriched when NOx were the prevailing forms.
XVI. The spatial distribution of elemental C concentrations in mosses was coincident
with that of topsoil organic C in Europe, evidencing a clear influence of the
substrate on moss tissue chemistry, especially in northern latitudes.
XVII. Variations in tissue stoichiometry were found to be highly dependent on N
deposition loads, which suggested that C:N ratios could be a helpful tool to
identify areas at risk because of N pollution at a regional scale.
XVIII. 13C signatures in mosses varied according to the origin of the C assimilated
and to environmental conditions. Because of this fact, monitoring of 13C natural
abundance at a regional scale might provide not only valuable information
about atmospheric pollution processes, but also about changes in temperature
and water availability regimes across Europe.
Chapter 6
234
XIX. Additional measurements of C and stable isotopes in mosses might be a
promising tool in European surveys, not only in the attribution of likely
pollution sources, but also as biological markers of key environmental
processes.
Considering tissue N data, this study corroborated previous findings of other moss
surveys carried out in Europe. Furthermore, this work provided useful information
about C, C:N and isotopic signatures 15N and 13C for the first time at a European
scale. Whereas results from Chapter 3 might contribute to cover information gaps in
moss surveys in the Mediterranean area, results from this chapter offered additional
and valuable information about N pollution patterns and sources, as well as ecological
processes at a regional scale. Therefore, findings from both chapters should be taken
into consideration in next ICP-Vegetation moss surveys. Similarly to findings from
Chapters 3 and 4, 15N signatures showed a clear association with N reduced forms
(the higher the NHy the lower the 15N, and vice versa). This relationship was especially
evident in N polluted areas. Nevertheless, under low N deposition loads, the
interpretation of results showed that the observed isotopic signatures might be closely
related to site-specific ecological processes. Analyses of 13C signatures allowed us to
reach the same conclusion. Thus, our results suggested that the evaluation of isotopic
signatures at a regional scale must be performed in a contextualized manner. Finally,
variations in the C:N balance were found to be strongly inferred by N deposition.
Hence, at this point it would be interesting to elucidate how these changes in tissue
stoichiometry could be affecting the functioning of natural ecosystems in Europe.
Annex I
235
Annex I
EDEN project
Chapter 2 was carried out in the framework of the EDEN project (Effects of nitrogen
deposition in Mediterranean evergreen holm oak forests), in which participated three
research groups: Centro de Investigación Ecológica y Aplicaciones Forestales (CREAF)
from Barcelona, Centro de Investigaciones Energéticas, Medioambientales y
Tecnológicas (CIEMAT) from Madrid, and Laboratorio Integrado de Calidad Ambiental
(LICA), University of Navarra, from Navarra.
The main aim of this project was to determine and characterize the nitrogen inputs to
evergreen holm oak forests in the Iberian Peninsula and evaluate the effects in the
nitrogen biogeochemical cycle.
To that end, four holm oak forests subjected to different climatic and edaphic
conditions were monitored for two years from 2011 to 2013. In particular, during this
period we evaluated: meteorological conditions, bulk and throughfall rain deposition
(DON only the last year), atmospheric concentrations of O3, NH3, NO2 and HNO3, ion-
exchange resins, and N and C tissue contents, as well as N and C isotopic fractionation
of leaves, litterfall, soil and mosses. The investigation of these variables was
challenging; it required a high sampling and analytical effort, and the union of results
for developing common databases was not always an easy job. But, despite all
handicaps, we get interesting and valuable data about N pollution in these
Mediterranean forests.
Although in the present PhD only a small part of the EDEN-related findings has been
shown, it is important to highlight that results from this research project not only have
led to two other doctoral dissertations in Madrid and Barcelona, but also to relevant
manuscripts that are being published in internationally recognized scientific journals:
Aguillaume, L., 2015. Efectos de la deposición de nitrógeno en encinares
mediterráneos: cargas e indicadores. PhD Dissertation. Universitat Autonòma
de Barcelona.

Annex I
236
Aguillaume, L., Izquieta-Rojano, S., García-Gómez, H., Elustondo, D.,
Santamaría, J.M., Alonso, R., Àvila, A.. Dry deposition and canopy uptake in
Mediterranean holm-oak forests with a canopy budget model: a focus on N
estimations. Atmospheric Environment (submitted).
García-Gómez, H., Aguillaume, L., Izquieta-Rojano, S., Valiño, F., Àvila, A.,
Elustondo, D., Santamaría, J.M., Alastuey, A., Calvete-Sogo, H., González-
Fernández, I., Alonso, R., 2015. Atmospheric pollutants in peri-urban forests of
Quercus ilex: evidence of pollution abatement and threats for vegetation.
Environmental Sciences and Pollution Research. DOI: 10.1007/s11356-015-
5862-z.
García-Gómez, H., Izquieta-Rojano, S., Aguillaume, L., González-Fernández, I.,
Valiño, F., Elustondo, D., Santamaría, J.M., Àvila, A., Fenn, M.E., Alonso, R..
Atmospheric deposition of inorganic nitrogen in Spanish forests of Quercus ilex
measured with ion-exchange resins and conventional collectors. Environmental
Pollution (submitted).
Izquieta-Rojano, S., García-Gómez, H., Aguillaume, L., Santamaría, J.M., Tang,
Y.S., Santamaría, C., Valiño, F., Lasheras, E., Alonso, R., Àvila, A., Cape, J.N.,
Elustondo, D., 2016. Throughfall and bulk deposition of dissolved organic
nitrogen to holm oak forests in the Iberian Peninsula: Flux estimation and
identification of potential sources. Environmental Pollution 210, 104-112.
http://dx.doi.org/10.1016/j.envpol.2015.12.002.

Annex I
237
ICP-Vegetation programme
According to information from its website (http://icpvegetation.ceh.ac.uk), the
International Cooperative Programme on Effects of air Pollution on Natural Vegetation
and Crops (ICP Vegetation) was established in the late eighties under the United
Nation Economic Commision for Europe (UNECE) Convention on Long-Range
Transboundary Air Pollution (LRTAP) with the aim of investigating the impacts of
selected air pollutants on crops and natural vegetation.
The first survey based on the mosses sampling technique was developed in 1980 in
Sweden, and was focused on the study of heavy metals. Since then, the mosses survey
has been expanded to include more than 20 countries in 2014 (Harmens et al., 2015),
and sampling campaigns have been conducted periodically every 5 years. Moreover,
although initially this network only aimed at reporting heavy metal pollution data,
currently mosses are also analyzed to get information about nitrogen deposition and
POPs.
Chapter 5 has been developed in collaboration with 15 participants of the ICP
Vegetation programme: Austria, Belgium, Bulgaria, Croatia, Finland, France, Germany,
Italy, Macedonia, Slovenia, Spain, Sweden, Switzerland, Turkey and UK. All these
countries provided moss samples from the 2005/2006 campaign to be analyzed for
their tissue N and C content, and their N and C isotopic fractionation (15N/14N and
13C/12C).
To our knowledge, this is the first time that isotopic signatures (15N, 13C) of mosses
are evaluated for their potential for discriminating pollution sources at the European
scale.
References
Harmens, H., Mills, G., Hayes, F., Norris, D., Sharps, K., 2015. Twenty eight years of ICP Vegetation: an
overview of its activities. Annali di Botanica (Roma), 5, 31-43.

Annex I
238

Annex II
239
Annex II
Published papers
Izquieta-Rojano, S., García-Gómez, H., Aguillaume, L., Santamaría, J.M., Tang,
Y.S., Santamaría, C., Valiño, F., Lasheras, E., Alonso, R., Àvila, A., Cape, J.N.,
Elustondo, D., 2016. Throughfall and bulk deposition of dissolved organic
nitrogen to holm oak forests in the Iberian Peninsula: Flux estimation and
identification of potential sources. Environmental Pollution 210, 104-112.
http://dx.doi.org/10.1016/j.envpol.2015.12.002.
Izquieta-Rojano, S., Elustondo, D., Ederra, A., Lasheras, E., Santamaría, C.,
Santamaría, J.M., 2016. Pleurochaete squarrosa (Brid.) Lindb. as an alternative
moss species for biomonitoring surveys of heavy metal, nitrogen deposition
and δ15N signatures in a Mediterranean area. Ecological Indicators 60, 1221-
1228.
García-Gómez, H., Aguillaume, L., Izquieta-Rojano, S., Valiño, F., Àvila, A.,
Elustondo, D., Santamaría, J.M., Alastuey, A., Calvete-Sogo, H., González-
Fernández, I., Alonso, R., 2015. Atmospheric pollutants in peri-urban forests of
Quercus ilex: evidence of pollution abatement and threats for vegetation.
Environmental Sciences and Pollution Research. DOI: 10.1007/s11356-015-
5862-z.

Annex II
240