Relative contributions of multiple determinants to bone mineral density in men
24
Relative Contributions of Multiple Determinants to Bone Mineral Density in Men Gretchen R. Chiu, Andre B. Araujo, Thomas G. Travison, Susan A. Hall, and John B. McKinlay New England Research Institutes, Watertown, MA, USA Abstract Introduction—Osteoporosis in men has gained recognition as a public health problem, generating an interest in the search for risk factors. Isolation of individual risk factors could allocate disproportionate attention to relationships that may be of limited consequence. Methods—The Boston Area Community Health/Bone (BACH/Bone) Survey is a population-based study of randomly-selected community-dwelling men (age 30-79 y). Bone mineral density (BMD) and lean mass were measured by dual x-ray absorptiometry. Socioeconomic status, health history, and lifestyle factors were obtained via interview. Hormone levels and markers of bone turnover were obtained from non-fasting blood samples. Multivariate analyses measured relative contributions of covariates to femoral neck (hip), 1/3 distal radius (wrist), and lumbar spine BMD. Results—Factors positively associated with BMD in multivariate models at the three sites were black race and appendicular lean mass. Asthma was consistently negatively associated. Various other risk factors also contributed significantly to each of the individual sites. R 2 values for the hip, wrist, and spine were 41%, 30%, and 24% respectively. Lean mass accounted for the most explained variance at all three sites. Conclusions—These data emphasize the limitation of focusing on individual risk factors and highlight the importance of potentially modifiable lean mass in predicting BMD. Keywords aging; body composition; bone mineral density; men; population studies Introduction Osteoporosis in men has gained wide recognition as an understudied public health problem, generating increased attention to male bone fragility as well as new focus on identification of risk factors and potential avenues of prevention. Numerous risk factors have been identified including but not limited to age,(1,2) hormone concentrations,(3-5) serum measures of bone metabolism,(6-9) lifestyle factors,(10-12) body composition,(13-15) decreased physical activity,(12,16) and medication use.(17,18) Recent publications have highlighted the most important risk factors for osteoporosis, fracture risk, and low bone mineral density (BMD) in men.(19,20) Research on the potential risk factors for osteoporosis, fracture risk, and low BMD to date has generally focused on one risk factor at a time. As a result, it is possible that disproportionate Correspondence: Gretchen R. Chiu, M.S. New England Research Institutes 9 Galen Street, Watertown, MA 02472 Phone: 617.923.7747 x312, Fax: 617.924.0968 [email protected]. Reprints: Andre B. Araujo, Ph.D. New England Research Institutes 9 Galen Street, Watertown, MA 02472 Phone: 617.923.7747 x452, Fax: 617.924.0968 [email protected]. NIH Public Access Author Manuscript Osteoporos Int. Author manuscript; available in PMC 2010 March 10. Published in final edited form as: Osteoporos Int. 2009 December ; 20(12): 2035–2047. doi:10.1007/s00198-009-0895-0. NIH-PA Author Manuscript NIH-PA Author Manuscript NIH-PA Author Manuscript
-
Upload
independent -
Category
Documents
-
view
0 -
download
0
Transcript of Relative contributions of multiple determinants to bone mineral density in men
Relative Contributions of Multiple Determinants to Bone MineralDensity in Men
Gretchen R. Chiu, Andre B. Araujo, Thomas G. Travison, Susan A. Hall, and John B. McKinlayNew England Research Institutes, Watertown, MA, USA
AbstractIntroduction—Osteoporosis in men has gained recognition as a public health problem, generatingan interest in the search for risk factors. Isolation of individual risk factors could allocatedisproportionate attention to relationships that may be of limited consequence.
Methods—The Boston Area Community Health/Bone (BACH/Bone) Survey is a population-basedstudy of randomly-selected community-dwelling men (age 30-79 y). Bone mineral density (BMD)and lean mass were measured by dual x-ray absorptiometry. Socioeconomic status, health history,and lifestyle factors were obtained via interview. Hormone levels and markers of bone turnover wereobtained from non-fasting blood samples. Multivariate analyses measured relative contributions ofcovariates to femoral neck (hip), 1/3 distal radius (wrist), and lumbar spine BMD.
Results—Factors positively associated with BMD in multivariate models at the three sites wereblack race and appendicular lean mass. Asthma was consistently negatively associated. Various otherrisk factors also contributed significantly to each of the individual sites. R2 values for the hip, wrist,and spine were 41%, 30%, and 24% respectively. Lean mass accounted for the most explainedvariance at all three sites.
Conclusions—These data emphasize the limitation of focusing on individual risk factors andhighlight the importance of potentially modifiable lean mass in predicting BMD.
Keywordsaging; body composition; bone mineral density; men; population studies
IntroductionOsteoporosis in men has gained wide recognition as an understudied public health problem,generating increased attention to male bone fragility as well as new focus on identification ofrisk factors and potential avenues of prevention. Numerous risk factors have been identifiedincluding but not limited to age,(1,2) hormone concentrations,(3-5) serum measures of bonemetabolism,(6-9) lifestyle factors,(10-12) body composition,(13-15) decreased physicalactivity,(12,16) and medication use.(17,18) Recent publications have highlighted the mostimportant risk factors for osteoporosis, fracture risk, and low bone mineral density (BMD) inmen.(19,20)
Research on the potential risk factors for osteoporosis, fracture risk, and low BMD to date hasgenerally focused on one risk factor at a time. As a result, it is possible that disproportionate
Correspondence: Gretchen R. Chiu, M.S. New England Research Institutes 9 Galen Street, Watertown, MA 02472 Phone: 617.923.7747x312, Fax: 617.924.0968 [email protected]. Reprints: Andre B. Araujo, Ph.D. New England Research Institutes 9 Galen Street,Watertown, MA 02472 Phone: 617.923.7747 x452, Fax: 617.924.0968 [email protected].
NIH Public AccessAuthor ManuscriptOsteoporos Int. Author manuscript; available in PMC 2010 March 10.
Published in final edited form as:Osteoporos Int. 2009 December ; 20(12): 2035–2047. doi:10.1007/s00198-009-0895-0.
NIH
-PA Author Manuscript
NIH
-PA Author Manuscript
NIH
-PA Author Manuscript
attention may be given to factors whose relation to osteoporosis, fracture risk, or BMD isspurious or of limited clinical relevance. This highlights the need for assessment of therelative importance of risk factors as contributors to bone fragility. As has been the case withother diseases,(21,22) there has been limited attention given to the relative importance ofcontributors to bone fragility. Most existing attempts (23-32): 1) are restricted to relatively fewpotential risk factors, 2) make sample exclusions which eliminate some potential factors, 3)do not include men, 4) are confined to homogeneous populations, and/or 5) are derived fromconvenience samples.
A recent investigation from The Osteoporotic Fractures in Men Study (MrOS) provided adetailed examination of a large set of potential contributors to decreased BMD in older men.This study showed that body weight, neuromuscular function, personal and family history offracture, diabetes, race and ethnicity, and the use of selected medications were the factors moststrongly correlated with BMD.(33)
In this report, we consider a large class of potential contributors to BMD using data from thecross-sectional Boston Area Community Health / Bone (BACH/Bone) Survey, anobservational study of N=1,219 randomly-selected, community-dwelling men between theages of 30-79 y. Our primary objective is to establish the relative contributions of these factorsto inter-subject variation in BMD at three skeletal sites: the hip (femoral neck), wrist (1/3 distalradius), and lumbar spine (L1-4). BMD at these sites has been shown to predict fractures.(34-37)
Materials and MethodsDesign
The BACH/Bone Survey is a cross-sectional investigation of bone health among 1,219community-dwelling black, Hispanic, and white men, specifically designed to test hypothesesabout race/ethnic differences in skeletal health. BACH/Bone enrolled subjects from the largerBoston Area Community Health (BACH) Survey, a study of 5,501 randomly selected black,Hispanic, and white male and female Boston, MA residents, ages 30 to 79 years. The BACHSurvey employed a multistage stratified cluster design to recruit a random sample, obtainingapproximately equally-sized subsamples by gender, race, and age group (30-39 y, 40-49 y,50-59 y, 60-79 y); baseline data were collected between April 2002 and June 2005.
Following the BACH in-person interviews, male respondents (N=2,301) were invited toparticipate in an additional study on bone health (the BACH/Bone Survey). Exclusion criteriawere weight greater than 300 lbs, inability to lift self onto the scan table, and relocation fromstudy area. Between November 2002 and July 2005, 1,219 (65%) of 1,877 eligible BACH menwere enrolled in BACH/Bone; 1,209 of these subjects completed DXA scans.
The parent BACH Survey protocol was approved by the New England Research Institutes(NERI) Institutional Review Board (IRB) and the BACH/Bone protocol was approved by IRBsat both NERI and BUSM. Written informed consent for each study participant was obtainedindependently. Extensive information concerning the BACH and BACH/Bone designs andsampling procedures has been previously published.(1,38)
Data CollectionInterviews and measurements for BACH and BACH/Bone were conducted by trained staff atNERI and the BUSM’s General Clinical Research Center (GCRC), respectively. Datacollection for BACH generally occurred in participants’ homes. Data used in this investigationfrom BACH included demographic characteristics (age, education, household income, maritalstatus), health status (including family history and self-report of comorbid conditions such as
Chiu et al. Page 2
Osteoporos Int. Author manuscript; available in PMC 2010 March 10.
NIH
-PA Author Manuscript
NIH
-PA Author Manuscript
NIH
-PA Author Manuscript
asthma and high blood pressure), a comprehensive collection of prescription and over-the-counter medication use, and lifestyle attributes (alcohol use, diet with Block food frequencyquestionnaire,(39) physical activity using the Physical Activity Scale for the Elderly (PASE),(40) and smoking). Race/ethnicity was determined according to the federal standard.(41) Menwho were screened as not of black, Hispanic, or white origin were excluded by design fromBACH.
A non-fasting blood sample was collected close to waking time in BACH to control for diurnalvariation in hormone levels (42,43) (median time since awakening 3 h 38 min). Serum sampleswere stored at −80° C until analysis. Testosterone (T), luteinizing hormone (LH), follicle-stimulating hormone (FSH), and sex hormone-binding globulin (SHBG) were measured at theChildren’s Hospital Medical Center Research Laboratories (Boston, MA) by competitiveelectrochemiluminescence immunoassays on the 2010 Elecsys system (Roche Diagnostics,Indianapolis, IN). The lower limits of detection for T, LH, FSH, and SHBG were 2 ng/dL (0.07nmol/L), 0.10 IU/L, 0.10 mIU/mL, and 3 nmol/L, respectively. The inter-assay coefficients ofvariation (CV) for T at concentrations of 24-700 ng/dL (0.83-24.31 nmol/L) were 7.4-1.7%,5.2-2.0% for LH at concentrations of 0.5-50.7 IU/L, 3.8-5.3% for FSH at concentrationsbetween 1.2-103 mIU/mL, and 2.4-2.7% for SHBG at concentrations between 25-95 nmol/L.Estradiol (E2) was measured at the Mayo Clinic Core Laboratory (Rochester, MN) with liquidchromatography-tandem mass spectrometry. The lower limit of detection was 12.5 pg/mL (46pmol/L). E2 values less than 12.5 pg/mL (46 pmol/L) were calculated by manual integrationof chromatograms. The inter-assay CVs for estradiol concentrations 1.25-60 pg/mL (4.6-220pmol/L) ranged between 13.4-6.0%. Free T and E2 concentrations were calculated from totalT or E2 and SHBG concentrations using mass action equations.(44,45)
As part of the BACH/Bone study, BUSM GCRC staff performed the DXA scan, obtainedanthropometric data, and other information. Scans of the femoral neck, 1/3 distal radius, andanteroposterior lumbar spine were performed using a Hologic QDR 4500W densitometer(Hologic, Inc., Waltham, MA). DXA scans were performed and analyzed by trained andcertified technicians. The DXA system was monitored weekly for drift. CVs were less than1.5%.(46) Body composition measures, including total body and regional fat mass (FM) andnonfat mass, were also obtained. Lean mass (LM) was calculated by subtracting the bonemineral content from nonfat mass. Appendicular lean mass (ALM) was generated by addingthe relevant quantities for subjects’ arms and legs.
A non-fasting BACH/Bone blood sample, obtained on average approximately 36 days afterBACH, was collected from each subject. This sample was obtained throughout the day(median: 11:25am, min: 7:45am, max: 7:40pm) and was used to measure 25-hydroxyvitaminD [25(OH)D] [25(OH)D2 + 25(OH)D3], bio-intact parathyroid hormone (PTH), calcium, andbone turnover markers. The 25(OH)D was measured in duplicate by a competitive proteinbinding (CPB) assay without prior chromatography as previously described.(47) Inter-assayCVs were less than 15%. The lower limit of detection for the serum 25(OH)D assay was 5 ng/mL (12.5 nmol/L). PTH was measured with the Nichols Advantage System (Nichols InstituteDiagnostics, San Clemente, CA) (inter-assay CVs were less than 8.3%), as was calcium(Arsenazo III, Quest Diagnostics, Cambridge, MA). Markers of bone turnover included serumintact osteocalcin (OC), a marker of bone formation, and serum C-terminal telopeptides ofType-1 collagen (CTx), a marker of bone resorption. OC was measured in duplicate with theNichols Advantage System (Nichols Institute Diagnostics, San Clemente, CA) and CTx wasmeasured with Serum CrossLaps ELISA (Nordic Bioscience Diagnostics, Herlev, Denmark).Inter-assay CVs for OC and CTx were less than 10% and 8.1%, respectively.
The physical function tests in BACH/Bone included a timed walking test (time needed to walk50 ft) and a chair stand test (time needed to stand up and sit down five times with arms folded).
Chiu et al. Page 3
Osteoporos Int. Author manuscript; available in PMC 2010 March 10.
NIH
-PA Author Manuscript
NIH
-PA Author Manuscript
NIH
-PA Author Manuscript
Following Guralnik et al,(48) we created a composite “physical function” variable as follows:those completing the walking test and chair stands test were assigned scores of 1-4 per test,corresponding to the quartiles of time needed to complete the test, with the fastest time scored4. Those who could not complete the test were assigned a score of 0. The scores from thewalking and chair stands tests were summed together. Since only one subject was not able tocomplete the walking task, we included that subject with those who were in the longest quartileof walking times. Thus, the score ranges from 0- 7.
Additional data collected for the BACH/Bone Survey included height by stadiometer, weightby digital scale, changes in medication use between BACH and BACH/Bone, vitaminsupplement use, and grip strength with a Jamar hydraulic hand dynamometer. Sunlightexposure was assessed with the question, “Over the past 3 months, about how many hours perweek did you usually spend outside. Please include daylight hours only,” with possible answersof <1 h, 1 to <2 h, 2 to <4 h, 4 to <7 h, or 7+ h.
Analytic SampleOf the 1,209 male participants who completed DXA scans, we excluded 20 subjects takingthyroid hormones and 27 subjects taking oral/systemic corticosteroids (as well as budesonideand flunisolide) because both groups of medications have been shown to be related to BMD,and because there were too few subjects to statistically measure any true relationship. Thirty-four subjects missing a DXA scan (either hip, wrist, and/or spine) were also excluded. Thisleft 1,128 men (93%) as a base analysis sample.
Due to missing data for selected covariates, more specific analysis samples were developedfor each BMD site. From the base sample of 1,128 men, the final hip BMD sample was reducedto N=686 (28 missing measures of body composition, 3 missing data on asthma status, 160missing data on caffeine consumption, 3 missing years of education, 2 did not complete thePASE questionnaire, and 246 did not have a free E2 (FE2) value). For the final wrist model,the base sample was reduced to N=985 (28 missing measures of body composition, 3 missingdata on asthma status, 2 missing data related to cancer, and 110 missing grip strengthmeasurements). Similarly, the final spine BMD sample contained 873 men (28 missing leanmass measures, 3 missing data on asthma, 160 missing data on caffeine consumption, and 64were missing a value for CTx).
Statistical MethodsTo account for the complex sampling design, the following analyses were conducted usingSUDAAN 9.0. First, covariates were tested in age-adjusted linear regression models modelingBMD at the hip, wrist, and spine (see full list of covariates in Table 1). Covariates meeting aminimal criterion for association with outcomes (p≤.20) in these age-adjusted regressions wereorganized into groups (e.g., “lifestyle”). Smaller multivariate models containing only thevariables within a group were tested at all three sites in order to determine which covariateswithin the group were most strongly associated with the outcomes. Backwards stepwiseelimination of non-significant covariates was performed on these models using a strongercriterion for association (p≤.10). Finally, a larger multivariate linear regression model wasproduced containing all variables remaining from each sub-model. We again employedbackwards elimination (p≤.10) in order to reach a more parsimonious “final” model.
We used R2 to compare the relative contributions of the groups of variables left in the finalmodel. The R2 for the final model was recorded and each group was removed individually,always controlling for all other variables in the final model. The change in R2, denoted byΔR2, was recorded for removal of each group. Each ΔR2 was then divided by a sum of theΔR2s in order to illustrate the relative contribution of each subgroup:
Chiu et al. Page 4
Osteoporos Int. Author manuscript; available in PMC 2010 March 10.
NIH
-PA Author Manuscript
NIH
-PA Author Manuscript
NIH
-PA Author Manuscript
where i = each of the groups and n = number of groups. This method is a generalization of theR2 method used in previous publications.(49) The result from this equation is a percentage ofthe contribution of a group of variables to the sum of the differences in R2 from all variablegroupings. For this analysis, we use this percentage to estimate the contribution each group ofvariables makes to the explained variance. In this final step, age was considered on its own inorder to capture age differences not expressed by the other covariates.
All models containing ALM were adjusted for height and all models with markers of skeletalmetabolism (i.e., OC, CTx, 25(OH)D, serum calcium, and PTH) were adjusted for time of dayand season of measurement. Additional analyses testing for variation in covariates by race/ethnicity were performed using interaction terms in the final models.
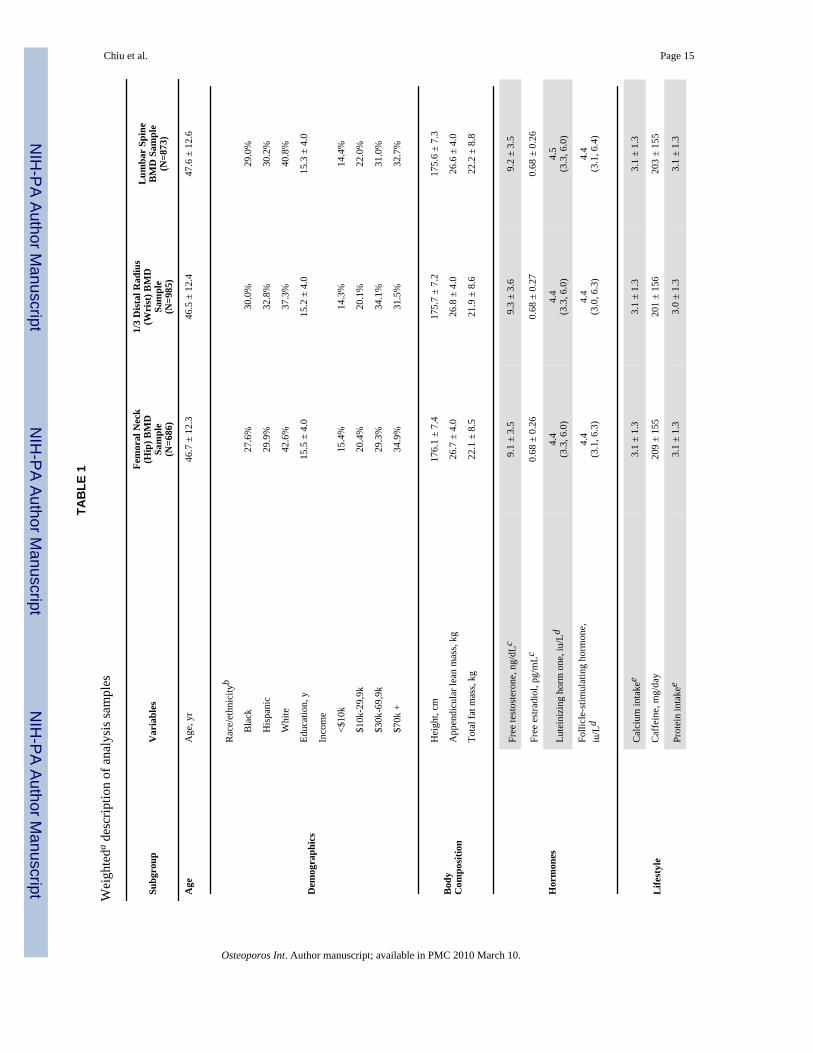
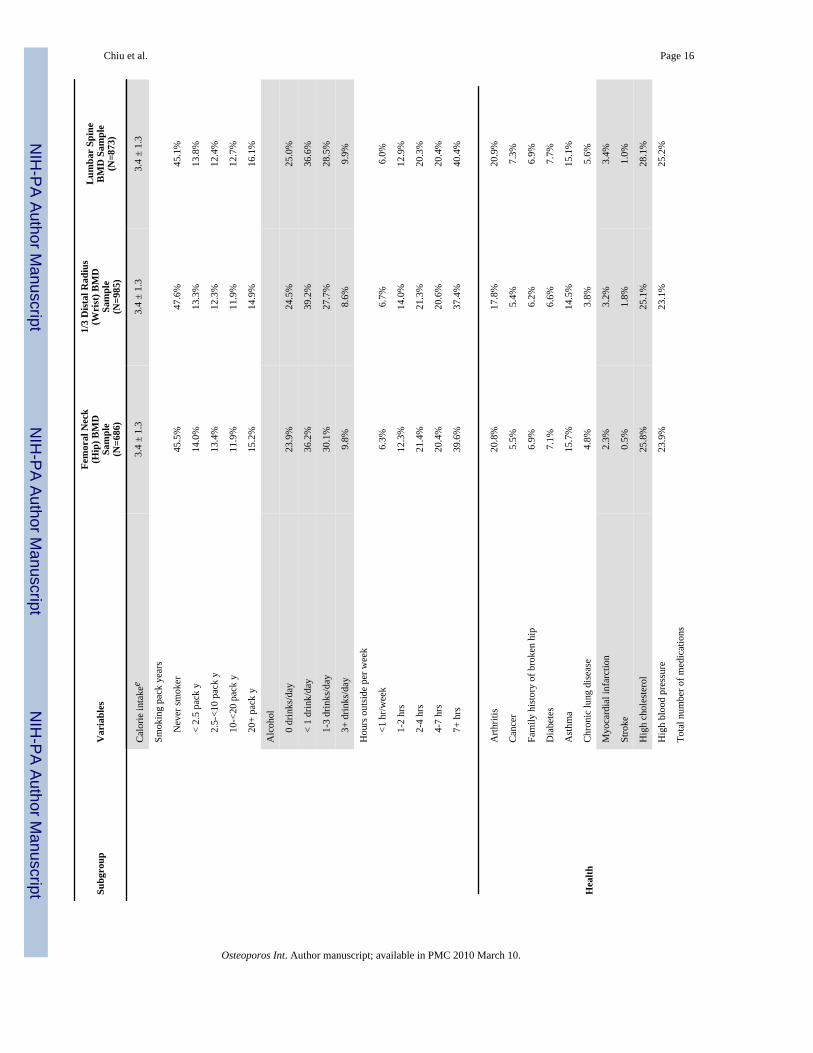
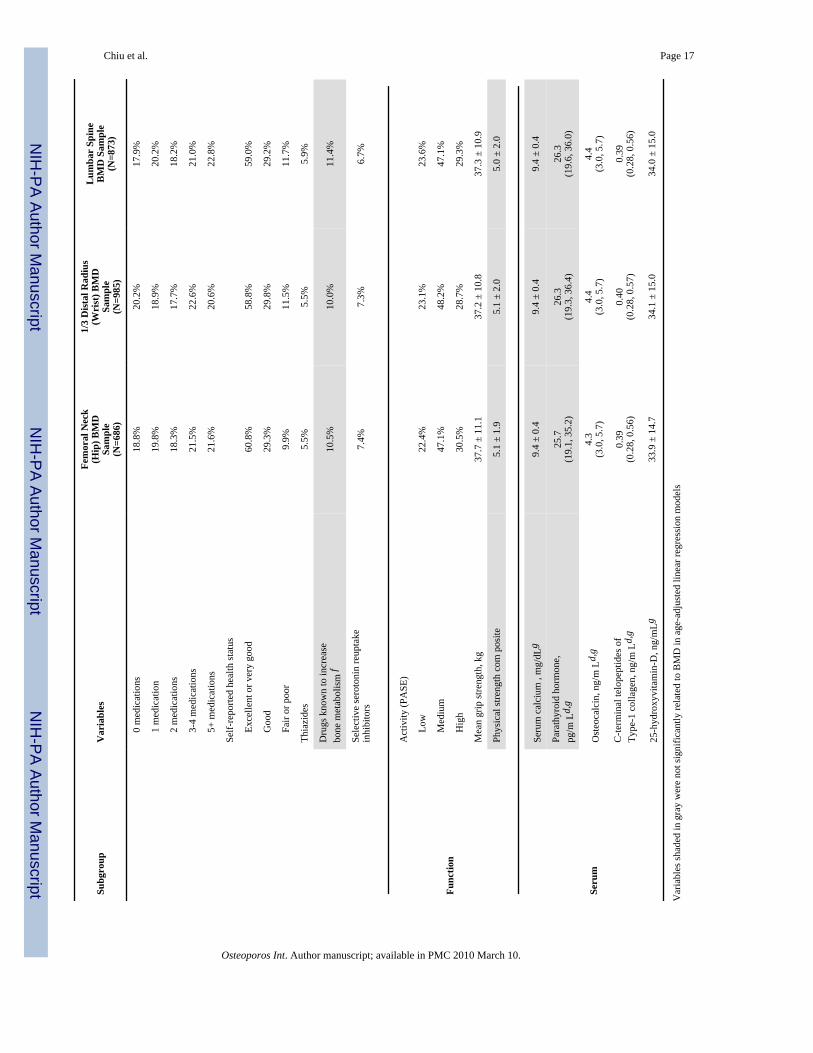
ResultsSummary statistics for the three samples are displayed in Table 1. There was little variation ofcharacteristics between the samples, with subjects aged approximately 47y and with ALM ofabout 27kg. Seven percent of subjects were taking selective serotonin reuptake inhibitors(SSRIs) and about 15% of subjects reported a diagnosis of asthma. Additionally, almost halfof the subjects were non-smokers and about 15% reported over 20 smoking pack-years.
Variables shaded gray in Table 1 were not significantly associated (p>.20) with hip, wrist, orspine BMD in the initial age-adjusted models, and were therefore not considered in futuremultivariate regression models. For example, free T and the physical strength composite didnot contribute to BMD at any of the three sites (p>.50), nor did a grouping of drugs known toincrease bone metabolism (including calcium supplements, vitamin D supplements, and/oranabolic steroids) (p>.22). In an additional analysis (not shown), a count of these drugscategorized into 0, 1, or 2+ showed no significant effect on BMD and no dose-responserelationship. No covariates in final models at any site had a significant interaction with race/ethnicity.
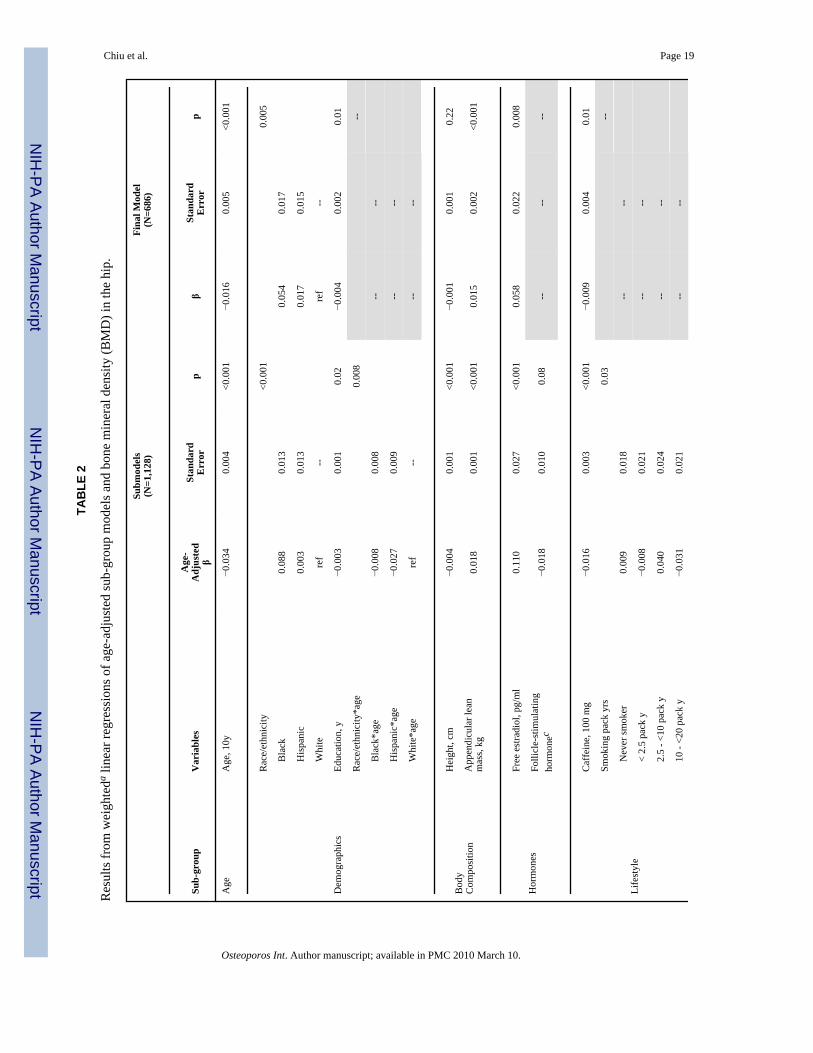
Hip BMDTable 2 displays the age-adjusted linear regressions of the sub-models after backwards stepwiseelimination for hip BMD. In these sub-models, age had a large association with hip BMD; witheach decade increase, BMD was lower by 0.034 g/cm2 (p<.001). Similarly, strong associationswere observed for race/ethnicity in the demographics sub-model, ALM in the bodycomposition sub-model, FE2 in the hormone sub-model, caffeine intake in the lifestyle sub-model, arthritis in the health sub-model, and grip strength in the function sub-model (all p<.001).
The results of the final multivariate model for hip BMD are shown in Table 2. These resultsshow a positive association with ALM and physical activity to BMD, as well as an inverseassociation of caffeine consumption to BMD. As in the demographics sub-model, black menhad a higher average BMD than white and Hispanic men.
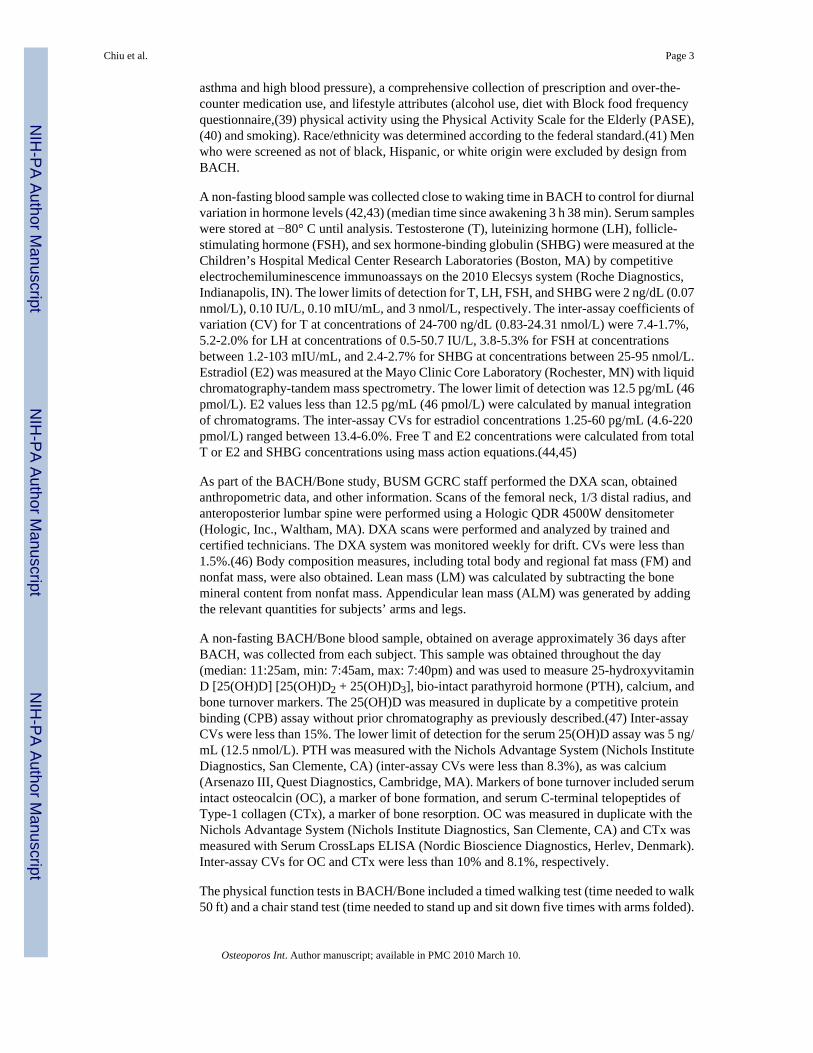
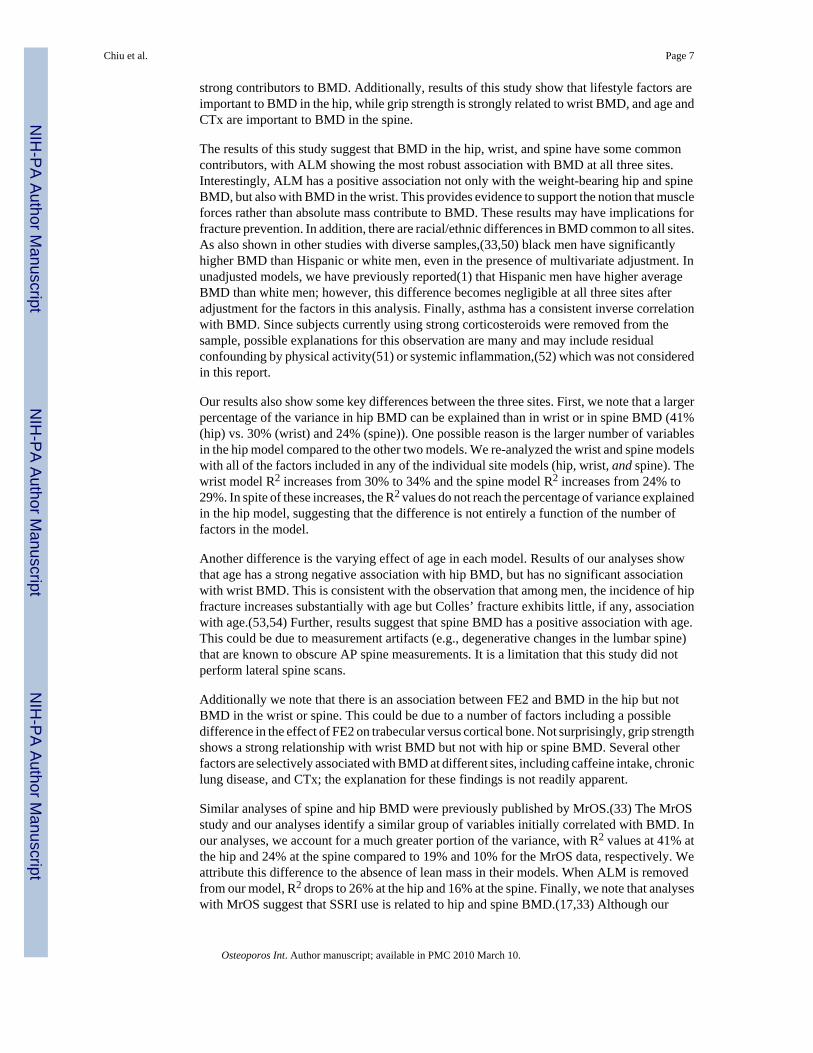
The R2 statistic reveals that the final model accounted for a total of 40.5% of inter-individualvariation in hip BMD. Figure 1 illustrates the non-confounded R2 contribution of each sub-group. Of the contributing groups, the body composition group was the most powerful
Chiu et al. Page 5
Osteoporos Int. Author manuscript; available in PMC 2010 March 10.
NIH
-PA Author Manuscript
NIH
-PA Author Manuscript
NIH
-PA Author Manuscript
explanatory factor with height-adjusted ALM contributed nearly 60% of the change in R2. Thenext largest contributor (17%) was demographics (education, race/ethnicity). Age itselfcontributed 7% of the change in R2, and all other groups contributed less than 5% each.
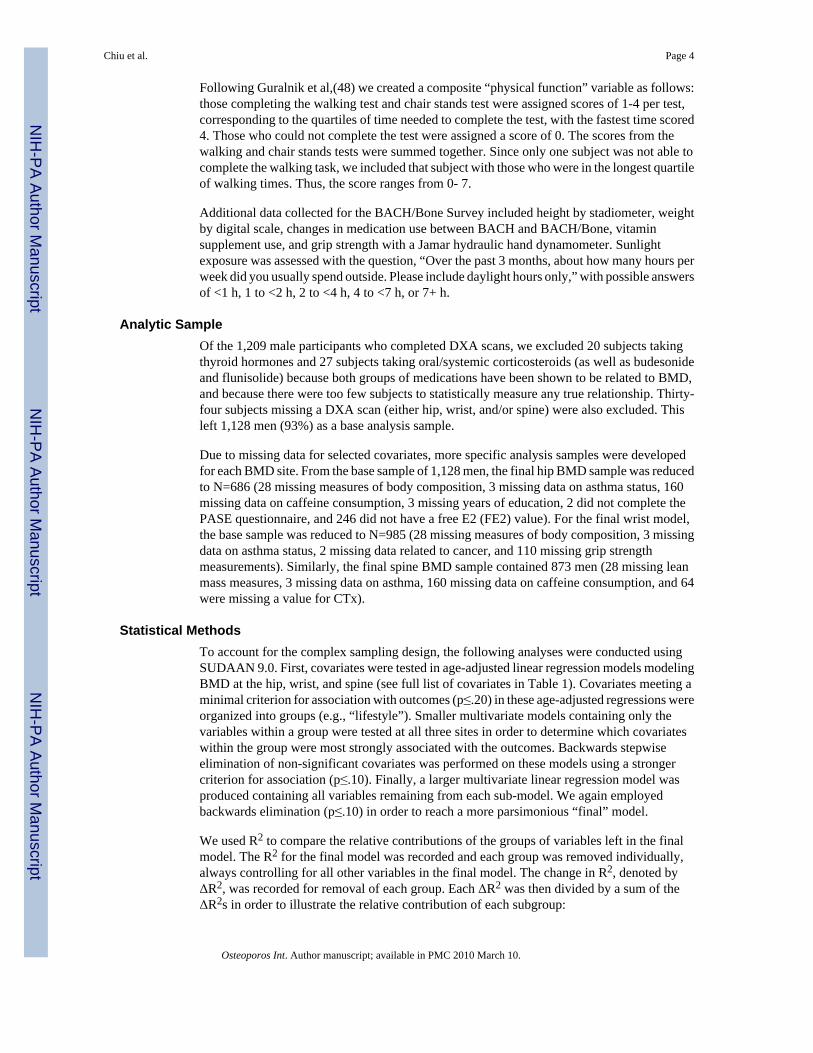
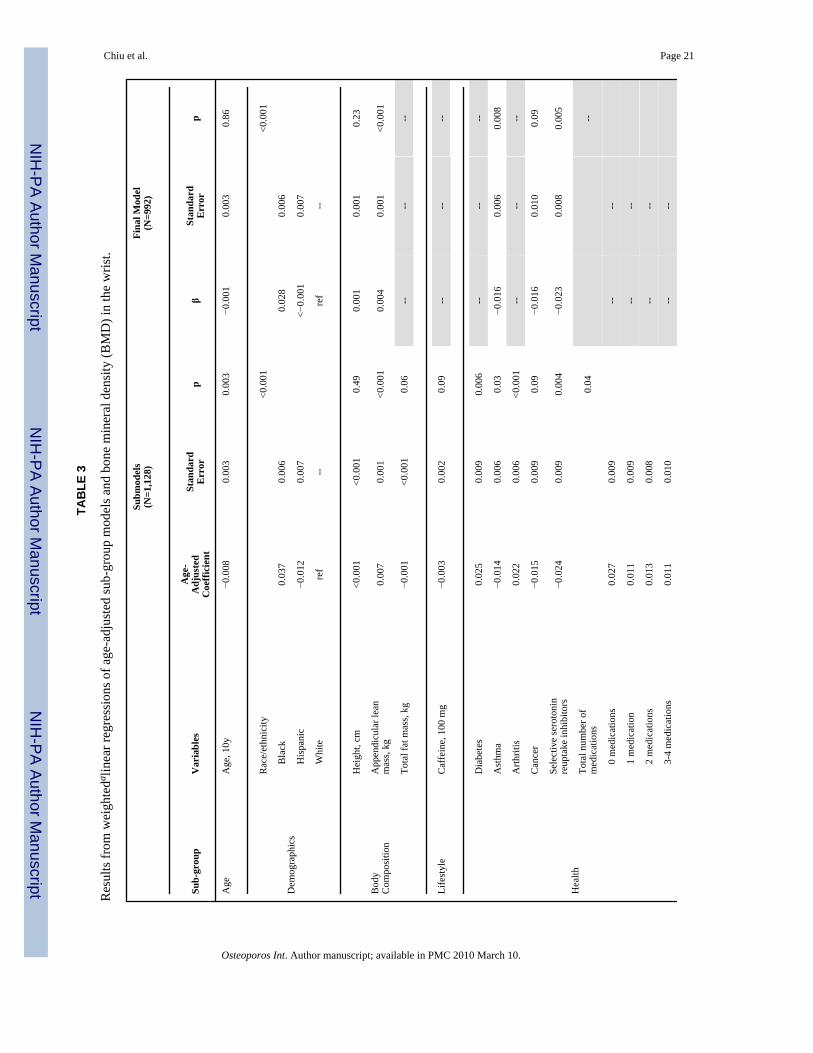
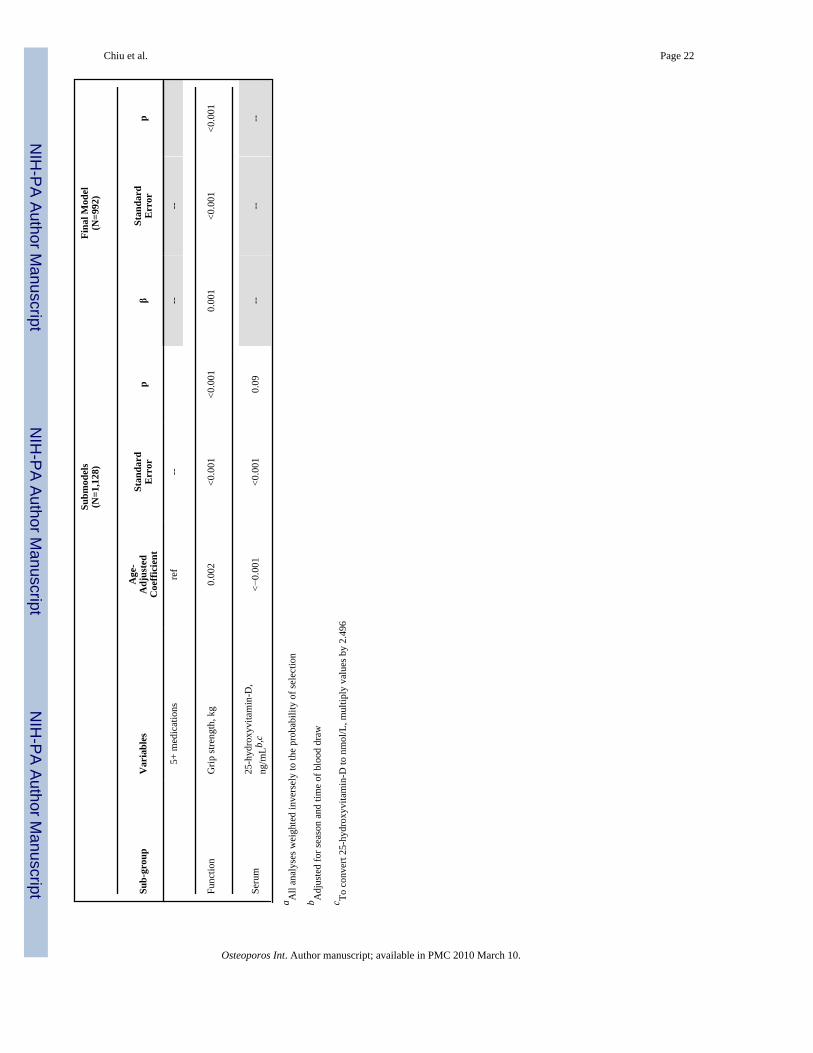
Wrist BMDTable 3 displays the results for wrist BMD models. The center column illustrates the outcomesfrom age-adjusted linear regressions of the sub-models after backwards stepwise elimination.Similar to results in the hip BMD model, age, ALM, race/ethnicity, and several other variableswere significant predictors of wrist BMD. However, no final hormone variables wereassociated in the wrist sub-models and many groups (lifestyle, demographics, serum, andfunction) were reduced to only one significant contributor. SSRIs, arthritis, and diabetes werethe strongest contributors to wrist BMD in the health sub-model.
In the final model for wrist BMD (Table 3), there was a strong positive association betweenwrist BMD and black race, ALM, and grip strength. SSRIs and asthma had significant negativecorrelations with BMD at the wrist.
The R2 statistic reveals that the final model for wrist BMD accounted for a total of 30% ofinter-individual variation. As with the hip data, the body composition group was the mostpowerful explanatory factor (see Figure 2), contributing 43%. Function (grip strength) (23%),demographics (race/ethnicity) (21%), and health (asthma, cancer, SSRIs) (12%) were alsomajor contributors. Hormones were not associated in the previous analytical step, and due tonon-significance of their components, lifestyle and bone-related serum measures were alsoeliminated from the final wrist model. Age contributed 0.1% the change in R2.
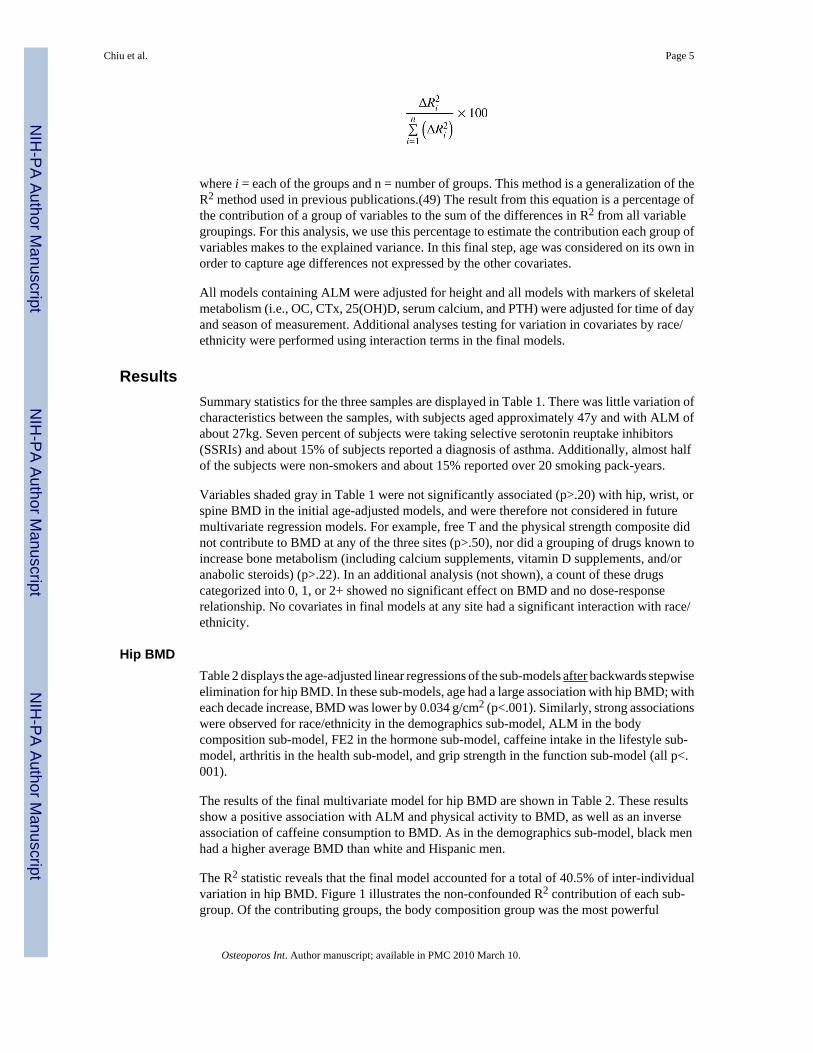
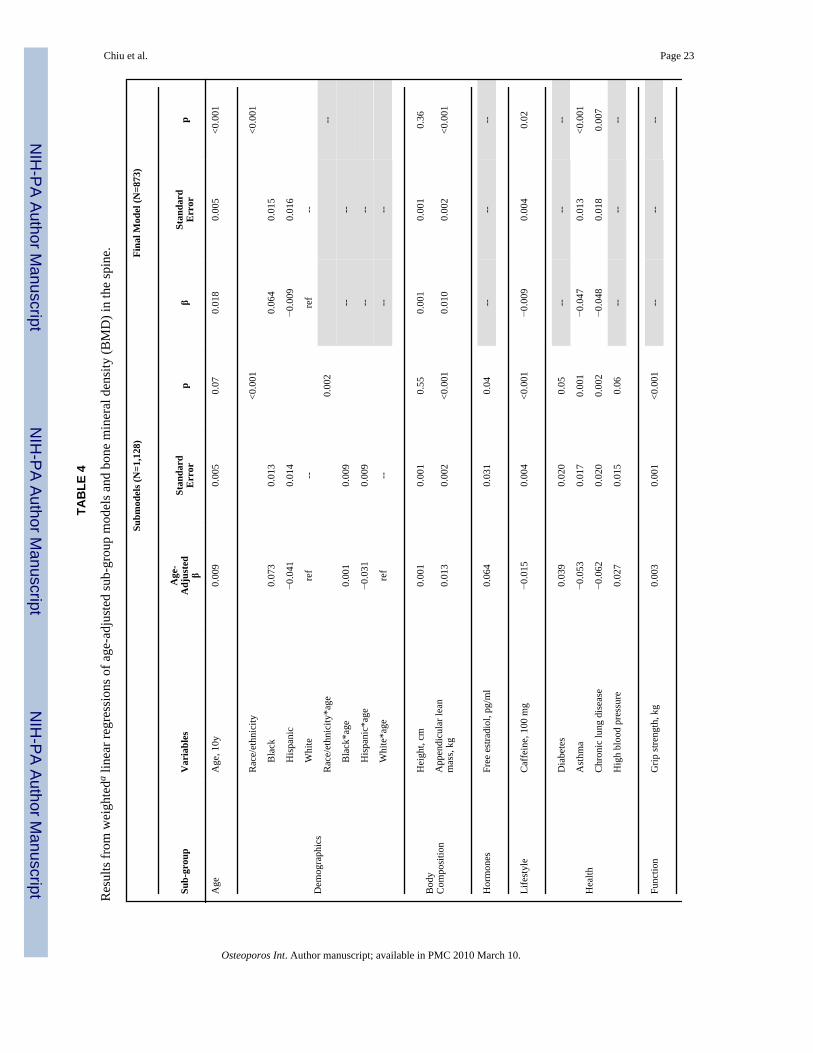
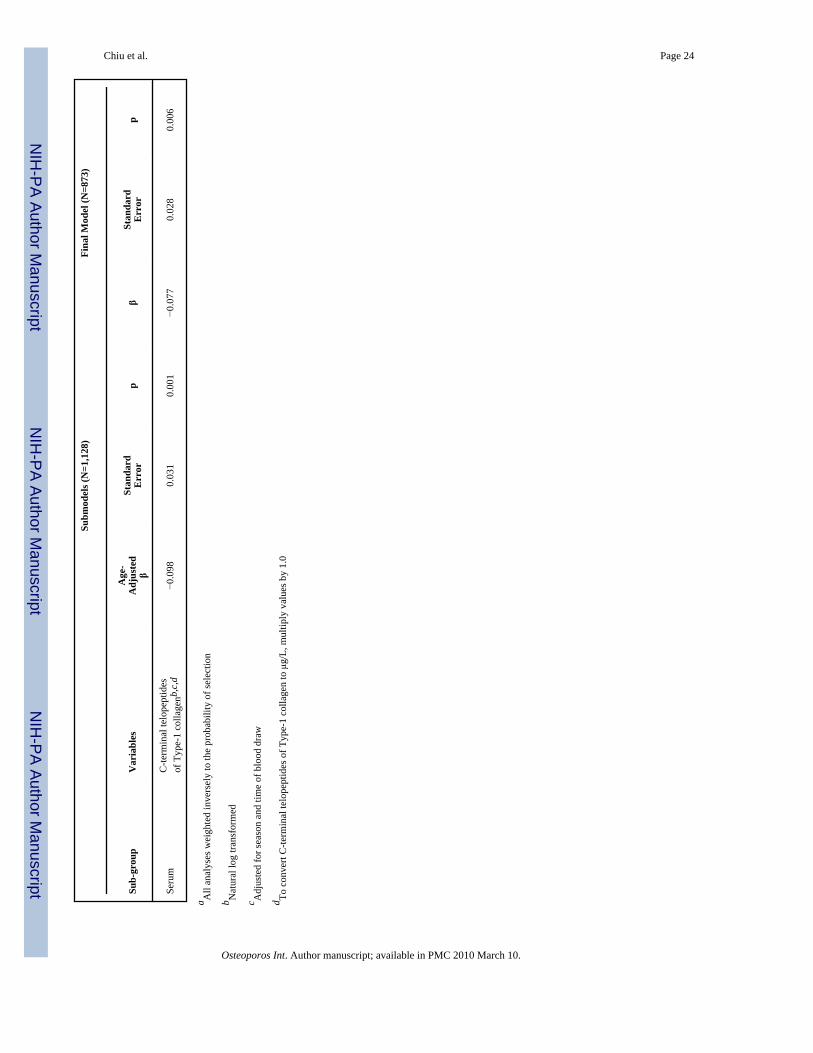
Spine BMDTable 4 displays the age-adjusted linear regressions of the sub-models after backwards stepwiseelimination for spine BMD. Strong associations were observed for race/ethnicity in thedemographics sub-model. Other important correlations in the spine sub-models included: ALMin the body composition sub-model, caffeine intake in the lifestyle sub-model, asthma in thehealth sub-model, grip strength in the function sub-model, and CTx in the serum sub-model(all p≤.001). Chronic lung disease was also a strong predictor of spine BMD.
The final multivariate model for spine BMD is displayed in Table 4. Age, black race, and ALMshow strong positive correlations even after adjustment for the other risk factors. Caffeineintake, asthma, chronic lung disease, and CTx all demonstrated negative cross-sectionalrelationships with spine BMD.
The R2 statistic revealed that this model explained 23.5% of the variance in spine BMD. Figure3 illustrates the comparison of the non-confounded R2 contribution of each sub-group. Of thecontributing groups, the body composition group was the most powerful explanatory factor.Body composition (ALM, height) contributed about 43% of the change in R2. The other largecontributors were demographics (race/ethnicity) with 17%, serum (CTx) with 14%, age with11%, and health (asthma, chronic lung disease) with 11%. Lifestyle factors (caffeine intake)contributed less than 5% of the change in R2.
DiscussionIn this population-based study of men aged 30 to 79, we considered the correlation of a widerange of previously identified risk factors for low BMD, osteoporosis, and fracture risk withBMD levels in the hip, wrist, and spine. As hypothesized, BMD is independently associatedwith a large number of these factors. Adjusting for all strongly related factors, ALM shows themost robust association with BMD at all three sites. Race/ethnicity and health status are also
Chiu et al. Page 6
Osteoporos Int. Author manuscript; available in PMC 2010 March 10.
NIH
-PA Author Manuscript
NIH
-PA Author Manuscript
NIH
-PA Author Manuscript
strong contributors to BMD. Additionally, results of this study show that lifestyle factors areimportant to BMD in the hip, while grip strength is strongly related to wrist BMD, and age andCTx are important to BMD in the spine.
The results of this study suggest that BMD in the hip, wrist, and spine have some commoncontributors, with ALM showing the most robust association with BMD at all three sites.Interestingly, ALM has a positive association not only with the weight-bearing hip and spineBMD, but also with BMD in the wrist. This provides evidence to support the notion that muscleforces rather than absolute mass contribute to BMD. These results may have implications forfracture prevention. In addition, there are racial/ethnic differences in BMD common to all sites.As also shown in other studies with diverse samples,(33,50) black men have significantlyhigher BMD than Hispanic or white men, even in the presence of multivariate adjustment. Inunadjusted models, we have previously reported(1) that Hispanic men have higher averageBMD than white men; however, this difference becomes negligible at all three sites afteradjustment for the factors in this analysis. Finally, asthma has a consistent inverse correlationwith BMD. Since subjects currently using strong corticosteroids were removed from thesample, possible explanations for this observation are many and may include residualconfounding by physical activity(51) or systemic inflammation,(52) which was not consideredin this report.
Our results also show some key differences between the three sites. First, we note that a largerpercentage of the variance in hip BMD can be explained than in wrist or in spine BMD (41%(hip) vs. 30% (wrist) and 24% (spine)). One possible reason is the larger number of variablesin the hip model compared to the other two models. We re-analyzed the wrist and spine modelswith all of the factors included in any of the individual site models (hip, wrist, and spine). Thewrist model R2 increases from 30% to 34% and the spine model R2 increases from 24% to29%. In spite of these increases, the R2 values do not reach the percentage of variance explainedin the hip model, suggesting that the difference is not entirely a function of the number offactors in the model.
Another difference is the varying effect of age in each model. Results of our analyses showthat age has a strong negative association with hip BMD, but has no significant associationwith wrist BMD. This is consistent with the observation that among men, the incidence of hipfracture increases substantially with age but Colles’ fracture exhibits little, if any, associationwith age.(53,54) Further, results suggest that spine BMD has a positive association with age.This could be due to measurement artifacts (e.g., degenerative changes in the lumbar spine)that are known to obscure AP spine measurements. It is a limitation that this study did notperform lateral spine scans.
Additionally we note that there is an association between FE2 and BMD in the hip but notBMD in the wrist or spine. This could be due to a number of factors including a possibledifference in the effect of FE2 on trabecular versus cortical bone. Not surprisingly, grip strengthshows a strong relationship with wrist BMD but not with hip or spine BMD. Several otherfactors are selectively associated with BMD at different sites, including caffeine intake, chroniclung disease, and CTx; the explanation for these findings is not readily apparent.
Similar analyses of spine and hip BMD were previously published by MrOS.(33) The MrOSstudy and our analyses identify a similar group of variables initially correlated with BMD. Inour analyses, we account for a much greater portion of the variance, with R2 values at 41% atthe hip and 24% at the spine compared to 19% and 10% for the MrOS data, respectively. Weattribute this difference to the absence of lean mass in their models. When ALM is removedfrom our model, R2 drops to 26% at the hip and 16% at the spine. Finally, we note that analyseswith MrOS suggest that SSRI use is related to hip and spine BMD.(17,33) Although our
Chiu et al. Page 7
Osteoporos Int. Author manuscript; available in PMC 2010 March 10.
NIH
-PA Author Manuscript
NIH
-PA Author Manuscript
NIH
-PA Author Manuscript

analyses do not show a similar correlation for hip or spine BMD, our results do suggest acorrelation between current use of SSRIs and wrist BMD. The potential association betweenSSRIs and BMD is a relatively new finding and should be explored in future studies.
Results from our analyses using data from the BACH/Bone study provide additional insightsinto individual factors important for predicting BMD in men and highlight the potentialimportance of lifestyle changes that might slow age-related declines in BMD. Consistent withthe findings from many other studies examining body composition and BMD,(13,55) ourresults suggest that lean mass is the strongest predictor of BMD in the hip, spine and wrist.Our data also suggest that lowering caffeine intake and increasing physical activity could havea positive impact on BMD. Of course, randomized trials are needed before reaching definitiveconclusions about how lifestyle changes can modify BMD or fracture risk.
To date, this report provides one of the most in-depth considerations of the relativecontributions to BMD in a large population-based sample of men. The wide range of covariatesavailable for analysis is a clear strength of this study. Not only do we have many variablespreviously determined to be relevant to BMD, but we can also examine the relativecontributions of these factors, rather than their influence in isolation. Furthermore, theprobability sampling and the diversity of race/ethnicity and socioeconomic status amongparticipants allows us to consider subjects that otherwise may generally not present for medicalcare.
Our study also has several limitations. Blood samples were non-fasting and drawn throughoutthe day and year. In order to control for this variation, we have adjusted for the season and timeof blood draw in all models containing markers of skeletal metabolism. Another potentiallimitation is that some of our risk factors were collected via self-report (i.e., nutrition, smoking,comorbidities), as is typical in epidemiologic studies We cannot establish causation due to thecross-sectional design, but the design permits us to measure a ‘snapshot’ of persons in time.While our models may be subject to type I error, our methodology for model selection reducesthe potential for it.
Non-participation may affect our estimates. However, the generalizability of the parent BACHSurvey from which BACH/Bone is drawn is known. BACH men were similar to men in theNational Health and Nutrition Examination Survey, National Health Interview Survey andBehavioral Risk Factor Surveillance Survey with respect to the distributions of common co-morbidities (except asthma, more common in BACH).(38,56) Sixty-five percent of eligibleBACH men participated in the BACH/Bone study. As previously reported, BACH/Boneparticipants differed from BACH participants with respect to variables that might impact BMD;in some cases, the effect would be to overestimate average BMD while in others, average BMDmight be underestimated.(1) However, as summarized above, many of our identifiedassociations in this analysis have been observed in prior studies. In this analysis, our analyticsamples were reduced by missing data. Comparisons of analytic samples to remaining BACH/Bone subjects not in those samples show that the final hip and wrist samples are slightlyyounger (by ~3 y and ~8 y respectively) t, while the spine sample does not differ by age. Thewrist sample contained subjects who have slightly higher ALM than remaining BACH/Bonesubjects.
Our findings identify the potential limitations of risk factor epidemiology as a general approachand highlight the need to better understand the relationships in context with other risk factors.In spite of the fact that we have examined many potential risk factors, we are only able toexplain about half of the variance in BMD observed in this study, suggesting there may beother risk factors for BMD not included in our study. Nevertheless, our findings contribute tothe current literature by suggesting that the most important risk factor for BMD, in the context
Chiu et al. Page 8
Osteoporos Int. Author manuscript; available in PMC 2010 March 10.
NIH
-PA Author Manuscript
NIH
-PA Author Manuscript
NIH
-PA Author Manuscript
of many others, is ALM. Although a causal relationship still needs to be determined, low leanmass is a modifiable risk factor that can be improved with resistance training and physicalactivity. Therefore, our study may have clinical implications for care and future studies ofskeletal health.
AcknowledgmentsFunding Grant Support: The BACH/Bone Survey was supported by grant AG 20727 from the National Institute onAging (NIA). The parent study (BACH) was supported by grant DK 56842 from the National Institute of Diabetesand Digestive and Kidney Diseases. Additional support from MO RR00533.
References1. Araujo AB, Travison TG, Harris SS, Holick MF, Turner AK, McKinlay JB. Race/ethnic differences
in bone mineral density in men. Osteoporos Int 2007;18:943–953. [PubMed: 17340219]2. Looker AC, Wahner HW, Dunn WL, Calvo MS, Harris TB, Heyse SP, Johnston CC Jr. Lindsay R.
Updated data on proximal femur bone mineral levels of US adults. Osteoporos Int 1998;8:468–489.[PubMed: 9850356]
3. Araujo AB, Travison TG, Leder BZ, McKinlay JB. Correlations between serum testosterone, estradiol,and sex hormone-binding globulin and bone mineral density in a diverse sample of men. J ClinEndocrinol Metab 2008;93:2135–2141. [PubMed: 18364385]
4. Khosla S, Melton LJ 3rd, Atkinson EJ, O’Fallon WM. Relationship of serum sex steroid levels tolongitudinal changes in bone density in young versus elderly men. J Clin Endocrinol Metab2001;86:3555–3561. [PubMed: 11502778]
5. Riggs BL, Khosla S, Melton LJ 3rd. Sex steroids and the construction and conservation of the adultskeleton. Endocr Rev 2002;23:279–302. [PubMed: 12050121]
6. Hannan MT, Litman HJ, Araujo AB, McLennan CE, McLean RR, McKinlay JB, Chen TC, HolickMF. Serum 25-hydroxyvitamin D and bone mineral density in a racially and ethnically diverse groupof men. J Clin Endocrinol Metab 2008;93:40–46. [PubMed: 17986641]
7. Leder BZ, Araujo AB, Travison TG, McKinlay JB. Racial and ethnic differences in bone turnovermarkers in men. J Clin Endocrinol Metab 2007;92:3453–3457. [PubMed: 17579203]
8. Nguyen TV, Meier C, Center JR, Eisman JA, Seibel MJ. Bone turnover in elderly men: relationshipsto change in bone mineral density. BMC Musculoskelet Disord 2007;8:13. [PubMed: 17316428]
9. Szulc P, Delmas PD. Biochemical markers of bone turnover in men. Calcif Tissue Int 2001;69:229–234. [PubMed: 11730257]
10. Hannan MT, Tucker KL, Dawson-Hughes B, Cupples LA, Felson DT, Kiel DP. Effect of dietaryprotein on bone loss in elderly men and women: the Framingham Osteoporosis Study. J Bone MinerRes 2000;15:2504–2512. [PubMed: 11127216]
11. Lorentzon M, Mellstrom D, Haug E, Ohlsson C. Smoking is associated with lower bone mineraldensity and reduced cortical thickness in young men. J Clin Endocrinol Metab 2007;92:497–503.[PubMed: 17077132]
12. Reid IR, Plank LD, Evans MC. Fat mass is an important determinant of whole body bone density inpremenopausal women but not in men. J Clin Endocrinol Metab 1992;75:779–782. [PubMed:1517366]
13. Reid IR. Relationships between fat and bone. Osteoporos Int 2008;19:595–606. [PubMed: 17965817]14. Travison TG, Araujo AB, Esche GR, McKinlay JB. The relationship between body composition and
bone mineral content: threshold effects in a racially and ethnically diverse group of men. OsteoporosInt. 2007
15. Zhao LJ, Jiang H, Papasian CJ, Maulik D, Drees B, Hamilton J, Deng HW. Correlation of obesityand osteoporosis: effect of fat mass on the determination of osteoporosis. J Bone Miner Res2008;23:17–29. [PubMed: 17784844]
16. Reid IR, Legge M, Stapleton JP, Evans MC, Grey AB. Regular exercise dissociates fat mass and bonedensity in premenopausal women. J Clin Endocrinol Metab 1995;80:1764–1768. [PubMed: 7775619]
Chiu et al. Page 9
Osteoporos Int. Author manuscript; available in PMC 2010 March 10.
NIH
-PA Author Manuscript
NIH
-PA Author Manuscript
NIH
-PA Author Manuscript

17. Haney EM, Chan BK, Diem SJ, Ensrud KE, Cauley JA, Barrett-Connor E, Orwoll E, Bliziotes MM.Association of low bone mineral density with selective serotonin reuptake inhibitor use by older men.Arch Intern Med 2007;167:1246–1251. [PubMed: 17592097]
18. Wong CA, Walsh LJ, Smith CJ, Wisniewski AF, Lewis SA, Hubbard R, Cawte S, Green DJ, PringleM, Tattersfield AE. Inhaled corticosteroid use and bone-mineral density in patients with asthma.Lancet 2000;355:1399–1403. [PubMed: 10791523]
19. Ebeling PR. Clinical practice. Osteoporosis in men. The New England journal of medicine2008;358:1474–1482. [PubMed: 18385499]
20. Liu H, Paige NM, Goldzweig CL, Wong E, Zhou A, Suttorp MJ, Munjas B, Orwoll E, Shekelle P.Screening for osteoporosis in men: a systematic review for an American College of Physiciansguideline. Ann Intern Med 2008;148:685–701. [PubMed: 18458282]
21. McKinlay JB, Marceau LD. To boldly go. Am J Public Health 2000;90:25–33. [PubMed: 10630133]22. Kleinman KP, McKinlay JB. Prostate cancer: how much do we know and how do we know it? Aging
Male 2000;3:115–123. [PubMed: 16760146]23. Clarke BL, Ebeling PR, Jones JD, Wahner HW, O’Fallon WM, Riggs BL, Fitzpatrick LA. Predictors
of bone mineral density in aging healthy men varies by skeletal site. Calcif Tissue Int 2002;70:137–145. [PubMed: 11907709]
24. Glynn NW, Meilahn EN, Charron M, Anderson SJ, Kuller LH, Cauley JA. Determinants of bonemineral density in older men. J Bone Miner Res 1995;10:1769–1777. [PubMed: 8592955]
25. Hill DD, Cauley JA, Sheu Y, Bunker CH, Patrick AL, Baker CE, Beckles GL, Wheeler VW, ZmudaJM. Correlates of bone mineral density in men of African ancestry: the Tobago bone health study.Osteoporos Int 2008;19:227–234. [PubMed: 17874032]
26. Kenny AM, Prestwood KM, Marcello KM, Raisz LG. Determinants of bone density in healthy oldermen with low testosterone levels. J Gerontol A Biol Sci Med Sci 2000;55:M492–497. [PubMed:10995046]
27. Diaz-Guerra, G Martinez; Hawkins, F.; Rapado, A.; Diaz, MA Ruiz; Diaz-Curiel, M. Hormonal andanthropometric predictors of bone mass in healthy elderly men: major effect of sex hormone bindingglobulin, parathyroid hormone and body weight. Osteoporos Int 2001;12:178–184. [PubMed:11315235]
28. Orwoll ES, Bevan L, Phipps KR. Determinants of bone mineral density in older men. Osteoporos Int2000;11:815–821. [PubMed: 11199184]
29. Proctor DN, Melton LJ, Khosla S, Crowson CS, O’Connor MK, Riggs BL. Relative influence ofphysical activity, muscle mass and strength on bone density. Osteoporos Int 2000;11:944–952.[PubMed: 11193247]
30. Rhee EJ, Oh KW, Lee WY, Kim SW, Oh ES, Baek KH, Kang MI, Park CY, Choi MG, Yoo HJ, ParkSW. Age, body mass index, current smoking history, and serum insulin-like growth factor-I levelsassociated with bone mineral density in middle-aged Korean men. J Bone Miner Metab 2004;22:392–398. [PubMed: 15221500]
31. Smerdely P, Seller M, Smith A, Day P, Diamond T. Predictors of bone mass in healthy older men inthe community. Med J Aust 2000;173:183–186. [PubMed: 11008590]
32. Walker MD, Babbar R, Opotowsky A, McMahon DJ, Liu G, Bilezikian JP. Determinants of bonemineral density in Chinese-American women. Osteoporos Int 2007;18:471–478. [PubMed:17120181]
33. Cauley JA, Fullman RL, Stone KL, Zmuda JM, Bauer DC, Barrett-Connor E, Ensrud K, Lau EM,Orwoll ES. Factors associated with the lumbar spine and proximal femur bone mineral density inolder men. Osteoporos Int 2005;16:1525–1537. [PubMed: 15889316]
34. Cummings SR, Black DM, Nevitt MC, Browner W, Cauley J, Ensrud K, Genant HK, Palermo L,Scott J, Vogt TM. Bone density at various sites for prediction of hip fractures. The Study ofOsteoporotic Fractures Research Group. Lancet 1993;341:72–75. [PubMed: 8093403]
35. Cummings SR, Cawthon PM, Ensrud KE, Cauley JA, Fink HA, Orwoll ES. BMD and risk of hip andnonvertebral fractures in older men: a prospective study and comparison with older women. J BoneMiner Res 2006;21:1550–1556. [PubMed: 16995809]
Chiu et al. Page 10
Osteoporos Int. Author manuscript; available in PMC 2010 March 10.
NIH
-PA Author Manuscript
NIH
-PA Author Manuscript
NIH
-PA Author Manuscript
36. Mackey DC, Lui LY, Cawthon PM, Bauer DC, Nevitt MC, Cauley JA, Hillier TA, Lewis CE, Barrett-Connor E, Cummings SR. High-trauma fractures and low bone mineral density in older women andmen. Jama 2007;298:2381–2388. [PubMed: 18042915]
37. Marshall D, Johnell O, Wedel H. Meta-analysis of how well measures of bone mineral density predictoccurrence of osteoporotic fractures. BMJ 1996;312:1254–1259. [PubMed: 8634613]
38. McKinlay JB, Link CL. Measuring the urologic iceberg: design and implementation of the BostonArea Community Health (BACH) Survey. Eur Urol 2007;52:389–396. [PubMed: 17383808]
39. Block G, Hartman AM, Dresser CM, Carroll MD, Gannon J, Gardner L. A data-based approach todiet questionnaire design and testing. Am J Epidemiol 1986;124:453–469. [PubMed: 3740045]
40. Washburn RA, McAuley E, Katula J, Mihalko SL, Boileau RA. The physical activity scale for theelderly (PASE): evidence for validity. J Clin Epidemiol 1999;52:643–651. [PubMed: 10391658]
41. Wallman K. Data on race and ethnicity: Revising the federal standard. Am Stat 1997:31–35.42. Bremner WJ, Vitiello MV, Prinz PN. Loss of circadian rhythmicity in blood testosterone levels with
aging in normal men. J Clin Endocrinol Metab 1983;56:1278–1281. [PubMed: 6841562]43. Diver MJ, Imtiaz KE, Ahmad AM, Vora JP, Fraser WD. Diurnal rhythms of serum total, free and
bioavailable testosterone and of SHBG in middle-aged men compared with those in young men. ClinEndocrinol (Oxf) 2003;58:710–717. [PubMed: 12780747]
44. Södergard R, Backstrom T, Shanbhag V, Carstensen H. Calculation of free and bound fractions oftestosterone and estradiol-17 beta to human plasma proteins at body temperature. J Steroid Biochem1982;16:801–810. [PubMed: 7202083]
45. Vermeulen A, Verdonck L, Kaufman JM. A critical evaluation of simple methods for the estimationof free testosterone in serum. J Clin Endocrinol Metab 1999;84:3666–3672. [PubMed: 10523012]
46. Baran, D. Manufacturer’s specifications. Hologic Inc; Bedford, MA: 1995. Precision in fan beamdensitometry: A mulit-site validation.
47. Chen TC, Turner AK, Holick MF. Methods for the determination of the circulating concentration of25-hydroxyvitamin D. J Nutr Biochem 1990;1:315–319. [PubMed: 15539221]
48. Guralnik JM, Simonsick EM, Ferrucci L, Glynn RJ, Berkman LF, Blazer DG, Scherr PA, WallaceRB. A short physical performance battery assessing lower extremity function: association with self-reported disability and prediction of mortality and nursing home admission. J Gerontol1994;49:M85–94. [PubMed: 8126356]
49. Hall SA, Esche GR, Araujo AB, Travison TG, Clark RV, Williams RE, McKinlay JB. Correlates oflow testosterone and symptomatic androgen deficiency in a population-based sample. J ClinEndocrinol Metab 2008;93:3870–3877. [PubMed: 18664536]
50. George A, Tracy JK, Meyer WA, Flores RH, Wilson PD, Hochberg MC. Racial differences in bonemineral density in older men. J Bone Miner Res 2003;18:2238–2244. [PubMed: 14672360]
51. Ford ES, Heath GW, Mannino DM, Redd SC. Leisure-time physical activity patterns among USadults with asthma. Chest 2003;124:432–437. [PubMed: 12907526]
52. Ding C, Parameswaran V, Udayan R, Burgess J, Jones G. Circulating levels of inflammatory markerspredict change in bone mineral density and resorption in older adults: a longitudinal study. J ClinEndocrinol Metab 2008;93:1952–1958. [PubMed: 18285417]
53. Baron JA, Karagas M, Barrett J, Kniffin W, Malenka D, Mayor M, Keller RB. Basic epidemiologyof fractures of the upper and lower limb among Americans over 65 years of age. Epidemiology1996;7:612–618. [PubMed: 8899387]
54. O’Neill TW, Cooper C, Finn JD, Lunt M, Purdie D, Reid DM, Rowe R, Woolf AD, Wallace WA.Incidence of distal forearm fracture in British men and women. Osteoporos Int 2001;12:555–558.[PubMed: 11527052]
55. Zhao LJ, Liu YJ, Liu PY, Hamilton J, Recker RR, Deng HW. Relationship of obesity withosteoporosis. J Clin Endocrinol Metab. 2007
56. New England Research Institutes. Can the BACH data be generalized to the U.S. population?Comparison of BACH batch 1-4 data with data from three national surveys (NHIS, NHANES, andBRFSS) Web-based technical report. New England Research Institutes; 2006.
Chiu et al. Page 11
Osteoporos Int. Author manuscript; available in PMC 2010 March 10.
NIH
-PA Author Manuscript
NIH
-PA Author Manuscript
NIH
-PA Author Manuscript
Fig. 1.Femoral neck (hip) bone mineral density variance. Unexplained and explained variances fromR2 of final model. Percentages for each contributing subgroup calculated using this formula:
. The full model contains: lifestyle (caffeine), function (PASE categories),health (asthma), hormones (free estradiol), age, demographics (education, race/ethnicity), andbody composition (height-adjusted appendicular lean mass) subgroups.
Chiu et al. Page 12
Osteoporos Int. Author manuscript; available in PMC 2010 March 10.
NIH
-PA Author Manuscript
NIH
-PA Author Manuscript
NIH
-PA Author Manuscript
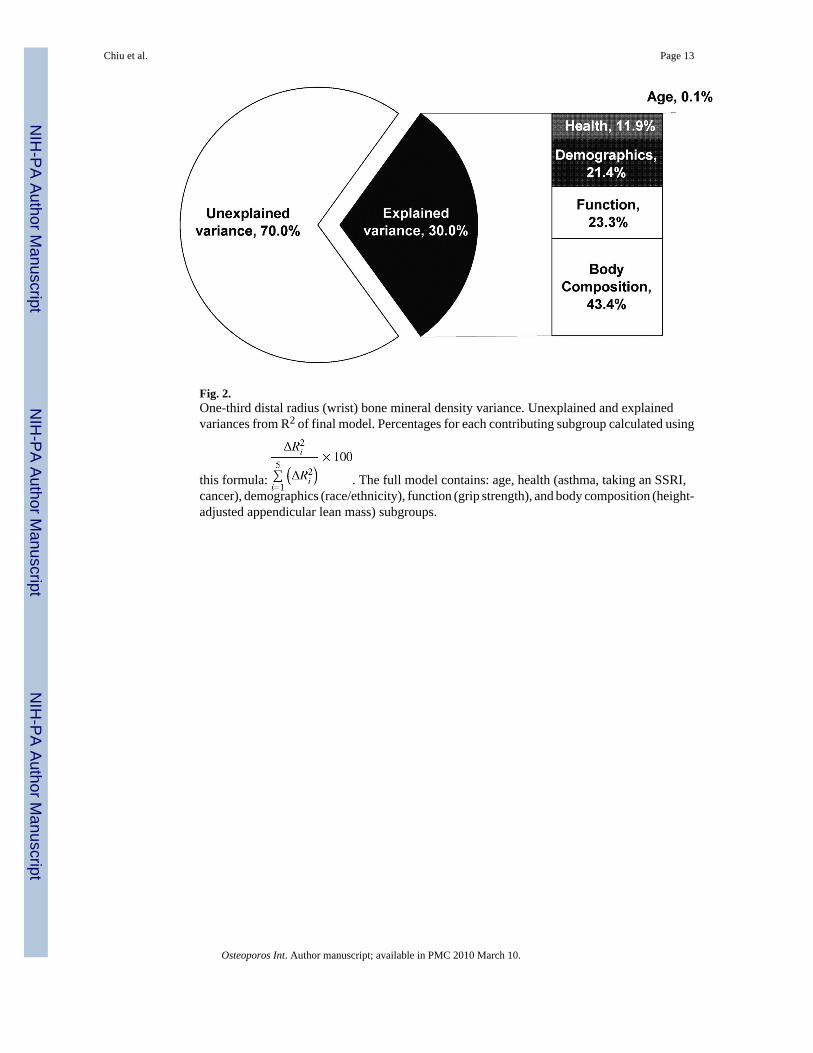
Fig. 2.One-third distal radius (wrist) bone mineral density variance. Unexplained and explainedvariances from R2 of final model. Percentages for each contributing subgroup calculated using
this formula: . The full model contains: age, health (asthma, taking an SSRI,cancer), demographics (race/ethnicity), function (grip strength), and body composition (height-adjusted appendicular lean mass) subgroups.
Chiu et al. Page 13
Osteoporos Int. Author manuscript; available in PMC 2010 March 10.
NIH
-PA Author Manuscript
NIH
-PA Author Manuscript
NIH
-PA Author Manuscript
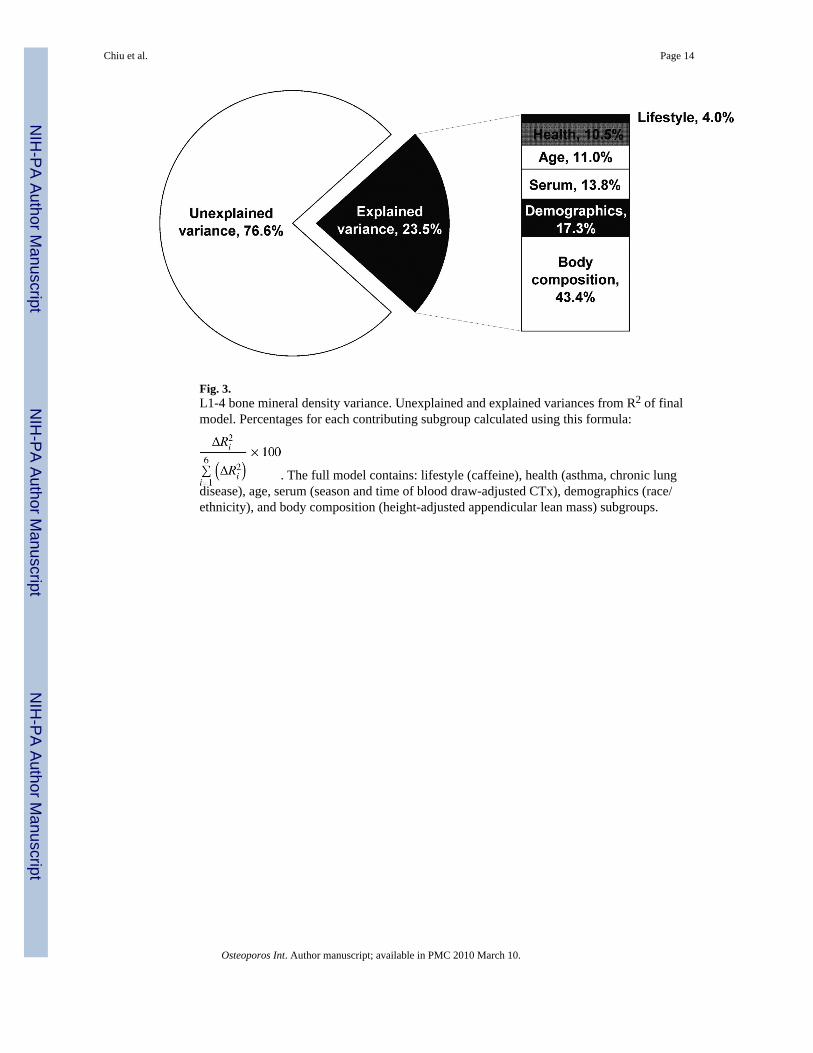
Fig. 3.L1-4 bone mineral density variance. Unexplained and explained variances from R2 of finalmodel. Percentages for each contributing subgroup calculated using this formula:
. The full model contains: lifestyle (caffeine), health (asthma, chronic lungdisease), age, serum (season and time of blood draw-adjusted CTx), demographics (race/ethnicity), and body composition (height-adjusted appendicular lean mass) subgroups.
Chiu et al. Page 14
Osteoporos Int. Author manuscript; available in PMC 2010 March 10.
NIH
-PA Author Manuscript
NIH
-PA Author Manuscript
NIH
-PA Author Manuscript
NIH
-PA Author Manuscript
NIH
-PA Author Manuscript
NIH
-PA Author Manuscript
Chiu et al. Page 15
TAB
LE 1
Wei
ghte
da des
crip
tion
of a
naly
sis s
ampl
es
Subg
roup
Var
iabl
esFe
mor
al N
eck
(Hip
) BM
DSa
mpl
e(N
=686
)
1/3
Dis
tal R
adiu
s(W
rist
) BM
DSa
mpl
e(N
=985
)
Lum
bar
Spin
eB
MD
Sam
ple
(N=8
73)
Age
Age
, yr
46.7
± 1
2.3
46.5
± 1
2.4
47.6
± 1
2.6
Dem
ogra
phic
s
Rac
e/et
hnic
ityb
B
lack
27.6
%30
.0%
29.0
%
H
ispa
nic
29.9
%32
.8%
30.2
%
W
hite
42.6
%37
.3%
40.8
%
Educ
atio
n, y
15.5
± 4
.015
.2 ±
4.0
15.3
± 4
.0
Inco
me
<$
10k
15.4
%14
.3%
14.4
%
$1
0k-2
9,9k
20.4
%20
.1%
22.0
%
$3
0k-6
9,9k
29.3
%34
.1%
31.0
%
$7
0k +
34.9
%31
.5%
32.7
%
Bod
yC
ompo
sitio
n
Hei
ght,
cm17
6.1
± 7.
417
5.7
± 7.
217
5.6
± 7.
3
App
endi
cula
r lea
n m
ass,
kg26
.7 ±
4.0
26.8
± 4
.026
.6 ±
4.0
Tota
l fat
mas
s, kg
22.1
± 8
.521
.9 ±
8.6
22.2
± 8
.8
Hor
mon
es
Free
test
oste
rone
, ng/
dLc
9.1
± 3.
59.
3 ±
3.6
9.2
± 3.
5
Free
est
radi
ol, p
g/m
Lc0.
68 ±
0.2
60.
68 ±
0.2
70.
68 ±
0.2
6
Lute
iniz
ing
horm
one
, iu/
Ld4.
4(3
.3, 6
.0)
4.4
(3.3
, 6.0
)4.
5(3
.3, 6
.0)
Folli
cle-
stim
ulat
ing
horm
one,
iu/L
d4.
4(3
.1, 6
.3)
4.4
(3.0
, 6.3
)4.
4(3
.1, 6
.4)
Life
styl
e
Cal
cium
inta
kee
3.1
± 1.
33.
1 ±
1.3
3.1
± 1.
3
Caf
fein
e, m
g/da
y20
9 ±
155
201
± 15
620
3 ±
155
Prot
ein
inta
kee
3.1
± 1.
33.
0 ±
1.3
3.1
± 1.
3
Osteoporos Int. Author manuscript; available in PMC 2010 March 10.
NIH
-PA Author Manuscript
NIH
-PA Author Manuscript
NIH
-PA Author Manuscript
Chiu et al. Page 16
Subg
roup
Var
iabl
esFe
mor
al N
eck
(Hip
) BM
DSa
mpl
e(N
=686
)
1/3
Dis
tal R
adiu
s(W
rist
) BM
DSa
mpl
e(N
=985
)
Lum
bar
Spin
eB
MD
Sam
ple
(N=8
73)
Cal
orie
inta
kee
3.4
± 1.
33.
4 ±
1.3
3.4
± 1.
3
Smok
ing
pack
yea
rs
N
ever
smok
er45
.5%
47.6
%45
.1%
<
2.5
pack
y14
.0%
13.3
%13
.8%
2.
5-<1
0 pa
ck y
13.4
%12
.3%
12.4
%
10
-<20
pac
k y
11.9
%11
.9%
12.7
%
20
+ pa
ck y
15.2
%14
.9%
16.1
%
Alc
ohol
0
drin
ks/d
ay23
.9%
24.5
%25
.0%
<
1 dr
ink/
day
36.2
%39
.2%
36.6
%
1-
3 dr
inks
/day
30.1
%27
.7%
28.5
%
3+
drin
ks/d
ay9.
8%8.
6%9.
9%
Hou
rs o
utsi
de p
er w
eek
<1
hr/w
eek
6.3%
6.7%
6.0%
1-
2 hr
s12
.3%
14.0
%12
.9%
2-
4 hr
s21
.4%
21.3
%20
.3%
4-
7 hr
s20
.4%
20.6
%20
.4%
7+
hrs
39.6
%37
.4%
40.4
%
Hea
lth
Arth
ritis
20.8
%17
.8%
20.9
%
Can
cer
5.5%
5.4%
7.3%
Fam
ily h
isto
ry o
f bro
ken
hip
6.9%
6.2%
6.9%
Dia
bete
s7.
1%6.
6%7.
7%
Ast
hma
15.7
%14
.5%
15.1
%
Chr
onic
lung
dis
ease
4.8%
3.8%
5.6%
Myo
card
ial i
nfar
ctio
n2.
3%3.
2%3.
4%
Stro
ke0.
5%1.
8%1.
0%
Hig
h ch
oles
tero
l25
.8%
25.1
%28
.1%
Hig
h bl
ood
pres
sure
23.9
%23
.1%
25.2
%
Tota
l num
ber o
f med
icat
ions
Osteoporos Int. Author manuscript; available in PMC 2010 March 10.
NIH
-PA Author Manuscript
NIH
-PA Author Manuscript
NIH
-PA Author Manuscript
Chiu et al. Page 17
Subg
roup
Var
iabl
esFe
mor
al N
eck
(Hip
) BM
DSa
mpl
e(N
=686
)
1/3
Dis
tal R
adiu
s(W
rist
) BM
DSa
mpl
e(N
=985
)
Lum
bar
Spin
eB
MD
Sam
ple
(N=8
73)
0
med
icat
ions
18.8
%20
.2%
17.9
%
1
med
icat
ion
19.8
%18
.9%
20.2
%
2
med
icat
ions
18.3
%17
.7%
18.2
%
3-
4 m
edic
atio
ns21
.5%
22.6
%21
.0%
5+
med
icat
ions
21.6
%20
.6%
22.8
%
Self-
repo
rted
heal
th st
atus
Ex
celle
nt o
r ver
y go
od60
.8%
58.8
%59
.0%
G
ood
29.3
%29
.8%
29.2
%
Fa
ir or
poo
r9.
9%11
.5%
11.7
%
Thia
zide
s5.
5%5.
5%5.
9%
Dru
gs k
now
n to
incr
ease
bone
met
abol
ism
f10
.5%
10.0
%11
.4%
Sele
ctiv
e se
roto
nin
reup
take
inhi
bito
rs7.
4%7.
3%6.
7%
Func
tion
Act
ivity
(PA
SE)
Lo
w22
.4%
23.1
%23
.6%
M
ediu
m47
.1%
48.2
%47
.1%
H
igh
30.5
%28
.7%
29.3
%
Mea
n gr
ip st
reng
th, k
g37
.7 ±
11.
137
.2 ±
10.
837
.3 ±
10.
9
Phys
ical
stre
ngth
com
pos
ite5.
1 ±
1.9
5.1
± 2.
05.
0 ±
2.0
Seru
m
Seru
m c
alci
um ,
mg/
dLg
9.4
± 0.
49.
4 ±
0.4
9.4
± 0.
4
Para
thyr
oid
horm
one,
pg/m
Ld,
g25
.7(1
9.1,
35.
2)26
.3(1
9.3,
36.
4)26
.3(1
9.6,
36.
0)
Ost
eoca
lcin
, ng/
m L
d,g
4.3
(3.0
, 5.7
)4.
4(3
.0, 5
.7)
4.4
(3.0
, 5.7
)
C-te
rmin
al te
lope
ptid
es o
fTy
pe-1
col
lage
n, n
g/m
Ld,
g0.
39(0
.28,
0.5
6)0.
40(0
.28,
0.5
7)0.
39(0
.28,
0.5
6)
25-h
ydro
xyvi
tam
in-D
, ng/
mLg
33.9
± 1
4.7
34.1
± 1
5.0
34.0
± 1
5.0
Var
iabl
es sh
aded
in g
ray
wer
e no
t sig
nific
antly
rela
ted
to B
MD
in a
ge-a
djus
ted
linea
r reg
ress
ion
mod
els
Osteoporos Int. Author manuscript; available in PMC 2010 March 10.
NIH
-PA Author Manuscript
NIH
-PA Author Manuscript
NIH
-PA Author Manuscript
Chiu et al. Page 18a A
ll an
alys
es w
eigh
ted
inve
rsel
y to
the
prob
abili
ty o
f sel
ectio
n
b Un-
wei
ghte
d pe
rcen
tage
s
c Con
vers
ion
fact
ors:
free
test
oste
rone
(toc
onve
rt to
nm
ol/L
, mul
tiply
val
ues b
y 0.
0347
); fr
ee e
stra
diol
(to
conv
ert t
o pm
ol/L
, mul
tiply
val
ues b
y 3.
671)
d Due
to sk
ewed
val
ues t
hese
are
med
ians
and
the
25%
and
75%
qua
rtile
s
e Thes
e va
riabl
es w
ere
divi
ded
into
qui
ntile
s acr
oss t
he e
ntire
sam
ple.
The
num
bers
pre
sent
ed re
pres
ent w
hich
qui
ntile
they
fell
into
by
sub-
sam
ple
(i.e.
a 2
.5 w
ould
sign
ify c
alci
um in
take
of l
ow to
med
ium
inta
ke c
ompa
red
to th
e re
st o
f the
sam
ple)
f Cal
cium
supp
lem
ents
, vita
min
D su
pple
men
ts, a
nd/o
r ana
bolic
ster
oids
g Con
vers
ion
fact
ors:
seru
m c
alci
um (t
o co
nver
t to
mm
ol/L
, mul
tiply
val
ues b
y 0.
25);
para
thyr
oid
horm
one
(to c
onve
rt to
ng/
L, m
ultip
ly v
alue
s by
0.10
53);
oste
ocal
cin
& C
-term
inal
telo
pept
ides
of T
ype-
1co
llage
n, (t
o co
nver
t to μg
/L, m
ultip
ly v
alue
s by
1.0)
; 25-
hydr
oxyv
itam
in-D
(to
conv
ert t
o nm
ol/L
, mul
tiply
val
ues b
y 2.
496)
Osteoporos Int. Author manuscript; available in PMC 2010 March 10.
NIH
-PA Author Manuscript
NIH
-PA Author Manuscript
NIH
-PA Author Manuscript
Chiu et al. Page 19
TAB
LE 2
Res
ults
from
wei
ghte
da lin
ear r
egre
ssio
ns o
f age
-adj
uste
d su
b-gr
oup
mod
els a
nd b
one
min
eral
den
sity
(BM
D) i
n th
e hi
p.
Subm
odel
s(N
=1,1
28)
Fina
l Mod
el(N
=686
)
Sub-
grou
pV
aria
bles
Age
-A
djus
ted
βSt
anda
rdE
rror
pβ
Stan
dard
Err
orp
Age
Age
, 10y
−0.0
340.
004
<0.0
01−0
.016
0.00
5<0
.001
Dem
ogra
phic
s
Rac
e/et
hnic
ity<0
.001
0.00
5
B
lack
0.08
80.
013
0.05
40.
017
H
ispa
nic
0.00
30.
013
0.01
70.
015
W
hite
ref
--re
f--
Educ
atio
n, y
−0.0
030.
001
0.02
−0.0
040.
002
0.01
Rac
e/et
hnic
ity*a
ge0.
008
--
B
lack
*age
−0.0
080.
008
----
H
ispa
nic*
age
−0.0
270.
009
----
W
hite
*age
ref
----
--
Bod
yC
ompo
sitio
n
Hei
ght,
cm−0
.004
0.00
1<0
.001
−0.0
010.
001
0.22
App
endi
cula
r lea
nm
ass,
kg0.
018
0.00
1<0
.001
0.01
50.
002
<0.0
01
Hor
mon
esFr
ee e
stra
diol
, pg/
ml
0.11
00.
027
<0.0
010.
058
0.02
20.
008
Folli
cle-
stim
ulat
ing
horm
onec
−0.0
180.
010
0.08
----
--
Life
styl
e
Caf
fein
e, 1
00 m
g−0
.016
0.00
3<0
.001
−0.0
090.
004
0.01
Smok
ing
pack
yrs
0.03
--
N
ever
smok
er0.
009
0.01
8--
--
<
2.5
pack
y−0
.008
0.02
1--
--
2.
5 - <
10 p
ack
y0.
040
0.02
4--
--
10
- <2
0 pa
ck y
−0.0
310.
021
----
Osteoporos Int. Author manuscript; available in PMC 2010 March 10.
NIH
-PA Author Manuscript
NIH
-PA Author Manuscript
NIH
-PA Author Manuscript
Chiu et al. Page 20
Subm
odel
s(N
=1,1
28)
Fina
l Mod
el(N
=686
)
Sub-
grou
pV
aria
bles
Age
-A
djus
ted
βSt
anda
rdE
rror
pβ
Stan
dard
Err
orp
20
+ pa
ck y
ref
----
--
Hea
lth
Dia
bete
s0.
037
0.01
80.
03--
----
Ast
hma
−0.0
290.
016
0.08
−0.0
410.
012
0.00
1
Arth
ritis
0.04
30.
012
<0.0
01--
----
Can
cer
−0.0
390.
018
0.03
----
--
Chr
onic
lung
dis
ease
−0.0
430.
021
0.04
----
--
Hig
h bl
ood
pres
sure
0.03
90.
013
0.00
4--
----
Tota
l num
ber o
fm
edic
atio
ns0.
06--
0
med
icat
ions
0.04
70.
022
----
1
med
icat
ion
0.01
80.
019
----
2
med
icat
ions
0.02
30.
018
----
3-
4 m
edic
atio
ns−0
.002
0.01
7--
--
5+
med
icat
ions
ref
----
--
Func
tion
Grip
stre
ngth
, kg
0.00
20.
001
<0.0
01--
----
Act
ivity
(PA
SE)
0.06
0.03
Lo
w−0
.044
0.01
8−0
.042
0.01
6
M
ediu
m−0
.015
0.01
4−0
.021
0.01
3
H
igh
ref
--re
f--
Seru
mO
steo
calc
in, n
g/m
Lb,c
,d−0
.021
0.00
90.
02--
----
a All
anal
yses
wei
ghte
d in
vers
ely
to th
e pr
obab
ility
of s
elec
tion
b Nat
ural
log
trans
form
ed
c Adj
uste
d fo
r sea
son
and
time
of b
lood
dra
w
d To c
onve
rt os
teoc
alci
n to
μg/
L, m
ultip
ly v
alue
s by
1.0
Osteoporos Int. Author manuscript; available in PMC 2010 March 10.
NIH
-PA Author Manuscript
NIH
-PA Author Manuscript
NIH
-PA Author Manuscript
Chiu et al. Page 21
TAB
LE 3
Res
ults
from
wei
ghte
da line
ar re
gres
sion
s of a
ge-a
djus
ted
sub-
grou
p m
odel
s and
bon
e m
iner
al d
ensi
ty (B
MD
) in
the
wris
t.
Subm
odel
s(N
=1,1
28)
Fina
l Mod
el(N
=992
)
Sub-
grou
pV
aria
bles
Age
-A
djus
ted
Coe
ffici
ent
Stan
dard
Err
orp
βSt
anda
rdE
rror
p
Age
Age
, 10y
−0.0
080.
003
0.00
3−0
.001
0.00
30.
86
Dem
ogra
phic
s
Rac
e/et
hnic
ity<0
.001
<0.0
01
B
lack
0.03
70.
006
0.02
80.
006
H
ispa
nic
−0.0
120.
007
<−0.
001
0.00
7
W
hite
ref
--re
f--
Bod
yC
ompo
sitio
n
Hei
ght,
cm<0
.001
<0.0
010.
490.
001
0.00
10.
23
App
endi
cula
r lea
nm
ass,
kg0.
007
0.00
1<0
.001
0.00
40.
001
<0.0
01
Tota
l fat
mas
s, kg
−0.0
01<0
.001
0.06
----
--
Life
styl
eC
affe
ine,
100
mg
−0.0
030.
002
0.09
----
--
Hea
lth
Dia
bete
s0.
025
0.00
90.
006
----
--
Ast
hma
−0.0
140.
006
0.03
−0.0
160.
006
0.00
8
Arth
ritis
0.02
20.
006
<0.0
01--
----
Can
cer
−0.0
150.
009
0.09
−0.0
160.
010
0.09
Sele
ctiv
e se
roto
nin
reup
take
inhi
bito
rs−0
.024
0.00
90.
004
−0.0
230.
008
0.00
5
Tota
l num
ber o
fm
edic
atio
ns0.
04--
0
med
icat
ions
0.02
70.
009
----
1
med
icat
ion
0.01
10.
009
----
2
med
icat
ions
0.01
30.
008
----
3-
4 m
edic
atio
ns0.
011
0.01
0--
--
Osteoporos Int. Author manuscript; available in PMC 2010 March 10.
NIH
-PA Author Manuscript
NIH
-PA Author Manuscript
NIH
-PA Author Manuscript
Chiu et al. Page 22
Subm
odel
s(N
=1,1
28)
Fina
l Mod
el(N
=992
)
Sub-
grou
pV
aria
bles
Age
-A
djus
ted
Coe
ffici
ent
Stan
dard
Err
orp
βSt
anda
rdE
rror
p
5+
med
icat
ions
ref
----
--
Func
tion
Grip
stre
ngth
, kg
0.00
2<0
.001
<0.0
010.
001
<0.0
01<0
.001
Seru
m25
-hyd
roxy
vita
min
-D,
ng/m
Lb,c
<−0.
001
<0.0
010.
09--
----
a All
anal
yses
wei
ghte
d in
vers
ely
to th
e pr
obab
ility
of s
elec
tion
b Adj
uste
d fo
r sea
son
and
time
of b
lood
dra
w
c To c
onve
rt 25
-hyd
roxy
vita
min
-D to
nm
ol/L
, mul
tiply
val
ues b
y 2.
496
Osteoporos Int. Author manuscript; available in PMC 2010 March 10.
NIH
-PA Author Manuscript
NIH
-PA Author Manuscript
NIH
-PA Author Manuscript
Chiu et al. Page 23
TAB
LE 4
Res
ults
from
wei
ghte
da lin
ear r
egre
ssio
ns o
f age
-adj
uste
d su
b-gr
oup
mod
els a
nd b
one
min
eral
den
sity
(BM
D) i
n th
e sp
ine.
Subm
odel
s (N
=1,1
28)
Fina
l Mod
el (N
=873
)
Sub-
grou
pV
aria
bles
Age
-A
djus
ted
βSt
anda
rdE
rror
pβ
Stan
dard
Err
orp
Age
Age
, 10y
0.00
90.
005
0.07
0.01
80.
005
<0.0
01
Dem
ogra
phic
s
Rac
e/et
hnic
ity<0
.001
<0.0
01
B
lack
0.07
30.
013
0.06
40.
015
H
ispa
nic
−0.0
410.
014
−0.0
090.
016
W
hite
ref
--re
f--
Rac
e/et
hnic
ity*a
ge0.
002
--
B
lack
*age
0.00
10.
009
----
H
ispa
nic*
age
−0.0
310.
009
----
W
hite
*age
ref
----
--
Bod
yC
ompo
sitio
n
Hei
ght,
cm0.
001
0.00
10.
550.
001
0.00
10.
36
App
endi
cula
r lea
nm
ass,
kg0.
013
0.00
2<0
.001
0.01
00.
002
<0.0
01
Hor
mon
esFr
ee e
stra
diol
, pg/
ml
0.06
40.
031
0.04
----
--
Life
styl
eC
affe
ine,
100
mg
−0.0
150.
004
<0.0
01−0
.009
0.00
40.
02
Hea
lth
Dia
bete
s0.
039
0.02
00.
05--
----
Ast
hma
−0.0
530.
017
0.00
1−0
.047
0.01
3<0
.001
Chr
onic
lung
dis
ease
−0.0
620.
020
0.00
2−0
.048
0.01
80.
007
Hig
h bl
ood
pres
sure
0.02
70.
015
0.06
----
--
Func
tion
Grip
stre
ngth
, kg
0.00
30.
001
<0.0
01--
----
Osteoporos Int. Author manuscript; available in PMC 2010 March 10.
NIH
-PA Author Manuscript
NIH
-PA Author Manuscript
NIH
-PA Author Manuscript
Chiu et al. Page 24
Subm
odel
s (N
=1,1
28)
Fina
l Mod
el (N
=873
)
Sub-
grou
pV
aria
bles
Age
-A
djus
ted
βSt
anda
rdE
rror
pβ
Stan
dard
Err
orp
Seru
mC
-term
inal
telo
pept
ides
of T
ype-
1 co
llage
nb,c
,d−0
.098
0.03
10.
001
−0.0
770.
028
0.00
6
a All
anal
yses
wei
ghte
d in
vers
ely
to th
e pr
obab
ility
of s
elec
tion
b Nat
ural
log
trans
form
ed
c Adj
uste
d fo
r sea
son
and
time
of b
lood
dra
w
d To c
onve
rt C
-term
inal
telo
pept
ides
of T
ype-
1 co
llage
n to
μg/
L, m
ultip
ly v
alue
s by
1.0
Osteoporos Int. Author manuscript; available in PMC 2010 March 10.