Relative brain size in Australian birds
11
Relative brain size in Australian birds Donald C. Franklin A,E , Stephen T. Garnett A , Gary W. Luck B , Cristian Gutierrez-Ibanez C and Andrew N. Iwaniuk D A Research Institute for the Environment & Livelihoods, Charles Darwin University, Darwin, NT 0909, Australia. B Institute for Land, Water and Society, Charles Sturt University, PO Box 789, Albury, NSW 2640, Australia. C Centre for Neuroscience, University of Alberta, Edmonton, AB, T6G 2E9, Canada. D Canadian Centre for Behavioural Neuroscience, University of Lethbridge, Lethbridge, AB, T1K 3M4, Canada. E Corresponding author. Email: [email protected] Abstract. Among species, relative brain size (RBS) is correlated with aspects of ecology and behaviour. We analysed patterns of RBS in Australian birds based on 3164 measurements of brain size in 504 species, and provide species-level data for further analysis. Regression slopes calculated both with and without phylogenetic correction are provided for all species and for well-represented orders and passerine families. Patterns of brain-size allometry differ among orders but the evidence for variation among passerine families is equivocal, depending on the method of analysis. These differences are attributable both to absolute differences in RBS corresponding to different regression intercepts and to different regression slopes. Allometric patterns in Australian birds are virtually identical to those reported elsewhere, with large RBS in parrots, cockatoos and owls, and particularly small RBS in galliforms, dromaiids, grebes, swifts and swallows. Our data can be used to generate hypotheses about the drivers of RBS in particular avian groups. For example, small RBS in unrelated aerial foragers suggests that physical constraints may influence the evolution of RBS. Received 2 May 2013, accepted 9 September 2013, published online 25 March 2014 Introduction Avian species with larger relative brain size (RBS) exhibit greater behavioural flexibility (Lefebvre 2011; Reif et al. 2011). The evidence for this is diverse and remains after con- trolling for a range of other functional traits. For instance, birds with larger RBS are more likely to: (1) establish when introduced to new areas (Sol et al. 2002, 2005a, 2008; Vall- llosera and Sol 2009); (2) occupy urban environments (Carrete and Tella 2011; Maklakov et al. 2011; but see Kark et al. 2007); (3) tolerate greater climatic uncertainty (Schuck-Paim et al. 2008) and (4) adjust the timing of breeding to account for geographical differences in temperature during the breeding season (Moussus et al. 2011). A complementary set of proposed benefits of larger RBS to behavioural adaptability – complex sociality – has been demonstrated among primates (Dunbar 1992) but evidence for such a relationship among avian taxa is equivocal (Nealen and Ricklefs 2001; Iwaniuk and Arnold 2004; Emery et al. 2007). RBS is also positively associated with survival rates in birds (Sol et al. 2007). The unifying concept behind analyses of RBS is that the development and maintenance of large brains is costly (Ricklefs 2004; Isler and van Schaik 2009) and therefore must provide considerable benefits to compensate for these costs. However, the compartmentalisation of brain functions is such that beha- viours are associated with particular regions of the brain, and analysis of RBS has been criticised as simplistic because it fails to focus on those regions of the brain that are important for specific behaviours (Healy and Rowe 2007). For example, size of the forebrain may be more strongly related to the complexity of social behaviours in birds than overall size of the brain (Burish et al. 2004). However, Bennett and Harvey (1985) found that the relative size of brain regions of birds tends to be positively correlated with RBS, suggesting that RBS is a reason- able first approximation for the relative size of the brain’s components. Iwaniuk et al.(2004a) also found positive correla- tions, though consistently only among directly connected brain regions. The size of the brain and forebrain are positively related across non-passerine orders but not consistently within passerines (Iwaniuk et al. 2005). Data on the size of brain regions are much harder to obtain than for entire brains as only the latter can be measured directly from skulls. Moreover, the strong relationships between RBS and avian behaviour suggest that analyses of variation in RBS are still valuable. Absolute brain size and body size exhibit a strong power (allometric) relationship (for birds, see Nealen and Ricklefs 2001): larger species have larger brains, but in smaller species brain mass is a greater proportion of body mass. Interspecific comparisons of brain size must account for the relationship between brain size and body mass. RBS is often calculated as the residual from a linear regression of brain size (mass) on body size (mass) after both measures are log-transformed. Most studies of RBS in birds have been conducted on northern hemisphere species (see Iwaniuk and Arnold 2004 for a notable exception). We present an analysis of RBS among orders and passerine families of Australian birds based on 3164 measurements of brain size in 504 species in which all CSIRO PUBLISHING Emu, 2014, 114, 160–170 http://dx.doi.org/10.1071/MU13034 Journal compilation Ó BirdLife Australia 2014 www.publish.csiro.au/journals/emu
Transcript of Relative brain size in Australian birds
Relative brain size in Australian birds
Donald C FranklinAE Stephen T GarnettA Gary W LuckB Cristian Gutierrez-IbanezC
and Andrew N IwaniukD
AResearch Institute for the Environment amp Livelihoods Charles Darwin University Darwin NT 0909 AustraliaBInstitute for Land Water and Society Charles Sturt University PO Box 789 Albury NSW 2640 AustraliaCCentre for Neuroscience University of Alberta Edmonton AB T6G 2E9 CanadaDCanadian Centre for Behavioural Neuroscience University of Lethbridge Lethbridge AB T1K 3M4 CanadaECorresponding author Email donfranklincdueduau
Abstract Among species relative brain size (RBS) is correlated with aspects of ecology and behaviour We analysedpatterns of RBS in Australian birds based on 3164 measurements of brain size in 504 species and provide species-leveldata for further analysis Regression slopes calculated both with and without phylogenetic correction are provided for allspecies and for well-represented orders and passerine families Patterns of brain-size allometry differ among orders but theevidence for variation among passerine families is equivocal depending on the method of analysis These differences areattributable both to absolute differences in RBS corresponding to different regression intercepts and to different regressionslopes Allometric patterns in Australian birds are virtually identical to those reported elsewhere with large RBS inparrots cockatoos and owls and particularly small RBS in galliforms dromaiids grebes swifts and swallows Our datacan be used to generate hypotheses about the drivers of RBS in particular avian groups For example small RBS inunrelated aerial foragers suggests that physical constraints may influence the evolution of RBS
Received 2 May 2013 accepted 9 September 2013 published online 25 March 2014
Introduction
Avian species with larger relative brain size (RBS) exhibitgreater behavioural flexibility (Lefebvre 2011 Reif et al2011) The evidence for this is diverse and remains after con-trolling for a range of other functional traits For instance birdswith larger RBS are more likely to (1) establish whenintroduced to new areas (Sol et al 2002 2005a 2008 Vall-llosera and Sol 2009) (2) occupy urban environments (Carreteand Tella 2011 Maklakov et al 2011 but see Kark et al 2007)(3) tolerate greater climatic uncertainty (Schuck-Paim et al 2008)and (4) adjust the timing of breeding to account for geographicaldifferences in temperature during the breeding season (Moussuset al 2011) A complementary set of proposed benefits of largerRBS to behavioural adaptability ndash complex sociality ndash has beendemonstrated among primates (Dunbar 1992) but evidence forsuch a relationship among avian taxa is equivocal (Nealen andRicklefs 2001 Iwaniuk and Arnold 2004 Emery et al 2007)RBS is also positively associated with survival rates in birds(Sol et al 2007)
The unifying concept behind analyses of RBS is that thedevelopment and maintenance of large brains is costly (Ricklefs2004 Isler and van Schaik 2009) and therefore must provideconsiderable benefits to compensate for these costs Howeverthe compartmentalisation of brain functions is such that beha-viours are associated with particular regions of the brain andanalysis of RBS has been criticised as simplistic because it failsto focus on those regions of the brain that are important forspecific behaviours (Healy and Rowe 2007) For example size
of the forebrain may be more strongly related to the complexityof social behaviours in birds than overall size of the brain(Burish et al 2004) However Bennett and Harvey (1985) foundthat the relative size of brain regions of birds tends to bepositively correlated with RBS suggesting that RBS is a reason-able first approximation for the relative size of the brainrsquoscomponents Iwaniuk et al (2004a) also found positive correla-tions though consistently only among directly connectedbrain regions The size of the brain and forebrain are positivelyrelated across non-passerine orders but not consistently withinpasserines (Iwaniuk et al 2005) Data on the size of brainregions are much harder to obtain than for entire brains as onlythe latter can be measured directly from skulls Moreover thestrong relationships between RBS and avian behaviour suggestthat analyses of variation in RBS are still valuable
Absolute brain size and body size exhibit a strong power(allometric) relationship (for birds see Nealen and Ricklefs2001) larger species have larger brains but in smaller speciesbrain mass is a greater proportion of body mass Interspecificcomparisons of brain size must account for the relationshipbetween brain size and body mass RBS is often calculated asthe residual from a linear regression of brain size (mass) onbody size (mass) after both measures are log-transformed
Most studies of RBS in birds have been conducted onnorthern hemisphere species (see Iwaniuk and Arnold 2004 fora notable exception) We present an analysis of RBS amongorders and passerine families of Australian birds based on3164 measurements of brain size in 504 species in which all
CSIRO PUBLISHING
Emu 2014 114 160ndash170httpdxdoiorg101071MU13034
Journal compilation BirdLife Australia 2014 wwwpublishcsiroaujournalsemu
orders and all but one small passerine family are representedOur analysis is heuristic (sensu Raerinne 2013) and provides afoundation from which to generate hypotheses about evolution-ary and behavioural relationships associated with RBS inAustralian birds It is particularly relevant to the capacity ofspecies to adapt behaviourally to climate change as behaviouraladaptability favours population persistence (Williams et al2008 Dawson et al 2011) Davey et al (2012) demonstratedthat recent changes in the structure of British bird communitiesinvolved a shift towards behaviourally flexible species andthat the geographical distribution of these changes stronglyimplicates climate change as the driver of this shift In a nationalassessment of the vulnerability of Australian birds to climatechange RBS has been included as one of seven sensitivitymetrics (Garnett and Franklin In press)
Methods
We follow Christidis and Boles (2008) in delimiting theAustralian avifauna and its taxonomic relationships with mod-ifications acknowledged where referred to in the main textOur dataset is constrained to native non-vagrant species ofthe Australian mainland and its continental islands It comprisesdata on the brain size and body mass of 504 species representingall Australian avian orders (Table S1 in Supplementarymaterial) and encompasses 746 of the Australian avifaunaFor orders with 10 or more species in the dataset (n = 11 ordersTable 1) the proportion of species measured varied from532 of species (Procellariformes) to 962 (Psittaciformes)The dataset includes 224 species of passerine (711 of
Australian passerine species) with all passerine familiesrepresented except the Sturnidae (which is represented inAustralia by only one native non-vagrant species)(Table 2) The six passerine families with 10 or more Australianspecies in the dataset had from 455 (Maluridae) to 920(Artamidae) of species measured
Brain size was assessed using dead birds collected from zoosand veterinary clinics and skulls held in museums in which theskull was not fractured Endocranial volume was measured byfilling the skull via the foramen magnum with a 50 50 mixtureof sizes 11 and 12 lead shot This is a standard procedureemployed in many studies of brain size and was demonstratedto be a robust measure of brain volume by Iwaniuk and Nelson(2002) As the lead shot was poured in the skull was repeatedlytapped to prevent the formation of lacunae Once the brain cavitywas filled the lead shot was then decanted into a modifiedsyringe to determine volume Measurements are accurate to001 mL In species for which more than one individual wasassessedmeanbrain volumewas employedMeanbrain volumes(mL) were converted to mass (g) by multiplying by a constant of1036 (Sol et al 2005a)
To assess the repeatability of brain volume measurementsone individual of each of eight species were evaluated usingthe same method 10ndash12 times
Mean body mass was obtained from live weights presented inthe Handbook of Australian New Zealand and Antarctic Birds(volumes 1ndash7 Marchant and Higgins 1990 1993 Higgins andDavies 1996 Higgins 1999 Higgins et al 2001 2006 Higginsand Peter 2002) Where weights were specified as a range orfor each of the sexes or subspecies we determined the median
Table 1 Relative brain size (RBS) in Australian avian orders based on the non-phylogeneticall species regression (Fig 1 Table 4)
Species n the number of Australian non-vagrant species Sample n the number of species for which brain-sizedata are available (see Table S1) CI is the 95 confidence interval of the mean
RBSOrder Species
nSample
nPercentagesampled
Mean CI Range
Casuariiformes 2 2 1000 ndash02786 ndash0305 ndash ndash0252Galliformes 6 4 667 ndash03109 plusmn00720 ndash0374 ndash ndash0267Anseriformes 21 18 857 ndash01619 plusmn00275 ndash0314 ndash ndash0083Phaethontiformes 2 1 500 ndash0139Podicipediformes 3 3 1000 ndash02687 plusmn02634 ndash0382 ndash ndash0172Columbiformes 22 18 818 ndash02388 plusmn00193 ndash0327 ndash ndash0091Caprimulgiformes 6 4 667 ndash00943 plusmn02672 ndash0208 ndash 0155Apodiformes 4 3 750 ndash01533 plusmn05614 ndash0356 ndash 0091Procellariformes 47 25 532 ndash00088 plusmn00313 ndash0146 ndash 0119Sphenisciformes 2 1 500 ndash0008Phalacrocoraciformes 12 9 750 ndash01081 plusmn01081 ndash0389 ndash 0022Ciconiiformes 21 17 810 ndash00419 plusmn00432 ndash0186 ndash 0116Accipitriformes 18 15 833 00339 plusmn00288 ndash0057 ndash 0106Falconiformes 6 5 833 00581 plusmn00408 0026 ndash 0098Gruiformes 17 12 706 ndash01404 plusmn00499 ndash0255 ndash 0007Charadriiformes 87 63 724 ndash01292 plusmn00184 ndash0340 ndash ndash0015Psittaciformes 52 50 962 02273 plusmn00289 0035 ndash 0516Cuculiformes 12 11 917 ndash00592 plusmn00305 ndash0114 ndash 0019Strigiformes 8 8 1000 01978 plusmn00795 0120 ndash 0390Coraciiformes 12 11 917 ndash00270 plusmn00555 ndash0174 ndash 0107Passeriformes 315 224 711 00436 plusmn00113 ndash0154 ndash 0259
Relative brain size in Australian birds Emu 161
weight Use of a generic source was considered preferable tothe use of weights from specimens for which brain size wasmeasured (where available) as many of the latter are museumspecimens that were often weighed some time after death and inthe case of historical collections using equipment of pooraccuracy
Because this analysis is descriptive and not an evaluation ofecological or evolutionary questions we have included resultsfrombothnon-phylogenetic analyseswith species as independentdata points as well as phylogenetically corrected analyses Allbody mass and mean brain mass data were log10 transformedbefore analysis RBS was calculated as the y-axis residual fromthe respective non-phylogenetic and phylogenetic regressions
Non-phylogenetic allometric patterns were identified by ma-jor-axis regression (Jolicoeur 1973) using the quasi-Newtonestimation algorithm (StatSoft Inc 2012) Where measurementerror is possible in the predictor variable as is the case in these
analyses major-axis regression is preferable to least-squaresregression (Pagel andHarvey1988)Major-axis regression yieldsslightly steeper slopes (and thus lower intercepts) (Pagel andHarvey 1988 Nealen and Ricklefs 2001) and always performsas well as or better than least-squares regression (Jolicoeur1973)
The logarithm of brain size (not RBS) and regression slopeswere compared both among orders and among passerine familiesusing (1) simple analysis of covariance (ANCOVA) models and(2) homogeneity-of-slopes analysis of covariance (ANCOVA)models All models included log body mass as a covariateand were based only on orders or families for which we had dataon 10 or more species
Brain size is an oft-cited example of a character that isstrongly influenced by phylogenetic relatedness (Harvey andPagel 1991) so in addition to treating species as independentdata points we also ran analyses that included phylogenetic
Table 2 Relative brain size (RBS) in Australian passerine avian families based on the non-phylogeneticpasserine regression (Fig 2b Table 4)
Species n the number of Australian non-vagrant species Sample n the number of species for which brain-sizedata are available (see Table S1) CI is the 95 confidence interval of the mean
RBSFamily Species
nSample
nPercentagesampled
Mean CI Range
Pittidae 3 1 333 ndash0104Menuridae 2 1 500 ndash0059Atrichornithidae 2 1 500 0113Climacteridae 6 5 833 ndash00211 plusmn00555 ndash0092 ndash 0019Ptilonorhynchidae 10 8 800 00755 plusmn00395 0000 ndash 0136Maluridae 22 10 455 00278 plusmn00299 ndash0023 ndash 0093Dasyornithidae 3 2 667 00106 ndash0009 ndash 0030Acanthizidae 40 25 625 00592 plusmn00290 ndash0050 ndash 0238Pardalotidae 4 2 500 ndash00040 ndash0036 ndash 0028Meliphagidae 74 57 770 ndash00137 plusmn00153 ndash0106 ndash 0156Pomatostomidae 4 4 1000 00954 plusmn01083 0015 ndash 0179Orthonychidae 2 2 1000 ndash00021 ndash0036 ndash 0032Psophodidae 8 5 625 00176 plusmn00986 ndash0085 ndash 0120Neosittidae 1 1 1000 0064Campephagidae 7 5 714 ndash00338 plusmn00869 ndash0135 ndash 0061Pachycephalidae 14 9 643 00530 plusmn00363 ndash0034 ndash 0108Oriolidae 3 3 1000 ndash00672 plusmn00516 ndash0088 ndash ndash0046Artamidae 14 13 929 ndash00250 plusmn00453 ndash0117 ndash 0098Dicruridae 1 1 1000 ndash0062Rhipiduridae 6 4 667 ndash00825 plusmn00685 ndash0130 ndash ndash0033Corvidae 5 4 800 00344 plusmn00292 0009 ndash ndash0051Monarchidae 13 9 692 ndash00020 plusmn00404 ndash0111 ndash 0048Corcoracidae 2 2 1000 ndash00226 ndash0052 ndash 0007Paradisaeidae 4 3 750 00116 plusmn00724 ndash0018 ndash 0040Petroicidae 21 19 905 00040 plusmn00267 ndash0070 ndash 0122Alaudidae 1 1 1000 ndash0055Cisticolidae 2 1 500 0009Acrocephalidae 2 1 500 0121Megaluridae 5 3 600 ndash00598 plusmn01407 ndash0123 ndash ndash0014Timaliidae 3 1 333 ndash0049Hirundinidae 5 5 1000 ndash01217 plusmn00327 ndash0163 ndash ndash0092Turdidae 2 2 1000 ndash00681 ndash0071 ndash ndash0066Sturnidae 1 0 00Nectariniidae 2 2 1000 ndash00529 ndash0070 ndash ndash0036Estrildidae 18 10 556 ndash00308 plusmn00422 ndash0122 ndash 0065Motacillidae 3 2 667 ndash01142 ndash0185 ndash ndash0043
162 Emu D C Franklin et al
information A phylogenetic tree for 483 species was constructedin Mesquite (Maddison and Maddison 2011) Inter-ordinal rela-tionships are as in Hackett et al (2008) and resolution withinorders and families is as provided by Ovenden et al (1987)Edwards and Naeem (1993) Kusmierski et al (1997)McCracken and Sheldon (1998) Kennedy and Page (2002)Barker et al (2004) Fjeldsaring (2004) Iwaniuk et al (2004b)Sorenson et al (2004) Thomas et al (2004) Lerner andMindell(2005) Sorenson and Payne (2005) Moyle (2006) Chesser andten Have (2007) Pereira et al (2007) Wright et al (2008)Gonzalez et al (2009) Irestedt et al (2009) Kennedy et al(2009) Wink et al (2009) Gardner et al (2010) Joslashnsson et al(2010a 2010b) Christidis et al (2011)Nyaacuteri and Joseph (2011)White et al (2011) and Kearns et al (2013) The remaining21 species (Table S2 in Supplementary material) were notincluded because their phylogenetic relationship with otherspecies is not known or not clear We adopted an arbitrarybranch-length model to the phylogenetic tree which adequatelystandardized the data following the procedures outlined inGarland et al (1992) and implemented in the PDAP PDTREEmodule of Mesquite (Midford et al 2008)
We performed major-axis regressions that account for phy-logenetic relatedness (pRMA) using the phylRMA function inthephytools (Revell 2012)package inR (Pinheiroet al 2013)Weobtained estimates for the entire dataset and individual ordersand passerine families with 10 or more species in the datasetWe initially calculated the regression parameters using a Pagelrsquoslambda (l) transformation as the evolutionary model andobtained the maximum likelihood estimate of l (Pagel 1999)l is a multiplier of the internal branches of a phylogeny andvaries between 0 and 1 These internal branches directly expressthe degree of expected correlation among the traits A l of 1 isequal to a Brownianmotion model of evolutionary change wherevariance in a continuous trait accumulates at a constant rate inrandom directions over the branches of a phylogeny whereas a lof 0 is equal to no phylogenetic signal If l is between 0 and 1 thephylogenetic signal is present but there is less of an effect thanwould be expected from the original branch lengths We thencalculated the same regression assuming a l of 0 or 1 and usedlikelihood ratio tests to assess if the l obtained was significantlydifferent from 0 or 1 If l was not significantly different from 0then there is no phylogenetic signal present and only the regularmajor-axis regressions are reported in our results If l wassignificantly different from 0 but not significantly different from
1 then the regression parameters were estimated assuming aBrownian motion model of evolutionary change
To compare brain size among orders and passerine familiestaking into account phylogenetic relatednessweusedgeneralisedleast square regression models with a phylogenetic correction(PGLS) with order or families (in the case of passerines) as acovariate For this we used the ape and nlme packages in R(Paradis et al 2004 Pinheiro et al 2013) As with the ANCOVAanalysiswe tested for theheterogeneity of the slopes by includingthe interaction between body mass and the categorical variable(order or family) As with the pRMA analysis Pagelrsquos l trans-formation was used as the evolutionary model and the maximumlikelihood estimate of l was obtained Likelihood ratio testswhere used to test if l was significantly different from 0 and1 As with other analyses only the orders and families with 10 ormore species in the dataset were included Because a generalisedleast square regression (GLS) is equivalent but not exactly thesame as an ANCOVA we also include the results of a GLSregression
Results
Measurements of brain volume were highly repeatable withthe mean coefficient of variation for within-individual measure-ments being 1003 (range 059ndash145) (Table 3)
As with previous studies of brainndashbody size allometry brainmass was strongly correlated with body mass in Australian birds(Fig 1 Table 4 R2 = 089 for both methods of analysis) with aslope of ~06 regardless of whether species are treated as inde-pendent data points or if phylogeny is taken into account
Within 11 well-represented orders correlation coefficientswere generally higher than those for all birds (Table 4) Regres-sion slopes varied among orders as to whether they were steeperor shallower than those for all species (Table 4 Fig 2a b) trendsthat were generally similar regardless of whether the analysiswas with phylogenetic correction or without it with the possibleexception of the Ciconiiformes (Table 4) Comparisons of brainndashbody scaling among orders revealed significant differences inslopes and intercepts for both phylogenetic and non-phylogeneticanalyses (Table 5a) Using anANCOVA heterogeneity of slopesappeared to exert a stronger effect than differences in interceptsbut the reverse was true of the PGLS Nevertheless it is clearthat orders vary significantly from one another in brainndashbodyallometry Among orders the Psittaciformes (cockatoos and
Table 3 Repeatability of measurements of brain volume assessed for one individual each of eight Australian bird speciesn the number of times the individual was measured CV coefficient of variation
Species Brain volume (mL)Common name Scientific name Sex Weight (g) n mean se CV () range
Wompoo Fruit-Dove Ptilinopus magnificus Male 475 11 2591 00113 145 25ndash265White-headed Petrel Pterodroma lessonii Female 470 10 5840 00145 079 58ndash595Collared Sparrowhawk Accipiter cirrocephalus Female 134 10 2490 00067 085 245ndash25Red-rumped Parrot Psephotus haematonotus Male ndash
A 10 2495 00090 114 245ndash255Eastern Koel Eudynamys orientalis Female 215 10 2705 00090 105 265ndash275Southern Boobook Ninox novaeseelandiae Male 279 12 5604 00144 089 55ndash57Laughing Kookaburra Dacelo novaeguineae Female 340 10 4380 00082 059 435ndash44White-plumed Honeyeater Lichenostomus penicillatus Female 195 11 0738 00028 126 073ndash0755
ANot recorded
Relative brain size in Australian birds Emu 163
parrots) and Strigiformes (owls) have particularly large RBSwhereas the Galliformes (megapodes quails and relatives)Casuariiformes (emus and cassowaries) and Podicipediformes(grebes) have particularly small RBS (Table 1)
Because we had a large sample of passerines we also exam-ined variation in brainndashbody allometry and RBS amongpasserine families Based on the residuals from the passerineRMA regression the Pomatostomidae (Australasian babblers)and Ptilonorhynchidae (catbirds and bowerbirds) along with thesole represented species of Acrocephalidae (Oriental Reed-War-bler Acrocephalus orientalis which we accept as a regularmigrant to Australia contra Christidis and Boles 2008) andAtrichornithidae (Noisy Scrub-bird Atrichornis clamosus) haveparticularly large RBS (Table 2) In contrast the Hirundinidae(swallows and martins) and Motacillidae (pipits and wagtails)along with the sole represented species of Pittidae (Noisy PittaPitta veriscolor) have particularly small RBS These differencesin RBSwere also apparent in brainndashbody size allometric relation-ships in families represented by 10 or more species in ourdataset (Table 4 Fig 2c) With the exception of the Artamidaeindividual families had lower correlation coefficients than thatof all passerines combined RMA slopes varied much among
10
1
Non-passerines
Passerines
100 1000
Body mass (g)
Bra
in m
ass
(g)
10 00010
Fig 1 Allometric (logndashlog) relationship between body mass and brainmass in 504 Australian bird species The regression lines are from analyseswith and without phylogenetic correction (dashed and solid linesrespectively) (from Table 4) AS Australian Swiftlet (Aerodramusterraereginae) E Emu (Dromaius novaehollandiae) PC Palm Cockatoo(Probosciger aterrimus) SC Southern Cassowary (Casuarius casuarius)
Table 4 Regression estimate for log10ndashlog10 analysis of the relationship between body mass and brain mass in Australianavian species using major-axis regression (RMA) and phylogenetically corrected RMA (pRMA)
n number of species Under BMl for phylogenetically corrected analyses (ie pRMA rows) the nature of the model ofevolutionary change is indicated as a number which is a maximum likelihood estimate for Pagelrsquos lambda (l) models or as BM
Brownian motion lsquoNorsquo (in RMA rows) indicates there was no phylogenetic signal
Taxa Analysis n Slope plusmn se (P) Intercept plusmn se R2 BMl
All birds RMA 504 05859 plusmn 00106 (lt00001) ndash08916 plusmn 00217 0892pRMA 484 06378 ndash11212 0889 0952
OrdersAnseriformes RMA 18 05093 plusmn 00363 (lt00001) ndash08228 plusmn 01099 0932 NoColumbiformes RMA 18 04579 plusmn 00312 (lt00001) ndash08443 plusmn 00703 0935 NoProcellariformes RMA 25 06857 plusmn 00165 (lt00001) ndash11697 plusmn 00455 0987
pRMA 25 06615 ndash10955 0953 BMCiconiiformes RMA 17 06651 plusmn 00521 (lt00001) ndash11637 plusmn 01525 0923
pRMA 17 05565 ndash08024 0901 BMAccipitriformes RMA 15 05812 plusmn 00419 (lt00001) ndash08445 plusmn 01204 0943 NoGruiformes RMA 12 05976 plusmn 00326 (lt00001) ndash10633 plusmn 00903 0972 NoCharadriiformes RMA 63 06510 plusmn 00219 (lt00001) ndash11587 plusmn 00470 0939
pRMA 62 06456 ndash11576 0915 BMPsittaciformes RMA 50 07753 plusmn 00221 (lt00001) ndash10648 plusmn 00477 0964
pRMA 48 07423 ndash09893 0875 BMCuculiformes RMA 11 06047 plusmn 00276 (lt00001) ndash09852 plusmn 00523 0982 noCoraciiformes RMA 11 07047 plusmn 00707 (lt00001) ndash11387 plusmn 01329 0921 noPasseriformes RMA 224 07053 plusmn 00103 (lt00001) ndash10197 plusmn 00155 0956
pRMA 213 06943 ndash1003 0893 0928Passerine familiesMaluridae RMA 10 07855 plusmn 01862 (0003) ndash10698 plusmn 01814 0766 noAcanthizidae RMA 25 08008 plusmn 00857 (lt00001) ndash10568 plusmn 00876 0798
pRMA 25 09488 ndash12140 0576 BMMeliphagidae RMA 57 06598 plusmn 00255 (lt00001) ndash09711 plusmn 00356 0927
pRMA 55 06732 ndash1004 0918 0845Artamidae RMA 13 07813 plusmn 00316 (lt00001) ndash11933 plusmn 00633 0983
pRMA 13 07370 ndash11143 0950 BMPetroicidae RMA 19 07538 plusmn 00891 (lt00001) ndash10749 plusmn 01095 0829
pRMA 19 06929 ndash10153 0658 0685Estrildidae RMA 10 04692 plusmn 03473 (021) ndash07931 plusmn 03791 0213
pRMA 10 05762 ndash08930 0225 BM
164 Emu D C Franklin et al
families being shallowest in the Estrildidae (grassfinches) andsteepest in the Acanthizidae (thornbills scrubwrens and allies)This was also true for the pRMA regressions although the slopefor the Acanthizidae was even steeper and approached isometry(09488) Although the ANCOVA and GLS indicated that fam-ilies differed significantly from one another in slopes and inter-cepts (the interaction term) these effects were not present afterphylogenetic correction (PGLS) (Table 5b)
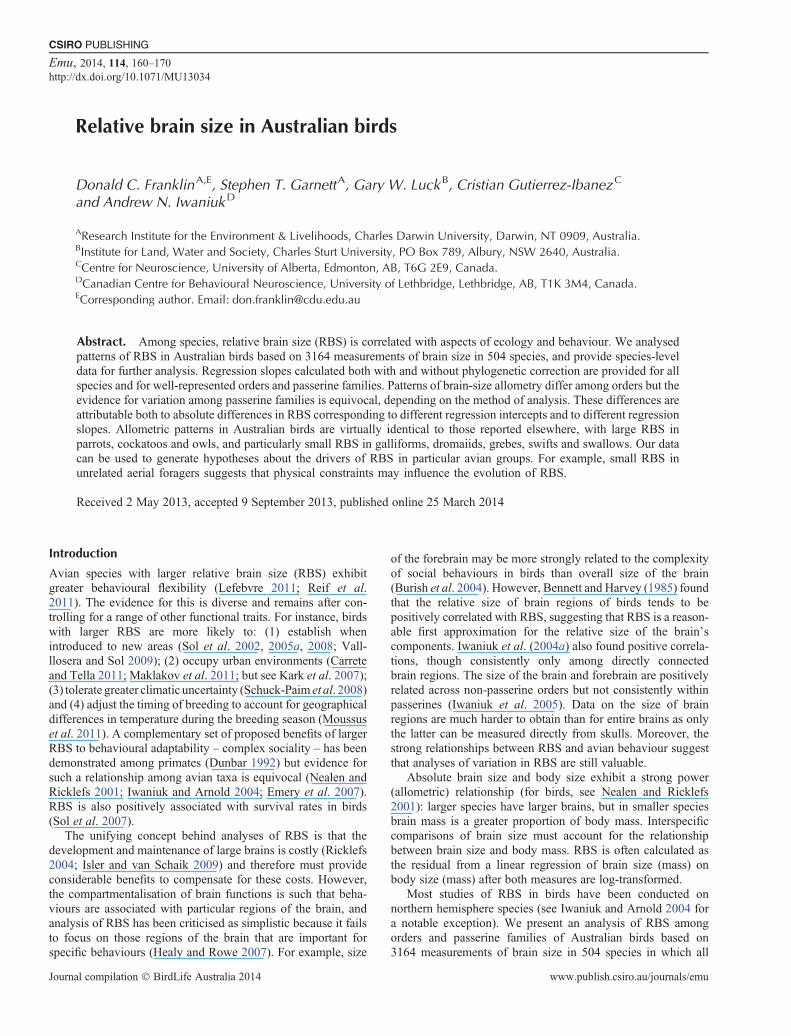
More detailed analyses are provided for two non-passerineorders and one passerine family in Fig 3
Discussion
Larger birds have bigger brains with the tight allometricrelationship between brain and body size in Australian birdsbeing very similar to that observed in other studies (Bennett andHarvey 1985 Nealen and Ricklefs 2001 Iwaniuk and Nelson2003) Regression slopes and intercepts depend upon the taxaconsidered and somewhat also on the regression methodemployed Our all-species RMA slope of 0586 closely matchesthe 0592 reported by Nealen and Ricklefs (2001) based on alarge sample of birds across a wide taxonomic range andemploying the same regression method The ranking of ordersis also very similar to that reported elsewhere Bennett andHarvey (1985) noting that RBS is greatest in parrots (see alsoIwaniuk et al 2005) cockatoos owls woodpeckers and thepasserine families and smallest in game birds grebes wildfowland pigeons We also provide new data for several endemicpasserine taxa and RBS differences among some of thesefamilies Given that most of these endemic families are basal(Barker et al 2004) to the relatively large-brained Corvidae(Emery and Clayton 2004) determining evolutionary rates ofchange in RBS and the ancestral state of this lineage will likelybe important in understanding how and why relatively largebrains evolve
Phylogeny can have a significant effect on calculated allome-tric relationships and interpretation of results (Bennett andHarvey 1985 Pagel and Harvey 1988 Harvey and Pagel1991 Garland and Ives 2000) notably by the lsquotaxon-level effectrsquo(Pagel and Harvey 1988 Nealen and Ricklefs 2001) The taxon-level effect is based on the observation that both the slopes andcorrelation coefficients of brainndashbody size allometric lines de-crease from higher to lower taxonomic levels Thus slopes andcorrelation coefficients are lower for lines calculated within aspecies than they are within a genus which is lower than thatwithin a subfamily and so on Within our dataset we detected asignificant phylogenetic effect on brainndashbody allometry acrossall birds but only within some orders and passerine families(Table 4) Although this could suggest that phylogeny does notaffect brain size in some lineages it is equally probable that thisis an artefact of small sample sizes Among the orders examinedthe six that did not have a significant phylogenetic signal werealso the ones that had the smallest number of species availablefor analysis Interestingly both slopes and correlation coefficientsappear to vary greatly among passerine families but the extent towhich this reflects life-history characteristics requires furtheranalyses
Although we provide original data on species and drawattention to the RBS of a few of these we caution against placingtoo much emphasis on individual species and in particular oninterpreting such data as evidence of relative intelligence Dataon individual species are more subject to measurement error(noise) than data generalised across taxa and in some cases areconstrained by a sample size of one or a few individuals Brainmass can also vary considerably within species (Iwaniuk andNelson 2002) The Grey-fronted Honeyeater (Lichenostomusplumulus) is an example of an outlier in our analysis of the
Bra
in m
ass
(g)
10
1
10
1
10
10 100 1000
10 100 1000 10 000
10 100 1000 10 000
1
AnseriformesProcellariformesCiconiiformesGruiformesCharadriiformes
Columbiformes
AccipitriformesPsittaciformes
CuculiformesCoraciiformes
Passeriformes
MaluridaeAcanthizidaeMeliphagidae
ArtamidaePetroicidae
Estrildidae
(a)
(b)
(c)
Body mass (g)
Fig 2 Allometric (logndashlog) regressions of brain size on body mass forAustralian birds (a) orders associated mainly with aquatic marine or coastalenvironments (b) orders associated mainly with terrestrial environments(c) passerine families Only orders and families for which 10 or more specieswere sampled are shown and these regressions are those withoutphylogenetic correction The black lines are regression lines from analyseswith and without phylogenetic correction (dashed and solid linesrespectively from Table 4) in (a) and (b) these are the regressions of allspecies in (c) these are regressions of Passeriformes
Relative brain size in Australian birds Emu 165
Meliphagidae with an especially high RBS This could reflect asample size of one for this species inaccurate body mass data orboth Further RBS is a context-dependent measure the contextbeing the taxa used to calculate it This is well illustrated in ouranalyses of the Palm Cockatoo (Probosciger aterrimus) Thisspecies has the largest RBS when comparisons are made acrossall species (Fig 1) However among the psittaciforms its RBSwas exceeded by the Budgerigar (Melopsittacus undulatus)(Fig 3d) a situation that arises because the slope for the Psitta-ciformes regression is considerably steeper than that for allspecies (Fig 2b)
Although analyses across a wide range of taxa demonstratethe association between large RBS and more complex cognitivebehaviour (Lefebvre 2011) additional processes may also influ-ence or be related to brain size Brain mass in birds may beconstrained by the cost of carrying additional weight in flightsuggesting that migratory species and those that forage aeriallyshould have smaller RBS Our finding that the AustralianSwiftlet (Aerodramus terraereginae) has the smallest RBS ofall measured Australian birds and that the swallows and martins(Hirundinidae) also have particularly small RBS indeed suggeststhat aerial foraging is a constraint on brain size Moreovermigratory birds tend to have smaller RBS than non-migratoryspecies (Winkler et al 2004 Sol et al 2005b 2010 Pravosudovet al 2007) This effect may be influenced by the fact thatmigratory birds are unlikely to develop complex social beha-viours such as cooperative breeding (Cockburn 2003) althoughit is unclear whether cooperative breeding is associated withlarge RBS (Iwaniuk and Arnold 2004 Graber et al 2012) Solet al (2005b) suggested that migration is necessary for birds witha smaller RBS because they lack the behavioural flexibility tocope with severe winters although Pravosudov et al (2007)
found that small RBS in migratory species may be aconsequence of selection pressure to reduce weight rather thana precursor to it These lines of evidence reinforce the need toavoid simplistic interpretations of bivariate analyses andconsider multiple correlates and complex potential drivers ofRBS (Healy and Rowe 2007)
Our data describe overall patterns in the Australian avifaunaandcanbeused togenerate or evaluatehypothesesWeemphasisestrongly that our study does not provide an evaluation of evolu-tionary hypotheses For example bowerbirds (Ptilonorhynchi-dae) have large RBS among passerines and large RBS (or thetelencephalic proportion of the brain) has been associated withcomplex behaviours (such as bower building) though findingsabout complex behaviours are mixed (Bennett and Harvey 1985Ricklefs 2004 Burish et al 2004) However large RBS andbower-building behaviour in the Ptilonorhynchidae may repre-sent a single-lineage effect and thus for analytical purposes asample size of one from which no generalisation may be madeA more appropriate evaluation of the relationship betweenbower-building behaviour and RBS was provided by Madden(2001) and Day et al (2005) using phylogenetically constrainedanalyses of variation in RBS and bower complexity withinthe Ptilonorhynchidae and in comparison with other speciesthese two studies appear to confirm that bower complexity andRBS are positively associated
Analyses of RBS can be misleading for a variety of reasonsand in some cases the putative correlation between RBS andbehaviour or life history is spurious (Healy andRowe 2007) Thatsaid the fact that RBS does vary significantly among orders asshown in our analysis and others (Nealen and Ricklefs 2001Iwaniuk and Nelson 2003) and that consistent relationships arefound across multiple statistical analyses (eg Sol et al 2002
Table 5 Comparisons of brain mass among orders and passerine families (from Table 4) using threemodelling approaches ANCOVA generalised least square (GLS) and phylogenetically corrected GLS (PGLS)
with tests for homogeneity of slopeslog10(brain mass) is the response variable order or family the categorical predictor and log10(body mass) the covariateA Pagelrsquos lambda (l) model of evolutionary change was use for the PGLS and the maximum likelihood estimate of
l is shown
Taxa Model type l Effect F df P
(a) Order ANCOVA Order 23 10 442 0013log10(body mass) 30475 1 442 lt00001Interaction 77 10 442 lt00001
GLS Order 1423 10 422 lt00001log10(body mass) 168083 1 422 lt00001Interaction 81 10 422 lt00001
PGLS 0868 Order 35 10 422 00002log10(body mass) 53972 1 422 lt00001Interaction 60 10 422 lt00001
(b) Family ANCOVA Family 22 5 122 0064log10(body mass) 1656 1 122 lt00001Interaction 25 5 122 0037
GLS Family 58 5 120 00001log10(body mass) 26614 1 120 lt00001Interaction 26 5 120 0028
PGLS 0793 Family 02 5 120 09442log10(body mass) 9705 1 120 lt00001Interaction 19 5 120 01045
166 Emu D C Franklin et al
10(a) (b)
(c) (d )
(f )(e )
01
00
ndash01
ndash02
01
00
ndash01
01
00
ndash01
1
10
1
10
100 1000
100 1000 100 1000
100 1000
100 10 100
1
Charadriiformes
Bra
in m
ass
(g)
Rel
ativ
e br
ain
mas
s
Psittaciformes
Body mass (g)
Meliphagidae
Fig 3 Allometric (logndashlog) relationship between brain mass and body mass for birds in two Australian orders andone Australian family (a c e) and corresponding relative brain masses (b d f) calculated using the regression for theorder or family obtained from analysis without phylogenetic correction In parts a c e the solid and short-dashedlines are regressions 95 CI for the order or family the dotted line is the regression line for all Australian species(from Fig 1) and the longer-dashed line in e is the regression line for Australian passerines (from Fig 2c) In partsb d f outlying species (RBSgt 001 or ltndash001) are labelled as follows (b) BFD Black-fronted Dotterel (Elseyornismelanops) RKD Red-kneed Dotterel (Erythrogonys cinctus) RNP Red-necked Phalarope (Phalaropus lobatus)RCBQ Red-chested Button-quail (Turnix pyrrhothorax) BS Banded Stilt (Cladorhynchus leucocephalus) RNARed-necked Avocet (Recurvirostra novaehollandiae) (d) B Budgerigar (Melopsittacus undulatus) ML MuskLorikeet (Glossopsitta concinna) PC Palm Cockatoo (Probosciger aterrimus) BP Bourkersquos Parrot (Neopsephotusbourkii) EP Eclectus Parrot (Eclectus roratus) WC Western Corella (Cacatua pastinator) (f) GFH Grey-frontedHoneyeater (Lichenostomus plumulus)
Relative brain size in Australian birds Emu 167
2005a 2005b 2007 2008 2010) suggests that RBS is biolog-ically important The data we provide should foster further studyinto interspecific variation in RBS especially among Australianbirds many of which have unique life histories and behaviourscompared to Nearctic and Palearctic species
Acknowledgements
We thank Healesville Sanctuary and the Springvale Veterinary Clinic forproviding some specimens used in this study as well as the curators andcollectionsmanagers at the followingmuseums for access to their collectionsSouth Australian Museum Museum of Victoria Australian MuseumQueensland Museum Australian National Wildlife Collection and the Na-tional Museum of Natural History (Washington DC) Partial funding for thisstudywas provided by scholarships and fellowships toAN Iwaniuk from theAustralian Museum Trust Monash University and the Smithsonian Institu-tion The contributions of D C Franklin and S T Garnett were funded underAustralian Research Council Grant LP0990395 and a grant from the NationalClimate Change Adaptation Research Facility
References
Barker F K Cibois A Schikler P Feinstein J and Cracraft J (2004)Phylogeny and diversification of the largest avian radiation Proceedingsof the National Academy of Sciences of the United States of America 10111040ndash11045 doi101073pnas0401892101
Bennett P M and Harvey P H (1985) Relative brain size and ecology inbirds Journal of Zoology 207 151ndash169 doi101111j1469-79981985tb04920x
Burish M J Kueh H Y andWang S S-H (2004) Brain architecture andsocial complexity in modern and ancient birds Brain Behavior andEvolution 63 107ndash124 doi101159000075674
Carrete M and Tella J L (2011) Inter-individual variability in fear ofhumans and relative brain size of the species are related to contemporaryurban invasion in birds PLoS ONE 6 e18859 doi101371journalpone0018859
Chesser R T and ten Have J (2007) On the phylogenetic position of thescrub-birds (Passeriformes Menuridae Atrichornithidae) of AustraliaJournal of Ornithology 148 471ndash476 doi101007s10336-007-0174-9
Christidis L and Boles W E (2008) lsquoSystematics and Taxonomy ofAustralian Birdsrsquo (CSIRO Publishing Melbourne)
Christidis L IrestedtM Rowe D BolesW E andNorman J A (2011)Mitochondrial and nuclear DNA phylogenies reveal a complex evolu-tionary history in the Australasian robins (Passeriformes Petroicidae)Molecular Phylogenetics and Evolution 61 726ndash738 doi101016jympev201108014
Cockburn A (2003) Cooperative breeding in oscine passerines doessociality inhibit speciation Proceedings of the Royal Society ndash
B Biological Sciences 270 2207ndash2214 doi101098rspb20032503DaveyCMChamberlainDENewson S ENobleDG and Johnston
A (2012) Rise of the generalists evidence for climate driven homog-enization in avian communities Global Ecology and Biogeography 21568ndash578 doi101111j1466-8238201100693x
Dawson T P Jackson S T House J I Prentice I C and Mace G M(2011) Beyond predictions biodiversity conservation in a changingclimate Science 332 53ndash58 doi101126science1200303
Day L B Westcott D A and Olster D H (2005) Evolution of bowercomplexity and cerebellum size in bowerbirds Brain Behavior andEvolution 66 62ndash72 doi101159000085048
Dunbar R I M (1992) Neocortex size as a constraint on group size inprimates Journal of Human Evolution 22 469ndash493 doi1010160047-2484(92)90081-J
Edwards S V and Naeem S (1993) The phylogenetic component ofcooperative breeding in perching birds American Naturalist 141754ndash789 doi101086285504
Emery N J and Clayton N S (2004) The mentality of crows convergentevolution of intelligence in corvids and apes Science 306 1903ndash1907doi101126science1098410
Emery N J Seed A M von Bayern A M P and Clayton N S (2007)Cognitive adaptations of social bonding in birds Philosophical Transac-tions of the Royal Society ndash B Biological Sciences 362 489ndash505 doi101098rstb20061991
Fjeldsaring J (2004) lsquoThe Grebesrsquo (Oxford University Press Oxford UK)Gardner J L Trueman J W H Ebert D Joseph L and Magrath R D
(2010) Phylogeny and evolution of the Meliphagoidea the largestradiation of Australasian songbirds Molecular Phylogenetics and Evo-lution 55 1087ndash1102 doi101016jympev201002005
Garland T Jr and Ives A R (2000) Using the past to predict thepresent confidence intervals for regression equations in phylogeneticcomparative methods American Naturalist 155 346ndash364 doi101086303327
Garland T Jr Harvey P H and Ives A R (1992) Procedures for theanalysis of comparative data using phylogenetically independent con-trasts Systematic Biology 41 18ndash32
Garnett S T and Franklin D C (Eds) (In press) lsquoClimate ChangeAdaptation Plan for Australian Birdsrsquo (CSIRO Publishing Melbourne)
Gonzalez J Duttmann H and Wink M (2009) Phylogeneticrelationships based on two mitochondrial genes and hybridizationpatterns in Anatidae Journal of Zoology 279 310ndash318 doi101111j1469-7998200900622x
Graber S Van Schaik C P and Isler K (2012) Cooperative breedingand hominin brain size evolution evidence from a comparative study inbirds American Journal of Physical Anthropology 147(54 Suppl) 154
Hackett S J Kimball R T Reddy S Bowie R CK Braun E L BraunM J Chojnowski J L Cox A Han K-L Harshman J HuddlestonC JMarks BDMiglia K JMooreW S Sheldon FH SteadmanD W Witt C C and Yuri T (2008) A phylogenomic study of birdsreveals their evolutionary history Science 320 1763ndash1768
Harvey P H and Pagel M D (1991) lsquoThe Comparative Method inEvolutionary Biologyrsquo (Oxford University Press Oxford UK)
Healy S D and Rowe C (2007) A critique of comparative studies ofbrain sizeProceedings of the Royal Society ndash B Biological Sciences 274453ndash464 doi101098rspb20063748
Higgins P J (Ed) (1999) lsquoHandbook of Australian New Zealand ampAntarctic Birds Vol 4 Parrots to Dollarbirdrsquo (Oxford University PressMelbourne)
Higgins P J and Davies S J J F (Eds) (1996) lsquoHandbook of AustralianNew Zealand amp Antarctic Birds Vol 3 Snipe to Pigeonsrsquo (OxfordUniversity Press Melbourne)
Higgins P J and Peter J M (Eds) (2002) lsquoHandbook of Australian NewZealandampAntarcticBirdsVol 6 Pardalotes to shrike-thrushesrsquo (OxfordUniversity Press South Melbourne)
Higgins P J Peter J M and Steele W K (Eds) (2001) lsquoHandbook ofAustralian New Zealand ampAntarctic Birds Vol 5 Tyrant-flycatchers toChatsrsquo (Oxford University Press South Melbourne)
Higgins P J Peter J M and Cowling S J (Eds) (2006) lsquoHandbook ofAustralian NewZealandampAntarctic Birds Vol 7 Boatbill to Starlingsrsquo(Oxford University Press South Melbourne)
Irestedt M Joslashnsson K A Fjeldsaring J Christidis L and Ericson P G P(2009) An unexpectedly long history of sexual selection in birds-of-paradise BMC Evolutionary Biology 9 235 doi1011861471-2148-9-235
Isler K and van Schaik C P (2009) The expensive brain a framework forexplaining evolutionary changes in brain size Journal of Human Evolu-tion 57 392ndash400 doi101016jjhevol200904009
168 Emu D C Franklin et al
Iwaniuk A N and Arnold K E (2004) Is cooperative breeding associatedwith bigger brains A comparative test in the Corvida (Passeriformes)Ethology 110 203ndash220 doi101111j1439-0310200300957x
Iwaniuk A N and Nelson J E (2002) Can endocranial volumes be usedas reliable estimates of brain size in birds Canadian Journal of Zoology80 16ndash23 doi101139z01-204
Iwaniuk A N and Nelson J E (2003) Developmental differences arecorrelated with relative brain size in birds a comparative analysisCanadian Journal of Zoology 81 1913ndash1928 doi101139z03-190
Iwaniuk A N Dean K M and Nelson J E (2004a) A mosaic patterncharacterizes the evolution of the avian brain Proceedings of the RoyalSociety ndash B Biological Sciences 271 S148ndashS151 doi101098rsbl20030127
Iwaniuk A N Nelson J E James H F and Olson S L (2004b) Acomparative test of the correlated evolution of flightlessness and relativebrain size in birds Journal of Zoology 263 317ndash327 doi101017S0952836904005308
Iwaniuk A N Dean KM andNelson J E (2005) Interspecific allometryof the brain and brain regions in parrots (Psittaciformes) comparisonswith other birds and primates Brain Behavior and Evolution 65 40ndash59doi101159000081110
Jolicoeur P (1973) Imaginary confidence limits of the slope of the majoraxis of a bivariate normal distribution a sampling experiment Journalof the American Statistical Association 68 866ndash871 doi10108001621459197310481438
Joslashnsson K A Bowie R C K Nylander J A A Christidis L NormanJ A and Fjeldsaring J (2010a) Biogeographical history of cuckoo-shrikes(Aves Passeriformes) transoceanic colonization of Africa from Aus-tralo-Papua Journal of Biogeography 37 1767ndash1781 doi101111j1365-2699201002328x
Joslashnsson K A Bowie R C K Moyle R G Christidis L Norman J ABenz B W and Fjeldsaring J (2010b) Historical biogeography of an -Indo-Pacific passerine bird family (Pachycephalidae) differentcolonization patterns in the Indonesian and Melanesian archipelagosJournal of Biogeography 37 245ndash257 doi101111j1365-2699200902220x
Kark S Iwaniuk A Schalimtzek A and Banker E (2007) Living in thecity can anyone become an lsquourban exploiterrsquo Journal of Biogeography34 638ndash651 doi101111j1365-2699200601638x
Kearns A M Joseph L and Cook L G (2013) A multilocus coalescentanalysis of the speciational history of the Australo-Papuan butcherbirdsand their allies Molecular Phylogenetics and Evolution 66 941ndash952doi101016jympev201211020
Kennedy M and Page R D M (2002) Seabird supertrees combiningpartial estimates of procellariiform phylogeny Auk 119 88ndash108
Kennedy M Valle C A and Spencer H G (2009) The phylogeneticposition of the Galapagos Cormorant Molecular Phylogenetics andEvolution 53 94ndash98 doi101016jympev200906002
Kusmierski R Borgia G Uy A and Crozier R H (1997) Labileevolution of display traits in bowerbirds indicates reduced effects ofphylogenetic constraint Proceedings of the Royal Society ndash B BiologicalSciences 264 307ndash313 doi101098rspb19970044
Lefebvre L (2011) Taxonomic counts of cognition in the wild BiologyLetters 7 631ndash633 doi101098rsbl20100556
Lerner H R L and Mindell D P (2005) Phylogeny of eagles OldWorld vultures and other Accipitridae based on nuclear and mitochon-drial DNA Molecular Phylogenetics and Evolution 37 327ndash346doi101016jympev200504010
Madden J (2001) Sex bowers and brains Proceedings of the RoyalSociety ndash B Biological Sciences 268 833ndash838 doi101098rspb20001425
MaddisonW P andMaddison D R (2011) Mesquite AModular Systemfor Evolutionary Analysis Version 275 Available at httpmesquiteprojectorg [Verified 9 November 2013]
Maklakov A A Immler S Gonzalez-Voyer A Ronn J and Kolm N(2011) Brains and the city big-brained passerine birds succeed in urbanenvironments Biology Letters 7 730ndash732 doi101098rsbl20110341
Marchant S and Higgins P J (Eds) (1990) lsquoHandbook of Australian NewZealand amp Antarctic Birds Vol 1 Ratites to Ducksrsquo (Oxford UniversityPress Melbourne)
Marchant S and Higgins P J (Eds) (1993) lsquoHandbook of Australian NewZealand amp Antarctic Birds Vol 2 Raptors to lapwingsrsquo (Oxford Uni-versity Press Melbourne)
McCracken K G and Sheldon F H (1998) Molecular and osteologicalheron phylogenies sources of incongruence Auk 115 127ndash141doi1023074089118
Midford P E Garland T H and Maddison W (2008) PDAPPDTREEpackage for Mesquite v112 Available at httpmesquiteprojectorgpdap_mesquite [Verified 10 April 2013]
Moussus J-P Clavel J Jiguet F and Julliard R (2011) Which are thephenologically flexible species A case study with common passerinebirds Oikos 120 991ndash998 doi101111j1600-0706201018955x
Moyle R G (2006) A molecular phylogeny of kingfishers (Alcedinidae)with insights into early biogeographic history Auk 123 487ndash499doi1016420004-8038(2006)123[487AMPOKA]20CO2
Nealen P M and Ricklefs R E (2001) Early diversification of the avianbrain body relationship Journal of Zoology 253 391ndash404 doi101017S095283690100036X
Nyaacuteri A S and Joseph L (2011) Systematic dismantlement of Lichenos-tomus improves the basis for understanding relationships within thehoneyeaters (Meliphagidae) and the historical development of Aus-tralo-Papuan bird communities Emu 111 202ndash211 doi101071MU10047
Ovenden J RMackinlay A G and Crozier R H (1987) Systematics andmitochondrial genome evolution of Australian rosellas (Aves Platycer-cidae) Molecular Biology and Evolution 4 526ndash543
Pagel M (1999) Inferring the historical patterns of biological evolutionNature 401 877ndash884 doi10103844766
Pagel M D and Harvey P H (1988) The taxon-level problem in theevolution of mammalian brain size facts and artifacts American Natu-ralist 132 344ndash359 doi101086284857
Paradis E Claude J and Strimmer K (2004) APE analyses of phyloge-netics and evolution in R language Bioinformatics 20 289ndash290doi101093bioinformaticsbtg412
Pereira S L Johnson K P Clayton D H and Baker A J (2007)Mitochondrial and nuclear DNA sequences support a Cretaceous originof Columbiformes and a dispersal-driven radiation in the PaleogeneSystematic Biology 56 656ndash672 doi10108010635150701549672
Pinheiro JBatesDDebRoyS SarkarD andRDevelopmentCoreTeam(2013) nlme Linear and Nonlinear Mixed Effects Models R packageVersion 31ndash109 (The R Project for Statistical Computing ViennaAustria) Available at httpwwwr-projectorg [Verified 8 February2013]
Pravosudov V V Sanford K and Hahn T P (2007) On the evolution ofbrain size in relation to migratory behaviour in birds Animal Behaviour73 535ndash539 doi101016janbehav200610005
Raerinne J P (2013) Explanatory predictive and heuristic roles of allo-metries and scaling relationships Bioscience 63 191ndash198 doi101525bio20136337
Reif J Boumlhning-GaeseK FladeM Schwarz J andSchwagerM (2011)Population trends of birds across the iron curtain brain mattersBiological Conservation 144 2524ndash2533
Revell L J (2012) phytools an R package for phylogenetic comparativebiology (andother things)Methods inEcologyandEvolution3 217ndash223doi101111j2041-210X201100169x
Ricklefs R E (2004) The cognitive face of avian life histories ndash the 2003Margaret Morse Nice Lecture Wilson Bulletin 116 119ndash133 doi10167604-054
Relative brain size in Australian birds Emu 169
Schuck-Paim C Alonso W J and Ottoni E B (2008) Cognition in anever-changing world climatic variability is associated with brain size inNeotropical parrots Brain Behavior and Evolution 71 200ndash215doi101159000119710
Sol D Timmermans S andLefebvre L (2002) Behaviouralflexibility andinvasion success in birds Animal Behaviour 63 495ndash502 doi101006anbe20011953
SolDDuncanRPBlackburnTMCasseyP andLefebvreL (2005a)Big brains enhanced cognition and response of birds to novel environ-ments Proceedings of the National Academy of Sciences of the UnitedStates of America 102 5460ndash5465 doi101073pnas0408145102
Sol D Lefebvre K and Rodriguez-Teijeiro J D (2005b) Brain sizeinnovative propensity and migratory behaviour in temperate Palearcticbirds Proceedings of the Royal Society ndash B Biological Sciences 2721433ndash1441 doi101098rspb20053099
Sol D Szeacutekely T Liker A and Lefebvre L (2007) Big-brained birdssurvive better in nature Proceedings of the Royal Society ndash B BiologicalSciences 274 763ndash769 doi101098rspb20063765
Sol D Bacher S Reader SM andLefebvre L (2008) Brain size predictsthe success of mammal species introduced into novel environmentsAmerican Naturalist 172 S63ndashS71 doi101086588304
Sol D Garcia N Iwaniuk A Davis K Meade A Boyle W A andSzeacutekely T (2010) Evolutionary divergence in brain size betweenmigratory and resident birds PLoS ONE 5 e9617 doi101371journalpone0009617
Sorenson M D and Payne R B (2005) A molecular genetic analysis ofcuckoo phylogeny In lsquoThe Cuckoosrsquo (Ed R B Payne) pp 68ndash94(Oxford University Press Oxford UK)
SorensonMD Balakrishnan C N and Payne R B (2004) Clade-limitedcolonization in brood-parasitic finches (Vidua spp) Systematic Biology53 140ndash153 doi10108010635150490265021
StatSoft Inc (2012) lsquoStatistica 11rsquo (StatSoft Inc Tulsa)Thomas G HWills M A and Szekely T (2004) A supertree approach to
shorebird phylogeny BMC Evolutionary Biology 4 28 doi1011861471-2148-4-28
Vall-llosera M and Sol D (2009) A global risk assessment for thesuccess of bird introductions Journal of Applied Ecology 46787ndash795 doi101111j1365-2664200901674x
White N E Phillips M J Gilbert M T P Alfaro-Nunez A WillerslevE Mawson P R Spencer P B S and Bunce M (2011) Theevolutionary history of cockatoos (Aves Psittaciformes Cacatuidae)Molecular Phylogenetics and Evolution 59 615ndash622 doi101016jympev201103011
Williams S E Shoo L P Isaac J L Hoffmann A A and Langham G(2008) Towards an integrated framework for assessing the vulnerabilityof species to climate change PLoS Biology 6 e325 doi101371journalpbio0060325
Wink M El-Sayed A-A Sauer-Guumlrth H and Gonzalez J (2009)Molecular phylogeny of owls (Strigiformes) inferred from DNAsequences of the mitochondrial cytochrome b and the nuclear RAG-1gene Ardea 97 581ndash591 doi1052530780970425
Winkler H Leisler B and Bernroider G (2004) Ecological constraintson the evolution of avian brains Journal of Ornithology 145 238ndash244doi101007s10336-004-0040-y
Wright T F Schirtzinger E E Matsumoto T Eberhard J R GravesG R Sanchez J J Capelli S Muller H Scharpegge J ChambersG K and Fleischer R C (2008) A multilocus molecular phylogenyof the parrots (Psittaciformes) support for a Gondwanan origin duringthe Cretaceous Molecular Biology and Evolution 25 2141ndash2156doi101093molbevmsn160
170 Emu D C Franklin et al
wwwpublishcsiroaujournalsemu

orders and all but one small passerine family are representedOur analysis is heuristic (sensu Raerinne 2013) and provides afoundation from which to generate hypotheses about evolution-ary and behavioural relationships associated with RBS inAustralian birds It is particularly relevant to the capacity ofspecies to adapt behaviourally to climate change as behaviouraladaptability favours population persistence (Williams et al2008 Dawson et al 2011) Davey et al (2012) demonstratedthat recent changes in the structure of British bird communitiesinvolved a shift towards behaviourally flexible species andthat the geographical distribution of these changes stronglyimplicates climate change as the driver of this shift In a nationalassessment of the vulnerability of Australian birds to climatechange RBS has been included as one of seven sensitivitymetrics (Garnett and Franklin In press)
Methods
We follow Christidis and Boles (2008) in delimiting theAustralian avifauna and its taxonomic relationships with mod-ifications acknowledged where referred to in the main textOur dataset is constrained to native non-vagrant species ofthe Australian mainland and its continental islands It comprisesdata on the brain size and body mass of 504 species representingall Australian avian orders (Table S1 in Supplementarymaterial) and encompasses 746 of the Australian avifaunaFor orders with 10 or more species in the dataset (n = 11 ordersTable 1) the proportion of species measured varied from532 of species (Procellariformes) to 962 (Psittaciformes)The dataset includes 224 species of passerine (711 of
Australian passerine species) with all passerine familiesrepresented except the Sturnidae (which is represented inAustralia by only one native non-vagrant species)(Table 2) The six passerine families with 10 or more Australianspecies in the dataset had from 455 (Maluridae) to 920(Artamidae) of species measured
Brain size was assessed using dead birds collected from zoosand veterinary clinics and skulls held in museums in which theskull was not fractured Endocranial volume was measured byfilling the skull via the foramen magnum with a 50 50 mixtureof sizes 11 and 12 lead shot This is a standard procedureemployed in many studies of brain size and was demonstratedto be a robust measure of brain volume by Iwaniuk and Nelson(2002) As the lead shot was poured in the skull was repeatedlytapped to prevent the formation of lacunae Once the brain cavitywas filled the lead shot was then decanted into a modifiedsyringe to determine volume Measurements are accurate to001 mL In species for which more than one individual wasassessedmeanbrain volumewas employedMeanbrain volumes(mL) were converted to mass (g) by multiplying by a constant of1036 (Sol et al 2005a)
To assess the repeatability of brain volume measurementsone individual of each of eight species were evaluated usingthe same method 10ndash12 times
Mean body mass was obtained from live weights presented inthe Handbook of Australian New Zealand and Antarctic Birds(volumes 1ndash7 Marchant and Higgins 1990 1993 Higgins andDavies 1996 Higgins 1999 Higgins et al 2001 2006 Higginsand Peter 2002) Where weights were specified as a range orfor each of the sexes or subspecies we determined the median
Table 1 Relative brain size (RBS) in Australian avian orders based on the non-phylogeneticall species regression (Fig 1 Table 4)
Species n the number of Australian non-vagrant species Sample n the number of species for which brain-sizedata are available (see Table S1) CI is the 95 confidence interval of the mean
RBSOrder Species
nSample
nPercentagesampled
Mean CI Range
Casuariiformes 2 2 1000 ndash02786 ndash0305 ndash ndash0252Galliformes 6 4 667 ndash03109 plusmn00720 ndash0374 ndash ndash0267Anseriformes 21 18 857 ndash01619 plusmn00275 ndash0314 ndash ndash0083Phaethontiformes 2 1 500 ndash0139Podicipediformes 3 3 1000 ndash02687 plusmn02634 ndash0382 ndash ndash0172Columbiformes 22 18 818 ndash02388 plusmn00193 ndash0327 ndash ndash0091Caprimulgiformes 6 4 667 ndash00943 plusmn02672 ndash0208 ndash 0155Apodiformes 4 3 750 ndash01533 plusmn05614 ndash0356 ndash 0091Procellariformes 47 25 532 ndash00088 plusmn00313 ndash0146 ndash 0119Sphenisciformes 2 1 500 ndash0008Phalacrocoraciformes 12 9 750 ndash01081 plusmn01081 ndash0389 ndash 0022Ciconiiformes 21 17 810 ndash00419 plusmn00432 ndash0186 ndash 0116Accipitriformes 18 15 833 00339 plusmn00288 ndash0057 ndash 0106Falconiformes 6 5 833 00581 plusmn00408 0026 ndash 0098Gruiformes 17 12 706 ndash01404 plusmn00499 ndash0255 ndash 0007Charadriiformes 87 63 724 ndash01292 plusmn00184 ndash0340 ndash ndash0015Psittaciformes 52 50 962 02273 plusmn00289 0035 ndash 0516Cuculiformes 12 11 917 ndash00592 plusmn00305 ndash0114 ndash 0019Strigiformes 8 8 1000 01978 plusmn00795 0120 ndash 0390Coraciiformes 12 11 917 ndash00270 plusmn00555 ndash0174 ndash 0107Passeriformes 315 224 711 00436 plusmn00113 ndash0154 ndash 0259
Relative brain size in Australian birds Emu 161
weight Use of a generic source was considered preferable tothe use of weights from specimens for which brain size wasmeasured (where available) as many of the latter are museumspecimens that were often weighed some time after death and inthe case of historical collections using equipment of pooraccuracy
Because this analysis is descriptive and not an evaluation ofecological or evolutionary questions we have included resultsfrombothnon-phylogenetic analyseswith species as independentdata points as well as phylogenetically corrected analyses Allbody mass and mean brain mass data were log10 transformedbefore analysis RBS was calculated as the y-axis residual fromthe respective non-phylogenetic and phylogenetic regressions
Non-phylogenetic allometric patterns were identified by ma-jor-axis regression (Jolicoeur 1973) using the quasi-Newtonestimation algorithm (StatSoft Inc 2012) Where measurementerror is possible in the predictor variable as is the case in these
analyses major-axis regression is preferable to least-squaresregression (Pagel andHarvey1988)Major-axis regression yieldsslightly steeper slopes (and thus lower intercepts) (Pagel andHarvey 1988 Nealen and Ricklefs 2001) and always performsas well as or better than least-squares regression (Jolicoeur1973)
The logarithm of brain size (not RBS) and regression slopeswere compared both among orders and among passerine familiesusing (1) simple analysis of covariance (ANCOVA) models and(2) homogeneity-of-slopes analysis of covariance (ANCOVA)models All models included log body mass as a covariateand were based only on orders or families for which we had dataon 10 or more species
Brain size is an oft-cited example of a character that isstrongly influenced by phylogenetic relatedness (Harvey andPagel 1991) so in addition to treating species as independentdata points we also ran analyses that included phylogenetic
Table 2 Relative brain size (RBS) in Australian passerine avian families based on the non-phylogeneticpasserine regression (Fig 2b Table 4)
Species n the number of Australian non-vagrant species Sample n the number of species for which brain-sizedata are available (see Table S1) CI is the 95 confidence interval of the mean
RBSFamily Species
nSample
nPercentagesampled
Mean CI Range
Pittidae 3 1 333 ndash0104Menuridae 2 1 500 ndash0059Atrichornithidae 2 1 500 0113Climacteridae 6 5 833 ndash00211 plusmn00555 ndash0092 ndash 0019Ptilonorhynchidae 10 8 800 00755 plusmn00395 0000 ndash 0136Maluridae 22 10 455 00278 plusmn00299 ndash0023 ndash 0093Dasyornithidae 3 2 667 00106 ndash0009 ndash 0030Acanthizidae 40 25 625 00592 plusmn00290 ndash0050 ndash 0238Pardalotidae 4 2 500 ndash00040 ndash0036 ndash 0028Meliphagidae 74 57 770 ndash00137 plusmn00153 ndash0106 ndash 0156Pomatostomidae 4 4 1000 00954 plusmn01083 0015 ndash 0179Orthonychidae 2 2 1000 ndash00021 ndash0036 ndash 0032Psophodidae 8 5 625 00176 plusmn00986 ndash0085 ndash 0120Neosittidae 1 1 1000 0064Campephagidae 7 5 714 ndash00338 plusmn00869 ndash0135 ndash 0061Pachycephalidae 14 9 643 00530 plusmn00363 ndash0034 ndash 0108Oriolidae 3 3 1000 ndash00672 plusmn00516 ndash0088 ndash ndash0046Artamidae 14 13 929 ndash00250 plusmn00453 ndash0117 ndash 0098Dicruridae 1 1 1000 ndash0062Rhipiduridae 6 4 667 ndash00825 plusmn00685 ndash0130 ndash ndash0033Corvidae 5 4 800 00344 plusmn00292 0009 ndash ndash0051Monarchidae 13 9 692 ndash00020 plusmn00404 ndash0111 ndash 0048Corcoracidae 2 2 1000 ndash00226 ndash0052 ndash 0007Paradisaeidae 4 3 750 00116 plusmn00724 ndash0018 ndash 0040Petroicidae 21 19 905 00040 plusmn00267 ndash0070 ndash 0122Alaudidae 1 1 1000 ndash0055Cisticolidae 2 1 500 0009Acrocephalidae 2 1 500 0121Megaluridae 5 3 600 ndash00598 plusmn01407 ndash0123 ndash ndash0014Timaliidae 3 1 333 ndash0049Hirundinidae 5 5 1000 ndash01217 plusmn00327 ndash0163 ndash ndash0092Turdidae 2 2 1000 ndash00681 ndash0071 ndash ndash0066Sturnidae 1 0 00Nectariniidae 2 2 1000 ndash00529 ndash0070 ndash ndash0036Estrildidae 18 10 556 ndash00308 plusmn00422 ndash0122 ndash 0065Motacillidae 3 2 667 ndash01142 ndash0185 ndash ndash0043
162 Emu D C Franklin et al
information A phylogenetic tree for 483 species was constructedin Mesquite (Maddison and Maddison 2011) Inter-ordinal rela-tionships are as in Hackett et al (2008) and resolution withinorders and families is as provided by Ovenden et al (1987)Edwards and Naeem (1993) Kusmierski et al (1997)McCracken and Sheldon (1998) Kennedy and Page (2002)Barker et al (2004) Fjeldsaring (2004) Iwaniuk et al (2004b)Sorenson et al (2004) Thomas et al (2004) Lerner andMindell(2005) Sorenson and Payne (2005) Moyle (2006) Chesser andten Have (2007) Pereira et al (2007) Wright et al (2008)Gonzalez et al (2009) Irestedt et al (2009) Kennedy et al(2009) Wink et al (2009) Gardner et al (2010) Joslashnsson et al(2010a 2010b) Christidis et al (2011)Nyaacuteri and Joseph (2011)White et al (2011) and Kearns et al (2013) The remaining21 species (Table S2 in Supplementary material) were notincluded because their phylogenetic relationship with otherspecies is not known or not clear We adopted an arbitrarybranch-length model to the phylogenetic tree which adequatelystandardized the data following the procedures outlined inGarland et al (1992) and implemented in the PDAP PDTREEmodule of Mesquite (Midford et al 2008)
We performed major-axis regressions that account for phy-logenetic relatedness (pRMA) using the phylRMA function inthephytools (Revell 2012)package inR (Pinheiroet al 2013)Weobtained estimates for the entire dataset and individual ordersand passerine families with 10 or more species in the datasetWe initially calculated the regression parameters using a Pagelrsquoslambda (l) transformation as the evolutionary model andobtained the maximum likelihood estimate of l (Pagel 1999)l is a multiplier of the internal branches of a phylogeny andvaries between 0 and 1 These internal branches directly expressthe degree of expected correlation among the traits A l of 1 isequal to a Brownianmotion model of evolutionary change wherevariance in a continuous trait accumulates at a constant rate inrandom directions over the branches of a phylogeny whereas a lof 0 is equal to no phylogenetic signal If l is between 0 and 1 thephylogenetic signal is present but there is less of an effect thanwould be expected from the original branch lengths We thencalculated the same regression assuming a l of 0 or 1 and usedlikelihood ratio tests to assess if the l obtained was significantlydifferent from 0 or 1 If l was not significantly different from 0then there is no phylogenetic signal present and only the regularmajor-axis regressions are reported in our results If l wassignificantly different from 0 but not significantly different from
1 then the regression parameters were estimated assuming aBrownian motion model of evolutionary change
To compare brain size among orders and passerine familiestaking into account phylogenetic relatednessweusedgeneralisedleast square regression models with a phylogenetic correction(PGLS) with order or families (in the case of passerines) as acovariate For this we used the ape and nlme packages in R(Paradis et al 2004 Pinheiro et al 2013) As with the ANCOVAanalysiswe tested for theheterogeneity of the slopes by includingthe interaction between body mass and the categorical variable(order or family) As with the pRMA analysis Pagelrsquos l trans-formation was used as the evolutionary model and the maximumlikelihood estimate of l was obtained Likelihood ratio testswhere used to test if l was significantly different from 0 and1 As with other analyses only the orders and families with 10 ormore species in the dataset were included Because a generalisedleast square regression (GLS) is equivalent but not exactly thesame as an ANCOVA we also include the results of a GLSregression
Results
Measurements of brain volume were highly repeatable withthe mean coefficient of variation for within-individual measure-ments being 1003 (range 059ndash145) (Table 3)
As with previous studies of brainndashbody size allometry brainmass was strongly correlated with body mass in Australian birds(Fig 1 Table 4 R2 = 089 for both methods of analysis) with aslope of ~06 regardless of whether species are treated as inde-pendent data points or if phylogeny is taken into account
Within 11 well-represented orders correlation coefficientswere generally higher than those for all birds (Table 4) Regres-sion slopes varied among orders as to whether they were steeperor shallower than those for all species (Table 4 Fig 2a b) trendsthat were generally similar regardless of whether the analysiswas with phylogenetic correction or without it with the possibleexception of the Ciconiiformes (Table 4) Comparisons of brainndashbody scaling among orders revealed significant differences inslopes and intercepts for both phylogenetic and non-phylogeneticanalyses (Table 5a) Using anANCOVA heterogeneity of slopesappeared to exert a stronger effect than differences in interceptsbut the reverse was true of the PGLS Nevertheless it is clearthat orders vary significantly from one another in brainndashbodyallometry Among orders the Psittaciformes (cockatoos and
Table 3 Repeatability of measurements of brain volume assessed for one individual each of eight Australian bird speciesn the number of times the individual was measured CV coefficient of variation
Species Brain volume (mL)Common name Scientific name Sex Weight (g) n mean se CV () range
Wompoo Fruit-Dove Ptilinopus magnificus Male 475 11 2591 00113 145 25ndash265White-headed Petrel Pterodroma lessonii Female 470 10 5840 00145 079 58ndash595Collared Sparrowhawk Accipiter cirrocephalus Female 134 10 2490 00067 085 245ndash25Red-rumped Parrot Psephotus haematonotus Male ndash
A 10 2495 00090 114 245ndash255Eastern Koel Eudynamys orientalis Female 215 10 2705 00090 105 265ndash275Southern Boobook Ninox novaeseelandiae Male 279 12 5604 00144 089 55ndash57Laughing Kookaburra Dacelo novaeguineae Female 340 10 4380 00082 059 435ndash44White-plumed Honeyeater Lichenostomus penicillatus Female 195 11 0738 00028 126 073ndash0755
ANot recorded
Relative brain size in Australian birds Emu 163
parrots) and Strigiformes (owls) have particularly large RBSwhereas the Galliformes (megapodes quails and relatives)Casuariiformes (emus and cassowaries) and Podicipediformes(grebes) have particularly small RBS (Table 1)
Because we had a large sample of passerines we also exam-ined variation in brainndashbody allometry and RBS amongpasserine families Based on the residuals from the passerineRMA regression the Pomatostomidae (Australasian babblers)and Ptilonorhynchidae (catbirds and bowerbirds) along with thesole represented species of Acrocephalidae (Oriental Reed-War-bler Acrocephalus orientalis which we accept as a regularmigrant to Australia contra Christidis and Boles 2008) andAtrichornithidae (Noisy Scrub-bird Atrichornis clamosus) haveparticularly large RBS (Table 2) In contrast the Hirundinidae(swallows and martins) and Motacillidae (pipits and wagtails)along with the sole represented species of Pittidae (Noisy PittaPitta veriscolor) have particularly small RBS These differencesin RBSwere also apparent in brainndashbody size allometric relation-ships in families represented by 10 or more species in ourdataset (Table 4 Fig 2c) With the exception of the Artamidaeindividual families had lower correlation coefficients than thatof all passerines combined RMA slopes varied much among
10
1
Non-passerines
Passerines
100 1000
Body mass (g)
Bra
in m
ass
(g)
10 00010
Fig 1 Allometric (logndashlog) relationship between body mass and brainmass in 504 Australian bird species The regression lines are from analyseswith and without phylogenetic correction (dashed and solid linesrespectively) (from Table 4) AS Australian Swiftlet (Aerodramusterraereginae) E Emu (Dromaius novaehollandiae) PC Palm Cockatoo(Probosciger aterrimus) SC Southern Cassowary (Casuarius casuarius)
Table 4 Regression estimate for log10ndashlog10 analysis of the relationship between body mass and brain mass in Australianavian species using major-axis regression (RMA) and phylogenetically corrected RMA (pRMA)
n number of species Under BMl for phylogenetically corrected analyses (ie pRMA rows) the nature of the model ofevolutionary change is indicated as a number which is a maximum likelihood estimate for Pagelrsquos lambda (l) models or as BM
Brownian motion lsquoNorsquo (in RMA rows) indicates there was no phylogenetic signal
Taxa Analysis n Slope plusmn se (P) Intercept plusmn se R2 BMl
All birds RMA 504 05859 plusmn 00106 (lt00001) ndash08916 plusmn 00217 0892pRMA 484 06378 ndash11212 0889 0952
OrdersAnseriformes RMA 18 05093 plusmn 00363 (lt00001) ndash08228 plusmn 01099 0932 NoColumbiformes RMA 18 04579 plusmn 00312 (lt00001) ndash08443 plusmn 00703 0935 NoProcellariformes RMA 25 06857 plusmn 00165 (lt00001) ndash11697 plusmn 00455 0987
pRMA 25 06615 ndash10955 0953 BMCiconiiformes RMA 17 06651 plusmn 00521 (lt00001) ndash11637 plusmn 01525 0923
pRMA 17 05565 ndash08024 0901 BMAccipitriformes RMA 15 05812 plusmn 00419 (lt00001) ndash08445 plusmn 01204 0943 NoGruiformes RMA 12 05976 plusmn 00326 (lt00001) ndash10633 plusmn 00903 0972 NoCharadriiformes RMA 63 06510 plusmn 00219 (lt00001) ndash11587 plusmn 00470 0939
pRMA 62 06456 ndash11576 0915 BMPsittaciformes RMA 50 07753 plusmn 00221 (lt00001) ndash10648 plusmn 00477 0964
pRMA 48 07423 ndash09893 0875 BMCuculiformes RMA 11 06047 plusmn 00276 (lt00001) ndash09852 plusmn 00523 0982 noCoraciiformes RMA 11 07047 plusmn 00707 (lt00001) ndash11387 plusmn 01329 0921 noPasseriformes RMA 224 07053 plusmn 00103 (lt00001) ndash10197 plusmn 00155 0956
pRMA 213 06943 ndash1003 0893 0928Passerine familiesMaluridae RMA 10 07855 plusmn 01862 (0003) ndash10698 plusmn 01814 0766 noAcanthizidae RMA 25 08008 plusmn 00857 (lt00001) ndash10568 plusmn 00876 0798
pRMA 25 09488 ndash12140 0576 BMMeliphagidae RMA 57 06598 plusmn 00255 (lt00001) ndash09711 plusmn 00356 0927
pRMA 55 06732 ndash1004 0918 0845Artamidae RMA 13 07813 plusmn 00316 (lt00001) ndash11933 plusmn 00633 0983
pRMA 13 07370 ndash11143 0950 BMPetroicidae RMA 19 07538 plusmn 00891 (lt00001) ndash10749 plusmn 01095 0829
pRMA 19 06929 ndash10153 0658 0685Estrildidae RMA 10 04692 plusmn 03473 (021) ndash07931 plusmn 03791 0213
pRMA 10 05762 ndash08930 0225 BM
164 Emu D C Franklin et al
families being shallowest in the Estrildidae (grassfinches) andsteepest in the Acanthizidae (thornbills scrubwrens and allies)This was also true for the pRMA regressions although the slopefor the Acanthizidae was even steeper and approached isometry(09488) Although the ANCOVA and GLS indicated that fam-ilies differed significantly from one another in slopes and inter-cepts (the interaction term) these effects were not present afterphylogenetic correction (PGLS) (Table 5b)
More detailed analyses are provided for two non-passerineorders and one passerine family in Fig 3
Discussion
Larger birds have bigger brains with the tight allometricrelationship between brain and body size in Australian birdsbeing very similar to that observed in other studies (Bennett andHarvey 1985 Nealen and Ricklefs 2001 Iwaniuk and Nelson2003) Regression slopes and intercepts depend upon the taxaconsidered and somewhat also on the regression methodemployed Our all-species RMA slope of 0586 closely matchesthe 0592 reported by Nealen and Ricklefs (2001) based on alarge sample of birds across a wide taxonomic range andemploying the same regression method The ranking of ordersis also very similar to that reported elsewhere Bennett andHarvey (1985) noting that RBS is greatest in parrots (see alsoIwaniuk et al 2005) cockatoos owls woodpeckers and thepasserine families and smallest in game birds grebes wildfowland pigeons We also provide new data for several endemicpasserine taxa and RBS differences among some of thesefamilies Given that most of these endemic families are basal(Barker et al 2004) to the relatively large-brained Corvidae(Emery and Clayton 2004) determining evolutionary rates ofchange in RBS and the ancestral state of this lineage will likelybe important in understanding how and why relatively largebrains evolve
Phylogeny can have a significant effect on calculated allome-tric relationships and interpretation of results (Bennett andHarvey 1985 Pagel and Harvey 1988 Harvey and Pagel1991 Garland and Ives 2000) notably by the lsquotaxon-level effectrsquo(Pagel and Harvey 1988 Nealen and Ricklefs 2001) The taxon-level effect is based on the observation that both the slopes andcorrelation coefficients of brainndashbody size allometric lines de-crease from higher to lower taxonomic levels Thus slopes andcorrelation coefficients are lower for lines calculated within aspecies than they are within a genus which is lower than thatwithin a subfamily and so on Within our dataset we detected asignificant phylogenetic effect on brainndashbody allometry acrossall birds but only within some orders and passerine families(Table 4) Although this could suggest that phylogeny does notaffect brain size in some lineages it is equally probable that thisis an artefact of small sample sizes Among the orders examinedthe six that did not have a significant phylogenetic signal werealso the ones that had the smallest number of species availablefor analysis Interestingly both slopes and correlation coefficientsappear to vary greatly among passerine families but the extent towhich this reflects life-history characteristics requires furtheranalyses
Although we provide original data on species and drawattention to the RBS of a few of these we caution against placingtoo much emphasis on individual species and in particular oninterpreting such data as evidence of relative intelligence Dataon individual species are more subject to measurement error(noise) than data generalised across taxa and in some cases areconstrained by a sample size of one or a few individuals Brainmass can also vary considerably within species (Iwaniuk andNelson 2002) The Grey-fronted Honeyeater (Lichenostomusplumulus) is an example of an outlier in our analysis of the
Bra
in m
ass
(g)
10
1
10
1
10
10 100 1000
10 100 1000 10 000
10 100 1000 10 000
1
AnseriformesProcellariformesCiconiiformesGruiformesCharadriiformes
Columbiformes
AccipitriformesPsittaciformes
CuculiformesCoraciiformes
Passeriformes
MaluridaeAcanthizidaeMeliphagidae
ArtamidaePetroicidae
Estrildidae
(a)
(b)
(c)
Body mass (g)
Fig 2 Allometric (logndashlog) regressions of brain size on body mass forAustralian birds (a) orders associated mainly with aquatic marine or coastalenvironments (b) orders associated mainly with terrestrial environments(c) passerine families Only orders and families for which 10 or more specieswere sampled are shown and these regressions are those withoutphylogenetic correction The black lines are regression lines from analyseswith and without phylogenetic correction (dashed and solid linesrespectively from Table 4) in (a) and (b) these are the regressions of allspecies in (c) these are regressions of Passeriformes
Relative brain size in Australian birds Emu 165
Meliphagidae with an especially high RBS This could reflect asample size of one for this species inaccurate body mass data orboth Further RBS is a context-dependent measure the contextbeing the taxa used to calculate it This is well illustrated in ouranalyses of the Palm Cockatoo (Probosciger aterrimus) Thisspecies has the largest RBS when comparisons are made acrossall species (Fig 1) However among the psittaciforms its RBSwas exceeded by the Budgerigar (Melopsittacus undulatus)(Fig 3d) a situation that arises because the slope for the Psitta-ciformes regression is considerably steeper than that for allspecies (Fig 2b)
Although analyses across a wide range of taxa demonstratethe association between large RBS and more complex cognitivebehaviour (Lefebvre 2011) additional processes may also influ-ence or be related to brain size Brain mass in birds may beconstrained by the cost of carrying additional weight in flightsuggesting that migratory species and those that forage aeriallyshould have smaller RBS Our finding that the AustralianSwiftlet (Aerodramus terraereginae) has the smallest RBS ofall measured Australian birds and that the swallows and martins(Hirundinidae) also have particularly small RBS indeed suggeststhat aerial foraging is a constraint on brain size Moreovermigratory birds tend to have smaller RBS than non-migratoryspecies (Winkler et al 2004 Sol et al 2005b 2010 Pravosudovet al 2007) This effect may be influenced by the fact thatmigratory birds are unlikely to develop complex social beha-viours such as cooperative breeding (Cockburn 2003) althoughit is unclear whether cooperative breeding is associated withlarge RBS (Iwaniuk and Arnold 2004 Graber et al 2012) Solet al (2005b) suggested that migration is necessary for birds witha smaller RBS because they lack the behavioural flexibility tocope with severe winters although Pravosudov et al (2007)
found that small RBS in migratory species may be aconsequence of selection pressure to reduce weight rather thana precursor to it These lines of evidence reinforce the need toavoid simplistic interpretations of bivariate analyses andconsider multiple correlates and complex potential drivers ofRBS (Healy and Rowe 2007)
Our data describe overall patterns in the Australian avifaunaandcanbeused togenerate or evaluatehypothesesWeemphasisestrongly that our study does not provide an evaluation of evolu-tionary hypotheses For example bowerbirds (Ptilonorhynchi-dae) have large RBS among passerines and large RBS (or thetelencephalic proportion of the brain) has been associated withcomplex behaviours (such as bower building) though findingsabout complex behaviours are mixed (Bennett and Harvey 1985Ricklefs 2004 Burish et al 2004) However large RBS andbower-building behaviour in the Ptilonorhynchidae may repre-sent a single-lineage effect and thus for analytical purposes asample size of one from which no generalisation may be madeA more appropriate evaluation of the relationship betweenbower-building behaviour and RBS was provided by Madden(2001) and Day et al (2005) using phylogenetically constrainedanalyses of variation in RBS and bower complexity withinthe Ptilonorhynchidae and in comparison with other speciesthese two studies appear to confirm that bower complexity andRBS are positively associated
Analyses of RBS can be misleading for a variety of reasonsand in some cases the putative correlation between RBS andbehaviour or life history is spurious (Healy andRowe 2007) Thatsaid the fact that RBS does vary significantly among orders asshown in our analysis and others (Nealen and Ricklefs 2001Iwaniuk and Nelson 2003) and that consistent relationships arefound across multiple statistical analyses (eg Sol et al 2002
Table 5 Comparisons of brain mass among orders and passerine families (from Table 4) using threemodelling approaches ANCOVA generalised least square (GLS) and phylogenetically corrected GLS (PGLS)
with tests for homogeneity of slopeslog10(brain mass) is the response variable order or family the categorical predictor and log10(body mass) the covariateA Pagelrsquos lambda (l) model of evolutionary change was use for the PGLS and the maximum likelihood estimate of
l is shown
Taxa Model type l Effect F df P
(a) Order ANCOVA Order 23 10 442 0013log10(body mass) 30475 1 442 lt00001Interaction 77 10 442 lt00001
GLS Order 1423 10 422 lt00001log10(body mass) 168083 1 422 lt00001Interaction 81 10 422 lt00001
PGLS 0868 Order 35 10 422 00002log10(body mass) 53972 1 422 lt00001Interaction 60 10 422 lt00001
(b) Family ANCOVA Family 22 5 122 0064log10(body mass) 1656 1 122 lt00001Interaction 25 5 122 0037
GLS Family 58 5 120 00001log10(body mass) 26614 1 120 lt00001Interaction 26 5 120 0028
PGLS 0793 Family 02 5 120 09442log10(body mass) 9705 1 120 lt00001Interaction 19 5 120 01045
166 Emu D C Franklin et al
10(a) (b)
(c) (d )
(f )(e )
01
00
ndash01
ndash02
01
00
ndash01
01
00
ndash01
1
10
1
10
100 1000
100 1000 100 1000
100 1000
100 10 100
1
Charadriiformes
Bra
in m
ass
(g)
Rel
ativ
e br
ain
mas
s
Psittaciformes
Body mass (g)
Meliphagidae
Fig 3 Allometric (logndashlog) relationship between brain mass and body mass for birds in two Australian orders andone Australian family (a c e) and corresponding relative brain masses (b d f) calculated using the regression for theorder or family obtained from analysis without phylogenetic correction In parts a c e the solid and short-dashedlines are regressions 95 CI for the order or family the dotted line is the regression line for all Australian species(from Fig 1) and the longer-dashed line in e is the regression line for Australian passerines (from Fig 2c) In partsb d f outlying species (RBSgt 001 or ltndash001) are labelled as follows (b) BFD Black-fronted Dotterel (Elseyornismelanops) RKD Red-kneed Dotterel (Erythrogonys cinctus) RNP Red-necked Phalarope (Phalaropus lobatus)RCBQ Red-chested Button-quail (Turnix pyrrhothorax) BS Banded Stilt (Cladorhynchus leucocephalus) RNARed-necked Avocet (Recurvirostra novaehollandiae) (d) B Budgerigar (Melopsittacus undulatus) ML MuskLorikeet (Glossopsitta concinna) PC Palm Cockatoo (Probosciger aterrimus) BP Bourkersquos Parrot (Neopsephotusbourkii) EP Eclectus Parrot (Eclectus roratus) WC Western Corella (Cacatua pastinator) (f) GFH Grey-frontedHoneyeater (Lichenostomus plumulus)
Relative brain size in Australian birds Emu 167
2005a 2005b 2007 2008 2010) suggests that RBS is biolog-ically important The data we provide should foster further studyinto interspecific variation in RBS especially among Australianbirds many of which have unique life histories and behaviourscompared to Nearctic and Palearctic species
Acknowledgements
We thank Healesville Sanctuary and the Springvale Veterinary Clinic forproviding some specimens used in this study as well as the curators andcollectionsmanagers at the followingmuseums for access to their collectionsSouth Australian Museum Museum of Victoria Australian MuseumQueensland Museum Australian National Wildlife Collection and the Na-tional Museum of Natural History (Washington DC) Partial funding for thisstudywas provided by scholarships and fellowships toAN Iwaniuk from theAustralian Museum Trust Monash University and the Smithsonian Institu-tion The contributions of D C Franklin and S T Garnett were funded underAustralian Research Council Grant LP0990395 and a grant from the NationalClimate Change Adaptation Research Facility
References
Barker F K Cibois A Schikler P Feinstein J and Cracraft J (2004)Phylogeny and diversification of the largest avian radiation Proceedingsof the National Academy of Sciences of the United States of America 10111040ndash11045 doi101073pnas0401892101
Bennett P M and Harvey P H (1985) Relative brain size and ecology inbirds Journal of Zoology 207 151ndash169 doi101111j1469-79981985tb04920x
Burish M J Kueh H Y andWang S S-H (2004) Brain architecture andsocial complexity in modern and ancient birds Brain Behavior andEvolution 63 107ndash124 doi101159000075674
Carrete M and Tella J L (2011) Inter-individual variability in fear ofhumans and relative brain size of the species are related to contemporaryurban invasion in birds PLoS ONE 6 e18859 doi101371journalpone0018859
Chesser R T and ten Have J (2007) On the phylogenetic position of thescrub-birds (Passeriformes Menuridae Atrichornithidae) of AustraliaJournal of Ornithology 148 471ndash476 doi101007s10336-007-0174-9
Christidis L and Boles W E (2008) lsquoSystematics and Taxonomy ofAustralian Birdsrsquo (CSIRO Publishing Melbourne)
Christidis L IrestedtM Rowe D BolesW E andNorman J A (2011)Mitochondrial and nuclear DNA phylogenies reveal a complex evolu-tionary history in the Australasian robins (Passeriformes Petroicidae)Molecular Phylogenetics and Evolution 61 726ndash738 doi101016jympev201108014
Cockburn A (2003) Cooperative breeding in oscine passerines doessociality inhibit speciation Proceedings of the Royal Society ndash
B Biological Sciences 270 2207ndash2214 doi101098rspb20032503DaveyCMChamberlainDENewson S ENobleDG and Johnston
A (2012) Rise of the generalists evidence for climate driven homog-enization in avian communities Global Ecology and Biogeography 21568ndash578 doi101111j1466-8238201100693x
Dawson T P Jackson S T House J I Prentice I C and Mace G M(2011) Beyond predictions biodiversity conservation in a changingclimate Science 332 53ndash58 doi101126science1200303
Day L B Westcott D A and Olster D H (2005) Evolution of bowercomplexity and cerebellum size in bowerbirds Brain Behavior andEvolution 66 62ndash72 doi101159000085048
Dunbar R I M (1992) Neocortex size as a constraint on group size inprimates Journal of Human Evolution 22 469ndash493 doi1010160047-2484(92)90081-J
Edwards S V and Naeem S (1993) The phylogenetic component ofcooperative breeding in perching birds American Naturalist 141754ndash789 doi101086285504
Emery N J and Clayton N S (2004) The mentality of crows convergentevolution of intelligence in corvids and apes Science 306 1903ndash1907doi101126science1098410
Emery N J Seed A M von Bayern A M P and Clayton N S (2007)Cognitive adaptations of social bonding in birds Philosophical Transac-tions of the Royal Society ndash B Biological Sciences 362 489ndash505 doi101098rstb20061991
Fjeldsaring J (2004) lsquoThe Grebesrsquo (Oxford University Press Oxford UK)Gardner J L Trueman J W H Ebert D Joseph L and Magrath R D
(2010) Phylogeny and evolution of the Meliphagoidea the largestradiation of Australasian songbirds Molecular Phylogenetics and Evo-lution 55 1087ndash1102 doi101016jympev201002005
Garland T Jr and Ives A R (2000) Using the past to predict thepresent confidence intervals for regression equations in phylogeneticcomparative methods American Naturalist 155 346ndash364 doi101086303327
Garland T Jr Harvey P H and Ives A R (1992) Procedures for theanalysis of comparative data using phylogenetically independent con-trasts Systematic Biology 41 18ndash32
Garnett S T and Franklin D C (Eds) (In press) lsquoClimate ChangeAdaptation Plan for Australian Birdsrsquo (CSIRO Publishing Melbourne)
Gonzalez J Duttmann H and Wink M (2009) Phylogeneticrelationships based on two mitochondrial genes and hybridizationpatterns in Anatidae Journal of Zoology 279 310ndash318 doi101111j1469-7998200900622x
Graber S Van Schaik C P and Isler K (2012) Cooperative breedingand hominin brain size evolution evidence from a comparative study inbirds American Journal of Physical Anthropology 147(54 Suppl) 154
Hackett S J Kimball R T Reddy S Bowie R CK Braun E L BraunM J Chojnowski J L Cox A Han K-L Harshman J HuddlestonC JMarks BDMiglia K JMooreW S Sheldon FH SteadmanD W Witt C C and Yuri T (2008) A phylogenomic study of birdsreveals their evolutionary history Science 320 1763ndash1768
Harvey P H and Pagel M D (1991) lsquoThe Comparative Method inEvolutionary Biologyrsquo (Oxford University Press Oxford UK)
Healy S D and Rowe C (2007) A critique of comparative studies ofbrain sizeProceedings of the Royal Society ndash B Biological Sciences 274453ndash464 doi101098rspb20063748
Higgins P J (Ed) (1999) lsquoHandbook of Australian New Zealand ampAntarctic Birds Vol 4 Parrots to Dollarbirdrsquo (Oxford University PressMelbourne)
Higgins P J and Davies S J J F (Eds) (1996) lsquoHandbook of AustralianNew Zealand amp Antarctic Birds Vol 3 Snipe to Pigeonsrsquo (OxfordUniversity Press Melbourne)
Higgins P J and Peter J M (Eds) (2002) lsquoHandbook of Australian NewZealandampAntarcticBirdsVol 6 Pardalotes to shrike-thrushesrsquo (OxfordUniversity Press South Melbourne)
Higgins P J Peter J M and Steele W K (Eds) (2001) lsquoHandbook ofAustralian New Zealand ampAntarctic Birds Vol 5 Tyrant-flycatchers toChatsrsquo (Oxford University Press South Melbourne)
Higgins P J Peter J M and Cowling S J (Eds) (2006) lsquoHandbook ofAustralian NewZealandampAntarctic Birds Vol 7 Boatbill to Starlingsrsquo(Oxford University Press South Melbourne)
Irestedt M Joslashnsson K A Fjeldsaring J Christidis L and Ericson P G P(2009) An unexpectedly long history of sexual selection in birds-of-paradise BMC Evolutionary Biology 9 235 doi1011861471-2148-9-235
Isler K and van Schaik C P (2009) The expensive brain a framework forexplaining evolutionary changes in brain size Journal of Human Evolu-tion 57 392ndash400 doi101016jjhevol200904009
168 Emu D C Franklin et al
Iwaniuk A N and Arnold K E (2004) Is cooperative breeding associatedwith bigger brains A comparative test in the Corvida (Passeriformes)Ethology 110 203ndash220 doi101111j1439-0310200300957x
Iwaniuk A N and Nelson J E (2002) Can endocranial volumes be usedas reliable estimates of brain size in birds Canadian Journal of Zoology80 16ndash23 doi101139z01-204
Iwaniuk A N and Nelson J E (2003) Developmental differences arecorrelated with relative brain size in birds a comparative analysisCanadian Journal of Zoology 81 1913ndash1928 doi101139z03-190
Iwaniuk A N Dean K M and Nelson J E (2004a) A mosaic patterncharacterizes the evolution of the avian brain Proceedings of the RoyalSociety ndash B Biological Sciences 271 S148ndashS151 doi101098rsbl20030127
Iwaniuk A N Nelson J E James H F and Olson S L (2004b) Acomparative test of the correlated evolution of flightlessness and relativebrain size in birds Journal of Zoology 263 317ndash327 doi101017S0952836904005308
Iwaniuk A N Dean KM andNelson J E (2005) Interspecific allometryof the brain and brain regions in parrots (Psittaciformes) comparisonswith other birds and primates Brain Behavior and Evolution 65 40ndash59doi101159000081110
Jolicoeur P (1973) Imaginary confidence limits of the slope of the majoraxis of a bivariate normal distribution a sampling experiment Journalof the American Statistical Association 68 866ndash871 doi10108001621459197310481438
Joslashnsson K A Bowie R C K Nylander J A A Christidis L NormanJ A and Fjeldsaring J (2010a) Biogeographical history of cuckoo-shrikes(Aves Passeriformes) transoceanic colonization of Africa from Aus-tralo-Papua Journal of Biogeography 37 1767ndash1781 doi101111j1365-2699201002328x
Joslashnsson K A Bowie R C K Moyle R G Christidis L Norman J ABenz B W and Fjeldsaring J (2010b) Historical biogeography of an -Indo-Pacific passerine bird family (Pachycephalidae) differentcolonization patterns in the Indonesian and Melanesian archipelagosJournal of Biogeography 37 245ndash257 doi101111j1365-2699200902220x
Kark S Iwaniuk A Schalimtzek A and Banker E (2007) Living in thecity can anyone become an lsquourban exploiterrsquo Journal of Biogeography34 638ndash651 doi101111j1365-2699200601638x
Kearns A M Joseph L and Cook L G (2013) A multilocus coalescentanalysis of the speciational history of the Australo-Papuan butcherbirdsand their allies Molecular Phylogenetics and Evolution 66 941ndash952doi101016jympev201211020
Kennedy M and Page R D M (2002) Seabird supertrees combiningpartial estimates of procellariiform phylogeny Auk 119 88ndash108
Kennedy M Valle C A and Spencer H G (2009) The phylogeneticposition of the Galapagos Cormorant Molecular Phylogenetics andEvolution 53 94ndash98 doi101016jympev200906002
Kusmierski R Borgia G Uy A and Crozier R H (1997) Labileevolution of display traits in bowerbirds indicates reduced effects ofphylogenetic constraint Proceedings of the Royal Society ndash B BiologicalSciences 264 307ndash313 doi101098rspb19970044
Lefebvre L (2011) Taxonomic counts of cognition in the wild BiologyLetters 7 631ndash633 doi101098rsbl20100556
Lerner H R L and Mindell D P (2005) Phylogeny of eagles OldWorld vultures and other Accipitridae based on nuclear and mitochon-drial DNA Molecular Phylogenetics and Evolution 37 327ndash346doi101016jympev200504010
Madden J (2001) Sex bowers and brains Proceedings of the RoyalSociety ndash B Biological Sciences 268 833ndash838 doi101098rspb20001425
MaddisonW P andMaddison D R (2011) Mesquite AModular Systemfor Evolutionary Analysis Version 275 Available at httpmesquiteprojectorg [Verified 9 November 2013]
Maklakov A A Immler S Gonzalez-Voyer A Ronn J and Kolm N(2011) Brains and the city big-brained passerine birds succeed in urbanenvironments Biology Letters 7 730ndash732 doi101098rsbl20110341
Marchant S and Higgins P J (Eds) (1990) lsquoHandbook of Australian NewZealand amp Antarctic Birds Vol 1 Ratites to Ducksrsquo (Oxford UniversityPress Melbourne)
Marchant S and Higgins P J (Eds) (1993) lsquoHandbook of Australian NewZealand amp Antarctic Birds Vol 2 Raptors to lapwingsrsquo (Oxford Uni-versity Press Melbourne)
McCracken K G and Sheldon F H (1998) Molecular and osteologicalheron phylogenies sources of incongruence Auk 115 127ndash141doi1023074089118
Midford P E Garland T H and Maddison W (2008) PDAPPDTREEpackage for Mesquite v112 Available at httpmesquiteprojectorgpdap_mesquite [Verified 10 April 2013]
Moussus J-P Clavel J Jiguet F and Julliard R (2011) Which are thephenologically flexible species A case study with common passerinebirds Oikos 120 991ndash998 doi101111j1600-0706201018955x
Moyle R G (2006) A molecular phylogeny of kingfishers (Alcedinidae)with insights into early biogeographic history Auk 123 487ndash499doi1016420004-8038(2006)123[487AMPOKA]20CO2
Nealen P M and Ricklefs R E (2001) Early diversification of the avianbrain body relationship Journal of Zoology 253 391ndash404 doi101017S095283690100036X
Nyaacuteri A S and Joseph L (2011) Systematic dismantlement of Lichenos-tomus improves the basis for understanding relationships within thehoneyeaters (Meliphagidae) and the historical development of Aus-tralo-Papuan bird communities Emu 111 202ndash211 doi101071MU10047
Ovenden J RMackinlay A G and Crozier R H (1987) Systematics andmitochondrial genome evolution of Australian rosellas (Aves Platycer-cidae) Molecular Biology and Evolution 4 526ndash543
Pagel M (1999) Inferring the historical patterns of biological evolutionNature 401 877ndash884 doi10103844766
Pagel M D and Harvey P H (1988) The taxon-level problem in theevolution of mammalian brain size facts and artifacts American Natu-ralist 132 344ndash359 doi101086284857
Paradis E Claude J and Strimmer K (2004) APE analyses of phyloge-netics and evolution in R language Bioinformatics 20 289ndash290doi101093bioinformaticsbtg412
Pereira S L Johnson K P Clayton D H and Baker A J (2007)Mitochondrial and nuclear DNA sequences support a Cretaceous originof Columbiformes and a dispersal-driven radiation in the PaleogeneSystematic Biology 56 656ndash672 doi10108010635150701549672
Pinheiro JBatesDDebRoyS SarkarD andRDevelopmentCoreTeam(2013) nlme Linear and Nonlinear Mixed Effects Models R packageVersion 31ndash109 (The R Project for Statistical Computing ViennaAustria) Available at httpwwwr-projectorg [Verified 8 February2013]
Pravosudov V V Sanford K and Hahn T P (2007) On the evolution ofbrain size in relation to migratory behaviour in birds Animal Behaviour73 535ndash539 doi101016janbehav200610005
Raerinne J P (2013) Explanatory predictive and heuristic roles of allo-metries and scaling relationships Bioscience 63 191ndash198 doi101525bio20136337
Reif J Boumlhning-GaeseK FladeM Schwarz J andSchwagerM (2011)Population trends of birds across the iron curtain brain mattersBiological Conservation 144 2524ndash2533
Revell L J (2012) phytools an R package for phylogenetic comparativebiology (andother things)Methods inEcologyandEvolution3 217ndash223doi101111j2041-210X201100169x
Ricklefs R E (2004) The cognitive face of avian life histories ndash the 2003Margaret Morse Nice Lecture Wilson Bulletin 116 119ndash133 doi10167604-054
Relative brain size in Australian birds Emu 169
Schuck-Paim C Alonso W J and Ottoni E B (2008) Cognition in anever-changing world climatic variability is associated with brain size inNeotropical parrots Brain Behavior and Evolution 71 200ndash215doi101159000119710
Sol D Timmermans S andLefebvre L (2002) Behaviouralflexibility andinvasion success in birds Animal Behaviour 63 495ndash502 doi101006anbe20011953
SolDDuncanRPBlackburnTMCasseyP andLefebvreL (2005a)Big brains enhanced cognition and response of birds to novel environ-ments Proceedings of the National Academy of Sciences of the UnitedStates of America 102 5460ndash5465 doi101073pnas0408145102
Sol D Lefebvre K and Rodriguez-Teijeiro J D (2005b) Brain sizeinnovative propensity and migratory behaviour in temperate Palearcticbirds Proceedings of the Royal Society ndash B Biological Sciences 2721433ndash1441 doi101098rspb20053099
Sol D Szeacutekely T Liker A and Lefebvre L (2007) Big-brained birdssurvive better in nature Proceedings of the Royal Society ndash B BiologicalSciences 274 763ndash769 doi101098rspb20063765
Sol D Bacher S Reader SM andLefebvre L (2008) Brain size predictsthe success of mammal species introduced into novel environmentsAmerican Naturalist 172 S63ndashS71 doi101086588304
Sol D Garcia N Iwaniuk A Davis K Meade A Boyle W A andSzeacutekely T (2010) Evolutionary divergence in brain size betweenmigratory and resident birds PLoS ONE 5 e9617 doi101371journalpone0009617
Sorenson M D and Payne R B (2005) A molecular genetic analysis ofcuckoo phylogeny In lsquoThe Cuckoosrsquo (Ed R B Payne) pp 68ndash94(Oxford University Press Oxford UK)
SorensonMD Balakrishnan C N and Payne R B (2004) Clade-limitedcolonization in brood-parasitic finches (Vidua spp) Systematic Biology53 140ndash153 doi10108010635150490265021
StatSoft Inc (2012) lsquoStatistica 11rsquo (StatSoft Inc Tulsa)Thomas G HWills M A and Szekely T (2004) A supertree approach to
shorebird phylogeny BMC Evolutionary Biology 4 28 doi1011861471-2148-4-28
Vall-llosera M and Sol D (2009) A global risk assessment for thesuccess of bird introductions Journal of Applied Ecology 46787ndash795 doi101111j1365-2664200901674x
White N E Phillips M J Gilbert M T P Alfaro-Nunez A WillerslevE Mawson P R Spencer P B S and Bunce M (2011) Theevolutionary history of cockatoos (Aves Psittaciformes Cacatuidae)Molecular Phylogenetics and Evolution 59 615ndash622 doi101016jympev201103011
Williams S E Shoo L P Isaac J L Hoffmann A A and Langham G(2008) Towards an integrated framework for assessing the vulnerabilityof species to climate change PLoS Biology 6 e325 doi101371journalpbio0060325
Wink M El-Sayed A-A Sauer-Guumlrth H and Gonzalez J (2009)Molecular phylogeny of owls (Strigiformes) inferred from DNAsequences of the mitochondrial cytochrome b and the nuclear RAG-1gene Ardea 97 581ndash591 doi1052530780970425
Winkler H Leisler B and Bernroider G (2004) Ecological constraintson the evolution of avian brains Journal of Ornithology 145 238ndash244doi101007s10336-004-0040-y
Wright T F Schirtzinger E E Matsumoto T Eberhard J R GravesG R Sanchez J J Capelli S Muller H Scharpegge J ChambersG K and Fleischer R C (2008) A multilocus molecular phylogenyof the parrots (Psittaciformes) support for a Gondwanan origin duringthe Cretaceous Molecular Biology and Evolution 25 2141ndash2156doi101093molbevmsn160
170 Emu D C Franklin et al
wwwpublishcsiroaujournalsemu
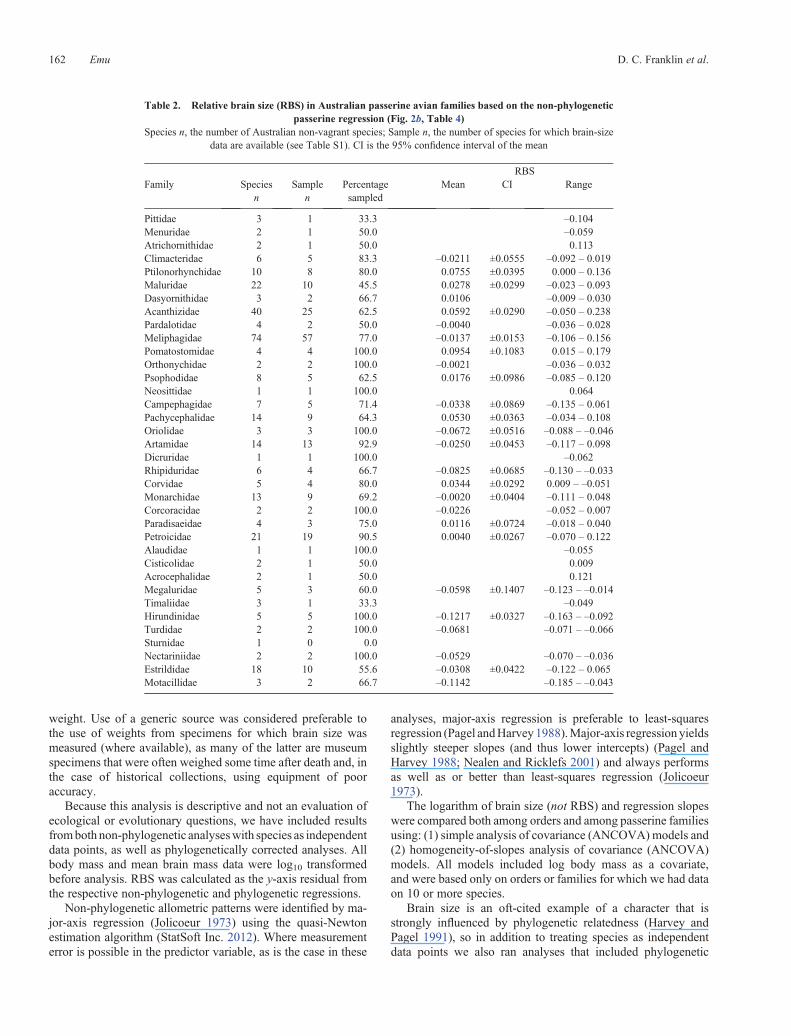
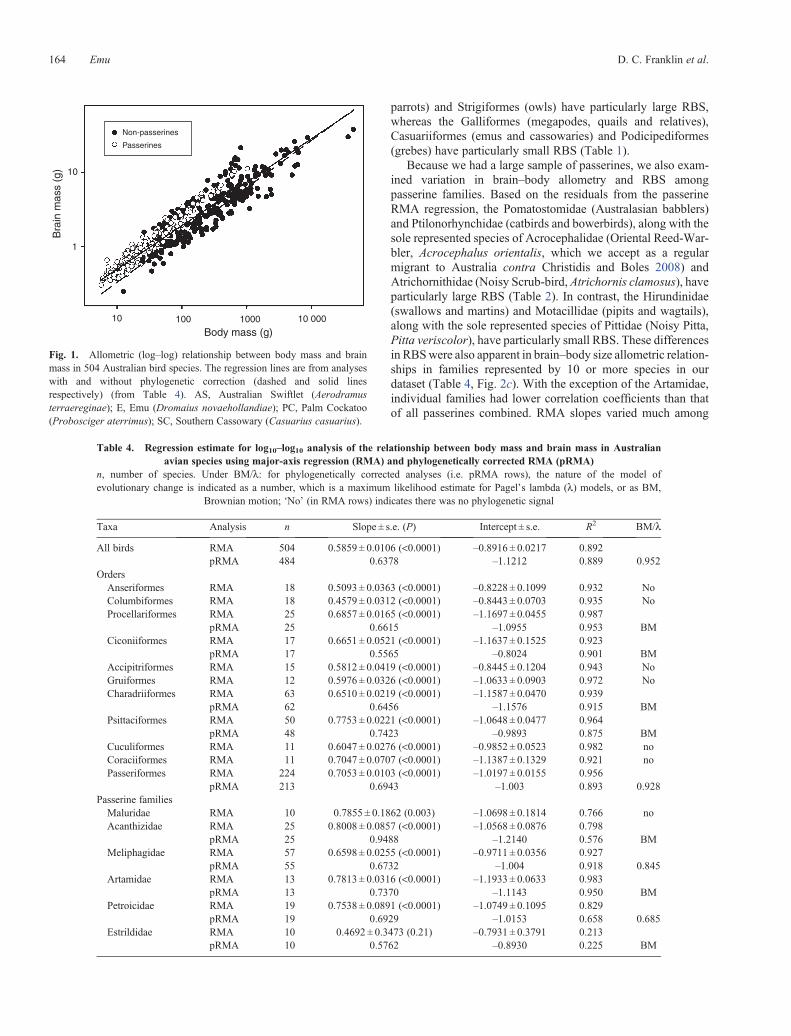
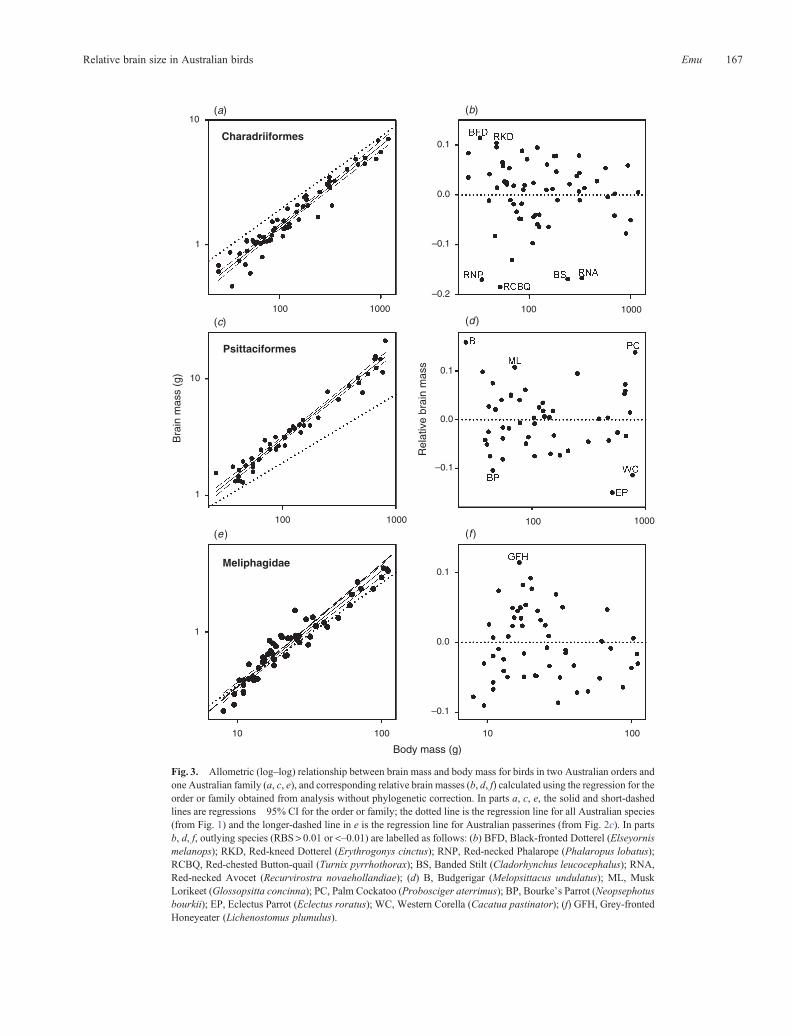