Relationships Between Physical Activity and Motor ... - CORE
270
Relationships Between Physical Activity and Motor and Cognitive Function in Young Children Abigail Fisher B.Sc. A Thesis submitted in fulfilment of the Degree of Doctor of Philosophy To the Department of Human Nutrition Faculty of Medicine University of Glasgow October 2008 Under the Supervision of Professor John J. Reilly With Funding from the Yorkhill Children’s Foundation & the Scottish Governments Chief Scientist’s Office (CSO) & British Heart Foundation. brought to you by CORE View metadata, citation and similar papers at core.ac.uk provided by Enlighten: Theses
-
Upload
khangminh22 -
Category
Documents
-
view
2 -
download
0
Transcript of Relationships Between Physical Activity and Motor ... - CORE

Relationships Between Physical Activity and Motor and
Cognitive Function in Young Children
Abigail Fisher B.Sc.
A Thesis submitted in fulfilment of the Degree of
Doctor of Philosophy
To the
Department of Human Nutrition
Faculty of Medicine
University of Glasgow
October 2008
Under the Supervision of Professor John J. Reilly
With Funding from the Yorkhill Children’s Foundation & the Scottish Governments Chief Scientist’s Office (CSO) & British Heart Foundation.
brought to you by COREView metadata, citation and similar papers at core.ac.uk
provided by Enlighten: Theses

2
Acknowledgements
I would like to acknowledge the Yorkhill Children’s Foundation, Chief
Scientist’s Office, and British Heart Foundation for funding.
I would like to thank Professor John Reilly for constant support & guidance and
Dr James Paton, Professor John McColl, James Boyle, Professor Philip
Tomporowksi & Dr David Young for their invaluable guidance, all members of
the MAGIC research team, the children, parents, schools and nurseries involved
in the research studies in this thesis, and the staff and students in the Department
of Human Nutrition who have been involved either directly or indirectly in the
research. I would like to thank Professor Lawrence Weaver and the staff in the
Department of Child Health. Special thanks to Ms Catriona Pearson for
assistance in data collection, Jennifer Taylor, Susan Nielsen and Sareena Hamzah
for providing me with coffee and company, and my friends and family for
support.

3
Declaration page
Author’s declaration
I declare that the work contained in this thesis is original, and is the work of one
author, Abigail Fisher except where otherwise stated. The information reported
from other authors has been quoted with their name and source of publication.
The relative contributions in terms of study design, data collection and analysis
has been highlighted at the beginning of each research chapter.
Supervisor’s declaration
I certify that the work reported in this thesis has been performed by A Fisher and
that during the period of study he has fulfilled the conditions of the ordinances
and regulations governing the Degree of Doctor of Philosophy.
Name ____________________ Date _________________
Signed ____________________

4
Abstract
Background: There is evidence suggesting a relationship between physical
activity and movement skills in adolescents. Evidence, primarily from animal
and older adult data, suggests that physical activity can improve cognitive
function. Both motor and cognitive function are essential components of school
readiness. If these relationships exist in young children, promotion of physical
activity may have a significant impact on school readiness and academic
achievement.
Participants and Methods
Study 1: 394 children (mean 4.2 SD 0.5 years; 209 boys/185 girls) were
recruited from 36 Glasgow preschools. Physical activity (PA) was measured
using the Actigraph accelerometer, movement skills (MS) were assessed using a
test based on the Movement Assessment Battery. Studies 2-4: 64 children (mean
age 6.2 yrs SD 0.3; 33 boys / 38 girls) were recruited from 6 Glasgow primary
schools. Psychological outcome measures were the Cambridge
Neuropsychological Test Battery (CANTAB) (working memory), the Attention
Network Test (reaction time) the Cognitive Assessment System (CAS)
(executive function), and the short form of Connor’s Parent Rating Scale
(CPRS:S) (behaviour). Physical activity was measured using the Actigraph
GT1M accelerometer. A specialist and trained teacher-led physical activity
intervention (active games) was run in intervention schools 2 hours per week for
10 weeks. The control PE sessions were specialist and teacher led standard
curriculum, increased to 2 hours per week.

5
Results: Study 1: There was a statistically significant, but very weak (r 0.18, p
<0.001), correlation between MS and PA. Boys and girls in the highest quartile
for MS had significantly greater time spent in MVPA than girls and boys and
girls in the lowest quartile, but this difference was small; median difference
between girls in Q4 and Q1 0.9%: 95% CI 0.2-1.6% p 0.01), median difference
between boys in Q4 and Q1 (median difference 0.9% 95% CI 0.0-0.2% p 0.04).
Studies 2-4: Test and 3 week retest intraclass correlations (ICC) from the
Cambridge Neuropsychological Test Battery (CANTAB) and Attention Network
Test (ANT) suggest these measures are not sufficiently reliable in to be used an
outcome in a future RCT in this age group (CANTAB spatial span r 0.51
p<0.001; spatial working memory r 0.49 p<0.00.1; strategy r 0.08, p<0.52) (ANT
reaction time 0.32 p<0.05; accuracy 0.62, p<0.001). The CAS was accepted well
by young children, has good previously established reliability, and would be a
suitable outcome measure for a full scale RCT. There was no significant
difference between the intervention and control group change in CAS scores
(Full scale t=-0.74, p=0.48) or any of the subscales (p all >0.05). Physical
activity was significantly higher during the intervention, than the control physical
education (PE) sessions (median difference 628 cpm 95% CI 460, 786 p=
<0.0001). During the standard curriculum PE sessions children in the control
group spent 58% of their monitored time in sedentary behaviour. The existing
data suggest that a 10 week intervention may improve spatial working memory
(t=2.78, p 0.01) and aspects of behaviour (CPRS:S Cognitive Problems/
Inattention (t=2.00 p=0.04) in this age group, but further research in larger
samples, with a more robust measure of SPW would be required to confirm these

6
findings. The data allowed a power calculation for a future full scale RCT to be
calculated (based on the CAS Planning scale), based on data from the current
study a sample size of n=75 in each arm would be required, recruiting 100 in
each arm to allow for drop-out.
Conclusion
The present data suggest only a weak relationship between MS and habitual
activity, and questions the strong emphasis placed on movement skill
development in the preschool curriculum. The present thesis provides data to
adequately design and power a future full scale RCT to examine the effects of
exercise and cognitive function.

7
List of publications
JJ Reilly, A Fisher, S Ashworth, C Boreham, Physical Activity and Health in Children and Adults (2008) Editors G. O’ Donavan and S.J. Biddle, Human Kinetics Champaign, Illinois. Based on Chapter 1. A Fisher, JJ Reilly, LA Kelly, C Montgomery, A Williamson, JY Paton, S Grant. Fundamental movement skills and habitual physical activity in young children. Med Sci Sports Exerc 2005; 37: 684-688. Based on Chapter 3.
A Fisher, JJ Reilly, JY Paton, JE Boyle, P Tomoropowski, J McColl Effect of a school physical education intervention on cognitive function and behaviour in 7-8 year olds: exploratory randomised controlled pilot. Under preparation. Based on Chapters 5 and 6.
Research awards arising from thesis work Scottish International Education Trust (SCIET) Young Researchers Travel Award, 2005. Yorkhill Childrens Foundation Research Prize, 2005 & 2006.
Grants arising from thesis work Scottish Executive Health Dept Chief Scientists Office (2006-2007; £14,768). Effect of exercise on cognitive function in children JJ Reilly (PI), J Boyle, JY Paton, A Fisher.
Other publications L A Kelly, J J Reilly, A Fisher, C Montgomery, A Williamson, J H McColl, J Y Paton and S Grant. Effect of socioeconomic status on objectively measured physical activity. Arch Dis Child 2006: 91: 35-3
JJ Reilly, LA Kelly, C Montgomery, A Williamson, A Fisher, JH McColl, R LoConte, JY Paton, S Grant. Physical activity to prevent obesity in young children: cluster randomised controlled trial. BMJ 2006;333:104
A Fisher, JJ Reilly, LA Kelly, C Montgomery, A Williamson, JY Paton, S Grant. Seasonality in physical activity in young children. Pediatr Exerc Sci 2005; 17: 31-40

8
Contents
Acknowledgements 2 Declaration page 3 Abstract 4 List of publications 7 Contents 8 List of tables 10 List of figures 11 Glossary 12 Chapter 1: Literature review 14 1.1. Exercise and cognitive function: background 15 1.2. Physical activity and cognitive or motor function: animal data 16
1.3. Physical activity and cognitive function in adults 19 1.4. Physical activity and cognitive function in children 26 1.5. Physical activity and cognitive function: potential mechanisms 33 1.6. Physical activity and motor development 44 1.7. Researching the relationship between physical activity and motor or cognitive function: design issues. 46 1.8. Summary 48
Chapter 2: Methods I – Movement assessment 76 2.1 Movement skill assessment in young children 77 2.2 Measurement of physical activity in children 84 2.3. Anthropometric measures 97
Chapter 3. The relationship between fundamental movement skills and physical activity in young children. 107 3.1 Introduction 109 3.2 Participants and methods 110 3.3. Results 115 3.5 Discussion 119 3.5. Conclusions 122
Chapters 4-6: General introduction 124 Chapter 4 - Methods II 125 4.1. Cognitive Assessment System 126 4.2 Conner’s Parents Rating Scale: short form 132
Chapter 5. Reliability of psychological outcome measures 135 5.1 Test retest reliability of the Cambridge Neuropsychological Test Battery (CANTAB) 137 5.1.1 Introduction 137 5.1.2 Participants & methods 139
Reliability 142 5.1.3 Results 144 5.1.4 Discussion 146 5.1.5 Conclusions 148
5.2 Test retest reliability of the Attention Network Test 149 5.2.1 Introduction 149 5.2.2 Participants and methods 150

9
5.2.3 Results 154 5.2.4 Discussion 156 5.2.5 Conclusions 157
Chapter 6. Chronic Effect of Aerobic Exercise on Executive Function: A Pilot Study 158 6.1 Introduction 160 6.2. Participants and methods 163 6.2 Results 167 6.4. Discussion 183 6.5. Conclusion 190
Chapter 7. Overall thesis discussion 191 7.1 Summary of findings 192 7.2 Directions for future research 198
8.1. References 201
10
List of tables
Table 1. 1 Key reviews and meta-analyses examining the effect of exercise on cognitive function 50 Table 1. 2 Overview of key animal studies examining effects of exercise or environmental enrichment on brain structure and cognition. 52 Table 1. 3 Randomised controlled trials & meta-analytic studies examining effect of exercise on cognitive function in adults; key references. 56 Table 1. 4 Prospective & cross sectional studies examining the effects of exercise and cognitive function / cognitive impairment in adults. 60 Table 1. 5 Studies examining effect of exercise on cognitive function or academic achievement in children. 64 Table 1. 6 Studies examining the relationship between physical activity and movement skills. 74 Table 2. 1 Movement skill assessments for Preschoolers (3-5 years); psychometric properties & practical utility 82 Table 2. 2 Published reviews of measurement of physical activity in children / adolescents. 98 Table 2. 3 Summary of scales for direct observation of physical activity in children 99 Table 2. 4 Specifications of the 3 most commonly used accelerometers in paediatric research. 102 Table 2. 5 Accelerometer validation studies in children. 103 Table 3. 1 Physical characteristics and physical activity of children 116 Table 5. 1 Reliability of the CANTAB working memory battery in 6 year olds. 145 Table 5. 2 Reliability data from the Attention Network Test (ANT) in 6 year olds 155 Table 6. 1 Baseline characteristics for LEAPFROG participants 168 Table 6. 2 Habitual physical activity and physical activity intensity during intervention and control physical education (PE) sessions 172 Table 6. 3 Scores from the Cognitive Assessment System (CAS) 174 Table 6. 4 Change in scores of from Cognitive Assessment System (CAS) in Intervention and Control groups 174 Table 6. 5 Adjusted T scores for Conner’s Parent Rating Scales Short Form 181 Table 6. 6 Adjusted model for LEAPFROG psychological outcome measures 182 Table 7. 1 Future directions for research. 199

11
List of figures
Figure 3. 1 Lower, middle and upper quartiles for time spent in moderate and vigorous physical (MVPA) activity in boys and girls 118 Figure 5. 1 The CANTAB Motor Screening subtest. 140 Figure 5.2 The CANTAB Motor Spatial Span Subtest 141 Figure 5. 3 The CANTAB Spatial Span subtest 142 Figure 5. 4 Schematic representation of the Warning Types, Cue, Flankers and Stimuli in the Child Attention Network Test (ANT) 153 Results: Figure 6. 1 CONSORT Flow Diagram for LEAPFROG 169 Figure 6. 2 Boxplot of changes in Cognitive Assessment System (CAS) score in LEAPFROG Intervention and Control groups 175 Figure 6. 3 Boxplot of changes in Cognitive Assessment System (CAS) score 176 Figure 6. 4 Scatterplot of Cognitive Assessment System and BMI SDS 176 Figure 6. 5 Change in Attention Network Test (ANT) reaction time. 178 Figure 6. 6 Change in Attention Network Test (ANT) accuracy scores. 178
12
Glossary
Acetylcholine: a neurotransmitter at cholinergic synapses in the central, sympathetic,
and parasympathetic nervous systems. It is the most prevalent neurotransmitter in the
body and is crucial to arousal, learning, memory, and motor function.
APOE e4 allele: genetic risk factor for dementia.
BDNF: (Brain-derived neurotrophic factor) is a member of the neurotrophic family that
support the health & functioning of glutamatergic neurons (the primary neuron type in
the brain). Brain-derived neurotrophic factor is capable of mediating the beneficial
effects of exercise on brain plasticity BDNF is synthesised in the cell body, then
transferred back and forth to synapses (see Cotman & Engesser-Cesar, 2001 p75).
BOLD fMRI- Blood oxygen level dependent functional magnetic resonance
imageing that relies on changes in hemoglobin oxygenation.
BRdU can be incorporated into the newly synthesized DNA of replicating cells (during
the S phase of the cell cycle), substituting for thymidine during DNA replication.
Antibodies specific for BrdU can then be used to detect the incorporated chemical (see
immunohistochemistry), thus indicating cells that were actively replicating their DNA
CREB (cAMP response-element-binding) stimulus induced transcriptional regulator,
has a significant role in adaptive response and long-term memory formation. Found in
mRNA. Neural marker of plasticity.
Dementia Cognitive impairment (e.g. loss of memory) that is significant enough
to affect normal functioning. Specific types of dementia are Altzeimer’s disease
and Vascular dementia.
EEG - Electroencephalography is the measurement of electrical activity
produced by the brain as recorded from electrodes placed on the scalp.
Executive functions - ‘higher’ cognitive processing, for example making goals,
planning, response inhibition, working memory.

13
Exercise - is a sub-category of physical activity, which involves “planned,
structured, and repetitive movements done to improve or maintain one or more
components of physical fitness” (Caspersen et al 1985).
fMRI- (functional Magnetic Resonance Imagining) is a type of specialised
imageing scan that measures the movement of blood related to neural activity in
the brain or spinal cord of humans or other animals.
Glutamanergic neurons – The primary neuron type in the brain. They connect
cognitive, sensory and motor brain regions.
Acetylinecholine is released by neurons at the neuromuscular junction that causes
muscle contraction
Muscaniric receptors – acetylcholine receptors.
Neuron – neurons are the key cells in the brain.
Physical activity (PA) is defined as bodily movement produced by the
contraction of skeletal muscle that increases energy expenditure above the basal
level (Caspersen et al., 1998; Power et al., 1990). Habitual physical activity is a
representation of an individual’s usual physical activity.
Synapse: The region of a neuron where communication occurs.
Synapsin I: Found within mRNA. Neural marker of plasticity.
TrkB – the BDNF receptor.

14
Chapter 1: Literature review

15
1.1. Exercise and cognitive function: background Note: Review studies will have only been cited when making general statements, as a guide for original
research references and as an indicator of future research directions. Where a review is cited an R will
appear beside the citation. For key reviews & meta-analyses on this topic see Table 1. 1.
Physical activity improves human brain health (Dishman et al., 1996R). There has
been a resurgence of interest in the relationship between exercise and human
cognitive function in recent years (Tomporowski, 2008R; Colcombe & Kramer,
2003; Sibley & Etnier, 2003). In the 50’s and 60’s this was an area of interest in
research, however in the 1970’s the research trends shifted to the physical
benefits of exercise (Kirkendal 1986R). The large, and continuously growing,
body of animal literature, and advent of new brain imageing techniques (e.g.
blood oxygen level imageing (BOLD) and functional magnetic resonance
imagine (fMRI) – see glossary for descriptions- in humans have greatly advanced
researchers understanding of how exercise may impact on brain structure and
function in adults (Kramer, 1999). Researchers are now developing interest in
determining whether the exercise-related benefits on cognition seen in adults also
apply to children.
The original research in this thesis relates to the relationship between physical
activity and aspects of child cognitive function, and relationships between
physical activity and motor function. However, as there is a paucity of child data
examining the relationship between physical activity and cognitive or motor
function at present (Tomporowski, 2008R; Etnier, 2006; Fisher et. al, 2005) and
no previous experimental data on children under 7 years, key references from
adult and animal data will be discussed also.

16
1.2. Physical activity and cognitive or motor function: animal data For detailed descriptions of studies see
Table 1. 2.
There is a wealth of very convincing animal data suggesting that physical activity
can alter brain structure and function, impacting on learning and behaviour (see
summary Table 1.2). It is beyond the scope of this thesis to review all the
animal literature, but the studies that are deemed chronologically important (both
by the thesis author and by consistent citations in expert reviews) and most
relevant to the current thesis will be discussed. Animal studies will be presented
in chronological order to emphasise the development of the field.
Black et al. (1990) carried out a post-mortem examination of the cerebellar
cortex of 38 10 month old rats that had been kept for 10 days in one of 4
experimental conditions; the Acrobatic condition (AC) which involved
progressively more difficult balance beams, see-saws and ropes; the Forced
Exercise condition (FX) (progressive treadmill walking); the Voluntary Exercise
condition (free access to a running wheel) and the Inactive Condition (IC) which
allowed minimal opportunity for exercise. Increased synaptogenesis (formation
of new synapses) was seen only in the Acrobatic condition, whereas increased
angiogenesis (formation of new blood vessels) was seen in both Forced and
Voluntary Exercise conditions, relative to the Acrobatic and Inactive animals.
The authors suggested that an element of motor learning must be present (i.e.
progressively more difficult / new challenges) for synaptogenesis to take place
(in rats) (Black et al., 1990).

17
Fordice & Farrar (1991) provided evidence that aerobic exercise can alter and
enhance neurotransmitter systems; chronic treadmill running increased
hippocampal high-affinity choline uptake (HACU) and muscaniric (membrane-
bound acetylcholine receptor) receptor density in the rat hippocampus, resulting
in enhanced spatial memory performance, as compared to acute treadmill
running and control rats, (Fordice & Farrar, 1991). See
Table 1. 2 for details. There is also evidence that exercise can counteract the age-
related decline in dopamine function in rats (MacRae et al., 1987).
Animal data suggest that exercise may enhance other systems in the molecular
brain systems (Neeper et al., 1995). There is increasing support for the view that
exercise induces brain-derived neurotrophic (BDNF) factor gene expression
(Cotman & Engesser-Cesar, 2002R). BDNF is a growth factor that supports the
health and functioning of neurons. BDNF targets the primary neuron type in the
brain; the glutamanergic neuron (Cotman & Engesser-Cesar, 2002R). Neeper et
al., (1995 & 1996) report evidence that voluntary wheel running in rats may
increase gene expression of brain-derived neutrotrophic factor (BDNF) (Neeper
et al., 1995 & 1996). BDNF is a neurotrophin (nerve growth factor) which
supports the function and survival of neurons, and may help protect neurons from
free radical damage. Neeper et al., (1995) found a direct correlation between
BDNF messenger ribonucleic acid (mRNA) in the hippocampus, and distance
run by the animal, and note that the greatest effects of exercise on BDNF were
found in areas of high brain plasticity (changeable areas, responsive to
environmental stimuli) (Neeper et al.1995).

18
BDNF is important in learning, and the formation of new memories via long-
term potentiation (LTP). In LTP, synaptic stimulation and activity lead to the
long-term potentiation of the synaptic response (Cotman and Engessar-Cesar,
2002). LTP is BDNF dependent.
Tong et al. (2001) provide further supporting evidence of enhanced hippocampal
BDNF gene expression in rodents in response to exercise (wheel running). These
authors also found that exercise led to changes in expression of a large number of
other genes in the mouse hippocampus known to be associated with neuronal
activity, structure of the synapse, and neuronal plasticity (Tong et al., 2001)
Evidence suggests that environmental enrichment can positively influence
cognitive function (Kemmperman, 1997). However, in animal studies, results are
often confounded by the fact that ‘enrichment’ includes more social interaction,
and more opportunity for physical activity, than control conditions (van Pragg et
al. 1999). van Pragg et al., (1999) attempted to control for this in a mouse study,
by separating the components of enrichment to include Standard housing (with
the same amount of space as Enrichment group); Enrichment; Exercise
(voluntary wheel running) Swimming; and a control group. Their findings
indicated that, post-mortem, the mice in the Exercise and Enrichment groups
displayed enhanced neurogenesis in a hippocampal area called the dentate gyrus.
The dentate gyrus is associated with neural plasticity, and storing of memories
(van Pragg et al., 1999). Interestingly, the Swimming group did not differ from
the control in terms of neurogenesis. The authors suggest this may be as the
forced exercise periods (Swimming) were much shorter than the voluntary wheel

19
running and/or the forced exercise may have caused stress which may
‘counterbalance’ the positive effect of exercise on the brain (van Pragg et al.,
1999).
Overall, the animal studies to date provides convincing evidence that exercise
has a beneficial effect on cognition, and this benefit may come from changes in
the ‘architecture’ of the brain (Tong et al., 2001).
1.3. Physical activity and cognitive function in adults
For detailed descriptions of studies see Table 1. 3 & Table 1. 4.
Adults over the age of 85 are the fastest growing segment of our population
(McAuley et al., 2004R). The incidence of dementia increases dramatically from
mid-life to old age (Matthews et al., 2005) with approximately 1 in 10 adults
aged 85-89 years developing dementia (Jorm & Jolley, 1998), and there are huge
associated economic costs (McAuley et al., 2004R). Maintaining brain health and
plasticity through life is, therefore, an extremely important public health goal
(Rockwood & Middleton, 2007R; Rovio et al., 2005), and it is increasingly clear
that exercise can help achieve it (Rovio et al., 2005; Cotman and Berchtold,
2002R). Over the past decade, a number of studies on humans have shown the
benefits of exercise on brain health and function, particularly in ageing
populations (Rockwood & Middleton, 2007; Cotman and Berchtold, 2002).
Historically, exercise participation has consistently emerged as a key indicator of
improved cognitive function in older adults (Berkman, 1993; Hill, 1993; Rogers,
1990; Blomquist and Danner, 1987) and recent research suggests that exercise is
associated with a reduced risk of cognitive impairment (e.g. dementia and
20
Alzheimer’s disease) (Rovio et al. 2005; Lytle et al., 2004; Weuve et al., 2004;
Laurin et al, 2001), especially in those genetically susceptible – i.e. carriers of
the APOE e4 allele (Rovio et al. 2005). However, interaction between the APOE
allele and exercise has not been confirmed in all studies (Podewils et al., 2005).
A 5-year prospective study of 4615 individuals indicated that physical activity
was associated with lower risks of non-dementia cognitive impairment (CIND),
Alzheimer’s disease (AD) and dementia (Laurin et al., 2001). Similarly, Abbott
et al., (2004) found a relationship between distance walked per day, and
probability of developing Alzheimer’s up to eight years later, in their sample of
2257 71 to 93 year old men. A retrospective study found that behavioural
stimulation and physical activity reduced the risk of developing AD (Friedlands,
et al., 2001). These data from humans are supported by the animal research
demonstrating that exercise and / or behavioural enrichment can increase
neuronal survival and resistance to brain insult (Stummer et al., 1994; Carro et
al., 2001) promote brain vascularisation (Black et al., 1990; Isaacs et al., 1992)
stimulate neurogenesis (van Praag et al., 1999), enhance learning (van Praag et
al., 1999; Young et al., 1999), and contribute to maintenance of cognitive
function during ageing (Escorihuela et al., 1995).
In a cross-sectional study of 55-79 year olds in the USA, age-related declines in
cortical tissue density were significantly reduced as a function of cardiovascular
fitness. These associations were greatest in the frontal, prefrontal and parietal
cortices (Colcombe et al., 2003). These regions show the greatest age-related
declines in humans (Raz, 2000). Importantly, they are also thought to support

21
executive functions (Colcombe et al., 2004) which show the greatest
improvement with cardiovascular training in ageing humans (Colcombe &
Kramer 2003).
There is the suggestion from the animal literature that early life physical activity
may be especially important, because it enables optimal neural development,
resulting in a neural reserve that can be drawn upon in old age (Black, Isaacs and
Greenough, 1991). Dik et al., (2003) carried a longitudinal study in 3107 of the
participants in the Longitudinal Ageing Study Amsterdam (LASA) examining
whether early life physical activity could influence cognition (measured by Mini
Mental-State Exam, MMSE) in old age. After controlling for age, sex, verbal
intelligence, socio-economic status, lifestyle (early life physical work demands,
current PA levels, smoking status, alcohol consumption) and health indicators
(diabetes, cardiac disease, depression), there was a significant positive
association of early life physical activity with information processing speed (in
men only) (Dik et al., 2003). Information processing speed declines rapidly with
ageing, and is thought to be the basic component of most cognitive functions
(Salthouse, 1996). A major limitation of this study was that early life physical
activity was assessed using retrospective self-report, based on a single question.
Participants with cognitive impairment were excluded from this study; however
the misclassification of previous physical activity by the elderly is likely (Falkner
et al., 2001).
A number of recent large prospective studies on older adults have examined the
relationship between physical activity and cognition. Yaffe et al., (2001) reported

22
a study of 5925 community dwelling women (>65 years of age), who were
characterised by the distance (number of blocks on the street) they walked per
week. The central question was whether higher levels of activity would serve a
protective function 6-8 years later. These authors found that women with greater
baseline physical activity levels were less likely to experience cognitive decline,
measured by the mini-mental status exam (MMSE) during 6-8 year follow-up.
This effect remained after controlling for age, education, health status,
depression, diabetes, stroke, smoking and oestrogen use. A similar study (Barnes
et al., 2003) with 349 participants (>55 years of age) found that baseline fitness
level predicted higher levels of cognitive performance six years later. This study
is noteworthy as it used both measures of aerobic fitness and self-report measures
of physical activity, and assessed a wider range of cognitive processes. Higher
levels of aerobic fitness (measured by V02 peak) predicted better performance of
measures of attention and executive function (Barnes et al., 2003).
Richards et al., (2003) found that self-reported physical activity level at 36 years
of age was predictive of higher levels of verbal memory in a sample of 1919
participants, from 43-53 years. Rovia et al., (2005) demonstrated that mid-life
physical activity is associated with reduced risk of dementia in later life (Rovia et
al., 2005). A large longitudinal study has also suggested obesity and overweight
as an independent risk factor for cognitive impairment, even after controlling for
cardiovascular disease and diabetes (other risk factors for cognitive impairment)
(Whitmer, 2005) however, these authors did not control for physical activity.
Gustafson et al., (2004) showed a longitudinal (24 year follow up) relationship
between BMI and temporal lobe atrophy in women (Gustafson et al., (2004) even

23
after controlling for a number of physical, demographic and lifestyle factors,
including self reported physical activity (Gustafson et al., 2004). Adiposity
related inflammation has been suggested as a potential hypothesis (Knecht et al.,
2008R); C reactive protein is elevated in adiposity (Das, 2001), and also
associated with cognitive decline and dementia (Yaffe et al., 2004). Mid life
adiposity (skin fold thickness) has also been associated with Parkinson’s disease
(Abbot et al., 2003). It is unclear at present how, or if, these associations are
related to, or mediated by, physical activity.
The bulk of the existing data suggest that modest levels of physical activity and
exercise can have beneficial effects on several cognitive processes of middle-
aged and older individuals, and studies also suggest a reduced risk of
Alzheimer’s disease with physical activity. Although these studies are valuable
in establishing a reliable association between exercise and cognition, conclusions
are limited by the prospective, observational design (self selection into exercise
levels, limited assessments of cognition and fitness). It is important to examine
the relationship between fitness, cognition and brain function in randomised
clinical trials in order to confirm causality and to understand the ‘dose-response’
relationship between physical activity and cognition (Etnier et al., 2006).
Colcombe and Kramer (2003) carried out a meta-analysis of all experimental
studies published between 1966 and 2001 examining the effect of cardiovascular
fitness training on cognitive function carried out in adults over 55 years of age.
These authors found a clear and significant effect of aerobic training on cognitive
function. A further finding was that, although exercise effects were seen across a
24
wide range of tasks and cognitive processes, the effects were largest for those
that involved executive control processes (i.e. planning, scheduling, working
memory, interference control, task coordination) (Colcombe& Kramer, 2003).
Executive control processes, and the brain structures that support them, have
been shown to decline substantially with age (Raz, 2000). Therefore, the results
of the meta-analysis by Colcombe & Kramer (2003) suggest that even processes
that are quite susceptible to ageing appear to be amenable to intervention
(Kramer et al., 2005).
Colcombe et al., (2004a) carried out a cross-sectional fMRI study on 41 older
adults (aged 55-77 years). These adults were split depending on their
cardiovascular fitness (Rockport 1 mile walk test). The participants were
examined using functional magnetic resonance imageing, while performing a
modified version of the Ericksen Flanker test (Eriksen & Erisken, 1974.
Consistent with the author’s predictions, older adults who tested high in
cardiovascular fitness, demonstrated significantly greater activation in several
cortical regions associated with attentional control. In support, recent evidence
has shown that individual differences in cardiovascular fitness affect regional
cortical density (Colcome et al., 2003).
Kramer et al., (1999) demonstrated the first clear evidence that aerobic exercise
(versus stretching and toning) has selective positive effects on cognition; with the
benefits being seen in tasks involving executive control (planning, scheduling,
working memory). In a randomised controlled trial by the same authors
(Colcombe et al., 2004b) a separate sample of 29 sedentary older adults aged 58-

25
77 years were randomly assigned to either a cardiovascular training group
(aerobic) which involved walking groups 3 times per week for 6 months with
increasing length and intensity (heart rate), implemented by exercise training
personnel, or a stretching and toning group (control). After 6 months the aerobic
group showed a significantly greater level of task-related activity (measured by
functional magnetic resonance imageing (fMRI) while performing the Flanker
task as above) in attentional control areas (middle frontal gyrus, superior frontal
gyrus, and the superior parietal lobe) and, interestingly, a reduction in activity in
the anterior cingulate cortex (Colcombe et al., 2004).
As noted by the authors, fMRI measures used in these studies are sensitive to
changes in blood flow. Therefore, it may be suggested that the results of these
studies may be due to changes in fitness-related blood flow rather than changes
in neural recruitment. However, as noted, in these studies, high-fit or
cardiovascular trained participants show a decrease in activity in the anterior
cingulate cortex (a region associated with the presence of behavioural conflict
and the need to adapt attentional control processes). If increased fitness leads to
increases in task-related blood flow, it should be seen in all areas therefore these
data likely relate to changes in cortical function (Colcombe et al., 2003). The
result of the adult studies described above support the hypothesis that aerobic
exercise is associated with better performance on tests of executive function in
older adults.
Suggested mechanisms for the effect of exercise in prevention of cognitive
decline are mediation of risk factors (hypertension, high cholesterol, diabetes,
26
overweight) (Kivipelto et al., 2001; Launer et al., 2002), however, Ravo et al.
(2005) controlled for these factors and found a protective effect of exercise
against dementia and Alzheimer’s disease (Ravo et al., 2005). Other potential
mechanisms may be alleviation of the amyloid burden (Ravo et al., (2005),
increasing cognitive reserve, improvement or maintenance of vascular health
(although evidence suggests that exercise-related reduction in vascular dementia
are less likely; (Podewils et al., 2005) and neurobiological mechanisms.
Neurobiological mechanisms are discussed in more detail in section 1.6.
Data from animal models, human behavioural paradigms and neuroanatomical
models all suggest that exercise positively affects cognitive functioning in ageing
humans (Colcombe et al., 2004).
1.4. Physical activity and cognitive function in children
Children’s executive function
If the observed relationship between aerobic exercise and enhanced executive
function performance were to exist in children, this may have a positive impact
on school readiness and school performance (Bull et al., 2008), which in turn,
may aid in the promotion of physical activity (in educational establishments, and
by parents), and aid in the public health campaign to reduce the growing
epidemic of childhood obesity (Wooford et al., 2008; Sharma, 2006; DeMattia et
al., 2006; Reilly at al., 2006). Physical activity and play behaviours are thought
to have important roles in the normal maturation of children’s executive function
processes (Hughes, 1995; Johnston, Christie and Yawkey, 1987; Panksepp,

27
Sivity & Normasell, 1984). Indeed restrictive environments which limit
children’s access to time to engage in free play, rough and tumble play, and
physical activity may retard frontal lobe structures resulting in core deficits
present in ADHD (Panksepp, 1998).
Physical activity and cognitive function: child studies: for detailed descriptions
of studies see Table 1. 6.
A meta-analysis of 44 studies on the effect of chronic exercise studies on
cognition in children conducted by Sibley & Etnier (2003) suggested that chronic
exercise is positively related to cognitive function in children. A significant
overall effect size of 0.32 was obtained, providing further support for the effect
sizes demonstrated in the adult meta-analyses (Etnier, 1997; Colcombe &
Kramber, 2003; Etnier., 2006). Sibley & Etnier (2003) suggest however that their
analysis is weakened by a number of factors. Firstly an insufficient number of
studies (only 9 peer-reviewed studies using true experimental designs have been
published) and the methodology and outcome measures in these studies vary
dramatically. As noted by the authors, the little existing data support the
hypothesis that exercise causes improvement in cognition, but that the limited
number of studies, and potential confounding variables make it hard to draw
conclusions, and randomised controlled trials are required (Sibley & Etnier,
2003).
It is unclear to what extent the observed effect of exercise on executive function
in adults exists in children. In an attempt to address this issue, Davis et al. (2007)
carried out the first ever RCT designed to examine the relationship between

28
aerobic exercise and executive function in children. The trial involved 94
overweight (BMI >85th centile) 7-11 year old children in Georgia, USA. These
authors examined pre and post scores from the Cognitive Assessment System
(CAS); a standardized cognitive assessment containing a subscale measuring
executive function (the Planning scale) and three other subscales measuring other
aspects of cognition (the CAS is described in detail in Chapter 4 of this thesis)
after a 15 week intervention (aerobic games designed to elicit HR of >150 bpm).
Children were assigned to a Control, a Low-Dose exercise (20 minutes 5 x per
week) or High-Dose exercise (40 minutes 5 x per week) group. Significant
improvements were seen in post-test CAS scores in the High-Dose group relative
to the other groups. The improvements were seen in the Planning scale only,
supporting the executive function hypothesis (Davis et al., 2007). Interestingly,
similar improvements in fitness were seen in the High and Low-Dose exercise
groups; this does not support the cardiovascular fitness hypothesis (that exercise-
related cognitive gains are directly related to improvement in cardiovascular
fitness). The results in this study may apply only to sedentary, overweight
children from low socio-economic background, who may respond better to
intervention (Davis et al., 2007). It is important to carry out research to determine
whether these results can be applied to more typically developing children over a
wider range of ages. It should be noted, that at the time of designing the protocol
for the pilot study described in Chapter 6, the data from Davis et al. were not
available. It was unclear what exercise ‘dose’ was necessary to elicit a change in
cognitive function in children.

29
Physical activity and behaviour
There has been very little evidence on the effects of physical activity (chronically
or acutely) in typically developing children. A meta-analysis by Allison et al.
(1995) revealed 16 studies (some single participant studies) examining the effects
of ‘antecedent exercise’; defined as ‘any increased physical exertion applied with
the intent of reducing disruptive behaviour’, on disruptive behaviour. A
significant effect size of 0.33 was reported. It is unclear whether this is
generalisable, as it possible that children with behavioural disorders may
response better to intervention (Allison et al., (1995), and this is an area for
further research.
Physical activity and academic achievement: see table 1.5.
Educators have suggested that physical activity contributes to academic
performance (Sibley & Etnier, 2003). Physical activity is thought to be
associated with improvements in attitude, discipline, behaviour and creativity
(Keays & Allison, 1995). Cross-sectional studies tend to find a positive
relationship between physical activity level and academic achievement (e.g.
Castelli et al., 2007; Nelson & Gordon-Larson, 2006; Linder, 2002; Field et al.,
2001). However, findings are equivocal; some cross-sectional studies have
suggested no relationship (Dollman et al., 2006), or even an inverse relationship
between physical activity and academic achievement (Tremblay et al., 2000).
The large majority of existing studies have been cross-sectional in nature, and
therefore give no information on the direction of the relationship, have used self
reported physical activity, and sometimes self reported achievement scores (child
participants asked to provide average grades) and may be confounded by

30
numerous other health-related, demographic or environmental variables (see
summary Table 1. 5).
For example, in a large-scale descriptive study on California school children,
Winger & Thomas (2002) reported data obtained from 353,000 5th grade,
322,000 7th grade and 279,000 9th grade were associated with children’s fitness
scores on the Stanford Achievement Test (Winger & Thomas, 2002). In each age
group higher academic achievement scores, particularly in maths and reading,
were related with higher levels of physical fitness (Winger & Thomas, 2002).
Castelli et al., (2007) found that aerobic fitness has a small, significant positive
relationship to academic achievement (Castelli et al., 2007). These data do not
attribute a causal relationship between children’s physical activity and learning
as the data are cross-sectional.
To date there is only one randomised controlled trial that has examining the
effects of physical activity (increased physical education (PE) time) in schools on
academic achievement (Ahamed et al., 2007). In a 16 month cluster RCT, ten
schools were randomised to intervention or control (usual practice). The
intervention consisted of the AS! BC model, which is a school health framework
designed to promote physical activity in schools incorporating school, home and
environment elements, and teacher training (Ahamed et al, 2007). In this
intervention study, 15 minutes extra physical education per day was provided by
teachers. There was no significant difference in achievement scores after 16
month intervention (Ahamed et al., 2007). Although this study is the only
existing RCT to examine the effects of exercise on achievement, there are
31
notable limitations; physical activity was assessed by questionnaire, which is
prone to bias, especially in children (Trost, 2005). There were no objective
measures of either habitual physical activity or the intensity of the PE
intervention. 15 minutes a day extra PE time only amounts to around an extra 75
minutes per week, which may not be enough to be a high enough ‘dose’ of
physical activity to influence cognition (Davis et al, 2007), and the practicalities
of carrying out such an intervention in school time make it probable that a large
proportion of the supposed ‘enhanced’ PE was actually spent organising and
instructing children, and warming up / cooling down. Although randomised, the
control group had significantly higher baseline achievement scores than the
intervention group (Ahmed, et al., 2007) while this may have been unavoidable,
it suggests that there may have been inherent differences between the children in
the intervention and the control group. Another major limitation was the failure
to control for socio-economic status (SES), which is a know predictor of
academic achievement (Noble, 2005; Blair, 2005).
Only four large-scale studies (included in the Sibley and Etnier meta-anlaysis)
have been conducted and published examining the effect of exercise and
academic achievement; the Vanves project (not published in English, but
mentioned as quoted consistently), the Trois Riveries study (Shephard et al,
1984), the South Australian study (Dwyer et al., 1978), and Project SPARK
(Sallis et al., 1999). In each of these studies time in physical education (PE) was
increased dramatically and time spent in academic subjects was reduced. In three
of the studies there was a significant improvement in academic performance with
increased PE, and in one (the South Australian study) there was no difference in

32
academic performance between increased PE and standard curriculum (see Table
1. 5). This finding is also important as, although time spent in PE was increased
by approximately 15%-20%, there was no detriment to more ‘academic’ subjects.
The mechanisms by which physical activity may positively influence academic
achievement are unclear. It has been suggested that exercise may exert its
positive effect on cognitive function in children by providing a ‘break’ from the
classroom (Shephard, 1996). While it would seem natural that this would be the
case, this does not appear to be supported in the literature; there is evidence that
there may a threshold level of activity that has to be reached in order for children
to benefit academically from exercise within school physical education (PE)
time. Coe et al., (2006) randomly assigned 214 children to either enrolment in
school PE or non-enrolment, and found that, even within the PE group, only
those children who achieved a level of activity set by the US Healthy People
2010 Guidelines (US Surgeon Generals Report, 1996); at least 5 or more session
of 30 minutes moderate PA per week, and 3 or more 20 minute sessions of
vigorous activity (Coe et al., 2006).
Of note in the study by Coe et al., (2006) is that there were no significant
differences in the grades of children in the PE group in general versus the non-PE
group, despite substantially less ‘academic’ classroom time. While there is very
limited data on the effect of enhanced school PE on academic grades, and the
results of existing studies are equivocal, the literature is consistent in it’s finding
that increased physical education time, and it’s consequent reduction in
classroom time, does not have a detrimental effect on academic performance

33
(Trudea & Shephard, 2008R; Coe et al., 2006; Dwyer, et al., 2001; Daley &
Ryan, 2000). It is important to establish which aspects of physical activity impact
which aspects of cognitive function, and also how changes in cognitive function
relate to academic achievement, before attempting to determine whether physical
education in schools can influence academic performance. School-based physical
education also tends to have a large motor skill development component and
emphasis with limited evidence of the impact of aerobic exercise. Based on the
adult & animal data it is likely that aerobic exercise has the greatest impact on
cognition, and none of the existing studies looking at the effects of PE on
academic achievement take this into account.
It is important to try and understand the interaction between physical activity,
motor and cognitive development, in order to attempt to understand how they
may influence school performance
1.5. Physical activity and cognitive function: potential
mechanisms
It is clear that exercise can positively influence cognitive function (Etnier et al.,
2006; Colcombe & Kramer, 2003; Sibley & Etnier, 2003). Possible mechanisms
by which exercise may exert its effects on cognition are discussed.
Acute exercise effects on cognition
Acute (a single session) of exercise is thought to have a facilitating effect on
mental functioning, but previous studies in humans have been inconclusive,
likely due to lack of consistency in the methods of testing (Magnie et al., 2000;
34
Tomporwksi & Ellis 1986). Several studies in adults have reported numerous
benefits of acute exercise sessions such as reduction in anxiety (Roth,1989),
feelings of well-being and clarity of thought (Tuson & Sinyor 1993), and
increased speed of information processing. It is likely that the mechanism by
which acute (a single) exercise session may influence cognition will be different
to brain adaptations observed following chronic (longer term) exercise.
Therefore, the potential mechanisms will be discussed separately (where
possible).
Neurophysiological Data
Research on the neuroelectric system has greatly advanced the understanding of
cognitive processing (Nelson & Monk, 2001; Thomas & Nelson, 1996). Event-
related potentials (ERPS’s) reflect changing voltage patterns in brain activity that
occurs in response to a stimulus. The P3 is a component of the ERP that occurs
around 300-800ms after the onset of a stimulus, which is elicited when
participants attend to, and discriminate between stimuli (Hillman et al., 2005;
Polish, 1991). The P3 is thought to be involved in the allocation of working
memory and attention resources (Hillman et al., 2005) (For supporting literature
see Polish, 1995).
Few studies have examined the possible relationship between exercise and
electrophysiological changes in the brain. Van Praag et al., (2000) found that
postsynaptic potential (EPSP) slopes were higher in the hippocampus of rats
living in enriched environments (van Praag et al., 2000).

35
Both physical activity participation and aerobic fitness have been associated with
behavioural performance using cross-sectional (Polich & Lardon, 1997) and
randomised controlled-trials (Dustman et al., 1990; Kramer, 1999) designs in
adults, but there is a gap in the literature examining the effects of exercise on
neuroelectric activity in children. The direct measurement of the neurolectric
response to exercise may be particularly beneficial in children, as there are a
number of other factors, such as socioeconomic status, that may influence
children’s activity participation (Duncan et al., 2004) and cognition (Blair, 2005;
Noble, 2005), making it particularly problematic to determine the influence of
fitness on cognitive function during the early life span (Hillman et al., 2005).
In an attempt to address this Hillman et al., (2005) investigated the relationship
between age, aerobic fitness, and cognitive function by comparing high fit and
low fit preadolescent children and adults (Hillman et al., 2005). 51 adults and
children were placed into either high fit or low fit (child) groups, or high fit or
low fit (adult) groups, based on their scores on the Fitnessgram, which is a valid
and reliable assessment of fitness for both adults and children (Hillman et al.,
2005). P3 amplitude was measured by electroencephalogram (EEG) in
participants whilst performing the visual oddball paradigm (a stimulus
discrimination task). The results of this study indicated that high-fit
preadolescent children had greater P3 amplitude than low-fit children and than
both adult groups. This suggests that high-fit children had higher neural
recruitment for the stimulus discrimination task. Additionally, high-fit children
and adults had faster P3 latency than their low-fit counterparts, indicating faster
neurocognitive processing (Hillman et al., 2005). The overall suggestion from

36
this study is that higher-fit children have greater allocation of attention and
working memory resources in response to stimulus processing, which supports
previous research on physical activity and cognitive function (Hillman et al.,
2004). There are notable limitations of the study by Hillman et al., (2005).
Firstly, the study is cross-sectional in design; therefore it is plausible that
selection bias may account for the findings that were attributed to fitness.
Although participants were carefully matched; it is possible that high and low fit
participants may differ in other factors that were not controlled for (e.g. genetics,
personality traits, and skull thickness) (Hillman et al., 2005). There were a
relatively small number of participants in each group also. The authors suggest
that similar studies be carried out with larger numbers of participants (Hillman et
al., 2005).
To date, only three studies have examined the influence of an acute bout of
exercise on cognitive processing using event-related potentials (ERP), but these
have yielded promising results. Nakamura et al., (1999) examined variations in
P3 amplitude using an acoustic oddball paradigm in trained joggers after an acute
bout of jogging and found increased amplitude in the Cz and Pz electrode sites,
and no difference at Fz, when compared to baseline. A limitation of this study
however was the small sample size (n= 7) (Nakamura et al., 1999).
Magnie et al., (2000) measured changes in the P3 and N4 components before and
after maximal graded exercise tests. These authors reported increased P3
amplitude and decreased latency for P3 during the post-exercise compared to the
pre-exercise testing sessions, and suggested that the exercise induced differences

37
in P3 were indicative of an overall increase in central nervous system arousal
(Magnie et al., 2000). Hillman et al., (2003) examined P3 amplitude of 20
college students while performing the Eriksen Flanker task (Eriksen & Erisken,
1974) before and after a 30 minute treadmill run. A larger P3 amplitude was
observed in these students post-exercise compared to baseline. At baseline a
shorter P3 latency was observed during neutral (i.e. HHHHH) versus incongruent
conditions (HHSHH), but this difference was not observed after acute exercise.
Overall, the findings of this study support the hypothesis that acute exercise can
influence the neuroelectric activity underlying executive control processes
(Hillman et al., 2003).
Functional MRI (fMRI) studies support the notion the exercise-related
improvement in cognitive function is greatest on tasks that require greater
amounts of executive control (Hillman et al., 2006). Older adult fMRI studies
suggest that cross-sectionally fitness, and longitudinally, aerobic exercise is
associated with a decrease in activity in the anterior cingulate cortex (Colcombe
et al., 2004), and an improvement in a task involving executive control
(Colcombe et al., 2004). Brain imaging (fMRI) studies have indicated that
reading is associated with an activation of the prefrontal cortex (PFC), and
parietal posterior cingulate cortex, and maths comprehension with an area of the
brain called the intraparietal sulcus (which is located on the surface of the
parietal lobe) in adults and children, but also an area of the PFC in children
(Hillman et al. 2008R) It has been demonstrated that exercise is related to the
prefrontal network of the brain in older adults, therefore it is feasible that
children may benefit academically from exercise (Hillman et al. 2008).

38
Changes in molecular brain systems
There is evidence to suggest that some of the beneficial aspects of exercise arise
from direct effects on the molecular brain systems (Cotman and Berchtold,
2002). Evidence from animal studies has suggested that aerobic exercise can
enhance brain-derived neurotrophic factor (BDNF) gene expression and increase
BDNF production in the hippocampus, cerebellum and cortex both acutely, and
chronically, enhancing learning, and possibly reducing risk of age-related
cognitive decline (Cotman and Berchtold, 2002; Cotman and Engesser-Cesar,
2002). Although other trophic factors, including nerve growth factor (NGF)
(Neeper, 1996) and fibroblast growth factor (Gomex-Pinilla, 2001) were also
induced in the hippocampus in respond to exercise, their upregulation was
transient and less robust than that of BDNF, suggesting BDNF is a better
candidate for mediating the effect of exercise on the brain (Cotman and
Berchtold, 2002). Exercise training in ageing animals has also been shown to
increase levels of other key neurochemicals that improve plasticity and neuronal
survival such as insulin-like growth factors (IGF-1) and serotonin (Kramer et al.,
2005).
The increase in BDNF, and other neurotrophic factors, associated with aerobic
exercise may then increase the number of synapses, capillaries and cell bodies, as
is seen in rats (Neeper et al., 2002; Churchill et al., 2002; van Praag et al., 1999).
One possibility is then that aerobic exercise increases the number of synapses in
frontal and parietal grey matter allowing for greater recruitment of these under
high cognitive load (Colcome et al., 2004).

39
Evidence for the exercise induced benefit of BDNF in humans?
As noted above, it is becoming increasingly evident that (at least some) of the
benefit of exercise on the brain is mediated via a brain derived neurotrophic
factor (BDNF) mechanism (Ferris et al., 2007). Adequate BDNF is essential for
healthy brain function (Ferris et al., 2007). The animal evidence is highly
supportive of the notion that physical exercise enhances BDNF gene expression,
especially in areas of the hippocampus susceptible to plasticity, and promotes
learning and memory (Vaynman et al., 2004; also see summary
Table 1. 2) but at present there are limited data in humans. In older adult
studies, Colcombe & Kramer (2004a & b) saw a reduction in the age-based
decline in tissue density in frontal, parietal and temporal cortices of the brain as a
function of introduction of an aerobic walking programme these outcomes would
be consistent with neurotrophic and neurogenic action of BDNF, however assays
for BDNF were not performed.
Certainly BDNF is essential for ‘normal’ human cognitive functioning (Ferris et
al., 2007). The important of BDNF in healthy brain function can be demonstrated
by examining related disorders brain function that may be mediated by BDNF,
for example chronic stress (Dunman et al., 2006), depression (Martinowich et al.,
2007R), Parkinson’s disease, and Alzheimer’s disease. What is striking about
each of these cognitive disorders is that there is (some) evidence that aerobic
exercise may be able to prevent, or alleviate each of these conditions (Dishman et
al., 2006R; Thorsen et al., 2005; Cassidy et al., 2004; Cotman & Berchtold,
2003R; Smith & Zigmond, 2003). There is also a suggestion that the mechanisms
may be related; for example stress has been demonstrated to decrease

40
hippocampal BDNF mRNA (Dunman & Monteggia et al., 2006; Smith et al.,
1995), whereas animal data suggest that exercise can increase it (
Table 1. 2). Conventional treatments for depression (i.e. antidepressants)
increase BDNF mRNA gene expression in the hippocampus and prefrontal
cortex (Martinowich et al., 2007R). New research also suggests that stress and
depression impair long term potentiation (LTP) (Martinowich et al., 2007) and
BDNF is a mediator of LTP in the hippocampus (Lu et al., 2005R). There is some
(limited) evidence that serum BDNF levels may be elevated following acute
exercise in adults (Rojas Vega et al., 2007), the research on direct links between
BNDF and exercise in human are understudied, and this is an area for future
research.
The results of Colcombe and Kramers (2003) meta-analysis revealed several
moderator variables that may support the notion that aspects of exercise act
directly on the brain. For example, aerobic exercise training programmes
combined with strength and flexibility training had a greater positive effect on
cognition than aerobic alone. This effect may result from increases in insulin-like
growth factor (IGF-1) in response to strength training (Kramer et al., 2005). IGF-
1 is involved in neuronal growth and differentiation (Carro et al., 2001). Exercise
training programs also had a larger impact on cognition if the study samples had
greater than 50% females. This effect may be due, in part, to the positive
influence of oestrogen on both BDNF and increased exercise participation
(Cotman and Berchtold, 2002). It has been demonstrated that oestrogen up-
regulates BDNF mRNA in much the same way as exercise, and that BDNF and
oestrogren are important for hippocampal synatopgenesis and neurogenesis

41
(Kramer et al., 2005; Berchtold et al., 2001). Dysfunction of the BDNF system is
also implicated in schizophrenia (Weickert et al., 2003) and traumatic brain
injury (Horsfield et al., 2002). There is some evidence that exercise may aid
recovery and improve functioning following traumatic brain injury (Grealy et al.,
1999), and improve psychiatric symptoms in schizophrenic patients (Humphrey
et al. 2005) although, likely due to the nature of these disorders, the evidence
base is limited, and existing studies are small. Genetic BDNF system dysfunction
is also implicated in obsessive compulsive disorder (OCD) and Tourette’s
syndrome (Klaffke et al., 2006). Whether these conditions can be influenced
positively by exercise, or whether inactivity is a risk factor for any of the
conditions previously mentioned (with the exception of TBI) are areas for future
research.
Another possibility is that increases in fitness lead to increase capillary supply in
the regions necessary to carry out executive functions, which, in turn, provides
the metabolic resource necessary to coherently respond during task performance
(Colcombe et al., 2003) and as mentioned before, cholinergic function is
enhanced following aerobic exercise in rats, which leads to better spatial learning
performance (Fordyce & Farrar, 1991).
A cardiovascular fitness hypothesis?
While meta-anlayses examing the effect of exercise on cognitive function in
adults (Etnier, et al, 1997; Colcombe & Kramer et al, 2003) indicated a
significant positive effect of exercise on cognitive function, with overall effect
sizes of 0.25 and 0.48 respectively, they did not provide direct support for the

42
hypothesis that an increase in cardiovascular fitness was related to a relative
increase in cognitive function; for example, Colcombe & Kramer (2003)
categorised 18 studies into no change in VO2 max, a 5-11% increase, or a 12-
25% increase. There was no significant difference in the effect size on cognitive
function between these groups (Colcombe & Kramer, 2003; Etnier et al., 2006).
Etnier et al., (2006) published a meta-regression analysis with the aim of testing
the cardiovascular fitness hypothesis. Regression analysis was carried out on 211
effect sizes. The analysis revealed a significant positive effect size of exercise on
cognition of 0.35; the similarity of this to the other meta-analysis effect sizes is
important, because, as noted by Etnier et al., (2006), only 11% of the studies in
this analysis were used in the 1997 meta-analysis. This suggests a real, and fairly
consistent, effect size of exercise on cognitive function in adults (Etnier et al.,
1997; Colcombe & Kramer et al., 2003; Etnier et al., 2006) and in children
(Sibley & Etnier, 2003). However, while the study supports an effect of exercise
on cognitive function, it does not support the hypothesis that this exercise-related
improvement in cognition is mediated or facilitated by an improvement in
cardiovascular fitness.
Results of the regression analysis of cross-sectional studies suggest there was a
significant interaction of age and aerobic fitness on cognitive performance, so
age groups were reanalysed separately to clarify the nature of this interaction
(Etnier et al., 2006). The results revealed that aerobic fitness was a significant
negative predictor of cognitive performance for children and young adults, was a
significant positive predictor of cognitive performance for adults, and a was not a
significant predictor in older adults (Etnier et al., 2006). For pre-post test

43
comparisons, cardiovascular fitness was negatively predictive of cognitive
performance for older adults, and not a significant predictor in either adults, or
children (Etnier, et al., 2006). The inconsistency of these results makes
interpretation difficult.
Overall however, the results of this meta-analytic review indicated large gains in
cognitive function in groups with small gains in fitness, and clearly do not
support a cardiovascular fitness hypothesis. Limitations to this meta-analysis
should be noted; firstly, as a meta-analytic study, summary statistics are
combined, with inconsistent study designs, exercise interventions and cognitive
tests employed. It is unclear how generalisable these results are to children, as
the majority of the existing work has been done in older adults (63% of studies),
with a very small percentage of the data coming from child studies (1%) (Etnier
et al, 2006). The RCT in older adults by Colcombe et al., (2004) (previously
discussed) indicated a reduction in conflict in incongruent tasks (see glossary) of
around 11% in the aerobic fitness group versus around 2% in the stretching
toning group, which is markedly similar to the improvement in cardiovascular
fitness in each group (10% and 3% increase in maximal VO2 uptake) (Colcombe
et al., 2004). The results of this study do appear, on the surface, to support the
cardiovascular fitness hypothesis.
As is noted by Etnier et al., (2006) empirical studies designed to test a dose
response relationship between cardiovascular fitness are needed, and empirical
trials involving children are required.

44
1.6. Physical activity and motor development
The relationship between motor development and cognitive development
While it was previously though that motor development and cognitive
development were two separate constructs, it is now suggested that they are
‘’fundamentally intertwined’’ (Diamond, 2000 pp 44). The prefrontal cortex of
the brain was thought to be essential for more complex human cognitive
functions, and the cerebellum, traditionally, thought to be the critical site for
motor skills (Diamond, 2000). However, more recent evidence has suggested that
the cerebellum is also critical for complex cognitive functions (Raichle, 1994),
and that there is a relationship between cognitive and motor performance in
young children (Wassenber et al., 2005). There is also a wealth of evidence
suggesting that the majority of children who have a cognitive developmental
disorder (e.g. dyslexia; ADHD) also have impaired movement skills
(Wassenberg et al., 2005). Exercise or habitual physical activity in young
children is mainly gross locomotor movement during ‘play’ (Pelligrinini &
Smith, 1998). It begins around the first year of life, and peaks around 4-5 years.
It is thought to serve an important developmental purpose (Gabbard, 2004).
There is a rapid growth and development of neurons around this period (from
birth to 5 years) – the ‘brain growth spurt’ (Gabbard, 2004), and active ‘play’
may positively influence synapse formation, and motor maturation (Pelligrini &
Smith, 1998). This period also coincides with the ‘window of opportunity’ for
optimal motor development (Gabbard, 2004).Measurement of movement (motor)
skills will be discussed in more detail in chapter 2.

45
Physical activity and motor development in children: see table 1.6.
Despite the emphasis put on movement skills development in schools particularly
during physical education (McMurray et al., 2002) there is a lack of data
examining the relationship between any type of physical activity and movement
skills (see Table 1. 6 for details of existing literature). Okely et al., (2004) found
a significant cross-sectional associ ation between body mass index (BMI) and 6
fundamental movement skills in 5518 4th to 10th grade Australian adolescents
(Okely et al, (2004). There is no measure of physical activity reported in this
study, and the cross-sectional design gives no information about the direction of
the relationship. The same authors (Okely et al., 2001) found a small, but
significant relationship between physical activity and participation in organised
sports; in a regression model containing gender, geographic location &
movements skills, movement skills accounted for only 3% of the variance in time
spent in organised physical activity (Okely, et al. 2001). As noted by the authors,
the use of self-reported physical activity may limit the results, however, in the
only study examining the relationship between physical activity and movement
skills in preschoolers (Fisher et al, (2005) a similar amount of the variance (3%)
of time spent in objectively measured moderate and vigorous physical activity
(MVPA) was explained by movement skills score. This study (Fisher et al.,
2005) forms chapter 3 of this thesis, so will be discussed in more detail. The
existing literature in this area is shown in Table 1. 6 Studies examining the
relationship between physical activity and movement skills., and will be
discussed in more detail in Chapter 3. Extreme lack of research in the area,
differences in research design, assessment of and agreement on what constitutes

46
a ‘movement skill’, and differing method of assessing physical activity have
made findings equivocal.
1.7. Researching the relationship between physical activity and
motor or cognitive function: design issues.
Age group
There are reasons to suspect that exercise-induced benefits on cognition may be
more pronounced in young children than in older children and adolescents (Davis
et al., 2007). Younger children may be more susceptible to the effects of exercise
as their brains are more ‘plastic’, and going through periods of rapid growth and
development (Gabbard, 2004; Diamond, 2000). The average weight of a
newborns brain is around 450g, and an adult’s brain is 1400g. Human brain
growth tends to be in ‘spurts’ followed by ‘quiet’ periods (Harris & Butterworth,
pp72-73). (Perry, 2002). Children are still in a state of neural differentiation, and
their central nervous systems may adapt more rapidly in response to
environmental stimulus (e.g. exercise) (Davis et al., 2007; Cabeza, 2001)
whereas older adults are in a state of de-differentiation (Cabeza, 2001). Evidence
suggests that better scores on tests of digit span and executive function in
preschool (4 years) are predictors of maths and reading in primary school and the
benefit is evident for at least 3 years (Bull et al., 2008).
A considerable body of evidence suggests a ‘critical period’ for wiring of neural
circuits and optimal brain growth (Fontaine et al 2006). It appears that, while the
timing of the growth spurt cannot be altered, the extent of brain development is
activity dependent (Harris & Butterworth, 2004). Around 10 years of age the

47
brain selectively eliminates (prunes) connections that are infrequently or never
used (Gabbard, 2004). Supporting data suggests that there is a rapid rise in brain
glucose utilisation between birth and four years, a plateau from 4 – 9 years, then
a gradual decline into adulthood (Chugani et al 1998; Diamond 2000; Gabbard
2004). Some researchers have suggested ‘windows of opportunity’ for optimal
cognitive and motor development (Gabbard, 2004). It seems likely that physical
activity interventions to enhance cognitive or motor functions should be
implemented as early as possible.
Educators believe that the process of movement, particularly in very young
children, stimulates cognitive development (Leppo et al., 2000; Pica 1997).
Burdette & Whittaker (2005) describe the need to ‘resurrect free play’ in
children, especially outdoors, not only as an intervention to reduce obesity, but
also for normal development of cognition and social and emotional domains. If
animal data are to be considered, it appears that motor learning and aerobic
exercise can independently influence brain development. In younger children it
has also been shown that environment can influence cognitive and socio-
emotional development, and later school readiness (Casey, 2000).
Potential confounders
There is some evidence suggesting that body mass index (BMI) may be inversely
related to academic performance (Castelli et al., 2005; Huang et al., 2006; Datar
et al., 2004; Mikkila et al., 2003; Mo-Suwan et al., 1999). However, these results
are cross-sectional and likely confounded by other variables that may impact
independently on BMI, and academic achievement (e.g. socio-economic status).

48
Indeed, when other variables have been controlled for in these studies, often the
significant relationship between BMI and academic achievement disappears (e.g.
Hung et al., 2006; Dartar et al., 2004).
Previous research has indicated that socio-economic status (SES), parental
education, handedness (i.e. left or right), and gender may influence cognitive
and/or motor development (Noble et al 2005; Casey et al 2005; Okely et al.,
2004; Gabbard, 2004). There is also evidence for an effect of diet on cognitive
function and behaviour (Stevenson, 2006R; Rogers, 2001R). Therefore, where
possible, to examine the relationship between physical activity and cognitive or
motor development, these should be controlled for.
1.8. Summary
The animal and older adult data provide convincing evidence that aerobic
exercise can positively influence executive control. There is support for the
notion that this is true in older, overweight children (Davis et al., 2007), but
randomised controlled trials are required to determine whether exercise can
influence executive function in younger children.
There is emphasis on the development of movement skills in the school physical
education curriculum, and relationship between physical activity and movement
skills has been highlighted as a research area. However, it is unclear whether
habitual physical activity and movement skills are related in young children.

49
Aims
The aims of this thesis are;
To examine the relationship between movement skills and physical activity in
young children.
To carry out pilot and exploratory work to examine the relationship between
exercise and cognitive function in young children.

Table 1. 1 Key reviews and meta-analyses examining the effect of exercise on cognitive function
Author Title Brief Summary of Conclusions Tomporowski et al., (2008) Review: Child data.
Exercise and children’s intelligence, cognition and academic achievement.
Exercise appears to facilitate children’s executive functions.
Trudeau & Shephard, (2008) Review: Child data.
PE, school PE, school sports & academic performance.
PA can be added to the school curriculum by taking time from other subjects without the risk of hindering student academic achievement. Taking time away from physical education time and adding time to academic or curricular subjects does not enhance grades, and may be detrimental to health.
Angevaran, Aufdemkampe & Verhaar, (2008) Review: Older adult data.
Physical activity and enhanced fitness to improve cognitive function in older people.
11 studies fulfilled the inclusion criteria; RCT’s involving older adults (>55 years) with an aerobic exercise intervention. There is evidence that aerobic physical activities that improve cardiovascular fitness are beneficial for cognitive function, however the data are insufficient to show that the improvements in cognitive function can be attributed to improvement in fitness.
Cotman & Berchtold (2007) Review: Animal data.
Physical activity and the maintenance of cognition: Learning from animal models.
Work in animal models has identified several key responses in including up-regulation of growth factors, increased neurogenesis, and improved learning and memory, which might be the key to improved cognition in response to exercise.
Rockwood & Middleton (2007) Review: Adult data.
Physical activity and the maintenance of cognitive function.
The available epidemiologic support the concept that physical activity might prevent or delay the onset of cognitive decline. Whether that will translate to a reduction in dementia in unknown.
Hillman, Erickson & Kramer, (2008) Review: Animal, adult, child data.
Be smart, exercise your heart: exercise effects on brain and cognition.
Human and non-human studies have shown that aerobic exercise can improve cognitive performance. A growing number of studies support the idea that physical exercise might lead to increased physical and mental health throughout life.
Dishman et al. (2006) Review: Animal, adult, child data.
Neurobiology of Exercise Voluntary exercise can influence brain plasticity by enhancing neurogenerative, neuroadaptive, and neuroprotective processes. Motor skills training and regular exercise enhance executive function of cognition, and some times of learning (including motor learning).
Etnier et al., (2006) Meta-regression analysis: Child and adult data.
A meta-regression analysis to examine the relationship between aerobic fitness and cognitive performance.
There was a significant negative relationship between aerobic fitness and cognitive performance. The results do not support the cardiovascular fitness hypothesis for the effect of exercise on cognitive function. Future studies should employ dose-response relationships to confirm these findings, and examine other physiological and psychological variables that may mediate the relationship between exercise and cognition.

51
Kramer et al., (2005)
Fitness, ageing and neurocognitive function.
In general, the results are promising and suggest fitness may serve a neuroprotective function for ageing humans.
McAualey, Kramer & Colcombe (2003) Review:
Cardiovascular fitness and neurocognitive function in older adults: A brief review.
Animal data and older adult data are reviewed, and future research directions assessed.
Colcombe & Kramer (2003)
Meta-analysis: Older adult data. Fitness effects on the cognitive function of older adults, A meta-analytic study.
18 intervention studies (1966-2001) were included. Fitness training was found to have a robust but selective effects on cognitive function, with the largest being fitness-induced benefits on executive control.
Sibley & Etnier (2003) Meta-analysis: Child data discussed.
The relationship between physical activity and cognition in children: a meta-analysis.
There is a significant positive relationship between physical activity and cognition in children, however, more research is needed. Statistically powerful intervention studies, both acute and chronic, that include valid and reliable measures, and control for potential confounders are needed.
Cotman & Engesser-Cesar (2002) Review: Animal data.
Exercise Enhances & Protects Brain Function
Exercise induces gene expression in the brain, increasing BDNF, a molecule that increases neuronal survival, enhances learning, and protects against cognitive decline.
Etnier, et al, (1997) Meta-analyis.
The influence of physical fitness and exercise upon cognitive functioning: a meta-analysis.
From the existing 200 studies examining the effects of exercise on cognition, 135 had sufficient data to calculate an effect size. The overall effect size was 0.25 suggesting a small positive effect of exercise on cognition. Characteristics of the exercise, participants, the cognitive tests and quality of the study design all influenced effect size. As experimental rigour decreased, the effect size increased, emphasising the importance of a rigorous study design.
Allison, Faith & Franklyn (1995) Antecendent exercise in the treatment of disruptive behaviour.
Meta-analysis of 16 studies suggested a significant positive effect of antecedent exercise on disruptive behaviour. Effect size 0.33.
Kavale & Mattson (1983) Meta-analysis; child data.
One jumped off the balance beam: meta-analysis of perceptual-motor training.
Meta-analysis of 180 studies suggest that perceptual motor training is not an effective for improving academic, cognitive or perceptual-motor training.

52
Table 1. 2 Overview of key animal studies examining effects of exercise or environmental enrichment on brain structure and cognition.
Animal data will be presented in chronological order to represent developments in the field. Author Aim / Design Findings
MacRae et al., (1987) Ageing and young rats Comparison between rats Trained (exercised on treadmill 12 weeks; endurance) And ‘Untrained’
Endurance training may slow down the negative effects of ageing on dopamine neurons and
receptors.
Black et al., (1990) To examine the different effects on the cerebellar cortex (an area associated with motor learning and neural plasticity) of motor activity, aerobic exercise and inactivity. 38 rats in 4 conditions Acrobatic (motor learning); Forced Exercise (aerobic); Voluntary Exercise; Inactive.
Animals keep in acrobatic condition had greater number of synapses per Purkinjie cell than
animals from exercise or inactive groups. No significant difference in number of synapses
between exercise groups & inactive group.
Exercise group animals had greater number of density of blood vessels in the molecular layer.
Conculsion: Motor learning increases synaptogenesis, Physical activity (exercise) increases
angiogenesis in cerebellar cortex.
Fordyce & Farrar
(1991)
To examine hippocampal and parietal cortical
cholinergic function (areas and system associated
with learning and memory) in F344 rats.
5 conditions: Control (n=8) Acute treadmill run
(n=12) Chronic treadmill run (n=12) Control
spatial-memory tested (n=6) and Chronic run
spatial memory tested (n=6)
Spatial memory test Whishaw Test (version of
the Morris Water Maze)
Daily physical activity (chronic) enhanced performance on the spatial memory test. Enhanced
performance appeared to be associated with running-induced alterations in the hippocampal not
parietal cortical area (increased high-affinity choline uptake (HACU) and muscanaric receptor
density.
HACU was increased after acute exercise, and decreased after chronic exercise coupled with an
upregulation of musinaric receptors in the chronic condition.
These findings are indicative of a reduction in neural activity after chronic exercise – an
adaptation to repeat stimulation - coupled with an improvement in performance.
HACU was increased in the Control Spatial Memory tested rats, and is generally increased after a
learning experience.

53
Chronic-run rats may possess ability for enhanced cholinergic synaptic communication.
Isaacs et al., (1992) To compare the morphology of cerebellar
cortex in adult female rats exposed for 1
month to:
Repetitive Exercise (treadmill / running
wheel)
Motor Learning
Inactive Condition
Promotion of brain vascularisation in the exercise group (increased angiogenesis associated with
metabolic demands) as compared to Motor Learning or Inactive rats.
Motor Learning rats displayed increased volume of molecular layer per Purkinje neuron and
increased blood vessel number.
Different types of angiogenesis in motor learning and exercised rats.
Neeper et al., (1995 &
1996)
BNDF mRNA was measured following 0
(control) 2, 4 or 7 nights voluntary wheel
running.
BDNF mRNA levels in the hippocampus were correlated with distance run.
Exercise effects on BDNF were greatest in areas of high brain plasticity.
Van Pragg et al.,
(1999)
To examine the contribution of learning and
physical activity to growth of new cells in
the dentate gyrus (a region of the
hippocampus associated with memory
formation) . Mice divided into Learner
(water-maze learner) Swimmer, Runner
(Voluntary Wheel Runner) Enriched and
Control.
Both Enriched and Runner groups showed enhanced Brdu (a marker that indicates replication of
DNA in cells) increased cell proliferation, cell survival and neurogenesis in hippocampus. In both
groups, more cells became neurons (enhanced differentiation) than in control groups
Neeper et al.,. (1995 ;
1996)
Exploration of the effect of exercise on gene
expression in rat hippocampus. 3 month old
rats; 3 weeks of wheel running compared to
sedentary controls.
Increased hippocampal BDNF gene expression in rats. Increased BDNF and nerve growth factor
in cortex, cerebellum and hippocampus.
AP180 genes (and others) was induces in hippocampus of running rats.

54
Tong et al., (2001) To examine the effects of exercise on acute
gene expression in the rat hippocampus.
Rats voluntary running for 3 weeks vs
sedentary controls.
Exercise leads to enhanced BDNF gene expression.
Exercise enhanced expression of numerous genes known to be associated with neuronal activity,
synaptic structure and neuronal plasticity.
Radak et al., (2001) Young (4 weeks old) and middle aged (14
month old) rats assigned to:
Young Exercised & Control
Middle-aged Exercise and Control
Exercise – swimming 1 hours day, 5 days
per week for 9 weeks.
Passive avoidance test (memory test)
Conditioned pole-jumping avoidance
(learning).
Middle-aged Exercised rats had better short (24 hours) and long term (72 hour) memory than
controls (Controls reduced significantly; the age-related decline was prevented by exercise).
Learning was improved in Young and Middle-Aged Exercise groups compared to controls.
Exercise decreased the accumulation of reactive carbonyl derivatives (RCD) in rat brain.
Vaynman, et al.,
(2004)
Rats randomly assigned to:
Sedentary: hippocampal cytochrome C
(cytC) injection
Exercise: hippocampal cytC injection)
Sedentary: hippocampal Trk/B-IgG
injection)
Exercise: hippocampal Trk/B-IgG injection)
Trk/B-IgG blocks the action of BDNF by
binding to the BDNF receptor (TrkB)
Morris Water Maze
Exercise significantly increased the mRNA levels of CREB and synapsin I (neural plasticity
markers) in the Exercise cytC group.
Blocking action of BDNF was enough to prevent the exercise induced increase in CREB (cAMP
response-element-binding) and synapsin.
Escape latencies from the Morris Water Maze were significantly negatively associated with
hippocampal BDNF levels (i.e. less hippocampal BDNF, slower escape, reduced spatial memory
performance).
Cognitive enhancement seen in exercise in BDNF dependant.

55
Exercise: Voluntary running wheel 1 week.
BDNF might enhance memory by augmenting CREB expression.
Garza et al., (2004) To examine whether antidepressant
treatment may enhance BDNF in the
hippocampus of ageing rats, and whether
this can be accelerated by voluntary
exercise (voluntary wheel running).
In aged rats (22 month old) antidepressant treatment, voluntary physical exercise, or the two
interventions combined resulted in significant increases in hippocampal BDNF mRNA expression
after 2, 7 or 20 days.
Areas affected appeared to differ between younger and older rats.

56
Table 1. 3 Randomised controlled trials & meta-analytic studies examining effect of exercise on cognitive function in adults; key
references. Reference Sample Methods Findings Limitations Ravia et al., (2005)
1448 adults examined at midlife (50 years) and later life (70 years)
Midlife: Leisure time PA questionnaire; BP; BMI; Serum cholesterol; history of locomotive disorders. Later life: Incidence of dementia or Alzheimer’s disease, alcohol, smoking, stroke, history of diabetes, heart attack.
Leisure time PA at least twice per week is associated with reduced risk of dementia and Alzheimer’s disease in later life. The associated were more pronounced in APOE e4 allele carriers.
Physical activity assess by questionnaire. Unreliable / prone to bias.
Colcombe et al., (2004a) 41 older adults Rockport 1 mile walk fitness test (Kline et al, 1987)
Cross sectional Brains scanned with fMRI scanner while carrying out a Flanker task of incongruent << > << and congruent >>>>> stimuli
Groups spilt by fitness level. Higher fit group more efficient at dealing with incongruent (conflicting) stimuli. (18% interference) than lower fit (26% interference). fMRI revealed greater activation in cortical regions related to selective attentional control ; the right middle-frontal gyrus (MFG); superior frontal gyrus (SFG) ; superior parietal lobe (SPL) and reduced activity in anterior cingulated cortex (ACC).
Cross sectional – potential confounders. Possible that social stimulation is responsible for cognitive benefits of exercise (although this is controlled for in Colcombe et al. 2004b) Small sample (although large for a brain imageing study).
Colcombe et al., (2004b) 29 58-77 year olds (11 males) Cardiorespiratory fitness assessed by Parvo Medics TrueMAx 2400 (maximal oxygen & indirect calorimetry)
RCT – Aerobic group (walking; 10-15 mins + 1 minute per session; 40-50% HR initially, then 60-70% HR. 3x week for 6 months ) Control (stretching and toning; 3x week for 6 months)
Aerobic group – significant increase in cardiovascular fitness relative to control (maximal vo2 uptake 10.2% vs 2.9%) Aerobic group significant (11%) reduction in conflict. Control group 2% reduction (non-significant). fMRI revealed greater activation in cortical regions related to selective attentional control ; the right MFG; SFG;
All males, not generalisable to females, especially as oestrogen know to impact cognitive decline. Small sample in each group. Fairly wide age-range.

57
Brains scanned with fMRI scanner while carrying out a Flanker task of incongruent << > << and congruent >>>>> stimuli at baseline, and 6 month follow-up.
SPL and reduced activity in ACC.
Colcombe & Kramer
(2003)
18 intervention studies published between 1966-2001
Meta-analysis Inclusion criteria; RCT’s involving a fitness programme over time vs a control, in adults aged 55-80 years. 4 theoretical hypotheses based on previous adult research. Speed hypothesis (tasks requiring low-level neuropsychological functioning e.g SRT; finger tapping) Visiospatial hypothesis
(tasks requiring remembering visual or spatial information). Controlled-process
hypothesis (tasks that initially require effortful control, then becomes automatic e.g. choice reaction time). Executive control hypothesis (tasks that do no become
Exercise had greatest effect on executive processes, significantly greater that any other task EF 0.68, however, improvements relative to controls were seen in controlled processes 0.426 spatial 0.426 and speed 0.274. Participants in strength plus aerobic improved significantly more that aerobic alone (0.59 vs 0.41). Participation in brief (1-3 months) programs provided as much benefit as moderate (4-6) , but not as much as long term (6+). Acute bouts / 30 minutes had no significant effect. Group as a whole seemed to benefit more if >50% females. Participants in the mid-old (66-70 yrs) category seemed to benefit most. Clinical populations and non-clinical populations seemed to benefit equally. Fitness training increased cognitive
N/A

58
automatic over time, and require a central executor. Relating to planning, inhibition and scheduling of a mental procedure, e.g. Erikson Flanker Task).
performance on average 0.5 SD
regardless of type of task, exercise or participants characteristics.
Bakken, (2001) 15 72-91 year olds. RCT - Aerobic exercise (marching, side-stepping, boxing, cycling, walking 1 hours 3 x week vs Control (waiting list) for 8 weeks. Finger-movement tracking test (of pattern on computer screen). Test of visual attention / information processing. GXT.
Performance on tracking test improved with aerobic performance. No aerobic training effect. Note: does not support the
aerobic fitness hypothesis.
Only 5 participants in each group available for final analysis (study was a pilot study). Control, no intervention, possible ‘Hawthorn effect’.
Kramer et al. (1999) 124 60-75 year olds RCT aerobic (walking) or anaerobic (stretching and toning). Executive control tasks; task switching. Non executive control tasks.
Walking group showed significant improvements in rate of oxygen consumption (5.1% compared to -2.8% in the toning group) and performance on tests of executive control. No difference in non-executive control tasks.
Blumenthal et al.,, (1988) 30 men aged 30-58 years. RCT – 3 x per week for 12 weeks. Aerobic (jogging) (n=15) 15 strength training (n=15) VO2 max. Reaction time (Steinberg 1969 memory search
Aerobic group 15% increase in VO2
Strength group 3% increase in VO2
Both groups showed improvements in RT, but not
Small sample, all men – not generalisable. Wide age-range.

59
paradigm). related to type of exercise or improvement in aerobic fitness. Does not support aerobic fitness
hypothesis.
Dustman et al., (1984) 55-70 years. RCT- 4 months of aerobic training
Improvement in SRT and Stroop test, but not in choice RT.
Abstract only. Mentioned due to consistent citation in other papers.
Blumenthal et al.,, (1989) 101 men aged 60-83 years.
RCT 4 months aerobic training (n=33). Yoga & flexibility (n=34). Waiting list control (n=34). Peak oxygen consumption & anaerobic threshold. Mood, psychiatric symptoms & neuropsychological function.
Aerobic group: 11% improvement in VO2-sub-2. 13% increase in anaerobic threshold. Lowered cholesterol and diastolic BP.
Abstract only. Mentioned due to consistent citation in other papers..

60
Table 1. 4 Prospective & cross sectional studies examining the effects of exercise and cognitive function / cognitive impairment in
adults.
Reference Sample Methods Findings Limitations
Ravo et al., (2006) 1449 65-79 year olds.
Midlife (50 years) Leisure time PA (questionnaire) BP, BMI, serum cholesterol, history of locomotor disorders. Later life (70 years) Incidence of dementia History of diabetes, stroke, heart attack, smoking, alcohol.
Leisure time PA (at least twice a week) was associated with a reduced risk of dementia and Alzheimer’s. The relationship was more pronounced in genetically susceptible individuals (carriers of APOE e4 allele).
Other potential lifestyle confounders that may not have been controlled for (e.g. diet, SES).
Hillman et al., (2006)
PA and cognitive function
(accuracy and RT on Flanker
task).
241 15-71 year olds, USA.
Cross-sectional examination of relationship of PA to executive control (planning, scheduling, working memory, interference control, task coordination). Erikkson Flanker Task. Multiple regression controlling for age, gender, IQ.
Age related slowing of RT across flanker conditions. Physical activity was associated with faster RT regardless of age. Physical activity was related with response Accuracy during the incongruent trials for the older cohort only.
Self reported physical activity, prone to bias / unreliable. Wide age-range; from adolescents to older adults.
Podewils et al., (2005) 3375 adults >65 years, USA. Cardiovascular Health Study.
Cerebral magnetic resonance imagine (MRI). Physical activity – Minnesota Leisure time questionnaire. Blood samples (APOE genotyping), social network. SES, age, gender, education level, ethnicity, smoking, alcohol, HRT. MMSE
Those who developed dementia (n=408) were more likely to have lower education level, were more likely t carry the APOE e4 allele, had poorer cognitive performance at baseline, and were more likely to show white-matter disease on MRI. More likely to have history of stroke or hypertension. Leisure time PA was inversely
The interaction between PA and APOE e4 in this study was limited to only 28 participants - possibly underpowered.
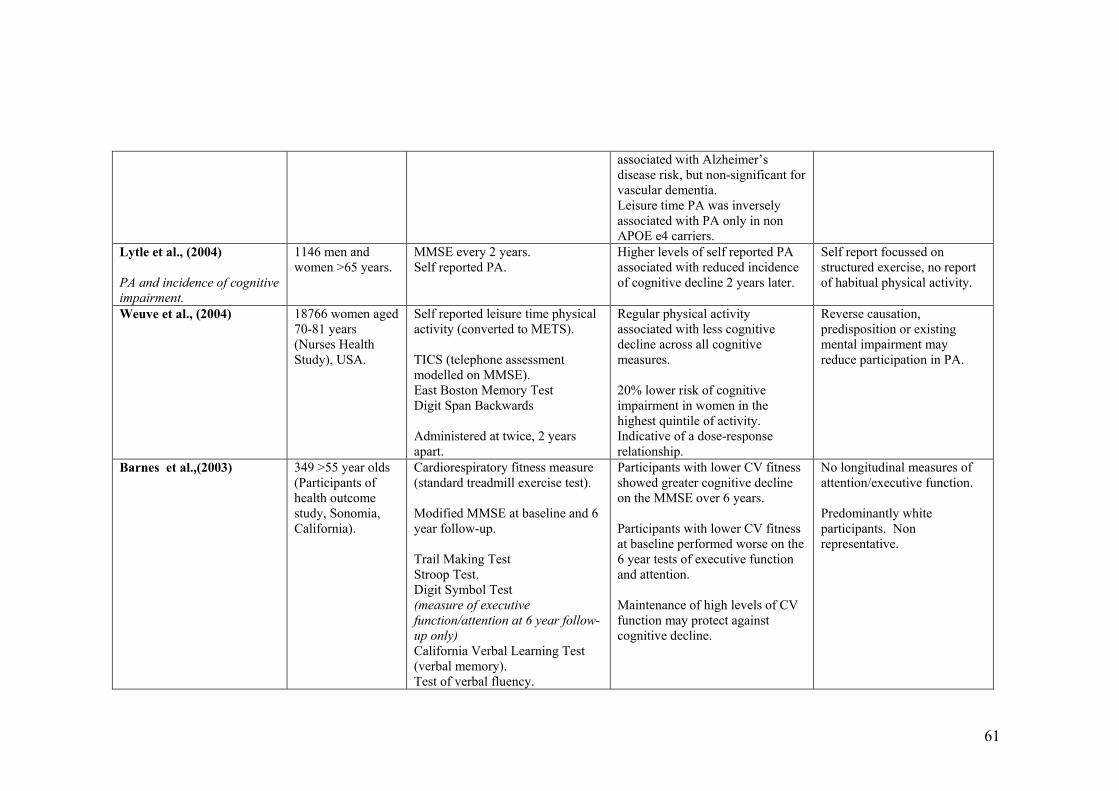
61
associated with Alzheimer’s disease risk, but non-significant for vascular dementia. Leisure time PA was inversely associated with PA only in non APOE e4 carriers.
Lytle et al., (2004)
PA and incidence of cognitive
impairment.
1146 men and women >65 years.
MMSE every 2 years. Self reported PA.
Higher levels of self reported PA associated with reduced incidence of cognitive decline 2 years later.
Self report focussed on structured exercise, no report of habitual physical activity.
Weuve et al., (2004) 18766 women aged 70-81 years (Nurses Health Study), USA.
Self reported leisure time physical activity (converted to METS). TICS (telephone assessment modelled on MMSE). East Boston Memory Test Digit Span Backwards Administered at twice, 2 years apart.
Regular physical activity associated with less cognitive decline across all cognitive measures. 20% lower risk of cognitive impairment in women in the highest quintile of activity. Indicative of a dose-response relationship.
Reverse causation, predisposition or existing mental impairment may reduce participation in PA.
Barnes et al.,(2003) 349 >55 year olds (Participants of health outcome study, Sonomia, California).
Cardiorespiratory fitness measure (standard treadmill exercise test). Modified MMSE at baseline and 6 year follow-up. Trail Making Test Stroop Test. Digit Symbol Test (measure of executive
function/attention at 6 year follow-
up only)
California Verbal Learning Test (verbal memory). Test of verbal fluency.
Participants with lower CV fitness showed greater cognitive decline on the MMSE over 6 years. Participants with lower CV fitness at baseline performed worse on the 6 year tests of executive function and attention. Maintenance of high levels of CV function may protect against cognitive decline.
No longitudinal measures of attention/executive function. Predominantly white participants. Non representative.

62
Dik et al., (2003) 1241 62-85 year olds, Holland.
MMSE Alphabet coding task (information processing speed) Physical activity by questionnaire. Confounders: age, gender, lifestyle factors & health indicators.
Early life physical activity associated with information processing speed but not score on MMSE. Association only significant in men.
Cross-sectional design. Early life PA was asked retrospectively with only 1 questions. Self reported PA unreliable in general, especially in those prone to cognitive decline. No control for HRT, which is associated with cognitive decline in women.
Yaffe et al.,, (2001)
PA and incidence of cognitive
impairment.
5925 women >65 years. (Participants of Study of Osteoporotic Fractures).
Prospective study; baseline and 6-8 year follow up. Self reported PA (city blocks walked). MMSE
Women who reported greater levels of PA were less likely to show symptoms of cognitive decline at 6-8 year follow-up (17% impairment in the highest quartile for physical activity and 24% in the lowest quartile). This significant trend remained after adjusting for age, educational level, comorbid conditions, smoking status, oestrogen use, and functional limitation. Odds ratio 0.66 (95% CI 0.54-0.82)
Self report of physical activity. Prone to bias, possibly more pronounced in participants prone to impaired cognitive function. Participants who dropped out of study tended to have lower IQ & lower physical activity. Possibly link between subclinical cognitive function and lower participation in PA at baseline. No men in study, and majority of participants were caucasian.
Laurin et al., (2001) 4615 older adults (>65 years) Canada
Prospective study; baseline & five year follow-up. MMSE Self reported PA Confounders: age, education.
Women – risk of CIND, Alzheimer’s disease & dementia were lower with higher levels of PA. Dose response evident. Men – risk of CIND, Alzheimer’s disease & dementia were lower (but non significant) with higher
PA assessed by 2 questions. No adjustment for SES, HRT, health status. No control for pre-clinical cognitive decline at baseline.

63
levels of PA.
Data excluded (non follow up data) tended to be older less active, less education participants .
MiniMental State Examination (MMSE) – screening tool for cognitive impairment.
Telephone Interview for Cognitive Status (TICS).
HRT Hormone replacement therapy. SES socio-economic status.

64
Table 1. 5 Studies examining effect of exercise on cognitive function or academic achievement in children.
Reference Sample Methods Used Findings Limitations
Buck, Hillman and Castelli
(2007)
74 7-12 year olds, USA. Age appropriate paper and pencil version of the Stroop task. Fitnessgram. IQ, health and demographics (coviariates).
Aerobic fitness was associated with better performance on all conditions of the Stroop test. Results indicated that relation between fitness and task performance was not greater on compoments requiring more interference control. (i.e. incongruent).
Cross-sectional. It is possible the differences seen in performance are related to another factor (e.g motivation or self esteem).
Davis et al., (2007) 94 overweight (BMI >85th centile) 7-11 year olds USA.
RCT Low dose aerobic exercise (20 minutes 5 x per week aerobic games to maintain HR >150 bpm) High dose (as above 40 minutes per week) Control (No intervention) Cognitive Assessment System (CAS)
Significant improvement in CAS (Planning scores only) in High exercise group relative to Low dose and control groups. Supportive of effect of aerobic exercise on executive functions. Suggestion of a threshold effect. Children in high and lose dose improved equally in fitness.
Limited to sedentary overweight children, so results not generalisable. Children and interventionists were not blinded to the condition. Control group should possibly have had an ‘intervention’ of some sort (i.e. non active, but similar time / attention from staff).
Castelli et al., (2007) 259 3rd and 5th grade children, Fitness (aerobic, muscle strength Field tests of physical fitness Cross sectional.

65
USA. and body composition). Academic achievement.
related to global aspects of academic achievement (maths & reading). BMI inversely associated with academic achievement.
Other confounders (e.g. SES) could explain the relationship.
Ahamed et al., (2007) 396 9-11 year old school children, Canada.
16 month cluster RCT. BMI PA questionnaire Standardised test of achievement (Canadian Achievement Test).
No difference in achievement scores at follow up.
No objective measure of habitual PA or intensity of intervention. Despite randomisation baseline achievement scores were significantly higher at baseline. Average 50 minutes PA extra per week, possibly not high enough dose.
Sigfusdottir, Kristjansson &
Allegrante, (2007)
5810 14-15 year old school children, Iceland.
Cross-sectional Self reported academic achievement (asked to report average grades). BMI from self-reported height & weight. Self reported fruit and vegetable & other dietary data.
BMI most strongly correlated with academic achievement. Diet and PA weaker significant correlations (24% of variance combined). Parental education, absenteeism, and self esteem all stronger
Cross sectional design. Relationship between BMI and academic achievement may be

66
Depressive symptoms (Symptom Distress Checklist). Self esteem (Rosenberg self esteem scale).
correlates of academic achievement than health behaviours.
overstated, as no control for SES, which has been shown to be related to BMI & academic achievement.
Dollman, Boshoff & Dodd
(2006)
117 schools (no individual child data presented)
Cross-sectional Schools surveyed on average time spent on PE and demographic characteristics Average child literacy and number scores. Regression assessed the relationship between PE, academic scores and demographics.
The only predictors of language and numeracy scores were SES and number of staff. No relationship between time spent on PE and language and numeracy scores.
Quality & intensity of PE lessons not considered. It is feasible that less frequent, high quality and intensity PE would impact cognition more than frequent low quality/intensity PE lessons. PE lessons likely have a large skill-based element, adult data suggests aerobic exercise may have biggest impact on cognitive function. Habitual or physical activity outside school

67
not considered. Huang et al., (2006) 666 11-14 year olds, USA. Self reported grades
Actual grades Age, gender, ethnicity BMI Body fat (Tanita) Previous Day PA recall
Mostly Latino and Asian-American children. Non representative. Adiposity & BMI were not related to actual grades, but were to self reported grades. Provides evidence of unreliability of self reported grades. MVPA related to self reported and actual grades inof adiposity & BMI.
Nelson & Gordon-Larsen,
(2006)
5979 males; 5978 females mean age 15.8 (SD 11.6 years) National Longitudinal Study of Adolescent Health
Cross-sectional 7 day standard recall of physical activity; MET values calculated.
Active teenagers (>5 bouts of MVPA per week) were significantly more likely to have higher grades (adjusted risk ratio 1.20).
Self reported PA and grades. Possible confounders (e.g. higher PA= lower truancy=better grades simply as a factor of being in class more often?; higher PA= higher self esteem= between

68
school performance?).
Yu et al, (2006) 333 8-12 year olds, Hong Kong.
Exam and test results Self esteem (questionnaire) Self reported PA ‘School conduct’ grades (no elaboration in paper as to what these are).
Girls had higher academic scores than boys. PA not significantly related to academic achievement. PA significantly related to school conduct.
Cross-sectional, correlation results, don’t give information about the direction of the relationship,. Teacher ‘school conduct grades’ highly subjective. Self reported physical activity unreliable, especially in children.
Field, Diego & Sanders
(2001)
89 high school children (age-range not provided in paper) USA.
Cross-sectional Questionnaire based assessment of physical activity.
Children with higher levels of activity group had higher grade point averages, spent less time depressed, more time in sports and better relationships with their parents.
Small sample, questionnaire based physical activity. Difficult to tease out the interaction between family relationships (a correlated of achievement) PA, and achievement. No control for SES, which can

69
influence achievement, and possibly family relationship.
Coe et al., (2006)
214 10-13 year old children, Michigan, USA.
Cross-sectional Random assignment to PE enrolment vs not enrolled in PE. Habitual PA 3-d physical activity recall. MET values SOFIT direct observation of PE classes. School grades.
PE enrolment did not influence academic grades. When examining percentiles, Students who achieved Healthy People Guidelines achieved higher grades.
Possibly not high enough dose of activity in PE group (estimated mean 19% time in MVPA in 50 minute session). Quality / intensity of PE classes (only 4 observed in a semester). Unreliable measure of habitual activity. Possible evidence that there may be a ‘threshold’ level of activity that has to be reached to benefit cognition.
Dwyer et al., (2001)
7961 7-15 year old school children, Australia.
Cross sectional Scholastic achievement as rated on a Likert scale by principle or teacher. Measures of BMI and muscular
Scholastic ratings higher in boys, and higher for older than younger children. Scholastic ratings positively associated with fitness, capacity
Cross sectional design, likely confounders, and direction of relationship can’t be inferred.

70
power, muscular force & endurance, joint mobility, skin folds, lung function, cardiorespiratory endurance (1.6km run).
and activity and weakly with muscular force, endurance and power (all significantly).
Tremblay, Inman & Williams
(2000)
6923 6th grade (9-12 year old) children, Canada
Cross-sectional Maths & Reading Scores Items from Self-description questionnaire (self esteem measure) Physical activity assessed by questionnaire. SES
Physical activity & SES were related to self-esteem PA levels were weakly negatively related to achievement. PA negative relationship with BMI. SES & self esteem significantly related to math and reading score. SES negatively associated with BMI.
Measure of physical activity was only based on 4 questions; 2 about exercise and 2 about stretching toning. Unreliable, especially in younger children and questions not necessarily relevant to the age group (would a child ‘stretch and tone?’) No assessment of habitual activity. The weak measure of PA was sensitive enough to show a negative relationship with BMI though) Cross sectional design, can’t infer causality

71
(e.g. self esteem may lead to increased PA participation).
Linder (2002) 1447 13-17 year old students, Hong Kong.
Cross-sectional Objective measure of scholastic achievement (records from schools) and the effect of academic banding - whole schools ‘banded’ in terms of overall performance. Physical activity questionnaire
Physical activity School band was a significant predictor of PA participation time. Children from higher band schools greater participation.
Cross-sectional study design can’t imply causal relationship. Higher band school may have had benefits (e.g. more funding, opportunity for PA, quality of teaching, staff). There may have been differences between SES groups in low and high band schools.
Linder (1999) 4690 9-18 year old school children, Hong Kong.
Cross-sectional Self reported sport participation and perceived ‘self reported’ academic achievement.
Weak significant positive correlations between sport participation and perceived achievement.
Self reported sports participation and perceived academic achievement in children, with cross-sectional design. Too many potential confounders to draw any

72
conclusion. Caterino & Polack (1999)
† 177 9-11 years 15 mins stretching and walking Woodcock-Johnstone Test of Concentration
9 & 10 : no detriment to concentration 11 yrs : improvement in concentration
No control group.
Corder (1996) † 24 “mentally retarded” boys 4 weeks daily PE Improvement in intellectual/social development
Small sample. Not generalisable.
Klein & Deffenbacher (1977) † 30 hyperactive males 3 weeks circuit training, 2 x per
week Continuous performance task, Matching Familiar figures task
Improvement in Matching Familiar figures task in hyperactive exercise group
Small sample. Not generalisable
McCormick et al., (1968) † 7 weeks – PE 2 x weeks
(perceptual motor training) Improvement reading achievement
Cant find abstract / paper (extracted from Sibley & Etnier, 2003)
Sallis et al.,. (1999) †
(Project SPARK) 754 Californian school children
2 years specialist-taught PE 3 x week
No harmful effect on academic test scores despite greatly increased time in PE (intervention 28% more per week than controls)
2 year follow-up significantly less decline in score in Intervention vs Control
Non randomised.
Zervas et al., (1991) † 9 pairs of monozygotic twin
boys 11 – 14 years
6 months 20 mins treadmill running Matching a comparison design
Significant pre and post test improvement in decision making in exercise groups
Shephard et al., (1984) †
(Trois Rivieres Experiment) 546 school children, grades 1-6
1 additional hour per day of specialist instructed PE Goodenough & WISC tests
At baseline controls significantly higher academic grades, grades 2-6 experimental students higher grades (significantly in 2, 3, 5)
Dwyer et al., (1978) †
(SHAPE, South Australian Study 519 10 year old Australian school children
14 weeks: Fitness (75 mins high No significant differences in academic performance between

73
intensity PE 5 x week) , Skill (75
mins curriculum PE /week)
Control (3 x 30 mins PE wk)
groups.
† Experimental studies highlighted in Sibley & Etniers (2003) review
SOFIT – system for observing fitness instruction time.
SES – socioeconomic status

74
Table 1. 6 Studies examining the relationship between physical activity and movement skills. Reference Sample Methods Used Findings Limitations
Cliff et al. (2007) 13 overweight children Community based motor development programme. BMI, motor development, perceived athletic competence, perceived global self-worth. Objectively measured PA.
Decline in MVPA at follow up and post treatment. Perceived athletic competence and global self-worth increased.
Small sample size (was a feasibility study though). Does an increase in movement skill time have a detrimental effects on time spent in MVPA?
Fisher et al., (2005)
392 3-5 year old children, UK. See chapter 4 of thesis. See chapter 4 of thesis. See chapter 4 of thesis.
Lela & Toivo (2002) 294 6 year olds, Tartu.
Parent & teacher reported PA . Motor ability evaluated using tests from Eurofit test battery & 3 minute endurance shuttle run test. Controlled drawing observation test as a measure of school readiness.
Indoor physical activity predicted 19-25% of variance in motor scores. Motor ability tests significantly related to school readiness.
Subjective measure of PA. Construct validity of the other measures (i.e. do they measure what they propose to?)
Okely, Booth & Chey (2004) 5518 8th to 10th grade Australian adolescents
BMI & waist circumference Six fundamental movement skills (run, vertical jump, catch, overhand throw, forehand strike, kick)
Inverse linear relationship between FMS and overweight/waist circumference in both sexes. Overweight children were twice as likely to be in the lowest quintile for FMS.
No measure of physical activity, so interactions can only be implied.
Okely, Booth & Patterson
(2001)
982 8th (mean age 13.3 yrs) grade & 862 10th grade (mean age 15.3 years) Australian children.
Physical activity – self report of time in organised and non-organised physical activity. Six fundamental movement skills (run, vertical jump, catch, overhand throw, forehand strike,
A regression analysis revealed that movement skills, gender, grade and SES all had a significant effect on time in organised PA (whole model 4.3% of
Use of self reported PA unreliable.

75
kick) variance). Movement skills only explained 3% of the variance
Butch & Eaton (1989) Relationship between running speed and agility & participation in vigorous PA.
Use of ‘product’ oriented assessment (i.e. a yes or no’) as opposed to a process oriented (each part of the movement process is scored).
Ulrich (1987)
Kindergarten to 4th grade. Significant relationship between movement competence & PA (organised sports participation)

Chapter 2: Methods I – Movement assessment

77
2.1 Movement skill assessment in young children
Introduction
A literature search revealed no recent papers reviewing tests of movement skills
for use in research in young children. Therefore, the aim of this review was to
describe widely used tests of movement skills in terms of practical considerations
for use in research: age range, cost, training required and psychometric
properties.
For a test of movement skills to be widely adopted it must be easy to administer,
standardised, reliable and valid and practical for it’s intended use (Greenwood et
al., 2002), The following review discusses the practical utility, and validity /
reliability and use in research of tests of movement skills in preschool (3-5 years
– the age to be studied in Chapter 3 of the thesis).
Assessing fundamental movement skills in preschool children
Four of the most widely used tests for the measurement of movement skills in
preschool children are: the Bruininks Oteresky Test of Motor Proficiency
(BOTMP) (Bruininks, 1978) (the most widely used in the USA), the Movement
Assessment Battery for Children (MABC) (Hendersen & Sugden, 1992), Test of
Gross Motor Development (TGMD) (there is now an updated version TDMD-2,
Ulrich, 2000) and Peabody Developmental Motor Scales (Folio & Fewell, 2000).
Practical considerations of these tests and psychometric properties of these tests
are highlighted in Table 2. 1.

78
Movement Assessment Battery (Movement ABC; MABC)
The Movement ABC was developed by Henderson & Sugden (1992) as a method
of assessing those at risk of motor impairment. It is the single most used tool for
assessment of developmental coordination disorder (Geuze et. al, 2001).
Applicability of the US norms published in the test manual have been examined
in Europe (Smits-Engelsman et al. 1998; Rosblad & Gard, 1998) Asia (Miyahara
et al., 1998; Chow et al., 2001, Wright et al., 1994) and Australasia (Livesey,
Coleman and Piek, 2007). These studies (on the whole) suggest generalisability,
but with some cultural differences between the Asian data and US norms (for
example Miyahara et al. (1998) found their Japanese sample performed better on
dynamic balance, but poorer on drawing tasks than the US normative sample
(Miyahara et al., 1998). Although the normative data begins at 4 years, there is
some evidence that the MABC can be used in successfully in children as young
as 3 (Livesey et al., 2007).
There are two components of the Movement Assessment Battery: a Performance
Test (previously the Test of Motor Impairment, then Test of Movement
Impairment – Henderson Revision TOMI-HI) and Checklist. The MABC is well
structured, and division of tests into age bands with similar skills sets allows
comparison of skills through a child’s development. Although the most widely
used test of developmental coordination disorder (DCD), the psychometric
properties of the MABC Performance test and Checklist require further
investigation; use in children under 4 may be feasible, but normative data does
not exist in this age group, and cultural differences between some Asian
79
countries as compared to US norms suggests a normative database must be
developed for these countries.
The Test of Gross Motor Development-2 (TGMD-2)
The Test of Gross Motor Development (TGMD) (Ulrich, 2000) was published as
a criterion referenced test for programme planning (Wiart et al., 2001). The
authors suggest that the TGMD will assess the movement skills generally taught
in physical education. The 12 movement skills tested by the TGMD are divided
into Locomotion and Object control skills.
The TGMD-2 is a useful, practical and cost effective tool that has been
successfully used in research in children and adolescents (Okely et al., 2001)
however it’s usefulness in preschool children is limited, as most items in the
object control test are too difficult for 3-4 year olds (Burton & Miller, 1998,
p242).
Peabody Developmental Motor Scales (PDMS-2) (Folio & Feldwell, 2000)
The Peabody Developmental Motor Scales is a standardised test with
components to evaluate gross, and fine motor scales. The test can be used in
children from birth – 71 months. Acceptable reliability has been demonstrated in
both the gross and fine motor scales (Folio & Feldwell, 2000; Van Hartingsveldt,
2005) Psychometric properties of the PDMS-2 are shown in Table 2. 1. There
are some noteworthy limitations of the PDMS-2 – a relatively large amount of
equipment is required, and would have to be purchased to ensure standardisation
80
and transported by car to test sites. The test is relatively time consuming (20-30
minutes for each scale), therefore the numbers to be tested could
Additional outcome measures of movement skills
Ages and stages Questionnaire
The Ages and Stages Questionnaire (Bricker et al., 1995) is a multi-domain,
parent assessment. Parents complete the simple, illustrated 30-item
questionnaires at designated intervals, assessing children in their natural
environments. Each questionnaire can be completed in just 10-15 minutes and
covers five key developmental areas: communication, gross motor, fine motor,
problem solving, and personal-social. The Ages & Stages Questionnaire is
standardised, low cost (can be photocopied by purchasing a one off licence) and
can be used up to age 5. The Ages and Stages Questionnaire has good reliability:
2 week test retest reliability in 175 children 0.94 (Standard Error of the Mean
(SEM) = 0.10). Inter-rater reliability in 112 children was reported to be 0.91
(SEM 0.12) (Squires et al., 1997).
Concurrent validity of the Ages and Stages Questionnaire with a number of
standardized tests (Gessell & Armatruda Developmental and Neurological
Examination; Bayley Scale of Infant Development (Infants), The Stanford-Binet
Intelligence Test and McCarthy Scales of Children’s Abilities (preschoolers) has
been carried out. The sensitivity and specificity across all age categories was
75% and 85% respectively (Lee & Harris, 2005).

81
Limitations
While the Ages & Stages Questionnaire has great potential for large scale
evaluations of motor skills, it is well known that the response rate to postal
questionnaires is low. Therefore, measures must be taken to ensure a reasonable
response rate: electronic / online version, telephone follow-ups, face-to-face
administration by an interviewer. The preferred level for sensitivity of a motor
skills test is at least 80%, and specificity at least 90% (Glascoe et al., 1992),
whereas the Ages & Stages Questionnaire has a sensitivity of 75% and 85%
respectively (Bricker et al. , 1995), and these factors must be taken into
consideration.
Affordances in the Home Environment for Motor Development (AHEMD-
SR; Gabbard et al., 2008)
The AHEMD-SR is a parent report of the quality and quantity of factors in the
home that may influence motor development. The AHEMD-SR shows good
reliability and validity in children aged 18/42 months (Rodrigues et al., 2005;
Gabbard et al., 2008) and the authors are currently validating the tool for use in
younger children.
Limitations
Validity data for the AHEMD-SR is only available in a small sample, and no
normative data exists at present. However, normative data, and reliability data in
other samples and settings needs to be established. The test cannot be used after
3 years, so may not be appropriate for the requirements of the current study.
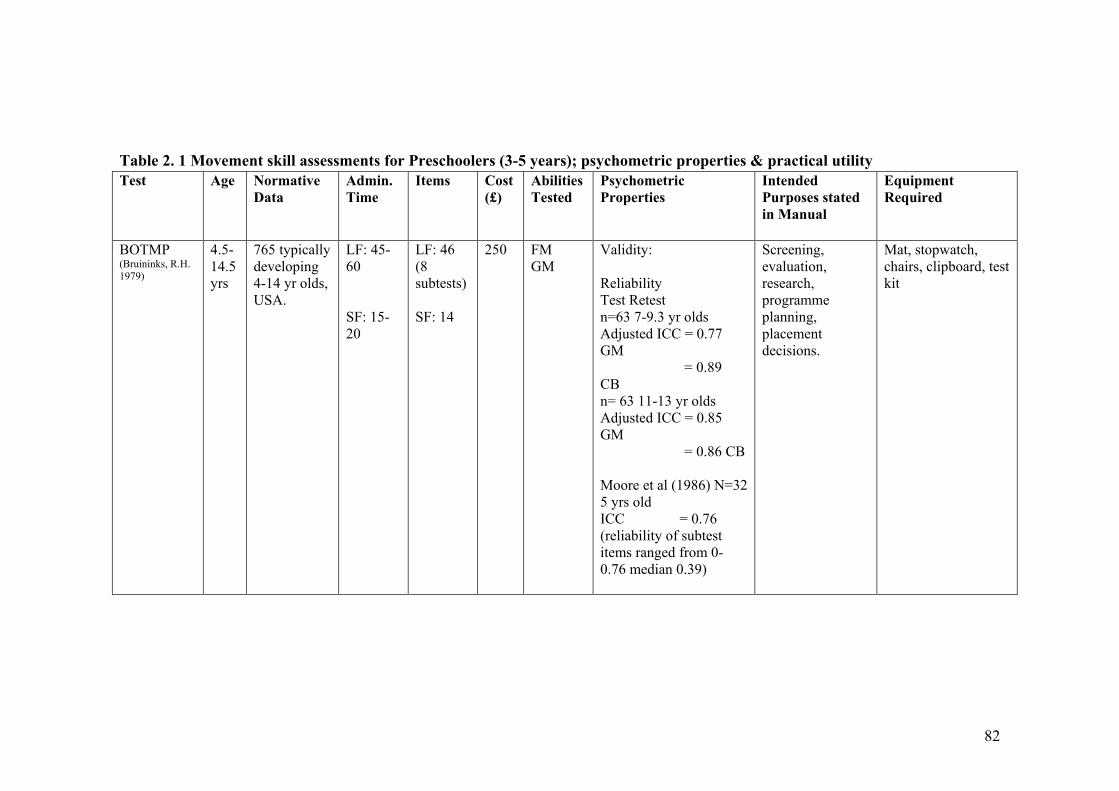
82
Table 2. 1 Movement skill assessments for Preschoolers (3-5 years); psychometric properties & practical utility Test Age
Normative
Data
Admin.
Time
Items Cost
(£)
Abilities
Tested
Psychometric
Properties
Intended
Purposes stated
in Manual
Equipment
Required
BOTMP (Bruininks, R.H. 1979)
4.5-14.5 yrs
765 typically developing 4-14 yr olds, USA.
LF: 45-60 SF: 15-20
LF: 46 (8 subtests) SF: 14
250 FM GM
Validity: Reliability Test Retest n=63 7-9.3 yr olds Adjusted ICC = 0.77 GM = 0.89 CB n= 63 11-13 yr olds Adjusted ICC = 0.85 GM = 0.86 CB Moore et al (1986) N=32 5 yrs old ICC = 0.76 (reliability of subtest items ranged from 0-0.76 median 0.39)
Screening, evaluation, research, programme planning, placement decisions.
Mat, stopwatch, chairs, clipboard, test kit
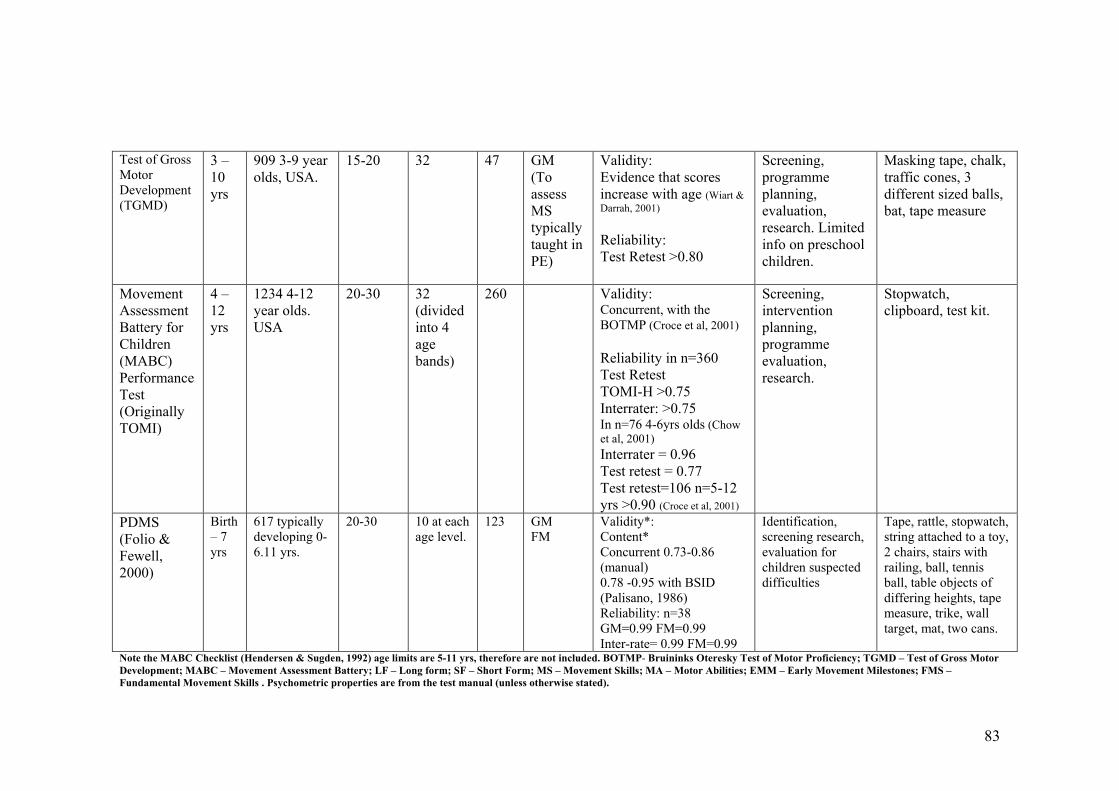
83
Test of Gross Motor Development (TGMD)
3 – 10 yrs
909 3-9 year olds, USA.
15-20 32 47 GM (To assess MS typically taught in PE)
Validity: Evidence that scores increase with age (Wiart & Darrah, 2001) Reliability: Test Retest >0.80
Screening, programme planning, evaluation, research. Limited info on preschool children.
Masking tape, chalk, traffic cones, 3 different sized balls, bat, tape measure
Movement Assessment Battery for Children (MABC) Performance Test (Originally TOMI)
4 – 12 yrs
1234 4-12 year olds. USA
20-30 32 (divided into 4 age bands)
260 Validity: Concurrent, with the BOTMP (Croce et al, 2001) Reliability in n=360 Test Retest TOMI-H >0.75 Interrater: >0.75 In n=76 4-6yrs olds (Chow et al, 2001) Interrater = 0.96 Test retest = 0.77 Test retest=106 n=5-12 yrs >0.90 (Croce et al, 2001)
Screening, intervention planning, programme evaluation, research.
Stopwatch, clipboard, test kit.
PDMS (Folio & Fewell, 2000)
Birth – 7 yrs
617 typically developing 0- 6.11 yrs.
20-30 10 at each age level.
123 GM FM
Validity*: Content* Concurrent 0.73-0.86 (manual) 0.78 -0.95 with BSID (Palisano, 1986) Reliability: n=38 GM=0.99 FM=0.99 Inter-rate= 0.99 FM=0.99
Identification, screening research, evaluation for children suspected difficulties
Tape, rattle, stopwatch, string attached to a toy, 2 chairs, stairs with railing, ball, tennis ball, table objects of differing heights, tape measure, trike, wall target, mat, two cans.
Note the MABC Checklist (Hendersen & Sugden, 1992) age limits are 5-11 yrs, therefore are not included. BOTMP- Bruininks Oteresky Test of Motor Proficiency; TGMD – Test of Gross Motor Development; MABC – Movement Assessment Battery; LF – Long form; SF – Short Form; MS – Movement Skills; MA – Motor Abilities; EMM – Early Movement Milestones; FMS –
Fundamental Movement Skills . Psychometric properties are from the test manual (unless otherwise stated).

84
2.2 Measurement of physical activity in children
Physical activity has been recognised as a leading health indicator (US Dept,
Health: Healthy People 2010). The growing epidemic of childhood obesity is
almost certainly due in part to a lack of physical activity in modern children.
Levels of physical activity may be particularly important in young children
(Kelly et al., 2004), as these children are at a critical period for the development
of obesity. In order to quantify levels of physical activity in young children, the
best method of measurement must be identified. To date there is a lack of studies
examining ‘best practice’ for the measurement of physical activity (Oliver et al.,
2007). As a result of their short bursts of spontaneous physical activity and
cognitive-ability and recall limitations, only direct observation or objective
measures of physical activity should be used in children under 10 years (Cardon
& De Bourdeaudhuij, 2007).
The aim of the current section is to provide a brief review the methods of
measuring / assessing physical activity in young children, with the aim of
selecting an appropriate measure for the studies in this thesis.
Methods
Search terms CHILDREN or YOUNG PEOPLE and PRESCHOOL and
PHYSICAL ACTIVITY or EXERCISE or PLAY and EVALUATION or
ASSESSMENT or MEASURE$ were used.
Computer searches were made in English language journals through Medline,
Embase, PsychInfo, general internet searches and review articles.

85
There are a number of excellent existing reviews on the measurement of physical
activity in children / adolescents. These are highlighted in Table 2.2.
Criterion methods
Doubly labelled water (energy expenditure)
Doubly labelled water (DLW) is used in the assessment of free-living energy
expenditure (Schoeller & van Santen, 1998; Ainslie, Reilly & Westerterp, 2003).
DLW data are usually collected from 4-20 days, to give a representation of free
living energy expenditure. The participant takes a dose of water orally,
containing a known amount of stable isotopes of hydrogen (2H) and oxygen
(18O). The isotopes mix with the normal hydrogen and oxygen in the body water.
As energy is expended, CO2 and water are produced. The CO2 is lost in breath,
and water in urine, sweat and breath (Ainslie, Reilly & Westerterp, 2003, p9).
18O is lost more rapidly (as it is contained in both CO2 and water). 2H is only
contained in CO2 (Ainslie, Reilly & Westerterp, 2003, p9). The difference
between the rate of loss of 18O and 2H reflects the bodies CO2 production rate,
and can be used to estimate energy expenditure (EE). To make the calculation
more reliable, an estimate of CO2 production to VO2 can be calculated by
calculating a respiratory quotient or collecting data on energy intake. Indirect
calorimetery can also be used to measure CO2 production in relation to VO2.
The doubly labelled water method is often considered the ‘gold standard’ for
measurement of free living energy expenditure (Mann et al, 2007), and can be
used in babies, children, adults, and the elderly. DLW can be used as a criterion
to assess validity of measure to assess (for example) physical activity, or energy

86
intake (Ainslie, Reilly & Westerterp, 2003) however, energy expenditure and
physical activity are separate constructs and this may limit attempts to validate
measures of physical activity (Sirard & Pate, 2001). While the DLW technique
demonstrates excellent validity (Schoeller & Hnilicka,), there are some clear
limitations to its usefulness in large scale studies. Primarily the cost: more than
£500 per adult participant at present, and specialist expertise required for
analysis. A recent study in 9 adult males (Mann et al., 2007) has indicated that a
one-tenth dose of doubly labelled water may provide a reliable measure of
energy expenditure at a lower cost (Mann et al., 2007), but this would require
further investigation in the intended populations, and would still prove too
expensive for a population based study.
Direct Observation
Direct observation is the most appropriate criterion measure of physical activity
for children (Sirard & Pate, 2001). Methods of direct observation are summarised
in Table 2.3.While direct observation is often considered the ‘criterion’ method
for measurement of physical activity in young children, it has limitations. It is
fairly expensive and labour intensive, and cannot be used to assess habitual
physical activity. It is a subjective measure, and as such, is dependent on how
accurately data are observed, interpreted and recorded. Some studies have
demonstrated inter-observer agreement to be poor. Direct observation has been
validated against methods which in themselves are dependent on factors other
than physical activity level (heart rate and oxygen consumption). However, it
remains the most appropriate criterion measure of physical activity for use in
children, and it may be feasible, and advisable, to validate the intended method
87
(e.g. motion sensor) against direct observation in sub-sample of the intended
population.
Objective Measures
Objective measures of physical activity have the advantage that they are free
from researcher bias, are affordable compared to criterion methods, reduce bias
in data as a result of self report or parent (proxy) report. Of the objective
measures used in paediatric research, accelerometers are the most common.
Some studies have also investigated the use of pedometers in preschoolers: these
motion sensors will be discussed in more detail.
Pedometers
Pedometers are small devices containing mechanical motion sensors that
measure physical activity in steps, and can be worn around the hip, ankle or
waist. They are generally relatively cheap, easy to use (no researcher training
required) and the step count can be easily understood by adults and children. The
step count is also potentially motivational. Adult studies have suggested that the
Yamax Digiwalker DW/SW 200 is the most reliable commercially available
pedometer (Schneider et al., 2004; Schneider et al., 2003). There are very few
studies examining the use and validity of pedometers in children: Kilawnowski et
al. (1999) compared output of the Yamax Digiwalker SW 200, Tritrac
Accelerometer and the Children’s Activity Ratings Scales (CARS) in 10 7-12
year old children (Buffalo USA) during classroom and recreational periods.
Correlations between all measures were significant for recreational and
classroom periods combined, and for recreational time alone (r >0.90, p<0.001).

88
Correlations between pedometer and accelerometer were significantly lower for
classroom time alone (r = 0.50, p<0.05), the authors suggest this may be due to
the pedometer being sensitive to vertical movement only (Kilanowski et al.,
1999). However the results indicate that the pedometer had a higher correlation
coefficient with the Children’s Activity Rating Scale (CARS) (Puhl et al., 1990)
(r 0.80, p<0.02) than the Tritrac accelerometer (r = 0.70, p<0.01) (Kilanowski et
al., 1999). The small number of subjects in this study (7 boys; 3 girls) mean that
the results are not generalisable. Rowe et al. (2004) examined reliability and
reactivity (alteration in behaviour to wearing the monitor) of 299 10-14 year old
children in North Carolina USA (Rowe et al., 2004). These authors found no
evidence of reactivity, and this finding is supported by Vincent & Pangranzi,
(2002a) who found no evidence of reactivity when using sealed pedometers that
were sealed so that the wearer couldn’t see the screen. Cardon & De
Bourdeaudhuij (2004) used Yamax Digiwalker SW-200 pedometers to measure
the step-count of 92 Belgian school children aged 6-13 years, and compared
physical activity to reported MVPA (parent / child diary). There was a weak
significant correlation (r=0.39, p<0.001) between pedometer counts and self
reported MVPA. This correlation is similar to studies comparing accelerometer
data to self reported physical activity. Eisenmann et al (2007) examined the
utility of physical activity measured by pedometer (Digiwalker 200 SW) in
predicting overweight in 608 (mean age 9.6 years) children, Midwest USA. The
results indicated that children not meeting the pedometer recommendations:
11000-12000 steps/ day for girls, 15000 steps/day for boys (Vincent & Pangranzi
2002b; Cardon & De Bourdeaudhuij, 2004; Tudor-Lock et al., 2004) were two
times more likely to be overweight / obese than those meeting recommendations.

89
Although the Yamax Digiwalker 200 shows promise in adults and older children,
to our knowledge there are only 3 studies examining the use of pedometers in
younger children (Oliver et al., 2007R).
Limitations of the pedometer
Pedometers have several limitations. They provide only estimates of cumulative
activity, and do not store activity data by time. It is not possible to determine
intensity or duration of activity. The one dimensional nature may be problematic
when measuring physical activity in children, as children may engage in play
behaviours that involve a greater range of movements than adult movement.
They are better suited to higher intensity activities (Kilawnowski, 1999), and
therefore would not be suitable for the measurement of sedentary behaviours and
may mask lower intensity activity. There is some suggestion that the ability of
the pedometer to accurately measure free living physical activity is questionable
(Oliver et al., 2007). They are, however, correlated with physical activity in
children and provide an inexpensive method for measuring physical activity in
large samples of children.
Accelerometers
Both volume and intensity of activity are needed in physical activity research in
order to understand the dose-response relationship between physical activity and
the outcome being measured (Freedson, Pober & Janz, 2005). An alternative
motion sensor, widely used in paediatric physical activity research, is the
accelerometer. Acclerometers measure ‘acceleration’ (the change in velocity
over time) and can therefore be used to measure the volume and intensity of
90
movement. The internal mechanics of the accelerometer are beyond this scope of
this thesis, but for a comprehensive description see Chen & Bassett, (2005).
Intensity of activity can be quantified by applying cut points to define sedentary,
light, and moderate and vigorous (MVPA) activity, or using equations to
transform raw data to heart rate, or energy expenditure. The use of regression
equations to transform data is problematic in children however, as associations
are confounded by growth (Freedson, Pober & Janz, 2005). The bulk of the
paediatric accelerometer literature involves 3 models: the Actigraph (CSA / MTI)
Actical & Actiwatch (Mini Mitter, or the RT3 Triaxial Research Tracker
(Tritrac-R3D) for a summary of the specification of these models see Table 2. 4.
For details of validation studies in children see Table 2. 5.
Which accelerometer?
Uniaxial or triaxial
Children generally have a range of activities in a variety of directions, so it
would seem logical that triaxial accelerometers may provide a more reliable
measure of physical activity. However, little empirical evidence exists to support
the use of a triaxial over uniaxial monitor (Freedson, Pober & Janz, 2005).
Model
Selection of the model should be based on practicality of use, intended
population / sample size, software available for analysis, comparability to other
studies and availability of a reliable method to quantify intensity of activity
(Trost et al, 2005). Recent reviews (Reilly et al., 2008; De Vries et al., 2007)
recommend use of the Actigraph (www.theactrigraph.com) accelerometer, based

91
on the fact that is the most widely used in paediatric research, and has the largest
body and evidence to support its validity, reliability and use in children (Reilly et
al., 2008 p 615; De Vries et al., 2007). Based on these criteria, the Actigraph
accelerometer may be the best of the currently available motion sensors for use
in children. It has been validated for use in children, is small & lightweight,
rechargeable, waterproof (the most recent Actigraph model, GT1M) easy to
initialise and download and has a wide range of possible epoch lengths
(www.theactigraph.com). Existing large birth cohorts; Avon Longitudinal Study
of Parents & Children; ALSPAC (Riddoch et al., 2007; Ness et al., 2007) and
new research (Millenium Birth Cohort – MRC Institute of Child Health, Personal
Communication) in large population based studies have selected this as an
outcome for the measurement of physical activity. The Actigraph accelerometer
has been used and validated in children against doubly labelled water and direct
observation (Fairweather et al., 1999). There are also published paediatric cut
points for Actigraph output to quantify sedentary behaviour (Reilly et al., (2003),
light activity and moderate and vigorous activity (MVPA) (Puyau et al., 2002).
The Actigraph accelerometer has been used successfully in very large samples of
children: n= 6329, Trioano et al., 2007 National Health and Nutrition
Examination Survery (NHANES) www.cdc.gov/nchs/nhanes; n = >5000 Avon
Longitudinal Study of Parents and Children (ALSPAC) www.alspac.bristol.ac.uk
(Mattocks et al., 2008).

92
Practical considerations
Time sampling frequency (epoch)
Most studies use a 1 minute epoch, but there is some evidence that at very high
intensity activities a shorter epoch would provide more representative
information (Nilsson et al., 2002). However, in reality, even in children, epoch
length used does not appear to greatly impact the overall data in sedentary
behaviour, light and moderate physical activity (Reilly et al., 2008). Epoch
length appears to only be important only at high levels of physical activity
(Reilly et al., 2008; Rowlands et al., 2006; Nilsson et al., 2002).
Length of measurement period
The number of days and hours need to be determined for each sample and setting
(Reilly et al., 2008), however in young children it appears the most reliable
measure is obtained from 10 hours per day over 7 days (Penpraze et al., 2006).
Representative data can be obtained from as little as 3 days of monitoring (Reilly
et al., 2008; Penpraze et al., 2006). Based on this, accelerometer inclusion criteria
for the studies in this thesis were at least 9 hours of data on at least 3 days. This
provides reliability of 62%. The optimum monitoring period is 10 hours for 7
days, representing reliability of 80% (Penpraze et al., 2006).
Monitor placement
The bulk of the literature using accelerometers in children indicates the
placement on the right hip is valid, and tolerated well by children. In an
accerlometer calibration study by Puyau et al. (2002) hip or leg placement of

93
monitor did not significantly influence physical activity output. However,
placement around the waist is generally recommended (Reilly et al., 2008).
Cut-points
Analysis of child Actigraph data in 72 4-7 year old children (Reilly et al., 2008)
comparing the most commonly used cut-points to quantify sedentary behaviour
and moderate and vigorous physical activity (MVPA) (Treuth et al., 2004; Reilly
et al., 2003; Puyau et al., 2002; Freedson et al., 1997) indicate that the most
plausible cut-points to use are 1100 per minute to define sedentary behaviour
(Reilly et al., 2003) and between 3000-3600 counts per minute to quantify
MVPA (Reilly et al., 2008). For consistency, the cut point to define MVPA in
this thesis is based on the study by Puyau et al. (2002) (> 3200 counts per
minute). Vigorous physical activity, as measured by acceleromtery, in young
children is defined as > 8200 counts per minute, based on the cut point provided
by Puyau et al. (2002).
Old versus new Actigraph (GT1M) Model
In 2005 a new Actigraph model was launched; the GT1M. This replaced the
Actigraph 7164, which forms the bulk of the literature on accelerometery, but
which is no longer in use. Corder et al. (2007) suggest that the new GT1M
systematically records physical activity around 9% lower than the old Actigraph
model (Model 7164). The authors suggest a correction factor of 0.91 should be
used when comparing data from the GT1M and the 7164. These authors suggest
that the increased memory, and improved inter-monitor reliability of the GT1M
94
should “produce more accurate and standardized data than the 7164” (Corder et
al., 2007).
Limitations of Accelerometers
At present there is no clear consensus on which cut points should be used to
quantify sedentary behaviour or which epoch length to use in young children –
some researchers suggest that 1 minute epochs may not capture the short
spontaneous bursts of activity seen in young children; however recent evidence
comparing epoch lengths does not support this (Reilly et al., 2008). If lower
epochs are to be used, this in itself is problematic – the lower the epoch, the
shorter the possible data collection period possible. Previous cut points have been
validated for on minute epochs, but its unclear whether these can be applied to
shorter epochs lengths and, if so, how? Although the manufacturers claim that
the technology is the same, as noted above, there are new data suggesting the
new model of Actigraph (GT1M) reports activity counts around 7-10% lower
than the older model (Corer et al., 2007) – this is problematic when applying cut-
points that have been developed using the old model and comparison with studies
that have used the old model, or have combined both old and new model.
Ongoing research is being carried out to determine this in adults
http://clinicaltrials.gov/ct2/show/NCT00342212 and in children.
To our knowledge, to date, no-one has published data on how data from an
individual monitor may change over time, and especially in the case of the new
Actigraph GT1M which is proposed as ‘self-calibrating’, this is potentially
important.
95
Heart rate
The “Flex Heart Rate” (Flex HR) has become a standard method for assessing
energy expenditure in human populations (for detailed review see Leonard,
2003). Reliability of the Flex HR as a proxy for energy expenditure, against
criterion methods of doubly labelled water, and whole body indirect calorimtery,
have been demonstrated in adults (see Leonard et al., 2003 pp 481 for summary
of adult validation studies), and in children (Leonard et al., 2003 pp 483).
Limitations of use of the flex-HR method in children
Previous validation studies in children are relatively limited (Leonard et al.
(2003). Existing data suggests that Flex HR is good for assessing group total
energy expenditure (TEE), but may lack precision when providing individual
estimates (Livingstone et al., 2000). HR calibration studies in children have
tended to include only one type of exercise, generally treadmill or cycle
ergometer, and this may not be representative of the daily activity patterns of
children (Livingstone et al. (2000). Previous experience in our group suggested
that there was lower compliance to use of HR monitors in young children as
compared to acclerometers (unpublished pilot data from the ‘SPARKLE’ study).
The combination of heart rate and accelerometery has been suggested as a
promising measure of energy expenditure and physicial activity in children, for
example the ‘ActiHeart’, www.camntech.com/cntactiheart.htm however further
research in children is required.

96
Proxy (parental) assessments of physical activity
Questionnaires and activity diaries have a clear advantage in large population
based or epidemiological studies. However, as a result of their cognitive-ability
and recall limitations, it is recommended that direct observation or objective
measures of physical activity should be used in this age-group (Cardon & De
Bourdeaudhuij, 2007; Burdette, 2004). This, however, is not necessarily feasible
for large-scale epidemiological studies. There are very few proxy measures of
physical activity for children. Burdette et al. (2004) examined the validity of an
Outdoor Time Checklist and parent recall of outdoor playtime in 250 children
(Cincinnati, USA) against the RT3 accelerometer. The Checklist is based on the
premise that children accumulate the majority of their physical activity outdoors
(Burdette et al., 2004). Time spent outdoors (as recorded by parents on the
checklist) was significantly, but weakly, correlated (r=0.33, p<.001) with the
levels of physical activity measured by the accelerometer, as was outdoor
playtime recall (0.20, p=<0.001). The 2 parent measures of outdoor time were
correlated with one another (r=0.57, p=<0.001) (Burdette et al, 2004). While the
checklist and recall may have merit in determining the proportion of overall
physical activity accumulated by time spent outside in these children, it is not
viewed as a precise enough measure of physical activity for many research
applications. The differences in climate between the USA and UK (colder/wetter
climate – less time outside) mean that it is unlikely that the results would
translate. In their review, Sirard and Pate (2001) conclude that there is little
evidence for the validity of proxy reports of physical activity by parents and
teachers (Sirad & Pate, 2001).
97
A parent diary or proxy measure of physical activity may be considered to
complement an objective measure may be considered. If a proxy measure of
physical activity is the only feasible outcome measure, it must at the very least be
validated in the proposed population against a criterion measure (direct
observation), or a reliable objective measure (accelerometer), and reliability (test
retest and inter-rater) data must be collected.
Conclusion: the existing research, expert reviews and recommendations suggest
that the best outcome measure for objectively measuring physical activity in
young children is the Actigraph accelerometer, placed on the right hip, with an
attempt to collect data for 7-10 hours per day for 3-7 days (inclusion criteria at
least 3 days containing at least 9 hours of activity.
2.3. Anthropometric measures
For descriptive purposes, we measured height to 0.1 cm, and body mass (to
0.1kg) in all children. Body mass index (BMI) was calculated as mass (kg) /
height (m2).Body mass index (BMI) was calculated (kg/m2), and converted to
BMI SD scores based on the UK 1990 reference data, using an Excel file and
macro from the Child Growth Foundation (Cole et al., 1995).

98
Table 2. 2 Published reviews of measurement of physical activity in children / adolescents.
Reference Title / Topic
Reilly et al. (2008) Objective measurement of physical activity and sedentary behaviour: review with new data.
De Vries et al. (2006) Clinimetric review of motion sensors in children and adolescents.
Rowlands (2007) Accelerometer assessment of physical activity in children: an update.
Trost, S.G. (2007) State of the Art Reviews: Measurement of physical activity in Children and Adolescents.
Oliver, Schofield & Kolt, (2007 Assessment of Physical Activity in Preschoolers
Trost, McIver & Pate, (2005) Conducting Accelerometer based activity assessments in field based research.
Freedson, Pober & Yanz, (2005) Calibration of Accelerometer output in children.
Chen & Basset, , (2005) The technology of accelerometery-based activity monitors: current & future use.
Sirard, J.R. & Pate, R.R. (2001) Physical Activity Assessments in Children & Adolescents.
Sallis, F.J. & Saelens, B.E. (2001) Assessment of Physical Activity by Self Report: Status, Limitations and Future Directions. †
† Includes adult studies, but included for relevance.

99
Table 2. 3 Summary of scales for direct observation of physical activity in children Scale Description Reliability
Studies in
Children
Concurrent
Validity
Intended setting for
use.
Limitations
CARS (Child Activity
Rating Scale) (Puhl et
al, 1990)
10 seconds of observation followed by 10 seconds of recording. Most commonly used. Coding of activity in 5 categories (resting, low, medium-to-high, vigorous)
Assessment of practicality and inter-observer reliability over a 12 month period in 491 3-4 year olds. Interrater reliability 0.74-0.94 in n=192 3-4 yr olds.
V02 & HR Various. Validation against V02.
OSRAC-P
(Observational
System for Recording
Physical Activity in
Children-Preschool
Version) (Brown et
al, 2006).
5 seconds of observation followed by 25 seconds of coding. Modified version of CARS. Developed with preschool children.
Inter rater kappa = 0.79-0.99
Preschool (Indoor, outdoor, social).
Broad range of agreement for physical activity level and type (0.10-1.00) and 0.500-1.00).
BEACHES
(Behaviours of Eating
and Activity for
Children’s Health
Evaluation System)
(McKenzie et al,
1 minute momentary time sampling with 5 categories during various conditions.
Interrater 19 4-9yr olds K=0.71-1.0
HR Various. Wide range of social and environmental influences. Home.
Time: four observations of 60 minutes recommended to characterised child behaviour.

100
1991) Complex coding system & 10 hours of practice require for administrator (McKenzie et al, 1991).
SOPLAY (System for
Observing Play and
Leisure Activity in
Youth) (McKenzie et
al, 2000).
Incorporates aspects of SOFIT/ BEACHES & CARS. Planned activity check recording.
Intrerrater correlations 0.75 (0.76-0.98 lower in more active girls).
Self Reported Physical Activity. (before school 0.74; lunchtime 0.73; after 0.35) Coding validated with HR.
Various: Groups of children. Behavioural settings / target areas in schools / communities coded as ‘sedentary’, ‘activity or ‘very active.’
Aimed at older (school aged) children, no evidence of use in preschool. Low correlation for after-school activities (possibly relating to comparison with self-report).
Children’s Physical
Activity Form
(CPAF)
1 minute time sampling in 4 categories.
Interrater reliability in 18 8-10 yrs 0.96-0.98
Correlation with HR 0.61-0.72 Actigraph accelerometer in 3-4 year olds (Fairweather et al, 1999; Kelly et al, 2004).
Structured class. Moderate correlation with HR.
FATS (Fargo Activity
Time sampling
Survey)
10 second time sampling in 8 categories.
Interrater reliability in =14 aged 2-4 years 0.91-0.99
LSI r=0.78-0.90 Various. Validation against LSI. Studies have suggested low correlations (albeit against self report) r = 0.16 to r = 0.40 (LaPorte et al (1981)

101
and Klesges et al 1985).
LSI: Large-scale integrated physical activity monitor.

102
Table 2. 4 Specifications of the 3 most commonly used accelerometers in paediatric research.
Accelerometer Actigraph (MTI/CSA) RT3 Actical / Actiwatch †
Manufacturer
MTI Stay Healthy Mini Mitter
Dimensions
51x41x15mm, 43g 71 x 56 x 28 mm, 65g
Battery Type
Battery Life (1 min epoch)
Coin cell (rechargeable by USB in the GT1M) 22 days (14 days in GT1M)
1 x AAA 8.5 days
Coin cell 45 days
Epoch 1 second – 10 mins 1 second or 1 minute 15 seconds – 15 minutes
Axes Uniaxial (vertical place) Triaxial Uniaxial Manufacturers calibrator
available for purchase
√ (not for GT1M) X √
Waterproof √ (GT1M ‘self calibrating’) X √ †usually used in sleep research

103
Table 2. 5 Accelerometer validation studies in children. Reference Sample Aim / Method Summary Findings Corder et al., (2007) 15 boys and 15 girls aged 15.8
years SD 0.6. Comparison of old (7164) and new (GT1M) Actigraph models.
Correlation between models r=0.95 (p <0.0001) GT1M averaged 9% lower than 7164. A correction factor of 0.91 is suggested. GT1M showed more time sedentary, and less in light intensity activity. GT1M cut points should be 10% lower than existing (in this age-group).
Reilly et al. (2008) 32 5-6 year olds. Analysis of Actigraph applying 15, 30, 54 and 60 second epochs.
Differences between epochs for sedentary behaviour were not significant. Epoch differences for MVPA were significant but small.
Mattocks et al., (2007) 83 12 year olds. To develop population-specific cut points for definition MVPA. Cosmed K4b2 Actigraph 7164
Lower threshold for MVPA was 3581 counts per minute.
Penpraze et al., (2006) 76 mean age 5.36 years SD 0.4. To identify the optimal montoring period for use of the Actigraph in preschool children.
The most reliable physical activity was a monitoring period of 10 hours per day for 7 days.
McLain et al. (2006) 31 children mean age 10.2 SD 0.4 years.
Comparison of Kenz Lifecorder (pedometer) Yamax Digiwalker pedometer and Actigraph
The 2 pedometers recorded a similar number of steps, but a significantly lower number

104
accelerometer step counter. that the Actigraph. Pate et al., (2006) 30 3-5 year olds Actigraph and Cosmed during rest
and structured physical activity . activity
Correlation between accelerometer counts and VO2
was 0.82. Sirard et al., (2005) 16 3-5 year olds.
281 3-5 year olds
To establish cut points and evaluate the Actigaph as a measure of activity in preschools.
Abstract only, need paper.
Kelly et al,(2004) Pediatr. Exerc. Sci 16; 324-333.
78 3-4 year olds CSA/MTI WAM-7164 and Actiwatch accelerometers simultaneously measured activity during structured-play classes in 3- to 4-year olds
Correlation between Actigraph & D.O. (r=0.72) Actiwatch & D.O. (r=16) Between monitors (r=0.36)
Treuth et al., (2004) 74 13-14 year old girls Accelerometer and oxygen consumption (VO2) (Cosmed K4b2) for 10 sedentary (e.g. TV viewing) and vigorous (e.g running) activities.
Sedentary cut point 0-50 Light 51-1499 Moderate 1500-2600 Vigorous >2600 Counts per 30 seconds.
Reilly et al., (2003) 30 3-4 year olds (n=52 cross validation)
Comparison of Actigraph accelerometer to direct observation (CPAF)
Optimal sensitivity and specificity for sedentary behaviour at 1100 counts per minute cut point. Mean specificity in cross-validation was 82 SD 11% (79-86%)
Chu et al, (2003) Pediatri. Exerc. Sci. 15; 55-56.
34 Vietnamese 11-15 year olds. Validation of the Actigraph to predict energy expenditure.
Activity counts from Actigraph significantly correlated with oxygen consumption (r 0.88)(Cardiopulmonary

105
diagnostic system) and HR (r=0.73). Prediction equations should be used in groups rather than individuals.
Nilsson et al., (2002) 16 7 year olds To examine Actigraph data using different time sampling intervals (epochs) and different monitor placements.
There was so significant difference in time spent in moderate activity between epochs. A significant epoch effect was seen at high and very high intensity activity levels (p<0.1). There was no significant effect of monitor placement.
Puyau et al, (2002) Obes. Res. 10:150-157..
26 6-16 year olds Relationship activity counts from Actigraph & Actiwatch to whole body calorimetry.
Stronger correlations with Actical (r=0.85) than Actiwatch (r=0.82). Correlation between monitors (0.93).
Ott et al, (2000) Ped. Exerc. Sci. 12:360-370.
28 9-11 year olds Ability of Actigraph and Tritrac-RD3 to measure free play in children. Compared to HR / observation.
Both monitors significantly correlated with HR / obs across activities (video games, stepping, hopscotch, basketball, dancing, running). Tritrac-RD3 (r 0.66-0.73) Actigraph (r 0.53-0.64) Correlation between monitors (r=0.86) suggest similar data from uniaxial / triaxial.
Finn & Specker, Med. & Sci in 40 3-4 year olds. Comparison of Actiwatch and Correlations between
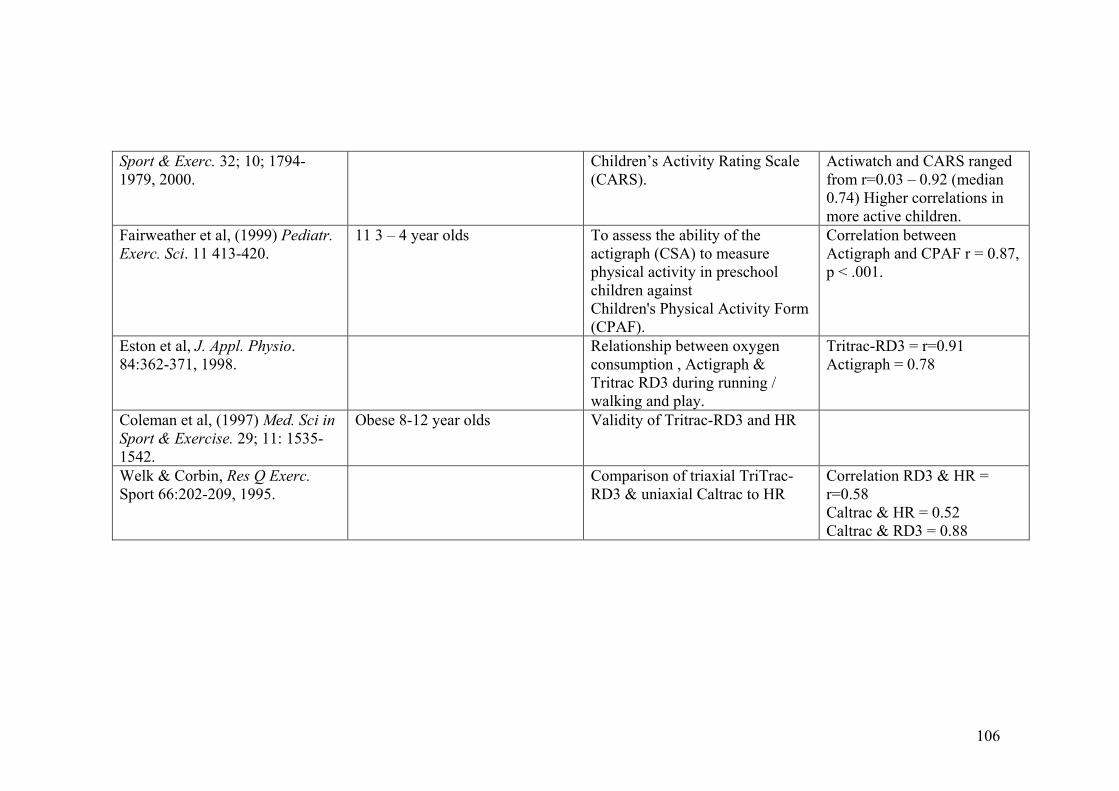
106
Sport & Exerc. 32; 10; 1794-1979, 2000.
Children’s Activity Rating Scale (CARS).
Actiwatch and CARS ranged from r=0.03 – 0.92 (median 0.74) Higher correlations in more active children.
Fairweather et al, (1999) Pediatr. Exerc. Sci. 11 413-420.
11 3 – 4 year olds To assess the ability of the actigraph (CSA) to measure physical activity in preschool children against Children's Physical Activity Form (CPAF).
Correlation between Actigraph and CPAF r = 0.87, p < .001.
Eston et al, J. Appl. Physio. 84:362-371, 1998.
Relationship between oxygen consumption , Actigraph & Tritrac RD3 during running / walking and play.
Tritrac-RD3 = r=0.91 Actigraph = 0.78
Coleman et al, (1997) Med. Sci in Sport & Exercise. 29; 11: 1535-1542.
Obese 8-12 year olds Validity of Tritrac-RD3 and HR
Welk & Corbin, Res Q Exerc. Sport 66:202-209, 1995.
Comparison of triaxial TriTrac-RD3 & uniaxial Caltrac to HR
Correlation RD3 & HR = r=0.58 Caltrac & HR = 0.52 Caltrac & RD3 = 0.88

107
Chapter 3. The relationship between fundamental movement
skills and physical activity in young children.
Published in Medicine and Science in Sport and Exercise:
A Fisher, JJ Reilly, LA Kelly, C Montgomery, A Williamson, JY Paton, S
Grant. Fundamental movement skills and habitual physical activity in young
children. Med Sci Sports Exerc 2005; 37: 684-688.

108
Contributions
Study design, all movement skills and physical activity data collection,
downloading and accelerometer physical activity data reduction, and statistical
analysis were all carried out by the thesis author under the supervision of
Professor John Reilly.
Data were collected as the baseline of a large RCT; the MAGIC (Movement
Activity Glagsow Intervention in Children) Study, therefore the study presented
in this chapter would not have been possible without the input of the MAGIC
research team; Professor John Reilly (PI) , Dr Louise Kelly, Dr Collette
Montogomery, Dr James Paton and John McColl.
109
3.1 Introduction
There is increasing evidence that modern pre-school children might be less
physically active than expected (Reilly et al., 2004; Jackson et al., 2003;Kelly et
al., 2003), and there is increasing emphasis on early childhood lifestyle as a
determinant of later disease risk (Reilly et al., 2003; Janz et al., 2002; Fulton et
al., 2001). It is widely believed that fundamental movement skills and habitual
physical activity are related in childhood and adolescence (McKenzie et al.,
2004; Fulton et al., 2001; Okely et al., 2001; Pate et al., 2001), and elucidating
relationships between these two variables was highlighted as a research priority
by the Centre for Disease Control (CDC) in 2001 (Fulton et al., 2001). However,
Pate (2001) questioned the premise that these two variables are related and asked
whether the degree of emphasis being placed on motor skills in the paediatric
physical activity community was excessive.
Very few studies have examined the relationship between habitual physical
activity and fundamental movement skills (basic motor skills) in children. Okely
et al (2001) found a significant relationship between fundamental movement
skills and self-reported participation in organised physical activity in adolescents,
although only a small proportion (3%) of participation in organised physical
activity was explained by fundamental movement skills score. Butcher and Eaton
(1989) reported a significant positive relationship between fundamental
movement skills and participation in vigorous activity in pre-school children.
However these authors used free play behaviour as their single measure of
physical activity and running speed and agility were the only movement skills
assessed. Ulrich et al (2004) found a significant relationship between parent-

110
reported ‘movement competence’ and participation in organised sport in 5 to 10
year old children.
There is, therefore, no consensus in the literature on the methods that should be
used to assess/ report physical activity, or the definition of fundamental
movement skills, and measurement of both variables present practical problems,
particularly in young children. Consequently, studies in this area have been
scarce. We are not aware of any published studies that have tested empirically
whether or not there are relationships between objectively measured habitual
physical activity and global fundamental movement skills in young children.
A pilot study in 60 pre-school children (Reilly et al., 2003) found a significant
positive correlation (r 0.30, p<0.05) between habitual physical activity, as
measured by CSA accelerometer over two days, and fundamental movement
skills test score in pre-school children. The aim of the current study was therefore
to test whether there was any significant relationship between these two variables
in a larger and more socio-economically representative sample of contemporary
pre-school children in which physical activity was measured over a longer period
(6 days).
3.2 Participants and methods
We aimed to study pre-school children recruited for baseline measurements (pre-
intervention) of the Movement and Activity Intervention in Glasgow Children
(MAGIC) randomised controlled trial (Reilly et al., 2006). For inclusion in the
current study (for analysis purposes) children had to be apparently healthy,

111
having no chronic disease relating to energy expenditure or physical activity. The
children all lived in urban or suburban settings in and around Glasgow, Scotland.
The study was approved by the Yorkhill Hospital Ethics Committee. Informed
written consent was obtained from the parent/ guardian of each child.
The ‘MAGIC’ randomised controlled trial entered 545 children. Insufficient
numbers of accelerometers and research staff during the study period meant that
a pragmatic decision was taken to measure habitual physical activity (a
secondary outcome measure in the trial) in 482 of these 545, and we selected
these 482 children randomly (using a computer generated random number
sequence) from the entire sample of 545. Of these 482, 58 children were
excluded due to insufficient accelerometry data to meet our reliability criteria
established before the study began; a minimum of 9 hours per day over at least
three days (Penpraze et al., 2006). Physical activity was therefore measured
successfully in 424/482 children. A further 30 of these 424 children were
excluded from analysis due to: absence from nursery school on day of movement
skills test (n=27) or inability/unwillingness to perform the movement skills test
(n = 3). This left data from 394 children for analysis in the present study.
Physical activity measurements
Habitual physical activity was measured using the Actigraph Model 7164
accelerometer (MTI, Fort Walton Beach, FL). This is a small, lightweight,
uniaxial device (measures movement largely in the vertical plane) which was
worn on the right hip under clothing as previously described (Reilly et al., 2006;
Jackson et al., 2003; Reilly et al., 2003; Fairweather et al., 1999; Chapter 2 of

112
thesis). A number of studies have reported favourably on the validity of the
Actigraph in children, by comparisons against direct observation of behaviour or
energy expenditure (Reilly et al., 2003; Puyau et al., 2002; Finn & Specker et al.,
2000; Fairweather et al., 1999; Eston et al., 1999; Trost et al., 1998) .The
CSA/MTI produces output in activity counts per unit time. This output can be
considered in ‘raw’ form (counts per minute, cpm) as a valid index of total
‘volume’ of physical activity (Puyau et al., 2002; Nilsson et al., 2000;
Fairweather et al., 1999). Alternatively, output can be interpreted using cut-
points which define different intensities of physical activity (Reilly et al., 2003;
Nillson et al., 2002; Puyau et al., 2002). Paediatric cut-points have been
published which have been validated for young children carrying out unrestricted
activities based on both of the criterion measures for physical activity, i.e. energy
expenditure (Puyau et al., 2002) and direct observation of behaviour (Reilly et al.,
2003). We applied these cut-points in the present study: sedentary behaviour
<1100 counts per minute (Reilly et al., 2003); light intensity physical activity
1100-3200 counts per minute (Puyau et al., 2002); moderate and vigorous
physical activity (MVPA) >3200 counts per minute (Puyau et al., 2002).
Alternative cut-points are less suitable for paediatric use at present because they
do not meet a number of criteria are unpublished; involve extrapolations from
adult studies which may be questionable; involve extrapolation from treadmill
exercise which does not necessarily represent the types of activities carried out
by young children (Reilly et al., 2008).
We aimed to measure habitual physical activity in participating children by
asking families to fit the accelerometers in the early morning and remove them at

113
night (before bedtime) for a period of 6 consecutive days. Parents and nursery
staff were asked to record when accelerometers were fitted and removed, and
why they were removed (e.g. for swimming).
Fundamental movement skills assessment
Fundamental movement skills were measured using 15 tasks based on the
Movement Assessment Battery (Henderson & Sugden, 2002). Reliability and
concurrent validity of the Movement Assessment Battery in young children has
been documented previously by Croce et al: intra-class correlations for test-retest
reliability over a 1 week period for children aged 5 - 6 ranged from 0.92 to 0.98.
(Croce et al., 2001). The measurements in the current study were carried out by
the same trained observer (the thesis author), positioned to allow full view of the
tests, but far enough away to avoid obstructing or distracting children. The test
involved a set of 15 tasks: jumps (vertical jump, running jump and standing jump
from measured distance of 33 inches); balance, standing on one foot for exactly 1
second and standing on one foot for exactly 6 seconds-timed by stopwatch; skips
(4 different forms of skipping); ball exercises, kicking rolled ball from 72”,
catching ball from 33” (overarm throw), catching bounced ball from 72”;
throwing beanbag into a target from 72”. These tasks were selected because they
have been successfully measured in other studies (Butcher & Eaton, 1989), are
age appropriate for the children in our study (Gabbard, 2004), and, as a set,
favoured neither boys nor girls (Garcia et al., 1994).
A member of staff from each participating nursery was shown how to perform/
demonstrate each task. To make the children feel more comfortable they were

114
taken out of class for testing in groups of 4-5 children (distraction caused by
interactions between children is common in larger groups) but each child was
tested and scored individually. Each group was given a single demonstration of
the exercise. Children then attempted each task individually and the single
trained observer (the author) checked a box YES (if the task was performed
correctly), or NO (if the task was not carried out / carried out incorrectly). The
test was scored YES = 1, NO = 0. Each child was therefore given a total score
from 0-15. This single measure of overall movement skills was used for analysis,
though analysis by subsets of tasks (locomotive, manipulative, and balance) was
also carried out and these results are discussed below.
Anthropometry
For descriptive purposes, we measured height to 0.1 cm, and body mass (to
0.1kg) in all children. Body mass index (BMI) was calculated as mass (kg) /
height (m2). BMI was expressed as a standard deviation score (SDS) relative to
1990 UK reference data.
Statistical analyses
We first tested for associations between fundamental movement skills score and
various indices of habitual physical activity (total physical activity summarised
as accelerometry count per minute; % of monitored time spent in light intensity
physical activity; % of monitored time spent in MVPA) using correlations. We
also tested for differences in these indices of habitual physical activity by
quartiles of movement skills score using Kruskal-Wallis tests. To compare
activity levels in different quartiles for movement skills a Kruskall Wallis test

115
was carried out using data from boys only, girls only, and both sexes combined.
Where Kruskal-Wallis tests were significant, we used Mann-Whitney tests to
assess the significance of differences in physical activity between the upper and
lower quartiles for movement skills score. Statistical significance was set at p
<0.05.
3.3. Results
Full data were available from 394 children, mean age 4.2 SD 0.5 years (209
boys; 185 girls). The mean duration of accelerometry in the 394 children studied
was 56.0 hours (SD 13.3). Physical characteristics, and summary data for total
physical activity, percentage time spent sedentary, in light intensity physical
activity, MVPA, and fundamental movement skills are shown in table 3.1. Total
physical activity and percentage monitored time spent in light activity and in
MVPA were slightly but significantly higher in boys than in girls (Mann-
Whitney U test p <0.001). Percentage time spent in sedentary behaviour was
slightly, but significantly, lower in boys than in girls (Mann Whitney U test
p<0.001). There was no difference in fundamental movement skills score
between boys (median 8: min 0 max 14) and girls (median 8: min 0 max 14)
(Mann Whitney U test p 0.56).
Relationship between fundamental movement skills and physical activity
Correlations in the entire sample
Total movement skills score was weakly but significantly positively correlated
with total physical activity (accelerometry output in cpm): r 0.10, p 0.039. Total
fundamental movement skills score was not significantly correlated with % time

116
spent in light intensity activity: r 0.02, p 0.625. Total movement skills score was
weakly but significantly positively correlated with % of monitored time spent in
MVPA: r 0.18, p <0.001.
Table 3. 1 Physical characteristics and physical activity of children
Variable Mean / Median SD Range
Age (y) 4.2 / 4.2 0.5 3.6, 5.0
Height (m) 1.03 / 1.03 0.04 0.92, 1.16
BMI 16.37 / 16.16 1.44 13.00, 24.94
BMI SDS 0.43 / 0.38 0.94 -2.23, 4.45
Mean accelerometer
counts/min
769 / 747 † 192 365, 1480
% time inactive 76.3 / 77.0 † 6.8 53.6 , 92.9
% time in light
intensity activity
20.3 / 19.9 † 5.3 6.3 , 34.9
% time in MVPA 3.3 / 2.9† 2.2 0.3, 13.0
Fundamental
movement skills score
8 / 8 3 0 , 14
n=394; 209 boys, 185 girls † significantly higher in boys than girls by Mann Whitney U test

117
Relationships between quartiles for movement skills score and habitual
physical activity
We found no significant association between quartiles of movement skills score
and total physical activity (accelerometry count in cpm; Kruskal-Wallis, p=0.16),
or time spent in light intensity physical activity (p=0.54). These observations
were essentially the same whether analysed for the entire sample or by treating
the sexes separately in the analysis (boys p=0.21; girls p=0.49).
There was a significant association with quartiles of movement skills score and
percentage of monitored time spent in MVPA (p=0.001). Comparison of
percentage time spent in MVPA by quartiles for fundamental movement skills
score are summarised in figure 3.1. In the girls time spent in MVPA was
significantly higher in the upper quartile (Q4) quartile for fundamental
movement skills than the lower quartile (Q1) (median difference 0.9%: 95% CI
0.2-1.6% p 0.01). In boys time spent in the upper quartile (Q4) for fundamental
movement skills score was significantly higher by Mann-Whitney test than the
lower quartile (Q1) (median difference 0.9% 95% CI 0.0-0.2% p 0.04).

118
Figure 3. 1 Lower, middle and upper quartiles for time spent in moderate
and vigorous physical (MVPA) activity in boys and girls
2
3
4
1 2 3 4
Quartile for movement skills score
% monitored time spent in
MVPA
Boys
Girls
% monitored time spent in MVPA as measured by the Actigraph GT1M accelerometer, using >3200 cut point by Puyau et al., (2002). Boys and girls in the upper quartile spent significantly more time in MVPA than boys and girls in the lower quartile (p<0.05).

119
3.5 Discussion
Main findings in context
The present study suggests that there are significant but weak cross-sectional
relationships between habitual physical activity (specifically time spent in
moderate and vigorous physical activity and total physical activity) and
fundamental movement skills in modern pre-school children. Children who spent
more time in MVPA tended to have higher fundamental movement skills scores,
but each explained only a small amount of variation in the other variable in the
present study. Our observations tend to support the view expressed by Pate
(2001) that habitual physical activity and movement skills may not be closely
associated in childhood. However, our observation of marked differences
between time spent in MVPA and motor skills in upper and lower quartiles
(figure 3.1) perhaps suggests that, at the extremes of the distribution, these
associations might be more important. This possibility should be explored in
future research. For example, children with the most limited engagement in
MVPA also had poorest performance in the motor skills assessment and it is
possible that limited engagement in MVPA might hinder motor development, or
that limited motor development might restrict participation in MVPA.
Our findings are also similar to those of Okely et al (2001) who found a weak,
but statistically significant, relationship between time spent in organised physical
activity and fundamental movement skills in Australian adolescents (Okely et al.,
2001). The amount of variance in time spent in organised physical activity
explained by fundamental movement skills in the Australian study was small

120
(3%). A recent study in 124 Australian 6-12 year olds using the Movement
Assessment Battery reported only weak significant, or non-significant,
correlations with pedometer counts (Zivani et al., 2008).
In children in the present study engagement in MVPA was relatively low and
engagement in sedentary behaviour high. We have previously reported this
observation in other samples of young Scottish children (Reilly et al., 2006;
Reilly et al., 2004; Jackson et al., 2003). The relatively low levels of habitual
physical activity and time spent in MVPA might have reduced our ability to
detect associations with movement skills score.
It is possible that gender differences might exist in the relationships between
physical activity and motor skills (Gabbard, 2004; McKenzie et al., 2004; Okely,
et al., 2001; Garcia,1994). We did not find any marked gender differences in the
main analyses described above: this observation might have been due to use of
data reduction to a single global movement skills score. More subtle observations
such as gender differences might have been detectable within categories of the
movement skills score (for locomotive, manipulative or balancing tasks), but our
subsequent analyses using these three components of the movement skills score
failed to indicate any clear gender differences.
Limitations
Despite being the largest empirical investigation of relationships between
movement skills and physical activity to date, the present study had a number of
limitations. We used a uni-axial accelerometer which, in principle, should
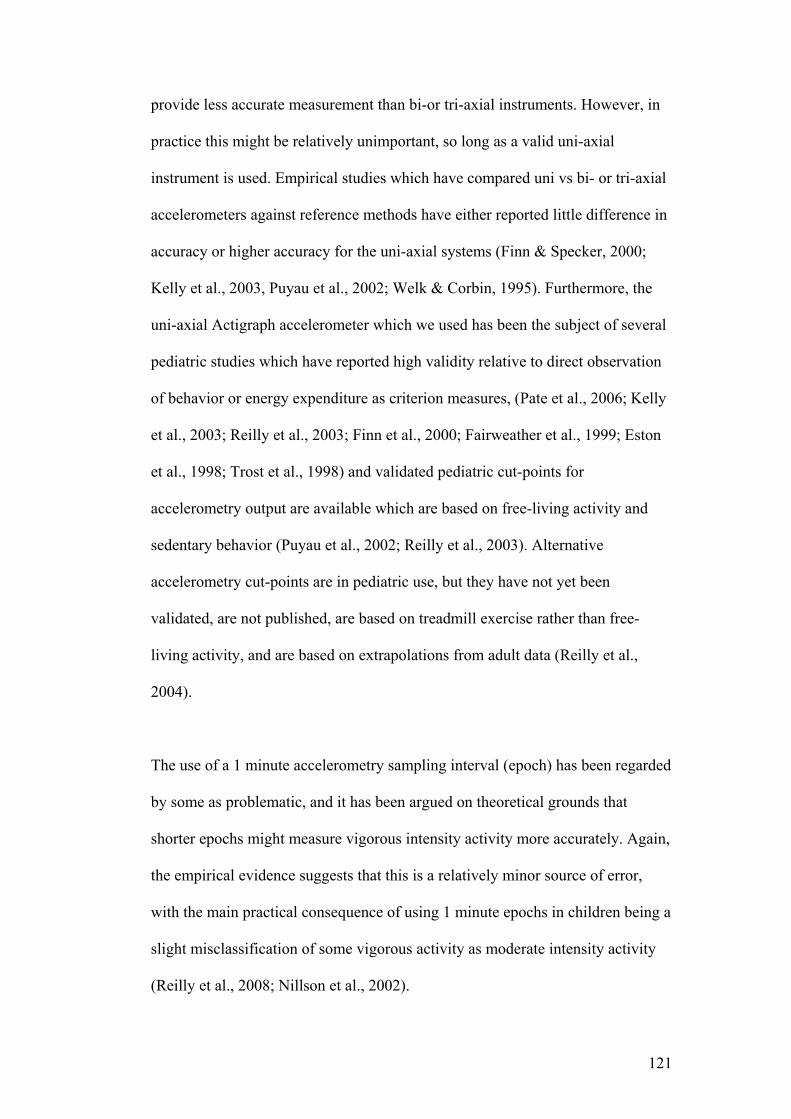
121
provide less accurate measurement than bi-or tri-axial instruments. However, in
practice this might be relatively unimportant, so long as a valid uni-axial
instrument is used. Empirical studies which have compared uni vs bi- or tri-axial
accelerometers against reference methods have either reported little difference in
accuracy or higher accuracy for the uni-axial systems (Finn & Specker, 2000;
Kelly et al., 2003, Puyau et al., 2002; Welk & Corbin, 1995). Furthermore, the
uni-axial Actigraph accelerometer which we used has been the subject of several
pediatric studies which have reported high validity relative to direct observation
of behavior or energy expenditure as criterion measures, (Pate et al., 2006; Kelly
et al., 2003; Reilly et al., 2003; Finn et al., 2000; Fairweather et al., 1999; Eston
et al., 1998; Trost et al., 1998) and validated pediatric cut-points for
accelerometry output are available which are based on free-living activity and
sedentary behavior (Puyau et al., 2002; Reilly et al., 2003). Alternative
accelerometry cut-points are in pediatric use, but they have not yet been
validated, are not published, are based on treadmill exercise rather than free-
living activity, and are based on extrapolations from adult data (Reilly et al.,
2004).
The use of a 1 minute accelerometry sampling interval (epoch) has been regarded
by some as problematic, and it has been argued on theoretical grounds that
shorter epochs might measure vigorous intensity activity more accurately. Again,
the empirical evidence suggests that this is a relatively minor source of error,
with the main practical consequence of using 1 minute epochs in children being a
slight misclassification of some vigorous activity as moderate intensity activity
(Reilly et al., 2008; Nillson et al., 2002).

122
The fundamental movement skills test has certain limitations. There may be
gender differences in the ability to perform certain tasks within the test, and
indeed this has been demonstrated previously in pre-school and in older children,
with girls typically performing more successfully in balancing tasks, and boys
being in tasks which involve running and jumping (Gabbard, 2004; Garcia,
1994). It is possible that relationships between movement skills and physical
activity might have been stronger if these sub-categories of movement skills
were considered, rather than reducing the data to a single global score. In an
attempt to address this question we analysed using three components of the
overall movement skills score separately, but in practice the results were very
similar to those obtained when the overall combined score was considered.
Our use of a product oriented, rather than process oriented, assessment of
fundamental movement skills may be viewed as a weakness (Okely et al., 2001);
product oriented assessment means the child can either peform the movement or
not (for example ‘can the child catch a ball?’ Yes or No) process oriented
assessments score every process of the movement (for example, ‘does the child
track the ball with their eyes? ‘Do they reach out for the ball?’). These
limitations may have masked the relationship between physical activity and
movement skills to some extent.
3.5. Conclusions
The present study questions whether there is relationship between movement
skills and habitual physical activity in preschool children. Alternative study

123
designs should be considered. In particular, longitudinal studies and intervention
studies might provide greater ability to detect associations between these
variables.

124
Chapters 4-6: General introduction
The following chapters relate to the relationship between exercise and cognitive
function. The original aim of this thesis was to move from examining the
relationship between physical activity and movement skills in preschoolers, to
examining the relationship between exercise and cognitive function in
preschoolers. For a variety of reasons: instability of psychological measures (as
advised by our expert Education psychologist J Boyle, University of Strathclyde,
and expert Cognitive Psychologist P Tomporowski) and practical issues such as
difficulty in introducing an intense aerobic intervention into preschools, the
decision was taken to attempt to carry out the following studies in primary school
children (6 year olds) instead.
As the effects of exercise on cognition in children this age had never been carried
out before, we had several aims (discussed in more details in each chapter), all
built around designing a future RCT to examine the effects of exercise on
cognitive function in primary school children.
We applied for and successfully received a separate grant from the Chief
Scientist’s Office (CSO) for this funding.
Scottish Executive Health Dept Chief Scientists Office (2006-2007; £14,768).
Effect of exercise on cognitive function in children JJ Reilly (PI), J Boyle, JY
Paton, A Fisher.

125
Chapter 4 - Methods II
Psychological outcome measures
4.1 Cognitive Assessment System (CAS)
4.2 Conner’s Parents Rating Scale (CPRS:S)
This chapter describes standardised psychological outcome measures where
reliability data already exists in our proposed age group.

126
4.1. Cognitive Assessment System
The Cognitive Assessment System (Naglieri & Das, 1997) is a psychological
instrument that can be used to determine individual’s levels of cognitive
functioning (Das, 2002). The Cognitive Assessment System (CAS) was
developed to assess 4 aspects of cognition: Planning, Attention, Simultaneous
and Successive processes (PASS theory) (Luria, 1996, Posner, 1993) and
consists of 12 subtests (described in more detail), and a total score (Full Scale).
The test is designed for children and adolescents aged 5-17 years. PASS was
developed from a combination of theory and applied psychology, and it has been
suggested that PASS processes are essential elements of all human cognitive
functioning (Das, 2002). The CAS has been shown in previous studies to be a
useful tool for the diagnosis of learning difficulties, and a valid and reliable tool
for intervention studies (Das, 2002; Naglieri, 1999; Naglieri & Das, 1997;
Kranzler & Weng, 1991, Fein & Day, 2003). The CAS was selected for the
study described in Chapter 6, as it is the main outcome in the only existing
randomised controlled trial examining the effects of exercise on cognitive
function (in older overweight children) (Davis et al., 2007) so would allow
comparison of findings, has good reliability and validity in young children
(discussed in more detail (Das & Naglieri, 1997), and has subscales that allow
the aerobic exercise-executive function hypothesis (described in chapters 1 & 6)
to be tested.
Test descriptions and validity data from Das & Naglieri (1997) Cognitive
Assessment System Interpretative Handbook unless otherwise stated.

127
Planning
Planning is an element of executive functioning whereby the individual
determines, selects, applies and evaluates a solution to problem, and also guides
how people focus their attention (Das, 2002). Planning is associated with the
frontal lobe of the brain (Das, 2002), and is the process by which a problem with
no obvious solution is solved. The Planning subtest of the CAS requires the
child to develop and apply strategies to novel tasks, devise a plan of action to
solve a problem, evaluate and monitor the value of the strategy used to solve the
problem, revise or reject any unsuccessful strategy, and control the impulse to act
spontaneously. Planning is an essential component of problem solving activities,
and therefore essential in the classroom, and everyday life (Das & Naglier,
1997). Subtests of the planning battery are Matching Numbers, Planned Codes,
and Planned Connections (Planned Connections is not used in children under 7)
(Das & Naglieri, 1997). For examples of subtests see Appendix I.
Attention
Attention is a cognitive process by which an individual selectively focuses on a
particular stimuli while inhibiting responses to competing stimuli, for example
focussing on the teacher in a classroom, while blocking out conflicting ‘noise’
e.g. the large amount of auditory and visual stimulus present in an everyday
classroom. Neuroimaging research indicates that attention is divided into the
engagement, maintenance, disengagement and shifting of attention (Posner,
1993, p. 644). The subtests of Attention in the CAS require attention to be
focused (concentrated to a particular activity), selective (the inhibition or
‘blocking out’ of some stimuli while focusing on others) sustained (the variation

128
of performance over time) and effortful (the varying amount of effort required to
sustain attention over time). Subtests of the Attention scale are Expressive
Attention, Number Detection, and Receptive Attention (Receptive Attention is
not used in children under 7).
Simultaneous Processing
Simultaneous processing is thought to be associated with the occipital and
parietal lobes of the posterior region of the cortex (Das, 2002). Simultaneous
processing is a cognitive process where the individual integrates separate stimuli
into a group or whole group. It has spatial and logical-grammatical components.
The spatial aspect of simultaneous processing involves both the perception of
stimuli as a group, and the internalized formation of complex visual images. The
logical-grammatical dimension allows for the integration of words into ideas
through the understanding of word relationships, prepositions, and inflections so
the person can obtain meaning. Subtests of the simultaneous processing scale are
Nonverbal Matrices, Verbal-Spatial Relations, and Figure Memory.
Successive Processing
Successive processing is a cognitive process where the individual puts stimuli
into a specific order that forms a logical progression. This type of mental
processing is needed when things follow one another in an order that should be
strictly defined. Each element should be only related to the stimuli that precede it
and there are strong serial and syntactic components. Successive processing
subtests in the CAS require perception and reproduction of the serial nature of
stimuli, understanding of sentences based around syntactic relationships, and the

129
articulation of separate sounds in a consecutive series. The successive subtests
are Word Series, Sentence Repetition and Speech Rate. Successive processing is
associated with the frontal-temporal lobe of the cortex (Das, 2002).
The CAS can be used as a predictor of achievement: the full scale standard score
is the best predictor of achievement, and the PASS subscale scores will relate to
specific areas of achievement.
Outcomes of the CAS
A raw score can be obtained for each subtest, for some subtests this is the time to
complete in seconds (Planned Connections and Speech Rate), for some (Figure
Memory, Nonverbal Matrices, Verbal-spatial Relations, Word Series, Sentence
Repetition, and Sentence Questions). The Planned Codes, Matching Numbers
and Expressive Attention raw scores are obtained by developing a ratio for each
item based on the number correct, and the time to complete in seconds. Raw
scores for the Number Detection, and Receptive Attention subtests are calculated
by developing a ratio based on the number of items correct: the number of
incorrect items.
Standardisation of the CAS
The CAS has been standardized in, and normative data provided for, a sample of
2200 children from North America, aged 5-17 years: 300 children aged years,
5.00-5.11, 300 aged 6.00-6.11 years, and 300 children aged 7.0-7.11 years (Das
& Naglieri, - the populations of interest in this thesis.
130
Reliability of the CAS
Reliability is defined as “the consistency of scores obtained by the same persons
when re-examined with the same test on different occasions, or with different
sets of equivalent items, or under variable examining conditions”(Anastasi, 1988
p.102: Das & Naglieri, p.43). Reliability can provide information about the
internal consistency of a test, and can be used for calculation of statistics such as
the standard error of the mean (SEM). Reliability coefficients for all subtests,
were uniformly high, and the reliability of the PASS scale (0.89-0.93 in ages 5-7
years), and Full scale (0.95-0.96 in ages 5-7 years) were high.
Test-retest reliability data were obtained from 93 children aged 5-7 years, from a
period of 9-73 days (median 21 days). Test retest reliability across all subtests
was high, and from the Planning (r= 0.88), Simultaneous (r=0.77), Attention
(r=0.80), Successive (0.85) and Full Scale (r=0.89).
The correlation coefficients achieved in the tests of reliability for the CAS fall in
to the range deemed appropriate for use a psychological research tool (in or
above the range 0.75-0.80 Coolican, 1994; Sattler, 2001).
Validity of the CAS
Content validity
Content validity refers to the extent that the items in a test represent the cognitive
domains being assessed. The subtests and items of the CAS were developed
using a combination of task analysis and experimental design, to reflect the
processed described in PASS theory.

131
Construct Validity
Construct validity examines how well the test actually measures the construct, or
trait of interest. A major criterion for construct validity is the progression of
scores through ages groups, in the expected direction, for example, test involving
time would be expected to decrease with age, tests involving number of correct
scores would be expected to increase through age groups. This has been
demonstrated with the CAS (Das & Naglieri, (1997) p.51).
Criterion-Related Validity
Criterion validity examines how well a test compares to a criterion method. This
is demonstrated in the CAS using relationships to intelligence and achievement
tests, the use of strategy, and the relationship with strategy use scores in the
Planning subsets, the PASS performance of students from groups of children
with cognitive disorders in comparison to ‘normal’ children. Performance on the
CAS and Woodcock-Johnstone test of achievement were compared. Correlations
were relatively high for the Full Scale (r=0.73), but only moderate for the PASS
scale (r=0.50 to 0.67) (Naglieri & Das, 1997).
Limitations of the CAS
The CAS is only moderately correlated with other measures of achievement, so
caution must be used if relating CAS scores to overall academic performance. At
present the normative database has been obtained from North American
Children, and therefore may not directly relate to other populations. However,
Van Luit et al, 2005 examined CAS scores of 71 Dutch children with the
American normative database and found scores similar (Van Luit et al, 2005).

132
with The CAS is a relatively expensive outcome measure for a research study, as
must be administered and scored by a trained psychologist, and relatively lengthy
to administer (40 – 60 minutes), so requires a large time commitment from
schools if used as an outcome measure in a large sample of children.
4.2 Conner’s Parents Rating Scale: short form
Based on the suggestion that exercise may positively influence the behaviour of
children with behaviour problems (Allison et al., 1995), and the lack of data on
effects of exercise on behaviour in typically developing children, the decision
was made to include a behavioural measure as a secondary outcome in the study
described in chapter 6. The Conner’s Rating Scale (CRS) is the most frequently
used questionnaire in the assessment of attention deficit hyperactivity disorder
(ADHD) (Huss et al 2002). The short form of the Connors Parents Rating Scale
has 27 items examining Oppositional problems (6 items), Cognitive Problems/
Inattention (6 items), Hyperactivity (6 items), ADHD Index (12 items). Parents
must rate their child’s behaviour (in the past month) on a score of 0 ‘not at all –
never, seldom’, to 4 ‘very much true-very often, very frequent’. For an example
of the short form Conner’s Parent Rating Scale see Appendix II. The selection
of this test was based the criteria that is the most widely used behavioural rating
scale in research, can be administered by post, and has a valid short form. Raw
scores from the CPRS:S are converted to age and gender related T scores; the
items on the rating scale (1-27 see Appendix IIa) are added to give a total for
each section. The score for each section corresponds with an age and gender
related T score (on the reverse of the scoring form, see Appendix IIb).

133
Reliability of the Conner’s Parents Rating Scale: Short Form
Test and retest reliability for the 5-7 years age group are for the Oppositional
scale 0.62, Cognitive Problems and Innattention scale 0.73, Hyperactivity scale
0.85 and ADHD Index 0.85 (Conner’s Technical Manual 2001). Internal
consistency of the subscales were reported as all >0.85 (Conner’s, 1997).
Validity of the Conner’s Parents Rating Scale: Short Form (CPRS:S)
The factorial validity (to what extent the subscales are appropriate, and make
sense empirically and theoretically) convergent validity (the extent to which the
measure correlates with other instruments thought to measure the same construct
and discriminant validity (the extent to which the instrument discriminates
between groups e.g. ADHD versus non-ADHD) has been demonstrated
(Conner’s Technical Manual, 2001 p119-144).
Normative data
Normative data are available in 545 North American children aged 6-8 years (the
age group in the proposed study) (Conner’s Technical Manual, 2001). Benefits
of the Conner’s parents rating scale are that it is parent reported, and can be
administered and scored by any trained administrator making it suitable for a
large scale evaluation. A short form is available (which takes about 15 minutes to
complete) and the form can be administered by post in instances where face to
face evaluation in not feasible.
134
Limitations of the Conner’s parents rating scale
Test retest reliability of the Oppositional scale in the CPRS: S is only moderate (r
0.62), so results from this subscale should be viewed with caution. The form is a
subjective, parental measure of behaviour, and as such, may be prone to bias, but
is also widely used and recommended by psychologists. Where postal
administration is used, there is a likelihood of a lower response rate.
Finally, the Conner’s parents rating scale should not be used as a diagnostic tool,
unless administered by a trained psychologist. However, it is acceptable for a
trained researcher to administer the form as a research tool (Conner’s, 2004 p8-
9).
Review of the literature indicated that the other proposed psychological outcome
measures; the Cambridge Neuropsychological Test Battery (CANTAB) and
Attention Network Test (ANT) revealed that there was no reliability data for in
our proposed age group, therefore the following chapter describes the CANTAB
and ANT and test retest reliability data collected by the thesis author.

135
Chapter 5. Reliability of psychological outcome measures
This chapter describes psychological outcome measures where no reliability data
existed in our proposed age group.

136
Contributions:
Selection of outcome measures and study design were carried out by the thesis
author in collaboration with expert psychologists Mr James Boyle and Dr Philip
Tomporowski, under the supervision of Professor JJ Reilly.
Collection of all data was carried out by the thesis author, with assistance from
Ms Catriona Pearson (collecting children from class, helping with carrying/
setting up equipment).
All data management and statistical analysis was carried out by the thesis author
under the supervision of Professor John Reilly and with advice from
collaborators; Mr James Boyle, Dr Philip Tomporowski, Dr James Paton,
Professor John McColl.

137
5.1 Test retest reliability of the Cambridge Neuropsychological
Test Battery (CANTAB)
5.1.1 Introduction
The Cambridge Neuropsychological Test Battery (CANTAB) (www.cantab.com)
is a computerised neuropsychological assessment battery consisting of 19
computerised tasks. The test battery is designed to focus mainly on the
measurement of the frontal & temporal lobes of the brain (Luciana & Nelson,
2002). CANTAB was originally designed to investigate impairment in executive
functions associated with ageing (Hughes & Graham, 2002; Fray et al., 1996),
particularly in adult clinical disorders (Robbins et al., 1994). However, there are
features of the CANTAB that potentially make it attractive for research in
children. All task stimuli in the CANTAB are non verbal, and consist of simple
shapes and colours. Completing the tests requires no verbal responses and no
reading ability, making it suitable for use even in young children. Furthermore,
the graded nature of the CANTAB tasks reduces the likelihood of a ceiling
effect. The CANTAB test is administered using a touch-screen and laptop,
enabling standardised objective measurement, and each test has a standard script.
Studies support the validity and use of neuropsychological assessment by
CANTAB in adults (Rahman et al.,1999; Elliott et al., 1997; Fowler et al.,1997;
Owen et al, 1997; Lange et al., 1992) and more recently, the CANTAB system
has been used in paediatric populations (Luciana & Nelson, 2003). Several
studies have shown that CANTAB is sensitive to executive dysfunction (autism

138
and attention deficity hyperactivity disorder) in children (Hughes & Graham,
2002; Hughes et al. 1994) and can detect age-related improvements in executive
function (Luciana & Nelson, 1998). However, there is little published data on the
use of CANTAB in normally developing children at present.
Luciana & Nelson (1998, 2003) were the first to assess the feasibility of using
CANTAB in a large normative paediatric sample. These authors assessed the age
limits of the assessment, and whether it could be administered to normally
developing children from 4-12 year old children, without having to adapt the
adult version of CANTAB (Luciana, et al., 2003). The authors found that 4 year
old children had difficulty comprehending test instructions, were intimidated by
and / or had difficulty using the touch screen technology, and lacked motivation
to complete tasks in as many as 50% of cases (Luciana & Nelson, 2003).
However, performance in 5 year olds was markedly better, and in 6-8 year olds
was akin to testing young adults. (Luciana & Nelson, 2003).
Luciana (2003) also highlights the importance of establishing test-retest
reliability data for CANTAB in children. At present, to our knowledge, test-retest
data do not exist. The primary purpose of the current study was therefore to
gather data on the test-retest reliability of the CANTAB in 6 year old children.

139
5.1.2 Participants & methods
Participants were 6 year old children recruited from volunteering Glasgow City
Council primary schools, recruited as part of the LEAPFROG (Learning,
Exercise and Activity a Pilot: Furthering Research Through Organised Games)
pilot randomised controlled trial. Children were recruited by issuing letters and
consent forms to all eligible children (attending primary 2 of mainstream
schools). Informed, written consent was given from all parents of child
participants. Verbal assent and an initialled consent form was provided by all
children. Ethical approval for the study was given by the NHS Central Office for
Research (COREC). Glasgow City Council also approved the study.
CANTAB test administration
The test was administered in the child’s school in an available quiet area (empty
classroom, medical room). The administration script was followed for each test
used as per CANTAB manufacturers recommendation. The test was administered
using a laptop computer and portable USB touch screen. Both instruments had
the full system requirements for the administration of CANTAB
(www.cantab.com). The tests were administered a baseline, and after 3 weeks
(retest) in the same location. One child was tested at a time by the same
researcher in every instance (AF). The touchscreen was set to calibrate
automatically every time the system was switched on by a specialist
psychological technitian at Strathclyde University. The children were seated
exactly 53 cm from the screen (measure from ‘nose to screen’).

140
The CANTAB tests used in the present study were the following:
1. Motor screening test (see Figure 5.1) A pink cross appears on a black screen,
and the participant must touch the centre of the cross with the dominant hand.
There are two measurable outcomes of the Motor Screening Test, the Mean
Latency (time taken for the participant to touch the cross) and Mean Error (the
accuracy of the participants pointing – i.e. the distance between centre of cross
and the exact location the screen was touched). This test is used as a screening
test for visual, movement and comprehension problems, and to familiarise the
participant with the touch-screen.
Figure 5. 1 The CANTAB Motor Screening subtest.
2. Spatial Span (SSP) test (see Figure 5.2) is a computerised version of the
Corsi Blocks task (Milner, 1971) that tests Spatial Working Memory capacity
(the number of items that can be held in working memory). The participants must
observe as a pattern of boxes are lit up on the screen, then remember and
replicate the pattern by touching the boxes that lit up, in the correct order. The
test begins with two boxes, and gets progressively harder (to a maximum of

141
nine). If a participant touches the appropriate boxes in the right order, they move on to
the next level of difficulty. After two failed attempts at a level, the test ends.
The three outcomes measured in the Spatial Span Test are Span length –the
longest sequence of coloured squares that can be remembered and copied by the
participant; Total Errors - the number of times an incorrect box is selected; and
Total Usage Errors - the number of times a participant selects a box out of
sequence.
Figure 5.2 The CANTAB Motor Spatial Span Subtest
3. CANTAB test of Spatial Working Memory (SWM) Strategy (see Figure
5.3) assesses working memory & strategy use. A number (from 2 to 9) of red
squares are visible on the screen, and blue tokens are hidden behind them. The
participant must touch a red square to reveal whether there is token behind it and,
if there is ‘drag’ (with finger) the token to fill up a column. The outcome
measures from this test are Between Errors (the number of times a participant
revisits a square where they had previously found a token; calculated with 4 +
tokens only); Within Errors – (the number of times a participant revisits a box
already found to be empty, Double Errors - an error categorised as Between and
Within); and Strategy (whether a strategic search is used; Owen et al., 1990).
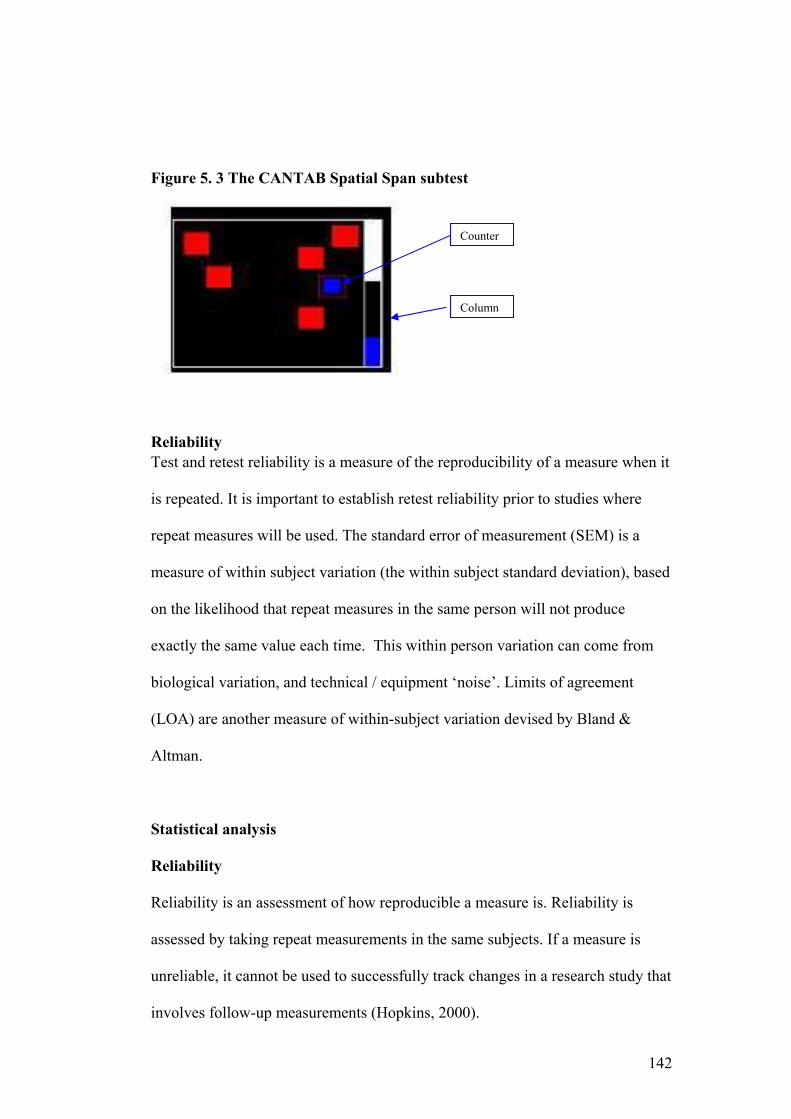
142
Figure 5. 3 The CANTAB Spatial Span subtest
Reliability
Test and retest reliability is a measure of the reproducibility of a measure when it
is repeated. It is important to establish retest reliability prior to studies where
repeat measures will be used. The standard error of measurement (SEM) is a
measure of within subject variation (the within subject standard deviation), based
on the likelihood that repeat measures in the same person will not produce
exactly the same value each time. This within person variation can come from
biological variation, and technical / equipment ‘noise’. Limits of agreement
(LOA) are another measure of within-subject variation devised by Bland &
Altman.
Statistical analysis
Reliability
Reliability is an assessment of how reproducible a measure is. Reliability is
assessed by taking repeat measurements in the same subjects. If a measure is
unreliable, it cannot be used to successfully track changes in a research study that
involves follow-up measurements (Hopkins, 2000).
Counter
Column

143
It is unlikely that repeat measures in the same person will produce exactly the
same value each time. The standard error of measurement (SEM) is the
within-subject variation; the individuals standard deviation. It can also be called
the ‘typical error’. The error can come from biological difference, and / or
equipment ‘noise’ or error (Hopkins, 2000). Another measure of within-subject
variation is the coefficient of variation, which is the standard deviation (SD)
expressed as a percentage of the mean (Hopkins, 2000).
Comparing repeat measures from a number of participants, the difference in
mean from test 1 to test 2 can be calculated for each participant, and the mean of
the differences in mean for the whole sample gives the difference in mean and
SD. This SD divided by the √2 is the SEM. ‘Limits of agreement’ (LOA) can
be calculated by multiplying the SD of the difference in mean by 1.96.
Technically, it can only be certain an observed change is ‘real’ (i.e. isn’t due to
measurement error) if it is greater than the LOA (Hopkins, 2000).
Another way to quantify how reliable a measure is, is to calculate the intraclass
correlation (ICC) coefficient between repeat measures. A correlation of 1
represents perfect agreement between tests, and a correlation of 0 indicates no
agreement. In psychological studies a measure should have a retest correlation
coefficient of at least 0.75 (Coolican, 1994).
In test retest reliability for cognitive measures in children a retest timing of 3
weeks (+/- 1 week) was recommended by our expert educational psychologist

144
(JE Boyle) as this is a short enough period of time for no major developmental
changes to take place, but long enough to minimise potential learning effect (JE
Boyle, personal communication).
Statistical analyses were performed using SPSS software (www.spss.com), and
the reliability spreadsheet www.sportsci.org/resource/stats/ (Hopkins, 2000).
Intraclass correlations (ICC), Coefficient of Variation (COV), Standard Error of
Measurement (SEM) and Limits of Agreement (LOA) between test and 3 week
restest reliability data were computer. Statistical significance was set a p<0.05.
5.1.3 Results
Characteristics of study participants
71 children (mean age 6.2 yrs SD 0.3, 33 boys / 38 girls) were recruited for the
study, 3 children were absent from school on the day of testing so baseline
CANTAB data were collected from 68 children. At retest there were a further 4
children absent, giving available test and re-test data for analyses from 64
children (mean age 6.2 years SD 0.3 29 boys / 33 girls).
Practical utility of the tests
The individual administration times differed from the adult times published in
the CANTAB manual. Overall, our experience was that the tests were quick and
easy to administer, and were enjoyed by and engageing for children. In this age
range, the range of completion times for each test as follows: Motor test 2-3mins;
Spatial Span 3-6 minutes; Spatial Working Memory 10-15 minutes. No child

145
tested refused to complete any of the testing, and the re-test measurement was
met with a positive reaction from all children tested.
Test-retest results
For test retest correlations of CANTAB working memory tests see Table 5. 1.
None of the tests examined fall into the acceptable level of stability (in or above
the range 0.75- 0.80) required for use as a clinical research tool (Coolican,1994;
Sattler, 2001).
Table 5. 1 Reliability of the CANTAB working memory battery in 6 year
olds.
Outcome Mean
1
SD Mean
2
SD ICC SEM CV LOA
SSP Span 4 1 3 1 0.51** 1 20 2
SSP Total Errors
10 4 9 4 -0.1 4 15 12
SSP Usage Errors
3 2 3 2 0.1 2 51 5
SWM Strategy 40 3 39 3 0.03 3 8 8
SWM Within Errors
69 11 70 10 0.59** 7 8 20
SWM Total Errors
70 12 71 11 0.53** 8 10 22
SSP spatial span (number of items that can be held in short term memory), SSP total errors (the number of times an incorrect item is selected), SSP usage errors; the number of times an item is selected out of sequence. SWM spatial working memory; SWM Between Errors - the number of times participant revisits a square where they had previously found a token; Within Errors – the number of times a participant revisits a box already found to be empty, Strategy - whether a strategic search is used. ICC – intraclass correlation; SEM – standard error of measurement; CV – coefficient of variation; LOA – Limits of agreement. **p<0.001 Mean 1 is baseline, Mean 2 is 3 week retest; n=64 mean age 6.2 SD 0.3 years. The outcome measures from this test are).
146
5.1.4 Discussion
There is currently very little data on the feasibility, and no data on the reliability,
of administering CANTAB to the paediatric population. Luciana et al.,(2003),
describe the experience of administering CANTAB with 6 year old children as
“tending to be highly motivated, intrigued by the computerised testing format.”
This was consistent with our experience in the current study: the children were
all familiar with computer equipment, and the introduction of the touch-screen
and bright colours and shapes, engaged their attention and curiosity, making the
test instructions relatively easy to administer.
The test retest data suggest that the scores from the selected tests from the
CANTAB working memory battery used in the current study may not be stable
enough to use as a primary outcome measure for future research intervention
studies on executive function in 6 year old children. However, it should be noted
that the current study examined only tests from the Working Memory Battery (as
data were collected as part of a pilot study for a future randomised controlled
trial).
In their examination of adult CANTAB test retest reliability, Lowe & Rabbit
(1998) found extreme variation in correlations between individual tests in the
CANTAB battery, and indeed within individual outcomes in each test. These,
and the results from the current study, suggest that data from CANTAB should
not be used or interpreted with confidence unless test-retest reliability has been
established in the intended population and age group (Lowe & Rabbit, 1998).

147
Lowe and Rabbit, in their examination of test retest reliability of the CANTAB
and ISPOCD tests in 162 older adults (60-80 years) found that reliability in the
Spatial Span and Spatial working memory tests in CANTAB did not fall into
acceptable range for reliability as a research tool (correlations 0.68 & 0.64
respectively). These authors found, however, that reliability fell into acceptable
levels in tests ‘simpler’ tasks, such as simple choice reaction time, and simpler
search and recognition tasks (Lowe & Rabbit, 1998). It is suggested that tasks
involving executive functions may only work when they are ‘novel’ to the
participant, as a marked learning effect can be seen when an individual discovers
an optimal strategy, but will improve less if no strategy is found, and deteriorate
if a sub-optimal strategy is found (Lowe & Rabbit, 1998). If this is the case, then
this further limits the value of these tests as a research tool. Young children, in an
early stage of cognitive development, tend not to be able to form effective
strategies for problem solving therefore this is a likely contributor to the low
reliability of some of the CANTAB subtests.
Only a minority of children failed to complete the Spatial Span task (i.e. did not
get a score of 2 or more) in the present study, at either at baseline (n= at 3 week
re-test (n=7), or both. For the children who achieved a score in the spatial span
task at baseline, then not at re-test it appears that de-motivation may be an issue,
as it is clear the initial instructions were understood. For children who achieved
no score at baseline, but a relatively high score at follow-up, it is unclear whether
they did not initially comprehend the test instructions, were de-motivated at
baseline, or had a learning effect at follow-up. These are issues that must be

148
evaluated when using CANTAB in children in future. Researchers intending to
use this system with children should be aware of these potential problems.
Limitations
For the present study reliability of tests from the CANTAB working memory
battery were assessed only. The main reason for this was that we were
specifically considering tests of working memory for a planned randomised
controlled intervention trial. There is a need validate all tests from the CANTAB
battery in children.
5.1.5 Conclusions
In the present study, Spatial Span and Spatial Working Memory tests, from the
Cambridge Neuropsychological Test Battery (CANTAB) showed only modest
test-retest reliability. The present study suggests that these tests within the
CANTAB battery are not reliable enough in 6 year old children to be used as a
research tool. The currently study also further highlights the need to gather test
retest reliability data of the intended psychological outcome measures within the
intended population prior to carrying out a full scale RCT.
Computerised neuropsychological testing has great potential as a measure of
executive dysfunction in children. The current study suggests that the CANTAB
is too variable to use as a primary outcome measure in psychological research in
children.

149
5.2 Test retest reliability of the Attention Network Test
5.2.1 Introduction
It has been suggested that attention is divided into three distinct networks (Fan et
al, 2002: Posner & Peterson, 1990). Alerting, which refers to the readiness of an
individual to respond to any type of stimulus. Orienting, a process that refers to
how and to what degree an individual is prepared for a specific stimulus and
executive control, which refers to the process of resolving conflict when two
responses are called for by a stimulus (Posner and Petersen, 1990; Fan et al,
2002). Numerous brain imaging studies support the existence of the alerting,
orienting and executive control networks of attention (Corbetta et al, 2000;
Corbetta & Shulman, 2002: Fan et al, 2003: Pardo et al, 1991; Posner &
Petersen, 1990).
The Attentional Network Test (ANT) is an experimental paradigm designed to
examine the three attentional networks (Fan et al, 2002). The ANT is a
computerised test based on the Eriksen Flanker Task (Eriksen & Eriksen, 1974)
providing reaction time (RT) and accuracy scores to congruent, incongruent and
neutral flankers and incorporating cues (no cue, centre, double and spatial) to
vary alertness and orienting (Fan et al, 2002, Reuda et al, 2004). Reaction times
for networks of attention can be calculated by subtracting relevant cues and
flankers: Alerting RT for No Cue – RT for Double Cue, Orienting: RT for
Central Cue – RT for Spatial Cue, Conflict: RT for Incongruent – RT for
Congruent trials (Reuda et al, 2004).
The ANT has promise for research in children, as a specific child version has
been developed (using coloured fish as flankers), the test is simple, free to
150
download from the test authors (www.sacklerinstitute.org/users/jin.fan/),
inexpensive to run (approximately £450 ($900) for an E-Prime software licence
(www.pstnet.com)) and fairly quick to administer (approximately 30 minutes).
The ANT requires little verbal ability and little interaction with the test
administrator, and has been used to demonstrate the existence of the attentional
networks in previous studies involving even young children (Reuda et al, 2003;
Reuda et al, 2005). The ANT can be administered by any trained researcher.
In previous studies, the ANT has been shown to be sensitive to disorders of
cognition such as schizophrenia (Wang et al, 2005; Neuhaus et al, 2006) and
depression (Gruber at al, 2007). Changes in reaction time and accuracy scores of
the ANT have been shown to progress through age groups in adults and in
children (Reuda et al, 2004). The ANT shows relatively high immediate test and
retest reliability in adults (Fan e al 2002). Prior to using the ANT as a
psychological research tool in children, it is important for test retest reliability
data to be collected in the intended age group.
The aim of this study was therefore to determine the test-test reliability of the
Attention Network Test in 6 year old children.
5.2.2 Participants and methods
Participants were 6 year old children involved in the LEAPFROG study
(Learning, Exercise & Activity a Pilot: Furthering Research through Organised
Games), who were recruited by sending recruitment information to all children in
primary 2 of volunteering primary schools from the City of Glasgow, Scotland.

151
Children were eligible for inclusion in the study if they had no diagnosed
disorder of cognitive or motor function. The study was approved by Central
Office for Research Ethics Committee (COREC). Informed written consent was
given by all parents of and child participants.
Test administration
The administration of the child ANT was followed as described by the test
authors (Rueda et al., 2004). The test was administered in the child’s school in an
available quiet area (empty classroom, medical room). The test was administered
using a DELL laptop and run on E-Prime Software (www.psnet.com). Two
children were tested at a time and by the same administrator in every instance
(AF). The children were seated approximately 53 cm away from the computer
screen (measured using a tape measure from ‘nose to screen’, with the dominant
hand resting on the mouse.
The ANT involved 4 blocks, each approximately 5 minutes long. The first block
was a practice trial to ensure no visual or comprehension problems, so data were
not included in analysis. There are 3 experimental blocks of 48 trials, each
representing one of 12 potential conditions (congruent, incongruent and neutral)
x (no cue, central cue, double cue, and spatial ‘down or up’ cue) (see Figure 5.4)
The child must determine whether the flanker (fish) is pointing left or right, and
click the corresponding mouse button. Reaction time (ms) following onset of the
stimulus and accuracy (whether correct button selected) are recorded. Picture
cards demonstrating a right pointing and left pointing fish (neutral condition),
152
were used prior to the practice trial to ensure that children understood the
instructions.
Statistical analysis
See reliability description in Section 5.1.
Statistical analyses were performed using SPSS software (www.spss.com), and
the reliability spreadsheet www.sportsci.org/resource/stats/ (Hopkins, 2000).
Intraclass correlations (ICC), Coefficient of Variation (COV), Standard Error of
Measurement (SEM) and Limits of Agreement (LOA) between test and 3 week
restest reliability data were computer. Statistical significance was set a p<0.05.

153
Figure 5. 4 Schematic representation of the Warning Types, Cue, Flankers and Stimuli in the Child Attention Network Test (ANT)
+
+ * +
*
*
+
*
No Centre Double Spatial
Congruent Stimulus
Incongruent Stimulus
Neutral Stimulus
Warning Types
Cues
Flankers

154
The children were told that they had to ‘feed hungry fish’ by pressing the mouse
button that matched the way the fish was pointing (as described by Reuda et al,
2004).
5.2.3 Results
Characteristics of Study Participants and Practical Utility of the Test
We recruited 71 children for the study. 3 children refused to complete all blocks
of the test at either baseline or retest, 4 were absent from school at either baseline
or retest, and data were excluded from 2 as median reaction times were <200ms:
these responses were thought to be ‘anticipatory’. Data were available from 62
children at baseline and retest, mean age 6.2 SD 0.3 years (44% boys, 56% girls:
6.6% Left handed). The test took around 30 minutes to complete.
Test -retest reliability of the ANT
Correlations between test and retest reliability for flanker and warning types and
for alerting, orienting and executive control were uniformly low (see Appendix
III), therefore analyses were carried out on a composite reaction time and
accuracy scores. Composite reaction time test and retest reliability coefficients
were also relatively low, although statistically significant. Reliability data are
presented in Table 5. 1.

155
Table 5. 2 Reliability data from the Attention Network Test (ANT) in 6 year olds Outcome Mean 1 SD Mean 2 SD ICC SEM CV LOA
RT (ms) 960 138 856 123 0.35* 104 17 297
ACC 104 28 105 28 0.60** 18 84 52
RT - reaction time to stimulus in milliseconds (mean of median), stimulus is a fish appearing on screen (mouse button is pressed); ACC accuracy – total correct from 144 a ‘correct’ response is when the mouse button pressed corresponds with the direction the ‘flanker’ (fish) is pointing in; ICC – intraclass correlation SEM – standard error of measurement; CV – coefficient of variation; LOA – Limits of agreement. Participants were n=62 children taking part in the LEAPFROG pilot study. *p<0.05 **p<0.001 Mean 1 is baseline, Mean 2 is 3 week retest.
5.2.4 Discussion
Though test-retest correlations were statistically significant, the present study
found that test-retest reliability of the ANT in the current sample and setting was
relatively low. Our findings indicate that the ANT is unlikely to be sufficiently
reliable in 6-7 year olds to serve as an appropriate outcome measure indicative of
effects of biological significance in future intervention studies, unless the
intervention to be tested in the trial yields large effects. However, the ANT may
still have use as a moderator in a regression analyses.
In adults, the ANT showed relatively high immediate test and re-test reliability
scores (Fan et al., 2002). At present no data exists (to our knowledge) on how
reliable the test is in adults over time.
Although the ANT took a similar length of time to administer in children as for
adults (30 minutes), it may have been fairly difficult for 6 year old children to
maintain interest for this length of time, as the test itself is fairly repetitive.
Indeed 3 children refused to complete the full test either at baseline or a 3 week
retest as they indicated to the researcher that they were ‘bored.’
In our experience children had to be watched very closely during the ANT in
order to ensure they were not simply pressing the mouse button randomly, and
were paying attention to the screen at all times, and there was a tendency for
children to become distracted during the test. These methodological problems are
likely to be related to the age of the children tested in the present study.
Anticipatory responses (i.e. pressing the mouse button randomly in anticipation

157
of the stimulus) were evident in the data (reaction time <200ms), but only in 2
children on one occasion each and these data were excluded as noted above.
Test and retest correlation coefficients were low when individual flankers and
warnings were examined, and when subtractions were carried out to examine
networks of attention (Appendix III). Therefore, composite reaction times and
accuracy were used. None of the baseline and re-test correlations for individual
flanker and warning types fell within the range deemed appropriate for use as a
psychological research tool (Coolican, 1994). In light of the fact that the adult
(Etnier et al., 1997; Colcombe and Cramer, 2003) and child (Sibley and Etnier,
2003) meta-analyses examining the effects of exercise on cognitive function find
a fairly consistent significant effect size of less that 0.5, the Attention Network
Test is arguably not a suitable primary outcome measure for future intervention
requiring repeat measures in this age group.
5.2.5 Conclusions
We hoped in a future trial, to examine the effects of aerobic exercise on
executive control specifically as previous data suggest that aerobic exercise
(Colcombe et al., 2004 b) or, cross-sectionally, fitness (Hillman et al., 2005) may
differentially influence the attentional networks. So the Attention Network Test
was originally selected as a candidate outcome measure for this reason.
However, the current study suggests that the ANT is not be reliable enough to
used as a primary outcome measure in this way in 6-7 year old children.

158
Chapter 6. Chronic Effect of Aerobic Exercise on Executive
Function: A Pilot Study

159
Contributions:
Some data in the present study could not be collected by the author; the
Cognitive Assessment System (CAS) data were collected by Miss Elaine Beck
and Miss Katy Brady, as the CAS must be administered by a trained
psychologist. The psychologists were blinded to the nature of the study, and the
allocation of the schools.
Design and implementation of the Intervention and Control PE sessions,
Glasgow City Council was carried out by Glasgow City Council Primary PE
specialists under Mrs Christine Watson (Head of Primary PE) in collaboration
with thesis author (A Fisher) and Professor John Reilly.
Collection of habitual physical activity data, Attention Network Test and
CANTAB – thesis author, with assistance from Miss Catriona Pearson.
Collection of data of intensity of intervention and control PE sessions was carried
out by Miss Catriona Pearson under the supervision of the thesis author.
Downloading, reducing and analysing this data was carried out by the thesis
author.
Study design, data management and statistical analysis thesis author under the
supervision of Professor John Reilly and with support from collaborators; Mr
James Boyle, Dr Philip Tomporowski, Dr James Paton, Dr John McColl, and
advice from Dr David Young.

160
6.1 Introduction
Regular physical activity improves brain health (Dishman et al., 2003), as noted
in chapter 1. Exercise can improve depressive symptoms (Pertruzzello et al,
1991; Peluso Mam et al., 2005) quality of sleep (Elavsky & McAuley, 2007;
Youngsted, 2005), and cognitive function in older adults (Colcombe & Kramer,
2003) and in children (Sibley & Etnier, 2003: Tomporowski, 2003).
There is substantial animal evidence to suggest that an enriched environment and
/ or increases in physical activity can enhance brain structure and function
(Cotman & Berchtold, 2002; van Pragg, 2000; Young et al., 1999; Kempermann
et al., 1997; Escorihuela et al., 1995). Evidence from animal data also suggests
that voluntary exercise alone (such as wheel running and treadmill training) has
similar effects on the rodent brain as environmental enrichment, such as
enhanced learning and memory (van Pragg et al., 1999; 2000). In exercise studies
comparing sedentary and active animals, the more marked differences were seen
in more challenging cognitive tasks (van Pragg et al., 2000). Animal studies also
indicate that aerobic exercise (such as wheel running in rats) can increase
expression of the genes that encode brain growth factors, and thereby the
expression of these growth factors, such as brain derived neurotrophic factors
(BDNF) (Cotman & Engesser-Cesar, 2002; Dishman et al., 2006) which has
emerged as a mediator of the efficiency of the brain synapses, neuronal
connectivity, and use-dependent brain plasticity (Cotman & Berchtold, 2002) –
key aspects in cognitive functions such as the formation of new memories, as
noted in chapter 1. There is also evidence to suggest aerobic exercise can elevate

161
neurotransmitter levels, and increase neurogenesis in the dentate gyrus of the
rodent hippocampus (van Pragg et al., 2000; Dishman et al., 2006).
In recent human research, functional magnetic resonance imaging (fMRI) studies
in older adults have suggested that cardiovascular fitness (Colcombe et al., 2004)
can alter the activity of areas of the brain associated with attentional control
(Colcombe et al. 2004: Colcombe & Kramer, 2003) and mediate age-related
brain tissue loss (Colcombe et al. 2003). There is also some evidence that regular
physical activity may maintain life-long brain health, and reduce incidence of
age-related Alzheimer’s disease (Laurin et al., 2001), and have neuroprotective
effects, reducing incidence of neurodegenerative diseases such as Parkinson’s
disease (Smeyne et al., 2004: Thacker et al., 2007).
The mechanism(s) by which exercise impacts cognitive function in humans are
unclear at present as described in chapter 1, but meta-analyses and well
controlled studies in older adults point to the positive effects of aerobic exercise
appear to impacting tasks involving executive control most strongly (Colcombe
& Kramer, 2003). The selective effects of exercise on aspects of executive
control have been demonstrated in well designed RCT’s in both older adults
(Kramer et al., 1999; Colcombe et al., 2004) and now in overweight children
(Davis et al., 2007).
In a recent survey of 1200 parents and teachers in the USA, (www.rwjf.org) it
was suggested that around 90% of participants surveyed believe that children
who are physically active learn and behave better in the classroom

162
(www.rwjf.org). Despite this, there has been very little research examining the
relationship between physical activity and cognition in children (Burdette &
Whittaker, 2005). Less than 1 % of all existing studies examining the relationship
between physical activity and cognition with a true experimental design involve
child participants (Etnier et al, 2007).
A cross-sectional electroenecephelogram (EEG) study in 51 high and low fit (as
measured by the Fitnessgram) participants in Illinois, USA, suggests that higher
fit children have faster neurocognitive processing, and recruit more neurons for
attentional and working memory tasks that lower fit children (Hillman et al,
2005). Castelli et al. (2007) demonstrated a positive relationship (cross-
sectionally) between fitness and academic grades (Castelli et al., (2007). A
recent RCT in overweight children in Georgia, USA indicated that enhanced
aerobic exercise improved performance on the Planning scale of the Cognitive
Assessment System (CAS), a measure of executive function (Davis et al., 2007)
(these studies are described in detail in Chapter 1).
There is a suggestion that any benefit of physical activity may be greater in
younger children, in an early stage of brain development, with a higher degree of
neural plasticity (Gabbard, 2004: Diamond, 2000). Any benefit of physical
activity on cognitive function, and therefore school performance, would logically
be more beneficial if implemented as early in life as possible. To our knowledge,
however, there have been no studies examining the effect of a physical activity
intervention on cognitive function in children under the age of 7 years.

163
The aim of the current pilot study was to examine the effect of increasing aerobic
school–time physical education on executive functioning and behaviour in 6 year
old children. The study was a pilot for a future full-scale RCT and so emphasis
was placed on an assessment of the feasibility of the intervention and of the
outcome measures.
6.2. Participants and methods
Participants were recruited from 6 volunteering primary schools in the City of
Glasgow, Scotland. Recruitment packs were issued to all primary 2 classes of
participating schools. Children were eligible for inclusion in the study if they had
no known diagnosed disorder of cognition, and no condition affecting their
ability to participate in a physical activity programme.
The study was approved by the Central Office of Research Ethics (COREC) and
approved by Glasgow City Council. Informed written consent was provided by
all parents of, and child, participants. The study was registered as a randomised
controlled trial number ISRCTN70853932.
Schools were randomised, by a statistician independent of the study (Dr David
Young, Yorkhill Hospital), to receive either the Intervention or Control condition
for 10 weeks (September to December 2006).
The Intervention consisted of a series of specialist devised aerobic games, based
around the aerobic components of the ‘Basic Moves’ programme (Jess et al.,

164
2004), which a programme that already exists within the primary school
curriculum.. The programme was adapted by Glasgow City Council primary PE
specialists to include only the ‘travelling movement’ component.. The travelling
movements are run, gallop, fast side step, skip (Jess et al., 2004 pp 25) and the
PE specialists utilised these components, and included them in games that they
deemed suitable for 6 year olds. The PE specialists were asked to make the
sessions ‘as physically active’as possible (in our terms spending as much time
‘moving’; in moderate and vigorous physical activity (MVPA) assessed by the
Actigraph accelerometer. In children the accelerometer cut point for MVPA
corresponds to heart rate of >140 (Puhl et al. 1990). The PE specialists and
teachers were also advised to ‘minimise instruction time’, and ‘minimise / avoid
any time children were queuing for equipment, or standing around’. Two hour-
long sessions were given per week; one delivered by a PE specialist, and one
session by a trained teacher (the class teacher). Activity data was collected from
PE sessions. The aim was for the children to spend at least 50% of the hour in
MVPA. In practice, however, this proved difficult to achieve.
The Control schools received the standard curriculum, which between the
September and December terms consists largely of movement skill development
(e.g. object control – throwing and catching a ball, balance, gymnastics). In an
attempt to examine the effect of increased aerobic activity only, and control for
any improvement in psychological outcome measures by simply intervening
(Hawthorn effect) physical education time was increased to two hours per week
also, one specialist delivered, and one trained teacher session. Parents were fully
informed that the study was a pilot aiming to see whether exercise with a
165
specialist in increased school physical education time could influence learning
and behaviour, but not which group were expected to see the greater change (i.e.
aerobic or non-aerobic), to avoid any bias in parental ratings of behaviour.
Psychological Outcome Measures
The Cognitive Assessment System (CAS) was administered by a trained
psychologist blinded to the allocation of the schools, once at baseline and once at
12 week follow-up. The CAS has high reliability and validity in 6 year old
children, with test retest reliability coefficients for 96 5-7 year olds falling
between 0.95-0.96 (Das & Naglieri). The Attention Network Test and
Cambridge Neuropsychological Test Battery (CANTAB) working memory
battery were administered to the children once at baseline, once at 3 week re-test
(data presented elsewhere- Chapter 4), and once at 10 week follow-up by the
same trained researcher in all instances (the author). As a secondary outcome,
parental rating of behaviour was assessed using the Connors Parents Rating
scale: short-form (CPRS:S) (Conners, 2001) discussed in chapter 4.
Physical Activity
We measured physical activity both habitually (6/7 day record) and during
randomly selected Intervention and Control PE sessions, using the Actigraph
GTM1 accelerometer (www.theactigraph.com). As described in chapter 2 the
Actigraph is a small, uniaxial accelerometer that measures physical activity on
the vertical plane. Validity of the Actigraph in children (Janz et al, 1994; Trost et
al, 1998; Eston et al, 1998; Jackson et al, 2003; Kelly et al, 2004) has been
demonstrated against criterion methods of doubly-labelled water and direct

166
observation. Published, validated paediatric cut points exist for the Actigraph to
quantify sedentary behaviour (Reilly et al, 2003), light and moderate-and-
vigorous physical activity (MVPA) (Puyau et al, 2002). The Actigraph was
placed on the right hip, under clothing (Jackson et al, 2003; Fairweather et al,
1999; Reilly et al, 2004).
Statistical Analysis
Analysis was carried out on Minitab software (www.minitab.com). All data were
checked for normal distribution using graphical summary of data, skewness,
descriptive statistics, and test of normality. For initial basic between group
comparisons, t tests (or Mann Whitney Tests where appropriate) were carried out
on the change (follow up score minus baseline score) over time. A General
Linear Model was carried out on all psychological outcome measures with the
follow up score as the Response variable, Group (Intervention or Control), socio-
economic status (SES), Gender, School(with nested Group) as Factors and Age
and Baseline score on the psychological outcome measure as Covariates.
The study was a pilot study aimed, in part, at gathering data to adequately power
a full scale RCT, so as such was not powered, but based on the advice of our
statistician (J McColl) 6-8 primary schools would allow to control for clustering
and the advice of our psychologists (JE Boyle and P Tomporowski) an sample of
around 60 was aimed for. Based on practical considerations, the aim was to
recruit 10-15 children from each primary school.

167
The general linear model in more detail
The General Linear Model is a statistical analysis that is midway between
analysis of variance and regression. The main purpose of the General Linear
Model is to increase the precision of comparisons between groups by accounting
for variation in important variables, or adjust comparisons between groups. The
Response is the variable of interest (for example, change in CAS scores from
baseline to follow up), and the other variables are entered into the Model.
Continuous variables (e.g. age) are entered as covariates.
6.2 Results
Baseline descriptive data
For a CONSORT (www.consort-statement.org) flow diagram of the LEAPFROG
study see figure 6.3
We recruited 64 children from 6 participating primary schools mean age 6.1
years SD 0.3. Participant baseline characteristics are shown in Table 6.1. There
were no significant differences in any baseline anthropometric characteristics
between Intervention and Control children (p >0.05).

168
Table 6. 1 Baseline characteristics for LEAPFROG participants
Whole sample (n=64) SD
Intervention (n=34) SD
Control (n=30) SD
Mean age (years) 6.1 0.3 6.1 0.3 6.2 0.3 Mean BMI (kg/m
2)
16.4 1.7 16.2 1.7 16.7 2.6 Mean BMI SDS 0.4 1.2 0.3 1.0 0.5 1.4 % Overweight (BMI >89th centile) 24 24 24 % Obese (BMI >95th centile) 10 10 10 % boys 45 47 42 % Left handed 9 12 8 Mean birth weight (g) 3158 648 3205 738 3100 495
Median SES †
6 1 6 1 7 1 † Deprivation category score based on postcode McLoone et al. (2005)
BMI SDS (Body mass index standard deviation score) was calculated using the LMS method (1990 UK
reference data) (Cole et al., 1995)

169
Results: Figure 6. 1 CONSORT Flow Diagram for LEAPFROG
study
Recruitment packs issued to (n=185)
Excluded (n= 0)
Analysed: CAS (n=31) CPRS:S (n=15) PA: (n=33) ANT: (n=29: 2 refusal to complete full task: 1 data excluded as median RT <200ms) CANTAB:
Lost to follow-up (n= 3) Reasons: Changed schools (n=2) Absent from school (n=1)
Allocated to intervention (n= 34)
Received allocated intervention (n= 34)
Did not receive allocated intervention
(n= 0)
Lost to follow-up (n= 2) Reasons: Absence from school
Allocated to Control (n=30)
Received allocated intervention (n= 30)
Did not receive allocated intervention
(n=1) Reasons: withdrew from study as moved back to lower grade class.
Analysed: CAS (n=26) CPRS:S (n=12) PA (n=25) ANT: (n=25: 1 data failed to save properly; 1 child had eye-patch and couldn’t see screen properly)
Allocation
Analysis
Follow-Up
Enrolment (n=64)
Randomised
Consent n=64 No response n=121

170
Habitual physical activity and intensity of the physical education
intervention
Physical activity data were available for analysis for n=58 children, from an
attempted 62. Limited number of accelerometers prevented us from attempting to
collect habitual data in all 64 children. Two children were absent from school, 1
accelerometer was lost and 1 data from 1 child was excluded as monitor was only
worn for 2 days based on our exclusion criteria; at least 3 days of measurement
with at least 9 hours of data (Penpraze et al., 2006).
Physical activity data are presented in Table 6.2. Means, standard deviations,
medians and inter quartile ranges are presented, as some data were skewed.
There were no significant differences in 6/7 day habitual physical activity
between Intervention and Control groups at baseline (p<0.05) so habitual activity
data were combined for presentation in table.
Total physical activity (mean accelerometer counts per minute: cpm) was
significantly higher in Intervention than Control physical education (PE) sessions
(median difference 628 cpm 95% CI 460, 786 p= <0.0001). Total physical
activity in both Intervention and Control PE sessions were significantly higher
than for habitual physical activity (p=<0.001). Percentage time spent in light
intensity physical activity (above 1100 cpm, but less than 3200; Reilly et al.,
2003; Puyau et al, 2002) was significantly higher in Intervention (36%) than
Control (30%) PE sessions (mean difference 6 %, 95% CI 2, 11 p= <0.009).
Time spent in light intensity physical activity in both Intervention and Control
PE was significantly higher than habitual physical activity (p<0.0001).

171
Percentage time spent in moderate and vigorous intensity physical activity
(MVPA) was significantly higher in Intervention (20 %) than Control (9 %) PE
sessions (median difference 9 %, 95% CI 5, 13 p= <0.0001). Time spent inactive
<1100 (Reilly et al, 2004) was significantly lower in Intervention PE sessions (44
%) than Control PE sessions (61 %) or during Habitual physical activity (78 %).

Table 6. 2 Habitual physical activity and physical activity intensity during intervention and control physical education (PE)
sessions
Habitual
n=58
Intervention PE Sessions
n=33
Control PE Sessions
n=25
Mean SD Median IQ range Mean SD Median IQ Range Mean SD Median IQ Range
Total physical activity (accelerometer cpm) 715 169 691 602, 799 1973 493 1801 1618, 2173 1280 305 1158 1057, 1501 % of monitored Time spent Inactive ( <1100 cpm) 77 11 78 74, 81 43 12 44 36, 49 58 9 61 52, 65 % of monitored Time spent in Light intensity activity (1100 to 3200 cpm) 19 4 19 16, 22 36 10 36 30, 41 30 8 30 25, 35 % of monitored time spent in MVPA (>3200 cpm) 3 2 3 1.8, 5 21 8 20 14, 27 12 7 9 7, 15
Data are from waist-worn Actigraph GT1M accelerometer. Total physical activity: mean accelerometer counts per minute; MVPA moderate and vigorous physical activity. Inactive cut point <1100 cpm (counts per minute) from Reilly et al. (2003); Light and MVPA cut points from Puyau et al. (2002). Data are from n=58 children mean age 6.1 SD 0.3 years.

Effects of intervention versus control
Cognitive Assessment System (CAS)
Scores from the CAS are presented in Table 6.3. There were no significant
differences in the changes in scores from baseline to follow up between the
intervention and control group by 2 sample t test (see Table 6.4 for 2 sample t
test results). A general linear model to examine any effect of ‘Group’
(intervention or control) on difference in Planning scores (baseline minus follow
up) and including gender, SES and school (for clustering) as potential covariates
indicated no effect of Group on changes in CAS Planning scores (p 0.38), Full
scale (p=0.78) see Table 6.5 or any of the other CAS subscales (Attention p =
0.75; Simultaneous p = 0.91; Successive p=0.85). There was a significant effect
of school on change in Planning scale only (p 0.001) i.e. the school attended
appeared to have an effect on how much scores on the Planning scale changed
over time, but this was not related to Group allocation (see Table 6.5). BMI SD
scores were not included in the model as the degrees of freedom for error were
negative and Minitab would not allow the calculation, but BMI SD score was not
significantly correlated with Planning Score; correlation coefficient = 0.071 p =
0.636. See Figure 6.4. BMI was not significantly correlated with any of the
baseline or follow up scales of the CAS (p >0.05).

Table 6. 3 Scores from the Cognitive Assessment System (CAS)
Intervention
Baseline Intervention Follow up Control Baseline Control Follow-up
Mean SD Mean SD Mean SD Mean SD
Planning 106 17 113 17 118† 11 125† 10
Attention 103 13 106 10 108 15 110 14
Simultaneous 99 13 104 12 106 17 106 15
Successive 103 12 108 16 102 16 105 21
Full Scale 104 14 110 9 113 15 116 13 † Significantly higher than Intervention group by 2 sample t test (p <0.05) ; CAS was performed in schools by trained psychologists at baseline, then after 10 week enhanced physical education intervention. Sample were n=school children mean age 6.1 SD 0.3 years.
Table 6. 4 Change in scores of from Cognitive Assessment System (CAS) in Intervention and Control groups
Intervention
Control
Mean† SD Mean
† SD Mean difference 95% CI p-value
Planning 7 21 7 14 -0.1 -10,10 0.985
Attention 3 14 3 14 -0.7 - 9, 7 0.861
Simultaneous 4 15 0 16 -4.4 - 14, 5 0.334
Successive 3 14 3 14 -1.5 - 10, 6 0.709
Full Scale 6 10 5 8 -1.7 - 7, 4 0.516
† data are mean changes in scores. Data are from 2 sample t tests comparing change in mean between intervention and control groups Sample were n=school children mean age 6.2 SD 0.3 years. Statistical significance was set at p<0.05.
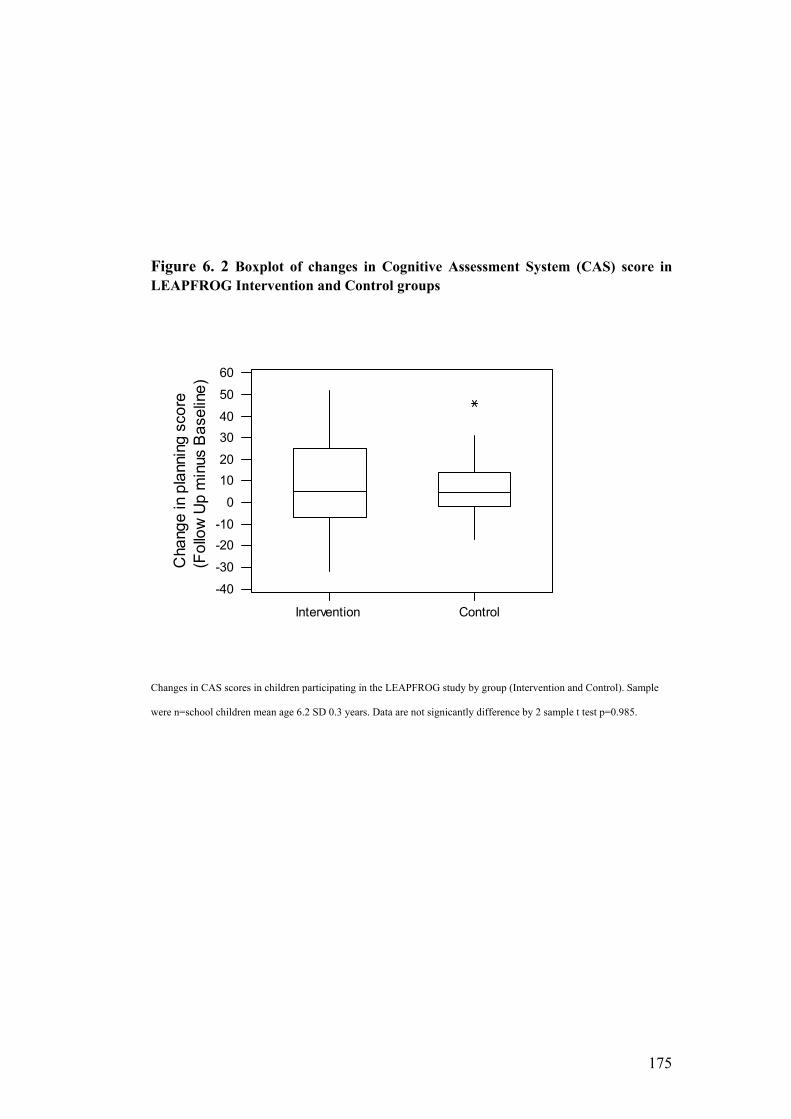
175
Figure 6. 2 Boxplot of changes in Cognitive Assessment System (CAS) score in
LEAPFROG Intervention and Control groups
Intervention Control
-40
-30
-20
-10
0
10
20
30
40
50
60
Change in planning score
(Follow Up minus Baseline)
Changes in CAS scores in children participating in the LEAPFROG study by group (Intervention and Control). Sample
were n=school children mean age 6.2 SD 0.3 years. Data are not signicantly difference by 2 sample t test p=0.985.

176
Figure 6. 3 Boxplot of changes in Cognitive Assessment System (CAS) score
I C I I C C
-40
-30
-20
-10
0
10
20
30
40
50
60
School Allocation; I Intervention C Control
Change in Planning score
Fig 6.3. Change in Cognitive Assessment System Planning score from baseline and after 10 week intervention or control in n=58 children mean age 6.1 SD 0.3 years in schools participating in the LEAPFROG study; I – intervention C- control .
Figure 6. 4 Scatterplot of Cognitive Assessment System and BMI SDS
-2 -1 0 1 2 3 4
-40
-30
-20
-10
0
10
20
30
40
50
60
BMI SDS
Change in Planning score
Fig 6.4 Scatterplot of BMI SDS calculated relative to 1990 UK reference data and CAS in n=58 n=58 children mean age 6.1 SD 0.3 years in schools participating in the LEAPFROG study.

177
Attention Network Test (ANT)
There were no significant differences in change in ANT reaction time scores by 2
sample t test (Intervention mean change -118 ms SD 121sm vs Control -107ms
SD 175ms; estimate for difference -11.1ms, 95% CI 86, 108ms) p=0.816 see
Figure 6.5. Change in reaction time data is negative, as reaction time was
generally faster at follow up in both groups. A general linear model indicated that
there was no effect of ‘Group’ on change in reaction time (see Table 6.5) but a
significant effect of gender on reaction time at follow up (p=0.04) with boys
having significantly fast reaction times than girls, data not presented. There was a
significant difference in change in ANT Accuracy scores by 2 sample t test. With
the Intervention group showing a significantly greater increase in ANT Accuracy
scores than the Control (Intervention mean increase 18 SD 24 vs Control mean
increase 2 SD 18; Estimate for difference 16, 95% CI 3, 29) p=0.02. See Figure
6.8. In the general linear model a trend remained for the change in Accuracy
between groups (adjusted mean difference 13 p 0.063) (see Table 6.6).
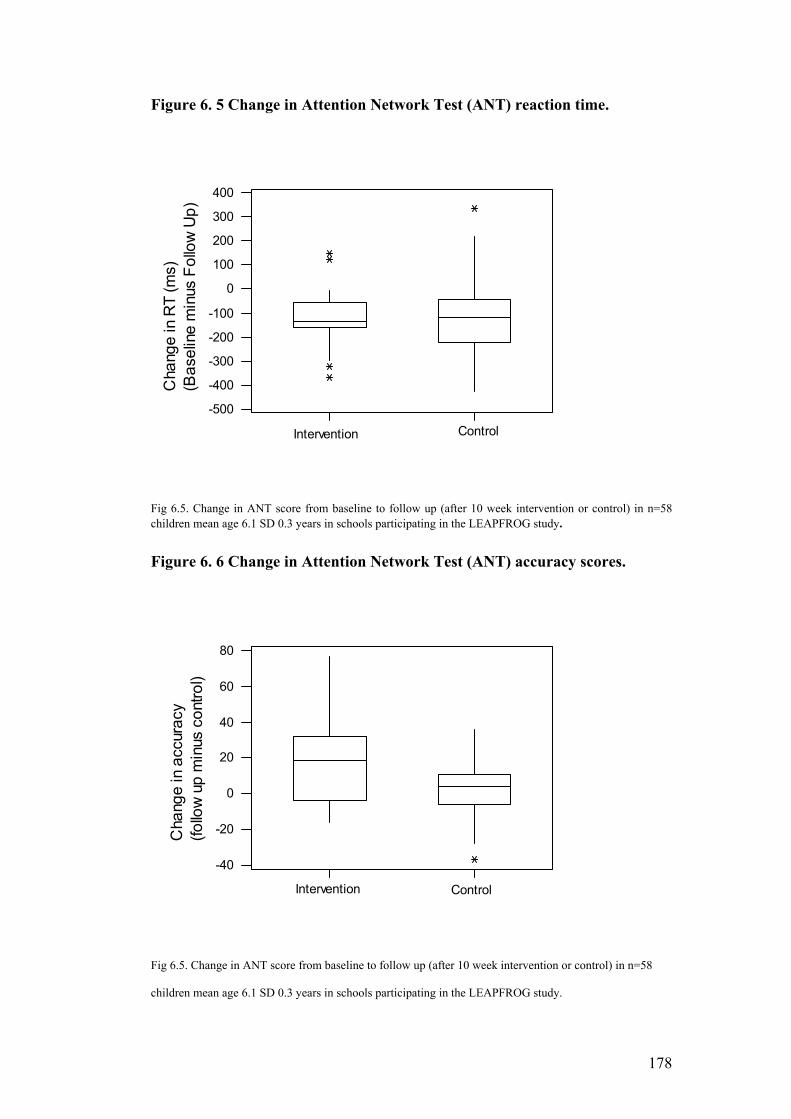
178
Figure 6. 5 Change in Attention Network Test (ANT) reaction time.
Intervention Control
-500
-400
-300
-200
-100
0
100
200
300
400
Change in RT (ms)
(Baseline minus Follow Up)
Fig 6.5. Change in ANT score from baseline to follow up (after 10 week intervention or control) in n=58 children mean age 6.1 SD 0.3 years in schools participating in the LEAPFROG study.
Figure 6. 6 Change in Attention Network Test (ANT) accuracy scores.
Intervention Control
-40
-20
0
20
40
60
80
Change in accuracy
(follow up minus control)
Fig 6.5. Change in ANT score from baseline to follow up (after 10 week intervention or control) in n=58
children mean age 6.1 SD 0.3 years in schools participating in the LEAPFROG study.

179
Cambridge Neuropsychological Test Battery (CANTAB)
There was a significant difference between the Intervention and Control group (p
0.002) for Spatial Working Memory score but on closer inspection, this was a
factor of the Control group getting significantly worse (median change -1) and no
improvement in the Intervention (median change 0). A large proportion of the
data in both groups indicated negative values - it is improbable that Spatial
Memory Span (i.e. the number of items that can be held in working memory)
would decrease over time; therefore this analysis has been excluded as data could
be misleading, and may further reflect problems in use of this particular test in
children of this age.
There was a significant difference in change in the Spatial Working Memory
Between Errors test between the Intervention and Control group by 2 sample t
test, with the Intervention group showing a significant reduction in errors
(improvement in performance) relative to the Control group (Intervention mean –
5 SD 14 Control 4 SD 8 Estimate for difference 9 95% CI 3, 16) p = 0.009. A
general linear model containing Group (Intervention or Control), gender, school
and age indicated there remained a significant effect of Group on change in
Spatial Working Memory Between Error Score (p = 0.01) and the direction of the
results indicated a significant reduction in errors at follow up in the Intervention
relative to the Control group (see Table 6.6).

180
Secondary Outcome Measures (in the pilot study)
Body Mass Index (BMI) SD scores
There was no significant change in BMI SD scores from follow-up to baseline
between groups by 2 sample t test (mean change in Intervention 0.05 SD 0.313;
mean change in Control 0.026 SD 0.436; Estimate for difference 0.024, 95% CI -
0.203, 0.252) p=0.830
Connor’s Parents Rating Scale: short form (CPRS:S)
Response rates for postal questionnaires were low, so results should be viewed
with caution (27 returned at both baseline and follow up). Raw scores from
CPRS:S are converted to age and gender related T scores (see Appendix II a. and
b. for scoring sheets). For Connor’s Parents Rating Scales T Scores see table 6.5.
Between group comparisons indicated differences between Intervention and
Control T scores in all subscales (p<0.05), with a significant reduction in scores
at follow up in the Intervention group relative to the Control, however, when
gender, age, SES were controlled for using a General Linear Model, the Group
difference remained only in the Cognitive Problems / Inattention subscales (see
table 6.6).

181
Table 6. 5 Adjusted T scores for Conner’s Parent Rating Scales Short Form
Intervention
(n=15) Control (n=12)
T Scores Baseline Follow-
Up Baseline Follow-Up
Mean SD Mean SD Mean SD Mean SD
Oppositional 53 7 46 4 51 9 52 12 Cognitive Problems / Inattention 54 7 48 4 51 5 52 7 Hyperactivity 57 13 52 6 55 9 57 13 ADHD Index 53 6 49 5 50 3 51 5
Questionnaires were administered by post due to time and staffing shortages (CPRS was a secondary outcome) and response rates were low. A lower score at
follow up indicates a reduction in symptoms on the subscales (improved ‘behaviour’).
Scores are age and gender adjusted T scores.

182
Table 6. 6 Adjusted model for LEAPFROG psychological outcome measures
Outcome (Response) CAS Difference
of Means
SE of
Difference
T Value P Value
Full scale -3 -5 -0.71 0.48 Planning -7 -8 -0.94 0.35 Attention -7 -8 -0.89 0.39
Simultaneous -1 -8 -0.03 0.97 Successive 2 6 0.24 0.81
ANT
Reaction time (ms) 28 41 0.67 0.50 Accuracy -14 -7 -1.93 0.06
CANTAB
SWM Between Errors 12 4 2.78 0.01
CPRS:S Oppositional 9 6 1.60 0.13 Cognitive
Problems/Inattention 9 5 2 0.04
Hyperactivity 11 9 1.33 0.20 ADHD Index 2 3 0.56 0.60
Data are from general linear model containing the psychological outcome as a response, and group, school(with nested Group), gender and SES as factors, and decimal age as a covariate. Data are from children participating in the LEAPROG pilot RCT mean age 6.1 SD 0.3 years.
SE Standard Error CAS Cognitive Assessment System
ANT Attention Network Test
CANTAB Cambridge Neuropsychological Test Batter
CPRS:S Connors Parent Rating Scale : Short Form

183
6.4. Discussion
The current study was a pilot study for a future RCT, designed to develop and
monitor the intensity of an aerobic exercise intervention and determine the most
suitable primary outcome measure for a future RCT in young children. All aims
of the pilot study were achieved successfully. Though intended as a
pilot/feasibility study, it was the first RCT examining the effects of exercise on
cognitive function in children as young as 6 years old.
Aerobic exercise intervention
The present study suggests that the adapted specialist / trained teacher delivered
Basic Moves Sessions was a feasible aerobic intervention for young children, and
allowed them to reach a fairly high intensity of physical activity. Children in the
Intervention group spent around 20% of their time in MVPA, during the 1 hour
PE sessions. Despite the instruction to school teachers (both class teachers and
primary school PE specialists) to keep children moving ‘as much as possible’
during the one hour of PE, the data suggest that children spent around 40% of
their time inactive during even during the Intervention sessions (mean counts per
minute <1100, Reilly et al., 2003). In a future full scale trial we would aim to
monitor physical activity intensity of every session, and provide regular feedback
to staff and videotape (where possible) the sessions to play back to them, to
ensure that intensity levels are kept sufficiently high for as long as possible
during each PE session. Due to the research staff and time limitations of the pilot
study, this was not feasible. The use of heart rate during intervention sessions in

184
a future full scale trial, may enhance motivation in children (Davis et al,. 2007),
and allow the intervention to be sufficiently progressive in nature.
Ensuring high and sustained intensities of physical activity during school PE is
not as straightforward as it may seem and a large amount of research effort has
been put into attempts to make school PE more aerobically intense (Fairclough &
Stratton, 2005; McMurray et al. 2002). Luekper et al., (1999) and McMurray et
al., (2002) have previously observed that children only spend a very small
percentage (typically around 6%) of their physical education time in aerobic
activities (McMurray et al., 2002; Luekper et al., 1999). The current
recommendations for physical activity are that all children should spend around
30 minutes of their time in MVPA during the school day (Koplan et al., 2004
p14) and a total of one hour per day in MVPA (Strong et al., 2005), whereas
current estimates are less that 25 minutes of MVPA per school week (Nader et
al., 2005). In our intervention, the children spent around 20% of their physical
activity time in MVPA, which, as the sessions were run by educationalists
(teachers and school PE specialists) rather than researchers, using resources
freely available in the schools, and within school time, could be easily
translatable. It is feasible that, working closely with PE specialists and teachers,
and providing more opportunity for self monitoring (e.g. video observation of
their own classes) the intervention could be enhanced further, to provide the
recommended 30 minutes of MVPA recommeded in school time. Instruction
time and time waiting should be kept to a minimum (Koplan et al., 2005;
Gortmaker et al., 1999) – while we attempted to address this initially, due to

185
funding limitations of the pilot, we did not have the staff to directly observe the
PE classes, and did not have consent to video tape the full class of children.
Cognitive Assessment System (CAS)
The current study indicates that Cognitive Assessment System (CAS) is a
feasible primary outcome measure for a future RCT in children in this age group,
and setting. There were no significant effects of group in changes in any of the
Cognitive Assessment System (CAS) Subscales. This may be due to not having a
high enough ‘dose’ of exercise to benefit cognition, or due to insufficient power.
Davis et al (2007) saw a significant improvement of the Planning scale in a High
dose aerobic exercise group (40 minutes of aerobic exercise 5 times per week),
but no significant improvement in a Low dose group (20 minutes of exercise 5
times per week). CAS scores in the Low dose group did not change significantly
relative to the Control group, suggesting a ‘threshold’ that may have to be
reached for exercise to positive impact cognition (Davis et al., 2007). It should
be noted that when designing and implementing the current study, the data from
the study by Davis et al., (2007) were not available. It is also feasible that very
young children, at a different stage of cognitive development, respond differently
to the positive cognitive effects of exercise (Tomporowski, 2008R). The good
reliability of subscales that allow the executive function hypothesis to be tested
and positive response from young Scottish children, administering psychologists,
and staff in primary schools, indicate that the CAS would be a suitable primary
outcome measure for a future RCT.

186
ANT & CANTAB
Due to very limited staff on the pilot RCT, and time involved to extract data from
the ANT and CANTAB for analysis, test retest reliability data were not
calculated prior to the follow up measurement period, so CANTAB and ANT
follow-up measures were taken. While test and retest reliability data suggested
the the Attention Network Test (ANT) or Cambridge Neuropsychological Test
Battery (CANTAB) were not reliable enough to use as primary psychological
outcome measures (full data presented in Chapter 4), a significant improvement
in the Between Errors in the Spatial Working Memory Test of the CANTAB
(p=0.03) in the present study. Interpretation of the results is difficult as we
cannot be sure this was not down to error of measurement; however it is likely
that a less reliable test may be more likely to mask any potential differences,
rather than the opposite way around. The Between Errors outcome of the
CANTAB test of Spatial Working Memory has been shown to be sensitive to
executive dysfunction (Kempton et al., 1999), and therefore, it could be theorised
that improved executive function through aerobic exercise could lead to
enhanced performance on these tasks.
Although the results from the CPRS were encouraging, the low response rate to
the postal questionnaires means that any results should be viewed with caution.
The CPRS was originally a secondary outcome measure, and staffing limitations
(only one full time research assistant) meant that there was possibly not enough
emphasis to parents on return of the postal questionnaires in the present study. In
a future trial, the CPRS would be a primary outcome measure, and a research

187
assistant full responsible for the administration and follow-up of the CPRS would
be employed.
Power calculation and considerations
One of the aims of the current study was to provide data to adequately power a
future full scale RCT. With the Planning scale of the Cognitive Assessment
System as a primary outcome measure, using the current data this would be
problematic. Possibly due to the intervention not be intense enough (Davis et al.,
2007) or the study being underpowered to detect change. Applying the mean
difference in change in Planning scores of the CAS of 7 between groups after
controlling for differences within schools (Table 6.5) and using our group mean
standard deviation of 15, at 80% power we would require 74 children in each
group (around double the number we had in the current study). The overall
design of the RCT based on the current pilot is discussed in more detail in
Chapter 8.
Potential mechanisms for findings of present study
The current study was a pilot, exploratory study, with small sample sizes, so
results should be viewed with caution. The current pilot suggests that the
enhanced PE intervention was associated with a possible improvement in the
Attention Network Test accuracy but not reaction time in the Intervention groups
versus Control. While it must be accepted that the difference may be due to test
retest error, there are theoretical reasons why this difference could be seen. In
their 2003 meta-analysis of older adult exercise and cognitive function data,
Colcombe & Kramer indicated a stronger effect size for studies involving task

188
that require executive control than tasks that fall in the authors (theoretical)
category of controlled-process; tasks that initially require control then become
automatic with practice e.g. choice reaction time. The Attention Network Test,
and the Eriksen Flanker Task that the ANT is based on, provides examples of
tests that contain both components – the choice reaction time (a controlled-
process task) and the need to ‘block out’ interfering stimuli (an executive control
task) (see Colcombe & Kramer, 2003 p127).. In adults, aerobic exercise is linked
with a reduction in activity of the anterior cingulate corex (Colcombe et al.
2004), and an improvement in performance in executive function tests. The
anterior cingulate cortex is linked with both behaviour and executive function,
and it is feasible that, even in a ten week intervention in young children, aerobic
exercise may enhance BDNF gene expression, improve long term potentiation
and spatial memory (as seen in rodents – see Table 1.2 Chapter 1). Further
studies in larger samples, using fMRI to examine changes in the brain would be
warranted. In summary, though conclusions about relationships between these
aspects of cognition and exercise can only be tentative from the present study,
they are biologically plausible and consistent with current literature.
There was a significant reduction in scores in the CPRS:S Cognitive Problems
and Inattention scale in the present study (Table 6.6). Behaviour and conflict
response are regulated by the anterior cingulate cortex (ACC) (Divinsky et al.,
1995R). The activity of the ACC has been demonstrated to be altered by aerobic
exercise versus stretching and toning in older adults (Colcombe et al., 2004), and
it is feasible this is also true of young children, so again there is a degree of
biological plausibility and consistency with recent literature in the findings of the

189
present study. However in a future RCT, it would be desirable to establish
whether such effects exist in a larger sample, and it may be possible to use
functional magnetic resonance imaging (fMRI) to confirm whether there are
structural changes taking place in the brain of young children in response to
exercise.
Limitations
There are a number of limitations to the present study. The sample size is small,
however the study was a pilot, designed to adequately power a potential future
full scale RCT. The intervention may not have been intense enough, as reported
in the study by Davis et al. (2007), at least 40 minutes at least 5 times per week is
required to see a change in the Cognitive Assessment System (CAS) however,
these data were not available when designing the current study. Use of
accelerometers only may not have been sufficient to monitor intervention
intensity, and ensure that overload was being achieved. It is likely that the
children would plateu as the intervention was not progress. The use of heart rate
during the intervention would be employed in a future RCT. Children cannot
achieve improvement in ‘aerobic’ fitness to the same extent as adults until
puberty is reached, partly because they are naturally ‘fitter’ and partly due to low
levels of testosterone (muscles, including the heart, cannot increase in size as
much) (Rowland, 1996).
Children have a higher anaerobic threshold than adults; children tend to reach
anaerobic threshold around 85 maximal HR (>170 beats per minute) so more
intense exercise could be more beneficial for children. Children have greater
190
aerobic enzyme activity than adults and burn greater fat burning capacity during
exercise. Because of this higher intensity training that impacts the glycolytic
system, rather than the fatty acid system may be more beneficial. It is feasible,
therefore, that suitable interval training, rather than a continous aerobic sessions,
would be a better intervention for children (Rowland, 1996).
6.5. Conclusion
The current pilot study provides the information required to design and
implement a full scale randomised controlled trial in young Scottish children.

191
Chapter 7. Overall thesis discussion
192
7.1 Summary of findings
The results of the current studies suggest that movement skills and physical
activity are only weakly related in young children (chapter 3). The pilot study in
Chapter 6 provides data to adequately power a future full scale RCT examining
the relationship between exercise and cognitive function in young children. The
studies in this thesis are the first to examine the relationship between physical
activity and motor and cognitive development in children under the age of 7
years. The studies in the thesis add to the literature that habitual physical activity
and movement skills are not strongly related (Okely et al., 2001), although this
relationship may be more important at higher levels of activity, and potentially
different types of activities (sports participation).. The results of the thesis also
lay the foundations for design of a full scale RCT to examine the relationship
between chronic aerobic exercise and executive function, and suggest that
chronic aerobic exercise, as compared to movement skill development, may
positively enhance aspects of cognitive function (Colcombe et al., 2004). Chapter
6 provides the first data (to our knowledge) to suggest that aerobic exercise may
positively influence behaviour in typically developing children (as opposed to
children with behaviour problems / overweight obese children), and this is
certainly an area for further research with larger samples. The results of all the
studies included in this thesis add to the literature that modern children spend a
large proportion of their time sedentary. In all samples in the current thesis,
children spent around 70% of their time in sedentary behaviour, and only around
4% of their time in moderate and vigorous intensity physical activity (MVPA).
193
A combination of observational and RCT (pilot) studies were included in the
thesis. It is noted that the observational nature of the study in chapter 3 may
mean that the conclusions were confounded by other variables that were not
measured, and may mask the relationship between movement skills and habitual
activity. The relatively small samples in the intervention studies in chapters 6 and
7 make drawing conclusions difficult, but these studies were intended as pilot /
feasibility studies for possible future work. This work in this thesis overall was
intended to lay the foundation for a full scale RCT examining the relationship
between exercise and cognitive function. At the beginning of the thesis work,
research in the area of physical activity / exercise and motor and cognitive
function was very limited, and non-existent in children under 7 years.
The original aim for the current PhD had been to examine the relationship
between habitual physical activity and movement skills in preschoolers cross
sectionally, as the nature of the data (being baseline data for an RCT) only
allowed this study design, then follow up this work examining the relationship
between physical activity and cognitive function in preschoolers. However,
further research into the area and contact with expert psychologists, indicated
that reliable cognitive measures for preschoolers did not exist (because many
aspects of executive function have simply not developed in preschool children
and they are an under-researched group), and our own experience indicated that
it would be difficult to implement a purely aerobic intervention in preschools.
The decision was taken (based on expert advice) to assess the feasibility of
carrying out a study of this nature in a slightly older sample of 6-8 year old
children within primary schools, but it was not even clear if this would be
194
feasible, so pilot work had to be done to determine which outcomes could be
used in children of this age, which exercise intervention to use in this age group,
and how to best carry out research of this nature in schools. The rationale for
studying the youngest age group feasible was that, due to their greater neural
plasticity, it is believed that any cognitive effects of exercise would be greater in
children and greatest in younger children in whom brain development proceeds
rapidly. It is the author’s belief that these aims were achieved successfully
through the thesis work.
At present, in preschool and primary physical education a large percentage of
time is spent of activities to promote movement skills development, and a small
percentage of time is generally spent on aerobic activity (McMurray et al.,
(2002). While certainly important, as the ability to move underlies the ability to
carry out any physical activity (Gabbard, 2004), it is possible the emphasis is too
strongly on movement skills, with little time for children to carry out moderate to
vigorous ‘play’. In addition, in light of the fact that modern children are so
sedentary, and that it appears that aerobic exercise can positively enhance
cognitive function, a larger proportion of physical education time should possibly
be spent on aerobic activity in future, with less emphasis on movement skills.
Alternatively, more time could be devoted to school physical education .
The Scottish Government recently withdrew policy to increase school physical
education time to two hours per week. Evidence now consistently shows that
there are no negative effects on academic scores by enhancing physical education
time in schools, even by as much as 1 hour per day, and, in fact, the right type of

195
activity may positively enhance cognition, and possibly behaviour (although this
is an area for futher research) therefore physical education time in schools should
arguably increase. A large, adequately powered RCT would provide more robust
and convincing evidence of possibly benefits of increased exercise in school,
which may in turn influence Government Policy on school physical education.
Based on our data from Chapter 6 it appears that and RCT examining the effect
of exercise on cognitive function is feasible in children as young as 6. We would
aim to use the Cognitive Assessment System (CAS), Conner’s Parents Rating
Scale: Short Form (CPRS:S) and the Actigraph GT1M accelerometer as a
primary outcome measures the Attention Network Test (ANT) as a secondary
outcome (justifications are discussed in Chapter 6). Data on potential
confounders; body mass index (BMI) and socio-economic status (SES) would be
collected. We would also aim to use functional Magnetic Resonance Imaging
(fMRI) in a subsample of participants to examine any structural changes in the
brain (preliminary discussions with the University of Glasgow Centre for
Cognitive Neuroimaging suggest that this would be feasible, and collaboration
would be welcome).
Based on the data from our pilot study (chapter 6) using our data from the CAS
Planning scale (a primary outcome), we would aim to have an n of around 100
children in each group so that full data n around 75 participants in each arm of
the future RCT could be obtained. Our practical experience has suggested that
around 10-15 children per school is feasible (due to the length of time required
for CAS testing). In some schools in the pilot study presented in chapter 6

196
responses were low; to counteract this, we would work with teachers to
determine the best ways to gain optimal recruitment (for example, talking at
parent’s evenings, providing translators for families who do not have English as
a first language). Due to limited funding for the chronic effects of exercise study
in chapter 6, we only had one member of staff available to deliver recruitment
packs to schools (the thesis author) then rely on them being handed to children /
parents, read and returned. We would include measures of heart rate during the
intervention, and potentially employ a suitable paediatric interval training aspect
to the intervention. Having staff available for recruitment in the full scale trial
may also help to prevent bias of parents with low literacy. The recent study in
overweight and obese children by Davis et al., (2007) and our preliminary
findings suggest that a 10-15 week duration of intervention may be long enough
to show improvements in cognitive function in children, but the intervention
should probably be at least 40 minutes 5 times per week, as observed from our
study, cognitive changes may be seen in younger children Carrying out an
intervention of the proposed intensity (daily PE) would likely be more feasible
over a single school term. It would also be important to examine how long any
potential cognitive benefits of exercise lasted for following the end of the
intervention.
We would hope to implement the intervention in much the same way (with
Glasgow city council Primary PE specialists / trained teachers) but more
frequently (daily) and work with PE specialists and teachers to enhance the
aerobic activity during the sessions, so the children spend a greater proportion of
time in moderate and vigorous physical activity (MVPA). It is likely that to

197
achieve the recommended 60 minutes of MVPA recommended by Strong et al.
(2005), a home intervention would have to be addressed

198
7.2 Directions for future research
Table 8.1 Indicates recent reviews suggest directions for future research in the
area of exercise and cognitive function.
Observational studies have produced limited evidence on childhood physical
activity and cognition, and physical activity and movement skills to date. Recent
reviews (Tomporowski, 2008; Hillman, 2008) have concluded that RCT’s are
necessary and this is an obvious conclusion from the present thesis. It is clear
more randomised controlled-trials, examining the dose reponse of exercise on
cognitive function, and the interaction with fitness, are required in both adults
and in children. Neuroimaging (including fMRI) in children would also allow
researchers to determine whether the structural changes in the brain observered
in older adults, are also observed in children, and neuroimaging studies could be
nested within future RCT of intervention.
Public health strategies to promote exercise as an intervention for life long brain
(as well as physical) health may have more impact than physical health alone,
and in future health promotion (for example, obesity prevention) studies,
researchers should consider including cognitive outcome measures.
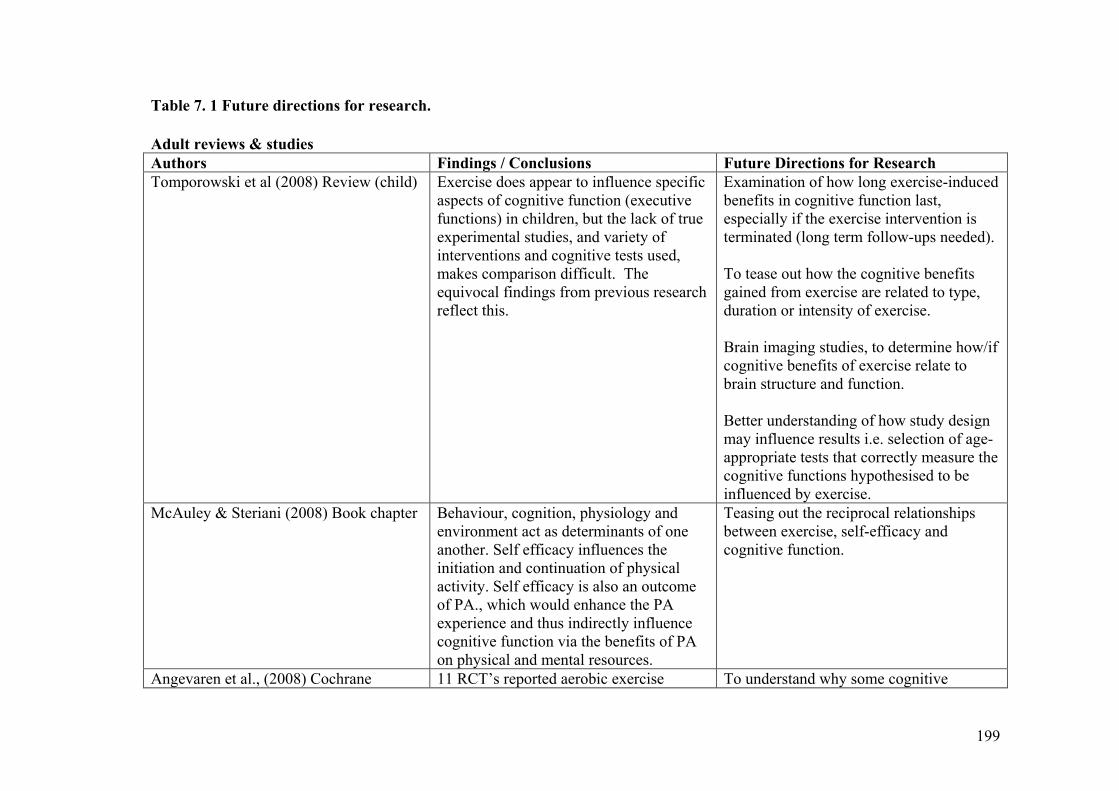
199
Table 7. 1 Future directions for research.
Adult reviews & studies
Authors Findings / Conclusions Future Directions for Research
Tomporowski et al (2008) Review (child) Exercise does appear to influence specific aspects of cognitive function (executive functions) in children, but the lack of true experimental studies, and variety of interventions and cognitive tests used, makes comparison difficult. The equivocal findings from previous research reflect this.
Examination of how long exercise-induced benefits in cognitive function last, especially if the exercise intervention is terminated (long term follow-ups needed). To tease out how the cognitive benefits gained from exercise are related to type, duration or intensity of exercise. Brain imaging studies, to determine how/if cognitive benefits of exercise relate to brain structure and function. Better understanding of how study design may influence results i.e. selection of age-appropriate tests that correctly measure the cognitive functions hypothesised to be influenced by exercise.
McAuley & Steriani (2008) Book chapter Behaviour, cognition, physiology and environment act as determinants of one another. Self efficacy influences the initiation and continuation of physical activity. Self efficacy is also an outcome of PA., which would enhance the PA experience and thus indirectly influence cognitive function via the benefits of PA on physical and mental resources.
Teasing out the reciprocal relationships between exercise, self-efficacy and cognitive function.
Angevaren et al., (2008) Cochrane 11 RCT’s reported aerobic exercise To understand why some cognitive

200
Review (adult) interventions resulted in increased CV fitness (improvement in maximal oxygen uptake test) of the intervention group. Of approximately 14%. This improvement coincided with an improvement in cognitive capacity. The largest effect sizes were found in auditory attention (0.52) and delayed memory (0.50). The largest impact was seen in motor function (effect size 1.17). Modest effects were seen on information processing speed (ES 0.26) and visual attention (ES 0.26). Data are insufficient to conclude that exercise-related improvement in cognitive functions are due to improvements in CV fitness.
functions improve with (aerobic) exercise, while some are insensitive to exercise. Development / agreement of a standardised set of neuropsychological tests by researchers in the field, to heighten the reproducibility of results. Further examination of the ‘fitness effect’.
Rockwood & Middleton (2007) Review (adult)
Longitudinal studies suggest that the risk of dementia, cognitive impairment, cognitive decline, and Alzheimer’s disease is lower among people engaging in high levels of PA. There is a dose-response relationship between between PA and cognitive function.
How interactions between the APOE e4 allele and physical activity affect the risk of cognitive impairment.

201
8.1. References

202
References
Abbott, R. D., Ross, G. W., White, L. R., Sanderson, W. T., Burchfiel, C. M.,
Kashon, M., Sharp, D. S., Masaki, K. H., Curb, J. D., & Petrovitch, H. (2003)
Environmental, life-style, and physical precursors of clinical Parkinson's disease:
recent findings from the Honolulu-Asia Aging Study. Journal of Neurology, 250
Suppl 3:III30-9.
Abbott, R. D., White, L. R., Ross, G. W., Masaki, K. H., Curb, J. D., &
Petrovitch, H. (2004) Walking and dementia in physically capable elderly men.
Journal of the American Medical Association, 292, 1447-1453.
Adlard, P. A., Perreau, V. M., & Cotman, C. W. (2005) The exercise-induced
expression of BDNF within the hippocampus varies across life-span.
Neurobiology of Aging, 26, 511-520.
Ahamed, Y., Macdonald, H., Reed, K., Naylor, P. J., Liu-Ambrose, T., & Mckay,
H. (2007) School-based physical activity does not compromise children's
academic performance. Medicine & Science in Sports & Exercise, 39, 371-6.
Ainslie, P. N., Reilly, T., & Westerterp, K. R. (2003) Estimating Human Energy
Expenditure. Sports Medicine, 33, 683-698.
Alaimo, K., Olson, C. M., & Frongillo, E. A., Jr. (2001) Food insufficiency and
American school-aged children's cognitive, academic, and psychosocial
development. Pediatrics, 108, 44-53.

203
Alhassan, S., Sirard, J. R., & Robinson, T. N. (2007) The effects of increasing
outdoor play time on physical activity in Latino preschool children. International
Journal of Pediatric Obesity, 2, 153-8.
Angevaren, M., Aufdemkampe, G., Verhaar, H. J., Aleman, A., & Vanhees, L.
(2008) Physical activity and enhanced fitness to improve cognitive function in
older people without known cognitive impairment. Cochrane Database of
Systematic Reviews, 2, CD005381.
Bakken, R. C., Carey, J. R., Di Fabio, R. P., Erlandson, T. J., Hake, J. L., &
Intihar, T. W. (2001) Effect of aerobic exercise on tracking performance in
elderly people: a pilot study. Physical Therapy, 81, 1870-9.
Barnes, D. E., Yaffe, K., Satariano, W. A., & Tager, M. D. (2003) A longitudinal
study of cardiorespiratory fitness and cognitive function in healthy older adults.
Journal of the American Geriatric Society, 51, 459-465.
Baur, L. A. & O'Connor, J. (2004) Special considerations in childhood and
adolescent obesity. Clinics in Dermatology, 22, 338-44.
Bayley, N. (1935) The development of motor abilities during the first three years.
Monographs of the Society for Research in Child Development, 1, 1-26.
Bayley, N. (1969) Bayley Scales of Infant Development., 2nd edn, Therapy Skin
Builders., San Antonio.
Bazar, K. A., Yun, A. J., Lee, P. Y., Daniel, S. M., & Doux, J. D. (2006) Obesity
and ADHD may represent different manifestations of a common environmental
oversampling syndrome: a model for revealing mechanistic overlap among
204
cognitive, metabolic, and inflammatory disorders. Medical Hypotheses, 66, 263-
9.
Beebe, L. H., Tian, L., Morris, N., Goodwin, A., Allen, S. S., & Kuldau, J.
(2005) Effects of Exercise on Mental and Physical Health Parameters of Persons
with Schizophrenia, Issues in Mental Health Nursing, 26, 611-676.
Bender, J. M., Brownson, R. C., Elliott, M. B., & Haire-Joshu, D. L. (2005)
Children's physical activity: using accelerometers to validate a parent proxy
record. Medicine & Science in Sports & Exercise, 37, 1409-13.
Benham-Deal, T. (2005) Preschool children's accumulated and sustained physical
activity. Perceptual & Motor Skills, 100, 443-50.
Berkman, L. F., Seeman, T. E., Albert, M., & Blazer, D. (1993) High, Usual and
impaired functioning in community dwelling older men and women: findings
from the Macarthur foundation research network on successful ageing. Journal
of Clinical Epidemiology, 46, 1129-1140.
Beutel, M. E., Klockenbrink, P., Wiltink, J., Dietrich, S., Thiede, R., Fan, J., &
Posner, M. I. (2006) Attention and executive functions in patients with severe
obesity. A controlled study using the Attention Network Test. Nervenarzt, 77,
1323-4, 1326-31.
Bherer, L., Kramer, A. F., Peterson, M. S., Colcombe, S., Erickson, K., & Becic,
E. (2006) Testing the limits of cognitive plasticity in older adults: application to
attentional control. Acta Psychologica, 123, 261-78.

205
Bjorklund, D. F. & Brown, R. D. (1998) Physical play and cognitive
development: integrating activity, cognition, and education. Child Development,
69, 604-606.
Black, J. E., Isaacs, K. R., Anderson, B. J., Alcantara, A. A., & Greenough, W.
T. (1990) Learning causes synaptogenesis, whereas motor activity causes
angiogenesis, in cerebellar cortex of adult rats. Proceedings of the National
Academy of Sciences of the United States of America, 87, 5568-72.
Black, J. E., Isaacs, K. R., & Greenough, W. T. (1991) Usual vs. successful
aging: some notes on experiential factors. Neurobiology of Aging, 12, 325-8;
discussion 352-5.
Blomquist, K. B. & Danner, F. (1987) Effects of physical conditioning on
information-processing efficiency. Perceptual & Motor Skills, 65, 175-86.
Bluechart, M. H., Weiner, J., & Shephard, R. J. (1995) Exercise programmes in
the treatment of children with learning disabilities. Sports Medicine, 19, 55-72.
Blumenthal, J. A. & Madden, D. J. (1988) Effects of aerobic exercise training,
age, and physical fitness on memory-search performance. Psychology & Aging,
3, 280-5.
Blumenthal, J. A., Emery, C. F., Madden, D. J., & George, L. K. (1989)
Cardiovascular and behavioral effects of aerobic exercise training in healthy
older men and women. Journals of Gerontology, 44, M147-57.

206
Bouchard, M., Laforest, F., Vandelac, L., Bellinger, D., & Mergler, D. (2007)
Hair manganese and hyperactive behaviors: pilot study of school-age children
exposed through tap water. Environmental Health Perspectives, 115, 122-7.
Braunholtz, D. A., Edwards, S. J., & Lilford, R. J. (2001) Are randomized
clinical trials good for us (in the short term)? Evidence for a "trial effect".
Journal of Clinical Epidemiology, 54, 217-24.
Bricker, D. (1993) Assessment, evaluation and programming system for infants
and children. Baltimore, Brookes.
Bricker, D. & Squires, J. (1995) Ages and Stages Questionnaire : A parent-
completed child monitoring system. Baltimore, Brookes.
Bricker, D. D., Bailey, E. J., & Slentz, K. (1990) Reliability, validity, and utility
of the Evaluation and Programming System: For Infants and Young Children
(EPS--I). Journal of Early Intervention, 14, 145-160.
Broglio, S. P., Tomporowski, P. D., & Ferrara, M. S. (2005) Balance
performance with a cognitive task: a dual-task testing paradigm. Medicine &
Science in Sports & Exercise, 37, 689-95.
Brooks, F. & Magnusson, J. (2006) Taking part counts: Adolescents' experiences
of the transition from inactivity to active participation in school-based physical
education. Health Education Research, 21, 872-883, 2006.
Brown, D., Cuccurullo, S., Lee, J., Petagna, A., & Strax, T. (2008)
Electrodiagnostic medicine skills competency in physical medicine and

207
rehabilitation residents: a method for development and assessment. American
Journal of Physical Medicine & Rehabilitation, 87, 654-65.
Brown, W. H., Pfeiffer, K. A., Mclver, K. L., Dowda, M., Almeida, M. J., &
Pate, R. R. (2006) Assessing preschool children's physical activity: the
Observational System for Recording Physical Activity in children-preschool
version. Research Quarterly for Exercise & Sport, 77, 167-76 .
Bruininks, R. H. 1978, Bruininks-Oseretsky test of motor proficiency examiners
manual. American Guidance Service, Circle Pines,MN.
Buck, S. M., Hillman, C. H., & Castelli, D. M. (2008) The relation of aerobic
fitness to stroop task performance in preadolescent children. Medicine & Science
in Sports & Exercise, 40, 166-72.
Bull, R., Espy, K. A., & Weibe, S. A. (2008) Short-term memory working
memory and executive functioning in preschoolers: longitudinal predictors of
academic achievement age 7 years. Developmental Neuropsychology, 33, 205-
208.
Bunge, S. A., Ochsner, K. N., Desmond, J. E., Glover, G. H., & Gabrieli, J. D.
(2001) Prefrontal regions involved in keeping information in and out of mind.
Brain, 124, 2074-86.
Burdette, H. L., Whitaker, R. C., & Daniels, S. R. (2004) Parental report of
outdoor playtime as a measure of physical activity in pre-school age children.
Archives of Pediatrics & Adolescent Medicine, 158, 353-357.

208
Burdette, H. L. & Whitaker, R. C. (2005) Resurrecting free play in young
children: looking beyond fitness and fatness to attention, affiliation, and affect.
Archives of Pediatrics & Adolescent Medicine, 159, 46-50.
Burton, A. & Miller, D. E. 1998, Movement skill assessment Human Kinetics
Inc..
Bush, G., Luu, P., & Posner, M. I. (2000) Cognitive and emotional influences in
the anterior cingulate cortex. Trends in Cognitive Sciences, 4, p. 215-222.
Butcher, J. E. & Eaton, W. O. (1989) Gross and fine motor proficiency in pre-
schoolers: relationships with free play and activity levels. Journal of Human
Movement Studies, 16, 27-36.
Byrne, A. & Byrne, D. G. (1993) The effect of exercise on depression, anxiety
and other mood states: a review. Journal of Psychosomatic Research, 37, 565-
574.
Cardon,G., De,Bourdeaudhuij,I. (2004) Comparison of pedometer and
accelerometer measures of physical activity in preschool children. Pediatric
Exercise Science, 2, 205-214.
Carles S Jr, Curnier, D., Pathak, A., Roncalli, J., Bousquet, M., Garcia, J. L.,
Galinier, M., & Senard, J. M. (2007) Effects of short-term exercise and exercise
training on cognitive function among patients with cardiac disease. Journal of
Cardiopulmonary Rehabilitation & Prevention, 27, 395-9.
Carro, E., Trejo, J. L., Busiguina, S., & Torres-Aleman, I. (2001) Circulating
insulin-like growth factor I mediates the protective effects of physical exercise

209
against brain insults of different aetiology and anatomy. Journal of
Neuroscience, 21, 5678-5684.
Casey, B. J., Trainor, R., Giedd, J., Vauss, Y., Vaituzis, C. K., Hamburger, S.,
Kozuch, P., & Rapoport, J. L. (1997) The role of the anterior cingulate in
automatic and controlled processes: a developmental neuroanatomical study.
Developmental Psychobiology, 30, 61-9.
Casey, B. J. & Giedd, K. M. T. (2000) Structural and functional brain
development and its relation to cognitive development. Biological Psychiatry,
54, 1-3.
Casey, B. J., Tottenham, N., & Fossella, J. (2002) Clinical, imaging, lesion, and
genetic approaches toward a model of cognitive control. Developmental
Psychobiology, 40, 237-54.
Castelli, D. M., Hillman, C. H., Buck, S. M., & Erwin, H. E. (2007) Physical
fitness and academic achievement in third- and fifth-grade students. Journal of
Sport & Exercise Psychology, 29, 239-52.
Catellier, D. J., Hannan, P. J., Murray, D. M., Addy, C. L., Conway, T. L., Yang,
S., & Rice, J. C. (2005) Imputation of missing data when measuring physical
activity by accelerometry. Medicine & Science in Sports & Exercise.37(11
Suppl):S555-62.
Chapillon, P., Patin, V., Roy, V., Vincent, A., & Caston, J. (2002) Effects of pre-
and postnatal stimulation on developmental, emotional, and cognitive aspects in
rodents: a review. Developmental Psychobiology, 41, 373-87.
210
Chen, K. Y. & Bassett, D. R., Jr. (2005) The technology of accelerometry-based
activity monitors: current and future. Medicine & Science in Sports & Exercise,
37, 490-500.
Chmura, J., Nazar, K., & Kaciuba-Uscilko, H. (1994) Choice reaction time
during graded exercise in relation to blood lactate and plasma catecholamine
thresholds. International Journal of Sports Medicine, 15, 172-176.
Chow, S. M. & Henderson, S. E. (2003) Interrater and test-retest reliability of the
Movement Assessment Battery for Chinese preschool children. American
Journal of Occupational Therapy, 57, 574-7.
Chu, B. B., Lawson, D., & Naughton, G. (2003) Validation of the Computer
Science Applications activity monitor as an objective measure of energy
expenditure in Vietnamese adolescents. Pediatric Exercise Science, 15, 55-66.
Churchill, J. D., Galvez, R., Colcombe, S., Swain, R. A., Kramer, A. F., &
Greenough, W. T. (2002) Exercise, experience and the aging brain. Neurobiology
of Aging, 23, 941-55.
Cobain, M. R. & Foreyt, J. P. (2005) Designing "lifestyle interventions" with the
brain in mind. Neurobiology of Aging, 26, S 85-7.
Colcombe, S. J., Erickson, K. I., Raz, N., Webb, A. G., Cohen, N. J., McAuley,
E., & Kramer, A. F. (2003) Aerobic fitness reduces brain tissue loss in aging
humans. Journals of Gerontology Series A-Biological Sciences & Medical
Sciences, 58, 176-80.
211
Colcombe, S. J., Kramer, A. F., McAuley, E., Erickson, K. I., & Scalf, P. (2004)
Neurocognitive aging and cardiovascular fitness: recent findings and future
directions. Journal of Molecular Neuroscience, 24, 9-14.
Colcombe, S. J., Kramer, A. F., Erickson, K. I., Scalf, P., McAuley, E., Cohen,
N. J., Webb, A., Jerome, G. J., Marquez, D. X., & Elavsky, S. (2004)
Cardiovascular fitness, cortical plasticity, and aging. Proceedings of the National
Academy of Sciences of the United States of America, 101, 3316-21.
Colcombe, S. J., Erickson, K. I., Scalf, P. E., Kim, J. S., Prakash, R., McAuley,
E., Elavsky, S., Marquez, D. X., Hu, L., & Kramer, A. F. (2006) Aerobic
exercise training increases brain volume in aging humans. Journals of
Gerontology Series A-Biological Sciences & Medical Sciences, 61, 1166-70.
Colcombe, S. & Kramer, A. F. (2003) Fitness effects on the cognitive function of
older adults: A meta-analytic study. Psychological Science, 14, 125-130.
Cole, T. J., Freeman, J. V., & Preece, M. A. (1995) Body mass index reference
curves for the UK, 1990. Archives of Disease in Childhood, 73, 25-9.
Coleman, K. J., Saelens, B. E., Wiedrich-Smith, M. D., Finn, J. D., & Epstein, L.
H. (1997) Relationships between TriTrac-R3D vectors, heart rate, and self-report
in obese children. Medicine & Science in Sports & Exercise, 29, 1535-1542.
Coles, K. & Tomporowski, P. D. (2008) Effects of acute exercise on executive
processing, short-term and long-term memory. Journal of Sports Sciences, 26,
333-44.

212
Conners, C. K., Sitarenios, G., Parker, J. D. A., & Epstein, J. N. (1998) The
revised Conners' Parent Rating Scale (CPRS-R): Factor structure, reliability, and
criterion validity. Journal of Abnormal Child Psychology, 26, 257-268.
Conners, K. C. 2001, Conners' Rating Scales - Revised Technical Manual Multi-
Health Systems Inc.
Coolican, H. (2004) Research Methods and Statistics in Psychology 4th Edition
(pp 152) London, Hodder & Stoghton.
Corbetta, M., Kincade, J. M., Ollinger, J. M., McAvoy, M. P., & Shulman, G. L.
(2000) Voluntary orienting is dissociated from target detection in human
posterior parietal cortex. Nature Neuroscience., 3, 292-297.
Corbetta, M. & Shulman, G. L. (2002) Control of goal-directed and stimulus-
driven attention in the brain. Nature Reviews Neuroscience, 3, 201-15.
Corbetta, M., Kincade, J. M., Ollinger, J. M., McAvoy, M. P., & Shulman, G. L.
(2000) Voluntary orienting is dissociated from target detection in human
posterior parietal cortex. Nature Neuroscience, 3. 292-297.
Corder, K., Brage, S., Ramachandran, A., Snehalatha, C., Wareham, N., &
Ekelund, U. (2007) Comparison of two Actigraph models for assessing free-
living physical activity in Indian adolescents. Journal of Sports Sciences, 25,
1607-11.
Corder, W. O. (1966) Effects of physical education on the intellectual, physical,
and social development of educable mentally retarded boys. Exceptional
Children, 32, 357-64.
213
Cotman, C. W. & Engesser-Cesar, C. (2002) Exercise enhances and protects
brain function. Exercise & Sport Sciences Reviews, 30, 75-9.
Cottrell, L. A., Northrup, K., & Wittberg, R. (2007) The extended relationship
between child cardiovascular risks and academic performance measures. Obesity,
15, 3170-7.
Cournot, M. M., Marquie, J. C. P., Ansiau, D. P., Martinaud, C. M., Fonds, H.
M., Ferrieres, J. M., & Ruidavets, J. B. M. (2006) Relation between body mass
index and cognitive function in healthy middle-aged men and women.
Neurology, 67, 1208-1214.
Craik, F. I. M. & Salthouse, T. A. (2000) The handbook of aging and cognition,
2nd Edition, Mahwah, NJ, US: Lawrence Erlbaum Associates.
Crespo, C. J., Smit, E., Troiano, R. P., Bartlett, S. J., Macera, C. A., & Andersen,
R. E. (2001) Television watching, energy intake, and obesity in US children:
results from the third National Health and Nutrition Examination Survey, 1988-
1994. Archives of Pediatrics & Adolescent Medicine, 155, 360-5.
Croce, R. V., Horvat, M., & McCarthy, E. (2001) Reliability and concurrent
validity of the movement assessment battery for children. Perceptual & Motor
Skills, 93, 275-80.
Dale, D., Corbin, C. B., & Dale, K. S. (2000) Restricting opportunities to be
active during school time: do children compensate by increasing physical activity
levels after school? Research Quarterly for Exercise & Sport, 71, 240-8.

214
Daley, A. J. & Ryan, J. (2000) Academic performance and participation in
physical activity by secondary school adolescents. Perceptual & Motor Skills,
91, 531-4.
Das, J. P. (2002) A Better Look At Intelligence. Current Directions in
Psychological Science, 11, 28-33.
Das, U. N. (2001) Is obesity an inflammatory condition? Nutrition, 17, 953-66.
Datar, A., Sturm, R., & Magnabosco, J. L. (2004) Childhood Overweight and
Academic Performance: National Study of Kindergartners and First-Graders.
Obesity Research, 12, 58-68.
Davis, C. L., Tomporowski, P. D., Boyle, C. A., Waller, J. L., Miller, P. H.,
Naglieri, J. A., & Gregoski, M. (2007) Effects of aerobic exercise on overweight
children's cognitive functioning: a randomized controlled trial. Research
Quarterly for Exercise & Sport, 78, 510-9.
De Luca, C. R., Wood, S. J., Anderson, V., Buchanan, J. A., Proffitt, T. M.,
Mahony, K., & Pantelis, C. (2003) Normative data from the CANTAB. I:
development of executive function over the lifespan. Journal of Clinical &
Experimental Neuropsychology, 25, 242-54.
De Ridder, A. & De Graeve, D. (2006) Healthcare use, social burden and costs of
children with and without ADHD in Flanders, Belgium. Clinical Drug
Investigation, 26, 75-90.
215
de Vries, S. I., Bakker, I., Hopman-Rock, M., Hirasing, R. A., & van Mechelen,
W. (2006) Clinimetric review of motion sensors in children and adolescents.
Journal of Clinical Epidemiology, 59, 670-80.
Deary, I. J. P., Whalley, L. J. M., Batty, G. D. P., & Starr, J. M. M. (2006)
Physical fitness and lifetime cognitive change. Neurology, 67, 1195-1200.
DeMattia, L., Lemont, L., & Meurer, L. (2007) Do interventions to limit
sedentary behaviours change behaviour and reduce childhood obesity? A critical
review of the literature. Obesity Reviews, 8, 69-81.
Dencker, M., Thorsson, O., Karlsson, M. K., Linden, C., Svensson, J., Wollmer,
P., & Andersen, L. B. (2006) Daily physical activity and its relation to aerobic
fitness in children aged 8-11 years. European Journal of Applied Physiology, 96,
587-92.
Derks, E. M., Hudziak, J. J., & Boomsma, D. I. (2007) Why more boys than girls
with ADHD receive treatment: a study of Dutch twins. Twin Research & Human
Genetics: the Official Journal of the International Society for Twin Studies, 10,
765-70.
Devinsky, O., Morrell, M. J., & Vogt, B. A. (1995) Contributions of anterior
cingulate cortex to behaviour. Brain, 118, 279-306.
Dietz, W. H. (1998) Health consequences of obesity in youth: childhood
predictors of adult disease. Pediatrics, 101, 518-25.
Dietz, W. H. & Gortmaker, S. L. (2001) Preventing obesity in children &
adolescents. Annual Review of Public Health, 22, 337-353.
216
Dik, M. G., Deeg, D. J. H., Visser, M., & Jonker, C. (2003) Early life physical
activity and cognition at old age. Journal of Clinical & Experimental
Neuropsychology, 25, 643-653.
Dishman, R. K. (2003) The impact of behavior on quality of life. Quality of Life
Research, 12, 43-9.
Dishman, R. K., Berthoud, H. R., Booth, F. W., Cotman, C. W., Edgerton, V. R.,
Fleshner, M. R., Gandevia, S. C., Gomez-Pinilla, F., Greenwood, B. N., Hillman,
C. H., Kramer, A. F., Levin, B. E., Moran, T. H., Russo-Neustadt, A. A.,
Salamone, J. D., Van Hoomissen, J. D., Wade, C. E., York, D. A., & Zigmond,
M. J. (2006) Neurobiology of exercise. Obesity, 14, 345-56.
Dollman, J., Boshoff, K., & Dodd, G. (2006) The relationship between
curriculum time for physical education and literacy and numeracy standards in
South Australian primary schools. European Physical Education Review, 12,
151-163.
Dowsett, S. M. & Livesey, D. J. (2000) The development of inhibitory control in
preschool children: effects of "executive skills" training. Developmental
Psychobiology, 36, 161-74.
Dulaney, C. L. & Tomporowski, P. D. Attention and cognitive-skill acquisition.
Duman, R. S. & Monteggia, L. M. (2006) A neurotrophic model for stress-
related mood disorders. Biological Psychiatry, 59, 1116-27.
Duncan, J. (2001) An adaptive coding model of neural function in prefrontal
cortex. Nature Reviews Neuroscience, 2, 820-9.

217
Durston, S., Thomas, K. M., Worden, M. S., Yang, Y., & Casey, B. J. (2002) The
effect of preceding context on inhibition: an event-related fMRI study.
Neuroimaging, 16, 449-53.
Dworetzky, B. A. (2001) The neurology of memory. Seminars in Speech &
Language, 22, 95-105.
Dwyer, T., Coonan, D. R., Leitch, D. R., Hetzel, B. S., & Baghurst, R. A. (1983)
An investigation of the effects of daily physical activity on the health of primary
school students in South Australia. International Journal of Epidemiology, 12,
308-313.
Dwyer, T., Sallis, J. F., Blizzard, L., Lazarus, R., & Dean, K. (2001) Relation of
academic performance to physical activity and fitness in children. Pediatric
Exercise Science, 13, 225-237.
Eisenmann, J. C. & Wickel, E. E. (2005) Moving on land: an explanation of
pedometer counts in children. European Journal of Applied Physiology, 93, 440-
6.
Eisenmann, J. C., Laurson, K. R., Wickel, E. E., Gentile, D., & Walsh, D. (2007)
Utility of pedometer step recommendations for predicting overweight in children.
International Journal of Obesity, 31, 1179-82.
Ekelund, U., Sjostrom, M., Yngve, A., Poortvliet, E., Nilsson, A., Froberg, K.,
Wedderkopp, N., & Westerterp, K. (2001) Physical activity assessed by activity
monitor and doubly labeled water in children. Medicine & Science in Sports &
Exercise, 33, 275-81.

218
Elavsky, S. & McAuley, E. (2007) Lack of perceived sleep improvement after 4-
month structured exercise programs. Menopause, 3, 535-40.
Ellaway, A., Kirk, A., Macintyre, S., & Mutrie, N. (2007) Nowhere to play? The
relationship between the location of outdoor play areas and deprivation in
Glasgow. Health & Place, 13, 557-61.
Elliott, R., Sahakian, B. J., Matthews, K., Bannerjea, A., Rimmer, J., & Robbins,
T. W. (1997) Effects of methylphenidate on spatial working memory and
planning in healthy young adults. Psychopharmacology, 131, 196-206.
Emery, C. F., Hsiao, E. T., Hill, S. M., & Frid, D. J. (2003) Short-term effects of
exercise and music on cognitive performance among participants in a cardiac
rehabilitation program. Heart & Lung, 32, 368-73.
Emery, C. F., Huppert, F. A., & Schein, R. L. (1995) Relationships among age,
exercise, health, and cognitive function in a British sample. The Gerontologist,
35, 378-385.
Erickson, K. I., Colcombe, S. J., Elavsky, S., McAuley, E., Korol, D. L., Scalf, P.
E., & Kramer, A. F. (2007) Interactive effects of fitness and hormone treatment
on brain health in postmenopausal women. Neurobiology of Aging, 28, 179-85.
Eriksen, B. A. & Erisksen, C. W. (1974) Effect of noise letters upon the
identification of target letter in nonsearch task. Perceptual Psychophysiology, 16,
143-149.
219
Eriksson, P. S., Perfilieva, E., Bjork-Eriksson, T., Alborn, A. M., Nordborg, C.,
Peterson, D. A., & Gage, F. H. (1998) Neurogenesis in the adult human
hippocampus. Nature Medicine, 4, 1313-7.
Escorihuela, R. M., Tobena, A., & Fernandez-Teruel, A. (1995) Environmental
enrichment and postnatal handling prevent spatial learning deficits in aged
hypoemotional (Roman high-avoidance) and hyperemotional (Roman low-
avoidance) rats. Learning & Memory, 2, 40-8.
Eston, R. G., Rowlands, A. V., & Ingledew, D. K. (1998) Validity of heart rate,
pedometry, and accelerometry for predicting the energy cost of children's
activities. Journal of Applied Physiology, 84, 362-71.
Etnier, J. L., Nowell, P. M., Landers, D. M., & Sibley, B. A. (2006) A meta-
regression to examine the relationship between aerobic fitness and cognitive
performance. Brain Research Reviews, 52, 119-30.
Etnier, J. L., Salazar, W., Landers, D. M., Petruzzello, S. J., Han, M., & Nowell,
P. (1997) The influence of physical fitness and exercise upon cognitive
functioning: A meta-analysis. Journal of Sport & Exercise Psychology, 19, p.
249-277.
Fairclough, S. J. & Stratton, G. (2006) Effects of a physical education
intervention to improve student activity levels. Physical Education & Sport
Pedagogy, 11, 29-44.
Fairweather, S. C., Reilly, J. J., Grant, S., Whittaker, A., & Paton, J. Y. (1999)
Using the computer science and applications (CSA) activity monitor in preschool
children. Pediatric Exercise Science, 11, 413-420.

220
Falkner, K. L., McCann, S. E., & Trevisan, M. (2001) Participant characteristics
and quality of recall of physical activity in the distant past. American Journal of
Epidemiology, 154, 865-72.
Fan, J., McCandliss, B. D., Sommer, T., Raz, A., & Posner, M. I. (2002) Testing
the efficiency and independence of attentional networks. Journal of Cognitive
Neuroscience, 14, 340-7.
Fan, J., Fossella, J., Sommer, T., Wu, Y., & Posner, M. I. (2003) Mapping the
genetic variation of executive attention onto brain activity. Proceedings of the
National Academy of Sciences of the United States of America, 100, 7406-11.
Fan, J., Flombaum, J. I., McCandliss, B. D., Thomas, K. M., & Posner, M. I.
(2003) Cognitive and brain consequences of conflict. Neuroimage, 18, 42-57.
Fan, J. & Posner, M. (2004) Human attentional networks. Psychiatrische Praxis,
31, S210-4.
Fan, J., McCandliss, B. D., Fossella, J., Flombaum, J. I., & Posner, M. I. (2005)
The activation of attentional networks. Neuroimage, 26, 471-9.
Fan, J., Byrne, J., Worden, M. S., Guise, K. G., McCandliss, B. D., Fossella, J.,
& Posner, M. I. (2007) The relation of brain oscillations to attentional networks.
Journal of Neuroscience, 27, 6197-206.
Fan, J. & Posner, M. (2004) Human Attentional Networks. Psychiatrische
Praxis, 31, S210 -S214.
Faulkner, G. & Sparkes, A. (1999) Exercise as therapy for schizophrenia: An
ethnographic study. Journal of Sport & Exercise Psychology, 21, 52-69.

221
Fein, E. C. & Day, E. A. (2004) The PASS theory of intelligence and the
acquisition of a complex skill: A criterion-related validation study of Cognitive
Assessment System scores. Personality and Individual Differences, 37, 1123-
1136.
Feldman, R., Eidelman, A. I., Sirota, L., & Weller, A. (2002) Comparison of
skin-to-skin (kangaroo) and traditional care: parenting outcomes and preterm
infant development. Pediatrics, 110, 16-26.
Ferris, L. T., Williams, J. S., & Shen, C. L. (2007) The effect of acute exercise
on serum brain-derived neurotrophic factor levels and cognitive function.
Medicine & Science in Sports & Exercise, 39, 728-34.
Field, T., Diego, M., & Sanders, C. E. (2001) Exercise is positively related to
adolescents' relationships and academics, Adolescence, 36, 105-10.
Findling, R. L., Quinn, D., Hatch, S. J., Cameron, S. J., DeCory, H. H., &
McDowell, M. (2006) Comparison of the clinical efficacy of twice-daily Ritalin
and once-daily Equasym XL with placebo in children with Attention
Deficit/Hyperactivity Disorder. European Child & Adolescent Psychiatry, 15,
450-9.
Finn, K. J. & Specker, B. (2000) Comparison of Actiwatch activity monitor and
Children's Activity Rating Scale in children. Medicine & Science in Sports &
Exercise, 32, 1794-7.

222
Fisher, A., Reilly, J. J., Kelly, L. A., Montgomery, C., Williamson, A., Paton, J.
Y., & Grant, S. (2005) Fundamental movement skills and habitual physical
activity in young children. Medicine & Science in Sports & Exercise, 37, 684-8.
Fogarty, M., Happell, B., & Pinikahana, J. (2004) The benefits of an exercise
program for people with schizophrenia: a pilot study. Psychiatric Rehabilitation
Journal, 28, 173-6.
Folio, M. R. & Fewell, R. R. 2000, Peabody Developmental Movement Scales,
2nd edn, PRO:ED, Austin.
Fontaine, N. S., Torre, D. L., & Grafwallner, R. (2006) Effects of quality early
care on school readiness skills of children at risk. Early Child Development and
Care, 176, 99-109.
Fordyce, D. E. & Farrar, R. P. (1991) Physical activity effects on hippocampal
and parietal cortical cholinergic function and spatial learning in F344 rats.
Behavioural Brain Research, 43, 115-23.
Fossella, J., Sommer, T., Fan, J., Wu, Y., Swanson, J. M., Pfaff, D. W., &
Posner, M. I. (2002) Assessing the molecular genetics of attention networks.
BMC Neuroscience, 3, 14.
Fowler, K. S., Saling, M. M., Conway, E. L., Semple, J. M., & Louis, W. J.
(1997) Computerized neuropsychological tests in the early detection of dementia:
prospective findings. Journal of the International Neuropsychological Society, 3,
139-46.
223
Frankenburgh, W. K. & Dodds, J. B. (1967) The Denver Developmental
Screening Test. Journal of Pediatrics., 71, 181-191.
Fratiglioni, L., Paillard-Borg, S., & Winblad, B. (2004) An active and socially
integrated lifestyle in late life might protect against dementia. Lancet Neurology,
3, 343-353.
Fray, P. J., Robbins, T. W., & Sahakian, B. J. (2003) Neuropsychiatric
aplications of CANTAB. International Journal of Geriatric Psychiatry, 11, 329-
336.
Freedman, D. J., Riesenhuber, M., Poggio, T., & Miller, E. K. (2001) Categorical
representation of visual stimuli in the primate prefrontal cortex. Science, 291,
312-6.
Freedson, P., Pober, D., & Janz, K. F. (2005) Calibration of accelerometer output
for children. Medicine & Science in Sports & Exercise, 37, S523-30.
Freidlands, R. P. (2001) Patients with Altziemers disease have reduced activities
in midlife compared with health control group members.
Proc.Nat.Acad.Sci.USA., 98, 3440-3445.
Fulton, J. E., Burgeson, C. R., Perry, G. R., Sherry, B., Galuska, D. A.,
Alexander, M. P., Wechsler, H., & Caspersen, C. J. (2001) Assessment of
physical activity and sedentary behavior in preschool-age children: Priorities for
research. Pediatric Exercise Science, 13, 113-126.
224
Fumagalli, F., Racagni, G., & Riva, M. A. (2006) Shedding light into the role of
BDNF in the pharmacotherapy of Parkinson's disease. Pharmacogenomics
Journal, 6, 95-104.
Gabbard, C. P. 2004, Lifelong Motor Development, 4 edn, Texas, Pearsons
Education Inc, Benjamin Cummings.
Gabbard, C., Cacola, P., & Rodrigues, L. P. (2008) A new inventory for
assessing Affordances in the Home Environment for Motor Development
(AHEMD-SR) . Early Childhood Education Journal, 36, 5-9.
Gable, S., Chang, Y., & Krull, J. L. (2007) Television watching and frequency of
family meals are predictive of overweight onset and persistence in a national
sample of school-aged children. Journal of the American Dietetic Association,
107, 53-61.
Garcia, C. (1994) Gender differences in young children's interactions when
learning fundamental motor skills. Research Quarterly for Exercise & Sport, 65,
213-25.
Garza, A. A., Ha, T. G., Garcia, C., Chen, M. J., & Russo-Neustadt, A. A. (2004)
Exercise, antidepressant treatment, and BDNF mRNA expression in the aging
brain. Pharmacology, Biochemistry and Behavior, 77, 209-220.
Giammattei, J., Blix, G., Marshak, H. H., Wollitzer, A. O., & Pettitt, D. J. (2003)
Television watching and soft drink consumption: associations with obesity in 11-
to 13-year-old schoolchildren. Archives of Pediatrics & Adolescent Medicine,
157, 882-6.

225
Giedd, J. N., Blumenthal, J., Jeffries, N. O., Castellanos, F. X., Liu, H.,
Zijdenbos, A., Paus, T., Evans, A. C., & Rapoport, J. L. (1999) Brain
development during childhood and adolescence: a longitudinal MRI study.
Nature Neuroscience, 2, 861-3.
Gold, S. M., Schulz, K. H., Hartmann, S., Mladek, M., Lang, U. E., Hellweg, R.,
Reer, R., Braumann, K. M., & Heesen, C. (2003) Basal serum levels and
reactivity of nerve growth factor and brain-derived neurotrophic factor to
standardized acute exercise in multiple sclerosis and controls. Journal of
Neuroimmunology, 138, 99-105.
Gomez-Pinilla, F. & Vaynman, S. (1992) A "deficient environment" in prenatal
life may compromise systems important for cognitive function by affecting
BDNF in the hippocampus. Experimental Neurology. 192, 235-243.
Gomez-Pinilla, F., Dao, L., & So, V. (1997) Physical exercise induces FGF-2
and its mRNA in the hippocampus. Brain Research, 764, 1-8.
Gomez-Pinilla, F., Ying, Z., Opazo, P., Roy, R. R., & Edgerton, V. R. (2001)
Differential regulation by exercise of BDNF and NT-3 in rat spinal cord and
skeletal muscle. European Journal of Neuroscience, 13, 1078-84.
Gomez-Pinilla, F., Ying, Z., Roy, R. R., Molteni, R., & Edgerton, V. R. (2002)
Voluntary exercise induces a BDNF-mediated mechanism that promotes
neuroplasticity. Journal of Neurophysiology, 88, 2187-95.
Gortmaker, S. L., Peterson, K., Wiecha, J., Sobol, A. M., Dixit, S., Fox, M. K., &
Laird, N. (1999) Reducing obesity via a school-based interdisciplinary
226
intervention among youth: Planet Health. Archives of Pediatrics & Adolescent
Medicine, 153, 409-18.
Grantham-McGregor, S. & Ani, C. (2001) A review of studies on the effect of
iron deficiency on cognitive development in children. Journal of Nutrition, 131,
649S-666S; discussion 666S-668S.
Graves, L., Stratton, G., Ridgers, N. D., & Cable, N. T. (2007) Comparison of
energy expenditure in adolescents when playing new generation and sedentary
computer games: cross sectional study. BMJ, 335, 1282-4.
Graves, L., Stratton, G., Ridgers, N. D., & Cable, N. T. (2008) Energy
expenditure in adolescents playing new generation computer games. British
Journal of Sports Medicine, 42, 592-4.
Grealy, M. A., Johnson, D. A., & Rushton, S. K. (1999) Improving cognitive
function after brain injury: the use of exercise and virtual reality. Archives of
Physical Medicine & Rehabilitation, 80, 661-7.
Greenwood, C. R., Luze, G. J., Cline, G., Kuntz, S., & Leitschuh, C. (2002)
Developing a general outcome measure of growth in movement for infants and
toddlers. Topics in Early Childhood Special Education , 22,. 143-157.
Grego, F., Vallier, J. M., Collardeau, M., Bermon, S., Ferrari, P., Candito, M.,
Bayer, P., Magnie, M. N., & Brisswalter, J. (2004) Effects of long duration
exercise on cognitive function, blood glucose, and counterregulatory hormones
in male cyclists. Neuroscience Letters, 364, 76-80.
227
Grego, F., Vallier, J. M., Collardeau, M., Rousseu, C., Cremieux, J., &
Brisswalter, J. (2005) Influence of exercise duration and hydration status on
cognitive function during prolonged cycling exercise. International Journal of
Sports Medicine, 26, 27-33.
Griesbach, G. S., Hovda, D. A., Molteni, R., Wu, A., & Gomez-Pinilla, F. (2004)
Voluntary exercise following traumatic brain injury: brain-derived neurotrophic
factor upregulation and recovery of function. Neuroscience, 125, 129-39.
Groves, J. O. (2007) Is it time to reassess the BDNF hypothesis of depression?.
[Review] [106 refs]. Molecular Psychiatry, 12, 1079-88.
Gruber, S., Rathgeber, K., Braunig, P., & Gauggel, S. (2007) Stability and course
of neuropsychological deficits in manic and depressed bipolar patients compared
to patients with Major Depression. Journal of Affective Disorders, 104, 61-71.
Gueze, R. H., Jongmans, M. J., Schoemaker, M. M., & Smits-Engelsman, B. C.
(1920) Clinical and research diagnostic criteria for developmental coordination
disorder: a review and discussion. Human Movement Science, 20, 7-47.
Gustafson, D., Lissner, L., Bengtsson, C., Bjorkelund, C., & Skoog, I. (2004) A
24-year follow-up of body mass index and cerebral atrophy. Neurology, 63,
1876-81.
Gustafson, D. (2006) Adiposity indices and dementia. Lancet Neurology, 5, 713-
20.

228
Gutentag, S. S., Naglieri, J. A., & Yeates, K. O. (1998) Performance of children
with traumatic brain injury on the Cognitive Assessment System. Assessment, 5,
263-72.
Guthke, J. & Stein, H. (1996) Are learning tests the better version of intelligence
tests? European Journal of Psychological Assessment, 12, 1-13.
Haddad, F. A. (2004) Planning versus speed: an experimental examination of
what Planned Codes of the Cognitive Assessment System measures. Archives of
Clinical Neuropsychology. 19, 313-317.
Halterman, J. S., Kaczorowski, J. M., Aligne, C. A., Auinger, P., & Szilagyi, P.
G. (2001) Iron deficiency and cognitive achievement among school-aged
children and adolescents in the United States. Pediatrics, 107, 1381-6.
Han, S., Jiang, Y., Gu, H., Rao, H., Mao, L., Cui, Y., & Zhai, R. (2004) The role
of human parietal cortex in attention networks. Brain, 127, 650-9.
Harris, M. & Butterworth, G. 2002, ‘Development from conception to birth’, in
Developmental Psychology, pp. 63-91, London, Psychology Press Limited.
Harrow, M. (1997) Validation of a Questionnaire to Assess Physicla Activity in
Children Ages 4-8 Years. Research Quarterly for Exercise & Sport., 68, 259-
268.
Henderson, S. E. & Sugden, D. A. 1992, Movement Assessment Battery for
Children. Sidcup, Kent. Therapy Skill Builders.
Hill, E. L. (2004) Evaluating the theory of executive dysfunction in autism.
Developmental Review, 24, p. 189-233.

229
Hill, R. D., Storandt, M., & Malley, M. (1993) The impact of long-term exercise
training on psychological function on older adults. Journal of Gerontology, 48,
pp. 12-17.
Hillman, C. H., Snook, E. M., & Jerome, G. J. (2003) Acute cardiovascular
exercise and executive control function. International Journal of
Psychophysiology, 48, 307-14.
Hillman, C. H., Castelli, D. M., & Buck, S. M. (2005) Aerobic fitness and
neurocognitive function in healthy preadolescent children. Medicine & Science in
Sports & Exercise, 37, 1967-74.
Hillman, C. H., Erickson, K. I., & Kramer, A. F. (2008) Be smart, exercise your
heart: exercise effects on brain and cognition. Nature Reviews Neuroscience, 9,
58-65.
Hillman, C. H., Snook, E. M., & Jerome, G. J. (2003) Acute cardiovascular
exercise and executive control function. International Journal of
Psychophysiology, 48, 307-314.
Hollan, S. (1996) Iron supplementation and cognitive function. Lancet, 348,
1669-70.
Hopkins WG (2000). Measures of reliability in sports medicine and science.
Sports Medicine 30, 1-15.
Horsfield, S. A., Rosse, R. B., Tomasino, V., Schwartz, B. L., Mastropolo, J., &
Duetsch, S. I. (2002) Fluoexetine's effects on cognitive peformance in patients

230
with traumatic brain injury. International Journal of Psychiatric Medicine, 32,
337-344.
Horwitz, B., Rumsey, J. M., & Donohue, B. C. (1998) Functional connectivity of
the angular gyrus in normal reading and dyslexia. Proceedings of the National
Academy of Sciences of the United States of America, 95, 8939-44.
Hrabok, M., Kerns, K. A., & Muller, U. (2007) The vigilance, orienting, and
executive attention networks in 4-year-old children. Child Neuropsychology, 13,
408-21.
Huang, T. T., Goran, M. I., & Spruijt-Metz, D. (2006) Associations of adiposity
with measured and self-reported academic performance in early adolescence.
Obesity, 14, 1839-45.
Hughes, C. & Graham, A. (2002) Measuring executive functions in childhood:
Problems and solutions? Child and Adolescent Mental Health, 7, 134-142.
Isaacs, K. R., Anderson, B. J., Alcantara, A. A., Black, J. E., & Greenough, W.
T. (1992) Exercise and the brain: angiogenesis in the adult rat cerebellum after
vigorous physical activity and motor skill learning.[erratum appears in J Cereb
Blood Flow Metab 1992 May;12(3):533]. Journal of Cerebral Blood Flow &
Metabolism, 12, 110-9.
Jackson, D. M., Reilly, J. J., Kelly, L. A., Montgomery, C., Grant, S., & Paton, J.
Y. (2003) Objectively measured physical activity in a representative sample of 3-
to 4-year-old children. Obesity Research, 11, 420-5.

231
Jacoby, S., Josman, N., Jacoby, D., Koike, M., Itoh, Y., Kawai, N., Kitamura, Y.,
Sharlin, E., & Weiss, P. L. (2006) Tangible user interfaces: Tools to examine,
assess, and treat dynamic constructional processes in children with
developmental coordination disorders. International Journal on Disability and
Human Development, 5, 257-263.
Janz, K. F. (1994) Validation of the CSA accelerometer for assessing children's
physical activity. Medicine & Science in Sports & Exercise, 26, 369-75.
Janz, K. F., Levy, S. M., Burns, T. L., Torner, J. C., Willing, M. C., & Warren, J.
J. (2002) Fatness, physical activity, and television viewing in children during the
adiposity rebound period: The Iowa bone development study. Preventive
Medicine, 35, 563-571.
Jha, A. P., Krompinger, J., & Baime, M. J. (2007) Mindfulness training modifies
subsystems of attention. Cognitive, Affective & Behavioral Neuroscience, 7, 109-
19.
Jones, L. B., Rothbart, M. K., & Posner, M. I. (2003) Development of executive
attention in preschool children. Developmental Science, 6, 495-504.
Jongmans, M. J., Smits-Engelsman, B. C., & Schoemaker, M. M. (2003)
Consequences of comorbidity of developmental coordination disorders and
learning disabilities for severity and pattern of perceptual-motor dysfunction.
Journal of Learning Disabilities, 36, 528-37.
Jordan, R. (2003) Social play and autistic spectrum disorders: a perspective on
theory, implications and educational approaches. Autism, 7, pp. 347-60.

232
Jorm, A. F. & Jolley, D. (1998) Review: incidence of dementia and Alzhemer's
disease increases with age. Aetiology, 2, 728-33.
Jukes, M. (2005) The long-term impact of preschool health and nutrition on
education. Food & Nutrition Bulletin, 26, S193-201.
Kamijo, K., Nishihira, Y., Hatta, A., Kaneda, T., Kida, T., Higashiura, T., &
Kuroiwa, K. (2004) Changes in arousal level by differential exercise intensity.
Clinical Neurophysiology, 115, 2693-2698.
Kamijo, K., Nishihira, Y., Higashiura, T., & Kuroiwa, K. (2007) The interactive
effect of exercise intensity and task difficulty on human cognitive processing.
International Journal of Psychophysiology, 65, 114-21.
Kaur, H., Choi, W. S., Mayo, M. S., & Harris, K. J. (2003) Duration of television
watching is associated with increased body mass index. Journal of Pediatrics,
143, 506-11.
Kavale, K. & Mattson, P. D. (1983) "One jumped off the balance beam": meta-
analysis of perceptual-motor training. Journal of Learning Disabilities, 16, 165-
73.
Kayser, B. (2003) Exercise starts and ends in the brain. European Journal of
Applied Physiology, 90, 411-9.
Keays, J. J. & Allison, K. R. (1995) The effects of regular moderate to vigorous
physical activity on student outcomes: a review. Canadian Journal of Public
Health.Revue Canadienne de Sante Publique, 86, 62-5.

233
Kelly, L. A., Reilly, J. J., Jackson, D. M., Montgomery, C., Grant, S., & Paton, J.
Y. (2004) Tracking physical activity and sedentary behavior in young children.
Pediatric Exercise Science, 19, 51-60.
Kelly, L. A., Fairweather, S. C., Grant, S., Barrie, S., & Reilly, J. J. (2004)
Comparison of two accelerometers for assessment of physical activity in
preschool children. Pediatric Exercise Science., 16, 324-333.
Kempermann, G., van Praag, H., & Gage, F. H. (2000) Activity-dependent
regulation of neuronal plasticity and self repair. Progress in Brain Research, 127,
35-48.
Kempermann, G., Wiskott, L., & Gage, F. H. (2004) Functional significance of
adult neurogenesis. Current Opinion in Neurobiology, 14, 186-91.
Kirby, A., Salmon, G., & Edwards, L. (2007) Attention-deficit hyperactivity and
developmental coordination disorders: Knowledge and practice among child and
adolescent psychiatrists and paediatricians. Psychiatric Bulletin, 31, 336-338.
Klaffke, S., Konig, I. R., Poustka, F., Ziegler, A., Hebebrand, J., & Bandmann,
O. (2006) Brain-derived neurotrophic factor: a genetic risk factor for obsessive-
compulsive disorder and Tourette syndrome? Movement Disorders, 21, 881-3.
Klenberg, L., Korkman, M., & Lahti-Nuuttila, P. (2001) Differential
development of attention and executive functions in 3- to 12-year-old Finnish
children. Developmental Neuropsychology, 20, 407-428.
234
Klesges, R. C., Coates, T. J., & Moldenhaure-Klesges, L. (1984) FATS: An
observational system for assessing children's eating and physical activity
behaviour. Behavioural Assessment., 6, 333-345.
Klimkeit, E. I., Mattingley, J. B., Sheppard, D. M., Farrow, M., & Bradshaw, J.
L. (2004) Examining the development of attention and executive functions in
children with a novel paradigm. Child Neuropsychology, 10, 201-11.
Kline, G. M., Porcari, J. P., Hintermeister, R., Freedson, P. S., Ward, A.,
McCarron, R. F., Ross, J., & Rippe, J. M. (1987) Estimation of VO2max from a
one-mile track walk, gender, age, and body weight. Medicine & Science in Sports
& Exercise, 19, 253-259.
Knecht, S., Ellger, T., & Levine, J. A. (2008) Obesity in neurobiology. Progress
in Neurobiology, 84, 85-103.
Koplan, J. P., Liverman, V. I., & Kraak, V. I. 2004, Preventing Childhood
Obesity National Academy of Sciences, Washington DC: Insitute of Medicine.
Kramer, A. F., Colcombe, S. J., McAuley, E., Eriksen, K. I., Scalf, P., Jerome, G.
J., Marquez, D. X., Elavsky, S., & Webb, A. G. (2003) Enhancing brain and
cognitive function of older adults through fitness training. Journal of Molecular
Neuroscience, 20, 213-221.
Kramer, A. F., Hahn, S., Cohen, N. J., Banich, M. T., McAuley, E., Harrison, C.
R., Chason, J., Vakil, E., Bardell, L., Boileau, R. A., & Colcombe, A. (1999)
Ageing, fitness and neurocognitive function. Nature, 400, 418-419.
235
Kramer, A. F., Colcombe, S. J., McAuley, E., Scalf, P. E., & Erickson, K. I.
(2005) Fitness, aging and neurocognitive function. Neurobiology of Aging, 26,
S124-7.
Kranzler, J. H. & Weng, L. (1995) Factor structure of the PASS cognitive tasks.
Journal of the School of Psychology., 33, 143-157.
Kretchmer, N., Beard, J. L., & Carlson, S. (1996) The role of nutrition in the
development of normal cognition. American Journal of Clinical Nutrition, 63,
997S-1001S.
Kumar, G. & Steer, R. A. (2003) Factorial validity of the Conners' Parent Rating
Scale-Revised: Short Form with psychiatric outpatients. Journal of Personality
Assessment, 80, 252-259.
Lange, K. W., Robbins, T. W., Marsden, C. D., James, M., Owen, A. M., & Paul,
G. M. (1992) L-dopa withdrawal in Parkinson's disease selectively impairs
cognitive performance in tests sensitive to frontal lobe dysfunction.
Psychopharmacology, 107, 394-404.
Lanningham-Foster, L., Jensen, T. B., Foster, R. C., Redmond, A. B., Walker, B.
A., Heinz, D., & Levine, J. A. (2006) Energy expenditure of sedentary screen
time compared with active screen time for children. Pediatrics, 118, 1831-5.
Laurin, D. (2001) Physical activity and risk of cognitive impairment and
dementia in elderly persons. Archives of Neurology, 58, 498-504.
Lautenschlager, N. T. & Almeida, O. P. (2006) Physical activity and cognition in
old age. Current Opinion in Psychiatry, 19, 190-193.
236
Lawrence, V., Houghton, S., Douglas, G., Durkin, K., Whiting, K., & Tannock,
R. (2004) Executive function and ADHD; A comparison of children's
performance during neuropsychological testing and real-world activities. Journal
of Attention Disorders, 7, 137 -149.
Lee, L. L. S. & Harris, S. R. (2005) Psychometric properties and standardization
samples of four screening tests for infants and young children: A review.
Pediatric Physical Therapy, 17, 140-147.
Lewis, M. D., Koroshegyi, C., Douglas, L., & Kampe, K. (1997) Age-specific
associations between emotional responses to separation and cognitive
performance in infancy. Developmental Psychology, 33, 32-42.
Lindner, K. J. (2002) The physical activity participation-academic performance
relationship revisited: Perceived and actual performance and the effect of
banding (academic tracking). Pediatric Exercise Science, 14, 155-169.
Livesey, D., Keen, J., Rouse, J., & White, F. (2006) The relationship between
measures of executive function, motor performance and externalising behaviour
in 5- and 6-year-old children. Human Movement Science, 25, 50-64.
Livesey, D., Coleman, R., & Piek, J. (2007) Performance on the Movement
Assessment Battery for Children by Australian 3- to 5-year-old children. Child:
Care, Health and Development, 33, 713 -719.
Lu, B., Pang, P. T., & Woo, N. H. (2005) The yin and yang of neurotrophin
action. Nature Reviews Neuroscience, 6, 603-14.

237
Luciana, M. & Nelson, C. A. (1998) The functional emergence of prefrontally-
guided working memory systems in four- to eight-year-old children.
Neuropsychologia, 36, 273-93.
Luciana, M. (2003) Practitioner review: Computerized assessment of
neuropsychological function in children: Clinical and research applications of the
Cambridge Neuropsychological Testing Automated Battery (CANTAB). Journal
of Child Psychology and Psychiatry & Allied Disciplines, 44, 649-653.
Luciana, M. & Nelson, C. A. (2002) Assessment of neuropsychological function
through use of the Cambridge Neuropsychological Testing Automated Battery:
Performance in 4- to 12-year-old children. Developmental Neuropsychology, 22,
595-624
Luciana, M. & Nelson, C. A. (1998) The functional emergence of prefrontally-
guided working memory systems in four- to eight-year-old children.
Neuropsychologia, 36, 273-93,
Luria, A. R. (1966) Human brain and psychological processes New York,
Harper and Row.
Lytle, M. E., Bilt, J. V., Pandav, R. S., Dodge, H. H., & Ganguli, M. (2004)
Exercise level and cognitive decline: The MoVIES project. Alzheimer Disease &
Associated Disorders, 18, 57-64.

238
MacRae, P. G., Spirduso, W. W., & Walters, T. J. (1987) Endurance training
effects on striatal D2 dopamine receptor binding and striatal dopamine
metabolites in presenescent older rats. Psychopharmacology, 92, 236-240.
Maddison, R., Ni Mhurchu, C., Jull, A., Jiang, Y., Prapavessi, H., & Rodgers, A.
(2007) Energy expended playing video console games: an opportunity to increase
childrens physical activity? Pediatric Exercise Science, 19, 334-343.
Magnie, M. N., Bermon, S., Martin, F., Madany-Lounis, M., Suisse, G.,
Muhammad, W., & Dolisi, C. (2000) P300, N400, aerobic fitness, and maximal
aerobic exercise. Psychophysiology, 37, 369-77.
Manios, Y., Kafatos, A., & Markakis, G. (1998) Physical Activity of 6 Year Old
Children: Validation of Two Proxy Reports. Pediatric Exercise Science, 10, 176-
188.
Mann, D. V., Ho, C. S., Critchley, L., Fok, B. S. P., Pang, E. W. H., Lam, C. W.
K., & Hjelm, N. M. (2007) Affordable measurement of human total energy
expenditure and body composition using one-tenth dose doubly labelled water.
International Journal of Obesity., 31, 751-755.
Martinowich, K., Manji, H., & Lu, B. (2007) New insights into BDNF function
in depression and anxiety. Nature Neuroscience, 10, 1089-93.
McAuley, E., Kramer, A. F., & Colcombe, S. J. (2004) Cardiovascular fitness
and neurocognitive function in older adults: a brief review. Brain, Behavior, &
Immunity, 18, 214-20.

239
McAuley, E. & Elavsky, S. (2008) ‘Self-efficacy, physical activity, and cognitive
function’ in Exercise and its mediating effects on cognition, pp. 69-84, PA, US,
Spirduso, Waneen W (Ed); Poon, Leonard W (Ed); Chodzko-Zajko, Wojtek
(Ed). (2008), Pennsylvania State U, Champaign, IL, US: Human Kinetics.
McCandliss, B. D. & Noble, K. G. (2003) The Development of Reading
Impairment: A Cognitive Neuroscience Model. Mental Retardation and
Developmental Disabilities Research Reviews, 9, 196 -205.
McCarney, R., Warner, J., Iliffe, S., van Haselen, R., Griffin, M., & Fisher, P.
(2007) The Hawthorne Effect: a randomised, controlled trial. BMC Medical
Research Methodology, 7, 30-35.
McKenzie, T. L., Kolody, B., Lewis, M., Marshall, S., & Rosengard, P. (1999)
Effects of health-related physical education on academic achievement: project
SPARK. Research Quarterly for Exercise and Sport, 70, 127-148.
McKenzie, T. L., Sallis, J. F., Nader, P. R., Patterson, T. L., Elder, J. P., Berry,
C. C., Rupp, J. W., Atkins, C. J., Buono, M. J., & Nelson, J. A. (1991)
BEACHES: an observational system for assessing children's eating and physical
activity behaviors and associated events. Journal of Applied Behavior Analysis,
24, 141-51.
McKenzie, T. L., Marshall, S. J., Sallis, J. F., & Conway, T. L. (2000) Leisure-
time physical activity in school environments: An observational study using
SOPLAY. Preventive Medicine, 30, 70-77.

240
McKenzie, T. L., Sallis, J. F., Broyles, S. L., Zive, M. M., Nader, P. R., Berry, C.
C., & Brennan, J. J. (2002) Childhood movement skills: predictors of physical
activity in Anglo American and Mexican American adolescents? Research
Quarterly for Exercise & Sport, 73, 238-44.
McLoone, P. (2004) Carstairs scores for Scottish postcode sectors from the 2001
census. Glasgow: Social and Public Health Science Unit, University of
Glasgow.
McMorris, T., Collard, K., Corbett, J., Dicks, M., & Swain, J. P. (2008) A test of
the catecholamines hypothesis for an acute exercise-cognition interaction.
Pharmacology, Biochemistry & Behavior, 89, 106-15.
McMurray, R. G., Harrell, J. S., Bangdiwala, S. I., Bradley, C. B., Deng, S., &
Levine, A. (2002) A school-based intervention can reduce body fat and blood
pressure in young adolescents. Journal of Adolescent Health, 31, 125-132.
Mezzacappa, E. (2004) Alerting, orienting, and executive attention:
developmental properties and sociodemographic correlates in an epidemiological
sample of young, urban children. Child Development, 75, 1373-86.
Mhurchu C., Maddison, R., Jiang, Y., Jull, A., Prapavessis, H., & Rodgers, A.
(2008) Couch potatoes to jumping beans: A pilot study of the effect of active
video games on physical activity in children. International Journal of Behavioral
Nutrition and Physical Activity, 5, 8-13.
Miyahara, M., Tsujii, M., Hanai, T., Jongmans, M., Barnett, A., Henderson, S.
E., Hori, M., Nakanishi, K., & Kageyama, H. (1998) The Movement Assessment

241
Battery for Children: A preliminary investigation of its usefulness in Japan.
Human Movement Science, 17, 679-697.
Morse, J. K., Weigand, S. J., Anderson, K., You, Y., Cai, N., Carnahan, J.,
Miller, J., DiStefano, P., Altar, C. A., Linsday, R. M., & Alderson, R. A. (1993)
Brain-derived neurotrophic factor (BDNF) prevents the degeneration of medial
septal cholinergic neurons following fimbria transection. The Journal of
Neuroscience, 13, 4146-4156.
Murer, M. G., Yan, Q., & Raisman-Vozari, R. (2001) Brain-derived neurotrophic
factor in the control human brain, and in Alzheimer's disease and Parkinson's
disease. Progress in Neurobiology, 63, 71-124.
Nader, P. R. & National Institute of Child Health and Human Development
Study of Early Child Care and Youth Development Network (2003) Frequency
and intensity of activity of third-grade children in physical education. Archives of
Pediatrics & Adolescent Medicine, 157, 185-90.
Naglieri, J. A., Goldstein, S., Delauder, B. Y., & Schwebach, A. (1920)
Relationships between the WISC-III and the Cognitive Assessment System with
Conners' rating scales and continuous performance tests. Archives of Clinical
Neuropsychology, 20, 385-401.
Naglieri, J. A. & Das, J. P. (1997) Cognitive Assessment System Interpretive
Handbook. Illinois, Riverside Publishing: Houghton Miffling Company.
Naglieri, J. A. & Rojahn, J. (2001) Intellectual classification of Black and White
children in special education programs using the WISC-III and the Cognitive
Assessment System. American Journal of Mental Retardation, 106, 359-67.

242
Naglieri, J. A. & Das, J. P. (1990) Planning, Attention, Simultaneous, and
Successive (PASS) cognitive processes as a model for intelligence. Journal of
Psychoeducational Assessment, 8, 303-337.
Naglieri, J. A., Otero, T., DeLauder, B., & Matto, H. (2007) Bilingual Hispanic
children's performance on the English and Spanish versions of the Cognitive
Assessment System. School Psychology Quarterly, 22, 432-448.
Nakamura, Y., Nishimoto, K., Akamatu, M., Takahashi, M., & Maruyama, A.
(1999) The effect of jogging on P300 event related potentials. Electromyography
& Clinical Neurophysiology, 39, 71-4.
Neeper, S. A., Gomez-Pinilla, F., Choi, J., & Cotman, C. W. (1996) Physical
activity increases mRNA for brain-derived neurotrophic factor and nerve growth
factor in rat brain. Brain Research, 726, 49-56.
Nelson, C. A. & Monk, C. S. (2001) The use of age related potentials in the
study of cognitive development. Cambridge MA: The MIT Press.
Nelson, M. C. & Gordon-Larsen, P. (2006) Physical activity and sedentary
behavior patterns are associated with selected adolescent health risk behaviors.
Pediatrics, 117, 1281-90.
Neuhaus, A. H., Koehler, S., Opgen-Rhein, C., Urbanek, C., Hahn, E., &
Dettling, M. (2007) Selective anterior cingulate cortex deficit during conflict
solution in schizophrenia: an event-related potential study. Journal of Psychiatric
Research, 41, 635-44.

243
Newbord, J., Stock, J. R., Wneck, L., Guidubaldi, J., & Svinivki, J. 1984,
Battelle Developmental Inventory. DLM Teaching Resources, Allen TX.
Nilsson, A., Ekelund, U., Yngve, A., & Sjostrom, M. (2002) Assessing physical
activity among children with accelerometers using different time sampling
intervals and placements. Pediatric Exercise Science, 14, 87-96.
Noble, K. G., Tottenham, N., & Casey, B. J. (2005) Neuroscience Perspectives
on Disparities in School Readiness and Cognitive Achievement. The Future of
Children, 15, 71-89.
O'Connor, M. J., Shah, B., Whaley, S., Cronin, P., Gunderson, B., & Graham, J.
(2002) Psychiatric illness in a clinical sample of children with prenatal alcohol
exposure. American Journal of Drug & Alcohol Abuse, 28, 743-54.
O'Hara, N. M., Baranowski, T., & Simons-Morton, B. G. (1989) Validity of the
of the observation of childrens physical activity. Research Quarterly for Exercise
& Sport., 60, 42-47.
Oja, L. & Jurimae, T. (2002) Physical activity, motor ability, and school
readiness of 6-yr.-old children. Perceptual and Motor Skills, 95, 407-415.
Okely, A. D., Booth, M. L., & Patterson, J. W. (2001) Relationship of physical
activity to fundamental movement skills among adolescents. Medicine and
Science in Sports and Exercise, 33, 1899-1904.
Okely, A. D. & Booth, M. L. (2004) Mastery of fundamental movement skills
among children in New South Wales: prevalence and sociodemographic
distribution. Journal of Science & Medicine in Sport, 7, 358-72.
244
Oliver, M., Schofield, G. M., & Kolt, G. S. (2007) Physical activity in
preschoolers : understanding prevalence and measurement issues. Sports
Medicine, 37, 1045-70.
Owen, A. M., Iddon, J. L., Hodges, J. R., Summers, B. A., & Robbins, T. W.
(1997) Spatial and non-spatial working memory at different stages of Parkinson's
disease. Neuropsychologia, 35, 519-32.
Owen, N., Leslie, E., Salmon, J., & Fotheringham, M. J. (2000) Environmental
determinants of physical activity and sedentary behavior. Exercise & Sport
Sciences Reviews, 28, 153-8.
Pardo, J. V., Fox, P. T., & Raichle, M. E. (1991) Localization of a human system
for sustained attention by positron emission tomography. Nature, 349, 61-4.
Pate, R. R. (2001) Assessment of physical activity and sedentary behavior in pre-
school children: priorities for research (reponse). Pediatric Exercise Science, 13,.
129-130.
Pate, R. R., Pfeiffer, K. A., Trost, S. G., Ziegler, P., & Dowda, M. (2004)
Physical activity among children attending preschools. Pediatrics, 114, 1258-63.
Pate, R. R., Almeida, M. J., McIver, K. L., Pfeiffer, K. A., & Dowda, M. (2006)
Validation and calibration of an accelerometer in preschool children. Obesity, 14,
2000-6.
Pellegrini, A. D. & Smith, P. K. (1998) Physical activity play: the nature and
function of a neglected aspect of playing. Child Development, 69, 577-98.

245
Peluso, M. A. & Guerra de Andrade, L. H. (2005) Physical activity and mental
health: the association between exercise and mood. Clinics (Sao Paulo,
Brazil).60, 61-70.
Penpraze, V., Reilly, J. J., MacLean, C. M., Montgomery, C., Kelly, L. A., Paton,
J. Y., Aitchison, T., & Grant, S. (2006) Monitoring of physical activity in young
children: How much is enough? Pediatric Exercise Science, 18, 483-491.
Perry, B. D. (2002) Childhood experience and the expression of genetic
potential: What childhood neglect tells us about nature and nurture. Brain &
Mind, 3 79-100.
Pham, T. M., Soderstrom, S., Winblad, B., & Mohammed, A. H. (1999) Effects
of environmental enrichment on cognitive function and hippocampal NGF in the
non-handled rats. Behavioural Brain Research, 103, 63-70.
Piper, M. C. & Darrah, J. (1994) Motor assessment of the developing infant
Philidelphia., Saunders.
Podewils, L. J., Guallar, E., Kuller, L. H., Fried, L. P., Lopez, O. L., Carlson, M.,
& Lyketsos, C. G. (2005) Physical activity, APOE genotype, and dementia risk:
findings from the Cardiovascular Health Cognition Study. American Journal of
Epidemiology, 161, 639-51.
Polich, J., Ladish, C., & Burns, T. (1990) Normal variation of P300 in children:
Age, memory span, and head size. International Journal of Psychophysiology, 9,
237 -248.

246
Posner, M. I. (1980) Orienting of attention. Quarterly Journal of Experimental
Psychology, 41A, 19-14.
Posner, M. I. & Petersen, S. E. (1990) The attention system of the human brain.
Annual Review of Neuroscience, 13, 25-42.
Posner, M. I. & Rothbart, M. K. (2007) Research on attention networks as a
model for the integration of psychological science. Annual Review of
Psychology, 58, 1-23.
Posner, M. I. & Raichle, M. E. (1994) Images of mind. New York, Scientific
American Books.
Posner, M. I. & Raichle, M. E. (1995) Prec of Images of Mind. Behavioral and
Brain Sciences, 18, 327 -383.
Prakash, R. S., Snook, E. M., Erickson, K. I., Colcombe, S. J., Voss, M. W.,
Motl, R. W., & Kramer, A. F. (2007) Cardiorespiratory fitness: A predictor of
cortical plasticity in multiple sclerosis. Neuroimage, 34, 1238-44.
Puhl, J., Greaves, K., Hoyt, M., & Baranowski, T. (1990) Children's Activity
Rating Scale (CARS): description and calibration. Research Quarterly for
Exercise & Sport, 61, 26-36.
Puyau, M. R., Adolph, A. L., Vohra, F. A., & Butte, N. F. (2002) Validation and
calibration of physical activity monitors in children. Obesity Research, 10, 150-7.
Radak, Z., Kaneko, T., Tahara, S., Nakamoto, H., Pucsok, J., Sasvari, M.,
Nyakas, C., & Goto, S. (2001) Regular exercise improves cognitive function and

247
decreases oxidative damage in rat brain. Neurochemistry International, 38, 17-
23.
Rahman, S., Robbins, T. W., & Sahakian, B. J. (1999) Comparative cognitive
neuropsychological studies of frontal lobe function: implications for therapeutic
strategies in frontal variant frontotemporal dementia. Dementia & Geriatric
Cognitive Disorders, 10, S15-28.
Raichle, M. E., Fiez, J. A., Videen, T. O., & MacLeod, A. M. (1994) Practice-
related changes in human brain functional anatomy during nonmotor learning.
Cerebral Cortex, 4, 8-26.
Ratner, S., Laor, N., Bronstein, Y., Weizman, A., & Toren, P. (2005) Six-week
open-label reboxetine treatment in children and adolescents with attention-
deficit/hyperactivity disorder. Journal of the American Academy of Child &
Adolescent Psychiatry, 44,428-33.
Raz, N. (2000) Aging of the brain and its impact on cognitive performance:
Integration of structural and functional findings. 2nd Edition, pp 1-90, Mahwah,
NJ, US: Lawrence Erlbaum Associates.
Reilly, J. J. & McDowell, Z. C. (2003) Physical activity interventions for the
treatment and prevention of childhood obesity. Proceedings of the Nutritional
Society., 62, 611-619.
Reilly, J. J., Jackson, D. M., Montgomery, C., Kelly, L. A., Slater, C., Grant, S.,
& Paton, J. Y. (2004) Physical activity in young children (correspondence).
Lancet, 363, 1163-1164.
248
Reilly, J. J., Penpraze, V., Hislop, J., Davies, G., Grant, S., & Paton, J. Y. (2008)
Objective measurement of physical activity and sedentary behaviour: a review
with new data. Archives of Disease in Childhood., 93, 614-619.
Reilly, J. J., Coyle, J., Kelly, L., Burke, G., Grant, S., & Paton, J. Y. (2003) An
objective method for measurement of sedentary behavior in 3- to 4-year olds.
Obesity Research, 11, 1155-8.
Reilly, J. J., Jackson, D. M., Montgomery, C., Kelly, L. A., Slater, C., Grant, S.,
& Paton, J. Y. (2004) Total energy expenditure and physical activity in young
Scottish children: Mixed longitudinal study. Lancet, 363, 211-212.
Reilly, J. J., Kelly, L., Montgomery, C., Williamson, A., Fisher, A., McColl, J.
H., Lo, C. R., Paton, J. Y., & Grant, S. (2006) Physical activity to prevent obesity
in young children: cluster randomised controlled trial.[see comment]. BMJ, 333,
1041.
Richard, D. & Boisvert, P. (2006) The Neurobiology of Obesity. Obesity, 14,
187S -188S.
Ridley, K. & Olds, T. (2001) Video center games: energy cost and children's
behaviours. Pediatric Exercise Science, 13, 413-421.
Robbins, T. W., James, M., Owen, A. M., Sahakian, B. J., McInnes, L., &
Rabbitt, P. (1994) Cambridge neuropsychological test automated battery
(CANTAB): A factor analytic study of a large sample of normal elderly
volunteers. Dementia, 5, 266-281.

249
Rockwood, K. & Middleton, L. (2007) Physical activity and the maintenance of
cognitive function. Alzheimer's & Dementia, 3,S38-S44.
Rodrigues, L. P., Saraiva, L., & Gabbard, C. (2005) Development and construct
validation of an inventory for assessing the home environment for motor
development. Research Quarterly for Exercise & Sport, 76, 140-8.
Rogers, R. L., Meyer, J. S., & Mortel, K. F. (1990) After reaching retirement age
physical activity sustains cerebral perfusion and cognition. Journal of the
American Geriatrics Society, 38, 123-8.
Rogers, R. L. e. a. (1990) After reaching retirement age physical activity sustains
cerebral perfusion and cognitive function. Journal of American Geriatric Society,
38, 123-128.
Rojas, V. S., Struder, H. K., Vera, W. B., Schmidt, A., Bloch, W., & Hollmann,
W. (2006) Acute BDNF and cortisol response to low intensity exercise and
following ramp incremental exercise to exhaustion in humans. Brain Research,
59-65.
Rosblad, B. & Gard, L. (1998) The assessment of children with developmental
coordination disorders in Sweden: A preliminary investigation of the suitability
of the movement ABC. Human Movement Science, 17, 711-719.
Rosenblum, S. (2006) The development and standardization of the Children
Activity Scales (ChAS-P/T) for the early identification of children with
Developmental Coordination Disorders. Child: Care, Health and Development,
32, 619 -632.

250
Roth, D. L. (1989) Acute emotional and psychophysiological effects of aerobic
exercise. Psychophysiology, 26, 593-602.
Rovio, S., Kareholt, I., Helkala, E. L., Viitanen, M., Winblad, B., Tuomilehto, J.,
Soininen, H., Nissinen, A., & Kivipelto, M. (2005) Leisure-time physical activity
at midlife and the risk of dementia and Alzheimer's disease. Lancet Neurology, 4,
705-11.
Rowe, D., Mahar, M., & Raedeke, T. (2004) Measuring physical activity with
pedometers: reliability, reactivity and replacement of missing data. Pediatric
Exercise Science., 16, 343-354.
Rowlands, A. V. & Eston, R. G. (2005) Comparison of accelerometer and
pedometer measures of physical activity in boys and girls, ages 8-10 years.
Research Quarterly for Exercise & Sport, 76, 251-7.
Rowland (1996) Developmental exercise physiology. Human Kinetics
Rowlands, A. V. (2007) Accelerometer assessment of physical activity in
children: An update. Pediatric Exercise Science, 19, 252-266.
Rueda, M. R., Fan, J., McCandliss, B. D., Halparin, J. D., Gruber, D. B., Lercari,
L. P., & Posner, M. I. (2004) Development of attentional networks in childhood.
Neuropsychologia, 42, 1029-40.
Rueda, M. R., Posner, M. I., & Rothbart, M. K. (2005) The development of
executive attention: contributions to the emergence of self-regulation.
Developmental Neuropsychology, 28, 573-94.
251
Rueda, M. R., Rothbart, M. K., McCandliss, B. D., Saccomanno, L., & Posner,
M. I. (2005) Training, maturation, and genetic influences on the development of
executive attention. Proceedings of the National Academy of Sciences of the
United States of America, 102, 14931-6.
Rueda, M. R., Posner, M. I., & Rothbart, M. K. (2005) The development of
executive attention: contributions to the emergence of self-regulation.
Developmental Neuropsychology, 28, 573-94.
Russell, D. J., Rosenbaum, P. L., Cadman, D. T., Gowland, C., Hardys, S., &
Jarvis, S. (1989) The Gross Motor Function Test: a means to evaluate the effects
of physical therapy. Developmental Medicine & Child Neurology, 31, 341-352.
Sabbagh, M. A., Xu, F., Carlson, S. M., Moses, L. J., & Lee, K. (2006) The
development of executive functioning and theory of mind. A comparison of
Chinese and U.S. preschoolers. Psychological Science, 17, 74-81.
Saelens, B. E., Sallis, J. F., Nader, P. R., Broyles, S. L., Berry, C. C., & Taras, H.
L. (2002) Home environmental influences on children's television watching from
early to middle childhood. Journal of Developmental & Behavioral Pediatrics,
23, 127-32.
Sahay, A. & Hen, R. (2007) Adult hippocampal neurogenesis in depression.
Nature Neuroscience, 10, 1110-5.
Sallis, J. F., Berry, C. C., Broyles, S. L., McKenzie, T. L., & Nader, P. R. (1995)
Variability and tracking of physical activity over 2 yr in young children.
Medicine & Science in Sports & Exercise, 27, 1042-9.

252
Salvia & Ysseldyke (2004) Assessment in Special and Inclusive Education, 9th
Ed Boston, Houghton Miflin.
Savitz, J., Solms, M., & Ramesar, R. (2006) The molecular genetics of cognition:
dopamine, COMT and BDNF. Genes, Brain, & Behavior, 5, 311-28.
Schlaggar, B. L., Brown, T. T., Lugar, H. M., Visscher, K. M., Miezin, F. M., &
Petersen, S. E. (2002) Functional neuroanatomical differences between adults
and school-age children in the processing of single words. Science, 296, -1479.
Schneider, P. L., Crouter, S. E., & Lukajic, O. e. al. (2003) Accuracy and
reliability of 10 pedometers for measuring steps over a 400 m walk. Medicine &
Science in Sports & Exercise., 35, 1779-1784.
Schneider, P. L., Crouter, S. E., & Basset, j. D. R. (2004) Pedometer measures of
free-living physical activity: comparison of 13 models. Medicine & Science in
Sports & Exercise., 36, 331-335.
Schoeller, D. A. & van Santen, E. (1982) Measurement of energy expenditure in
humansby the doubly labelled water method. Journal of Applied Physiology, 53,
955-959.
Shephard, R. J. (1996) Habitual physical activity and academic performance.
Nutrition Reviews, 54, S32-6.
Sibley, B. A. & Etnier, J. L. (2003) The relationship between physical activity
and cognition in children : a meta-analysis. Pediatric Exercise Science, 15, 243-
256.

253
Sigfusdottir, I. D., Kristjansson, A. L., & Allegrante, J. P. (2007) Health
behaviour and academic achievement in Icelandic school children. Health
Education Research, 22, 70-80.
Smith, A. D. & Zigmond, M. J. (2003) Can the brain be protected through
exercise? Lessons from an animal model of parkinsonism. Experimental
Neurology, 184, 31-9.
Smits-Engelsman, B. C., Fiers, M. J., Henderson, S. E., & Henderson, L. (2008)
Interrater reliability of the movement assessment battery for children. Physical
Therapy, 88, 286-94.
Smits-Engelsman, B. C. M., Henderson, S. E., & Michels, C. G. J. (1998) The
assessment of children with developmental coordination disorders in the
Netherlands: The relationship between the Movement Assessment Battery for
Children and the Korperkoordinations Test fur Kinder. Human Movement
Science, 17, 713-719.
Spinks, A., Macpherson, A., Bain, C., & McClure, R. (2006) Determinants of
sufficient daily activity in Australian primary school children. Journal of
Paediatrics & Child Health, 42, 674-9.
Squire, L. R., Haist, F., & Shimamura, A. P. (1989) The neurology of memory:
quantitative assessment of retrograde amnesia in two groups of amnesic patients.
Journal of Neuroscience, 9, 828-39.
Squires, J., Bricker, D., & Potter, L. (1997) Revision of a parent-completed
developmental screening tool: Ages and stages questionnaires. Journal of
Pediatric Psychology, 22, 313-328.
254
Strasser, A., Skalicky, M., Hansalik, M., & Viidik, A. (2006) The Impact of
Environment in Comparison with Moderate Physical Exercise and Dietary
Restriction on BDNF in the Cerebral Parietotemporal Cortex of Aged Sprague-
Dawley Rats. Gerontology, 52, 377 -381.
Strong, W. B., Malina, R. M., Blimkie, C. J. R., Daniels, S. R., Dishman, R. K.,
Gutin, B., Hergenroeder, A. C., Must, A., Nixon, P. A., Pivarnik, J. M., Rowland,
T., Trost, S., & Trudeau, F. (2005) Evidence based physical activity for school-
age youth. Journal of Pediatric, 146, 732-737.
Swanson, J. M. (2003) Role of Executive Function in ADHD. Journal of Clinical
Psychiatry, 64, 35 -39.
Symons, C. W., Cinelli, B., James, T. C., & Groff, P. (1997) Bridging student
health risks and academic achievement through comprehensive school health
programs. Journal of School Health, 67, 220-7.
Tamis-LeMonda, C. S., Shannon, J. D., Cabrera, N. J., & Lamb, M. E. (2004)
Fathers and mothers at play with their 2- and 3-year-olds: contributions to
language and cognitive development. Child Development, 75, 1806-20.
Tan, B., Aziz, A. R., Chua, K., & Teh, K. C. (2002) Aerobic demands of the
dance simulation game. International Journal of Sports Medicine, 23, 125-129.
Tang, Y. Y., Ma, Y., Wang, J., Fan, Y., Feng, S., Lu, Q., Yu, Q., Sui, D.,
Rothbart, M. K., Fan, M., & Posner, M. I. (2007) Short-term meditation training
improves attention and self-regulation. Proceedings of the National Academy of
Sciences of the United States of America, 104, 17152-6.

255
Temple, J. L., Giacomelli, A. M., Kent, K. M., Roemmich, J. N., & Epstein, L.
H. (2007) Television watching increases motivated responding for food and
energy intake in children. American Journal of Clinical Nutrition, 85, 355-61.
Themanson, J. R., Hillman, C. H., & Curtin, J. J. (2006) Age and physical
activity influences on action monitoring during task switching. Neurobiology of
Aging, 27, 1335-45.
Thomas, K. M. (2003) Assessing brain development using neurophysiologic and
behavioral measures. Journal of Pediatrics, 143, S46-53.
Thomas, K. M. & Nelson, C. A. (1996) Age-related changes in the
electrophysiological response to visual stimulus novelty: A topographical
approach. Electroencephalography & Clinical Neurophysiology, 98, 294 -308.
Tomporowski, P. D. Cognitive and behavioral responses to acute exercise in
youths: a review. Pediatric Exercise Science, 15, 348-359.
Tomporowski, P. D. & Ellis, N. R. (1984) Effects of exercise on the physical
fitness, intelligence, and adaptive behavior of institutionalized mentally retarded
adults. Applied Research in Mental Retardation, 5, 329-337.
Tomporowski, P. D. & Ellis, N. R. (1985) The effects of exercise on the health,
intelligence, and adaptive behavior of institutionalized severely and profoundly
mentally retarded adults: a systematic replication. Applied Research in Mental
Retardation, 6, 465-73.
Tomporowski, P. D. & Ellis, N. R. (1986) Effects of exercise on cognitive-
processes - a review. Psychological Bulletin, 99, 338-346.

256
Tomporowski, P. D., Ellis, N. R., & Stephens, R. (1987) The immediate effects
of strenuous exercise on free-recall memory. Ergonomics, 30, 121-129.
Tomporowski, P. D., Simpson, R. G., & Hager, L. (1993) Method of recruiting
subjects and performance on cognitive tests. American Journal of Psychology,
106, 499-521.
Tomporowski, P. D. (2003) Effects of acute bouts of exercise on cognition. Acta
Psychologica, 112, 297-324.
Tomporowski, P. D., Beasman, K., Ganio, M. S., & Cureton, K. (2007) Effects
of dehydration and fluid ingestion on cognition. International Journal of Sports
Medicine, 28, 891-6.
Tomporowski, P. D., Davis, C. L., Miller, P. H., & Naglieri, J. A. (2008)
Exercise and children's intelligence, cognition, and academic achievement.
Educational Psychology Review, 20, 111 -131.
Tong, L., Shen, H., Perreau, V. M., Balazs, R., & Cotman, C. W. (2001) Effects
of exercise on gene-expression profile in the rat hippocampus. Neurobiology of
Disease, 8, 1046-1056.
Toren, P., Rehavi, M., Luski, A., Roz, N., Laor, N., Lask, M., & Weizman, A.
(2005) Decreased platelet vesicular monoamine transporter density in children
and adolescents with attention deficit/hyperactivity disorder. European
Neuropsychopharmacology, 15, 159-62.
Townsend, J., Westerfield, M., Leaver, E., Makeig, S., Jung, T., Pierce, K., &
Courchesne, E. (2001) Event-related brain response abnormalities in autism:
257
evidence for impaired cerebello-frontal spatial attention networks. Cognitive
Brain Research, 11, 127-45.
Trejo, J. L., Carro, E., Nunez, A., & Torres-Aleman, I. (2002) Sedentary life
impairs self-reparative processes in the brain: the role of serum insulin-like
growth factor-I. Reviews in the Neurosciences, 13, 365-74.
Tremblay, M. S., Inman, J. W., & Willms, J. D. (2000) The relationship between
physical activity, self-esteem, and academic achievement in 12-year-old children.
Pediatric Exercise Science, 12, 312-323.
Treuth, M. S., Schmitz, K., Catellier, D. J., McMurray, R. G., Murray, D. M.,
Almeida, M. J., Going, S., Norman, J. E., & Pate, R. (2004) Defining
accelerometer thresholds for activity intensities in adolescent girls. Medicine and
Science in Sports and Exercise, 36, 1259-1266.
Troiano, R., Berrigan, D., Dodd, K., Masse, L., Tilert, T., & McDowell, M.
(2008) Physical Activity in the United States Measured by Accelerometer.
Medicine & Science in Sports & Exercise., 40, 181-8.
Trost, S. G., Ward, D. S., Moorehead, S. M., Watson, P. D., Riner, W., & Burke,
J. R. (1998) Validity of the computer science and applications (CSA) activity
monitor in children. Medicine & Science in Sports & Exercise, 30, 629-33.
Trost, S. G., McIver, K. L., & Pate, R. R. (2005) Conducting accelerometer-
based activity assessments in field-based research. Medicine & Science in Sports
& Exercise, 37, S531-43.
258
Trost, S. G., Way, R., & Okely, A. D. (2006) Predictive validity of three
ActiGraph energy expenditure equations for children. Medicine & Science in
Sports & Exercise, 38, 380-7.
Trost, S. G. (2007) State of the art reviews: measurement of physical activity in
children and adolescents. American Journal of Lifestyle Medicine, 1, 299-314.
Trudeau, F. & Shephard, R. J. (2005) Contribution of school programmes to
physical activity levels and attitudes in children and adults. Sports Medicine, 35,
89-105.
Trudeau, F. & Shephard, R. J. (2008) Physical education, school physical
activity, school sports and academic performance. International Journal of
Behavioral Nutrition & Physical Activity, 5, 10.
Turgut, G., Kaptanoglu, B., Turgut, S., Genc, O., & Tekinturk, S. (2001)
Influence of acute exercise on urinary protein, creatinine, insulin-like growth
factor-I (IGF-I) and IGF binding protein-3 concentrations in children. Tohoku
Journal of Experimental Medicine, 201, 165-170.
Tuson, K. M. & Sinyor, D. (1993) On the affective benefits of acute aerobic
exercise: taking stock after twenty years of research, Exercise psychology: the
influence of physical exercise on psychological processes, pp80-121, New York,
Toronto.
Ulrich, B. D. (2004) Perceptions of physical competence, motor competence, and
participation in organised sport. Research Quarterly for Exercise & Sport., 58,
57-67.

259
Ulrich, D. 1985, Test of Gross Motor Development PRO:ED, Austin TX.
Ulrich, D. 2000, Test of Gross Motor Development (TGMD-2), 2nd edn,
PRO:ED, Austin, TX.
US Deparment of Health: Healthy People 2010. 2008.
van Beurden, E., Zask, A., Barnett, L. M., & Dietrich, U. C. (2002) Fundamental
movement skills--how do primary school children perform? The 'Move it Groove
it' program in rural Australia. Journal of Science & Medicine in Sport, 5, 244-52.
van Beurden, E., Barnett, L. M., Zask, A., Dietrich, U. C., Brooks, L. O., &
Beard, J. (2003) Can we skill and activate children through primary school
physical education lessons? "Move it Groove it"--a collaborative health
promotion intervention. Preventive Medicine, 36, 493-501.
van Hartingsveldt, M. J., Cup, E. H. C., & Oostendorp, R. A. B. (2005)
Reliability and validity of the fine motor scale of the Peabody Developmental
Motor Scales-2. Occupational Therapy International, 12, 1-13.
Van Luit, J. E. H., Kroesbergen, E. H., & Naglieri, J. A. (2005) Utility of the
PASS Theory and Cognitive Assessment System for Dutch Children With and
Without ADHD. Journal of Learning Disabilities, 38, 434-439.
van Praag, H., Kempermann, G., & Gage, F. H. (1999) Running increases cell
proliferation and neurogenesis in the adult mouse dentate gyrus. Nature
Neuroscience, 2, 266-270.
van Praag, H., Kempermann, G., & Gage, F. H. (2000) Neural consequences of
environmental enrichment. Nature Reviews Neuroscience,1, 191-8.

260
Vaynman, S., Ying, Z., & Gomez-Pinilla, F. (1920) Hippocampal BDNF
mediates the efficacy of exercise on synaptic plasticity and cognition. European
Journal of Neuroscience, 20, 2580-2590.
Vaynman, S., Ying, Z., & Gomez-Pinilla, F. (2004) Exercise induces BDNF and
synapsin I to specific hippocampal subfields. Journal of Neuroscience Research,
76, 356-62.
Vaynman, S. S., Ying, Z., Yin, D., & Gomez-Pinilla, F. (2006) Exercise
differentially regulates synaptic proteins associated to the function of BDNF.
Brain Research, 1070, 124-30.
Vincent, S. D. & Pangrazi, R. P. (2002) Does reactivity exist in children when
measuring activity levels with pedometers? Pediatric Exercise Science., 16, 343-
354.
Voigt, R. G., Llorente, A. M., Jensen, C. L., Fraley, J. K., Berretta, M. C., &
Heird, W. C. (2001) A randomized, double-blind, placebo-controlled trial of
docosahexaenoic acid supplementation in children with attention-
deficit/hyperactivity disorder. Journal of Pediatrics, 139, 189-96.
Wang, K., Fan, J., Dong, Y., Wang, C. Q., Lee, T. M., & Posner, M. I. (2005)
Selective impairment of attentional networks of orienting and executive control
in schizophrenia. Schizophrenia Research, 78, 235-41.
Weickert, C. S., Hyde, T. M., Lipska, B. K., Herman, M. M., Weinberger, D. R.,
& Kleinman, J. E. (2003) Reduced brain-derived neurotrophic factor in
prefrontal cortex of patients with schizophrenia. Molecular Psychiatry, 8, 592-
610.
261
Welk, G. J. & Corbin, C. B. (1995) The validitiy of the Tritrac RD3 activity
monitor for the assessment of physical activity in children. Research Quarterly
for Exercise & Sport., 66, 202-209.
Welsh, A. U. & Labbe, E. E. (1994) Children and aerobic exercise - a review of
cognitive and behavioural effects. Journal of Experimental and Child
Psychology, 58, 405-4170.
Westerterp, K. R. (1999) Physical activity assessment with accelerometers.
International Journal of Obesity & Related Metabolic Disorders: Journal of the
International Association for the Study of Obesity, 23 S45-9.
Weuve, J., Kang, J. H., Manson, J. E., Breteler, M. M., Ware, J. H., & Grodstein,
F. (2004) Physical activity, including walking, and cognitive function in older
women. JAMA, 292, 1454-61.
Whitmer, R. A., Gunderson, E. P., Barrett-Connor, E., Quesenberry, C. P., Jr., &
Yaffe, K. (2005) Obesity in middle age and future risk of dementia: a 27 year
longitudinal population based study. BMJ, 330, 1360.
Wiart, L. & Darrah, J. (2001) Review of four tests of gross motor development.
Developmental Medicine & Child Neurology, 43, 279-285.
Wright, H. C., Sugden, D. A., Ng, R., & Tan, J. (1994) Identification of children
with movement problems in Singapore: Usefulness of the movement ABC
checklist. Adapted Physical Activity Quarterly, 11, 150-157.

262
Yaffe, K., Barnes, D., Nevitt, M., Lui, L. Y., & Covinsky, K. (2001) A
prospective study of physical activity and cognitive decline in elderly women.
Nature Neuroscience, 161, 1703-1708.
Yaffe, K., Barnes, D., Nevitt, M., Lui, L. Y., & Covinsky, K. (2001) A
prospective study of physical activity and cognitive decline in elderly women:
women who walk.[see comment]. Archives of Internal Medicine, 161, 1703-8.
Yaffe, K., Kanaya, A., Lindquist, K., Simonsick, E. M., Harris, T., Shorr, R. I.,
Tylavsky, F. A., & Newman, A. B. (2004) The Metabolic Syndrome,
Inflammation, and Risk of Cognitive Decline. JAMA: Journal of the American
Medical Association, 292, 2237-2242.
Yagi, Y., Coburn, K. L., Estes, K. M., & Arruda, J. E. (1999) Effects of aerobic
exercise and gender on visual and auditory P300, reaction time, and accuracy.
European Journal of Applied Physiology and Occupational Physiology, 80, 402-
408.
Ying, Z., Roy, R. R., Edgerton, V. R., & Gomez-Pinilla, F. (2003) Voluntary
exercise increases neurotrophin-3 and its receptor TrkC in the spinal cord. Brain
Research, 987, 93-9.
Youngstedt, S. D. (2005) Effects of exercise on sleep. [Review] [71 refs]. Clinics
in Sports Medicine, 24, 355-65, xi.
Zelazo, P. D., Muller, U., Frye, D., Marcovitch, S., Argitis, G., Boseovski, J.,
Chiang, J. K., Hongwanishkul, D., Schuster, B. V., & Sutherland, A. (2003) The
development of executive function in early childhood. Monographs of the
Society for Research in Child Development, 68, vii-137.

263
Websites
www.cantab.com
www.consort-statement.org
www.pstnet.com Psychology Software Tools Inc.
www.rwjf.org (2007) www.rwjf.org/files/publications/other/HealthySchools.pdf.
The Robert Johnson Foundation Healthy Schools for Healthy Kids.
www.sacklerinstitute.org/users/jin.fan/ (2007) Sackler Institute.
www.theactigraph.com

264
Appendix

265
Appendix I.a Cognitive Assessment System (CAS) Planning Scale: Matching
Numbers
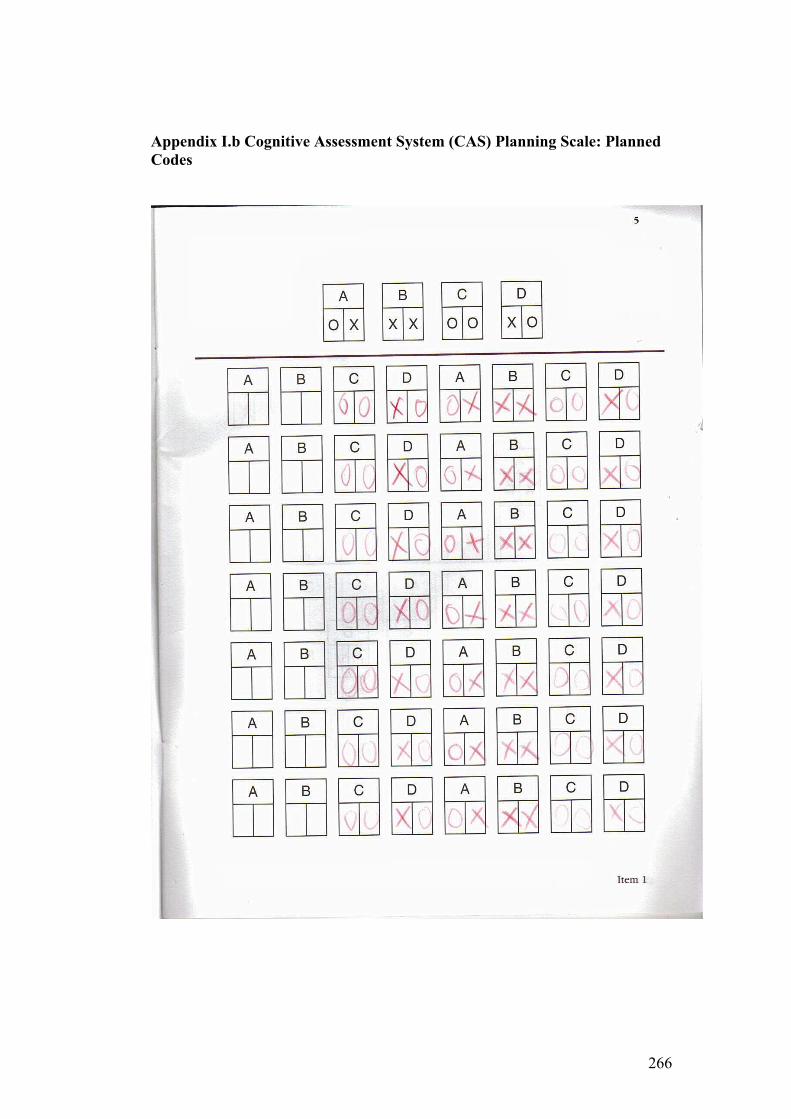
266
Appendix I.b Cognitive Assessment System (CAS) Planning Scale: Planned
Codes

267
Appendix II.a
Conner’s Parent Rating Scale: Short Form

268
Appendix II.b
Conner’s Parent Rating Scale: Short Form Conversion sheet for age and
gender related T scores

269
Appendix III.
Raw data from Attention Network Test in n=62 6 year old Scottish children at baseline.
Warning Centre Double No Down Up
Flanker RT SD AC SD RT SD AC SD RT SD AC SD RT SD AC SD RT SD AC SD
Congruent 928 176 9 3 924 150 10 3 990 152 9 2 956 214 5 1 923 187 5 1
Incongruent 1038 175 8 3 1019 178 8 3 1094 151 7 3 1045 187 4 2 1034 211 4 2
Neutral 919 155 10 2 888 190 10 2 992 150 9 3 868 163 5 1 922 193 5 2 Reaction time (RT) = mean of median (ms). Reaction time to stimulus (central fish) appearing on screen, mouse button is pressed and time recorded. Accuracy (AC) = Centre / Double / No total correct out of a possible 12; Down & Up total correct from a possible 6. Accuracy is whether correct mouse button is pressed (in response to direction fish is facing). Children were n=62 mean age 6.1 SD 0.2 participants of the LEAPFROG pilot study. Congruent – fish all pointing in the same direction; incongruent – middle fish pointing the opposite way from the others; Neutral only one fish. The warnings are stars that appear before stimulus onset – either a single in the centre, 2 (double) at top and bottom, none ‘no’ or down (bottom) up (top).
Raw data from Attention Network Test in n=62 6 year old Scottish children at 3 week retest. 3 week re- test Centre Double No Down Up
Flanker / Warning RT SD AC SD RT SD AC SD RT SD AC SD RT SD AC SD RT SD AC SD
Congruent 821 171 10 2 836 164 10 2 930 135 9 2 818 184 5 1 840 171 5 1
Incongruent 917 151 8 3 899 163 9 3 988 180 8 3 889 165 4 1 879 203 4 2
Neutral 829 159 9 2 798 170 10 2 908 156 9 2 788 172 5 1 824 185 5 1 Reaction time (RT) = mean of median (ms). Reaction time to stimulus (central fish) appearing on screen, mouse button is pressed and time recorded. Accuracy (AC) = Centre / Double / No total correct out of a possible 12; Down & Up total correct from a possible 6. Accuracy is whether correct mouse button is pressed (in response to direction fish is facing). Children were n=62 mean age 6.1 SD 0.2 participants of the LEAPFROG pilot study. Congruent – fish all pointing in the same direction; incongruent – middle fish pointing the opposite way from the others; Neutral only one fish. The warnings are stars that appear before stimulus onset – either a single in the centre, 2 (double) at top and bottom, none ‘no’ or down (bottom) up (top).

270
Correlation coefficients for correlations between baseline and 3 week rest test reaction time and accuracy data (raw data shown in tables
1a & b)
Flanker / Warning Type Centre RT ACC Double RT ACC No ACC Down ACC Up ACC
Congruent 0.23 0.30* 0.27* 0.37* 0.22 0.53** 0.56** 0.30* -0.05 0.41**
Incongruent 0.13 0.50** 0.17 0.55** 0.24 0.42* 0.31* 0.39* 0.19 0.43**
Neutral 0.41** 0.48** 0.25 0.38* 0.24 0.42* 0.19 0.30* 0.13 0.30**
*p<0.05; **p<0.005
Intraclass correlations for baseline and 3 week retest between different flankers and warning types from the Attention Network Test (ANT) Reaction time to stimulus (central fish) appearing on screen, mouse button is pressed and time recorded.; Accuracy (AC) = Centre / Double / No total correct out of a possible 12; Down & Up total correct from a possible 6. Accuracy is whether correct mouse button is pressed (in response to direction fish is facing). Children were n=62 mean age 6.1 SD 0.2 participants of the LEAPFROG pilot study. Congruent – fish all pointing in the same direction; incongruent – middle fish pointing the opposite way from the others; Neutral only one fish. The warnings are stars that appear before stimulus onset – either a single in the centre, 2 (double) at top and bottom, none ‘no’ or down (bottom) up (top).