Relationship between the chemical and morphological characteristics of human dentin after Er:YAG...
9
Relationship between the chemical and morphological characteristics of human dentin after Er:YAG laser irradiation Luís Eduardo Silva Soares Ovídio César Lavesa Martin Lilian Tan Moriyama Cristina Kurachi Airton Abrahão Martin
Transcript of Relationship between the chemical and morphological characteristics of human dentin after Er:YAG...
Relationship between the chemical andmorphological characteristics of humandentin after Er:YAG laser irradiation
Luís Eduardo Silva SoaresOvídio César Lavesa MartinLilian Tan MoriyamaCristina KurachiAirton Abrahão Martin
Relationship between the chemical and morphologicalcharacteristics of human dentin after Er:YAG laserirradiation
Luís Eduardo Silva Soares,a Ovídio César Lavesa Martin,b Lilian Tan Moriyama,c Cristina Kurachi,c andAirton Abrahão Martinb
aUniversidade do Vale do Paraíba, UNIVAP, Department of Dental Materials and Operative Dentistry, School of Dentistry, Research andDevelopment Institute, IP&D, Laboratory of Biomedical Vibrational Spectroscopy, LEVB, Av. Shishima Hifumi, 2911, 12244-000,São José dos Campos, São Paulo, BrazilbUniversidade do Vale do Paraíba, UNIVAP, Research and Development Institute, IP&D, Laboratory of Biomedical Vibrational Spectroscopy,LEVB, Av. Shishima Hifumi, 2911, 12244-000, São José dos Campos, São Paulo, BrazilcUniversidade de São Paulo, USP, Instituto de Física de São Carlos, IFSC, Departamento de Física e Ciências dos Materiais, FCM,Av. Trabalhador São-Carlense, 400, 13566-590, São Carlos, São Paulo, Brazil
Abstract. The effects of laser etching on dentin are studied by microenergy-dispersive x-ray fluorescence spectrom-etry (μ-EDXRF) and scanning electron microscopy (SEM) to establish the correlation of data obtained. Fifteen humanthird molars are prepared, baseline μ-EDXRF mappings are performed, and ten specimens are selected. Each speci-men received four treatments: acid etching (control-CG) or erbium:yttrium–aluminum–garnet (Er:YAG) laser irra-diation (I—100 mJ, II—160 mJ, and III—220 mJ), and maps are done again. The Ca and P content are significantlyreduced after acid etching (p < 0.0001) and increased after laser irradiation with 220 mJ (Ca: p < 0.0153 and P:p ¼ 0.0005). The Ca/P ratio increased and decreased after CG (p ¼ 0.0052) and GI (p ¼ 0.0003) treatments,respectively. CG treatment resulted in lower inorganic content (GI: p < 0.05, GII: p < 0.01, and GIII: p < 0.01)and higher Ca/P ratios than laser etching (GI: p < 0.001, GII: p < 0.01, and GIII: p < 0.01). The SEM photomicrog-raphies revealed open (CG) and partially open dentin tubules (GI, GII, and GIII). μ-EDXRF mappings illustrated thatacid etching created homogeneous distribution of inorganic content over dentin. Er:YAG laser etching (220 mJ)produced irregular elemental distribution and changed the stoichiometric proportions of hydroxyapatite, as showedby an increase of mineral content. Decreases and increases of mineral content in the μ-EDXRF images are correlatedto holes and mounds, respectively, as found in SEM images. © 2013 Society of Photo-Optical Instrumentation Engineers (SPIE) [DOI: 10
.1117/1.JBO.18.6.068001]
Keywords: laser irradiation; tooth mapping; energy-dispersive x-ray fluorescence spectrometry; scanning electron microscopy.
Paper 12728RRR received Nov. 9, 2012; revised manuscript received May 28, 2013; accepted for publication Jun. 3, 2013; publishedonline Jun. 24, 2013.
1 IntroductionEtching of dentin with phosphoric acid is the most traditionalmechanism to remove the smear layer (accumulated layer ofmechanically polished debris) and to partially demineralizedentin and open the dentinal tubules. This application exposesthe collagen layer enhancing the adhesive systems to flowthrough the demineralized layer, creating the micromechanicalretention of composite resin restorations in the microporosities.However, acid etching may make dentin more permeable, and itmay be not completely filled with adhesive.1 Therefore, differentstrategies, such as erbium:yttrium–aluminum–garnet (Er:YAG)laser irradiation, have been proposed to prepare dentin toenhance the adhesion to tooth tissues.
The Er:YAG laser wavelength of 2.94 μm is highly absorbedby both water and hydroxyapatite, and has great applicability indental hard tissues.2 Absorbed laser pulses give rise to micro-explosions on the dentin surface, so that dental hard tissue
can be effectively removed.3 A number of studies have been per-formed to verify the use of Er:YAG laser for dentin etching.4–11
The understanding of Er:YAG laser mechanism of interactionwith dentin is essential since the adhesion of composite resincould be altered by laser irradiation.6,11 Previous investigationson the effects of erbium laser irradiation on dentin and bondingprocedures are somewhat controversial. Staninec et al.12
achieved similar values of shear bond strength with Er:YAGconditioning in comparison with acid etch. Earlier studies onenamel and dentin substrates showed that Er:YAG laser associ-ated with acid etching or self-etching primers produced bondstrength values comparable with those achieved with acidetching or self-etching primers.13,14 Soares et al.11 found byenergy-dispersive x-ray fluorescence spectrometry (EDXRF)mappings that the Er:YAG laser energy of 180 mJ produceda localized increase in Ca and P content on the superficiallayer of the dentin (∼0 to 0.10 mm), which was differentfrom the profile produced by acid etching and laser energiesof 80 and 120 mJ, respectively.
Moretto et al.6 evaluated the dentin morphology and micro-tensile bond strength of irradiated tissue, and found that the
Address all correspondence to: Luís Eduardo Silva Soares, Universidade do Valedo Paraíba, UNIVAP, Department of Dental Materials and Operative Dentistry,Instituto de Pesquisa e Desenvolvimento, IP&D, Laboratório de EspectroscopiaVibracional Biomédica, LEVB. Av. Shishima Hifumi, 2911, Urbanova, CEP12244-000, São José dos Campos, SP, Brazil. Tel: +55 12 39471165; Fax:+55 12 39471165; E-mail: [email protected] 0091-3286/2013/$25.00 © 2013 SPIE
Journal of Biomedical Optics 068001-1 June 2013 • Vol. 18(6)
Journal of Biomedical Optics 18(6), 068001 (June 2013)
erbium laser interacts with the dental hard tissue resulting in aspecific morphological pattern of dentin and collagen fibrils thatnegatively affected the bond strength of composite resin. Theyfound an irregular hybrid layer in the irradiated groups with agreater adhesive deposition in the regions of valleys (bottom ofthe pulse), while the peaks were covered with a thinner adhe-sive layer.
Energy dispersive spectroscopy has been used associatedwith scanning electron microscopy (SEM) analysis to studythe effects of dentin irradiation with Er:YAG15–17 or with Er,Cr:YSGG laser.18,19 Also, microenergy-dispersive x-ray fluores-cence spectrometry (μ-EDXRF) analysis has been used inprevious studies for the same purpose.10,11 However, despitechemical and morphological information provided by thoseprevious studies, none of them correlated the chemical datato morphological changes.
Micro x-ray fluorescence is used to obtain the chemical com-position of a sample without any specific sample preparationsuch as the gold coating that is desired for high-resolutionimages in SEM analysis. Also, the specimens prepared forSEM analysis are coated with carbon to prevent charging.Imaging using μ-EDXRF is nondestructive, and samples can bevisualized several times. Moreover, physical or chemicalfixations as well as coating of surfaces by sputtering for havinga better contrast and conductivity are not necessary. Usingthe standard procedure for preparation of dentin samples inSEM, a sample is dehydrated in graded acetone series, dried,and coated in sputtering device after its fixation. The occurrenceof artifacts caused by shrinking cannot be eliminated in practice,because dentin is strongly sensitive to dehydration.20 Thus theμ-EDXRF analysis became an attractive alternative to evaluatechemical changes on teeth after laser application.
The null hypotheses tested were that there would bedifferences in composition of inorganic phase (Ca and P) of den-tin surfaces prepared using different Er:YAG laser irradiationparameters compared with acid etching. The second aim ofthe present study was to correlate morphological featuresobtained by SEM images with the elemental data obtainedby μ-EDXRF mappings of dentin inorganic content.
2 Materials and Methods
2.1 Specimen Preparation
This study was approved by the Ethics Committee of theUniversidade do Vale do Paraíba (H146/CEP/2009). The spec-imens were prepared from 15 randomly selected, erupted, non-carious human third molars. The teeth used were recentlyextracted (less than 3 months) from patients, where extractionsof third molars were part of their dental treatment (for periodon-tal or orthodontic reasons). The teeth were selected according tothe following criteria: intact buccal enamel surfaces withoutdevelopmental defects, cracks, caries, restorations, or fluorosis.
All the specimens were stored in saline solution (Aster®Produtos Médicos LTDA, Sorocaba, SP, Brazil) at 9°C justafter extraction to help clean the organic debris.21 After extrac-tion, the remaining soft tissue was removed from the tooth sur-face with a dental scaler (7/8, Duflex®, Rio de Janeiro, RJ,Brazil). The teeth were polished with a pumice (S. S.White®, Rio de Janeiro, RJ, Brazil) and water paste using aRobinson brush (Viking–KG Sorensen®, Barureri, SP, Brazil)on a low-speed hand-piece (KaVo® do Brasil SA, Joinvile,SC, Brazil), then cleaned and stored in a 0.1% thymol solution
for 1 week. To prepare the dentin specimens, the teeth werewashed for 24 h with filtered water to eliminate thymolresidues.9,10
After the cleaning procedure, the occlusal one third of thecrowns of the samples were sectioned perpendicular to thelong axis of the teeth by means of a water-cooled low-speeddiamond disc at 250 rpm and with a 100 g load (Isomet1000—BUEHLER, Lake Bluff, Illinois) as previouslydescribed.7,8 The surface was ground for 1 min with wet600-grit silicon carbide paper at 150 rpm to expose the super-ficial dentin layer and to produce a smooth surface.9 Roots wereremoved with a water-cooled low-speed diamond disc produc-ing one dentin disc-shaped slice with 4 mm thickness for eachtooth. All slices were obtained approximately from the sametooth depth.
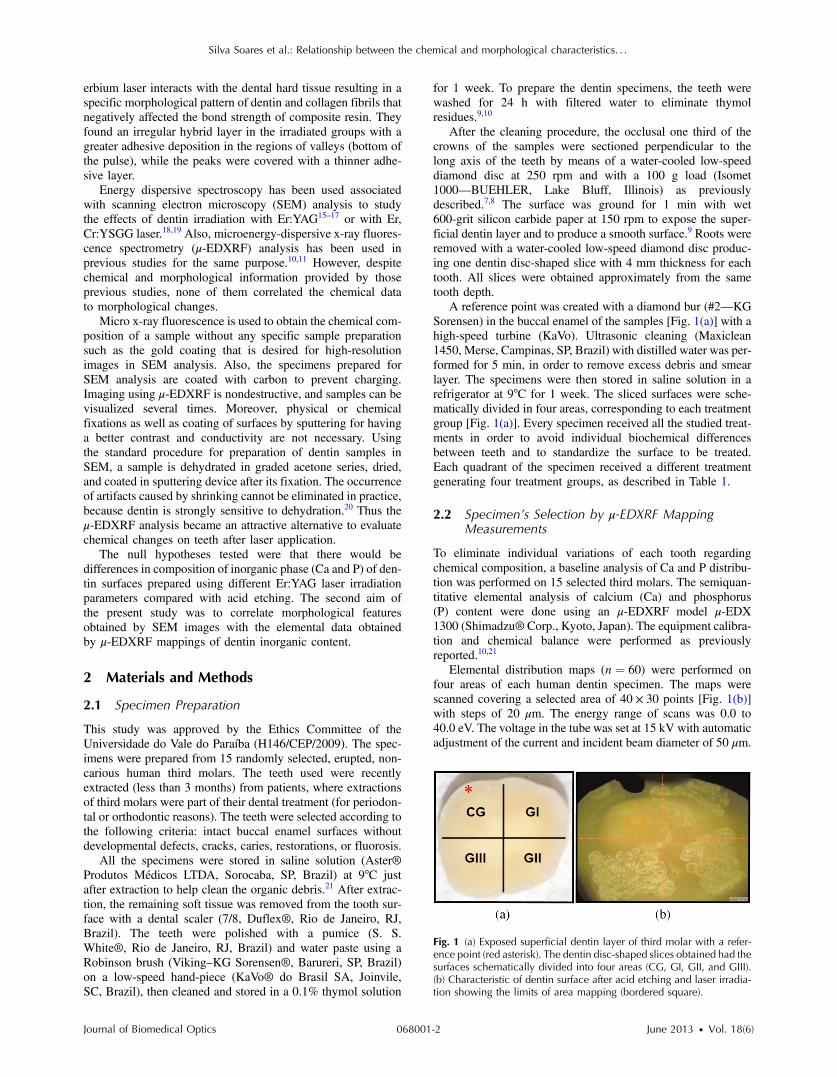
A reference point was created with a diamond bur (#2—KGSorensen) in the buccal enamel of the samples [Fig. 1(a)] with ahigh-speed turbine (KaVo). Ultrasonic cleaning (Maxiclean1450, Merse, Campinas, SP, Brazil) with distilled water was per-formed for 5 min, in order to remove excess debris and smearlayer. The specimens were then stored in saline solution in arefrigerator at 9°C for 1 week. The sliced surfaces were sche-matically divided in four areas, corresponding to each treatmentgroup [Fig. 1(a)]. Every specimen received all the studied treat-ments in order to avoid individual biochemical differencesbetween teeth and to standardize the surface to be treated.Each quadrant of the specimen received a different treatmentgenerating four treatment groups, as described in Table 1.
2.2 Specimen’s Selection by μ-EDXRF MappingMeasurements
To eliminate individual variations of each tooth regardingchemical composition, a baseline analysis of Ca and P distribu-tion was performed on 15 selected third molars. The semiquan-titative elemental analysis of calcium (Ca) and phosphorus(P) content were done using an μ-EDXRF model μ-EDX1300 (Shimadzu® Corp., Kyoto, Japan). The equipment calibra-tion and chemical balance were performed as previouslyreported.10,21
Elemental distribution maps (n ¼ 60) were performed onfour areas of each human dentin specimen. The maps werescanned covering a selected area of 40 × 30 points [Fig. 1(b)]with steps of 20 μm. The energy range of scans was 0.0 to40.0 eV. The voltage in the tube was set at 15 kV with automaticadjustment of the current and incident beam diameter of 50 μm.
Fig. 1 (a) Exposed superficial dentin layer of third molar with a refer-ence point (red asterisk). The dentin disc-shaped slices obtained had thesurfaces schematically divided into four areas (CG, GI, GII, and GIII).(b) Characteristic of dentin surface after acid etching and laser irradia-tion showing the limits of area mapping (bordered square).
Journal of Biomedical Optics 068001-2 June 2013 • Vol. 18(6)
Silva Soares et al.: Relationship between the chemical and morphological characteristics. . .
After mappings, the data of each specimen were processed bythe equipment software (Shimadzu® microEDX MP ver. 1.03,Shimadzu Corp.). The software provided the average values foreach component. After that, five specimens, which showedirregular chemical distribution of Ca and P throughout dentinsurface, were excluded. Next, the 10 selected specimens weresubmitted to four experimental treatments (Table 1).
2.3 Surface Treatment
Specimens were removed from the saline solution and laser irra-diation was performed in a noncontact mode by an Er:YAG laser(Twin Light, Fontana Medical Lasers, Slovenia, λ ¼ 2.94 μm) ata focal distance of 15 mm with a cooling water spray(20 mL∕min). This laser system operates from 200 to 450 μsof pulse duration. Irradiation of the control group quadrantwas avoided, and a visual distance was maintained between thesides of each group. The pulse repetition rate of 10 pulses persecond (10 Hz) was used, and three different radiant pulseenergy parameters were selected (Group I: 120 mJ; Group II:160 mJ; and Group III: 220 mJ). Laser irradiation wasperformed in a sweeping motion, and by this way, 3 s wasthe time to irradiate the whole target area of the specimen.After the irradiation procedure, acid etching was performedon the control group area using 37% phosphoric acid gel(FGM, Joinville, SC, Brazil) for 15 s. The etched surfacewas then rinsed with an air-water spray for 15 s. To preventthe flow of phosphoric acid onto the areas allocated for groupsI, II, and III, acid etching was performed with gel, and the rins-ing procedure was done with the specimen tilted in the opposite
direction to the irradiated areas, thus avoiding contaminationwith acid during the rinsing procedure.7,8 μ-EDXRF area map-pings (n ¼ 40) were performed again to determine the mineralcontent after dentin treatments [Fig. 1(b)] with the same condi-tions used in first measurements.
2.4 SEM Analysis
After treatments, one specimen was randomly selected for SEMobservation. The specimen was mounted on aluminum stubs,and the carbon was thermally evaporated on to the specimens,and then examined using a Supra 50 VP Scanning ElectronMicroscope (EVO-MA10, Carl Zeiss® STM, Oberkochen,Germany) with an acceleration voltage of 20 kV. The SEMimages were captured at the magnification of 5000×.
2.5 Statistical Analysis
Statistical analysis of the μ-EDXRF results was performed usingInstat® software (GraphPad Software, San Diego, California).The Kolmorogov and Smirnov test verified the normal distribu-tion of the sample data. The standard deviations were assessedby Bartlett’s test. Statistical comparisons of Ca and P weightpercentages and the Ca/P ratio between nontreated and treatedvalues (in the same group of treatment) were performed usingthe unpaired t-test with Welch correction. The Kruskal–WallisTest (nonparametric ANOVA) was used to evaluate, after treat-ments, the Ca and P weight percentages and the Ca/P ratiobetween control and laser groups and among laser groups.
3 Resultsμ-EDXRF spectra reveal the mineral dentin content (Ca and P)and Ca/P ratio of dentin before and after treatments (Table 2).The unpaired t-test with Welch correction showed significantreduction in weight percentages of Ca and P (p < 0.0001)and a significant increase in the Ca/P ratio (p ¼ 0.0052) afteracid etching (CG). No significant changes were found in inor-ganic dentin content after laser irradiation at 100 mJ (GI)(p > 0.05). However, the Ca/P ratio significantly decreasedin GI specimens (p ¼ 0.0003). The laser irradiation with160 mJ (GII) did not resulted in significant changes in inorganicdentin content as well as in the Ca/P ratio (p > 0.05). The laser
Table 1 Description of the experimental treatments and parameters.
Groups Surface treatments
Control group 37% phosphoric acid (15 s)
Group I Er:YAG laser (100 mJ, 10 Hz, 3 s)
Group II Er:YAG laser (160 mJ, 10 Hz, 3 s)
Group III Er:YAG laser (220 mJ, 10 Hz, 3 s)
Table 2 Mean and standard deviations (SD) (n ¼ 10) of the average content of calcium (Ca) and phosphorus (P) percentages in the dentin and the Ca/P weight ratios obtained by x-ray fluorescence before (nontreated—N) and after (treated—T) treatments. Statistical comparisons were performed:(a) between N and T data (significant statistical comparisons are highlighted in gray); (b) after treatments between control and laser groups (differentcapital letters shows statistical differences); and (c) among laser groups (the same small letters indicate absence of statistical difference).
Groups
Ca (wt%) P (wt%) Ca/P
Mean (S.D.) p-Value Mean (S.D.) p-Value Mean (S.D.) p-Value
CGN 29.36 (1.31) p < 0.0001 15.91 (0.51) p < 0.0001 1.85 (0.03) p ¼ 0.0052CGT 23.37 (1.04)A 12.15 (0.82)A 1.93 (0.07)A
G1N 30.03 (3.08) p ¼ 0.8128 16.15 (1.28) p ¼ 0.2011 1.86 (0.05) p ¼ 0.0003G1T 29.74 (2.34)Ba 16.82 (0.93)Ba 1.77 (0.04)Ba
G2N 29.96 (1.84) p ¼ 0.1244 16.55 (1.43) p ¼ 0.0709 1.82 (0.07) p ¼ 0.4243G2T 31.59 (2.60)Ba 17.62 (0.98)Ba 1.79 (0.05)Ba
G3N 28.93 (0.99) p < 0.0153 15.72 (0.37) p ¼ 0.0005 1.84 (0.03) p ¼ 0.0645G3T 32.22 (3.42)Ba 17.90 (1.30)Ba 1.80 (0.06)Ba
Journal of Biomedical Optics 068001-3 June 2013 • Vol. 18(6)
Silva Soares et al.: Relationship between the chemical and morphological characteristics. . .
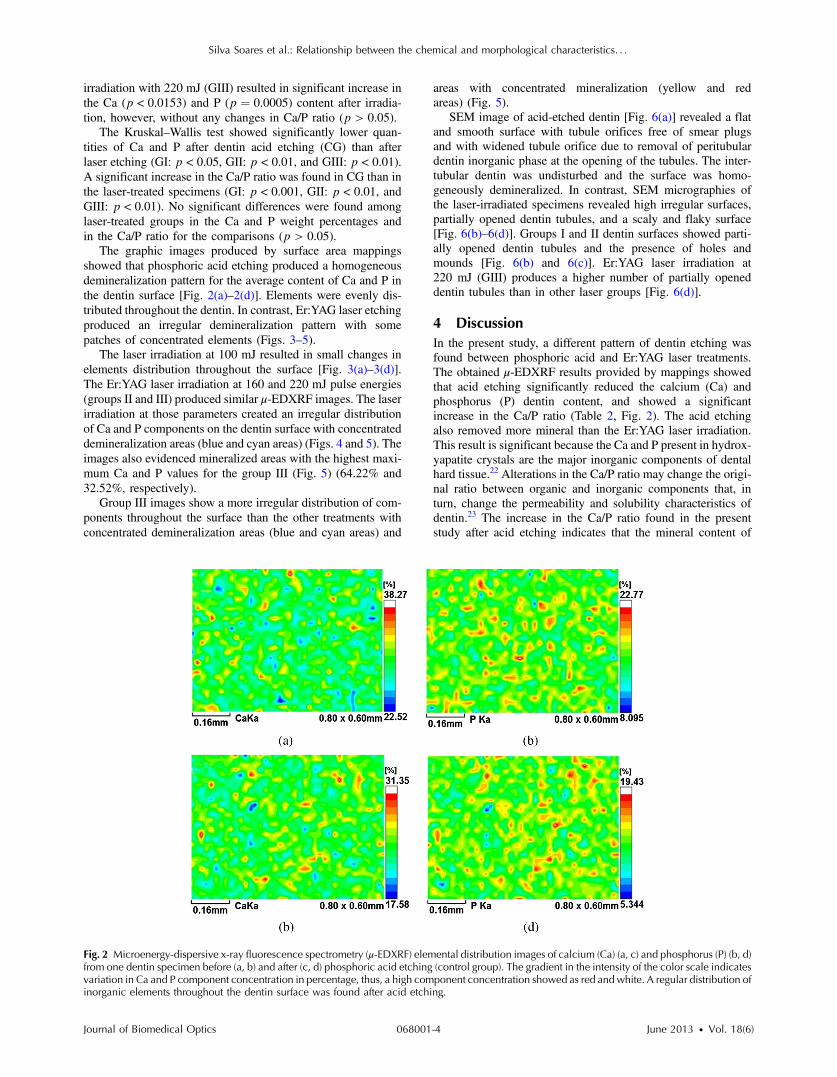
irradiation with 220 mJ (GIII) resulted in significant increase inthe Ca (p < 0.0153) and P (p ¼ 0.0005) content after irradia-tion, however, without any changes in Ca/P ratio (p > 0.05).
The Kruskal–Wallis test showed significantly lower quan-tities of Ca and P after dentin acid etching (CG) than afterlaser etching (GI: p < 0.05, GII: p < 0.01, and GIII: p < 0.01).A significant increase in the Ca/P ratio was found in CG than inthe laser-treated specimens (GI: p < 0.001, GII: p < 0.01, andGIII: p < 0.01). No significant differences were found amonglaser-treated groups in the Ca and P weight percentages andin the Ca/P ratio for the comparisons (p > 0.05).
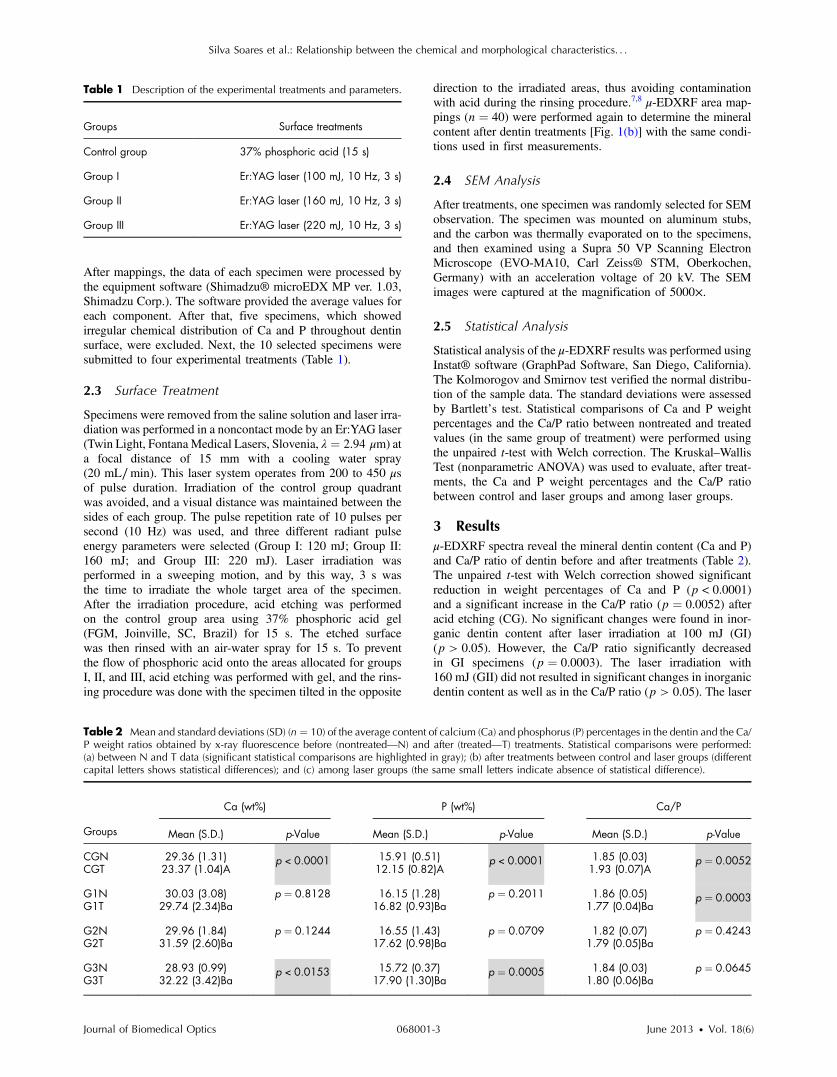
The graphic images produced by surface area mappingsshowed that phosphoric acid etching produced a homogeneousdemineralization pattern for the average content of Ca and P inthe dentin surface [Fig. 2(a)–2(d)]. Elements were evenly dis-tributed throughout the dentin. In contrast, Er:YAG laser etchingproduced an irregular demineralization pattern with somepatches of concentrated elements (Figs. 3–5).
The laser irradiation at 100 mJ resulted in small changes inelements distribution throughout the surface [Fig. 3(a)–3(d)].The Er:YAG laser irradiation at 160 and 220 mJ pulse energies(groups II and III) produced similar μ-EDXRF images. The laserirradiation at those parameters created an irregular distributionof Ca and P components on the dentin surface with concentrateddemineralization areas (blue and cyan areas) (Figs. 4 and 5). Theimages also evidenced mineralized areas with the highest maxi-mum Ca and P values for the group III (Fig. 5) (64.22% and32.52%, respectively).
Group III images show a more irregular distribution of com-ponents throughout the surface than the other treatments withconcentrated demineralization areas (blue and cyan areas) and
areas with concentrated mineralization (yellow and redareas) (Fig. 5).
SEM image of acid-etched dentin [Fig. 6(a)] revealed a flatand smooth surface with tubule orifices free of smear plugsand with widened tubule orifice due to removal of peritubulardentin inorganic phase at the opening of the tubules. The inter-tubular dentin was undisturbed and the surface was homo-geneously demineralized. In contrast, SEM micrographies ofthe laser-irradiated specimens revealed high irregular surfaces,partially opened dentin tubules, and a scaly and flaky surface[Fig. 6(b)–6(d)]. Groups I and II dentin surfaces showed parti-ally opened dentin tubules and the presence of holes andmounds [Fig. 6(b) and 6(c)]. Er:YAG laser irradiation at220 mJ (GIII) produces a higher number of partially openeddentin tubules than in other laser groups [Fig. 6(d)].
4 DiscussionIn the present study, a different pattern of dentin etching wasfound between phosphoric acid and Er:YAG laser treatments.The obtained μ-EDXRF results provided by mappings showedthat acid etching significantly reduced the calcium (Ca) andphosphorus (P) dentin content, and showed a significantincrease in the Ca/P ratio (Table 2, Fig. 2). The acid etchingalso removed more mineral than the Er:YAG laser irradiation.This result is significant because the Ca and P present in hydrox-yapatite crystals are the major inorganic components of dentalhard tissue.22 Alterations in the Ca/P ratio may change the origi-nal ratio between organic and inorganic components that, inturn, change the permeability and solubility characteristics ofdentin.23 The increase in the Ca/P ratio found in the presentstudy after acid etching indicates that the mineral content of
Fig. 2 Microenergy-dispersive x-ray fluorescence spectrometry (μ-EDXRF) elemental distribution images of calcium (Ca) (a, c) and phosphorus (P) (b, d)from one dentin specimen before (a, b) and after (c, d) phosphoric acid etching (control group). The gradient in the intensity of the color scale indicatesvariation in Ca and P component concentration in percentage, thus, a high component concentration showed as red and white. A regular distribution ofinorganic elements throughout the dentin surface was found after acid etching.
Journal of Biomedical Optics 068001-4 June 2013 • Vol. 18(6)
Silva Soares et al.: Relationship between the chemical and morphological characteristics. . .
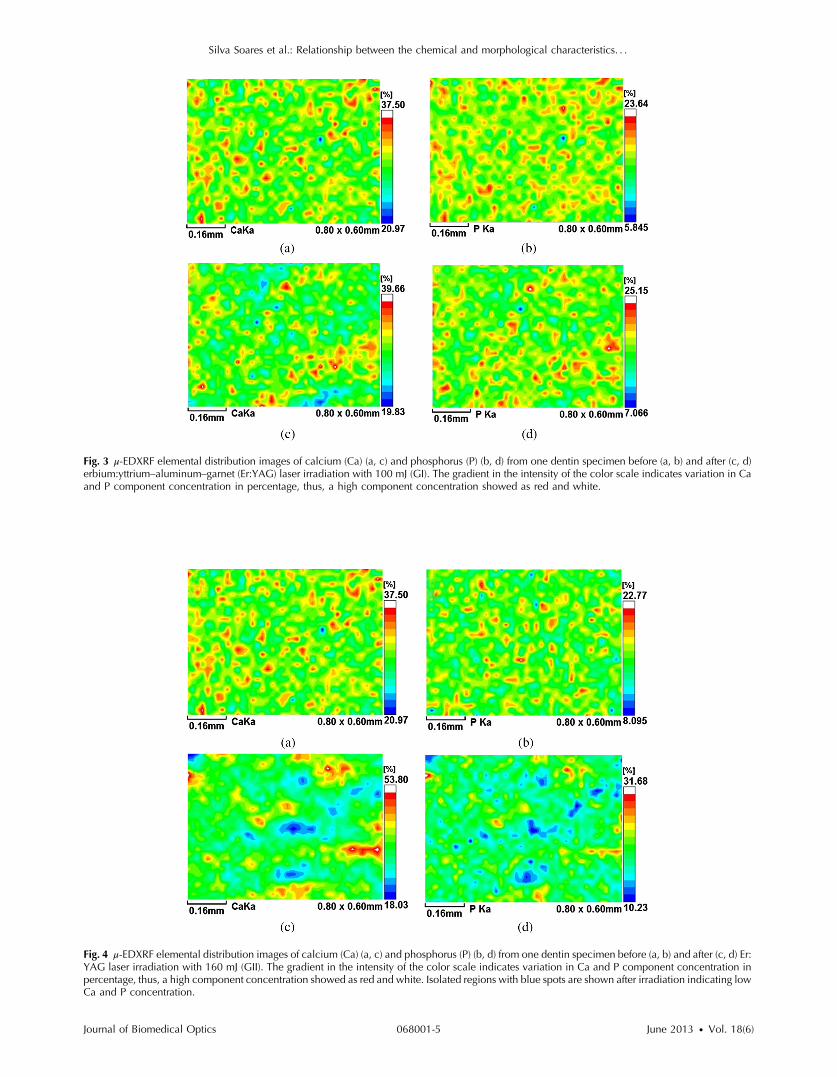
Fig. 3 μ-EDXRF elemental distribution images of calcium (Ca) (a, c) and phosphorus (P) (b, d) from one dentin specimen before (a, b) and after (c, d)erbium:yttrium–aluminum–garnet (Er:YAG) laser irradiation with 100 mJ (GI). The gradient in the intensity of the color scale indicates variation in Caand P component concentration in percentage, thus, a high component concentration showed as red and white.
Fig. 4 μ-EDXRF elemental distribution images of calcium (Ca) (a, c) and phosphorus (P) (b, d) from one dentin specimen before (a, b) and after (c, d) Er:YAG laser irradiation with 160 mJ (GII). The gradient in the intensity of the color scale indicates variation in Ca and P component concentration inpercentage, thus, a high component concentration showed as red and white. Isolated regions with blue spots are shown after irradiation indicating lowCa and P concentration.
Journal of Biomedical Optics 068001-5 June 2013 • Vol. 18(6)
Silva Soares et al.: Relationship between the chemical and morphological characteristics. . .
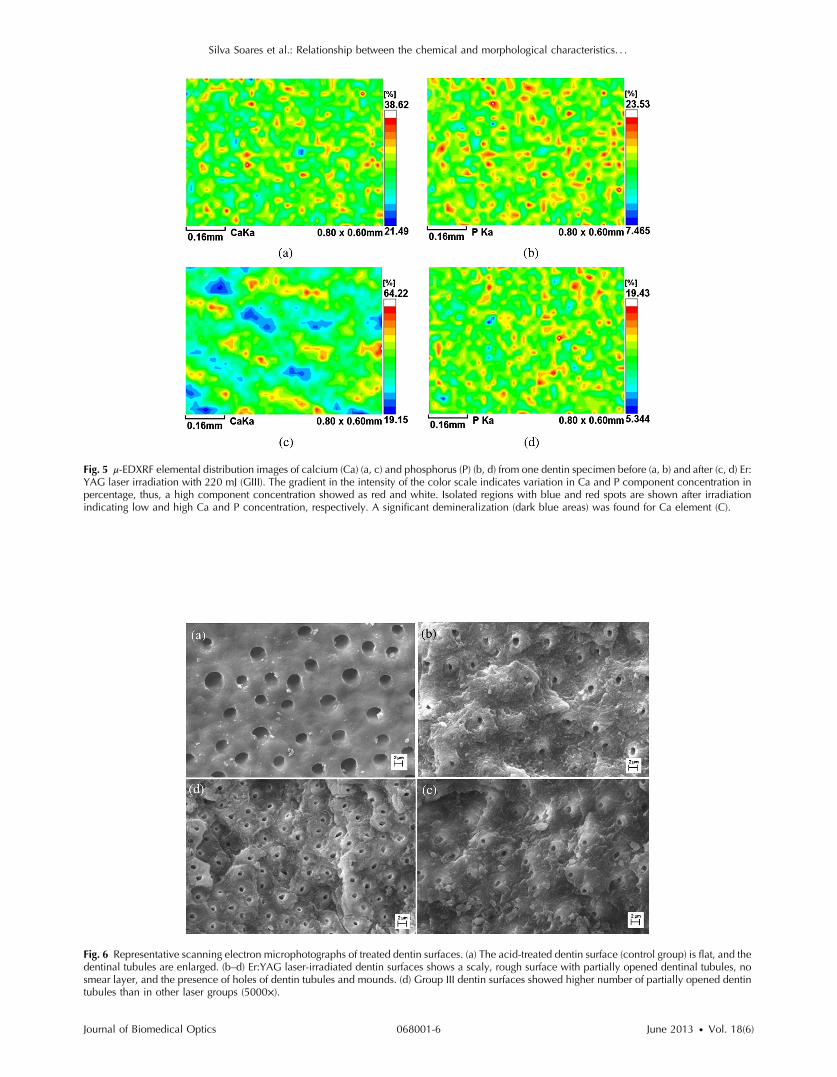
Fig. 5 μ-EDXRF elemental distribution images of calcium (Ca) (a, c) and phosphorus (P) (b, d) from one dentin specimen before (a, b) and after (c, d) Er:YAG laser irradiation with 220 mJ (GIII). The gradient in the intensity of the color scale indicates variation in Ca and P component concentration inpercentage, thus, a high component concentration showed as red and white. Isolated regions with blue and red spots are shown after irradiationindicating low and high Ca and P concentration, respectively. A significant demineralization (dark blue areas) was found for Ca element (C).
Fig. 6 Representative scanning electron microphotographs of treated dentin surfaces. (a) The acid-treated dentin surface (control group) is flat, and thedentinal tubules are enlarged. (b–d) Er:YAG laser-irradiated dentin surfaces shows a scaly, rough surface with partially opened dentinal tubules, nosmear layer, and the presence of holes of dentin tubules and mounds. (d) Group III dentin surfaces showed higher number of partially opened dentintubules than in other laser groups (5000×).
Journal of Biomedical Optics 068001-6 June 2013 • Vol. 18(6)
Silva Soares et al.: Relationship between the chemical and morphological characteristics. . .
dentin was significantly removed enabling, thus, an increase inthe permeability which could favor the adhesive penetration.
The significant decrease in the Ca/P ratio after Er:YAG irra-diation with 100 mJ (Table 2) may be explained by the higherorganic content in the dentin, which adds to the higher phospho-rus values and, therefore, the lower Ca/P values.24 The signifi-cant increase found in the Ca and P content after Er:YAG laserirradiation on dentin with 220 mJ is a result of the evaporation oforganic components during laser irradiation due to an increase intemperature in the irradiated area,25 which may well lead to anincrease in Ca or P content of superficial dentin. Clinically, thisincrease in Ca and P levels may result in acquired acid resistanceof the dentin surface.11,26
The homogeneous demineralization pattern showed by μ-EDXRF mapping of Ca and P after acid etching at the dentinsurface (Fig. 2) indicates a favorable substrate for adhesion pro-cedures. In contrast, for the Er:YAG laser-irradiated dentin, theCa and P distribution throughout the surface was inhomo-geneous with some spots of high and others with low mineralcontents (Figs. 3–5). This uneven distribution of minerals wasmore evident after laser irradiation with an energy of 220 mJ(Fig. 5). The high mineral content areas resulted from organiccontent evaporation25 reducing the permeability of the lasertreated dentin and increasing resistance of the superficial dentinto acid.26 The low mineral content spots are caused by the abla-tive mechanism of this type of laser. During irradiation, the inci-dent energy is readily and highly absorbed by water moleculespresent in the dentin’s crystalline structures and organic compo-nents, thus causing sudden heating and water vaporization. Theresulting high-stream pressure within the irradiated tissue leadsto the occurrence of microexplosions in the surrounding struc-tures, and thus, removal of the dental tissues.26
Our μ-EDXRF mapping results are in agreement with theprevious study of Moretto et al.,6 who found by SEM an irregu-lar surface after Er:YAG laser irradiation exhibiting areas withvalleys and peaks. In our study, μ-EDXRF analysis showedareas with low content of Ca and P (blue colors), which probablyindicates regions of valleys (as result of laser ablative mecha-nism). Other areas were found with high content of minerals(with white and red colors), which probably indicates thepeak regions found by SEM analysis. Those modifications indentin after laser irradiation shown in previous reports raisesconcerns about chemical modifications of dentin by lasersand the interaction of adhesive restorations in substrates.6 A den-tin substrate with chemical modifications alters the patterns ofdentin bonding, and this indicates a necessity to develop newmaterials which result in effective bonding. The high mineralcontent after irradiation with 220 mJ, the significant changesin the Ca/P ratio after laser irradiation with 100 mJ, and thelower mineral content of etched surfaces than in irradiated den-tin suggest that without chemical changes in dental adhesive thebonding will be compromised after laser irradiation.
SEM analysis of the laser-irradiated dentin showed a highlyirregular surface, partially opened dentin tubules, and a scalyand flaky surface [Fig. 6(b)–6(d)], in contrast to the smoothersurface and opened dentin tubules seen in acid-etched dentin[Fig. 6(a)]. These results agree with previous studies.8,27,28
Er:YAG laser irradiation produces no demineralization ofperitubular dentin [Fig. 6(b)–6(d)], so there are no funnel-shaped tubule orifices in dentin.29 In this situation, resin bondingwould form resin tags with parallel walls and with a diametersimilar to that of the original tubule lumen. Since hybridization
of the lateral walls of dentinal tubules is lacking, lower shearbond strength is expected.29
It is known that surface irregularity interferes with theEDXRF quantitative analysis with conventional fluorescencex-ray spectrometers, and corrections using Compton andRayleigh scattering should be done.30 Another possibility toreduce the surface irregularity effects is to reduce the excitationspot or to enlarge it, in order to excite the whole surface underanalysis.31 In our case, the surface effect was reduced by thesmall excitation spot of the μ-EDXRF (50 μm), and therefore,the intensity color’s gradient scheme indicates the variation ofthe component’s content. The holes found in SEM image(Fig. 6) are due to ablation of material produced by the laserirradiation resulting in a decrease of mineral content, whichappear as a blue area in the μ-EDXRF images. In the oppositeway, the mounds areas have a high mineral content, and appearin the μ-EDXRF images as a white and red area.
5 ConclusionsThe results of μ-EDXRF mappings showed that the amounts ofCa and P (wt%) decreased significantly after acid etching ena-bling, thus, an increase in the permeability which could favor theadhesive penetration. The high mineral content after irradiationwith 220 mJ, the significant changes in the Ca/P ratio after laserirradiation with 100 mJ, and the lower mineral content of acidetched surfaces than in irradiated dentin suggest that withoutchemical changes in dental adhesive the bonding will be com-promised after laser irradiation. The laser energy of 220 mJprobably denatured the collagen of dentin, thus, changing thestoichiometric proportions of hydroxyapatite as shown by anincrease of mineral. Data obtained with the μ-EDXRF imageshad correlation with features found in SEM images, wherethe decrease and increase of mineral content in the μ-EDXRFimages were correlated to holes and mounds in micrographies,respectively. These findings help to elucidate the chemical struc-ture of dentin after laser etching, and show the possibility of thisassociation of analytical tools to make possible the developmentof effective guidelines for laser irradiation for dentinhybridization.
AcknowledgmentsThe authors thanks to Fundação de Amparo à Pesquisa doEstado de São Paulo for the X-ray microfluorescence equipment(Grant No. 2005/50811-9) and to CNPq (302761/2009-8).
References1. E. Firat, S. Gurgan, and N. Gutknecht, “Microtensile bond strength of
an etch-and-rinse adhesive to enamel and dentin after Er:YAG laser pre-treatment with different pulse durations,” Lasers Med. Sci. 27(1), 15–21(2012).
2. R. S. Navarro et al., “The influence of erbium:yttrium–aluminum–gar-net laser ablation with variable pulse width on morphology and micro-leakage of composite restorations,” Lasers Med. Sci. 25(6), 881–889(2010).
3. M. Omae et al., “XPS analysis of the dentin irradiated by Er:YAG laser,”Dent. Mater. J. 28(4), 471–476 (2009).
4. S. Gurgan et al., “Shear bond strength of composite bonded to erbium:yttrium-aluminum-garnet laser-prepared dentin,” Lasers Med. Sci.24(1), 117–122 (2009).
5. U. Keller and R. Hibst, “Experimental studies of the application of theEr:YAG laser on dental hard substances: II. Light microscopic and SEMinvestigations,” Lasers Surg. Med. 9(4), 345–351 (1989).
Journal of Biomedical Optics 068001-7 June 2013 • Vol. 18(6)
Silva Soares et al.: Relationship between the chemical and morphological characteristics. . .
6. S. G. Moretto et al., “Effects of ultramorphological changes on adhesionto lased dentin—scanning electron microscopy and transmission elec-tron microscopy analysis,” Microsc. Res. Tech. 74(8), 720–726 (2011).
7. L. E. S. Soares et al., “Effects of treatment for manipulation of teeth andEr:YAG laser irradiation on dentin: a Raman spectroscopy analysis,”Photomed. Laser Surg. 25(1), 50–57 (2007).
8. L. E. S. Soares et al., “Combined FT-Raman and SEM studies of theeffects of Er:YAG laser irradiation on dentin,” Photomed. LaserSurg. 25(4), 239–244 (2007).
9. L. E. S. Soares et al., “Effects of Er:YAG laser irradiation and manipu-lation treatments on dentin components, part 1: Fourier transform-Raman study,” J. Biomed. Opt. 14(2), 024001 (2009).
10. L. E. S. Soares et al., “Effects of Er:YAG laser irradiation and manipu-lation treatments on dentin components, part 2: energy-dispersive X-rayfluorescence spectrometry study,” J. Biomed. Opt. 14(2), 024002(2009).
11. L. E. S. Soares et al., “Effects of heating by steam autoclaving andEr:YAG laser etching on dentin components,” Lasers Med. Sci. 26(5),605–613 (2011).
12. M. Staninec et al., “Adhesion of composite to enamel and dentin sur-faces irradiated by IR laser pulses of 0.5–35 μs duration,” J. Biomed.Mater. Res. Part B Appl. Biomater. 79B(1), 193–201 (2006).
13. M. Gonçalves et al., “Influence of the frequency of Er:YAG laser on thebond strength of dental enamel,” J. Clin. Laser Med. Surg. 21(2), 105–108 (2003).
14. S. R. Visuri et al., “Shear strength of composite to Er:YAG laser-pre-pared dentin,” J. Dent. Res. 75(1), 599–605 (1996).
15. H. Tokonabe et al., “Morphological changes of human teeth with Er:YAG laser irradiation,” J. Clin. Laser Med. Surg. 17(1), 7–12 (1999).
16. K. Matsumoto et al., “Morphological and compositional changes ofhuman dentin after Er:YAG laser irradiation,” J. Oral Laser Appl.3(1), 15–19 (2003).
17. E. U. Çelik et al., “Effect of different laser devices on the compositionand microhardness of dentin,” Oper. Dent. 33(5), 496–501 (2008).
18. M. Hossain et al., “Atomic analysis and knoop hardness measurementof the cavity floor prepared by Er,Cr:YSGG laser irradiation in vitro,”J. Oral Rehabil. 30(5), 515–521 (2003).
19. S. Shahabi and S. Zendedel, “Atomic analysis and hardness measure-ment of the cavity prepared by laser,” Lasers Med. Sci. 25(3), 379–383(2010).
20. J. Perdigão et al., “An ultra-morphological characterization ofcollagen-depleted etched dentin,” Am. J. Dent. 12(5), 250–255(1999).
21. A. C. B. De Carvalho Filho et al., “Energy dispersive X-rayspectrometry study of the protective effects of fluoride varnishand gel on enamel erosion,” Microsc. Res. Tech. 74(9), 839–844(2011).
22. M. Hennequin and Y. Douillard, “Effects of citric acid treatment on theCa, P and Mg contents of human dental roots,” J. Clin. Periodontol.22(7), 550–557 (1995).
23. M. A. Malkoc et al., “Effects of laser and acid etching and air abrasionon mineral content of dentin,” Lasers Med. Sci. 26(1), 21–27(2011).
24. M. Rythén et al., “Chemical aspects on dental hard tissues in primaryteeth from preterm infants,” Eur. J. Oral Sci. 118(4), 389–395(2010).
25. R. Rohanizadeh et al., “Ultrastructural properties of laser-irradiated andheat-treated dentin,” J. Dent. Res. 78(12), 1829–1835 (1999).
26. Z. He et al., “Acid resistance of dentin after erbium: yttrium-aluminum-garnet laser irradiation,” Lasers Med. Sci. 24(4), 507–513(2009).
27. W. J. Dunn, J. T. Davis, and A. C. Bush, “Shear bond strength and SEMevaluation of composite bonded to Er:YAG laser-prepared dentin andenamel,” Dent. Mater. 21(7), 616–624 (2005).
28. A. E. Souza et al., “Influence of Er:YAG laser on tensile bond strengthof a self-etching system and a flowable resin in different dentin depths,”J. Dent. 32(4), 269–275 (2004).
29. L. Ceballos et al., “Bonding to Er-YAG-laser-treated dentin,” J. Dent.Res. 81(2), 119–122 (2002).
30. A. Markowicz, “An overview of quantification methods in energy-dispersive X-ray fluorescence analysis,” Pramana 76(2), 321–329(2011).
31. B. Beckhoff et al.,Handbook of Practical X-Ray Fluorescence Analysis,Springer-Verlag, Berlin Heidelberg (2006).
Journal of Biomedical Optics 068001-8 June 2013 • Vol. 18(6)
Silva Soares et al.: Relationship between the chemical and morphological characteristics. . .