Relationship between Mineral Soil Surface Area and ... - MDPI
14
Article Relationship between Mineral Soil Surface Area and the Biological Degradation of Biosolids Added to Soil Dongqi Wen 1 , Wenjuan Zhai 1 , Demetrios Moschandreas 1 , Guanglong Tian 2 and Kenneth E. Noll 1, * Received: 7 July 2015; Accepted: 18 December 2015; Published: 25 December 2015 Academic Editor: Stephen R. Smith 1 Civil, Architecture and Environmental Engineering, Illinois Institute of Technology, 3201 S Dearborn St., Chicago, IL 60616, USA; [email protected] (D.W.); [email protected] (W.Z.); [email protected] (D.M.) 2 Environmental Monitoring and Research Division, Monitoring and Research Department, Metropolitan Water Reclamation District of Greater Chicago, 6001 W. Pershing Road, Cicero, IL 60804, USA; [email protected] * Correspondence: [email protected]; Tel.: +1-312-545-8343; Fax: +1-312-567-8847 Abstract: Geochemical and biological processes that operate in the soil matrix and on the soil surface are important to the degradation of biosolids in soil. Due to the large surface area of soils it is assumed that the microbial ecology is associated with mineral soil surface area. The total mineral surface areas were determined for soils from eight different fields selected from a long term study (1972–2006) of annual biosolids application to 41 fields in central Illinois varying in size from 3.6 to 66 ha. The surface areas for the soils varied from 1 to 9 m 2 /g of soil. The biological degradation rates for the eight soils were determined using a biological degradation rate model (DRM) and varied from 0.02 to 0.20/year ´1 . Regression analysis revealed that the degradation rate was positively associated with mineral soil surface area (1 m 2 /g produces 0.018 year ´1 increase in the degradation rate). The annual soil sequestration rate was calculated to increase from 1% to 6% when the soil total surface area increased from 1 to 9 m 2 /g of soil. Therefore, land application of biosolids is an effective way to enhance carbon sequestration in soils and reduce greenhouse gas emissions. Keywords: soil carbon; carbon sequestration; biosolids; biological degradation; mineral soil surface area 1. Introduction The ability for soils to biologically degrade biosolids and sequester carbon (C) is recognized as one method to mitigate greenhouse gas emissions [1,2]. Due to the large surface area of soils, biological processes that operate on the soil surface are potentially important to the degradation rate of biosolids in soil. However detailed knowledge of where microorganisms reside is very difficult to obtain. In this study the relationship between the mineral soil surface area and the degradation rate of biosolids added to soil is evaluated to provide a better understanding of the important variables that control sequestration and lead to application of technologies based on their ability to increase the rate of sequestration. Biosolids are nutrient-rich organic materials resulting from anaerobic digestion of primary and secondary sludge from wastewater treatment plants. Jarecki and Lal [3] suggested that application of biosolids is an important management practice to increase soil C sequestration in agricultural soils. Net C sequestration rates from biosolids applied to soil have been reported to be between 1 to 3 Mg ha ´1 ¨year ´1 with biosolids application rate between 56 to 71 Mg ha ´1 ¨year ´1 [4]. Agriculture 2016, 6, 1; doi:10.3390/agriculture6010001 www.mdpi.com/journal/agriculture
-
Upload
khangminh22 -
Category
Documents
-
view
0 -
download
0
Transcript of Relationship between Mineral Soil Surface Area and ... - MDPI

Article
Relationship between Mineral Soil Surface Area andthe Biological Degradation of Biosolids Added to Soil
Dongqi Wen 1, Wenjuan Zhai 1, Demetrios Moschandreas 1, Guanglong Tian 2 andKenneth E. Noll 1,*
Received: 7 July 2015; Accepted: 18 December 2015; Published: 25 December 2015Academic Editor: Stephen R. Smith
1 Civil, Architecture and Environmental Engineering, Illinois Institute of Technology, 3201 S Dearborn St.,Chicago, IL 60616, USA; [email protected] (D.W.); [email protected] (W.Z.);[email protected] (D.M.)
2 Environmental Monitoring and Research Division, Monitoring and Research Department,Metropolitan Water Reclamation District of Greater Chicago, 6001 W. Pershing Road, Cicero, IL 60804,USA; [email protected]
* Correspondence: [email protected]; Tel.: +1-312-545-8343; Fax: +1-312-567-8847
Abstract: Geochemical and biological processes that operate in the soil matrix and on the soil surfaceare important to the degradation of biosolids in soil. Due to the large surface area of soils it isassumed that the microbial ecology is associated with mineral soil surface area. The total mineralsurface areas were determined for soils from eight different fields selected from a long term study(1972–2006) of annual biosolids application to 41 fields in central Illinois varying in size from 3.6 to66 ha. The surface areas for the soils varied from 1 to 9 m2/g of soil. The biological degradation ratesfor the eight soils were determined using a biological degradation rate model (DRM) and variedfrom 0.02 to 0.20/year´1. Regression analysis revealed that the degradation rate was positivelyassociated with mineral soil surface area (1 m2/g produces 0.018 year´1 increase in the degradationrate). The annual soil sequestration rate was calculated to increase from 1% to 6% when the soil totalsurface area increased from 1 to 9 m2/g of soil. Therefore, land application of biosolids is an effectiveway to enhance carbon sequestration in soils and reduce greenhouse gas emissions.
Keywords: soil carbon; carbon sequestration; biosolids; biological degradation; mineral soilsurface area
1. Introduction
The ability for soils to biologically degrade biosolids and sequester carbon (C) is recognizedas one method to mitigate greenhouse gas emissions [1,2]. Due to the large surface area of soils,biological processes that operate on the soil surface are potentially important to the degradation rateof biosolids in soil. However detailed knowledge of where microorganisms reside is very difficult toobtain. In this study the relationship between the mineral soil surface area and the degradation rateof biosolids added to soil is evaluated to provide a better understanding of the important variablesthat control sequestration and lead to application of technologies based on their ability to increase therate of sequestration.
Biosolids are nutrient-rich organic materials resulting from anaerobic digestion of primary andsecondary sludge from wastewater treatment plants. Jarecki and Lal [3] suggested that applicationof biosolids is an important management practice to increase soil C sequestration in agriculturalsoils. Net C sequestration rates from biosolids applied to soil have been reported to be between 1to 3 Mg ha´1¨year´1 with biosolids application rate between 56 to 71 Mg ha´1¨year´1 [4].
Agriculture 2016, 6, 1; doi:10.3390/agriculture6010001 www.mdpi.com/journal/agriculture

Agriculture 2016, 6, 1 2 of 14
The rate of biosolids decomposition is one of the key variables governing the dynamic ofC sequestration and therefore numerous investigators have studied degradation rates of biosolidsapplied to soil [5–14]. One of the most comprehensive models of C sequestration in soils isCENTURY [10], which simulates the flux of C through plant litter using three soil organic fractions(active, slow, and passive), each of which has a significantly different degradation rate above andbelow ground litter pools. Parton et al. [10] applied the CENTURY model to estimate soil organicmatter decomposition rates and pointed out that decomposition rates are affected by climate (i.e.,soil temperature, soil moisture content) and soil texture. The average slow soil organic fractiondecomposition rate (0.12 year´1) was similar to biosolids degradation rates presented in this studyunder similar climate conditions. Sorenson [15] applied 14C-labiled cellulose to seven differentsoils containing different silt and clay amounts to determine the effect of soil texture on cellulosedegradation decomposition rates. The study reported that clay content influents soil organic carboncontent (biomass) with higher clay concentrations related to higher cellulose degradation rates.Gilmour and Gilmour [9] developed a model for the rate of decomposition of biosolids based onexperimental results from Terry et al. [8] to compute the rate of conversion to carbon dioxide (CO2)for a single biosolids application to soil. The model indicates that the biosolids degradation processfollows the exponential first-order decay model. Zhai et al. [14] formulated a degradation rate model(DRM) using data from a long term field study of biosolids applied to soil [4]. The DRM is basedon quantification of the degradation rate for biosolids and yield for residual microbial biomass fromrepeated application of biosolids to soil and provides an easy quantitative method for evaluatingC sequestration.
The objective of this paper is to examine the effect of mineral soil surface area on the biosolidsdegradation rate and C sequestration rate. The degradation rate and surface area distribution aredetermined for soils from eight fields from the Tian et al. [4] database. Tian et al. [4] reported onbiosolids degradation and C sequestration from a long term study (1972–2006) of annual biosolidsapplication to 41 fields varying size from 3.6 to 66 ha. The biosolids applied to the fields were in theliquid phase with an average organic carbon content of 23.2% [4].
2. Materials and Methods
This paper explores the effect of mineral soil surface area on the biosolids degradation rate andC sequestration. We hypothesize that soils with more surface area have the capability of biodegradingbiosolids at a faster rate. To evaluate this hypothesis, the total surface areas (1 to 9 m2/g) anddegradation rates (0.02 to 0.20 year´1) were compared for soils from eight fields. The fields wereselected with care from the Tian et al. [4] database. Application of the DRM model determinedthe required degradation rates. The fields were selected strategically from the 41 fields to representdifferent mineral surface areas. This approach facilitates the objective of establishing an associationbetween total mineral surface area and degradation rate.
Tian divided 41 fields into three groups based on soil type. Group I consisted of 20 fields of“coarse” mine spoil soils, primarily Lenzburg (Fine-loamy, mixed, active, calcareous, mesic HaplicUdarents) and Lenzwheel soil series [16]. Group II consisted of nine fields of “fine” mine spoil soils,primarily Rapatee (fine-silty, mixed, superactive, non-acid, mesic Mollic Udarents) soil series. GroupIII consisted of 12 fields of various non-mined soils that were degraded by intensive cultivation orovergrazing. Of the eight fields selected for evaluation in this study, three were from group I (F32, F39and F15), three from group II (F43, F45, and F47) and two from group III (F10 and F37), see Table 1 [17].Six of the soils were selected because they represented pairs with similar annual biosolids applicationrates but different soil types (F37 and F39, F45 and F10, and F43 and F15). Soils from fields 47 and32 were selected because they represent large variations in degradation rate and application rate (SeeTable 1). A sieve analysis was performed to determine the size distribution of the coarse particles, andthe hydrometer method was used to determine the size distribution of the fine particles [18] for the

Agriculture 2016, 6, 1 3 of 14
eight soils. The degradation rates and surface area were also calculated for three soils evaluated byTerry et al. [8] based on laboratory conditions and compared to results from soils from the eight fields.
2.1. Application of DRM to Determine Degradation Rate
The DRM [14] was used in this study to determine the biological degradation rate andC sequestration amounts for biosolids applied to eight fields from 1972 to 2006 in Fulton County,Illinois [2]. 1. The biosolids decomposition in the DRM is described by first order kinetics:
dCdt“ ´kC (1)
where:
‚ C = the carbon concentration present in the biosolids (Mg/Ha)‚ k = the first-order rate (year´1)‚ t = biosolids decomposition time (year).
Equation (1) can be quantified as Equation (2) below:
Ct “ Co ¨ e´kt (2)
where:
‚ Co = initial concentration of C in biosolids (Mg/Ha)‚ Ct = the concentration at time t (Mg/Ha).
With the same annually biosolids C added (Co); the accumulated residue of biosolids C (r) aftertime t (year.) is given by Equation (3) [19]:
r “ p1` f 1 ` f 2 ` f 3 ` ¨ ¨ ¨ ` f tq ¨ Co (3)
where:
‚ f = the fraction left after 1 year. decay, or f “ Ct{Co “ e´ kt, with t “ 1.
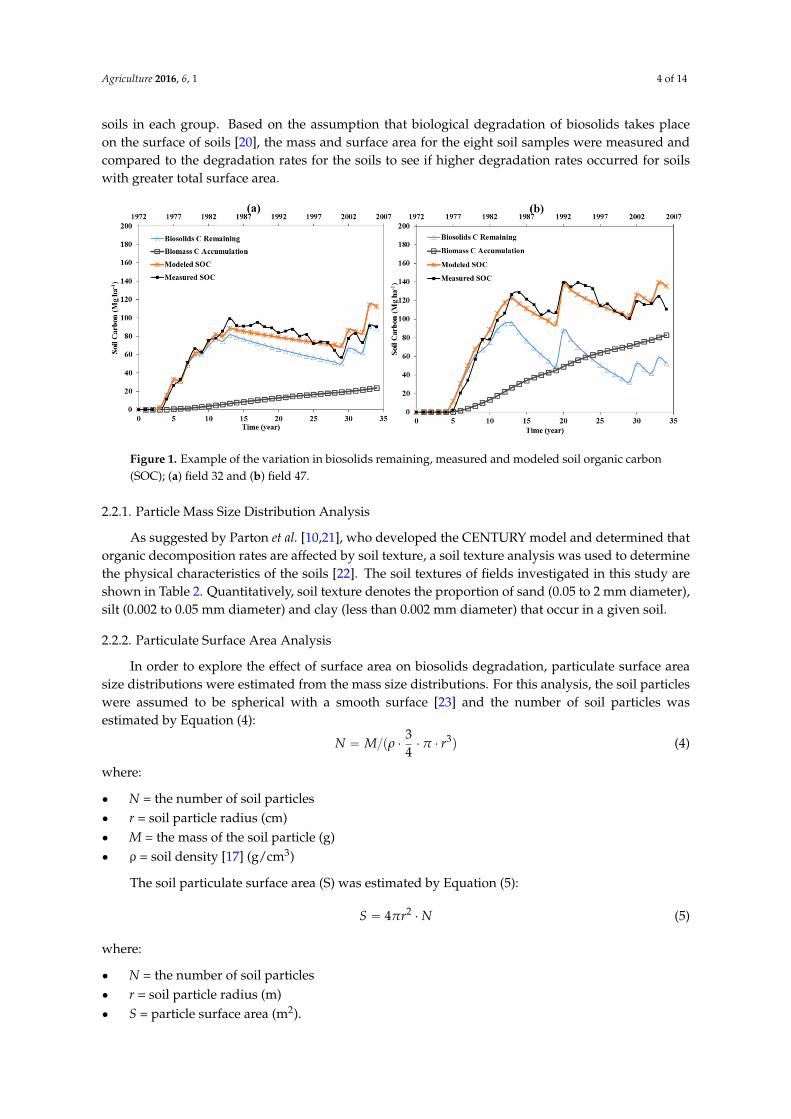
The DRM was developed by curve-fitting the measured values of SOC for each year (1972–2006)with model-generated values of SOC for each of the 41 fields using trial and error to producea best-fit average degradation rate for biosolids degradation and biomass yield (Figure 1). When theappropriate degradation rate and biomass yield are estimated from curve fitting, it is possible to usethe DRM to estimate (1) the degradation of biosolids as a function of time; (2) the portion of the SOCdue to biosolids remaining and (3) the portion due to residual microbial biomass (C sequestered).The average estimated and measured SOC are 3.94 and 3.34 Mg/Ha/year, respectively, for GroupI fields. For Group II fields, the average estimated and measured SOC amounts are 3.17 and2.59 Mg/Ha/year, respectively, while the average estimated and measured SOC for Group III fieldsare 2.15 and 1.68 Mg/Ha/year [14]. Figure 1 provides examples of the measured and modeled SOCconcentrations and amount of C sequestered over the 34 years for two of the eight fields that havelong application time (15 to 22 year). The coefficient of determinations between SOC measured andestimated with the DRM were very good (average coefficient of determination is 0.94) indicating thatthe curve-fitting technique was able to provide degradation rate and yield information that allows theDRM model to provide acceptable estimates of the measured SOC values and sequestration amounts.
2.2. Soil Particulate Size Distribution
Tian et al. [4] classified the eight fields evaluated in this study as coarse (group I), fine (group II),and mixed (group III) but provided no additional information concerning difference in the type of
Agriculture 2016, 6, 1 4 of 14
soils in each group. Based on the assumption that biological degradation of biosolids takes placeon the surface of soils [20], the mass and surface area for the eight soil samples were measured andcompared to the degradation rates for the soils to see if higher degradation rates occurred for soilswith greater total surface area.Agriculture 2016, 6, 1 4 of 13
Figure 1. Example of the variation in biosolids remaining, measured and modeled soil organic carbon (SOC); (a) field 32 and (b) field 47.
2.2.1. Particle Mass Size Distribution Analysis
As suggested by Parton et al. [10,21], who developed the CENTURY model and determined that organic decomposition rates are affected by soil texture, a soil texture analysis was used to determine the physical characteristics of the soils [22]. The soil textures of fields investigated in this study are shown in Table 2. Quantitatively, soil texture denotes the proportion of sand (0.05 to 2 mm diameter), silt (0.002 to 0.05 mm diameter) and clay (less than 0.002 mm diameter) that occur in a given soil.
2.2.2. Particulate Surface Area Analysis
In order to explore the effect of surface area on biosolids degradation, particulate surface area size distributions were estimated from the mass size distributions. For this analysis, the soil particles were assumed to be spherical with a smooth surface [23] and the number of soil particles was estimated by Equation (4):
)43/( 3rMN ⋅⋅⋅= πρ (4)
where:
N = the number of soil particles r = soil particle radius (cm) M = the mass of the soil particle (g) ρ = soil density [17] (g/cm3)
The soil particulate surface area (S) was estimated by Equation (5):
NrS ⋅= 24π (5)
where:
N = the number of soil particles r = soil particle radius (m) S = particle surface area (m2).
2.3. Reference Soils from Terry
Terry et al. [8] evaluated the biological degradation of synthetic biosolids using three different soil types under controlled conditions in the laboratory over a one year period to determine the
Figure 1. Example of the variation in biosolids remaining, measured and modeled soil organic carbon(SOC); (a) field 32 and (b) field 47.
2.2.1. Particle Mass Size Distribution Analysis
As suggested by Parton et al. [10,21], who developed the CENTURY model and determined thatorganic decomposition rates are affected by soil texture, a soil texture analysis was used to determinethe physical characteristics of the soils [22]. The soil textures of fields investigated in this study areshown in Table 2. Quantitatively, soil texture denotes the proportion of sand (0.05 to 2 mm diameter),silt (0.002 to 0.05 mm diameter) and clay (less than 0.002 mm diameter) that occur in a given soil.
2.2.2. Particulate Surface Area Analysis
In order to explore the effect of surface area on biosolids degradation, particulate surface areasize distributions were estimated from the mass size distributions. For this analysis, the soil particleswere assumed to be spherical with a smooth surface [23] and the number of soil particles wasestimated by Equation (4):
N “ M{pρ ¨34¨ π ¨ r3q (4)
where:
‚ N = the number of soil particles‚ r = soil particle radius (cm)‚ M = the mass of the soil particle (g)‚ ρ = soil density [17] (g/cm3)
The soil particulate surface area (S) was estimated by Equation (5):
S “ 4πr2 ¨ N (5)
where:
‚ N = the number of soil particles‚ r = soil particle radius (m)‚ S = particle surface area (m2).

Agriculture 2016, 6, 1 5 of 14
2.3. Reference Soils from Terry
Terry et al. [8] evaluated the biological degradation of synthetic biosolids using three differentsoil types under controlled conditions in the laboratory over a one year period to determine the effectof soil type, moisture, pH, temperature, and application rate on the decomposition rate of biosolidsin soil. The synthetic sludge applied to Terry’s experiment was in liquid phase with volatile solidssimilar to biosolids applied to 41 fields in Illinois. The syntactic biosolids had organic carbon percent(22.3%) similar to biosolids used in this study. Results from Terry’s experiments were compared withresults from this study. Terry’s paper reports on the emissions from biosolids added to soil withlittle analysis of the results. We have reanalyzed the data in detail to demonstrate that the mineralsoil surface area and degradation rate are related. This analysis provides new data for comparisonof laboratory and field degradation rate (Biological degradation rates under laboratory and fieldconditions are different due to differences in average soil temperature and moisture content [9]).
3. Results and Discussion
3.1. Biosolids Degradation Rate
3.1.1. DRM Estimated Rate of Biosolids Degradation
Analyses of DRM simulation results for the eight fields (Table 1) indicated that the degradationrate varied between 0.02 and 0.20 year´1. It can be seen from Figure 1 that the slow rates ofbiosolids degradation and the large application rates resulted in large increases in SOC due to thepresence of biosolids that have not reacted. The SOC concentration peaked in the mid-1980s after12 years of annual biosolids application. The application of biosolids declined after 1985 and theaccumulation of biosolids did not continue to increase. During the early stages of biosolids addition,the biosolids accumulation exceeded degradation, resulting in the accumulation of stored biosolidsand, therefore, an increase in SOC. Eventually the amount of decomposition converged on theamount of biosolids applied and the biosolids approached a steady state. This result is supportedby Hamake [19], who developed a mathematical model to predict the cumulative levels of pesticidesin soil. The study indicated that when pesticides application rates equal the decomposition rates,a steady state is approached. Also, Jastrow et al. [24] suggested carbon sequestration occurs whena positive disequilibrium sustained between C input and C degraded over some period of time.A new steady-state system would eventually be achieved when the amount of degradation convergeon the amount of application. These studies explain the increasing of SOC during the early stages ofbiosolids addition and the achievement of a steady state in this study.
Application of biosolids increased the sequestered C concentration up to 1985 in all eight fields,as suggested by Figure 2. There was a marked increase in the ratio of C sequestered to C applicationrate up to year 1985 due to accumulation of the C from the conversion of biosolids to new biomass.Beyond 2025, the trend in Figure 2 indicates almost the same ratio of C sequestration to C applicationrate. In the short term, lower biosolids degradation rates result in less microbial production andproduce a smaller increase in C sequestration, i.e. F32 . In the long term, all of the applied biosolidsmay undergo degradation and the amount of C sequestered is determined by the total amount ofbiosolids applied. Under aerobic conditions, approximately 35% to 40% of the C in biosolids mayeventually be sequestered, although this may take a long time (between 20 and 100 years) with kbetween 0.20 and 0.02 year´1, and 95% biosolids conversion (see Table 1 and Figure 2).

Agriculture 2016, 6, 1 6 of 14
Table 1. Variation in the first order biosolids degradation rate (from Equation (1)* in DRM), annualapplication rate, soil density, and surface area for soils evaluated.
Soil Type FieldsNo.
GroupNo.
BiosolidsDegradationRate (year´1)
AnnualApplicationRate (Mg/ha)
Soil Density[17] (g/cm3)
SurfaceArea (m2/g)
Coarse
F32 I 0.02 8.93 2.6 1.29F39 I 0.05 11.95 2.6 1.73F10 III 0.06 12.85 2.6 2.29F15 I 0.11 15.44 2.6 2.42
Fine
F37 III 0.14 11.75 2.6 6.55F47 II 0.15 18.02 2.6 8.54F45 II 0.15 12.95 2.6 7.63F43 II 0.20 15.63 2.6 7.65
Other soilsamples
Fincastle N/A 0.13 5.15 2.6 4.81Chalmers N/A 0.10 5.15 2.6 4.66
[6] Tracy N/A 0.07 5.15 2.6 2.13
* dC/dt = ´kC
Agriculture 2016, 6, 1 6 of 13
rate up to year 1985 due to accumulation of the C from the conversion of biosolids to new biomass. Beyond 2025, the trend in Figure 2 indicates almost the same ratio of C sequestration to C application rate. In the short term, lower biosolids degradation rates result in less microbial production and produce a smaller increase in C sequestration, i.e. F32 . In the long term, all of the applied biosolids may undergo degradation and the amount of C sequestered is determined by the total amount of biosolids applied. Under aerobic conditions, approximately 35% to 40% of the C in biosolids may eventually be sequestered, although this may take a long time (between 20 and 100 years) with k between 0.20 and 0.02 year−1, and 95% biosolids conversion (see Table 1 and Figure 2).
Figure 2. Percent of biosolids converted to biomass (carbon sequestration) between 1972 and 2025 for the eight fields. The variation between fields is due to difference in the degradation rate (See Table1).
3.1.2. Rate of Degradation Related to Coarse and Fine Soil Type
Analyses of DRM simulation results for the 41 fields in the Tian et al. database [4] indicated higher biosolids degradation rates occur with finer soils. This effect can be seen in Figure 3 that shows that the microbial degradation rate was smaller for coarse (group I) than for fine (group II) soil type (separation of the regression lines). The error bars in Figure 3 represent one standard deviation for each average biosolids application rate for related fields in Tian’s database [4]. The Tian et al. database [4] has included only one data point for fine soils for each application rate in Group II. Figure 3 also identified the eight fields from the database [4] selected for evaluation in this paper. Four of the fields represent fine soils and four represent coarse soils.
The average difference in the degradation rate between the linear regression lines was near 0.10 year−1. This represents the different in the average degradation rate of biosolids when applied on coarse and fine soils. This result is supported by other researchers who used soil texture rather than soil surface area to relate to biological decomposition [15,25]. Sorenson [15] conducted an experiment to investigate the relationship between clay content concentrations and organic material decomposition rate. He suggested that higher clay concentrations (finer texture) causes a more rapid biological decomposition,. Parton [25] determined that active organic carbon turnover time (1/k) decreased with increase in clay and silt content. Both of the results agree with the findings of this study.
Figure 2. Percent of biosolids converted to biomass (carbon sequestration) between 1972 and 2025 forthe eight fields. The variation between fields is due to difference in the degradation rate (See Table 1).
3.1.2. Rate of Degradation Related to Coarse and Fine Soil Type
Analyses of DRM simulation results for the 41 fields in the Tian et al. database [4] indicatedhigher biosolids degradation rates occur with finer soils. This effect can be seen in Figure 3 thatshows that the microbial degradation rate was smaller for coarse (group I) than for fine (group II) soiltype (separation of the regression lines). The error bars in Figure 3 represent one standard deviationfor each average biosolids application rate for related fields in Tian’s database [4]. The Tian et al.database [4] has included only one data point for fine soils for each application rate in Group II.Figure 3 also identified the eight fields from the database [4] selected for evaluation in this paper.Four of the fields represent fine soils and four represent coarse soils.

Agriculture 2016, 6, 1 7 of 14
The average difference in the degradation rate between the linear regression lines was near0.10 year´1. This represents the different in the average degradation rate of biosolids when appliedon coarse and fine soils. This result is supported by other researchers who used soil texture ratherthan soil surface area to relate to biological decomposition [15,25]. Sorenson [15] conducted anexperiment to investigate the relationship between clay content concentrations and organic materialdecomposition rate. He suggested that higher clay concentrations (finer texture) causes a morerapid biological decomposition,. Parton [25] determined that active organic carbon turnover time(1/k) decreased with increase in clay and silt content. Both of the results agree with the findings ofthis study.Agriculture 2016, 6, 1 7 of 13
Figure 3. Biosolids degradation rate as a function of average annual carbon application rate separated into coarse and fine soil types (group I and II). Also identified are the eight fields used in this study including fields with similar application rates (paired field) and different soil types with 95% confidence interval shown for each soil group. The soil groups are from Tian et al. database [4].
3.1.3. Degradation Rate of Synthetic Biosolids
Decomposition was initially very rapid in the three soils evaluated by Terry [8] with 54% to 63% of the total C in the biosolids removed during the first 28 days followed by a slow decomposition for the period from 28 to 336 days. Gilmour and Gilmour [9] developed a model for the rate of decomposition of biosolids based on the experiment results from Terry et al. [8]. The model indicated that the biosolids degradation process follows first-order exponential decay with rapid and slow decomposition terms. The model provided corrections for field conditions of temperature and moisture that may be different than the laboratory conditions. Based on the study of Gilmour and Gilmour [9], Tian et al. [4] determined that the decomposition of biosolids at a site similar to the location of the 41 fields in Illinois (average temperature near 10 °C and 10% moisture) was only 37% of that under Terry's [8] laboratory conditions (temperature 21 °C and 20% moisture).
The laboratory degradation rates, shown in Figure 4, were determined for the slow decomposition phase for the biosolids added to the three soils based on first order kinetics using Terry's decomposition data for synthetic biosolids incubated for 28 to 336 days at 21 °C and 20% moisture. The degradation rates need to be reduced to 37% of the laboratory values for comparison to field data presented in Table 1. The reduced rates varied from 0.07 to 0.13 year−1 for the three soils. It is generally assumed that the rapid fraction is consumed completely before the decomposition of the slow fraction starts [26]. The slow decomposition phase was used in this study because the biosolids have already undergone short term volatile losses and has no remaining rapid fraction. This was similar to the field conditions where the long term repeated annual application of biosolids results in the accumulation of biosolids over long time periods with only slow decomposition remaining (see Figure 1).
3.2. Particulate Mass and Surface Area Distribution Analysis
Soil texture for each of the eight soil samples is presented in Table 2. The eight fields can be divided into two types of soil, with the coarse samples from fields 10, 15, 32, and 39 classified as soils with a sandy loam texture; and the fine samples from fields 37, 43, 45, and 47 classified as soils with a clay loam texture.
Figure 3. Biosolids degradation rate as a function of average annual carbon application rate separatedinto coarse and fine soil types (group I and II). Also identified are the eight fields used in thisstudy including fields with similar application rates (paired field) and different soil types with95% confidence interval shown for each soil group. The soil groups are from Tian et al. database [4].
3.1.3. Degradation Rate of Synthetic Biosolids
Decomposition was initially very rapid in the three soils evaluated by Terry [8] with 54% to 63%of the total C in the biosolids removed during the first 28 days followed by a slow decompositionfor the period from 28 to 336 days. Gilmour and Gilmour [9] developed a model for the rateof decomposition of biosolids based on the experiment results from Terry et al. [8]. The modelindicated that the biosolids degradation process follows first-order exponential decay with rapid andslow decomposition terms. The model provided corrections for field conditions of temperature andmoisture that may be different than the laboratory conditions. Based on the study of Gilmour andGilmour [9], Tian et al. [4] determined that the decomposition of biosolids at a site similar to thelocation of the 41 fields in Illinois (average temperature near 10 ˝C and 10% moisture) was only 37%of that under Terry's [8] laboratory conditions (temperature 21 ˝C and 20% moisture).
The laboratory degradation rates, shown in Figure 4, were determined for the slowdecomposition phase for the biosolids added to the three soils based on first order kinetics usingTerry's decomposition data for synthetic biosolids incubated for 28 to 336 days at 21 ˝C and 20%moisture. The degradation rates need to be reduced to 37% of the laboratory values for comparison tofield data presented in Table 1. The reduced rates varied from 0.07 to 0.13 year´1 for the three soils. Itis generally assumed that the rapid fraction is consumed completely before the decomposition of theslow fraction starts [26]. The slow decomposition phase was used in this study because the biosolids

Agriculture 2016, 6, 1 8 of 14
have already undergone short term volatile losses and has no remaining rapid fraction. This wassimilar to the field conditions where the long term repeated annual application of biosolids results inthe accumulation of biosolids over long time periods with only slow decomposition remaining (seeFigure 1).
3.2. Particulate Mass and Surface Area Distribution Analysis
Soil texture for each of the eight soil samples is presented in Table 2. The eight fields can bedivided into two types of soil, with the coarse samples from fields 10, 15, 32, and 39 classified as soilswith a sandy loam texture; and the fine samples from fields 37, 43, 45, and 47 classified as soils witha clay loam texture.Agriculture 2016, 6, 1 8 of 13
Figure 4. Variation in degradation rate (year−1, slope of trend line) for three soils based on first order kinetics ( ktCC −=)/ln( 9 ) and Terry et.al [8] laboratory decomposition data (incubated for
28 to 336 days at a temperature of 21 °C and moisture content of 20%).
The soil texture for the 11 soils analyzed in this study and mineral surface areas are closely related (See Table 2), and therefore literature relating soil texture to degradation rate can also apply to mineral soil surface area [15,25,27]. Both Parton [25] and Paul [27] indicated that active organic carbon decomposition rates increased with increased clay plus silt contents, while increased sand content caused decreased active organic carbon decomposition rates. The results from this study correspond to those findings and demonstrate that soil texture is closely related to mineral soil surface area. However, mineral soil surface area provides a more definitive relationship to biological degradation of biosolids added to soil than soil texture. This is because surface area measurements are related to individual soil mass percentage while soil texture represents a range of mass percentages.
Table 2. Mass and mineral soil surface area percentage (clay, silt, and sand) and soil texture of selected soil samples.
Field Clay Silt Sand Soil Texture
mass (%) surface
area (%) mass (%) surface area (%) mass (%) surface
area (%) F32 10.00 23.00 21.10 70.00 68.90 7.00 Sandy loam F39 10.00 50.50 23.01 46.30 67.00 3.21 Sandy loam F10 14.80 39.10 23.20 56.10 62.00 4.79 Sandy loam F15 10.00 54.20 24.10 43.30 65.90 3.42 Sandy loam F37 28.70 66.10 40.10 33.10 31.20 0.72 Clay loam F47 31.02 69.30 49.10 31.40 19.90 0.31 Clay loam F45 30.20 65.50 47.90 34.10 21.90 0.36 Clay loam F43 30.10 66.50 45.05 33.20 25.00 0.35 Clay loam
Fincastle 16.80 55.80 69.70 43.60 13.50 0.30 Silt loam Chalmers 24.80 61.40 60.90 37.90 14.30 0.36 Silt loam
Tracy 8.90 53.80 37.20 43.00 53.90 3.10 Sandy Loam
Figure 5 provides the surface area distribution for soils evaluated in this study. The total surface area for the coarse soils varied from a low of 1.3 to a high of 2.4 m2/g of soil. The total surface area for the fine soils varied from a low of 6.5 to a high of 8.5 m2/g of soil. The average difference between the two groups was 5.2 m2/g of soil. As mentioned in Section 3.1.2, the average difference in biosolids
Figure 4. Variation in degradation rate (year´1, slope of trend line) for three soils based on first orderkinetics (lnpC{C9q “ ´ kt) and Terry et.al [8] laboratory decomposition data (incubated for 28 to336 days at a temperature of 21 ˝C and moisture content of 20%).
The soil texture for the 11 soils analyzed in this study and mineral surface areas are closelyrelated (See Table 2), and therefore literature relating soil texture to degradation rate can also apply tomineral soil surface area [15,25,27]. Both Parton [25] and Paul [27] indicated that active organic carbondecomposition rates increased with increased clay plus silt contents, while increased sand contentcaused decreased active organic carbon decomposition rates. The results from this study correspondto those findings and demonstrate that soil texture is closely related to mineral soil surface area.However, mineral soil surface area provides a more definitive relationship to biological degradationof biosolids added to soil than soil texture. This is because surface area measurements are related toindividual soil mass percentage while soil texture represents a range of mass percentages.
Figure 5 provides the surface area distribution for soils evaluated in this study. The total surfacearea for the coarse soils varied from a low of 1.3 to a high of 2.4 m2/g of soil. The total surfacearea for the fine soils varied from a low of 6.5 to a high of 8.5 m2/g of soil. The average differencebetween the two groups was 5.2 m2/g of soil. As mentioned in Section 3.1.2, the average differencein biosolids degradation rates between these two groups was 0.1 year´1 (see Figure 3). This leadsto the conclusion that the average difference in total mineral soil surface area of 5.2 m2/g causesthe average difference in degradation rate of 0.1 year´1. Please notice that the average differencein biosolids degradation rate is caused by soil surface area and not biosolids application rate, seeSection 3.3.

Agriculture 2016, 6, 1 9 of 14
Table 2. Mass and mineral soil surface area percentage (clay, silt, and sand) and soil texture of selectedsoil samples.
Field Clay Silt Sand Soil Texture
Mass(%)
SurfaceArea (%)
Mass(%)
SurfaceArea (%)
Mass(%)
SurfaceArea (%)
F32 10.00 23.00 21.10 70.00 68.90 7.00 Sandy loamF39 10.00 50.50 23.01 46.30 67.00 3.21 Sandy loamF10 14.80 39.10 23.20 56.10 62.00 4.79 Sandy loamF15 10.00 54.20 24.10 43.30 65.90 3.42 Sandy loamF37 28.70 66.10 40.10 33.10 31.20 0.72 Clay loamF47 31.02 69.30 49.10 31.40 19.90 0.31 Clay loamF45 30.20 65.50 47.90 34.10 21.90 0.36 Clay loamF43 30.10 66.50 45.05 33.20 25.00 0.35 Clay loam
Fincastle 16.80 55.80 69.70 43.60 13.50 0.30 Silt loamChalmers 24.80 61.40 60.90 37.90 14.30 0.36 Silt loamTracy 8.90 53.80 37.20 43.00 53.90 3.10 Sandy Loam
Agriculture 2016, 6, 1 9 of 13
degradation rates between these two groups was 0.1 year−1 (see Figure 3). This leads to the conclusion that the average difference in total mineral soil surface area of 5.2 m2/g causes the average difference in degradation rate of 0.1 year−1. Please notice that the average difference in biosolids degradation rate is caused by soil surface area and not biosolids application rate, see Section 3.3.
Figure 5. Overall total surface area and surface area for clay, silt, and sand components for soils [8]. The average and deviation of mineral soil surface area are shown.
The total surface areas for Terry’s soil samples were calculated using Equations (4) and (5); see Table 2 and Figure 5. The Fincastle and Chambers soils had total surface areas (average 4.7 m2/g) between Tian et al. fine and coarse soil groups [4] and the Tracy soil was comparable to the coarse soil group (2.1 m2/g). One can observe from Figure 5 that biosolids degradation rates increase with finer soil texture which indicated strong dependent between degradation rates and texture. This result is observed by other researchers [15,27–30]. Schimel [28,29] pointed out that clay content influents soil organic carbon content with higher clay concentration (finer soil texture) related to higher organic compounds degradation rates. Allison et al. [30] showed that the soil texture of mineral soil colloid affects the rate of organic carbon loss and the quantity of humus formed from readily decomposable plant materials.
3.3. Relationship between Mineral Soil Surface Area and Biosolids Degradation
Figure 6 shows the relationship between the total mineral soil surface area and the degradation rate for the eight fields. The figure indicates that the degradation rate increased when there was an increase in the total surface area. The degradation rate varied from 0.02 to 0.20 year−1 when the soil total surface area varied from 1.3 to 8.5 m2/g of soil.
The values from Table 1 for the three reference soils from Terry et al. [8] are also given in Figure 6 for comparison but the coefficient of determination between the variables presented in the figure is based only on the eight samples from the Tian et al. [4] database. The reference soils provide results similar to the relationship developed for the eight Tian soils when they are corrected for field temperature and moisture conditions as suggested by Gilmour and Gilmour [9] and Tian et al. [4].
Figure 5. Overall total surface area and surface area for clay, silt, and sand components for soils [8].The average and deviation of mineral soil surface area are shown.
The total surface areas for Terry’s soil samples were calculated using Equations (4) and (5); seeTable 2 and Figure 5. The Fincastle and Chambers soils had total surface areas (average 4.7 m2/g)between Tian et al. fine and coarse soil groups [4] and the Tracy soil was comparable to the coarse soilgroup (2.1 m2/g). One can observe from Figure 5 that biosolids degradation rates increase with finersoil texture which indicated strong dependent between degradation rates and texture. This result isobserved by other researchers [15,27–30]. Schimel [28,29] pointed out that clay content influents soilorganic carbon content with higher clay concentration (finer soil texture) related to higher organiccompounds degradation rates. Allison et al. [30] showed that the soil texture of mineral soil colloidaffects the rate of organic carbon loss and the quantity of humus formed from readily decomposableplant materials.
3.3. Relationship between Mineral Soil Surface Area and Biosolids Degradation
Figure 6 shows the relationship between the total mineral soil surface area and the degradationrate for the eight fields. The figure indicates that the degradation rate increased when there was an

Agriculture 2016, 6, 1 10 of 14
increase in the total surface area. The degradation rate varied from 0.02 to 0.20 year´1 when the soiltotal surface area varied from 1.3 to 8.5 m2/g of soil.
The values from Table 1 for the three reference soils from Terry et al. [8] are also given in Figure 6for comparison but the coefficient of determination between the variables presented in the figureis based only on the eight samples from the Tian et al. [4] database. The reference soils provideresults similar to the relationship developed for the eight Tian soils when they are corrected for fieldtemperature and moisture conditions as suggested by Gilmour and Gilmour [9] and Tian et al. [4].Agriculture 2016, 6, 1 10 of 13
Figure 6. Biosolids degradation rate as a function of surface area for eight soils from different fields with 95% confidence interval. The three reference soils from Terry et al. [8] laboratory degradation experiments are also identified but not included in the correlation calculations.
Table 3 provides information on the rate of change in the degradation rate between the coarse and fine soil pairs based on the same application rates. The average difference in total mineral soil surface area of 5.13 m2/g of soil produces an average difference in the rate of degradation near 0.09 year−1. Therefore, there is an average increase of 0.018 year−1 in the degradation rate due to an increase of 1 m2/g of soil when the application rates are the same. This indicates that changes in total surface area produce a greater change in the degradation rate than changes in application rate.
Table 3. Comparison of changes in biosolids degradation rate and mineral soil surface area for paired soils (same biosolids application rate, but different soil texture).
Paired Samples Average Biosolids Application Rate (Mg Ha−1 year−1)
Difference of k (∆k) (year−1)
Difference of Surface Area (∆SF) (m2/g)
∆k/∆SF (g year−1 m−2)
F39 vs. F37 11.85 0.09 4.82 0.019 F10 vs. F45 12.90 0.09 5.34 0.017 F15 vs. F43 15.54 0.09 5.23 0.017
Average N/A 0.09 5.13 0.018
To further explore the effects of surface area and application rate on the degradation rate, we formulated a multiple linear regression analysis between the degradation rate for the eight soils and the variables of total mineral soil surface area and the annual biosolids application rate. The analysis performed by SPSS (version 22.0, SPSS Inc., Chicago, IL, USA), indicates that the total mineral soil surface area is a significant indicator of degradation rate with a high coefficient of determination ( 86.02 =R ) but annual application rate is not statistically significant ( 05.032.0 >=p ). Therefore the regression model relating degradation rate and total mineral soil surface area is given by Equation (6) as indicated in Figure 6:
026.0017.0 += xy (6)
where:
y = the degradation rate (year−1) x = the total mineral soil surface area (m2/g)
Figure 6. Biosolids degradation rate as a function of surface area for eight soils from different fieldswith 95% confidence interval. The three reference soils from Terry et al. [8] laboratory degradationexperiments are also identified but not included in the correlation calculations.
Table 3 provides information on the rate of change in the degradation rate between the coarse andfine soil pairs based on the same application rates. The average difference in total mineral soil surfacearea of 5.13 m2/g of soil produces an average difference in the rate of degradation near 0.09 year´1.Therefore, there is an average increase of 0.018 year´1 in the degradation rate due to an increase of1 m2/g of soil when the application rates are the same. This indicates that changes in total surfacearea produce a greater change in the degradation rate than changes in application rate.
Table 3. Comparison of changes in biosolids degradation rate and mineral soil surface area for pairedsoils (same biosolids application rate, but different soil texture).
Paired SamplesAverage BiosolidsApplication Rate(Mg ha´1¨year´1)
Difference of k(∆k) (year´1)
Difference ofSurface Area(∆SF) (m2/g)
∆k/∆SF(g¨year´1¨m´2)
F39 vs. F37 11.85 0.09 4.82 0.019F10 vs. F45 12.90 0.09 5.34 0.017F15 vs. F43 15.54 0.09 5.23 0.017
Average N/A 0.09 5.13 0.018
To further explore the effects of surface area and application rate on the degradation rate, weformulated a multiple linear regression analysis between the degradation rate for the eight soils andthe variables of total mineral soil surface area and the annual biosolids application rate. The analysisperformed by SPSS (version 22.0, SPSS Inc., Chicago, IL, USA), indicates that the total mineral soil

Agriculture 2016, 6, 1 11 of 14
surface area is a significant indicator of degradation rate with a high coefficient of determination(R2 “ 0.86) but annual application rate is not statistically significant (p “ 0.32 ą 0.05). Therefore theregression model relating degradation rate and total mineral soil surface area is given by Equation (6)as indicated in Figure 6:
y “ 0.017x` 0.026 (6)
where:
‚ y = the degradation rate (year´1)‚ x = the total mineral soil surface area (m2/g)
Equation (6) was applied to the decomposition of biosolids for the three reference soils fromTerry et al. [8] since these observations (see Figure 6) were not used to generate Equation (6). Theestimated biosolids degradation rates from Terry et al. [8] were related to the rate predicted by thesimple regression model shown in Equation (6). The agreement between values of estimated threevalues) from Terry et al. data and predicted by Equation (6) is statistically significant.
3.4. C Sequestration
Figure 7 shows the increase in the annual percentage of applied biosolids that can be sequesteredas a function of total mineral soil surface area. The annual percentage of biosolids converted tobiomass is determined based on a mass balance between gases C emitted to the atmosphere andstored as biomass C sequestered in the soil and are computed using the DRM. The C sequestrationvalues were determined based on the assumption of first order degradation using Equations (1) to(3) with a biomass yield of 40%. The total mineral soil surface area for different degradation rateswas determined from Equation (6). The sequestration rates for Terry et al. [8] soils were based ondegradation rates determined from Figure 4 (0.19 to 0.35 year´1, 21 ˝C and 20% moisture) and for theeight fields from the DRM (Table 1). For Terry’s [8] soils the increase in total surface area was 2.7 m2/gand produced an increase in the annual sequestration rate from 6% to 11%. For the soils from the eightfields (10 ˝C and 10% moisture), the increase in total surface area was 7.2 m2/g and this produced anincrease in the annual sequestration rate from 1% to 6%. Importantly, the present study indicatesthat land application of biosolids is an appropriate way to enhance C sequestration in soils [1],which was recommended by United Nations Framework Convention on Climate Change (UNFCCC)as a necessary step toward reducing greenhouse gas (GHG) [2]. This leads to the conclusion thatapplying biosolids to soils with fine texture contributes to the reduction of GHG more effectivelythan applying to coarser soils, since higher biosolids degradation rates are strongly related to finersoil texture and will generate higher soil organic C sequestration [14]. Pertinent literature also showsthat soil with finer texture has a higher capacity [25] to hold water which is positive for both plantgrowth and ensuring biosolids degradation rates. Increasing soil C sequestration is an importantoption not only to mitigate climate change but also to enhance soil fertility and the productivityof agroecosystems [31]. Applying biosolids are much more effective in enhancing C sequestrationthan other agriculture method such as applying animal manure or plant materials [30,32]. Soil totalsurface area as well as temperature and moisture affect the rate of biosolids degradation and the rateof C sequestration.

Agriculture 2016, 6, 1 12 of 14
Agriculture 2016, 6, 1 11 of 13
Equation (6) was applied to the decomposition of biosolids for the three reference soils from Terry et al. [8] since these observations (see Figure 6) were not used to generate Equation (6). The estimated biosolids degradation rates from Terry et al. [8] were related to the rate predicted by the simple regression model shown in Equation (6). The agreement between values of estimated three values) from Terry et al. data and predicted by Equation (6) is statistically significant.
3.4. C Sequestration
Figure 7 shows the increase in the annual percentage of applied biosolids that can be sequestered as a function of total mineral soil surface area. The annual percentage of biosolids converted to biomass is determined based on a mass balance between gases C emitted to the atmosphere and stored as biomass C sequestered in the soil and are computed using the DRM. The C sequestration values were determined based on the assumption of first order degradation using Equations (1) to (3) with a biomass yield of 40%. The total mineral soil surface area for different degradation rates was determined from Equation (6). The sequestration rates for Terry et al. [8] soils were based on degradation rates determined from Figure 4 (0.19 to 0.35 year−1, 21 °C and 20% moisture) and for the eight fields from the DRM (Table 1). For Terry’s [8] soils the increase in total surface area was 2.7 m2/g and produced an increase in the annual sequestration rate from 6% to 11%. For the soils from the eight fields (10 °C and 10% moisture), the increase in total surface area was 7.2 m2/g and this produced an increase in the annual sequestration rate from 1% to 6%. Importantly, the present study indicates that land application of biosolids is an appropriate way to enhance C sequestration in soils [1], which was recommended by United Nations Framework Convention on Climate Change (UNFCCC) as a necessary step toward reducing greenhouse gas (GHG) [2]. This leads to the conclusion that applying biosolids to soils with fine texture contributes to the reduction of GHG more effectively than applying to coarser soils, since higher biosolids degradation rates are strongly related to finer soil texture and will generate higher soil organic C sequestration [14]. Pertinent literature also shows that soil with finer texture has a higher capacity [25] to hold water which is positive for both plant growth and ensuring biosolids degradation rates. Increasing soil C sequestration is an important option not only to mitigate climate change but also to enhance soil fertility and the productivity of agroecosystems [31]. Applying biosolids are much more effective in enhancing C sequestration than other agriculture method such as applying animal manure or plant materials [30,32]. Soil total surface area as well as temperature and moisture affect the rate of biosolids degradation and the rate of C sequestration.
Figure 7. Annual percentages of applied biosolids converted to sequestered carbon as a function of mineral soil surface area for field (10 °C and 10% moisture) and laboratory conditions (21 °C and 20% moisture). Sequestered % is based on first order kinetics and a biomass yield of 40%.
Figure 7. Annual percentages of applied biosolids converted to sequestered carbon as a functionof mineral soil surface area for field (10 ˝C and 10% moisture) and laboratory conditions (21 ˝C and20% moisture). Sequestered % is based on first order kinetics and a biomass yield of 40%.
4. Conclusions
This study has reanalyzed data on biosolids application to soil from a field study and a laboratorystudy to determine the relationship between biosolids mineral soil surface area and biosolidsdegradation. Regression analysis indicates that there is an association between total mineral soilsurface area (of sand, silt, and clay) and biosolids degradation rate. There was an average increaseof 0.018 year´1 in the degradation rate due to an increase of 1 m2/g of soil when the applicationrates were the same. Biological degradation of biosolids added to soil was significantly associated(R2 “ 0.80) with the total mineral soil surface area. Mineral soil surface area (related to soiltexture) has been shown to influence other soil characteristics such as soil organic matter content, soilaggregation and biomass (also defined as soil humus or sequestered carbon) accumulation that playan important role in soil degradation rates. It was not possible to include these additional variables inthe regression analysis based on the data available; however, it was shown that application rate doesnot have a statistically significant effect on the degradation rate.
Applying biosolids to soils with fine texture (higher mineral soil surface area) contributes to thereduction of GHG more effectively than application to coarse soils since higher biosolids degradationrates are related to finer soil texture and generate higher soil organic C sequestration. Increasing soilC sequestration is an important option not only to mitigate climate change but also to enhance soilfertility and the productivity of agroecosystems.
One limitation of this study is that only eight different soils were evaluated. In the future a widerrange of soil types will be investigated to evaluate the effect of mineral soil surface areas on biosolidsdegradation rates
Acknowledgments: We recognize Metropolitan Water Reclamation District of Greater Chicago (MWRDGC) forcollecting the data used in this study and Cecil Lu-Hing who was responsible for initiating and supervising thedata collection program.
Author Contributions: Dongqi Wen designed the experiment and analyzed data to investigate mineral soilsurface area of selected soil samples. Wenjuan Zhai developed the DRM model. Guanglong Tian collected andsupplied all the soil samples studied in this paper. Kenneth E. Noll and Dongqi Wen drafted the manuscript.Demetrios Moschandreas, Wenjuan Zhai and Guanglong Tian carried out the critical revision of the manuscript.
Conflicts of Interest: The authors declare no conflict of interest.

Agriculture 2016, 6, 1 13 of 14
References
1. Post, W.M.; Peng, T.H.; Emauel, W.R.; King, A.W.; Dale, V.H.; de Angelis, D.L. The global carbon cycle.Am. Sci. 1990, 78, 310–326.
2. Brown, S.; Leonard, P. Building carbon credits with biosolids recycling. BioCycle 2004, 45, 25–29.3. Jarecki, M.K.; Lal, R. Crop management for soil carbon sequestration. Crit. Rev. Plant. Sci. 2003, 22, 471–502.
[CrossRef]4. Tian, G.; Granato, T.C.; Cox, A.E.; Pietz, R.I.; Carlson, C.R.; Abedin, Z. Soil carbon sequestration resulting
from long-term application of biosolids for land reclamation. J. Environ. Qual. 2009, 38, 61–74. [CrossRef][PubMed]
5. Conant, R.T.; Paustian, K. Potential soil carbon sequestration in overgrazed grassland ecosystems.Glob. Biogeochem. Cycles 2002, 16, 901–909. [CrossRef]
6. West, T.Q.; Post, W.M. Soil organic carbon sequestration rates by tillage and crop rotation: A global dataanalysis. Soil Sci. Soc. Am. J. 2002, 66, 1930–1946. [CrossRef]
7. Miller, A., III; Morgan, M.E.; Libbey, L.M. Lactobacillus maltaromicus, a new species producing a maltyaroma. Int. J. Syst. Bacterial. 1974, 24, 346–354. [CrossRef]
8. Terry, R.E.; Nelson, D.W.; Sommers, L.E. Decomposition of anaerobically digested sewage sludge as affectedby soil environmental conditions. J. Environ. Qual. 1979, 8, 342–347. [CrossRef]
9. Gilmour, J.T.; Gilmour, C.M. A simulation model for sludge decomposition in soil. J. Environ. Qual. 1980, 9,194–199. [CrossRef]
10. Parton, W.J.; Schimel, D.S.; Cole, C.V.; Ojima, D.S. Analysis of factors controlling soil organic matter levelsin great plains grasslands. Soil Sci. Soc. of Am. J. 1987, 51, 1173–1179. [CrossRef]
11. Brown, S.; Beecher, N.; Carpenter, A. Calculator tool for determining greenhouse gas emissions for biosolidsprocessing and end use. Environ. Sci. Technol. 2010, 44, 9509–9515. [CrossRef] [PubMed]
12. Bolan, N.S.; Kunhikrishnan, A.; Naidu, R. Carbon storage in a heavy clay soil landfill site after biosolidsapplication. Sci. Total Environ. 2013, 465, 216–225. [CrossRef] [PubMed]
13. Thangarajan, R.; Bolan, N.S.; Tian, G.; Naidu, R.; Kunhikrishnan, A. Role of organic amendment applicationon greenhouse gas emission from soil. Sci. Total Environ. 2013, 465, 72–96. [CrossRef] [PubMed]
14. Zhai, W.; Moschandreas, D.J.; Tian, G.; Venkatesan, D.; Noll, K.E. Degradation rate model formulationto estimate soil carbon sequestration from biosolids application. Soil Sci. Soc. Am. J. 2013, 78, 238–247.[CrossRef]
15. Sorenson, L.H. Carbon-nitrogen relationships during the humiliation of cellulose in soils containingdifferent amounts of clay. Soil Biol. Bio chem. 1981, 13, 313–321. [CrossRef]
16. USDA. Soil Survey of Fulton County, Illinois; U.S. Department of Agriculture: Washington, DC, USA, 1997.17. Hillel, D. Fundamentals of Soil Physics, 2nd ed.; Academic Press Inc.: Orlando, FL, USA, 1980; pp. 123–124.18. Liu, C.; Evett, J. Grain-size analysis of soil (including both mechanical and hydrometer analyses). In Soil
Properties: Testing, Measurement, and Evaluation, 6th ed.; Prentice Gall: Upper Saddle River, NJ, USA, 2008;pp. 117–128.
19. Hamaker, J. Mathematical prediction of cumulative levels of pesticides in soil. In Organic Pesticides in theEnvironment, 1st ed.; American Chemical Society: Washington, DC, USA, 1966; pp. 124–131.
20. Loosdrecht, M.C.; Lyklema, J.; Norde, W.; Zehnder, A.J. Influence of interfaces on microbial activity.Microbiol. Mol. Biol. Rev. 1990, 54, 75–87.
21. Parton, W.J.; Ojima, D.S.; Cole, C.V.; Schimel, D.S. A general model for soil organic matter dynamics:Sensitivity to litter chemistry, texture and management. Soil Sci. Am. J. 1994, 39, 147–167.
22. USDA. Textural Soil Classification; U.S. Department of Agriculture: Washington, DC, USA, 1987.23. Borkovec, M.; Wu, Q.; Degovics, G.; Laggner, P.; Sticher, H. Surface area and size distributions of soil
particles. Colloid Surface A 1993, 73, 65–76. [CrossRef]24. Jastrow, J.D.; Amonette, J.E.; Bailey, V.L. Mechanisms controlling soil carbon turnover and their potential
application for enhancing carbon sequestration. Clim. Change 2007, 80, 5–23. [CrossRef]25. Parton, W.J.; Flach, K.; Burke, I.C.; Cole, C.V.; Yonker, C.M. Texture, climate and cultivation effects on soil
organic matter content in US grassland soils. Soil Sci. Am. J. 1989, 53, 800–805.26. Gilmour, J.T.; Clark, M.D. Predicting long-term decomposition of biosolids with a seven-day test.
J. Environ. Qual. 1996, 25, 766–770. [CrossRef]

Agriculture 2016, 6, 1 14 of 14
27. Paul, E.A. Dynamics of organic matter soils. Plant Soil. 1984, 76, 275–285. [CrossRef]28. Schimel, D.S.; Coleman, D.C.; Horton, K.C. Soil Organic matter dynamics in paired rangeland and cropland
topo sequences in North Dakota. Geoderma 1985, 36, 201–214. [CrossRef]29. Schimel, D.S.; Parton, W.J. Microclimatic controls of nitrogen mineralization and nitrification in shortgrass
steppe soils. Plant Soil. 1986, 93, 347–357. [CrossRef]30. Allison, F.E.; Sherman, M.S.; Pinck, L.A. Maintenance of soil organic matter. Soil Sci. 1949, 68, 463–478.
[CrossRef]31. Manlay, R.J.; Feller, C.; Swift, M.J. Historical evolution of soil organic matter concepts and their relationships
with the fertility and sustainability of cropping systems. Agric. Ecosyst. Environ. 2007, 119, 217–233.[CrossRef]
32. Gerzabek, M.H.; Haberhauer, G.; Kirchmann, H. Soil organic matter pools and carbon-13 naturalabundances in particle-size fraction of a long-term agricultural field experiment receiving organicamendments. Soil Sci. Soc. Am. J. 2001, 64, 352–358. [CrossRef]
© 2015 by the authors; licensee MDPI, Basel, Switzerland. This article is an openaccess article distributed under the terms and conditions of the Creative Commons byAttribution (CC-BY) license (http://creativecommons.org/licenses/by/4.0/).