Post-tsunami rehabilitation of fish cage farms on the Andaman coast of Thailand
JOUR.GEOL.SOC.INDIA, VOL.76, AUG. 2010
164 BASAB MUKHOPADHYAY AND OTHERS
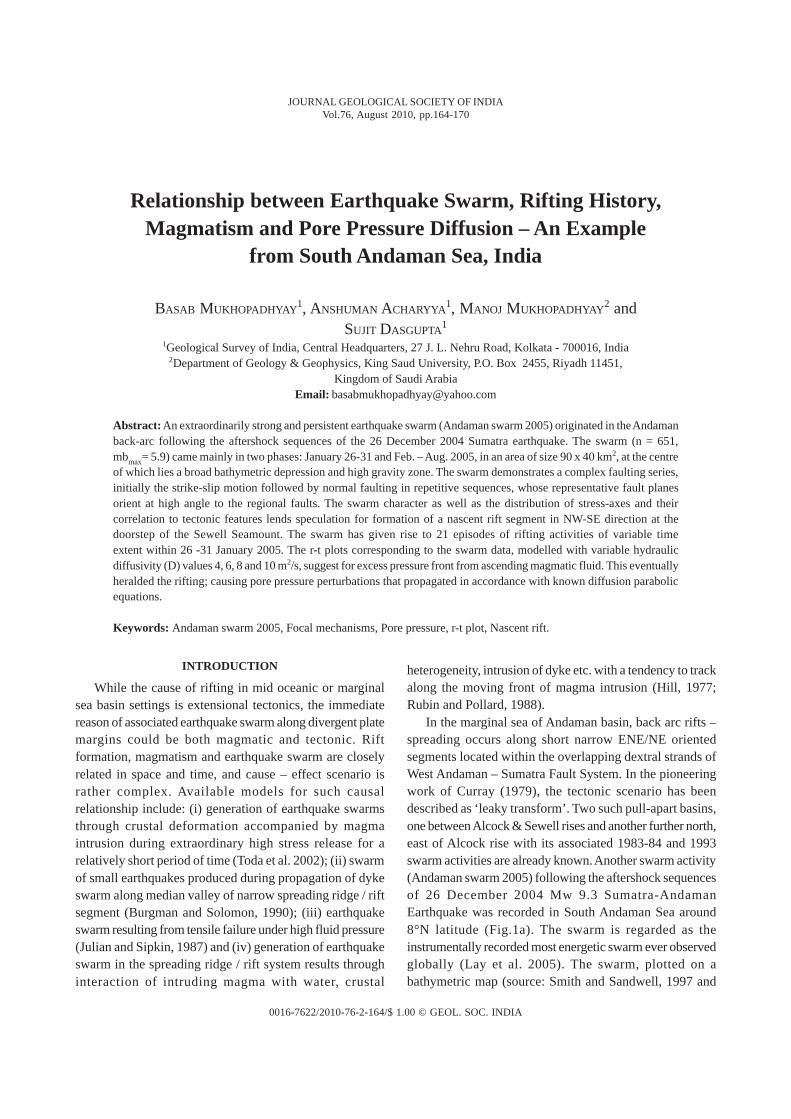
Relationship between Earthquake Swarm, Rifting History,Magmatism and Pore Pressure Diffusion – An Example
fr om South Andaman Sea, India
BASAB MUKHOPADHYAY1, ANSHUMAN ACHARYYA
1, MANOJ MUKHOPADHYAY2 and
SUJIT DASGUPTA1
1Geological Survey of India, Central Headquarters, 27 J. L. Nehru Road, Kolkata - 700016, India2Department of Geology & Geophysics, King Saud University, P.O. Box 2455, Riyadh 11451,
Kingdom of Saudi ArabiaEmail: [email protected]
Abstract: An extraordinarily strong and persistent earthquake swarm (Andaman swarm 2005) originated in the Andamanback-arc following the aftershock sequences of the 26 December 2004 Sumatra earthquake. The swarm (n = 651,mbmax= 5.9) came mainly in two phases: January 26-31 and Feb. – Aug. 2005, in an area of size 90 x 40 km2, at the centreof which lies a broad bathymetric depression and high gravity zone. The swarm demonstrates a complex faulting series,initially the strike-slip motion followed by normal faulting in repetitive sequences, whose representative fault planesorient at high angle to the regional faults. The swarm character as well as the distribution of stress-axes and theircorrelation to tectonic features lends speculation for formation of a nascent rift segment in NW-SE direction at thedoorstep of the Sewell Seamount. The swarm has given rise to 21 episodes of rifting activities of variable timeextent within 26 -31 January 2005. The r-t plots corresponding to the swarm data, modelled with variable hydraulicdiffusivity (D) values 4, 6, 8 and 10 m2/s, suggest for excess pressure front from ascending magmatic fluid. This eventuallyheralded the rifting; causing pore pressure perturbations that propagated in accordance with known diffusion parabolicequations.
Keywords: Andaman swarm 2005, Focal mechanisms, Pore pressure, r-t plot, Nascent rift.
heterogeneity, intrusion of dyke etc. with a tendency to trackalong the moving front of magma intrusion (Hill, 1977;Rubin and Pollard, 1988).
In the marginal sea of Andaman basin, back arc rifts –spreading occurs along short narrow ENE/NE orientedsegments located within the overlapping dextral strands ofWest Andaman – Sumatra Fault System. In the pioneeringwork of Curray (1979), the tectonic scenario has beendescribed as ‘leaky transform’. Two such pull-apart basins,one between Alcock & Sewell rises and another further north,east of Alcock rise with its associated 1983-84 and 1993swarm activities are already known. Another swarm activity(Andaman swarm 2005) following the aftershock sequencesof 26 December 2004 Mw 9.3 Sumatra-AndamanEarthquake was recorded in South Andaman Sea around8°N latitude (Fig.1a). The swarm is regarded as theinstrumentally recorded most energetic swarm ever observedglobally (Lay et al. 2005). The swarm, plotted on abathymetric map (source: Smith and Sandwell, 1997 and
INTRODUCTION
While the cause of rifting in mid oceanic or marginalsea basin settings is extensional tectonics, the immediatereason of associated earthquake swarm along divergent platemargins could be both magmatic and tectonic. Riftformation, magmatism and earthquake swarm are closelyrelated in space and time, and cause – effect scenario israther complex. Available models for such causalrelationship include: (i) generation of earthquake swarmsthrough crustal deformation accompanied by magmaintrusion during extraordinary high stress release for arelatively short period of time (Toda et al. 2002); (ii) swarmof small earthquakes produced during propagation of dykeswarm along median valley of narrow spreading ridge / riftsegment (Burgman and Solomon, 1990); (iii) earthquakeswarm resulting from tensile failure under high fluid pressure(Julian and Sipkin, 1987) and (iv) generation of earthquakeswarm in the spreading ridge / rift system results throughinteraction of intruding magma with water, crustal
JOURNAL GEOLOGICAL SOCIETY OF INDIAVol.76, August 2010, pp.164-170
0016-7622/2010-76-2-164/$ 1.00 © GEOL. SOC. INDIA

JOUR.GEOL.SOC.INDIA, VOL.76, AUG. 2010
RELATIONSHIP BETWEEN EARTHQUAKE SWARM, RIFTING HISTORY, MAGMATISM AND PORE PRESSURE DIFFUSION165
http://topex.ucsd.edu/cgi-bin/get_data.cgi), outlines anintense NE-SW oriented seismic cluster centering at about8oN latitude (Fig.1c) over a high gravity zone (source:Sandwell and Smith, 2009) (Fig.1d). In our earliercommunication (Mukhopadhyay and Dasgupta, 2008) wehave postulated the development of a nascent pull-apart rift
basin segment close to 8°N latitude (Fig.1e) from theseismotectonic analysis of 2005 swarm.
In this paper, as an extension of our earlier work, theobjectives are: (i) seismotectonic characterisation andanalyse the 2005 swarm, (ii) delineate history of rifting, and(iii) infer on the triggering mechanism of the swarm by
Fig.1. Salient features of 2005 Andaman swarm: (a) location map showing seismic events represented by the three swarms of 1983-84,
1993 and 2005 along with active tectonic features. Dashed lines in the right side of SFS are the interpreted rifts by Curray,2005. AT – Andaman Trench, WAF- West Andaman Fault, ASR - Andaman Spreading Ridge, SFS – Sumatra Fault System,NFS – Netaji Fault System, B – Barren Volcano, N- Narcondam. (b) Lower hemisphere equal area plot of P axes (red circles),T axes (black circles) their composite, and nodal fault planes (black great circles) of 2005 swarm. (c) Plot of seismic events of2005 swarm on bathymetric contours. (d) Plot of seismic events of 2005 swarm on gravity contours. (e) Plot of earthquakeswith CMT data of 2005 swarm on bathymetry along with inferred new rift system in South Andaman Sea. Beach ball diagramsof some representing events are plotted. The solid black lines (after Mukhopadhyay and Dasgupta, 2008) indicate boundaryof newly formed rift across WAF, SFS and NFS. Red star (Fig. 1c and 1d) indicates injection point from which the fluid diffusionstarts.

JOUR.GEOL.SOC.INDIA, VOL.76, AUG. 2010
166 BASAB MUKHOPADHYAY AND OTHERS
studying the role of probable magmatic fluid associated withdyking events by constructing the r-t plots where ‘r’ is theradius of the triggering front and ‘t’ is the time.
CHARACTERISTICS OF 2005 SWARM
A total of 651 tremors between 26 - 31 January 2005(mb = 3.9 to 5.9, NEIC catalog) are recorded at crustal tosub-crustal depths (Table 1a) with dual frequency peaks inthe magnitudes 4.5 and 5.2 respectively. Major pulse withmore than 200 events / day was noted during 27-28 January2005. The swarm further produced 90 more earthquakes inthe magnitude range of mb: 4.0 to 5.9, during the periodbetween February and August 2005 (Table 1b). The swarmcluster is of oval shape with an aspect ratio of 2.75 (length110 km/ width 40 km) and its b-value 1.83; which issuggestive of its possible origin from rift related volcanicactivity (Mukhopadhyay and Dasgupta, 2008). Eruption ofthe Barren Volcano in central Andaman Sea eventually tookplace in May-June 2005 following the swarm.
Out of a total of 116 well-constrained CMT solutions(www.seismology.harvard.edu) within the period 26 - 31January 2005, 80 represent strike slip earthquakes, 22 denotenormal fault (i.e. normal with dip slip component) while theremaining 14 events indicate normal faulting with asignificant strike-slip component (i.e. normal with obliqueslip). The magnitude variation within events indicate thathigher magnitude earthquakes are by and large of strike-
slip source mechanism, whereas, comparatively lowmagnitude earthquakes are with normal geometry. Theearthquake events in the swarm have their major compressivestress axis dipping 50° towards 6°N, whereas, the extensionalaxis is consistent and oriented sub-horizontally (16°) towards115° N; with two average fault planes: one with strike 58°Nand dip 84° towards southeast, and other with strike 146°Nand dip 62° southwest (Fig.1b) (Mukhopadhyay andDasgupta, 2008). The focal depths of 116 earthquakes withCMT solutions (Table 2) indicate occurrences of maximumnumber of strike slip and normal events within mid-crustaldepth (between 22 – 30 km) with very few earthquakesbeyond 33 km depth. Prior to 26 December 2004 Sumatra –Andaman earthquake, seismicity in the swarm zone wascharacterized primarily by strike-slip mechanisms consistentwith the features accommodating right-lateral obliqueconvergence, such as the West Andaman Fault (WAF) andSumatra Fault System (SFS) (Engdahl et al. 2007). Similarstrike-slip motion prevailed during the swarm formingperiod, but with occurrence of normal events that was absentearlier, indicating formation of extensional structure in andaround this zone.
RIFTING HISTORY BELOW THE SOUTHANDAMAN SEA
Magma injection in rifted areas commonly invokes theinjection of shallow, vertical, en-echelon dykes extendingalong a narrow rift zone, this injection accounts initial strikeslip motion followed by the collapse of closely spaced innerrift wall with earthquakes of normal fault source mechanism(Hill, 1977). Our previous study (Mukhopadhyay andDasgupta, 2008) on 2005 Andaman swarm indicated thatintruding magmatic dykes followed by rifting, spreading
Table 1. Statistical details of the Andaman Sea 2005 swarm activity
a) 26-31 January, 2005
Pulsating nature and 138.94 hours of swarm activityfrom 26 to 31st January 2005
Date Number of mb Depth in kmevents / day (range) (range)
26 41 3.9-5.6 13-4927 234 3.9-5.9 16-3828 243 4.0-5.7 13-4329 89 3.9-5.6 16-4830 25 4.1-5.6 11-3031 19 4.2-5.2 15-30
b) February – August 2005
Month Number of mb Depth in kmevents / month (range) (range)
February 43 4.2-5.9 11-56March 9 4.1-5.2 30-37April 5 4.2-5.0 23-30May 3 4.0-4.5 30June 18 4.2-5.3 20-66July 8 4.3-4.9 16-46August 4 4.2-5.5 19-46
Table 2. Focal Depth distribution of 116 CMT solutions and their sourcemechanism
Type of source No. of Depth Depth band and no. ofmechanism CMT range events
data (km)
Normal fault (i.e. (13 – 24) km—10 eventsNormal with dip 22 (13-43) (24 – 30) km—9 eventsslip) (40 –43) km—3 events
Normal faulting with asignificant strike-slip 14 (17-30) (17 – 22) km—5 eventscomponent (i.e. Normal (23 – 30) km—9 eventswith Oblique slip)
(16 – 25) km—16 eventsStrike slip 80 (16-43) (26 – 32) km—60 events
(33 – 43) km—4 events

JOUR.GEOL.SOC.INDIA, VOL.76, AUG. 2010
RELATIONSHIP BETWEEN EARTHQUAKE SWARM, RIFTING HISTORY, MAGMATISM AND PORE PRESSURE DIFFUSION167
and collapse of rift walls had released the strain to generate2005 Andaman swarm.
‘Magma Injection Model’ of Hill (1977) has modelledthe time taken for completing ‘one rifting episode’ as thetotal time taken to complete a sequence of earthquakes withstrike slip and normal fault plane solutions. On scrutiny ofthe 116 numbers of CMT earthquake data of sourcemechanism of ‘2005 Andaman Swarm’ occurred between26 and 31 January 2005, we have identified twenty-one suchperiodic temporal sequences. The sequences are numberedfrom 1st to 21st. We have further calculated the timing withinthese sequences and categorised the time taken by the initialoccurrences of clusters of strike slip earthquakes as “riftformation time”, followed by a series of earthquakes clusterswith normal fault plane solutions as “rift collapse time”.Summation of “rift formation time” and “rift collapse time”is the “total time taken by one rifting episode”. Numbers offault plane solutions of different categories (strike slip andnormal); numbers of earthquakes; rift formation, rift collapseand total rifting time within these twenty-one episodes aretabulated (Table 3). “Rift formation” / “rift collapse time”
is correlated as a function of “total rifting time”. A positivecorrelation exists between “rift formation time” and “riftcollapse time” i.e. where “rift formation time” is large; the“rift collapse time” is also large. The development anddistribution of these twenty-one rifting episodes is expressedpictorially as a function of time (Fig.2). The rift formationwas on its peak during 12th to 15th episodes (Table 3) where261 earthquakes have been generated within 26.89 hours.
MAGMA TIC DYKING EVENTS – PORE PRESSURE,DIFFUSION AND SWARM
The 2005 Andaman swarm was initially described byUSGS as a release of large amount of elastic strain at plateinterface between Indian Plate and SE Asian Plate withoutany visible sign of volcanic activity on surface or underwater in the surrounding areas. Subsequently, a crateredseamount is spotted in the swarm zone during a voyage bythe National Institute of Oceanography (India). Theunconsolidated aggregates (consisting of globules with66-97% manganese oxide) that were collected from the
Table 3. Salient parameters of episodes of rifting from 26 to 31 January, 2005
Sequential Earthquake event date CMT Number of Rift Rift TotalRifting (Hr:Mn:Sec), magnitude (mb) solutions* earthquakes formation collapse riftingepisodes time (hrs) time (hrs) time (hrs)
From To
1 26.1.2005 (03:38:13), 4.8 27.1.2005 (03:58:45), 5.43 SS, 1 NOb 62 19.41 4.93 24.342 27.1.2005 (04:02:08), 4.7 27.1.2005 (06:56:59), 5.73 SS, 1 NOb 21 2.26 0.71 2.973 27.1.2005 (07:08:27), 4.8 27.1.2005 (07:35:46), 5.23 SS, 1 NOb 6 0.53 0.12 0.654 27.1.2005 (07:41:22), 4.9 27.1.2005 (09:25:28), 5.27 SS, 1 NOb 21 1.6 0.23 1.835 27.1.2005 (09:32:23), 4.6 27.1.2005 (12:11:56), 5.4 8 SS, 1 NOb 27 2.52 0.26 2.786 27.1.2005 (12:20:19), 4.5 27.1.2005 (14:35:07), 5.17 SS, 1 NOb 29 2.02 0.36 2.387 27.1.2005 (14:38:37), 4.2 27.1.2005 (18:52:39), 5.69 SS, 1 N 51 3.09 1.2 4.298 27.1.2005 (19:12:18), 4.7 27.1.2005 (19:31:10), 5.21 SS, 1 N 3 0.46 0.18 0.649 27.1.2005 (19:40:36), 5.3 27.1.2005 (20:17:38), 5.11 SS, 1 N 7 0.16 0.62 0.78
10 27.1.2005 (20:23:13), 4.1 27.1.2005 (20:51:11), 5.2 1 SS, 2 NOb 10 0.46 0.1 0.5611 27.1.2005 (20:53:06), 4.6 27.1.2005 (22:56:48), 5.03 SS, 2 N 27 1.83 0.27 2.112 27.1.2005 (23:0:56), 4.5 28.1.2005 (02:23:14), 5.3 3 SS, 2 NOb, 43 2.78 0.66 3.44
3 N13 28.1.2005 (02:27:38), 4.7 28.1.2005 (08:29:46), 5.38 SS, 2 NOb, 76 5.97 0.14 6.11
1 N14 28.1.2005 (08:41:22), 4.5 28.1.2005 (17:16:30), 4.74 SS, 1 NOb, 85 9.33 1.49 10.82
2 N15 28.1.2005 (17:23:04), 4.3 29.1.2005 (01:50:23), 5.42 SS, 2 N 57 4.22 2.3 6.5216 29.1.2005 (01:56:39), 4.6 29.1.2005 (05:26:48), 5.31 SS, 1 N 13 1.79 1.81 3.617 29.1.2005 (06:33:58), 3.9 29.1.2005 (19:06:16), 5.33 SS, 2 N 39 13.19 0.47 13.6618 29.1.2005 (19:20:33), 4.3 29.1.2005 (22:03:37), 5.44 SS, 1 N 18 1.87 1.08 2.9519 29.1.2005 (22:12:34), 4.7 30.1.2005 (02:35:16), 5.22 SS, 2 N 17 4.37 0.16 4.5320 30.1.2005 (03:13:28), 5.1 30.1.2005 (10:32:54), 5.02 SS, 2 N 14 6.24 1.72 7.9621 30.1.2005 (10:40:18), 4.8 31.1.2005 (08:15:06), 5.22 SS, 1 NOb, 17 15.8 5.91 21.71
1 N- 31.1.2005 (08:56:18), 4.2 31.1.2005 (22:34:37), 4.73 SS 8 - - -
* [SS – Strike slip Solution, NOb – Normal with oblique slip solution, N – Normal with dip slip solution]

JOUR.GEOL.SOC.INDIA, VOL.76, AUG. 2010
168 BASAB MUKHOPADHYAY AND OTHERS
to evaluate the role of ascending magmatic fluid associatedwith dyke intrusion by constructing r-t plots. This method isbased on the diffusion equation for a point pore pressuresource in a homogeneous isotropic fluid saturated poro-elastic medium and estimates the distance ‘r’ of thepropagating pore pressure front from the injection point (thatacts as a source), with r = √(4πDt) as a function of time (t)(Shapiro et al. 1997). The equation actually defines theenveloping (modelled) parabola in the r-t plot with variablediffusivity (D) values. The D-value in the earth’s crust rangesbetween 0.1 and 10m2/s (Shapiro et al. 1999) but may reachup to 90m2/s (Antonioli et al. 2005). Shapiro et al. (2002)predict that fluid flow may trigger an earthquake at a location‘r ’ at any time ‘t’ after the pressure perturbation. Therefore,in r-t plot seismicity points should lie below the modelledparabolic curve. On the contrary, if the earthquake triggeringoccurs shortly after the pore pressure perturbations (Noir etal. 1997), we should observe a narrow cluster of seismicityalong the line of modelled parabola in the r-t plot. So, the r-t plot represents spatial distances ‘r’ of the individual eventsfrom the injection point as a function of time ‘t’. Thus, anunambiguously defined injection point, which correspondsto the origin of the graph, is a prerequisite for this method.The injection point from which the fluid diffusion starts isidentified as the epicentral location of the first earthquake(Date 26/1/2005, 3 Hr: 38 Min: 13Sec, Latitude 7.87,Longitude 94.08, mb 4.8, depth 18 km) of the 2005 Andamanswarm (for more explanation on injection point, see Shapiroet al. 1997, 2002). The location of this injection point ismarked on the map as red star (Figs 1c and 1d). Further, thespatial distances ‘r’ and elapsed ‘time’ from the injectionpoint to the following earthquakes within the swarm iscalculated. The points in the r-t plots for D values of 4, 6, 8and 10 m2/s follow the parabolic equations and occur belowthe modelled parabolic curve (Fig.3). It can be inferred that2005 swarm sequence is controlled by pore pressureperturbations in a poro-elastic fluid saturated medium. Thetime dependent perturbation is associated with co-seismicstress changes generated by dyke intrusion. High fluidpressure due to this magmatic activity has generated the porepressure perturbation in sub-crustal depth. Here, themigration of seismicity is consistent with pore pressurerelaxation – as is noted for intra-plate earthquake swarmselsewhere (Parotidis et al. 2003).
CONCLUSIONS
Existence of active rifting in a back-arc setting alongCentral Andaman Basin north of 10° latitude is known fromearlier studies. Our earlier work (Mukhopadhyay and
Fig.2. Graph showing total rifting time as a function of riftformation / rift collapse time. The rifting episodes from 26to 31 January 2005 are sequentially numbered from 1st to21st.
flank of the seamount had indicated hydrothermal manganeseprecipitation as a consequence of recent pulses ofhydrothermal activity (Kattoju et al. 2008). The inter-platemotion partitioning along up-thrusted Andaman plate (Layet al. 2005) during the initial phase of rupture propagationof Sumatra-Andaman earthquake had produced the new riftzone by magmatic dyke injection from the underlying plume(Mukhopadhyay and Dasgupta, 2008). The magmatic originis also attested by the high b-value (1.83) of 2005Andamanswarm. The influence of plume and dyking event continuedup to August 2005 with a marginal increase in seismicactivity between February and June 2005 (Table 1b). Suchdyking event apparently changed the state of stress in theback-arc area, ultimately triggering similar dyking eventsin the surrounding magma chambers. It is intriguing that thesaid period of intense seismicity bears a close space-timerelationship to the Barren Island volcanism that erupted inMay-June 2005. The swarm zone is closely delineated by aNE-SW lithospheric hinge fault running transverse to theAndaman subduction zone as reported in one of our earlierstudy (the fault f-13 in Dasgupta et al. 2003). Thus the originof the nascent rift is seemingly controlled by mantle flow atlithospheric depths.
In order to make a preliminary assessment on theprobable triggering mechanism for the swarm, we attempt

JOUR.GEOL.SOC.INDIA, VOL.76, AUG. 2010
RELATIONSHIP BETWEEN EARTHQUAKE SWARM, RIFTING HISTORY, MAGMATISM AND PORE PRESSURE DIFFUSION169
Dasgupta, 2008) and its extension in the present work, forthe first time, have brought out the presence of a nascent riftand its rifting episodes in south Andaman Sea around 8°Nlatitude. The trend and geographic extent of this nascent riftis constrained by seismicity and CMT data (Fig.1e). Therift makes high angle to the regional trend of strike slip faultsystems (WAF, SFS and NFS) and is parallel to the transversehinge fault at lithospheric depths. The presence of broadbathymetric depression and high gravity in and around theproposed rift site has confirmed surface expression of therift and presence of near surface denser material (probablemantle material?). The rifting process is manifested by sixdays intense seismic activity in the form of swarm with
twenty-one episodes of rifting of variable time extent. Weinterpret the rifting and accompanied swarm activity is aproduct of magmatic dyke intrusion in phases within thehot, thin oceanic crust (modelled by Shapiro et al. 2008) inthe SE Asian Plate. The ascending magmatic fluidaccompanying this dyke intrusion has triggered theearthquakes by causing pore pressure perturbations, whichpropagate according to the diffusion equations illustratedin r-t plots (Fig.3). The pore-pressure diffusion has triggeredthe swarm activity by changing the effective stresses. Thehigh diffusivity (D) values required to model the r-t plotsindicate a highly inter-connected fractured lithospherewithin the nascent rift.
Fig.3. r-t plot of the data of swarm 2005 with parabolic envelope of variable hydraulic diffusivity values; (a) D = 4 m2/s, (b) D = 6 m2/s,(c) D = 8 m2/s and (d) D = 10 m2/s. The injection point is marked by red star in Fig.1c and 1d. ‘r’ represents spatial distances ofthe individual events from the injection point as a function of time ‘t’.
References
ANTONIOLI, A., PICCININI, D., CHIARALUCE, L. and COCCO M. (2005)Fluid flow and seismicity pattern: Evidence from the 1997Umbria-Marche (central Italy) seismic sequence. Geophys.Res. Lett., v.32, L10311, DOI:10.1029/2004GL022256.
BERGMANN, E.A. and SOLOMON, S.C. (1990) Earthquake swarms
on the Mid Atlantic Ridge: products of magmatic or extensionaltectonics? Jour. Geophys. Res., v.95, pp.4943-4965.
CURRAY, J.R. (2005) Tectonics and history of the Andaman Searegion. Jour. Asian Earth Sci., v.25, pp.187-232.
CURRAY, J.R., MOORE, D.G., LAWVER, L.A., EMMEL, F.J., RAITT, R.W.,

JOUR.GEOL.SOC.INDIA, VOL.76, AUG. 2010
170 BASAB MUKHOPADHYAY AND OTHERS
HENRY, M. and K IECKHEFER, R. (1979) Tectonics of theAndaman Sea and Burma. Amer. Assoc. Pet. Geol. Mem., v.29,pp.189-198.
DASGUPTA, S., MUKHOPADHYAY, M., BHATTACHARYA, A. and JANA, T.K. (2003) The geometry of the Burmese–Andaman subductinglithosphere. Jour. Seism., v.7, pp.155-174.
ENGDAHL, E.R., VILLASENOR A., DESHON, H.R. and THURBER, C.H.(2007) Teleseismic Relocation and Assessment of Seismicity(1918–2005) in the Region of the 2004 Mw 9.0 Sumatra–Andaman and 2005 Mw 8.6 Nias Island Great Earthquakes.Bull. Seism. Soc. Am., v.97(1A), pp.S43–S61, DOI: 10.1785/0120050614.
HILL , D.P. (1977) A model of earthquake swarms. Jour. Geophy.Res., v.82, pp.1347-1352.
JULIAN , B.R. and SIPKIN S.A. (1985) Earthquake process in theLong Valley Caldera area, California. Jour. Geophys. Res.,v.90, pp.11155-11169.
KATTOJU, K. R., RAY, D., MUDHOLKAR, A., GOLLU, M. P., MATHEW,R., PAROPKARI, A L., KALATHIL , B. and RAMACHANDRAN , R.(2008) Tectonic and Magmatic Implications of the Off-NicobarEarthquake Swarm, Andaman Sea. Eos Trans. AGU, no.89(53),Fall Meet. Suppl., Abs. T51B-1890.
LAY, T., KANAMORI , H., AMMON, C.J., NETTLES, M., WARD, S.N.,ASTER, R.C., BECK, S. L., BILEK, S.L., BREDZINSKI, R., BUTLER,R., DESHON, H.R., EKSTROM, G., SATAKE, K. and SIPKIN, S.(2005) The great Sumatra – Andaman earthquake of 26December 2004. Science, v.308, pp.1127-1132.
MUKHOPADHYAY, B. and DASGUPTA, S. (2008) Swarms in AndamanSea, India – a seismotectonic analysis. Acta Geophysica,v.56(4), pp.1000-1014, DOI: 10.2478/s11600-008-0039-5.
NOIR, J., JACQUES, E., BEKRI, S., ALDER, P.M., TAPPONIER, P. andKING G.C.P. (1997) Fluid flow triggered migration of events
in the 1989 Dobi earthquake sequence of Central Afar.Geophys. Res. Lett., v.24, pp.2335-2338.
PAROTIDIS, M., ROTHERT, E. and SHAPIRO, S.A. (2003) Pore-pressurediffusion: A possible triggering mechanism for the earthquakeswarms 2000 in Vogtland/NW Bohemia, Central Europe.Geophys. Res. Lett., v.30(20), p.2075, DOI:10.1029/2003GL018110.
RUBIN, A.M. and POLLARD, D.D. (1988) Dike induced faulting inrift zones of Iceland and Afar. Geology, v.16, pp.413-417.
SANDWELL, D.T. and SMITH , W.H.F. (2009) Global marine gravitydata from retracted Geosat and ERS-1 altimetry: Ridgesegmentation versus spreading rate. Jour. Geophys. Res., v.114,p. B01411, DOI: 10.1029/2008 JB 006008.
SHAPIRO, N.M., RITZWOLLER, M.H. and ENGDAHL, E.R. (2008)Structural context of the great Sumatra- Andaman IslandEarthquake. Geophys. Res. Lett., v.35, L05301.
SHAPIRO, S.A., HUENGES, E. and BORM, G. (1997) Estimating thecrust permeability from fluid-injection-induced seismicemission at the KTB site. Geophys. Jour. Int., v.131, pp.F15-F18.
SHAPIRO, S.A., AUDIGANE, P. and ROYER, J.J. (1999) Large scale insitu permeability tensor of rocks from induced micro-seismicity.Geophys. Jour. Int., v.137, pp.207-213.
SHAPIRO, S.A., ROTHERT, E. and RATH, V. (2002) Characterizationof fluid transport properties of reservoirs using inducedmicroseismicity. Geophysics, v.67(1), pp.212-220.
SMITH , W.H.F. and SANDWELL , D.T. (1997) Global seafloortopography from satellite altimetry and ship depth soundings.Science, v.277, pp.1957-1962.
TODA. S., STEIN, R.S. and SAGIYA, T. (2002) Evidence from the AD2000 Izu Islands earthquake swarm that stressing rate governseismicity. Nature, v.419, pp.58-61.
(Received: 1 April 2010; Revised form accepted: 3 May 2010)
Copyright © 2022 FDOKUMEN


![SIPUNCULANS IN HUMP CORAL PORITES LUTEA, THE ANDAMAN SEA, THAILAND. [1994]](https://static.fdokumen.com/doc/165x107/6322f3f063847156ac06da7d/sipunculans-in-hump-coral-porites-lutea-the-andaman-sea-thailand-1994.jpg)