Australia and Indonesia in collision: geochemical sources of magmatism
23
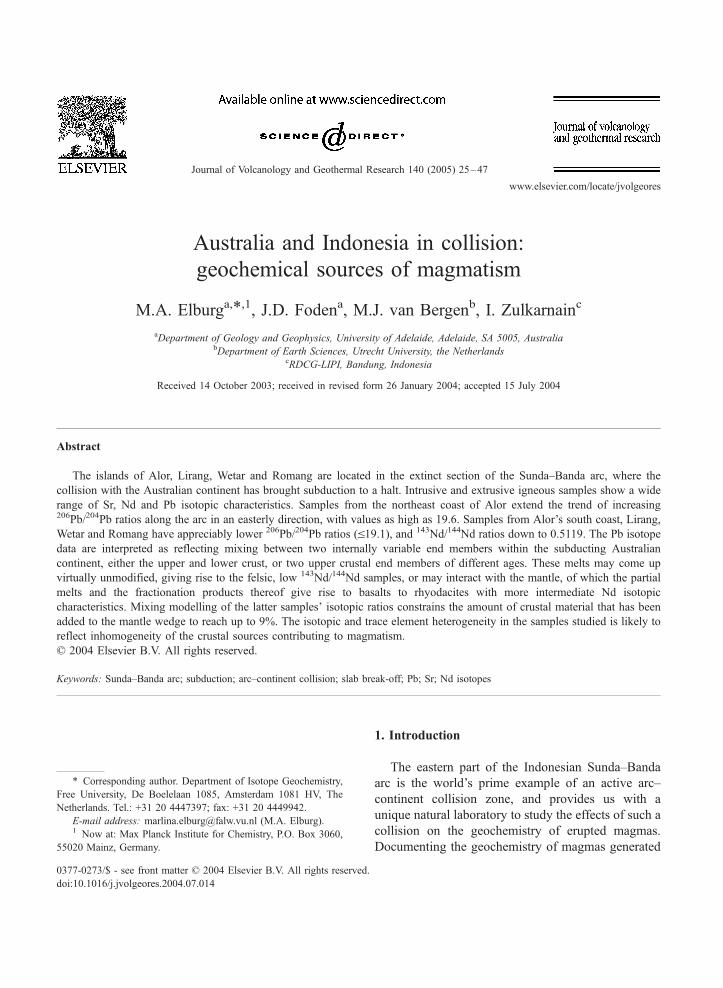
Australia and Indonesia in collision: geochemical sources of magmatism M.A. Elburg a, * ,1 , J.D. Foden a , M.J. van Bergen b , I. Zulkarnain c a Department of Geology and Geophysics, University of Adelaide, Adelaide, SA 5005, Australia b Department of Earth Sciences, Utrecht University, the Netherlands c RDCG-LIPI, Bandung, Indonesia Received 14 October 2003; received in revised form 26 January 2004; accepted 15 July 2004 Abstract The islands of Alor, Lirang, Wetar and Romang are located in the extinct section of the Sunda–Banda arc, where the collision with the Australian continent has brought subduction to a halt. Intrusive and extrusive igneous samples show a wide range of Sr, Nd and Pb isotopic characteristics. Samples from the northeast coast of Alor extend the trend of increasing 206 Pb/ 204 Pb ratios along the arc in an easterly direction, with values as high as 19.6. Samples from Alor’s south coast, Lirang, Wetar and Romang have appreciably lower 206 Pb/ 204 Pb ratios (V19.1), and 143 Nd/ 144 Nd ratios down to 0.5119. The Pb isotope data are interpreted as reflecting mixing between two internally variable end members within the subducting Australian continent, either the upper and lower crust, or two upper crustal end members of different ages. These melts may come up virtually unmodified, giving rise to the felsic, low 143 Nd/ 144 Nd samples, or may interact with the mantle, of which the partial melts and the fractionation products thereof give rise to basalts to rhyodacites with more intermediate Nd isotopic characteristics. Mixing modelling of the latter samples’ isotopic ratios constrains the amount of crustal material that has been added to the mantle wedge to reach up to 9%. The isotopic and trace element heterogeneity in the samples studied is likely to reflect inhomogeneity of the crustal sources contributing to magmatism. D 2004 Elsevier B.V. All rights reserved. Keywords: Sunda–Banda arc; subduction; arc–continent collision; slab break-off; Pb; Sr; Nd isotopes 1. Introduction The eastern part of the Indonesian Sunda–Banda arc is the world’s prime example of an active arc– continent collision zone, and provides us with a unique natural laboratory to study the effects of such a collision on the geochemistry of erupted magmas. Documenting the geochemistry of magmas generated 0377-0273/$ - see front matter D 2004 Elsevier B.V. All rights reserved. doi:10.1016/j.jvolgeores.2004.07.014 * Corresponding author. Department of Isotope Geochemistry, Free University, De Boelelaan 1085, Amsterdam 1081 HV, The Netherlands. Tel.: +31 20 4447397; fax: +31 20 4449942. E-mail address: [email protected] (M.A. Elburg). 1 Now at: Max Planck Institute for Chemistry, P.O. Box 3060, 55020 Mainz, Germany. Journal of Volcanology and Geothermal Research 140 (2005) 25– 47 www.elsevier.com/locate/jvolgeores
-
Upload
independent -
Category
Documents
-
view
1 -
download
0
Transcript of Australia and Indonesia in collision: geochemical sources of magmatism
www.elsevier.com/locate/jvolgeores
Journal of Volcanology and Geotherm
Australia and Indonesia in collision:
geochemical sources of magmatism
M.A. Elburga,*,1, J.D. Fodena, M.J. van Bergenb, I. Zulkarnainc
aDepartment of Geology and Geophysics, University of Adelaide, Adelaide, SA 5005, AustraliabDepartment of Earth Sciences, Utrecht University, the Netherlands
cRDCG-LIPI, Bandung, Indonesia
Received 14 October 2003; received in revised form 26 January 2004; accepted 15 July 2004
Abstract
The islands of Alor, Lirang, Wetar and Romang are located in the extinct section of the Sunda–Banda arc, where the
collision with the Australian continent has brought subduction to a halt. Intrusive and extrusive igneous samples show a wide
range of Sr, Nd and Pb isotopic characteristics. Samples from the northeast coast of Alor extend the trend of increasing206Pb/204Pb ratios along the arc in an easterly direction, with values as high as 19.6. Samples from Alor’s south coast, Lirang,
Wetar and Romang have appreciably lower 206Pb/204Pb ratios (V19.1), and 143Nd/144Nd ratios down to 0.5119. The Pb isotope
data are interpreted as reflecting mixing between two internally variable end members within the subducting Australian
continent, either the upper and lower crust, or two upper crustal end members of different ages. These melts may come up
virtually unmodified, giving rise to the felsic, low 143Nd/144Nd samples, or may interact with the mantle, of which the partial
melts and the fractionation products thereof give rise to basalts to rhyodacites with more intermediate Nd isotopic
characteristics. Mixing modelling of the latter samples’ isotopic ratios constrains the amount of crustal material that has been
added to the mantle wedge to reach up to 9%. The isotopic and trace element heterogeneity in the samples studied is likely to
reflect inhomogeneity of the crustal sources contributing to magmatism.
D 2004 Elsevier B.V. All rights reserved.
Keywords: Sunda–Banda arc; subduction; arc–continent collision; slab break-off; Pb; Sr; Nd isotopes
0377-0273/$ - see front matter D 2004 Elsevier B.V. All rights reserved.
doi:10.1016/j.jvolgeores.2004.07.014
* Corresponding author. Department of Isotope Geochemistry,
Free University, De Boelelaan 1085, Amsterdam 1081 HV, The
Netherlands. Tel.: +31 20 4447397; fax: +31 20 4449942.
E-mail address: [email protected] (M.A. Elburg).1 Now at: Max Planck Institute for Chemistry, P.O. Box 3060,
55020 Mainz, Germany.
1. Introduction
The eastern part of the Indonesian Sunda–Banda
arc is the world’s prime example of an active arc–
continent collision zone, and provides us with a
unique natural laboratory to study the effects of such a
collision on the geochemistry of erupted magmas.
Documenting the geochemistry of magmas generated
al Research 140 (2005) 25–47
M.A. Elburg et al. / Journal of Volcanology and Geothermal Research 140 (2005) 25–4726
in a present-day arc–continent collision zone is not
only a prerequisite for recognising such deposits in the
geological record, but also places constraints on the
physical parameters describing the collision and
refines our knowledge of processes involved in arc
magma genesis.
Most studies of subduction-related volcanism are
concerned with steady state subduction of oceanic
lithosphere underneath oceanic or continental crust.
Within this context there are many studies of geo-
chemical changes in space, such as along (Hawkes-
worth and Ellam, 1989; Hilton and Craig, 1989;
Kersting et al., 1996; Turner et al., 1997) or across
arcs (Whitford and Nicholls, 1976; Woodhead and
Johnson, 1993; Hochstaedter et al., 2000; Churikova
et al., 2001), and their implications for geochemical
sources and physical slab–wedge transfer processes.
However, relatively little is known about magmatism
associated with the final stages of the subduction
process during arc–continent or continent–continent
collision, when the entrance of a buoyant piece of
crust brings subduction to a halt.
The northward movement of the Australian plate
beneath the Indonesian Sunda–Banda arc has led to
collision between the eastern portion of the arc and the
Australian continent. This has caused cessation of
magmatism, which first affected the islands of Wetar,
Lirang and Atauro (of which the youngest deposits are
3 Ma; Abbott and Chamalaun, 1981) and has since
spread to Romang, Alor and the Pantar Strait islands
(Fig. 1A). The volcanic deposits directly to the east
and west of the inactive segment have been the
subject of previous geochemical studies (Vroon et al.,
1993, 2001; Hoogewerff et al., 1997). However, the
inactive area itself has received comparatively little
attention. Early work includes the theses by De Jong
(1941) and Heering (1941), which focused on field
and petrological descriptions of the igneous rocks
from Alor, Wetar and Lirang. More recent studies on
the inactive segment have dealt with its geochronol-
ogy (Abbott and Chamalaun, 1981), or presented
limited geochemical data for some of the islands
(Whitford et al., 1977; McCulloch et al., 1983; Vroon
et al., 1993, 2001; Elburg et al., 2002).
In this contribution we report new major and trace
element and Sr, Nd and Pb isotopic data for samples
from the inactive islands of Alor, Lirang, Wetar and
Romang (Fig. 1). Rb–Sr dating was undertaken on
selected samples to constrain the temporal develop-
ment of the geochemical signature. The isotopic data
show a pronounced regionality, with striking north-to-
south Pb isotopic trends on the island of Alor. These
are interpreted as reflecting mixing between different
subducted crustal components and the sub-arc mantle,
whose Sr, Pb and Nd budget is swamped by the
crustal contributions.
2. Tectonic situation
An excellent review of the tectonic development of
the southeast Asian region during the past 50 Ma has
been given by Hall (2002), and the following
summary is largely based on this work.
The Indonesian subduction system has a long
history, with the Eocene–Oligocene arc being located
along the edge of Sundaland, from Sumatra through
Java, Sumba and western Sulawesi. Collision between
western Sulawesi and several continental slivers of
Australian origin caused a jump in the subduction
system to a more southerly position during the middle
Miocene, with volcanic activity commencing on the
oceanic plate to the east, giving rise to the islands of
Bali, Lombok and Sumbawa. Extension in the Flores
Sea started round 10 Ma as a result of southward
movement of the subduction hinge. This caused
movement of the island of Sumba to a fore-arc
position, and development of the south Banda Sea
(Honthaas et al., 1998). Progressive eastward develop-
ment of the subduction system gave rise to the eastern
Sunda and Banda arc. The South Banda Basin was
long thought to be a trapped piece of Mesozoic
oceanic crust (Bowin et al., 1980), but recent work has
shown that it formed by back-arc extension during
Late Miocene–Early Pliocene time (Hinschberger et
al., 2001; Honthaas et al., 1998). The age of the
subducting lithosphere along the arc increases from
50–90 Ma along Sumatra to 140–160 Ma near Flores
(Widiyantoro and van der Hilst, 1996). This age
variation has resulted in a distinct steepening of the
subducted slab towards the east (Widiyantoro and van
der Hilst, 1996; Schoffel and Das, 1999) and the onset
of tearing in the oldest part (Spence, 1986). The
boundary between the oceanic and continental part of
the downgoing plate is thought to lie in the vicinity of
Sumba (Lynnes and Lay, 1988). Seismic data suggest
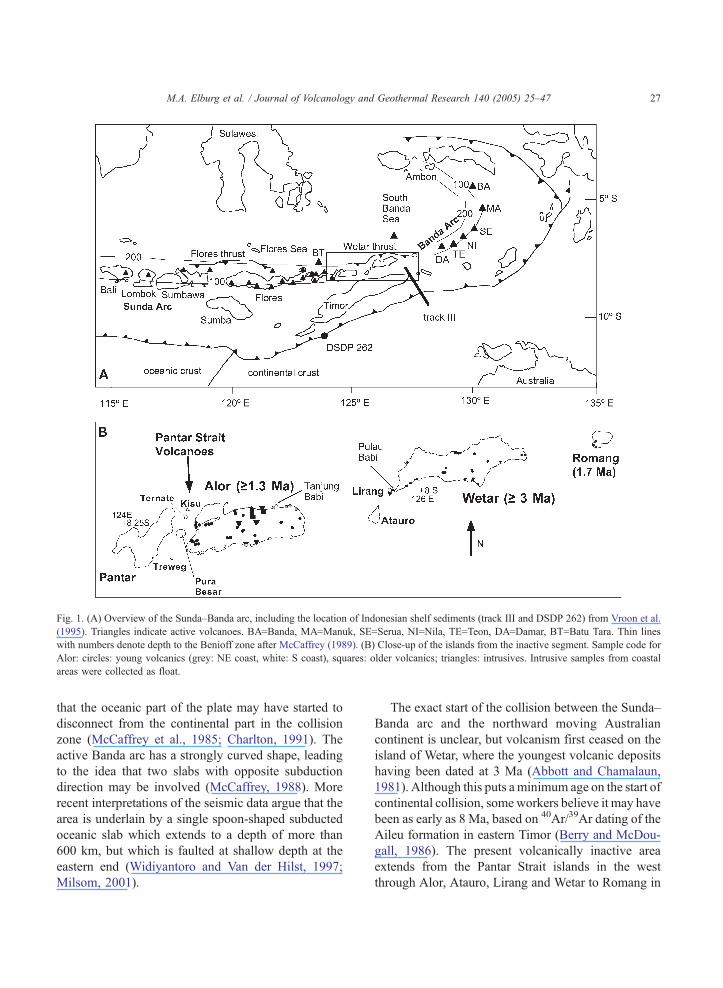
Fig. 1. (A) Overview of the Sunda–Banda arc, including the location of Indonesian shelf sediments (track III and DSDP 262) from Vroon et al.
(1995). Triangles indicate active volcanoes. BA=Banda, MA=Manuk, SE=Serua, NI=Nila, TE=Teon, DA=Damar, BT=Batu Tara. Thin lines
with numbers denote depth to the Benioff zone after McCaffrey (1989). (B) Close-up of the islands from the inactive segment. Sample code for
Alor: circles: young volcanics (grey: NE coast, white: S coast), squares: older volcanics; triangles: intrusives. Intrusive samples from coastal
areas were collected as float.
M.A. Elburg et al. / Journal of Volcanology and Geothermal Research 140 (2005) 25–47 27
that the oceanic part of the plate may have started to
disconnect from the continental part in the collision
zone (McCaffrey et al., 1985; Charlton, 1991). The
active Banda arc has a strongly curved shape, leading
to the idea that two slabs with opposite subduction
direction may be involved (McCaffrey, 1988). More
recent interpretations of the seismic data argue that the
area is underlain by a single spoon-shaped subducted
oceanic slab which extends to a depth of more than
600 km, but which is faulted at shallow depth at the
eastern end (Widiyantoro and Van der Hilst, 1997;
Milsom, 2001).
The exact start of the collision between the Sunda–
Banda arc and the northward moving Australian
continent is unclear, but volcanism first ceased on the
island of Wetar, where the youngest volcanic deposits
having been dated at 3 Ma (Abbott and Chamalaun,
1981). Although this puts a minimum age on the start of
continental collision, someworkers believe it may have
been as early as 8 Ma, based on 40Ar/39Ar dating of the
Aileu formation in eastern Timor (Berry and McDou-
gall, 1986). The present volcanically inactive area
extends from the Pantar Strait islands in the west
through Alor, Atauro, Lirang and Wetar to Romang in
M.A. Elburg et al. / Journal of Volcanology and Geothermal Research 140 (2005) 25–4728
the east. Continuing deformation in the area is taken up
by the Wetar thrust to the north of the volcanically
extinct islands (Kreemer et al., 2000). There is no
seismicity between 50 and 380 km beneath Timor and
the volcanically inactive islands to its north (McCaf-
frey, 1989; Milsom, 2001).
It is generally thought that the eastern Sunda and
Banda arcs have been built on oceanic crust (Bowin et
al., 1980), but some workers have proposed the
presence of a piece of continental material in the
Wetar area on the basis of slightly elevated crustal
thicknesses (Richardson and Blundell, 1996) and the
limited Sr and Nd isotopic data available for the area
(Honthaas et al., 1998).
3. Sample description
Samples from Wetar and Lirang were derived from
pre-existing collections (De Jong, 1941; Heering,
1941) and some south coast samples (sample numbers
prefixed WE) came from the Snellius II expedition
(SOZ-LIPI, 1984–1985). The only age constraints that
exist are given by the K–Ar work of Abbott and
Chamalaun (1981). Extrusives from Wetar were dated
between 3 and 8 Ma on whole rocks, and hornblende
separates from intrusives on the south coast yielded
ages of 6 to 13 Ma. Although Abbott and Chamalaun
(1981) assume that the approximately 12 Ma age for
the intrusives is correct, and that the younger ages
reflect argon loss, it is equally well possible that
excess argon has influenced their results, since K
contents of the separates were low (0.16–0.2%). No
other igneous samples with ages of more than 8 Ma
have been reported from the area (Honthaas et al.,
1998). The younger end of the age range of the
extrusives is confirmed by our Rb–Sr isochron (Table
1) of biotite, apatite and whole rock on a completely
fresh rhyolite (H260) from the east of the island
(3.48F0.45 Ma; MSWD=0.16). We analysed four
coarse-grained intrusives (WE1E2, WE1K2, H110x,
H138x) and a dolerite (H135) from near the area
where Abbott and Chamalaun (1981) found their 6–13
Ma intrusives. Apart from a dolerite from a more
northerly area (H19x) all other Wetar samples
analysed were extrusives, among which were two
samples of cordierite-pseudomorph bearing rhyolites
(WE1A1 and WE1A2) that overlie the intrusives.
The samples from Lirang and the small island of
Pulau Babi to the east consist of quartz–feldspar
rhyolites, a granodiorite and a holocrystalline sample
of intermediate-fine grained plagioclase and horn-
blende, which is found as a dyke crosscutting the
granodiorite. This is described as a hornblende-
spessartite by De Jong (1941). Both the granodiorite
and the hornblende-spessartite are altered. Whole-
rock K–Ar dating of Lirang samples has been
performed by Honthaas et al. (1998) who obtained
an age of 4.1F0.2 Ma for a rhyolite and 6.7F0.4 Ma
for a granodiorite.
The interior of the island of Alor has reasonably
strong topographic relief with the highest peak
reaching 1700 m. No volcanic landforms can be
distinguished, and most relief is likely to be a
reflection of erosion and post-depositional uplift that
has been shown to be in the order of 1 mm/year
(Hantoro et al., 1994). Most exposed rock types are
igneous, but minor amounts of limestone, in the form
of uplifted coral reefs, outcrop on the northwest
peninsula. During our fieldwork, three major types of
igneous deposits have been sampled. The island is
blanketed by a cover of relatively fresh pyroclastics
and subordinate lava flows, which we will refer to as
the byounger volcanicsQ. Underneath these fresh
deposits is a layer of strongly altered volcanics, which
we have called the bolder volcanicsQ. The older
volcanics have been intruded and altered by dioritic
to granodioritic intrusives, and seem to be the oldest
exposed deposits on the island. The intrusives are only
exposed in deeply incised valleys in the interior of the
island.
The older volcanics include ignimbrites and
mingled mafic–felsic lavas. Plagioclase has been
extensively altered to sericite and pseudomorphs of
pyroxene consist of chlorite and fibrous amphibole.
Relatively large crystals of Fe–Ti-oxide may be
phenocrystic. Calcite and quartz occur as alteration
minerals.
The intrusives range from diorite to granodiorite,
with mafic enclaves being relatively common in the
granodioritic bodies. The distribution of the different
intrusive rock types cannot be deduced from the
limited outcrop that could be investigated. Their
mineralogy changes from clinopyroxene, plagioclase
and Fe–Ti-oxide in the more mafic samples to
hornblende, biotite, plagioclase, Fe–Ti-oxide with
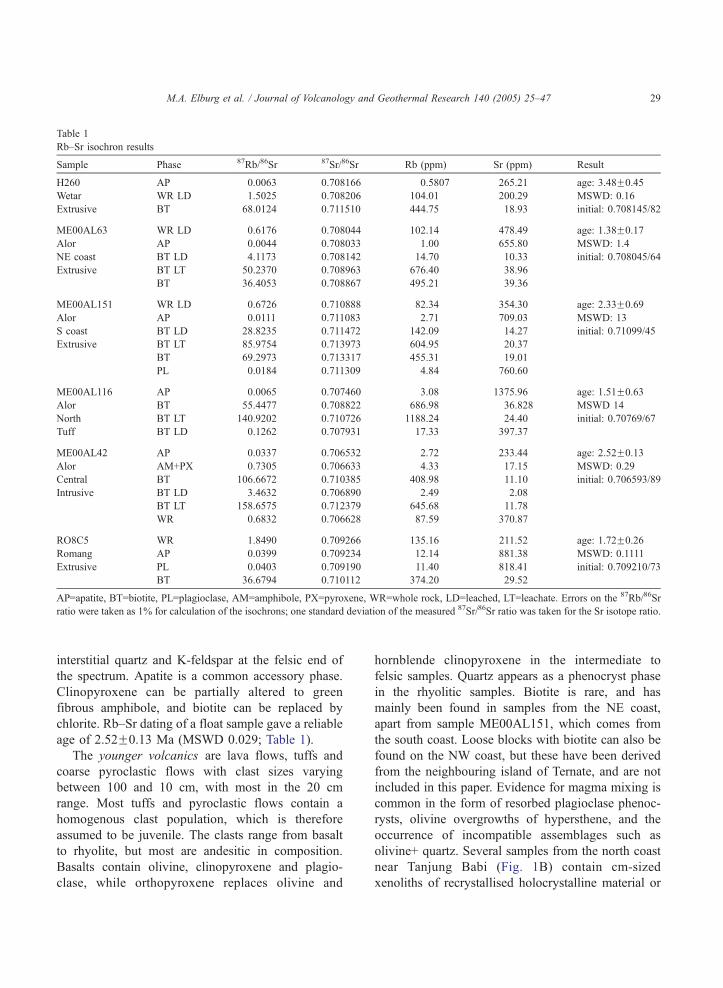
Table 1
Rb–Sr isochron results
Sample Phase 87Rb/86Sr 87Sr/86Sr Rb (ppm) Sr (ppm) Result
H260 AP 0.0063 0.708166 0.5807 265.21 age: 3.48F0.45
Wetar WR LD 1.5025 0.708206 104.01 200.29 MSWD: 0.16
Extrusive BT 68.0124 0.711510 444.75 18.93 initial: 0.708145/82
ME00AL63 WR LD 0.6176 0.708044 102.14 478.49 age: 1.38F0.17
Alor AP 0.0044 0.708033 1.00 655.80 MSWD: 1.4
NE coast BT LD 4.1173 0.708142 14.70 10.33 initial: 0.708045/64
Extrusive BT LT 50.2370 0.708963 676.40 38.96
BT 36.4053 0.708867 495.21 39.36
ME00AL151 WR LD 0.6726 0.710888 82.34 354.30 age: 2.33F0.69
Alor AP 0.0111 0.711083 2.71 709.03 MSWD: 13
S coast BT LD 28.8235 0.711472 142.09 14.27 initial: 0.71099/45
Extrusive BT LT 85.9754 0.713973 604.95 20.37
BT 69.2973 0.713317 455.31 19.01
PL 0.0184 0.711309 4.84 760.60
ME00AL116 AP 0.0065 0.707460 3.08 1375.96 age: 1.51F0.63
Alor BT 55.4477 0.708822 686.98 36.828 MSWD 14
North BT LT 140.9202 0.710726 1188.24 24.40 initial: 0.70769/67
Tuff BT LD 0.1262 0.707931 17.33 397.37
ME00AL42 AP 0.0337 0.706532 2.72 233.44 age: 2.52F0.13
Alor AM+PX 0.7305 0.706633 4.33 17.15 MSWD: 0.29
Central BT 106.6672 0.710385 408.98 11.10 initial: 0.706593/89
Intrusive BT LD 3.4632 0.706890 2.49 2.08
BT LT 158.6575 0.712379 645.68 11.78
WR 0.6832 0.706628 87.59 370.87
RO8C5 WR 1.8490 0.709266 135.16 211.52 age: 1.72F0.26
Romang AP 0.0399 0.709234 12.14 881.38 MSWD: 0.1111
Extrusive PL 0.0403 0.709190 11.40 818.41 initial: 0.709210/73
BT 36.6794 0.710112 374.20 29.52
AP=apatite, BT=biotite, PL=plagioclase, AM=amphibole, PX=pyroxene, WR=whole rock, LD=leached, LT=leachate. Errors on the 87Rb/86Sr
ratio were taken as 1% for calculation of the isochrons; one standard deviation of the measured 87Sr/86Sr ratio was taken for the Sr isotope ratio.
M.A. Elburg et al. / Journal of Volcanology and Geothermal Research 140 (2005) 25–47 29
interstitial quartz and K-feldspar at the felsic end of
the spectrum. Apatite is a common accessory phase.
Clinopyroxene can be partially altered to green
fibrous amphibole, and biotite can be replaced by
chlorite. Rb–Sr dating of a float sample gave a reliable
age of 2.52F0.13 Ma (MSWD 0.029; Table 1).
The younger volcanics are lava flows, tuffs and
coarse pyroclastic flows with clast sizes varying
between 100 and 10 cm, with most in the 20 cm
range. Most tuffs and pyroclastic flows contain a
homogenous clast population, which is therefore
assumed to be juvenile. The clasts range from basalt
to rhyolite, but most are andesitic in composition.
Basalts contain olivine, clinopyroxene and plagio-
clase, while orthopyroxene replaces olivine and
hornblende clinopyroxene in the intermediate to
felsic samples. Quartz appears as a phenocryst phase
in the rhyolitic samples. Biotite is rare, and has
mainly been found in samples from the NE coast,
apart from sample ME00AL151, which comes from
the south coast. Loose blocks with biotite can also be
found on the NW coast, but these have been derived
from the neighbouring island of Ternate, and are not
included in this paper. Evidence for magma mixing is
common in the form of resorbed plagioclase phenoc-
rysts, olivine overgrowths of hypersthene, and the
occurrence of incompatible assemblages such as
olivine+ quartz. Several samples from the north coast
near Tanjung Babi (Fig. 1B) contain cm-sized
xenoliths of recrystallised holocrystalline material or
M.A. Elburg et al. / Journal of Volcanology and Geothermal Research 140 (2005) 25–4730
large, rounded plagioclase xenocrysts, which are
most likely derived from the underlying intrusives.
The younger volcanics have been divided into three
groups according to their geographical location
(south coast, northeast coast, central Alor) to facili-
tate discussion of their isotopic signature (see below).
Three samples were dated by Rb–Sr, with the most
reliable analysis (MSWD 1.4) providing an age of
1.38F0.17 Ma. The two other samples gave error-
chrons with an MSWD around 14 and ages of 1.5
and 2.3 Ma. The high MSWD indicates that there
was no isotopic equilibrium between the mineral
phases, and that these ages can be taken as being
approximate at best.
Samples from Romang have been analysed and
described by Vroon et al. (2001, 1993) and these
analyses have been incorporated into the database
used for this study. Three additional samples from the
same sample collection were analysed during the
present study. One sample was dated and gave an age
of 1.72F0.26 Ma (MSWD 0.111).
4. Analytical techniques
Samples were crushed in a stainless steel jaw
crusher after removal of weathered rims. A split was
ground to b2 Am grainsize in a tungsten carbide ring
mill, and this material was used for XRF, ICP-MS and
Sr, Nd and Pb isotopic analyses.
XRF analyses were performed at the Department of
Geology and Geophysics, Adelaide University, fol-
lowing procedures described by Elburg et al. (2002).
Most Sr, Nd and Pb isotopic compositions were
measured on a Finnigan MAT 262 Thermal Ionisation
Mass Spectrometer in static mode at Adelaide Uni-
versity. The average 87Sr/86Sr ratio for SRM987
during the time when the samples were run was
0.710278F26 (2r, n=45). Whole procedure blanks
for Sr are better than 1 ng. Rb and Sr concentrations
were measured for mineral separates and whole rocks
used for geochronology by splitting the dissolved
sample and spiking with 84Sr and 85Rb spike.
Reproducibility was monitored by analysis of the in-
house standard TasBas and is better than 1% for the
Rb/Sr ratio. Typical Rb blanks were less than 100 pg.
Leaching of biotite for the Rb–Sr isochrons was
performed in capped beakers with 6 N HCl for 24 h
on a hotplate at 150 8C. The supernatant was pipettedoff and the sample was washed twice with distilled
water, which was added to the leachate. Leaching of
whole-rock powders was done with hot 3N HCl for 30
min, with the rest of the procedure the same as for the
biotite. Leachates and residues were analysed for
isotopic composition only.
Nd isotopic ratios were monitored by measuring
J&M specpure Nd2O3, and this yielded a 143Nd/144Nd
ratio of 0.511569F22 (2r, n=25). The value for BCR-1 at the time was 0.512590F28, and LaJolla gave
0.511800F22. Nd blanks are better than 500 pg.
All Pb isotopic analyses were performed at
approximately the same temperature of 1150 8C, anda mass fractionation factor of 0.10% per amu was
used, based on replicate analyses of the NBS981 Pb
standard. Two sigma errors are 0.008 for 206Pb/204Pb,
0.0012 for 207Pb/204Pb and 0.030 for 208Pb/204Pb
based on repeated measurements of the NBS981
standard. This mainly reflects variation in the fractio-
nation factor.
One sample from Wetar (WE1A1) was analysed
at the Free University of Amsterdam for its major
and trace element and isotopic composition, follow-
ing the procedures described by Vroon et al.
(1993).
Rare Earth Elements (REE) and some other low
abundance elements were analysed by ICP-MS at the
Department of Earth Sciences, Monash University,
and the University of Queensland, using calibration
curves based on rock standard BHVO-1 following
Eggins et al. (1997) for trace element content. Drift
corrections were applied by the repeated analysis of
dummy standards and the use of an internal In
standard. Washing between samples was done with a
dilute HF solution, to minimise the memory effect for
elements like Hf. Reproducibility is better than 2% for
all elements, except for Cs and Hf, for which it is
better than 4%. Accuracy is in the order of 5% for all
elements.
5. Data presentation
5.1. Major and trace element geochemistry
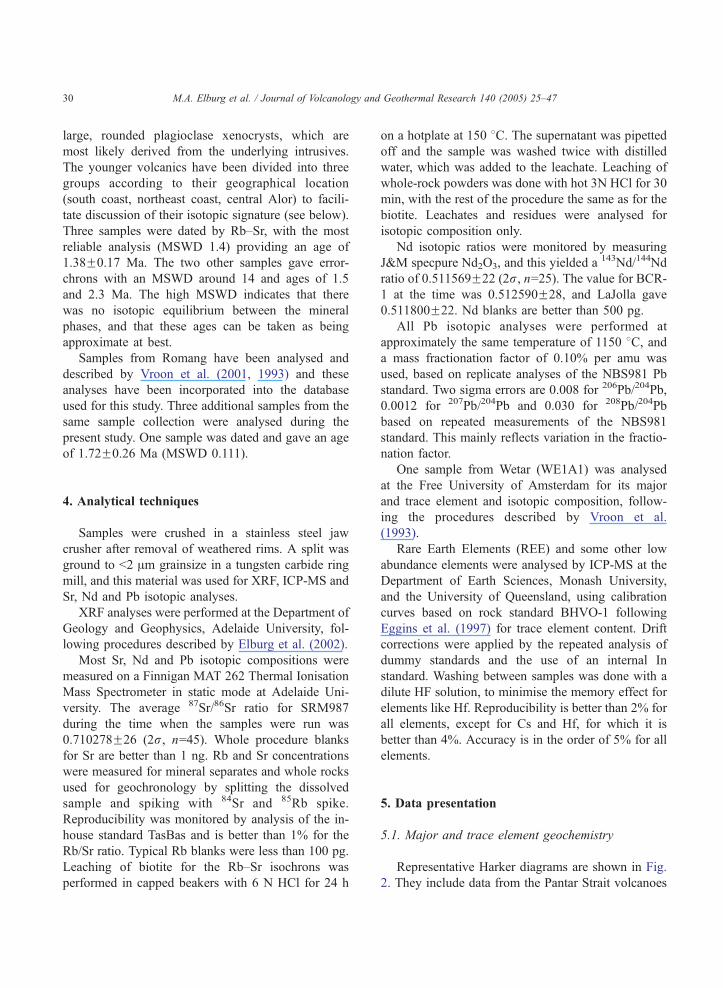
Representative Harker diagrams are shown in Fig.
2. They include data from the Pantar Strait volcanoes
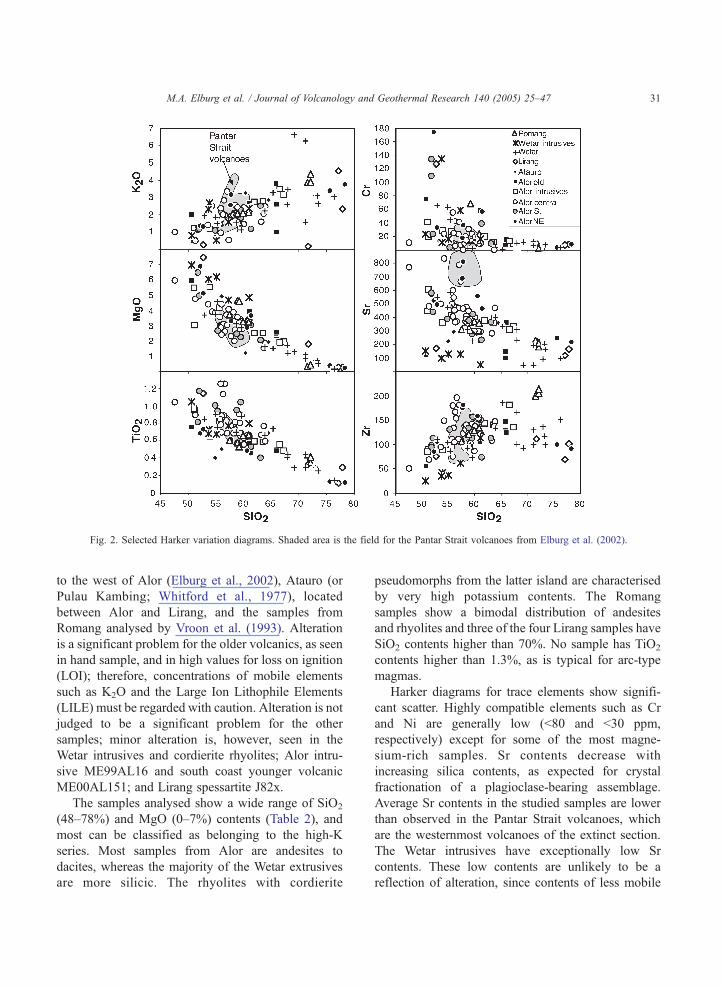
Fig. 2. Selected Harker variation diagrams. Shaded area is the field for the Pantar Strait volcanoes from Elburg et al. (2002).
M.A. Elburg et al. / Journal of Volcanology and Geothermal Research 140 (2005) 25–47 31
to the west of Alor (Elburg et al., 2002), Atauro (or
Pulau Kambing; Whitford et al., 1977), located
between Alor and Lirang, and the samples from
Romang analysed by Vroon et al. (1993). Alteration
is a significant problem for the older volcanics, as seen
in hand sample, and in high values for loss on ignition
(LOI); therefore, concentrations of mobile elements
such as K2O and the Large Ion Lithophile Elements
(LILE) must be regarded with caution. Alteration is not
judged to be a significant problem for the other
samples; minor alteration is, however, seen in the
Wetar intrusives and cordierite rhyolites; Alor intru-
sive ME99AL16 and south coast younger volcanic
ME00AL151; and Lirang spessartite J82x.
The samples analysed show a wide range of SiO2
(48–78%) and MgO (0–7%) contents (Table 2), and
most can be classified as belonging to the high-K
series. Most samples from Alor are andesites to
dacites, whereas the majority of the Wetar extrusives
are more silicic. The rhyolites with cordierite
pseudomorphs from the latter island are characterised
by very high potassium contents. The Romang
samples show a bimodal distribution of andesites
and rhyolites and three of the four Lirang samples have
SiO2 contents higher than 70%. No sample has TiO2
contents higher than 1.3%, as is typical for arc-type
magmas.
Harker diagrams for trace elements show signifi-
cant scatter. Highly compatible elements such as Cr
and Ni are generally low (b80 and b30 ppm,
respectively) except for some of the most magne-
sium-rich samples. Sr contents decrease with
increasing silica contents, as expected for crystal
fractionation of a plagioclase-bearing assemblage.
Average Sr contents in the studied samples are lower
than observed in the Pantar Strait volcanoes, which
are the westernmost volcanoes of the extinct section.
The Wetar intrusives have exceptionally low Sr
contents. These low contents are unlikely to be a
reflection of alteration, since contents of less mobile

Table 2
Whole-rock data for selected samples
Group
sample
Alor
old volc.
ME99AL25
Alor
old volc.
ME00AL88
Alor
intrusives
ME99AL16
Alor
intrusives
ME00AL42
Alor
intrusives
ME00AL94
Alor
young volc.
ME99AL13
Alor
young volc.
ME99AL29
Alor
young volc.
ME99AL35
Alor
young volc.
ME99AL40
Alor
young S.
ME00AL127
Alor
young S.
ME00AL147
SiO2 61.03 65.90 51.17 61.92 67.29 56.49 63.89 47.53 53.63 59.50 61.31
Al2O3 16.75 16.00 20.85 16.77 15.26 18.19 16.60 18.49 18.78 16.47 17.17
Fe2O3 6.17 4.51 8.95 5.71 4.50 8.08 5.64 12.22 8.92 8.68 6.81
MnO 0.15 0.04 0.14 0.08 0.07 0.14 0.07 0.19 0.16 0.14 0.12
MgO 3.92 2.55 3.05 2.50 1.93 3.11 1.84 5.97 4.40 2.26 3.02
CaO 5.24 3.30 10.46 5.48 4.23 7.46 5.10 11.02 8.90 6.55 6.66
Na2O 3.40 4.32 2.95 3.27 2.96 2.62 3.64 2.31 2.96 3.42 3.14
K2O 2.67 0.99 1.25 2.73 3.17 2.82 2.47 1.02 1.40 1.81 1.19
TiO2 0.57 0.48 0.95 0.59 0.49 0.89 0.60 1.04 0.72 1.05 0.53
P2O5 0.12 0.13 0.23 0.14 0.10 0.20 0.15 0.20 0.13 0.12 0.06
LOI 6.31 1.77 2.04 0.81 0.89 0.60 0.65 0.04 0.31 0.70 1.25
Total 99.92 99.64 99.69 99.89 99.37 99.66 99.35 99.96 99.97 100.19 99.71
Sc 19 8.8 21.8 17.7 12.5 23.1 15 27.2 25.5 26.6 21.6
V 148 89 231 128 91 216 127 333 220 245 146
Cr 58 15 19 20 9 8 4 4 13 7 39
Ni 23 6 17 8 4 9 4 12.81 1 6 13
Cu 3 7 74 7 6 66 24 42.697 52 129 22
Zn 70 33 68 29 19 66 47 76.924 76 83 46
Ga 15.8 15.5 20.9 18.2 14.3 20 16.3 16.565 20.5 18.9 18
Rb 76 26 44 90 87 111 75 20 46 66 16
Sr 231 366 609 375 338 478 472 769 498 274 238
Y 19 15 25 29 18 30 21 22 20 28 16
Zr 105 124 90 143 136 154 147 51 96 113 74
Nb 5 8 5.6 9.1 7.3 8.0 6.6 3.0 3.7 4.6 2.7
Cs 2.92 1.95 0.79 4.34 1.25 1.35 2.38 6.47 4.76
Ba 738 414 564 950 1381 793 1180 783 559 417 324
La 27 11 31.5 30.0 40.8 34.0 41.0 34.0 21.5 14.9 7.5
Ce 47 24 61.2 58.3 64.3 62.7 69.4 61.8 40.0 31.2 15.6
Pr 7.2 6.8 6.3 7.2 7.3 7.1 4.8 3.9 1.9
Nd 18 7 27.4 25.4 20.5 27.4 26.0 26.7 17.9 16.0 7.8
Sm 5.6 5.3 3.6 5.6 4.5 5.4 3.6 4.0 2.0
Eu 1.48 1.18 0.87 1.41 1.29 1.51 1.09 1.11 0.64
Gd 4.91 4.94 3.03 5.04 3.74 4.83 3.47 4.37 2.26
Tb 0.73 0.76 0.46 0.80 0.54 0.68 0.52 0.72 0.38
Dy 4.30 4.46 2.77 4.41 2.99 3.85 3.03 4.54 2.44
Ho 0.90 0.97 0.58 0.90 0.61 0.79 0.62 0.99 0.55
Er 2.45 2.81 1.67 2.64 1.82 2.16 1.84 2.88 1.61
Tm 0.37 0.43 0.26 0.39 0.28 0.32 0.27 0.44 0.26
Yb 2.31 2.78 1.74 2.47 1.83 1.99 1.73 2.85 1.71
Lu 0.34 0.42 0.27 0.37 0.29 0.29 0.26 0.43 0.26
Hf 2.57 4.33 3.40 3.91 3.36 1.59 2.94 3.09 1.95
Pb 9 3 5.36 11.04 8.50 21.25 20.05 14.45 16.51 24.03 14.97
Th 11 17 7.34 17.78 13.77 10.27 16.14 12.19 6.97 5.06 2.24
U 2.4 3.1 1.73 4.78 2.71 2.52 3.29 2.04 1.61 2.27 0.91
All oxides and most elements by X-ray fluorescence; Nb, Cs, REE, Hf, Pb, Th and U by ICP-MS for samples with full analyses.
M.A. Elburg et al. / Journal of Volcanology and Geothermal Research 140 (2005) 25–4732
incompatible elements such as Zr and the rare earth
elements (REE) are also very low. The felsic
samples from Romang are characterised by high
contents of Zr and Nb (not shown) compared to
samples of equivalent SiO2 contents from the other
islands. MORB-normalised trace element patterns of
nearly all samples show the characteristics of arc
volcanics with negative Nb and Ti anomalies and
positive K and Pb spikes (Fig. 3). However, the
magnitude of the anomalies varies between samples,
and nearly all show higher normalised Nb contents
than Zr. The relative enrichments of Ba and Rb also
vary in an unsystematic way, as shown by the three
mafic samples from Alor (Fig. 3B). As these
samples are completely fresh, alteration cannot be
responsible for these variations.
Alor
young S.
ME00AL151
Alor
young NE
ME00AL64
Alor
young NE
ME00AL72
Alor
young NE
ME00AL82
Romang
RO8B2
Romang
RO8C5
Wetar
crd-rhy
WE1A2
Wetar
H107
Wetar
intrusive
H110x
Wetar
J15x
Wetar
J27
Wetar
J101
Lirang
intrusive
J82x
63.09 52.17 78.27 52.81 60.86 72.09 69.07 76.21 50.55 65.23 73.36 55.21 52.77
18.08 17.65 12.32 18.37 17.24 14.85 14.98 13.27 17.14 16.11 14.40 18.38 16.93
4.37 7.27 0.67 9.27 5.71 2.23 2.57 1.54 10.68 5.29 2.23 7.81 9.73
0.06 0.12 0.01 0.15 0.10 0.03 0.05 0.02 0.15 0.11 0.05 0.13 0.10
2.02 6.91 0.23 5.11 3.24 0.40 1.31 0.15 7.01 1.51 0.54 4.60 7.47
5.86 9.67 1.47 9.35 7.10 2.10 2.02 2.14 9.28 4.32 3.33 8.93 6.80
3.49 2.88 3.11 2.77 2.80 3.94 2.89 3.41 3.24 3.18 3.13 2.49 4.61
2.54 1.39 3.77 1.31 2.17 3.87 6.61 3.08 0.84 3.29 2.65 1.50 0.25
0.41 0.69 0.12 0.73 0.67 0.41 0.29 0.14 1.05 0.74 0.26 0.76 1.15
0.10 0.13 0.02 0.13 0.10 0.07 0.20 0.02 0.06 0.21 0.05 0.19 0.20
1.00 1.09 0.70 0.34 1.39 0.35 2.71 1.91 1.37 2.18 1.85 1.15 1.91
99.76 100.12 99.57 100.22 99.73 99.39 99.65 99.14 100.12 99.50 99.31 99.90 99.58
10.7 24 1.2 24.7 19.7 8.7 8.8 7.3 42.1 15.3 7.4 26.6 37.2
84 196 9 229 183 22 29 5 434 54 27 255 333
9 174 8 33 24 2 12 3 24 1 8 45 127
6 63 2 20 10 1 7 2 20 1 4 20 54
15 33 6 54 43 6 2 7 5 4 12 29 537
42 45 14 75 60 28 32 34 56 70 28 66 51
18.3 16.4 12 18.1 18.4 18.8 17.1 14.9 17.4 18.2 15.5 17.6 16.2
97 61 185 44 83 141 234 92 25 118 47 44 3
365 526 218 493 362 213 46 97 152 338 168 588 173
11 17 8 20 25 32 15 26 16 33 17 27 23
112 85 92 106 134 215 93 151 27 186 100 86 76
8.2 4.9 7.2 3.6 15.2 20.3 14.2 7.1 1.3 11.0 6.6 4.4 2.3
3.66 4.45 11.83 2.59 4.69 4.62 1.79 11.37 1.10 5.40 2.10 2.71 0.11
464 680 1160 501 610 860 525 465 260 831 440 661 100
20.4 24.8 42.3 21.8 26.7 38.6 19.1 21.5 3.4 41.0 13.0 36.8 8.9
39.1 44.5 59.0 41.9 49.1 75.4 40.6 42.2 8.0 73.9 24.6 59.1 19.5
4.2 5.0 5.0 4.9 5.7 8.4 4.7 4.8 1.2 8.7 2.6 6.9 2.6
14.6 18.3 13.7 18.4 20.8 30.3 17.1 17.4 5.7 32.2 9.3 26.0 11.2
2.7 3.6 1.8 3.8 4.2 6.2 3.9 3.8 1.8 6.3 2.0 4.8 3.0
0.72 1.04 0.38 1.08 0.94 1.13 0.57 0.70 0.66 1.52 0.55 1.31 1.01
2.27 3.29 1.21 3.45 4.11 5.65 3.28 4.10 2.22 5.78 2.13 4.39 3.47
0.34 0.48 0.17 0.52 0.64 0.89 0.50 0.69 0.38 0.88 0.36 0.64 0.59
1.94 2.90 0.97 3.12 3.92 5.17 2.55 4.31 2.48 4.98 2.26 3.62 3.77
0.39 0.60 0.20 0.67 0.84 1.08 0.45 0.91 0.55 1.00 0.50 0.76 0.81
1.06 1.70 0.61 1.89 2.39 2.95 1.14 2.65 1.58 3.00 1.47 2.28 2.30
0.16 0.26 0.10 0.29 0.36 0.44 0.17 0.40 0.24 0.43 0.24 0.33 0.34
1.06 1.64 0.74 1.85 2.34 2.71 1.04 2.63 1.52 2.85 1.58 1.16 2.18
0.16 0.24 0.12 0.28 0.35 0.40 0.15 0.39 0.23 0.43 0.24 0.33 0.32
2.73 2.22 2.47 2.35 3.68 4.03 2.51 4.28 0.87 4.82 2.71 3.51 1.97
28.87 7.78 37.19 15.29 34.25 25.46 4.52 17.92 1.88 24.86 13.10 26.58 3.16
7.88 10.26 27.22 6.61 9.77 14.45 11.18 9.04 0.89 15.92 4.75 10.10 1.71
2.29 2.98 9.21 1.62 2.83 3.64 4.16 2.29 0.25 3.34 1.34 2.14 0.96
M.A. Elburg et al. / Journal of Volcanology and Geothermal Research 140 (2005) 25–47 33
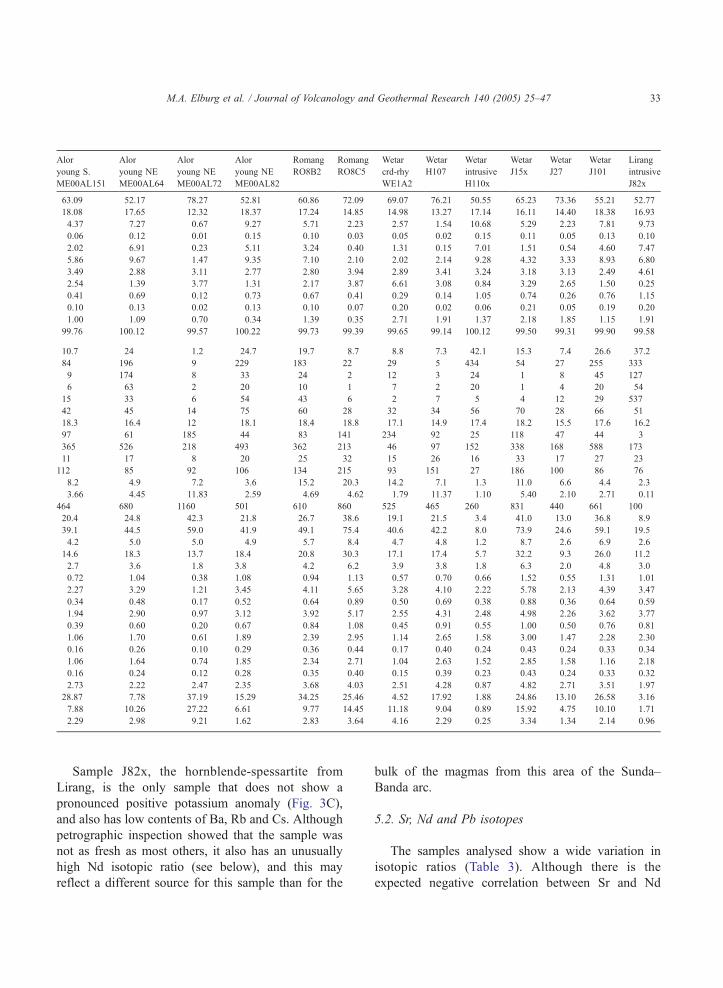
Sample J82x, the hornblende-spessartite from
Lirang, is the only sample that does not show a
pronounced positive potassium anomaly (Fig. 3C),
and also has low contents of Ba, Rb and Cs. Although
petrographic inspection showed that the sample was
not as fresh as most others, it also has an unusually
high Nd isotopic ratio (see below), and this may
reflect a different source for this sample than for the
bulk of the magmas from this area of the Sunda–
Banda arc.
5.2. Sr, Nd and Pb isotopes
The samples analysed show a wide variation in
isotopic ratios (Table 3). Although there is the
expected negative correlation between Sr and Nd

Fig. 3. Normalised trace element diagrams for selected samples. MORB-normalising values from Sun and McDonough (1989). (A) Patterns for
Alor intrusives and older volcanics (ME00AL88). (B) Patterns for the three most mafic samples analysed of the younger volcanics from Alor’s
south coast (ME00AL127), central Alor (ME00AL35) and northeast coast (ME00AL64); shaded area for all younger volcanics from Alor. (C)
Patterns for Wetar cordierite–rhyolite (WE1A2), Wetar intrusive (H110x), Wetar volcanic (J15x), Lirang hornblende spessartite (J82x) and
Romang extrusive (RO8b2).
M.A. Elburg et al. / Journal of Volcanology and Geothermal Research 140 (2005) 25–4734
isotopic ratios when the full data set is considered,143Nd/144Nd ratios vary between 0.51265 and 0.51235
at 87Sr/86Sr ratios around 0.707 (Fig. 4A), and
samples from Alor’s south coast account for nearly
all of this spread. The highest Sr and lowest Nd
isotopic ratios are measured for the cordierite rhyolites
from the south coast of Wetar. Although these samples
are comparatively felsic, there is no clear-cut corre-
lation between an index of fractionation such as SiO2
content and isotopic composition for the data set as a
whole (Fig. 5). The spessartite from Lirang is the
sample with the most mantle-like Sr and Nd isotopic
compositions, although it still plots towards the field
of sediments compared to values for Indian Ocean
mid ocean ridge (I-MORB) or ocean island basalts (I-
OIB). Romang has, compared to the other islands, a
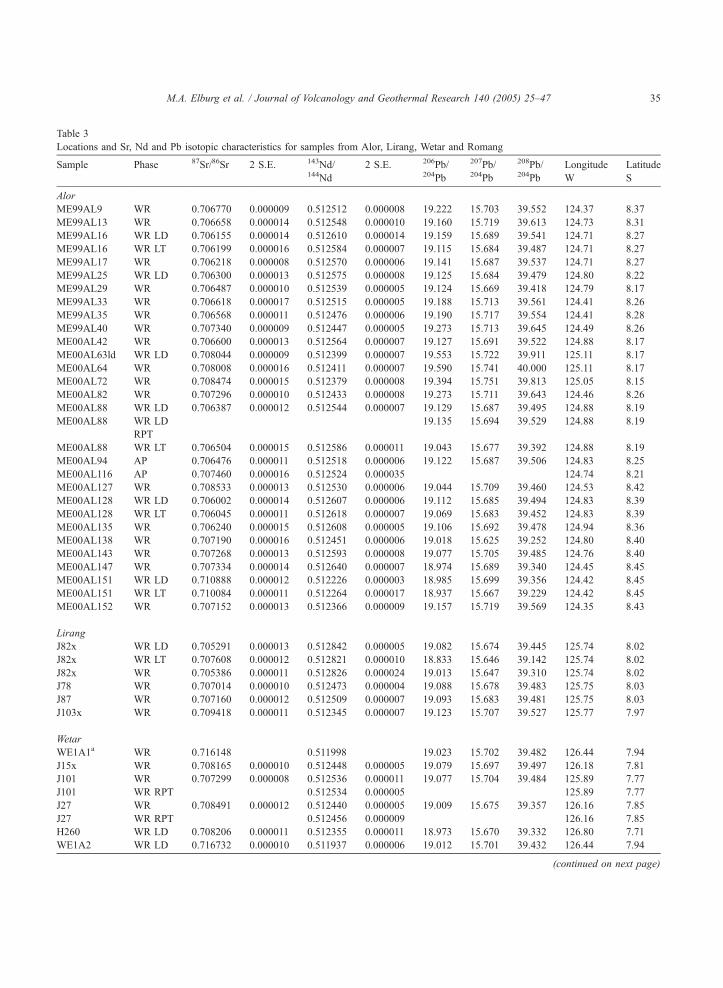
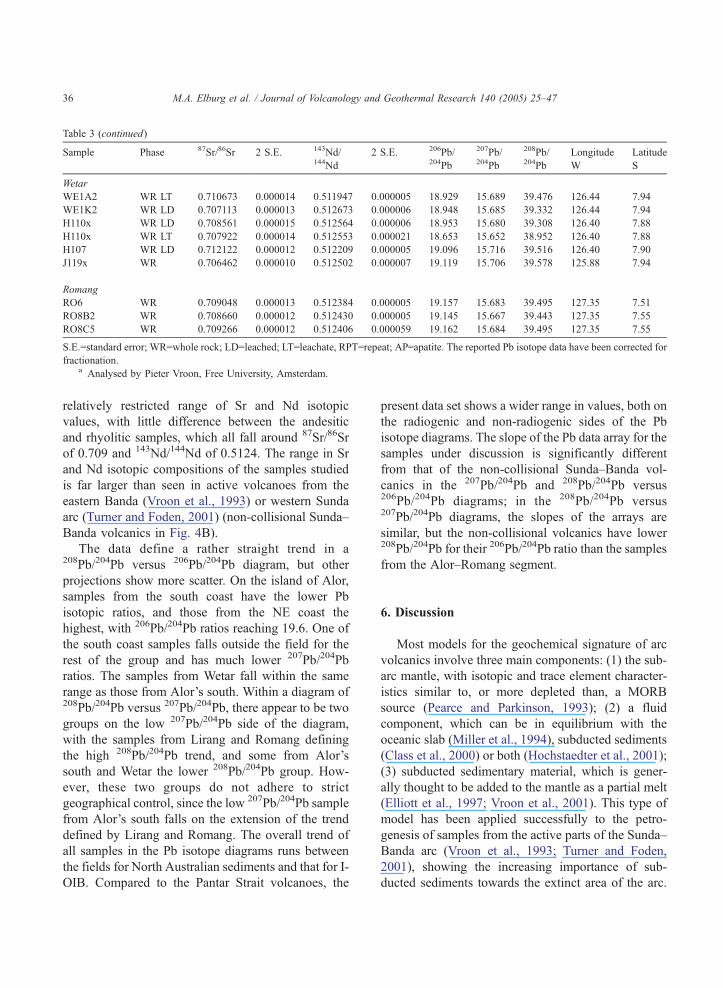
Table 3
Locations and Sr, Nd and Pb isotopic characteristics for samples from Alor, Lirang, Wetar and Romang
Sample Phase 87Sr/86Sr 2 S.E. 143Nd/144Nd
2 S.E. 206Pb/204Pb
207Pb/204Pb
208Pb/204Pb
Longitude
W
Latitude
S
Alor
ME99AL9 WR 0.706770 0.000009 0.512512 0.000008 19.222 15.703 39.552 124.37 8.37
ME99AL13 WR 0.706658 0.000014 0.512548 0.000010 19.160 15.719 39.613 124.73 8.31
ME99AL16 WR LD 0.706155 0.000014 0.512610 0.000014 19.159 15.689 39.541 124.71 8.27
ME99AL16 WR LT 0.706199 0.000016 0.512584 0.000007 19.115 15.684 39.487 124.71 8.27
ME99AL17 WR 0.706218 0.000008 0.512570 0.000006 19.141 15.687 39.537 124.71 8.27
ME99AL25 WR LD 0.706300 0.000013 0.512575 0.000008 19.125 15.684 39.479 124.80 8.22
ME99AL29 WR 0.706487 0.000010 0.512539 0.000005 19.124 15.669 39.418 124.79 8.17
ME99AL33 WR 0.706618 0.000017 0.512515 0.000005 19.188 15.713 39.561 124.41 8.26
ME99AL35 WR 0.706568 0.000011 0.512476 0.000006 19.190 15.717 39.554 124.41 8.28
ME99AL40 WR 0.707340 0.000009 0.512447 0.000005 19.273 15.713 39.645 124.49 8.26
ME00AL42 WR 0.706600 0.000013 0.512564 0.000007 19.127 15.691 39.522 124.88 8.17
ME00AL63ld WR LD 0.708044 0.000009 0.512399 0.000007 19.553 15.722 39.911 125.11 8.17
ME00AL64 WR 0.708008 0.000016 0.512411 0.000007 19.590 15.741 40.000 125.11 8.17
ME00AL72 WR 0.708474 0.000015 0.512379 0.000008 19.394 15.751 39.813 125.05 8.15
ME00AL82 WR 0.707296 0.000010 0.512433 0.000008 19.273 15.711 39.643 124.46 8.26
ME00AL88 WR LD 0.706387 0.000012 0.512544 0.000007 19.129 15.687 39.495 124.88 8.19
ME00AL88 WR LD
RPT
19.135 15.694 39.529 124.88 8.19
ME00AL88 WR LT 0.706504 0.000015 0.512586 0.000011 19.043 15.677 39.392 124.88 8.19
ME00AL94 AP 0.706476 0.000011 0.512518 0.000006 19.122 15.687 39.506 124.83 8.25
ME00AL116 AP 0.707460 0.000016 0.512524 0.000035 124.74 8.21
ME00AL127 WR 0.708533 0.000013 0.512530 0.000006 19.044 15.709 39.460 124.53 8.42
ME00AL128 WR LD 0.706002 0.000014 0.512607 0.000006 19.112 15.685 39.494 124.83 8.39
ME00AL128 WR LT 0.706045 0.000011 0.512618 0.000007 19.069 15.683 39.452 124.83 8.39
ME00AL135 WR 0.706240 0.000015 0.512608 0.000005 19.106 15.692 39.478 124.94 8.36
ME00AL138 WR 0.707190 0.000016 0.512451 0.000006 19.018 15.625 39.252 124.80 8.40
ME00AL143 WR 0.707268 0.000013 0.512593 0.000008 19.077 15.705 39.485 124.76 8.40
ME00AL147 WR 0.707334 0.000014 0.512640 0.000007 18.974 15.689 39.340 124.45 8.45
ME00AL151 WR LD 0.710888 0.000012 0.512226 0.000003 18.985 15.699 39.356 124.42 8.45
ME00AL151 WR LT 0.710084 0.000011 0.512264 0.000017 18.937 15.667 39.229 124.42 8.45
ME00AL152 WR 0.707152 0.000013 0.512366 0.000009 19.157 15.719 39.569 124.35 8.43
Lirang
J82x WR LD 0.705291 0.000013 0.512842 0.000005 19.082 15.674 39.445 125.74 8.02
J82x WR LT 0.707608 0.000012 0.512821 0.000010 18.833 15.646 39.142 125.74 8.02
J82x WR 0.705386 0.000011 0.512826 0.000024 19.013 15.647 39.310 125.74 8.02
J78 WR 0.707014 0.000010 0.512473 0.000004 19.088 15.678 39.483 125.75 8.03
J87 WR 0.707160 0.000012 0.512509 0.000007 19.093 15.683 39.481 125.75 8.03
J103x WR 0.709418 0.000011 0.512345 0.000007 19.123 15.707 39.527 125.77 7.97
Wetar
WE1A1a WR 0.716148 0.511998 19.023 15.702 39.482 126.44 7.94
J15x WR 0.708165 0.000010 0.512448 0.000005 19.079 15.697 39.497 126.18 7.81
J101 WR 0.707299 0.000008 0.512536 0.000011 19.077 15.704 39.484 125.89 7.77
J101 WR RPT 0.512534 0.000005 125.89 7.77
J27 WR 0.708491 0.000012 0.512440 0.000005 19.009 15.675 39.357 126.16 7.85
J27 WR RPT 0.512456 0.000009 126.16 7.85
H260 WR LD 0.708206 0.000011 0.512355 0.000011 18.973 15.670 39.332 126.80 7.71
WE1A2 WR LD 0.716732 0.000010 0.511937 0.000006 19.012 15.701 39.432 126.44 7.94
(continued on next page)
M.A. Elburg et al. / Journal of Volcanology and Geothermal Research 140 (2005) 25–47 35
Sample Phase 87Sr/86Sr 2 S.E. 143Nd/144Nd
2 S.E. 206Pb/204Pb
207Pb/204Pb
208Pb/204Pb
Longitude
W
Latitude
S
Wetar
WE1A2 WR LT 0.710673 0.000014 0.511947 0.000005 18.929 15.689 39.476 126.44 7.94
WE1K2 WR LD 0.707113 0.000013 0.512673 0.000006 18.948 15.685 39.332 126.44 7.94
H110x WR LD 0.708561 0.000015 0.512564 0.000006 18.953 15.680 39.308 126.40 7.88
H110x WR LT 0.707922 0.000014 0.512553 0.000021 18.653 15.652 38.952 126.40 7.88
H107 WR LD 0.712122 0.000012 0.512209 0.000005 19.096 15.716 39.516 126.40 7.90
J119x WR 0.706462 0.000010 0.512502 0.000007 19.119 15.706 39.578 125.88 7.94
Romang
RO6 WR 0.709048 0.000013 0.512384 0.000005 19.157 15.683 39.495 127.35 7.51
RO8B2 WR 0.708660 0.000012 0.512430 0.000005 19.145 15.667 39.443 127.35 7.55
RO8C5 WR 0.709266 0.000012 0.512406 0.000059 19.162 15.684 39.495 127.35 7.55
S.E.=standard error; WR=whole rock; LD=leached; LT=leachate, RPT=repeat; AP=apatite. The reported Pb isotope data have been corrected for
fractionation.a Analysed by Pieter Vroon, Free University, Amsterdam.
Table 3 (continued)
M.A. Elburg et al. / Journal of Volcanology and Geothermal Research 140 (2005) 25–4736
relatively restricted range of Sr and Nd isotopic
values, with little difference between the andesitic
and rhyolitic samples, which all fall around 87Sr/86Sr
of 0.709 and 143Nd/144Nd of 0.5124. The range in Sr
and Nd isotopic compositions of the samples studied
is far larger than seen in active volcanoes from the
eastern Banda (Vroon et al., 1993) or western Sunda
arc (Turner and Foden, 2001) (non-collisional Sunda–
Banda volcanics in Fig. 4B).
The data define a rather straight trend in a208Pb/204Pb versus 206Pb/204Pb diagram, but other
projections show more scatter. On the island of Alor,
samples from the south coast have the lower Pb
isotopic ratios, and those from the NE coast the
highest, with 206Pb/204Pb ratios reaching 19.6. One of
the south coast samples falls outside the field for the
rest of the group and has much lower 207Pb/204Pb
ratios. The samples from Wetar fall within the same
range as those from Alor’s south. Within a diagram of208Pb/204Pb versus 207Pb/204Pb, there appear to be two
groups on the low 207Pb/204Pb side of the diagram,
with the samples from Lirang and Romang defining
the high 208Pb/204Pb trend, and some from Alor’s
south and Wetar the lower 208Pb/204Pb group. How-
ever, these two groups do not adhere to strict
geographical control, since the low 207Pb/204Pb sample
from Alor’s south falls on the extension of the trend
defined by Lirang and Romang. The overall trend of
all samples in the Pb isotope diagrams runs between
the fields for North Australian sediments and that for I-
OIB. Compared to the Pantar Strait volcanoes, the
present data set shows a wider range in values, both on
the radiogenic and non-radiogenic sides of the Pb
isotope diagrams. The slope of the Pb data array for the
samples under discussion is significantly different
from that of the non-collisional Sunda–Banda vol-
canics in the 207Pb/204Pb and 208Pb/204Pb versus206Pb/204Pb diagrams; in the 208Pb/204Pb versus207Pb/204Pb diagrams, the slopes of the arrays are
similar, but the non-collisional volcanics have lower208Pb/204Pb for their 206Pb/204Pb ratio than the samples
from the Alor–Romang segment.
6. Discussion
Most models for the geochemical signature of arc
volcanics involve three main components: (1) the sub-
arc mantle, with isotopic and trace element character-
istics similar to, or more depleted than, a MORB
source (Pearce and Parkinson, 1993); (2) a fluid
component, which can be in equilibrium with the
oceanic slab (Miller et al., 1994), subducted sediments
(Class et al., 2000) or both (Hochstaedter et al., 2001);
(3) subducted sedimentary material, which is gener-
ally thought to be added to the mantle as a partial melt
(Elliott et al., 1997; Vroon et al., 2001). This type of
model has been applied successfully to the petro-
genesis of samples from the active parts of the Sunda–
Banda arc (Vroon et al., 1993; Turner and Foden,
2001), showing the increasing importance of sub-
ducted sediments towards the extinct area of the arc.
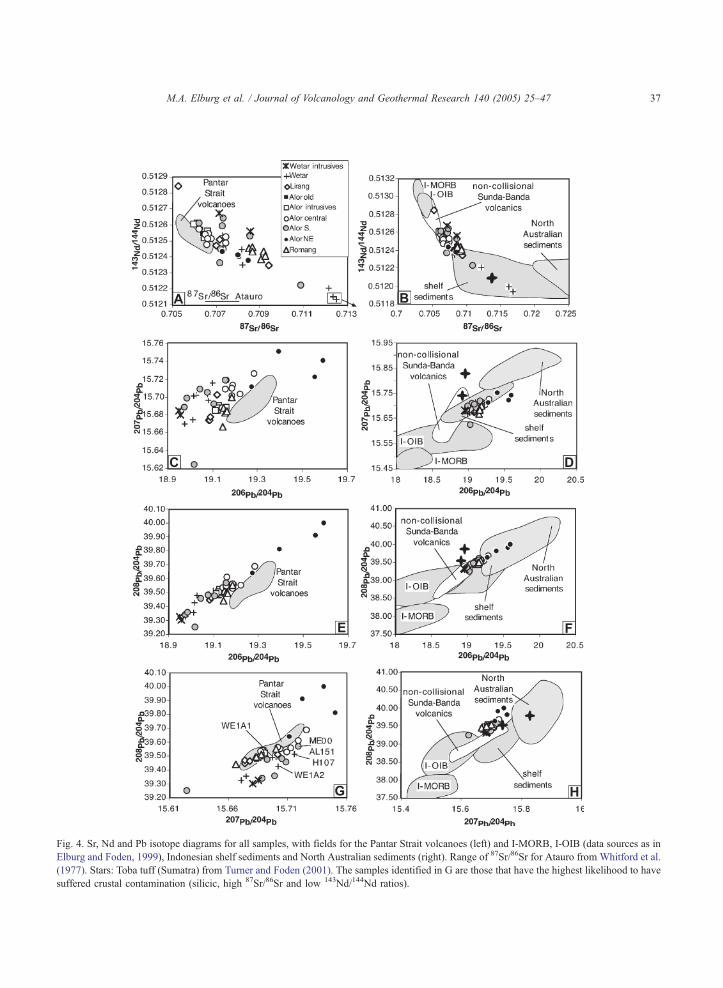
Fig. 4. Sr, Nd and Pb isotope diagrams for all samples, with fields for the Pantar Strait volcanoes (left) and I-MORB, I-OIB (data sources as in
Elburg and Foden, 1999), Indonesian shelf sediments and North Australian sediments (right). Range of 87Sr/86Sr for Atauro from Whitford et al.
(1977). Stars: Toba tuff (Sumatra) from Turner and Foden (2001). The samples identified in G are those that have the highest likelihood to have
suffered crustal contamination (silicic, high 87Sr/86Sr and low 143Nd/144Nd ratios).
M.A. Elburg et al. / Journal of Volcanology and Geothermal Research 140 (2005) 25–47 37
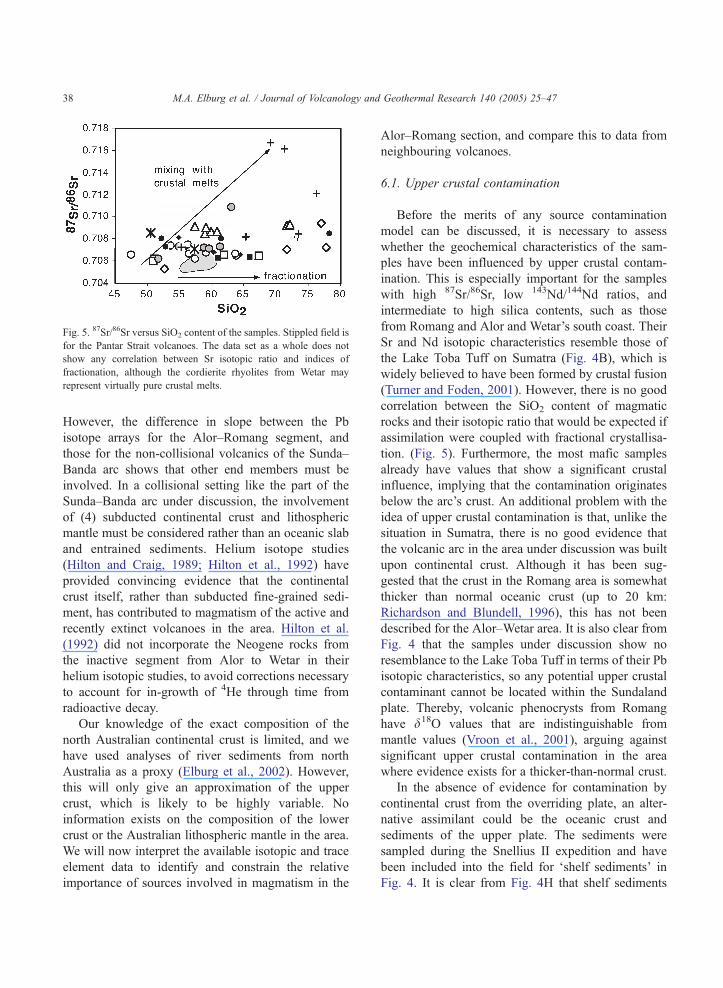
Fig. 5. 87Sr/86Sr versus SiO2 content of the samples. Stippled field is
for the Pantar Strait volcanoes. The data set as a whole does not
show any correlation between Sr isotopic ratio and indices of
fractionation, although the cordierite rhyolites from Wetar may
represent virtually pure crustal melts.
M.A. Elburg et al. / Journal of Volcanology and Geothermal Research 140 (2005) 25–4738
However, the difference in slope between the Pb
isotope arrays for the Alor–Romang segment, and
those for the non-collisional volcanics of the Sunda–
Banda arc shows that other end members must be
involved. In a collisional setting like the part of the
Sunda–Banda arc under discussion, the involvement
of (4) subducted continental crust and lithospheric
mantle must be considered rather than an oceanic slab
and entrained sediments. Helium isotope studies
(Hilton and Craig, 1989; Hilton et al., 1992) have
provided convincing evidence that the continental
crust itself, rather than subducted fine-grained sedi-
ment, has contributed to magmatism of the active and
recently extinct volcanoes in the area. Hilton et al.
(1992) did not incorporate the Neogene rocks from
the inactive segment from Alor to Wetar in their
helium isotopic studies, to avoid corrections necessary
to account for in-growth of 4He through time from
radioactive decay.
Our knowledge of the exact composition of the
north Australian continental crust is limited, and we
have used analyses of river sediments from north
Australia as a proxy (Elburg et al., 2002). However,
this will only give an approximation of the upper
crust, which is likely to be highly variable. No
information exists on the composition of the lower
crust or the Australian lithospheric mantle in the area.
We will now interpret the available isotopic and trace
element data to identify and constrain the relative
importance of sources involved in magmatism in the
Alor–Romang section, and compare this to data from
neighbouring volcanoes.
6.1. Upper crustal contamination
Before the merits of any source contamination
model can be discussed, it is necessary to assess
whether the geochemical characteristics of the sam-
ples have been influenced by upper crustal contam-
ination. This is especially important for the samples
with high 87Sr/86Sr, low 143Nd/144Nd ratios, and
intermediate to high silica contents, such as those
from Romang and Alor and Wetar’s south coast. Their
Sr and Nd isotopic characteristics resemble those of
the Lake Toba Tuff on Sumatra (Fig. 4B), which is
widely believed to have been formed by crustal fusion
(Turner and Foden, 2001). However, there is no good
correlation between the SiO2 content of magmatic
rocks and their isotopic ratio that would be expected if
assimilation were coupled with fractional crystallisa-
tion. (Fig. 5). Furthermore, the most mafic samples
already have values that show a significant crustal
influence, implying that the contamination originates
below the arc’s crust. An additional problem with the
idea of upper crustal contamination is that, unlike the
situation in Sumatra, there is no good evidence that
the volcanic arc in the area under discussion was built
upon continental crust. Although it has been sug-
gested that the crust in the Romang area is somewhat
thicker than normal oceanic crust (up to 20 km:
Richardson and Blundell, 1996), this has not been
described for the Alor–Wetar area. It is also clear from
Fig. 4 that the samples under discussion show no
resemblance to the Lake Toba Tuff in terms of their Pb
isotopic characteristics, so any potential upper crustal
contaminant cannot be located within the Sundaland
plate. Thereby, volcanic phenocrysts from Romang
have d18O values that are indistinguishable from
mantle values (Vroon et al., 2001), arguing against
significant upper crustal contamination in the area
where evidence exists for a thicker-than-normal crust.
In the absence of evidence for contamination by
continental crust from the overriding plate, an alter-
native assimilant could be the oceanic crust and
sediments of the upper plate. The sediments were
sampled during the Snellius II expedition and have
been included into the field for dshelf sedimentsT inFig. 4. It is clear from Fig. 4H that shelf sediments

M.A. Elburg et al. / Journal of Volcanology and Geothermal Research 140 (2005) 25–47 39
have a lower 208Pb/204Pb ratio for their 207Pb/204Pb
ratio than the more silicic samples from south Alor,
Lirang, Wetar and Romang, which are the most likely
to have experienced crustal contamination. On the
basis of the above considerations, we conclude that it
is unlikely that the samples with the most dcrustalTisotopic ratios obtained these characteristics by upper
crustal contamination.
6.2. Identification of Pb isotopic end members
Pb isotopic data can give us a first impression of
the identity of end members involved in magma
petrogenesis, since, unlike in Sr–Nd isotopic plots,
two-component mixing lines in Pb–Pb diagrams
should be straight, independent of slab-to-mantle
transfer processes. The wide scatter in the Pb isotope
data (Fig. 4), both on the unradiogenic and radiogenic
side of the diagrams, already shows that the sample
set cannot be modelled by simple mixing of two
homogeneous components. In a 208Pb/204Pb versus207Pb/204Pb diagram, it is obvious that the shelf
sediments analysed by Vroon et al. (1995) cannot
represent the radiogenic end member, since they do
not have high enough 208Pb/204Pb for their207Pb/204Pb. The north Australian river sediments
are a more suitable end member, although the scatter
in the most radiogenic samples from NE Alor shows
that this component is not homogeneous. It is,
however, quite likely that the Australian upper crust
represents the end member with high time-integrated
U/Pb and Th/Pb ratios. The other end of the Pb
isotopic array appears to point back towards the field
for I-OIB with significantly higher 208Pb/204Pb than
I-MORB at given 207Pb/204Pb ratios. This has been
the reason why previous studies have concluded that
the sub-arc mantle in the adjacent active section of the
Sunda–Banda arc should have Pb isotopic character-
istics similar to I-OIB rather than I-MORB (e.g.
Vroon et al., 1993), and that the arrays in Pb isotopic
space reflect mixing between mantle and subducted
continental material. However, when all available data
for the Sunda–Banda arc are considered, it becomes
obvious that the dcollision areaT, as defined by low3He/4He ratios relative to MORB (because of a
contribution of radiogenic helium from the subducting
continent), coincides with the area where the samples
point back towards high 208Pb/204Pb ratios on the less
radiogenic side of the array (Elburg et al., 2004). It is
hard to see why the sub-arc mantle should change
from being similar to I-MORB (as for the non-
collisional sector (Turner and Foden, 2001)) to
resembling I-OIB in its Pb isotopic composition in
the sector of the arc–continent collision. It is therefore
more logical that also the less-radiogenic end of the
Pb isotopic array represents a component brought into
the system during arc–continent collision. This agrees
with the conclusion by Miller et al. (1994) that Pb
isotopic compositions of arc magmas are dominated
by subducted components, and not by the mantle
source. From these considerations, we infer that the
less radiogenic end of the Pb isotopic array reflects
another component within the subducted Australian
plate, possibly the lower crust. Although no data are
available of the north Australian lower crust, existing
estimates of the lower crust in general indicate that it
should have U/Pb and Th/Pb ratios about half of those
of the upper crust (Taylor and McLennan, 1985). Over
time, this would lead to lower Pb isotopic ratios for
the lower crust than for the upper crust, which could
thus explain the array seen in the Pb isotope diagrams.
The scatter on both sides of the diagrams is likely to
reflect heterogeneity in both the lower and upper
crustal end members, as can be expected from the
diversity of crustal lithologies. Pb isotopic data for
west Australian granites indicate extreme heterogene-
ity, which in turn mimics the heterogeneity of the
lower crustal rocks from which they were derived
(Bickle et al., 1989).
The areal distribution of the Pb isotopic signature
is interesting to consider in relation to data from the
neighbouring volcanoes. Within the Alor–Romang
sector, the island of Alor shows by far the largest
range in isotopic signatures, and there is some
geographical grouping visible, with samples from
the northeast having the highest 206Pb/204Pb ratios
(V19.6), and those from the south coast the lowest.
The northeast coast samples fall within the trend of
increasing 206Pb/204Pb ratios from the west to the east
of the Sunda arc (Turner and Foden, 2001) (Fig. 6).
The samples from Alor’s south coast, Lirang, Wetar
and Romang, however, have lower 206Pb/204Pb iso-
topic ratios (V19.1). These values increase again whenpassing from the extinct sector into the active Banda
arc to the east (islands of Damar, Teon and Nila).
Within our previously discussed interpretation of the

Fig. 6. Variation of 206Pb/204Pb ratios along the oceanic Sunda–Banda arc, starting at Bali and ending at Banda. Data from Elburg et al. (2002),
Hoogewerff (1999), Stolz et al. (1990), Turner and Foden (2001), Turner et al. (2003), Van Bergen et al. (1992), Vroon et al. (1993). Symbols as
in Fig. 4 and closed diamonds: Pantar Strait volcanoes; small grey squares: active volcanoes Sunda–Banda arc. Arrows indicate the different Pb-
isotopic zones of the Sunda–Banda arc; Pb isotope arrays reflect mixing of (1) subducted oceanic crust and entrained sediments; (2) old
Australian upper crust and a low 206Pb/204Pb component of Australian derivation (probably lower crust), with upper crust dominant; (3) like 2,
but lower crust dominant.
M.A. Elburg et al. / Journal of Volcanology and Geothermal Research 140 (2005) 25–4740
Pb isotopic array of the extinct sector, this would
mean that magmatism in Alor’s south and on Lirang,
Wetar and Romang was dominated by a contribution
from the Australian lower crust, whereas the upper
crust would be the main contributor for neighbouring
islands.
6.3. Sr and Nd isotopes
Although Sr and Nd isotopes are potentially more
powerful indicators of the composition of the sub-arc
mantle and slab-to-wedge transfer processes, all
samples, apart from the Lirang spessartite, plot well
away from any possible mantle source and several plot
in the field for shelf sediments. Therefore, the
information they can convey about the composition
of the local mantle is highly limited. Even the
spessartite falls outside the field for any asthenospheric
mantle, and must contain a significant sedimentary
component.
The samples with the highest Sr and lowest Nd
isotope ratios are the two cordierite-bearing rhyolites,
of which the mineralogy already indicates the
importance of crustal material. Although high Sr
and low Nd isotopic ratios in subduction-related
magmas compared to MORB mantle are commonly
ascribed to subduction of continental material (either
sediment or continental crust) and its introduction into
the sub-arc mantle, this generally does not lead to the
extreme values seen on Wetar. Neither does this
process explain the presence of cordierite phenoc-
rysts, which have only been reported in magmas with
high d18O values (ambonites) on Ambon, in the
extinct, northern part of the Banda arc (Magaritz et
al., 1978; Vroon et al., 2001). Although the Sr
isotopic composition of these samples could be
influenced by alteration, Nd isotopic ratios are hardly
affected by most secondary processes, and these must
be close to primary magmatic values. They are
comparable to the most continental Nd isotopic values
reported previously for Wetar by McCulloch et al.
(1983). The isotopic composition, mineralogy and
felsic composition of these samples indicate that they
cannot have been in equilibrium with the mantle, or
have evolved from normal arc magmas by crystal
fractionation. Since we do not think that these
magmas represent upper crustal contamination of
mantle-derived magmas (see above; cf. Van Bemme-
len, 1949; Honthaas et al., 1999; Vroon et al., 2001
regarding the cordierite bearing bambonitesQ from the
island of Ambon), it is more likely that they are
partial melts of subducted continental material. It is

M.A. Elburg et al. / Journal of Volcanology and Geothermal Research 140 (2005) 25–47 41
important to note that samples from Romang have
similarly low 206Pb/204Pb ratios as the low-Nd
isotopic samples from Wetar, whereas the Sr–Nd–
Pb–O–Hf isotope data from Romang indicate magma
petrogenesis by modification of the sub-arc mantle by
partial melts of continental material, followed by
partial melting of this contaminated mantle (cf. Vroon
et al., 1993, 2001). This suggests that the material
subducted into the mantle wedge is similar in its Pb
isotopic ratios as the material that gave rise to the
cordierite rhyolites.
Another point to consider is that the samples with
the lowest Nd isotopic ratios are located on the south
coasts of the islands of Wetar and Alor, i.e. near the
front of the arc (Fig. 7). This is opposite to the, far
more restricted, decrease in Nd isotopic ratios across
the adjacent parts of the arc (Hoogewerff et al., 1997;
Elburg et al., 2002). The far greater magnitude of
variation in Nd isotopes in samples from the Alor–
Wetar section of the arc indicates the importance of
continental material in their origin. On Alor, there is a
clear trend in Pb isotopes, from low 206Pb/204Pb ratios
in the south to higher ratios in the northeast. Finally,
unlike the situation on Ambon, there is no unequiv-
ocal evidence for the presence of metamorphic base-
ment on the islands of Alor, Wetar or Lirang. Based
on these systematics, we propose that the cordierite
rhyolites are best explained as partial melts of
subducted continental crust. In one end member
Fig. 7. 143Nd/144Nd ratio versus estimated depth to the Benioff zone.
The samples with the lowest Nd isotopic ratios are found near the
front of the arc, in contrast to the more usual moderate decrease in
Nd isotopic ratio across the arc, as seen in the Pantar Strait
volcanoes (stippled field).
scenario, this crustal melt mixed with the mantle,
which subsequently melted, giving rise to the mag-
matism of Romang. On the other side of the spectrum
of possibilities, this crustal melt erupted in an almost
uncontaminated state, as seen in the cordierite
rhyolites on Wetar. If our interpretation that the low206Pb/204Pb isotope end member represents lower
crust, then it was mainly this component that was the
dominant non-mantle source to magmatism in south
Alor and Wetar. This contrasts with the situation in
northeast Alor, and neighbouring islands, where the
upper crust was the main non-mantle contributor.
During steady-state subduction of the continental
margin, the upper crust will always be closer to the
surrounding hot mantle wedge than the lower crust,
and it would logically be the main contributor. To
explain the presence of lower crustal melts at the front
of the arc, we propose that the leading, oceanic part of
the subducted slab has become disconnected from the
Australian continent, as has been shown by geo-
physical modelling to be the almost inevitable result
of arc–continent collision (Davies and von Blancken-
burg, 1995; Van de Zedde and Wortel, 2001). This
would then lead to upwelling of hot asthenospheric
mantle along the tear, thereby increasing the temper-
ature of the exposed lower crust, leading to melting of
this component. Evidence for slab detachment in this
particular part of the Sunda–Banda arc is given by
seismic data (McCaffrey et al., 1985; Charlton, 1991)
and modelling of the effective elastic thickness of the
north Australian lithosphere (Tandon et al., 2000).
The seismic quiescence between 50 and 380 km
underneath the inactive part of the arc (McCaffrey,
1989; Milsom, 2001) could also be interpreted as
signifying the absence of a slab. If slab break-off
happened at relatively shallow depths (cf. Van de
Zedde and Wortel, 2001), the resulting crustal melts
would be most visible near the arc trench, as is the
case on Wetar and Alor.
6.4. Alternative interpretation of the low 206Pb/204Pb
component
The Pb isotope data indicates that Sundaland crust,
similar to the material involved in the petrogenesis of
the Lake Toba Tuff, does not play a role in magma
genesis in the extinct section of the Sunda–Banda arc.
There is also little doubt from comparison with the
M.A. Elburg et al. / Journal of Volcanology and Geothermal Research 140 (2005) 25–4742
data for north Australian river sediments that the high206Pb/204Pb component represents the upper Austral-
ian crust. Unfortunately, the lack of constraints on the
composition of the Australian lower crust in the area
prohibits the unequivocal identification of the low206Pb/204Pb component as Australian lower crust.
However, considering the fact that this low 208Pb/204Pb also shows a relatively high 208Pb/204Pb for it208Pb/204Pb ratio, similar to the Australian upper
crust, and the fact that this component only appears
within the collisional section of the arc, it seems
certain that this component is also of Australian
derivation. An alternative to the idea of melting of the
lower crust is the presence of a different upper crustal
component in the sub-arc mantle. The fact that this
component has a less radiogenic Pb isotopic signature
than the high 206Pb/204Pb component could be a
reflection of its younger age, rather than a lower U/Pb
ratio. The existence of an underthrust Australian
microcontinent in the area to the east of Wetar has
been proposed by Richardson and Blundell (1996) to
explain the crustal thickness in this area, whereas
Snyder et al. (1996) suggests it could equally well be
an underthrust Palaeozoic basin. This postulated piece
of underthrust Australian continent or basin, with an
average age younger than the north Australian
continental rim, could be invoked as the source of
the low 206Pb/204Pb component. The area where the
low 206Pb/204Pb component dominates the Pb isotopic
budget (from south Alor to Romang) would in this
case reflect the size of the underthrust crust or basin.
The resemblance in Pb isotopic ratios between the
crustal melts that are represented by the south Wetar
cordierite rhyolites, and the mantle melts that formed
the Romang magmas (Vroon et al., 2001) still
necessitates a melting scenario similar to that depicted
in Section 6.3.
6.5. Trace element constraints
Both absolute elemental concentrations and the
ratios of trace elements are highly variable and far in
excess of what can be explained in a closed system by
crystal fractionation processes. Overall, ratios of
incompatible elements that are indicative of fluid
involvement in slab-to-wedge transfer processes (Pb/
Ce, Ba/Th; Fig. 8A) are rather low, as they are also in
the Pantar Strait volcanoes (Elburg et al., 2002).
Samples from south Alor, however, range to higher
values for Pb/Ce than most other samples. The
correlation between Pb/Ce and Ba/Th is much poorer
in this data set than in the Pantar Strait volcanoes.
Ratios involving Nb are heavily influenced by the
high concentrations of this element in samples from
Romang and, to a lesser extent, Wetar. The Th/Nb
versus 143Nd/144Nd ratios of Romang and some
south Alor samples can be modelled by simple
mixing between MORB source and a crustal melt
like the Wetar cordierite rhyolites (Fig. 8B). In this
model, 5% of crustal melt needs to be added to the
MORB source to explain the trace element and
isotopic characteristics of Romang. This is the same
value found by Vroon et al. (2001) to explain the
oxygen isotopic characteristics of the Romang
samples, using a less specific crustal melt (partial
melt of subducted sediments) as a contaminant.
Higher Th/Nb and 143Nd/144Nd ratios, more like
those in the Pantar Strait volcanoes, are seen in the
Wetar intrusives and the samples from central and
northeast Alor. The high Th/Nb ratios of the Pantar
Strait volcanoes have previously been modelled by
mixing between MORB source and partial melt of
subducted continental material, where rutile in the
residue retains Nb relative to Th. The lower Th/Nb
ratios seen in the Wetar cordierite rhyolites may
reflect larger degrees of melting at higher temper-
atures, where rutile is not a residual phase anymore.
One of the few trace element ratios that shows a
reasonable correlation with both Sr and Nd isotopic
composition is Rb/Ba (Fig. 8C), with the samples
with the highest Rb/Ba ratio having the lowest143Nd/144Nd and highest 87Sr/86Sr ratio. This corre-
lation is far better than that of Sm/Nd with143Nd/144Nd. The Wetar cordierite rhyolites form
the high Rb/Ba, low 143Nd/144Nd end of the trend,
and some Alor samples fall at the low Rb/Ba end of
the array. In spite of the good overall correlation,
several samples (a Wetar intrusive, the Lirang
spessartite and a rhyolite, and a basalt from central
Alor) fall off the main trend. Although it is
tempting to explain the observed correlation as
simple mixing between sub-arc mantle and a melt
similar to the Wetar cordierite rhyolites, it must be
noted that N-MORB-type mantle does not plot on
this trend, as it has a Rb/Ba ratio (~0.09) that is
higher than the low Rb/Ba side of the trend.

Fig. 8. (A) Pb/Ce versus Ba/Th for the analysed samples. Also shown is the field for the Pantar Strait volcanoes (light grey). Both elemental
ratios are indicative for the relative amount of fluid involved in slab-to-wedge transfer of element; the low values indicate that this transfer
mechanism was not very important in the extinct sector of the Sunda–Banda arc. The poor correlation between the ratios for the samples
analysed in this study may indicate that additional processes may have modified the ratios. (B) 143Nd/144Nd ratio versus Th/Nb, showing that the
least radiogenic Nd isotope sample from Alor’s south coast can be modelled by mixing between MORB-type mantle and 9% of a partial melt of
crustal material similar to the south Wetar cordierite rhyolites. Dark stippled field: North Australian river sediments (Elburg et al., 2002); light
stippled field: track III shelf sediments (Vroon et al., 1995). (C) Correlation between 143Nd/144Nd and Rb/Ba ratio. This is the best correlation
seen in the data, and appears to signify mixing between sub-arc mantle and a melt similar to the cordierite rhyolites. Fields as in A and B; striped
field: MORB. (D) 143Nd/144Nd versus 206Pb/204Pb ratio. The data set can be explained by mixing between MORB-type mantle, a component
similar to the Wetar cordierite rhyolites and Australian upper crust, for which the field of north Australian sediments acts as a proxy.
M.A. Elburg et al. / Journal of Volcanology and Geothermal Research 140 (2005) 25–47 43
Fractionation of Rb/Ba ratios in magmas with
respect to mantle and crustal end members has also
been observed for the Pantar Strait volcanoes
(Elburg et al., 2002), and this may reflect the
presence of phlogopite during partial melting of the
mantle.
6.6. Quantification of source contributions
It is obvious from the scatter in the isotope and
trace element diagrams that any attempt to model the
composition of the Alor–Romang samples must
involve a large number of end members, or a limited
number of end members with large internal variation.
In both cases, we do not have a handle on the exact
composition of these end members, neither in their
isotopic nor in their trace element characteristics. Such
large uncertainties on the input into the arc system
preclude any detailed modelling of the processes that
gave rise to magmatism in the Alor–Wetar area. A
crude estimate of the amount of continental material
involved in magma petrogenesis can be made on the
basis of several assumptions: (1) the sub-arc mantle is
similar to the source of I-MORB. This is based on
studies of Indonesian volcanics from the non-colli-
sional segment (Vroon et al., 1993; Turner and Foden,
2001). (2) One crustal end member (with relatively
low Pb isotopic ratios) is represented by the Wetar
cordierite rhyolites. (3) The other crustal end member
is the Australian upper crust. We took one of the
analyses of north Australian river sediments (ME1A;
Elburg et al., 2002) as a representative for this upper
crustal component. In a 143Nd/144Nd versus 206Pb/204Pb diagram (Fig. 8D) all samples fall between the

M.A. Elburg et al. / Journal of Volcanology and Geothermal Research 140 (2005) 25–4744
mixing curves between I-MORB and the two crustal
components. No more than 2% of the upper crustal
component is needed to explain the isotopic compo-
sition of the samples from Alor’s north coast, and up
to 9% to model the sample with the lowest Nd
isotopic composition from Alor’s south coast. The
extreme variability in the 87Sr/86Sr composition of the
upper crustal proxy (0.72–0.87) makes it hard to
constrain the Nd–Pb isotope results against models
involving Sr isotopes. The variability in Nd isotopic
composition at relatively constant Sr isotopic compo-
sition for the south Alor samples shows that a simple
two-component mixing model cannot explain their
isotopic ratios.
6.7. Involvement of the sub-continental lithospheric
mantle?
We have proposed that different crustal lithologies
may be involved in petrogenesis of the magmas in
the collision domain of the Banda–Sunda arc, but
previous studies (e.g. Varne, 1985) have invoked a
role for the sub-continental lithospheric mantle. This
was partially based on the extreme potassium
enriched signature of presumed collisional volcanics,
such as Batu Tara (Fig. 1A) and the active or
recently extinct volcanoes from Sumbawa (Tambora,
Sangeang Api, Sangenges and Soromundi). Our data
for the extinct segment show that most collisional
volcanoes do not have this shoshonitic signature, but
Fig. 9. (A) K2O versus SiO2 for the Sunda–Banda collisional volcanoes, an
and Soromundi. The data show that Batu Tara is clearly an exception in term
Sunda–Banda collisional volcanoes; lighter grey field: NW Sulawesi ultrap
collisional volcanics, Tambora, Sangeang Api, Sangenges, Soromundi and
represent melting of the Australian subcontinental lithospheric mantle (Elbu
isotopic evidence for involvement of old lithospheric mantle.
fall in the field of more normal dhigh-KT volcanics. Ifwe take the dcollision sectorT to comprise all
volcanoes in the area of low helium isotopic
signature (Hilton and Craig, 1989; Hilton et al.,
1992: east Flores to the Banda arc), Batu Tara is
clearly an exception in terms of its high potassium
contents (Fig. 9A). The shoshonitic volcanoes on
Sumbawa fall outside the collision area and at least
one of them, Sangeang Api, has a helium isotopic
signature that is close to that of MORB (Hilton and
Craig, 1989). The idea that Sumba is an Australian
microcontinent and has been involved in a collision
with the arc, thereby giving rise to the potassic
volcanism on Sumbawa (Varne, 1985; Varne and
Foden, 1986), is not supported by data from other
disciplines. Palaeomagnetic (Wensink, 1994; Wen-
sink and Van Bergen, 1995) and isotopic data (Vroon
et al., 1995) show that Sumba has come from a more
northerly position near western Sulawesi. It has
therefore never been part of the subducting plate
and cannot have been involved in magma genesis on
Sumbawa. Finally, shoshonitic samples from north-
west Sulawesi, which have been interpreted to
represent partial melts of underthrust Australian
lithospheric mantle (Elburg et al., 2003), show Pb
isotopic signatures that are different from either the
Sumbawa volcanoes or the collision segment (Fig.
9B).
We therefore see no evidence for the involvement
of Australian subcontinental lithospheric mantle in the
d the non-collisional volcanoes Tambora, Sangeang Api, Sangenges
s of K2O content among the collisional volcanoes. Grey field: other
otassics. (B) 208Pb/204Pb versus 206Pb/204Pb ratios for Sunda–Banda
Miocene samples from NW Sulawesi that have been interpreted to
rg et al., 2003). The data from the Sunda–Banda arc do not show Pb
M.A. Elburg et al. / Journal of Volcanology and Geothermal Research 140 (2005) 25–47 45
petrogenesis of any of the collisional or non-colli-
sional volcanoes of the Sunda–Banda arc.
7. Conclusions
Magmatism in the now extinct sector of the Sunda–
Banda arc has a high-K signature and variable trace
element and isotopic characteristics. The high206Pb/204Pb ratios in the Pantar Strait volcanoes and
most of Alor are interpreted to reflect a contribution
from the subducted Australian upper crust. The sudden
decline in 206Pb/204Pb ratios in samples from Alor’s
south coast, Lirang, Wetar and Romang is likely to
reflect a contribution from a different subducted
component of Australian derivation, probably the
lower crust. Melting of the lower crust may have been
induced by break-off of the oceanic lithosphere from
the continental part of the slab, thereby allowing hot
asthenospheric mantle to ascend through the slab
window and heat the lower crust to its melting point.
An alternative interpretation is that the low 206Pb/204Pb
component represents an underthrust promontory of
younger Australian upper crust. Virtually unmodified
partial melts of this low 206Pb/204Pb crustal component
have been found as rhyolites with cordierite pseudo-
morphs on Wetar’s south coast. Other samples from
the dlow 206Pb/204Pb zoneT represent partial melts of a
mixture of I-MORB mantle and up to 9% of the low206Pb/204Pb crustal component. No more than 2%
addition of upper crustal material to the mantle wedge
is needed to explain the Nd–Pb isotopic composition
of the high 206Pb/204Pb samples. However, these
constraints are not very precise, as the scatter in
isotopic and trace element data indicates pronounced
heterogeneity in the crustal end member. We cannot
comment on the homogeneity of the mantle end
member, as all samples show such a pronounced
influence of subducted continental material that the
mantle signature is obscured. Arrays in Pb isotopic
space, which have previously been interpreted as
mixing between mantle and crustal end members, are
now interpreted as reflecting mixing between sub-
ducted components only; in the case of the collision
segment, these may be the Australian upper and lower
continental crust. In case of the active areas to the east
and west, this is thought to be the subducted oceanic
slab and entrained sediments.
Acknowledgments
The field and analytical work for this paper was
carried out while ME was a recipient of an ARC APD,
and written during tenure of an EU Marie Curie
Fellowship. Pieter Vroon provided the analysis of
Wetar sample WE1A1. Jan Werner is acknowledged
for providing access to the collections housed at the
Geological Museum in Artis (Amsterdam). Ahmed
Karaing and Paul Bons provided invaluable help
during fieldwork. Julian Pearce and an anonymous
reviewer provided comments on an immature version
of part of this manuscript. Rhiannon George and an
anonymous reviewer are thanked for their formal
reviews.
Appendix A. Supplementary data
Supplementary data associated with this article can
be found, in the online version, at doi:10.1016/
j.jvolgeores.2004.07.014.
References
Abbott, M.J., Chamalaun, F.H., 1981. Geochronology of some
Banda arc volcanics. In: Wiryosuyono, S. (Ed.), Geology and
Tectonics of Eastern Indonesia. Geol. Res. Dev. Centre Spec.
Publ. Geol. Res. Dev. Centre, Bandung, pp. 253–268.
Berry, R.F., McDougall, I., 1986. Interpretation of 40Ar/39Ar and K/
Ar dating evidence from the Aileu formation, East Timor,
Indonesia. Chem. Geol. 59, 43–58.
Bickle, M.J., Bettenay, L.F., Chapman, H.J., Groves, D.I.,
McNaughton, N.J., Campbell, I.H., de Laeter, J.R., 1989. The
age and origin of younger granitic plutons of the Shaw Batholith
in the Archaean Pilbara Block, Western Australia. Contrib.
Mineral. Petrol. 101, 361–376.
Bowin, C., Purdy, G.M., Johnston, C., Shor, G., Lawver, L.,
Hartonon, H.M.S., Jezek, P., 1980. Arc–continent collision
in the Banda Sea region. Am. Assoc. Pet. Geol. Bull. 64,
868–915.
Charlton, T.R., 1991. Postcollision extension in arc–continent
collision zones, eastern Indonesia. Geology 19, 28–31.
Churikova, T.G., Dorendorf, F., Worner, G., 2001. Sources
and fluids in the mantle wedge below Kamchatka,
evidence from across-arc geochemical variation. J. Petrol.
42, 1567–1593.
Class, C., Miller, D., Goldstein, S.L., Langmuir, C.H., 2000.
Distinguishing melt and fluid subduction components in Umnak
Volcanics, Aleutian Arc. Geochem. Geophys. Geosyst. 1
(1999GC000010).
M.A. Elburg et al. / Journal of Volcanology and Geothermal Research 140 (2005) 25–4746
Davies, J.H., von Blanckenburg, F., 1995. Slab breakoff: a model of
lithosphere detachment and its test in the magmatism and
deformation of collisional orogens. Earth Planet. Sci. Lett. 129,
85–102.
De Jong, J.D. 1941. Geological investigations in West Wetar, Lirang
and Solor. PhD thesis, Universiteit van Amsterdam.
Eggins, S.M., Woodhead, J.M., Kinsley, L.P.J., Mortimer, G.E.,
Sylvester, P., McCulloch, M.T., Hergt, J.M., Handler, M.R.,
1997. A simple method for the precise determination of z40
trace elements in geological samples by ICP-MS using enriched
isotope internal standardisation. Chem. Geol. 134, 311–326.
Elburg, M., Foden, J., 1999. Sources for magmatism in Central
Sulawesi: geochemical and Sr–Nd–Pb constraints. Chem. Geol.
156, 67–93.
Elburg, M.A., van Bergen, M.J., Hoogewerff, J., Foden, J., Vroon,
P.Z., Zulkarnain, I., Nasution, A., 2002. Geochemical trends
across an arc–continent collision zone: magma sources and
slab–wedge transfer processes below the Pantar Strait volcanoes
(Indonesia). Geochim. Cosmochim. Acta 66, 2771–2789.
Elburg, M.A., van Leeuwen, T., Foden, J., Muhardjo, 2003. Spatial
and temporal isotopic domains of contrasting igneous suites in
Western and Northern Sulawesi, Indonesia. Chem. Geol. 199,
243–276.
Elburg, M.A., van Bergen, M.J., Foden, J., 2004. Subducted upper
and lower continental crust contributes to magmatism in the
collision sector of the Sunda–Banda arc, Indonesia. Geology 32,
41–44.
Elliott, T., Plank, T., Zindler, A., White, W., Bourdon, B., 1997.
Element transport from slab to volcanic front at the Mariana arc.
J. Geophys. Res. 102, 14,991–15,019.
Hall, R., 2002. Cenozoic geological and plate tectonic evolution of
SE Asia and the SW Pacific: computer-based reconstructions,
model and animations. J. Asian Earth Sci. 20, 353–431.
Hantoro, W.S., Prirazzoli, P.A., Jouannic, C., Faure, H., Hoang,
C.T., Radtke, U., Causse, C., Borel Best, M., Lafont, R., Bieda,
S., Lambeck, K., 1994. Quaternary uplifted coral reef terraces
on Alor Island, East Indonesia. Coral Reefs 13, 215–223.
Hawkesworth, C., Ellam, R., 1989. Chemical fluxes and wedge
replenishment rates along recent destructive plate margins.
Geology 17, 46–49.
Heering, J., 1941. Geological investigations in east Wetar, Alor and
Poera Besar. PhD thesis, University of Amsterdam, Amsterdam,
125 pp.
Hilton, D.R., Craig, H., 1989. A helium isotope transect along the
Indonesian archipelago. Nature 342, 906–908.
Hilton, D.R., Hoogewerff, J.A., van Bergen, M.J., Hammerschmidt,
K., 1992. Mapping magma sources in the east Sunda–Banda
arcs, Indonesia: Constraints from helium isotopes. Geochim.
Cosmochim. Acta 56, 851–859.
Hinschberger, F., Malod, J.-A., Dyment, J., Honthaas, C., Rehault,
J.-P., Burhanuddin, S., 2001. Magnetic lineations constraints for
the back-arc opening of the Late Neogene South Banda Basin
(eastern Indonesia). Tectonophysics 333, 47–59.
Hochstaedter, A.G., Gill, J.B., Taylor, B., Ishizuka, O., Yuasa, M.,
Morita, S., 2000. Across-arc geochemical trends in the Izu–
Bonin arc: constraints on source composition and mantle
melting. J. Geophys. Res. 105, 495–512.
Hochstaedter, A.G., Gill, J., Peters, R., Broughton, P., Holden, P.,
2001. Across-arc geochemical trends in the Izu–Bonin arc:
contributions from the subducting slab. Geochem. Geophys.
Geosyst. 2 (2000GC000105).
Honthaas, C., Rehault, J.-P., Maury, C., Bellon, H., Hemond, C.,
Malod, J.-A., Cornee, J.-J., Villeneuve, M., Cotten, J., Burha-
nuddin, S., Guillou, H., Arnaud, N., 1998. A Neogene back-arc
origin for the Banda Sea basins: geochemical and geochrono-
logical constraints from the Banda ridges (East Indonesia).
Tectonophysics 298, 297–317.
Honthaas, C., Maury, R.C., Priadi, B., Bellon, H., Cotten, J., 1999.
The Plio-Quaternary Ambon arc, Eastern Indonesia. Tectono-
physics 301, 261–281.
Hoogewerff, J.A., 1999. Magma genesis and slab–wedge interaction
across an island arc–continent collision zone, East Sunda Arc,
Indonesia. PhD thesis, Utrecht University.
Hoogewerff, J.A., Van Bergen, M.J., Vroon, P.Z., Hertogen, J.,
Wordel, R., Sneyers, A., Nasution, A., Varekamp, J.C.,
Moens, H.L.E., Mouchel, D., 1997. U-series, Sr–Nd–Pb
isotope and trace-element systematics across an active island
arc–continent collision zone: implications for element transfer
at the slab–wedge interface. Geochim. Cosmochim. Acta 61,
1057–1072.
Kersting, A.B., Arculus, R.J., Gust, D.A., 1996. Lithospheric
contributions to arc magmatism: isotope variations along strike
in volcanoes of Honshu, Japan. Science 272, 1464–1468.
Kreemer, C., Holt, W., Goes, S., Govers, R., 2000. Active
deformation in eastern Indonesia and the Philippines from
GPS and seismicity data. J. Geophys. Res. 105, 663–680.
Lynnes, C.S., Lay, T., 1988. Source process of the great 1977
Sumba earthquake. J. Geophys. Res. 93, 13407–13420.
Magaritz, M., Whitford, D.J., James, D.E., 1978. Oxygen isotopes
and the origin of high-87Sr/86Sr andesites. Earth Planet. Sci.
Lett. 40, 220–230.
McCaffrey, R., 1988. Active tectonics of the eastern Sunda and
Banda arcs. J. Geophys. Res. 93, 15163–15182.
McCaffrey, R., 1989. Seismological constraints and speculations on
Banda Arc tectonics. Neth. J. Sea Res. 24, 141–152.
McCaffrey, R., Molnar, P., Roecker, S.W., Joyodiwwiryo, Y.S.,
1985. Microearthquake seismicity and fault plane solutions
related to arc–continent collision in the eastern Sunda Arc,
Indonesia. J. Geophys. Res. 90, 4511–4528.
McCulloch, M.T., Compston, W., Abbott, M., Chivas, A., 1983.
Neodymium, strontium, lead and oxygen isotopic and trace
element constraints on magma genesis in the Banda Island-arc,
Wetar. Sixth Australian Geological Convention. Geological
Society of Australia, Canberra, pp. 152–153.
Miller, D.M., Goldstein, S.L., Langmuir, C.H., 1994. Cerium/lead
and lead isotope ratios in arc magmas and the enrichment of lead
in the continents. Nature 368, 514–520.
Milsom, J., 2001. Subduction in eastern Indonesia: how many
slabs? Tectonophysics 338, 167–178.
Pearce, J.A., Parkinson, I.J., 1993. Trace element models for mantle
melting: application to volcanic arc petrogenesis. In: Prichard,
H.M., Alabaster, T., Harris, N.B.W., Neary, C.R. (Eds.),
Magmatic Processes and Plate Tectonics. Geol. Soc. Spec.
Publ., 76, 373–403.

M.A. Elburg et al. / Journal of Volcanology and Geothermal Research 140 (2005) 25–47 47
Richardson, A.N., Blundell, D.J., 1996. Continental collision in the
Banda arc. In: Hall, R., Blundell, D. (Eds.), Tectonic Evolution
of Southeast Asia. Geol. Soc. Spec. Publ., 106, 47–60.
Schoffel, H.-J., Das, S., 1999. Fine details of the Wadati–Benioff
zone under Indonesia and its geodynamic implications.
J. Geophys. Res. 104, 13101–13114.
Snyder, D.B., Milsom, J., Prasetyo, H., 1996. Geophysical evidence
for local indentor tectonics in the Banda arc east of Timor. In:
Hall, R., Blundell, D. (Eds.), Tectonic Evolution of Southeast
Asia. Geol. Soc. Spec. Publ., 106, 61–73.
Spence, W., 1986. The 1977 Sumba earthquake series: evidence for
slab pull force acting at a subduction zone. J. Geophys. Res. 91,
7225–7239.
Stolz, A.J., Varne, R., Davies, G.R., Wheller, G.E., Foden, J.D.,
1990. Magma source components in an arc–continent collision
zone: the Flores–Lembata sector, Sunda arc, Indonesia. Contrib.
Mineral. Petrol. 105, 585–601.
Sun, S.-s., McDonough, W.F., 1989. Chemical and isotopic
systematics of oceanic basalts: implications for mantle
composition and processes. In: Saunders, A.D., Norry, M.J.
(Eds.), Magmatism in the Ocean Basins. Geol. Soc. Spec.
Publ., 42, 313–345.
Tandon, K., Lorenzo, J.M., O’Brien, G.W., 2000. Effective elastic
thickness of the northern Australian continental lithosphere
subducting beneath the Banda orogen (Indonesia): inelastic
failure at the start of continental subduction. Tectonophysics
329, 39–60.
Taylor, S.R., McLennan, S.M., 1985. The Continental Crust: Its
Composition and Evolution. Blackwell Scientific Publications,
Oxford, 312 pp.
Turner, S., Foden, J., 2001. U, Th and Ra disequilibria, Sr, Nd and
Pb isotope and trace element variations in Sunda arc lavas:
predominance of a subducted sediment component. Contrib.
Mineral. Petrol. 142, 43–57.
Turner, S., Hawkesworth, C., Rogers, N., Bartlett, J., Worthington,
T., Hergt, J., Pearce, J., Smith, I., 1997. 238U–230Th disequi-
libria, magma petrogenesis, and flux rates beneath the depleted
Tonga–Kermadec island arc. Geochim. Cosmochim. Acta 61,
4855–4884.
Turner, S., Foden, J., George, R., Evans, P., Varne, R., Elburg,
M.A., Jenner, G., 2003. Rates and processes of potassic magma
evolution beneath Sangeang Api volcano, east Sunda arc,
Indonesia. J. Petrol. 44, 491–515.
Van Bemmelen, R.W., 1949. General Geology of Indonesia and
Adjacent Archipelagoes. The Geology of Indonesia, 1a. Govern-
ment Printing Office, The Hague, 732 pp.
Van Bergen, M.J., Vroon, P.Z., Varekamp, J.C., Poorter,
R.P.E., 1992. The origin of the potassic rock suite from
Batu Tara volcano (East Sunda Arc, Indonesia). Lithos 21,
261–282.
van de Zedde, D.M.A., Wortel, M.J.R., 2001. Shallow slab
detachment as a transient source of heat at midlithospheric
depths. Tectonics 20, 868–882.
Varne, R., 1985. Ancient subcontinental mantle; a source for K-rich
orogenic volcanics. Geology 13, 405–408.
Varne, R., Foden, J.D., 1986. Geochemical and isotopic systematics
of eastern Sunda Arc volcanics: implications for mantle sources
and mantle mixing processes. In: Wezel, F.-C. (Ed.), The Origin
of Arcs. Elsevier, Amsterdam, pp. 159–189.
Vroon, P.Z., Lowry, D., van Bergen, M.J., Boyce, A.J., Mattey,
D.P., 2001. Oxygen isotope systematics of the Banda Arc:
low d18O despite involvement of subducted continental
material in magma genesis. Geochim. Cosmochim. Acta 65,
589–609.
Vroon, P.Z., Van Bergen, M.J., White, W.M., Varekamp, J.C., 1993.
Sr–Nd–Pb isotope systematics of the Banda Arc, Indonesia:
combined subduction and assimilation of continental material.
J. Geophys. Res. 98, 22349–22366.
Vroon, P.Z., Van Bergen, M.J., Klaver, G.J., White, W.M., 1995.
Strontium, neodymium, and lead isotopic and trace-element
signatures of the East Indonesian sediments: provenance and
implication for Banda Arc magma genesis. Geochim. Cosmo-
chim. Acta 59, 2573–2598.
Wensink, H., 1994. Paleomagnetism of rocks from Sumba: tectonic
implication since the late Cretaceous. J. Southeast Asian Earth
Sci. 9, 51–65.
Wensink, H., Van Bergen, M.J., 1995. The tectonic emplacement of
Sumba in the Sunda–Banda Arc: paleomagnetic and geo-
chemical evidence from the early Miocene Jawila volcanics.
Tectonophysics 250, 15–30.
Whitford, D.J., Nicholls, I.A., 1976. Potassium variation in lavas
across the Sunda Arc in Java and Bali. In: Johnson, R.W. (Ed.),
Volcanism in Australasia, pp. 63–75.
Whitford, D.J., Compston, W., Nicholls, I.A., Abbott, M.J., 1977.
Geochemistry of late Cenozoic lavas from eastern Indonesia:
Role of subducted sediments in petrogenesis. Geology 5,
571–575.
Widiyantoro, S., van der Hilst, R., 1996. Structure and evolution of
lithospheric slab beneath the Sunda Arc, Indonesia. Science 271,
1566–1570.
Widiyantoro, S., Van der Hilst, R., 1997. Mantle structure beneath
Indonesia inferred from high-resolution tomographic imaging.
Geophys. J. Int. 130, 167–182.
Woodhead, J.D., Johnson, R.W., 1993. Isotopic and trace-element
profiles across the New Britain island arc, Papua New Guinea.
Contrib. Mineral. Petrol. 113, 479–491.