
Relationship between blood pressure and flow rate in arteries ...
15
1 Relationship between blood pressure and flow rate in arteries using a modified Windkessel model Nam Lyong Kang * * Department of Nanomechatronics Engineering, Pusan National University, Miryang 50463, Republic of Korea This study examined the flow rate in arteries using the modified Windkessel model, considering various models for blood pressure. An exact solution was derived using a Laplace transform method and the effects of blood pressure on the flow rate in an artery were examined. The effects of the flow resistance, arterial compliance, and inertia of blood on the flow rate were also investigated. The flow rate decreased with increasing inertia of the blood and flow resistance and decreasing arterial compliance. The height and position of the secondary peak were determined by a combination of the flow resistance, arterial compliance, and blood inertance. The results suggest that the risk of hypertension may increase with age because decreases in flow rate due to an increase in flow resistance and a decrease in arterial compliance were more substantial than the increase in flow rate caused by a decrease in blood inertance. The proposed method can provide information to examine how factors, such as aging, disease, and exercise, affect the flow rate in blood vessels. Keywords : Artery system, Blood pressure, Modified Windkessel model, Blood flow rate, Laplace transformation
-
Upload
khangminh22 -
Category
Documents
-
view
2 -
download
0
Transcript of Relationship between blood pressure and flow rate in arteries ...

1
Relationship between blood pressure and flow rate in
arteries using a modified Windkessel model
Nam Lyong Kang*
* Department of Nanomechatronics Engineering, Pusan National University, Miryang 50463,
Republic of Korea
This study examined the flow rate in arteries using the modified Windkessel model,
considering various models for blood pressure. An exact solution was derived using a Laplace
transform method and the effects of blood pressure on the flow rate in an artery were examined.
The effects of the flow resistance, arterial compliance, and inertia of blood on the flow rate
were also investigated. The flow rate decreased with increasing inertia of the blood and flow
resistance and decreasing arterial compliance. The height and position of the secondary peak
were determined by a combination of the flow resistance, arterial compliance, and blood
inertance. The results suggest that the risk of hypertension may increase with age because
decreases in flow rate due to an increase in flow resistance and a decrease in arterial compliance
were more substantial than the increase in flow rate caused by a decrease in blood inertance.
The proposed method can provide information to examine how factors, such as aging, disease,
and exercise, affect the flow rate in blood vessels.
Keywords : Artery system, Blood pressure, Modified Windkessel model, Blood flow rate,
Laplace transformation

2
Introduction The temporal behavior of blood flowing out of the heart is related to blood pressure and
depends on the elasticity of the aorta and peripheral vascular resistance. The characteristics of
this system can be formulated using an analogy with the formalism of the electric current in
the Windkessel model. In this model, Poiseuille's law for the pressure drop in a tube
corresponds to Ohm's law for the voltage drop in a resistor. Therefore, for an aorta and artery
without compliance, the Poiseuille's formula determines the characteristics of blood flow. In
this case, all the blood flowing out of the heart reaches the capillary tubes through the peripheral
vascular system. On the other hand, some of the blood is stored around the artery walls if the
aorta and artery are somewhat compliant. In a healthy system, the aorta and artery should be
fully elastic to allow blood to flow in and out of the heart in the diastolic stage and systolic
stage, respectively.
The original Windkessel model developed by Otto Frank [1] has two elements and
represents the heart as a source of flow that pumps blood into the arterial system. The heart is
lumped into two elements: the peripheral vascular resistance and arterial compliance. The
individual resistances and compliances of all vessels are added in the Windkessel model.
Therefore, resistance and compliance are called peripheral resistance and total compliance,
respectively. On the other hand, the two-element Windkessel model produces unrealistic aortic
pressure wave properties when the aortic flow is used as input [2]. To overcome this weakness
of the two-element Windkessel model, the model was later modified to include the
characteristic impedance and inertia of the blood [3-7]. In these modified models, the blood
pressure, flow rate, peripheral resistance, arterial compliance, and blood inertance correspond
to the electric voltage, electric current, electric resistance, capacitance, and self-inductance,
respectively. The characteristic impedance links the Windkessel model to the wave travel
aspects of the artery system. The proximal compliance, distal compliance, and peripheral
resistance are connected in parallel.
On the other hand, the aging process decreases the arterial compliance and increases the
peripheral resistance because with age, the stiffness of the artery wall increases, the viscosity
increases, and the radius of the artery wall decreases [8]. In this case, the compliance and inertia
of blood play important roles in the flow rate. The aging process also affects the systolic rising
edge (SRE) and the peak position of the blood pressure because the shape characteristics of

3
blood pressure are affected by the increasing arterial stiffness with age [8-11]. Zahedi et al. [8]
showed that a steep rise and early peak of blood pressure occurred in younger subjects. The
rise was quite gradual and the pulse peak appeared much later in older subjects, i.e., the peak
time(𝑇𝑇𝑝𝑝) taken to reach the peak of the blood pressure after mitral valve closure is longer in
older people than in younger people. This shows that the vascular parameters change with age,
and the SRE could be considered a parameter in determining the age-dependent vascular state.
The arterial stiffness is also affected by elevated blood pressure and higher sympathetic
activities.
This study examined the behavior of circulatory blood flow inside the human body using
an analogy with an electric circuit system. For this purpose, an exact solution for the modified
Windkessel model was derived by applying the Laplace transform method, which is a powerful
tool for obtaining a series solution for differential equations when a periodic driving force is
applied. The flow rates calculated using the models for blood pressure introduced in this paper
were fitted to actual in vivo results to confirm the validation of the method. The effects of the
slope of the SRE and the peak time on the flow rate in an artery were examined using various
models for blood pressure. The effects of the peripheral resistance, arterial compliance, and
inertia of blood on the flow rate in the artery were then investigated. The risk of hypertension
with age is also discussed.
Methods
Adapting the well-known Windkessel models [3-5], the main artery system (modified
Windkessel model) shown in Fig. 1 was considered to examine the effects of blood pressure
on the flow rate. The peripheral resistance, 𝑅𝑅, represents the resistance to blood flow in the
arterial system, which is mainly in the resistance vessels, i.e., small arterials and arterioles. The
resistance is the relationship between the pressure drop across a vessel and the blood flow
through it and can be quantified by Poiseuille's law. The law relates the resistance to the length
and radius of a vessel and the viscosity of blood under the assumption that the flow is steady
and the vessel is rigid and uniform. The arterial compliance of the arterial wall, 𝐶𝐶, is the ratio
of a volume change to the resulting change in pressure of a blood vessel that consists of large
elastic arteries and small distal arteries. The compliance depends on the radius and wall

4
thickness of the vessel and will decrease with age due to progressive changes in the elastin and
collagen content of the arterial wall. The blood inertance, 𝐿𝐿, represents the inertia of blood
mass in the artery.
Fig. 1 Modified Windkessel model for the human arterial system. 𝐿𝐿 is the blood inertance, 𝐶𝐶
is the arterial compliance, and 𝑅𝑅 is the peripheral resistance. 𝑄𝑄1 and 𝑄𝑄2 are the flow rates
in the artery and peripheral blood vessels, respectively.
The blood flow increases dramatically at the beginning of the systolic state, and the human
body can maintain steady blood flow. Therefore, it is reasonable to include an inertial element
[3]. In previous models, the peripheral resistance is the main factor for the risk of hypertension,
but arterial compliance is also important for old-age systolic hypertension [12, 13]. The blood
inertance is predominant in large arteries, where the resistive effects do not play an important
role. To examine the effects of the slope of the SRE and the peak time (𝑇𝑇𝑝𝑝) on the flow rate in
the artery, this paper considers the periodic blood pressures with the same period (𝑇𝑇 = 0.85 [s])
given in Table 1 and does not consider the dicrotic notch (DN) in the blood pressure (this will
be done in a subsequent study). From the results reported by Zahedi et al. [8], models 1, 2, and
3-6 corresponds to younger subjects, middle-age subjects, and older subjects, respectively.
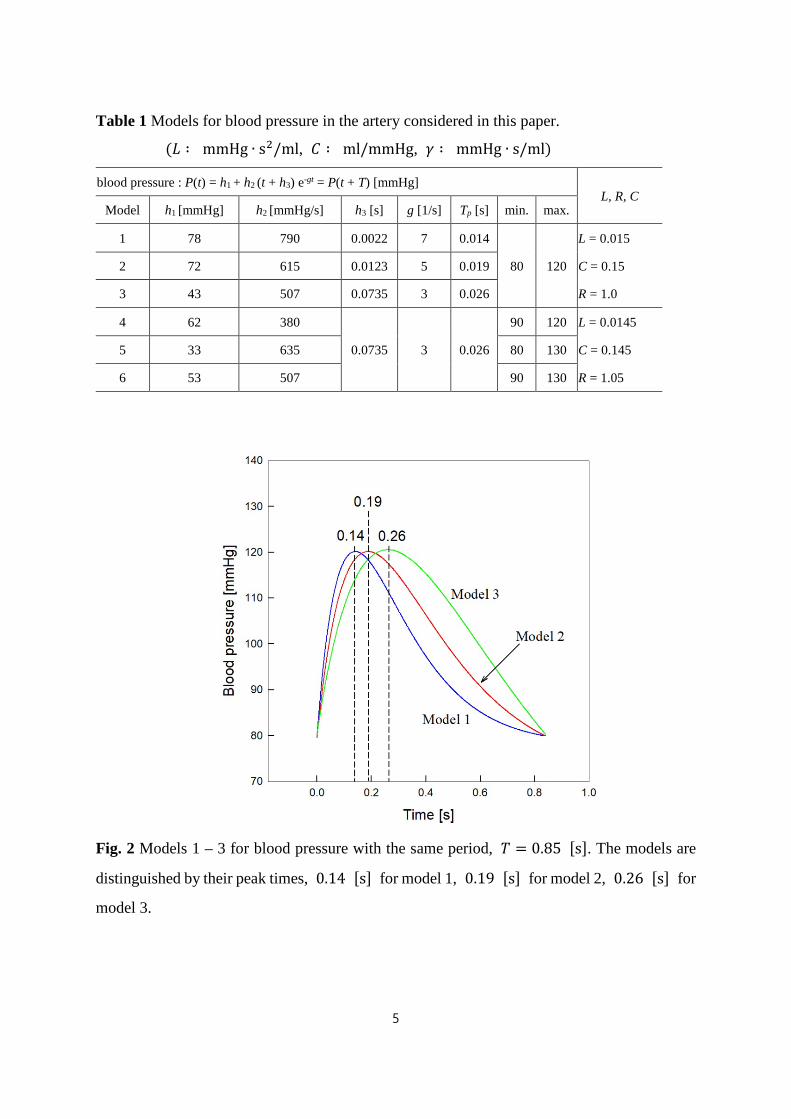
Models 1-3 (Fig. 2) have the same 𝐿𝐿,𝑅𝑅, and 𝐶𝐶 values as well as the same systolic and
diastolic pressures, but their peak times and SREs are different. Models 3-6 (Fig. 3) have the
same peak time but their systolic and diastolic pressures are different. Models 4-6 have the
same 𝐿𝐿,𝑅𝑅, and 𝐶𝐶 values. The age-dependence of the blood flow rate was investigated using
models 1-3, and the systolic pressure- and diastolic pressure-dependences of the blood flow
rate were investigated using models 3-6.
5
Table 1 Models for blood pressure in the artery considered in this paper.
(𝐿𝐿 ∶ mmHg ∙ s2/ml, 𝐶𝐶 ∶ ml/mmHg, 𝛾𝛾 ∶ mmHg ∙ s/ml)
blood pressure : P(t) = h1 + h2 (t + h3) e-gt = P(t + T) [mmHg] L, R, C
Model h1 [mmHg] h2 [mmHg/s] h3 [s] g [1/s] Tp [s] min. max.
1 78 790 0.0022 7 0.014
80 120
L = 0.015
2 72 615 0.0123 5 0.019 C = 0.15
3 43 507 0.0735 3 0.026 R = 1.0
4 62 380
0.0735 3 0.026
90 120 L = 0.0145
5 33 635 80 130 C = 0.145
6 53 507 90 130 R = 1.05
Fig. 2 Models 1 – 3 for blood pressure with the same period, 𝑇𝑇 = 0.85 [s]. The models are
distinguished by their peak times, 0.14 [s] for model 1, 0.19 [s] for model 2, 0.26 [s] for
model 3.

6
Fig. 3 Models 3 - 6 for blood pressure with the same peak time and same period, 𝑇𝑇𝑝𝑝 =
0.26 [s] and 𝑇𝑇 = 0.85 [s] . The models are distinguished by their pressure ranges,
80 ~ 120 [mmHg] for model 3, 90 ~ 120 [mmHg] for model 4, 80 ~ 130 [mmHg]
for model 5, and 90 ~ 130 [mmHg] for model 6.
The equation for blood flow can be derived by applying Kirchhoff's law to the artery system
in Fig. 1, as follows:
𝑑𝑑𝑄𝑄1𝑑𝑑𝑑𝑑
= −𝑎𝑎𝑄𝑄2 + 𝑓𝑓(𝑑𝑑), 𝑑𝑑𝑄𝑄2𝑑𝑑𝑑𝑑
= 𝑏𝑏𝑄𝑄1 − 𝑏𝑏𝑄𝑄2 (1)
where 𝑎𝑎 ≡ 𝑅𝑅/𝐿𝐿, 𝑏𝑏 ≡ 1/𝑅𝑅𝐶𝐶,𝑓𝑓(𝑑𝑑) = 𝑃𝑃(𝑑𝑑)/𝐿𝐿. By applying the Laplace transform to Eq. (1), the
Laplace transform of 𝑄𝑄1, 𝑄𝑄�1, can be expressed as follows:
𝑄𝑄�1 =𝑔𝑔1(𝑠𝑠 + 𝑏𝑏)
𝑠𝑠(𝑠𝑠2 + 𝑏𝑏𝑠𝑠 + 𝑎𝑎𝑏𝑏) +𝑔𝑔2ℎ3(𝑠𝑠 + 𝑏𝑏)
(𝑠𝑠 + 𝛾𝛾)(𝑠𝑠2 + 𝑏𝑏𝑠𝑠 + 𝑎𝑎𝑏𝑏)(1− 𝑒𝑒−𝑠𝑠𝑠𝑠)
−𝑔𝑔2(𝑇𝑇 + ℎ3)(𝑠𝑠 + 𝑏𝑏)𝑒𝑒−(𝑠𝑠+𝛾𝛾)𝑠𝑠
(𝑠𝑠 + 𝛾𝛾)(𝑠𝑠2 + 𝑏𝑏𝑠𝑠 + 𝑎𝑎𝑏𝑏)(1− 𝑒𝑒−𝑠𝑠𝑠𝑠) +𝑔𝑔2(𝑠𝑠 + 𝑏𝑏)�1 − 𝑒𝑒−(𝑠𝑠+𝛾𝛾)𝑠𝑠�
(𝑠𝑠 + 𝛾𝛾)2(𝑠𝑠2 + 𝑏𝑏𝑠𝑠 + 𝑎𝑎𝑏𝑏)(1 − 𝑒𝑒−𝑠𝑠𝑠𝑠) (2)
where 𝑔𝑔1 ≡ ℎ1/𝐿𝐿,𝑔𝑔2 ≡ ℎ2/𝐿𝐿, and 𝑠𝑠 is the Laplace variable. 𝑄𝑄1(0) is neglected to consider
the steady state flow rates. Expanding Eq. (2) into partial fractions results in the following:

7
𝑄𝑄�1 = 𝑔𝑔1 �𝐴𝐴1(𝑠𝑠 + 𝑏𝑏/2) + 𝐴𝐴2 − 𝐴𝐴1𝑏𝑏/2
(𝑠𝑠 + 𝑏𝑏/2)2 + ��𝑎𝑎𝑏𝑏 − 𝑏𝑏2/4�2 −
𝐴𝐴1𝑠𝑠�
+𝑔𝑔2 �𝐵𝐵1(𝑠𝑠 + 𝑏𝑏/2) + 𝐵𝐵2 − 𝐵𝐵1𝑏𝑏/2
(𝑠𝑠 + 𝑏𝑏/2)2 + ��𝑎𝑎𝑏𝑏 − 𝑏𝑏2/4�2 −
𝐵𝐵1𝑠𝑠 + 𝛾𝛾
�
× �ℎ3� 𝑒𝑒−𝑛𝑛𝑠𝑠𝑠𝑠∞
𝑛𝑛=0
− (𝑇𝑇 + ℎ3)𝑒𝑒−𝛾𝛾𝑠𝑠�𝑒𝑒−(𝑛𝑛+1)𝑠𝑠𝑠𝑠∞
𝑛𝑛=0
�
+𝑔𝑔2 �𝐷𝐷1𝑠𝑠 + 𝛾𝛾
+𝐷𝐷2
(𝑠𝑠 + 𝛾𝛾)2 −𝐷𝐷1(𝑠𝑠 + 𝑏𝑏/2) − 𝐷𝐷3 + 𝐷𝐷1𝑏𝑏/2
(𝑠𝑠 + 𝑏𝑏/2)2 + ��𝑎𝑎𝑏𝑏 − 𝑏𝑏2/4�2�
× �� 𝑒𝑒−𝑛𝑛𝑠𝑠𝑠𝑠∞
𝑛𝑛=0
− 𝑒𝑒−𝛾𝛾𝑠𝑠�𝑒𝑒−(𝑛𝑛+1)𝑠𝑠𝑠𝑠∞
𝑛𝑛=0
� (3)
where the Taylor expansion, (1 − 𝑥𝑥)−1 = ∑ 𝑥𝑥𝑛𝑛∞𝑛𝑛=0 , is used and
𝐴𝐴1 ≡ −1𝑎𝑎
, 𝐴𝐴2 ≡ 1 −𝑏𝑏𝑎𝑎
, 𝐵𝐵1 ≡𝛾𝛾 − 𝑏𝑏
𝛾𝛾(𝛾𝛾 − 𝑏𝑏) + 𝑎𝑎𝑏𝑏, 𝐵𝐵2 ≡
(𝛾𝛾 − 𝑏𝑏)𝑏𝑏 + 𝑎𝑎𝑏𝑏𝛾𝛾(𝛾𝛾 − 𝑏𝑏) + 𝑎𝑎𝑏𝑏
𝐷𝐷1 ≡𝑎𝑎𝑏𝑏 − 𝛾𝛾2 + 𝑏𝑏(2𝛾𝛾 − 𝑏𝑏)
𝐻𝐻, 𝐷𝐷2 ≡
(𝑏𝑏 − 𝛾𝛾)(𝛾𝛾2 − 2𝛾𝛾𝑏𝑏) + 𝑏𝑏(𝑎𝑎𝑏𝑏 + 𝑏𝑏𝛾𝛾 − 𝛾𝛾2) − 𝛾𝛾𝑎𝑎𝑏𝑏𝐻𝐻
𝐷𝐷3 ≡(𝑏𝑏 − 𝛾𝛾)𝑏𝑏(𝑏𝑏 − 𝑎𝑎) + 𝛾𝛾𝑎𝑎𝑏𝑏 − 𝑏𝑏(𝑎𝑎𝑏𝑏 + 𝑏𝑏𝛾𝛾 − 𝛾𝛾2)
𝐻𝐻
𝐻𝐻 ≡ (𝑏𝑏 − 𝛾𝛾)(𝑏𝑏𝛾𝛾2 − 2𝑎𝑎𝑏𝑏𝛾𝛾) − (𝑎𝑎𝑏𝑏 + 𝑏𝑏𝛾𝛾 − 𝛾𝛾2)(𝛾𝛾2 − 𝑎𝑎𝑏𝑏) + 𝛾𝛾𝑎𝑎𝑏𝑏(2𝛾𝛾 − 𝑏𝑏) (4)
Therefore, applying the inverse Laplace transform to Eq. (3) results in
𝑄𝑄1(𝑑𝑑) = 𝑔𝑔1𝐴𝐴1�𝑒𝑒−𝑏𝑏𝑏𝑏/2cos(𝜔𝜔𝑑𝑑) − 1� + 𝑔𝑔1𝐴𝐴2 − 𝐴𝐴1𝑏𝑏/2
𝜔𝜔𝑒𝑒−𝑏𝑏𝑏𝑏/2sin(𝜔𝜔𝑑𝑑)
+𝑔𝑔2(ℎ3𝐵𝐵1 − 𝐷𝐷1)�𝑒𝑒−𝑏𝑏𝑏𝑏𝑛𝑛/2cos(𝜔𝜔𝑑𝑑𝑛𝑛)𝑢𝑢(𝑑𝑑𝑛𝑛)∞
𝑛𝑛=0
− 𝑔𝑔2(ℎ3𝐵𝐵1 − 𝐷𝐷1)�𝑒𝑒−𝛾𝛾𝑏𝑏𝑛𝑛𝑢𝑢(𝑑𝑑𝑛𝑛)∞
𝑛𝑛=0
+𝑔𝑔2 �ℎ3𝐵𝐵2 − 𝐵𝐵1𝑏𝑏/2
𝜔𝜔+𝐷𝐷3 + 𝐷𝐷1𝑏𝑏/2
𝜔𝜔��𝑒𝑒−𝑏𝑏𝑏𝑏𝑛𝑛/2sin(𝜔𝜔𝑑𝑑𝑛𝑛)𝑢𝑢(𝑑𝑑𝑛𝑛)
∞
𝑛𝑛=0
−𝑔𝑔2𝑒𝑒−𝛾𝛾𝑏𝑏[(𝑇𝑇 + ℎ3)𝐵𝐵1 − 𝐷𝐷1]�𝑒𝑒−𝑏𝑏𝑏𝑏𝑛𝑛+1/2∞
𝑛𝑛=0
cos(𝜔𝜔𝑑𝑑𝑛𝑛+1)𝑢𝑢(𝑑𝑑𝑛𝑛+1)
−𝑔𝑔2𝑒𝑒−𝛾𝛾𝑏𝑏 �(𝑇𝑇 + ℎ3)𝐵𝐵2 − 𝐵𝐵1𝑏𝑏/2
𝜔𝜔+𝐷𝐷3 + 𝐷𝐷1𝑏𝑏/2
𝜔𝜔��𝑒𝑒−
𝑏𝑏𝑡𝑡𝑛𝑛+12
∞
𝑛𝑛=0
sin(𝜔𝜔𝑑𝑑𝑛𝑛+1)𝑢𝑢(𝑑𝑑𝑛𝑛+1)
8
+𝑔𝑔2𝑒𝑒−𝛾𝛾𝑏𝑏[(𝑇𝑇 + ℎ3)𝐵𝐵1 − 𝐷𝐷1]�𝑒𝑒−𝛾𝛾𝑏𝑏𝑛𝑛+1∞
𝑛𝑛=0
𝑢𝑢(𝑑𝑑𝑛𝑛+1)
+𝑔𝑔2𝐷𝐷2� 𝑑𝑑𝑛𝑛𝑒𝑒−𝛾𝛾𝑏𝑏𝑛𝑛∞
𝑛𝑛=0
𝑢𝑢(𝑑𝑑𝑛𝑛) − 𝑔𝑔2𝐷𝐷2𝑒𝑒−𝛾𝛾𝑠𝑠� 𝑑𝑑𝑛𝑛+1𝑒𝑒−𝛾𝛾𝑏𝑏𝑛𝑛+1∞
𝑛𝑛=0
𝑢𝑢(𝑑𝑑𝑛𝑛+1) (5)
where 𝑢𝑢[𝑥𝑥] is the step function, 𝜔𝜔 ≡ �𝑎𝑎𝑏𝑏 − 𝑏𝑏2/4, and 𝑑𝑑𝑛𝑛 ≡ 𝑑𝑑 − 𝑛𝑛𝑇𝑇.
Results
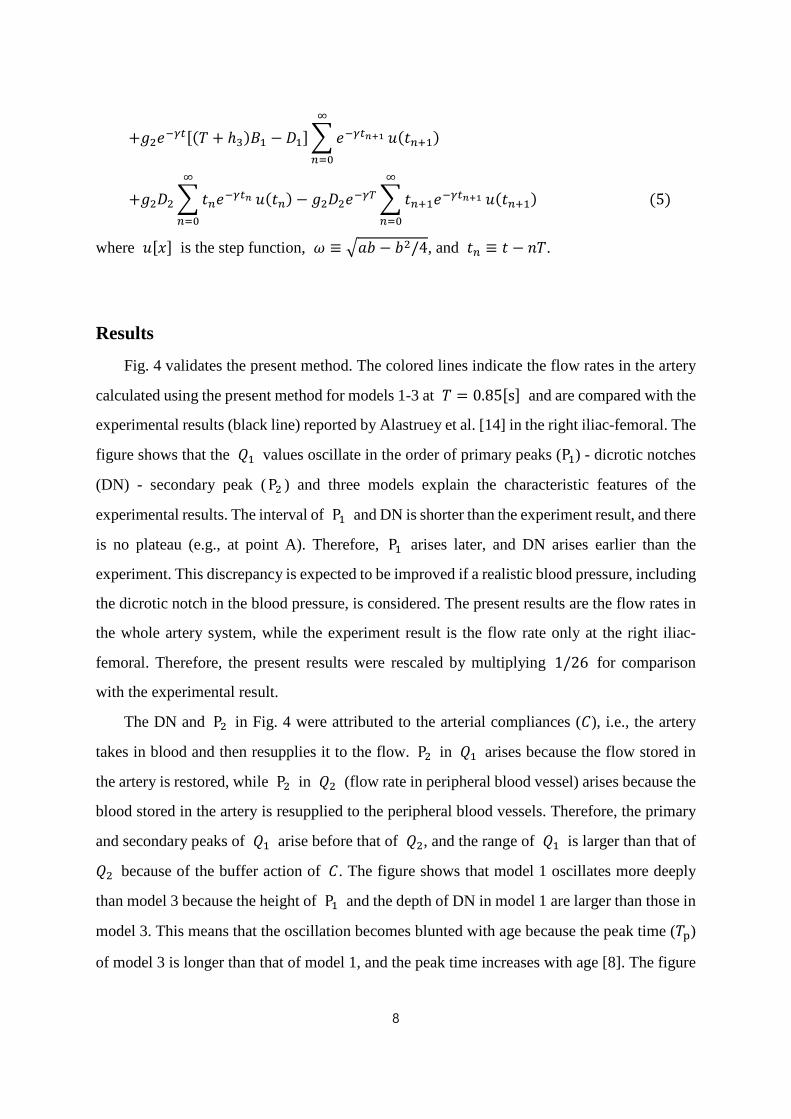
Fig. 4 validates the present method. The colored lines indicate the flow rates in the artery
calculated using the present method for models 1-3 at 𝑇𝑇 = 0.85[s] and are compared with the
experimental results (black line) reported by Alastruey et al. [14] in the right iliac-femoral. The
figure shows that the 𝑄𝑄1 values oscillate in the order of primary peaks (P1) - dicrotic notches
(DN) - secondary peak ( P2 ) and three models explain the characteristic features of the
experimental results. The interval of P1 and DN is shorter than the experiment result, and there
is no plateau (e.g., at point A). Therefore, P1 arises later, and DN arises earlier than the
experiment. This discrepancy is expected to be improved if a realistic blood pressure, including
the dicrotic notch in the blood pressure, is considered. The present results are the flow rates in
the whole artery system, while the experiment result is the flow rate only at the right iliac-
femoral. Therefore, the present results were rescaled by multiplying 1/26 for comparison
with the experimental result.
The DN and P2 in Fig. 4 were attributed to the arterial compliances (𝐶𝐶), i.e., the artery
takes in blood and then resupplies it to the flow. P2 in 𝑄𝑄1 arises because the flow stored in
the artery is restored, while P2 in 𝑄𝑄2 (flow rate in peripheral blood vessel) arises because the
blood stored in the artery is resupplied to the peripheral blood vessels. Therefore, the primary
and secondary peaks of 𝑄𝑄1 arise before that of 𝑄𝑄2, and the range of 𝑄𝑄1 is larger than that of
𝑄𝑄2 because of the buffer action of 𝐶𝐶. The figure shows that model 1 oscillates more deeply
than model 3 because the height of P1 and the depth of DN in model 1 are larger than those in
model 3. This means that the oscillation becomes blunted with age because the peak time (𝑇𝑇p)
of model 3 is longer than that of model 1, and the peak time increases with age [8]. The figure

9
also shows that the risk of hypertension increases with age because the peak of 𝑄𝑄1 decreases
with age. Therefore, the systolic blood pressure increases to supply more blood to the vessel.
Fig. 4 Flow rates in an artery. The colored lines indicate the flow rates in an artery calculated
using the present method for models 1-3 at 𝑇𝑇 = 0.85 [s] . The black line indicates the
experimental result reported by Alastruey et al. [14] for the flow rate in the right iliac-femoral.
Figure 5 shows that the depth of DN and the height of P1 in 𝑄𝑄1 for the model 2 at 𝑇𝑇 =
0.85 [s] decrease as 𝐶𝐶 decreases, while P2 is nearly independent of 𝐶𝐶. This occurs because
less blood is stored in the artery as 𝐶𝐶 decreases. In Eq. (4), 𝛾𝛾 − 𝑏𝑏 = 𝛾𝛾 − 1/𝑅𝑅𝐶𝐶 decreases and
𝜔𝜔 increases as 𝐶𝐶 decreases. Therefore, the height of the primary peak decreases and P2
moves into the left primary peak as 𝐶𝐶 decreases because the terms cos [𝜔𝜔(⋯ )] and
sin [𝜔𝜔(⋯ )] in Eq. (5) oscillate more quickly as 𝐶𝐶 decreases. This means that people with a
small 𝐶𝐶 should refrain from intense exercise because sufficient blood cannot be supplied to
the blood vessels, and they have a risk of hypertension.

10
Fig. 5 Flow rates in an artery of model 2 for various arterial compliances.
Fig. 6 Flow rates in an artery of model 2 for various blood inertances.

11
Figure 6 shows that the height of P1 in 𝑄𝑄1 for model 2 at 𝑇𝑇 = 0.85 [s] decreases with
increasing 𝐿𝐿 , and the fluctuations increase. This is because the blood inertance tends to
maintain the flow rate; thus, less blood is supplied to the artery as the blood inertance increases.
Therefore, people with a large 𝐿𝐿 have a risk of hypertension because their lung should
increase the systolic pressure to supply sufficient blood to the vessels. The height of P2
decreases with increasing 𝐿𝐿 because the drop in blood pressure increases with increasing 𝐿𝐿
according to Faraday’s law. The reason why P2 moves into the left primary peak as 𝐿𝐿
decreases is the same as that in Fig. 5. Figure 7 shows that the flow rates for model 2 decrease
with increasing peripheral resistance. Therefore, an increase in peripheral resistance may cause
hypertension because the lung should increase the systolic pressure to supply sufficient blood
to the vessels.
Fig. 7 Flow rates in an artery of model 2 for various peripheral resistances.
Figures 5 and 6 show that the flow rate decreases with decreasing compliance (𝐶𝐶), whereas
it decreases with increasing blood inertance (𝐿𝐿). This means that the flow rate is determined by
𝐶𝐶 and 𝐿𝐿 in a complicated manner. To investigate this further, the flow rates for model 3 were
12
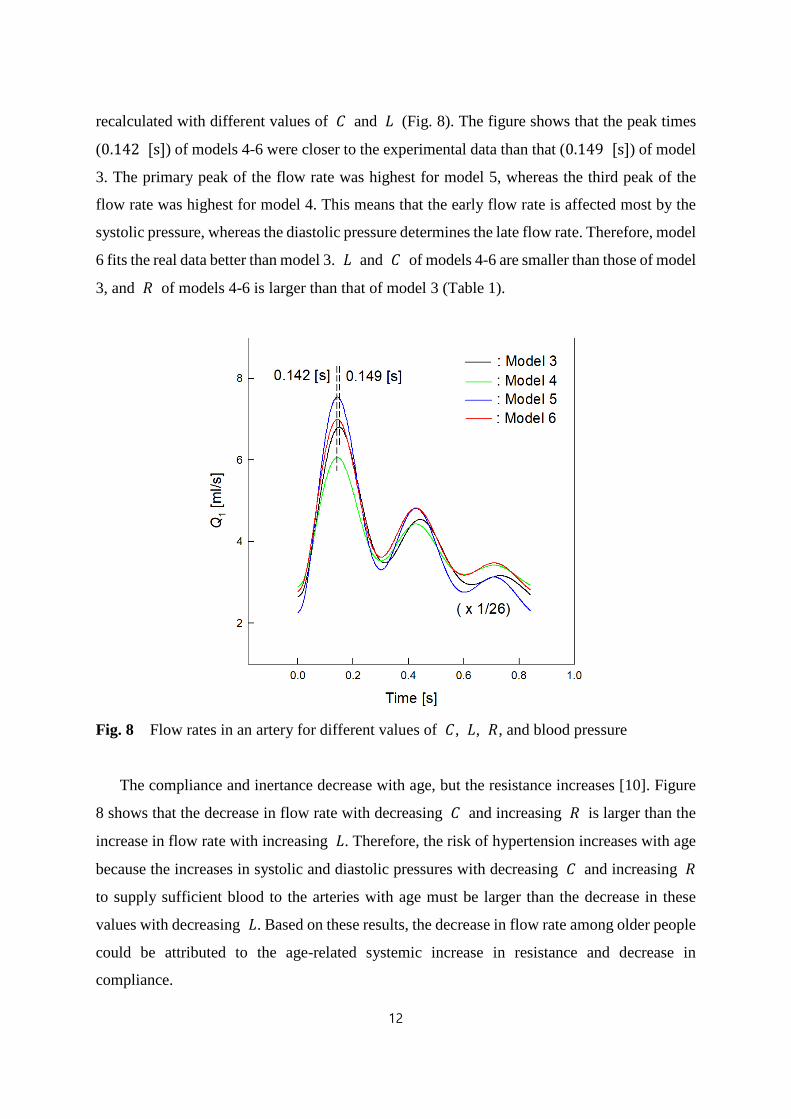
recalculated with different values of 𝐶𝐶 and 𝐿𝐿 (Fig. 8). The figure shows that the peak times
(0.142 [s]) of models 4-6 were closer to the experimental data than that (0.149 [s]) of model
3. The primary peak of the flow rate was highest for model 5, whereas the third peak of the
flow rate was highest for model 4. This means that the early flow rate is affected most by the
systolic pressure, whereas the diastolic pressure determines the late flow rate. Therefore, model
6 fits the real data better than model 3. 𝐿𝐿 and 𝐶𝐶 of models 4-6 are smaller than those of model
3, and 𝑅𝑅 of models 4-6 is larger than that of model 3 (Table 1).
Fig. 8 Flow rates in an artery for different values of 𝐶𝐶, 𝐿𝐿, 𝑅𝑅, and blood pressure
The compliance and inertance decrease with age, but the resistance increases [10]. Figure
8 shows that the decrease in flow rate with decreasing 𝐶𝐶 and increasing 𝑅𝑅 is larger than the
increase in flow rate with increasing 𝐿𝐿. Therefore, the risk of hypertension increases with age
because the increases in systolic and diastolic pressures with decreasing 𝐶𝐶 and increasing 𝑅𝑅
to supply sufficient blood to the arteries with age must be larger than the decrease in these
values with decreasing 𝐿𝐿. Based on these results, the decrease in flow rate among older people
could be attributed to the age-related systemic increase in resistance and decrease in
compliance.

13
Discussion
An exact solution for the modified Windkessel model was derived using the Laplace
transform method and considering various types of blood pressure. The age - and
cardiovascular - parameter dependences of hypertension were examined using three kinds of
blood pressures (models 1-3) distinguished by the peak time in the artery. The effects of the
arterial compliance (𝐶𝐶), blood inertance (𝐿𝐿), and peripheral resistance (𝑅𝑅) on the flow rate in
the artery were also investigated. The results explained that the artery takes up blood in the
systolic stage and resupplies it to the flow in the diastolic stage. The height of the primary peak
(P1) and the depth of the dicrotic notche (DN) in the flow rate decrease with increasing peak
time. The height of P1 and the depth of DN decrease with increasing 𝐿𝐿 and 𝑅𝑅 but decrease
with decreasing 𝐶𝐶.
In general, with age, the stiffness of the artery wall increases, the viscosity increases, and
the radius of the artery wall decreases [8]. The arterial compliance decreases with increasing
stiffness of the artery. The peripheral resistance increases with increasing viscosity, and the
blood inertance decreases with decreasing radius of the artery wall. As a result, with age, the
arterial compliance and blood inertance decrease, and the peripheral resistance increases. This
paper explains why the risk of hypertension increases with age because, despite the decrease
in blood inertance with age, the decrease in flow rate with increasing peripheral resistance and
decreasing compliance is larger than the increase in flow rate with decreasing blood inertance.
Therefore, the blood pressure increases with age to supply more blood to the artery. During
exercise, the heart beats more frequently, and the pressure of the heart increases to supply more
blood to the blood vessels in a short time because exercise shortens the period between
heartbeats. This study showed that a person with a small 𝐶𝐶, large 𝐿𝐿, and large 𝑅𝑅 should limit
intense exercise because they cannot supply sufficient blood to the blood vessels.
Conclusion
In conclusion, the present method can be applied to determining the age-dependent vascular
state, and some useful information about the blood circulation in the cardiovascular system can
be obtained from this method. The method can also be used to indicate the cardiovascular risk
because the resistance, compliance, and inertance vary with aging, hypertension, diabetes, and
other factors. The present method can be improved by considering a more accurate form for

14
blood pressure, including the DN in blood pressure, and can be applied to the four-element
Windkessel model, including the wave transmission phenomena [3, 4]. All these studies will
be performed in the near future.
References
1. Frank, O., 1899, “Die Grundform des arterielen Pulses erste Abhandlung: mathematische
Analyse,” Z. Biol., 37, pp. 483–526.
2. Stergiopulos, N., Meister, J. J., and Westerhof, N., 1995, “Evaluation of methods for the
estimation of total arterial compliance,” Am. J. Physiol., 268 (Heart Circ Physiol 37), pp.
H1540-H1548.
3. Burattini, R., and Gnudi, G., 1982, “Computer identification of models for the arterial
tree input impedance: comparison between two new simple models and first experimental
results,” Med. Biol. Eng. Comput., 20, pp. 134-144.
4. Stergiopulos, N., Westerhof, B. E., and Westerhof, N., 1999, “Total arterial inertance as
the fourth element of the windkessel model,” Am. J. Physiol., 276 (Heart Circ Physiol 45),
pp. H81-H88.
5. Segers, P., Rietzsxhel, E. R., De Buyzere, M. L., Stergiopulos, N., Westerhof, N., Van
Bortel, L. M., Gillebert, T., and Verdonck, P. R., 2008, “Three- and four-element
Windkessel models: assessment of their fitting performance in a large cohort of healthy
middle-aged individuals,” Proc. IMchE, 222, pp. 417-428.
6. Westerhof, N., Lankhaar, J. W., and Westerhof, B. E., 2009, “The arterial Windkessel,”
Med. Biol. Eng. Comput., 47, pp. 131–141.
7. Qiao, Y., Fan, J., Ding, Y., Zhu, T, and Luo, K., 2019, “A primary computational fluid
dynamics study of pre- and post-TEVAR with intentional left subclavian artery coverage
in a type B aortic dissection”, J. Biomech. Eng., 141, pp. 111002.
8. Zahedi, E., Chellappan, K., Ali, M. A. M., 2007, “Singh, H. Analysis of the Effect of
Ageing on Rising Edge Characteristics of the Photoplethysmogram using a Modified
Windkessel Model,” Cardiovasc. Eng., 7, pp. 172-181.
9. Shirouzu, S., Shirouzu, E., Tsuda, Y., and Sugano, H., 1998, “Circulatory parameter
extraction from digital plethysmogram I: waveform analysis of digital plethysmogram,”

15
Proceedings of the 20th annual international conference of the IEEE Engineering in
medicine and biology society, 20, pp. 3087–3089.
10. Allen, J., and Murray, A., 2003, “Age-related changes in the characteristics of the
photoplethysmographic pulse shape at various body sites,” Physiol. Meas., 24, pp. 297–
307.
11. Guan, D., Liang, F., and Gremaud, P. A., 2016, “Comparison of the Windkessel model
and structured-tree model applied to prescribe out flow boundary conditions for a one-
dimensional arterial tree model,” J. Biomec., 49, pp. 1583–1592.
12. Benetos, A., Safar, M., Rudnichi, A., Smulyan, H., Richard, J. L., Ducimetieere, P.,
and Guize, L., 1997, “Pulse pressure: a predictor of long-term catdiovascular mortality in
a French male population,” Hypertension, 30, pp. 1410-1415.
13. Mitchell, G. F., Moye, L. A., Braunwald, E., Rouleau, J. L., Bernstein, V., Geltman, E.
M., Flaker, G. C., and Pfeffer, M. A., 1997, “Sphygmomanometrically determined pulse
pressure is a powerful independent predictor of recurrent events after myocardial infarction
in patients with impaired left ventricular function SAVE investigators. Survival and
ventricular enlargement,” Circulation, 96, pp. 4254-4260.
14. Alastruey, J., Khir, A. W., Matthys, K. S., Segers, P., Sherwin, S. J., Verdonck, P. R.,
Parker, K. H., and Peir��𝑜, J., 2011, “Pulse wave propagation in a model human arterial
network: Assessment of 1-D visco-elastic simulations against in vitro measurements,” J.
Biomech., 44, pp. 2250-2258.