Relation of surface movements in West Bohemia to earthquake swarms
18
Stud. Geophys. Geod., 52 (2008), 549566 549 © 2008 Inst. Geophys. AS CR, Prague RELATION OF SURFACE MOVEMENTS IN WEST BOHEMIA TO EARTHQUAKE SWARMS J. MRLINA AND M. SEIDL Institute of Geophysics, Acad. Sci. Czech Republic, Boční II/1401, 141 31 Praha 4, Czech Republic ([email protected], [email protected]) Received: February 19, 2008; Revised: July 15, 2008; Accepted: August 22, 2008 ABSTRACT GPS observations in the Western Bohemia/Vogtland earthquake swarm region revealed indications of horizontal displacements of low amplitude, and no clear long-term trend in 19932007. On the other hand, in 19982001 there was relatively significant active movement along NNE-SSW oriented line that we called the “Cheb-Kraslice GPS Boundary” (ChKB), identical with an important limitation of earthquake activity. The most impressive were dextral (right-lateral) movements in the 19981999 period followed by reverse sinistral (left-lateral) movements in 19992000 that correlate with prevailing motion defined by fault plane solutions of the Autumn 2000 earthquake swarm. Before the February 2004 micro-swarm, two points located on opposite sides of the Mariánské Lázně fault showed extension in the order of about 7 mm in the same NNE-SSW direction of ChKB. The new NOKO permanent GPS station in Nový Kostel showed the peak-to-peak vertical changes up to 10 mm before and during the February 2007 micro-swarm. Annual precise levelling campaigns in the local network around Nový Kostel revealed regular vertical displacements during the 1994, 1997 and 2000 earthquake swarms. The points around the Nový Kostel seismological station showed uplift during the active periods, including the micro-swarm February 2004. However, no such indication was observed on levelling points in the period of the February 2007 swarm. Long-term vertical displacements depend on the same direction NNE-SSW (ChKB) as the GPS displacements. Both geodetic techniques have revealed oscillating displacements, GPS horizontal, and levelling vertical, rather than any long-term trends in the study period 19932007. The displacements exhibited significant spatial and temporal relation to tectonic activity (earthquake swarms) including their coincidence with the seismologically determined sense of motion along the fault plane during earthquakes. Key words: geodynamics, GPS displacements, precise levelling, surface kinematics, West Bohemia 1. INTRODUCTION Geodetic observations represent one of the most important tools for the investigations of the dynamics of the Earth crust and its deformation. They are widely applied in many projects throughout the world where significant displacements occur.
-
Upload
independent -
Category
Documents
-
view
1 -
download
0
Transcript of Relation of surface movements in West Bohemia to earthquake swarms

Stud. Geophys. Geod., 52 (2008), 549566 549 © 2008 Inst. Geophys. AS CR, Prague
RELATION OF SURFACE MOVEMENTS IN WEST BOHEMIA TO EARTHQUAKE SWARMS
J. MRLINA AND M. SEIDL
Institute of Geophysics, Acad. Sci. Czech Republic, Boční II/1401, 141 31 Praha 4, Czech Republic ([email protected], [email protected])
Received: February 19, 2008; Revised: July 15, 2008; Accepted: August 22, 2008
ABSTRACT
GPS observations in the Western Bohemia/Vogtland earthquake swarm region revealed indications of horizontal displacements of low amplitude, and no clear long-term trend in 19932007. On the other hand, in 19982001 there was relatively significant active movement along NNE-SSW oriented line that we called the “Cheb-Kraslice GPS Boundary” (ChKB), identical with an important limitation of earthquake activity. The most impressive were dextral (right-lateral) movements in the 19981999 period followed by reverse sinistral (left-lateral) movements in 19992000 that correlate with prevailing motion defined by fault plane solutions of the Autumn 2000 earthquake swarm. Before the February 2004 micro-swarm, two points located on opposite sides of the Mariánské Lázně fault showed extension in the order of about 7 mm in the same NNE-SSW direction of ChKB. The new NOKO permanent GPS station in Nový Kostel showed the peak-to-peak vertical changes up to 10 mm before and during the February 2007 micro-swarm.
Annual precise levelling campaigns in the local network around Nový Kostel revealed regular vertical displacements during the 1994, 1997 and 2000 earthquake swarms. The points around the Nový Kostel seismological station showed uplift during the active periods, including the micro-swarm February 2004. However, no such indication was observed on levelling points in the period of the February 2007 swarm. Long-term vertical displacements depend on the same direction NNE-SSW (ChKB) as the GPS displacements. Both geodetic techniques have revealed oscillating displacements, GPS horizontal, and levelling vertical, rather than any long-term trends in the study period 19932007. The displacements exhibited significant spatial and temporal relation to tectonic activity (earthquake swarms) including their coincidence with the seismologically determined sense of motion along the fault plane during earthquakes.
Ke y wo rd s : geodynamics, GPS displacements, precise levelling, surface
kinematics, West Bohemia
1. INTRODUCTION
Geodetic observations represent one of the most important tools for the investigations of the dynamics of the Earth crust and its deformation. They are widely applied in many projects throughout the world where significant displacements occur.

J. Mrlina and M. Seidl
550 Stud. Geophys. Geod., 52 (2008)
Historical geodetic measurements by classic techniques (triangulation) applied in West Bohemia before 1990s did not prove enough accuracy for geodynamic investigations, while precise levelling indicated a remarkable fact that contrary to previous uplift of the Krušné hory Mts. in the Quaternary geological time scale, the area is rather showing slow subsidence during the last decades (Vyskočil and Zeman, 1979).
In our case, practically no displacements were expected with respect to small earthquake magnitudes, up to M = 3.2 in 2000 (Fischer and Horálek, 2003). However, there are many other indicators of geodynamic activity in the region, like extensive fluids emissions (CO2, He3/He4) documented e.g. by Bräuer et al. (2003), groundwater variations, the presence of young Quaternary volcanoes with evidence of explosive activity, recently studied by Mrlina et al. (2007). As well, mantle-crustal upwelling was identified by Plomerová et al. (2007). However, even before these results were available, we decided to establish GPS and precise levelling networks in the West Bohemia seismoactive region. As well, we started some other observations at that time, as groundwater level monitoring and repeated measurements of gravity (Mrlina et al., 2003) that showed notable correlation with earthquake activity. Recently, we have established also tiltmeters recording in an underground observatory (Boušková et al., unpublished results) in order to contribute to the surface kinematics studies.
2. GPS OBSERVATIONS AND PROCESSING
This chapter deals with the GPS data observation and processing procedures, as well as with the results from 15 years (19932007) of GPS campaign-style observations in the geodynamic network Cheb in the seismoactive region of West Bohemia.
2 . 1 . G P S N e t w o r k
This local GPS network consists of 26 points with its centre located in the main epicentral area around the village of Nový Kostel. The longest baselines are up to 40 km. All network points are established by 5 m vertical steel pipe (1.5 m above the ground) fixed and filled with concrete. The points provide compulsory centring of GPS antennas. The network design, the establishment and the starting campaigns were described by Špičák et al. (1997). During these 15 years there were several important milestones. Probably the most important change was the replacement of the old Trimble 4000 series receivers with Trimble Compact and Trimble Geodetic antennas by the new Trimble 5700 series receivers with Trimble Zephyr and Trimble Zephyr Geodetic antennas. This happened in 2002 and obviously brought improvement in data accuracy expressed in standard error of unit weight of network adjustment.
The whole network of 26 points (18 points of inner network, 5 points of outer network, see Fig. 1a), is measured once a year in September. It is performed successively with five GPS receivers in a five-days-long main campaign under a constant plan of receivers/antennas rotation on particular points. The methodology was aimed at suppression of the antenna centre effects by observations with at least 2 different GPS sets at each point during one campaign and in different satellite geometry, it means not 1 GPS set at 1 point only. This procedure was used in order to fix this problem in case the subcontracted equipment would not be identical. In 2002 we purchased own equipment,

Relation of Surface Movements in West Bohemia to Earthquake Swarms
Stud. Geophys. Geod., 52 (2008) 551
but kept the system of receivers rotation (using always the same observation plan and GPS sets onwards). This procedure seemed to be satisfactory as there were no significant steps/shifts observed between 20012002 when the new equipment was employed.
Eventually, in order to get more precise and detailed information about horizontal displacements, four selected points in the central part of the network have been measured irregularly (four times) throughout whole year since 2003 (points 36). We perform 24 hrs simultaneous recording during these “micro-campaigns”.
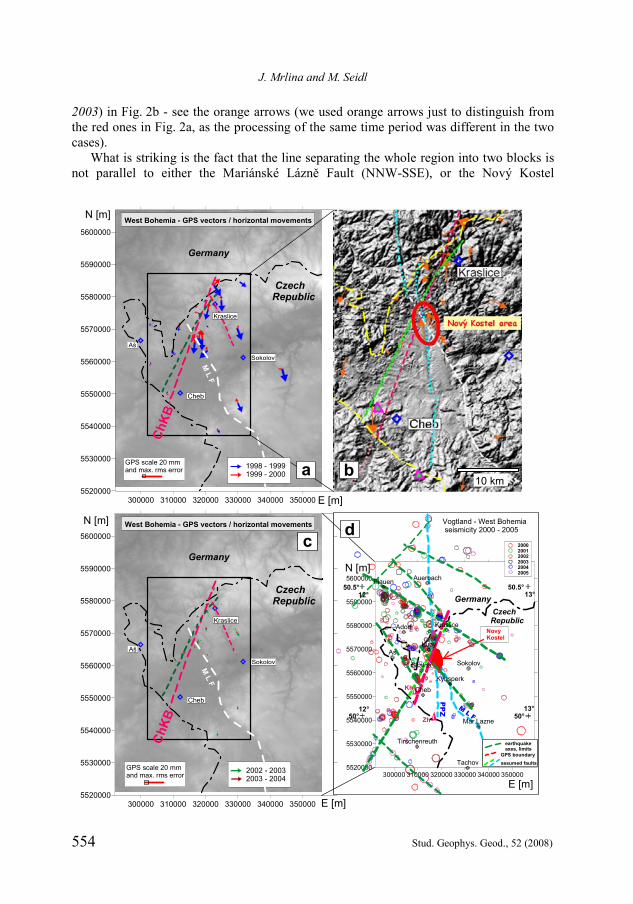
Fig. 1. Location of the study region in West Bohemia. a) - dots schematically represent the GPS observation points. Grid co-ordinates in WGS84/UTM33N datum, in the detail figure (top-left) also Latitude-Longitude is given. b) - GPS displacements vectors with 95% confidence ellipses for the two most active periods of 19981999 and 19992000, respectively. GPS solution was based on fixing the points in the western part of the area. Change of relative movement direction from dextral to sinistral (right-leteral to left-lateral) is clear from the vectors in the eastern part of the area. Schematic division line of different displacements - dashed line NNE-SSW.

J. Mrlina and M. Seidl
552 Stud. Geophys. Geod., 52 (2008)
In August 2006 a permanent GPS station (NOKO) was established in Nový Kostel, on top of a stand-by chimney of a house. Later we also installed a snow cover over the antenna. There is no evident disturbing source around the antenna to cause reflections or multipath effects. The data are recorded at internal receiver memory card.
2 . 2 . G P S D a t a P r o c e s s i n g
The Trimble Total Control (TTC) software was tested for various processing settings to obtain the best possible results. It turned out that using precise orbits and ionosphere data provides the best solutions. The Goad & Goodman fixed tropospheric model and the Trimble default antenna relative phase centre tables were used as an option in TTC processing settings. It has to be stressed that for geodynamic evaluation we focused mainly on the horizontal components of the co-ordinates, without ambitions to achieve very high resolution in height. Once the final work flow was determined all data was recomputed. The new TTC results were compared against the original results from the Bernese GPS software for the period 19942000. Good agreement between the two procedures justified using TTC for processing the data (Seidl, 2006). Also, e.g. Even-Tzur et al. (2004) reported obtaining equivalent results from TTC and Bernese processing of medium-size geodynamic network data. The micro-campaigns are processed in the same way with the difference of using the L1 GPS signal frequency instead of the Lc ionosphere free GPS signal combination to fix the ambiguities (number of waves of signal from satellite to receiver).
Network analysis consists of two steps. Firstly, baseline vectors of each campaign are exported from TTC with their covariance matrixes and they are adjusted as 3D local network in the GNU GaMa software (www.gnu.org/software/gama) to get final coordinates of points and a full covariance matrix. The network is adjusted as free network. Subsequently coordinates of points and covariance matrices from adjustment of each campaign are used to compare the campaigns by 3D transformation with scale set to one. All points of the network were used to compute transformation parameters. The other option used was fixing the GPS points in the western part of the area in order to enhance relative displacements in the eastern part. In case there are obvious outliers at some points these points are excluded from recalculation of transformation key. The final differences in geocentric coordinates X, Y, Z are transformed with their covariance into local system North, East, Up to plot the horizontal vector graphs with their 95% confidence ellipses of errors. The standard error of coordinate differences is estimated by application of the error propagation law to get at least approximate information about data accuracy.
The values of these standard errors are better than 3 mm in the worst case, while less than 2 mm in most cases in solution for main campaigns. In micro campaigns the standard errors of coordinate differences are better than 1.5 mm. Expressed in 95% horizontal confidence ellipses of errors we get values of semimajor axes around 5 mm for main campaigns and 3 mm for micro campaigns. In the tectonically active periods the final displacement vectors exceeded more than three times the value of semimajor axes of 95% error ellipses . For example, in 19981999 the average displacement vectors length was 13 mm, while in 20062007 only 3 mm, see Table 1. In the quiet periods the length of vectors stayed within the range of measurement errors.

Relation of Surface Movements in West Bohemia to Earthquake Swarms
Stud. Geophys. Geod., 52 (2008) 553
In order to demonstrate the level of confidence of the data, we present the horizontal displacement vectors of the most active periods 19981999 and 19992000 with 95% confidence ellipses of errors in Fig. 1b. The GPS network solutions based on fixing points at the western part of the area were used. The relative reversible displacements are clearly indicated in the eastern block.
The coordinates of the permanent station NOKO were computed directly in TTC as raw daily and subsequently weekly solutions. The processing setting of the software was identical to the main GPS campaign. No detailed analysis has been performed yet to study possible influence of systematic error sources such as type of monument, snow cover, multipath effect, troposphere etc. The station was separately connected to the nearest permanent station of the CZEPOS network (CKVA - Karlovy Vary) and to the POUS and MARJ stations of the EUREF network. The coordinates of these points were fixed during processing. The total vector length was evaluated for each of the three baselines, as well as for height.
2 . 3 . O b s e r v e d H o r i z o n t a l D i s p l a c e m e n t s
The achieved accuracy enabled to conclude, that no long-term continuous horizontal displacement trend (such as a few millimetres per year) exists in the region within the period of 15 years of observation. On the other hand, reversible movements were indicated in the most seismically active periods.
A n n u a l G P S C a m p a i g n s
Relatively significant reversible horizontal displacements were determined from GPS data in the period 19982000 (presented by Mrlina et al., 2003). Considering the data accuracy mentioned above, it was evident that the displacements in this period could be realistic, contrary to the previous and latter campaigns (compare Figs. 2a and 2c, and Table 1).
Now, after testing more processing procedures, we show different version of the same displacement image, based on fixing the GPS positions at points in the western part of the region. In Fig. 1b two periods are presented in detail for the inner part of the network (points 118), separately for each annual period. In Fig. 2a both blue and red arrows of the whole network demonstrate clearly the change of the displacement sense, forward to reverse (to S in 1999, to N in 2000 in the eastern block). This orientation of GPS vectors corresponds with the strike-slip component of the fault plane solutions of the local seismological events not only of the principal autumn 2000 earthquake swarm, but generally with earthquakes long term character (Fischer, 2003; Havíř, 2005). For comparison, we present vectors 19992000 in the original processing style (Mrlina et. al.,
Table 1. Overview of average length of displacement vectors in particular annual periods. The active movement period 1996–2000 is evidently expressed by average vectors up to 13 mm, while since 2001 the average is only about 3–5 mm. No measurements in 1997.
Period 94 9495 9596 97 9698 9899 9900 Displacement n.a. 5.29 5.54 n.a. 9.23 13.23 7.82 Period 0001 0102 0203 0304 0405 0506 0607 Displacement 5.58 4.49 4.77 2.82 5.12 2.91 2.74
J. Mrlina and M. Seidl
554 Stud. Geophys. Geod., 52 (2008)
2003) in Fig. 2b - see the orange arrows (we used orange arrows just to distinguish from the red ones in Fig. 2a, as the processing of the same time period was different in the two cases).
What is striking is the fact that the line separating the whole region into two blocks is not parallel to either the Mariánské Lázně Fault (NNW-SSE), or the Nový Kostel
300000 310000 320000 330000 340000 3500005520000
5530000
5540000
5550000
5560000
5570000
5580000
5590000
5600000
Cheb
Aš
Sokolov
GPS scale 20 mmand max. rms error
Germany
CzechRepublic
M L F
West Bohemia - GPS vectors / horizontal movements
Kraslice
ChKB
300000 310000 320000 330000 340000 3500005520000
5530000
5540000
5550000
5560000
5570000
5580000
5590000
5600000
Cheb
Aš
Sokolov
Germany
CzechRepublic
M L F
West Bohemia - GPS vectors / horizontal movements
Kraslice
ChKB
2002 - 20032003 - 2004
GPS scale 20 mmand max. rms error 300000 310000 320000 330000 340000 350000
5520000
5530000
5540000
5550000
5560000
5570000
5580000
5590000
5600000
Germany CzechRepublic
M L F
GPS boundaryassumed faults
NovyKostel
earthquake axes, limits
Vogtland - West Bohemia seismicity 2000 - 2005
200020012002200320042005
PP
Z
Kh
Zh
50.5° 50.5°13°12°
50°12° 13°
50°
Luby
Kraslice
SokolovAs
Cheb
Tachov
Kynsperk
Mar.Lazne
Skalna
Tirschenreuth
Adorf
AuerbachPlauen
1998 - 19991999 - 2000 a b
dc
10 km
N [m]
N [m]
E [m]
E [m]
E [m]
N [m]

Relation of Surface Movements in West Bohemia to Earthquake Swarms
Stud. Geophys. Geod., 52 (2008) 555
principal focal zone (N-S, 170). We called this new element the “Cheb-Kraslice GPS boundary“ (ChKB). It is presented in Fig. 2 as a violet dashed line of the NNE-SSW (20) orientation. We do not consider this boundary directly a fault, rather a line separating areas showing opposite sense of horizontal surface displacements. However, we can find indications of fault-like features in topography, at least locally, e.g. SW of Cheb and SW of Kraslice. As the whole region is probably composed of high number of larger and smaller blocks due to extensive tectonic/earthquake activity, we expect that ChKB represents a zone of faults and fractures that may locally have different directions. As example, if looking into the Nový Kostel focal area, the GPS vectors are oriented parallel to N-S trending focal zone in 2000, see the red vectors in Fig. 2a, and the orange vectors in Fig. 2b.
Another striking feature we found when we decided to investigate the relation between the horizontal displacements along ChKB and the earthquakes general distribution. We printed all events with magnitude M > 1 since the beginning of the active year 2000 (data from the Institute of Geophysics, Prague, http://www.ig.cas.cz/en/structure/observatories /west-bohemia-seismic-network-webnet). We attempted to divide the region into a set of “blocks” based on delineating the limits of the most seismically active areas, as well as on linear accumulations of earthquakes, see the dark green dashed lines in Fig. 2d. It turned out that the principal earthquake (EQ) limitation (division line of different character of seismicity in the western and eastern areas) is practically identical with ChKB. On this line there is a dramatic change in seismicity as follows:
to W of ChKB, there is obviously a semi-regular distribution of EQ with certain more dense accumulations along principal directions NW-SE and NE-SW, and with only limited areas without seismic activity, while
to E of ChKB, the EQ are concentrated to very few small areas, first of all the earthquake activity propagation over the ChKB to SSE in the Nový Kostel zone (documented also by Fischer and Michálek, 2008) and partly in the Skalná zone, too; however, the Nový Kostel focal area itself represents 85% of seismic events as well as energy of all earthquakes in the whole West Bohemia/Vogtland region.
Fig. 2. (Facing page) Results of GPS observations in the most active period 1998–2000 (coordinates in WGS84/UTM33, 10 10 km grid): a) Various processing procedures can enhance some features - in this case the GPS points on the western side of the network were fixed in order to strengthen relative displacement vectors in the Nový Kostel focal area. A “GPS boundary” ChKB 1520 NNE-SSW (pink line) is almost identical with an assumed fault evident in topography (green line) between Kraslice and Cheb. The other red line NNW-SSE is simplified trend of the Horní Slavkov fault parallel to MLF. b) Main epicentral area Nový Kostel is located on a tectonic junction near Nový Kostel. N-S trending Počátky-Plesná fault zone (Bankwitz et al., 2003) (kyan line) is crossing Mariánské Lázně fault (MLF) and other faults. GPS vectors of 19992000 were processed in this case without fixing western points (orange vectors). Opposite movement trends are clearly separated by the “GPS boundary” ChKB (pink line NNE-SSW). c) For comparison the GPS vectors of 20032004 period exhibit very small (practically invisible) displacements at the data accuracy level. d) The seismicity pattern is presented in a larger frame in order to better characterise seismicity axes and limits. Quaternary volcanoes - red triangles near Cheb: Kh - Komorní hůrka, Zh - Železná hůrka.

J. Mrlina and M. Seidl
556 Stud. Geophys. Geod., 52 (2008)
In other words, the Adorf block (West) with the wide-spread but limited activity is separated by ChKB from the Sokolov - Cheb blocks with very high activity (but concentrated to a very small area close to ChKB), as well as from the Auerbach and Aš blocks, see Fig. 2d.
We wish to stress that the “blocks” described above, and in Fig. 2d, are not at this stage defined as geological/tectonic blocks s.s., but rather as geometrical areas with different character of seismicity, separated either by linear accumulations of earthquakes or just by sharp change in seismicity.
These findings document that there does exist some relation between displacements/deformation indicated by GPS and earthquakes in the seismically active periods. However, we do not have enough data to characterize exactly such relation with respect to the campaign-style of GPS measurements being performed once per annum only. Therefore, we cannot define in detail whether we observe pre-, co- or post-seismic deformation.
M i c r o - C a m p a i g n s n e a r N o v ý K o s t e l
For the reasons of more detailed study, we have started performing four GPS ‘micro-campaigns’ per annum on four selected points nearby Nový Kostel since 2003 (Fig. 3). We detected one significant indication of displacement from the solution of the 06/200309/200310/200303/2004 micro-campaigns. Similarly to 19982000, we observed forward and reverse movements, in this case of up to 7 mm (total length of the cumulative extension vectors 06/2003 to 10/2003 in blue and violet in Fig. 3, versus the red reverse vectors 10/2003 to 03/2004). They were indicated by the points 5 and 6 located on the opposite sides of the MLF (Mariánské Lázně fault) at the area of its crossing with the Nový Kostel focal zone. With respect to the fact that we do not know which fault is responsible for such movement, we cannot distinguish the ratio of extension-compression to shear components of the displacement.
Similar indication was observed during the February 2007 micro-swarm, with smaller amplitudes of GPS vectors (less than 4 mm, with estimated standard error about 2 mm). As all the other periods were quiet, the discussed displacements do not seem to be caused by seasonal effects.
P e r m a n e n t G P S S t a t i o n i n N o v ý K o s t e l
Considering the uncertainties of the time determination of the observed displacements, with respect to one year gaps between the GPS main campaigns, we decided to install a permanent station in Nový Kostel (NOKO), straight in the centre of the focal area. This idea was based on the fact that there are two permanent stations of EUREF (European Reference Frame) already in operation in the West Bohemia region (Schenk et al., 2004); POUS (Poustka) is located 13 km to SW, and MARJ (Mariánská) 36 km to NE of NOKO. As well, CKVA station of the CZEPOS network is operating in Karlovy Vary, 28 km to E of NOKO. Another two stations exist in Luby and Kynšperk, the data are not yet available. The station NOKO was established on a stand-by strong chimney of a two-floor house. The continuous operation of NOKO started in autumn 2006. In December we installed an antenna snow-cap cover in order to reduce the impact of snow and ice.

Relation of Surface Movements in West Bohemia to Earthquake Swarms
Stud. Geophys. Geod., 52 (2008) 557
Fig. 3. Results of GPS 24-hours micro-campaigns near Nový Kostel. Maximum horizontal displacement is indicated between points 5 and 6 before and after the micro-swarm February 2004 (left of GPS point 6). The orientation of displacements NNE-SSW is parallel to the Cheb-Kraslice GPS boundary (ChKB) and tangential to MLF (Mariánské Lázně fault), as well as, in smaller angle, to the Nový Kostel focal zone. We present these data on a topographic map in order to provide exact locations of the GPS points (red triangles), levelling (blue dashed) line, etc., for any further use. NOKO - permanent GPS station.
Fig 4. GPS data record of the NOKO station. Height values calculated separately relative to the three existing permanent stations in the region under study. Daily and weekly solutions are presented as points, and lines, respectively.
6
4 35
NOKO
GPS pointsaround Novy Kostel
Seismic station NKC
N
Swarm02/2004
06/2003 ? 09/200309/2003 ? 10/200310/2003 ? 03/2004
5 mm
Levelling line
Axis of focal zone
MLF
1 km1 km
6
4 35
NOKO
GPS pointsaround Novy Kostel
Seismic station NKC
N
Swarm02/2004
06/2003 ? 09/200309/2003 ? 10/200310/2003 ? 03/2004
5 mm
Levelling line
Axis of focal zone
MLF
1 km
531,960
531,970
531,980
531,990
532,000
532,010
532,020
532,030
532,040
532,050
532,060
532,070
532,080
06-2
22
06-2
36
06-2
50
06-2
64
06-2
78
06-2
92
06-3
06
06-3
20
06-3
34
06-3
48
06-3
62
07-1
1
07-2
5
07-3
9
07-5
3
07-6
7
07-8
1
07-9
5
07-1
09
07-1
23
07-1
37
07-1
51
07-1
65
07-1
79
07-1
93
ckvapousckva_wpous_wmarjmarj_w
installation of antenna cover
Nový Kostel - permanent GPS station: one-year height record[m]
[ day ]
18/07/200711/08/2006
Karlovy Vary
Poustka
Mariánská
calculated from three regional GPS stations - daily and weekly solutions
software : Trimble Total Control
New Year February 2007 micro-swarm

J. Mrlina and M. Seidl
558 Stud. Geophys. Geod., 52 (2008)
In Fig. 4 we present the daily and weekly solutions for the height component. Beside the shift related to the installation of the snow cover, the most significant movement was observed in the period of the February 2007 micro-swarm. The height calculated separately from all the three reference points exhibited some variations already in January, with almost identical curve decline before the swarm (Julian days 0712 to 0740). The minimum of height was observed right at the period of the swarm (0740 equals February 9, 2007) that was defined by Fischer and Michálek (2008) on 910 February, 2007. Immediately after the swarm, height returned back to normal level, with higher velocity compared to subsidence preceding the swarm. According to our knowledge, the swarm had 2 phases - 910 February near Nový Kostel (days 07/4041 in Fig. 4), and 1922 February near Plesná (days 07/5053), about 6 km west of NOKO, so we show this time spam by dashed rectangle. The phases of this swarm were indicated also by anomalous tilts recorded in the Geodynamic Observatory SKAL (Skalná).
It is possible that the NOKO station reflected the February 2007 swarm by gentle subsidence preceding the swarm within about 15 days, which was compensated by a fast reverse uplift right after the swarm. The amplitude can be estimated up to 10 mm. However, there may be similar indications not related to any seismic activity, as well as impacts of tropospheric delay variations, so a longer observation period is necessary to evaluate the confidence level of the data and a possible relation between such displacements and earthquakes.
3. PRECISE LEVELLING
Precise levelling was introduced right at the beginning of our non-seismological geodynamic investigations (Mrlina, 2000). Since 1994 annual campaigns have been performed in the network established in the surroundings of Nový Kostel, always in the same period of the year (JuneJuly).
3 . 1 . L e v e l l i n g N e t w o r k s
The network covers the most dynamic part of the West Bohemia seismoactive region with the total of 75 points in 2006. The maximum size of the final network area is about 5 km in the N-S, and 2.5 km in the E-W directions, respectively. The measurements are connected to a deeply stabilized reference point No. 31/Z1A1 (REF 1) of the national levelling system, and to our GPS network (GPS points Nos. 3, 4, 5, 6, 11). Details of the network establishment and results of the measurements in the period 19941999 were presented by Mrlina (2000). In 2006 the last three points were established in order to make a levelling cross-line through Nový Kostel more straight in the direction WSW-ENE.
Similar profile outside the discussed network we established in Milhostov, about 7 km to SSE from Nový Kostel. The idea was to observe possible vertical displacements on the N-S trending Počátky-Plesná tectonic zone, defined by Bankwitz et al. (2003), in the place close to the strong CO2 emissions locality Bublák. This MILHOSTOV profile is 1.8 km long, crossing the valley of the river Plesná.
Our geodetic studies were preceded by Vyskočil (1986). He analysed levelling data from the two polygons in West Bohemia: Loket - Kamenný Dvůr - Cheb - Vojtanov and

Relation of Surface Movements in West Bohemia to Earthquake Swarms
Stud. Geophys. Geod., 52 (2008) 559
Kamenný Dvůr - Krajková - Oloví (- Kraslice). The measurements were carried out in 1946/56, 1967, 1974/77 and 1982. We revised these results and added the 1992 and 1998 campaigns performed on the first polygon.
3 . 2 . D a t a A c c u r a c y
The measurements within the Nový Kostel network have been performed using Leica WILD NA 3000 and Zeiss NI 007 instruments with calibrated invar rods. The same period of June-July was selected for the campaigns in order to avoid seasonal effects. The technique of precise levelling has been applied with mean kilometric error ranging from 0.7 to 1.0 mm (average 0.8 mm). The error was evaluated according to the following formula:
20
1 12 Rm n R [mm], (1)
where nR is number of sections, is the difference between forward and backward measurements (mm) and R stands for the length of section (km).
The quality was controlled by the polygon closures with the error limit in mm 2.25 F , where F is the length of a polygon (km). All closures satisfied this condition.
The confidence of vertical displacements was tested by errors of each couple of epochs. The confidence level was set to 3.5 mm for the temporal difference of elevation (over three-times of kilometric error). However, in practice, even smaller displacements may be considered as real surface movements.
3 . 3 . R e g i o n a l S c a l e R e s u l t s
No historical repeated levelling data are available from the limited area of Nový Kostel. In a more regional scale, Vyskočil and Zeman (1979) presented a map of annual rates of vertical movements with a contact of positive and negative values close to our investigated area, see top right of Fig. 5. The velocity rates achieved even more than 1 mm/year in some places (this velocity we derived from long time-span observations of 1950s to 1990s, P. Vyskocil, personal communication). As example, the Kraslice area exhibits the highest subsidence velocity rate of 1.5 mm/y. On the contrary, the Cheb basin located among Cheb - Luby - Kynšperk (top-left of Fig. 5) indicates relative stability. The nearby area around Krajková (located already in the basement of the Krušné hory Mts.) shows even relative uplift. This could be considered as evidence of the mantle-crustal dynamics reflecting magmatic processes, as well as related vertical stress development (mantle upwelling by Plomerová et al., 2007). Such active processes are also documented by earthquakes, active fluids emissions in the region, and last but not least, in geological time-scale, by the presence of Quaternary volcanism, recently studied by Mrlina et al. (2007).

J. Mrlina and M. Seidl
560 Stud. Geophys. Geod., 52 (2008)
We evaluated some more recent data from the profile Kynšperk - Oloví for the time span 19671998. The point in Kynšperk was fixed as reference, see Fig. 5 (graphs at bottom). We found that maximum displacement originated between Litov (LITO) and Krajková (KRAJ) points that are located just at the beginning of the Krušné hory slope on the eastern side of the Mariánské Lázně fault (MLF). These points exhibit continuous vertical separation till 1992, while maximum velocity is indicated in 1987 to 1992. Unexpectedly, this maximum is not related to the 1985/86 earthquake swarm, but to the following period with minor swarms (1991). Significant change of this trend appeared in 19921998, when both points showed reverse contradictory movement. During this period two significant swarms occurred in 1994 and 1997. Unfortunately, this profile is not connected to our N.Kostel levelling network due to long distance.
Fig. 5. West Bohemia - location map (top left) shows old levelling lines, our Nový Kostel network (red polygon) and our new MILHOSTOV profile (red line). Schematic map of vertical displacement velocity rate in mm (top right) based on historical levelling campaigns 19461974 (adopted after Vyskočil and Zeman, 1979). Most of the region under study west of Karlovy Vary exhibited negative tendency, except small area near Krajková NNE of Cheb, about 5 km SE of the Nový Kostel network. Profile Kynšperk - Oloví was studied in two ways: Bottom left: vertical displacements at each levelling point with the Kynšperk point as reference (principal earthquake swarms since 1985/86 are shown as red stars). Location of points (see top left) - from Kyšnperk to N as far as to Oloví. Bottom right: as the whole profile displacement at particular periods relative to the first reference campaign in 1967. Profile is approximated by a blue straight line in the location map.
Limited area around Krajkováseems to uplift
Most of the westernKrušné hory Mts.seem to subside !!!
Tertiary volcanic centre of the Doupov Mts. seems to uplift.
Levelling networkNový Kostel
20 km
Germany
Czechia
M L F
-40
-30
-20
-10
0
10
20
30
40
1967 1974 1982 1987 1992 1998
Series1Series2Series3Series4Series5
dH (mm)
KynsPochLitoKrajOlov -40
-30
-20
-10
0
10
20
30
40
KYNS POCH LITO KRAJ OLOV
1967 1974
1982 1987
1992 1998
dH (mm)

Relation of Surface Movements in West Bohemia to Earthquake Swarms
Stud. Geophys. Geod., 52 (2008) 561
It is not possible to draw clear conclusions from the discussed historical re-evaluated data. But what is clear is that the area shows vertical displacements with positive trend relatively close to the eastern vicinity of the Nový Kostel earthquake zone (Krajková area). As well, the Cheb basin seems to be relatively stable compared to the subsidence of the most of the western Krušné hory Mts. within the region under study, as shown in Fig. 5.
3 . 4 . L o c a l S c a l e R e s u l t s - N o v ý K o s t e l N e t w o r k
Annual campaigns of precise levelling were evaluated in two different ways: as annual elevation difference of a couple of consequent campaigns (Hn + 1 Hn), selected cases in Fig. 6 top, and as total elevation difference of any campaign respective to the reference campaign in 1994, or else (Hn Href), Fig. 6 bottom.
The first option provides the idea on consequent development of vertical displacements, while the second one can indicate long term trends. Similar approach was used by Mrlina (2000). Contours interval is very dense (1 or 2 mm) in order to provide detail image; however, we keep in mind that this interval is below the level of confidence of the data. Therefore, only general distribution of negative-positive values has statistical importance.
We present 2 examples of option a) in Fig. 6a,b. The differences in 20032004, as well as 20062007 are of similar character, indicating gentle uplift in the NE part relative to SW (swarms 02/2004 and 02/2007). The division line (separating negative from positive movements) is parallel rather to the direction of MLF (Mariánské Lázně fault) than to the axis of elliptical focal zone of Nový Kostel. This is slightly different from the earthquake swarm periods 19961997 and 2000, when the division lines were almost identical with the focal zone axis (Mrlina, 2000; Mrlina et al., 2003). This change may be related to the change of the character of earthquake activity after 2001, as a number of micro-swarms have occurred with partially different parameters (depth, distribution) according to Fischer and Michálek (2008). A strange bipolar anomaly occurred in the 20032004 differential map, see Fig. 6a, on a couple of points, that has not been explained yet (most likely a local technical problem), therefore it was covered by a raster.
Significant information can be extracted from the long-term displacement maps in Fig. 6c,d. What was considered a random behaviour in between earthquake swarms of 1994 and 1997 (Mrlina, 2000), can be seen now in the new light - the direction of the principal division line between positive and negative vertical displacements (thick red dotted in Fig. 6c,d) is identical with the direction of ChKB (Cheb-Kraslice GPS Boundary) that was defined in the previous chapter dealing with GPS data. Relatively positive vertical displacements are sharply separated from the negative ones on the eastern side of the network. In detail, we can recognize an uplifting block of semi-rectangular shape prolonged in the direction of ChKB in case of the total displacement 19942007 (Fig. 6c), and in the direction of MLF in case of displacements that include the Autumn 2000 swarm till recent (Fig. 6d). The division lines, or limits (red and dark blue dotted lines), can be local fractures trending NNE-SSW and NNW-SSE.

J. Mrlina and M. Seidl
562 Stud. Geophys. Geod., 52 (2008)
Fig. 6. Selected periods of repeated precise levelling in the Nový Kostel network - the 20032004 (a) and 20062007 (b) periods were selected with respect to important earthquake micro-swarms in 02/2004 and 02/2007, while the 06/20002007 (d) period represents total displacement since shortly before the Autumn 2000 big swarm till recent (2007). Total observation period 19942007 (c) is partly covered by a cross-raster, as the NW part of the network was established after 1994. The same cover was applied to dipole-like unexplained anomaly in Fig. 6a. Violet ellipse - principal focal zone, black dashed line - MLF (Mariánské Lázně fault), blue and red dot lines - principal division lines of vertical displacements NNW-SSE and NNE-SSW; contours of vertical displacement - interval 1 mm in a,b, and 2 mm in c,d (see different scale bars; ‘zero’ contour in red). Levelling points are black dots with black numbers, reference point is in a rectangle at the down-left corner of maps. Seismological station NKC - red star in the centre of the figures. Nový Kostel village is marked by black polygon with diagonal raster. Local XY grid scale in metres (local easting-northing).
-500 0 500 1000 1500 2000 2500
-1000
-500
0
500
1000
1500
2000
2500
3000
3500
R31
N42
N43.1N44
N44.1N45.1N46
N47
G3
G4G5
G6
G11
12
34
5
6
7
8
9
10
11
1213
14
15
1617
18 1920
2122
2324
25
26
27
28
29
30
31
32
3334
35
36
37
38
3940
4142
43
44
45
46
47
48
495051
5253 54
55
56
57585960 6162 63
64
66
Nový Kostel
2006 - 2007Nový Kostel- levelling
NKC
[mm]
-6
-5
-4
-3
-2
-1
0
1
2
3
4
5
6
-500 0 500 1000 1500 2000 2500
-1000
-500
0
500
1000
1500
2000
2500
3000
3500
R31
N42
N43.1N44N44.1N45.1N46
N47
G3
G4G5
G6
G11
12
34
5
6
7
8
9
10
11
1213
14
15
1617
18 1920
2122
2324
25
26
27
28
29
30
31
32
3334
35
36
37
38
3940
4142
43
44
45
46
47
48
495051
5253 54
55
56
57585960 6162 63
64
66
Nový Kostel
2003 - 2004Nový Kostel- levelling
NKC
-500 0 500 1000 1500 2000 2500
-1000
-500
0
500
1000
1500
2000
2500
3000
3500
R31
N42
N43.1N44N44.1N45.1N46
N47
G3
G4G5
G6
G11
12
34
5
6
7
8
9
10
11
1213
14
15
1617
18 1920
2122
2324
25
26
27
28
29
30
31
32
3334
35
36
37
38
3940
4142
43
44
45
46
47
48
495051
5253 54
55
56
57585960 6162 63
64
66
Nový Kostel
6/2000 - 2007Nový Kostel- levelling
NKC
-18-16-14-12-10-8-6-4-2024681012141618
[mm]
-500 0 500 1000 1500 2000 2500
-1000
-500
0
500
1000
1500
2000
2500
3000
3500
R31
N42
N43.1N44N44.1N45.1N46
N47
G3
G4G5
G6
G11
12
34
5
6
7
8
9
10
11
1213
14
15
1617
18 1920
2122
2324
25
26
27
28
29
30
31
32
3334
35
36
37
38
3940
4142
43
44
45
46
47
48
495051
5253 54
55
56
57585960 6162 63
64
66
Nový Kostel
1994 - 2007Nový Kostel- levelling
NKC
Not measured in 1994
cb
a b
d
Relation of Surface Movements in West Bohemia to Earthquake Swarms
Stud. Geophys. Geod., 52 (2008) 563
In general perspective, we can conclude that during the active periods the vertical displacement division lines coincide with MLF and the Nový Kostel focal zone directions, while, in total, the NNE-SSW direction of ChKB plays a significant role due to long-term displacements.
The picturesque behaviour of the area can be explained by intensive fracturing of this seismically active block that undergoes a complex stress evolution during active and quiet periods.
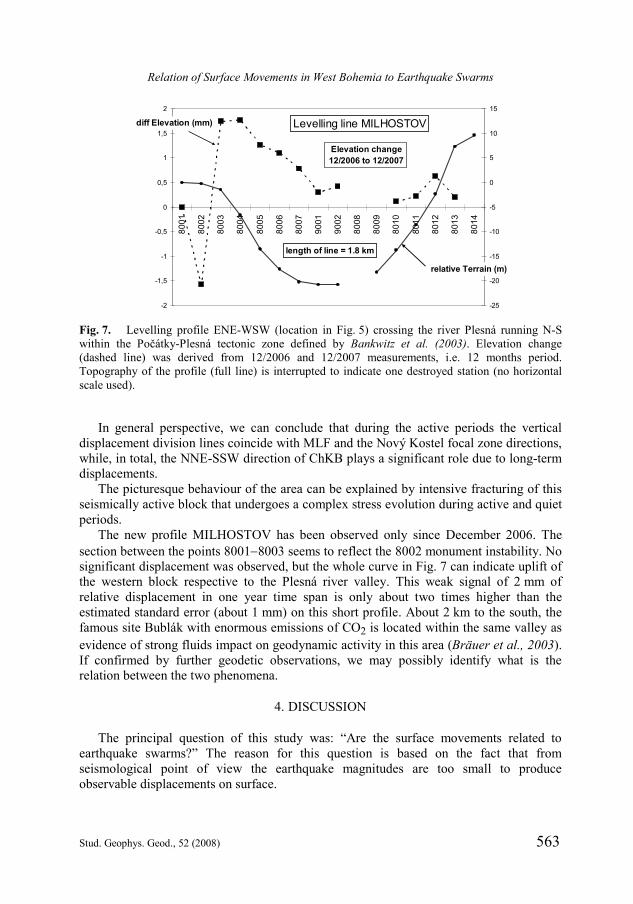
The new profile MILHOSTOV has been observed only since December 2006. The section between the points 80018003 seems to reflect the 8002 monument instability. No significant displacement was observed, but the whole curve in Fig. 7 can indicate uplift of the western block respective to the Plesná river valley. This weak signal of 2 mm of relative displacement in one year time span is only about two times higher than the estimated standard error (about 1 mm) on this short profile. About 2 km to the south, the famous site Bublák with enormous emissions of CO2 is located within the same valley as evidence of strong fluids impact on geodynamic activity in this area (Bräuer et al., 2003). If confirmed by further geodetic observations, we may possibly identify what is the relation between the two phenomena.
4. DISCUSSION
The principal question of this study was: “Are the surface movements related to earthquake swarms?” The reason for this question is based on the fact that from seismological point of view the earthquake magnitudes are too small to produce observable displacements on surface.
Fig. 7. Levelling profile ENE-WSW (location in Fig. 5) crossing the river Plesná running N-S within the Počátky-Plesná tectonic zone defined by Bankwitz et al. (2003). Elevation change (dashed line) was derived from 12/2006 and 12/2007 measurements, i.e. 12 months period. Topography of the profile (full line) is interrupted to indicate one destroyed station (no horizontal scale used).
-2
-1,5
-1
-0,5
0
0,5
1
1,5
2
8001
8002
8003
8004
8005
8006
8007
9001
9002
8008
8009
8010
8011
8012
8013
8014
-25
-20
-15
-10
-5
0
5
10
15
relative Terrain (m)
Levelling line MILHOSTOVdiff Elevation (mm)
length of line = 1.8 km
Elevation change 12/2006 to 12/2007

J. Mrlina and M. Seidl
564 Stud. Geophys. Geod., 52 (2008)
However, the results of repeated geodetic measurements show number of cases when such relation could be derived from observed data. For example, the GPS displacement vectors from the period before and after the autumn 2000 swarm (with statistically significant amplitudes) document pre-seismic forward (dextral) surface movement in 19981999, as well as co-seismic and/or post-seismic reverse (sinistral/left-lateral) deformation in 19992000. This was in very good correlation with fault plane solutions of the autumn 2000 swarm (Fischer and Horálek, 2003).
We called the division line of the opposite trends of movement the Cheb-Kraslice GPS Boundary (ChKB), as it is not considered a single fault. The NNE-SSW direction of ChKB corresponds well with the direction of the maximum extension (T-axis) derived from the analysis of the earthquakes of the “autumn 2000” swarm by Fischer (2003). As well, Havíř (2005) presented two different types of stress analysis in the region under study. Firstly, the orientation of principal stresses in the epicentral area of Nový Kostel was determined from four earthquake swarms (1985/86, 1994, 1997 and 2000). Maximum extension (3) was defined for 35 NE-SW direction, just slightly deviated to E from the direction of our ChKB (about 20). Secondly, the stress orientation was derived from geological observations of faults in the orthogneiss body between nearby villages Kopanina and Nový Částkov, with the direction of 15 NNE-SSW, very tight to the discussed ChKB direction (20 NNE-SSW). Caporali et al. (2005) presented GPS displacements related to the medium intensity Merano 2001 earthquake (M = 4.8). The GPS signal exceeded by more than two times the theoretical displacement modelled on the basis of the seismic moment M0. They also observed pre-seismic bending in the active area followed by completely the same sense of reverse movements as we observed in 19982000 in West Bohemia.
Wendt and Dietrich (2003) showed the results of their GPS observations in the adjacent Vogtland area in Germany, to the N and NW of our region. They focused on the PPZ (Počátky-Plesná zone) oriented N-S. From the published data an indication of similar dextral displacement can be estimated in the 19971999 differential map, but no obvious trends in 19992000. This may be explained by the fact that PPZ is not identical with ChKB.
From our results also the long-term vertical displacements seem to be strongly affected by structural features of the ChKB direction. The total 19942007 displacement in Fig. 6 shows significant division line parallel to this feature. The short-term vertical displacements during swarms or even micro-swarms, on the other hand, correspond rather with the “usual” direction of the Nový Kostel focal zone and MLF (Mariánské Lázně fault).
We assume that the principal horizontal displacements discussed above are realistic, but we are still aware that the length of resulting vectors is small and does not exceed dramatically the level of confidence of the data. Therefore, we consider continuation of our observations necessary until some next significant earthquake swarm, at least relevant to the autumn 2000 one.

Relation of Surface Movements in West Bohemia to Earthquake Swarms
Stud. Geophys. Geod., 52 (2008) 565
5. CONCLUSIONS
Geodetic observations in West Bohemia during the past 15 years (19932007) were evaluated. From the GPS and precise levelling data we draw the following conclusions:
Horizontal and vertical displacements are more pronounced in the seismologically active periods. However, we identified also pre-seismic movements that are compensated in opposite direction by co-/post-seismic deformation (forward - reverse). Principal example is the GPS dextral movement in 19981999, followed by sinistral “strike-slip” in 19992000 corresponding to the fault plane solutions of the autumn 2000 swarm. The observed deformation process is not linear in time, but appears to be related to the intensity of earthquake activity.
We determined a division line of reverse displacements from the GPS observations and called it the Cheb-Kraslice GPS Boundary (ChKB). This ChKB does not represent a fault sensus stricto (s.s.)., rather a zone separating blocks of different kinematic evolution. It may consist of local fractures and faults. It is also a zone separating blocks with a striking difference of the character of seismicity; the widespread earthquake activity in the western block is limited by ChKB, with the exception of the southernmost section of the principal Nový Kostel focal zone protruding to the SSE which, however, represents 85 % of the events and released tectonic energy. The ChKB trend acts as a limit of vertical long-term displacements around Nový Kostel, too.
During particular earthquake swarms the data show locally short-term displacements, both horizontal and vertical, oriented along the N-S and NNW-SSE directions of the Nový Kostel focal zone, and the Mariánské Lázně fault respectively.
In the geological sense, we conclude that the seismoactive area in the larger vicinity of Nový Kostel is probably composed of a set of particular miniblocks with a complex stress field evolution. As well, the seismogenic fault can be relatively simple at depth, but rather complex in the near subsurface. Such conditions are favourable for varying directions of displacements at surface. In regional view, the western Krušné hory Mts. do not exhibit, at this very recent time, general uplift as might be expected from their Quaternary geomorphological evolution.
Despite the unique set of 15 years of GPS and levelling observations, some results still may require further empirical confirmation in the period of another significant earthquake swarm, at least comparable with the Autumn 2000 one.
Acknowledgements: This investigation was mainly supported by grant project No. IAA3012308
of the Grant Agency of the Academy of Sciences of the Czech Republic. Authors are also grateful to J. Horálek for the encouragement to perform this long-term investigation and to T. Fischer for important comments to our analysis of seismicity. We appreciate valuable remarks of J. Vondrák and one anonymous reviewer that helped to improve the manuscript. As well, we acknowledge the effort of all personnel participating in the field work.

J. Mrlina and M. Seidl
566 Stud. Geophys. Geod., 52 (2008)
References
Bankwitz P., Schneider G., Kämpf H. and Bankwitz E., 2003. Structural characteristics of epicentral areas in Central Europe: study case Cheb Basin (Czech Republic). J. Geodyn., 35, 532.
Bräuer K., Kämpf H., Strauch G. and Weise S., 2003. Isotopic evidence (3He/4He, 13C (CO2)) of fluid-triggered intraplate seismicity. J. Geophys. Res., 108(B2), Art.No. 2070, doi: 10.1029/2002JB002077.
Caporali A., Braitenberg C. and Massironi M., 2005. Geodetic and hydrological aspect of the Merano earthquake of 17 July 2001. J. Geodyn., 39, 317336, doi: 10.1016/j.jog.2005.01.001.
Even-Tzur G., Salmon E., Kozakov M. and Rosenblum M., 2004. Designing a geodetic-geodynamic network: a comparative study of data processing tools. GPS Solutions, 8, 3035.
Fischer T., 2003. The AugustDecember 2000 earthquake swarm in NW Bohemia: the first results based on automatic processing of seismograms. J. Geodyn., 35, 5981.
Fischer T. and Horálek J., 2003. Space-time distribution of earthquakes in the principal focal zone of the NW Bohemia/Vogtland seismoactive region: period 19852001. J. Geodyn., 35, 125144.
Fischer T. and Michálek J., 2008. Post 2000-swarm microearthquake activity in the principal focal zone of West Bohemia/Vogtland: space-time distribution and waveform similarity analysis. Stud. Geophys. Geod., 52, 493.
Havíř J., 2005. Orientations of the principal paleostresses in the Western Bohemia seismoactive region and their comparison with recent stresses. J. Czech Geol. Soc., 50, 133142.
Mrlina J., 2000. Vertical displacements in the Nový Kostel seismoactive area. Stud. Geophys. Geod., 44, 336345.
Mrlina J., Kämpf H., Geissler W.H. and van den Boogart P., 2007. Assumed Quaternary maar structure at the Czech/German boundary between Mýtina and Neualbenreuth (western Eger Rift, Central Europe): geophysical, petrochemical and geochronological indications Z. Geol. Wiss., 35, 213230.
Mrlina J., Špičák A. and Skalský L., 2003. Non-seismological indications of recent tectonic activity in the West Bohemia earthquake swarm region. J. Geodyn., 35, 221234.
Plomerová J., Achauer U., Babuška V., Vecsey L., Bohema Working Group, 2007. Upper mantle beneath the Eger Rift (Central Europe): plume or asthenosphere upwelling? Geophys. J. Int., 169, 675682, doi: 10.1111/j.1365-246X.2007.03361.x.
Seidl M., 2006. Application of GPS Technology in Local Networks - Geodynamic Network Cheb. Ph.D. Thesis, Czech Technical University, Praha.
Schenk V., Kottnauer P., Schenková Z. and Hájek P., 2004. Czech permanent GPS observatories for geodynamic investigations of the Bohemian Massif operated by the Institute of Rock Structure and Mechanics, Prague. Acta Geodynamica et Geomaterialia, 1, No. 3 (135), 111114.
Špičák A., Mrlina J., Jindra D. and Mervart L., 1997. Repeated geodetic measurements in the West Bohemia seismoactive region: period 19931996. Stud. Geophys. Geod., 41, 319328.
Vyskočil P. and Zeman A., 1979. Recent movements of the Earth’s crust in the region of the Bohemian Massif and its south-east border. In: Vaněk J. (Ed.), Geodynamic Investigations in Czechoslovakia. Veda, Bratislava, Slovakia, 139146.
Wendt J. and Dietrich R., 2003. Determination of recent crustal deformation based on precise GPS measurements in the Vogtland earthquake area. J. Geodyn., 35, 235246.